Small-hydro-resource-mapping-in-Tanzania-hydropower-atlas ...
70
Small Hydro Resource Mapping in Tanzania HYDROPOWER ATLAS: FINAL REPORT January 2018 Public Disclosure Authorized Public Disclosure Authorized Public Disclosure Authorized Public Disclosure Authorized
-
Upload
khangminh22 -
Category
Documents
-
view
1 -
download
0
Transcript of Small-hydro-resource-mapping-in-Tanzania-hydropower-atlas ...
Small Hydro Resource Mapping in Tanzania
HYDROPOWER ATLAS: FINAL REPORT
January 2018
Pub
lic D
iscl
osur
e A
utho
rized
Pub
lic D
iscl
osur
e A
utho
rized
Pub
lic D
iscl
osur
e A
utho
rized
Pub
lic D
iscl
osur
e A
utho
rized
This report was prepared by SHER in association with Mhylab, under contract to The World Bank.
This is the final output from the small hydro Mapping and Geospatial Planning Tanzania [Project ID: P145287]. This activity is funded and supported by the Energy Sector Management Assistance Program (ESMAP), a multi-donor trust fund administered by The World Bank, under a global initiative on Renewable Energy Resource Mapping. Further details on the initiative can be obtained from the ESMAP website.
The Final Report relating to the Hydropower Atlas for Tanzania summarizes the project and the results obtained. The Hydropower Atlas has been validated through field-based surveys and has been internally peer-reviewed. It will be published via The World Bank s main website and listed on the ESMAP website along with the other project outputs please refer to the corresponding country page.
Copyright © 2018 THE WORLD BANK
Washington DC 20433
Telephone: +1-202-473-1000
Internet: www.worldbank.org
The World Bank, comprising the International Bank for Reconstruction and Development (IBRD) and the International
Development Association (IDA), is the commissioning agent and copyright holder for this publication. However, this work is a
product of the consultants listed, and not of World Bank staff. The findings, interpretations, and conclusions expressed in
this work do not necessarily reflect the views of The World Bank, its Board of Executive Directors, or the governments they
represent.
The World Bank does not guarantee the accuracy of the data included in this work and accept no responsibility for any
consequence of their use. The boundaries, colors, denominations, and other information shown on any map in this work do
not imply any judgment on the part of The World Bank concerning the legal status of any territory or the endorsement or
acceptance of such boundaries.
The material in this work is subject to copyright. Because The World Bank encourages dissemination of its knowledge, this
work may be reproduced, in whole or in part, for non-commercial purposes as long as full attribution to this work is given.
Any queries on rights and licenses, including subsidiary rights, should be addressed to World Bank Publications, The World
Bank Group, 1818 H Street NW, Washington, DC 20433, USA; fax: +1-202-522-2625; e-mail: [email protected].
Furthermore, the ESMAP Program Manager would appreciate receiving a copy of the publication that uses this publication for
its source sent in care of the address above, or to [email protected].
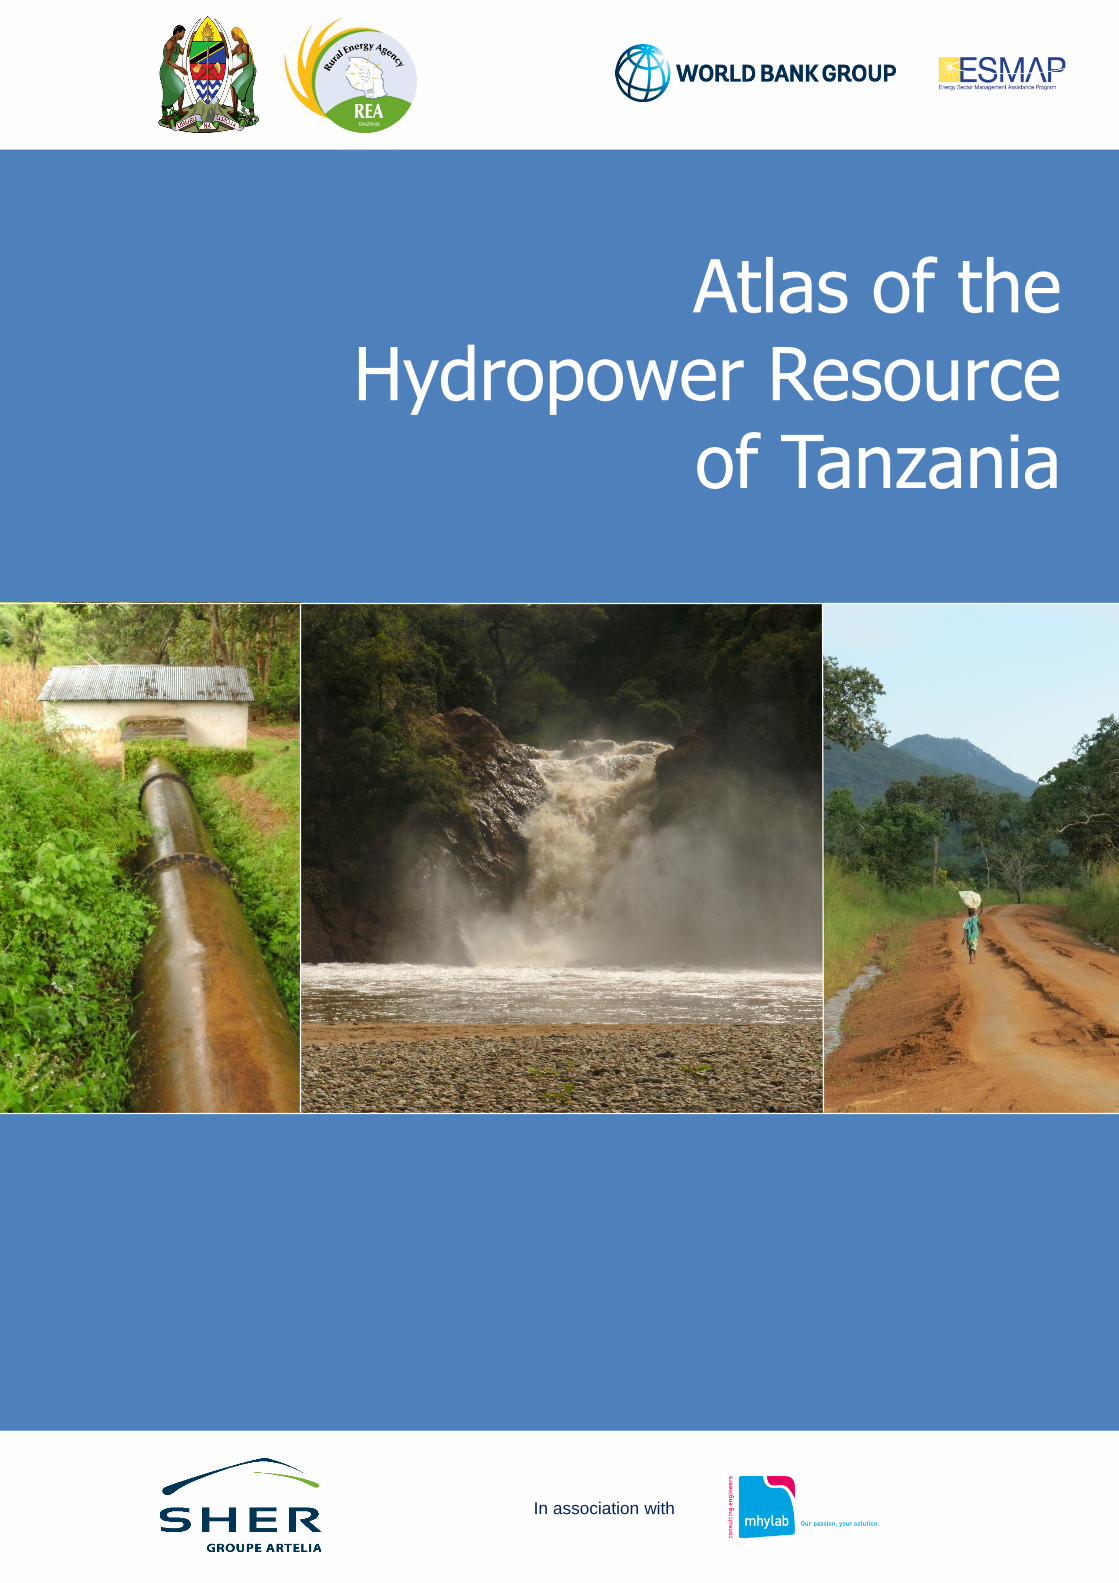
In association with
Atlas of the Hydropower Resource
of Tanzania

This Atlas is made available by The World Bank, financed by ESMAP
and prepared by SHER Ingénieurs-Conseils s.a. (Artelia Group).
- January 2018 -
The small hydropower potential of Tanzania is
important and largely underexploited. It is unevenly
distributed across the country and opportunities exist in
all capacity ranges »
«
Atlas of the Hydropower Resource
of Tanzania

The findings, interpretations, and conclusions expressed in this report
are entirely those of the SHER Ingénieurs-Conseils s.a. (Artelia Group)
and should not be attributed in any manner to the World Bank, or its
affiliated organizations, or to members of its board of executive
directors for the countries they represent, or to ESMAP. The World
Bank, ESMAP and SHER Ingénieurs-Conseils do not guarantee the
accuracy of the data included in this publication and accept no
responsibility whatsoever for any consequence of their use. The
boundaries, colors, denominations, and other information shown on
any map in this volume do not imply on the part of the World Bank
Group any judgment on the legal status of any territory or the
endorsement of acceptance of such boundaries.
All images remain the sole property of their source and may not be
used for any purpose without written permission from the source.
HYDRO-ATLAS OF TANZANIA Table of Content
Page i
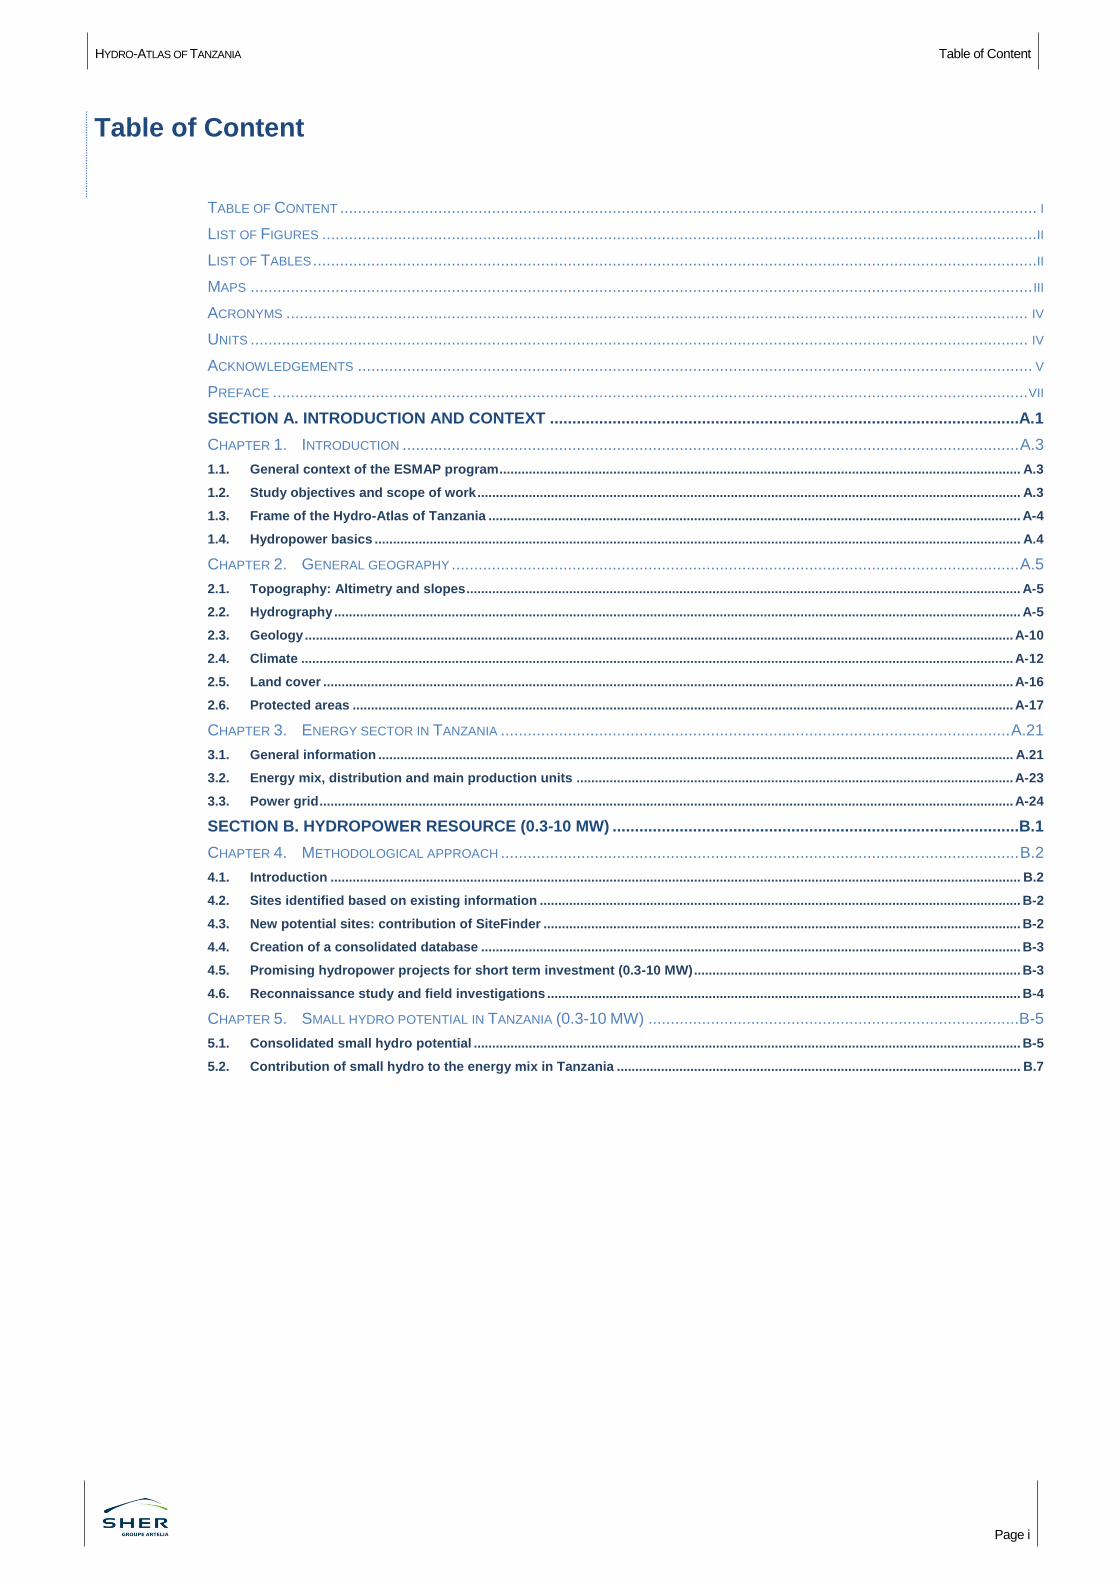
Table of Content
TABLE OF CONTENT ............................................................................................................................................................ I
LIST OF FIGURES ................................................................................................................................................................II
LIST OF TABLES ..................................................................................................................................................................II
MAPS ............................................................................................................................................................................... III
ACRONYMS ...................................................................................................................................................................... IV
UNITS .............................................................................................................................................................................. IV
ACKNOWLEDGEMENTS ....................................................................................................................................................... V
PREFACE ......................................................................................................................................................................... VII
SECTION A. INTRODUCTION AND CONTEXT .........................................................................................................A.1
CHAPTER 1. INTRODUCTION .......................................................................................................................................... A.3
1.1. General context of the ESMAP program .............................................................................................................................................. A.3
1.2. Study objectives and scope of work .................................................................................................................................................... A.3
1.3. Frame of the Hydro-Atlas of Tanzania ................................................................................................................................................. A-4
1.4. Hydropower basics ................................................................................................................................................................................ A.4
CHAPTER 2. GENERAL GEOGRAPHY ............................................................................................................................... A.5
2.1. Topography: Altimetry and slopes ....................................................................................................................................................... A-5
2.2. Hydrography ........................................................................................................................................................................................... A-5
2.3. Geology ................................................................................................................................................................................................. A-10
2.4. Climate .................................................................................................................................................................................................. A-12
2.5. Land cover ............................................................................................................................................................................................ A-16
2.6. Protected areas .................................................................................................................................................................................... A-17
CHAPTER 3. ENERGY SECTOR IN TANZANIA .................................................................................................................. A.21
3.1. General information ............................................................................................................................................................................. A.21
3.2. Energy mix, distribution and main production units ....................................................................................................................... A-23
3.3. Power grid ............................................................................................................................................................................................. A-24
SECTION B. HYDROPOWER RESOURCE (0.3-10 MW) ...........................................................................................B.1
CHAPTER 4. METHODOLOGICAL APPROACH .................................................................................................................... B.2
4.1. Introduction ............................................................................................................................................................................................ B.2
4.2. Sites identified based on existing information ................................................................................................................................... B-2
4.3. New potential sites: contribution of SiteFinder .................................................................................................................................. B-2
4.4. Creation of a consolidated database ................................................................................................................................................... B-3
4.5. Promising hydropower projects for short term investment (0.3-10 MW) ......................................................................................... B-3
4.6. Reconnaissance study and field investigations ................................................................................................................................. B-4
CHAPTER 5. SMALL HYDRO POTENTIAL IN TANZANIA (0.3-10 MW) ...................................................................................B-5
5.1. Consolidated small hydro potential ..................................................................................................................................................... B-5
5.2. Contribution of small hydro to the energy mix in Tanzania .............................................................................................................. B.7
HYDRO-ATLAS OF TANZANIA Charts and Tables
Page ii
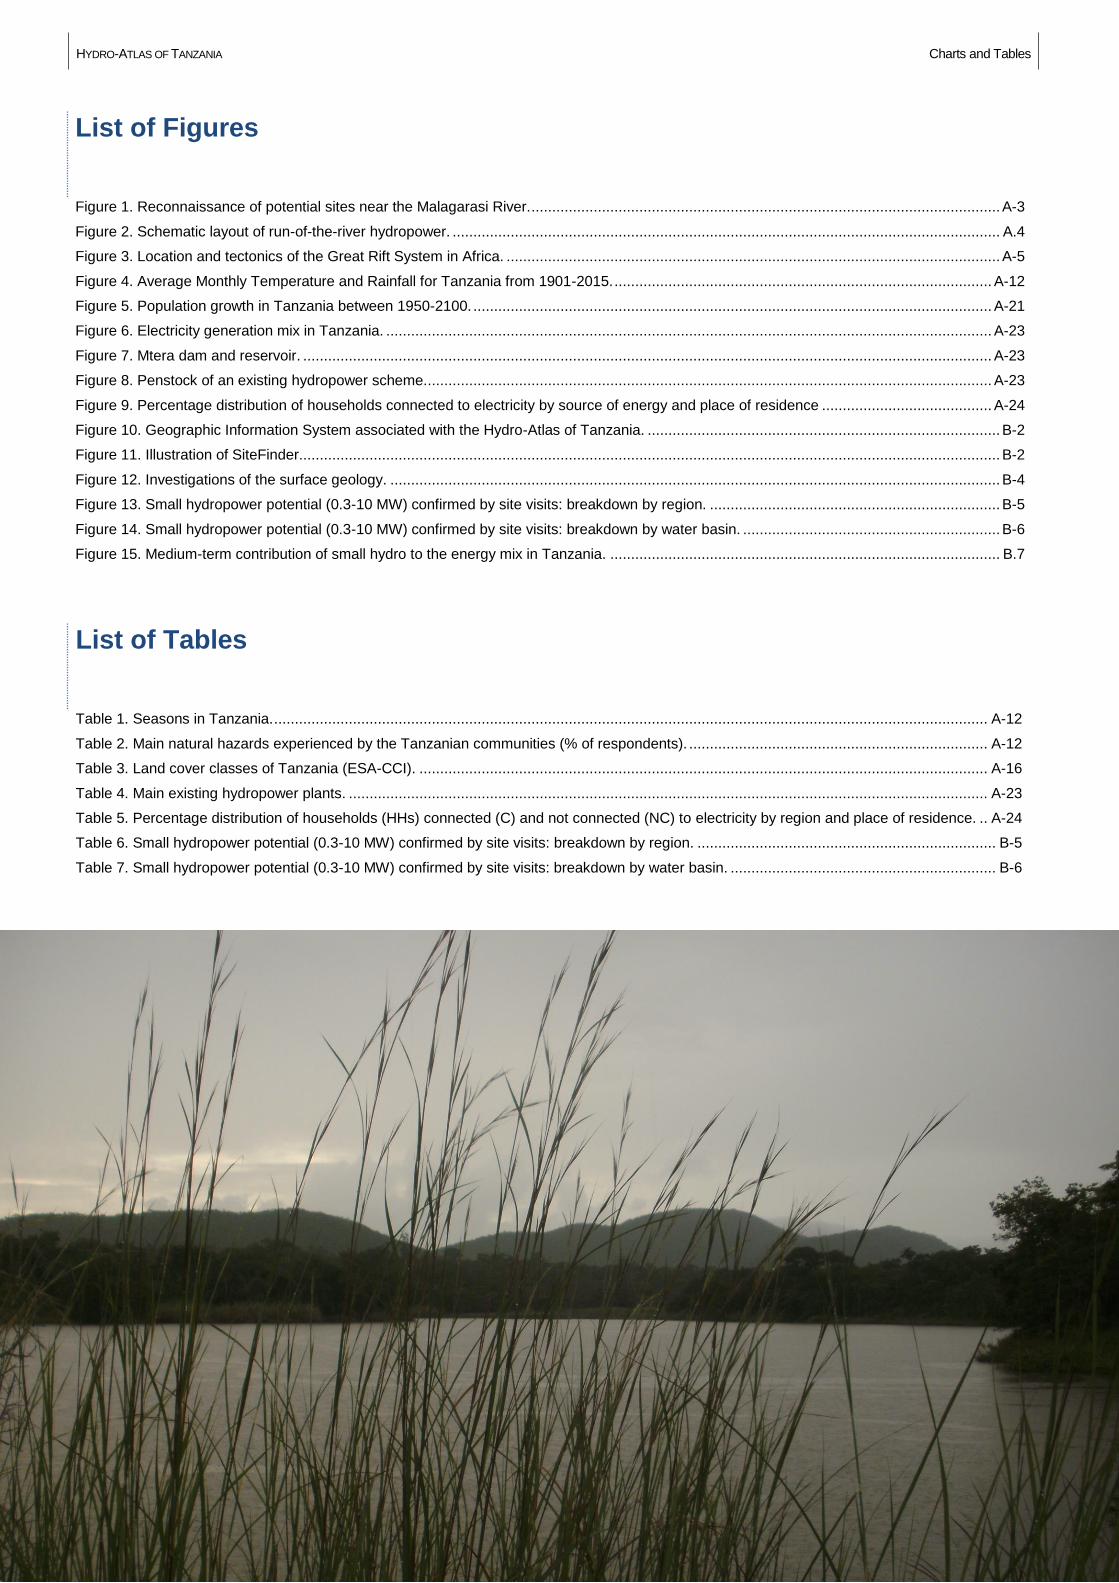
List of Figures
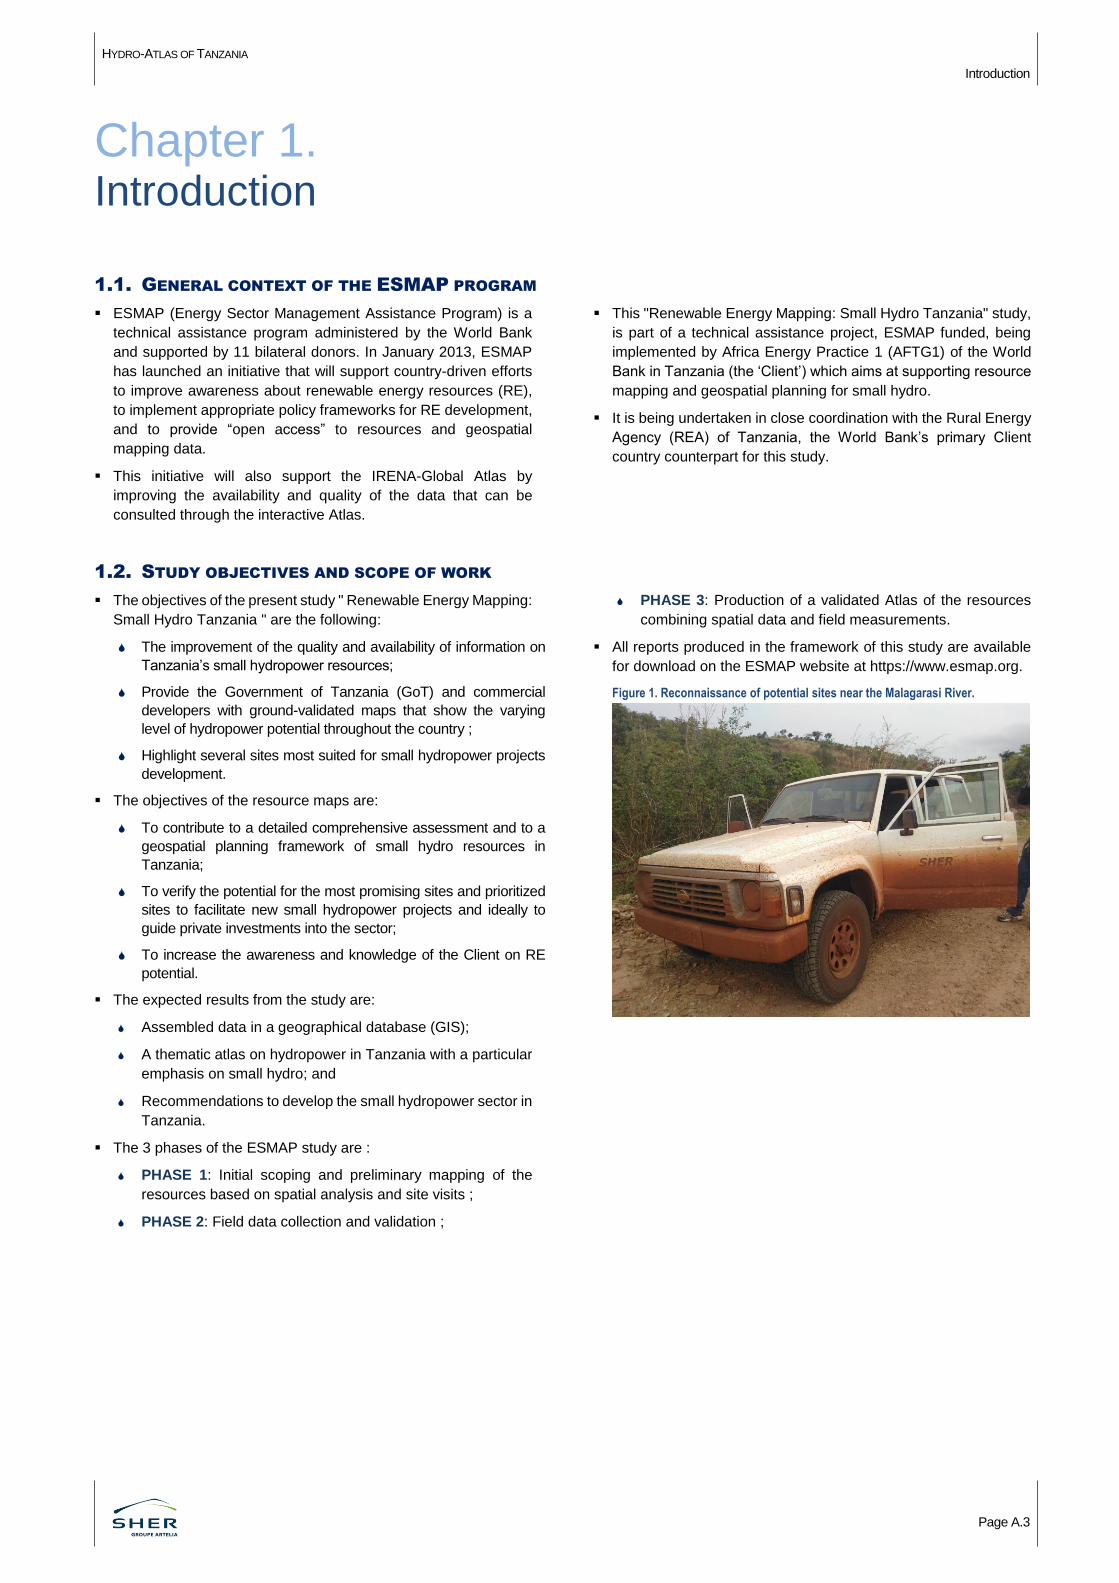
Figure 1. Reconnaissance of potential sites near the Malagarasi River. ................................................................................................................. A-3
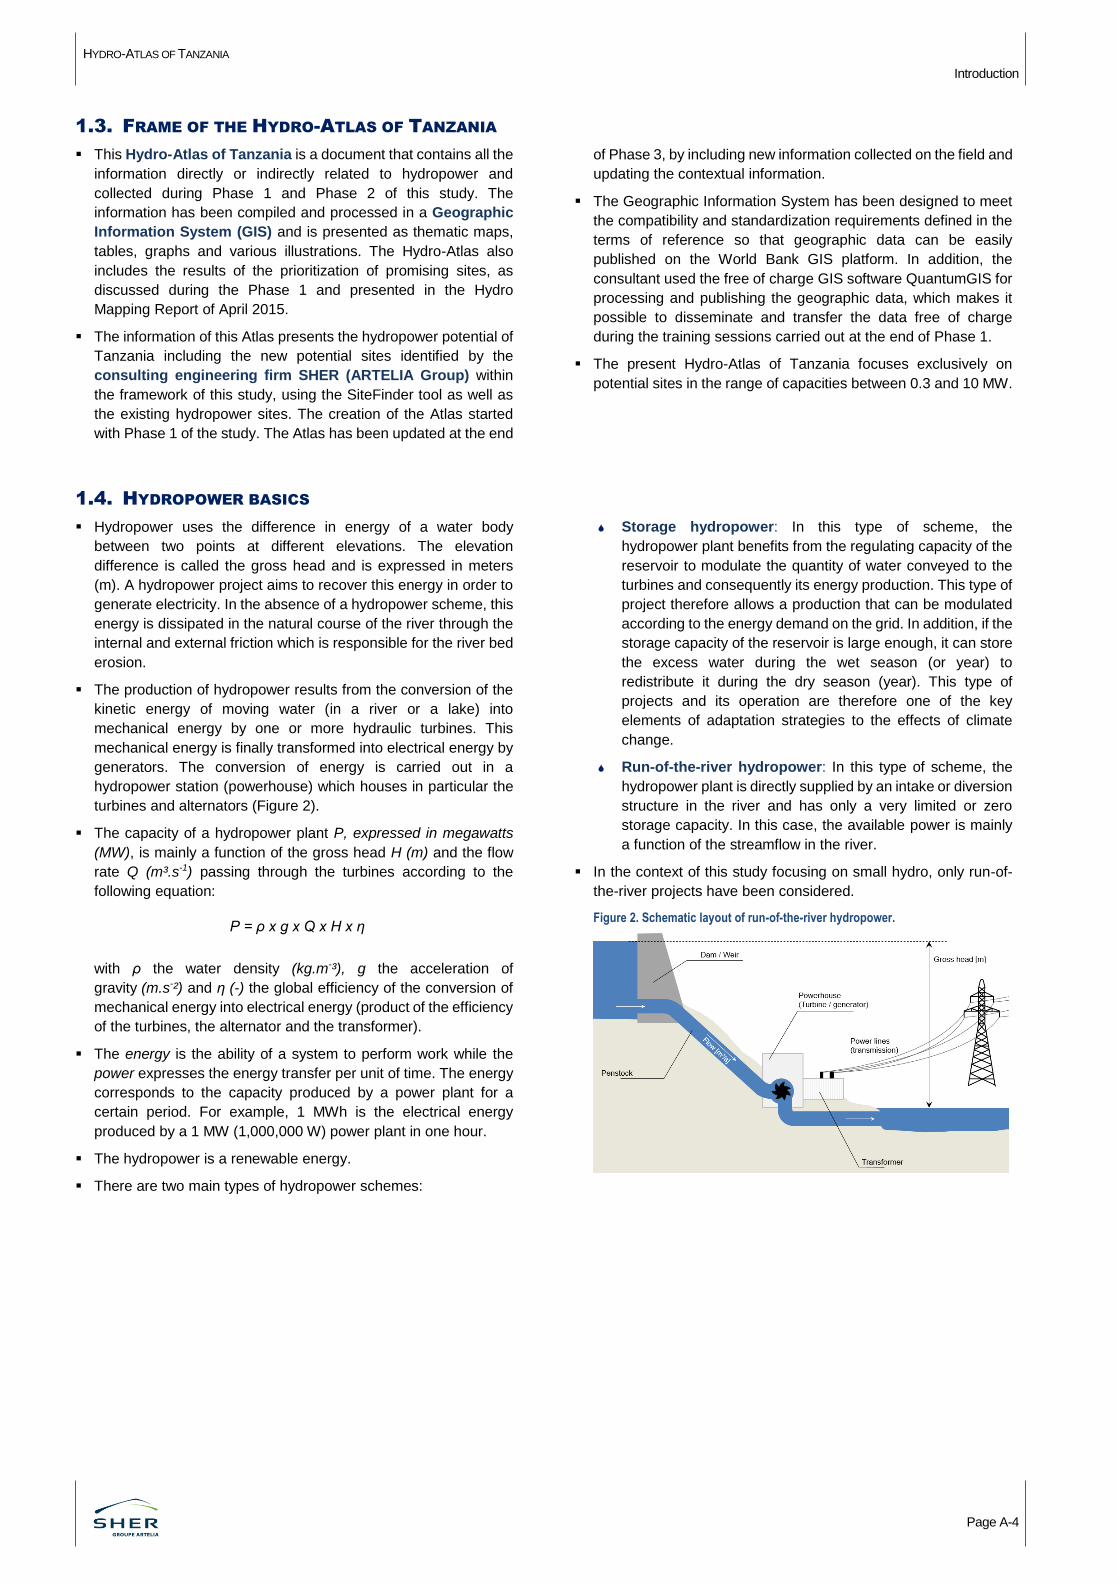
Figure 2. Schematic layout of run-of-the-river hydropower. .................................................................................................................................... A.4
Figure 3. Location and tectonics of the Great Rift System in Africa. ....................................................................................................................... A-5
Figure 4. Average Monthly Temperature and Rainfall for Tanzania from 1901-2015. ........................................................................................... A-12
Figure 5. Population growth in Tanzania between 1950-2100. ............................................................................................................................. A-21
Figure 6. Electricity generation mix in Tanzania. .................................................................................................................................................. A-23
Figure 7. Mtera dam and reservoir. ...................................................................................................................................................................... A-23
Figure 8. Penstock of an existing hydropower scheme......................................................................................................................................... A-23
Figure 9. Percentage distribution of households connected to electricity by source of energy and place of residence ......................................... A-24
Figure 10. Geographic Information System associated with the Hydro-Atlas of Tanzania. ..................................................................................... B-2
Figure 11. Illustration of SiteFinder......................................................................................................................................................................... B-2
Figure 12. Investigations of the surface geology. ................................................................................................................................................... B-4
Figure 13. Small hydropower potential (0.3-10 MW) confirmed by site visits: breakdown by region. ...................................................................... B-5
Figure 14. Small hydropower potential (0.3-10 MW) confirmed by site visits: breakdown by water basin. .............................................................. B-6
Figure 15. Medium-term contribution of small hydro to the energy mix in Tanzania. .............................................................................................. B.7
List of Tables
Table 1. Seasons in Tanzania. ............................................................................................................................................................................ A-12
Table 2. Main natural hazards experienced by the Tanzanian communities (% of respondents). ........................................................................ A-12
Table 3. Land cover classes of Tanzania (ESA-CCI). ......................................................................................................................................... A-16
Table 4. Main existing hydropower plants. .......................................................................................................................................................... A-23
Table 5. Percentage distribution of households (HHs) connected (C) and not connected (NC) to electricity by region and place of residence. .. A-24
Table 6. Small hydropower potential (0.3-10 MW) confirmed by site visits: breakdown by region. ........................................................................ B-5
Table 7. Small hydropower potential (0.3-10 MW) confirmed by site visits: breakdown by water basin. ................................................................ B-6
HYDRO-ATLAS OF TANZANIA Maps
Page iii
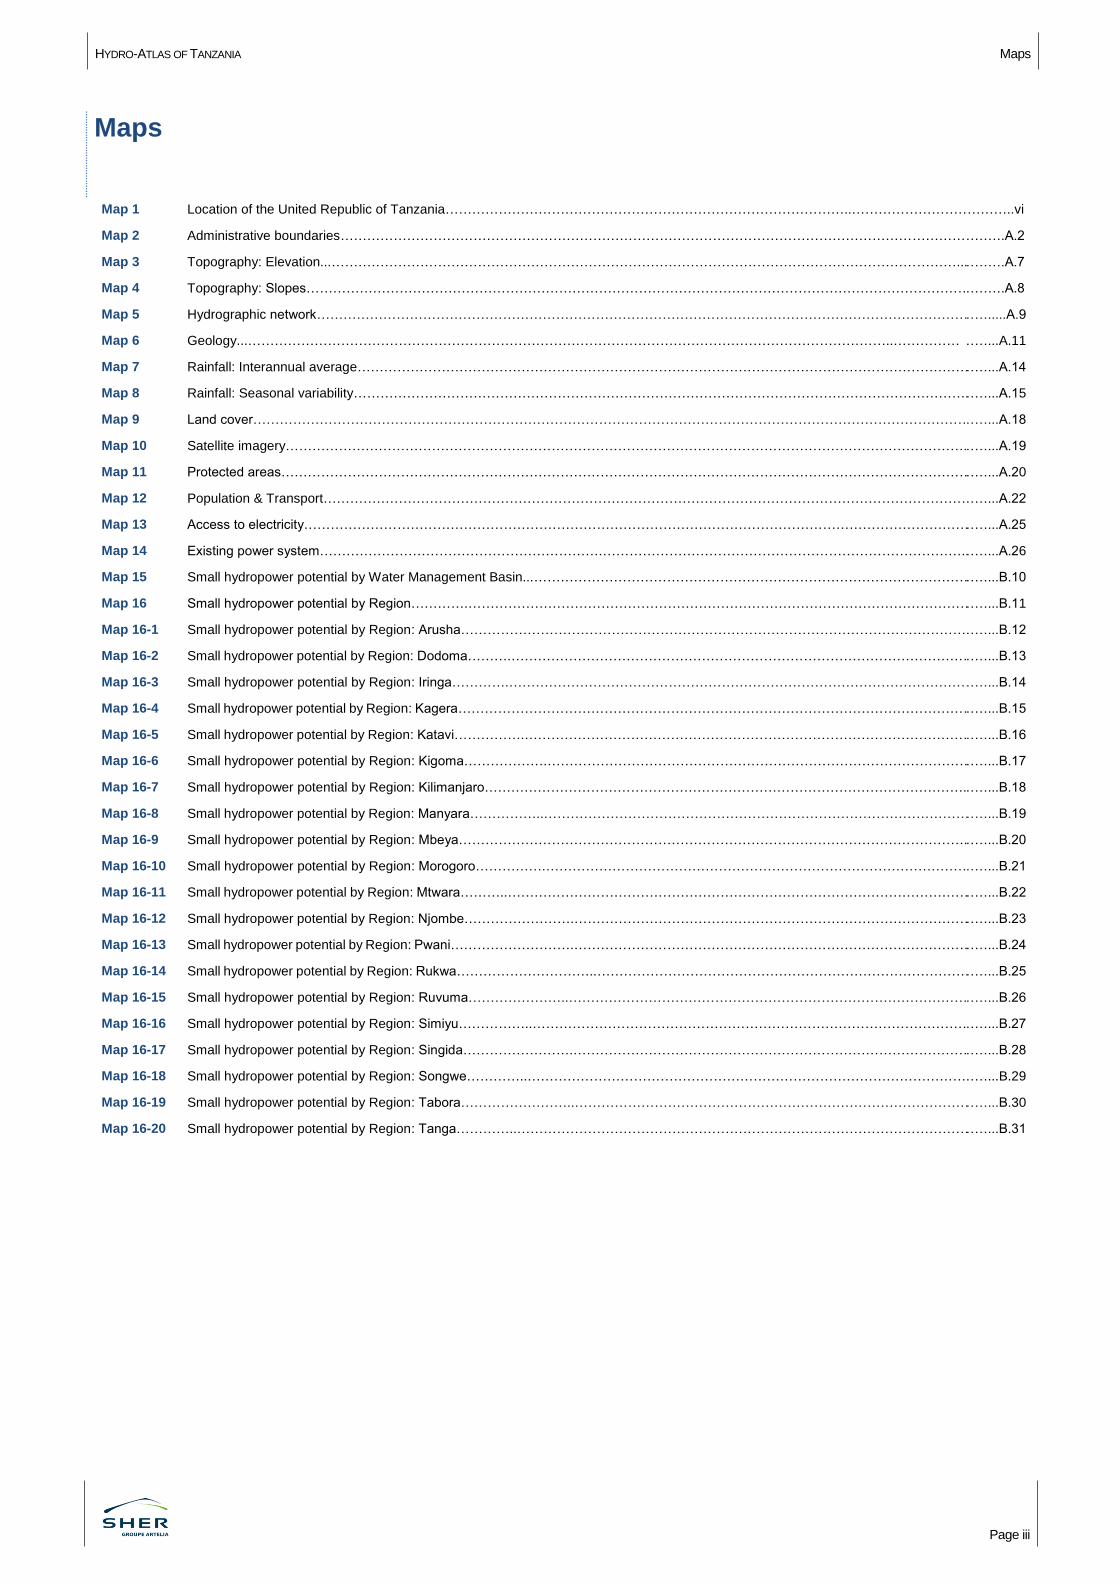
Maps
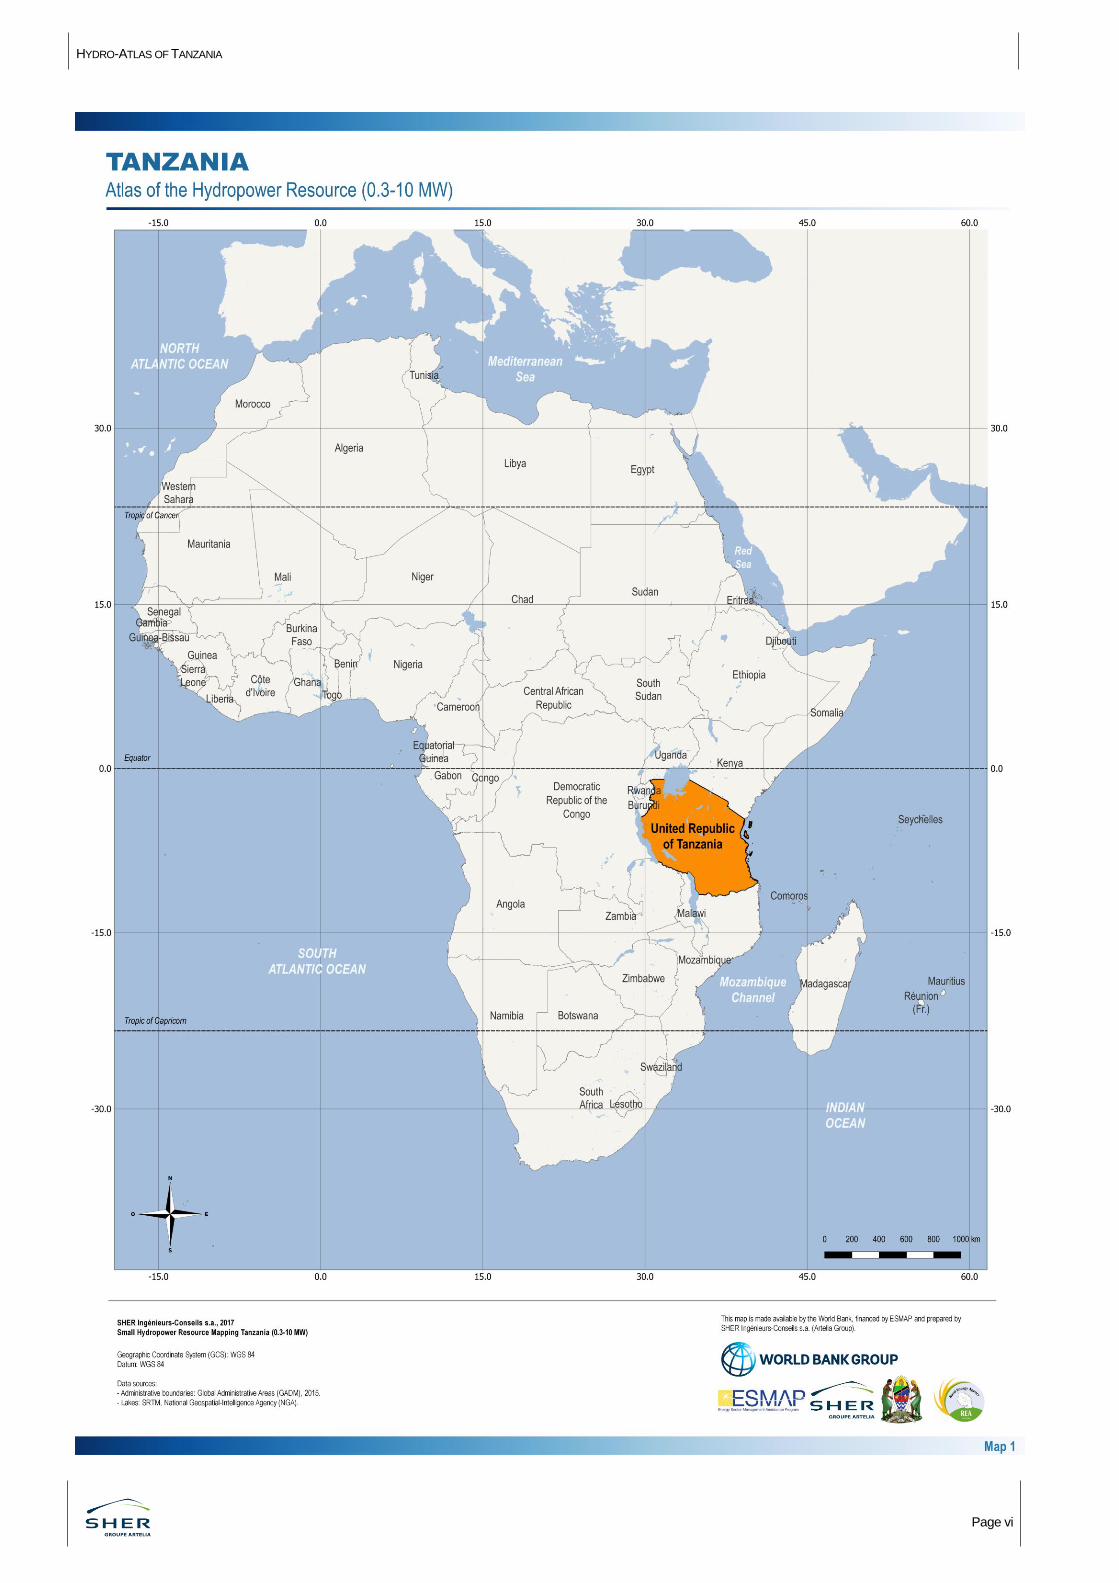
Map 1 Location of the United Republic of Tanzania………………………………………………………………………………..………………………. ………..vi
Map 2 Administrative boundaries…………………………………………………………………………………………………………………………… ……….A.2
Map 3 Topography: Elevation...……………………………………………………………………………………………………………………………... ……….A.7
Map 4 Topography: Slopes…………………………………………………………………………………………………………………………………… ……….A.8
Map 5 Hydrographic network………………………………………………………………………………………………………………………………… …….....A.9
Map 6 Geology...………………………………………………………………………………………………………………………………..…………… ……...A.11
Map 7 Rainfall: Interannual average………………………………………………………………………………………………………………………… ……...A.14
Map 8 Rainfall: Seasonal variability…………………………………………………………………………………………………………………………. ……...A.15
Map 9 Land cover……………………………………………………………………………………………………………………………………………… ……...A.18
Map 10 Satellite imagery……………………………………………………………………………………………………………………………………….. ……...A.19
Map 11 Protected areas…………………………………………………………………………………………………………………………………………. ……...A.20
Map 12 Population & Transport………………………………………………………………………………………………………………………………… ……...A.22
Map 13 Access to electricity…………………………………………………………………………………………………………………………………….. ……...A.25
Map 14 Existing power system……………………………………………………….……………………………………………………………………….. ……...A.26
Map 15 Small hydropower potential by Water Management Basin...……………………………………………………………………………………… ……...B.10
Map 16 Small hydropower potential by Region………….…………………………………………………………………………………………………… ……...B.11
Map 16-1 Small hydropower potential by Region: Arusha…………………………………………………………………………………………………….. ……...B.12
Map 16-2 Small hydropower potential by Region: Dodoma……….…………………………………………………………………………………………… ……...B.13
Map 16-3 Small hydropower potential by Region: Iringa………….…………………………………………………………………………………………… ……...B.14
Map 16-4 Small hydropower potential by Region: Kagera……………………………………………………………………………………………………… ……...B.15
Map 16-5 Small hydropower potential by Region: Katavi…………….………………………………………………………………………………………… ……...B.16
Map 16-6 Small hydropower potential by Region: Kigoma……………….…………………………………………………………………………………… ……...B.17
Map 16-7 Small hydropower potential by Region: Kilimanjaro……………………………………………………………………………………………….. ……...B.18
Map 16-8 Small hydropower potential by Region: Manyara……………..…………………………………………………………………………………….. ……...B.19
Map 16-9 Small hydropower potential by Region: Mbeya…………………………………………………………………………………………………….. ……...B.20
Map 16-10 Small hydropower potential by Region: Morogoro…………….……………………………………………………………………………………. ……...B.21
Map 16-11 Small hydropower potential by Region: Mtwara………..……………………………………………………………………………………………. ……...B.22
Map 16-12 Small hydropower potential by Region: Njombe…………………….………………………………………………………………………………. ……...B.23
Map 16-13 Small hydropower potential by Region: Pwani……………………….………………………………………………………………………………. ……...B.24
Map 16-14 Small hydropower potential by Region: Rukwa…………………………..………………………………………………………………………….. ……...B.25
Map 16-15 Small hydropower potential by Region: Ruvuma…………………..………………………………………………………………………………. ……...B.26
Map 16-16 Small hydropower potential by Region: Simiyu……………..……………………………………………………………………………………… ……...B.27
Map 16-17 Small hydropower potential by Region: Singida…………………….……………………………………………………………………………… ……...B.28
Map 16-18 Small hydropower potential by Region: Songwe…………..……………………………………………………………………………………….. ……...B.29
Map 16-19 Small hydropower potential by Region: Tabora……………………..……………………………………………………………………………… ……...B.30
Map 16-20 Small hydropower potential by Region: Tanga…………..…………………………………………………………………………………………. ……...B.31
HYDRO-ATLAS OF TANZANIA Acronyms and Units
Page iv
Acronyms
AFTG1 Africa Energy Practice 1
CCI Climate Change Initiative
DEM Digital Elevation Model
DSM Digital Surface Model
ESA European Space Agency
ESMAP Energy Sector Management Assistance Program
EWURA Energy and Water Utilities Regulatory Authority
FAO Food and Agriculture Organization (of the United Nations)
FNR Forest Nature Reserve
GHG Greenhouse Gas
GIS Geographic Information System
GLI Global Legal Insights
GoT Government of Tanzania
IPPs Independent Power Producers
IRENA International Renewable Energy Agency
IWRM Integrated Water Resources Management
LCOE Levelized Cost Of Energy
MERIS Medium Resolution Imaging Spectrometer
Mhylab Mini-hydraulics laboratory
NASA National Aeronautics and Space Administration
NCAA Ngorongoro Conservation Area Authority
RE Renewable Energy
REA Rural Energy Agency
SHER SHER Ingénieurs-Conseils (Artelia Group)
SPPs Small Power Producers
SRTM Shuttle Radar Topography Mission
TANAPA Tanzania National Parks
TANESCO Tanzania Electric Supply Company
TAWA Tanzania Wildlife Management Authority
TFS Tanzania Forest Services
UN United Nations
UNESCO United Nations Educational, Scientific and Cultural Organization
USAID United States Agency for International Development
WMB Water Management Basin
Units
Length
1 km = 1,000 m
1 mile = 1.56 km
1 foot = 0.3048 m
Volume
1 dm3 = 1 liter = 0.001 m3
1 hm3 = 1,000,000 m3 = 0.001 km3
1 km3 = 1 billion m3
Area
1 are = 100 m2 = 0.01 ha
1 ha = 10,000 m2
1 km2 = 1,000,000 m2 = 100 ha
1 acre = 4,047 m2 = 0.4047 ha
Capacity and energy
1 MW = 1,000 kW = 1,000,000 W
1 GWh = 1,000 MWh = 1,000,000 kWh
HYDRO-ATLAS OF TANZANIA Acknowledgements
Page v
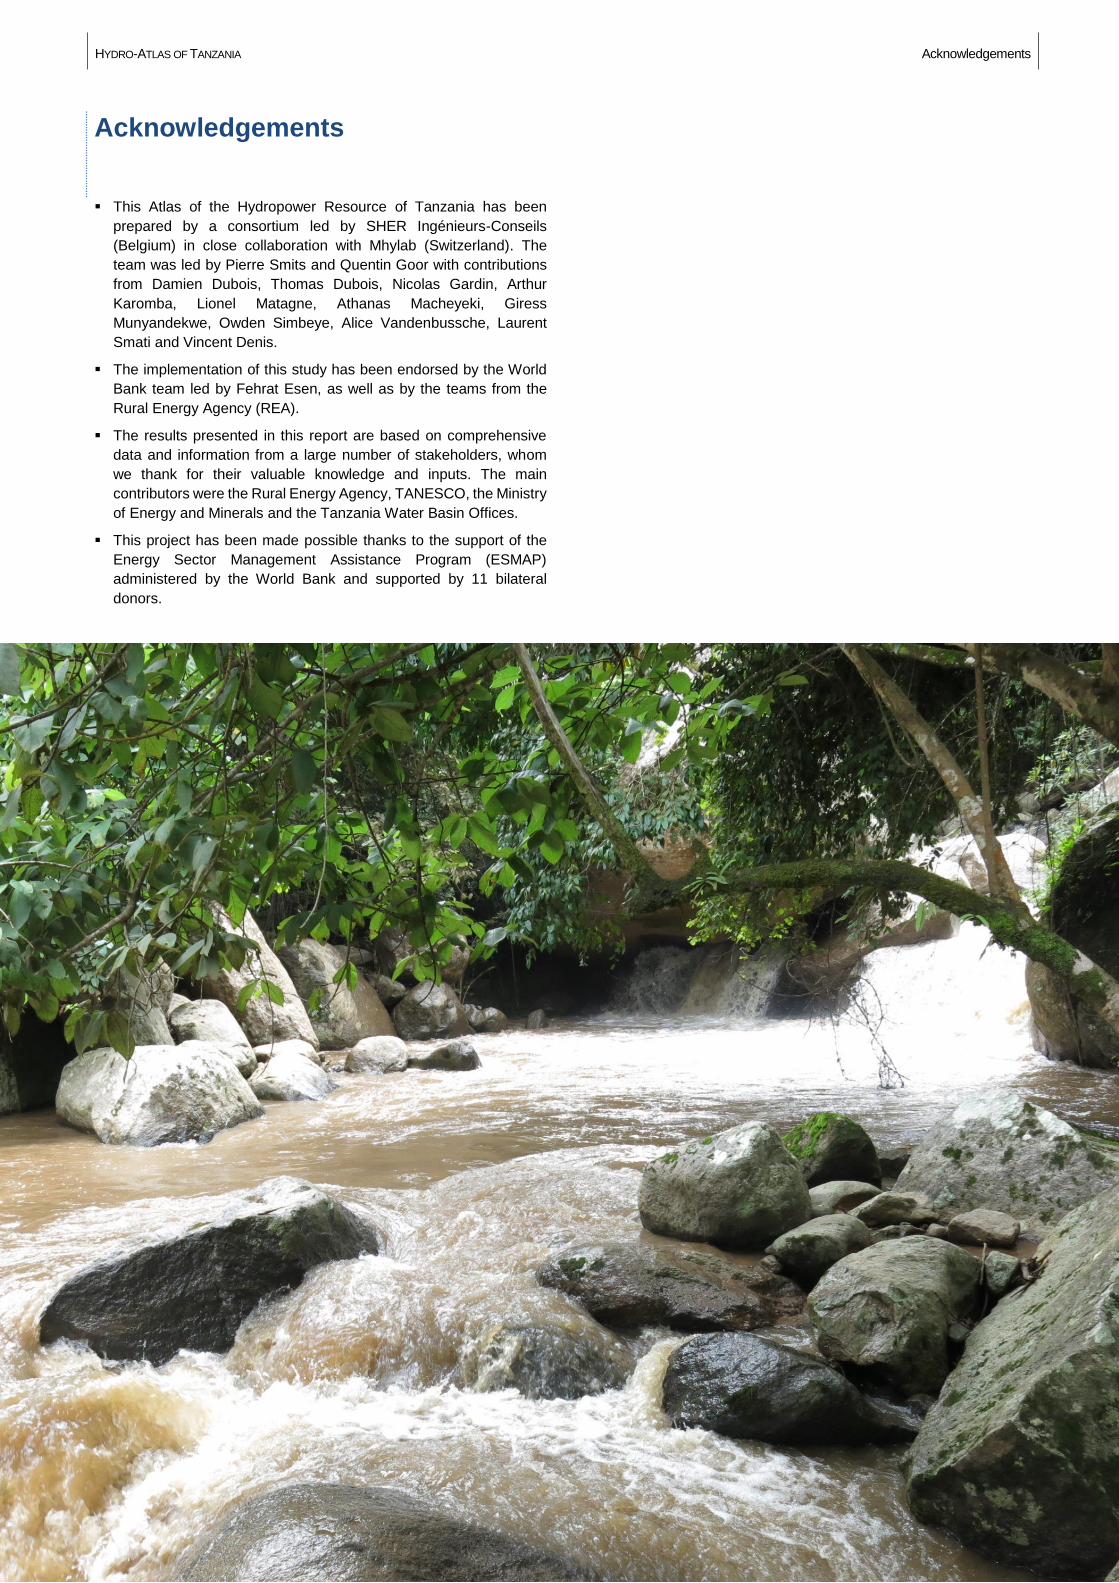
Acknowledgements
This Atlas of the Hydropower Resource of Tanzania has been
prepared by a consortium led by SHER Ingénieurs-Conseils
(Belgium) in close collaboration with Mhylab (Switzerland). The
team was led by Pierre Smits and Quentin Goor with contributions
from Damien Dubois, Thomas Dubois, Nicolas Gardin, Arthur
Karomba, Lionel Matagne, Athanas Macheyeki, Giress
Munyandekwe, Owden Simbeye, Alice Vandenbussche, Laurent
Smati and Vincent Denis.
The implementation of this study has been endorsed by the World
Bank team led by Fehrat Esen, as well as by the teams from the
Rural Energy Agency (REA).
The results presented in this report are based on comprehensive
data and information from a large number of stakeholders, whom
we thank for their valuable knowledge and inputs. The main
contributors were the Rural Energy Agency, TANESCO, the Ministry
of Energy and Minerals and the Tanzania Water Basin Offices.
This project has been made possible thanks to the support of the
Energy Sector Management Assistance Program (ESMAP)
administered by the World Bank and supported by 11 bilateral
donors.
HYDRO-ATLAS OF TANZANIA
Page vi
HYDRO-ATLAS OF TANZANIA Preface
Page vii
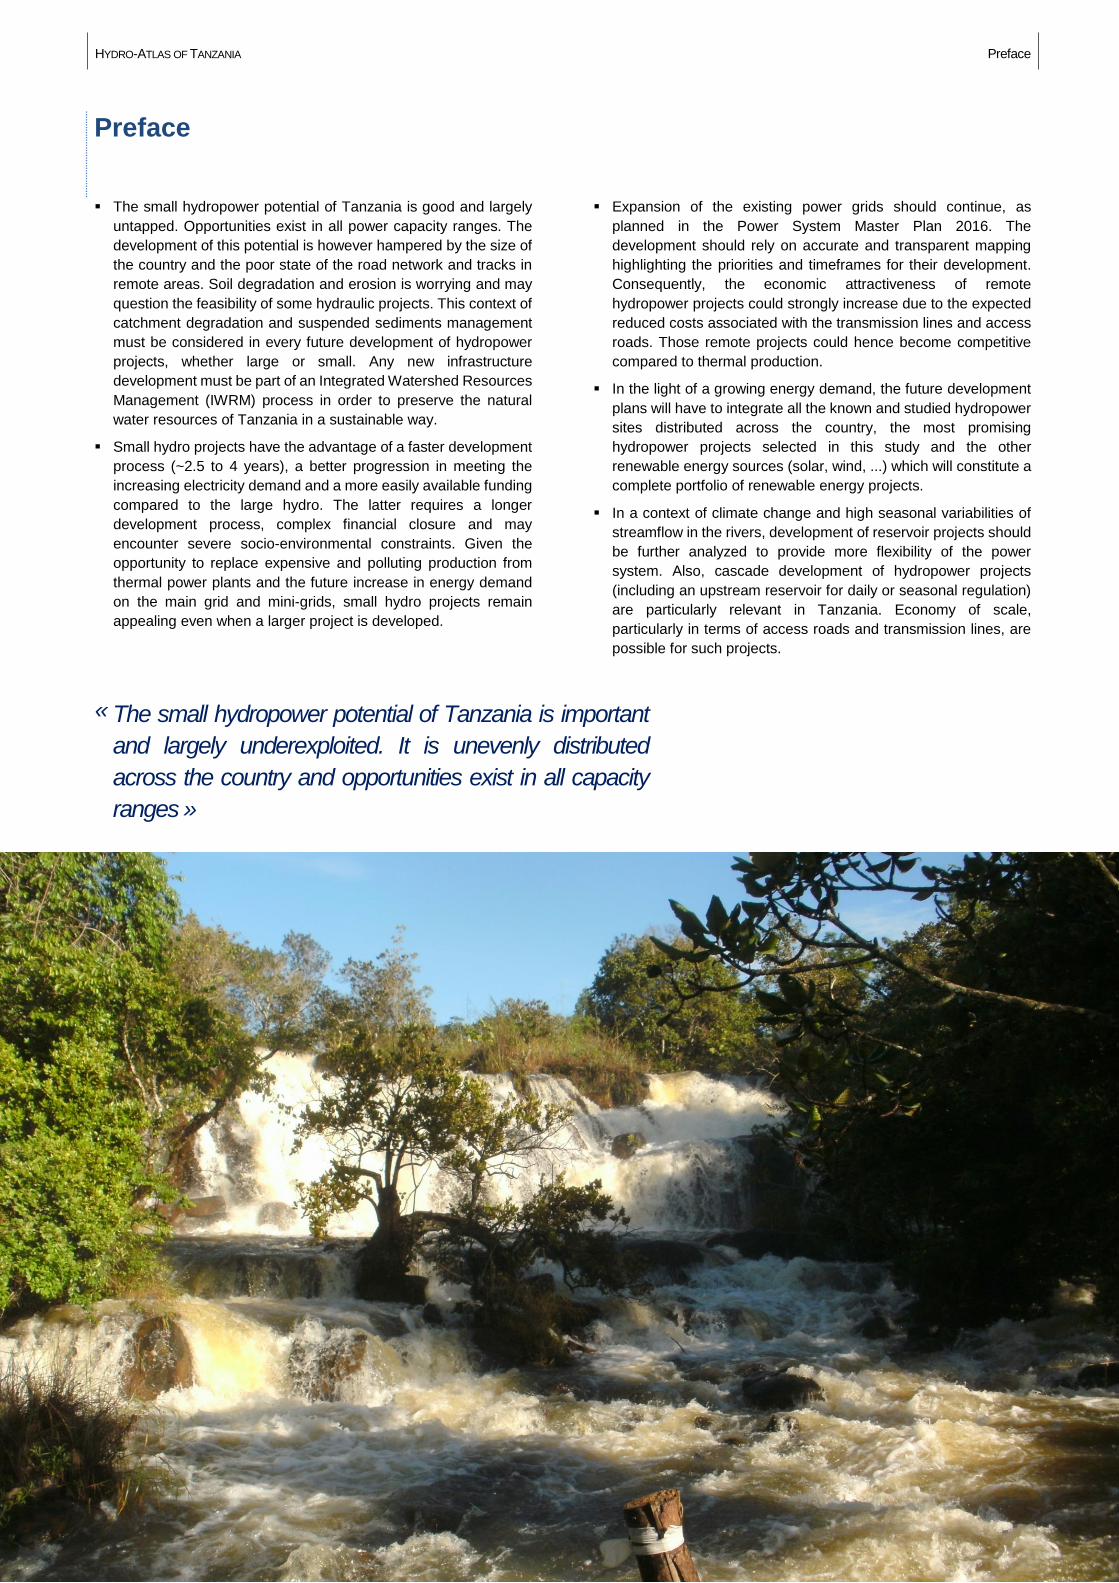
Preface
The small hydropower potential of Tanzania is good and largely
untapped. Opportunities exist in all power capacity ranges. The
development of this potential is however hampered by the size of
the country and the poor state of the road network and tracks in
remote areas. Soil degradation and erosion is worrying and may
question the feasibility of some hydraulic projects. This context of
catchment degradation and suspended sediments management
must be considered in every future development of hydropower
projects, whether large or small. Any new infrastructure
development must be part of an Integrated Watershed Resources
Management (IWRM) process in order to preserve the natural
water resources of Tanzania in a sustainable way.
Small hydro projects have the advantage of a faster development
process (~2.5 to 4 years), a better progression in meeting the
increasing electricity demand and a more easily available funding
compared to the large hydro. The latter requires a longer
development process, complex financial closure and may
encounter severe socio-environmental constraints. Given the
opportunity to replace expensive and polluting production from
thermal power plants and the future increase in energy demand
on the main grid and mini-grids, small hydro projects remain
appealing even when a larger project is developed.
Expansion of the existing power grids should continue, as
planned in the Power System Master Plan 2016. The
development should rely on accurate and transparent mapping
highlighting the priorities and timeframes for their development.
Consequently, the economic attractiveness of remote
hydropower projects could strongly increase due to the expected
reduced costs associated with the transmission lines and access
roads. Those remote projects could hence become competitive
compared to thermal production.
In the light of a growing energy demand, the future development
plans will have to integrate all the known and studied hydropower
sites distributed across the country, the most promising
hydropower projects selected in this study and the other
renewable energy sources (solar, wind, ...) which will constitute a
complete portfolio of renewable energy projects.
In a context of climate change and high seasonal variabilities of
streamflow in the rivers, development of reservoir projects should
be further analyzed to provide more flexibility of the power
system. Also, cascade development of hydropower projects
(including an upstream reservoir for daily or seasonal regulation)
are particularly relevant in Tanzania. Economy of scale,
particularly in terms of access roads and transmission lines, are
possible for such projects.
The small hydropower potential of Tanzania is important
and largely underexploited. It is unevenly distributed
across the country and opportunities exist in all capacity
ranges »
«

HYDRO-ATLAS OF TANZANIA
Page A.1
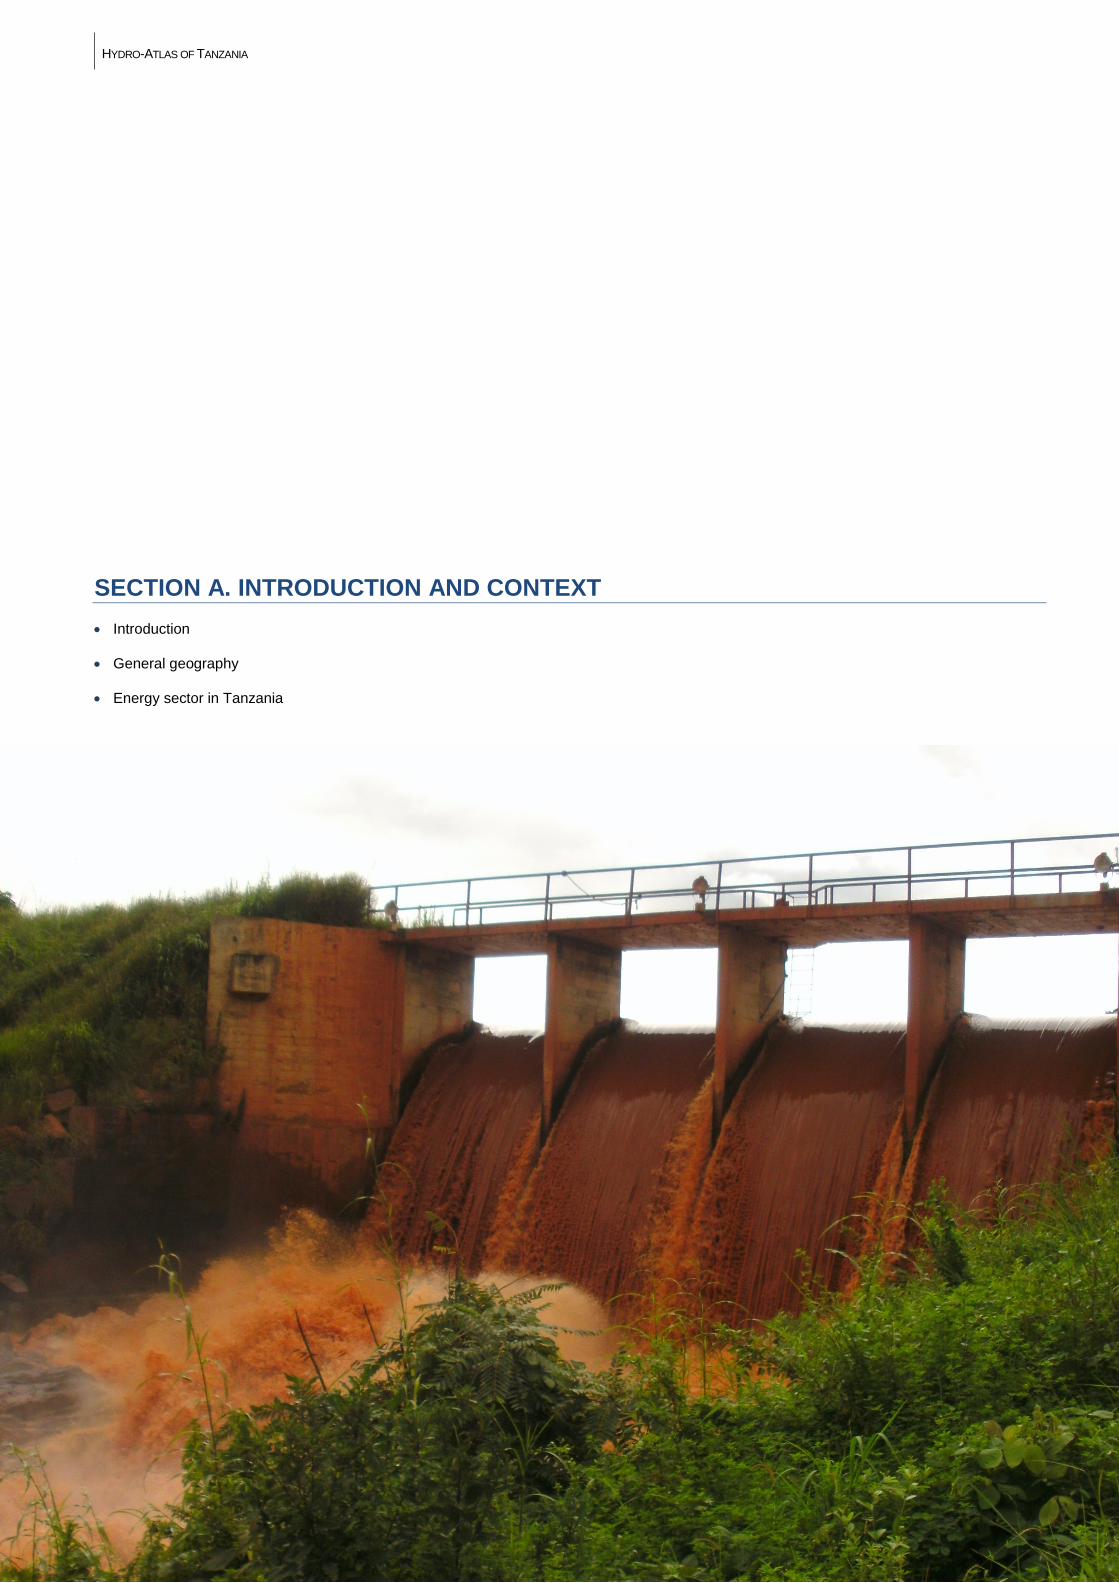
SECTION A. INTRODUCTION AND CONTEXT
Introduction
General geography
Energy sector in Tanzania
HYDRO-ATLAS OF TANZANIA
Introduction
Page A.2
HYDRO-ATLAS OF TANZANIA
Introduction
Page A.3
Chapter 1. Introduction
1.1. GENERAL CONTEXT OF THE ESMAP PROGRAM
ESMAP (Energy Sector Management Assistance Program) is a
technical assistance program administered by the World Bank
and supported by 11 bilateral donors. In January 2013, ESMAP
has launched an initiative that will support country-driven efforts
to improve awareness about renewable energy resources (RE),
to implement appropriate policy frameworks for RE development,
and to provide “open access” to resources and geospatial
mapping data.
This initiative will also support the IRENA-Global Atlas by
improving the availability and quality of the data that can be
consulted through the interactive Atlas.
This "Renewable Energy Mapping: Small Hydro Tanzania" study,
is part of a technical assistance project, ESMAP funded, being
implemented by Africa Energy Practice 1 (AFTG1) of the World
Bank in Tanzania (the ‘Client’) which aims at supporting resource
mapping and geospatial planning for small hydro.
It is being undertaken in close coordination with the Rural Energy
Agency (REA) of Tanzania, the World Bank’s primary Client
country counterpart for this study.
1.2. STUDY OBJECTIVES AND SCOPE OF WORK
The objectives of the present study " Renewable Energy Mapping:
Small Hydro Tanzania " are the following:
The improvement of the quality and availability of information on
Tanzania’s small hydropower resources;
Provide the Government of Tanzania (GoT) and commercial
developers with ground-validated maps that show the varying
level of hydropower potential throughout the country ;
Highlight several sites most suited for small hydropower projects
development.
The objectives of the resource maps are:
To contribute to a detailed comprehensive assessment and to a
geospatial planning framework of small hydro resources in
Tanzania;
To verify the potential for the most promising sites and prioritized
sites to facilitate new small hydropower projects and ideally to
guide private investments into the sector;
To increase the awareness and knowledge of the Client on RE
potential.
The expected results from the study are:
Assembled data in a geographical database (GIS);
A thematic atlas on hydropower in Tanzania with a particular
emphasis on small hydro; and
Recommendations to develop the small hydropower sector in
Tanzania.
The 3 phases of the ESMAP study are :
PHASE 1: Initial scoping and preliminary mapping of the
resources based on spatial analysis and site visits ;
PHASE 2: Field data collection and validation ;
PHASE 3: Production of a validated Atlas of the resources
combining spatial data and field measurements.
All reports produced in the framework of this study are available
for download on the ESMAP website at https://www.esmap.org.
Figure 1. Reconnaissance of potential sites near the Malagarasi River.
HYDRO-ATLAS OF TANZANIA
Introduction
Page A-4
1.3. FRAME OF THE HYDRO-ATLAS OF TANZANIA
This Hydro-Atlas of Tanzania is a document that contains all the
information directly or indirectly related to hydropower and
collected during Phase 1 and Phase 2 of this study. The
information has been compiled and processed in a Geographic
Information System (GIS) and is presented as thematic maps,
tables, graphs and various illustrations. The Hydro-Atlas also
includes the results of the prioritization of promising sites, as
discussed during the Phase 1 and presented in the Hydro
Mapping Report of April 2015.
The information of this Atlas presents the hydropower potential of
Tanzania including the new potential sites identified by the
consulting engineering firm SHER (ARTELIA Group) within
the framework of this study, using the SiteFinder tool as well as
the existing hydropower sites. The creation of the Atlas started
with Phase 1 of the study. The Atlas has been updated at the end
of Phase 3, by including new information collected on the field and
updating the contextual information.
The Geographic Information System has been designed to meet
the compatibility and standardization requirements defined in the
terms of reference so that geographic data can be easily
published on the World Bank GIS platform. In addition, the
consultant used the free of charge GIS software QuantumGIS for
processing and publishing the geographic data, which makes it
possible to disseminate and transfer the data free of charge
during the training sessions carried out at the end of Phase 1.
The present Hydro-Atlas of Tanzania focuses exclusively on
potential sites in the range of capacities between 0.3 and 10 MW.
1.4. HYDROPOWER BASICS
Hydropower uses the difference in energy of a water body
between two points at different elevations. The elevation
difference is called the gross head and is expressed in meters
(m). A hydropower project aims to recover this energy in order to
generate electricity. In the absence of a hydropower scheme, this
energy is dissipated in the natural course of the river through the
internal and external friction which is responsible for the river bed
erosion.
The production of hydropower results from the conversion of the
kinetic energy of moving water (in a river or a lake) into
mechanical energy by one or more hydraulic turbines. This
mechanical energy is finally transformed into electrical energy by
generators. The conversion of energy is carried out in a
hydropower station (powerhouse) which houses in particular the
turbines and alternators (Figure 2).
The capacity of a hydropower plant P, expressed in megawatts
(MW), is mainly a function of the gross head H (m) and the flow
rate Q (m³.s-1) passing through the turbines according to the
following equation:
P = ρ x g x Q x H x η
with ρ the water density (kg.m-³), g the acceleration of
gravity (m.s-²) and η (-) the global efficiency of the conversion of
mechanical energy into electrical energy (product of the efficiency
of the turbines, the alternator and the transformer).
The energy is the ability of a system to perform work while the
power expresses the energy transfer per unit of time. The energy
corresponds to the capacity produced by a power plant for a
certain period. For example, 1 MWh is the electrical energy
produced by a 1 MW (1,000,000 W) power plant in one hour.
The hydropower is a renewable energy.
There are two main types of hydropower schemes:
Storage hydropower: In this type of scheme, the
hydropower plant benefits from the regulating capacity of the
reservoir to modulate the quantity of water conveyed to the
turbines and consequently its energy production. This type of
project therefore allows a production that can be modulated
according to the energy demand on the grid. In addition, if the
storage capacity of the reservoir is large enough, it can store
the excess water during the wet season (or year) to
redistribute it during the dry season (year). This type of
projects and its operation are therefore one of the key
elements of adaptation strategies to the effects of climate
change.
Run-of-the-river hydropower: In this type of scheme, the
hydropower plant is directly supplied by an intake or diversion
structure in the river and has only a very limited or zero
storage capacity. In this case, the available power is mainly
a function of the streamflow in the river.
In the context of this study focusing on small hydro, only run-of-
the-river projects have been considered.
Figure 2. Schematic layout of run-of-the-river hydropower.
HYDRO-ATLAS OF TANZANIA
General geography
Page A.5
Chapter 2. General geography
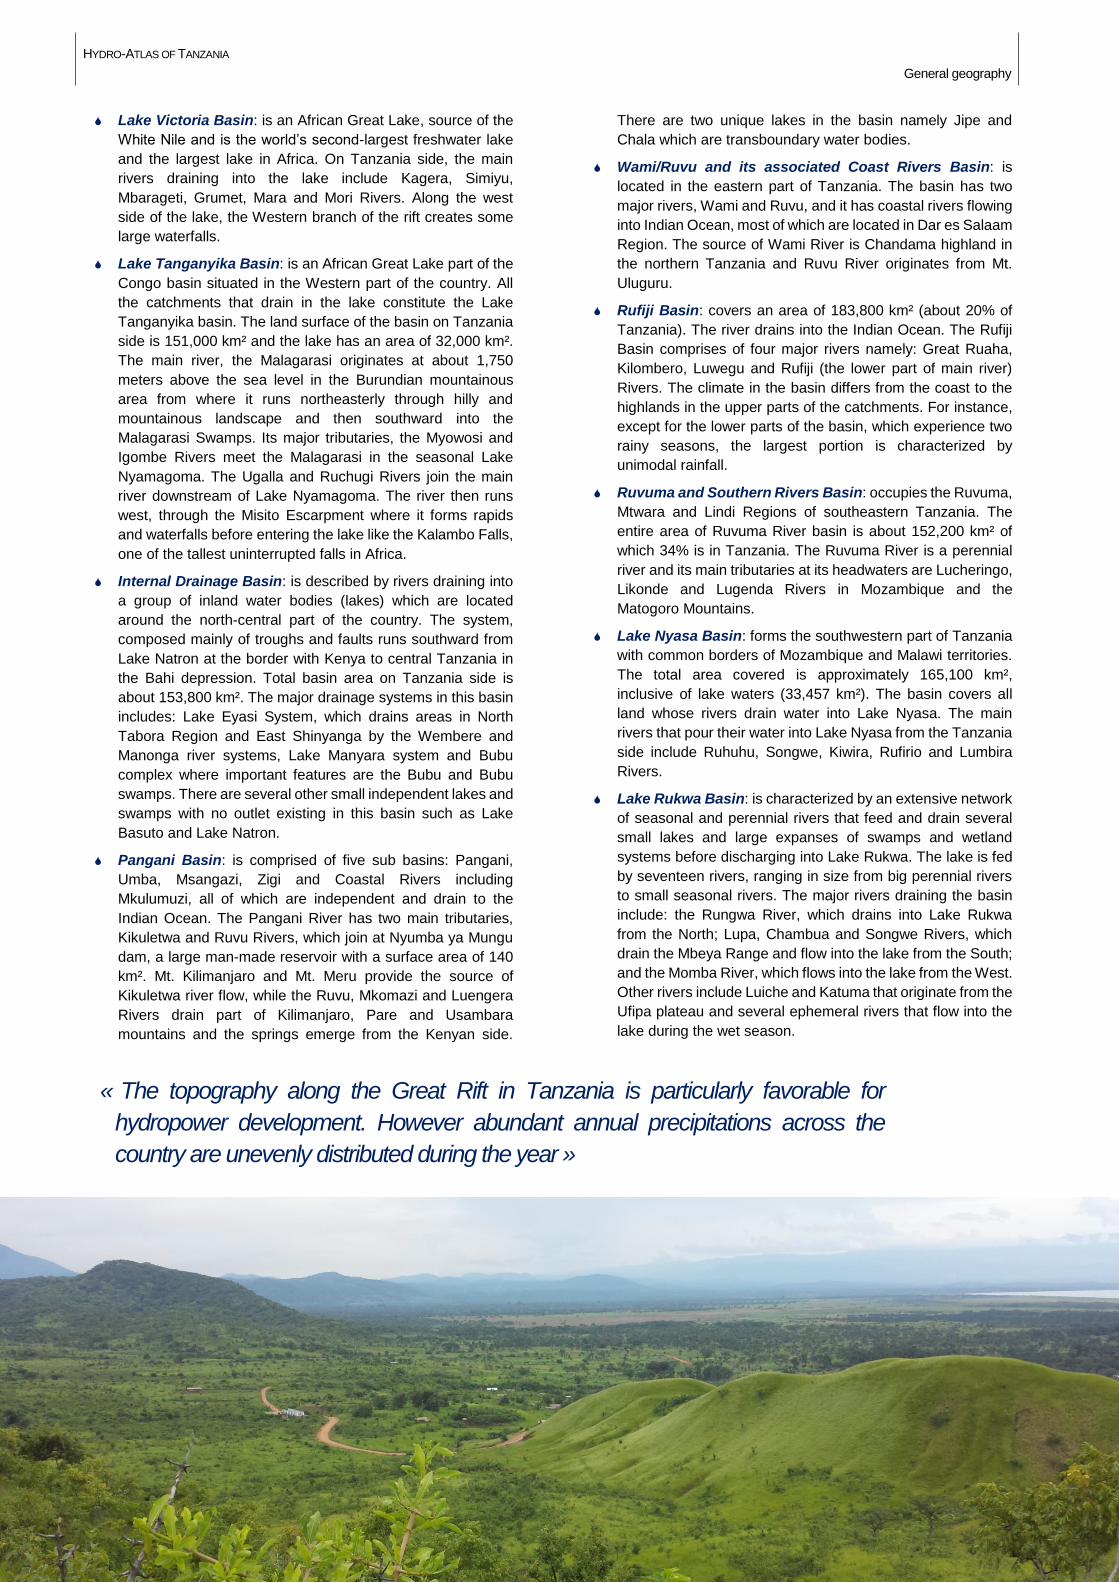
2.1. TOPOGRAPHY: ALTIMETRY AND SLOPES
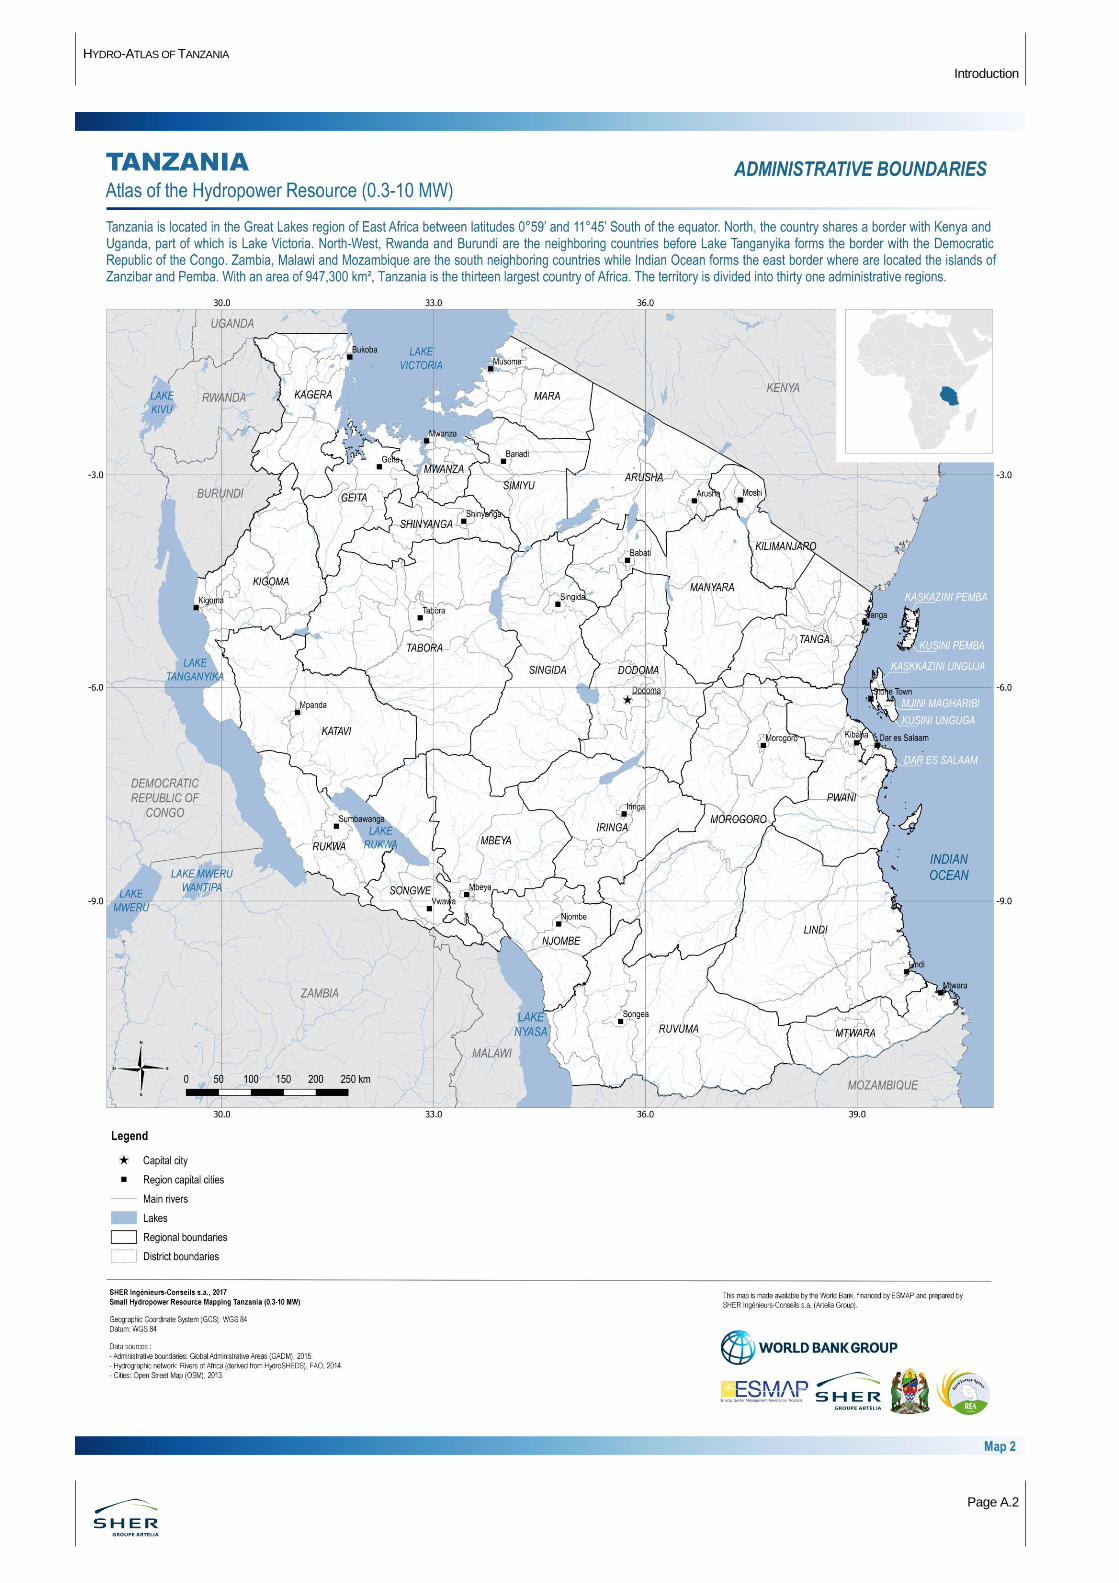
The United Republic of Tanzania consists of the Mainland and
Zanzibar, and is located in the Great Lakes region of East Africa
between latitudes 0°59’ and 11°45’ south of the equator (Map 2).
North, the country shares a border with Kenya and Uganda. Lake
Victoria forms a natural border with Uganda. North-West, Rwanda
and Burundi are the neighboring countries. The country is
bounded to the West by the Lake Tanganyika, which separates it
from the Democratic Republic of the Congo. Zambia, Malawi and
Mozambique are the South neighboring countries. Indian Ocean
forms the East border. Tanzania is the thirteen largest country of
Africa with a total surface area of 947,300 km².
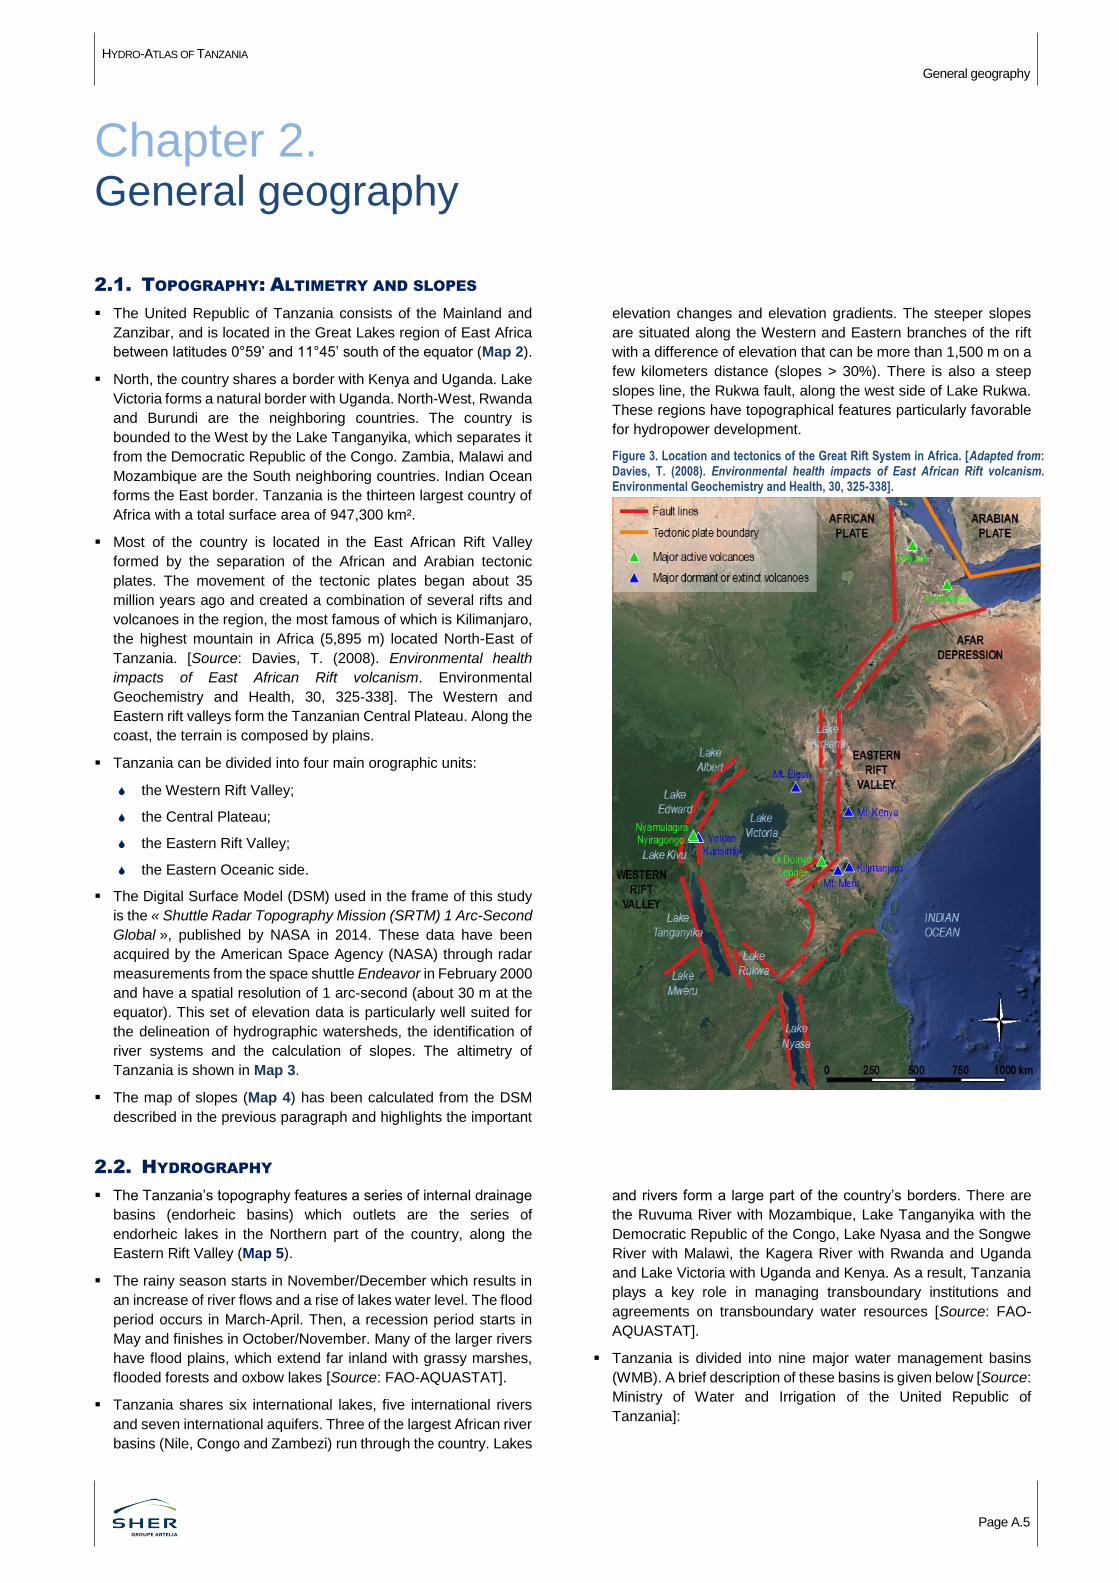
Most of the country is located in the East African Rift Valley
formed by the separation of the African and Arabian tectonic
plates. The movement of the tectonic plates began about 35
million years ago and created a combination of several rifts and
volcanoes in the region, the most famous of which is Kilimanjaro,
the highest mountain in Africa (5,895 m) located North-East of
Tanzania. [Source: Davies, T. (2008). Environmental health
impacts of East African Rift volcanism. Environmental
Geochemistry and Health, 30, 325-338]. The Western and
Eastern rift valleys form the Tanzanian Central Plateau. Along the
coast, the terrain is composed by plains.
Tanzania can be divided into four main orographic units:
the Western Rift Valley;
the Central Plateau;
the Eastern Rift Valley;
the Eastern Oceanic side.
The Digital Surface Model (DSM) used in the frame of this study
is the « Shuttle Radar Topography Mission (SRTM) 1 Arc-Second
Global », published by NASA in 2014. These data have been
acquired by the American Space Agency (NASA) through radar
measurements from the space shuttle Endeavor in February 2000
and have a spatial resolution of 1 arc-second (about 30 m at the
equator). This set of elevation data is particularly well suited for
the delineation of hydrographic watersheds, the identification of
river systems and the calculation of slopes. The altimetry of
Tanzania is shown in Map 3.
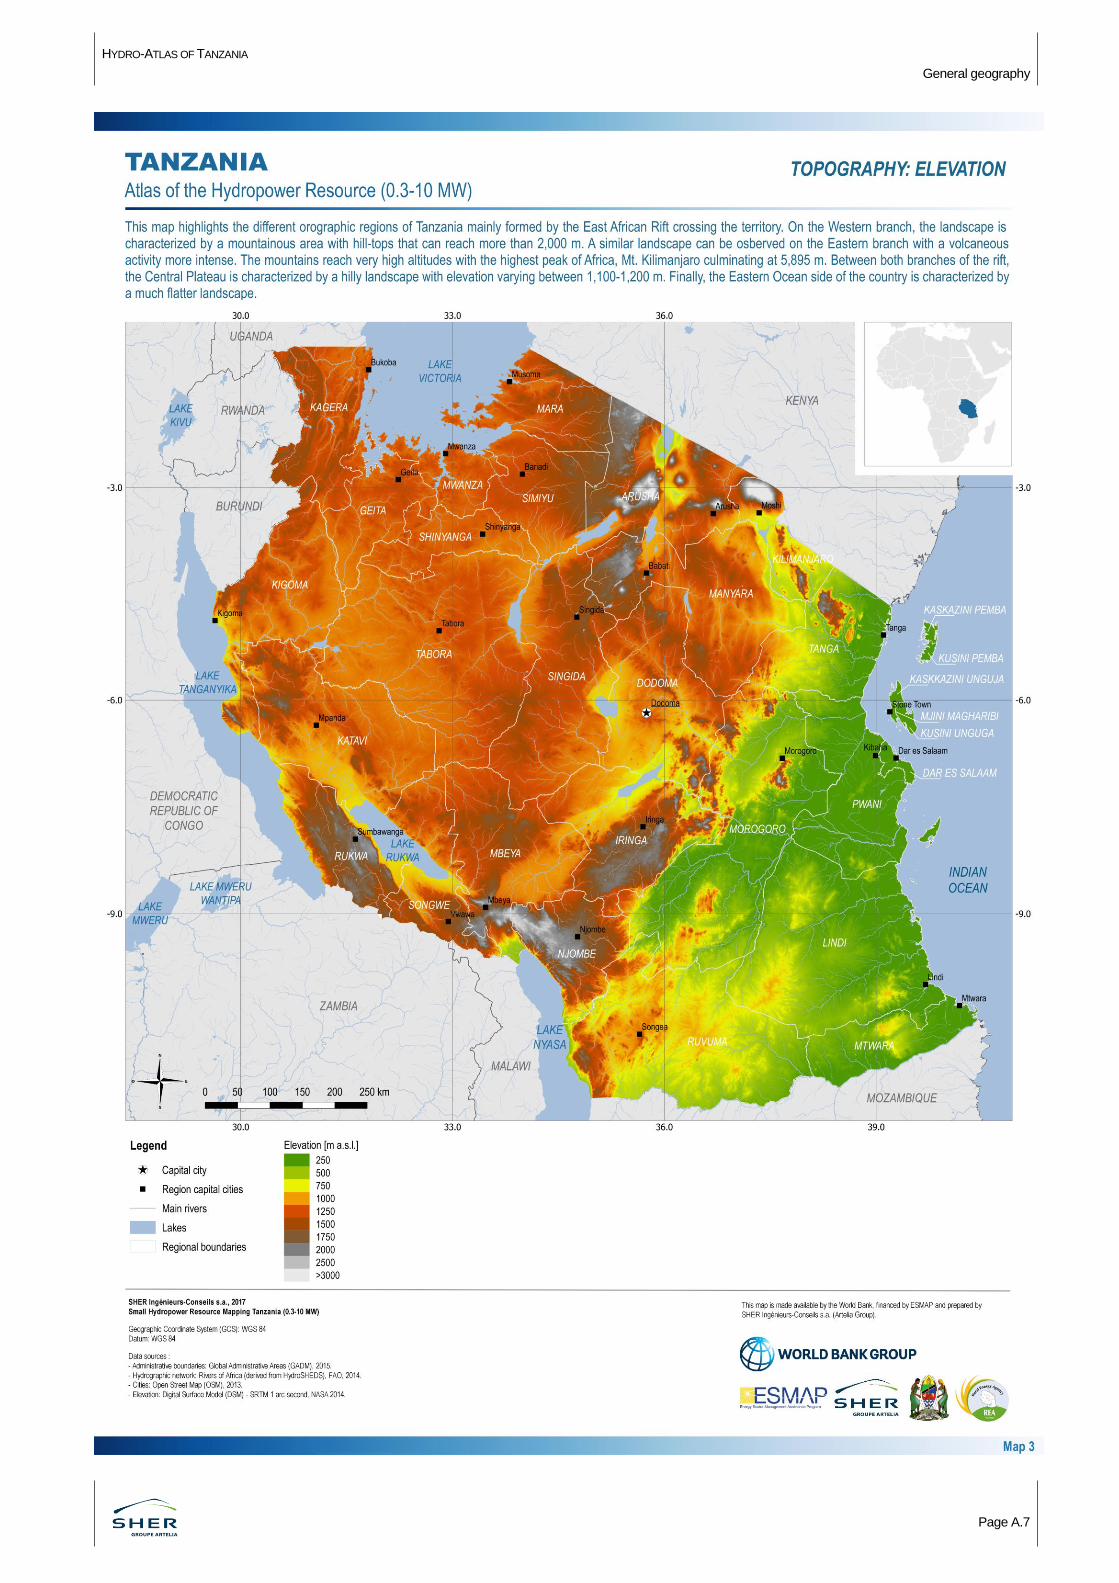
The map of slopes (Map 4) has been calculated from the DSM
described in the previous paragraph and highlights the important
elevation changes and elevation gradients. The steeper slopes
are situated along the Western and Eastern branches of the rift
with a difference of elevation that can be more than 1,500 m on a
few kilometers distance (slopes > 30%). There is also a steep
slopes line, the Rukwa fault, along the west side of Lake Rukwa.
These regions have topographical features particularly favorable
for hydropower development.
Figure 3. Location and tectonics of the Great Rift System in Africa. [Adapted from: Davies, T. (2008). Environmental health impacts of East African Rift volcanism. Environmental Geochemistry and Health, 30, 325-338].
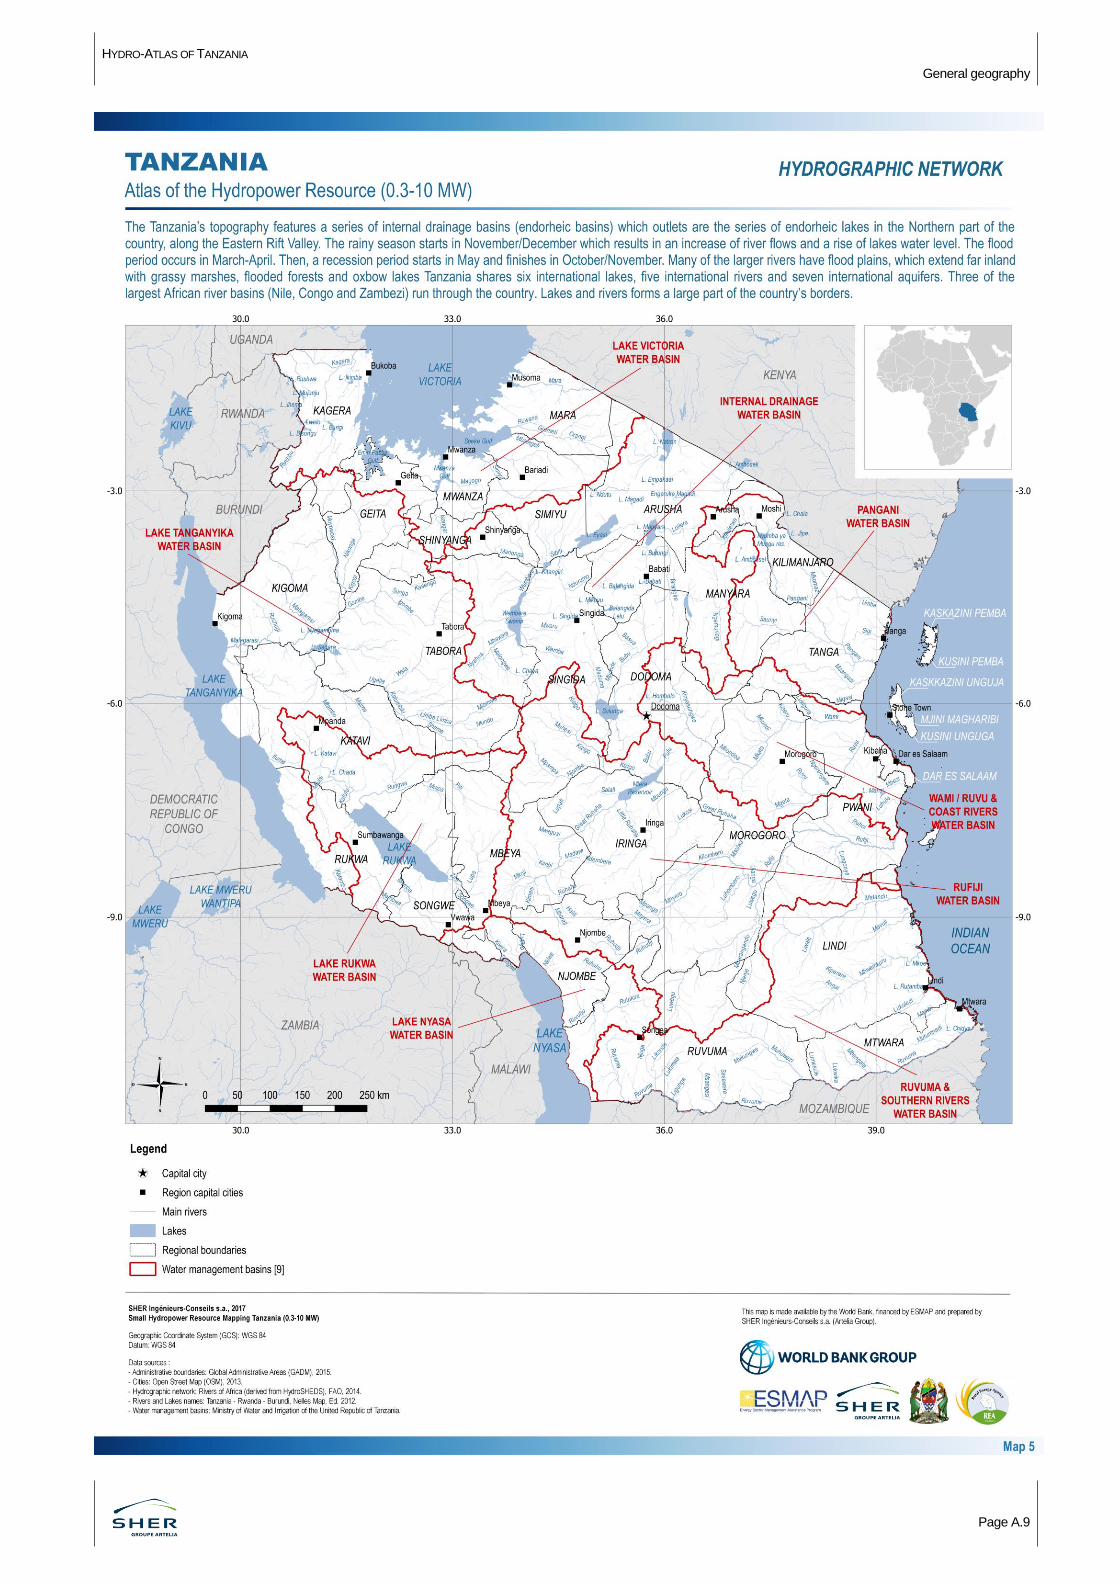
2.2. HYDROGRAPHY
The Tanzania’s topography features a series of internal drainage
basins (endorheic basins) which outlets are the series of
endorheic lakes in the Northern part of the country, along the
Eastern Rift Valley (Map 5).
The rainy season starts in November/December which results in
an increase of river flows and a rise of lakes water level. The flood
period occurs in March-April. Then, a recession period starts in
May and finishes in October/November. Many of the larger rivers
have flood plains, which extend far inland with grassy marshes,
flooded forests and oxbow lakes [Source: FAO-AQUASTAT].
Tanzania shares six international lakes, five international rivers
and seven international aquifers. Three of the largest African river
basins (Nile, Congo and Zambezi) run through the country. Lakes
and rivers form a large part of the country’s borders. There are
the Ruvuma River with Mozambique, Lake Tanganyika with the
Democratic Republic of the Congo, Lake Nyasa and the Songwe
River with Malawi, the Kagera River with Rwanda and Uganda
and Lake Victoria with Uganda and Kenya. As a result, Tanzania
plays a key role in managing transboundary institutions and
agreements on transboundary water resources [Source: FAO-
AQUASTAT].
Tanzania is divided into nine major water management basins
(WMB). A brief description of these basins is given below [Source:
Ministry of Water and Irrigation of the United Republic of
Tanzania]:
HYDRO-ATLAS OF TANZANIA
General geography
Page A.6
Lake Victoria Basin: is an African Great Lake, source of the
White Nile and is the world’s second-largest freshwater lake
and the largest lake in Africa. On Tanzania side, the main
rivers draining into the lake include Kagera, Simiyu,
Mbarageti, Grumet, Mara and Mori Rivers. Along the west
side of the lake, the Western branch of the rift creates some
large waterfalls.
Lake Tanganyika Basin: is an African Great Lake part of the
Congo basin situated in the Western part of the country. All
the catchments that drain in the lake constitute the Lake
Tanganyika basin. The land surface of the basin on Tanzania
side is 151,000 km² and the lake has an area of 32,000 km².
The main river, the Malagarasi originates at about 1,750
meters above the sea level in the Burundian mountainous
area from where it runs northeasterly through hilly and
mountainous landscape and then southward into the
Malagarasi Swamps. Its major tributaries, the Myowosi and
Igombe Rivers meet the Malagarasi in the seasonal Lake
Nyamagoma. The Ugalla and Ruchugi Rivers join the main
river downstream of Lake Nyamagoma. The river then runs
west, through the Misito Escarpment where it forms rapids
and waterfalls before entering the lake like the Kalambo Falls,
one of the tallest uninterrupted falls in Africa.
Internal Drainage Basin: is described by rivers draining into
a group of inland water bodies (lakes) which are located
around the north-central part of the country. The system,
composed mainly of troughs and faults runs southward from
Lake Natron at the border with Kenya to central Tanzania in
the Bahi depression. Total basin area on Tanzania side is
about 153,800 km². The major drainage systems in this basin
includes: Lake Eyasi System, which drains areas in North
Tabora Region and East Shinyanga by the Wembere and
Manonga river systems, Lake Manyara system and Bubu
complex where important features are the Bubu and Bubu
swamps. There are several other small independent lakes and
swamps with no outlet existing in this basin such as Lake
Basuto and Lake Natron.
Pangani Basin: is comprised of five sub basins: Pangani,
Umba, Msangazi, Zigi and Coastal Rivers including
Mkulumuzi, all of which are independent and drain to the
Indian Ocean. The Pangani River has two main tributaries,
Kikuletwa and Ruvu Rivers, which join at Nyumba ya Mungu
dam, a large man-made reservoir with a surface area of 140
km². Mt. Kilimanjaro and Mt. Meru provide the source of
Kikuletwa river flow, while the Ruvu, Mkomazi and Luengera
Rivers drain part of Kilimanjaro, Pare and Usambara
mountains and the springs emerge from the Kenyan side.
There are two unique lakes in the basin namely Jipe and
Chala which are transboundary water bodies.
Wami/Ruvu and its associated Coast Rivers Basin: is
located in the eastern part of Tanzania. The basin has two
major rivers, Wami and Ruvu, and it has coastal rivers flowing
into Indian Ocean, most of which are located in Dar es Salaam
Region. The source of Wami River is Chandama highland in
the northern Tanzania and Ruvu River originates from Mt.
Uluguru.
Rufiji Basin: covers an area of 183,800 km² (about 20% of
Tanzania). The river drains into the Indian Ocean. The Rufiji
Basin comprises of four major rivers namely: Great Ruaha,
Kilombero, Luwegu and Rufiji (the lower part of main river)
Rivers. The climate in the basin differs from the coast to the
highlands in the upper parts of the catchments. For instance,
except for the lower parts of the basin, which experience two
rainy seasons, the largest portion is characterized by
unimodal rainfall.
Ruvuma and Southern Rivers Basin: occupies the Ruvuma,
Mtwara and Lindi Regions of southeastern Tanzania. The
entire area of Ruvuma River basin is about 152,200 km² of
which 34% is in Tanzania. The Ruvuma River is a perennial
river and its main tributaries at its headwaters are Lucheringo,
Likonde and Lugenda Rivers in Mozambique and the
Matogoro Mountains.
Lake Nyasa Basin: forms the southwestern part of Tanzania
with common borders of Mozambique and Malawi territories.
The total area covered is approximately 165,100 km²,
inclusive of lake waters (33,457 km²). The basin covers all
land whose rivers drain water into Lake Nyasa. The main
rivers that pour their water into Lake Nyasa from the Tanzania
side include Ruhuhu, Songwe, Kiwira, Rufirio and Lumbira
Rivers.
Lake Rukwa Basin: is characterized by an extensive network
of seasonal and perennial rivers that feed and drain several
small lakes and large expanses of swamps and wetland
systems before discharging into Lake Rukwa. The lake is fed
by seventeen rivers, ranging in size from big perennial rivers
to small seasonal rivers. The major rivers draining the basin
include: the Rungwa River, which drains into Lake Rukwa
from the North; Lupa, Chambua and Songwe Rivers, which
drain the Mbeya Range and flow into the lake from the South;
and the Momba River, which flows into the lake from the West.
Other rivers include Luiche and Katuma that originate from the
Ufipa plateau and several ephemeral rivers that flow into the
lake during the wet season.
The topography along the Great Rift in Tanzania is particularly favorable for
hydropower development. However abundant annual precipitations across the
country are unevenly distributed during the year »
«
HYDRO-ATLAS OF TANZANIA
General geography
Page A.7
HYDRO-ATLAS OF TANZANIA
General geography
Page A.8
HYDRO-ATLAS OF TANZANIA
General geography
Page A.9
HYDRO-ATLAS OF TANZANIA
General geography
Page A-10
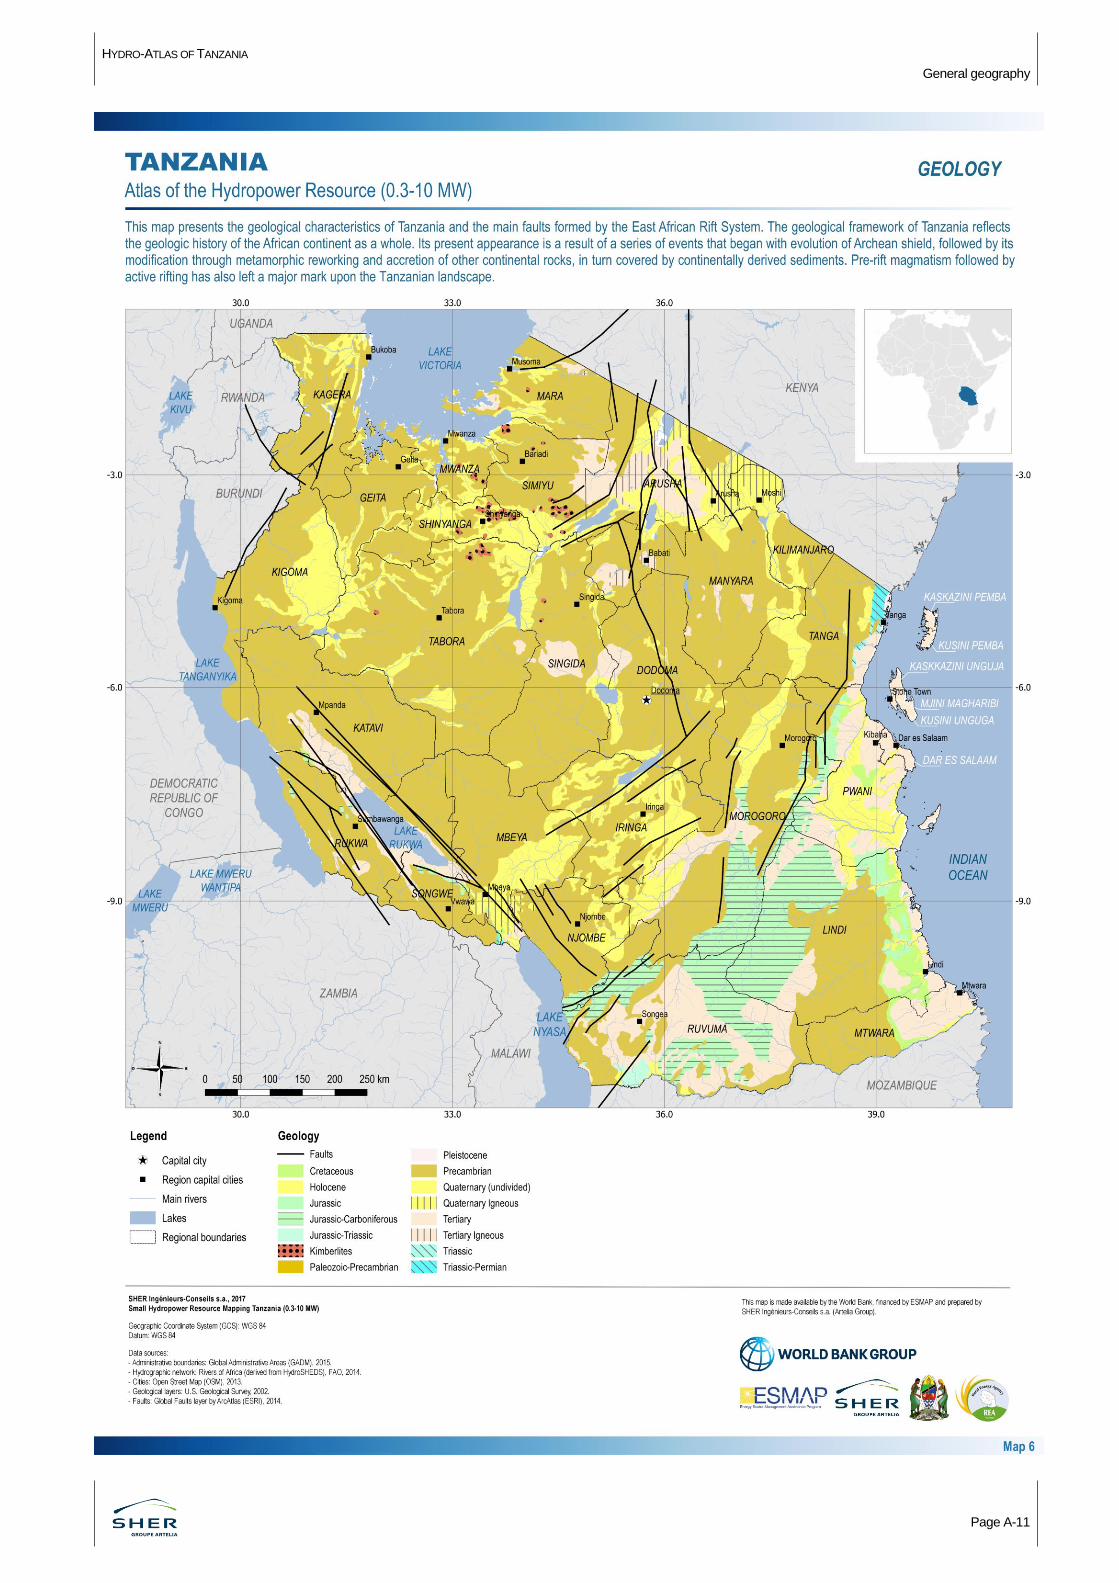
2.3. GEOLOGY
[Source: Sika Resources Inc. (2011), A brief introduction to the
geology and mining industry of Tanzania].
The geological framework of Tanzania is a good representation
of the whole geologic history of the African continent. Archean
evolution, its modification through metamorphic reworking and
accretion of other continental rocks, in turn covered by
continentally derived sediments; all these events have shaped the
nature of the soil.
Pre-rift magmatism followed by active rifting has also left a major
mark upon the Tanzanian landscape.
In the past, geological mapping programs have been
undertakenand have contributed to the identification of several
major litho-structural provinces from Archean (Precambrian) to
recent age. The Archean (Tanzanian) Craton covers a large
area of the western part of the country. It is approximatively
delimited by the East African Rift to the East. Archean rocks
contain various elements such as kimberlite pipes where there
used to have lodes of diamond and gold deposits. The Archean
basement terrain is bounded to the East and West by a
series of Proterozoic mobile belts. This area, on the East side in
particular, hosts most of the country’s wide variety of colored
gemstone deposits. Some recent research suggests that portions
of this assumed Proterozoic terrane may actually consist of
Archean crust that has endured a later phase of higher-grade
metamorphism.
The Phanerozoic is represented by a series of sedimentary units
of Paleozoic to Mesozoic age (Jurassic and Cretaceous). This
was followed by a pre-rift period of kimberlitic and related, alkalic,
mantle-derived intrusive and extrusive activity that presaged
active rifting. Rocks related to this event intrude up to Upper
Mesozoic and Lower Cenozoic sedimentary formations. Next,
came a period of rift-related intrusive and extrusive activity. This
activity was concentrated in the Arusha area in the northeast and
Mbeya area in the southwest that led to the formation of
mountain-sized volcanoes such as Mt. Meru and Mt. Kilimanjaro.
Finally, a wide variety of recent and largely semi- to un-
consolidated wind, water, and weathering-derived recent
formations are found across the country, a number of which host
alluvial gold, diamond, and colored gemstone deposits.
In the modern times, the typical weather of Tanzania is
characterized by a hot climate, long periods of steady rain during
the monsoon period (March through May) followed by a stretch of
hot, dry weather, which has led to the development of deeply
weathered rock formations and thick overlying lateritic and related
soil horizons.
The long, evolved drainage history of the country, considerably
affected by sudden and dramatic changes in geomorphology due
to tectonic events in the past, have led to a complex series of
fluvial, elluvial and alluvial deposits, which host a wide variety of
placer deposits (gold, diamonds, colored gemstones, etc.).
HYDRO-ATLAS OF TANZANIA
General geography
Page A-11
HYDRO-ATLAS OF TANZANIA
General geography
Page A-12
2.4. CLIMATE
2.4.1. Climate factors
[Sources: United Republic of Tanzania (Vice President’s Office),
National Climate Change Strategy, 2012; FAO, 2006].
The climate is diverse within the country due to its size (wide
elevation range which governs temperature and latitude) and is
affected by the ocean and inland lakes.
It is characterized by two main rain seasons namely the long rains
and the short rains. They originates from the southward and
northward movement of the Inter-Tropical Convergence Zone.
The long rains (Masika) begin in the mid of March and end at the
end May, while the short rains (Vuli) begin in the middle of
October and continues to early December. The northern part of
the country including areas around Lake Victoria Basin, North-
Eastern Highlands and the Northern Coast experience a bimodal
rainfall regime. Central, South and Western areas have a
prolonged unimodal rainfall regime starting from November,
continuing to the end of April. More details are given in the table
below (Table 1).
Table 1. Seasons in Tanzania. [Source: FAO, 2006].
MONTH WIND DIRECTION SEASON ZONE
North Central South
December to March NE Kaskazi Dry Dry Wet
March to May Variable Masika Wet Wet Wet
June to September SE Kusi Dry Dry Dry
October to November NE Vuli Wet Wet Wet
The table shows typical seasons in Tanzania but it may vary. High
evapotranspiration rate can reduce the effectiveness of rainfall,
especially in the semi-arid areas (PLDPT, 1984).
The combined influences of altitude, latitude, rainfall and soil
determine the climatic zones of East Africa. Pratt and Gwynne
(1977) classify Tanzania into five agro-ecological zones: afro-
alpine, humid to dry sub-humid, dry sub-humid to semi-arid, semi-
arid and arid.
2.4.2. Rainfall and temperature
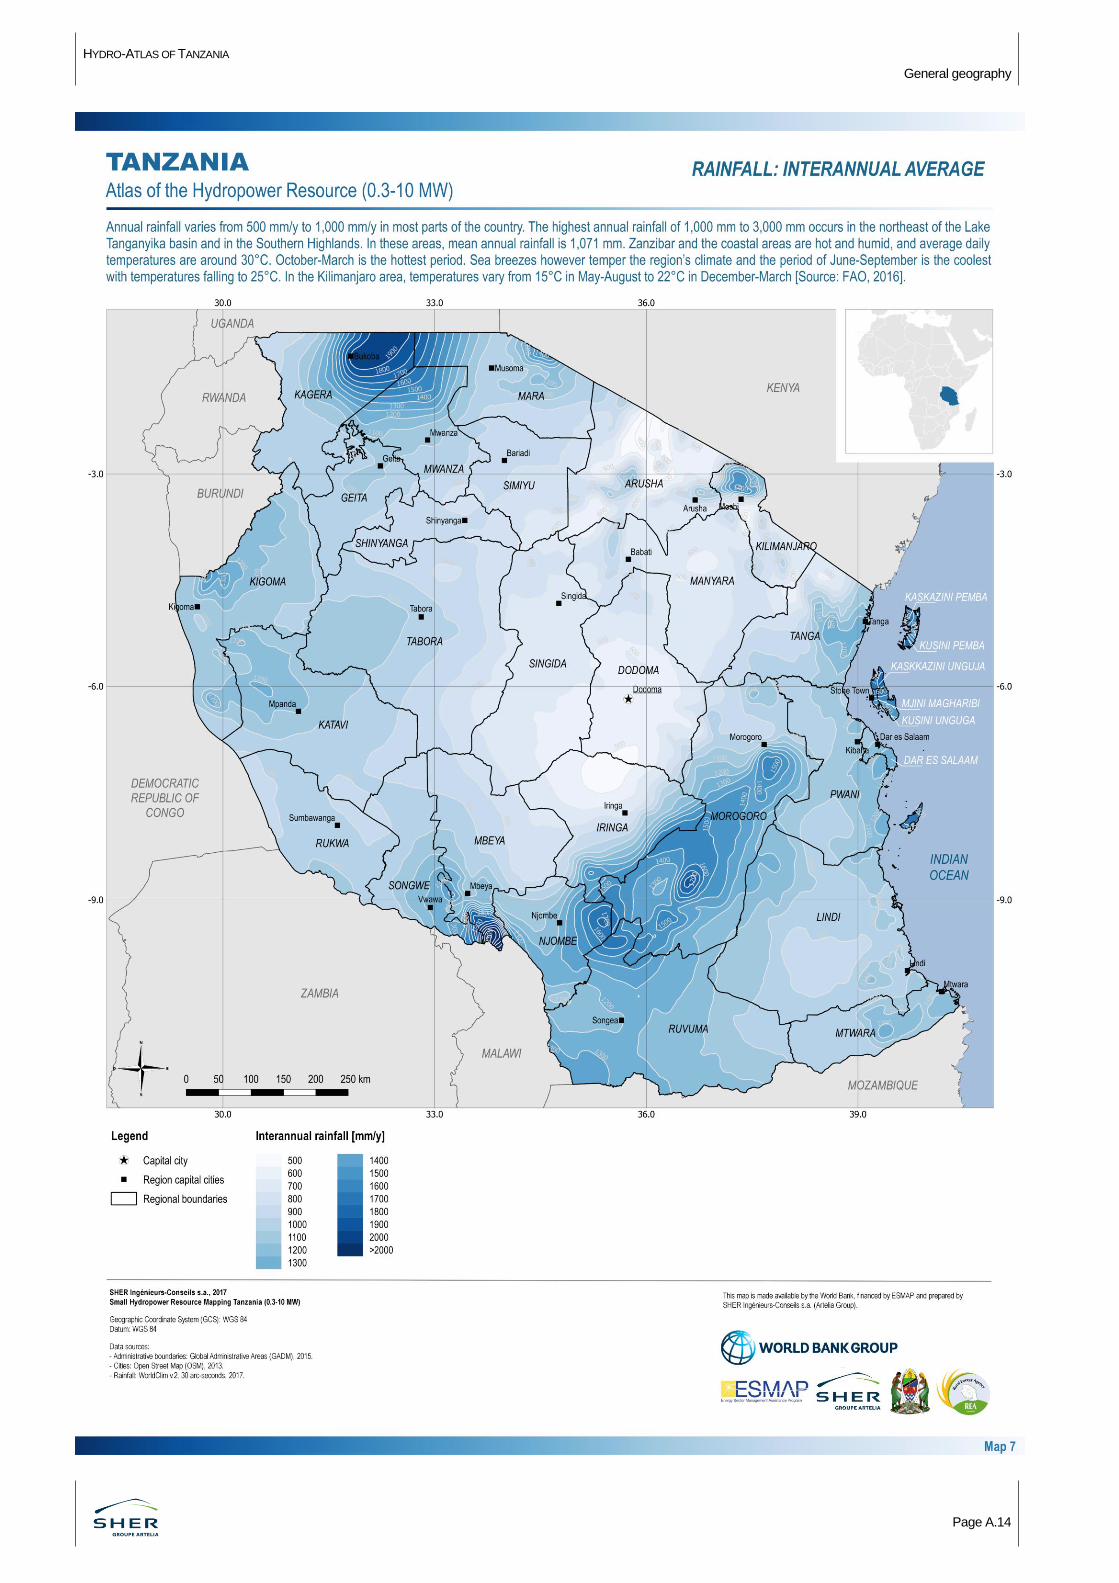
Annual rainfall varies from 500 mm/y to 1,000 mm/y in most parts
of the country. The highest annual rainfall of 1,000 mm to 3,000
mm occurs in the Northeast of the Lake Tanganyika Basin and in
the Southern Highlands. In these areas, mean annual rainfall is
1,071 mm. Zanzibar and the coastal areas are hot and humid, and
average daily temperatures are around 30°C. October-March is
the hottest period. Sea breezes however temper the region’s
climate and the period of June-September is the coolest with
temperatures falling to 25°C. In the Kilimanjaro area,
temperatures vary from 15°C in May-August to 22°C in
December-March [Source: FAO, 2016].
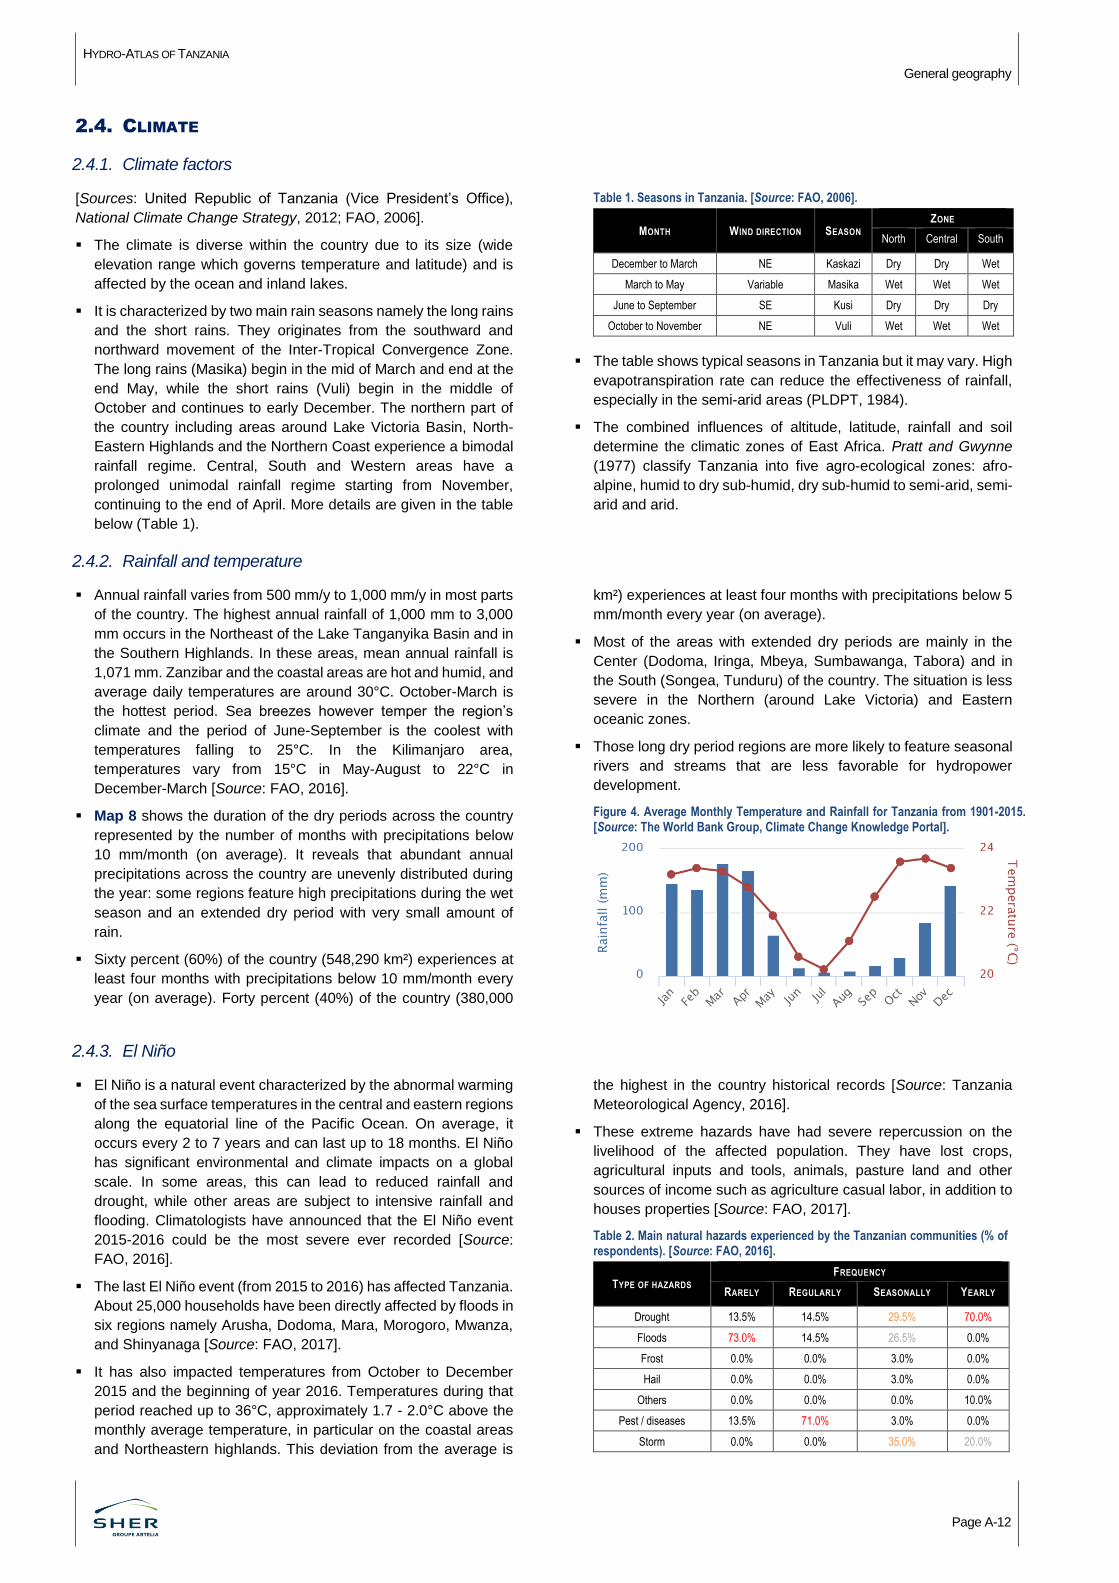
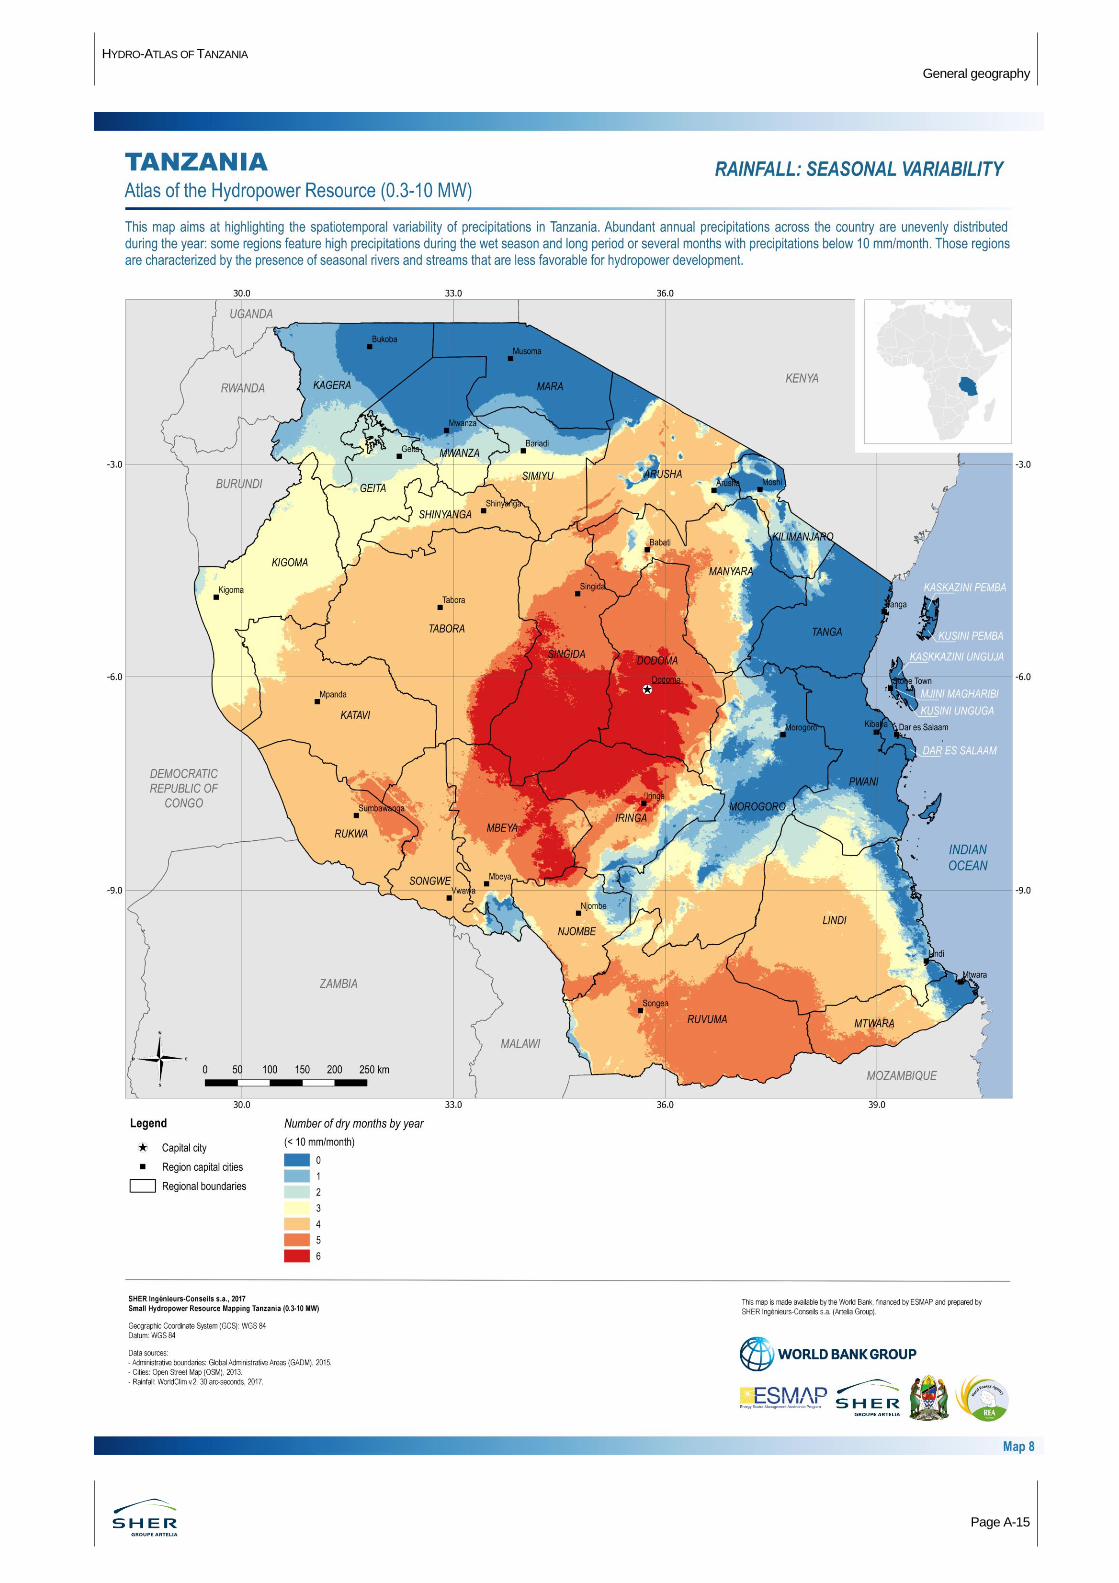
Map 8 shows the duration of the dry periods across the country
represented by the number of months with precipitations below
10 mm/month (on average). It reveals that abundant annual
precipitations across the country are unevenly distributed during
the year: some regions feature high precipitations during the wet
season and an extended dry period with very small amount of
rain.
Sixty percent (60%) of the country (548,290 km²) experiences at
least four months with precipitations below 10 mm/month every
year (on average). Forty percent (40%) of the country (380,000
km²) experiences at least four months with precipitations below 5
mm/month every year (on average).
Most of the areas with extended dry periods are mainly in the
Center (Dodoma, Iringa, Mbeya, Sumbawanga, Tabora) and in
the South (Songea, Tunduru) of the country. The situation is less
severe in the Northern (around Lake Victoria) and Eastern
oceanic zones.
Those long dry period regions are more likely to feature seasonal
rivers and streams that are less favorable for hydropower
development.
Figure 4. Average Monthly Temperature and Rainfall for Tanzania from 1901-2015. [Source: The World Bank Group, Climate Change Knowledge Portal].
2.4.3. El Niño
El Niño is a natural event characterized by the abnormal warming
of the sea surface temperatures in the central and eastern regions
along the equatorial line of the Pacific Ocean. On average, it
occurs every 2 to 7 years and can last up to 18 months. El Niño
has significant environmental and climate impacts on a global
scale. In some areas, this can lead to reduced rainfall and
drought, while other areas are subject to intensive rainfall and
flooding. Climatologists have announced that the El Niño event
2015-2016 could be the most severe ever recorded [Source:
FAO, 2016].
The last El Niño event (from 2015 to 2016) has affected Tanzania.
About 25,000 households have been directly affected by floods in
six regions namely Arusha, Dodoma, Mara, Morogoro, Mwanza,
and Shinyanaga [Source: FAO, 2017].
It has also impacted temperatures from October to December
2015 and the beginning of year 2016. Temperatures during that
period reached up to 36°C, approximately 1.7 - 2.0°C above the
monthly average temperature, in particular on the coastal areas
and Northeastern highlands. This deviation from the average is
the highest in the country historical records [Source: Tanzania
Meteorological Agency, 2016].
These extreme hazards have had severe repercussion on the
livelihood of the affected population. They have lost crops,
agricultural inputs and tools, animals, pasture land and other
sources of income such as agriculture casual labor, in addition to
houses properties [Source: FAO, 2017].
Table 2. Main natural hazards experienced by the Tanzanian communities (% of respondents). [Source: FAO, 2016].
TYPE OF HAZARDS FREQUENCY
RARELY REGULARLY SEASONALLY YEARLY
Drought 13.5% 14.5% 29.5% 70.0%
Floods 73.0% 14.5% 26.5% 0.0%
Frost 0.0% 0.0% 3.0% 0.0%
Hail 0.0% 0.0% 3.0% 0.0%
Others 0.0% 0.0% 0.0% 10.0%
Pest / diseases 13.5% 71.0% 3.0% 0.0%
Storm 0.0% 0.0% 35.0% 20.0%
HYDRO-ATLAS OF TANZANIA
General geography
Page A.13
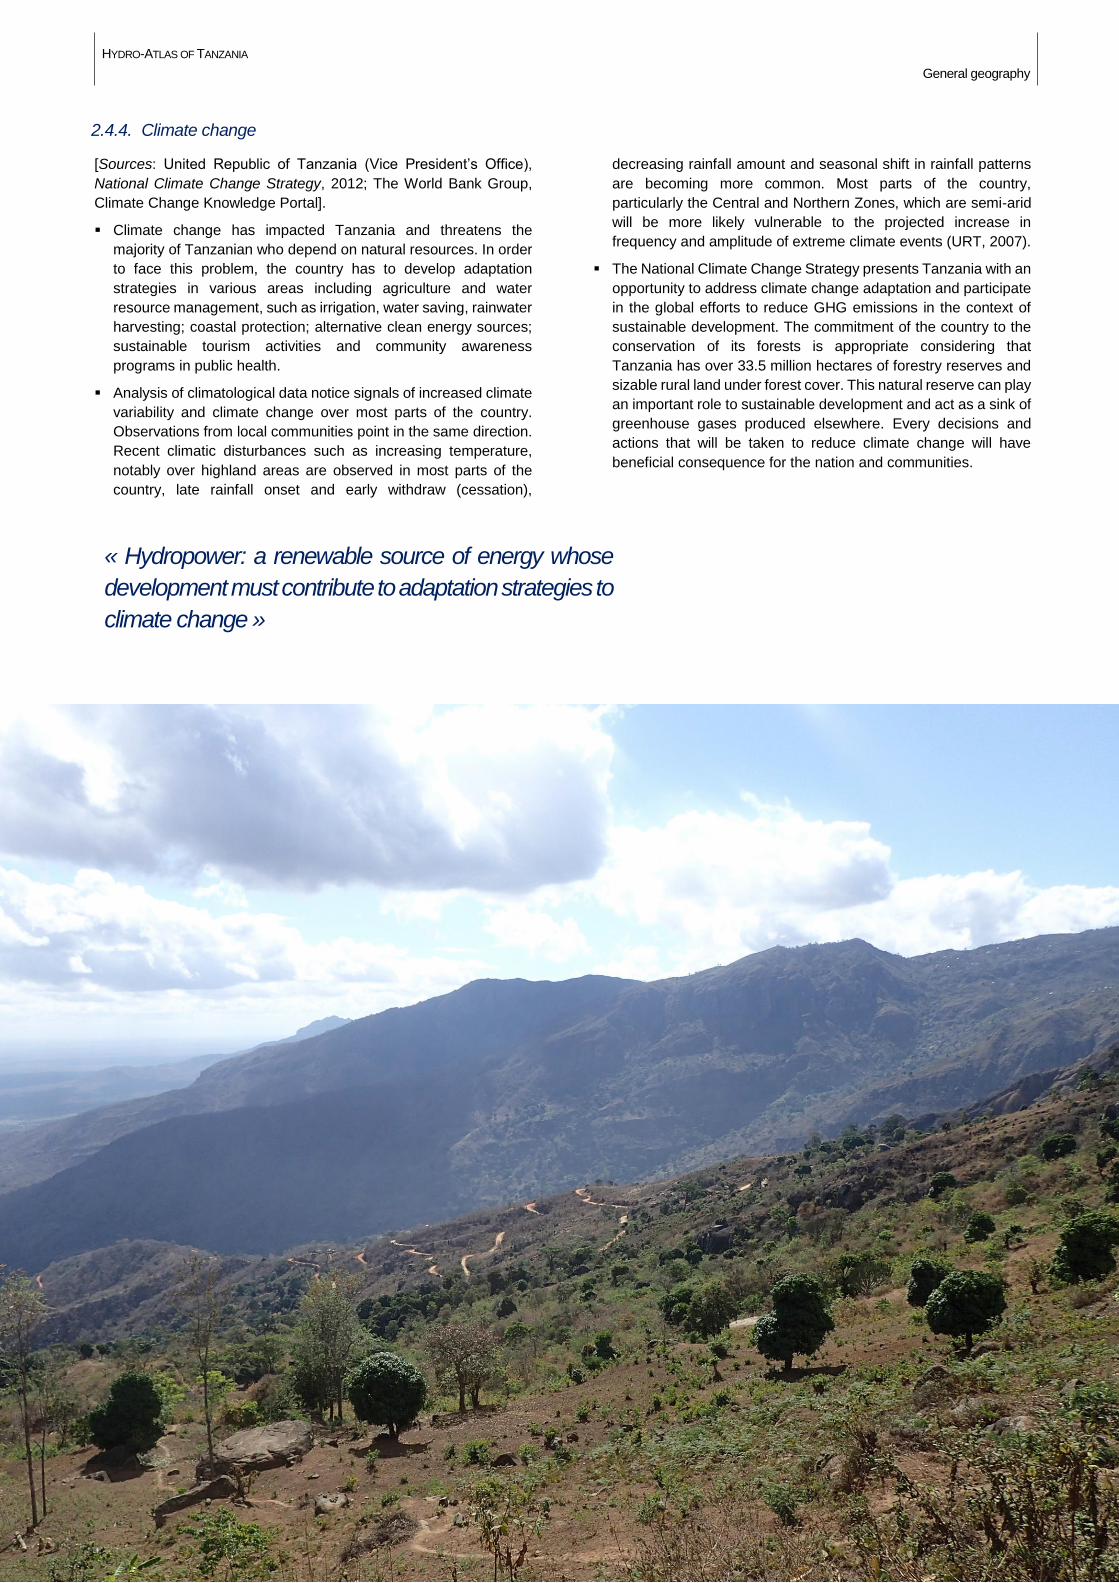
2.4.4. Climate change
[Sources: United Republic of Tanzania (Vice President’s Office),
National Climate Change Strategy, 2012; The World Bank Group,
Climate Change Knowledge Portal].
Climate change has impacted Tanzania and threatens the
majority of Tanzanian who depend on natural resources. In order
to face this problem, the country has to develop adaptation
strategies in various areas including agriculture and water
resource management, such as irrigation, water saving, rainwater
harvesting; coastal protection; alternative clean energy sources;
sustainable tourism activities and community awareness
programs in public health.
Analysis of climatological data notice signals of increased climate
variability and climate change over most parts of the country.
Observations from local communities point in the same direction.
Recent climatic disturbances such as increasing temperature,
notably over highland areas are observed in most parts of the
country, late rainfall onset and early withdraw (cessation),
decreasing rainfall amount and seasonal shift in rainfall patterns
are becoming more common. Most parts of the country,
particularly the Central and Northern Zones, which are semi-arid
will be more likely vulnerable to the projected increase in
frequency and amplitude of extreme climate events (URT, 2007).
The National Climate Change Strategy presents Tanzania with an
opportunity to address climate change adaptation and participate
in the global efforts to reduce GHG emissions in the context of
sustainable development. The commitment of the country to the
conservation of its forests is appropriate considering that
Tanzania has over 33.5 million hectares of forestry reserves and
sizable rural land under forest cover. This natural reserve can play
an important role to sustainable development and act as a sink of
greenhouse gases produced elsewhere. Every decisions and
actions that will be taken to reduce climate change will have
beneficial consequence for the nation and communities.
« Hydropower: a renewable source of energy whose
development must contribute to adaptation strategies to
climate change »
HYDRO-ATLAS OF TANZANIA
General geography
Page A.14
HYDRO-ATLAS OF TANZANIA
General geography
Page A-15
HYDRO-ATLAS OF TANZANIA
General geography
Page A-16
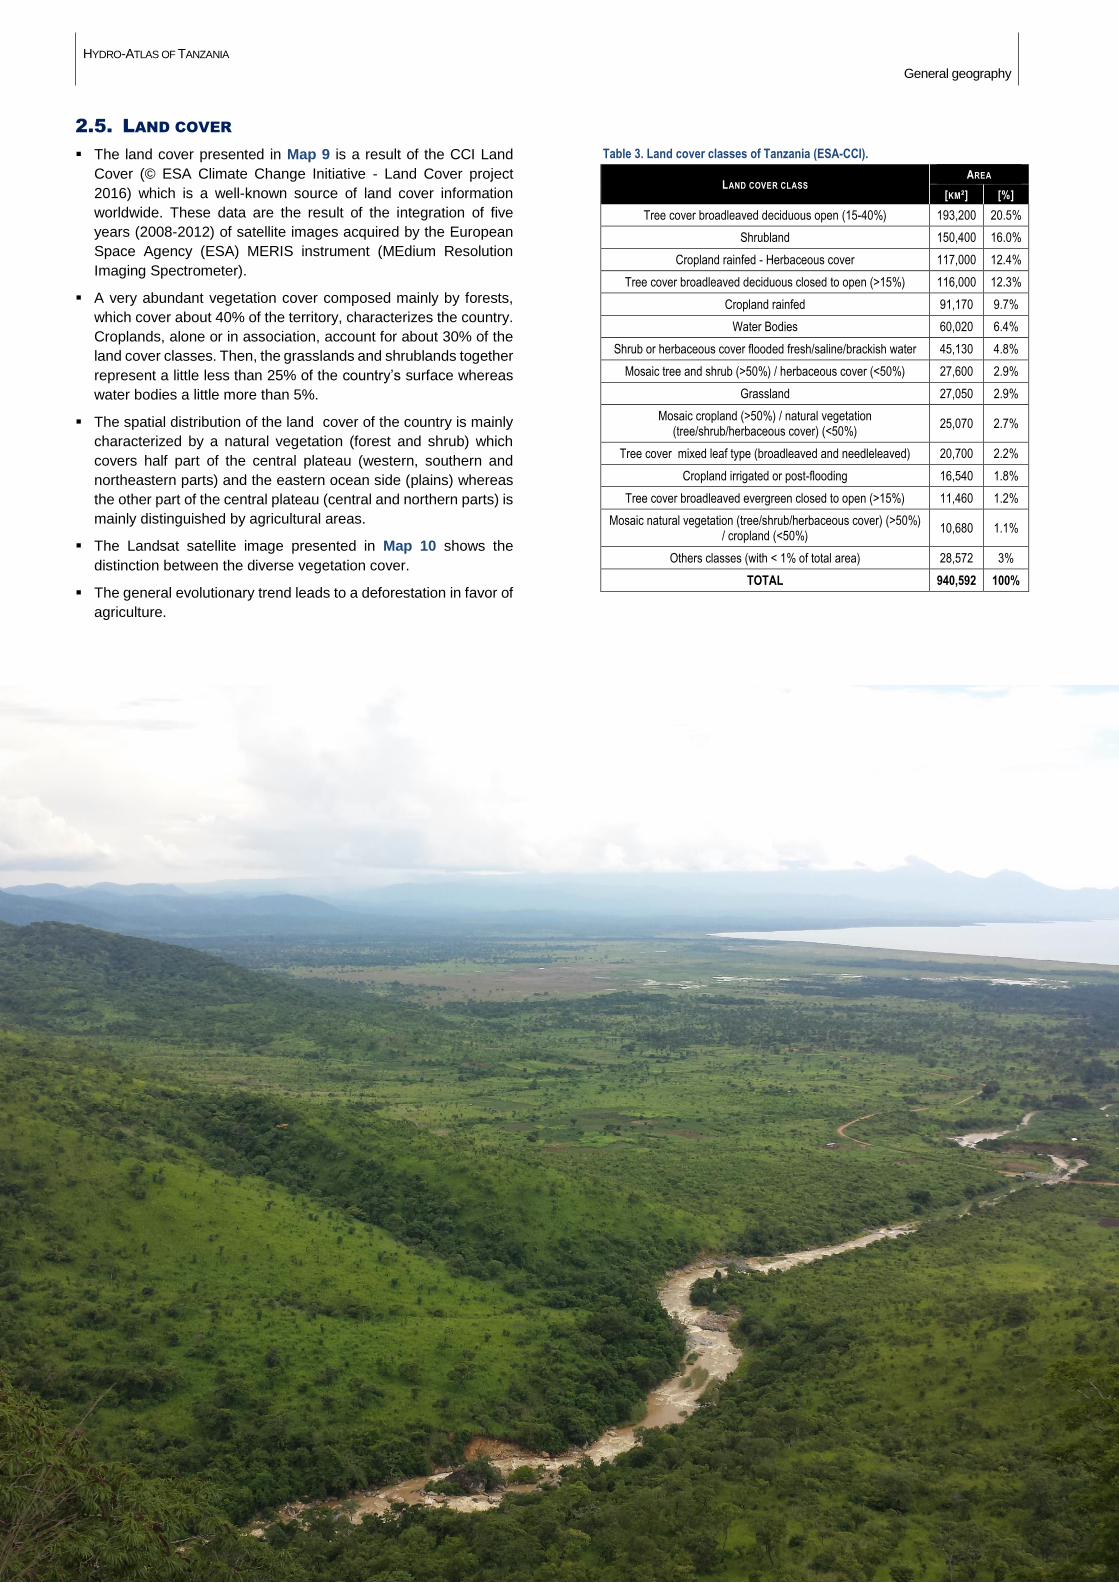
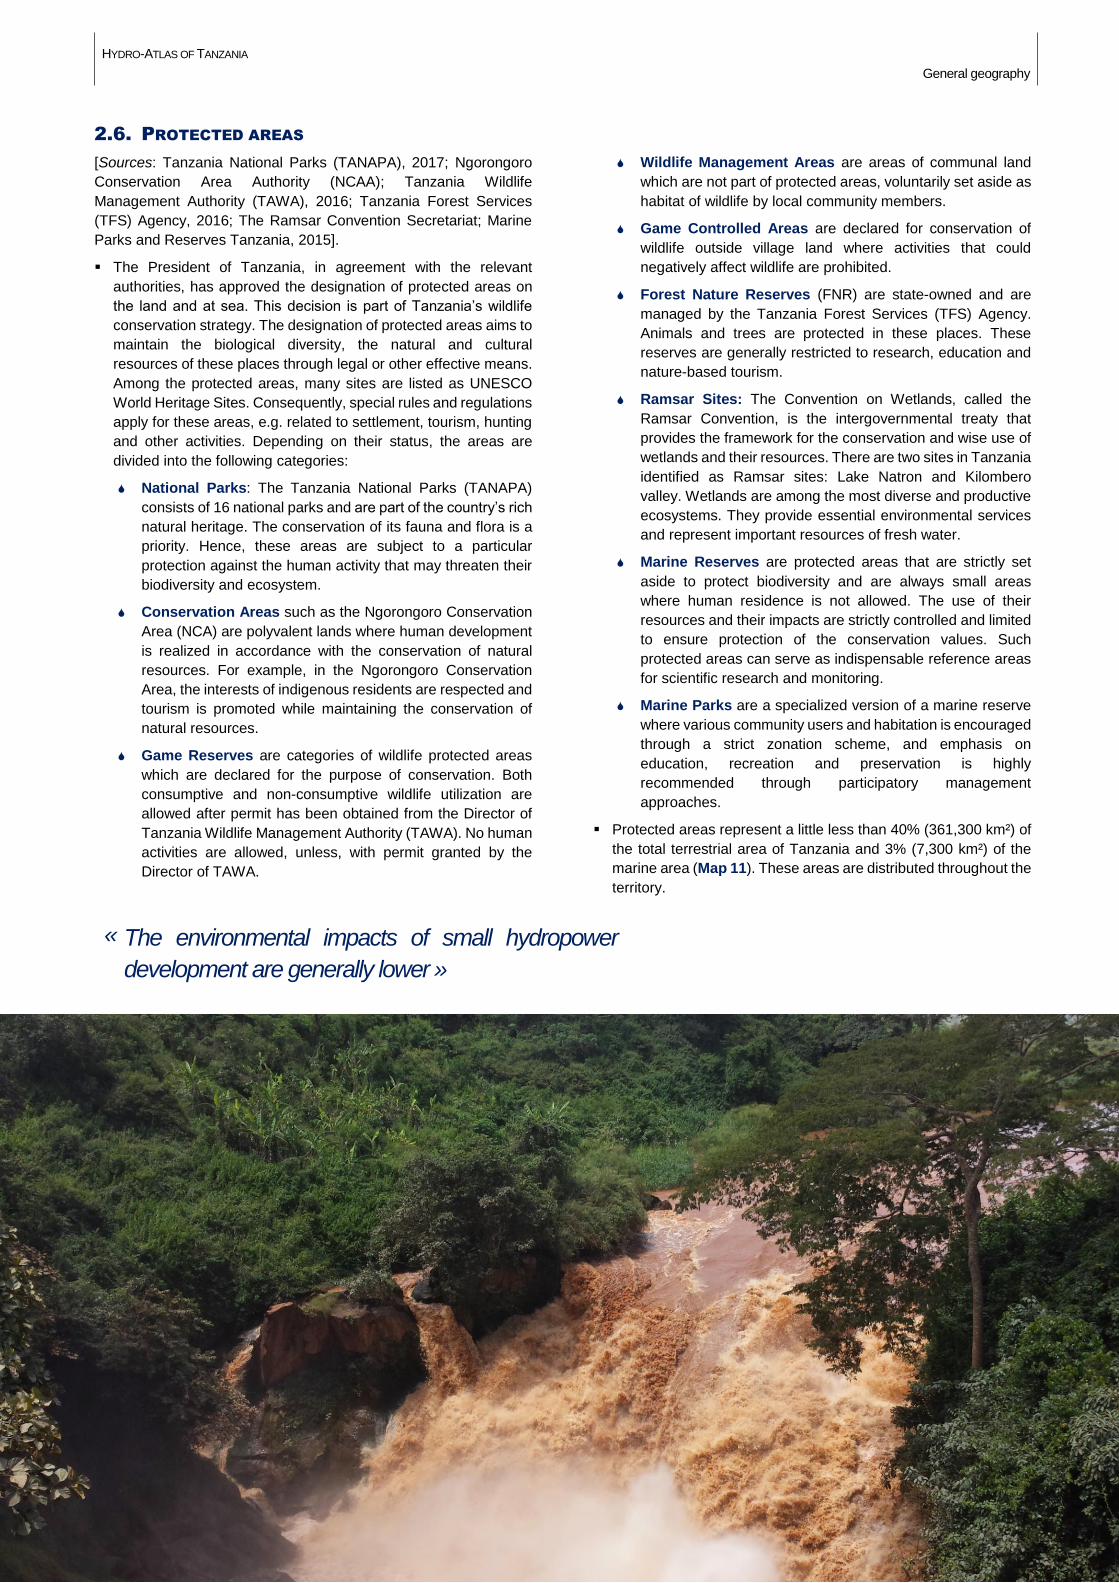
2.5. LAND COVER
The land cover presented in Map 9 is a result of the CCI Land
Cover (© ESA Climate Change Initiative - Land Cover project
2016) which is a well-known source of land cover information
worldwide. These data are the result of the integration of five
years (2008-2012) of satellite images acquired by the European
Space Agency (ESA) MERIS instrument (MEdium Resolution
Imaging Spectrometer).
A very abundant vegetation cover composed mainly by forests,
which cover about 40% of the territory, characterizes the country.
Croplands, alone or in association, account for about 30% of the
land cover classes. Then, the grasslands and shrublands together
represent a little less than 25% of the country’s surface whereas
water bodies a little more than 5%.
The spatial distribution of the land cover of the country is mainly
characterized by a natural vegetation (forest and shrub) which
covers half part of the central plateau (western, southern and
northeastern parts) and the eastern ocean side (plains) whereas
the other part of the central plateau (central and northern parts) is
mainly distinguished by agricultural areas.
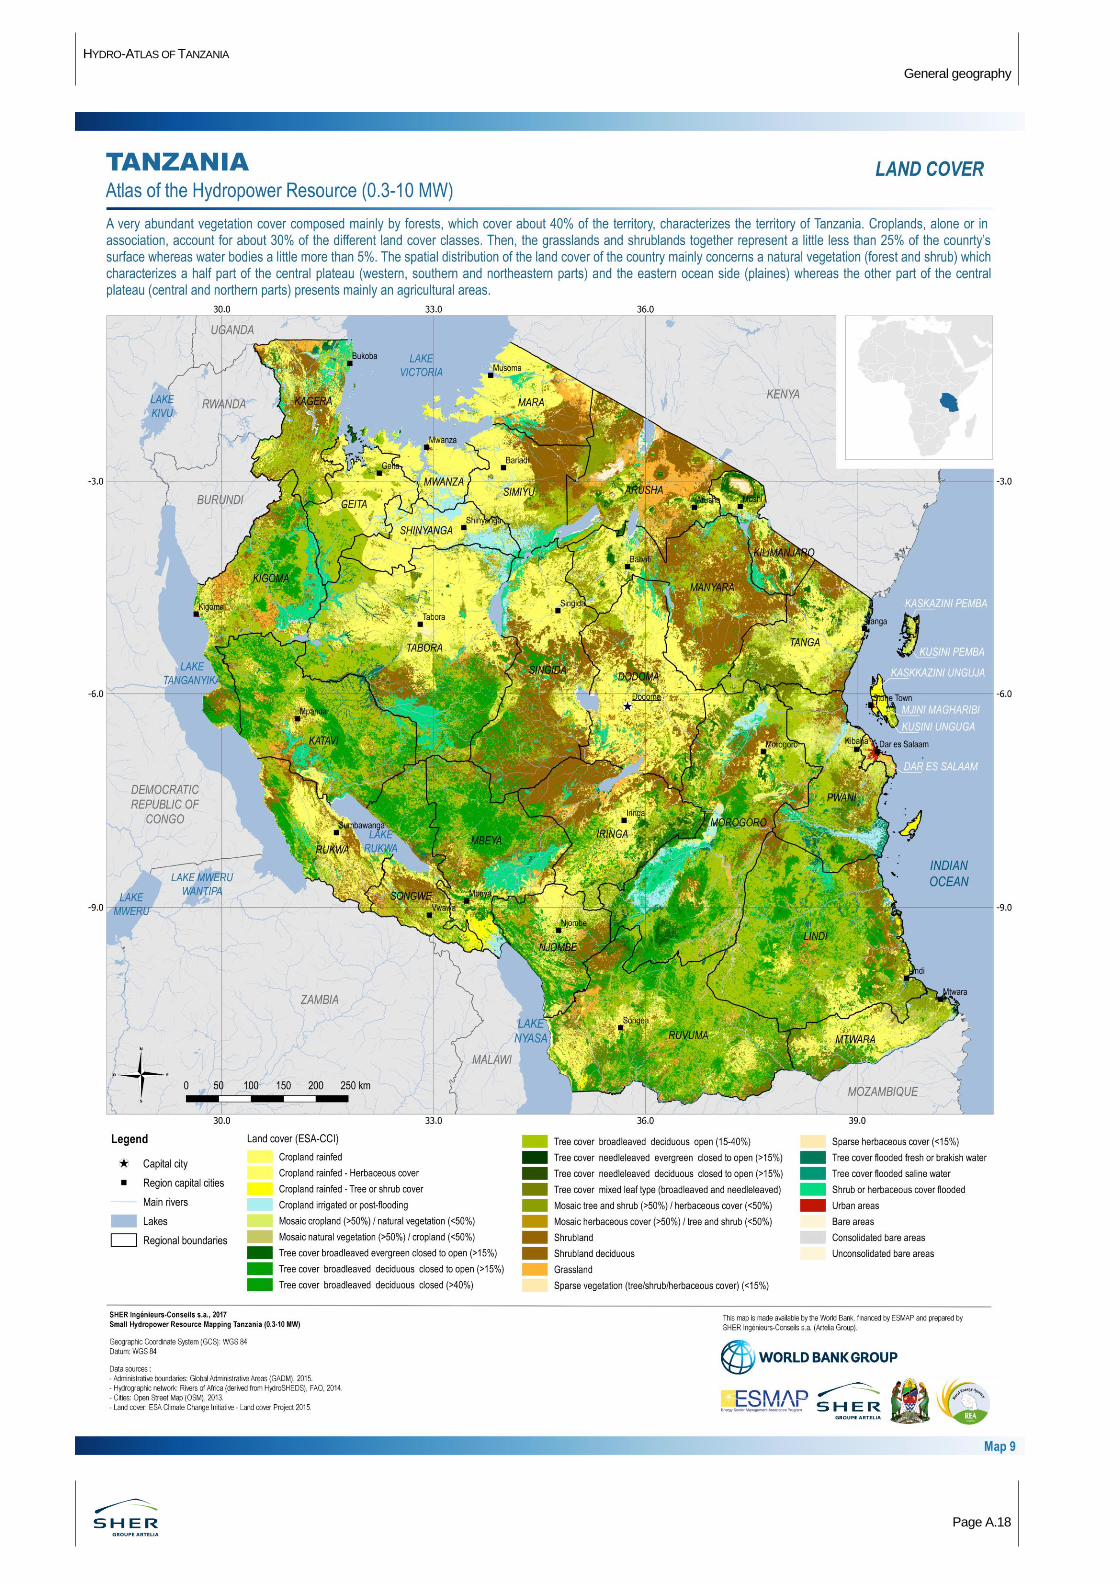
The Landsat satellite image presented in Map 10 shows the
distinction between the diverse vegetation cover.
The general evolutionary trend leads to a deforestation in favor of
agriculture.
Table 3. Land cover classes of Tanzania (ESA-CCI).
LAND COVER CLASS AREA
[KM²] [%]
Tree cover broadleaved deciduous open (15-40%) 193,200 20.5%
Shrubland 150,400 16.0%
Cropland rainfed - Herbaceous cover 117,000 12.4%
Tree cover broadleaved deciduous closed to open (>15%) 116,000 12.3%
Cropland rainfed 91,170 9.7%
Water Bodies 60,020 6.4%
Shrub or herbaceous cover flooded fresh/saline/brackish water 45,130 4.8%
Mosaic tree and shrub (>50%) / herbaceous cover (<50%) 27,600 2.9%
Grassland 27,050 2.9%
Mosaic cropland (>50%) / natural vegetation (tree/shrub/herbaceous cover) (<50%)
25,070 2.7%
Tree cover mixed leaf type (broadleaved and needleleaved) 20,700 2.2%
Cropland irrigated or post-flooding 16,540 1.8%
Tree cover broadleaved evergreen closed to open (>15%) 11,460 1.2%
Mosaic natural vegetation (tree/shrub/herbaceous cover) (>50%) / cropland (<50%)
10,680 1.1%
Others classes (with < 1% of total area) 28,572 3%
TOTAL 940,592 100%
HYDRO-ATLAS OF TANZANIA
General geography
Page A-17
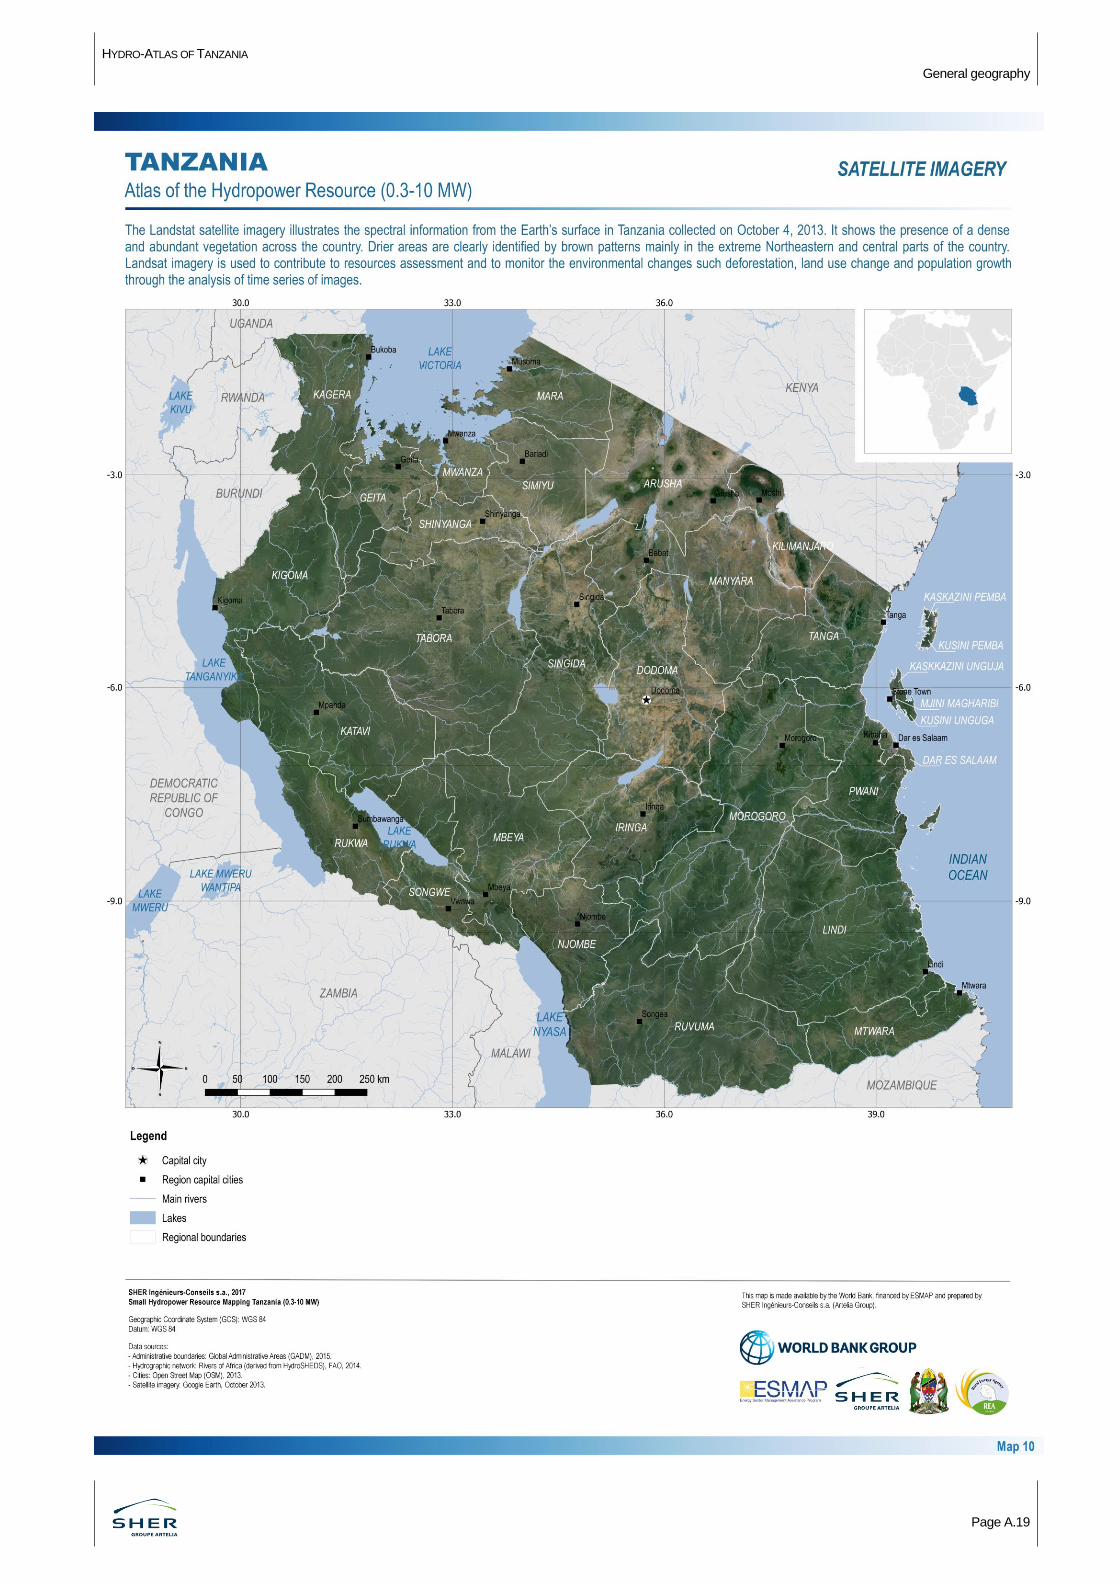
2.6. PROTECTED AREAS
[Sources: Tanzania National Parks (TANAPA), 2017; Ngorongoro
Conservation Area Authority (NCAA); Tanzania Wildlife
Management Authority (TAWA), 2016; Tanzania Forest Services
(TFS) Agency, 2016; The Ramsar Convention Secretariat; Marine
Parks and Reserves Tanzania, 2015].
The President of Tanzania, in agreement with the relevant
authorities, has approved the designation of protected areas on
the land and at sea. This decision is part of Tanzania’s wildlife
conservation strategy. The designation of protected areas aims to
maintain the biological diversity, the natural and cultural
resources of these places through legal or other effective means.
Among the protected areas, many sites are listed as UNESCO
World Heritage Sites. Consequently, special rules and regulations
apply for these areas, e.g. related to settlement, tourism, hunting
and other activities. Depending on their status, the areas are
divided into the following categories:
National Parks: The Tanzania National Parks (TANAPA)
consists of 16 national parks and are part of the country’s rich
natural heritage. The conservation of its fauna and flora is a
priority. Hence, these areas are subject to a particular
protection against the human activity that may threaten their
biodiversity and ecosystem.
Conservation Areas such as the Ngorongoro Conservation
Area (NCA) are polyvalent lands where human development
is realized in accordance with the conservation of natural
resources. For example, in the Ngorongoro Conservation
Area, the interests of indigenous residents are respected and
tourism is promoted while maintaining the conservation of
natural resources.
Game Reserves are categories of wildlife protected areas
which are declared for the purpose of conservation. Both
consumptive and non-consumptive wildlife utilization are
allowed after permit has been obtained from the Director of
Tanzania Wildlife Management Authority (TAWA). No human
activities are allowed, unless, with permit granted by the
Director of TAWA.
Wildlife Management Areas are areas of communal land
which are not part of protected areas, voluntarily set aside as
habitat of wildlife by local community members.
Game Controlled Areas are declared for conservation of
wildlife outside village land where activities that could
negatively affect wildlife are prohibited.
Forest Nature Reserves (FNR) are state-owned and are
managed by the Tanzania Forest Services (TFS) Agency.
Animals and trees are protected in these places. These
reserves are generally restricted to research, education and
nature-based tourism.
Ramsar Sites: The Convention on Wetlands, called the
Ramsar Convention, is the intergovernmental treaty that
provides the framework for the conservation and wise use of
wetlands and their resources. There are two sites in Tanzania
identified as Ramsar sites: Lake Natron and Kilombero
valley. Wetlands are among the most diverse and productive
ecosystems. They provide essential environmental services
and represent important resources of fresh water.
Marine Reserves are protected areas that are strictly set
aside to protect biodiversity and are always small areas
where human residence is not allowed. The use of their
resources and their impacts are strictly controlled and limited
to ensure protection of the conservation values. Such
protected areas can serve as indispensable reference areas
for scientific research and monitoring.
Marine Parks are a specialized version of a marine reserve
where various community users and habitation is encouraged
through a strict zonation scheme, and emphasis on
education, recreation and preservation is highly
recommended through participatory management
approaches.
Protected areas represent a little less than 40% (361,300 km²) of
the total terrestrial area of Tanzania and 3% (7,300 km²) of the
marine area (Map 11). These areas are distributed throughout the
territory.
The environmental impacts of small hydropower
development are generally lower »
«
HYDRO-ATLAS OF TANZANIA
General geography
Page A.18
HYDRO-ATLAS OF TANZANIA
General geography
Page A.19
HYDRO-ATLAS OF TANZANIA
General geography
Page A.20
HYDRO-ATLAS OF TANZANIA
Energy sector in Tanzania
Page A.21
Chapter 3. Energy sector in Tanzania
3.1. GENERAL INFORMATION
[Sources: U.S. Agency for International Development (USAID);
SHER Ingénieurs-Conseils, Small Hydro Mapping Report, 2015;
African Development Bank Group, Renewable Energy in Africa -
Tanzania country profile, 2015]
Tanzania is endowed by a variety of energy resources from coal
and natural gas to renewable energy sources like biomass,
hydropower, geothermal, solar and wind. Most of this potential
remains currently untapped, despite the expansion of the power
capacity and grid extension led by the Government of Tanzania
(GoT). The continued development of Tanzania’s energy sector
is critical to the country’s ability to grow economically, attract
foreign direct investment, and increase industrialization.
The development of the renewable resources available in the
country would contribute significantly to Tanzania’s energy supply
and contribute moving the country closer to achieving middle-
income status, as envisioned in the Tanzania National
Development Vision 2025.
For many years, the Tanzanian electric system has not been able
to satisfy the growing demand for electricity. Supply of electricity
is not keeping pace with demand causing frequent load shedding
and power outages. Consequently, the electricity demand is
supply-driven, and it is hence difficult to estimate the actual
demand in a context of sufficient supply. Government estimates
are that demand for electricity is on average growing between 10
% and 15 % per annum.
During the last 10 years, various important reforms were
implemented in the electricity sector. The main stakeholders in
the Tanzanian Electric Sector are the following: The Ministry of
Energy and Minerals responsible for “electricity matters” (as it is
designated in the Electricity Act, 2008), the Energy and Water
Utilities Regulatory Authority (established under EWURA Act,
Chapter 414), the Rural Energy Agency (REA) (established under
Part IV of the Rural Energy Act, 2005) and the utility Tanzania
Electric Supply Company Limited (TANESCO). Other Ministries
also have a role in the energy sector activities such as the Ministry
of Environment.
Recognizing the potential contribution of renewable energy to
the country’s future energy mix, the GoT is committed to
promote the development of low-carbon energy initiatives, by
harnessing the country’s renewable energy resource. Renewable
and clean sources of energy can be utilized to improve access to
sustainable, modern and cleaner energy services. Deployment of
renewable energy technologies has the potential to contribute to
job creation, income generation and the improved livelihoods for
vulnerable population groups, particularly women and children in
rural areas.
Tanzania is impacted by climate change, facing increasingly
unreliable rainfall patterns and more frequent and prolonged
drought periods over the past two decades. These have affected
the country’s power sector due to its strong dependence on
hydropower, as presented in Section B hereafter. This situation
has created power crises and increased dependence on
expensive and environment polluting fossil fuels most of which
are imported. This unsustainable situation is an opportunity to
boost the development of renewable energy and diversify the
energy mix to attain a more robust and resilient energy supply that
is less subject to oil price shocks.
Tanzania’s energy sector faces a number of significant
challenges amongst which:
Increasing electricity demand;
Risk of load shedding, power outages and associated
electricity price shocks due to the increasing unpredictability
of hydropower generation;
Financing of the energy sector;
Low access to reliable electricity;
The size of the country associated with scattered population
makes grid extension expensive for many remote areas;
Health risks and degradation of the environment from
household reliance on biomass energy.
In June 2014, considering the supply and financial crisis known
by the country in recent years, the GoT adopted the “Electricity
Supply Industry Reform Strategy and Roadmap 2014 – 2025”.
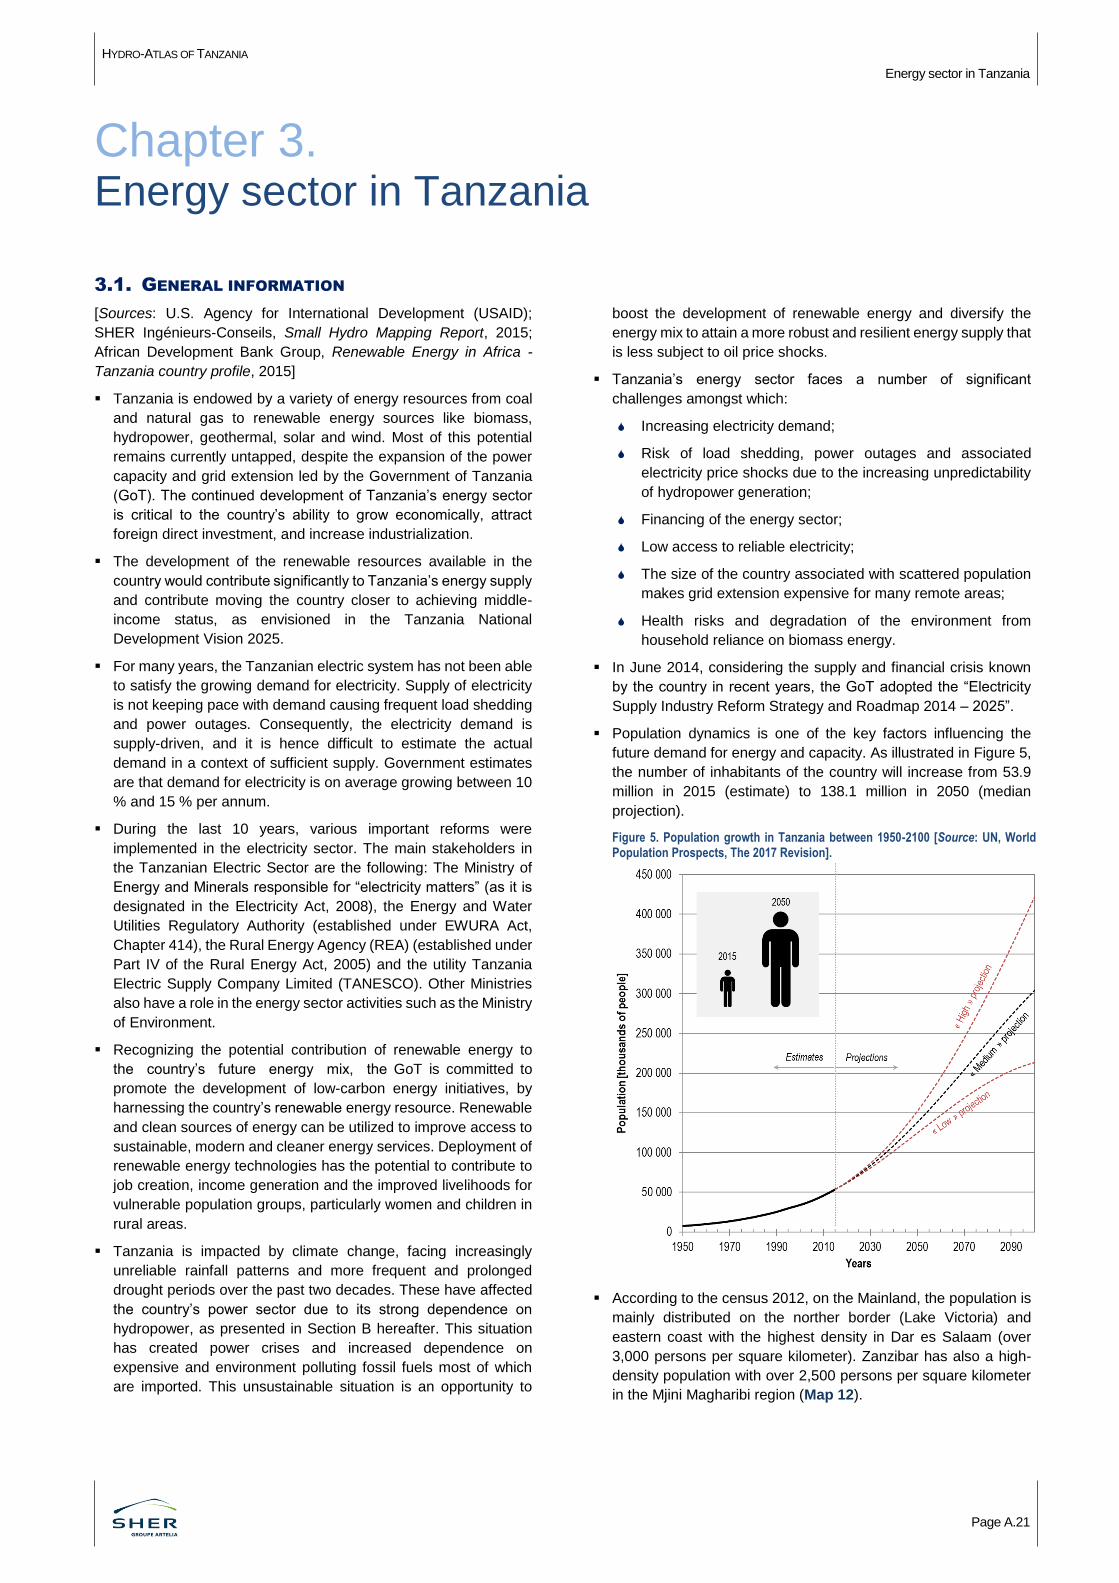
Population dynamics is one of the key factors influencing the
future demand for energy and capacity. As illustrated in Figure 5,
the number of inhabitants of the country will increase from 53.9
million in 2015 (estimate) to 138.1 million in 2050 (median
projection).
Figure 5. Population growth in Tanzania between 1950-2100 [Source: UN, World Population Prospects, The 2017 Revision].
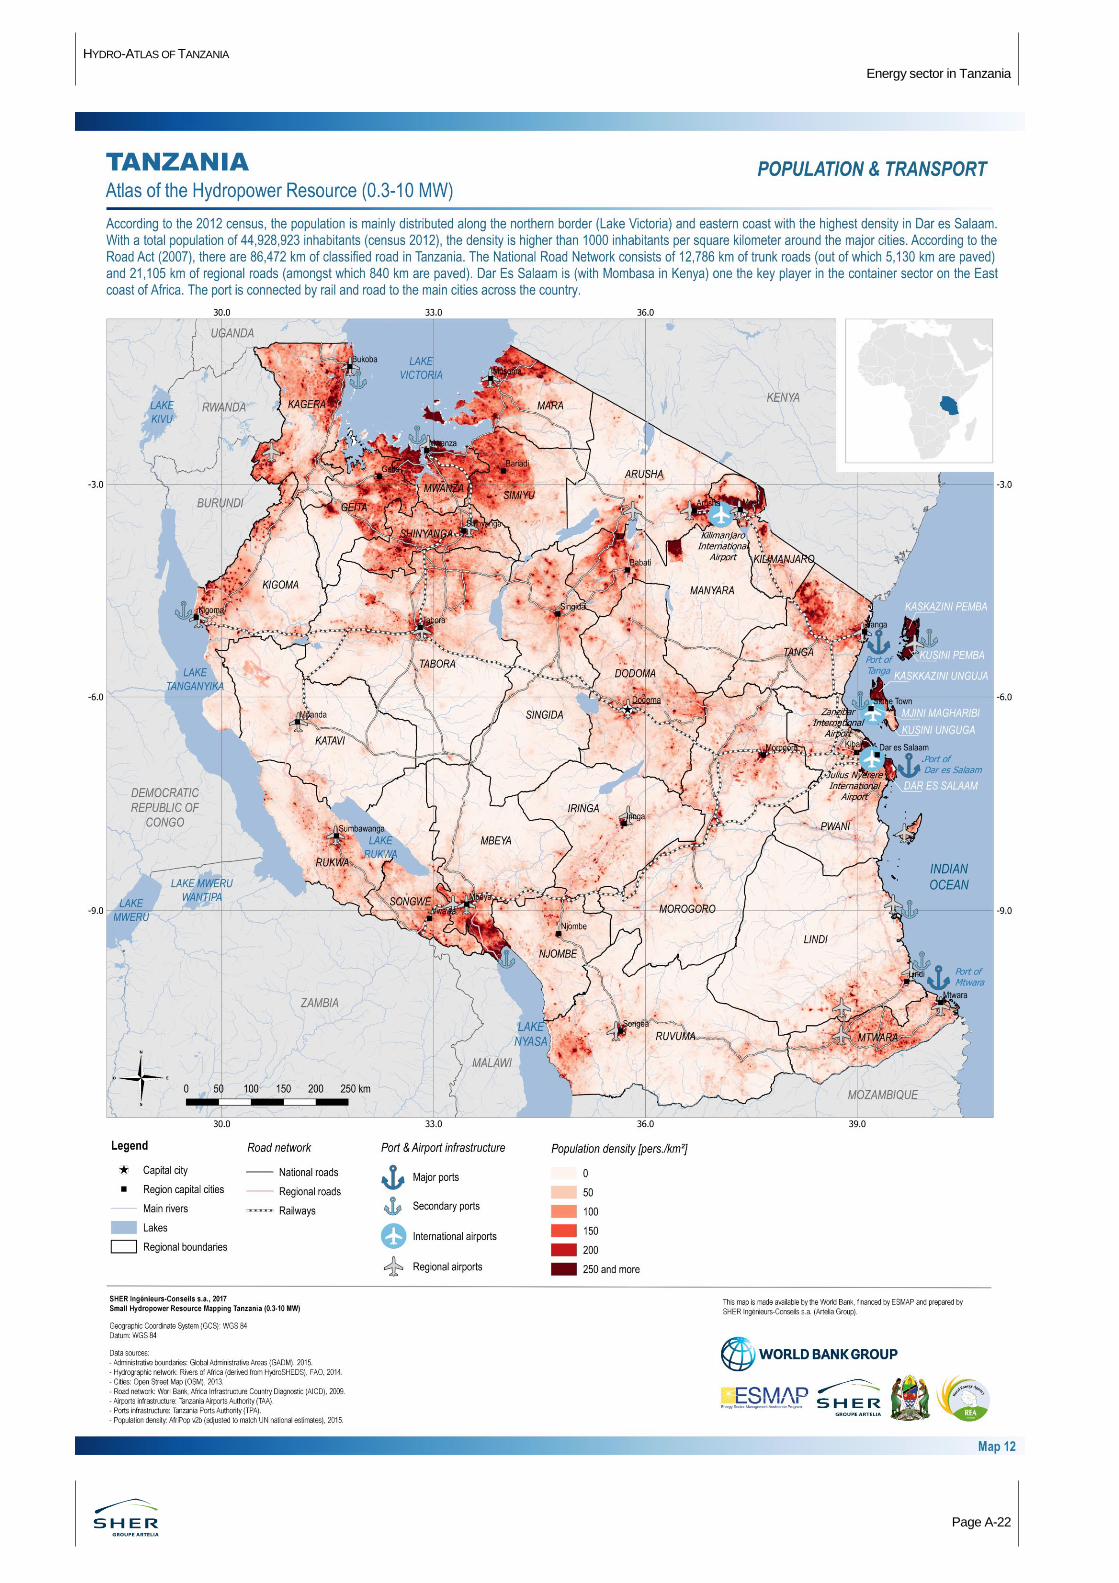
According to the census 2012, on the Mainland, the population is
mainly distributed on the norther border (Lake Victoria) and
eastern coast with the highest density in Dar es Salaam (over
3,000 persons per square kilometer). Zanzibar has also a high-
density population with over 2,500 persons per square kilometer
in the Mjini Magharibi region (Map 12).
HYDRO-ATLAS OF TANZANIA
Energy sector in Tanzania
Page A-22
HYDRO-ATLAS OF TANZANIA
Energy sector in Tanzania
Page A-23
3.2. ENERGY MIX, DISTRIBUTION AND MAIN PRODUCTION UNITS
Biomass is the major source of energy in Tanzania. It is primarily
used domestically, in the form of charcoal and firewood [Source:
Global Legal Insights (GLI), Energy 2018]. More than 80% of
energy delivered from biomass is consumed in rural areas. Heavy
use of biomass as the main energy source contributes to
deforestation, while the importation of oil costs about 25% to 35%
of the nation’s foreign currency earnings [Source: TANESCO,
Current status of energy sector in Tanzania, 2013].
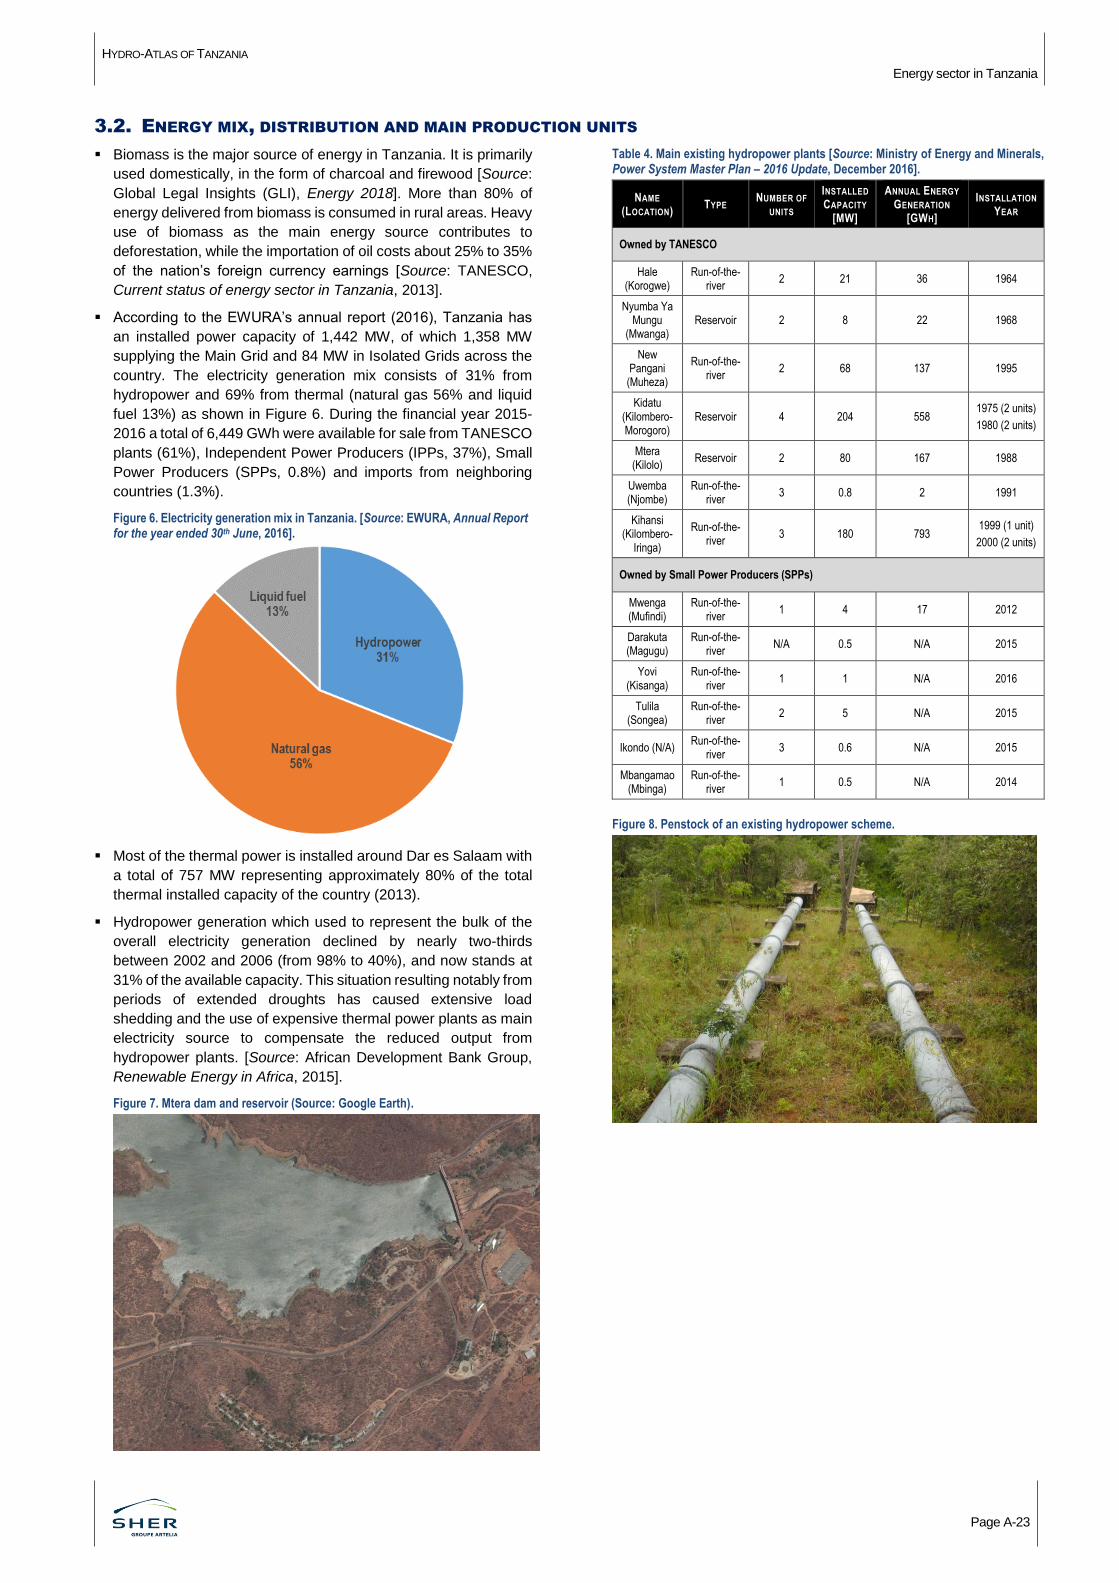
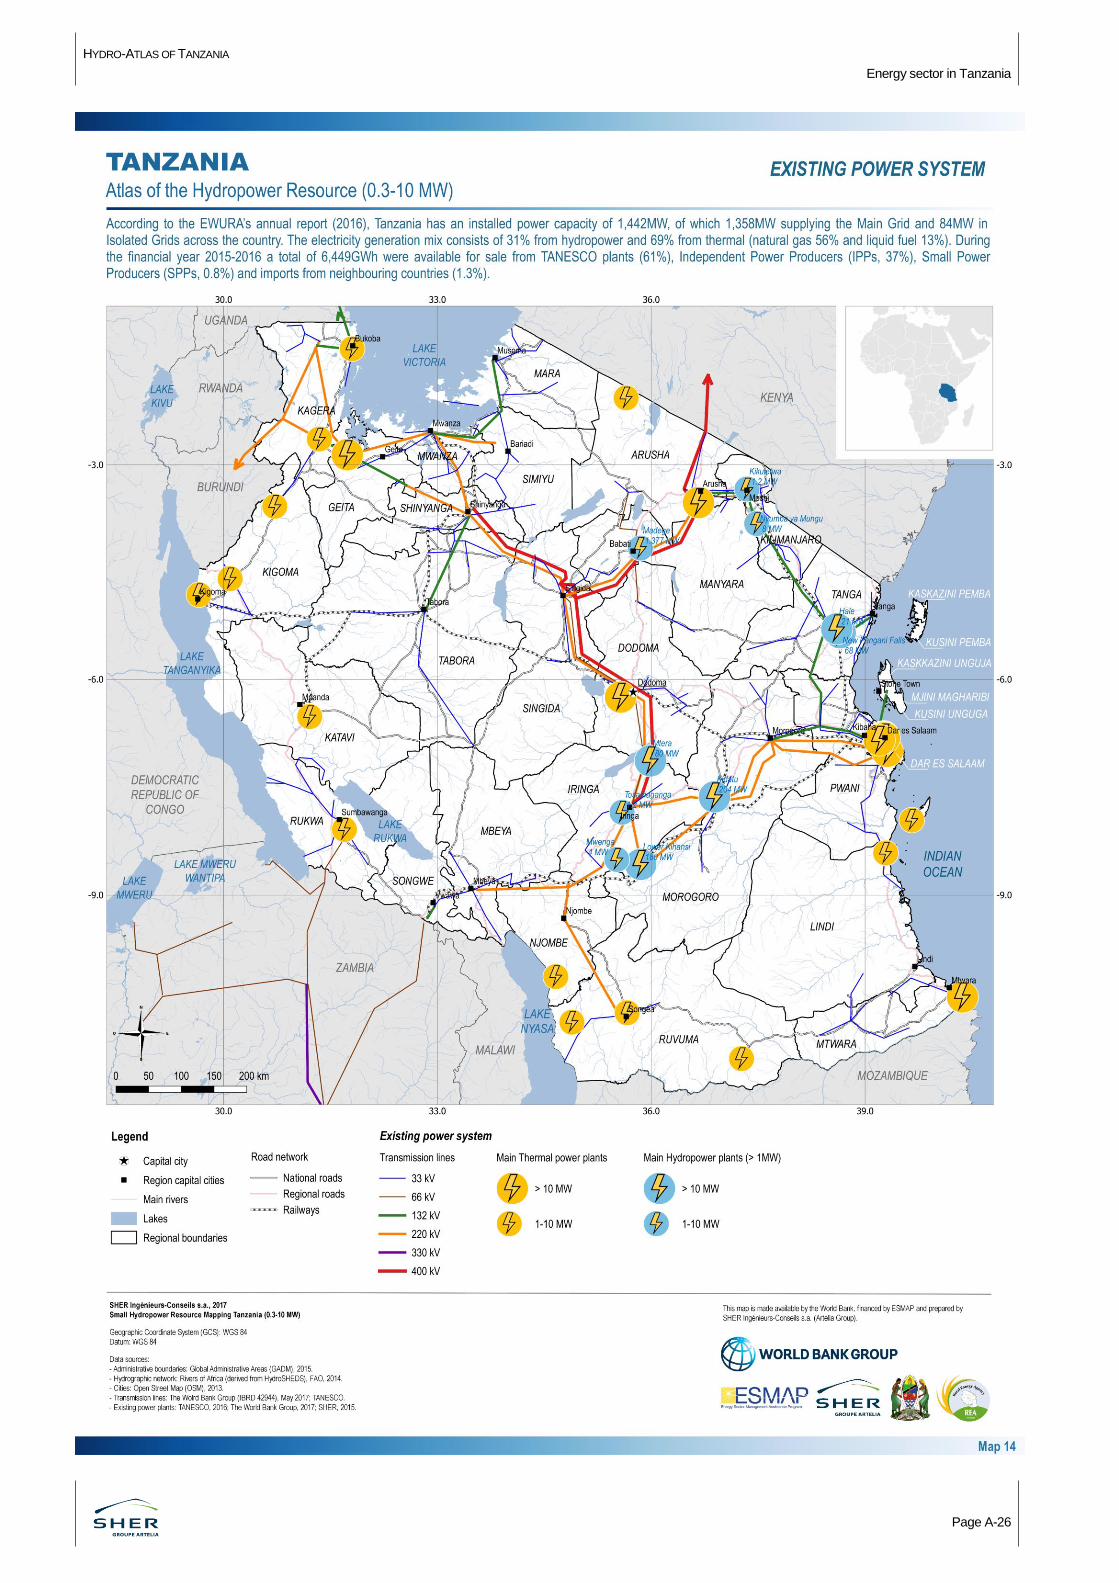
According to the EWURA’s annual report (2016), Tanzania has
an installed power capacity of 1,442 MW, of which 1,358 MW
supplying the Main Grid and 84 MW in Isolated Grids across the
country. The electricity generation mix consists of 31% from
hydropower and 69% from thermal (natural gas 56% and liquid
fuel 13%) as shown in Figure 6. During the financial year 2015-
2016 a total of 6,449 GWh were available for sale from TANESCO
plants (61%), Independent Power Producers (IPPs, 37%), Small
Power Producers (SPPs, 0.8%) and imports from neighboring
countries (1.3%).
Figure 6. Electricity generation mix in Tanzania. [Source: EWURA, Annual Report for the year ended 30th June, 2016].
Most of the thermal power is installed around Dar es Salaam with
a total of 757 MW representing approximately 80% of the total
thermal installed capacity of the country (2013).
Hydropower generation which used to represent the bulk of the
overall electricity generation declined by nearly two-thirds
between 2002 and 2006 (from 98% to 40%), and now stands at
31% of the available capacity. This situation resulting notably from
periods of extended droughts has caused extensive load
shedding and the use of expensive thermal power plants as main
electricity source to compensate the reduced output from
hydropower plants. [Source: African Development Bank Group,
Renewable Energy in Africa, 2015].
Figure 7. Mtera dam and reservoir (Source: Google Earth).
Table 4. Main existing hydropower plants [Source: Ministry of Energy and Minerals, Power System Master Plan – 2016 Update, December 2016].
NAME
(LOCATION) TYPE
NUMBER OF
UNITS
INSTALLED
CAPACITY
[MW]
ANNUAL ENERGY
GENERATION
[GWH]
INSTALLATION
YEAR
Owned by TANESCO
Hale (Korogwe)
Run-of-the-river
2 21 36 1964
Nyumba Ya Mungu
(Mwanga) Reservoir 2 8 22 1968
New Pangani (Muheza)
Run-of-the-river
2 68 137 1995
Kidatu (Kilombero-Morogoro)
Reservoir 4 204 558 1975 (2 units)
1980 (2 units)
Mtera (Kilolo)
Reservoir 2 80 167 1988
Uwemba (Njombe)
Run-of-the-river
3 0.8 2 1991
Kihansi (Kilombero-
Iringa)
Run-of-the-river
3 180 793 1999 (1 unit)
2000 (2 units)
Owned by Small Power Producers (SPPs)
Mwenga (Mufindi)
Run-of-the-river
1 4 17 2012
Darakuta (Magugu)
Run-of-the-river
N/A 0.5 N/A 2015
Yovi (Kisanga)
Run-of-the-river
1 1 N/A 2016
Tulila (Songea)
Run-of-the-river
2 5 N/A 2015
Ikondo (N/A) Run-of-the-
river 3 0.6 N/A 2015
Mbangamao (Mbinga)
Run-of-the-river
1 0.5 N/A 2014
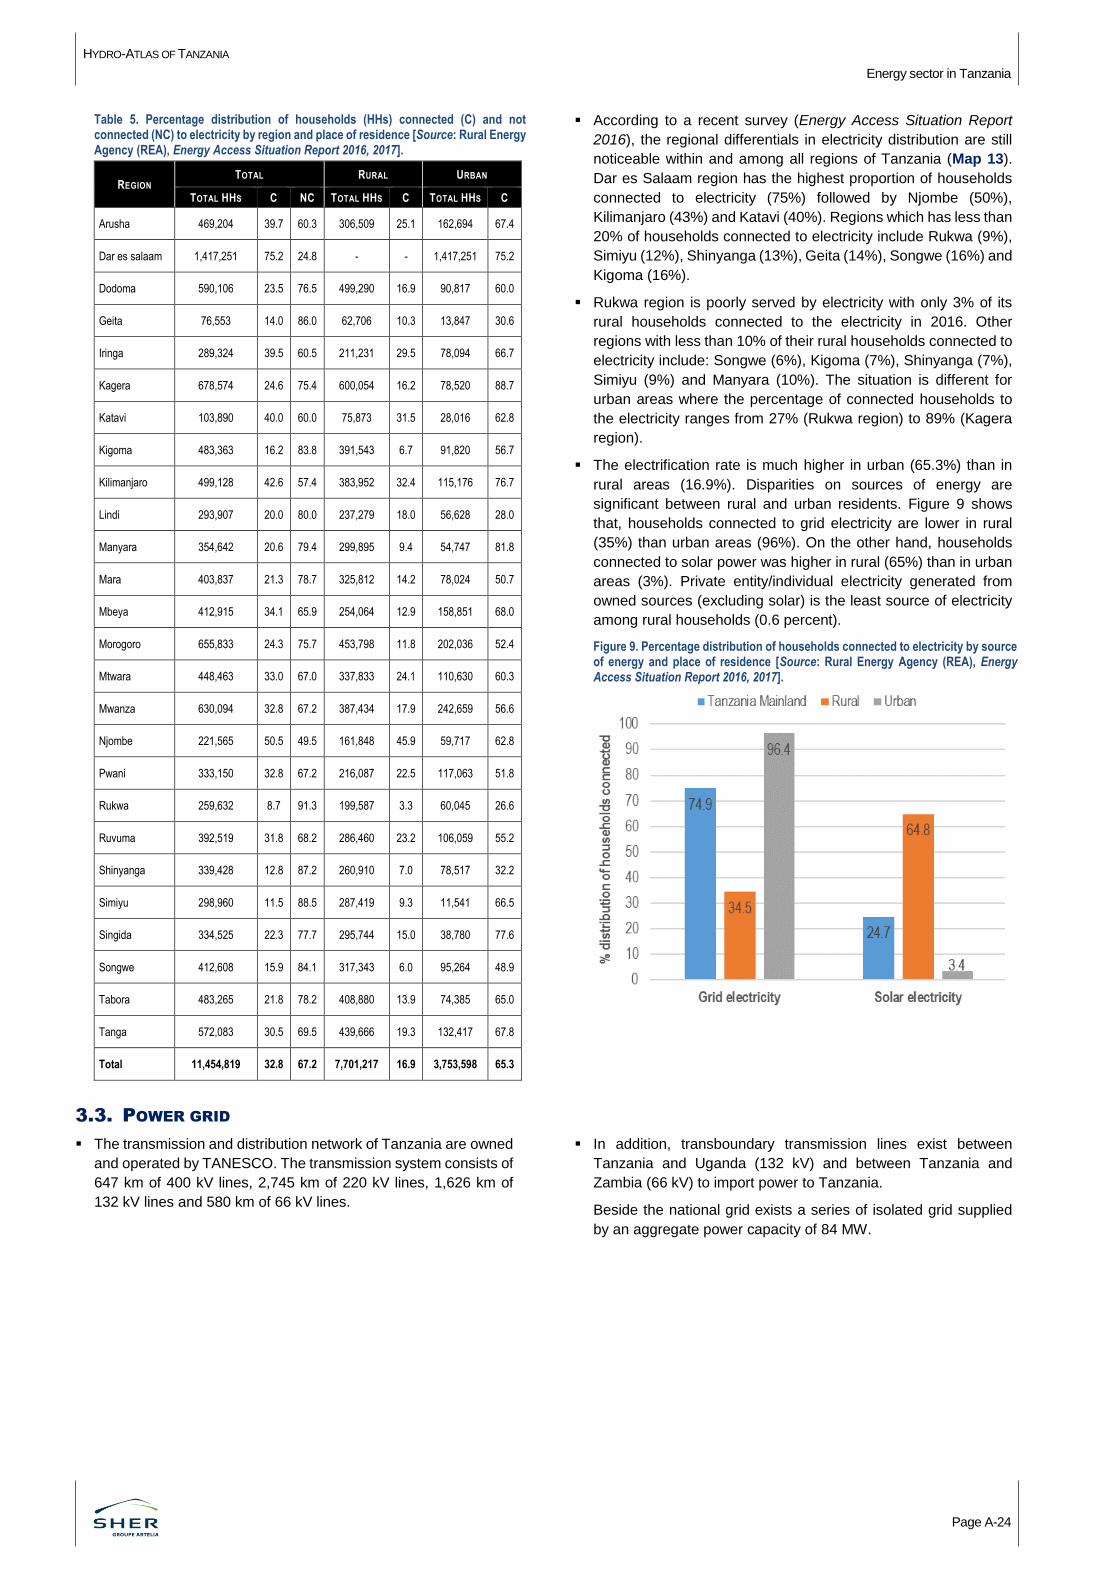
Figure 8. Penstock of an existing hydropower scheme.
HYDRO-ATLAS OF TANZANIA
Energy sector in Tanzania
Page A-24
Table 5. Percentage distribution of households (HHs) connected (C) and not connected (NC) to electricity by region and place of residence [Source: Rural Energy Agency (REA), Energy Access Situation Report 2016, 2017].
REGION TOTAL RURAL URBAN
TOTAL HHS C NC TOTAL HHS C TOTAL HHS C
Arusha 469,204 39.7 60.3 306,509 25.1 162,694 67.4
Dar es salaam 1,417,251 75.2 24.8 - - 1,417,251 75.2
Dodoma 590,106 23.5 76.5 499,290 16.9 90,817 60.0
Geita 76,553 14.0 86.0 62,706 10.3 13,847 30.6
Iringa 289,324 39.5 60.5 211,231 29.5 78,094 66.7
Kagera 678,574 24.6 75.4 600,054 16.2 78,520 88.7
Katavi 103,890 40.0 60.0 75,873 31.5 28,016 62.8
Kigoma 483,363 16.2 83.8 391,543 6.7 91,820 56.7
Kilimanjaro 499,128 42.6 57.4 383,952 32.4 115,176 76.7
Lindi 293,907 20.0 80.0 237,279 18.0 56,628 28.0
Manyara 354,642 20.6 79.4 299,895 9.4 54,747 81.8
Mara 403,837 21.3 78.7 325,812 14.2 78,024 50.7
Mbeya 412,915 34.1 65.9 254,064 12.9 158,851 68.0
Morogoro 655,833 24.3 75.7 453,798 11.8 202,036 52.4
Mtwara 448,463 33.0 67.0 337,833 24.1 110,630 60.3
Mwanza 630,094 32.8 67.2 387,434 17.9 242,659 56.6
Njombe 221,565 50.5 49.5 161,848 45.9 59,717 62.8
Pwani 333,150 32.8 67.2 216,087 22.5 117,063 51.8
Rukwa 259,632 8.7 91.3 199,587 3.3 60,045 26.6
Ruvuma 392,519 31.8 68.2 286,460 23.2 106,059 55.2
Shinyanga 339,428 12.8 87.2 260,910 7.0 78,517 32.2
Simiyu 298,960 11.5 88.5 287,419 9.3 11,541 66.5
Singida 334,525 22.3 77.7 295,744 15.0 38,780 77.6
Songwe 412,608 15.9 84.1 317,343 6.0 95,264 48.9
Tabora 483,265 21.8 78.2 408,880 13.9 74,385 65.0
Tanga 572,083 30.5 69.5 439,666 19.3 132,417 67.8
Total 11,454,819 32.8 67.2 7,701,217 16.9 3,753,598 65.3
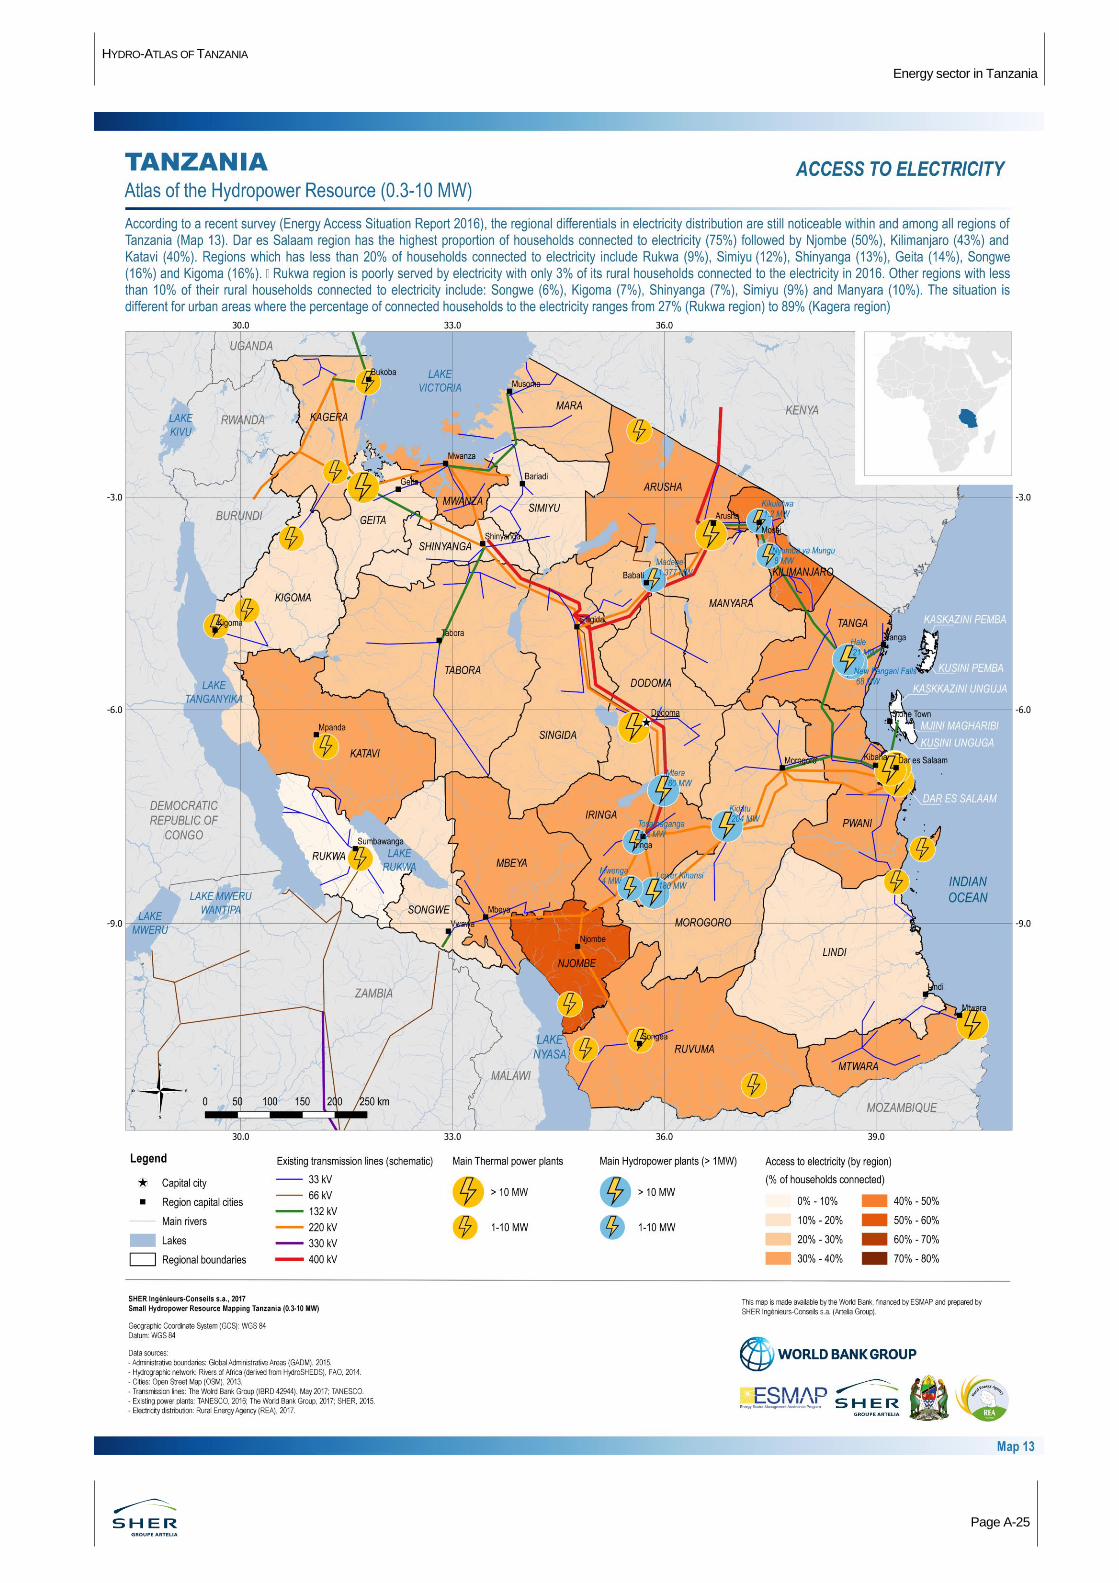
According to a recent survey (Energy Access Situation Report
2016), the regional differentials in electricity distribution are still
noticeable within and among all regions of Tanzania (Map 13).
Dar es Salaam region has the highest proportion of households
connected to electricity (75%) followed by Njombe (50%),
Kilimanjaro (43%) and Katavi (40%). Regions which has less than
20% of households connected to electricity include Rukwa (9%),
Simiyu (12%), Shinyanga (13%), Geita (14%), Songwe (16%) and
Kigoma (16%).
Rukwa region is poorly served by electricity with only 3% of its
rural households connected to the electricity in 2016. Other
regions with less than 10% of their rural households connected to
electricity include: Songwe (6%), Kigoma (7%), Shinyanga (7%),
Simiyu (9%) and Manyara (10%). The situation is different for
urban areas where the percentage of connected households to
the electricity ranges from 27% (Rukwa region) to 89% (Kagera
region).
The electrification rate is much higher in urban (65.3%) than in
rural areas (16.9%). Disparities on sources of energy are
significant between rural and urban residents. Figure 9 shows
that, households connected to grid electricity are lower in rural
(35%) than urban areas (96%). On the other hand, households
connected to solar power was higher in rural (65%) than in urban
areas (3%). Private entity/individual electricity generated from
owned sources (excluding solar) is the least source of electricity
among rural households (0.6 percent).
Figure 9. Percentage distribution of households connected to electricity by source of energy and place of residence [Source: Rural Energy Agency (REA), Energy Access Situation Report 2016, 2017].
3.3. POWER GRID
The transmission and distribution network of Tanzania are owned
and operated by TANESCO. The transmission system consists of
647 km of 400 kV lines, 2,745 km of 220 kV lines, 1,626 km of
132 kV lines and 580 km of 66 kV lines.
In addition, transboundary transmission lines exist between
Tanzania and Uganda (132 kV) and between Tanzania and
Zambia (66 kV) to import power to Tanzania.
Beside the national grid exists a series of isolated grid supplied
by an aggregate power capacity of 84 MW.
HYDRO-ATLAS OF TANZANIA
Energy sector in Tanzania
Page A-25
HYDRO-ATLAS OF TANZANIA
Energy sector in Tanzania
Page A-26
HYDRO-ATLAS OF TANZANIA
Page B.1
SECTION B. HYDROPOWER RESOURCE (0.3-10 MW)
Methodological approach
Small hydro potential in Tanzania (0.3-10 MW)
HYDRO-ATLAS OF TANZANIA
Methodological approach
Page B.2
Chapter 4. Methodological approach
4.1. INTRODUCTION
The present Atlas of Hydropower Resources focuses on potential
hydropower sites with an installed capacity between 0.3 and
10 MW.
The identification of new potential hydropower sites at the country
or regional scale relies on the following three-stage approach:
1. Screening of the study area using a dedicated tool that
calculates hydropower potential along a network of rivers
based on the rainfall and topography. This tool, SiteFinder,
has been developed by SHER Ingénieur-Conseils.
2. Desk-based analysis of the results of the screening phase
based on the analysis of satellite imageries and topographic
maps. It aims at identifying the actual location of potential
hydropower site along the river stretch and carrying out a first
estimate of the site key features.
3. Field visits are integral part of the potential site identification
process to validate the key features expected from the
previous stage.
The database of potential hydropower sites is complemented by
the sites that have been already studied and that are available
from the literature, studies or lists from the Ministries and other
stakeholders of the energy sector.
The development of the Hydro-Atlas, including the associated
Geographic Information System, is an essential tool for the
responsible Tanzanian agencies in charge of the planning and
development of the energy sector (Figure 10). The Hydro-Atlas is
indeed a unique tool that integrates all the information coming
from the different institutions involved in the hydropower sector. It
provides an overview of the sector in terms of both existing and
potential projects, allowing a better understanding of the energy
demand and candidate projects that need to be developed.
The Hydro-Atlas should be a dynamic and evolving tool that
must be updated according to future development of the
hydropower sector in Tanzania and the increasing availability of
information (hydrological measurements, update of site surveys,
etc.).
Figure 10. Geographic Information System associated with the Hydro-Atlas of Tanzania.
4.2. SITES IDENTIFIED BASED ON EXISTING INFORMATION
More than 100 documents were collected and reviewed during the
Study. Those documents embrace a large scope of fields related
to the electricity sector in Tanzania and from all kinds of authors
ranging from government officials to international consultants and
agencies. The sources of information on potential sites were the
following:
potential sites from the lists of the World Bank;
potential sites reported in the archives of the Ministry of
Energy and Minerals, REA, TANESCO;
potential sites described in different studies from
Consultants.
These lists, which contain common potential sites, present
geographical coordinates and some technical information such as
installed capacity, gross head or design flow.
It is important to remember that the lists are often summaries of
several documents. Most of the time, these documents are not or
not anymore available. Very often, there are significant errors on
the positioning and/or technical parameters, and it is not possible
to trace the source or to correct them. There is also uncertainty
about the technical parameters, when they are mentioned, as we
generally do not have information on the assumptions used to
determine them.
4.3. NEW POTENTIAL SITES: CONTRIBUTION OF SITEFINDER
SiteFinder is a screening tool that calculates hydropower potential
along a network of rivers. The result of SiteFinder is a set of river
stretches that appear to be relevant for the development of small
hydropower scheme i.e. river stretches that features the
combination of a high gradient of the river slope and favorable
hydrological conditions. The analysis relies on a Digital Elevation
Model (DEM) and climatic and/or hydrological data.
SiteFinder contributes to add 174 potential sites to the final
spatial database of hydropower. It is worth mentioning that
potential stretches that have not been visited may eventually not
be favorable for hydropower development.
Figure 11. Illustration of SiteFinder.
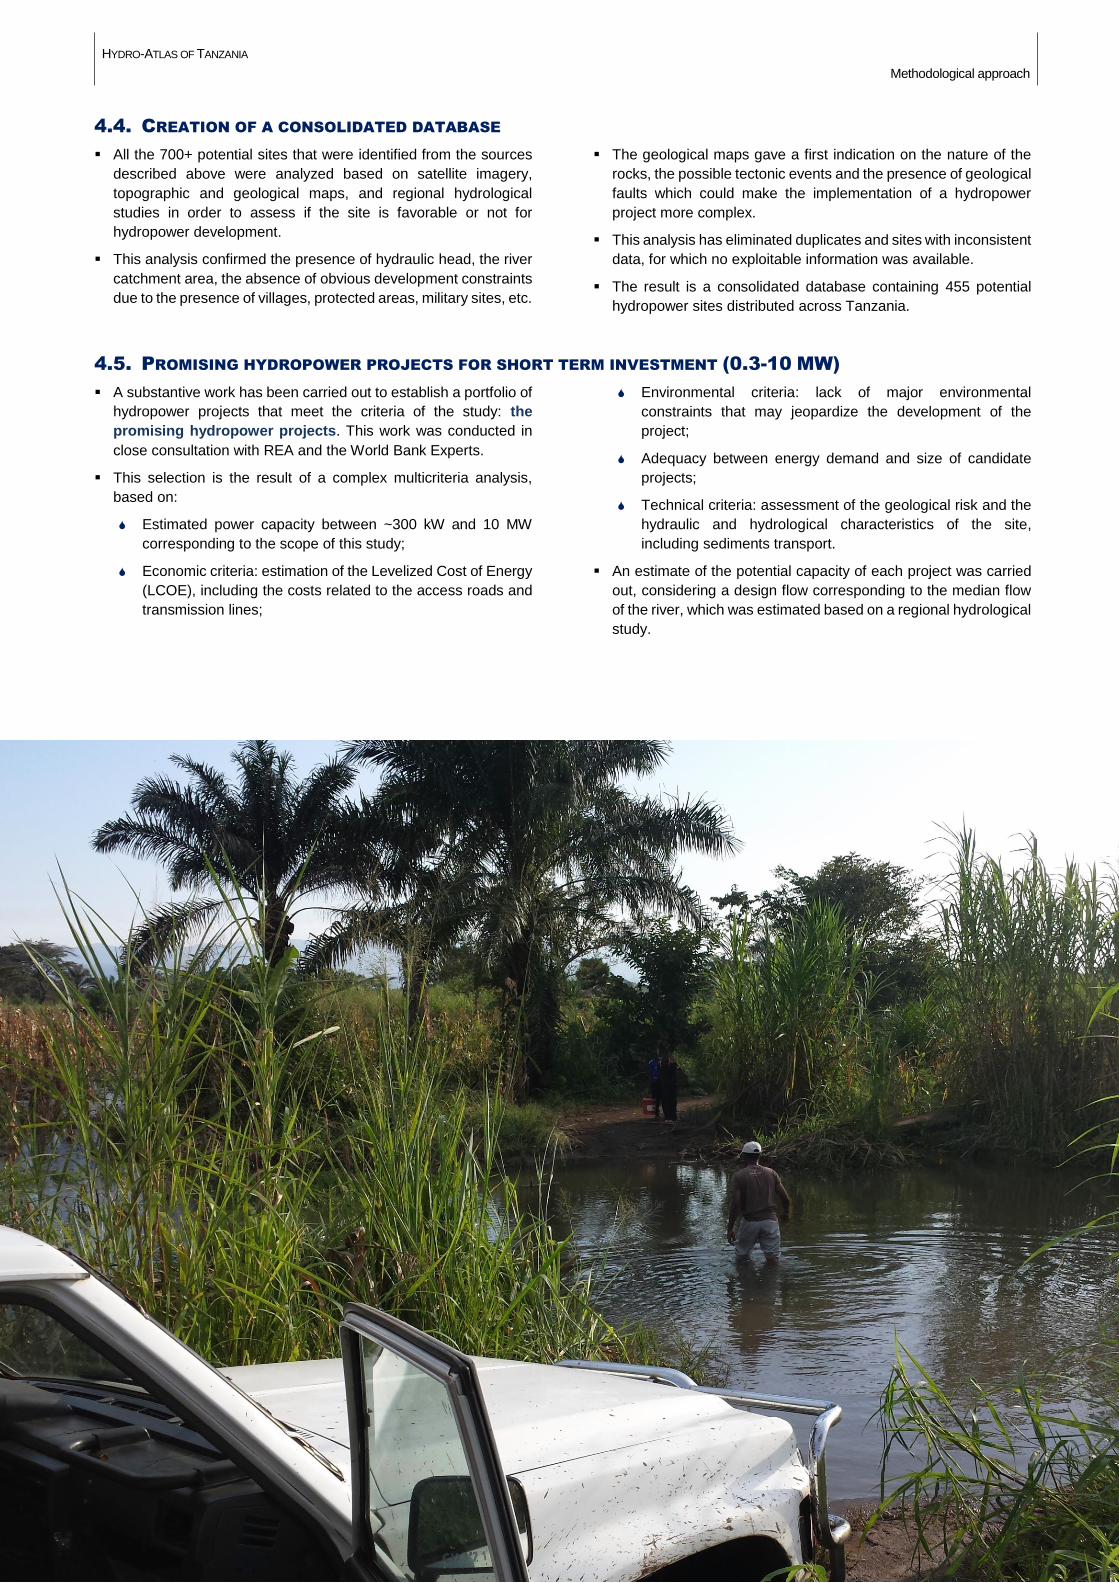
HYDRO-ATLAS OF TANZANIA
Methodological approach
Page B-3
4.4. CREATION OF A CONSOLIDATED DATABASE
All the 700+ potential sites that were identified from the sources
described above were analyzed based on satellite imagery,
topographic and geological maps, and regional hydrological
studies in order to assess if the site is favorable or not for
hydropower development.
This analysis confirmed the presence of hydraulic head, the river
catchment area, the absence of obvious development constraints
due to the presence of villages, protected areas, military sites, etc.
The geological maps gave a first indication on the nature of the
rocks, the possible tectonic events and the presence of geological
faults which could make the implementation of a hydropower
project more complex.
This analysis has eliminated duplicates and sites with inconsistent
data, for which no exploitable information was available.
The result is a consolidated database containing 455 potential
hydropower sites distributed across Tanzania.
4.5. PROMISING HYDROPOWER PROJECTS FOR SHORT TERM INVESTMENT (0.3-10 MW)
A substantive work has been carried out to establish a portfolio of
hydropower projects that meet the criteria of the study: the
promising hydropower projects. This work was conducted in
close consultation with REA and the World Bank Experts.
This selection is the result of a complex multicriteria analysis,
based on:
Estimated power capacity between ~300 kW and 10 MW
corresponding to the scope of this study;
Economic criteria: estimation of the Levelized Cost of Energy
(LCOE), including the costs related to the access roads and
transmission lines;
Environmental criteria: lack of major environmental
constraints that may jeopardize the development of the
project;
Adequacy between energy demand and size of candidate
projects;
Technical criteria: assessment of the geological risk and the
hydraulic and hydrological characteristics of the site,
including sediments transport.
An estimate of the potential capacity of each project was carried
out, considering a design flow corresponding to the median flow
of the river, which was estimated based on a regional hydrological
study.
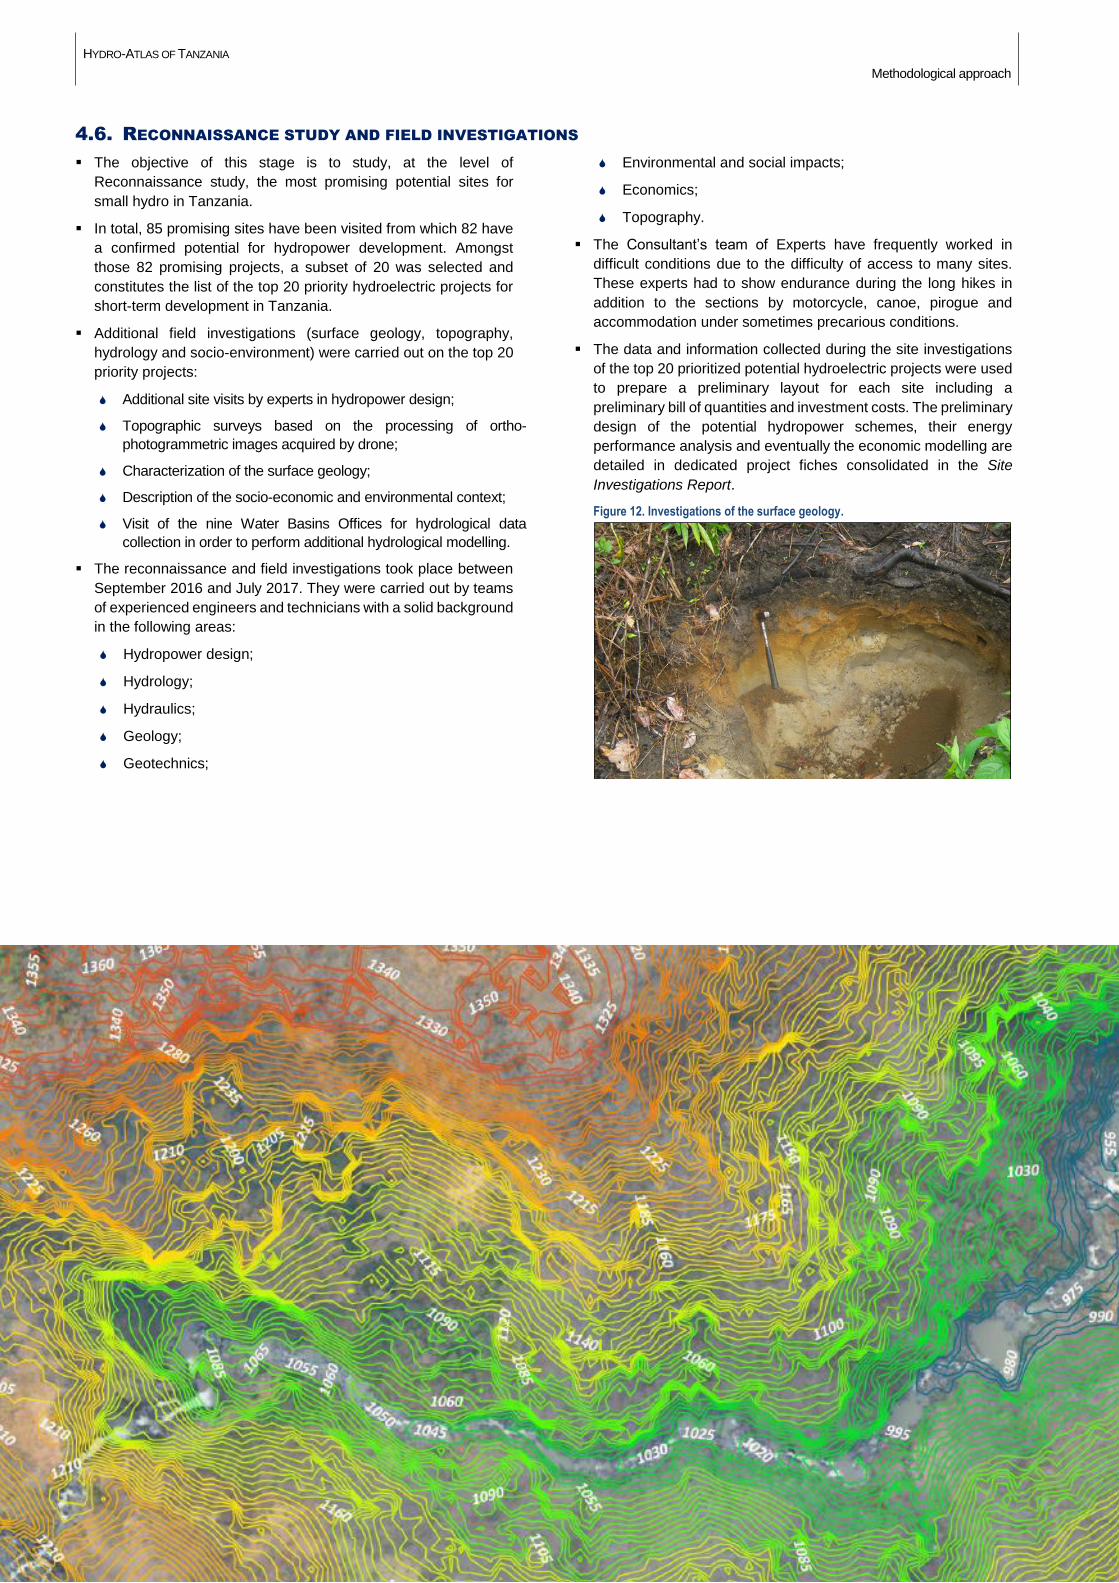
HYDRO-ATLAS OF TANZANIA
Methodological approach
Page B-4
4.6. RECONNAISSANCE STUDY AND FIELD INVESTIGATIONS
The objective of this stage is to study, at the level of
Reconnaissance study, the most promising potential sites for
small hydro in Tanzania.
In total, 85 promising sites have been visited from which 82 have
a confirmed potential for hydropower development. Amongst
those 82 promising projects, a subset of 20 was selected and
constitutes the list of the top 20 priority hydroelectric projects for
short-term development in Tanzania.
Additional field investigations (surface geology, topography,
hydrology and socio-environment) were carried out on the top 20
priority projects:
Additional site visits by experts in hydropower design;
Topographic surveys based on the processing of ortho-
photogrammetric images acquired by drone;
Characterization of the surface geology;
Description of the socio-economic and environmental context;
Visit of the nine Water Basins Offices for hydrological data
collection in order to perform additional hydrological modelling.
The reconnaissance and field investigations took place between
September 2016 and July 2017. They were carried out by teams
of experienced engineers and technicians with a solid background
in the following areas:
Hydropower design;
Hydrology;
Hydraulics;
Geology;
Geotechnics;
Environmental and social impacts;
Economics;
Topography.
The Consultant’s team of Experts have frequently worked in
difficult conditions due to the difficulty of access to many sites.
These experts had to show endurance during the long hikes in
addition to the sections by motorcycle, canoe, pirogue and
accommodation under sometimes precarious conditions.
The data and information collected during the site investigations
of the top 20 prioritized potential hydroelectric projects were used
to prepare a preliminary layout for each site including a
preliminary bill of quantities and investment costs. The preliminary
design of the potential hydropower schemes, their energy
performance analysis and eventually the economic modelling are
detailed in dedicated project fiches consolidated in the Site
Investigations Report.
Figure 12. Investigations of the surface geology.
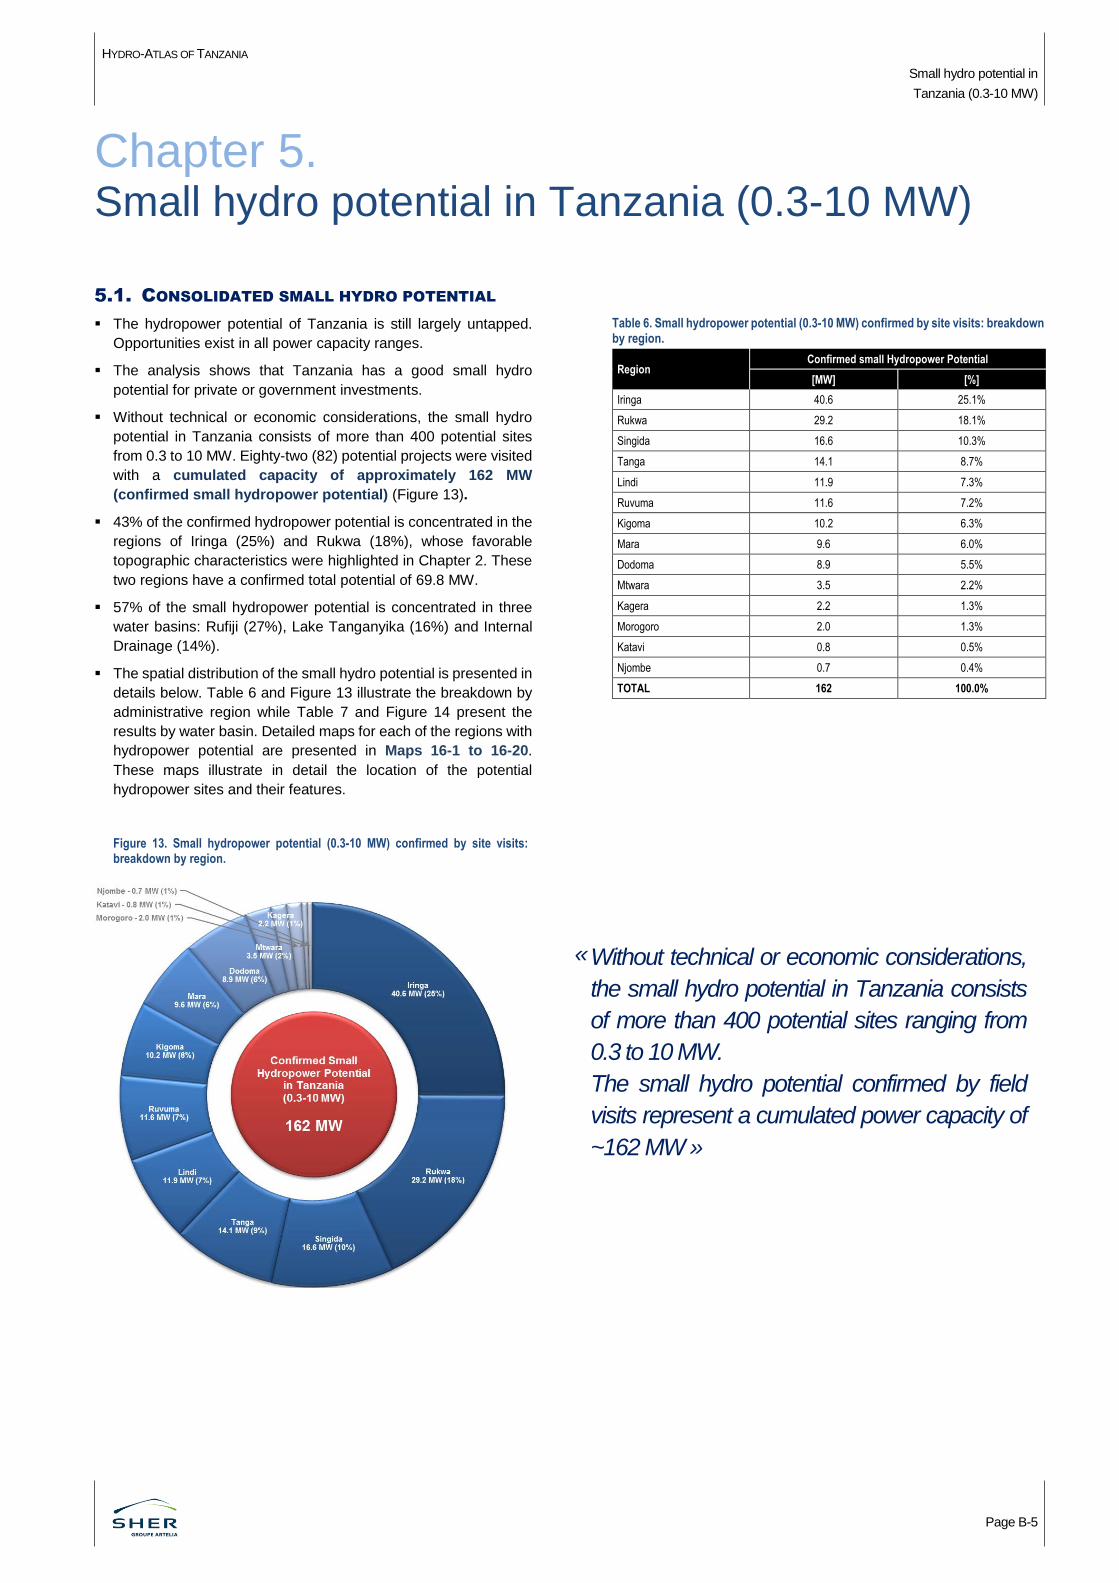
HYDRO-ATLAS OF TANZANIA
Small hydro potential in
Tanzania (0.3-10 MW)
Page B-5
Chapter 5. Small hydro potential in Tanzania (0.3-10 MW)
5.1. CONSOLIDATED SMALL HYDRO POTENTIAL
The hydropower potential of Tanzania is still largely untapped.
Opportunities exist in all power capacity ranges.
The analysis shows that Tanzania has a good small hydro
potential for private or government investments.
Without technical or economic considerations, the small hydro
potential in Tanzania consists of more than 400 potential sites
from 0.3 to 10 MW. Eighty-two (82) potential projects were visited
with a cumulated capacity of approximately 162 MW
(confirmed small hydropower potential) (Figure 13).
43% of the confirmed hydropower potential is concentrated in the
regions of Iringa (25%) and Rukwa (18%), whose favorable
topographic characteristics were highlighted in Chapter 2. These
two regions have a confirmed total potential of 69.8 MW.
57% of the small hydropower potential is concentrated in three
water basins: Rufiji (27%), Lake Tanganyika (16%) and Internal
Drainage (14%).
The spatial distribution of the small hydro potential is presented in
details below. Table 6 and Figure 13 illustrate the breakdown by
administrative region while Table 7 and Figure 14 present the
results by water basin. Detailed maps for each of the regions with
hydropower potential are presented in Maps 16-1 to 16-20.
These maps illustrate in detail the location of the potential
hydropower sites and their features.
Figure 13. Small hydropower potential (0.3-10 MW) confirmed by site visits: breakdown by region.
Table 6. Small hydropower potential (0.3-10 MW) confirmed by site visits: breakdown by region.
Region Confirmed small Hydropower Potential
[MW] [%]
Iringa 40.6 25.1%
Rukwa 29.2 18.1%
Singida 16.6 10.3%
Tanga 14.1 8.7%
Lindi 11.9 7.3%
Ruvuma 11.6 7.2%
Kigoma 10.2 6.3%
Mara 9.6 6.0%
Dodoma 8.9 5.5%
Mtwara 3.5 2.2%
Kagera 2.2 1.3%
Morogoro 2.0 1.3%
Katavi 0.8 0.5%
Njombe 0.7 0.4%
TOTAL 162 100.0%
Without technical or economic considerations,
the small hydro potential in Tanzania consists
of more than 400 potential sites ranging from
0.3 to 10 MW.
The small hydro potential confirmed by field
visits represent a cumulated power capacity of
~162 MW »
«
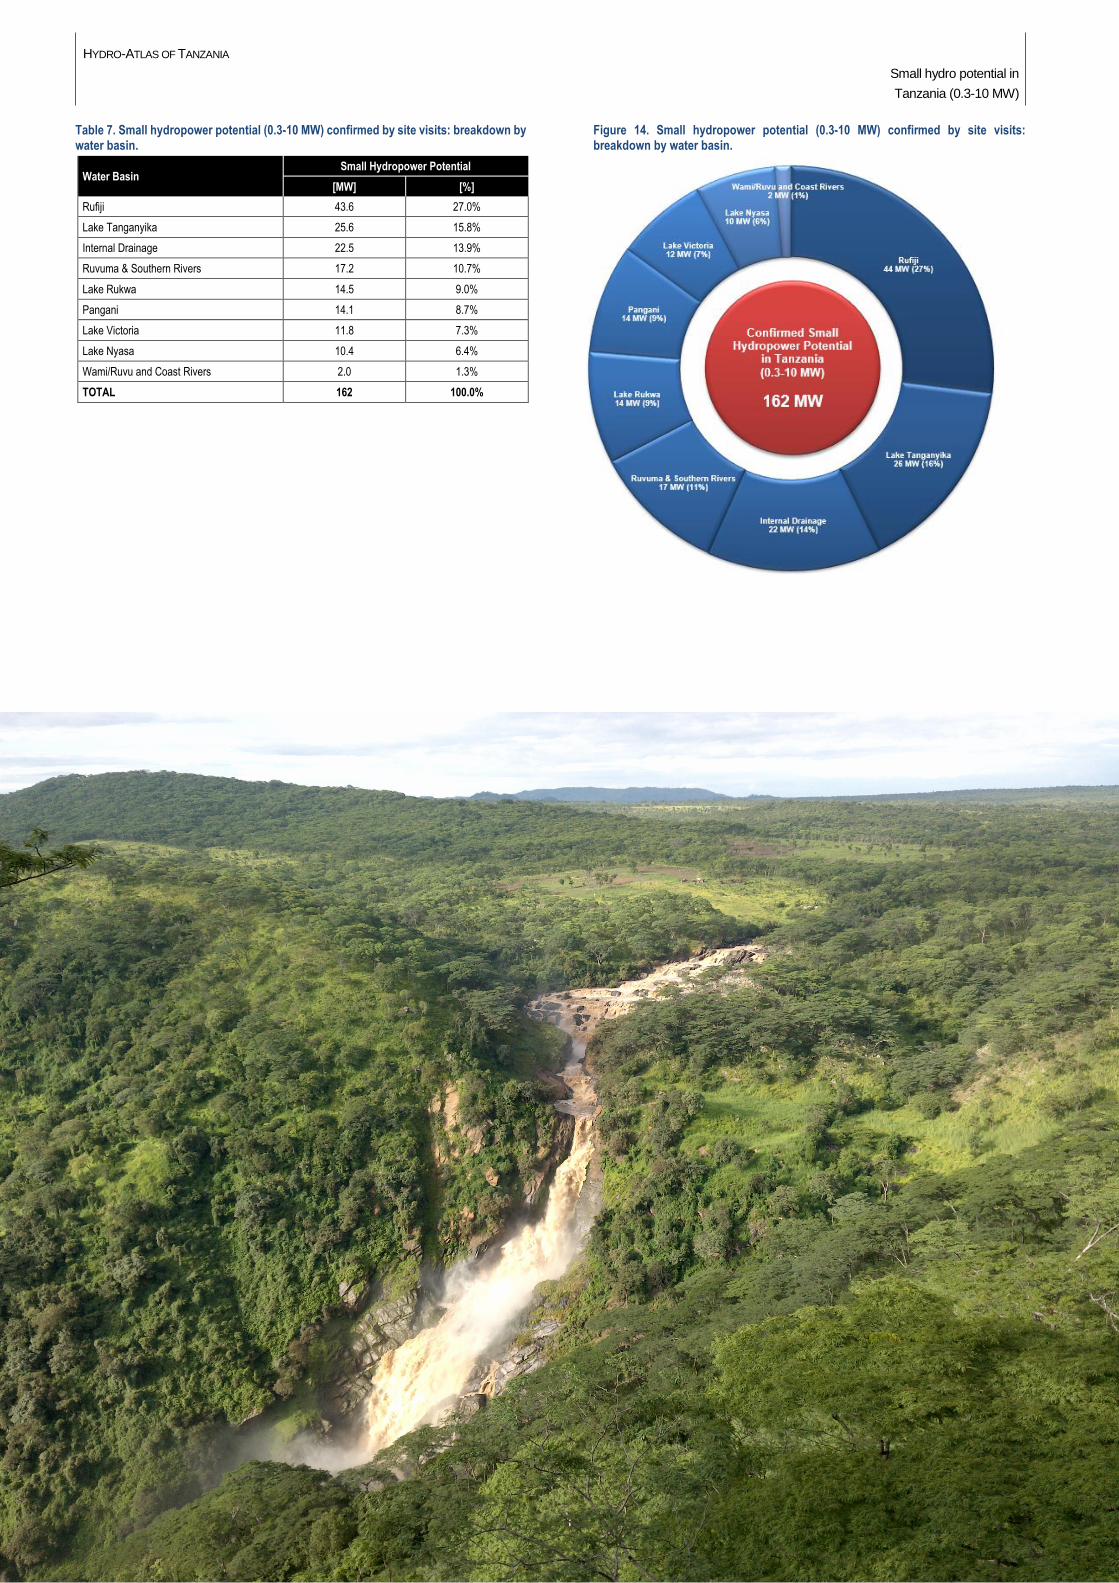
HYDRO-ATLAS OF TANZANIA
Small hydro potential in
Tanzania (0.3-10 MW)
Page B-6
Table 7. Small hydropower potential (0.3-10 MW) confirmed by site visits: breakdown by water basin.
Water Basin Small Hydropower Potential
[MW] [%]
Rufiji 43.6 27.0%
Lake Tanganyika 25.6 15.8%
Internal Drainage 22.5 13.9%
Ruvuma & Southern Rivers 17.2 10.7%
Lake Rukwa 14.5 9.0%
Pangani 14.1 8.7%
Lake Victoria 11.8 7.3%
Lake Nyasa 10.4 6.4%
Wami/Ruvu and Coast Rivers 2.0 1.3%
TOTAL 162 100.0%
Figure 14. Small hydropower potential (0.3-10 MW) confirmed by site visits: breakdown by water basin.
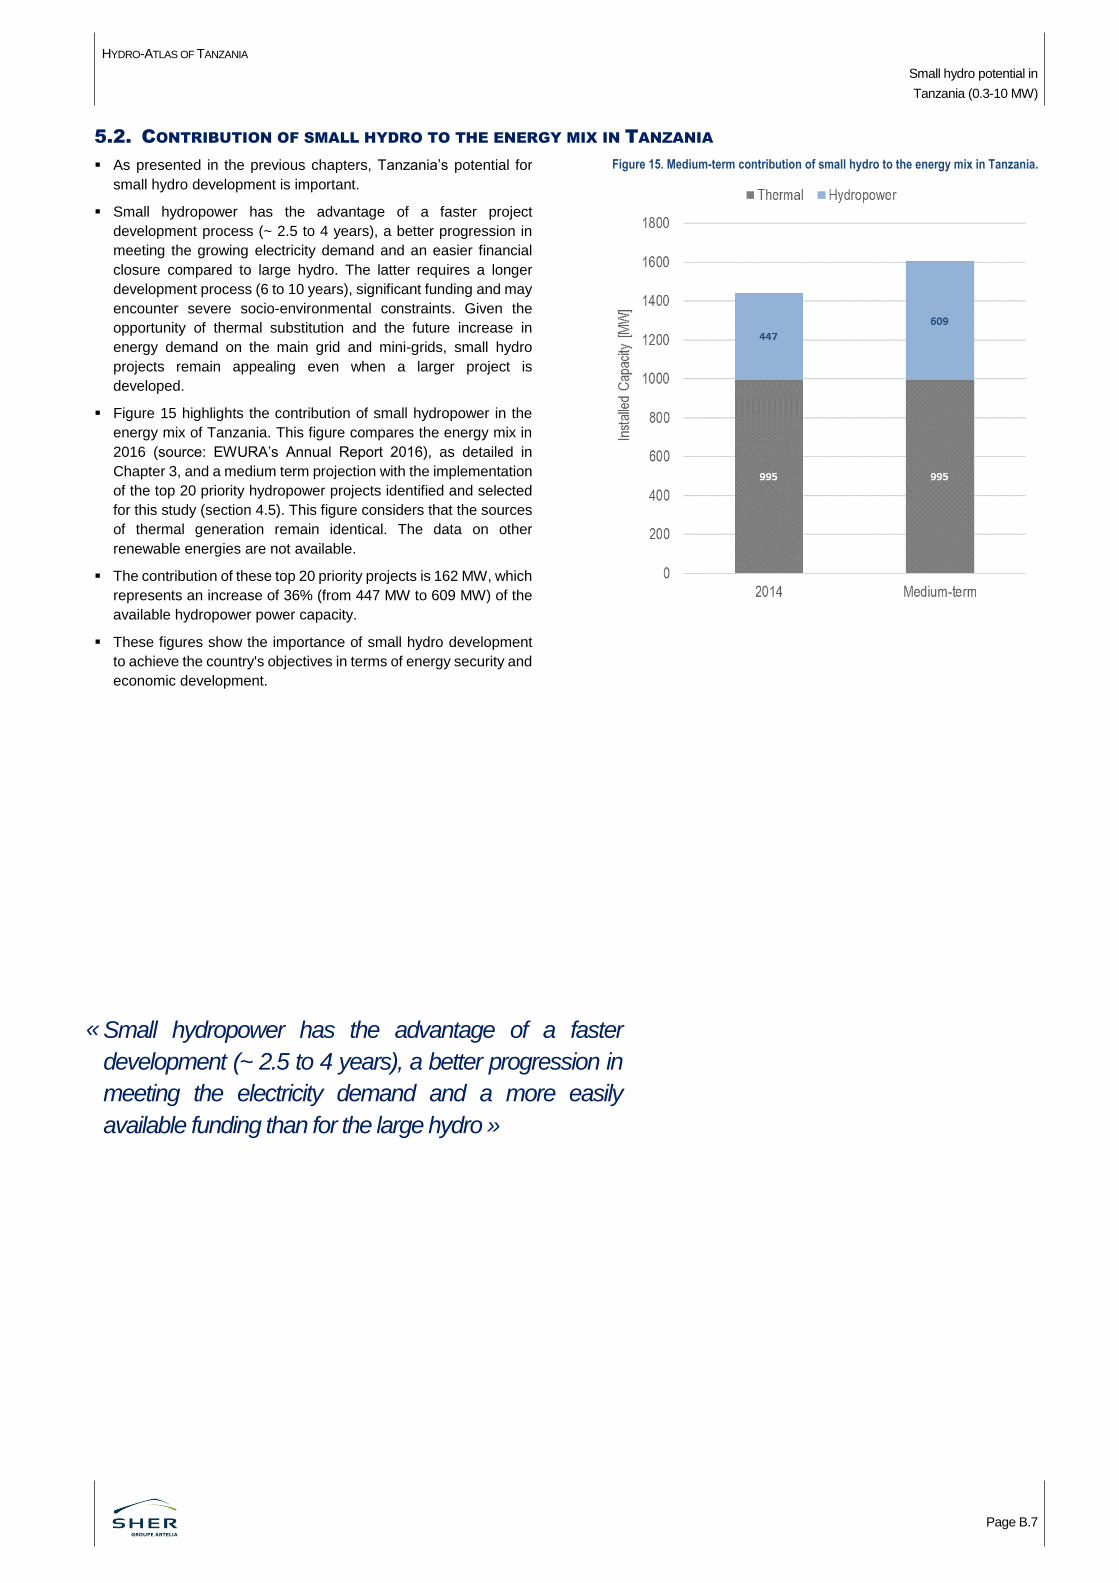
HYDRO-ATLAS OF TANZANIA
Small hydro potential in
Tanzania (0.3-10 MW)
Page B.7
5.2. CONTRIBUTION OF SMALL HYDRO TO THE ENERGY MIX IN TANZANIA
As presented in the previous chapters, Tanzania’s potential for
small hydro development is important.
Small hydropower has the advantage of a faster project
development process (~ 2.5 to 4 years), a better progression in
meeting the growing electricity demand and an easier financial
closure compared to large hydro. The latter requires a longer
development process (6 to 10 years), significant funding and may
encounter severe socio-environmental constraints. Given the
opportunity of thermal substitution and the future increase in
energy demand on the main grid and mini-grids, small hydro
projects remain appealing even when a larger project is
developed.
Figure 15 highlights the contribution of small hydropower in the
energy mix of Tanzania. This figure compares the energy mix in
2016 (source: EWURA’s Annual Report 2016), as detailed in
Chapter 3, and a medium term projection with the implementation
of the top 20 priority hydropower projects identified and selected
for this study (section 4.5). This figure considers that the sources
of thermal generation remain identical. The data on other
renewable energies are not available.
The contribution of these top 20 priority projects is 162 MW, which
represents an increase of 36% (from 447 MW to 609 MW) of the
available hydropower power capacity.
These figures show the importance of small hydro development
to achieve the country's objectives in terms of energy security and
economic development.
Figure 15. Medium-term contribution of small hydro to the energy mix in Tanzania.
Small hydropower has the advantage of a faster
development (~ 2.5 to 4 years), a better progression in
meeting the electricity demand and a more easily
available funding than for the large hydro »
«
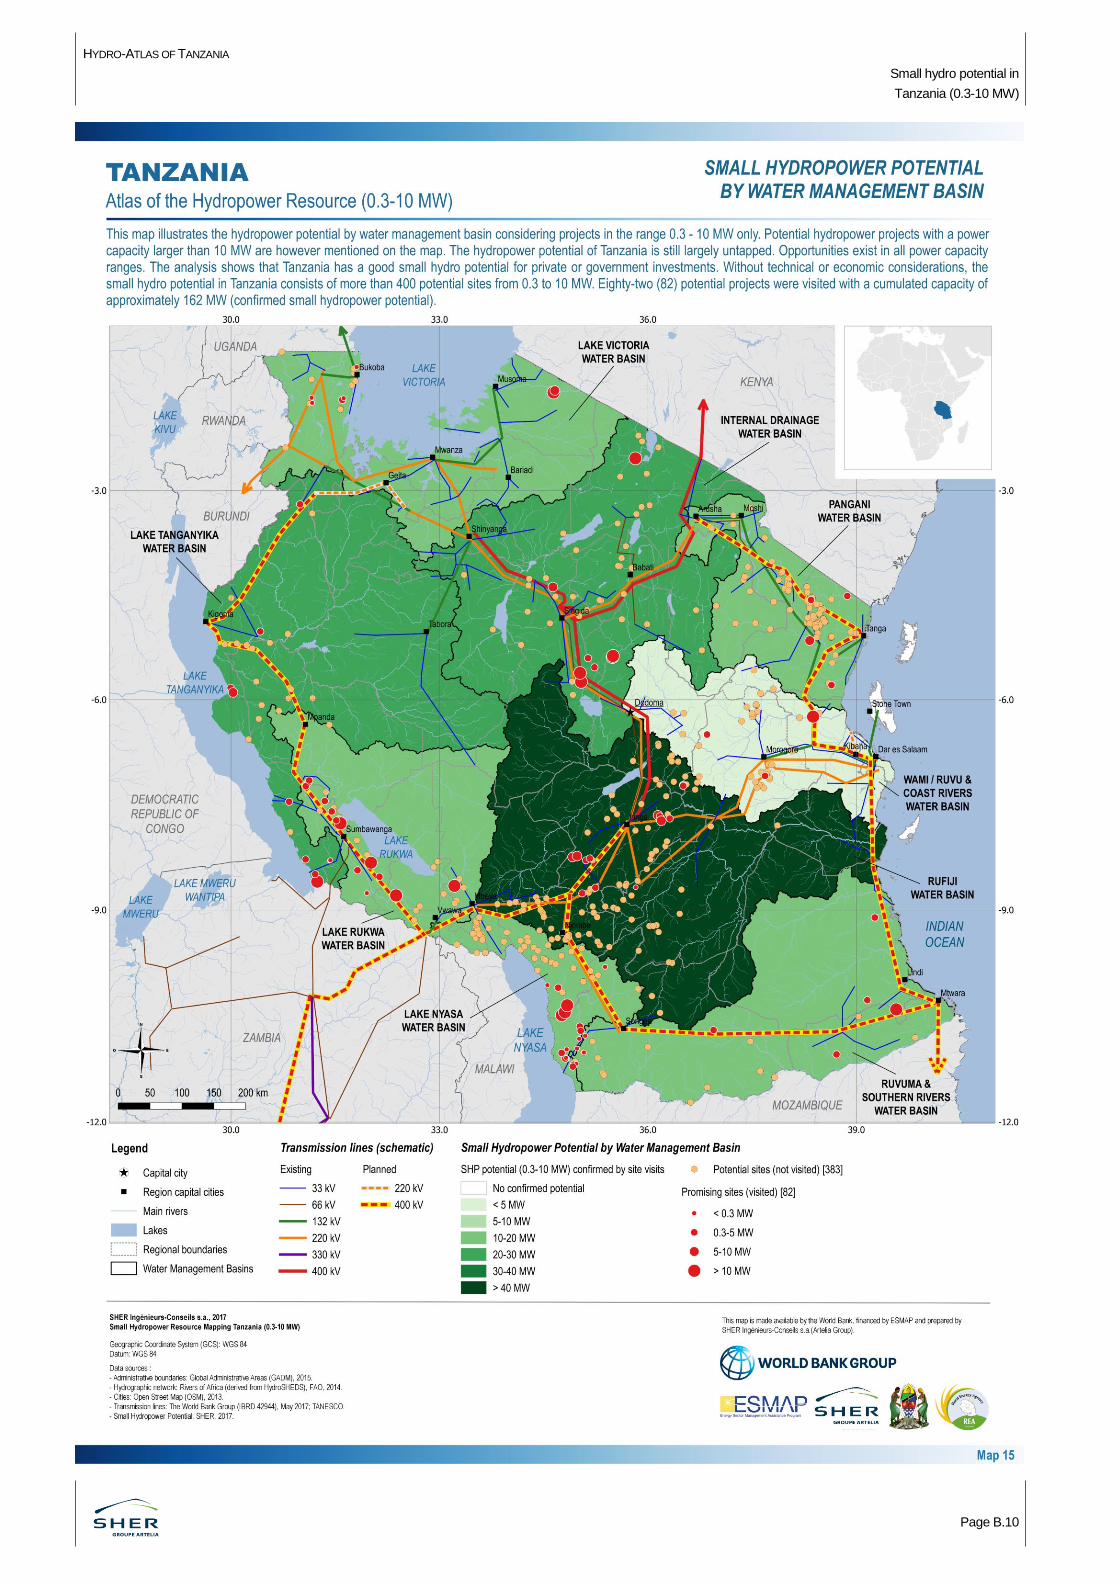
HYDRO-ATLAS OF TANZANIA
Small hydro potential in
Tanzania (0.3-10 MW)
Page B.10
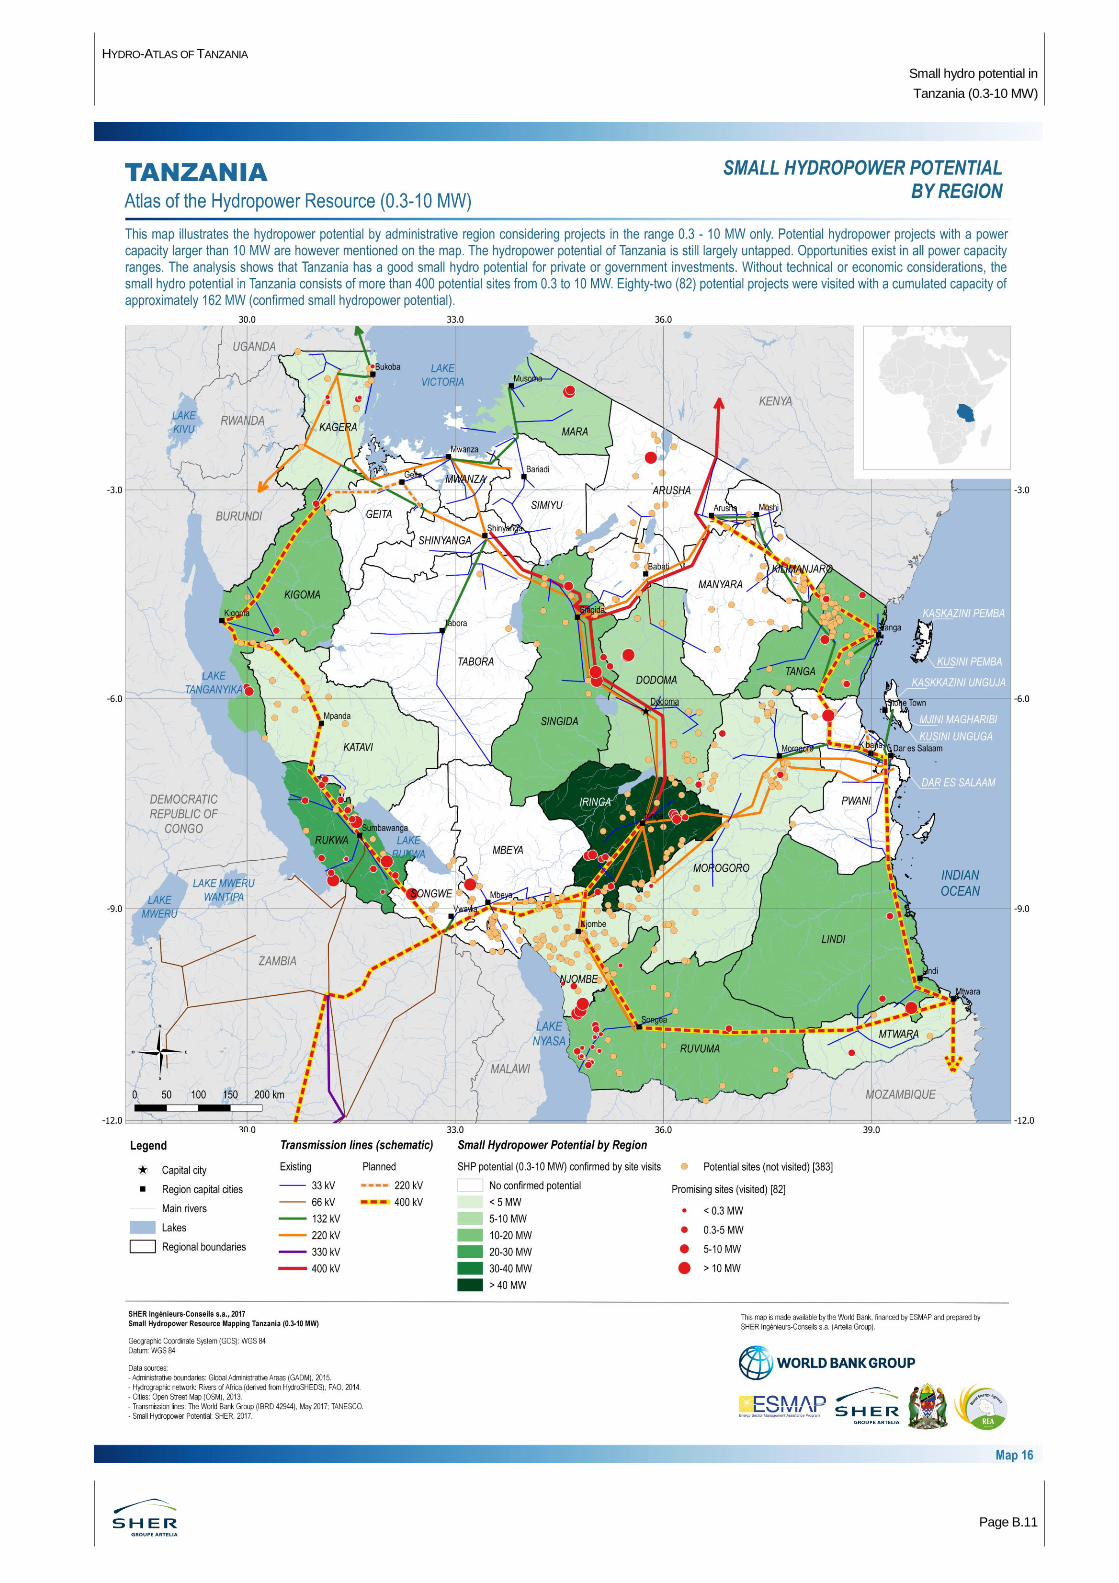
HYDRO-ATLAS OF TANZANIA
Small hydro potential in
Tanzania (0.3-10 MW)
Page B.11
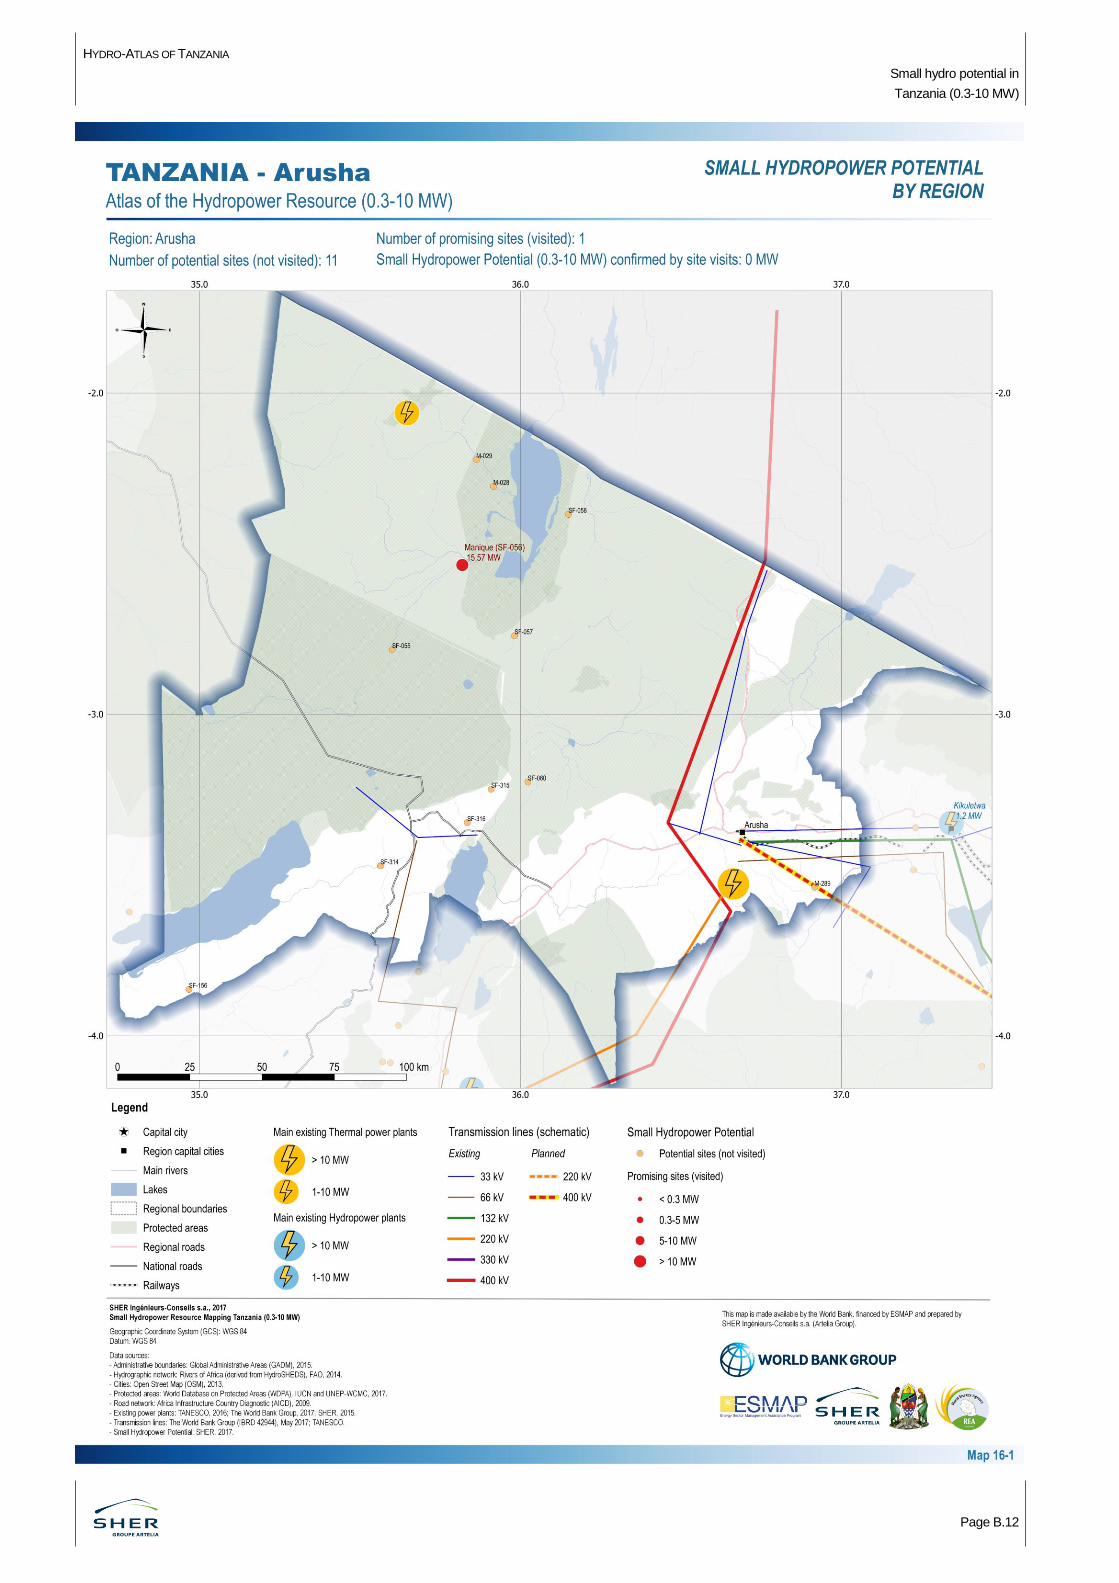
HYDRO-ATLAS OF TANZANIA
Small hydro potential in
Tanzania (0.3-10 MW)
Page B.12
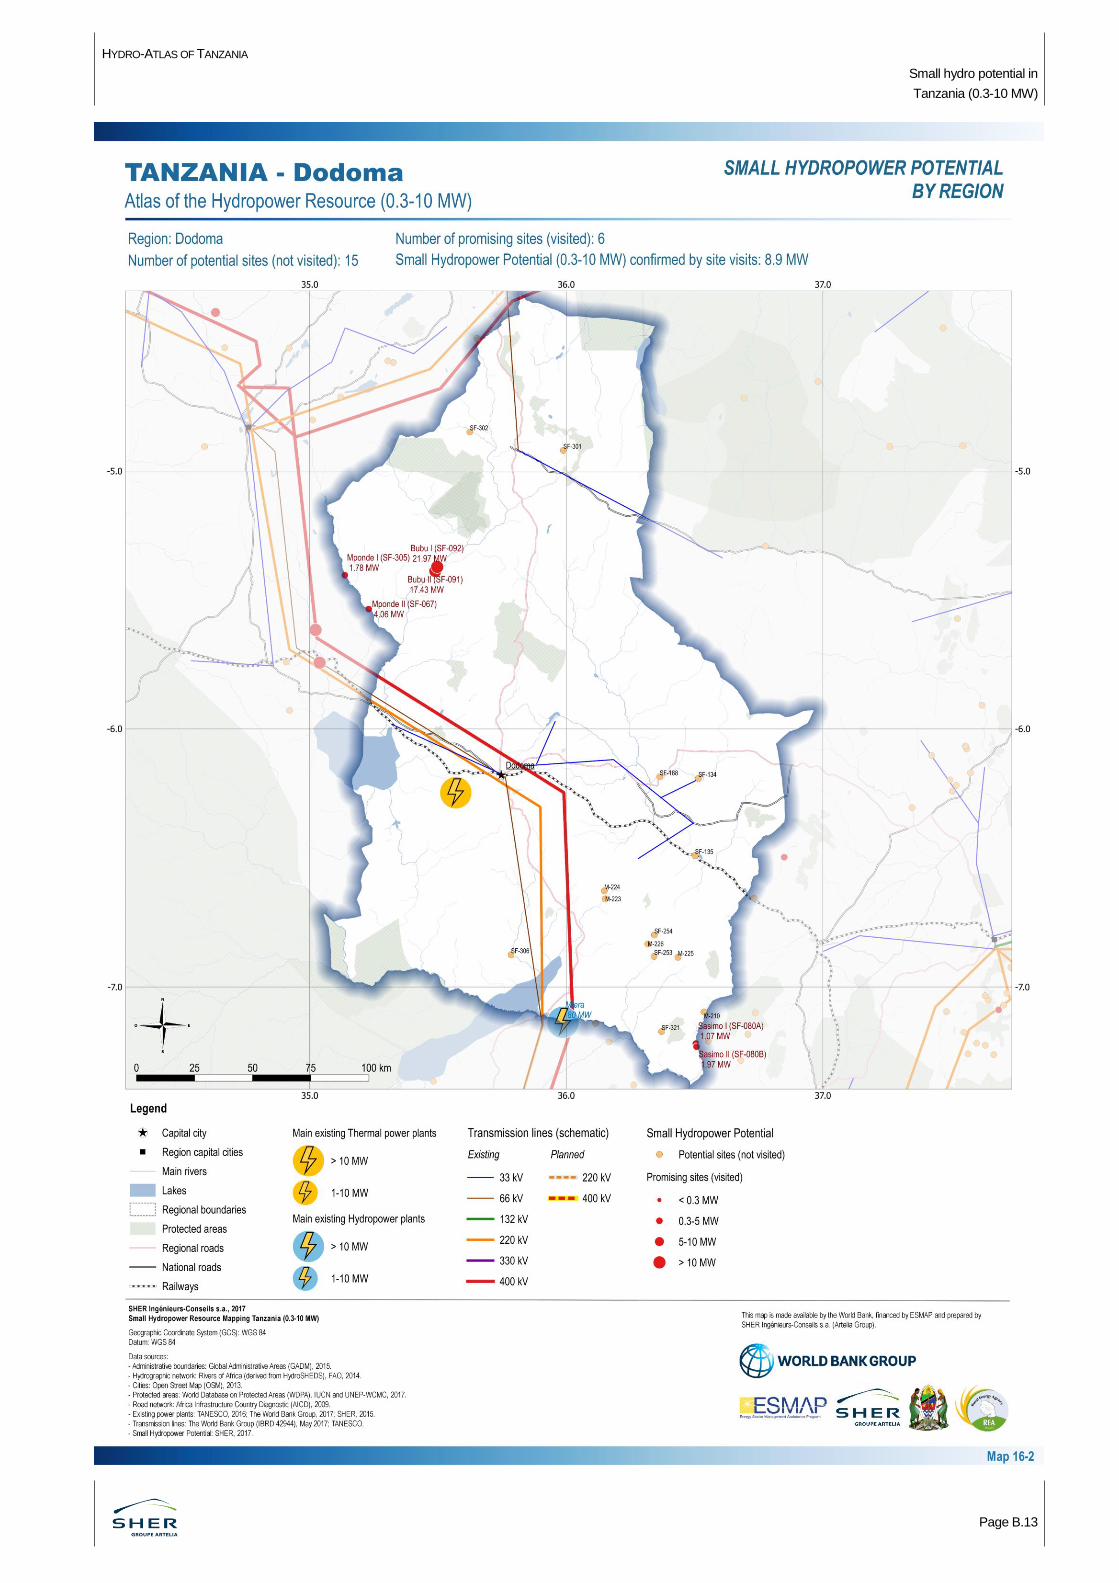
HYDRO-ATLAS OF TANZANIA
Small hydro potential in
Tanzania (0.3-10 MW)
Page B.13
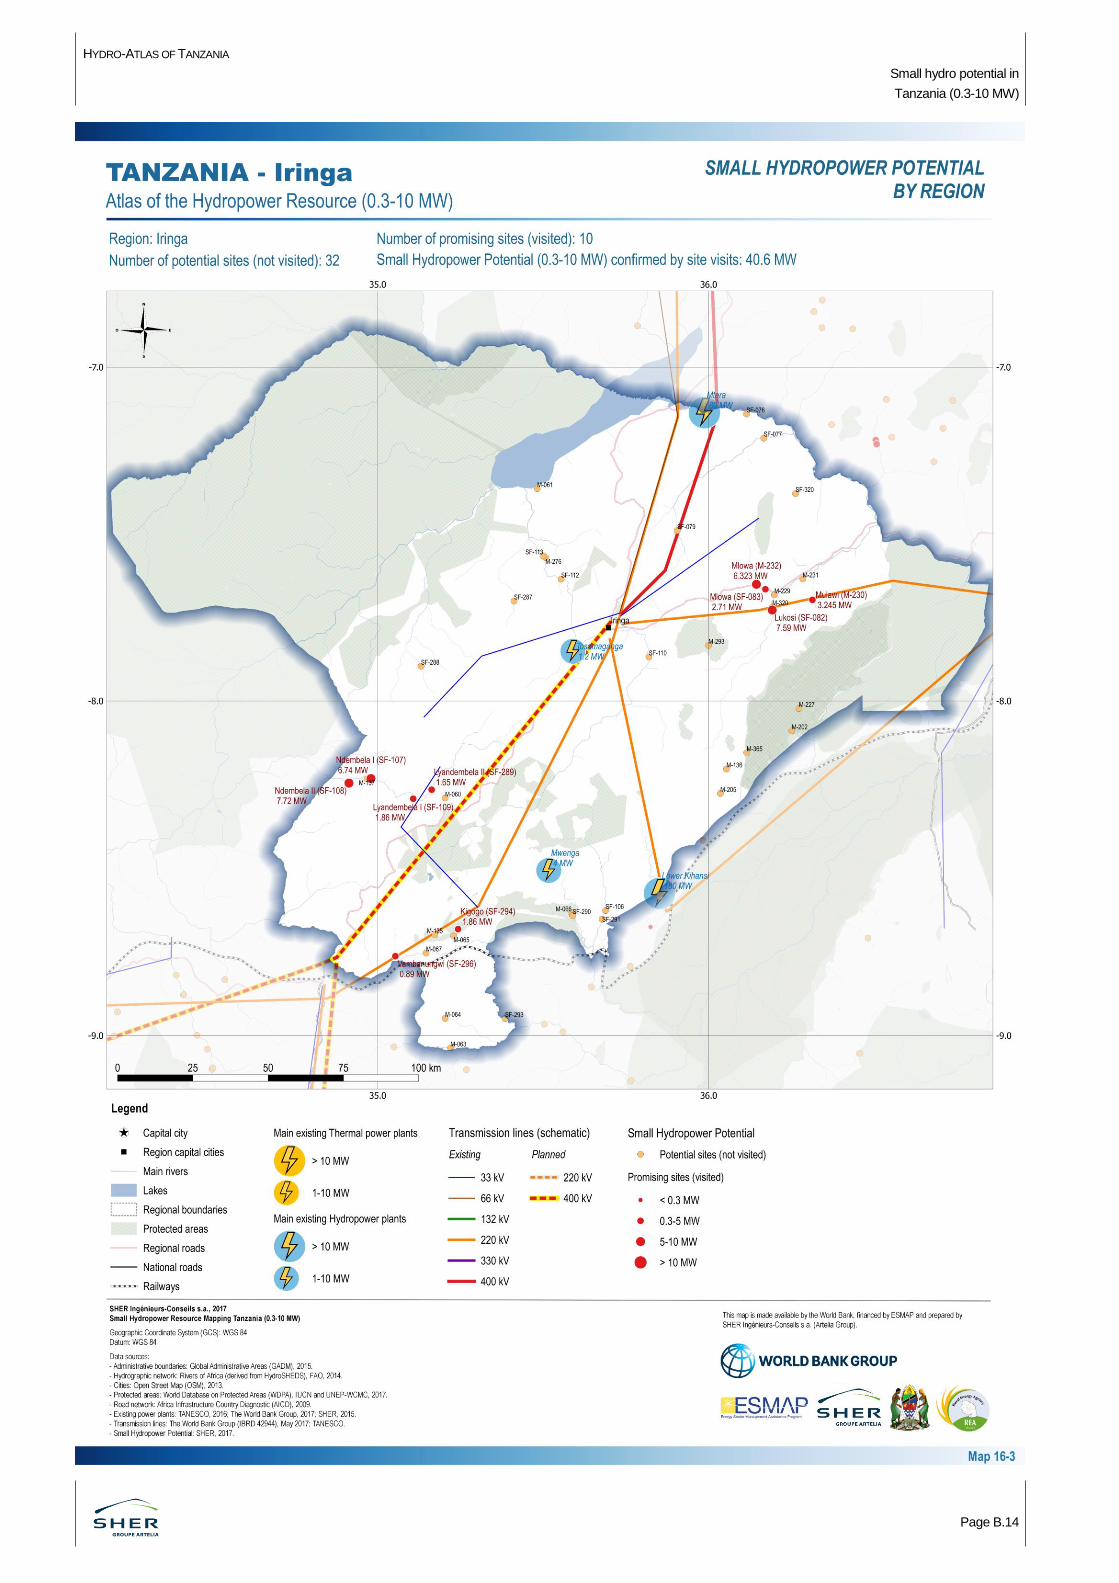
HYDRO-ATLAS OF TANZANIA
Small hydro potential in
Tanzania (0.3-10 MW)
Page B.14
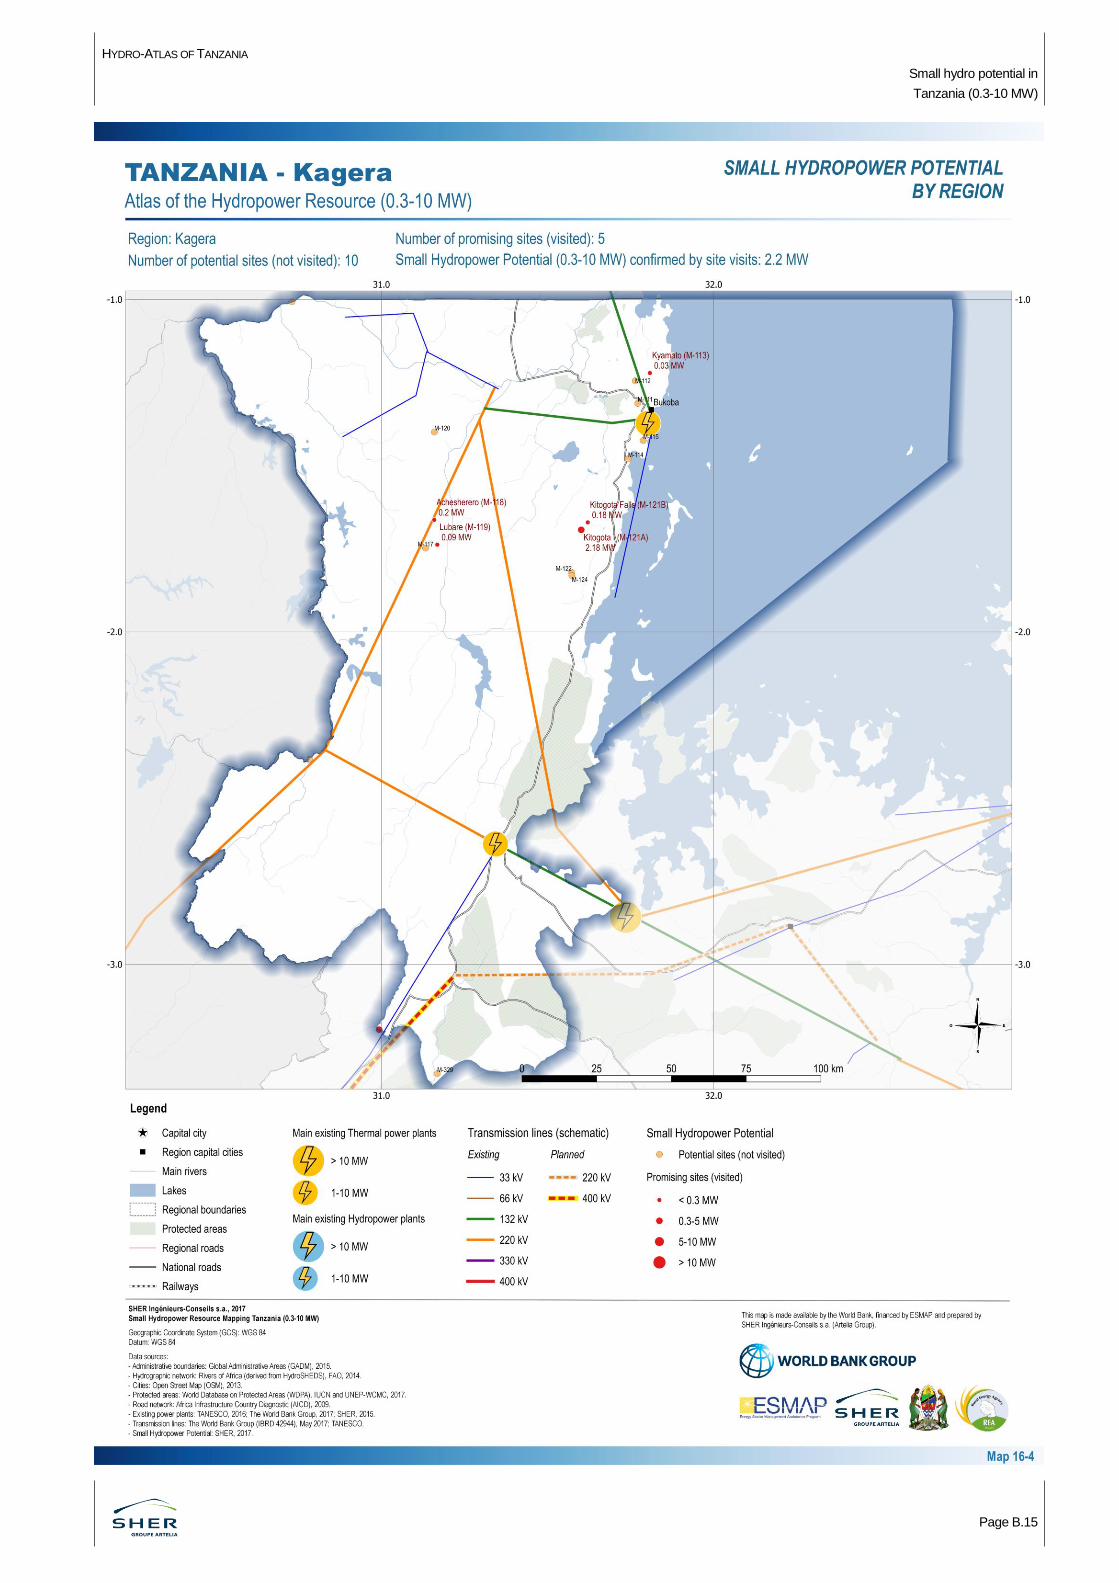
HYDRO-ATLAS OF TANZANIA
Small hydro potential in
Tanzania (0.3-10 MW)
Page B.15
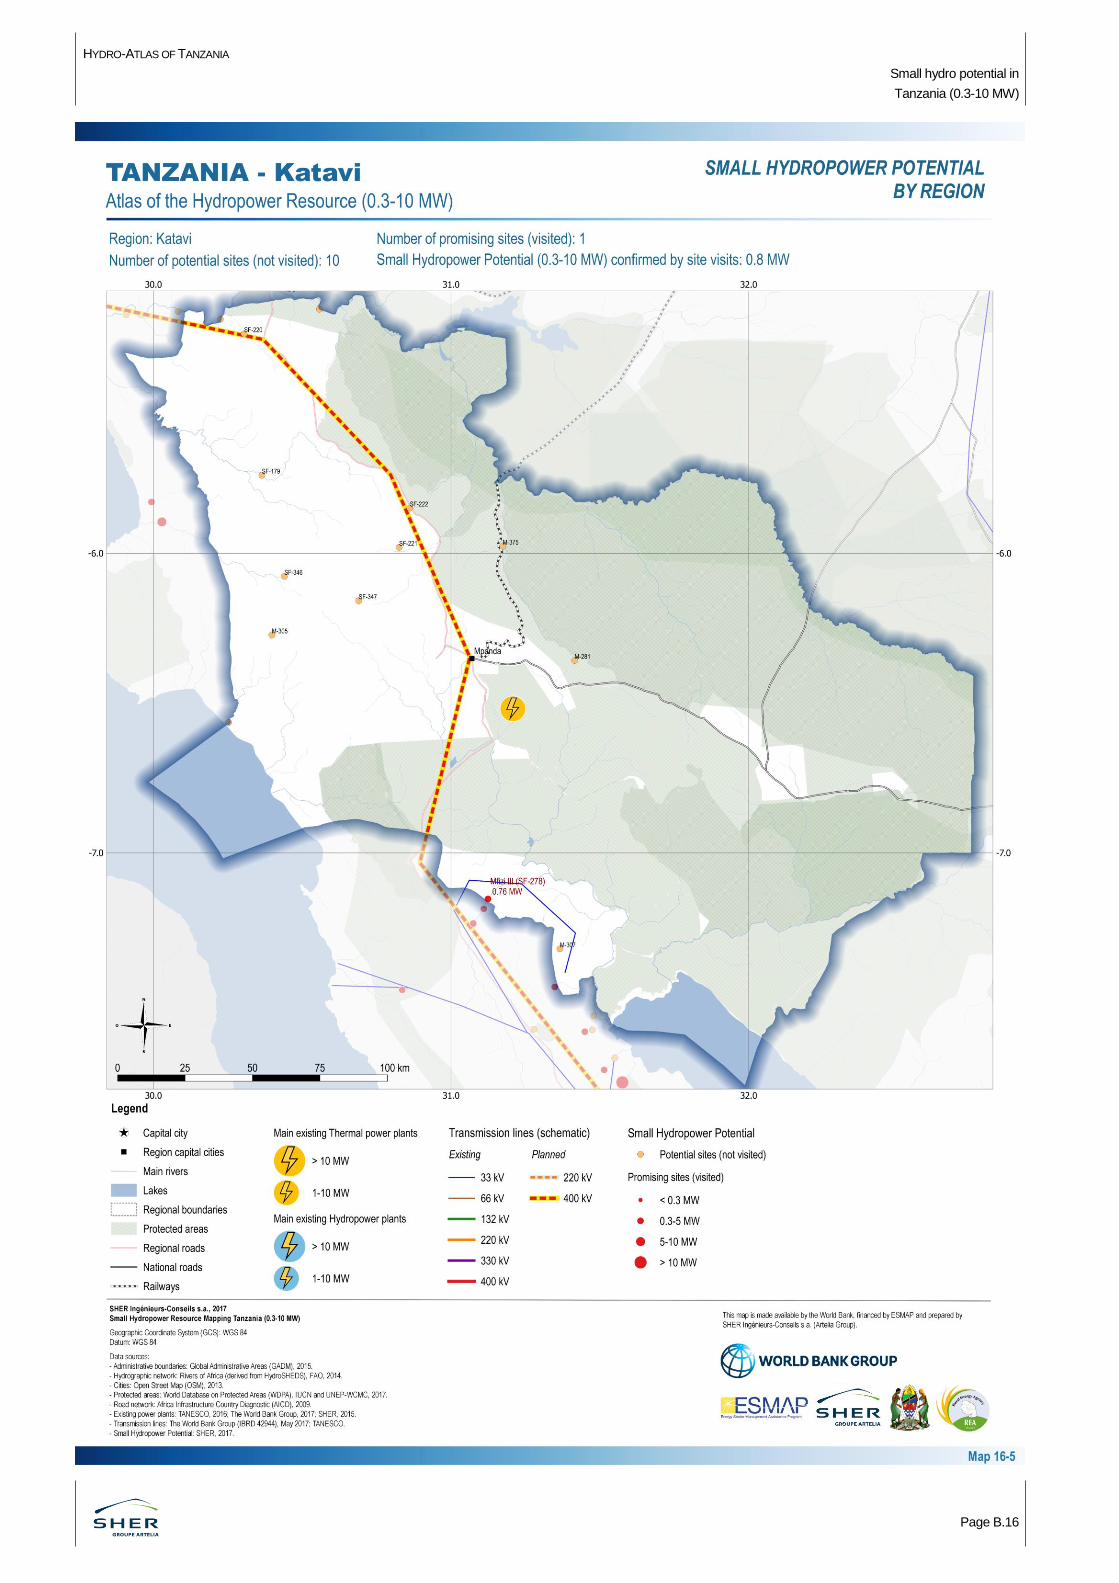
HYDRO-ATLAS OF TANZANIA
Small hydro potential in
Tanzania (0.3-10 MW)
Page B.16
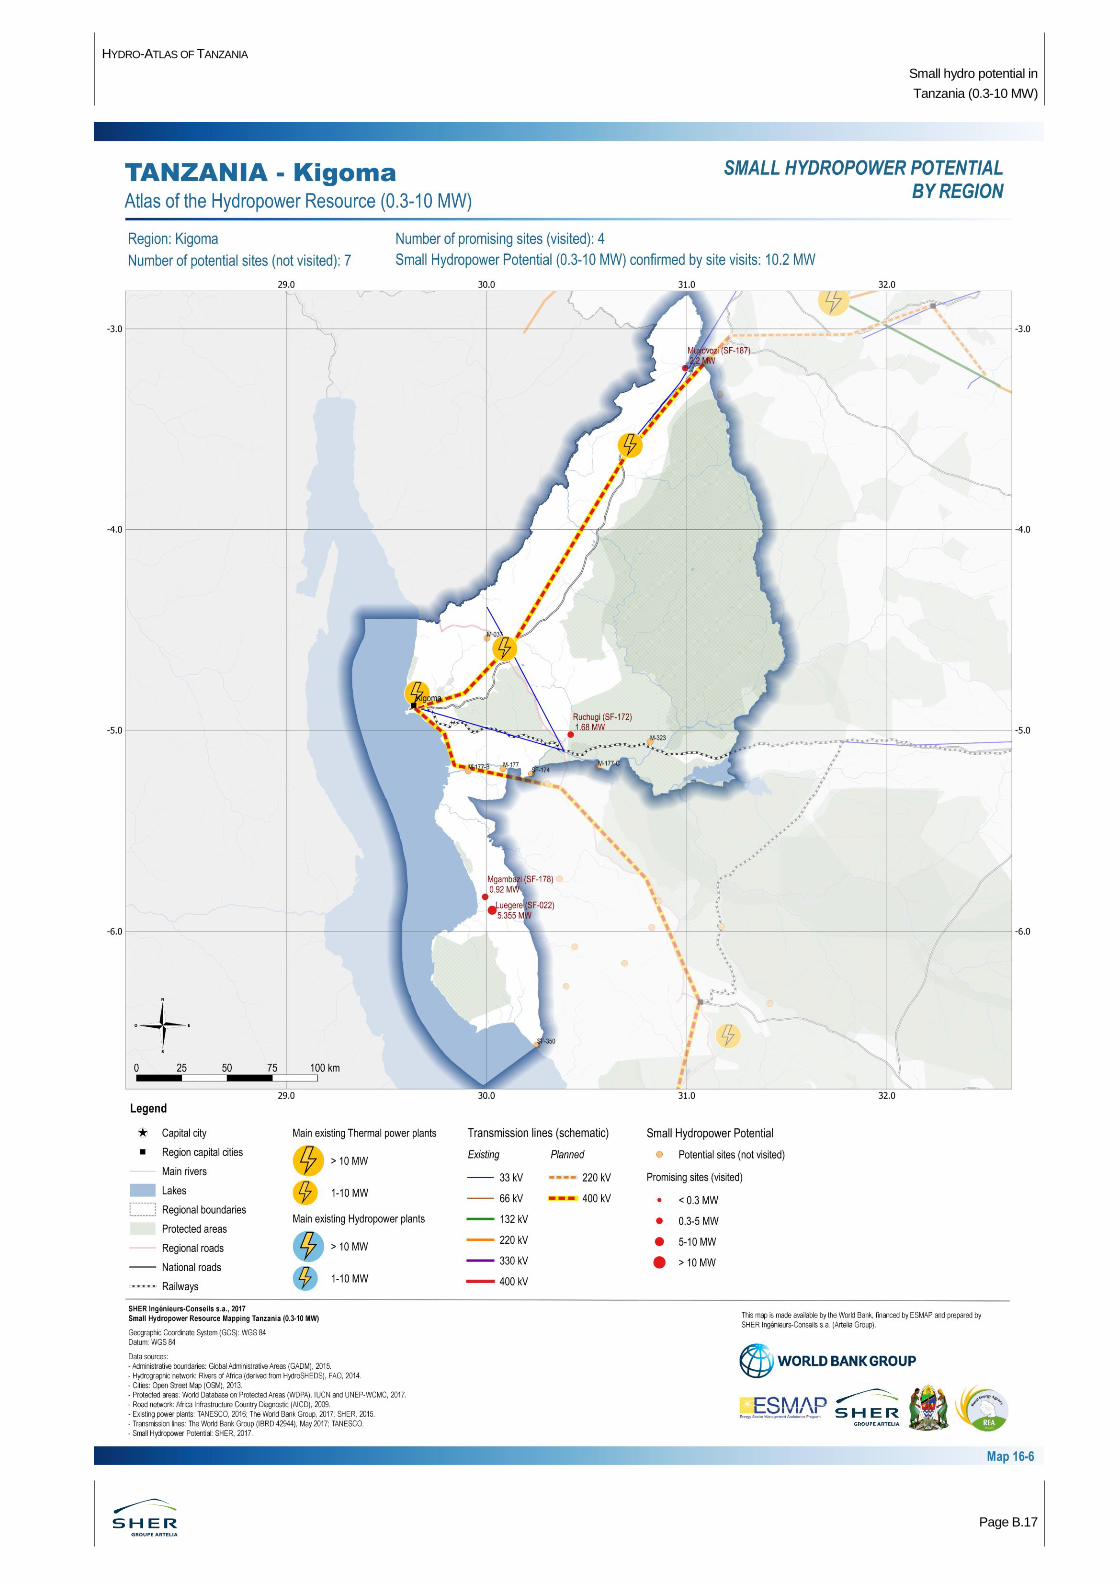
HYDRO-ATLAS OF TANZANIA
Small hydro potential in
Tanzania (0.3-10 MW)
Page B.17
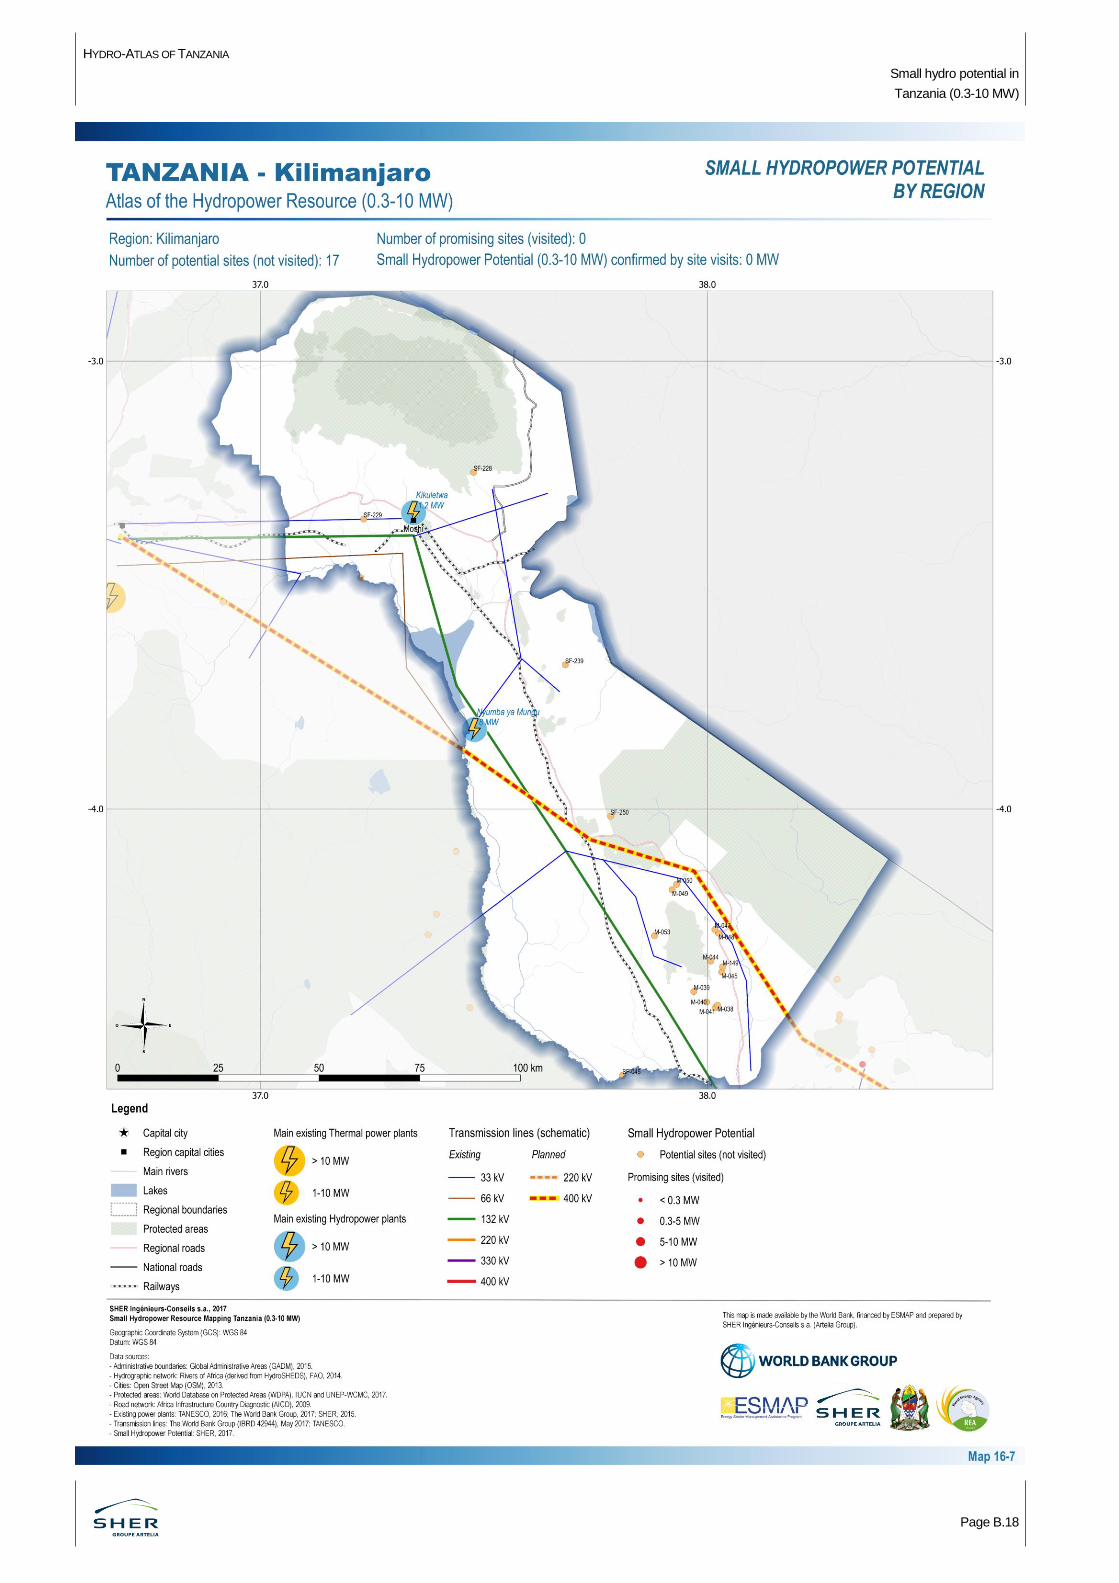
HYDRO-ATLAS OF TANZANIA
Small hydro potential in
Tanzania (0.3-10 MW)
Page B.18
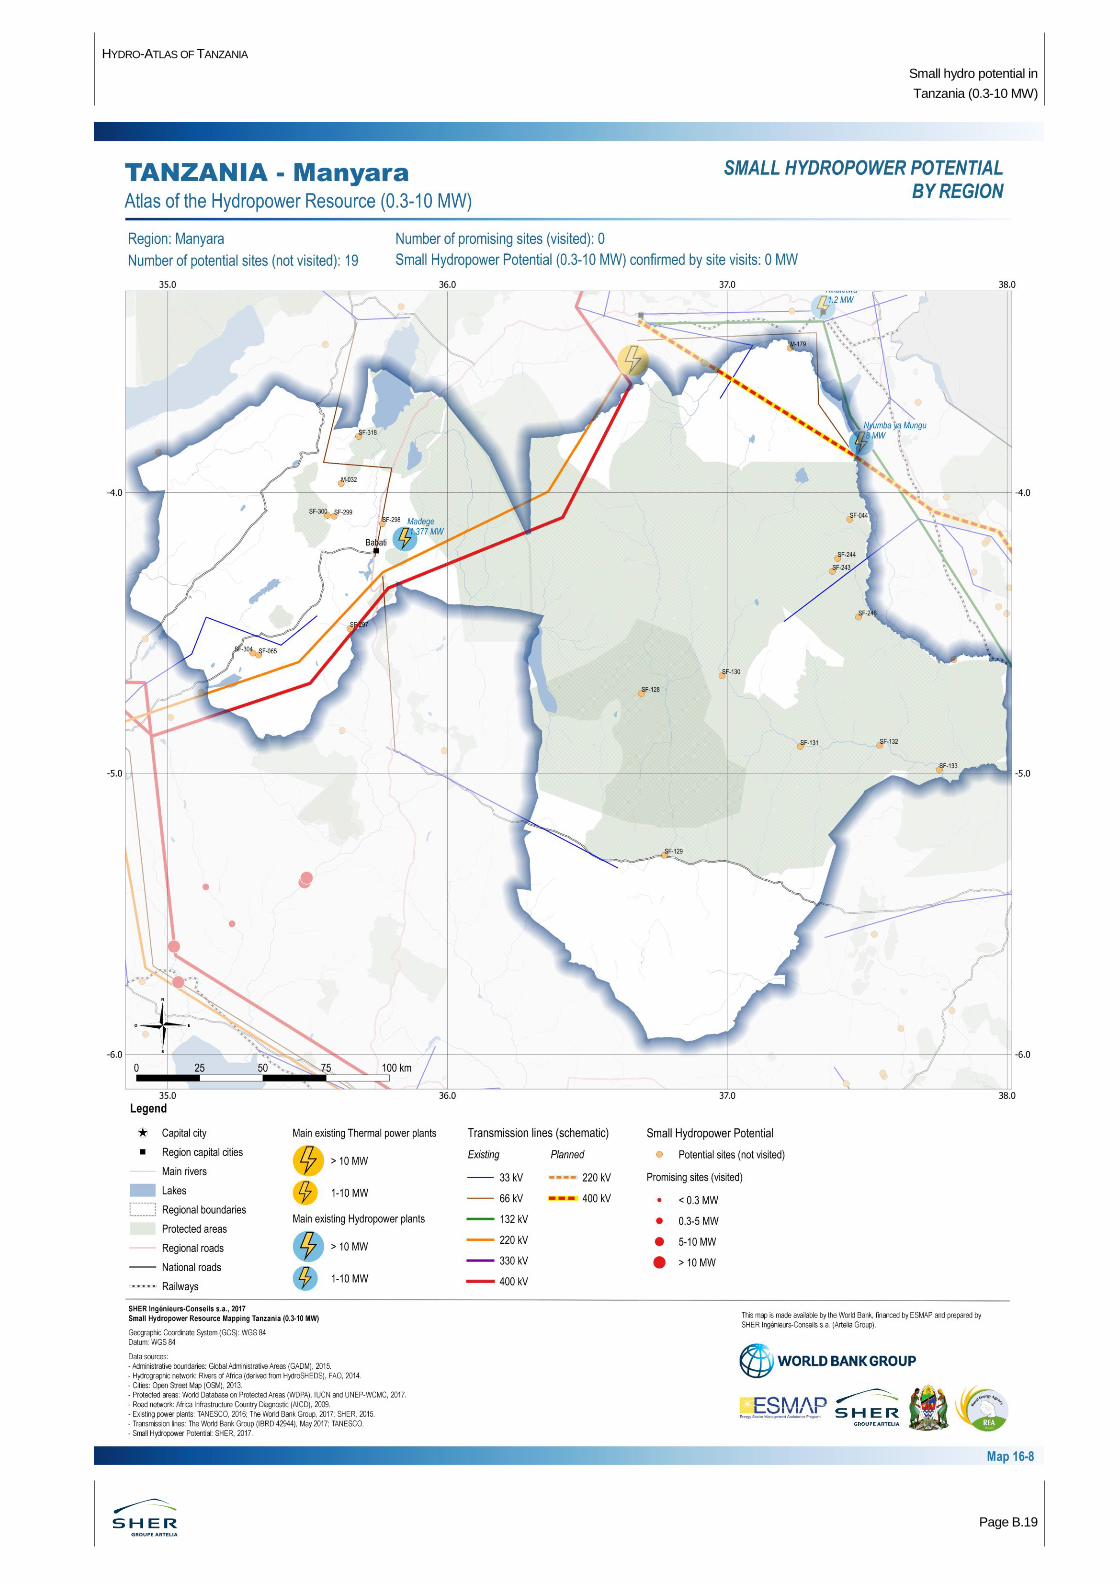
HYDRO-ATLAS OF TANZANIA
Small hydro potential in
Tanzania (0.3-10 MW)
Page B.19
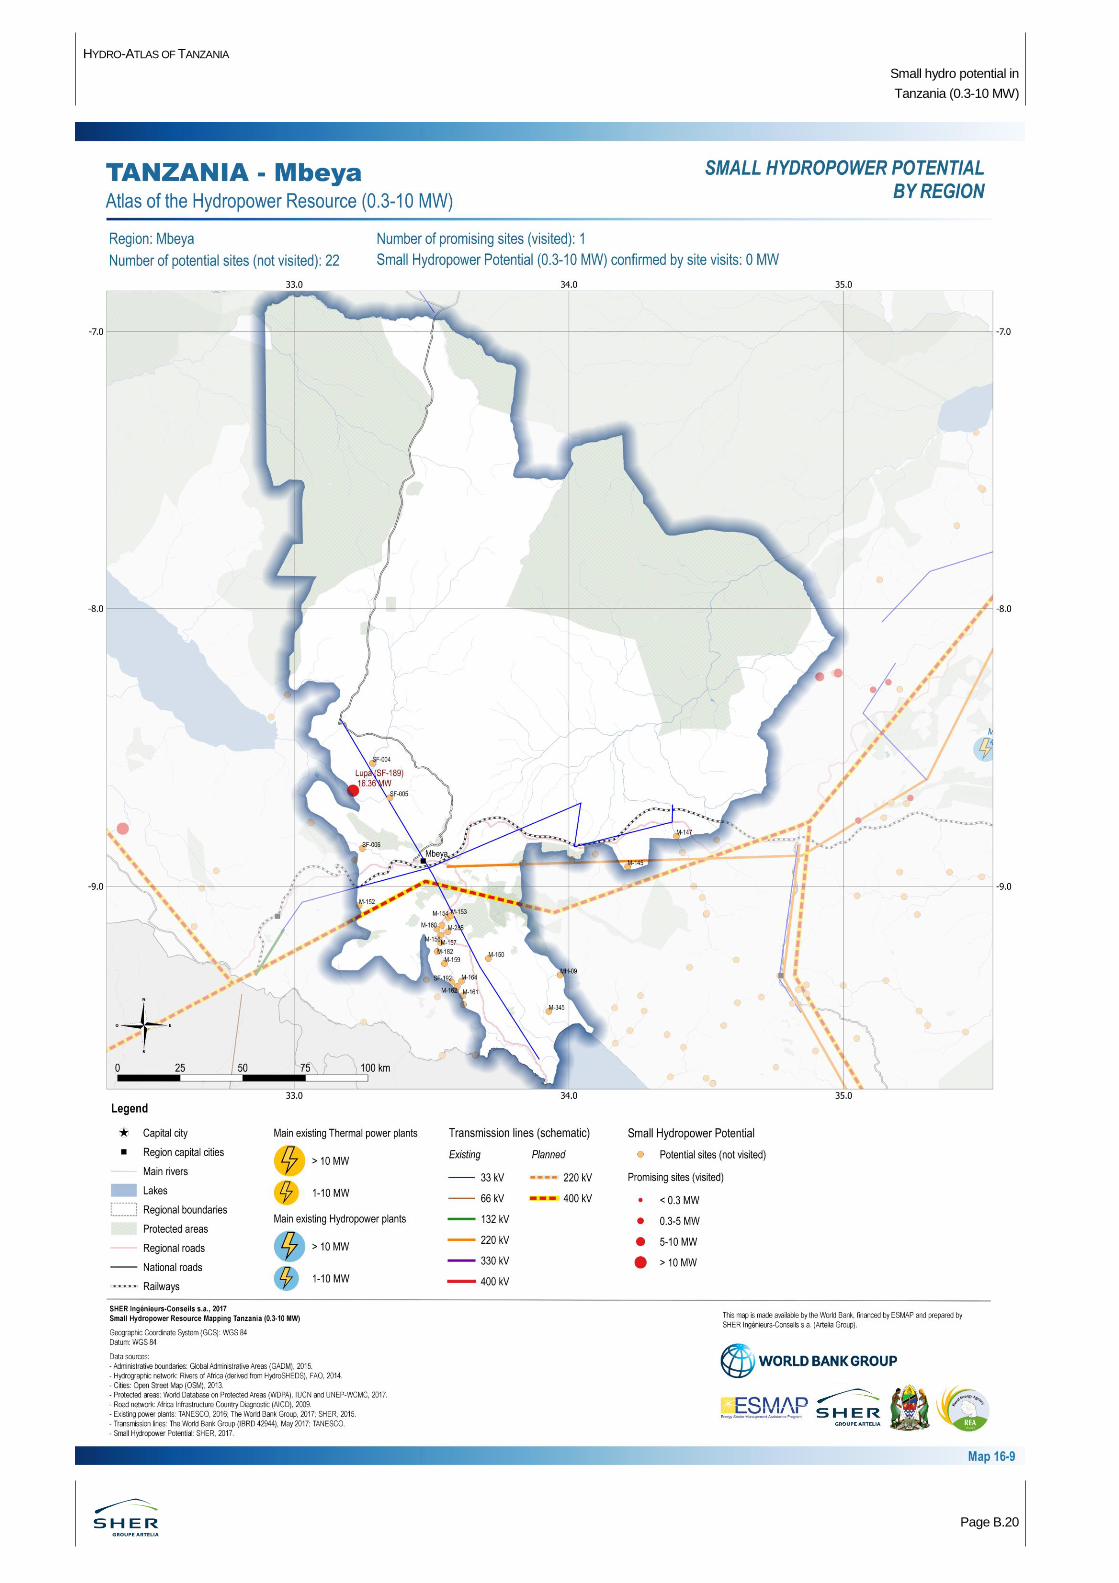
HYDRO-ATLAS OF TANZANIA
Small hydro potential in
Tanzania (0.3-10 MW)
Page B.20
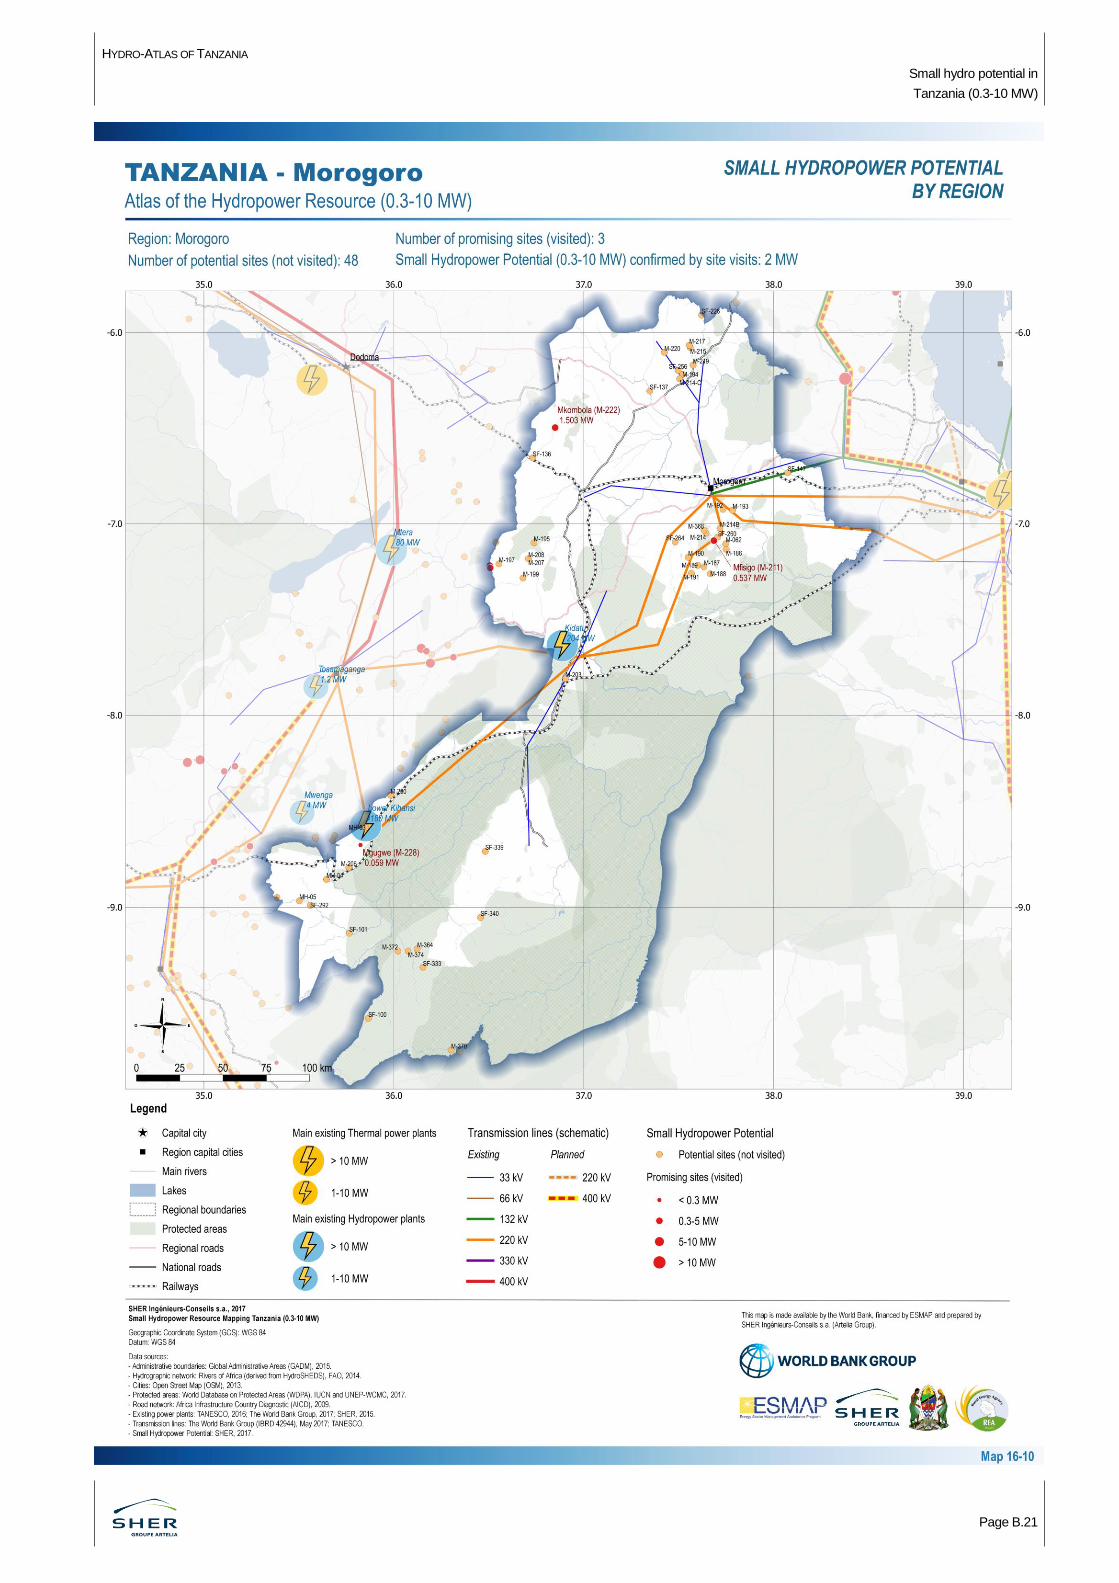
HYDRO-ATLAS OF TANZANIA
Small hydro potential in
Tanzania (0.3-10 MW)
Page B.21
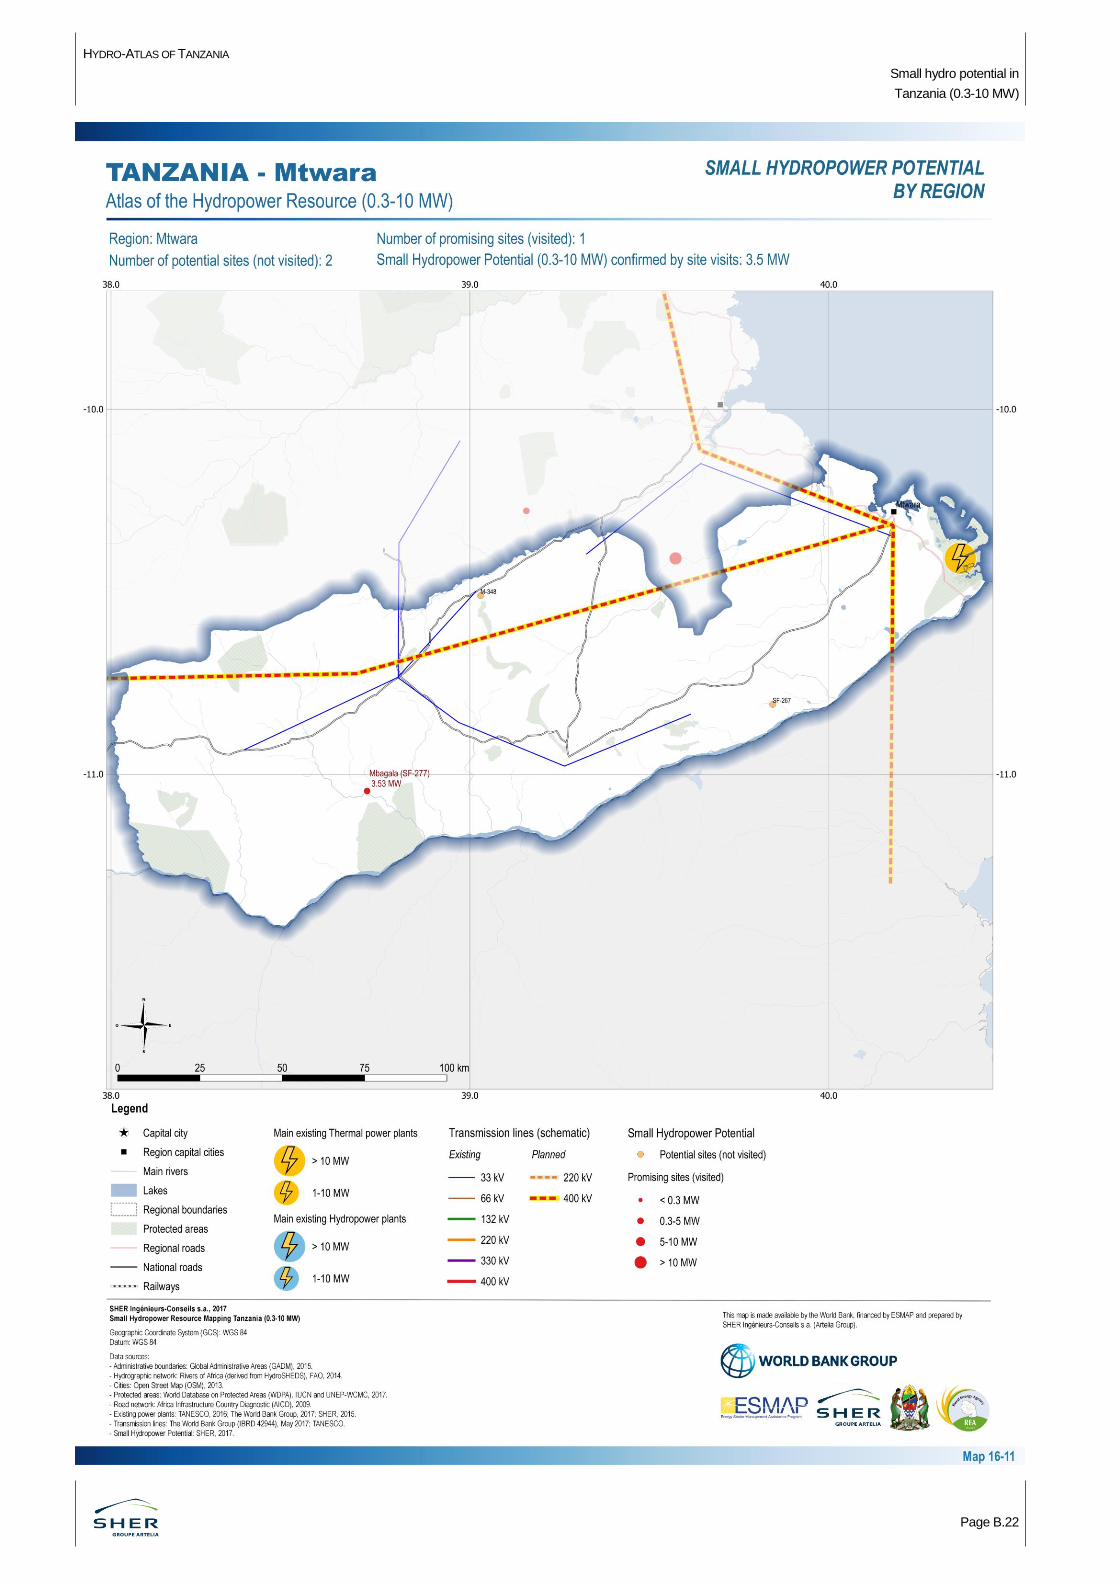
HYDRO-ATLAS OF TANZANIA
Small hydro potential in
Tanzania (0.3-10 MW)
Page B.22
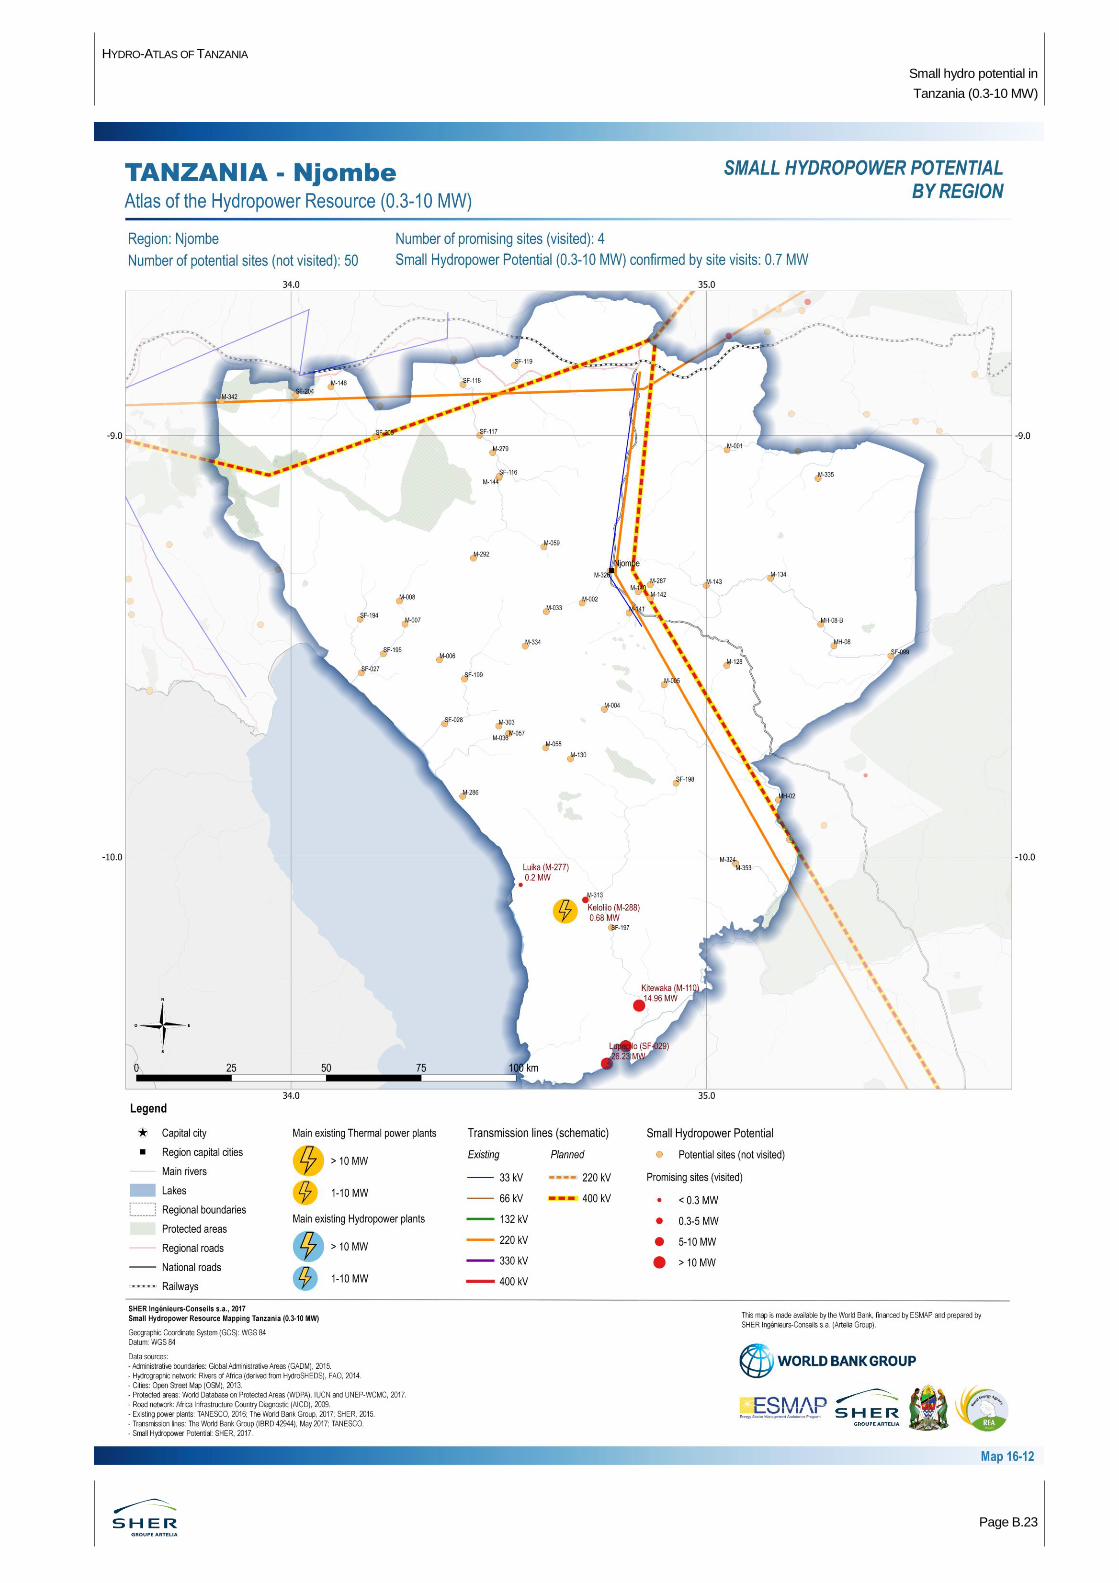
HYDRO-ATLAS OF TANZANIA
Small hydro potential in
Tanzania (0.3-10 MW)
Page B.23
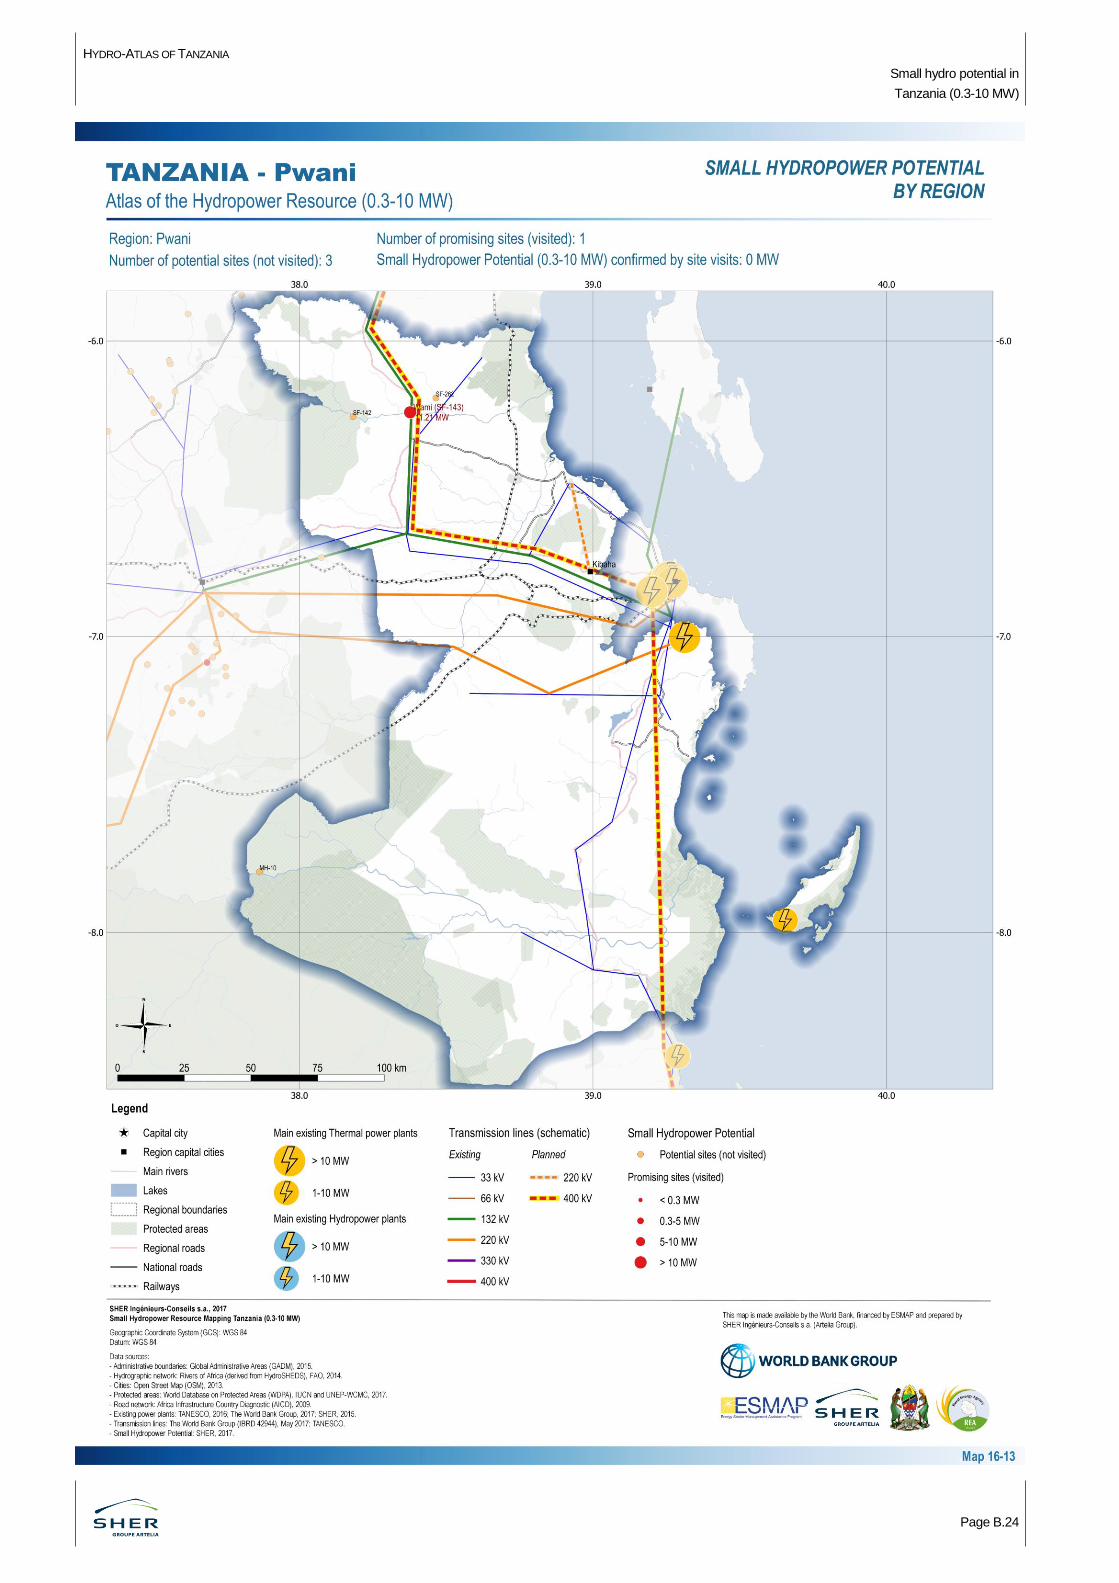
HYDRO-ATLAS OF TANZANIA
Small hydro potential in
Tanzania (0.3-10 MW)
Page B.24
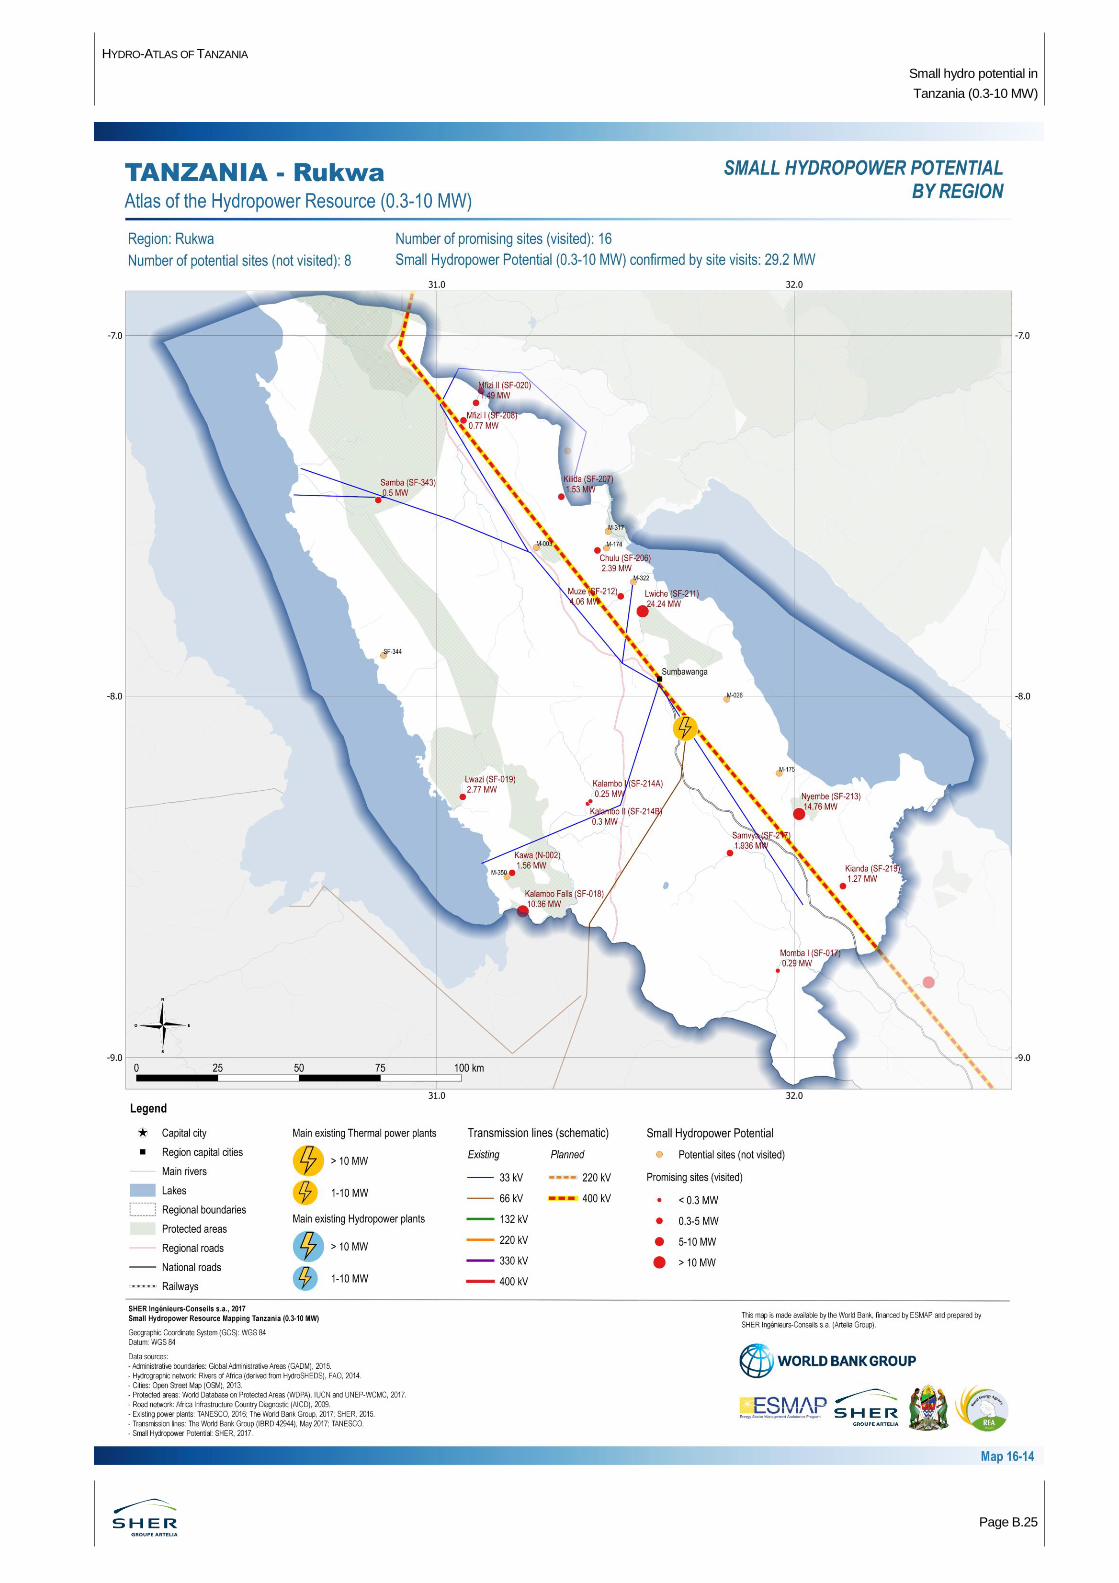
HYDRO-ATLAS OF TANZANIA
Small hydro potential in
Tanzania (0.3-10 MW)
Page B.25
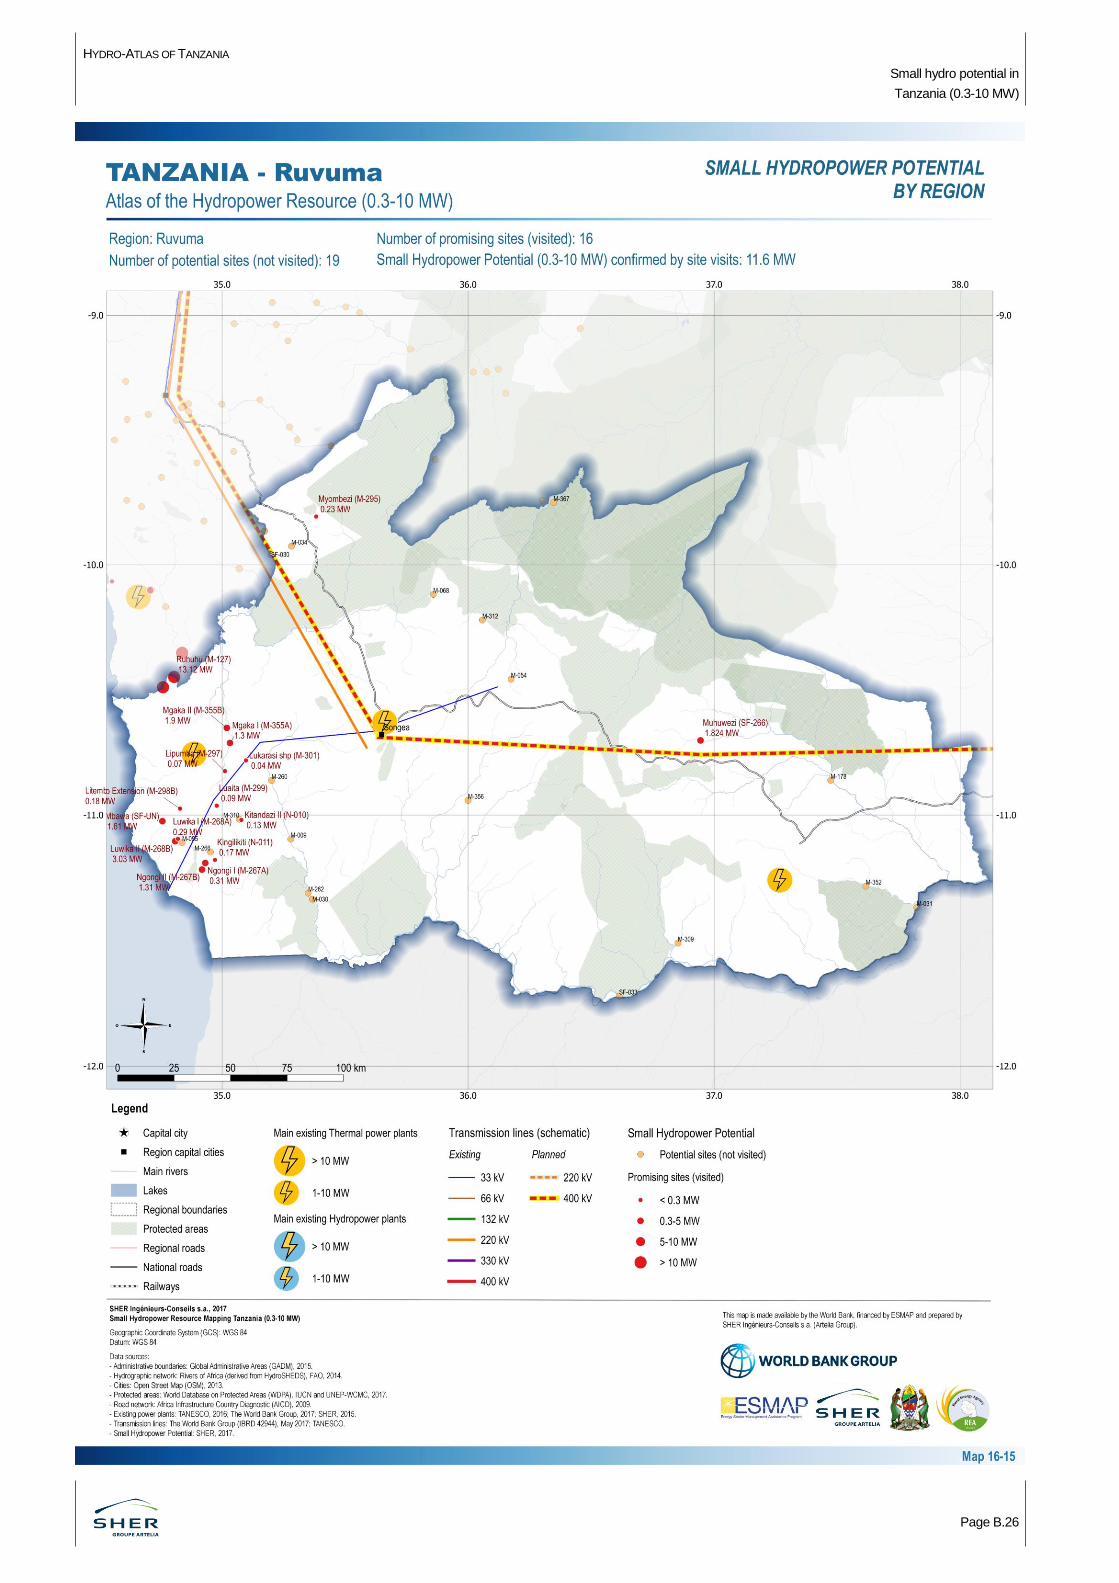
HYDRO-ATLAS OF TANZANIA
Small hydro potential in
Tanzania (0.3-10 MW)
Page B.26
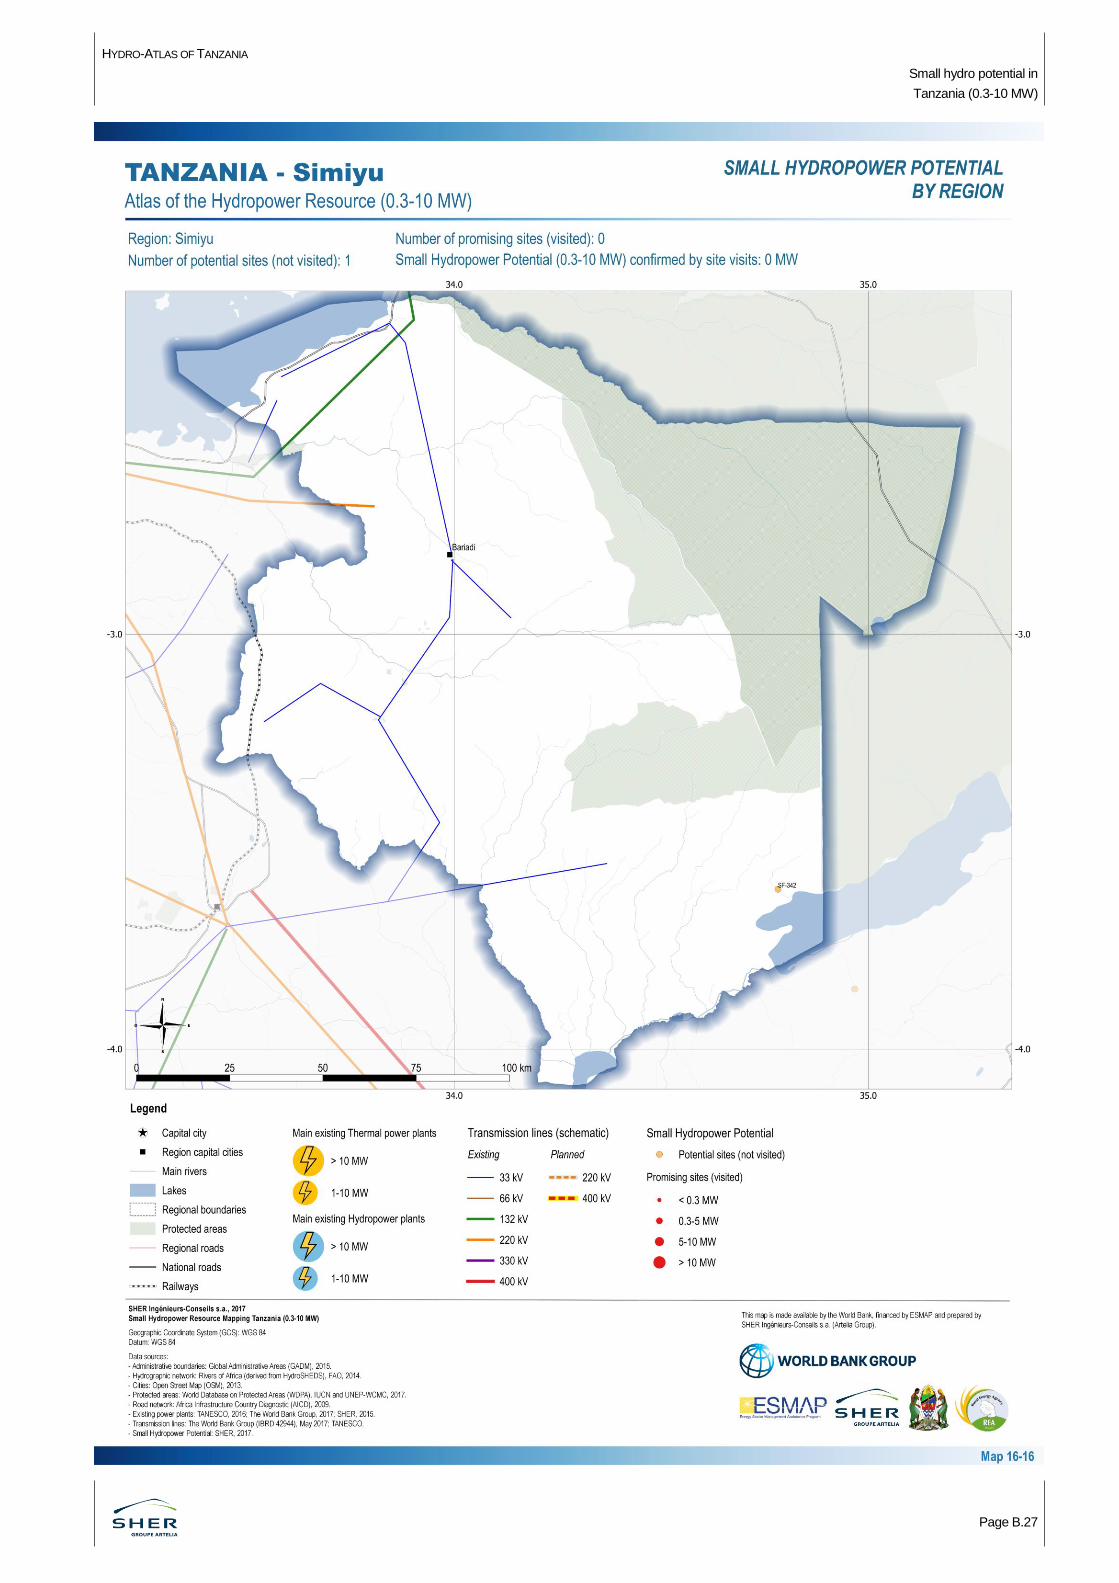
HYDRO-ATLAS OF TANZANIA
Small hydro potential in
Tanzania (0.3-10 MW)
Page B.27
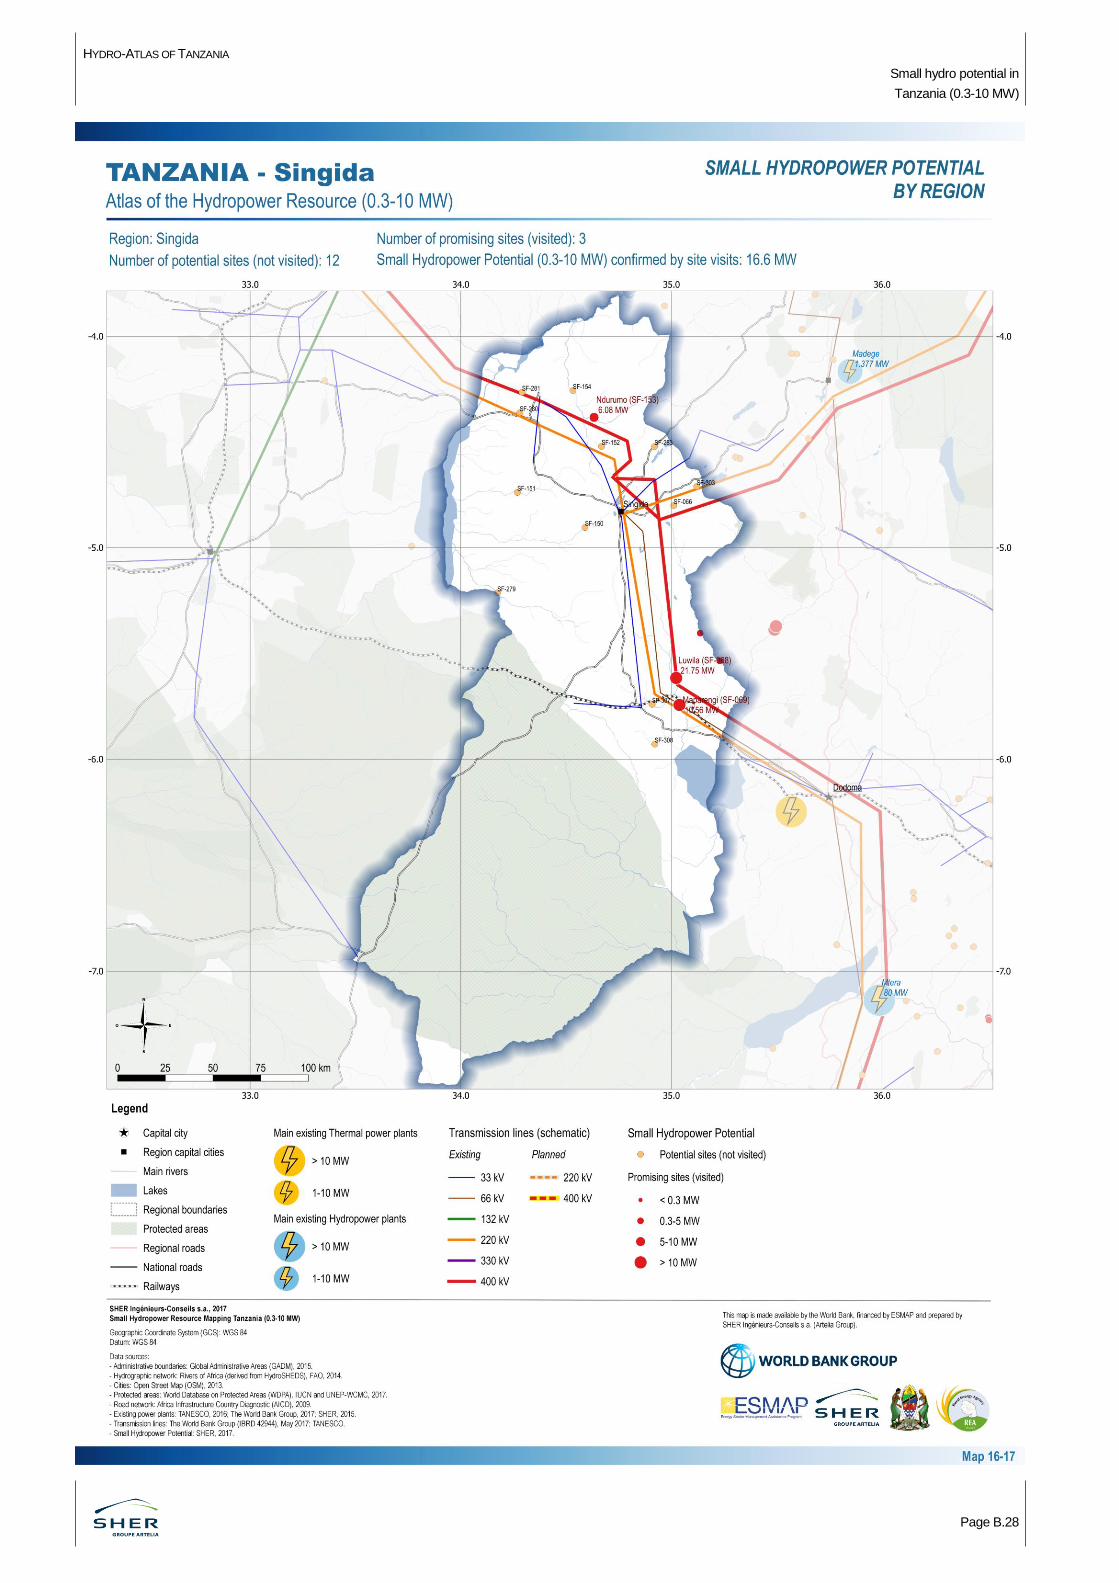
HYDRO-ATLAS OF TANZANIA
Small hydro potential in
Tanzania (0.3-10 MW)
Page B.28
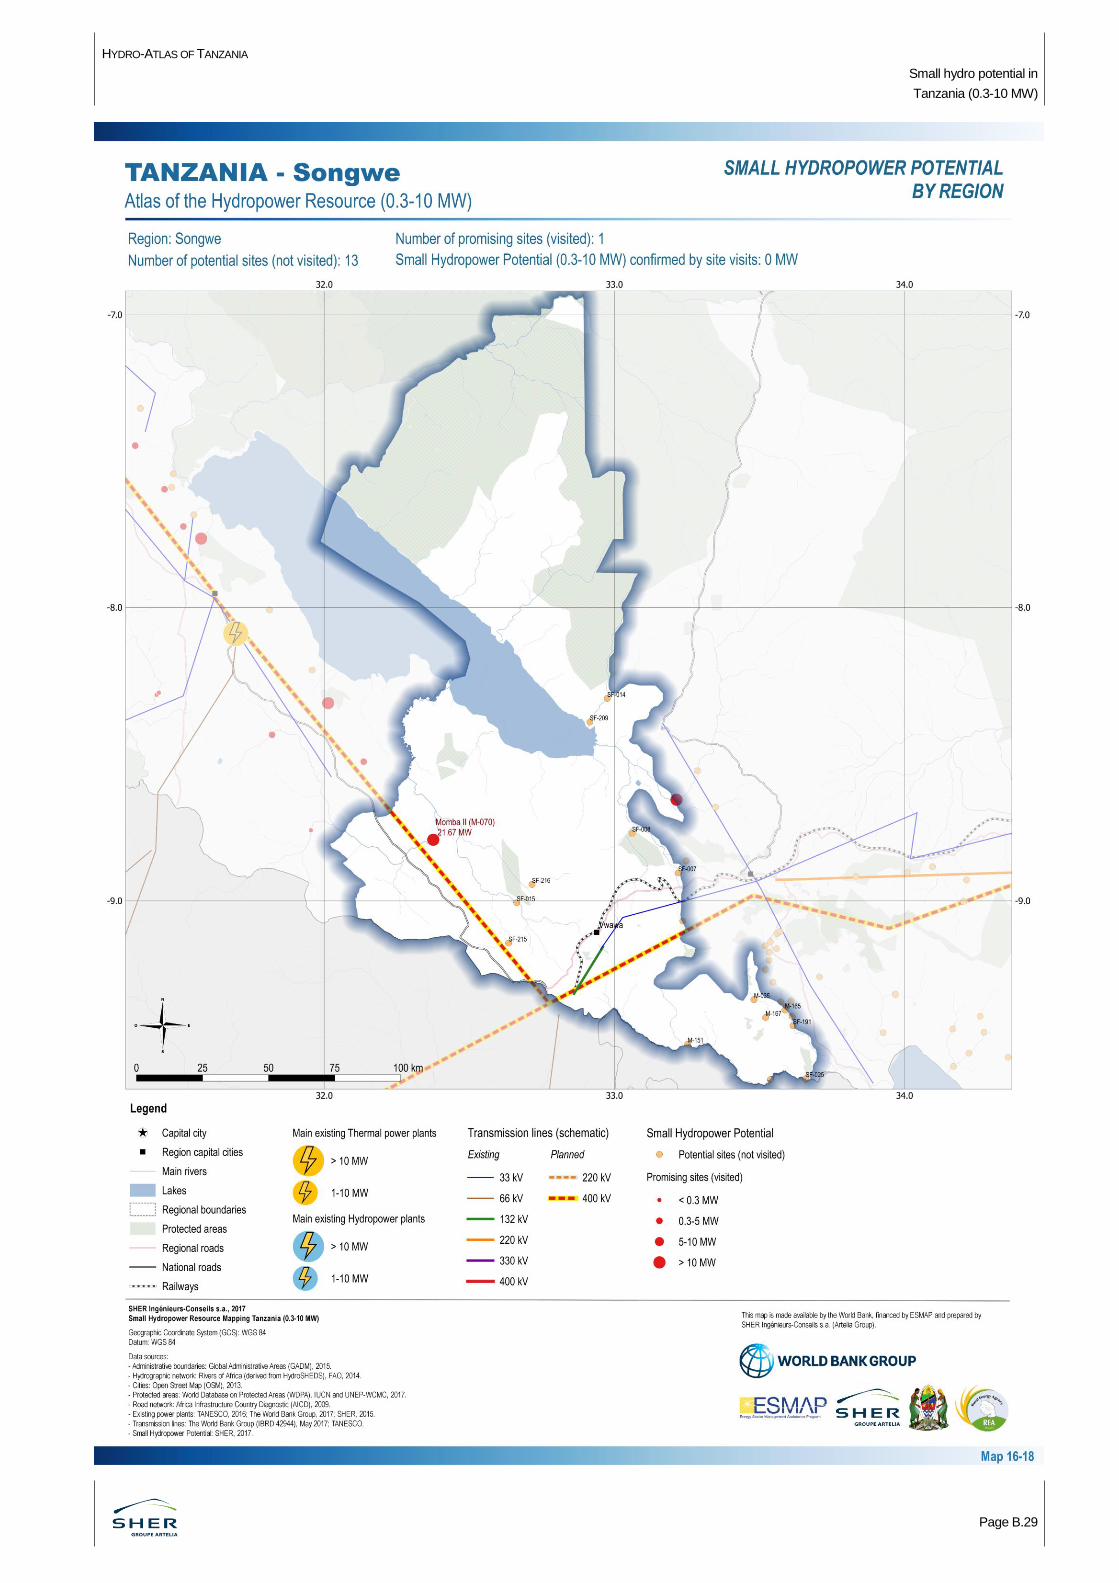
HYDRO-ATLAS OF TANZANIA
Small hydro potential in
Tanzania (0.3-10 MW)
Page B.29
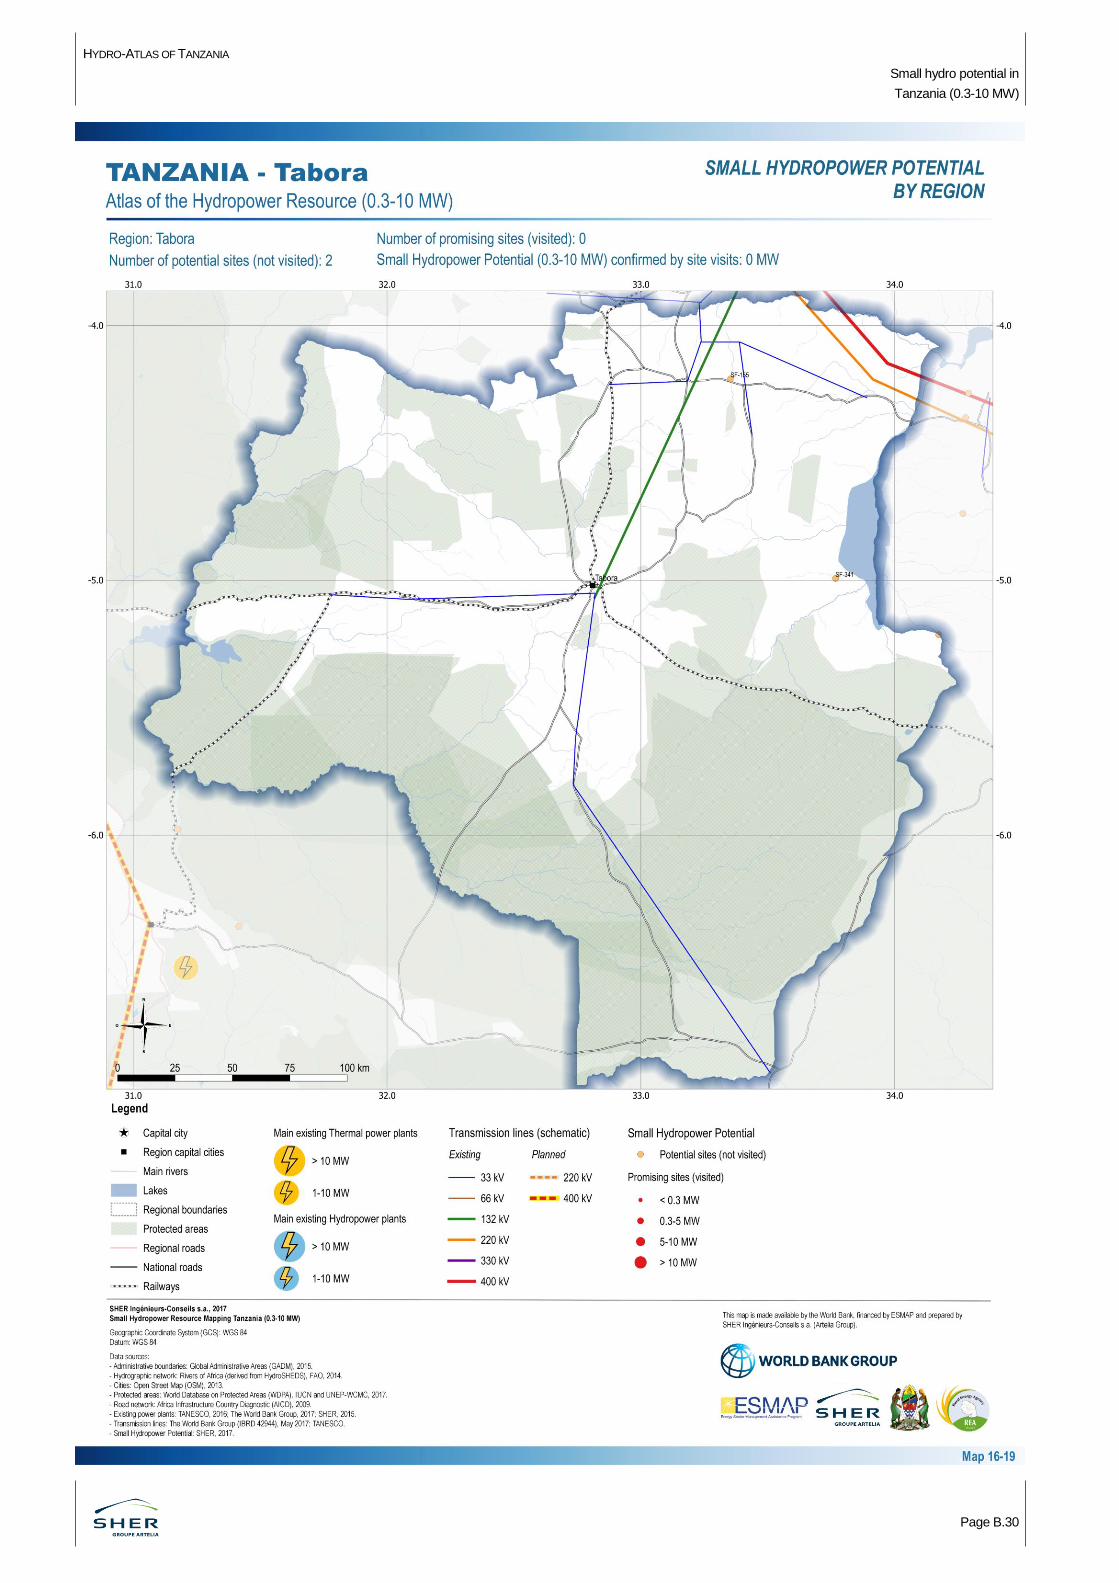
HYDRO-ATLAS OF TANZANIA
Small hydro potential in
Tanzania (0.3-10 MW)
Page B.30
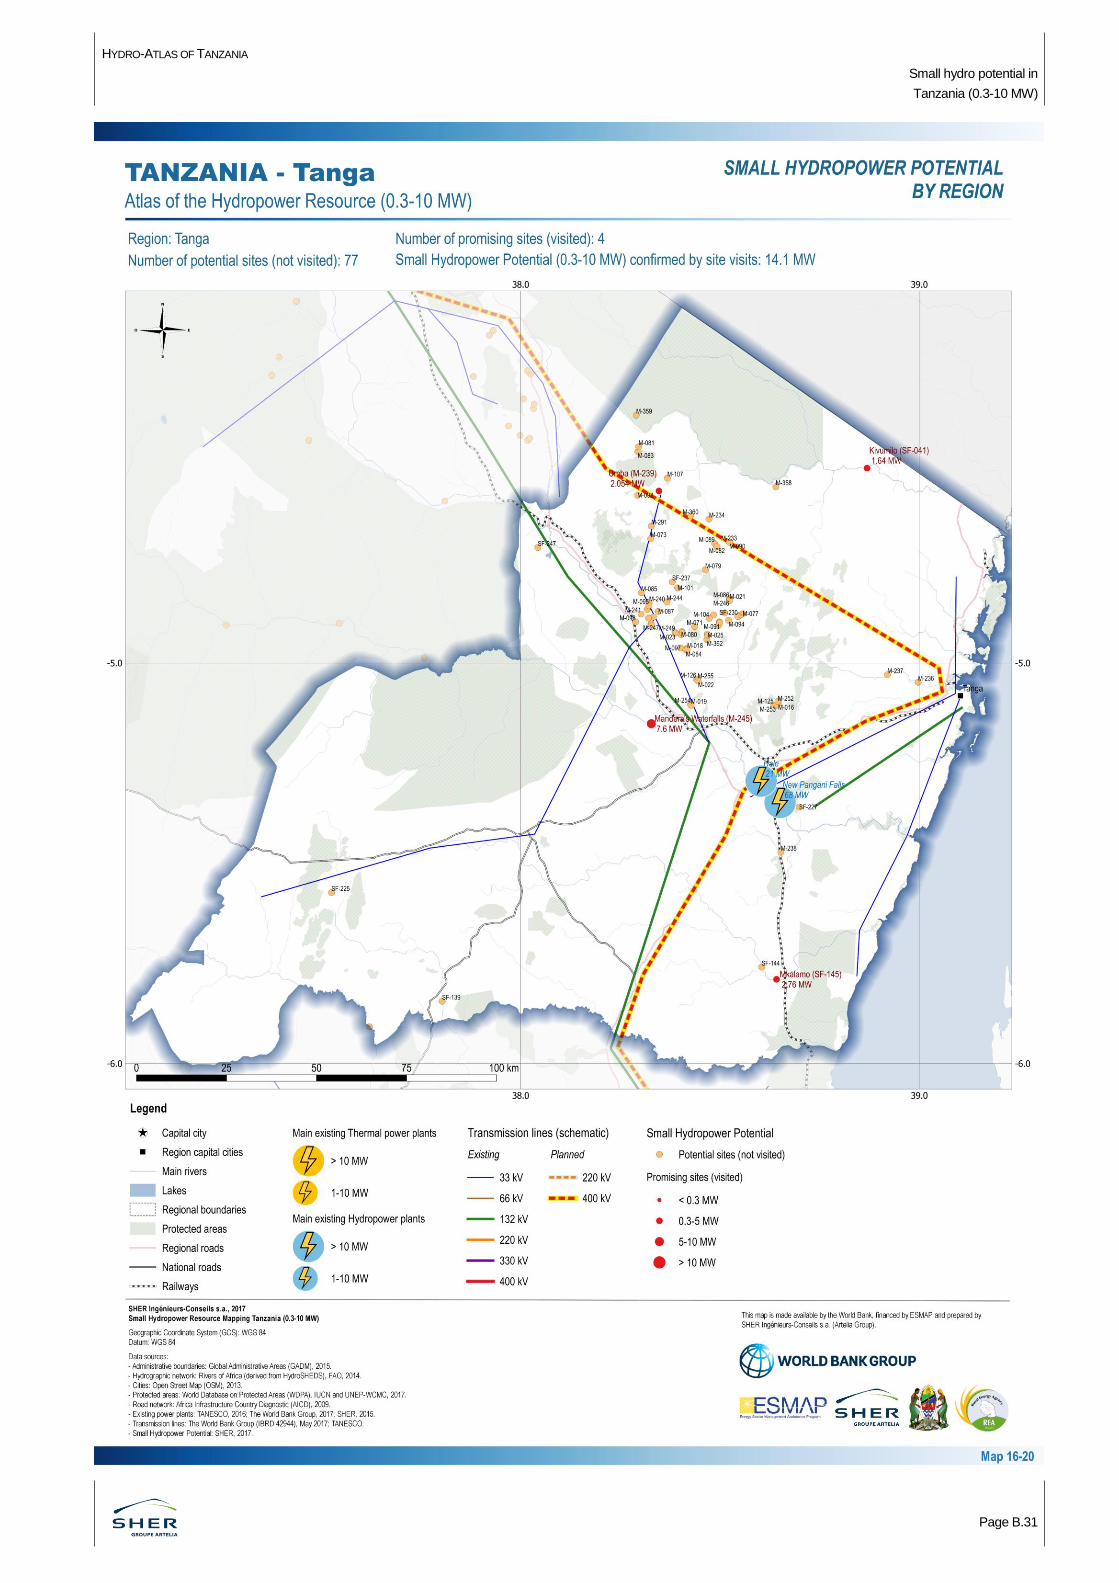
HYDRO-ATLAS OF TANZANIA
Small hydro potential in
Tanzania (0.3-10 MW)
Page B.31
www.sher.be