Atomic electric fields revealed by a quantum mechanical approach to electron picodiffraction

Risk Analysis, Vol. 10, No. 2, I990
Small Group Studies of Regulatory Decision-Making for Power-Frequency Electric and Magnetic Fields
Gordon Hester,’ M. Granger Morgan,’ Indira Nair,l and Keith Florig’
Received March 27, 1989; revised December 11, 1989
Three groups of lay opinion leaders were used in a group role-playing decision exercise designed to explore problems in public risk management decision-making. The application domain was possible risks from the 60 Hz electric and magnetic fields associated with high-voltage power transmission lines. While there were differences in the make-up and dynamics of the three groups, the structure and substantive content of the tasks undertaken dominated intergroup variation in terms of the factors that were most important to group members’ decisions. The groups displayed sophistication in their identification of decision attributes and in many of the arguments they advanced, but experienced difficulties in structuring and making trade-offs and decisions. The groups were not good at normalizing or otherwise manipulating quantitative information, and used it largely in the form it was received. Upper-bound risk estimates were treated operationally in most group discussions as expected values. Several kinds of strong framing effects were observed in the use of cost and risk information. Specific quantitative results obtained must be treated with care but may provide a starting place for further work on the acceptable level of transmission line risk.
KEY WORDS Group decision-making; risk management; risk communication; 60 Hz electromagnetic fields.
1. INTRODUCTION
The possibility that the electric and magnetic fields associated with high-voltage power transmission lines may pose health risks has been a topic of growing con- cern in regulatory circles. While there is now a great deal of excellent science available,(’) it is complex and subtle, and precludes clear conclusions about either the existence or magnitude of any risk. As a consequence, attempts at risk assessment have met with limited suc- cess.(2) At the same time, growing public concern, reg- ulatory activity,(3) and legal activity,(4) have forced regulators and others to take action.
During the summer and fall of 1986, we ran a series of experiments designed to explore how groups of non- technical community opinion leaders would approach and
‘ Department of Engineering and Public Policy, Carnegie Mellon Uni- versity, Pittsburgh, Pennsylvania 15213.
deal with a set of regulatory problems involving power- frequency fields. The studies were designed to identify and explore:
0 Issues citizen groups considered important. How such groups frame and attempt to solve these problems. How such groups cope with the very considera- ble uncertainty that is involved.
0 What trade-offs between level of risk and eco- nomic costs of control these groups consider ap- propriate.
0 What upper bound these groups feel science should be able to establish on the magnitude of any pos- sible field-related risk before society can appro- priately ignore i t (i.e., what should be the “stopping rule” for regulatory concern and risk motivated research(5)).
We used three groups of 9 or 10 people each, includ-
0272-4332/90/0G00-0213S06.00/1 0 1990 Socicty for Risk Analysis 213

214 Hester et al.
ing a chairman. Groups were selected to include a wide variety of professions (business people, nurses, govern- ment employees, including a town manager, a state trooper, etc.). We avoided people in technical and en- gineering professions. Details on the group make-up and selection are available elsewhere.@) The chairmen, who were selected for their experience in running meetings, were given no special information or instructions other than that we were as interested in the decision-making process as in any specific “answers” and that they should not press relentlessly for consensus. Group members re- ceived $100 honoraria for their participation. Sessions were held on Saturday mornings and ran until mid-after- noon.
2. EXPERIMENTAL SETTING
Several weeks before their session, group members received letters explaining that they would be playing the role of a “Citizen’s Commission,” advising the state on issues involving possible health risks from fields as- sociated with high-voltage power lines. They were ac- companied by short papers on power-frequency fields(’) and on risk assessment and management.@) The letters explained the purpose of the experiments and the way they would be conducted. This explanation was reiter- ated in a brief informal welcome at the beginning of each group session.
The formal session began with a brief introduction and task statement by an investigator (Morgan) playing the role of an “aide to the Governor.” He played a short videotaped message from the “Governor” (role-played by Hester) that outlined the group’s task in general terms, explained why a new transmission line was needed, and stressed that trade-offs between various important State goals such as economic development and public health were necessary. He explained that the committee’s rec- ommendations would be advisory rather than binding, but would be valued highly.
The “aide” gave the chairman two videotapes which he explained contained half-hour briefings on electric and magnetic fields (by Florig) and on the health effects research literature (by Nair). Multiple copies of the viewgraphs associated with these tapes were also given to the group chairman. In addition, the chairman was given multiple copies of:
0 A statement justifying the need for the proposed Westpark to Springdale transmission line. Rea- sons given were to meet the new load require- ments of western Pennsylvania (roughly a quarter
of a million people would be served by the line), provide added security to the region’s grid and thus reduce the risks of blackouts, and to allow the retirement of several old small generation sta- tions that, unlike Westpark, did not have modern air-pollution control equipment. A collection of summary data on the actuarial risk levels associated with a wide variety of risks in U.S. society stated in a variety of standard ways. Sealed envelopes containing instructions for Tasks 1, 2, and 3. An overview map (Fig. 1) and seven sectional maps (an example is provided in Fig. 2) showing details in populated areas of the four alternative routes for the proposed transmission line. These maps were the groups’ primary source of geo- graphic information about the four routes and the areas they passed through. Copies of all the maps used can be found elsewhere.(6)
The chairman was free to distribute these materials when he and the group members felt it was appropriate, provided only that each task was to be completed before the next one was begun.
The Governor’s aide explained to each group that there was a staff available to answer specific technical questions, perform requested calculations, and provide clarifications. He indicated that whenever the group needed help they should ask for it and someone would appear, but that the group controlled their own agenda and could proceed as they wished.
3. THE TASKS
Each group faced three problem solving tasks pre- sented in the form of memos from the “Governor” to the “Citizens Fields Review Committee.” All three groups opened their first task envelope shortly after their session started.
After some general discussion, Task 1 read:
Recently the State asked a committee of biological expcrts to . . .try to give us at least an upper limit on how big the adverse health effect [from the proposed lines] might be if indecd there is any effect at all.
After a careful review they have concluded that the upper limit on the rate of increased cancers per year among persons living in the immediate vicinity (is . , within 300 ft. of the edge of the right-of-way) of a transmission line like the proposed

Regulatory Decision-Making 215
Fig. 1. General map of the hypothetical Westpark to Springdale transmission line with the section details indicated.
Westpark to Springdale line is about MOO of a percent.* What that means is that IF living near this line has any effect at all on cancer rates, it will produce LESS THAN one new case of cancer per year in every 10,000 people exposed. The problem we now face is that we do not know how “serious” a potential risk we should consider this upper bound as representing.
Responding to the possible risk represented by this upper bound estimate is going to cost money. . . and of course ul- timately any money spent as a precaution against this possible risk will come from the electricity users of the State in the form of highcr electric bills. The question we would like to ask you to help us deal with is how much more, if any, the electric utility rate payers of the State should be required to pay to guard against this possible risk.
We would like you to make this recommendation to us in two ways. Table I provides data on four alternative routings for the proposed Westpark to Springdale 500 kV transmission
These and all other bounds on field related risks discussed in this paper are fabrications arbitrarily constructed by the investigators for the purposes of this experiment. In reality no group of biologists has yet been prepared to provide such quantitative bounds. The risk lev- els we used were arbitrary except that they were set at levels thought to be high enough to be salient to the participants in the experiments.
line. Each route has different estimated costs (which you should assume are accurate estimates) and involves different numbers of people and facilities along their rights-of-way. In addition to overall costs and counts of exposed people . . .we have also prepared for you some data on how the cost of transmission lines figure in the total cost of electricity.’ Please study these data and recommend which of the four line routes should be selected for construction.
Once you have completed this task and agreed upon your recommendation, I would like to ask you to try to address the same problem in a different way. Assume that for a variety of legal reasons only route C can be built. Suppose, howevcr, that in the very near future biologists will be ablc to tell us how to measure “effective dose” to fields from the point of view of cancer risk. There are a variety of ways in which the fields associated with transmission lines can be modified . - . As- sume that State regulators could order the utility to spend more money on the line to use one of these technologies to reduce the “effective dose” that nearby people receive from the line. We would like you to recommend to the State how much of an increase in total line cost our regulators would be justified in requiring in order to cut the effective dose in half. . .that is, in order to cut the upper limit on the possible risk from one
Not reproduced here but available in reference 6.

216 Hester et al.
Fig. 2. Route B Section 6 of the hypothetical Westpark to Springdale transmission line.
cancer pcr ycar for cvery 10,000 persons cxposed to one cancer per year for every 20,000 persons. Before making your decision you may want to do a few simple calculations. You may also want to consider how thc costs you recommend compare to the costs of other programs to manage risks.
If, aftcr you complcte this second task, your views about your first rccommcndation have changed, do not hesitate to go back and rcvisc i t . . .
We will refer to the route selection part of this task as “Task lA,” and to the part in which justifiable ex- penditure to reduce exposure was determined as “Task 1B.” In preparing these tasks we tried to be careful to limit the extent to which we imposed any particular framing or normalization on the problem. Thus, while we presented all the data we considered necessary to work the problem, we did not suggest or perform any specific calculations.
Task 2 was very similar to Task 1. Again, in the form of a memo from the “Governor,” it read as fol- lows:
Since the time when you prepared your recommendations for
us on the sighting and design of thc Westpark to Springdale 500 kV transmission line, our board of biological experts has met again and decided that they were overconfident in the “up- per-bound estimate” of no more than one cancer per year per 10,000 exposed people. There has been no new scientific data on this question. They have simply had more time to consider the arguments they went through to get their earlier estimates and have concluded that they cannot justify such a tight bound. What they are now telling us is that the best thcy can do is to say that IF there is any risk at all of increased cancer for persons living in close proximity to the line, the upper bound on how great that risk could be is 1/10 of a percent (rather than NO0 of a percent as they previously estimated). This would mean that if there are any increased cancers the upper bound could be at most 10 times more than we previously thought. That is, less than one case per year in every 1000 exposed pcople, rather than one case per year in every 10,000 exposed people.
Because this is a substantial change in thcir estimate, I would like you to go back and reconsidcr the two recommendations that you made to me on line route and field control costs. Thc cncloscd table“ contains the revised data to go with this new bound. . .
Not reproduced here. Similar to Table I, cxcept that all numbers in the bottom portion of the table have been divided by a factor of 10.

Regulatory Decision-Making 217
Table I. Data Provided to Group Members on Alternative Routes for thc Hypothetical Wcstpark to Springdale Transmission Line”
The following arc some cost, milcage, and population data on the four proposed alternative routes:
Capital Annual costs Number of people Length cost ($ millions) living within 300 ft of
Route (miles) ($ millions) including capital edge of right-of-way
A 35 25.0 1.9 20 B 32.5 16.3 1.2 157 C 32.5 16.6 1.3 24 D 40 27.8 2.1 9
If there are any cancers produced by this line, the upper-bound risk of 1 in 10,000 means that there will be less than about .016 cancers produced per ycar along route B (the lowest cost route), which is the same as saying that a cancer will result less frequently than roughly once every 64 years (64 x .016 = 1). The equivalent numbers for all four routes are:
That means on average it will take at least this
many years, or longer, for a case of cancer to
appear among the Route than this number each ycar exposed population
If there are any cilncers produced there will be less
A 0.002 500 B 0.016 64 C 0.0024 417 D 0.0009 1111
There are various ways in which these numbers can be combined to evaluate the alternatives. Rather than making specific suggestions that might influcnce your thinking, we suggest you do a few calculations and decide for yourself how (if at all) you want to use these various numbers to assist you in making your recommendation to the State.
“A similar table was provided in Task 2, except that all the risk num- bers were dividcd by a factor of 10.
In the first and second sessions we ran Tasks 1 and 2 as described above. In the third session the order was reversed and the group was first presented with the high upper bound risk (1:lOOO). In this case the health experts were described as “~nderconfident~~ in the Task 2 memo, which reduced the upper-bound risk estimate from 1:lOOO to 1:10,000. Regardless of the upper-bound risk esti- mates presented to the groups, we will refer to the two parts of the second task as Task 2A and Task 2B.
The third task was quite different. Again, in the form of a memo from the “Governor,” it read in part:
. . .In revicwing the matter with my advisors, I have con- cluded that there is one other question on which we would find it useful to havc your recommendation. That question is, How low would thc upper-bound risk that the biologists can set have to be beforc your advice to the State would be to ignore the whole problem of possible cancer risks from transmission line fields?
One reason that we find this question to be important is that it sets a target or limit on the research. The biologists tell us that they cannot design experiments that show that something doesn’t exist. They can only design experiments that show something is less likely than some upper bound. Clearly, if the increased annual risk of cancer, if any, for persons living in close proximity to transmission lines can be shown to be less than one in 200,000,000, we probably aren’t going to worry about it. Clearly, if the best bound we can set is one in 10, wc are going to worry about it. At what level (ix., at a risk of one in how many) should we completely stop worrying and spend our time on more important and pressing health and safety problems that face the citizens of the State?
We understand that, since numbers of this sort arc not things you deal with very often, this is likely to be a very tough question. It would help us, and perhaps you, if beforc selecting a number, you try to develop some arguments about how, or on what basis, you believe such a number should be cho- sen . . .
4. METHOD OF ANALYSIS
Full transcripts were prepared from videotapes of each of the group discussions. We analyzed these through the use of a coding scheme that identified issues raised by group members, which we call “decision factors,” as the basic unit of analysis. Our analysis is centered on the relative frequency with which these decision factors were addressed by group members and the ways they were combined in the group discussions.
The coding scheme used can best be explained with an example. The transcripts were divided into “speaker turns.” Each turn consists of a period in which one per- son talks, without regard to length. Each turn was coded for the factors addressed and the relation of these factors to the alternative power-line routes. The following is an excerpt of three speaker turns from a transcript:
82-7. There are three times as many people that would live around route C than route D.
8 3 4 . But if we’re looking at the statistics . . .
84-8. OK, three times-24 people. Is that such a tremendous difference when you take into account-I can’t see that as being such a big difference when you look at the three, A, C, and D. We’ve eliminated B. But if, for instance, you come back here and look at costs, the capital and also the annual cost, there’s a tremendous difference between those two. Whilc if you look at actual numbers, I would have to say that thcrc are twice as many people-a little over twice as many, but that’s pretty minimal just in terms of numbers.
In the first turn above, “82” denotes the turn number, and “7” denotes the speaker. The speaker addresses the factor “number of people exposed,” and asserts that this
218 Hester et al.
factor is a negative consideration for route C and a pos- itive one for route D. Thus, this turn is coded, “number of people exposed, C - , D + .”
In the second turn, no factor is addressed. This brief sentence fragment is typical of many of the speaker turns in that it does not address any identifiable decision fac- tor. Such turns were coded as “nothing.” Turns in which participants discussed the mechanics of making their de- cisions (“Should we take a vote now?”) were coded as “procedural.” Turns in which a speaker voted without stating a reason for the vote (“I vote for Dyy) were not coded, although the votes were noted and tallied sepa- rately.
In the third turn, speaker 8 addresses two topics: “cost of routes” and “number of people exposed.” He asserts that the routes differ significantly in terms of the former factor, and that it should thus play an important role in the choice to be made, but that the routes do not differ significantly in terms of the latter factor, and so it need not be considered. This turn is thus coded: “num- ber of people exposed, AO, CO, DO; Cost, A -, C +, D - .” (A “0” denotes a judgment by the speaker that a decision factor is neutral for the route being ad- dressed.) Note that the speaker did not specifically say that routes A and D were high-cost routes and route C was a low-cost route, but this is nonetheless reflected in the coding. The speaker did not have to say this: it was obvious both from the information provided to the par- ticipants and from the preceding discussion. Coding often required that the context of a statement and the common knowledge of the participants be taken into a c ~ o u n t . ~
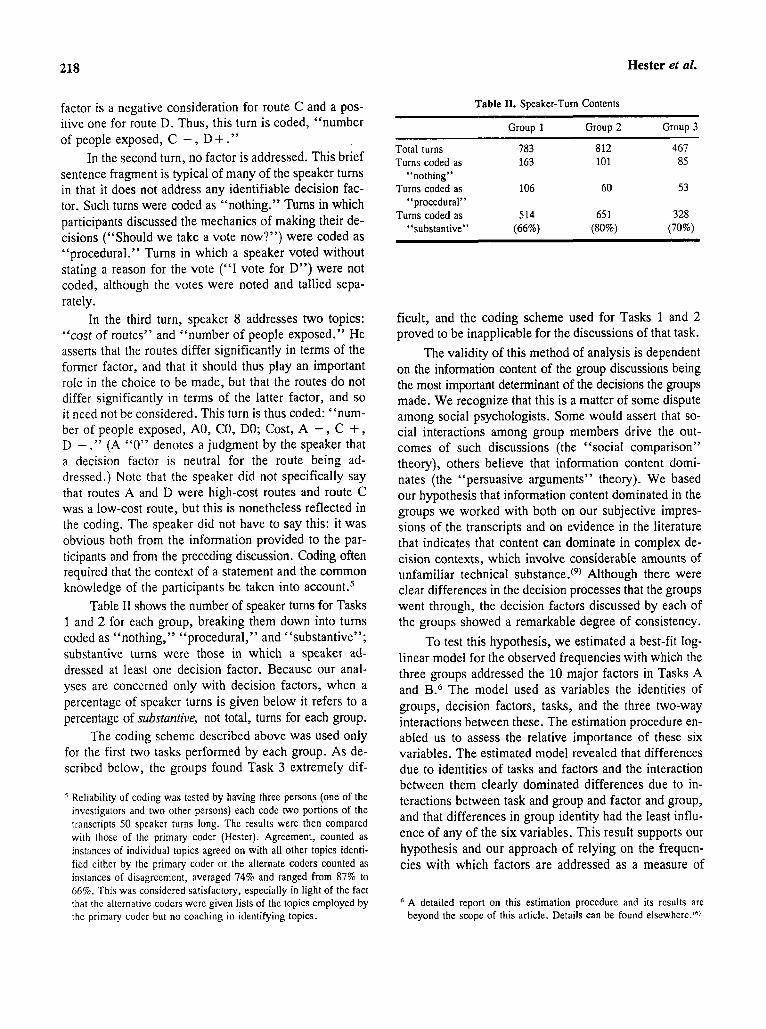
Table I1 shows the number of speaker turns for Tasks 1 and 2 for each group, breaking them down into turns coded as “nothing,” “procedural,” and “substantive”; substantive turns were those in which a speaker ad- dressed at least one decision factor. Because our anal- yses are concerned only with decision factors, when a percentage of speaker turns is given below it refers to a percentage of substantive, not total, turns for each group.
The coding scheme described above was used only for the first two tasks performed by each group. As de- scribed below, the groups found Task 3 extremely dif-
Rcliability of coding was tcsted by having three persons (one of the investigators and two other pcrsons) each code two portions of the transcripts 50 spcakcr turns long. The results were then compared with those of the primary coder (Hester). Agreement, counted as instances of individual topics agreed on with all other topics identi- fied cithcr by thc primary coder or the alternate coders counted as instances of disagrccmcnt, averaged 74% and ranged from 87% to 66%. This was considcrcd satisfactory, especially in light of the fact that the altcrnativc coders were given lists of the topics employed by the primary codcr but no coaching in identifying topics.
Table 11. Speaker-Turn Contents
Group 3 Group 2 Grouo 1
Total turns 783 812 467 Turns coded as 163 101 85
Turns coded as 106 60 53
Turns coded as 514 65 1 328
“nothing”
“procedural”
“substantive” (66%) (80%) (70%)
ficult, and the coding scheme used for Tasks 1 and 2 proved to be inapplicable for the discussions of that task.
The validity of this method of analysis is dependent on the information content of the group discussions being the most important determinant of the decisions the groups made. We recognize that this is a matter of some dispute among social psychologists. Some would assert that so- cial interactions among group members drive the out- comes of such discussions (the “social comparison” theory), others believe that information content domi- nates (the “persuasive arguments” theory). We based our hypothesis that information content dominated in the groups we worked with both on our subjective impres- sions of the transcripts and on evidence in the literature that indicates that content can dominate in complex de- cision contexts, which involve considerable amounts of unfamiliar technical substance.(9) Although there were clear differences in the decision processes that the groups went through, the decision factors discussed by each of the groups showed a remarkable degree of consistency.
To test this hypothesis, we estimated a best-fit log- linear model for the observed frequencies with which the three groups addressed the 10 major factors in Tasks A and B.6 The model used as variables the identities of groups, decision factors, tasks, and the three two-way interactions between these. The estimation procedure en- abled us to assess the relative importance of these six variables. The estimated model revealed that differences due to identities of tasks and factors and the interaction between them clearly dominated differences due to in- teractions between task and group and factor and group, and that differences in group identity had the least influ- ence of any of the six variables. This result supports our hypothesis and our approach of relying on the frequen- cies with which factors are addressed as a measure of
A detailed report on this estimation procedure and its results arc beyond the scope of this article. Details can be found el~ewherc.(~)

Regulatory Decision-Making 219
their importance in the problems worked by the three groups.’
In addition to this coding process, we also exam- ined the transcripts closely in an attempt to identify de- cision-making strategies or approaches, identify calculations made by the groups, and identify general themes that run through extended portions of the dis- cussions but might not be readily identified at the level of speaker turn analysis. These two methods comple- ment each other well. The coding approach, while ex- tracting limited information, is quite reliable. The more ad hoc approach of transcript examination enables us to identify other aspects of the group decision-making process.
5. DECISION FACTORS
Table I11 lists the decision factors addressed in Tasks 1 and 2, and shows the frequency with which they were addressed as a percentage of speaker turns for all three groups. Thus, “3.0%” indicates that a decision factor was addressed in 3% of the total of 1493 speaker turns, or about 45 turns. The table includes only those factors addressed in at least two groups. Since multiple factors were addressed in many speaker turns, the total exceeds 100%.
The fact that 41 distinct factors were discussed in- dicates the breadth of concerns raised in the groups. This is consistent with the risk-perception literature, indicat- ing that many factors are important to lay people making decisions about risks.(lO) Note that no specific inforrna- tion was provided to group members about many of these factors-they raised them based on the information which was implicit in the maps provided and their own knowl- edge and experiences.
We classified the 10 factors addressed in at least 1% of the total turns of each of the three groups as major, and the remaining 31 factors as minor.8 We assert that the major factors were the more important factors in the decisions being made by the groups. We considered the
’ Our claim that differences between groups arc dominated by task and factor identitics applies only to the three groups with which we worked. We do not conclude that it would necessarily hold for other cases. Note that this rcsults in two factors (“comparisons to other risks’’ and “population ncarby but outside exposure zone”) being classed as minor cvcn though they occur more frequently in the total number of turns for all three groups than docs one of the major factors (“effect on wildlife and ecology”.) This is due to the fact that these two factors were addressed fairly frequently by one of the groups but nearly ignored by another.
possibilities that we simply provided more explicit in- formation to the groups on these factors than on other factors, and that group members discussed these factors more because they felt that the fact that more explicit information was provided on these factors indicated that these were the things we wanted them to discus^.^ How- ever, of the 10 major factors explicit information was provided to the groups on only half (numbers 1-4, and 6 in Table 111). Furthermore, although explicit infor- mation was provided to the groups on the length of the four power-line routes, this was not among the major factors, but was ranked 16th in the frequency with which it was discussed.
We also distinguished between decision factors that were specific characteristics of the power-line routes and those that were not by considering whether, when a fac- tor was addressed, it was linked by the speaker to a specific route. Table IV lists 15 decision factors which were linked to a route fewer than 20% of the times they were addressed. lo This distinction demonstrates that group members did not limit their concerns to concrete char- acteristics of the routes under consideration, but also took into account more abstract considerations in making their decisions. Five of the 10 major factors are in this category.
Table V breaks down the frequency of occurrence of the 10 major factors by groups and tasks.” Three comparisons are of particular interest. First, the first three columns of the table show that the groups clearly dif- fered in the degrees to which they concentrated on one or another factor. Second, the groups show clear shifts of attention, reflected in the relative frequency with which they discussed different factors, between Task 1 and Task 2.12 Third, there are similar shifts of attention between
While it is not true that we wanted the groups to focus on the factors on which we provided explicit information, it is true that those factors were ones which we would have considered very important if we had to work the problems we presented to the groups.
’” All other factors that were addrcssed at least 10 times were linked to a route over 50% of the time. Note that two factors,“modification of lines to reduce effective dose” and “cost of modifying lines to reduce effective dose,” were considered only when addressed in Tasks 1A and 2A for this purpose. Tasks 1B and 2B involvcd a decision about modifying the line on Route C and these factors were thus necessarily linked to Route C during those tasks.
I1 Note that the denominator used to calculate the percentages in Table V is the total number of times some factor was addressed by group members rather than the total number of speaker turns. This measure was uscd here because it facilitates intergroup comparisons.
l2 Recall that the difference between Task 1 and Task 2 was that the groups were given a different upper-bound risk estimate. For Groups 1 and 2, the new estimate was higher than the original estimate; for Group 3 it was lower. Because of this order difference, we have not attempted to draw any conclusions based on differences between Task 1 and Task 2.

220
Table 111. Decision Factors Addressed by Groups
Hester ef al.
Factor Substantive Turns
(%I Major factors 1. 2. 3. 4.
5. 6. I . 8. 9.
10.
Cost of modifying lines to reduce exposure Cost of building and operating lines Annual cancer risk for an exposed individual Expected number of cancer cases per year or average for one case to occur Effect on individual electric bills Number of persons exposed on a route Ways of modifying lines to reduce exposure Uncertainty about risk estimates Potential for residential devclopment near routes Effect on wildlife and ecology
Minor factors 11. 12. 13. 14. 15. 16. 17. 18. 19. 20. 21. 22. 23. 24. 25. 26. 27. 28. 29. 30. 31. 32. 33. 34. 35. 36. 37. 38. 39. 40. 41.
Comparisons to other risks Provision of information to residents near line" Population near lines, but not in exposure zone Possibility of buying out and moving exposed residents Operating life of transmission line Lengths of power-line routes Quality of life for residents near lines Cancer rates in U.S. population Installation of intermittent exposure controls Household sources of fields exposure Nonresidential uses of exposure zone" Whether risk is assumed voluntarily or nonvoluntarily Proximity of route B to "Radonia Junior High School"" Noise produced by power line" Effect of line on agricultural land uses Identities of exposed persons Who pays for lines-utility, government, or consumers" Cost of avoiding one exposed person Possibility of altering routes" Possible noncancer health effects of fields exposure" How to define effective "dose" of exposure" Width of right-of-way" Field strengths as function of distance from line" Cumulative times people spend in exposure zone Effect on property values Possible exposure of workers to fields' Use of herbicides on right-of-way" "Value of life" implied by decisions" Mechanism of carcinogenesis" General populations knowledge of fields exposure risk" Other causes of cancep
19.0 17.5 16.0
time 9.4
7.8 7.8 6.5 5.2 4.8 2.8
3.8 3.2 2.1 2.0 1.4 1.3 1.3 1.3 1.3 1.2 1.2 1.2 1.1 1.1 1 .o 0.9 0.8 0.7 0.7 0.7 0.7 0.6 0.5 0.5 0.5 0.4 0.3 0.3 0.3 0.3 0.3
"Factors addressed by only two groups.
Task A and Task B. In most cases, we feel that these last differences show that the groups shifted their atten- tion appropriately toward the factors most closely related to the task at hand. For example, Factor 1, the cost of modifying lines to reduce effective dose, received far more attention in Task B, when determining how much to spend on line modification was the object of the task.
Factor 6, the number of persons exposed on a route, appropriately received less attention in Task B, in which use of Route C was required and the number of persons exposed could not be affected.
Finally, we looked at the frequency with which fac- tors are addressed in combinations in order to identify, in at least a rudimentary fashion, the trade-offs being

Regulatory Decision-Making 221
Table IV. Decision Factors Infrequently Linked to Individual Routes
Factor
Percent of turns Speaker factor was not
turns linked to a route
3. 5 . 8.
11. 1.
12. 7.
14. 15. 18. 19. 20. 22. 24. 25.
Annual cancer risk for an exposed individual" Effect on individual electric bills" Uncertainty about risk estimates" Comparisons to other risks Cost of modifying lines to reduce exposure (Task A only)" Provision of information to residents near line Ways of modifying lines to reduce exposure (Task A only)" Possibility of buying out and moving exposed residents Operating life of transmission line Cancer rates in U.S. population Installation of intermittent exposurc controls Household sources of fields exposure Whether risk is assumed voluntarily or nonvoluntarily Noise produced by power line Effect of line on agricultural land uses
239 117 77 52 51 48 42 30 21 20 19 18 18 16 13
95 97
100 100 82
100 86 90
100 100 95
100 94 94 92
"Major decision factor.
Table V. Frequencies with Which Major Factors Were Addressed as Percentages of Total Numbers of Times All Factors Were Addressed
Group Group Group All Task Task Task Task Factor 1 2 3 groups 1 2 A B
1. Cost of modifying line to reduce ex- 11.6 13.9 15.0 13.5 10.1 21.7 3.7 30.5
2. Cost of building and operating lines 12.0 11.6 14.1 12.4 13.3 10.2 11.9 10.6 3. Annual canccr risk for an exposed in- 14.9 9.8 8.5 10.8 7.7 20.3 12.6 9.3
4. Expected number of cancer cases per 9.6 4.4 6.1 6.7 5.2 10.2 6.4 7.2
posure
dividual
year or average time for one case to occur
5. Effect on individual electric bills 3.6 3.2 9.4 5.5 5.0 6.9 3.8 8.5 6. Number of persons exposed on a route 4.9 4.3 7.6 5.5 6.4 3.1 6.9 2.9 7. Ways of modifying lines to reduce cx- 4.5 3.9 5.2 4.6 5.2 3.0 3.1 7.2
8. Uncertainty about risk estimates 5.7 1.3 4.4 3.6 2.5 6.4 4.1 2.8 9. Potential for residential dcvelopment near 2.6 5.3 1.7 3.4 4.8 0.0 4.5 1.4
10. Effect on wildlife and ecology 2.8 2.5 1.1 2.0 2.7 0.3 3.0 0.0 Total factors 741 833 540 2114 1509 605 1353 761
posure
routes
considered by group members. Table VI shows how the 10 major factors were combined in speaker turns. Note that not all of these combinations involve trade-offs. For example, there is no trade-off between factors 3 and 4, cancer risk for exposed individuals and maximum num- ber of expected cancer cases.
Among the trade-offs discussed, that between risk
and cost (shown in Table VI in cells 1,3; 1,4; 1,6; 2,3; 2,4; and 2,6) received the most attention. This shows that the groups devoted much of their effort to finding an acceptable balance between cost and health risk. Fac- tor 3 (annual cancer risk) was combined with factors 1 and 2 (cost of modifying lines and cost of building lines, respectively) 29% of the times it was addressed; factor

222 Hester et al.
Table VI. Numbers of Times Major Factors Were Combined in Single Speaker Turns
Factors” 1 2 3 4 5 6 7 8 9 10
1. 2. 3. 4. 5 . 6. 7. 8. 9.
Total turns factor was addressed
52 32 22 65 17 28 6 1 0 42 39 50 41 21 15 3 0
17 6 14 16 47 3 1 7 6 8 7 3 1
1 2 4 2 1 0 6 6 4 0
5 0 0 0 0
5
283 262 239 141 117 116 97 77 72 42
“Kcy to factors: (1) cost of modifying lines to reduce exposure; (2) cost of building and operating lines; (3) annual cancer risk for an cxposcd individual; (4) expccted number of cancer cases per year or avcrage time for one case to occur; (5) effcct on individual electric bills; (6) number of pcrsons cxposcd on a route; (7) ways of modifying lines to rcducc exposure; (8) uncertainty about risk estimates; (9) po- tential for residential development near routes; (10) effect on wildlife and ecology.
4 (expected cancer cases) was combined with a cost fac- tor 38% of the time it was mentioned; and factor 6 (num- ber of persons exposed on a route) was combined with a cost factor 46% of the times it was menti~ned.’~ While other trade-offs were discussed, both the data in Table VI and a careful reading of the transcripts suggest that the groups did not successfully integrate them with the risk-cost trade-off. Factor 9 (potential residential devel- opment) was combined with a cost factor only 6% of the times it was mentioned and with a risk factor only 14% of the times it was mentioned. Factor 10 (effect on wildlife and ecology) was never combined with a cost- factor and was combined with a risk factor only 5% of the times it was mentioned.
Table VI also shows how some of the decision fac- tors considered by the groups were subject to “framing effects.” Both the cost of building transmission lines (factor 2 ) and the cost of modifying lines to reduce ex- pected exposure (factor 1) could be framed in two ways. The first framing is in terms of total cost (e.g., $16.6 million capital cost for line C). This was the default framing for the groups in the sense that this is how the data on cost were presented. The second framing is in terms of impact on the electricity bills of individuals or
l 3 Instances when both cost factors were combined with a risk factor werc identificd to eliminate double counting of speaker turns in calculating these percentages.
households (factor 5). The groups were able to calculate costs in these terms by dividing total cost by the number of people to be served by the line and estimating the average number of persons in a household. Group mem- bers discussed costs in terms of the second framing a total of 115 times (Table VI, cells 1,5 and 2,5). The total cost figures were clearly daunting to most group members, and they were hesitant to select the more costly routes, especially in Task 1. However, when costs were discussed in terms of the second framing, it was on the order of tens of dollars annually (per household). When presented in this framing the costs evidently seemed much less daunting, and the tendency was to advocate the higher cost routes.14 This can be clearly seen in exchanges such as the following between two members of the second group:
First speaker : “That’s fifty cents per person.”
Second speaker: “That sounds a lot better than two million [dollars].”
A particularly notable aspect of these changes in framing is that after the frame had been changed, speakers ap- peared to forget the earlier framing. In all sessions, such alternations of frames occurred at least several times.
A second example of a framing effect involves the characterization of risk. Risk can be framed in rather abstract terms (e.g., annual mortality risk of 1 x for an exposured individual) or in extremely concrete terms (e.g., if the route goes here, it will on average take 6.4 years or longer for a case of cancer to result). Factor 3 (level of risk per exposed individual) is in terms of the first framing and factor 4 (annual number of ex- pected cases or years to produce a case) is in terms of the second framing. While these alternative framings may in themselves evoke different responses, what is of par- ticular interest in Table VI is the combination of factors 3 and 4 with factor 8, uncertainty. It was made clear to group members that the risk estimate given (factor 3) and thus the number of expected cases of cancer in the exposed population (factor 4) were upper-bound esti- mates, and that the actual risk might be significantly lower. This uncertainty was specifically addressed 47 times in conjunction with factor 3 (Table VI, cell 3,8), but only seven times in conjunction with factor 4 (Table VI, cell 4,8). This is especially significant given that the routes under consideration varied with respect to factor
l 4 Wc were unable to quantify this effect in terms of spcakcr-turn counts because of the difficulty of associating frarnings of costs and advocacy of routes, which were seldom contained together in single speaker turns, but are confident that our observation of the effect is accurate.

Regulatory Decision-Making 223
4 (since different numbers of persons were exposed for each route) but not with respect with factor 3 (since the risk level for any exposed individual is constant). Thus, when group members were discussing the differences between the routes in terms of risk, they evidently tended to not take into account the uncertainty regarding the risk estimate. This conclusion is reinforced by our sub- jective observations of the sessions.
Kahneman and Tverskyc”) have shown convinc- ingly that alternative framings of problems in terms of gains and losses can induce significant changes in indi- vidual decision-making. Our results suggest strongly that similar effects can occur in the context of group deci- sion-making. This carries important implications for risk- management decision-making, especially when sophis- ticated advocates are able to manipulate the framings, and suggests that risk analysts interested in supporting informed decision-making should look for ways to iden- tify and compare multiple framings.
6. DECISION STRATEGIES
We observed a number of behavior patterns which can be characterized as decision strategies. This is not to say that the groups deliberated over how they would go about making their decisions, formulated a plan, and carried it through. They did no such thing. Rather, we observed that certain approaches to decision-making were employed repeatedly by group members.
The groups employed a pair of simple strategies for choosing among the four alternative power-line routes. The first of these was elimination of extremes. Route B had by far the largest number of people exposed. All of the groups eliminated this route from consideration rather quickly. Route A had close to the highest cost (second to route D, which exposed the fewest people) and was soon dropped from consideration by most group mem- bers, although a few evidently continued to consider it because they viewed it as a “compromise” choice be- tween routes C and D. The rationale for this strategy, when explicitly stated (which it was on several occa- sions), was usually some variation on the idea that it would make the completion of the route-selection task easier.
The second strategy was the consideration of routes by pairs. It was evidently easier to consider just two routes at a time than to consider three or four. Thus, routes A and D were often compared as the two “low risk” routes, and B and C as the two “low cost” routes. The “winners” in these two comparisons were often then compared to one another. All of the groups dis-
played difficulty in selecting and performing normali- zations that would allow simultaneous comparisons of all four routes. In some cases, pair-wise comparison ap- peared to be adopted as a strategy to avoid such nor- malization. l5
Another decision strategy that we observed was ref- erence to prior decisons and attempts to make subsequent decisions consistent with those prior decisions. This strategy was suggested explicitly 12 times by members of Group 1, 17 by Group 2, and 25 by Group 3. For example, in Task lA, several members of Group 1 voted for route D. In Task lB, some of them explicitly rea- soned as follows: since route D costs more than route C, and results in roughly half the number of persons being exposed as does route C, and since route D is the route I favor, I will advocate spending the difference in cost between the two routes.
This strategy was also used in two other situations. When a group completed Task 1 and moved on to Task 2, members sometimes attempted to use their Task 1 decision by identifying the route in Task 2 that yielded a maximum number of cancer cases that was as close as possible to the level they had found acceptable in Task 1.16 In Task 3, in which the group was asked to identify a de minimus risk level, a number of group members referred back to their previous decisions, attempting to identify a risk level equivalent to that for a route that they judged too costly to be justified on the basis of the associated risk. In all of these cases, a primary concern appeared to be to achieve consistency with earlier de- cisions.
7. PERFORMANCE OF TASK 3
Task 3 required the groups to identify a minimum upper-bound risk estimate for exposure to power-line fields, which would preclude government action. While the groups’ efforts in this task were disorganized and incoherent, there were some consistencies among them.
Each group made extensive reference to the risk tables provided to them. Generally, the approach was to look at the risks listed one-by-one and consider whether
Is The strategies of elimination of extremes and pair-wise comparison were difficult to separate because there were only four routes. Elim- ination of the two extreme choices left only a pair of routes to consider, making it impossible to discern whether the consideration of only a pair of routes was by design or default. In retrospect, providing five routes would have been preferable for the purpose of distinguishing between these two strategies.
lfi They were not very successful in doing this because none yielded a number that was very close.

224 Hester et al.
each of them justified concern or action, at the same time considering their magnitudes. However, group members found that this did not provide an adequate basis for making a decision because factors other than the risk level alone had a bearing on their responses to the risks. These other factors included:
0 The number of people exposed to the risk (men-
0 The number of deaths expected annually from
0 Whether the risk is assumed voluntarily or not
0 The benefits of the technology, if any, associated
0 Individual ability to control the risk (two groups). 0 The time lapse between exposure and effects (one
0 The ability of government to do anything about the risk (one group).
0 Alternative uses for money that might be spent to reduce the risk (opportunity cost), and the number of lives that could be saved by spending that money to control other risks (one group).
The considerations listed above demonstrate again the breadth of concerns lay people bring to risk management decisions. They resemble closely factors identified by other researchers as being important in perceptions of and responses to risk.(’O) This is especially interesting in that these considerations were brought up in the context of a discussion in a group of lay people rather than in response to questions asked in a laboratory situation.
tioned in all three groups).
the risk (three groups).
(two groups).
with the risk (two groups).
group).
8. PROBLEMS IN USING QUANTITATIVE INFORMATION
As noted, we tried hard to avpid imposing any par- ticular normalization on the data provided to the groups, and we also avoided suggesting or performing any cal- culations or manipulations of the data.17 There are, in fact, some normalizations, which could be fairly easily done, which we believe would be useful. For example, by comparing the costs and numbers of persons exposed and factoring in the risk level, figures could be calcu- lated which would reveal the upper-bound cost per po- tential cancer case avoided by shifting from one route to another. This normalization was performed only once, by a member of the second group as a means to compare
” We did indicatc that such calculations or manipulations might be vcry useful, and wc provided calculators.
just two of the routes. The figure derived was not dis- cussed by the group in this instance.
The only other manipulations of the data presented to the groups involved calculating the effect on individ- ual electric bills and the calculations required to assure that decisions made in the second part of a task consis- tent with the decision made in the first part (as described above). Regardless of why group members failed to per- form many normalizations or other calculations, the end result was that the groups relied heavily on using the materials and information provided aspresented to them, often going to rather considerable lengths to try to do comparisons which would have been easy with appro- priate normalizations.
A second problem was an insufficient appreciation on the part of most group members that the risk estimates provided to them were upper bounds on the possible risk of exposure to power-line fields. While this fact was occasionally brought up by individual group members, the general tendency was to treat the estimates as ex- pected values for the risk. This was especially true when the expected numbers of cancer cases for the four routes were discussed. Clearly, this misperception or misun- derstanding biases the decisions made in the direction of excessive expenditure on protection from or avoidance of risk.
9. SUMMARY OF GROUP DECISIONS
The decisions reached by the groups for each task are summarized below. In considering these, readers should bear in mind two things. First, we were more interested in observing the decision processes the groups went through and the factors that they considered im- portant to their decisions than we were in the decisions themselves. Group chairmen had been told not to press too hard to achieve consensus. Second, the problems we observed in the use of information lead us to believe that group members might well be induced to make different decisions if the same information were given to them in different forms. Therefore, the results reported here should not be taken as the definitive answers that lay decision- makers would provide to the questions we asked.
Task 1A required the group to recommend one of four routes. In Group 1, there were 2 votes for route A, 4 for route C, and 4 for Route D. Group 2 chose Route C by consensus without explicitly polling members for votes, but added the conditions that the 24 persons who would be exposed on that route be offered a chance to sell their property to the state and move and that anyone “close enough to be affected” be given information about

Regulatory Decision-Making 225
field exposure risk. In Group 3 (which was given a risk estimate of 1 in 1000 rather than 1 in 10,000 in Task l), there were 7 votes for route C, 2 for route D, and one vote split between routes A and D.
Task 2A was like Task lA, but with the risk esti- mate changed (increased 10-fold for Groups 1 and 2, decreased 10-fold for Group 3). In Group 1, there was 1 vote for route A, 1 for route C, and 8 for route D. Group 2 chose route D by consensus and included the same conditions as for Task 1A. In Group 3, there were 9 votes for route C and 1 for route D.
Task 1B required the group to recommend the max- imum amount to be spent on exposure controls to reduce “effective dose” (i-e., reduce the risk for those exposed) by one half, given that route C was to be used. Group 1 reported their answers in terms of percentage increases in the total cost of Route C, with individuals favoring expenditures between zero and 50%. Group 2 based its consensus answer on a 50-75 cent annual increase in electric bills per user, equivalent to about a 5 % increase. Group 3 also reached a consensus on an increase equiv- alent to about 5%, but based it on a comparison of risks and costs between Routes C and D.
Task 2B was like Task lB, except with the risk estimate changed as for Task 2A. Group 1 again gave answers in percentage terms, with nine members favor- ing an increase of 100% and the remaining member 30%. Group 2 reached a consensus on increased total spending of approximately 30%, this time basing their response on the difference in cost between routes C and D. In Group 3, eight members reached a consensus on no ad- ditional expenditure, but two members favored addi- tional expenditure identical to that in Task 1B.
To provide another perspective on these results, we normalized the results in terms of minimum cost per cancer case avoided.’* With upper-bound risk of 1 in 10,000, these costs are approximately $5 x lo7 for choosing route A, $7 x lo6 for route C, and $6 x lo7 for route D. (With upper-bound risk of 1 in 1000, each figure decreases by a factor of 10.) Cost figures for Tasks 1B and 2B were, however, dramat- ically higher. For the 1 in 10,000 risk level, a 10% cost increase amounts to over $1 x lo8! Clearly, the members of the groups were not aware of these dis- parities: we strongly suspect that they would have changed their answers if they had been.
Two things are interesting about the group mem- bers’ answers on Tasks 1B and 2B. First, the answers
These figures are minimum costs because the risk levels are upper bounds. For the route selections, we normalized with respect to route B, the lowest cost route.
vary widely in magnitude. We believe that this is due largely to the different approaches that the groups used in arriving at their answers, and the fact that the selection of those approaches did not involve considering a num- ber of alternatives, but rather simply using the approach that seemed easiest or was first suggested. Second, many of the answers yielded higher dollar figures for cancer cases avoided than did the route selections in Tasks 1A and 2A. (This is, of course, only apparent when the figures are normalized, and the groups did not perform these normalizations.) We believe that this can be traced to the fact that they gave the answers to the different tasks in ways that made comparisons difficult. In fact, the groups seemed to be searching for consistency in their answers, but did not know how to achieve it. This reinforces our view that these groups would have been greatly assisted by some good analyses, which would help them make better use of the information they had available.
Task 3 required the group to specify a risk level at which no government expenditure to control the risk would be justified. Answers from the group members on this task varied widely in terms of the ways they were ex- pressed. Expressed in terms of annual risk to exposed individuals, most answers fell within a range of 5 x
and 7 x In considering these results it is essential to keep in
mind their context. One should be very cautious about trying to extrapolate from them or draw inferences which would apply out of the context of these group decisions. This is especially true given the problems about the group decision-making process that we have identified.
10. CONCLUSIONS
On the basis of our analysis, we reach the following
1. The lay groups we studied were sophisticated in their identification of decision attributes. In- deed, they produced a more extensive set than many analysts might. However, they had great difficulty in making trade-offs among multiple attributes and were only able to effectively ad- dress the trade-off between the two most im- portant attributes-cost and risk.
2. While differences in group composition and dy- namics were clearly significant in the groups’ decision processes, the structure and substantive content of the tasks undertaken dominated in-
conclusions:

226
3.
4.
5.
6.
7.
tergroup variations in terms of the factors that were most important to group members’ deci- sions. The groups made substantial use of several sim- ple strategies or heuristics, notably elimination of extremes and pair-wise comparison. Al- though these may ease decision-making, they are likely to unknowingly introduce bias and other unintended effects in the decision process. The groups displayed strong framing effects in their decision processes and almost no aware- ness of the operation of these effects even after several alternations between two framings. The groups tended to take quantitative infor- mation in the form it was given without nor- malizing it or otherwise performing analysis on it. This raises the possibility that the form in which information is provided can have a sig- nificant impact on outcomes, especially given the potential for framing effects. Upper-bound representations of risk appear to be very difficult for lay people to use. There is a strong tendency for upper bounds to be treated operationally as expected values. While many of the arguments advanced by group members displayed remarkable sophistication, the group decision-making process we observed was disorganized.
Despite the problems this research has identified, we find the performance of our three lay decision groups to be very encouraging. Our findings suggest that, properly assisted, groups of well-informed, well-motivated lay opinion leaders, who invest serious sustained effort, should be capable of sophisticated high-quality decision-making on a variety of difficult semitechnical policy decision tasks in risk management. It appears that such groups can benefit from organizational and procedural assist- ance. In addition, and apparently far more important, they need help in the form of careful, balanced policy analysis that suggests ways to structure the problem, discusses the importance of framing, provides and com- pares alternative normalizations and framings, and helps them to see the implications of the arguments and pro- cedures they are adopting.
ACKNOWLEDGMENTS
We thank the 29 members of the groups who served as subjects in these studies for their very considerable
Hester et al.
assistance. Greg Fischer provided advice on experimen- tal design. Ann Bostrom and Eric Males served as con- firmatory coders. Patti Steranchak provided secretarial and adminstrative assistance. Frederick Morgan pro- vided assistance with the audio and video facilities. Ro- byn Dawes, Baruch Fischhoff, Lester Lave, and other members of the Carnegie Mellon University Research Group in Risk Perception and Communication provided critical reviews and suggestions. This research was sup- ported by the U.S. Department of Energy under subcon- tract number 19X-43342CY through Oak Ridge National Laboratory. Preparation of this paper was supported by NSF grant SES-8715564. Gordon Hester’s work on this project was supported by a Graduate Fellowship from the National Science Foundation.
REFERENCES
1. For recent reviews see lndira Nair, M. Granger Morgan, H. Keith Florig, “Power-Frequency Electric and Magnetic Fields Expo- sure, Effects, Research, and Regulation.” Review paper prepared for the Energy and Materials Program of the U.S. Congressional Office of Technology Assessment, February 1989; W. Ross Adey, “Electromagnetic Fields. Cell Membrane Amplification and Can- cer Promotion.” Paper presented at the NCRP Annual Meeting, National Academy of Sciences, 1986; and Florida Electric and Magnetic Fields Science Advisory Commission, Biological Efects of Nonionizing Radiation (Florida Electric Power Coordinating Group, Inc., Tampa, March 1985).
2. For discussions of various aspects of the problems of trying to do risk analysis on 60 Hz fields, see M. Grangcr Morgan er al., “Some First Steps Towards Assessing Possible Health Risks from Exposure to 50/60 Hz Electromagnetic Fields,” in L. E. Ander- son, B. J. Kelman, and R. J. Weigel (eds.), Interactions ofBio- logical Systems with Static and ELF Electric and Magnetic Fields, Proceedings of the Twenty-Third Life Sciences Symposium, Oc- tober 1984; H. Keith Florig, “Population Exposure to Power Fre- quency Fields: Concepts, Components, and Control.” Doctoral thesis, Department of Engineering and Public Policy, Carnegie Mellon University, Pittsburgh (1986).
3. See “Trends in Regulation,” Section 3 of Proceedings of the International Utility Symposium on Health Effects of Electric and Magnetic Fields. John P. O’Grady (ed.), Ontario Hydro1 Toronto. (1986), and Indira Nair, M. Granger Morgan, H. Keith Florig. “Power-Frequency Electric and Magnetic Fields Exposure, Ef- fects, Research, and Regulation” Review paper preparcd for the Energy and Materials Program of thc U.S. Congressional Office of Technology Assessment (1989).
4. See “Lessons Learned from Administrative and Judicial Processcs.” Section 6 of thc Proceedings of the International Utility Sympo- sium on Health Effects of Electric and Magnetic Fields, John P. O’Grady (ed.) Ontario Hydro, Toronto (1986); Indira Nair, M. Granger Morgan, H. Keith Florig, "Power-Frequency Electric and Magnetic Fields Exposure, Effects, Research, and Regulation.” Review paper prcpared for the Energy and Materials Program of the U.S. Congressional Office of Technology Assessment (1989).
5. M. G. Morgan, “Risk Research: When Should We Say Enough.” Science 23, 917 (1986).
6. R. E. Kasperson and P. J. M. Stallen (eds.). Communicating

Regulatory Decision-Making
Health and Safety Risks to the Public: International Perspectives, Reidel, Dortrecht, Netherlands (1989).
7. M. G. Morgan, H. K. Florig, I. Nair, and D. Lincoln. “Power- line Fields and Human Health.” IEEE Spectrum 62-68 (1985).
8. M. G. Morgan, “Probing the Question of Technology-Induced Risk.” IEEE Spectrum 58-64 (1981), “Choosing and Managing Technology-Induced Risk.” IEEE Spectrum 53-60 (1981).
D. J. Isenberg, “Group Polarization: A Critical Revicw and 9.
227
Meta-analysis.” Journal of Personaliy and Social Psychology,
10. P. Slovic, B. Fischhoff, and S. Lichenstein. “Facts and Fears: Understanding Perceived Risk.” Societal R b k Assessment: How Safe is Safe Enough, R. C . Schwing, and W. A. Albers (eds.), Plenum Press. New York (1980).
11. D. Kahneman and A. Tversky, “Prospect Theory: An Analysis of Dccision Under Risk.” Econornetrica, 263-291 (1979).
50, 1141-1151 (1986).
Copyright © 2022 FDOKUMEN