BEFORE THE FEDERAL ENERGY REGULATORY ... - Tampa Electric
132
BEFORE THE FEDERAL ENERGY REGULATORY COMMISSION DOCKET NO. ER10-____-000 DIRECT TESTIMONY AND EXHIBIT OF WILLIAM E. AVERA ON BEHALF OF TAMPA ELECTRIC COMPANY
-
Upload
khangminh22 -
Category
Documents
-
view
0 -
download
0
Transcript of BEFORE THE FEDERAL ENERGY REGULATORY ... - Tampa Electric
BEFORE THE
FEDERAL ENERGY REGULATORY COMMISSION
DOCKET NO. ER10-____-000
DIRECT TESTIMONY AND EXHIBIT
OF
WILLIAM E. AVERA
ON BEHALF OF TAMPA ELECTRIC COMPANY
DOCKET NO. ER10-____-000 EXHIBIT NO. TEC-200 FILED: 07/30/2010
WILLIAM E. AVERA 1
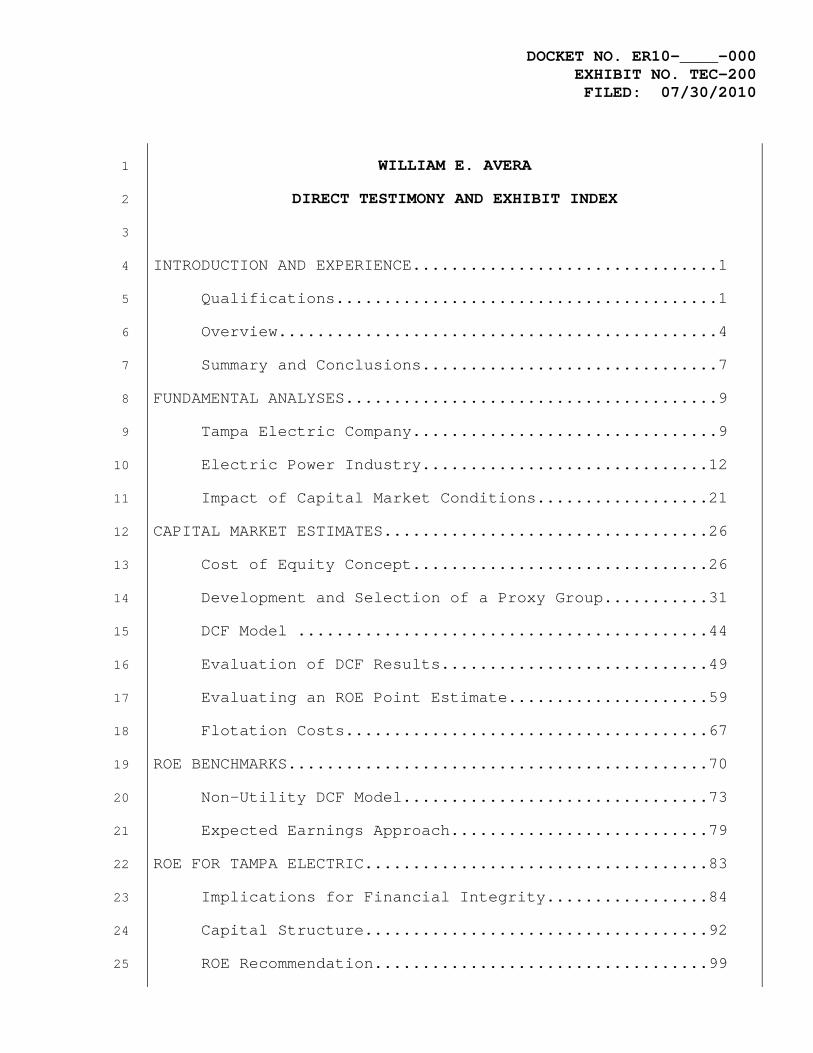
DIRECT TESTIMONY AND EXHIBIT INDEX 2
3
INTRODUCTION AND EXPERIENCE................................1 4
Qualifications........................................1 5
Overview..............................................4 6
Summary and Conclusions...............................7 7
FUNDAMENTAL ANALYSES.......................................9 8
Tampa Electric Company................................9 9
Electric Power Industry..............................12 10
Impact of Capital Market Conditions..................21 11
CAPITAL MARKET ESTIMATES..................................26 12
Cost of Equity Concept...............................26 13
Development and Selection of a Proxy Group...........31 14
DCF Model ...........................................44 15
Evaluation of DCF Results............................49 16
Evaluating an ROE Point Estimate.....................59 17
Flotation Costs......................................67 18
ROE BENCHMARKS............................................70 19
Non-Utility DCF Model................................73 20
Expected Earnings Approach...........................79 21
ROE FOR TAMPA ELECTRIC....................................83 22
Implications for Financial Integrity.................84 23
Capital Structure....................................92 24
ROE Recommendation...................................99 25
DOCKET NO. ER10-____-000 EXHIBIT NO. TEC-200 FILED: 07/30/2010
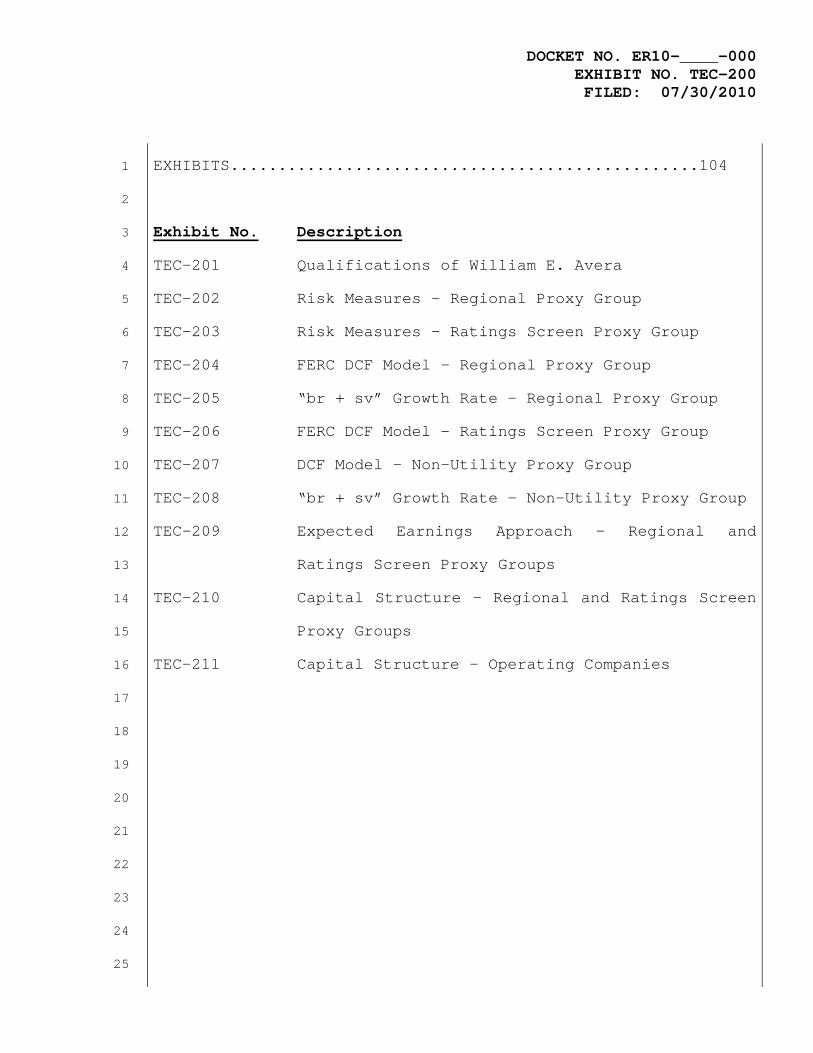
EXHIBITS.................................................104 1
2
Exhibit No. Description 3
TEC-201 Qualifications of William E. Avera 4
TEC-202 Risk Measures – Regional Proxy Group 5
TEC-203 Risk Measures – Ratings Screen Proxy Group 6
TEC-204 FERC DCF Model – Regional Proxy Group 7
TEC-205 “br + sv” Growth Rate – Regional Proxy Group 8
TEC-206 FERC DCF Model – Ratings Screen Proxy Group 9
TEC-207 DCF Model – Non-Utility Proxy Group 10
TEC-208 “br + sv” Growth Rate – Non-Utility Proxy Group 11
TEC-209 Expected Earnings Approach – Regional and 12
Ratings Screen Proxy Groups 13
TEC-210 Capital Structure – Regional and Ratings Screen 14
Proxy Groups 15
TEC-211 Capital Structure – Operating Companies 16
17
18
19
20
21
22
23
24
25

DOCKET NO. ER10-____-000 EXHIBIT NO. TEC-200 FILED: 07/30/2010
BEFORE THE FEDERAL ENERGY REGULATORY COMMISSION 1
PREPARED DIRECT TESTIMONY 2
OF 3
WILLIAM E. AVERA 4
ON BEHALF OF TAMPA ELECTRIC COMPANY 5
6
INTRODUCTION AND EXPERIENCE 7
Q. Please state your name and business address. 8
9
A. William E. Avera, 3907 Red River, Austin, Texas, 78751. 10
11
Q. In what capacity are you employed? 12
13
A. I am the President of FINCAP, Inc., a firm providing 14
financial, economic, and policy consulting services to 15
business and government. 16
17
Qualifications 18
Q. What are your qualifications? 19
20
A. I received a B.A. degree with a major in economics from 21
Emory University. After serving in the U.S. Navy, I 22
entered the doctoral program in economics at the 23
University of North Carolina at Chapel Hill. Upon 24
receiving my Ph.D., I joined the faculty at the 25
DOCKET NO. ER10-____-000 EXHIBIT NO. TEC-200 FILED: 07/30/2010
2
University of North Carolina and taught finance in the 1
Graduate School of Business. I subsequently accepted a 2
position at the University of Texas at Austin where I 3
taught courses in financial management and investment 4
analysis. I then went to work for International Paper 5
Company in New York City as Manager of Financial 6
Education, a position in which I had responsibility for 7
all corporate education programs in finance, accounting, 8
and economics. 9
10
In 1977, I joined the staff of the Public Utility 11
Commission of Texas (“PUCT”) as Director of the Economic 12
Research Division. During my tenure at the PUCT, I 13
managed a division responsible for financial analysis, 14
cost allocation and rate design, economic and financial 15
research, and data processing systems, and I testified in 16
cases on a variety of financial and economic issues. 17
Since leaving the PUCT in 1979, I have been engaged as a 18
consultant. I have participated in a wide range of 19
assignments involving utility-related matters on behalf 20
of utilities, industrial customers, municipalities, and 21
regulatory commissions. I have previously testified 22
before the Federal Energy Regulatory Commission (“FERC” 23
or the “Commission”), as well as the Federal 24
Communications Commission (“FCC”), the Surface 25

DOCKET NO. ER10-____-000 EXHIBIT NO. TEC-200 FILED: 07/30/2010
3
Transportation Board (and its predecessor, the Interstate 1
Commerce Commission), the Canadian Radio-Television and 2
Telecommunications Commission, and regulatory agencies, 3
courts, and legislative committees in over 40 states. 4
5
In 1995, I was appointed by the PUCT, with the approval 6
of the Governor, to the Synchronous Interconnection 7
Committee to advise the Texas legislature on the costs 8
and benefits of connecting Texas to the national electric 9
transmission grid. In addition, I served as an outside 10
director of Georgia System Operations Corporation, the 11
system operator for electric cooperatives in Georgia. 12
13
I have served as Lecturer in the Finance Department at 14
the University of Texas at Austin and taught in the 15
evening graduate program at St. Edward’s University for 16
twenty years. In addition, I have lectured on economic 17
and regulatory topics in programs sponsored by 18
universities and industry groups. I have taught in 19
hundreds of educational programs for financial analysts 20
in programs sponsored by the Association for Investment 21
Management and Research, the Financial Analysts Review, 22
and local financial analysts societies. These programs 23
have been presented in Asia, Europe, and North America, 24
including the Financial Analysts Seminar at Northwestern 25
DOCKET NO. ER10-____-000 EXHIBIT NO. TEC-200 FILED: 07/30/2010
4
University. I hold the Chartered Financial Analyst (CFA®) 1
designation and have served as Vice President for 2
Membership of the Financial Management Association. I 3
have also served on the Board of Directors of the North 4
Carolina Society of Financial Analysts. I was elected 5
Vice Chairman of the National Association of Regulatory 6
Utility Commissioners (“NARUC”) Subcommittee on Economics 7
and appointed to NARUC’s Technical Subcommittee on the 8
National Energy Act. I have also served as an officer of 9
various other professional organizations and societies. 10
11
Overview 12
Q. What is the purpose of your testimony? 13
14
A. The purpose of my testimony is to present to the FERC my 15
independent analysis of a fair rate of Return on Equity 16
(“ROE”) for the jurisdictional wholesale electric utility 17
operations of Tampa Electric Company (“Tampa Electric” or 18
“the Company”). My evaluation considered FERC’s 19
established precedent and policy objectives, industry 20
conditions and fundamentals, independent estimates of the 21
ROE for alternative benchmark groups of electric 22
utilities, as well as the particular exposures 23
confronting the Company and its electric production and 24
transmission systems. 25
DOCKET NO. ER10-____-000 EXHIBIT NO. TEC-200 FILED: 07/30/2010
5
Q. Please summarize the basis of your knowledge and 1
conclusions concerning the issues to which you are 2
testifying in this case. 3
4
A. To prepare my testimony, I used information from a 5
variety of sources that would normally be relied upon by 6
a person in my capacity. In connection with the present 7
filing, I considered and relied upon corporate 8
disclosures, publicly available financial reports and 9
filings, and other published information relating to 10
Tampa Electric. In addition, I am familiar with FERC 11
policy generally and have submitted testimony in numerous 12
proceedings at the Commission dealing with required rates 13
of return for electric utilities.1 I also reviewed 14
information relating generally to capital markets and 15
specifically to investor perceptions, requirements, and 16
expectations for regulated utilities in a restructured 17
wholesale electric power market. These sources, coupled 18
with my experience in the fields of finance and utility 19
regulation, have given me a working knowledge of ROE 20
issues affecting Tampa Electric and are the basis of my 21
conclusions. 22
1 See, e.g., Docket No. ER00-3316-000 on behalf of American Transmission Company, LLC, Docket No. ER02-485-000 involving the Midwest Independent Transmission System Operator, Inc., Docket No. ER04-157-000 on behalf of the transmission-owning members of the ISO New England, Inc., Docket No. ER07-562-000 on behalf of Trans-Allegheny Interstate Line Company, Docket No. ER08-386-000 on behalf of Potomac-Appalachian Transmission Highline, LLC, Docket No. EL08-31-000 on behalf of Westar Energy, Inc., and Docket No. ER08-686-000 on behalf of Pepco Holdings, Inc.
DOCKET NO. ER10-____-000 EXHIBIT NO. TEC-200 FILED: 07/30/2010
6
Q. What is the role of the ROE in setting a utility’s rates? 1
2
A. The rate of return on common equity compensates 3
shareholders for the use of their capital to finance the 4
plant and equipment necessary to provide utility service. 5
Investors commit capital only if they expect to earn a 6
return on their investment commensurate with returns 7
available from alternative investments with comparable 8
risks. To be consistent with sound regulatory economics 9
and the standards set forth by the Supreme Court in the 10
Bluefield2 and Hope3 cases, a utility’s allowed return on 11
common equity should be sufficient to: (1) fairly 12
compensate investors for capital they have invested in 13
the utility, (2) enable the utility to offer a return 14
adequate to attract new capital on reasonable terms, and 15
(3) maintain the utility’s financial integrity. 16
17
Q. How did you go about evaluating the ROE for Tampa 18
Electric? 19
20
A. I first reviewed the operations and finances of Tampa 21
Electric, as well as the general conditions in the 22
electric utility industry. With this background, I 23
2 Bluefield Water Works & Improvement Co. v. Pub. Serv. Comm’n, 262 U.S. 679 (1923).
3 FPC v. Hope Natural Gas Co., 320 U.S. 591 (1944).
DOCKET NO. ER10-____-000 EXHIBIT NO. TEC-200 FILED: 07/30/2010
7
examined current capital market conditions and conducted 1
quantitative analyses to estimate the current cost of 2
equity. Consistent with Commission precedent,4 I relied 3
on the Discounted Cash Flow (“DCF”) methodology, 4
currently prescribed by FERC, and applied it to a proxy 5
group of other electric utilities with a direct 6
correlation to Tampa Electric and the broader markets in 7
which the Company operates. In addition, I examined 8
alternative ROE benchmarks that included DCF cost of 9
equity estimates for a proxy group of low-risk industrial 10
firms and expected earned rates of return for utilities. 11
12
Summary and Conclusions 13
Q. Based on your evaluation, what did you conclude regarding 14
a fair ROE for Tampa Electric? 15
16
A. I recommend an ROE for Tampa Electric of 11.25 percent. 17
My recommendation falls well within the 8.2 percent to 18
13.6 percent zone of reasonableness produced by applying 19
the Commission-approved DCF approach to the proxy group 20
of nine regional electric utilities. While my 11.25 21
percent ROE recommendation exceeds the midpoint and 22
4 See, e.g., Bangor Hydro-Elec. Co., 117 FERC ¶ 61,129 (2006) (“Bangor Hydro”); Midwest
Indep. Transmission Sys. Operator, Inc., 100 FERC ¶ 61,292 (2002) (“Midwest ISO”), reh’g denied, 102 FERC ¶ 61,143 (2003), modified on other grounds sub nom. Pub. Serv. Comm’n v. FERC, 397 F.3d 1004 (D.C. Cir. 2005); S. Cal. Edison Co., 92 FERC ¶ 61,070 (2000) (“Southern California Edison”), reh’g denied, 108 FERC ¶ 61,085 (2004).
DOCKET NO. ER10-____-000 EXHIBIT NO. TEC-200 FILED: 07/30/2010
8
median produced using the Commission’s DCF approach, an 1
ROE above these values is supported by reference to 2
alternative ROE benchmarks, which consistently support a 3
higher allowed return. In evaluating the ROE for 4
jurisdictional utility operations, it is also important 5
to consider the uncertainties associated with Tampa 6
Electric and the challenges the Company faces in raising 7
the capital required to finance significant planned 8
infrastructure investment – including a renewed focus on 9
regulatory uncertainties. 10
11
My conclusions are reinforced by the need to consider 12
flotation costs, and the fact that current cost of 13
capital estimates are likely to understate investors’ 14
requirements at the time the outcome of this proceeding 15
becomes effective and beyond. Moreover, ongoing turmoil 16
in the domestic and global financial markets and 17
continued economic uncertainties have exacerbated the 18
risks faced by utilities and their investors. In 19
addition, my recommendation also considers the 20
Commission’s policy goal of attracting the capital 21
investment to expand utility infrastructure necessary to 22
support efficient, reliable wholesale power markets. 23
Taken together, these considerations confirm the 24
reasonableness of my recommended range and support an 25
DOCKET NO. ER10-____-000 EXHIBIT NO. TEC-200 FILED: 07/30/2010
9
11.25 percent ROE for Tampa Electric. 1
2
FUNDAMENTAL ANALYSES 3
Q. What is the purpose of this section? 4
5
A. As a predicate to the quantitative analyses that I 6
address later in this testimony, this section briefly 7
reviews the operations and finances of Tampa Electric. In 8
addition, it examines the risks and prospects for the 9
electric utility industry and conditions in the capital 10
markets and the general economy. An understanding of the 11
fundamental factors driving the risks and prospects of 12
electric utilities is essential in developing an informed 13
opinion of investors’ expectations and requirements that 14
are the basis of a fair rate of return. 15
16
Tampa Electric Company 17
Q. Please briefly describe Tampa Electric. 18
19
A. Tampa Electric is the principal subsidiary of TECO 20
Energy, Inc. (“TECO Energy”). Headquartered in Tampa, 21
Florida, Tampa Electric provides electric generation, 22
transmission, and distribution utility services 23
throughout an area of approximately 2,000 square miles in 24
West Central Florida, including Hillsborough County and 25
DOCKET NO. ER10-____-000 EXHIBIT NO. TEC-200 FILED: 07/30/2010
10
parts of Polk, Pasco and Pinellas Counties, with an 1
estimated population of over one million. The principal 2
communities served are Tampa, Winter Haven, Plant City 3
and Dade City. In addition, Tampa Electric engages in 4
wholesale sales to utilities and other resellers of 5
electricity. Through its Peoples Gas System division, 6
Tampa Electric also purchases, distributes and markets 7
natural gas to more than 334,000 residential, commercial, 8
industrial and electric power generation customers in the 9
state of Florida. 10
11
During 2009, approximately 49 percent of Tampa Electric’s 12
total operating revenue was derived from residential 13
sales, 31 percent from commercial sales, 9 percent from 14
industrial sales, and 11 percent from other sales, 15
including bulk power sales for resale. Tampa Electric’s 16
generating resources have a combined capacity of 17
approximately 4,700 megawatts. Approximately 55 percent 18
of Tampa Electric’s generation of electricity for 2009 19
was coal-fired, with natural gas representing 20
approximately 45 percent and oil representing less than 1 21
percent. Tampa Electric used its generating units to meet 22
approximately 91 percent of the total system load 23
requirements, with the remaining 9 percent coming from 24
purchased power. 25
DOCKET NO. ER10-____-000 EXHIBIT NO. TEC-200 FILED: 07/30/2010
11
Tampa Electric's transmission and distribution facilities 1
include over 7,700 miles of overhead lines and 2
approximately 4,470 miles of underground cables. At 3
December 31, 2009, Tampa Electric’s investment in assets 4
amounted to approximately $6.3 billion, with revenues 5
totaling approximately $2.9 billion. Tampa Electric's 6
retail electric operations are subject to the 7
jurisdiction of the Florida Public Service Commission 8
(“FPSC”), with wholesale power and interstate 9
transmission service regulated by FERC. 10
11
Q. Is Tampa Electric interconnected with other utilities 12
through a regional reliability organization? 13
14
A. Yes. Tampa Electric is interconnected with electric 15
power systems in the southeast through the Florida 16
Reliability Coordinating Council, Inc. (“FRCC”), which 17
serves as a regional entity for the purpose of proposing 18
and enforcing reliability standards and coordinating and 19
planning the bulk electric system in Florida. The area 20
of Florida that is within the FRCC region is peninsular 21
Florida east of the Apalachicola River, while the 22
panhandle area west of the Apalachicola River is within 23
the scope of the SERC Reliability Corporation (“SERC”). 24
25
DOCKET NO. ER10-____-000 EXHIBIT NO. TEC-200 FILED: 07/30/2010
12
Q. What credit ratings have been assigned to Tampa Electric? 1
2
A. Currently, Tampa Electric is assigned a corporate credit 3
rating of “BBB” by Standard & Poor’s Corporation (“S&P”), 4
with Moody’s Investors Service (“Moody’s”) assigning an 5
issuer rating of “Baa1”. Meanwhile, Fitch Ratings Ltd. 6
(“Fitch”) has assigned the Company a “BBB” issuer default 7
rating. 8
9
Electric Power Industry 10
Q. What general conditions have characterized the electric 11
power industry? 12
13
A. Since the 1990s, the industry has experienced significant 14
structural change resulting from market forces and 15
regulatory initiatives. At least initially, this process 16
was largely driven by regulatory reforms at the federal 17
level. The Energy Policy Act of 1992 greatly facilitated 18
competition for the production and sale of power at the 19
wholesale level, with FERC being a proponent of actions 20
designed to foster greater competition in markets for 21
wholesale power supply. 22
23
In April 1996, the Commission adopted Order No. 888,5 24
5 Promoting Wholesale Competition Through Open Access Non-Discriminatory Transmission Services by Public Utilities; Recovery of Stranded Costs by Public Utilities and Transmitting Utilities, Order No. 888, 1991-1996 FERC Stats. & Regs., Regs. Preambles ¶ 31,036 (1996), order on reh’g, Order No. 888-A, 1996-2000 FERC Stats. & Regs., Regs. Preambles ¶ 31,048, order on reh’g, Order No. 888-B, 81 FERC ¶ 61,248 (1997), reh’g denied, Order No. 888-C, 82 FERC ¶ 61,046 (1998), aff’d in part and remanded in part sub nom. Transmission Access Policy Study Group v. FERC, 225 F.3d 667 (D.C. Cir. 2000), aff’d sub nom. N.Y. v. FERC, 535 U.S. 1 (2002).
DOCKET NO. ER10-____-000 EXHIBIT NO. TEC-200 FILED: 07/30/2010
13
which mandated open access to the wholesale transmission 1
facilities of jurisdictional electric utilities. The 2
Commission later promoted improvements to the 3
transmission system and has continued to pursue the goal 4
of creating “seamless” wholesale power markets that 5
facilitate transactions across transmission grid 6
boundaries, among other objectives. In response to the 7
passage of the Energy Policy Act of 2005 (“EPAct 2005”), 8
FERC also issued its Order Nos. 679 and 679-A, 9
establishing incentive-based rate treatments to promote 10
greater capital investment in electric utility 11
infrastructure. 12
13
Q. How have investors’ risk perceptions for the utility 14
industry evolved? 15
16
A. Implementation of these structural changes and related 17
events have caused investors to rethink their assessment 18
of the relative risks associated with the utility 19
industry. The past decade witnessed steady erosion in 20
credit quality throughout the electric power industry, 21
both as a result of revised perceptions of the risks in 22
the industry and the weakened finances of industry 23
participants themselves. Late last year, S&P observed 24
with respect to the industry’s future that: 25
26
DOCKET NO. ER10-____-000 EXHIBIT NO. TEC-200 FILED: 07/30/2010
14
Looming costs associated with environmental 1 compliance, slack demand caused by economic 2 weakness, the potential for permanent demand 3 destruction caused by changes in consumer 4 behavior and closing of manufacturing 5 facilities, and numerous regulatory filings 6 seeking recovery of costs are some of the 7 significant challenges the industry has to deal 8 with.6 9
10
Q. Does Tampa Electric anticipate the need to access 11
the capital markets going forward? 12
13
A. Yes. Tampa Electric will require capital investment to 14
provide for necessary maintenance and replacements and 15
fund new investments in the facilities needed to 16
generate, transmit and distribute electricity, which are 17
expected to total over $1.2 billion over the years 2011 18
to 2014.7 19
20
Continued support for Tampa Electric’s financial 21
integrity and flexibility will be instrumental in 22
attracting the long-term capital necessary to fund these 23
projects in an effective manner. In addition, Tampa 24
Electric will be required to refinance maturing debt 25
issues and must meet short-term liquidity needs arising 26
from seasonal cash flows and ongoing construction 27
6 Standard & Poor’s Corporation, “U.S. Regulated Electric Utilities Head Into 2010 With Familiar Concerns,” RatingsDirect (Dec. 28, 2009).
7 TECO Energy, Inc., 2009 Form 10-K Report at 57.
DOCKET NO. ER10-____-000 EXHIBIT NO. TEC-200 FILED: 07/30/2010
15
programs. Tampa Electric’s exposure to storm restoration 1
activities magnifies the importance of maintaining 2
financial flexibility, which is essential to guarantee 3
access to the cash resources and interim financing 4
required to cover operating cash flows and fund required 5
investments in the utility system. 6
7
Q. Is the potential for energy market volatility an ongoing 8
concern for investors? 9
10
A. Yes. In recent years, utilities and their customers have 11
had to contend with dramatic fluctuations in energy costs 12
due to ongoing price volatility in the spot markets and 13
investors recognize the prospect of further turmoil in 14
energy markets. In times of extreme volatility, 15
utilities can quickly find themselves in a significant 16
under-recovery position with respect to power costs, 17
which can severely stress liquidity. Moody’s has warned 18
investors of ongoing exposure to “extremely volatile” 19
energy commodity costs, including purchased power prices, 20
which are heavily influenced by fuel costs,8 and Fitch 21
noted that rapidly rising energy costs created 22
vulnerability in the utility industry.9 23
8 Moody’s Investors Service, “Storm Clouds Gathering on the Horizon for the North American Electric Utility Sector,” Special Comment (Aug. 2007).
9 Fitch Ratings Ltd., “Staying Afloat: Downstream Liquidity in the Energy and Power Sectors,” Oil & Gas / Global Power Special Report (June 16, 2008).
DOCKET NO. ER10-____-000 EXHIBIT NO. TEC-200 FILED: 07/30/2010
16
For example, while coal has historically provided 1
relative stability with respect to fuel costs, the Energy 2
Information Administration (“EIA”), a statistical agency 3
of the U.S. Department of Energy (“DOE”), reported that 4
prices for Central and Northern Appalachia coal spiked 5
from approximately $45 per ton in June 2007 to over $140 6
per ton in September 2008, before falling back into the 7
$40 to $50 range in September 2009.10 8
9
The power industry and its customers have also had to 10
contend with dramatic fluctuations in gas costs due to 11
ongoing price volatility in the spot markets. Fitch has 12
highlighted the challenges that fluctuations in energy 13
prices can have for utilities and noted that: 14
15
The sharp run-up and subsequent collapse of 16 natural gas prices in 2008 is emblematic of the 17 extreme price volatility that characterizes the 18 commodity and is likely to persist in the 19 future.11 20
21
Moody’s concluded that natural gas “remains highly 22
volatile,” and warned that such price fluctuations “could 23
have a significant impact on a utility’s liquidity 24
10 Energy Information Administration, Coal News and Markets (Jun. 20 & Sep. 26, 2008, Oct. 13, 2009).
11 Fitch Ratings, Ltd., “U.S. Utilities, Power and Gas 2009 Outlook,” Global Power North American Special Report (Dec. 22, 2008).
DOCKET NO. ER10-____-000 EXHIBIT NO. TEC-200 FILED: 07/30/2010
17
profile.”12 1
2
While expectations for significantly lower power prices 3
reflect weaker fundamentals affecting current load and 4
fuel prices, investors recognize the potential that such 5
trends could quickly reverse. S&P observed that “short-6
term price volatility from numerous possibilities … is 7
always possible”,13 while Fitch noted, “uncertainty 8
regarding fuel prices, in particular natural gas costs, 9
has made planning for the future even more problematic.”14 10
Moody’s concluded that utilities remain exposed to 11
“volatile commodity prices … which can wreak havoc on 12
even the strongest utility liquidity profiles.”15 13
14
Q. What other financial pressures impact investors’ risk 15
assessment of electric utilities? 16
17
A. Investors are aware of the financial and regulatory 18
pressures faced by utilities associated with both rising 19
costs and the need to undertake significant capital 20
investments. As Moody’s observed: 21
12 Moody’s Investors Service, “Carbon Risks Becoming More Imminent for U.S. Electric Utility Sector,” Special Comment (March 2009).
13 Standard & Poor’s Corporation, “Top 10 Investor Questions: U.S. Regulated Electric Utilities,” RatingsDirect (Jan. 22, 2010).
14 Fitch Ratings, Ltd., “Electric Utility Capital Spending: The Show Will Go On,” Global Power U.S. and Canada Special Report (Oct. 14, 2009).
15 Moody’s Investors Service, “U.S. Electric Utilities Face Challenges Beyond Near-Term,” Industry Outlook (Jan. 2010).
DOCKET NO. ER10-____-000 EXHIBIT NO. TEC-200 FILED: 07/30/2010
18
Utilities remain exposed to large, long-term 1 capital investment challenges, volatile 2 commodity prices and legal judgments that can 3 wreak havoc on even the strongest liquidity 4 profiles.16 5
6
Similarly, S&P recently noted that cost increases and 7
capital projects, along with uncertain load growth, were 8
a significant challenge to the utility industry.17 Fitch 9
reached similar conclusions: 10
11
The combination of high capital expenditures 12 and relatively weak electricity demand will 13 continue to pressure credit quality and require 14 base rate increases in 2010 and beyond.18 15
16
As noted earlier, investors are aware that Tampa Electric 17
will undertake significant electric utility capital 18
expenditures. Providing the infrastructure necessary to 19
meet the energy needs of customers imposes additional 20
financial responsibilities and risks on Tampa Electric. 21
22
Q. Are environmental considerations also affecting 23
investors’ evaluation of electric utilities? 24
25
A. Yes. Although Tampa Electric’s exposure has been 26
16 Moody’s Investors Service, “U.S. Electric Utilities Face Challenges Beyond Near-Term,” Industry Outlook (Jan. 2010).
17 Standard & Poor’s Corporation, “Industry Economic And Ratings Outlook,” RatingsDirect (Feb. 2, 2010).
18 Fitch Ratings Ltd., “U.S. Utilities, Power, and Gas 2010 Outlook,” Global Power North America Special Report (Dec. 4, 2009).
DOCKET NO. ER10-____-000 EXHIBIT NO. TEC-200 FILED: 07/30/2010
19
moderated through its ability to recoup certain 1
environmental and conservation costs through a surcharge 2
recovery mechanism at the retail level in Florida, 3
utilities are confronting increased environmental 4
pressures that could impose significant uncertainties and 5
costs. In early 2007 S&P cited environmental mandates, 6
including emissions, conservation, and renewable 7
resources, as one of the top ten credit issues facing 8
U.S. utilities.19 Similarly, Moody’s noted that “the 9
prospect for new environmental emission legislation – 10
particularly concerning carbon dioxide – represents the 11
biggest emerging issue for electric utilities.”20 12
13
Compliance with these evolving standards will undoubtedly 14
require significant capital expenditures, especially for 15
utilities like Tampa Electric that depend significantly 16
on coal-fired generation. S&P concluded, “Although we 17
expect the cap-and-trade program to be economy wide and 18
affect a variety of sectors, it will disproportionately 19
affect the power sector.”21 S&P recently emphasized that 20
because of uncertainty over the details and timing of 21
future limits on CO2 emissions, existing ratings do not 22
19 Standard & Poor’s Corporation, “Top Ten Credit Issues Facing U.S. Utilities,” RatingsDirect (Jan. 29, 2007).
20 Moody’s Investors Service, “U.S. Investor-Owned Electric Utilities,” Industry Outlook (Jan. 2009).
21 Standard & Poor’s Corporation, “The Potential Credit Impact Of Carbon Cap-And-Trade Legislation On U.S. Companies,” RatingsDirect (Sep. 14, 2009).
DOCKET NO. ER10-____-000 EXHIBIT NO. TEC-200 FILED: 07/30/2010
20
fully reflect the impact of carbon risks.22 1
2
Q. Have investors recognized that electric utilities face 3
additional risks because of the impact of industry 4
restructuring on transmission operations? 5
6
A. Yes. Transmission operations have become increasingly 7
complex, and investors have recognized that difficulties 8
in obtaining permits and uncertainty over the adequacy of 9
allowed rates of return have contributed to heightened 10
risk and fueled concerns regarding the adequacy of 11
investment in the transmission sector of the electric 12
power industry. 13
14
At the same time, the development of competitive 15
wholesale power markets has resulted in increased demand 16
for transmission resources. Concerns regarding the need 17
to encourage further investment in the transmission 18
sector were exemplified by the Commission’s observations 19
in Order No. 679:23 20
21
[I]nvestment in transmission facilities in real 22 dollar terms declined significantly between 23 1975 and 1998. Although the amount of 24
22 Id.
23 Promoting Transmission Investment through Pricing Reform, Order No. 679, FERC Stats. & Regs. ¶ 31,222 (“Order No. 679”), order on reh’g, Order No. 679-A, FERC Stats. & Regs.¶ 31,236 (2006), order on reh’g, 119 FERC ¶ 61,062 (2007).

DOCKET NO. ER10-____-000 EXHIBIT NO. TEC-200 FILED: 07/30/2010
21
investment has increased somewhat in the past 1 few years, data for the most recent year 2 available, 2003, shows investment levels still 3 below the 1975 level in real dollars. This 4 decline in transmission investment in real 5 dollars has occurred while the electric load 6 using the nation’s grid more than doubled. 7 Further, the record shows that the growth rate 8 in transmission mileage since 1999 is not 9 sufficient to meet the expected 50 percent 10 growth in consumer demand for electricity over 11 the next two decades.24 12
13
The challenges posed by an increasingly complex 14
marketplace heighten the uncertainties associated with 15
transmission operations while requiring the commitment of 16
significant new capital investment to maintain and 17
enhance service capabilities. 18
19
Impact of Capital Market Conditions 20
Q. What are the implications of recent capital market 21
conditions? 22
23
A. The deep financial and real estate crisis that the 24
country experienced in late 2008, and continuing into 25
2009 led to unprecedented price fluctuations in the 26
capital markets as investors dramatically revised their 27
risk perceptions and required returns. As a result of 28
investors’ trepidation to commit capital, stock prices 29
24 Order No. 679 at P 10.
DOCKET NO. ER10-____-000 EXHIBIT NO. TEC-200 FILED: 07/30/2010
22
declined sharply while the yields on corporate bonds 1
experienced a dramatic increase. 2
3
With respect to utilities specifically, as of April 2010, 4
the Dow Jones Utility Average stock index remained almost 5
30 percent below the previous high reached in May 2008. 6
This sell-off in common stocks and sharp fluctuations in 7
utility bond yields reflect the fact that the utility 8
industry was not immune to the impact of financial market 9
turmoil and the ongoing economic downturn. As the Edison 10
Electric Institute (“EEI”) noted in a letter to 11
congressional representatives as the financial crisis 12
intensified, capital market uncertainties have serious 13
implications for utilities and their customers: 14
15
In the wake of the continuing upheaval on Wall 16 Street, capital markets are all but 17 immobilized, and short-term borrowing costs to 18 utilities have already increased substantially. 19 If the financial crisis is not resolved 20 quickly, financial pressures on utilities will 21 intensify sharply, resulting in higher costs to 22 our customers and, ultimately, could compromise 23 service reliability.25 24
25
Similarly, an October 1, 2008 Wall Street Journal report 26
confirmed that utilities had been forced to delay 27
25 Letter to House of Representatives, Thomas R. Kuhn, President, Edison Electric Institute (Sep. 24, 2008).
DOCKET NO. ER10-____-000 EXHIBIT NO. TEC-200 FILED: 07/30/2010
23
borrowing or pursue more costly alternatives to raise 1
funds.26 In December 2008, Fitch confirmed “sharp 2
repricing of and aversion to risk in the investment 3
community,” and noted that the disruptions in financial 4
markets and the fundamental shift in investors’ risk 5
perceptions had increased the cost of capital for 6
utilities.27 7
8
More recently, in assessing the impact of the downturn on 9
the utility sector, Fitch concluded, “While utilities 10
maintained relatively good market access during the 11
credit crisis, the cost of capital is higher than prior 12
to the credit crisis, and bank credit remains relatively 13
tight.”28 Similarly, S&P noted that while utilities are 14
expected to maintain access to credit in 2010, such 15
access will be “on more demanding terms than in previous 16
years,”29 with Moody’s noting that “costs associated with 17
credit facilities have increased significantly.”30 18
19
Q. How do interest rates on long-term bonds compare with 20
26 Smith, Rebecca, “Corporate News: Utilities’ Plans Hit by Credit Markets,” Wall Street Journal at B4 (Oct. 1, 2008).
27 Fitch Ratings Ltd., “U.S. Utilities, Power and Gas 2009 Outlook,” Global Power North America Special Report (Dec. 22. 2008).
28 Fitch Ratings Ltd., “Electric Utility Capital Spending: The Show Will Go On,” Global Power U.S. and Canada Special Report (Oct. 14, 2009).
29 Standard & Poor’s Corporation, “Ratings Roundup: Ratings Trend In Electric Utility Sector Turns More Negative In First Quarter Of 2010,” RatingsDirect (Apr. 16, 2010).
30 Moody’s Investors Service, “U.S. Electric Utilities Face Challenges Beyond Near-Term,” Industry Outlook (Jan. 2010).
DOCKET NO. ER10-____-000 EXHIBIT NO. TEC-200 FILED: 07/30/2010
24
those projected for the next few years? 1
2
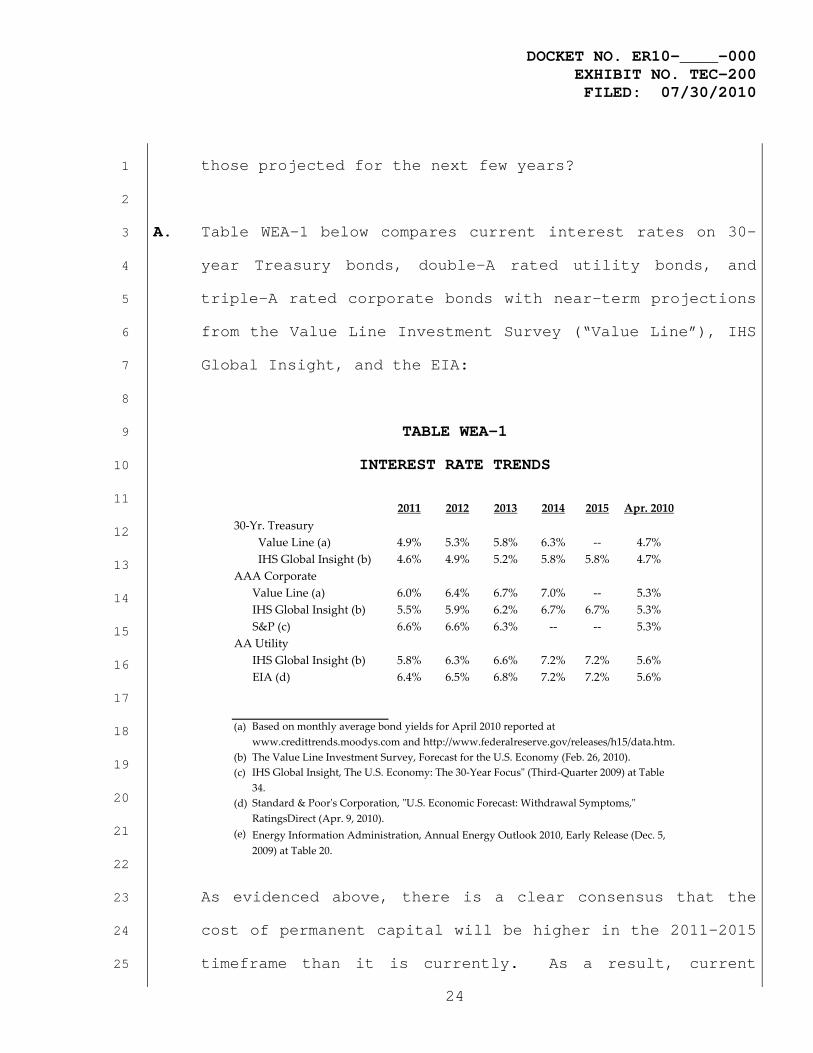
A. Table WEA-1 below compares current interest rates on 30-3
year Treasury bonds, double-A rated utility bonds, and 4
triple-A rated corporate bonds with near-term projections 5
from the Value Line Investment Survey (“Value Line”), IHS 6
Global Insight, and the EIA: 7
8
TABLE WEA-1 9
INTEREST RATE TRENDS 10
11
12
13
14
15
16
17
18
19
20
21
22
As evidenced above, there is a clear consensus that the 23
cost of permanent capital will be higher in the 2011-2015 24
timeframe than it is currently. As a result, current 25
2011 2012 2013 2014 2015 Apr. 201030‐Yr. Treasury
Value Line (a) 4.9% 5.3% 5.8% 6.3% ‐‐ 4.7% IHS Global Insight (b) 4.6% 4.9% 5.2% 5.8% 5.8% 4.7%
AAA CorporateValue Line (a) 6.0% 6.4% 6.7% 7.0% ‐‐ 5.3%IHS Global Insight (b) 5.5% 5.9% 6.2% 6.7% 6.7% 5.3%S&P (c) 6.6% 6.6% 6.3% ‐‐ ‐‐ 5.3%
AA UtilityIHS Global Insight (b) 5.8% 6.3% 6.6% 7.2% 7.2% 5.6%EIA (d) 6.4% 6.5% 6.8% 7.2% 7.2% 5.6%
(a)
(b) The Value Line Investment Survey, Forecast for the U.S. Economy (Feb. 26, 2010).(c)
(d)
(e)
Based on monthly average bond yields for April 2010 reported at www.credittrends.moodys.com and http://www.federalreserve.gov/releases/h15/data.htm.
Standard & Poorʹs Corporation, ʺU.S. Economic Forecast: Withdrawal Symptoms,ʺ RatingsDirect (Apr. 9, 2010).Energy Information Administration, Annual Energy Outlook 2010, Early Release (Dec. 5, 2009) at Table 20.
IHS Global Insight, The U.S. Economy: The 30‐Year Focusʺ (Third‐Quarter 2009) at Table 34.
DOCKET NO. ER10-____-000 EXHIBIT NO. TEC-200 FILED: 07/30/2010
25
cost of capital estimates are likely to understate 1
investors’ requirements at the time the outcome of this 2
proceeding becomes effective and beyond. 3
4
Q. What do these events imply with respect to the ROE for 5
Tampa Electric? 6
7
A. No one knows the future of our complex global economy. 8
We know that the financial crisis had been building for a 9
long time, and few predicted that the economy would fall 10
as rapidly as it has, or that corporate bond yields would 11
fluctuate as dramatically as they did. While conditions 12
in the economy and capital markets appear to have 13
stabilized, investors are apt to react swiftly and 14
negatively to any future signs of trouble in the 15
financial system or economy. As the Wall Street Journal 16
noted in February: 17
18
Stocks pulled out of a 167-point hole with a 19 late rally Friday, capping a wild week 20 reminiscent of the most volatile days of the 21 credit crisis. … It was a return to the unusual 22 relationships, or correlations, seen at major 23 flash points over the past two years when 24 investors fled risky assets and jumped into 25 safe havens. This market behavior, which has 26 reasserted itself repeatedly since the 27 financial crisis began, suggests that 28 investment decisions are still being driven 29 more by government support and liquidity 30
DOCKET NO. ER10-____-000 EXHIBIT NO. TEC-200 FILED: 07/30/2010
26
concerns than market fundamentals.31 1
2
More recently, the European debt crisis has sparked 3
renewed share price volatility and stress in the credit 4
markets. Given the importance of reliable utility 5
service for customers and the economy, it would be unwise 6
to ignore investors’ increased sensitivity to risk in 7
evaluating a fair ROE for Tampa Electric in this case. 8
9
CAPITAL MARKET ESTIMATES 10
Q. What is the purpose of this section of your testimony? 11
12
A. In this section, I develop DCF estimates of the cost of 13
equity for proxy groups of electric utilities. First, I 14
address the concept of the cost of equity, along with the 15
risk-return tradeoff principle fundamental to capital 16
markets. Next, I describe the specific DCF analyses I 17
conducted to estimate the current cost of equity for the 18
alternative proxy groups. 19
20
Cost of Equity Concept 21
Q. What role does the return on common equity play in a 22
utility’s rates? 23
24
31 Gongloff, Mark, “Stock Rebound Is a Crisis Flashback – Late Surge Recalls Market’s Volatility at Peak of Credit Difficulties; Unusual Correlations,” Wall Street Journal at B1 (Feb. 6, 2010).
DOCKET NO. ER10-____-000 EXHIBIT NO. TEC-200 FILED: 07/30/2010
27
A. The return on common equity is the cost of inducing and 1
retaining investment in the utility’s physical plant and 2
assets. This investment is necessary to finance the 3
asset base needed to provide utility service. Competition 4
for investor funds is intense and investors are free to 5
invest their funds wherever they choose. They will commit 6
money to a particular investment only if they expect it 7
to produce a return commensurate with those from other 8
investments with comparable risks. 9
10
Q. What fundamental economic principle underlies this cost 11
of equity concept? 12
13
A. The fundamental economic principle underlying the cost of 14
equity concept is the notion that investors are risk 15
averse. In capital markets where relatively risk-free 16
assets are available (e.g., U.S. Treasury securities), 17
investors can be induced to hold riskier assets only if 18
they are offered a premium, or additional return, above 19
the rate of return on a risk-free asset. Since all 20
assets compete with each other for investor funds, 21
riskier assets must yield a higher expected rate of 22
return than safer assets to induce investors to hold 23
them. 24
25
DOCKET NO. ER10-____-000 EXHIBIT NO. TEC-200 FILED: 07/30/2010
28
Given this risk-return tradeoff, the required rate of 1
return (k) from an asset (i) can generally be expressed 2
as 3
ki = Rf +RPi 4
5
where: Rf = Risk-free rate of return, and 6
RPi = Risk premium required to hold 7
riskier asset i. 8
9
Thus, the required rate of return for a particular asset 10
is a function of: (1) the yield on risk-free assets and 11
(2) the asset’s relative risk, with investors demanding 12
correspondingly larger risk premiums for bearing greater 13
risk. 14
15
Q. Is there evidence that the risk-return tradeoff principle 16
actually operates in the capital markets? 17
18
A. Yes. The risk-return tradeoff can be readily documented 19
in segments of the capital markets where required rates 20
of return can be directly inferred from market data and 21
where generally accepted measures of risk exist. Bond 22
yields, for example, reflect investors’ expected rates of 23
return, and bond ratings measure the risk of individual 24
bond issues. The observed yields on government 25
DOCKET NO. ER10-____-000 EXHIBIT NO. TEC-200 FILED: 07/30/2010
29
securities, which are considered free of default risk, 1
and bonds of various rating categories demonstrate that 2
the risk-return tradeoff does, in fact, exist in the 3
capital markets. 4
5
Q. Does the risk-return tradeoff observed with fixed income 6
securities extend to common stocks and other assets? 7
8
A. It is generally accepted that the risk-return tradeoff 9
evidenced with long-term debt extends to all assets. 10
Documenting the risk-return tradeoff for assets other 11
than fixed income securities, however, is complicated by 12
two factors. First, there is no standard measure of risk 13
applicable to all assets. Second, for most assets – 14
including common stock – required rates of return cannot 15
be directly observed. Yet there is every reason to 16
believe that investors exhibit risk aversion in deciding 17
whether or not to hold common stocks and other assets, 18
just as when choosing among fixed-income securities. 19
20
Q. Is this risk-return tradeoff limited to differences 21
between firms? 22
23
A. No. The risk-return tradeoff principle applies not only 24
to investments in different firms, but also to different 25

DOCKET NO. ER10-____-000 EXHIBIT NO. TEC-200 FILED: 07/30/2010
30
securities issued by the same firm. The securities issued 1
by a utility vary considerably in risk because they have 2
different characteristics and priorities. Long-term debt 3
secured by a mortgage on property is senior among all 4
capital in its claim on a utility’s net revenues and is, 5
therefore, the least risky. Following first mortgage 6
bonds are other debt instruments also holding contractual 7
claims on the utility’s net revenues, such as 8
subordinated debentures. The last investors in line with 9
respect to a claim on the utility’s assets are common 10
shareholders. They receive only the net revenues, if any, 11
which remain after all other claimants have been paid. 12
As a result, the rate of return that investors require 13
from a utility’s common stock, the most junior and 14
riskiest of its securities, must be considerably higher 15
than the yield offered by the utility’s senior, long-term 16
debt. 17
18
Q. What does the above discussion imply with respect to 19
estimating the cost of equity? 20
21
A. Although the cost of equity cannot be observed directly, 22
it is a function of the returns available from other 23
investment alternatives and the risks to which the equity 24
capital is exposed. Because it is unobservable, the cost 25
DOCKET NO. ER10-____-000 EXHIBIT NO. TEC-200 FILED: 07/30/2010
31
of equity for a particular utility must be estimated by 1
analyzing information about capital market conditions 2
generally, assessing the relative risks of the company 3
specifically, and employing various quantitative methods 4
that focus on investors’ required rates of return. These 5
various quantitative methods typically attempt to infer 6
investors’ required rates of return from stock prices, 7
interest rates, or other capital market data. 8
9
Q. What method did you use to evaluate the cost of equity 10
for Tampa Electric? 11
12
A. Consistent with FERC precedent, my analysis applied the 13
Commission’s one-step DCF methodology for electric 14
utilities. In recognition of the fact that no single 15
approach to estimating a utility’s cost of equity can be 16
regarded as definitive, I also developed an alternative 17
DCF benchmark using a proxy group of non-utility 18
companies. In addition, I also evaluated a fair ROE 19
using an earnings approach based on investors’ current 20
expectations in the capital markets. 21
22
Development and Selection of a Proxy Group 23
Q. How did you implement the DCF method to estimate the cost 24
of common equity for Tampa Electric? 25
DOCKET NO. ER10-____-000 EXHIBIT NO. TEC-200 FILED: 07/30/2010
32
A. Application of the DCF model to estimate the cost of 1
equity requires observable capital market data, such as 2
stock prices. Tampa Electric does not have publicly 3
traded common stock, but even for a publicly traded firm, 4
the cost of equity can only be estimated. As a result, 5
applying quantitative models using observable market data 6
produces only a result that inherently includes some 7
degree of observation error. Thus, the accepted approach 8
to increase confidence in the results is to apply the DCF 9
model to a proxy group of publicly traded companies that 10
investors regard as risk comparable. The results of the 11
analysis on the sample of companies are relied upon to 12
establish a range of reasonableness for the cost of 13
equity for the specific company at issue. 14
15
Q. What specific proxy group did you rely on for your 16
analyses? 17
18
A. Following the same general approach approved by the 19
Commission in Bangor Hydro and Westar,32 my analyses 20
focused on regional utilities located in adjacent 21
reliability organizations. My initial proxy group 22
consisted of the investor-owned members of FRCC and SERC 23
with publicly traded stock. Excluded from my analyses 24
32 Westar Energy, Inc., 122 FERC ¶ 61,268 at P 94 (2008) (“Westar”).
DOCKET NO. ER10-____-000 EXHIBIT NO. TEC-200 FILED: 07/30/2010
33
was one firm (E.ON AG) for which no data from IBES or 1
Value Line was currently available.33 Finally, I also 2
verified that Value Line, S&P, and IBES classify all of 3
the proxy companies predominantly as electric utilities.34 4
I refer to the resulting group of nine utilities as the 5
“Regional Proxy Group.” 6
7
Q. Has the Commission previously considered membership in a 8
regional reliability or transmission organization when 9
establishing proxy groups? 10
11
A. Yes. The ultimate goal of assembling a proxy group for 12
purposes of performing the DCF analysis is to calculate a 13
return for the utility in question that is analogous to 14
returns on comparable investments with a similar risk 15
profile.35 The Commission has recognized that being 16
located in the same geographical market is a relevant 17
factor in determining whether companies face comparable 18
risks. Consideration of geography as a proxy group 19
criterion first arose where the Commission established a 20
single ROE that was to be implemented across an entire 21
regional organization, as was the case in Midwest ISO.36 22
33 Formerly I/B/E/S International, Inc., IBES growth rates are now compiled and published by Thomson Reuters.
34 See, e.g., Tallgrass Transmission, LLC, 125 FERC ¶ 61,248 at P 77 (2008) (“Tallgrass”).
35 See, e.g., Southern California Edison Co., at 61,266 (2000).
36 Midwest ISO Inc., 100 FERC ¶ 61,292 (2002).
DOCKET NO. ER10-____-000 EXHIBIT NO. TEC-200 FILED: 07/30/2010
34
Subsequently, in cases involving services provided within 1
the context of well-integrated and coordinated market 2
operations, the Commission has accepted proxy groups 3
composed of members of adjacent regional transmission 4
organizations.37 In other words, in the specific case 5
where participating utilities face comparable risks due 6
to a high degree of similarity in market and regulatory 7
circumstances, geography has been accepted as a valid 8
proxy for risks. 9
10
Similarly, the Commission’s decision in Atlantic Path 15 11
premised its ROE findings on DCF results for the 12
applicant’s proposed proxy group of companies within the 13
footprint of the Western Electricity Coordinating Council 14
(“WECC”).38 The Atlantic Path 15 decision observed that 15
WECC utilities are electrically integrated and that being 16
located in the same geographic market is a relevant 17
factor to consider in determining whether companies face 18
similar risks.39 In Atlantic Path 15, the Commission 19
reasoned that adopting a region-wide proxy group, 20
modified through application of additional risk-based 21
screens, “will provide a significant measure of 22
37 See, e.g., Bangor Hydro; Potomac-Appalachian Transmission Highline, LLC, 122 FERC ¶ 61,188 (2008) (“PATH”); Westar; Virginia Electric Power Co., 123 FERC ¶ 61,098 (2008) (“VEPCO”).
38 Atlantic Path 15, 122 FERC ¶ 61,135 at P 19 (2008) (“Atlantic Path 15”).
39 Id. at PP 25-26.
DOCKET NO. ER10-____-000 EXHIBIT NO. TEC-200 FILED: 07/30/2010
35
regulatory certainty” and “improve the Commission’s 1
ability to decide cases quickly for entities seeking 2
financing of necessary infrastructure.”40 The decision 3
also suggested that the use of such proxy group might 4
“simplify rate proceedings and reduce litigation costs.”41 5
Thus, while there is no general policy requiring that 6
proxy companies be chosen based on geography, in those 7
instances where there is a clear link between location 8
and key operational characteristics that help to define 9
risks in the minds of investors, membership in a regional 10
reliability or transmission organization can serve as 11
valid criteria in defining proxy companies. 12
13
Q. Does the use of the Regional Proxy Group to establish a 14
reasonable ROE for Tampa Electric follow the Commission’s 15
precedent? 16
17
A. Yes. Consistent with FERC’s guidance, this proxy group 18
is composed of utilities “with a direct correlation” to 19
Tampa Electric and “the broader markets” with which Tampa 20
Electric interacts.42 In fact, geographic location is a 21
primary characteristic that shapes the risks and 22
challenges faced by Tampa Electric and its investors. 23
40 Id. at P 23.
41 Id.
42 Duquesne Light Co., 118 FERC ¶ 61,087 at P 73 (2007).
DOCKET NO. ER10-____-000 EXHIBIT NO. TEC-200 FILED: 07/30/2010
36
Because of its location on the Florida peninsula, Tampa 1
Electric is exposed to potential fuel supply 2
interruptions and transmission disturbances, and the 3
Company faces the ever-present danger of catastrophic 4
damage from recurring tropical storms. 5
6
Moreover, use of the Regional Proxy Group to determine 7
the ROE range of reasonableness is also consistent with 8
the high degree of integration between the FRCC and SERC 9
members, with three of the four publicly traded FRCC 10
member utilities also being members of SERC. Given the 11
history of regional planning, coordination and system 12
operations among these utilities and within the region, 13
there is a very direct link in the minds of investors 14
between Tampa Electric’s operating environment and that 15
of the other members of the FRCC and SERC. Reference to 16
the Regional Proxy Group also recognizes that these firms 17
compete for investment funds from the same pool of 18
potential capital. Considering these common traits, the 19
companies in the Regional Proxy Group provide a sound 20
basis on which to estimate investors’ required returns 21
and establish the ROE range of reasonableness for Tampa 22
Electric. 23
24
Q. Did your analysis also consider reported risk measures? 25
DOCKET NO. ER10-____-000 EXHIBIT NO. TEC-200 FILED: 07/30/2010
37
A. Yes. My evaluation also included a comparison of four 1
objective measures of the investment risks associated 2
with bonds and common stocks – S&P’s corporate credit 3
rating and Value Line’s Safety Rank, Financial Strength 4
Rating, and beta. 5
6
Credit ratings are assigned by independent rating 7
agencies to provide investors with a broad assessment of 8
the creditworthiness of a firm. Because the rating 9
agencies’ evaluation includes virtually all of the 10
factors normally considered important in assessing a 11
firm’s relative credit standing, corporate credit ratings 12
provide a broad measure of overall investment risk that 13
is readily available to investors. Widely cited in the 14
investment community and referenced by investors as an 15
objective measure of risk, credit ratings are also 16
frequently used as a primary risk indicator in 17
establishing proxy groups to estimate the cost of equity. 18
19
Apart from the broad assessment of investment risk 20
provided by credit ratings, other quality rankings 21
published by investment advisory services also provide 22
relative assessments of risk that are considered by 23
investors in forming their expectations. Given that Value 24
Line is perhaps the most widely available source of 25
DOCKET NO. ER10-____-000 EXHIBIT NO. TEC-200 FILED: 07/30/2010
38
investment advisory information, its rankings provide 1
useful guidance regarding the risk perceptions of 2
investors. The Safety Rank is Value Line’s primary risk 3
indicator and ranges from “1” (Safest) to “5” (Most 4
Risky). This overall risk measure is intended to capture 5
the total risk of a stock, and incorporates elements of 6
stock price stability and financial strength. The 7
Financial Strength Rating is designed as a guide to 8
overall financial strength and creditworthiness, with the 9
key inputs including financial leverage, business 10
volatility measures, and company size. Value Line’s 11
Financial Strength Ratings range from “A++” (strongest) 12
down to “C” (weakest) in nine steps. Finally, Value 13
Line’s beta, which measures the volatility of a 14
security's price relative to the market as a whole. A 15
stock that tends to respond less to market movements has 16
a beta less than 1.00, while stocks that tend to move 17
more than the market have betas greater than 1.00. 18
19
Q. What do these criteria indicate with respect to the 20
investment risks of the Regional Proxy Group and Tampa 21
Electric? 22
23
A. The risk measures for the Regional Proxy Group are shown 24
on Exhibit No. TEC-202. The average S&P corporate credit 25
DOCKET NO. ER10-____-000 EXHIBIT NO. TEC-200 FILED: 07/30/2010
39
rating for the utilities in the Regional Proxy Group is 1
“BBB+”, with four companies having ratings in the single-2
A category. Meanwhile, the average Value Line Safety 3
Rank for the utilities in the Regional Proxy Group is 4
“2”, while the Financial Strength Ratings for the proxy 5
firms averaged “B++”. Finally, the average beta value 6
for the Regional Proxy Group is 0.70. As discussed 7
earlier, Tampa Electric is rated “BBB” by S&P. Value 8
Line has assigned TECO Energy a Safety Rank of “3” and a 9
Financial Strength Rating of “B”, and reports a beta 10
value of 0.85.43 Based on these criteria, which reflect 11
objective, published indicators that incorporate 12
consideration of a broad spectrum of risks, including 13
financial and business position and exposure to company 14
specific factors, investors are likely to regard the 15
risks and prospects of the Utility Proxy Group as being 16
lower than those of Tampa Electric. 17
18
Q. Did you also evaluate DCF results after narrowing the 19
Regional Proxy Group based on credit ratings? 20
21
A. Yes. In developing a regional proxy group, the Commission 22
has also recognized that it may be appropriate to 23
43 Because Tampa Electric has no publicly traded common stock, I referenced the Value Line risk measures for its parent, TECO Energy.
DOCKET NO. ER10-____-000 EXHIBIT NO. TEC-200 FILED: 07/30/2010
40
eliminate firms based on reference to corporate credit 1
ratings. Consistent with this practice, I also examined 2
the results of the Commission’s DCF model after screening 3
the Regional Proxy Group to eliminate utilities with 4
corporate credit ratings outside a “comparable risk 5
band”, which the Commission has interpreted as one 6
“notch” higher or lower than the corporate ratings of the 7
utility at issue. With TECO Energy being rated “BBB” by 8
S&P, application of this criterion resulted in a proxy 9
group of five electric utilities with corporate credit 10
ratings in the “BBB-” to “BBB+” range, which I refer to 11
as the “Ratings Screen Proxy Group”. These utilities are 12
shown on Exhibit No. TEC-203. 13
14
Q. Do you believe that it is necessary to impose this credit 15
ratings screen in defining a proxy group for Tampa 16
Electric? 17
18
A. No. The ultimate goal of assembling a proxy group for 19
purposes of performing the DCF analysis is to calculate a 20
return for the utility in question that is analogous to 21
returns on comparable investments with a similar risk 22
profile. In cases involving services provided within the 23
context of well-integrated and coordinated market 24
operations, the Commission has recognized that geography 25
DOCKET NO. ER10-____-000 EXHIBIT NO. TEC-200 FILED: 07/30/2010
41
can serve as a proxy for comparable risk. In other 1
words, in geographic markets where participating 2
utilities face comparable risks due to similar market 3
circumstances, membership in adjacent regional 4
organizations has been accepted as a valid proxy for 5
risks in the context of establishing rates for wholesale 6
utility services. 7
8
I agree that credit ratings are a meaningful measure of 9
investment risks and that the overall risk profile of the 10
Regional Proxy Group should be considered, as I have 11
done; but narrowing a geographically-based proxy group 12
based on additional criteria runs counter to the 13
fundamental notion underlying this approach. Namely, 14
that participation in integrated, adjacent wholesale 15
markets with similar regulatory and operating 16
environments is a valid proxy for risk. The Regional 17
Proxy Group is consistent with the Commission’s 18
determination that members of well-integrated regional 19
markets face similar risks because of common 20
characteristics that are related to geographical 21
location. Moreover, as I demonstrated earlier, the 22
average investment risks attributable to the Regional 23
Proxy Group is generally comparable to those that 24
investors associate with Tampa Electric. Under these 25
DOCKET NO. ER10-____-000 EXHIBIT NO. TEC-200 FILED: 07/30/2010
42
circumstances, there is no need for additional screening 1
criteria. 2
3
Q. What potential problems are associated with employing 4
credit ratings to further narrow the Regional Proxy 5
Group? 6
7
A. If membership in regional organizations and geographic 8
proximity are accepted as the primary risk factors in 9
determining whether a utility should be included in a 10
proxy group, imposing additional screens can weaken the 11
ability of the proxy group to serve its intended purpose 12
of most closely approximating the risks entailed in 13
providing jurisdictional wholesale utility service. 14
Narrowing the regional proxy groups using additional risk 15
screens, such as corporate credit ratings, increases the 16
potential that the resulting subset will be insufficient 17
to reflect industry conditions and investor expectations 18
and ROE requirements. As noted earlier, the cost of 19
equity is inherently unobservable and because the DCF 20
model depends on estimates it is subject to measurement 21
error, with FERC having acknowledged the pitfalls of a 22
constrained proxy group.44 23
44 Application of the credit rating screen reduces the size of the proxy group, and while the
Commission has on occasion accepted proxy groups as small as four companies, FERC has generally recognized that a constrained proxy group “may not be representative of industry conditions.” See, e.g., Enbridge Pipelines (KPC), 100 FERC ¶ 61,260 at P 237 (2002) (citing Transcontinental Gas Pipe Line Corp., 60 FERC ¶ 63,001, at 65,041, aff'd in part, rev'd in part, 60 FERC ¶ 61,246, at 61,826 (1992), rev'd and remanded, N. C. Util. v. FERC, 42 F.3d 659 (1994), order on reh’g, Transco, 71 FERC ¶ 61,305, at 62,195 (1995)).
DOCKET NO. ER10-____-000 EXHIBIT NO. TEC-200 FILED: 07/30/2010
43
Even though corporate credit ratings provide a widely 1
accepted, objective benchmark for investment risks, the 2
inherent limitations of the DCF approach mean that the 3
potential to misjudge investors’ required return 4
increases as the size of the proxy group shrinks. In a 5
perfect world, bond ratings and DCF results would always 6
be inversely correlated, with DCF estimates for higher 7
rated companies being lower than for utilities with 8
inferior ratings. But because the true cost of equity is 9
unobservable and our estimating tools (e.g., applications 10
of the DCF model based on observable data) provide 11
imperfect readings, this is not always the case. 12
Consider the Commission’s decision in VEPCO, for example. 13
There, the Commission excluded FPL Group, Inc. (“FPL 14
Group,” now NextEra Energy, Inc.) from the proxy group 15
because its credit rating indicated lower risk than the 16
top threshold of its “BBB” to “A-” range, while the 17
average DCF estimate implied for FPL Group exceeded the 18
10.9 percent ROE determined based on the remaining proxy 19
companies.45 Conversely, while Central Vermont Public 20
Service Corporation was eliminated because its lower bond 21
rating was indicative of greater risk, its implied 22
average DCF estimate of 9.6 percent fell 130 basis points 23
below the 10.9 percent estimate for the proxy group. 24
Because the application of quantitative methods to 25
45 VEPCO at P 63; Supplemental Protest of Central Virginia Electric Cooperative, Craig-Botetourt Electric Cooperative, North Carolina Electric Membership Corporation, and Old Dominion Electric Cooperative, Exhibit INC-1.
DOCKET NO. ER10-____-000 EXHIBIT NO. TEC-200 FILED: 07/30/2010
44
estimate the cost of equity is inherently imprecise, the 1
potential for anomalous conclusions rises as the proxy 2
group is narrowed. As a result, while imposing an 3
additional risk screen may impart a patina of refinement, 4
it is more likely to increase, rather than ameliorate, 5
the potential for error. 6
7
DCF Model 8
Q. How is the DCF model used to estimate the cost of equity? 9
10
A. DCF models attempt to replicate the market valuation 11
process that sets the price investors are willing to pay 12
for a share of a company’s stock. The model rests on the 13
assumption that investors evaluate the risks and expected 14
rates of return from all securities in the capital 15
markets. Given these expectations, the price of each 16
stock is adjusted by the market until investors are 17
adequately compensated for the risks they bear. 18
Therefore, we can look to the market to determine what 19
investors believe a share of common stock is worth. By 20
estimating the cash flows investors expect to receive 21
from the stock in the way of future dividends and capital 22
gains, we can calculate their required rate of return. 23
Thus, the cash flows that investors expect from a stock 24
are estimated, and given the stock’s current market 25
DOCKET NO. ER10-____-000 EXHIBIT NO. TEC-200 FILED: 07/30/2010
45
price, we can back into the discount rate, or cost of 1
equity, that investors implicitly used in bidding the 2
stock to that price. 3
4
Q. What market valuation process underlies DCF models? 5
6
A. DCF models assume that the price of a share of common 7
stock is equal to the present value of the expected cash 8
flows (i.e., future dividends and stock price) that will 9
be received while holding the stock, discounted at 10
investors’ required rate of return. Thus, the cost of 11
equity is the discount rate that equates the current 12
price of a share of stock with the present value of all 13
expected cash flows from the stock. 14
15
Q. What form of the DCF model is customarily used to 16
estimate the cost of equity in rate cases? 17
18
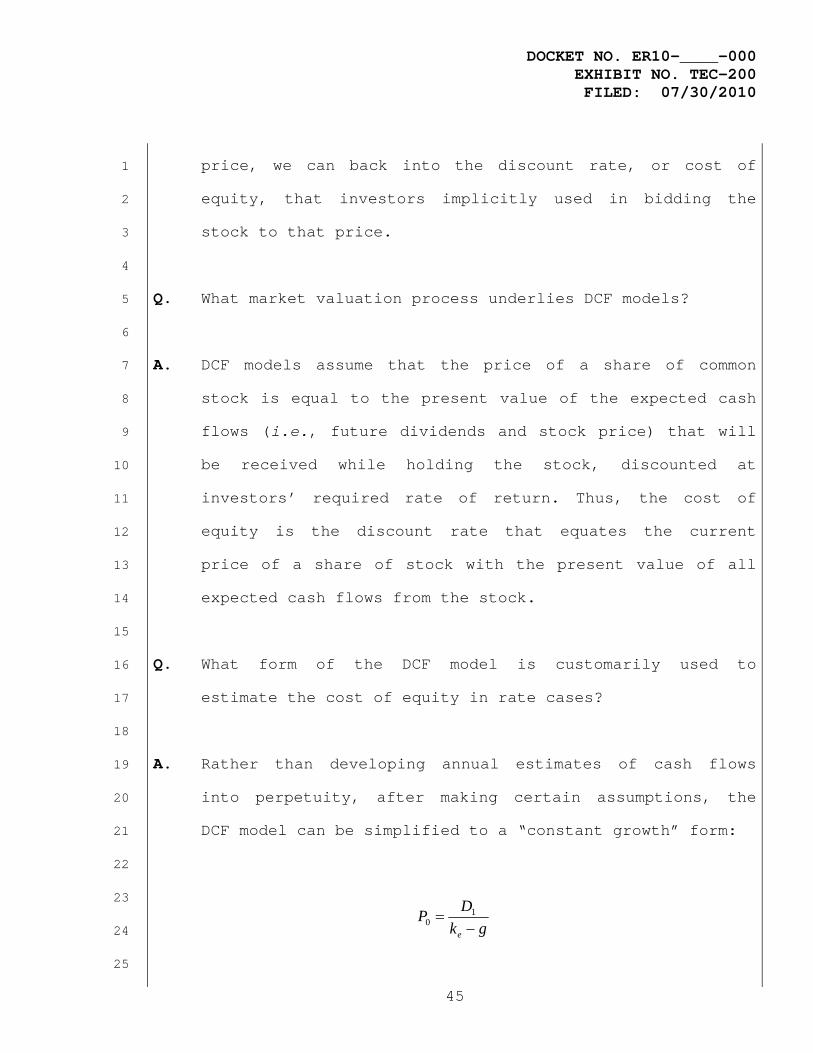
A. Rather than developing annual estimates of cash flows 19
into perpetuity, after making certain assumptions, the 20
DCF model can be simplified to a “constant growth” form: 21
22
23
24
25
gkDP
e −= 1
0
DOCKET NO. ER10-____-000 EXHIBIT NO. TEC-200 FILED: 07/30/2010
46
where: P0 = Current price per share; 1
D1 = Expected dividend per share in the 2 coming year; 3
ke = Cost of equity; 4 g = Investors’ long-term growth 5 expectations. 6
7
The cost of equity (ke) can be isolated by rearranging 8
terms: 9
10
11
12
This constant growth form of the DCF model recognizes 13
that the rate of return to stockholders consists of two 14
parts: 1) dividend yield (D1/P0); and 2) growth (g). In 15
other words, investors expect to receive a portion of 16
their total return in the form of current dividends and 17
the remainder through price appreciation. 18
19
Q. How did you calculate the dividend yield component of the 20
DCF model for the Regional Proxy Group? 21
22
A. Following Commission policy, average low and high 23
indicated dividend yields were calculated for each 24
electric utility during the six months October 2009 25
through March 2010. As indicated on Exhibit No. TEC-204, 26
these six-month average low and high historical dividend 27
gPDke +=
0
1
DOCKET NO. ER10-____-000 EXHIBIT NO. TEC-200 FILED: 07/30/2010
47
yields were also increased by one-half of the low and 1
high growth rates discussed subsequently (1 + 0.5g) to 2
convert them to adjusted dividend yields. 3
4
Q. What growth rates are used in the Commission's one-step 5
DCF method for electric utilities? 6
7
A. The one-step DCF method for electric utilities adopted by 8
the Commission employs two growth rates for each firm. 9
The first growth rate is a “sustainable” growth rate 10
calculated by the following formula: 11
12
g = br + sv 13
14
where: b = expected retention ratio; 15 r = expected earned rate of return; 16 s = percent of common equity expected to be 17
issued annually as new common stock; 18 v = equity accretion ratio. 19
20
The second growth rate is the IBES consensus five-year 21
earnings growth forecast. These two growth rates are 22
combined with the adjusted dividend yields to develop a 23
cost of equity range for each company. 24
25
Q. How did you calculate the sustainable growth rate? 26
27
DOCKET NO. ER10-____-000 EXHIBIT NO. TEC-200 FILED: 07/30/2010
48
A. For each electric utility, the expected retention ratio 1
(b) was calculated based on projected dividends and 2
earnings per share from Value Line for 2010, 2011, and 3
their 2013-2015 forecast horizon. Consistent with the 4
Commission’s DCF method, each firm's expected earned rate 5
of return (r) was based on Value Line’s end-of-year 6
forecasts.46 In Southern California Edison, the 7
Commission correctly recognized that if the rate of 8
return, or “r” component of the br+sv growth rate, is 9
based on end-of-year book values, such as those reported 10
by Value Line, it will understate actual returns because 11
of growth in common equity over the year.47 Accordingly, 12
consistent with the Commission’s findings and the theory 13
underlying this approach to estimating investors’ growth 14
expectations, an adjustment was incorporated to compute 15
an average rate of return.48 Finally, the percent of 16
common equity expected to be issued annually as new 17
common stock(s) was equal to the product of the projected 18
market-to-book ratio and growth in common shares 19
outstanding over Value Line’s forecast horizon, while the 20
equity accretion rate (v) was computed as 1 minus the 21
46 Bangor Hydro-Elec. Co., 122 FERC ¶ 61,265 at P 22 (2008).
47 Southern California Edison at 61,263 and n. 38.
48 Use of an average return in developing the sustainable growth rate is well supported. See, e.g., Morin, Roger A., “Regulatory Finance: Utilities’ Cost of Capital,” Public Utilities Reports, Inc. (1994), which discusses the need to adjust Value Line’s end-of-year data, consistent with the Commission’s findings in Southern California Edison. The Commission affirmed the need for this adjustment to “r” in Bangor Hydro Elec. Co., 122 FERC ¶ 61,265 (2008).
DOCKET NO. ER10-____-000 EXHIBIT NO. TEC-200 FILED: 07/30/2010
49
inverse of the projected market-to-book ratio. The 1
calculation of the sustainable growth rate for each 2
electric utility in the Regional Proxy Group is shown on 3
Exhibit No. TEC-205. 4
5
Q. What are investment analysts' projected growth rates for 6
the companies in the Regional Proxy Group? 7
8
A. The five-year IBES earnings growth forecasts for each 9
electric utility in the proxy group are shown in column 10
(d) on Exhibit No. TEC-204. 11
12
Q. What were the results of applying the Commission’s one-13
step DCF approach to the Regional Proxy Group? 14
15
A. As shown on Exhibit No. TEC-204, application of the 16
Commission’s DCF model to the Regional Proxy Group 17
resulted in current cost of equity estimates ranging from 18
7.9 percent to 13.6 percent. 19
20
Evaluation of DCF Results 21
Q. In evaluating the results of the constant growth DCF 22
model, is it appropriate to eliminate cost of equity 23
estimates that are extreme outliers? 24
25
DOCKET NO. ER10-____-000 EXHIBIT NO. TEC-200 FILED: 07/30/2010
50
A. Yes. In applying quantitative methods to estimate the 1
cost of equity, it is essential that the resulting values 2
pass fundamental tests of reasonableness and economic 3
logic. Accordingly, DCF estimates that are implausibly 4
low or high should be eliminated when evaluating the 5
results of this method. 6
7
Q. How did you evaluate DCF estimates at the low end of the 8
range? 9
10
A. It is a basic economic principle that investors can be 11
induced to hold more risky assets only if they expect to 12
earn a return to compensate them for their risk bearing. 13
As a result, the rate of return that investors require 14
from a utility’s common stock, the most junior and 15
riskiest of its securities, must be considerably higher 16
than the yield offered by senior, long-term debt. 17
Consistent with this principle, the DCF range must be 18
adjusted to eliminate cost of equity estimates that are 19
determined to be extreme low outliers when compared 20
against the yields available to investors from less risky 21
utility bonds. 22
23
Q. Has the Commission recognized that it is appropriate to 24
eliminate cost of equity estimates that fail to meet 25
DOCKET NO. ER10-____-000 EXHIBIT NO. TEC-200 FILED: 07/30/2010
51
threshold tests of economic logic? 1
2
A. Yes. In Southern California Edison, the Commission noted 3
that adjustments to the zone of reasonableness are 4
justified where applications of its preferred DCF 5
approach produce illogical results: 6
7
An adjustment to this data is appropriate in 8 the case of PG&E's low-end return of 8.42 9 percent, which is comparable to the average 10 Moody's "A" grade public utility bond yield of 11 8.06 percent, for October 1999. Because 12 investors cannot be expected to purchase stock 13 if debt, which has less risk than stock, yields 14 essentially the same return, this low-end 15 return cannot be considered reliable in this 16 case.49 17
18
Similarly, in its October 2006 decision in Kern River Gas 19
Transmission Company, the Commission noted that: 20
21 [T]he 7.31 and 7.32 percent costs of equity for 22 El Paso and Williams found by the ALJ are only 23 110 and 122 basis points above that average 24 yield for public utility debt.50 25
26
The Commission upheld the opinion of Staff and the 27
Administrative Law Judge that cost of equity estimates 28
for these two proxy group companies “were too low to be 29
credible.”51 30
49 Southern California Edison at 61,266 (note omitted).
50 Kern River Gas Transmission Company, 117 FERC ¶ 61,077 at P 140 and n. 227 (2006).
51 Id.
DOCKET NO. ER10-____-000 EXHIBIT NO. TEC-200 FILED: 07/30/2010
52
The practice of eliminating low-end outliers was affirmed 1
in PATH and VEPCO,52 and in its February 2008 decision in 2
Atlantic Path 15, the Commission disregarded a low-end 3
cost of equity estimate of 7.29 percent.53 In its 4
April 15, 2010 decision in SoCal Edison, FERC affirmed 5
that, “it is reasonable to exclude any company whose low-6
end ROE fails to exceed the average bond yield by about 7
100 basis points or more.”54 8
9
Q. What is the appropriate bond yield benchmark to evaluate 10
low-end DCF results? 11
12
A. The average S&P corporate credit rating for the firms in 13
the Regional Proxy Group is “BBB+”, with Tampa Electric 14
being rated “BBB”. Companies rated “BBB-”, “BBB”, and 15
“BBB+” are all considered part of the triple-B rating 16
category, with Moody’s monthly yields on triple-B utility 17
bonds averaging approximately 6.2 percent over the six-18
month period ending March 2010.55 19
20
Q. What else should be considered in evaluating DCF 21
estimates at the low end of the range? 22
52 PATH at P 98; VEPCO at P 64.
53 Atlantic Path 15, at P 20; Prepared Direct Testimony of James M. Coyne, Atlantic Path 15, Docket No. ER08-374 at Exhibit No. ATL-7.
54 Southern California Edison Co., 131 FERC ¶ 61,020 at P 55 (2010) (“SoCal Edison”).
55 Moody’s Investors Service, www.credittrends.com.
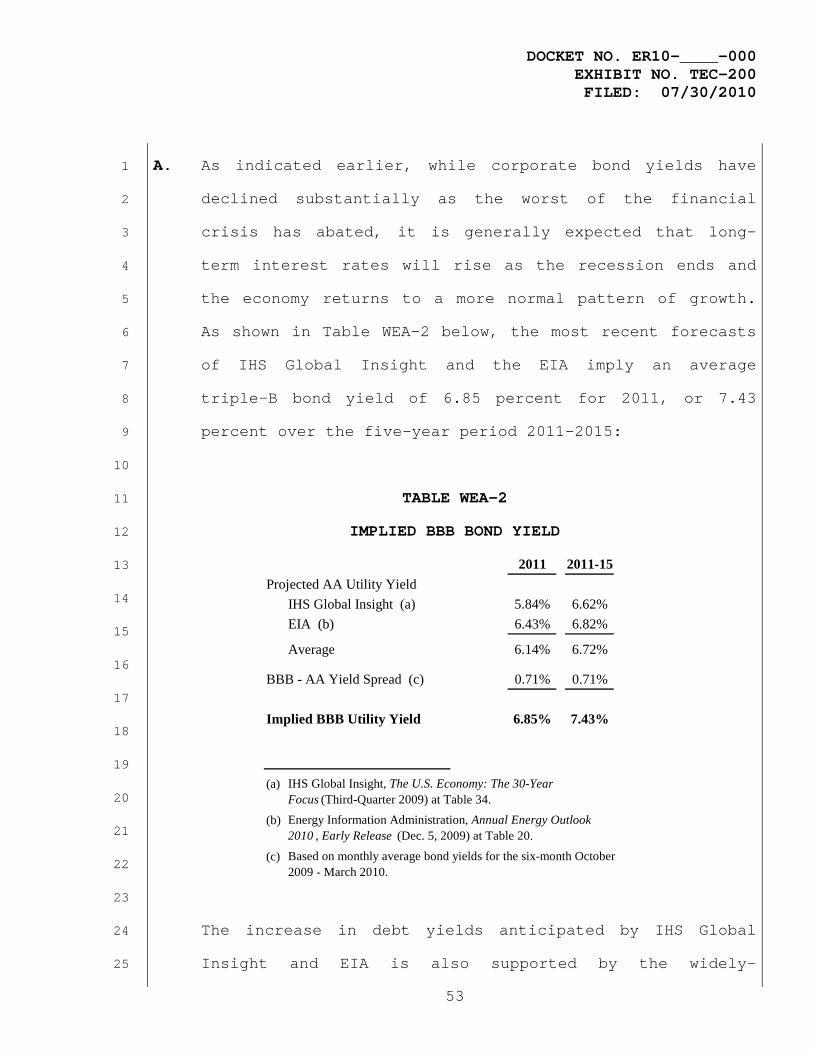
DOCKET NO. ER10-____-000 EXHIBIT NO. TEC-200 FILED: 07/30/2010
53
2011 2011-15Projected AA Utility Yield
IHS Global Insight (a) 5.84% 6.62%EIA (b) 6.43% 6.82%
Average 6.14% 6.72%
BBB - AA Yield Spread (c) 0.71% 0.71%
Implied BBB Utility Yield 6.85% 7.43%
(a)
(b)
(c)
Energy Information Administration, Annual Energy Outlook 2010 , Early Release (Dec. 5, 2009) at Table 20.
Based on monthly average bond yields for the six-month October 2009 - March 2010.
IHS Global Insight, The U.S. Economy: The 30-Year Focus (Third-Quarter 2009) at Table 34.
A. As indicated earlier, while corporate bond yields have 1
declined substantially as the worst of the financial 2
crisis has abated, it is generally expected that long-3
term interest rates will rise as the recession ends and 4
the economy returns to a more normal pattern of growth. 5
As shown in Table WEA-2 below, the most recent forecasts 6
of IHS Global Insight and the EIA imply an average 7
triple-B bond yield of 6.85 percent for 2011, or 7.43 8
percent over the five-year period 2011-2015: 9
10
TABLE WEA-2 11
IMPLIED BBB BOND YIELD 12
13
14
15
16
17
18
19
20
21
22
23
The increase in debt yields anticipated by IHS Global 24
Insight and EIA is also supported by the widely-25
DOCKET NO. ER10-____-000 EXHIBIT NO. TEC-200 FILED: 07/30/2010
54
referenced Blue Chip Financial Forecasts, which projects 1
that yields on corporate bonds will climb on the order of 2
70 basis points through the second quarter of 2011.56 3
Consistent with these forecasts, Fitch concluded, 4
“Interest rates are expected to rise over the course of 5
the year from very low levels.”57 6
7
Q. What does this test of logic imply with respect to the 8
DCF results for the Regional Proxy Group? 9
10
A. As shown on Exhibit No. TEC-204, the low-end DCF estimate 11
for Duke Energy Corporation (“Duke Energy”) was 7.9 12
percent. This value is barely 100 basis points above the 13
yield on triple-B utility bonds expected during 2010. In 14
light of the risk-return tradeoff principle and the tests 15
applied by the Commission in prior decisions, it is 16
inconceivable that investors are not requiring a 17
substantially higher rate of return for holding common 18
stock, which is the riskiest of a utility’s securities. 19
As a result, consistent with the test of economic logic 20
applied by FERC and the upward trend expected for utility 21
bond yields, this value provides little guidance as to 22
the returns investors require from utility common stocks 23
56 Blue Chip Financial Forecasts, Vol. 29, No. 2 (Feb. 1, 2010).
57 Fitch Ratings Ltd., “U.S. Utilities, Power, and Gas 2010 Outlook,” Global Power North America Special Report (Dec. 4, 2009).

DOCKET NO. ER10-____-000 EXHIBIT NO. TEC-200 FILED: 07/30/2010
55
and should be excluded. 1
2
Q. Is there any basis to exclude cost of equity estimates at 3
the high end of the range of reasonableness? 4
5
A. The FERC’s DCF approach does allow for high-end DCF 6
estimates to be excluded if they are found to be extreme 7
outliers, but none of the values for the Regional Proxy 8
Group are affected by this test. Specifically, in a 9
November 2004 Order in Bangor Hydro, the Commission 10
determined that a cost of equity estimate at the high end 11
of the range of reasonableness might also be excluded if 12
it is determined to be an extreme outlier.58 The 13
Commission found that a 17.7 percent cost of equity 14
estimate for PPL was “extreme” and that including this 15
result would “skew the results.”59 The Commission also 16
expressed concern regarding the sustainability of the 17
underlying 13.3 percent growth estimate for PPL,60 and has 18
also referenced this threshold as a test of 19
reasonableness.61 20
21
As noted earlier, the upper end of the cost of equity 22
58 ISO New England, Inc., et al., 109 FERC ¶ 61,147 at P 205 (2004) (“RTO Rehearing Order”).
59 Id.
60 Id.
61 See, e.g., SoCal Edison at P 57.
DOCKET NO. ER10-____-000 EXHIBIT NO. TEC-200 FILED: 07/30/2010
56
range produced by the DCF analysis presented in Exhibit 1
No. TEC-204 was based on a cost of equity estimate of 2
13.6 percent. This high-end estimate falls far below the 3
17.7 percent threshold established in Bangor Hydro. 4
Similarly, the 7.9 percent growth rate underlying this 5
cost of equity estimate is also significantly less than 6
the 13.3 percent benchmark that has been used by the 7
Commission to evaluate values at the high end of the DCF 8
range.62 Moreover, the 13.6 percent upper end of my DCF 9
range is not an “extreme outlier” when compared with the 10
ROE ranges approved by the Commission in the past.63 11
Accordingly, this high-end cost of equity estimate is 12
properly included under the rationale adopted by the 13
Commission. 14
15
Q. What ROE range does your DCF results imply for the 16
Regional Proxy Group? 17
18
A. Eliminating the illogical low-end outlier shaded on 19
Exhibit No. TEC-204 resulted in an adjusted range of 20
reasonableness for the Regional Proxy Group ranging from 21
8.2 percent to 13.6 percent. The midpoint of this range 22
is 10.9 percent. As discussed subsequently, I do not 23
62 See, e.g., PATH at P 100.
63 For example, the upper-end of the DCF range approved by the Commission for Tallgrass Transmission, LLC and Prairie Wind Transmission, LLC was 16.9 percent. Tallgrass at P 78.
DOCKET NO. ER10-____-000 EXHIBIT NO. TEC-200 FILED: 07/30/2010
57
support or recommend reliance on the median to evaluate 1
the ROE for Tampa Electric. Nevertheless, as indicated 2
on Exhibit No. TEC-204, if the median is based on the 3
average of the high and low estimates for those proxy 4
group firms with no extreme outliers, the result is 10.7 5
percent.64 6
7
Q. What were the DCF results for the Ratings Screen Proxy 8
Group? 9
10
A. As discussed earlier, there are compelling reasons 11
supporting the use of the Regional Proxy Group to 12
estimate the cost of equity for Tampa Electric. 13
Nevertheless, Exhibit No. TEC-206 presents the results of 14
the Commission’s model for the Ratings Screen Proxy 15
Group. As indicated there, this analysis resulted in the 16
same 8.2 percent to 13.6 percent ROE zone of 17
reasonableness produced for the Regional Proxy Group, 18
with the midpoint again being 10.9 percent. Using the 19
methodology employed in VEPCO, the median would be 10.5 20
percent. 21
22
Q. Do the DCF results for the Ratings Screen Proxy Group 23
64 See, e.g., VEPCO at n. 58. The Commission determines the median after averaging the low and high DCF results for each of the firms in the proxy group with two valid estimates.
DOCKET NO. ER10-____-000 EXHIBIT NO. TEC-200 FILED: 07/30/2010
58
make economic sense? 1
2
A. No. Earlier, I explained that further restricting the 3
Regional Proxy Group based on credit ratings can lead to 4
greater potential for error as the number of companies is 5
narrowed. In developing the Ratings Screen Proxy Group, 6
I eliminated all companies from the Regional Proxy Group 7
with single-A credit ratings. As a result, the 8
investment risks of the Ratings Screen Proxy Group are 9
higher than those of the Regional Proxy Group. Given the 10
fundamental principle that investors are risk averse, 11
this implies that the cost of equity for the Ratings 12
Screen Proxy Group should be higher than for the firms in 13
the Regional Proxy Group. 14
15
The DCF results presented on Exhibits TEC-204 and TEC-206 16
do not follow this logical result. As shown there, 17
despite the fact that the investment risks of the Ratings 18
Screen Proxy Group are higher, the midpoint of the DCF 19
range of reasonableness is identical to that of the 20
Regional Proxy Group, with the median DCF value being 21
lower. Considering that investors require a higher 22
return to assume greater risk, this lower median cost of 23
equity for the Ratings Screen Proxy Group does not make 24
economic sense. 25
DOCKET NO. ER10-____-000 EXHIBIT NO. TEC-200 FILED: 07/30/2010
59
The greater breadth of the Regional Proxy Group helps to 1
ensure that the resulting DCF range reflects the risks 2
and requirements of investors. As a result, the zone of 3
reasonableness for this group of comparable-risk electric 4
utilities provides a reasonable basis to establish the 5
allowed ROE for Tampa Electric. 6
7
Evaluating an ROE Point Estimate 8
Q. What is the Commission’s policy in determining a point 9
estimate from within the ROE zone of reasonableness? 10
11
A. Historically, the Commission was consistent in using the 12
midpoint of the zone of reasonableness as the basis for 13
allowed ROEs for electric utilities, as evidenced by 14
Bangor Hydro, Midwest ISO, Southern California Edison, 15
and in a plethora of other previous electric cases. For 16
example, in Consumers Energy, the Commission reversed an 17
initial decision in which the Presiding Judge had relied 18
on the median of the zone of reasonableness, rather than 19
the midpoint. The Commission concluded that: 20
21
The precedent on which the judge and Staff rely 22 in this instance was developed in the context 23 of setting the rate of return for gas 24 pipelines. In this case, there has been no 25 reason provided to depart from our precedent in 26 Opinion Nos. 445 and 446, setting the return at 27
DOCKET NO. ER10-____-000 EXHIBIT NO. TEC-200 FILED: 07/30/2010
60
the midpoint of the zone of reasonableness.65 1
2
The Commission followed the same approach in Consumers 3
Energy Co.66 and Utah Power & Light Co.,67 finding the 4
midpoint to be the appropriate return for an electric 5
utility. In certain decisions, however, the Commission 6
has relied on the median rather than the midpoint.68 Most 7
recently, FERC concluded, “in this SoCal Edison 8
proceeding, for a single utility of average risk, the 9
best measure of central tendency is the median.”69 10
11
Q. What rationale did the Commission advance to support 12
adopting the median? 13
14
A. The Commission determined that the median 1) “takes into 15
account more of the companies in the proxy group”, and 2) 16
“minimizes the impact of a potentially skewed proxy 17
group.”70 18
19
Q. Do you agree that the median is a superior measure of 20
central tendency when evaluating the ROE for a stand-21
65 Consumers Energy Co., 98 FERC ¶ 61,333, at 62,416 (2002).
66 85 FERC ¶ 61,100 (1998).
67 44 FERC ¶ 61,166 (1988).
68 See, e.g., VEPCO, 123 FERC ¶ 61,098 (2008); Golden Spread Elec. Cooperative, Inc., et al., 123 FERC ¶ 61,047 (2008) (“Golden Spread”).
69 SoCal Edison at P 92.
70 Id. at P 87.

DOCKET NO. ER10-____-000 EXHIBIT NO. TEC-200 FILED: 07/30/2010
61
alone utility? 1
2
A. No. I disagree with both of the findings underlying the 3
Commission’s decision to rely on the median DCF estimate 4
when establishing the ROE for a single utility. 5
6
Q. Does the median “take into account more of the companies 7
in the proxy group” than does the midpoint? 8
9
A. No. The median actually considers less information about 10
the distribution of reasonable DCF results for the proxy 11
group than does the midpoint. The median is simply the 12
observation with an equal number of data values above and 13
below. For odd-numbered samples, the median relies on 14
only a single number, e.g., the sixth number in an 15
eleven-number set. If the number of estimates is an even 16
number, then the median is the arithmetic average of the 17
two numbers falling in the middle. Thus, if there were 18
twelve estimates, then the median would in fact be the 19
average of the sixth and seventh estimates arrayed from 20
highest to lowest. As such, the median doesn’t expressly 21
“take into account” any information regarding the 22
individual DCF estimates for the proxy companies that are 23
above or below the single number (or average of two 24
single numbers) that fall in the middle of the 25
DOCKET NO. ER10-____-000 EXHIBIT NO. TEC-200 FILED: 07/30/2010
62
distribution. 1
2
While arguments against the midpoint frequently hinge on 3
the contention that this value relies on only the top and 4
bottom numbers in the range and ignores the rest, this 5
argument is incorrect. As the D.C. Circuit has held, 6
“[t]he midpoint doesn’t ‘completely disregard the middle 7
three numbers’; the highest and lowest numbers achieve 8
their status by reference to all five numbers.”71 Consider 9
this example of a five-estimate sample to illustrate the 10
point made by the D.C. Circuit. The estimates are 8.0, 11
8.1, 8.2, 15.0, and 15.1 percent. The median is 8.2 12
percent, while the range is 8.0 percent to 15.1 percent, 13
with a midpoint of 11.55 percent. The median of 8.2 14
percent does not reflect the range of values nor does it 15
include information about the 15.0 and 15.1 percent 16
values that define the upper end of the range. 17
18
In fact, the median could be more readily criticized for 19
under-weighting the results of the proxy group analysis, 20
since it ignores the range of reasonable returns 21
entirely. As the D.C. Circuit observed in approving the 22
use of the midpoint for setting the ROE for the Midwest 23
ISO: 24
71
Canadian Association of Petroleum Producers v. FERC, 254 F.3d 289, 298 (D.C. Cir. 2001).

DOCKET NO. ER10-____-000 EXHIBIT NO. TEC-200 FILED: 07/30/2010
63
[P]etitioners [arguing in support of the 1 median] are correct in noting that all measures 2 of central tendency ‘consider’ the entire proxy 3 group range, in the sense that all are 4 influenced – at least indirectly – by each data 5 point in the range. But only the midpoint 6 emphasizes that range, as it is equally placed 7 between the top and bottom values.72 8
9
The purpose of the Commission’s DCF analysis is to 10
produce a zone of reasonableness, and the midpoint 11
provides a better representation of a single ROE 12
applicable to this range than does the median, which 13
ignores the boundaries of the range entirely. 14
15
Q. Do concerns over skewed DCF results favor the median over 16
the midpoint? 17
18
A. No. Calculation of the median does not involve any 19
examination of the reasonableness of individual cost of 20
equity estimates; rather, it is simply a single number 21
that divides a set of observed values in two equal 22
halves, so that half of the values are below it, and half 23
are above. Moreover, the Commission’s DCF approach 24
already establishes a framework to address concerns over 25
skewed results by evaluating and excluding individual 26
cost of equity estimates that are extreme outliers. In 27
72 Public Service Commission of the Commonwealth of Kentucky, v. FERC, 397 F.3d 1004, 1010 (D.C. Cir. 2005).
DOCKET NO. ER10-____-000 EXHIBIT NO. TEC-200 FILED: 07/30/2010
64
others words, eliminating illogical low and high-end DCF 1
estimates when evaluating the results of the Commission’s 2
DCF approach also negates this second rationale advanced 3
for reliance on the median. 4
5
Q. Does it make sense to distinguish between filings 6
involving individual companies and those involving groups 7
of regional utilities when evaluating central tendency? 8
9
A. No. As noted above, the outcome of the Commission’s DCF 10
approach is a zone of reasonableness that reflects 11
investors’ required rate of return for a proxy group that 12
is comparable in risk to the applicant, irrespective of 13
whether the filing concerns a stand-alone utility or 14
multiple members of a regional organization. In each 15
case the object of the analysis is to obtain a reasonable 16
and reliable range of the unobservable cost of equity 17
based on objective estimates that contain unknown errors. 18
Given the importance of the zone of reasonableness in 19
framing the ROE under the Commission’s precedent for 20
electric utilities, the midpoint is more relevant in 21
establishing a central point estimate that expressly 22
considers this range. 23
24
Moreover, establishing different measures of central 25
DOCKET NO. ER10-____-000 EXHIBIT NO. TEC-200 FILED: 07/30/2010
65
tendency based on whether the party is a single utility 1
or a joint filing made up of multiple companies within a 2
region creates the potential that different ROEs could be 3
established for the same utility, solely depending on the 4
nature of the filing. Such a perverse economic outcome 5
has no logical relationship to changes in underlying 6
capital market conditions or investors’ risk perceptions 7
or requirements, and it directly contradicts the 8
Commission’s well-articulated policy goals of reducing 9
regulatory impediments to investment in utility 10
infrastructure and encouraging new capital investment. 11
12
Q. How else might the Commission approach the determination 13
of a single point estimate from within the ROE range? 14
15
A. The paramount consideration that must be reflected in the 16
choice of a point estimate is the need to ensure that the 17
end result meets the standards mandated by the Supreme 18
Court to ensure that a utility can attract capital. This 19
determination is not a quest to ordain a single 20
statistical measure of central tendency. Rather, it 21
challenges the Commission to consider the available 22
evidence and identify an ROE that is just, reasonable, 23
and sufficient to support the Commission’s goal of 24
encouraging investment in wholesale utility 25
DOCKET NO. ER10-____-000 EXHIBIT NO. TEC-200 FILED: 07/30/2010
66
infrastructure. 1
2
While I believe the midpoint provides a better 3
representation of a single ROE applicable to the DCF zone 4
of reasonableness, the Commission and other stakeholders 5
might be better served by abandoning a policy of 6
mechanistically determining the point estimate on a 7
single statistic. Both the midpoint and the median are 8
recognized statistical measures of central tendency and 9
the Commission is free to weigh both values in its 10
assessment of a fair ROE. Such a policy would be 11
consistent with statistical principles, which favor 12
retaining and evaluating all useful information in order 13
to obtain the most reliable conclusion. Moreover, 14
consideration of both the midpoint and the median 15
recognizes the inherent imprecision in estimating the 16
cost of equity and the important role of informed 17
judgment in evaluating the results of any quantitative 18
analysis. 19
20
Q. Would the Commission increase regulatory risk by electing 21
to consider more than one statistical indicator when 22
determining a fair ROE? 23
24
A. No. While the degree of regulatory support is clearly 25
DOCKET NO. ER10-____-000 EXHIBIT NO. TEC-200 FILED: 07/30/2010
67
one of the most significant considerations for investors, 1
they are far more concerned with the end-result and the 2
implications for the utility’s finances than with 3
adherence to specific rules or precedent, no matter what 4
the outcome. As S&P noted: 5
6
As much as possible, regulators should, in our 7 opinion, have the flexibility to react quickly 8 and prudently to new situations as they 9 develop. This is the sort of flexibility that 10 we believe comes under principles-based 11 regulation rather than rules-based regulation. 12 In the latter, a regulator may attempt to set 13 down every possible rule that can apply to a 14 given situation that may arise in an industry. 15 In the former, the regulator generally has the 16 authority to achieve certain ends and some 17 flexibility in how to achieve them.73 18
19
Similarly, a mechanical policy of referencing only the 20
median of the DCF estimates leaves the Commission with 21
little flexibility when the result fails to reflect a 22
fair and reasonable ROE. In this instance, any benefit 23
of consistency is more than overwhelmed by the risks that 24
an unresponsive, mechanical policy will lead to 25
inadequate returns. 26
27
Flotation Costs 28
Q. What other considerations are relevant in evaluating the 29
73 Standard & Poor’s Corporation, “Executive Comment: What Characterizes Effective Regulation? Understanding, Manageability, and Consistency,” RatingsDirect (May 5, 2010).
DOCKET NO. ER10-____-000 EXHIBIT NO. TEC-200 FILED: 07/30/2010
68
ROE for a utility? 1
2
A. The common equity used to finance the investment in 3
utility assets is provided from either the sale of stock 4
in the capital markets or from retained earnings not paid 5
out as dividends. When equity is raised through the sale 6
of common stock, there are costs associated with 7
"floating" the new equity securities. These flotation 8
costs include services such as legal, accounting, and 9
printing, as well as the fees and discounts paid to 10
compensate brokers for selling the stock to the public. 11
Also, some argue that the "market pressure" from the 12
additional supply of common stock and other market 13
factors may further reduce the amount of funds a utility 14
nets when it issues common equity. 15
16
Equity flotation costs are not included in a utility’s 17
rate base because neither that portion of the gross 18
proceeds from the sale of common stock used to pay 19
flotation costs is available to invest in plant and 20
equipment, nor are flotation costs capitalized as an 21
intangible asset. Unless some provision is made to 22
recognize these issuance costs, a utility’s revenue 23
requirements will not fully reflect all of the costs 24
incurred for the use of investors’ funds, with the need 25
DOCKET NO. ER10-____-000 EXHIBIT NO. TEC-200 FILED: 07/30/2010
69
for a flotation cost adjustment having been documented in 1
the financial literature.74 2
3
Q. What is the magnitude of the adjustment to the “bare 4
bones” cost of common equity to account for issuance 5
costs? 6
7
A. While there are a number of ways in which a flotation 8
cost adjustment can be calculated, one of the most common 9
methods used to account for flotation costs in regulatory 10
proceedings is to apply an average flotation-cost 11
percentage to a utility’s dividend yield. A review of the 12
finance literature and other studies of issuance costs 13
prepared by the investment community suggest an average 14
flotation cost percentage in the range of 3.6 percent to 15
10 percent.75 Applying these expense percentages to a 16
representative dividend yield for a utility of 5.0 17
percent implies a flotation cost adjustment on the order 18
of 18 to 50 basis points. While my DCF zone of 19
reasonableness recommendation does not include an 20
adjustment for flotation costs, this is a legitimate 21
74 See, e.g., Brigham, E.F., Aberwald, D.A., and Gapenski, L.C., “Common Equity Flotation Costs and Rate Making,” Public Utilities Fortnightly (May, 2, 1985); Morin, Roger A., “Regulatory Finance: Utilities’ Cost of Capital,” Public Utilities Reports at 175 (1994).
75 See, e.g., Morin, Roger A., “Regulatory Finance: Utilities’ Cost of Capital,” Public Utilities Reports (1994) at 166; Application of Yankee Gas Services Company for a Rate Increase, DPUC Docket No. 04-06-01, Direct Testimony of George J. Eckenroth (Jul. 2, 2004) at Exhibit GJE-11.1.
DOCKET NO. ER10-____-000 EXHIBIT NO. TEC-200 FILED: 07/30/2010
70
factor that supports the reasonableness of the ROE 1
requested by Tampa Electric in this case. 2
3
ROE BENCHMARKS 4
Q. What other analyses did you conduct to estimate the cost 5
of equity? 6
7
A. I also evaluated the cost of equity for Tampa Electric 8
against ROE benchmarks developed by applying the DCF 9
model to a group of non-utility companies and by 10
reference to expected earned rates of return for 11
utilities. 12
13
Q. What evidence supports your reference to alternative ROE 14
benchmarks? 15
16
A. I am well aware that the Commission has narrowed the 17
focus of its ROE evaluation to a particular variant of 18
the DCF approach. Nevertheless, because the cost of 19
equity is unobservable, no single method should be viewed 20
in isolation. Regulators have customarily considered the 21
results of alternative approaches in determining allowed 22
returns.76 It is widely recognized that no single method 23
76 For example, a NARUC survey reported that 26 regulatory jurisdictions ascribe to no specific method for setting allowed ROEs, with the results of all approaches being considered. “Utility Regulatory Policy in the U.S. and Canada, 1995-1996,” National Association of Regulatory Utility Commissioners (December 1996).
DOCKET NO. ER10-____-000 EXHIBIT NO. TEC-200 FILED: 07/30/2010
71
can be regarded as a panacea; with all approaches having 1
advantages and shortcomings. For example, a publication 2
of the Society of Utility and Financial Analysts 3
(formerly the National Society of Rate of Return 4
Analysts), concluded that: 5
6
Each model requires the exercise of judgment as 7 to the reasonableness of the underlying 8 assumptions of the methodology and on the 9 reasonableness of the proxies used to validate 10 the theory. Each model has its own way of 11 examining investor behavior, its own premises, 12 and its own set of simplifications of reality. 13 Each method proceeds from different fundamental 14 premises, most of which cannot be validated 15 empirically. Investors clearly do not 16 subscribe to any singular method, nor does the 17 stock price reflect the application of any one 18 single method by investors.77 19
20
As the Federal Communications Commission recognized: 21
22
Equity prices are established in highly 23 volatile and uncertain capital markets... 24 Different forecasting methodologies compete 25 with each other for eminence, only to be 26 superseded by other methodologies as conditions 27 change... In these circumstances, we should not 28 restrict ourselves to one methodology, or even 29 a series of methodologies, that would be 30 applied mechanically. Instead, we conclude 31 that we should adopt a more accommodating and 32 flexible position.78 33
34
77 Parcell, David C., “The Cost of Capital – A Practitioner’s Guide,” Society of Utility and Regulatory Financial Analysts (1997) at Part 2, p. 4.
78 Federal Communications Commission, Report and Order 42-43, CC Docket No. 92-133 (1995).

DOCKET NO. ER10-____-000 EXHIBIT NO. TEC-200 FILED: 07/30/2010
72
Q. Has the Commission also recognized that it may be 1
appropriate to consider the results of alternative 2
methods? 3
4
A. Yes. For example, the Commission concluded in Distrigas 5
of Massachusetts Corp. that, “no one methodology is 6
preferred to the exclusion of all others. The DCF 7
methodology, which we endorse, is but one analytical 8
tool.”79 FERC has also granted that “[i]n some instances, 9
the DCF methodology alone may be inappropriate.”80 While 10
electing not to make “broadly applicable changes to how 11
the Commission has traditionally performed its DCF 12
analysis,” Order No. 679 noted the opinion that “there is 13
a benefit to introducing more information into the 14
analysis process,” and FERC indicated a willingness to 15
consider modification to its standard approach on a case-16
by-case basis.81 More recently, in SoCal Edison, the 17
Commission recognized that additional methods could be 18
used to test or corroborate the results of its preferred 19
DCF approach.82 20
21
79 Distrigas of Massachusetts Corp., 41 FERC ¶ 61,205 at 61,550 (1987), modified on reh’g, 42 FERC ¶ 61,225 (1988).
80 Williston Basin Interstate Pipeline Co., 50 FERC ¶ 61,284 at 61,913 n.90 (1990), vacated on other grounds, 931 F.2d 949 (D.C. Cir. 1991).
81 Order No. 679, 116 FERC ¶ 61,057 at P 102 (2006); Order No. 679-A, 117 FERC ¶ 61,327 at P 63 (2006).
82 SoCal Edison at P 116.
DOCKET NO. ER10-____-000 EXHIBIT NO. TEC-200 FILED: 07/30/2010
73
Non-Utility DCF Model 1
Q. What other proxy group did you consider in evaluating a 2
fair ROE for Tampa Electric? 3
4
A. Consistent with underlying economic and regulatory 5
standards, I also applied the DCF model to a reference 6
group of comparable risk companies in the non-utility 7
sectors of the economy. I refer to this group as the 8
“Non-Utility Proxy Group”. 9
10
Q. Do utilities have to compete with non-regulated firms for 11
capital? 12
13
A. Yes. The cost of capital is an opportunity cost based on 14
the returns that investors could realize by putting their 15
money in other alternatives. Clearly the total capital 16
invested in utility stocks is only the tip of the iceberg 17
of total common stock investment, and there are a 18
plethora of other enterprises available to investors 19
beyond those in the utility industry. Utilities must 20
compete for capital, not just against firms in their own 21
industry, but with other investment opportunities of 22
comparable risk. With regulation taking the place of 23
competitive market forces, required returns for utilities 24
should be in line with those of non-utility firms of 25
DOCKET NO. ER10-____-000 EXHIBIT NO. TEC-200 FILED: 07/30/2010
74
comparable risk operating under the constraints of free 1
competition. 2
3
Q. Is it consistent with the Bluefield and Hope cases to 4
consider required returns for non-utility companies? 5
6
A. Yes. Returns in the competitive sector of the economy 7
form the very underpinning for utility ROEs because 8
regulation purports to serve as a substitute for the 9
actions of competitive markets. The Supreme Court has 10
recognized that it is the degree of risk, not the nature 11
of the business, which is relevant in evaluating an 12
allowed ROE for a utility. The Bluefield case refers to 13
“business undertakings attended with comparable risks and 14
uncertainties.” It does not restrict consideration to 15
other utilities. Indeed, if the requirement is business 16
in the same part of the country and the utility has the 17
exclusive franchise, then the Court could only be 18
referring to non-utility businesses and any nearby 19
utilities. Similarly, the Hope case states: 20
21
By that standard the return to the equity owner 22 should be commensurate with returns on 23 investments in other enterprises having 24 corresponding risks. 25
26
As in the Bluefield decision, there is nothing to 27
DOCKET NO. ER10-____-000 EXHIBIT NO. TEC-200 FILED: 07/30/2010
75
restrict “other enterprises” solely to the utility 1
industry. 2
3
Indeed, in teaching regulatory policy I usually observe 4
that in the early applications of the comparable earnings 5
approach, utilities were explicitly eliminated due to a 6
concern about circularity. In other words, soon after 7
the Hope decision regulatory commissions did not want to 8
get involved in circular logic by looking to the returns 9
of utilities that were established by the same or similar 10
regulatory commissions in the same geographic region. To 11
avoid circularity, regulators looked only to the returns 12
of non-utility companies. 13
14
Q. Does consideration of the results for the Non-Utility 15
Proxy Group make the estimation of the cost of equity 16
using the DCF model more reliable? 17
18
A. Yes. The estimates of growth from the DCF model depend 19
on analysts’ forecasts. It is possible for utility 20
growth rates to be distorted by short-term trends in the 21
industry or the industry falling into favor or disfavor 22
by analysts. The result of such distortions would be to 23
bias the DCF estimates for utilities. For example, Value 24
Line recently observed that near-term growth rates 25
DOCKET NO. ER10-____-000 EXHIBIT NO. TEC-200 FILED: 07/30/2010
76
understate the longer-term expectations for gas 1
utilities: 2
3
Natural Gas Utility stocks have fallen near the 4 bottom of our Industry spectrum for Timeliness. 5 Accordingly, short-term investors would 6 probably do best to find a group with better 7 prospects over the coming six to 12 months. 8 Longer-term, we expect these businesses to 9 rebound. An improved economic environment, 10 coupled with stronger pricing, should boost 11 results across this sector over the coming 12 years.83 13
14
Because the Non-Utility Proxy Group includes low risk 15
companies from many industries, it diversifies away any 16
distortion that may be caused by the ebb and flow of 17
enthusiasm for a particular sector. 18
19
Q. What criteria did you apply to develop the Non-Utility 20
Proxy Group? 21
22
A. My comparable risk proxy group was composed of those U.S. 23
companies followed by Value Line that: 1) pay common 24
dividends; 2) have a Safety Rank of “1”; 3) have a 25
Financial Strength Rating of “B++” or greater; 4) have a 26
beta less than 1.00; and, 5) have investment grade credit 27
ratings from S&P. While any differences in investment 28
83 The Value Line Investment Survey at 445 (Mar. 12, 2010).
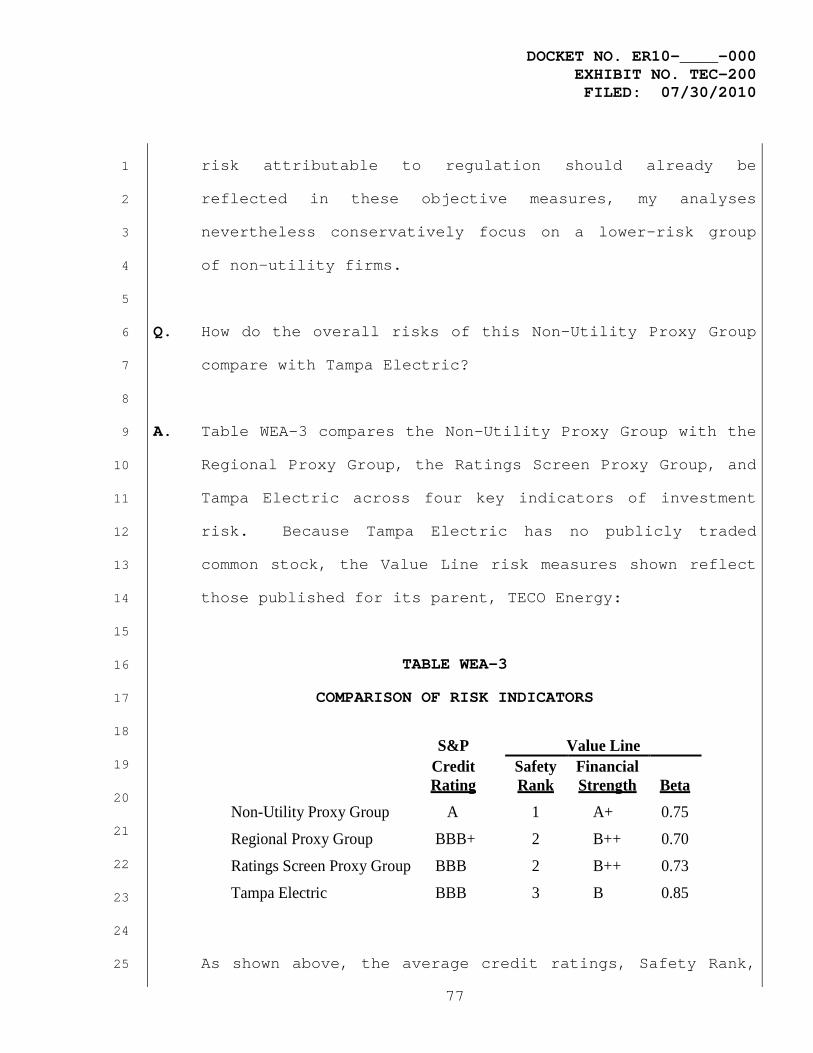
DOCKET NO. ER10-____-000 EXHIBIT NO. TEC-200 FILED: 07/30/2010
77
S&P Value Line Credit
Rating Safety
Rank Financial Strength
Beta
Non-Utility Proxy Group A 1 A+ 0.75
Regional Proxy Group BBB+ 2 B++ 0.70
Ratings Screen Proxy Group BBB 2 B++ 0.73
Tampa Electric BBB 3 B 0.85
risk attributable to regulation should already be 1
reflected in these objective measures, my analyses 2
nevertheless conservatively focus on a lower-risk group 3
of non-utility firms. 4
5
Q. How do the overall risks of this Non-Utility Proxy Group 6
compare with Tampa Electric? 7
8
A. Table WEA-3 compares the Non-Utility Proxy Group with the 9
Regional Proxy Group, the Ratings Screen Proxy Group, and 10
Tampa Electric across four key indicators of investment 11
risk. Because Tampa Electric has no publicly traded 12
common stock, the Value Line risk measures shown reflect 13
those published for its parent, TECO Energy: 14
15
TABLE WEA-3 16
COMPARISON OF RISK INDICATORS 17
18
19
20
21
22
23
24
As shown above, the average credit ratings, Safety Rank, 25
DOCKET NO. ER10-____-000 EXHIBIT NO. TEC-200 FILED: 07/30/2010
78
and Financial Strength Rating for the Non-Utility Proxy 1
Group suggest less risk than for the proxy groups of 2
utilities, with its 0.75 average beta indicating somewhat 3
greater risk. Thus, while the impact of differences in 4
regulation is already reflected in objective risk 5
measures, my analyses conservatively focus on a lower-6
risk group of non-utility firms. Considered together, a 7
comparison of these objective measures, which consider a 8
broad spectrum of risks, including financial and business 9
position, relative size, and exposure to company-specific 10
factors, indicates that investors would likely conclude 11
that the overall investment risks for Tampa Electric are 12
greater than those of the firms in the Utility and Non-13
Utility Proxy Groups. 14
15
My Non-Utility Proxy Group is comprised of 59 of the 16
best-known and most stable corporations in America and 17
has risk measures that are comparable to, or less than 18
the proxy groups of electric utilities referenced in my 19
analyses. While these companies do not have the 20
regulatory protections that utilities have, neither do 21
they bear the burdens of losing control over their 22
prices, undertaking the obligation to serve, and having 23
to invest in infrastructure even in unfavorable market 24
conditions. Tampa Electric can’t relocate its service 25
DOCKET NO. ER10-____-000 EXHIBIT NO. TEC-200 FILED: 07/30/2010
79
territory to an area with higher prospects for economic 1
growth or less exposure to storm damage, postpone capital 2
spending necessary to maintain reliability and 3
accommodate growth, or abandon customers when turmoil 4
roils energy or capital markets. 5
6
Q. What were the results of your DCF analysis for the Non-7
Utility Proxy Group? 8
9
A. The results of my DCF analysis for the Non-Utility Proxy 10
Group are presented in Exhibit TEC-207, with the 11
sustainable, br+sv growth rates being developed on 12
Exhibit TEC-208. As shown there, after eliminating 13
illogical low and high-end values, application of the 14
constant growth DCF model resulted in an ROE range of 15
reasonableness of 8.6 percent to 16.5 percent, with a 16
midpoint of 12.5 percent. Calculating the median based 17
on the average of the low and high DCF estimates for each 18
company with no extreme outliers resulted in an indicated 19
cost of equity of 12.6 percent.84 20
21
Expected Earnings Approach 22
Q. What other benchmarks did you develop to evaluate the ROE 23
84 This is identical to the approach used by the Commission and applied earlier to the Regional Proxy Group.
DOCKET NO. ER10-____-000 EXHIBIT NO. TEC-200 FILED: 07/30/2010
80
for Tampa Electric? 1
2
A. As I noted earlier, I also evaluated the ROE by reference 3
to expected rates of return for electric utilities. 4
Reference to rates of return available from alternative 5
investments of comparable risk can provide an important 6
benchmark in assessing the return necessary to assure 7
confidence in the financial integrity of a firm and its 8
ability to attract capital. This approach is consistent 9
with the economic underpinnings for a fair rate of 10
return, as reflected in the comparable earnings test 11
established by the Supreme Court in Hope and Bluefield. 12
Moreover, it avoids the complexities and limitations of 13
capital market methods and instead focuses on the returns 14
earned on book equity, which are readily available to 15
investors. 16
17
Q. What economic premise underlies the expected earnings 18
approach? 19
20
A. The simple, but powerful concept underlying the expected 21
earnings approach is that investors compare each 22
investment alternative with the next best opportunity. 23
If the utility is unable to offer a return similar to 24
that available from other opportunities of comparable 25
DOCKET NO. ER10-____-000 EXHIBIT NO. TEC-200 FILED: 07/30/2010
81
risk, investors will become unwilling to supply the 1
capital on reasonable terms. For existing investors, 2
denying the utility an opportunity to earn what is 3
available from other similar risk alternatives prevents 4
them from earning their opportunity cost of capital. In 5
this situation the government is effectively taking the 6
value of investors’ capital without adequate 7
compensation. 8
9
Q. How is the comparison of opportunity costs typically 10
implemented? 11
12
A. The traditional comparable earnings test identifies a 13
group of companies that are believed to be comparable in 14
risk to the utility. The actual earnings of those 15
companies on the book value of their investment are then 16
compared to the allowed return of the utility. While the 17
traditional comparable earnings test is implemented using 18
historical data taken from the accounting records, it is 19
also common to use projections of returns on book 20
investment, such as those published by recognized 21
investment advisory publications (e.g., Value Line). 22
Because these returns on book value equity are analogous 23
to the allowed return on a utility’s rate base, this 24
measure of opportunity costs results in a direct, “apples 25

DOCKET NO. ER10-____-000 EXHIBIT NO. TEC-200 FILED: 07/30/2010
82
to apples” comparison. 1
2
Moreover, regulators do not set the returns that 3
investors earn in the capital markets – they can only 4
establish the allowed return on the value of a utility’s 5
investment, as reflected on its accounting records. As a 6
result, the expected earnings approach provides a direct 7
guide to ensure that the allowed ROE is similar to what 8
other utilities of comparable risk will earn on invested 9
capital. This opportunity cost test does not require 10
theoretical models to indirectly infer investors’ 11
perceptions from stock prices or other market data. As 12
long as the proxy companies are similar in risk, their 13
expected earned returns on invested capital provide a 14
direct benchmark for investors’ opportunity costs that is 15
independent of fluctuating stock prices, market-to-book 16
ratios, debates over DCF growth rates, or the limitations 17
inherent in any theoretical model of investor behavior. 18
19
Q. What rates of return on equity are indicated for electric 20
utilities based on the expected earnings approach? 21
22
A. Value Line reports that its analysts anticipate an 23
average rate of return on common equity for the electric 24
utility industry of 11.0 percent in 2010 and 2011, and 25
DOCKET NO. ER10-____-000 EXHIBIT NO. TEC-200 FILED: 07/30/2010
83
11.5 percent over its 2013-2015 forecast horizon.85 1
Meanwhile, for the firms in the Regional Proxy Group 2
specifically, the returns on common equity projected by 3
Value Line over its forecast horizon are shown on page 1 4
of Exhibit TEC-209. Consistent with the rationale 5
underlying the development of the br+sv growth rates, 6
these year-end values were converted to average returns 7
using the same adjustment factor discussed earlier and 8
developed on Exhibit TEC-205. As shown on page 1 of 9
Exhibit TEC-209, Value Line’s projections for the 10
Regional Proxy Group suggest an average ROE of 11.5 11
percent, or 12.9 percent after eliminating low-end 12
outliers. With respect to the Ratings Screen Proxy 13
Group, Value Line’s projections imply an expected rate of 14
return of 10.8 percent, or 11.6 percent after excluding 15
illogical values (Exhibit TEC-209, page 2). 16
17
ROE FOR TAMPA ELECTRIC 18
Q. What is the purpose of this section? 19
20
A. This section presents my conclusions regarding a 21
reasonable ROE for Tampa Electric. It examines other 22
factors properly considered in determining a fair rate of 23
return, including the relationship between ROE and 24
85 The Value Line Investment Survey at 901 (Mar. 26, 2010).
DOCKET NO. ER10-____-000 EXHIBIT NO. TEC-200 FILED: 07/30/2010
84
preservation of a utility’s financial integrity and the 1
ability to attract capital. 2
3
Implications for Financial Integrity 4
Q. Why is it important to allow Tampa Electric an adequate 5
ROE? 6
7
A. Given the social and economic importance of the utility 8
industry, it is essential to maintain reliable and 9
economical service to all consumers. While it is 10
customers that ultimately realize the benefits of 11
increased investment in wholesale utility infrastructure, 12
a utility’s ability to fulfill its mandate can be 13
compromised if it lacks the necessary financial 14
wherewithal or is unable to earn a return sufficient to 15
attract capital. 16
17
As documented earlier, the major rating agencies have 18
warned of exposure to uncertainties associated with 19
political and regulatory developments, especially in view 20
of current financial and operating pressures in the 21
utility industry. Investors understand just how swiftly 22
unforeseen circumstances can lead to deterioration in a 23
utility’s financial condition, and stakeholders have 24
discovered firsthand how difficult and complex it can be 25
DOCKET NO. ER10-____-000 EXHIBIT NO. TEC-200 FILED: 07/30/2010
85
to remedy the situation after the fact. Investors’ 1
increased reticence to supply additional capital during 2
times of crisis highlights the need to preserve financial 3
flexibility and the importance of allowing an adequate 4
ROE. 5
6
Q. What role does regulation play in ensuring access to 7
capital for Tampa Electric? 8
9
A. Considering investors’ heightened awareness of the risks 10
associated with the utility industry and the damage that 11
results when a utility’s financial flexibility is 12
compromised, fair and balanced regulation remains crucial 13
to the Company’s access to capital. Investors recognize 14
that regulation has its own risks, and that constructive 15
regulation is a key ingredient in supporting utility 16
credit ratings and financial integrity, particularly 17
during times of adverse conditions. 18
19
Fitch concluded, “[G]iven the lingering rate of 20
unemployment and voter concerns about the economy, there 21
could well be pockets of adverse rate decisions, and 22
those companies with little financial cushion could 23
suffer adverse effects.”86 Moody’s has also emphasized 24
86 Fitch Ratings Ltd., “U.S. Utilities, Power and Gas 2010 Outlook,” Global Power North America Special Report (Dec. 4, 2009).
DOCKET NO. ER10-____-000 EXHIBIT NO. TEC-200 FILED: 07/30/2010
86
the need for regulatory support, concluding: 1
2 For the longer term, however, we are becoming 3 increasingly concerned about possible changes 4 to our fundamental assumptions about regulatory 5 risk, particularly the prospect of a more 6 adversarial political (and therefore 7 regulatory) environment. A prolonged 8 recessionary climate with high unemployment, or 9 an intense period of inflation, could make cost 10 recovery more uncertain.87 11
12
S&P noted “the quality of regulation is at the forefront 13
of our analysis of utility creditworthiness.”88 14
15
With respect to Florida specifically, in October 2009 16
Moody’s expressed concern regarding the state’s 17
regulatory climate: 18
19 Moody’s views the highly politicized atmosphere 20 surrounding the base rate proceedings of 21 Florida Power & Light Company … as negative to 22 the credit quality … and an indication that the 23 political and regulatory environment for 24 investor-owned utilities in Florida may be 25 deteriorating. … Moody’s views political 26 intervention in the utility regulatory process 27 as detrimental to credit quality, sometimes 28 resulting in adverse rate case outcomes. In 29 some cases this has led to multi-notch credit 30 rating downgrades of utilities in states where 31 this has occurred….89 32
Similarly, S&P noted that, “Regulatory developments 33
87 Moody’s Investors Service, “U.S. Regulated Electric Utilities, Six-Month Update,” Industry Outlook (July 2009).
88 Standard & Poor’s Corporation, “Assessing U.S. Utility Regulatory Environments,” RatingsDirect (Nov. 7, 2008).
89 Moody’s Investors Service, “Issuer Comment: Moody’s Views Politicized Florida Rate Cases as Credit Negative,” Global Credit Research (Oct. 7, 2009).
DOCKET NO. ER10-____-000 EXHIBIT NO. TEC-200 FILED: 07/30/2010
87
unrelated to TECO have raised questions about the 1
regulatory risk in Florida.”90 While recognizing that 2
Tampa Electric’s near-term exposure to these 3
uncertainties is limited, Moody’s concluded that 4
deterioration of the Florida regulatory environment could 5
undermine Tampa Electric’s credit profile and lead to 6
lower ratings.91 7
8
Q. Does the fact that Tampa Electric operates under various 9
cost adjustment mechanisms warrant any adjustment in your 10
evaluation of a fair ROE? 11
12
A. No. Investors recognize that Tampa Electric is exposed 13
to significant risks associated with energy price 14
volatility, and rising costs and concerns over these 15
risks have become increasingly pronounced in the 16
industry. The FPSC’s cost adjustment mechanisms are a 17
valuable means of mitigating those risks, but they do not 18
eliminate exposure to volatility and uncertainties over 19
cost recovery. Investors also recognize the potential 20
that regulators can discontinue rate mechanisms. As 21
noted above, of particular concern to investors is the 22
impact of regulatory lag and cost-recovery on the 23
90 Standard & Poor’s Corporation, “Summary: Tampa Electric Co.,” RatingsDirect (Dec. 28, 2009).
91 Moody’s Investors Service, “Credit Opinion: Tampa Electric Company,” Global Credit Research (May 14, 2010).
DOCKET NO. ER10-____-000 EXHIBIT NO. TEC-200 FILED: 07/30/2010
88
utility’s ability to earn its authorized return. While 1
the adjustment mechanisms approved for Tampa Electric 2
partially attenuate exposure to attrition in an era of 3
rising costs, this leveling of the playing field only 4
serves to preserve Tampa Electric’s opportunity to earn 5
its authorized return, as required by established 6
regulatory standards. 7
8
Moreover, adjustment mechanisms and contractual 9
arrangements that enable utilities to implement rate 10
changes to pass-through fluctuations in fuel costs have 11
been widely prevalent in the industry, and utilities 12
increasingly benefit from a wide variety of mechanisms 13
designed to mitigate against the risks associated with 14
fluctuations in costs and regulatory lag. While not 15
always directly analogous to the specific mechanisms in 16
effect for Tampa Electric, the objective is similar; 17
namely, to allow the utility an opportunity to earn a 18
fair rate of return and partially attenuate exposure to 19
attrition in an era of rising costs. Reflective of this 20
industry trend, the companies in the proxy group operate 21
under a variety of cost adjustment mechanisms, which 22
range from riders to recover bad debt expense and post-23
retirement employee benefit costs to adjustment clauses 24
designed to address the rising costs of environmental 25
DOCKET NO. ER10-____-000 EXHIBIT NO. TEC-200 FILED: 07/30/2010
89
compliance measures. As a result, the mitigation in 1
risks associated with utilities’ ability to attenuate the 2
impact of fluctuations in costs is already reflected in 3
the cost of equity estimates developed earlier. 4
5
Q. Do the exposures unique to Tampa Electric highlight the 6
need for ongoing support of the Company’s financial 7
strength and ability to attract capital? 8
9
A. Most definitely. As discussed earlier, Tampa Electric 10
faces a number of potential challenges that might require 11
the relatively swift commitment of considerable capital 12
resources in order to maintain the high level of service 13
to which its customers have become accustomed. For 14
example, shutdowns of generating facilities in response 15
to security threats or other catastrophic events would 16
impose significant reliance on wholesale power markets to 17
meet energy shortfalls. Tampa Electric’s relative 18
geographic isolation on the Florida peninsula also 19
imposes increased vulnerability to fuel supply 20
disruptions. Similarly, any interruption of gas supplies 21
due to deliverability constraints imposed on Tampa 22
Electric’s suppliers could also result in the need for a 23
considerable financial commitment for an alternative fuel 24
source or replacement power. 25
DOCKET NO. ER10-____-000 EXHIBIT NO. TEC-200 FILED: 07/30/2010
90
Given the potential for significant volatility in 1
wholesale energy markets and Tampa Electric’s lack of 2
control over the timing of such events, Tampa Electric 3
must have the wherewithal to meet these challenges even 4
when capital and energy market conditions are 5
unfavorable. In addition, it is crucial that Tampa 6
Electric maintain its ability to meet the significant 7
liquidity requirements necessary for storm restoration, 8
as well as the requirements of other programs such as 9
fuel hedging. Apart from exposure to the vagaries of 10
capital and energy market conditions, Tampa Electric must 11
simultaneously meet the long-term energy needs of its 12
retail service area and wholesale customers. To continue 13
to meet these challenges successfully and economically, 14
it is crucial that Tampa Electric receive adequate 15
support for its credit standing. 16
17
Q. Do customers benefit by enhancing the utility’s financial 18
flexibility? 19
20
A. Yes. Providing an ROE that is sufficient to compensate 21
investors and maintain Tampa Electric’s ability to 22
attract capital, even under duress, is consistent with 23
the economic requirements embodied in the Supreme Court’s 24
Hope and Bluefield decisions, but it is also in 25
DOCKET NO. ER10-____-000 EXHIBIT NO. TEC-200 FILED: 07/30/2010
91
customers’ best interests. Ultimately, it is customers 1
and the service area economy that enjoy the benefits that 2
come from ensuring that regional utilities have the 3
financial wherewithal to take whatever actions are 4
required to ensure a reliable energy supply. By the same 5
token, customers also bear a significant burden when the 6
ability to attract capital for system enhancements is 7
impaired and service quality is compromised. 8
9
Q. What evidence illustrates the benefits of maintaining 10
Tampa Electric’s ability to attract capital? 11
12
A. In recent years, Tampa Electric has invested the 13
substantial capital required to add the new generation 14
and transmission capacity dictated by the demands of a 15
vibrant service area and wholesale demand in peninsular 16
Florida and repair the devastation wrought by tropical 17
storms. Despite the associated complexities, including 18
volatile conditions in energy and capital markets, Tampa 19
Electric has effectively and economically responded to 20
these challenges, in part due to its strong financial 21
position. 22
23
While Tampa Electric's consistent efforts to keep pace 24
with the needs of its service area has benefited 25
DOCKET NO. ER10-____-000 EXHIBIT NO. TEC-200 FILED: 07/30/2010
92
customers and provided a strong platform for continued 1
success, actions that serve to erode financial strength 2
or impair financial flexibility could have swift and 3
damaging consequences. The cost of providing Tampa 4
Electric an adequate return is small relative to the 5
potential benefits that a strong utility can have in 6
providing reliable service and fostering growth. 7
8
Capital Structure 9
Q. Is an evaluation of the capital structure maintained by a 10
utility relevant in assessing its ROE? 11
12
A. Yes. Other things being equal, a higher debt ratio, or 13
lower common equity ratio, translates into increased 14
financial risk for all investors. A greater amount of 15
debt means more investors have a senior claim on 16
available cash flow, thereby reducing the certainty that 17
each will receive his contractual payments. This 18
increases the risks to which lenders are exposed, and 19
they require correspondingly higher rates of interest. 20
From common shareholders’ standpoint, a higher debt ratio 21
means that there are proportionately more investors ahead 22
of them, thereby increasing the uncertainty as to the 23
amount of cash flow, if any that will remain. 24
25

DOCKET NO. ER10-____-000 EXHIBIT NO. TEC-200 FILED: 07/30/2010
93
Q. What common equity ratio will be used to establish the 1
Company’s overall rate of return? 2
3
A. Tampa Electric’s capitalization reflects a common equity 4
ratio of 50.9 percent in this filing, which is based on 5
the Company’s actual capital structure reported in its 6
2009 FERC Form No. 1 Report. 7
8
Q. How does this compare with common equity ratios 9
maintained by the proxy groups of other electric 10
utilities? 11
12
A. As shown on page 1 of Exhibit No. TEC-210, common equity 13
ratios for the individual firms in the Regional Proxy 14
Group ranged from a low of 38.7 percent to a high of 56.3 15
percent at year-end 2009, with the average being 44.9 16
percent. For the Ratings Screen Proxy Group, the average 17
equity ratio at year-end 2009 was 44.0 percent (page 2 of 18
Exhibit No. TEC-210). 19
20
Q. What capitalization is representative for the proxy 21
groups going forward? 22
23
A. As shown on pages 1 and 2 of Exhibit No. TEC-210, Value 24
Line expects an average common equity ratio of 46.5 25
DOCKET NO. ER10-____-000 EXHIBIT NO. TEC-200 FILED: 07/30/2010
94
percent for its three-to-five-year forecast horizon for 1
the Regional Proxy Group and 46.9 percent for the Ratings 2
Screen Proxy Group. 3
4
Q. What capitalization ratios are maintained by other 5
electric utility operating companies? 6
7
A. Exhibit No. TEC-211 displays capital structure data at 8
year-end 2009 for the group of electric utility operating 9
companies owned by the firms in the Regional Proxy Group. 10
As shown there, common equity ratios for this group of 11
electric utility operating companies ranged from 33.7 12
percent to 73.7 percent and averaged 51.5 percent. 13
14
Q. What implication does the increasing risk of the industry 15
have for the capital structures maintained by utilities? 16
17
A. As discussed earlier, utilities are facing energy market 18
volatility, rising cost structures, the need to finance 19
significant capital investment plans, uncertainties over 20
accommodating future environmental mandates, and ongoing 21
regulatory risks. Coupled with the potential for turmoil 22
in capital markets, these considerations warrant a 23
stronger balance sheet to deal with an increasingly 24
uncertain environment. A more conservative financial 25

DOCKET NO. ER10-____-000 EXHIBIT NO. TEC-200 FILED: 07/30/2010
95
profile, in the form of a higher common equity ratio, is 1
consistent with increasing uncertainties and the need to 2
maintain the continuous access to capital that is 3
required to fund operations and necessary system 4
investments, even during times of adverse capital market 5
conditions. 6
7
Moody’s has repeatedly warned investors of the risks 8
associated with debt leverage and fixed obligations and 9
advised utilities not to squander the opportunity to 10
strengthen the balance sheet as a buffer against future 11
uncertainties.92 More recently, Moody’s concluded: 12
13
From a credit perspective, we believe a strong 14 balance sheet coupled with abundant sources of 15 liquidity represents one of the best defenses 16 against business and operating risk and 17 potential negative ratings actions.93 18
19
Similarly, S&P recently noted that, “we generally 20
consider a debt to capital level of 50% or greater to be 21
aggressive or highly leveraged for utilities.”94 Fitch 22
affirmed that it expects regulated utilities “to extend 23
their conservative balance sheet stance in 2010,” and 24
92 Moody’s Investors Service, “Storm Clouds Gathering on the Horizon for the North American Electric Utility Sector,” Special Comment (Aug. 2007); “U.S. Electric Utility Sector,” Industry Outlook (Jan. 2008).
93 Moody’s Investors Service, “U.S. Electric Utilities Face Challenges Beyond Near-Term,” Industry Outlook (Jan. 2010).
94 Standard & Poor’s Corporation, “Ratings Roundup: U.S. Electric Utility Sector Maintained Strong Credit Quality In A Gloomy 2009,” RatingsDirect (Jan. 26, 2010).
DOCKET NO. ER10-____-000 EXHIBIT NO. TEC-200 FILED: 07/30/2010
96
employ “a judicious mix of debt and equity to finance 1
high levels of planned investments.”95 2
3
Q. What other factors do investors consider in their 4
assessment of capital structure? 5
6
A. Depending on their specific attributes, contractual 7
agreements that obligate the utility to make specified 8
payments may be treated as debt in evaluating a utility’s 9
financial risk. Because such obligations typically 10
require the utility to make specified minimum contractual 11
payments akin to those associated with traditional debt 12
financing, investors consider a portion of these 13
commitments as debt in evaluating total financial risks. 14
The implications of these obligations have been 15
repeatedly cited by major bond rating agencies in 16
connection with assessments of utility financial risks. 17
Because bond ratings agencies and investors consider the 18
debt impact of such fixed obligations in assessing a 19
utility’s financial position, they imply greater risk and 20
reduced financial flexibility.96 21
22
Q. What does this evidence suggest with respect to Tampa 23
95 Fitch Ratings Ltd., “U.S. Utilities, Power, and Gas 2010 Outlook,” Global Power North America Special Report (Dec. 4, 2009).
96 The capital structure ratios presented earlier do not include imputed debt associated with power purchase agreements or the impact of other off-balance sheet obligations.
DOCKET NO. ER10-____-000 EXHIBIT NO. TEC-200 FILED: 07/30/2010
97
Electric’s proposed capital structure? 1
2
A. Based on my evaluation, I concluded that Tampa Electric’s 3
proposed capital structure represents a reasonable mix of 4
capital sources from which to calculate Tampa Electric’s 5
overall rate of return. While a capital structure 6
consisting of 50.9 percent common equity exceeds the 7
average maintained by the companies in the Regional and 8
Ratings Screen Proxy Groups, it falls within the bounds 9
of the ranges for the two proxy groups and below the 10
average equity ratio maintained by the corresponding 11
electric utility operating companies. Moreover, long-12
standing Commission precedent reflects a clear preference 13
for using the actual capital structure of the utility in 14
establishing the overall rate of return.97 As the 15
Commission stated in Kentucky West Virginia, for example: 16
17
In our opinion a utility should be regulated on 18 the basis of its being an independent entity; 19 that is, a utility should be considered as 20 nearly as possible on its own merits.98 21
22
In fact, the Commission has specifically rejected the 23
notion that a utility’s capital structure must fall 24
97 See, e.g., Kentucky West Virginia, Opinion No. 7, 2 FERC ¶ 61,139 (1978); Transcontinental Gas Pipeline Corp., 84 FERC ¶ 61,084 (1998).
98 Kentucky West Virginia, Opinion No. 7, 2 FERC ¶ 61,139 at 61,325 (1978); quoting Fla. Gas Transmission Co., 47 FPC 341, (1972).
DOCKET NO. ER10-____-000 EXHIBIT NO. TEC-200 FILED: 07/30/2010
98
within the range of the proxy group to be considered 1
reasonable. In Transcontinental Gas Pipeline Corp, the 2
Commission noted that an appropriate capital structure 3
“can fall within a very broad range,” and concluded, 4
“[T]he Commission has determined that it will not 5
continue to require that a pipeline’s equity ratio be 6
within the range established by the proxy companies in 7
order to use the pipeline’s own capital structure.”99 The 8
Commission has affirmed application of these guidelines 9
in evaluating the capital structure of electric 10
utilities.100 11
12
While industry averages provide one benchmark for 13
comparison, each firm must select its capitalization 14
based on the risks and prospects it faces, as well as its 15
specific needs to access the capital markets. Financial 16
flexibility plays a crucial role in ensuring the 17
wherewithal to meet the needs of customers, and utilities 18
with higher leverage may be foreclosed from additional 19
borrowing, especially during times of stress. Because of 20
the Company’s obligation to serve, Tampa Electric must 21
maintain ready access to capital under reasonable terms 22
so that it can meet the service requirements of its 23
99 Transcontinental Gas Pipeline Corp., 84 FERC ¶ 61,084 at pp. 16-17 (1998). 100
See, e.g., Allegheny Power, Opinion No. 469, 106 FERC ¶ 61,241 (2004); Milford Power Co., LLC, 110 FERC ¶61,299 at P 73 (2005) (ruling that actual debt/equity ratios that can be substantiated are preferred over a proxy capital structure).
DOCKET NO. ER10-____-000 EXHIBIT NO. TEC-200 FILED: 07/30/2010
99
wholesale and retail customers. The need for access 1
becomes even more important when the company has capital 2
requirements over a period of years, and financing must 3
be continuously available, even during unfavorable 4
capital market conditions. 5
6
ROE Recommendation 7
Q. Please summarize the results of your analyses. 8
9
A. The cost of common equity estimates produced by the 10
various capital market oriented analyses described in my 11
testimony are summarized in Table WEA-4, below: 12
13
14
15
16
17
18
19
20
21
22
23
24
25
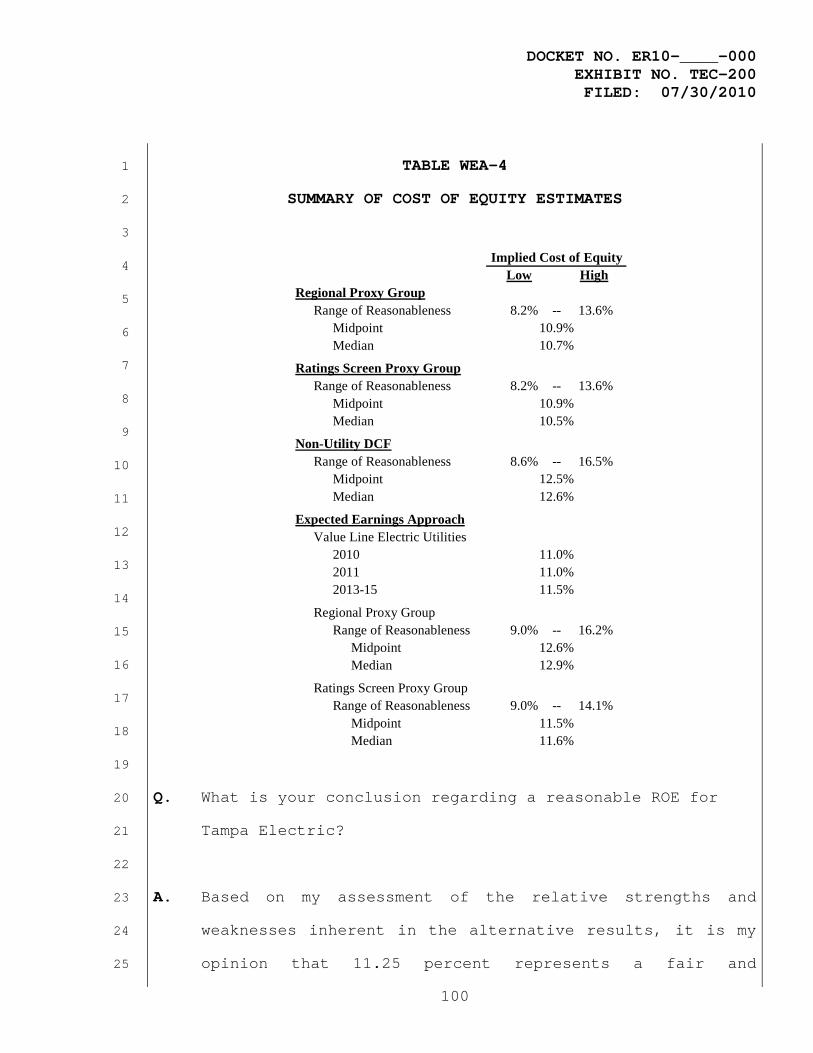
DOCKET NO. ER10-____-000 EXHIBIT NO. TEC-200 FILED: 07/30/2010
100
Low High
Regional Proxy GroupRange of Reasonableness 8.2% -- 13.6%
MidpointMedian
Ratings Screen Proxy GroupRange of Reasonableness 8.2% -- 13.6%
MidpointMedian
Non-Utility DCFRange of Reasonableness 8.6% -- 16.5%
MidpointMedian
Expected Earnings ApproachValue Line Electric Utilities
201020112013-15
Regional Proxy GroupRange of Reasonableness 9.0% -- 16.2%
MidpointMedian
Ratings Screen Proxy GroupRange of Reasonableness 9.0% -- 14.1%
MidpointMedian
11.5%11.6%
Implied Cost of Equity
10.9%10.7%
10.9%10.5%
11.0%11.0%11.5%
12.5%12.6%
12.6%12.9%
TABLE WEA-4 1
SUMMARY OF COST OF EQUITY ESTIMATES 2
3
4
5
6
7
8
9
10
11
12
13
14
15
16
17
18
19
Q. What is your conclusion regarding a reasonable ROE for 20
Tampa Electric? 21
22
A. Based on my assessment of the relative strengths and 23
weaknesses inherent in the alternative results, it is my 24
opinion that 11.25 percent represents a fair and 25
DOCKET NO. ER10-____-000 EXHIBIT NO. TEC-200 FILED: 07/30/2010
101
reasonable ROE for Tampa Electric. While my 11.25 percent 1
ROE recommendation exceeds the midpoint and median 2
produced for the Regional and Ratings Screen Proxy Groups 3
using the Commission’s DCF approach, it falls within the 4
ROE zones of reasonableness produced by these analyses. 5
Moreover, an ROE above the midpoint and median values 6
indicated by the Commission’s DCF method is supported by 7
reference to alternative ROE benchmarks, which 8
consistently support a higher allowed return. 9
10
Q. What other evidence is relevant in evaluating the results 11
of the Commission’s DCF approach? 12
13
A. Reference to the allowed rate of return for Tampa 14
Electric’s state-jurisdictional operations also provides 15
a useful guideline that can be used to assess the extent 16
to which the results of the FERC’s DCF approach are 17
comparable and sufficient. Currently, the FPSC has 18
established an ROE range of 10.25 percent to 12.25 19
percent for Tampa Electric, with a midpoint of 11.25 20
percent. These values were set by the FPSC in March 2009 21
as part of Tampa Electric’s base rate proceeding filed in 22
August 2008. 23
24
While the findings of the FPSC certainly do not limit the 25
DOCKET NO. ER10-____-000 EXHIBIT NO. TEC-200 FILED: 07/30/2010
102
Commission’s authority with respect to ROE, there would 1
be a disincentive to invest in FERC-jurisdictional 2
infrastructure if these utility assets would result in a 3
lower ROE. Moreover, the Commission’s long-standing 4
policy objective, as reflected in Order No. 679 and 5
numerous other decisions, has been to increase the level 6
of capital investment in electric utility facilities. In 7
allowing an incentive-based ROE for investments in new 8
transmission facilities, for example, the Commission 9
recognized the importance of providing an ROE that 10
overcomes obstacles to new projects and encourages 11
investment.101 The Commission noted that FERC-12
jurisdictional projects must compete for capital, and 13
that an incentive ROE would provide an effective tool to 14
foster new investment. 15
16
The level of past investment in wholesale utility 17
infrastructure has generally been deemed insufficient and 18
while there is no doubt a variety of strategic and 19
regulatory explanations for the reluctance of integrated 20
utilities to commit capital, there is also the 21
possibility that the ROE levels allowed in the past have 22
not been sufficient to attract new capital investment. 23
Hence, the prudent regulatory policy is to consider the 24
11.25 percent ROE that is currently allowed on Tampa 25
101 Order No. 679 at P 91.
DOCKET NO. ER10-____-000 EXHIBIT NO. TEC-200 FILED: 07/30/2010
103
Electric’s integrated utility assets. 1
2
Apart from the results of these quantitative methods, it 3
is crucial to recognize the importance of maintaining the 4
company’s financial position so that Tampa Electric 5
remains prepared to respond to unforeseen events that may 6
materialize in the future. While this imperative is 7
reinforced by recent capital market conditions, it 8
extends well beyond the financial markets and includes 9
the company’s ability to absorb potential shocks 10
associated with devastating hurricanes, volatile fuel 11
pricing, and disruptions in energy supply. My 12
conclusions are reinforced by the need to consider 13
flotation costs, and the fact that current cost of 14
capital estimates are likely to understate investors’ 15
requirements at the time the outcome of this proceeding 16
becomes effective and beyond. Coupled with the need to 17
provide an ROE that supports Tampa Electric’s credit 18
standing while funding necessary investments in utility 19
infrastructure, these considerations indicate that an 20
11.25 percent ROE is reasonable and appropriate. 21
22
Q. Does this conclude your direct testimony in this case? 23
24
A. Yes, it does. 25
DOCKET NO. ER10-____-000 WITNESS: AVERA
104
EXHIBITS
OF
WILLIAM E. AVERA
ON BEHALF OF TAMPA ELECTRIC COMPANY
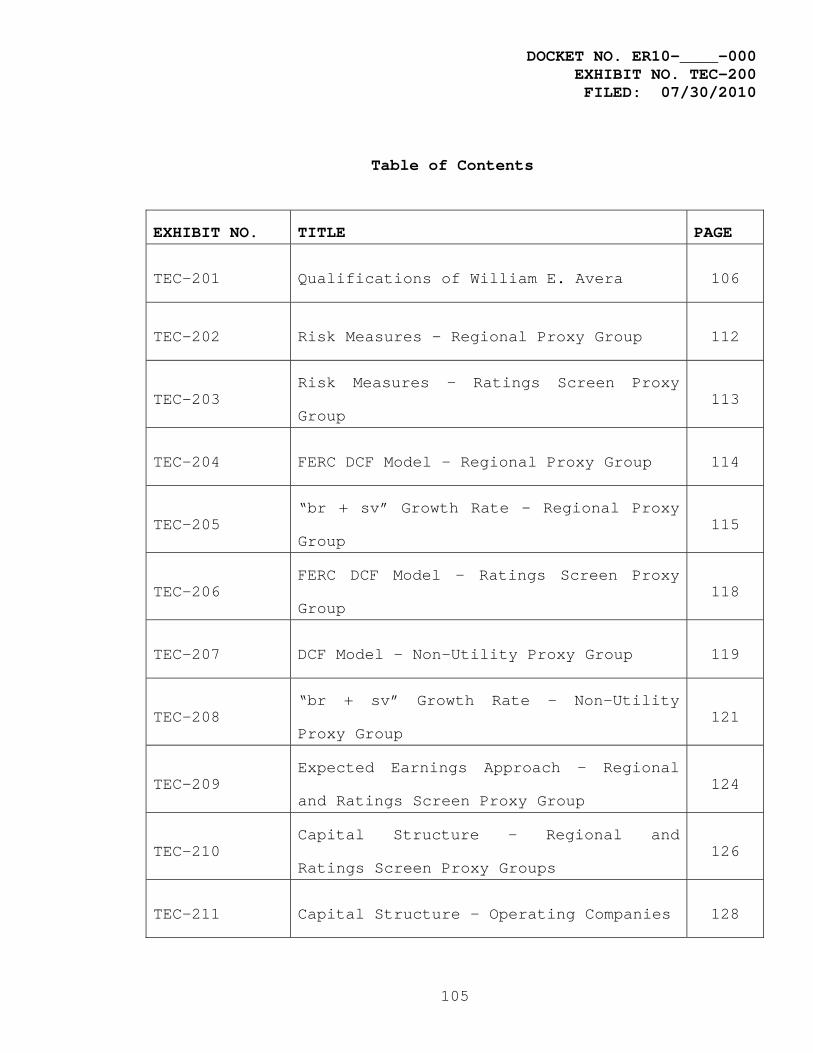
DOCKET NO. ER10-____-000 EXHIBIT NO. TEC-200 FILED: 07/30/2010
105
Table of Contents
EXHIBIT NO. TITLE PAGE
TEC-201 Qualifications of William E. Avera 106
TEC-202 Risk Measures – Regional Proxy Group 112
TEC-203 Risk Measures – Ratings Screen Proxy
Group 113
TEC-204 FERC DCF Model – Regional Proxy Group 114
TEC-205 “br + sv” Growth Rate – Regional Proxy
Group 115
TEC-206 FERC DCF Model – Ratings Screen Proxy
Group 118
TEC-207 DCF Model – Non-Utility Proxy Group 119
TEC-208 “br + sv” Growth Rate – Non-Utility
Proxy Group 121
TEC-209 Expected Earnings Approach – Regional
and Ratings Screen Proxy Group 124
TEC-210 Capital Structure – Regional and
Ratings Screen Proxy Groups 126
TEC-211 Capital Structure – Operating Companies 128
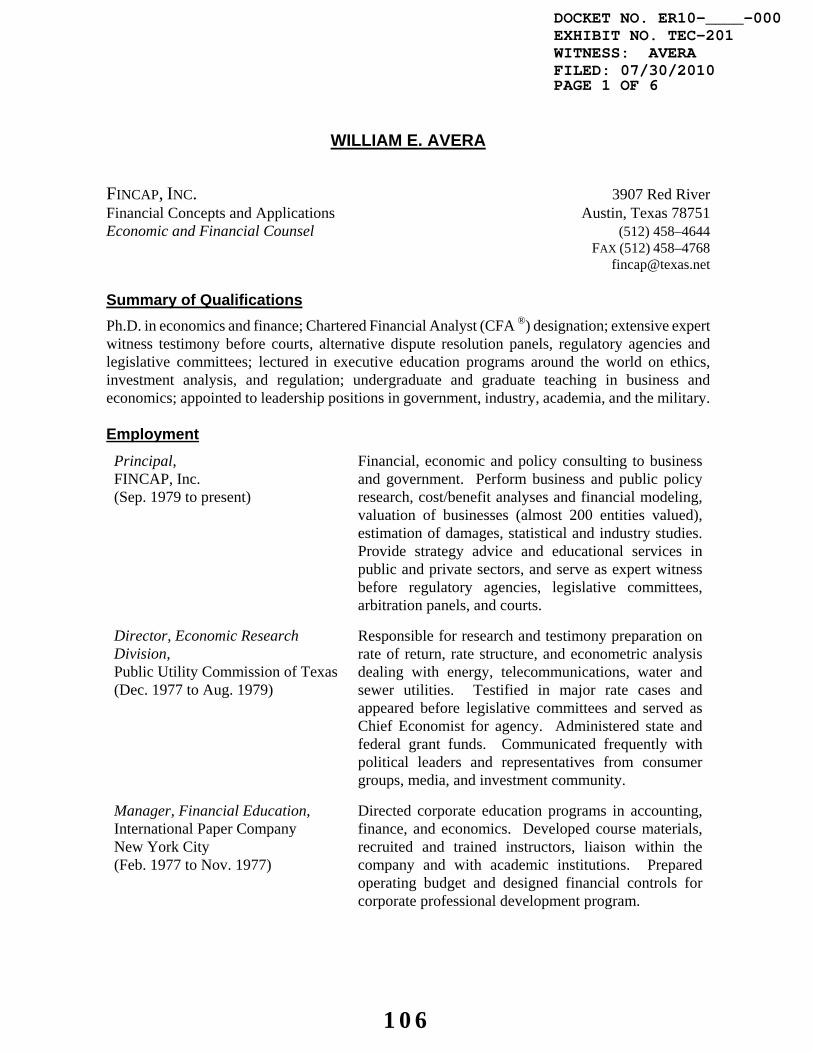
WILLIAM E. AVERA
FINCAP, INC. 3907 Red River Financial Concepts and Applications Austin, Texas 78751 Economic and Financial Counsel (512) 458–4644 FAX (512) 458–4768 [email protected] Summary of Qualifications Ph.D. in economics and finance; Chartered Financial Analyst (CFA ®) designation; extensive expert witness testimony before courts, alternative dispute resolution panels, regulatory agencies and legislative committees; lectured in executive education programs around the world on ethics, investment analysis, and regulation; undergraduate and graduate teaching in business and economics; appointed to leadership positions in government, industry, academia, and the military. Employment
Principal, FINCAP, Inc. (Sep. 1979 to present)
Financial, economic and policy consulting to business and government. Perform business and public policy research, cost/benefit analyses and financial modeling, valuation of businesses (almost 200 entities valued), estimation of damages, statistical and industry studies. Provide strategy advice and educational services in public and private sectors, and serve as expert witness before regulatory agencies, legislative committees, arbitration panels, and courts.
Director, Economic Research Division, Public Utility Commission of Texas (Dec. 1977 to Aug. 1979)
Responsible for research and testimony preparation on rate of return, rate structure, and econometric analysis dealing with energy, telecommunications, water and sewer utilities. Testified in major rate cases and appeared before legislative committees and served as Chief Economist for agency. Administered state and federal grant funds. Communicated frequently with political leaders and representatives from consumer groups, media, and investment community.
Manager, Financial Education, International Paper Company New York City (Feb. 1977 to Nov. 1977)
Directed corporate education programs in accounting, finance, and economics. Developed course materials, recruited and trained instructors, liaison within the company and with academic institutions. Prepared operating budget and designed financial controls for corporate professional development program.
DOCKET NO. ER10-____-000EXHIBIT NO. TEC-201WITNESS: AVERAFILED: 07/30/2010PAGE 1 OF 6
106
Lecturer in Finance, The University of Texas at Austin (Sep. 1979 to May 1981) Assistant Professor of Finance, (Sep. 1975 to May 1977)
Taught graduate and undergraduate courses in financial management and investment theory. Conducted research in business and public policy. Named Outstanding Graduate Business Professor and received various administrative appointments.
Assistant Professor of Business, University of North Carolina at
Chapel Hill (Sep. 1972 to Jul. 1975)
Taught in BBA, MBA, and Ph.D. programs. Created project course in finance, Financial Management for Women, and participated in developing Small Business Management sequence. Organized the North Carolina Institute for Investment Research, a group of financial institutions that supported academic research. Faculty advisor to the Media Board, which funds student publications and broadcast stations.
Education Ph.D., Economics and Finance, University of North Carolina at
Chapel Hill (Jan. 1969 to Aug. 1972)
Elective courses included financial management, public finance, monetary theory, and econometrics. Awarded the Stonier Fellowship by the American Bankers' Association and University Teaching Fellowship. Taught statistics, macroeconomics, and microeconomics. Dissertation: The Geometric Mean Strategy as a Theory of Multiperiod Portfolio Choice
B.A., Economics, Emory University, Atlanta, Georgia (Sep. 1961 to Jun. 1965)
Active in extracurricular activities, president of the Barkley Forum (debate team), Emory Religious Association, and Delta Tau Delta chapter. Individual awards and team championships at national collegiate debate tournaments.
Professional Associations Received Chartered Financial Analyst (CFA) designation in 1977; Vice President for Membership, Financial Management Association; President, Austin Chapter of Planning Executives Institute; Board of Directors, North Carolina Society of Financial Analysts; Candidate Curriculum Committee, Association for Investment Management and Research; Executive Committee of Southern Finance Association; Vice Chair, Staff Subcommittee on Economics and National Association of Regulatory Utility Commissioners (NARUC); Appointed to NARUC Technical Subcommittee on the National Energy Act. Teaching in Executive Education Programs University-Sponsored Programs: Central Michigan University, Duke University, Louisiana State University, National Defense University, National University of Singapore, Texas A&M University, University of Kansas, University of North Carolina, University of Texas.
DOCKET NO. ER10-____-000EXHIBIT NO. TEC-201WITNESS: AVERAFILED: 07/30/2010PAGE 2 OF 6
107

Business and Government-Sponsored Programs: Advanced Seminar on Earnings Regulation, American Public Welfare Association, Association for Investment Management and Research, Congressional Fellows Program, Cost of Capital Workshop, Electricity Consumers Resource Council, Financial Analysts Association of Indonesia, Financial Analysts Review, Financial Analysts Seminar at Northwestern University, Governor's Executive Development Program of Texas, Louisiana Association of Business and Industry, National Association of Purchasing Management, National Association of Tire Dealers, Planning Executives Institute, School of Banking of the South, State of Wisconsin Investment Board, Stock Exchange of Thailand, Texas Association of State Sponsored Computer Centers, Texas Bankers' Association, Texas Bar Association, Texas Savings and Loan League, Texas Society of CPAs, Tokyo Association of Foreign Banks, Union Bank of Switzerland, U.S. Department of State, U.S. Navy, U.S. Veterans
dministration, in addition to Texas state agencies and major corporations. A Presented papers for Mills B. Lane Lecture Series at the University of Georgia and Heubner Lectures at the University of Pennsylvania. Taught graduate courses in finance and economics for evening program at St. Edward's University in Austin from January 1979 through 1998. Expert Witness Testimony Testified in over 300 cases before regulatory agencies addressing cost of capital, regulatory policy, ate design, and other economic and financial issues. r
Federal Agencies: Federal Communications Commission, Federal Energy Regulatory Commission, Surface Transportation Board, Interstate Commerce Commission, and the Canadian
adio-Television and Telecommunications Commission. R State Regulatory Agencies: Alaska, Arizona, Arkansas, California, Colorado, Connecticut, Delaware, Florida, Georgia, Hawaii, Idaho, Illinois, Indiana, Iowa, Kansas, Kentucky, Maryland, Michigan, Missouri, Nevada, New Mexico, Montana, North Carolina, Ohio, Oklahoma, Oregon, Pennsylvania, South Carolina, South Dakota, Texas, Utah, Virginia, Washington, West Virginia,
isconsin, and Wyoming. W Testified in 42 cases before federal and state courts, arbitration panels, and alternative dispute tribunals (88 depositions given) regarding damages, valuation, antitrust liability, fiduciary duties, and other economic and financial issues. Board Positions and Other Professional Activities Audit Committee and Outside Director, Georgia System Operations Corporation (electric system operator for member-owned electric cooperatives in Georgia); Chairman, Board of Print Depot, Inc. and FINCAP, Inc.; Co-chair, Synchronous Interconnection Committee, appointed by Public Utility Commission of Texas and approved by governor; Appointed by Hays County Commission to Citizens Advisory Committee of Habitat Conservation Plan, Operator of AAA Ranch, a certified organic producer of agricultural products; Appointed to Organic Livestock Advisory Committee by Texas Agricultural Commissioner Susan Combs; Appointed by Texas Railroad Commissioners to study group for The UP/SP Merger: An Assessment of the Impacts on the State of Texas; Appointed by Hawaii Public Utilities Commission to team reviewing affiliate relationships of Hawaiian Electric Industries; Chairman, Energy Task Force, Greater Austin-San Antonio Corridor Council; Consultant to Public Utility Commission of Texas on cogeneration policy and other matters; Consultant to
DOCKET NO. ER10-____-000EXHIBIT NO. TEC-201WITNESS: AVERAFILED: 07/30/2010PAGE 3 OF 6
108
Public Service Commission of New Mexico on cogeneration policy; Evaluator of Energy Research Grant Proposals for Texas Higher Education Coordinating Board. Community Activities Board of Directors, Sustainable Food Center; Chair, Board of Deacons, Finance Committee, and Elder, Central Presbyterian Church of Austin; Founding Member, Orange-Chatham County (N.C.) Legal Aid Screening Committee. Military Captain, U.S. Naval Reserve (retired after 28 years service); Commanding Officer, Naval Special Warfare Engineering (SEAL) Support Unit; Officer-in-Charge of SWIFT patrol boat in Vietnam; Enlisted service as weather analyst (advanced to second class petty officer). Bibliography M onographs
Ethics and the Investment Professional (video, workbook, and instructor’s guide) and Ethics Challenge Today (video), Association for Investment Management and Research (1995)
“Definition of Industry Ethics and Development of a Code” and “Applying Ethics in the Real World,” in Good Ethics: The Essential Element of a Firm’s Success, Association for Investment Management and Research (1994)
“On the Use of Security Analysts’ Growth Projections in the DCF Model,” with Bruce H. Fairchild in Earnings Regulation Under Inflation, J. R. Foster and S. R. Holmberg, eds. Institute for Study of Regulation (1982)
An Examination of the Concept of Using Relative Customer Class Risk to Set Target Rates of Return in Electric Cost-of-Service Studies, with Bruce H. Fairchild, Electricity Consumers Resource Council (ELCON) (1981); portions reprinted in Public Utilities Fortnightly (Nov. 11, 1982)
“Usefulness of Current Values to Investors and Creditors,” Research Study on Current-Value Accounting Measurements and Utility, George M. Scott, ed., Touche Ross Foundation (1978)
“The Geometric Mean Strategy and Common Stock Investment Management,” with Henry A. Latané in Life Insurance Investment Policies, David Cummins, ed. (1977)
Investment Companies: Analysis of Current Operations and Future Prospects, with J. Finley Lee and Glenn L. Wood, American College of Life Underwriters (1975)
A rticles
“Should Analysts Own the Stocks they Cover?” The Financial Journalist, (March 2002) “Liquidity, Exchange Listing, and Common Stock Performance,” with John C. Groth and Kerry
Cooper, Journal of Economics and Business (Spring 1985); reprinted by National Association of Security Dealers
“The Energy Crisis and the Homeowner: The Grief Process,” Texas Business Review (Jan.–Feb. 1980); reprinted in The Energy Picture: Problems and Prospects, J. E. Pluta, ed., Bureau of Business Research (1980)
“Use of IFPS at the Public Utility Commission of Texas,” Proceedings of the IFPS Users Group Annual Meeting (1979)
DOCKET NO. ER10-____-000EXHIBIT NO. TEC-201WITNESS: AVERAFILED: 07/30/2010PAGE 4 OF 6
109
"Production Capacity Allocation: Conversion, CWIP, and One-Armed Economics,” Proceedings of the NARUC Biennial Regulatory Information Conference (1978)
"Some Thoughts on the Rate of Return to Public Utility Companies,” with Bruce H. Fairchild in Proceedings of the NARUC Biennial Regulatory Information Conference (1978)
"A New Capital Budgeting Measure: The Integration of Time, Liquidity, and Uncertainty,” with David Cordell in Proceedings of the Southwestern Finance Association (1977)
"Usefulness of Current Values to Investors and Creditors,” in Inflation Accounting/Indexing and Stock Behavior (1977)
"Consumer Expectations and the Economy,” Texas Business Review (Nov. 1976) "Portfolio Performance Evaluation and Long-run Capital Growth,” with Henry A. Latané in
Proceedings of the Eastern Finance Association (1973) Book reviews in Journal of Finance and Financial Review. Abstracts for CFA Digest. Articles in
Carolina Financial Times. S elected Papers and Presentations
“Economic Perspective on Water Marketing in Texas,” 2009 Water Law Institute, The University of Texas School of Law, Austin, TX (Dec. 2009).
“Estimating Utility Cost of Equity in Financial Turmoil,” SNL EXNET 15th Annual FERC Briefing, Washington, D.C. (Mar. 2009)
"The Who, What, When, How, and Why of Ethics," San Antonio Financial Analysts Society (Jan. 16, 2002). Similar presentation given to the Austin Society of Financial Analysts (Jan. 17, 2002)
“Ethics for Financial Analysts,” Sponsored by Canadian Council of Financial Analysts: delivered in Calgary, Edmonton, Regina, and Winnipeg, June 1997. Similar presentations given to Austin Society of Financial Analysts (Mar. 1994), San Antonio Society of Financial Analysts (Nov. 1985), and St. Louis Society of Financial Analysts (Feb. 1986)
“Cost of Capital for Multi-Divisional Corporations,” Financial Management Association, New Orleans, Louisiana (Oct. 1996)
"Ethics and the Treasury Function,” Government Treasurers Organization of Texas, Corpus Christi, Texas (Jun. 1996)
"A Cooperative Future,” Iowa Association of Electric Cooperatives, Des Moines (December 1995). Similar presentations given to National G & T Conference, Irving, Texas (June 1995), Kentucky Association of Electric Cooperatives Annual Meeting, Louisville (Nov. 1994), Virginia, Maryland, and Delaware Association of Electric Cooperatives Annual Meeting, Richmond (July 1994), and Carolina Electric Cooperatives Annual Meeting, Raleigh (Mar. 1994)
"Information Superhighway Warnings: Speed Bumps on Wall Street and Detours from the Economy,” Texas Society of Certified Public Accountants Natural Gas, Telecommunications and Electric Industries Conference, Austin (Apr. 1995)
"Economic/Wall Street Outlook,” Carolinas Council of the Institute of Management Accountants, Myrtle Beach, South Carolina (May 1994). Similar presentation given to Bell Operating Company Accounting Witness Conference, Santa Fe, New Mexico (Apr. 1993)
"Regulatory Developments in Telecommunications,” Regional Holding Company Financial and Accounting Conference, San Antonio (Sep. 1993)
DOCKET NO. ER10-____-000EXHIBIT NO. TEC-201WITNESS: AVERAFILED: 07/30/2010PAGE 5 OF 6
110
“Estimating the Cost of Capital During the 1990s: Issues and Directions,” The National Society of Rate of Return Analysts, Washington, D.C. (May 1992)
“Making Utility Regulation Work at the Public Utility Commission of Texas,” Center for Legal and Regulatory Studies, University of Texas, Austin (June 1991)
"Can Regulation Compete for the Hearts and Minds of Industrial Customers,” Emerging Issues of Competition in the Electric Utility Industry Conference, Austin (May 1988)
"The Role of Utilities in Fostering New Energy Technologies,” Emerging Energy Technologies in Texas Conference, Austin (Mar. 1988)
"The Regulators’ Perspective,” Bellcore Economic Analysis Conference, San Antonio (Nov. 1987) "Public Utility Commissions and the Nuclear Plant Contractor,” Construction Litigation
Superconference, Laguna Beach, California (Dec. 1986) "Development of Cogeneration Policies in Texas,” University of Georgia Fifth Annual Public
Utilities Conference, Atlanta (Sep. 1985) "Wheeling for Power Sales,” Energy Bureau Cogeneration Conference, Houston (Nov. 1985). "Asymmetric Discounting of Information and Relative Liquidity: Some Empirical Evidence for
Common Stocks" (with John Groth and Kerry Cooper), Southern Finance Association, New Orleans (Nov. 1982)
“Used and Useful Planning Models,” Planning Executive Institute, 27th Corporate Planning Conference, Los Angeles (Nov. 1979)
"Staff Input to Commission Rate of Return Decisions,” The National Society of Rate of Return Analysts, New York (Oct. 1979)
""Discounted Cash Life: A New Measure of the Time Dimension in Capital Budgeting,” with David Cordell, Southern Finance Association, New Orleans (Nov. 1978)
“The Relative Value of Statistics of Ex Post Common Stock Distributions to Explain Variance,” with Charles G. Martin, Southern Finance Association, Atlanta (Nov. 1977)
“An ANOVA Representation of Common Stock Returns as a Framework for the Allocation of Portfolio Management Effort,” with Charles G. Martin, Financial Management Association, Montreal (Oct. 1976)
“A Growth-Optimal Portfolio Selection Model with Finite Horizon,” with Henry A. Latané, American Finance Association, San Francisco (Dec. 1974)
“An Optimal Approach to the Finance Decision,” with Henry A. Latané, Southern Finance Association, Atlanta (Nov. 1974)
“A Pragmatic Approach to the Capital Structure Decision Based on Long-Run Growth,” with Henry A. Latané, Financial Management Association, San Diego (Oct. 1974)
“Growth Rates, Expected Returns, and Variance in Portfolio Selection and Performance Evaluation,” with Henry A. Latané, Econometric Society, Oslo, Norway (Aug. 1973)
DOCKET NO. ER10-____-000EXHIBIT NO. TEC-201WITNESS: AVERAFILED: 07/30/2010PAGE 6 OF 6
111
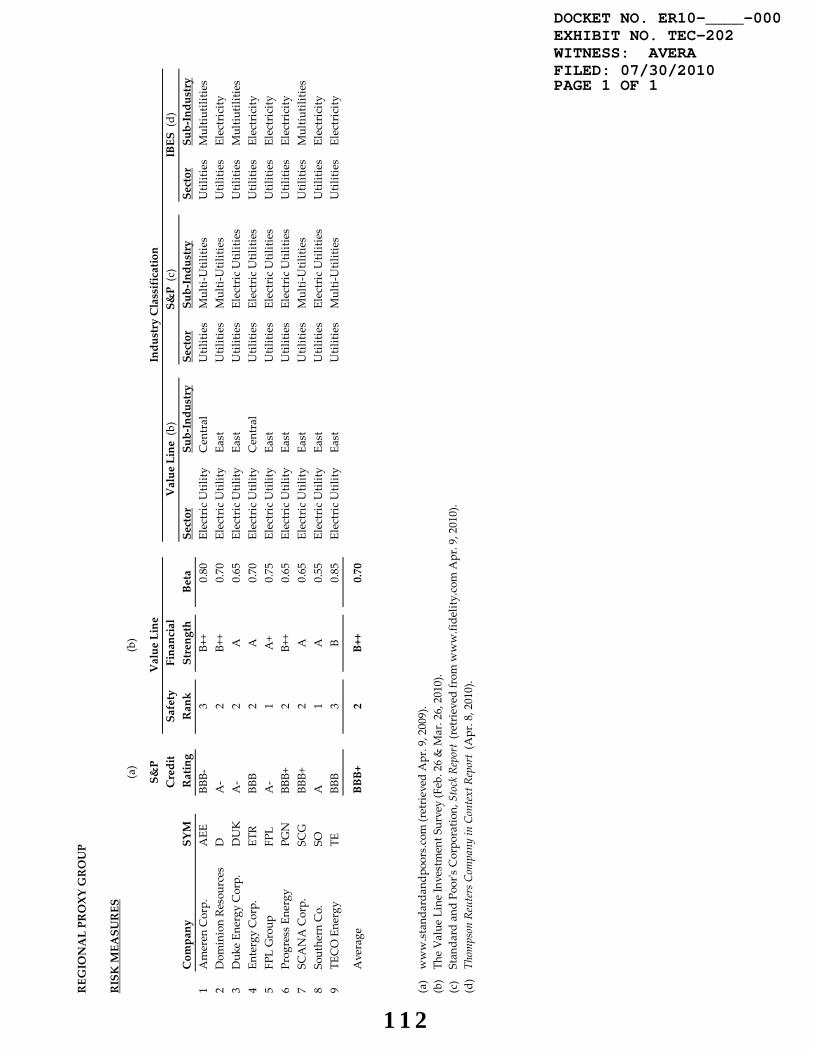
IBES (d
)Val
Li
REGIONAL PROXY GROUP
RISK MEASURES
(a)
(b)
S&P
Value
Industry Classification
neCredit
Safety
Financial
ue Line (b
)S&P (c)
Company
SYM
Rating
Rank
Strength
Beta
Sector
Sub‐Industry
Sector
Sub‐Industry
Sector
Sub‐Industry
1
Ameren Corp.
AEE
BBB‐
3B+
+0.80
Electric Ut ility
Central
Utilities
Multi‐Utilities
Utilities
Multiu
tilities
2
Dom
inion Re
sources
DA‐
2B+
+0.70
Electric Ut ilit y
East
Utilities
Multi‐Utilities
Utilities
Electricity
3
Duk
e En
ergy Corp.
DUK
A‐
2A
0.65
Electric Utility
East
Utilities
Electric Utilities
Utilities
Multiu
tilities
4
Entergy Corp.
ETR
BBB
2A
0.70
Electric Ut ilit y
Central
Utilities
Electric Utilities
Utilities
Electricity
5
FPL Group
FPL
A‐
1A+
0.75
Electric Utility
East
Utilities
Electric Utilities
Utilities
Electricity
6
Prog
ress Energy
PGN
BBB+
2B+
+0.65
Electric Utility
East
Utilities
Electric Utilities
Utilities
Electricity
7
SCANA Corp.
SCG
BBB+
2A
0.65
Electric Utility
East
Utilities
Multi‐Utilities
Utilities
Multiu
tilities
8
Southern Co.
SOA
1A
0.55
Electric Ut ilit y
East
Utilities
Electric Utilities
Utilities
Electricity
9
TECO Energy
TEBB
B3
B0.85
Electric Utility
East
Utilities
Multi‐Utilities
Utilities
Electricity
Average
BBB+
2B++
0.70
(a)
www.stand
arda
ndpo
ors.com (retrieved Apr. 9, 2009).
(b)
The Value Line Investment S
urvey (Feb. 26 & M
ar. 26, 2010).
(c)
Stan
dard and Poorʹs Corpo
ratio
n, Stock Report (retrieved from w
ww.fide
lity.com Apr. 9, 2010).
(d)Thompson Reuters Company in Context Report (A
pr. 8, 2010).
DOCKET NO. ER10-____-000EXHIBIT NO. TEC-202WITNESS: AVERAFILED: 07/30/2010PAGE 1 OF 1
112
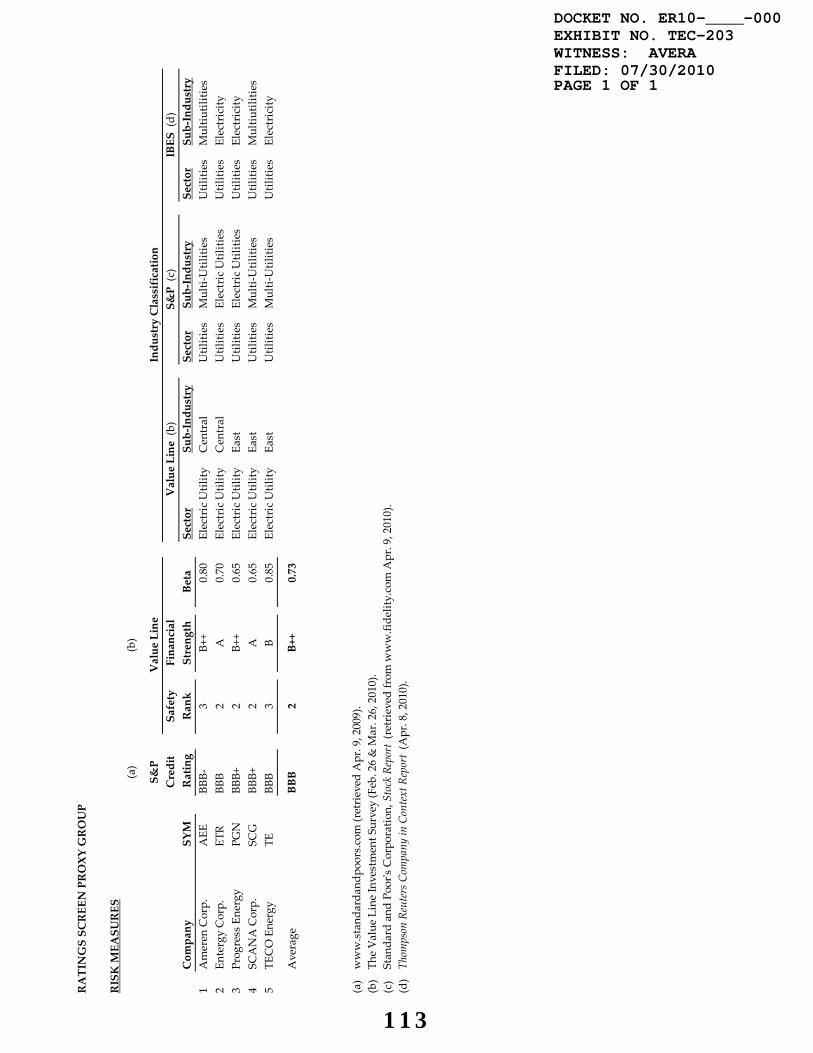
IBES (d
)Val
Li
RATINGS SCREEN PROXY GROUP
RISK MEASURES
(a)
(b)
S&P
Value
Industry Classification
neCredit
Safety
Financial
ue Line (b
)S&P (c)
Company
SYM
Rating
Rank
Strength
Beta
Sector
Sub‐Industry
Sector
Sub‐Industry
Sector
Sub‐Industry
1
Ameren Corp.
AEE
BBB‐
3B+
+0.80
Electric Ut ility
Central
Utilities
Multi‐Utilities
Utilities
Multiu
tilities
2
Entergy Corp.
ETR
BBB
2A
0.70
Electric Ut ilit y
Central
Utilities
Electric Utilities
Utilities
Electricity
3
Prog
ress Energy
PGN
BBB+
2B+
+0.65
Electric Utility
East
Utilities
Electric Utilities
Utilities
Electricity
4
SCANA Corp.
SCG
BBB+
2A
0.65
Electric Utility
East
Utilities
Multi‐Utilities
Utilities
Multiu
tilities
5
TECO Energy
TEBB
B3
B0.85
Electric Utility
East
Utilities
Multi‐Utilities
Utilities
Electricity
Average
BBB
2B++
0.73
(a)
www.stand
arda
ndpo
ors.com (retrieved Apr. 9, 2009).
(b)
The Value Line Investment S
urvey (Feb. 26 & M
ar. 26, 2010).
(c)
Stan
dard and Poorʹs Corpo
ratio
n, Stock Report (retrieved from w
ww.fide
lity.com Apr. 9, 2010).
(d)Thompson Reuters Company in Context Report (A
pr. 8, 2010).
DOCKET NO. ER10-____-000EXHIBIT NO. TEC-203WITNESS: AVERAFILED: 07/30/2010PAGE 1 OF 1
113
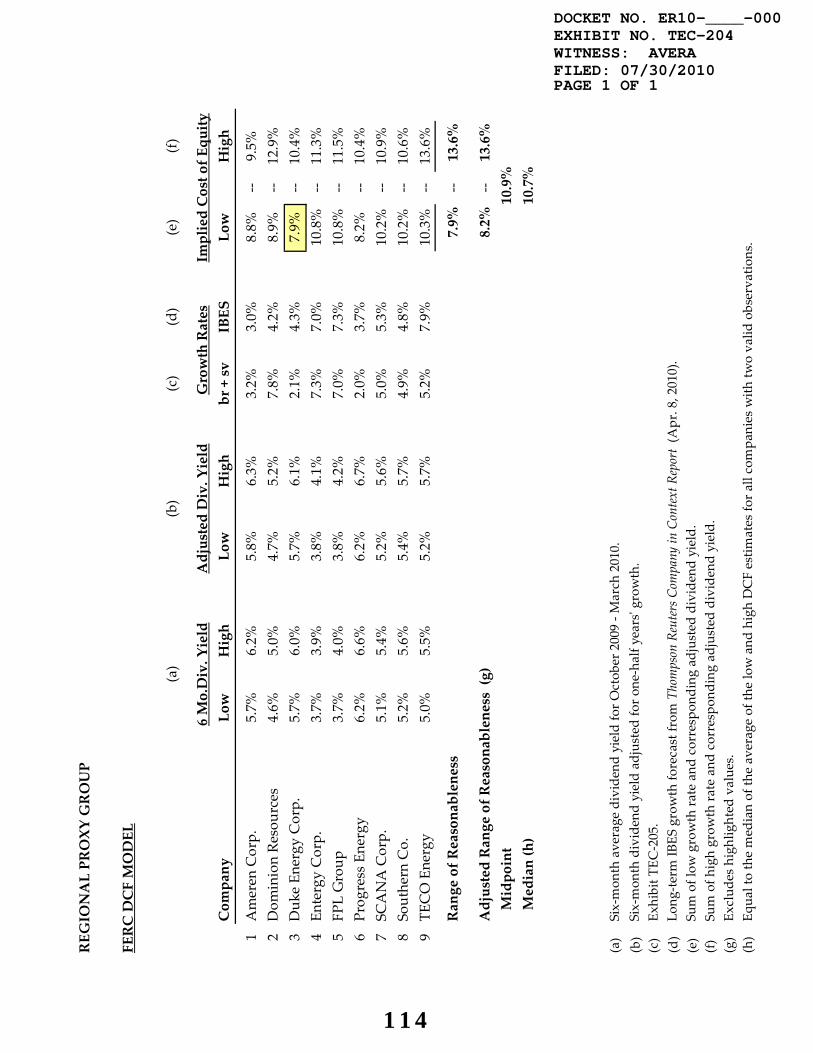
REGIONAL PROXY GROUP
FERC DCF MODEL
(a)
(b)
(c)
(d)
(e)
(f)
Implied Cost of Equity
Company
Low
High
Low
High
br + sv
IBES
Low
High
1 A
meren Corp.
5.7%
6.2%
5.8%
6.3%
3.2%
3.0%
8.8%
‐‐9.5%
2 D
ominion Resou
rces
4.6%
5.0%
4.7%
5.2%
7.8%
4.2%
8.9%
‐‐12.9%
3 D
uke En
ergy Corp.
5.7%
6.0%
5.7%
6.1%
2.1%
4.3%
7.9%
‐‐10.4%
4 E
ntergy Corp.
3.7%
3.9%
3.8%
4.1%
7.3%
7.0%
10.8%
‐‐11.3%
5 F
PL Group
3.7%
4.0%
3.8%
4.2%
7.0%
7.3%
10.8%
‐‐11.5%
6 P
rogress En
ergy
6.2%
6.6%
6.2%
6.7%
2.0%
3.7%
8.2%
‐‐10.4%
7 S
CANA Corp.
5.1%
5.4%
5.2%
5.6%
5.0%
5.3%
10.2%
‐‐10.9%
8 S
outhern Co.
5.2%
5.6%
5.4%
5.7%
4.9%
4.8%
10.2%
‐‐10.6%
9 T
ECO Energy
5.0%
5.5%
5.2%
5.7%
5.2%
7.9%
10.3%
‐‐13.6%
Range of Reasonableness
7.9%
‐‐13.6%
Adjusted Range of Reasonableness (g)
8.2%
‐‐13.6%
Midpoint
Median (h)
(a)
(b)
Six‐mon
th dividend yield ad
justed fo
r one‐half y
earsʹ growth.
(c)
Exhibit T
EC‐205.
(d)
Long‐te
rm IB
ES growth fo
recast from Thompson Reuters Company in Context Report (A
pr. 8, 2010).
(e)
Sum of low growth ra
te and correspon
ding adjusted divide
nd yield.
(f)Su
m of h
igh grow
th ra
te and correspon
ding adjusted divide
nd yield.
(g)
Exclud
es highlighted values.
(h)
Equa
l to the med
ian of th
e average of th
e low and high DCF estim
ates fo
r all compa
nies with tw
o valid observatio
ns.
Six‐mon
th average dividend yield for O
ctob
er 2009 ‐ M
arch 2010.
6 Mo.Div. Yield
Adjusted Div. Yield
Growth Rates
10.7%
10.9%
DOCKET NO. ER10-____-000EXHIBIT NO. TEC-204WITNESS: AVERAFILED: 07/30/2010PAGE 1 OF 1
114
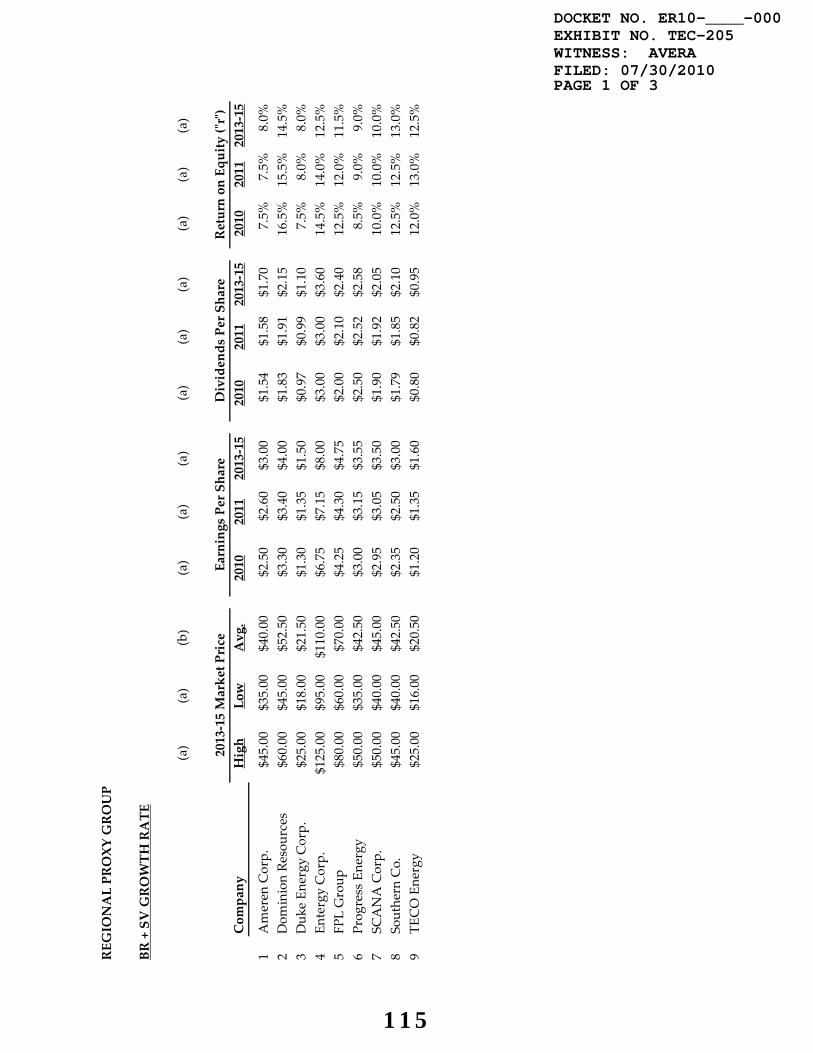
REGIONAL PROXY GROUP
BR + SV GROWTH RATE
(a)
(a)
(b)
(a)
(a)
(a)
(a)
(a)
(a)
(a)
(a)
(a)
Company
High
Low
Avg.
2010
2011
2013‐15
2010
2011
2013‐15
2010
2011
2013‐15
1
Ameren Corp.
$45.00
$35.00
$40.00
$2.50
$2.60
$3.00
$1.54
$1.58
$1.70
7.5%
7.5%
8.0%
2
Dom
inion Re
sources
$60.00
$45.00
$52.50
$3.30
$3.40
$4.00
$1.83
$1.91
$2.15
16.5%
15.5%
14.5%
3
Duk
e En
ergy Corp.
$25.00
$18.00
$21.50
$1.30
$1.35
$1.50
$0.97
$0.99
$1.10
7.5%
8.0%
8.0%
4
Entergy Corp.
$125.00
$95.00
$110.00
$6.75
$7.15
$8.00
$3.00
$3.00
$3.60
14.5%
14.0%
12.5%
5
FPL Group
$80.00
$60.00
$70.00
$4.25
$4.30
$4.75
$2.00
$2.10
$2.40
12.5%
12.0%
11.5%
6
Prog
ress Energy
$50.00
$35.00
$42.50
$3.00
$3.15
$3.55
$2.50
$2.52
$2.58
8.5%
9.0%
9.0%
7
SCANA Corp.
$50.00
$40.00
$45.00
$2.95
$3.05
$3.50
$1.90
$1.92
$2.05
10.0%
10.0%
10.0%
8
Southern Co.
$45.00
$40.00
$42.50
$2.35
$2.50
$3.00
$1.79
$1.85
$2.10
12.5%
12.5%
13.0%
9
TECO Energy
$25.00
$16.00
$20.50
$1.20
$1.35
$1.60
$0.80
$0.82
$0.95
12.0%
13.0%
12.5%
2013‐15 Market Price
Earnings Per Share
Dividends Per Share
Return on Equity (ʺrʺ)
DOCKET NO. ER10-____-000EXHIBIT NO. TEC-205WITNESS: AVERAFILED: 07/30/2010PAGE 1 OF 3
115

REGIONAL PROXY GROUP
BR + SV GROWTH RATE
(c)
(c)
(c)
(d)
(d)
(a)
(a)
(e)
(a)
(a)
(e)
(f)(g)
(h)
Total
EquityCommon
Total
EquityCommon
Chg in
Adj.
Adj.
Company
2010
2011
2013‐15
br
Capital
Ratio
Equity
Capital
Ratio
Equity
Equity
Factor
r
1
Ameren Corp.
38.4%
39.2%
43.3%
40.3%
7.7%
$15,991
49.1%
$7,852
$18,500
52.5%
$9,713
4.3%
1.0213
7.8%
2
Dom
inion Re
sources
44.5%
43.8%
46.3%
44.9%
15.5%
$26,976
41.7%
$11,249
$38,100
45.5%
$17,336
9.0%
1.0432
16.2%
3
Duk
e En
ergy Corp.
25.4%
26.7%
26.7%
26.2%
7.8%
$37,999
57.6%
$21,887
$49,000
51.0%
$24,990
2.7%
1.0133
7.9%
4
Entergy Corp.
55.6%
58.0%
55.0%
56.2%
13.7%
$19,985
43.1%
$8,614
$26,700
44.5%
$11,882
6.6%
1.0322
14.1%
5
FPL Group
52.9%
51.2%
49.5%
51.2%
12.0%
$29,272
44.3%
$12,967
$43,800
43.0%
$18,834
7.8%
1.0373
12.4%
6
Prog
ress Energy
16.7%
20.0%
27.3%
21.3%
8.8%
$20,530
46.0%
$9,444
$23,700
47.5%
$11,258
3.6%
1.0176
9.0%
7
SCANA Corp.
35.6%
37.0%
41.4%
38.0%
10.0%
$7,891
43.2%
$3,409
$11,125
46.5%
$5,173
8.7%
1.0417
10.4%
8
Southern Co.
23.8%
26.0%
30.0%
26.6%
12.7%
$34,225
43.5%
$14,888
$46,000
44.5%
$20,470
6.6%
1.0318
13.1%
9
TECO Energy
33.3%
39.3%
40.6%
37.7%
12.5%
$5,287
39.4%
$2,083
$6,375
43.5%
$2,773
5.9%
1.0286
12.9%
2009
2013‐15
Retention Ratio ʺbʺ
Average
Adjusted ʺrʺ
DOCKET NO. ER10-____-000EXHIBIT NO. TEC-205WITNESS: AVERAFILED: 07/30/2010PAGE 2 OF 3
116
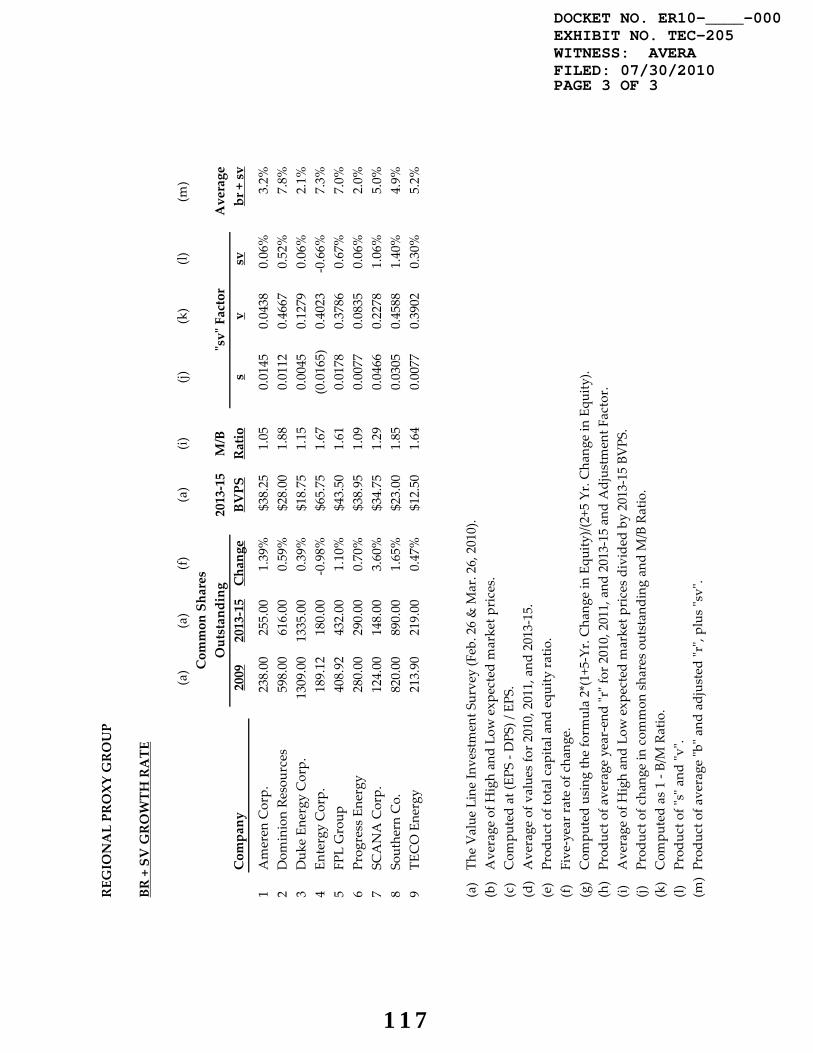
REGIONAL PROXY GROUP
BR + SV GROWTH RATE
(a)
(a)
(f)(a)
(i)(j)
(k)
(l)(m
)
2013‐15
M/B
Average
Company
2009
2013‐15Change
BVPS
Ratio
sv
svbr + sv
1
Ameren Corp.
238.00
255.00
1.39%
$38.25
1.05
0.0145
0.0438
0.06%
3.2%
2
Dom
inion Re
sources
598.00
616.00
0.59%
$28.00
1.88
0.0112
0.4667
0.52%
7.8%
3
Duk
e En
ergy Corp.
1309.00
1335.00
0.39%
$18.75
1.15
0.0045
0.1279
0.06%
2.1%
4
Entergy Corp.
189.12
180.00
‐0.98%
$65.75
1.67
(0.0165)
0.4023
‐0.66%
7.3%
5
FPL Group
408.92
432.00
1.10%
$43.50
1.61
0.0178
0.3786
0.67%
7.0%
6
Prog
ress Energy
280.00
290.00
0.70%
$38.95
1.09
0.0077
0.0835
0.06%
2.0%
7
SCANA Corp.
124.00
148.00
3.60%
$34.75
1.29
0.0466
0.2278
1.06%
5.0%
8
Southern Co.
820.00
890.00
1.65%
$23.00
1.85
0.0305
0.4588
1.40%
4.9%
9
TECO Energy
213.90
219.00
0.47%
$12.50
1.64
0.0077
0.3902
0.30%
5.2%
(a)
The Value Line Investment S
urvey (Feb. 26 & M
ar. 26, 2010).
(b)
Average of H
igh an
d Lo
w exp
ected market p
rices.
(c)
Com
puted at (E
PS ‐ DPS
) / EPS
.(d)
Average of v
alues for 2
010, 2011, and 2013‐15.
(e)
Prod
uct o
f total cap
ital and equ
ity ra
tio.
(f)Five‐year rate of cha
nge.
(g)
Com
puted using the form
ula 2*(1+5‐Yr. Cha
nge in Equ
ity)/(2+5 Yr. C
hang
e in Equ
ity).
(h)
Prod
uct o
f average year‐end ʺrʺ for 2010, 2011, and 2013‐15 and Adjustm
ent F
actor.
(i)Average of H
igh an
d Lo
w exp
ected market p
rices divide
d by 2013‐15 BVPS
.(j)
Prod
uct o
f cha
nge in com
mon sha
res ou
tstand
ing an
d M/B Ratio.
(k)
Com
puted as 1 ‐ B/M Ratio.
(l)Prod
uct o
f ʺsʺ and ʺvʺ.
(m)Prod
uct o
f average ʺbʺ a
nd adjusted ʺrʺ, plus ʺsvʺ.
ʺsvʺ Factor
Outstanding
Common Shares
DOCKET NO. ER10-____-000EXHIBIT NO. TEC-205WITNESS: AVERAFILED: 07/30/2010PAGE 3 OF 3
117
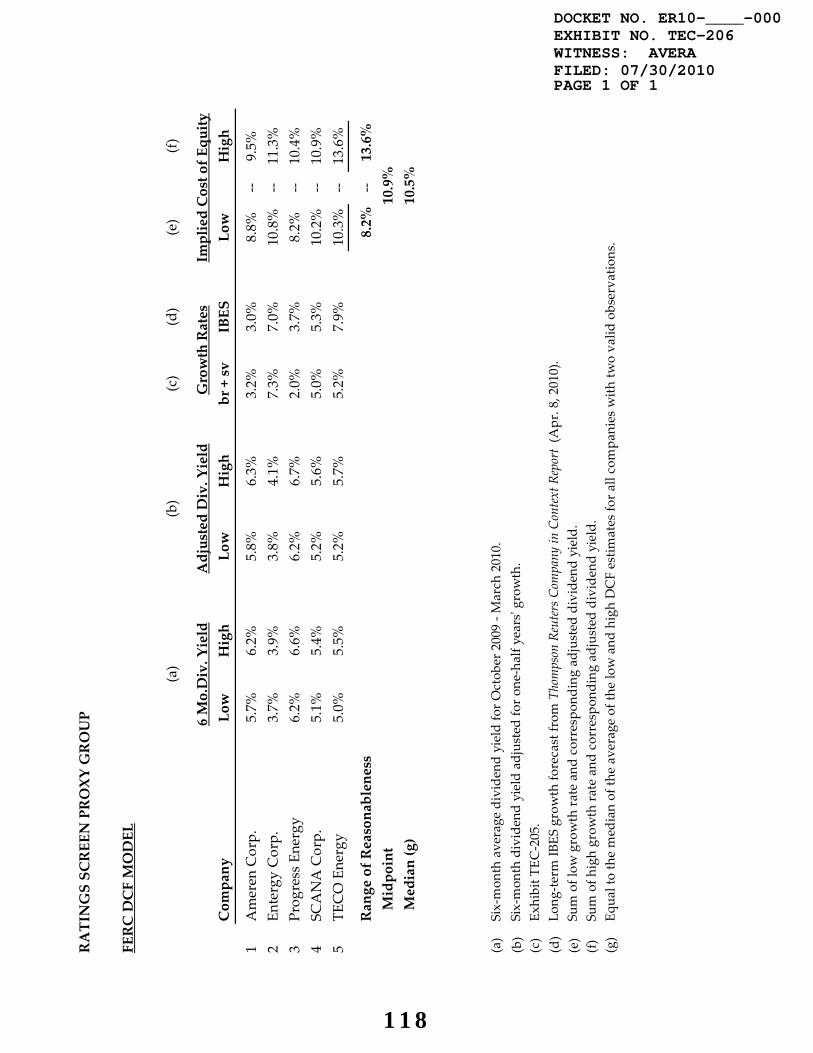
RATINGS SCREEN PROXY GROUP
FERC DCF MODEL
(a)
(b)
(c)
(d)
(e)
(f)
Implied Cost of Equity
Company
Low
High
Low
High
br + sv
IBES
Low
High
1
Ameren Corp.
5.7%
6.2%
5.8%
6.3%
3.2%
3.0%
8.8%
‐‐9.5%
2
Entergy Corp.
3.7%
3.9%
3.8%
4.1%
7.3%
7.0%
10.8%
‐‐11.3%
3
Prog
ress Energy
6.2%
6.6%
6.2%
6.7%
2.0%
3.7%
8.2%
‐‐10.4%
4
SCANA Corp.
5.1%
5.4%
5.2%
5.6%
5.0%
5.3%
10.2%
‐‐10.9%
5
TECO Energy
5.0%
5.5%
5.2%
5.7%
5.2%
7.9%
10.3%
‐‐13.6%
Range of Reasonableness
8.2%
‐‐13.6%
Midpoint
Median (g)
(a)
(b)
Six‐mon
th dividend yield ad
justed fo
r one‐half y
earsʹ growth.
(c)
Exhibit T
EC‐205.
(d)
Long‐te
rm IB
ES growth fo
recast from Thompson Reuters Company in Context Report (A
pr. 8, 2010).
(e)
Sum of low growth ra
te and correspon
ding adjusted divide
nd yield.
(f)Su
m of h
igh grow
th ra
te and correspon
ding adjusted divide
nd yield.
(g)
Equa
l to the med
ian of th
e average of th
e low and high DCF estim
ates fo
r all compa
nies with tw
o valid observatio
ns.
Six‐mon
th average dividend yield for O
ctob
er 2009 ‐ M
arch 2010.
6 Mo.Div. Yield
Adjusted Div. Yield
Growth Rates
10.5%
10.9%
DOCKET NO. ER10-____-000EXHIBIT NO. TEC-206WITNESS: AVERAFILED: 07/30/2010PAGE 1 OF 1
118

DCF MODEL
NON‐UTILITY PROXY GROUP
(a) (b) (d) (e) (e)
DividendCompany Yield IBES br+sv Low High
1 3M Company 2.53% 11.4% 15.8% 13.9% ‐‐ 18.4%2 Abbott Labs. 3.37% 11.5% 15.1% 14.9% ‐‐ 18.5%3 Alberto‐Culver 1.31% 12.5% 8.1% 9.4% ‐‐ 13.8%4 Allergan, Inc. 0.32% 13.6% 16.1% 13.9% ‐‐ 16.4%5 Automatic Data Proc. 3.10% 10.9% 10.9% 14.0% ‐‐ 14.0%6 Bard (C.R.) 0.81% 11.5% 15.5% 12.3% ‐‐ 16.4%7 Baxter Intʹl Inc. 2.08% 11.8% 15.7% 13.9% ‐‐ 17.7%8 Becton, Dickinson 1.88% 11.2% 13.2% 13.1% ‐‐ 15.1%9 Bemis Co. 3.15% 7.0% 9.9% 10.2% ‐‐ 13.0%10 Bristol‐Myers Squibb 4.89% 2.4% 4.3% 7.3% ‐‐ 9.2%11 Brown‐Forman ʹBʹ 2.05% 8.6% 13.2% 10.7% ‐‐ 15.2%12 Chevron Corp. 3.50% 16.2% 17.7% 19.7% ‐‐ 21.2%13 Chubb Corp. 2.86% 9.2% 9.3% 12.1% ‐‐ 12.1%14 Coca‐Cola 3.27% 8.5% 11.9% 11.8% ‐‐ 15.1%15 Colgate‐Palmolive 2.51% 9.0% 15.7% 11.5% ‐‐ 18.2%16 Commerce Bancshs. 2.28% 6.7% 8.3% 9.0% ‐‐ 10.5%17 ConAgra Foods 3.18% 9.9% 6.5% 9.7% ‐‐ 13.1%
Growth Rates Implied Cost of Equity
17 ConAgra Foods 3.18% 9.9% 6.5% 9.7% ‐‐ 13.1%18 Costco Wholesale 1.18% 13.7% 9.8% 10.9% ‐‐ 14.9%19 CVS Caremark Corp. 0.96% 11.8% 8.2% 9.2% ‐‐ 12.8%20 Ecolab Inc. 1.42% 13.0% 22.7% 14.4% ‐‐ 24.1%21 Everest Re Group Ltd. 2.36% 10.0% 9.2% 11.6% ‐‐ 12.4%22 Exxon Mobil Corp. 2.51% 16.1% 14.8% 17.3% ‐‐ 18.6%23 Genʹl Dynamics 2.19% 7.8% 12.0% 10.0% ‐‐ 14.2%24 Genʹl Mills 2.79% 8.1% 7.8% 10.5% ‐‐ 10.9%25 Genuine Parts 3.82% 7.3% 7.2% 11.0% ‐‐ 11.1%26 Grainger (W.W.) 1.75% 13.0% 8.7% 10.4% ‐‐ 14.8%27 Heinz (H.J.) 3.88% 6.5% 16.7% 10.4% ‐‐ 20.6%28 Home Depot 2.88% 12.2% 8.5% 11.3% ‐‐ 15.1%29 Hormel Foods 2.02% 8.0% 10.2% 10.0% ‐‐ 12.2%30 Illinois Tool Works 2.63% 15.4% 11.4% 14.1% ‐‐ 18.0%31 Intʹl Business Mach. 1.88% 8.9% 17.3% 10.8% ‐‐ 19.1%32 Johnson & Johnson 3.16% 6.9% 9.1% 10.1% ‐‐ 12.2%33 Kellogg 2.91% 10.3% 15.8% 13.2% ‐‐ 18.7%34 Kimberly‐Clark 4.31% 9.0% 17.2% 13.3% ‐‐ 21.5%
DOCKET NO. ER10-____-000EXHIBIT NO. TEC-207WITNESS: AVERAFILED: 07/30/2010PAGE 1 OF 2
119
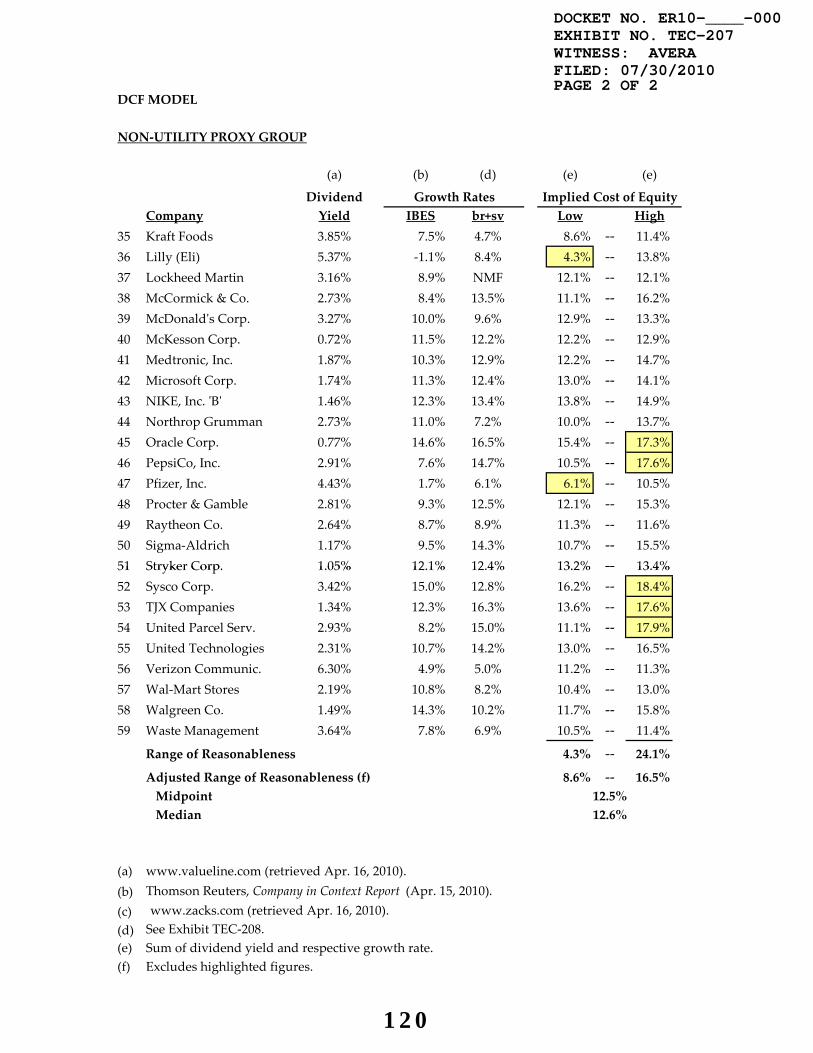
DCF MODEL
NON‐UTILITY PROXY GROUP
(a) (b) (d) (e) (e)
DividendCompany Yield IBES br+sv Low High
35 Kraft Foods 3.85% 7.5% 4.7% 8.6% ‐‐ 11.4%36 Lilly (Eli) 5.37% ‐1.1% 8.4% 4.3% ‐‐ 13.8%37 Lockheed Martin 3.16% 8.9% NMF 12.1% ‐‐ 12.1%38 McCormick & Co. 2.73% 8.4% 13.5% 11.1% ‐‐ 16.2%39 McDonaldʹs Corp. 3.27% 10.0% 9.6% 12.9% ‐‐ 13.3%40 McKesson Corp. 0.72% 11.5% 12.2% 12.2% ‐‐ 12.9%41 Medtronic, Inc. 1.87% 10.3% 12.9% 12.2% ‐‐ 14.7%42 Microsoft Corp. 1.74% 11.3% 12.4% 13.0% ‐‐ 14.1%43 NIKE, Inc. ʹBʹ 1.46% 12.3% 13.4% 13.8% ‐‐ 14.9%44 Northrop Grumman 2.73% 11.0% 7.2% 10.0% ‐‐ 13.7%45 Oracle Corp. 0.77% 14.6% 16.5% 15.4% ‐‐ 17.3%46 PepsiCo, Inc. 2.91% 7.6% 14.7% 10.5% ‐‐ 17.6%47 Pfizer, Inc. 4.43% 1.7% 6.1% 6.1% ‐‐ 10.5%48 Procter & Gamble 2.81% 9.3% 12.5% 12.1% ‐‐ 15.3%49 Raytheon Co. 2.64% 8.7% 8.9% 11.3% ‐‐ 11.6%50 Sigma‐Aldrich 1.17% 9.5% 14.3% 10.7% ‐‐ 15.5%51 Stryker Corp. 1.05% 12.1% 12.4% 13.2% ‐‐ 13.4%
Growth Rates Implied Cost of Equity
51 Stryker Corp. 1.05% 12.1% 12.4% 13.2% ‐‐ 13.4%52 Sysco Corp. 3.42% 15.0% 12.8% 16.2% ‐‐ 18.4%53 TJX Companies 1.34% 12.3% 16.3% 13.6% ‐‐ 17.6%54 United Parcel Serv. 2.93% 8.2% 15.0% 11.1% ‐‐ 17.9%55 United Technologies 2.31% 10.7% 14.2% 13.0% ‐‐ 16.5%56 Verizon Communic. 6.30% 4.9% 5.0% 11.2% ‐‐ 11.3%57 Wal‐Mart Stores 2.19% 10.8% 8.2% 10.4% ‐‐ 13.0%58 Walgreen Co. 1.49% 14.3% 10.2% 11.7% ‐‐ 15.8%59 Waste Management 3.64% 7.8% 6.9% 10.5% ‐‐ 11.4%
Range of Reasonableness 4.3% ‐‐ 24.1%
Adjusted Range of Reasonableness (f) 8.6% ‐‐ 16.5% Midpoint Median
(a) www.valueline.com (retrieved Apr. 16, 2010).(b) Thomson Reuters, Company in Context Report (Apr. 15, 2010).(c) www.zacks.com (retrieved Apr. 16, 2010).(d) See Exhibit TEC‐208.(e) Sum of dividend yield and respective growth rate.(f) Excludes highlighted figures.
12.5%12.6%
DOCKET NO. ER10-____-000EXHIBIT NO. TEC-207WITNESS: AVERAFILED: 07/30/2010PAGE 2 OF 2
120

BR + SV GROWTH RATE
NON‐UTILITY PROXY GROUP
(a) (a) (b) (a) (a) (a) (c) (a)
2013‐15 Market Price 2013‐15 ProjectionsCompany High Low Avg. EPS DPS BVPS b r
1 3M Company $120.00 $100.00 $110.00 $6.90 $2.26 $29.35 67.2% 23.5%2 Abbott Labs. $115.00 $95.00 $105.00 $5.70 $2.18 $22.05 61.8% 26.0%3 Alberto‐Culver $50.00 $40.00 $45.00 $2.25 $0.50 $17.95 77.8% 12.5%4 Allergan, Inc. $120.00 $100.00 $110.00 $5.50 $0.25 $36.05 95.5% 15.5%5 Automatic Data Proc. $85.00 $70.00 $77.50 $3.30 $1.60 $20.75 51.5% 16.0%6 Bard (C.R.) $155.00 $125.00 $140.00 $7.80 $0.86 $39.25 89.0% 20.0%7 Baxter Intʹl Inc. $110.00 $90.00 $100.00 $6.75 $1.75 $26.55 74.1% 25.5%8 Becton, Dickinson $135.00 $110.00 $122.50 $7.70 $2.20 $38.90 71.4% 20.5%9 Bemis Co. $65.00 $55.00 $60.00 $3.50 $1.04 $25.60 70.3% 13.5%10 Bristol‐Myers Squibb $40.00 $30.00 $35.00 $2.05 $1.40 $11.65 31.7% 17.5%11 Brown‐Forman ʹBʹ $80.00 $65.00 $72.50 $4.25 $1.40 $20.00 67.1% 21.5%12 Chevron Corp. $145.00 $115.00 $130.00 $13.00 $3.00 $53.15 76.9% 24.0%13 Chubb Corp. $85.00 $75.00 $80.00 $7.00 $1.60 $57.85 77.1% 12.0%14 Coca‐Cola $90.00 $75.00 $82.50 $3.90 $2.00 $17.15 48.7% 23.0%15 Colgate‐Palmolive $165.00 $135.00 $150.00 $7.50 $3.20 $18.25 57.3% 41.0%16 Commerce Bancshs. $50.00 $40.00 $45.00 $3.60 $1.20 $32.80 66.7% 11.0%17 ConAgra Foods $40.00 $35.00 $37.50 $2.30 $0.90 $15.20 60.9% 15.5%18 Costco Wholesale $90.00 $70.00 $80.00 $4.00 $0.80 $29.95 80.0% 13.5%19 CVS Caremark Corp. $75.00 $60.00 $67.50 $4.00 $0.55 $39.20 86.3% 10.5%20 Ecolab Inc. $65.00 $55.00 $60.00 $3.50 $0.85 $13.90 75.7% 25.5%21 Everest Re Group Ltd. $165.00 $135.00 $150.00 $15.00 $2.35 $141.65 84.3% 10.5%22 Exxon Mobil Corp. $125.00 $100.00 $112.50 $9.35 $1.90 $45.25 79.7% 21.0%23 Genʹl Dynamics $155.00 $125.00 $140.00 $10.00 $2.60 $57.00 74.0% 18.0%24 Genʹl Mills $110.00 $90.00 $100.00 $5.75 $2.50 $22.70 56.5% 27.5%25 Genuine Parts $65.00 $50.00 $57.50 $3.80 $1.98 $23.85 47.9% 16.0%26 Grainger (W.W.) $165.00 $135.00 $150.00 $9.35 $2.37 $52.40 74.7% 18.5%27 Heinz (H.J.) $75.00 $60.00 $67.50 $4.00 $2.20 $10.95 45.0% 37.0%28 Home Depot $50.00 $40.00 $45.00 $2.75 $1.10 $17.00 60.0% 16.0%29 Hormel Foods $75.00 $60.00 $67.50 $3.80 $1.20 $23.85 68.4% 16.0%30 Illinois Tool Works $75.00 $65.00 $70.00 $4.65 $1.36 $27.15 70.8% 17.5%31 Intʹl Business Mach. $220.00 $180.00 $200.00 $14.25 $3.15 $52.15 77.9% 28.5%32 Johnson & Johnson $125.00 $100.00 $112.50 $7.10 $2.70 $36.00 62.0% 20.0%33 Kellogg $90.00 $75.00 $82.50 $4.80 $1.85 $13.40 61.5% 36.0%34 Kimberly‐Clark $100.00 $80.00 $90.00 $6.00 $2.75 $15.55 54.2% 38.5%35 Kraft Foods $50.00 $40.00 $45.00 $2.75 $1.40 $26.20 49.1% 10.5%36 Lilly (Eli) $50.00 $45.00 $47.50 $3.40 $2.20 $15.60 35.3% 22.0%37 Lockheed Martin $220.00 $180.00 $200.00 $13.25 $3.50 $35.15 73.6% NMF38 McCormick & Co. $70.00 $55.00 $62.50 $3.15 $1.28 $17.40 59.4% 18.0%39 McDonaldʹs Corp. $105.00 $85.00 $95.00 $5.85 $3.00 $19.00 48.7% 30.5%40 McKesson Corp. $95.00 $80.00 $87.50 $6.55 $0.48 $48.70 92.7% 13.5%41 Medtronic, Inc. $80.00 $65.00 $72.50 $4.90 $1.04 $24.50 78.8% 20.0%42 Microsoft Corp. $45.00 $40.00 $42.50 $2.65 $0.70 $8.70 73.6% 31.5%43 NIKE, Inc. ʹBʹ $105.00 $85.00 $95.00 $5.30 $1.30 $31.45 75.5% 17.0%44 Northrop Grumman $155.00 $125.00 $140.00 $10.00 $2.50 $64.80 75.0% 15.5%45 Oracle Corp. $40.00 $35.00 $37.50 $2.40 $0.30 $11.80 87.5% 21.0%46 PepsiCo, Inc. $115.00 $95.00 $105.00 $5.15 $2.10 $19.40 59.2% 27.5%47 Pfizer, Inc. $30.00 $25.00 $27.50 $2.05 $1.16 $15.50 43.4% 13.5%48 Procter & Gamble $105.00 $85.00 $95.00 $5.25 $1.95 $26.00 62.9% 20.0%49 Raytheon Co. $115.00 $95.00 $105.00 $7.00 $1.80 $41.50 74.3% 17.5%50 Sigma‐Aldrich $85.00 $65.00 $75.00 $3.95 $0.80 $22.30 79.7% 18.0%51 Stryker Corp. $125.00 $100.00 $112.50 $5.15 $0.80 $34.05 84.5% 15.0%52 Sysco Corp. $45.00 $40.00 $42.50 $2.50 $1.20 $7.45 52.0% 33.5%53 TJX Companies $75.00 $60.00 $67.50 $4.15 $0.75 $10.80 81.9% 42.0%54 United Parcel Serv. $110.00 $90.00 $100.00 $4.55 $2.40 $14.30 47.3% 32.0%55 United Technologies $120.00 $95.00 $107.50 $6.75 $2.26 $28.35 66.5% 24.0%56 Verizon Communic. $60.00 $50.00 $55.00 $3.05 $1.96 $18.95 35.7% 14.5%57 Wal‐Mart Stores $95.00 $75.00 $85.00 $5.45 $1.55 $30.90 71.6% 17.5%58 Walgreen Co. $65.00 $55.00 $60.00 $3.40 $0.84 $24.20 75.3% 14.0%59 Waste Management $50.00 $40.00 $45.00 $3.05 $1.60 $17.65 47.5% 17.0%
DOCKET NO. ER10-____-000EXHIBIT NO. TEC-208WITNESS: AVERAFILED: 07/30/2010PAGE 1 OF 3
121

BR + SV GROWTH RATE
NON‐UTILITY PROXY GROUP
(a) (a) (d) (a) (a) (d) (e) (f) (g)2009 2013‐15 Adjusted ʺrʺNo. Common No. Common Chg in Adj. Adj.
Company BVPS Shares Equity BVPS Shares Equity Equity Factor r
1 3M Company $14.24 693.54 $9,876 $29.35 680.00 $19,958 15.1% 1.0702 25.2%2 Abbott Labs. $14.73 1551.20 $22,849 $22.05 1520.00 $33,516 8.0% 1.0383 27.0%3 Alberto‐Culver $12.18 98.26 $1,197 $17.95 92.00 $1,651 6.7% 1.0322 12.9%4 Allergan, Inc. $15.84 304.43 $4,822 $36.05 305.00 $10,995 17.9% 1.0822 16.8%5 Automatic Data Proc. $10.63 500.90 $5,325 $20.75 520.00 $10,790 15.2% 1.0705 17.1%6 Bard (C.R.) $19.30 96.20 $1,857 $39.25 90.00 $3,533 13.7% 1.0642 21.3%7 Baxter Intʹl Inc. $11.55 593.00 $6,849 $26.55 545.00 $14,470 16.1% 1.0747 27.4%8 Becton, Dickinson $21.69 237.08 $5,142 $38.90 225.00 $8,753 11.2% 1.0531 21.6%9 Bemis Co. $16.55 109.01 $1,804 $25.60 109.00 $2,790 9.1% 1.0436 14.1%10 Bristol‐Myers Squibb $8.65 1709.50 $14,787 $11.65 1650.00 $19,223 5.4% 1.0262 18.0%11 Brown‐Forman ʹBʹ $12.60 145.00 $1,827 $20.00 140.00 $2,800 8.9% 1.0427 22.4%12 Chevron Corp. $45.57 2017.20 $91,924 $53.15 1950.00 $103,643 2.4% 1.0120 24.3%13 Chubb Corp. $47.10 332.00 $15,637 $57.85 325.00 $18,801 3.8% 1.0184 12.2%14 Coca‐Cola $8.85 2312.00 $20,461 $17.15 2310.00 $39,617 14.1% 1.0660 24.5%15 Colgate‐Palmolive $5.96 494.17 $2,945 $18.25 460.00 $8,395 23.3% 1.1044 45.3%16 Commerce Bancshs. $22.72 83.11 $1,888 $32.80 90.00 $2,952 9.3% 1.0447 11.5%17 ConAgra Foods $11.02 484.37 $5,338 $15.20 435.00 $6,612 4.4% 1.0214 15.8%18 Costco Wholesale $21.25 432.51 $9,191 $29.95 415.00 $12,429 6.2% 1.0302 13.9%19 CVS Caremark Corp. $25.71 1391.00 $35,763 $39.20 1285.00 $50,372 7.1% 1.0342 10.9%20 Ecolab Inc. $8.45 236.50 $1,998 $13.90 245.00 $3,406 11.2% 1.0533 26.9%21 Everest Re Group Ltd. $75.62 65.60 $4,961 $141.65 60.00 $8,499 11.4% 1.0538 11.1%22 Exxon Mobil Corp. $24.41 4727.00 $115,386 $45.25 4300.00 $194,575 11.0% 1.0522 22.1%23 Genʹl Dynamics $32.21 385.71 $12,424 $57.00 360.00 $20,520 10.6% 1.0501 18.9%24 Genʹl Mills $18.42 337.50 $6,217 $22.70 300.00 $6,810 1.8% 1.0091 27.8%25 Genuine Parts $16.49 158.92 $2,621 $23.85 155.00 $3,697 7.1% 1.0344 16.6%26 Grainger (W.W.) $30.92 72.28 $2,235 $52.40 62.00 $3,249 7.8% 1.0374 19.2%27 Heinz (H.J.) $3.87 315.04 $1,219 $10.95 310.00 $3,395 22.7% 1.1020 40.8%28 Home Depot $11.40 1700.00 $19,380 $17.00 1625.00 $27,625 7.3% 1.0354 16.6%29 Hormel Foods $14.92 134.52 $2,007 $23.85 130.00 $3,101 9.1% 1.0435 16.7%30 Illinois Tool Works $17.55 502.34 $8,816 $27.15 480.00 $13,032 8.1% 1.0391 18.2%31 Intʹl Business Mach. $17.43 1305.30 $22,751 $52.15 1150.00 $59,973 21.4% 1.0966 31.3%32 Johnson & Johnson $18.50 2750.00 $50,875 $36.00 2500.00 $90,000 12.1% 1.0570 21.1%33 Kellogg $3.79 381.86 $1,447 $13.40 350.00 $4,690 26.5% 1.1170 40.2%34 Kimberly‐Clark $12.96 417.00 $5,404 $15.55 400.00 $6,220 2.9% 1.0141 39.0%35 Kraft Foods $15.11 1469.30 $22,201 $26.20 1400.00 $36,680 10.6% 1.0502 11.0%36 Lilly (Eli) $8.28 1149.90 $9,521 $15.60 1155.00 $18,018 13.6% 1.0637 23.4%37 Lockheed Martin $11.07 372.90 $4,128 $35.15 320.00 $11,248 22.2% 1.0999 NMF38 McCormick & Co. $8.11 130.10 $1,055 $17.40 135.00 $2,349 17.4% 1.0799 19.4%39 McDonaldʹs Corp. $12.35 1075.00 $13,276 $19.00 1000.00 $19,000 7.4% 1.0358 31.6%40 McKesson Corp. $26.40 266.00 $7,022 $48.70 250.00 $12,175 11.6% 1.0550 14.2%41 Medtronic, Inc. $13.20 1100.00 $14,520 $24.50 1000.00 $24,500 11.0% 1.0523 21.0%42 Microsoft Corp. $3.97 9151.00 $36,329 $8.70 7800.00 $67,860 13.3% 1.0624 33.5%43 NIKE, Inc. ʹBʹ $15.93 491.10 $7,823 $31.45 487.50 $15,332 14.4% 1.0672 18.1%44 Northrop Grumman $41.34 306.87 $12,686 $64.80 250.00 $16,200 5.0% 1.0244 15.9%45 Oracle Corp. $4.47 5150.00 $23,021 $11.80 4750.00 $56,050 19.5% 1.0888 22.9%46 PepsiCo, Inc. $7.77 1553.00 $12,067 $19.40 1500.00 $29,100 19.3% 1.0878 29.9%47 Pfizer, Inc. $11.15 8070.00 $89,981 $15.50 8070.00 $125,085 6.8% 1.0329 13.9%48 Procter & Gamble $21.18 2917.00 $61,782 $26.00 2900.00 $75,400 4.1% 1.0199 20.4%49 Raytheon Co. $25.64 383.20 $9,825 $41.50 330.00 $13,695 6.9% 1.0332 18.1%50 Sigma‐Aldrich $13.83 121.88 $1,686 $22.30 120.00 $2,676 9.7% 1.0462 18.8%51 Stryker Corp. $15.90 397.40 $6,319 $34.05 387.00 $13,177 15.8% 1.0734 16.1%52 Sysco Corp. $5.67 601.23 $3,409 $7.45 570.00 $4,247 4.5% 1.0220 34.2%53 TJX Companies $5.17 412.82 $2,134 $10.80 340.00 $3,672 11.5% 1.0542 44.3%54 United Parcel Serv. $7.05 1000.00 $7,050 $14.30 990.00 $14,157 15.0% 1.0696 34.2%55 United Technologies $16.89 942.29 $15,915 $28.35 900.00 $25,515 9.9% 1.0472 25.1%56 Verizon Communic. $18.10 2835.70 $51,326 $18.95 2820.00 $53,439 0.8% 1.0040 14.6%57 Wal‐Mart Stores $16.63 3925.00 $65,273 $30.90 3400.00 $105,060 10.0% 1.0476 18.3%58 Walgreen Co. $14.54 988.56 $14,374 $24.20 960.00 $23,232 10.1% 1.0480 14.7%59 Waste Management $13.56 486.12 $6,592 $17.65 465.00 $8,207 4.5% 1.0219 17.4%
DOCKET NO. ER10-____-000EXHIBIT NO. TEC-208WITNESS: AVERAFILED: 07/30/2010PAGE 2 OF 3
122
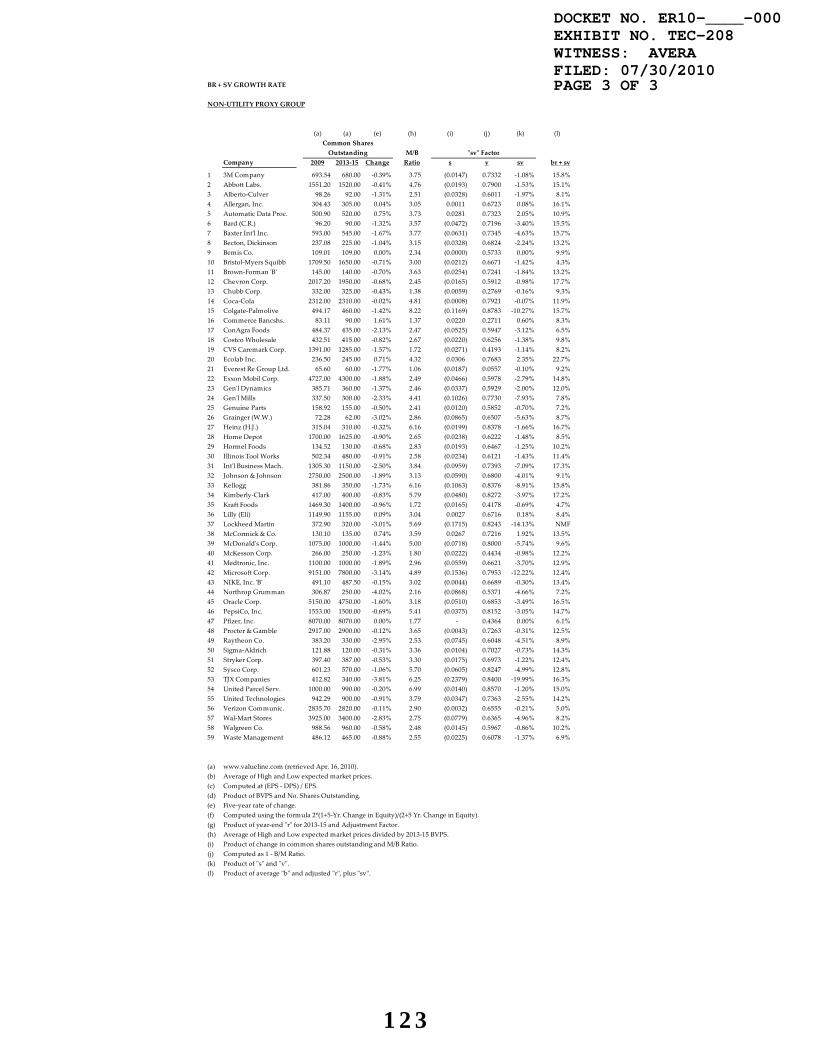
BR + SV GROWTH RATE
NON‐UTILITY PROXY GROUP
(a) (a) (e) (h) (i) (j) (k) (l)Common SharesOutstanding M/B ʺsvʺ Factor
Company 2009 2013‐15 Change Ratio s v sv br + sv
1 3M Company 693.54 680.00 ‐0.39% 3.75 (0.0147) 0.7332 ‐1.08% 15.8%2 Abbott Labs. 1551.20 1520.00 ‐0.41% 4.76 (0.0193) 0.7900 ‐1.53% 15.1%3 Alberto‐Culver 98.26 92.00 ‐1.31% 2.51 (0.0328) 0.6011 ‐1.97% 8.1%4 Allergan, Inc. 304.43 305.00 0.04% 3.05 0.0011 0.6723 0.08% 16.1%5 Automatic Data Proc. 500.90 520.00 0.75% 3.73 0.0281 0.7323 2.05% 10.9%6 Bard (C.R.) 96.20 90.00 ‐1.32% 3.57 (0.0472) 0.7196 ‐3.40% 15.5%7 Baxter Intʹl Inc. 593.00 545.00 ‐1.67% 3.77 (0.0631) 0.7345 ‐4.63% 15.7%8 Becton, Dickinson 237.08 225.00 ‐1.04% 3.15 (0.0328) 0.6824 ‐2.24% 13.2%9 Bemis Co. 109.01 109.00 0.00% 2.34 (0.0000) 0.5733 0.00% 9.9%10 Bristol‐Myers Squibb 1709.50 1650.00 ‐0.71% 3.00 (0.0212) 0.6671 ‐1.42% 4.3%11 Brown‐Forman ʹBʹ 145.00 140.00 ‐0.70% 3.63 (0.0254) 0.7241 ‐1.84% 13.2%12 Chevron Corp. 2017.20 1950.00 ‐0.68% 2.45 (0.0165) 0.5912 ‐0.98% 17.7%13 Chubb Corp. 332.00 325.00 ‐0.43% 1.38 (0.0059) 0.2769 ‐0.16% 9.3%14 Coca‐Cola 2312.00 2310.00 ‐0.02% 4.81 (0.0008) 0.7921 ‐0.07% 11.9%15 Colgate‐Palmolive 494.17 460.00 ‐1.42% 8.22 (0.1169) 0.8783 ‐10.27% 15.7%16 Commerce Bancshs. 83.11 90.00 1.61% 1.37 0.0220 0.2711 0.60% 8.3%17 ConAgra Foods 484.37 435.00 ‐2.13% 2.47 (0.0525) 0.5947 ‐3.12% 6.5%18 Costco Wholesale 432.51 415.00 ‐0.82% 2.67 (0.0220) 0.6256 ‐1.38% 9.8%19 CVS Caremark Corp. 1391.00 1285.00 ‐1.57% 1.72 (0.0271) 0.4193 ‐1.14% 8.2%20 Ecolab Inc. 236.50 245.00 0.71% 4.32 0.0306 0.7683 2.35% 22.7%21 Everest Re Group Ltd. 65.60 60.00 ‐1.77% 1.06 (0.0187) 0.0557 ‐0.10% 9.2%22 Exxon Mobil Corp. 4727.00 4300.00 ‐1.88% 2.49 (0.0466) 0.5978 ‐2.79% 14.8%23 Genʹl Dynamics 385.71 360.00 ‐1.37% 2.46 (0.0337) 0.5929 ‐2.00% 12.0%24 Genʹl Mills 337.50 300.00 ‐2.33% 4.41 (0.1026) 0.7730 ‐7.93% 7.8%25 Genuine Parts 158.92 155.00 ‐0.50% 2.41 (0.0120) 0.5852 ‐0.70% 7.2%26 Grainger (W.W.) 72.28 62.00 ‐3.02% 2.86 (0.0865) 0.6507 ‐5.63% 8.7%27 Heinz (H.J.) 315.04 310.00 ‐0.32% 6.16 (0.0199) 0.8378 ‐1.66% 16.7%28 Home Depot 1700.00 1625.00 ‐0.90% 2.65 (0.0238) 0.6222 ‐1.48% 8.5%29 Hormel Foods 134.52 130.00 ‐0.68% 2.83 (0.0193) 0.6467 ‐1.25% 10.2%30 Illinois Tool Works 502.34 480.00 ‐0.91% 2.58 (0.0234) 0.6121 ‐1.43% 11.4%31 Intʹl Business Mach. 1305.30 1150.00 ‐2.50% 3.84 (0.0959) 0.7393 ‐7.09% 17.3%32 Johnson & Johnson 2750.00 2500.00 ‐1.89% 3.13 (0.0590) 0.6800 ‐4.01% 9.1%33 Kellogg 381.86 350.00 ‐1.73% 6.16 (0.1063) 0.8376 ‐8.91% 15.8%34 Kimberly‐Clark 417.00 400.00 ‐0.83% 5.79 (0.0480) 0.8272 ‐3.97% 17.2%35 Kraft Foods 1469.30 1400.00 ‐0.96% 1.72 (0.0165) 0.4178 ‐0.69% 4.7%36 Lilly (Eli) 1149.90 1155.00 0.09% 3.04 0.0027 0.6716 0.18% 8.4%37 Lockheed Martin 372.90 320.00 ‐3.01% 5.69 (0.1715) 0.8243 ‐14.13% NMF38 McCormick & Co. 130.10 135.00 0.74% 3.59 0.0267 0.7216 1.92% 13.5%39 McDonaldʹs Corp. 1075.00 1000.00 ‐1.44% 5.00 (0.0718) 0.8000 ‐5.74% 9.6%40 McKesson Corp. 266.00 250.00 ‐1.23% 1.80 (0.0222) 0.4434 ‐0.98% 12.2%41 Medtronic, Inc. 1100.00 1000.00 ‐1.89% 2.96 (0.0559) 0.6621 ‐3.70% 12.9%42 Microsoft Corp. 9151.00 7800.00 ‐3.14% 4.89 (0.1536) 0.7953 ‐12.22% 12.4%43 NIKE, Inc. ʹBʹ 491.10 487.50 ‐0.15% 3.02 (0.0044) 0.6689 ‐0.30% 13.4%44 Northrop Grumman 306.87 250.00 ‐4.02% 2.16 (0.0868) 0.5371 ‐4.66% 7.2%45 Oracle Corp. 5150.00 4750.00 ‐1.60% 3.18 (0.0510) 0.6853 ‐3.49% 16.5%46 PepsiCo, Inc. 1553.00 1500.00 ‐0.69% 5.41 (0.0375) 0.8152 ‐3.05% 14.7%47 Pfizer, Inc. 8070.00 8070.00 0.00% 1.77 ‐ 0.4364 0.00% 6.1%48 Procter & Gamble 2917.00 2900.00 ‐0.12% 3.65 (0.0043) 0.7263 ‐0.31% 12.5%49 Raytheon Co. 383.20 330.00 ‐2.95% 2.53 (0.0745) 0.6048 ‐4.51% 8.9%50 Sigma‐Aldrich 121.88 120.00 ‐0.31% 3.36 (0.0104) 0.7027 ‐0.73% 14.3%51 Stryker Corp. 397.40 387.00 ‐0.53% 3.30 (0.0175) 0.6973 ‐1.22% 12.4%52 Sysco Corp. 601.23 570.00 ‐1.06% 5.70 (0.0605) 0.8247 ‐4.99% 12.8%53 TJX Companies 412.82 340.00 ‐3.81% 6.25 (0.2379) 0.8400 ‐19.99% 16.3%54 United Parcel Serv. 1000.00 990.00 ‐0.20% 6.99 (0.0140) 0.8570 ‐1.20% 15.0%55 United Technologies 942.29 900.00 ‐0.91% 3.79 (0.0347) 0.7363 ‐2.55% 14.2%56 Verizon Communic. 2835.70 2820.00 ‐0.11% 2.90 (0.0032) 0.6555 ‐0.21% 5.0%57 Wal‐Mart Stores 3925.00 3400.00 ‐2.83% 2.75 (0.0779) 0.6365 ‐4.96% 8.2%58 Walgreen Co. 988.56 960.00 ‐0.58% 2.48 (0.0145) 0.5967 ‐0.86% 10.2%59 Waste Management 486.12 465.00 ‐0.88% 2.55 (0.0225) 0.6078 ‐1.37% 6.9%
(a) www.valueline.com (retrieved Apr. 16, 2010).(b) Average of High and Low expected market prices.(c) Computed at (EPS ‐ DPS) / EPS.(d) Product of BVPS and No. Shares Outstanding.(e) Five‐year rate of change.(f) Computed using the formula 2*(1+5‐Yr. Change in Equity)/(2+5 Yr. Change in Equity).(g) Product of year‐end ʺrʺ for 2013‐15 and Adjustment Factor.(h) Average of High and Low expected market prices divided by 2013‐15 BVPS.(i) Product of change in common shares outstanding and M/B Ratio.(j) Computed as 1 ‐ B/M Ratio.(k) Product of ʺsʺ and ʺvʺ.(l) Product of average ʺbʺ and adjusted ʺrʺ, plus ʺsvʺ.
DOCKET NO. ER10-____-000EXHIBIT NO. TEC-208WITNESS: AVERAFILED: 07/30/2010PAGE 3 OF 3
123
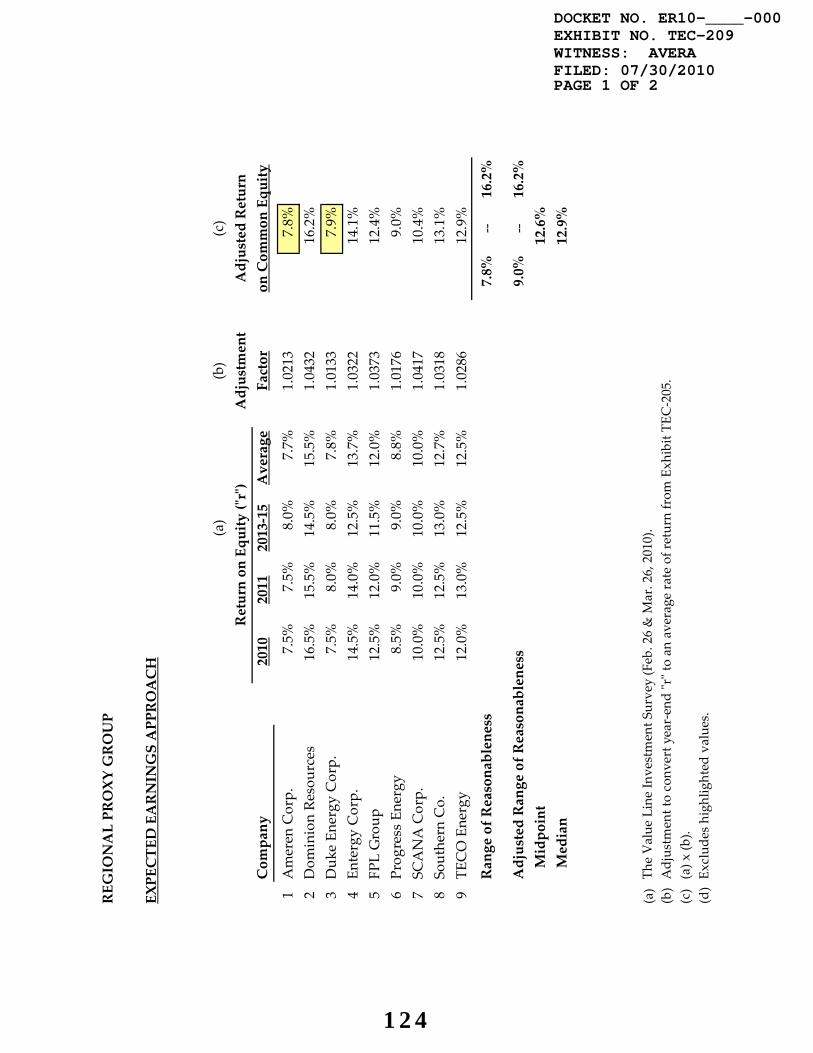
REGIONAL PROXY GROUP
EXPECTED EARNINGS APPROACH
(a)
(b)
(c)
Adjustment
Adjusted Return
Company
2010
2011
2013‐15
Average
Factor
on Common Equity
1 A
meren Corp.
7.5%
7.5%
8.0%
7.7%
1.0213
7.8%
2 D
ominion Resou
rces
16.5%
15.5%
14.5%
15.5%
1.0432
16.2%
3 D
uke En
ergy Corp.
7.5%
8.0%
8.0%
7.8%
1.0133
7.9%
4 E
ntergy Corp.
14.5%
14.0%
12.5%
13.7%
1.0322
14.1%
5 F
PL Group
12.5%
12.0%
11.5%
12.0%
1.0373
12.4%
6 P
rogress En
ergy
8.5%
9.0%
9.0%
8.8%
1.0176
9.0%
7 S
CANA Corp.
10.0%
10.0%
10.0%
10.0%
1.0417
10.4%
8 S
outhern Co.
12.5%
12.5%
13.0%
12.7%
1.0318
13.1%
9 T
ECO Energy
12.0%
13.0%
12.5%
12.5%
1.0286
12.9%
Range of Reasonableness
7.8%
‐‐16.2%
Adjusted Range of Reasonableness
9.0%
‐‐16.2%
Midpoint
12.6%
Median
12.9%
(a)Th
e Value Line Investment S
urvey (Feb. 26 & M
ar. 26, 2010).
(b)Adjustm
ent to conv
ert y
ear‐end ʺrʺ to an average ra
te of return from Exh
ibit TE
C‐205.
(c)(a) x (b
).(d)Ex
clud
es highlighted values.
Return on Equity (ʺrʺ)
DOCKET NO. ER10-____-000EXHIBIT NO. TEC-209WITNESS: AVERAFILED: 07/30/2010PAGE 1 OF 2
124
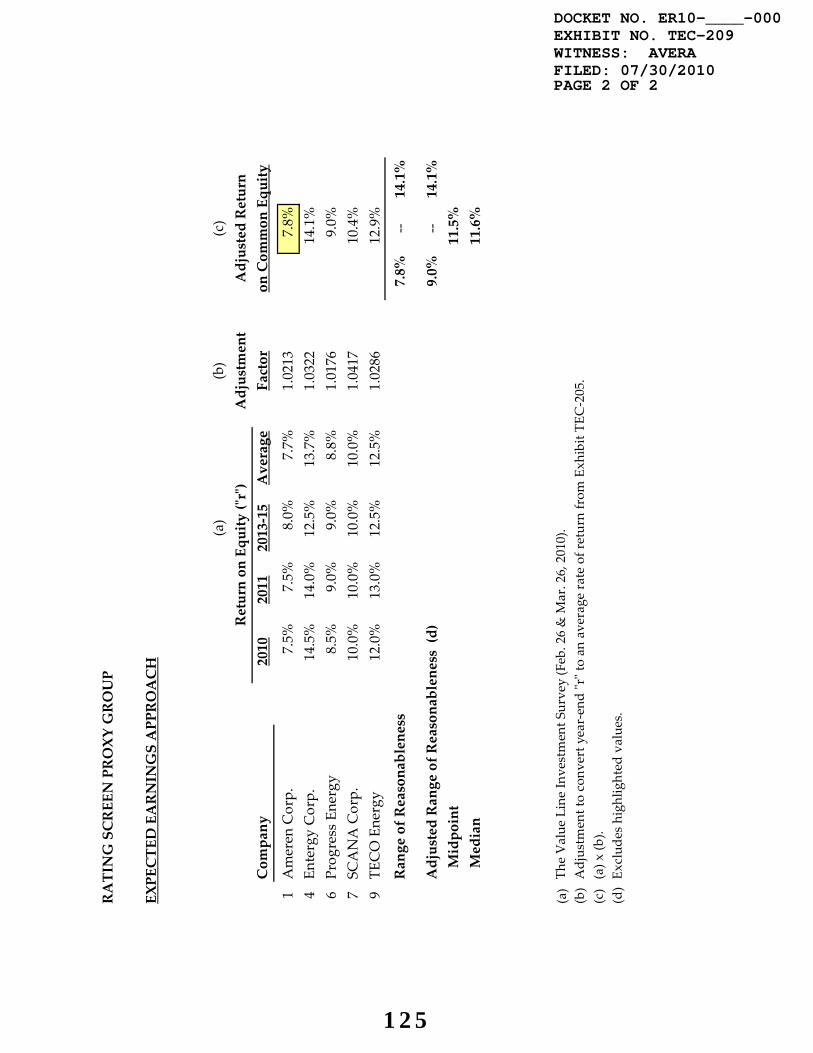
RATING SCREEN PROXY GROUP
EXPECTED EARNINGS APPROACH
(a)
(b)
(c)
Adjustment
Adjusted Return
Company
2010
2011
2013‐15
Average
Factor
on Common Equity
1 A
meren Corp.
7.5%
7.5%
8.0%
7.7%
1.0213
7.8%
4 E
ntergy Corp.
14.5%
14.0%
12.5%
13.7%
1.0322
14.1%
6 P
rogress En
ergy
8.5%
9.0%
9.0%
8.8%
1.0176
9.0%
7 S
CANA Corp.
10.0%
10.0%
10.0%
10.0%
1.0417
10.4%
9 T
ECO Energy
12.0%
13.0%
12.5%
12.5%
1.0286
12.9%
Range of Reasonableness
7.8%
‐‐14.1%
Adjusted Range of Reasonableness (d)
9.0%
‐‐14.1%
Midpoint
11.5%
Median
11.6%
(a)Th
e Value Line Investment S
urvey (Feb. 26 & M
ar. 26, 2010).
(b)Adjustm
ent to conv
ert y
ear‐end ʺrʺ to an average ra
te of return from Exh
ibit TE
C‐205.
(c)(a) x (b
).(d)Ex
clud
es highlighted values.
Return on Equity (ʺrʺ)
DOCKET NO. ER10-____-000EXHIBIT NO. TEC-209WITNESS: AVERAFILED: 07/30/2010PAGE 2 OF 2
125
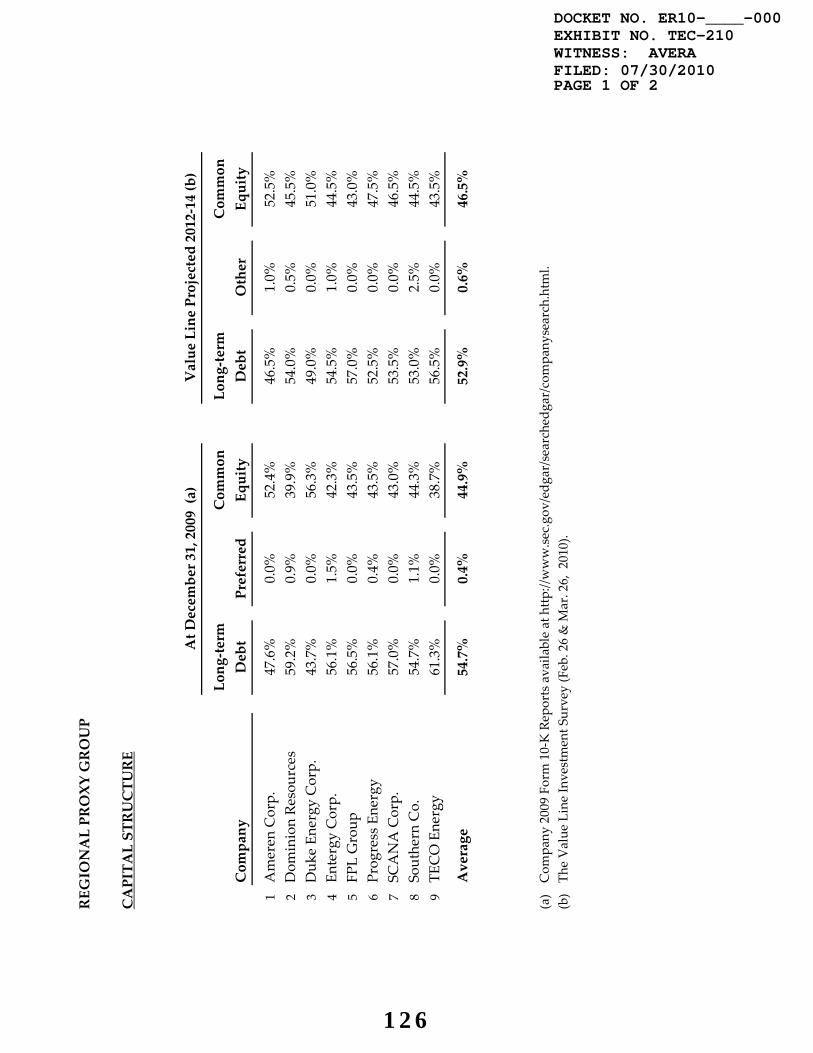
REGIONAL PROXY GROUP
CAPITAL STRUCTURE
Long‐term
Common
Long‐term
Common
Company
Debt
Preferred
Equity
Debt
Other
Equity
1 A
meren Corp.
47.6%
0.0%
52.4%
46.5%
1.0%
52.5%
2 D
ominion Re
sources
59.2%
0.9%
39.9%
54.0%
0.5%
45.5%
3 D
uke En
ergy Corp.
43.7%
0.0%
56.3%
49.0%
0.0%
51.0%
4 E
ntergy Corp.
56.1%
1.5%
42.3%
54.5%
1.0%
44.5%
5 F
PL Group
56.5%
0.0%
43.5%
57.0%
0.0%
43.0%
6 P
rogress En
ergy
56.1%
0.4%
43.5%
52.5%
0.0%
47.5%
7 S
CANA Corp.
57.0%
0.0%
43.0%
53.5%
0.0%
46.5%
8 S
outhern Co.
54.7%
1.1%
44.3%
53.0%
2.5%
44.5%
9 T
ECO Energy
61.3%
0.0%
38.7%
56.5%
0.0%
43.5%
Value Line Projected 2012‐14 (b)
At December 31, 2009 (a)
gy
Average
54.7%
0.4%
44.9%
52.9%
0.6%
46.5%
(a)
Com
pany 2009 Fo
rm 10‐K Rep
orts availa
ble at http
://www.sec.gov
/edg
ar/searchedg
ar/com
pany
search.htm
l.(b)
The Value Line Investment S
urvey (Feb. 26 & M
ar. 26, 2010).
DOCKET NO. ER10-____-000EXHIBIT NO. TEC-210WITNESS: AVERAFILED: 07/30/2010PAGE 1 OF 2
126
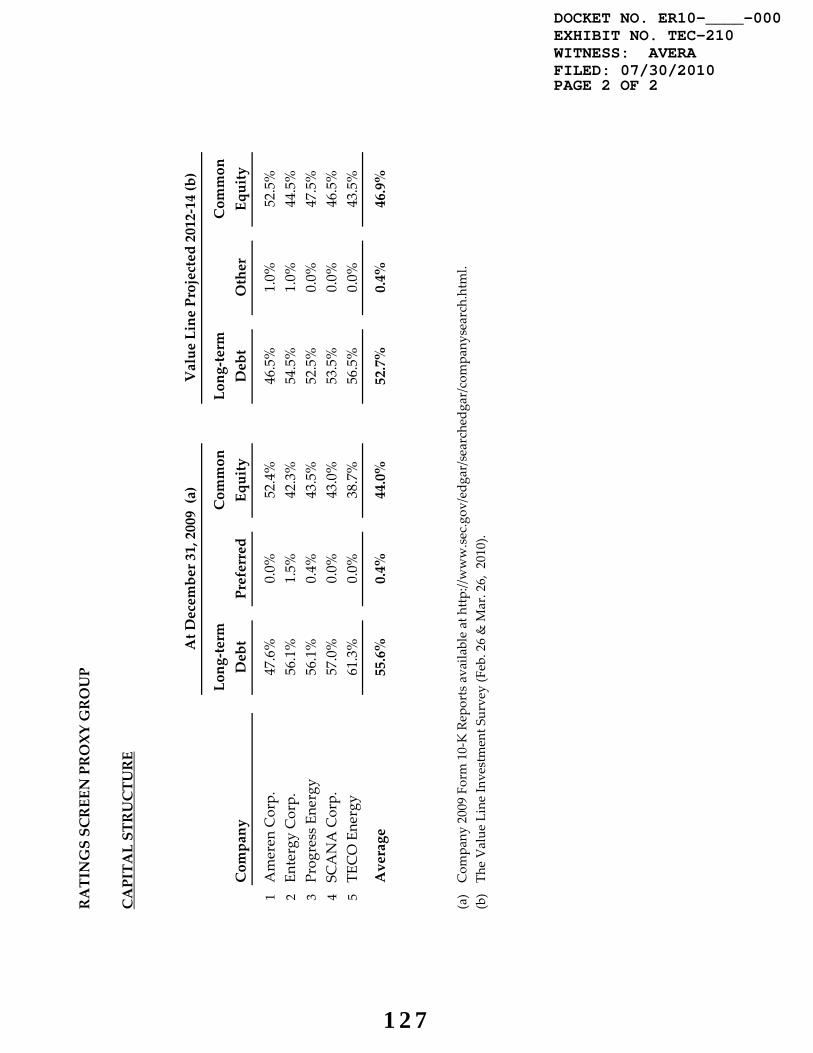
RATINGS SCREEN PROXY GROUP
CAPITAL STRUCTURE
Long‐term
Common
Long‐term
Common
Company
Debt
Preferred
Equity
Debt
Other
Equity
1 A
meren Corp.
47.6%
0.0%
52.4%
46.5%
1.0%
52.5%
2 E
ntergy Corp.
56.1%
1.5%
42.3%
54.5%
1.0%
44.5%
3 P
rogress En
ergy
56.1%
0.4%
43.5%
52.5%
0.0%
47.5%
4 S
CANA Corp.
57.0%
0.0%
43.0%
53.5%
0.0%
46.5%
5 T
ECO Energy
61.3%
0.0%
38.7%
56.5%
0.0%
43.5%
Average
55.6%
0.4%
44.0%
52.7%
0.4%
46.9%
Value Line Projected 2012‐14 (b)
At December 31, 2009 (a)
(a)
Com
pany 2009 Fo
rm 10‐K Rep
orts availa
ble at http
://www.sec.gov
/edg
ar/searchedg
ar/com
pany
search.htm
l.(b)
The Value Line Investment S
urvey (Feb. 26 & M
ar. 26, 2010).
DOCKET NO. ER10-____-000EXHIBIT NO. TEC-210WITNESS: AVERAFILED: 07/30/2010PAGE 2 OF 2
127
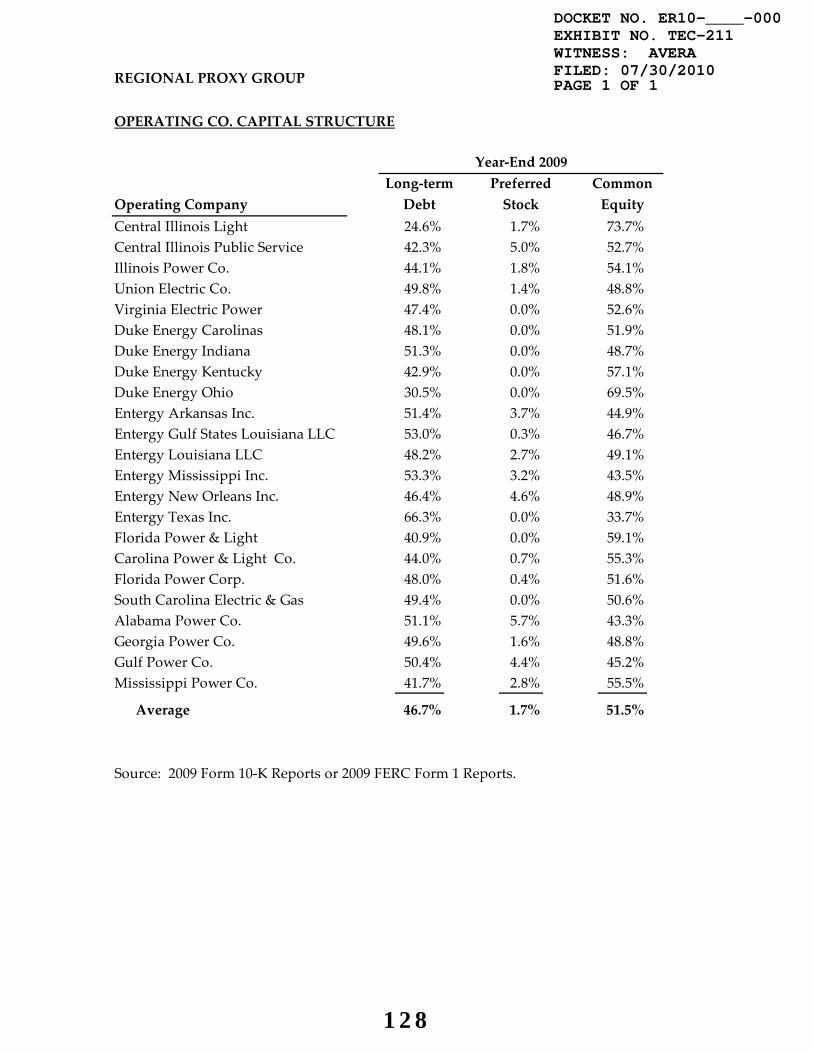
REGIONAL PROXY GROUP
OPERATING CO. CAPITAL STRUCTURE
Operating CompanyCentral Illinois Light 24.6% 1.7% 73.7%Central Illinois Public Service 42.3% 5.0% 52.7%Illinois Power Co. 44.1% 1.8% 54.1%Union Electric Co. 49.8% 1.4% 48.8%Virginia Electric Power 47.4% 0.0% 52.6%Duke Energy Carolinas 48.1% 0.0% 51.9%Duke Energy Indiana 51.3% 0.0% 48.7%Duke Energy Kentucky 42.9% 0.0% 57.1%Duke Energy Ohio 30.5% 0.0% 69.5%Entergy Arkansas Inc. 51.4% 3.7% 44.9%Entergy Gulf States Louisiana LLC 53.0% 0.3% 46.7%Entergy Louisiana LLC 48.2% 2.7% 49.1%Entergy Mississippi Inc. 53.3% 3.2% 43.5%Entergy New Orleans Inc. 46.4% 4.6% 48.9%Entergy Texas Inc. 66.3% 0.0% 33.7%Florida Power & Light 40.9% 0.0% 59.1%Carolina Power & Light Co. 44.0% 0.7% 55.3%Florida Power Corp. 48.0% 0.4% 51.6%South Carolina Electric & Gas 49.4% 0.0% 50.6%Alabama Power Co. 51.1% 5.7% 43.3%Georgia Power Co. 49.6% 1.6% 48.8%Gulf Power Co. 50.4% 4.4% 45.2%Mississippi Power Co. 41.7% 2.8% 55.5%
Average 46.7% 1.7% 51.5%
Source: 2009 Form 10‐K Reports or 2009 FERC Form 1 Reports.
Long‐term Debt
Preferred Stock
Common Equity
Year‐End 2009
DOCKET NO. ER10-____-000EXHIBIT NO. TEC-211WITNESS: AVERAFILED: 07/30/2010PAGE 1 OF 1
128
UNITED STATES OF AMERICABEFORE THE
FEDERAL ENERGY REGULATORY COMMISSION
In the Matter of ))
Tampa Electric Company ) Docket No. ER1O- -000
County of Travis )) SS
State of Texas )
VERIFICATION
William E. Avera, being first duly sworn, deposes and states that he is the witness
identified in the foregoing prepared testimony, and that the statements of fact in the
testimony and supporting exhibits are true and correct to the best of his knowledge,
information, and belief.
i-Zi- &CLWilliam E. Avera
SUBSRIBED AND SWORN before methë71 day of July, 2010
ublii
My commission expires on: \ / 0 2O I
DRIEN MCKENZIE
STATE OF TEXASMy Comm Exp. Jan. 10, 2011