Leukemia following Occupational Exposure to 60-Hz Electric and Magnetic Fields among Ontario...
11
American Journal of Epidemiology Copyright O 1996 by The Johns Hopkins University School of Hygiene and Public Health All rights reserved Vol. 144, No. 2 Printed in U.S.A Leukemia following Occupational Exposure to 60-Hz Electric and Magnetic Fields among Ontario Electric Utility Workers Anthony B. Miller, 1 Teresa To, 1 David A. Agnew, 2 Claus Wall, 1 and Lois M. Green 2 In a nested case-control study of 1,484 cancer cases and 2,179 matched controls from a cohort of 31,543 Ontario Hydro male employees, the authors evaluated associations of cancer risk with electric field exposure and reevaluated the previously reported findings for magnetic fields. Pensioners were followed from January 1, 1970, and active workers (including those who left the corporation) from January 1,1973, with both groups followed through December 31,1988. Exposures to electric and magnetic fields and to potential occupational confounders were estimated through job exposure matrices. Odds ratios were elevated for hematopoietic malignancies with cumulative electric field exposure. After adjustment, the odds ratio for leukemia in the upper tertile was 4.45 (95% confidence interval (Cl) 1.01-19.7). Odds ratios were also elevated for acute nonlymphoid leukemia, acute myeloid leukemia, and chronic lymphoid leukemia. For cumulative magnetic field exposure, there were similar elevations that fell with adjustment. Evaluation of the combined effect of electric and magnetic fields for leukemia showed significant elevations of risk for high exposure to both, with a dose- response relation for increasing exposure to electric fields and an inconsistent effect for magnetic fields. There was some evidence of a nonsignificant association for brain cancer and benign brain tumors with magnetic fields. For lung cancer, the odds ratio for high exposure to electric and magnetic fields was 1.84 (95% Cl 0.69-4.94). Am J Epidemiol 1996; 144:150-60. electromagnetic fields; leukemia; neoplasms; occupational diseases In 1979 it was first suggested that residential expo- sure to electric and magnetic fields might lead to increased cancer risk in children (1). Since then a number of studies have examined the possible rela- tions between exposure to a range of electric and magnetic field sources and cancer. High voltage trans- mission lines and distribution network lines are among the field sources considered in these studies. An in- consistent increase in the risk of cancer was observed among both the general population exposed (1-7) and the workers where high exposure to electric and/or magnetic fields seemed likely (8-24). Our findings for occupational exposure to magnetic fields derived from power frequencies of 50-60 Hz arising from employment in Electricit6 de France, Hydro Quebec, and Ontario Hydro have been reported Received for publication March 8, 1995, and accepted for pub- lication January 5, 1996. Abbreviation: Cl, confidence Interval; ICD, International Classifi- cation of Diseases. 1 Department of Preventive Medicine and Biostatistics, Faculty of Medicine, University of Toronto, Toronto, Ontario, Canada. 2 Health and Safety Services, Ontario Hydro, Toronto, Ontario, Canada. Reprint requests to Dr. A. B. Miller, Department of Preventive Medicine and Biostatistics, Faculty of Medicine, University of To- ronto, 12 Queens Park Crescent West, Toronto, Ontario M5S 1A8, Canada. previously (25). As the excess of leukemia in this triutility study came primarily from the Ontario Hydro component, further analyses were performed incorpo- rating more detailed data on potential occupational confounders (principally exposure to leukemogens), data on additional workers evaluated for exposure to electric and magnetic fields, and some additional cases of leukemia ascertained as eligible after the data set had been finalized for the triutility analysis. The present report gives the findings from these analyses, with particular attention to electric field exposure, as well as a reevaluation of the effects of magnetic field exposure. MATERIALS AND METHODS This was a nested case-control study within a study base of active male employees of Ontario Hydro from January 1, 1973, on, together with those pensioners known to be alive on January 1, 1970. New male employees who entered the work force and those who became pensioners from January 1, 1973, to December 31, 1988, were included in the study base. The period of observation for the detection of cases of cancer began after 1 year of full employment and ceased with the death of the worker or on December 31, 1988, whichever was earlier. 150 by guest on February 24, 2016 http://aje.oxfordjournals.org/ Downloaded from
-
Upload
independent -
Category
Documents
-
view
0 -
download
0
Transcript of Leukemia following Occupational Exposure to 60-Hz Electric and Magnetic Fields among Ontario...

American Journal of EpidemiologyCopyright O 1996 by The Johns Hopkins University School of Hygiene and Public HealthAll rights reserved
Vol. 144, No. 2Printed in U.S.A
Leukemia following Occupational Exposure to 60-Hz Electric and MagneticFields among Ontario Electric Utility Workers
Anthony B. Miller,1 Teresa To,1 David A. Agnew,2 Claus Wall,1 and Lois M. Green2
In a nested case-control study of 1,484 cancer cases and 2,179 matched controls from a cohort of 31,543Ontario Hydro male employees, the authors evaluated associations of cancer risk with electric field exposureand reevaluated the previously reported findings for magnetic fields. Pensioners were followed from January1, 1970, and active workers (including those who left the corporation) from January 1,1973, with both groupsfollowed through December 31,1988. Exposures to electric and magnetic fields and to potential occupationalconfounders were estimated through job exposure matrices. Odds ratios were elevated for hematopoieticmalignancies with cumulative electric field exposure. After adjustment, the odds ratio for leukemia in the uppertertile was 4.45 (95% confidence interval (Cl) 1.01-19.7). Odds ratios were also elevated for acute nonlymphoidleukemia, acute myeloid leukemia, and chronic lymphoid leukemia. For cumulative magnetic field exposure,there were similar elevations that fell with adjustment. Evaluation of the combined effect of electric andmagnetic fields for leukemia showed significant elevations of risk for high exposure to both, with a dose-response relation for increasing exposure to electric fields and an inconsistent effect for magnetic fields. Therewas some evidence of a nonsignificant association for brain cancer and benign brain tumors with magneticfields. For lung cancer, the odds ratio for high exposure to electric and magnetic fields was 1.84 (95% Cl0.69-4.94). Am J Epidemiol 1996; 144:150-60.
electromagnetic fields; leukemia; neoplasms; occupational diseases
In 1979 it was first suggested that residential expo-sure to electric and magnetic fields might lead toincreased cancer risk in children (1). Since then anumber of studies have examined the possible rela-tions between exposure to a range of electric andmagnetic field sources and cancer. High voltage trans-mission lines and distribution network lines are amongthe field sources considered in these studies. An in-consistent increase in the risk of cancer was observedamong both the general population exposed (1-7) andthe workers where high exposure to electric and/ormagnetic fields seemed likely (8-24).
Our findings for occupational exposure to magneticfields derived from power frequencies of 50-60 Hzarising from employment in Electricit6 de France,Hydro Quebec, and Ontario Hydro have been reported
Received for publication March 8, 1995, and accepted for pub-lication January 5, 1996.
Abbreviation: Cl, confidence Interval; ICD, International Classifi-cation of Diseases.
1 Department of Preventive Medicine and Biostatistics, Faculty ofMedicine, University of Toronto, Toronto, Ontario, Canada.
2 Health and Safety Services, Ontario Hydro, Toronto, Ontario,Canada.
Reprint requests to Dr. A. B. Miller, Department of PreventiveMedicine and Biostatistics, Faculty of Medicine, University of To-ronto, 12 Queens Park Crescent West, Toronto, Ontario M5S 1A8,Canada.
previously (25). As the excess of leukemia in thistriutility study came primarily from the Ontario Hydrocomponent, further analyses were performed incorpo-rating more detailed data on potential occupationalconfounders (principally exposure to leukemogens),data on additional workers evaluated for exposure toelectric and magnetic fields, and some additional casesof leukemia ascertained as eligible after the data sethad been finalized for the triutility analysis. Thepresent report gives the findings from these analyses,with particular attention to electric field exposure, aswell as a reevaluation of the effects of magnetic fieldexposure.
MATERIALS AND METHODS
This was a nested case-control study within a studybase of active male employees of Ontario Hydro fromJanuary 1, 1973, on, together with those pensionersknown to be alive on January 1, 1970. New maleemployees who entered the work force and those whobecame pensioners from January 1, 1973, to December31, 1988, were included in the study base. The periodof observation for the detection of cases of cancerbegan after 1 year of full employment and ceased withthe death of the worker or on December 31, 1988,whichever was earlier.
150
by guest on February 24, 2016http://aje.oxfordjournals.org/
Dow
nloaded from
Leukemia and Occupational Exposure to Electric and Magnetic Fields 151
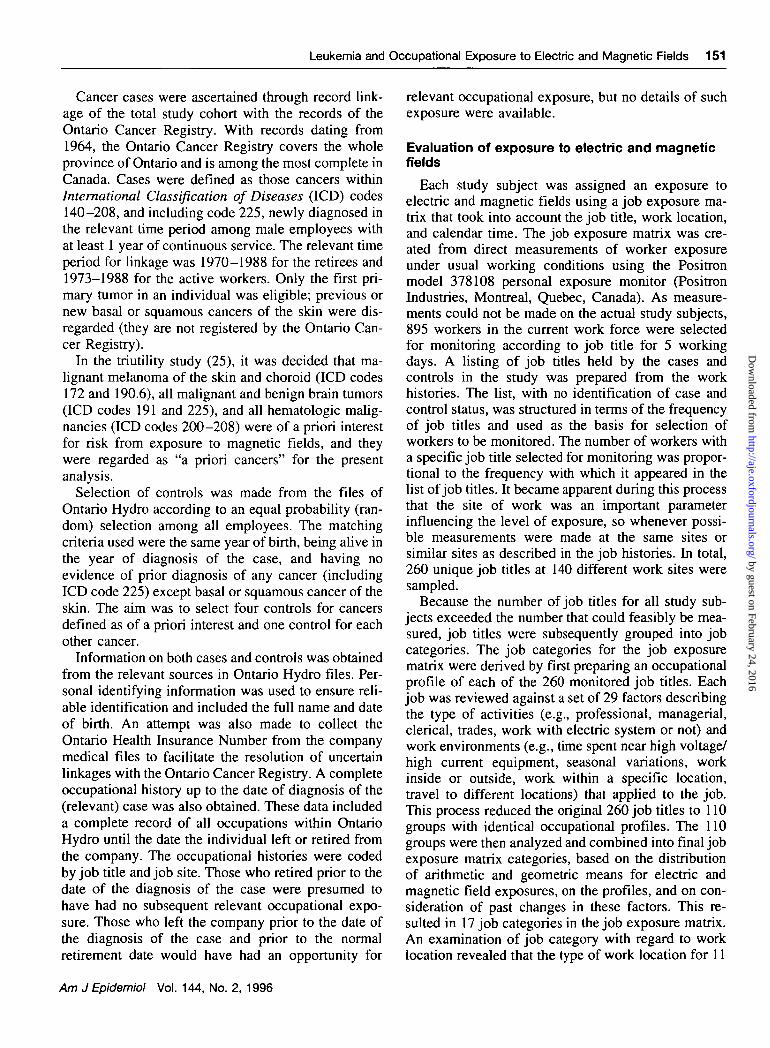
Cancer cases were ascertained through record link-age of the total study cohort with the records of theOntario Cancer Registry. With records dating from1964, the Ontario Cancer Registry covers the wholeprovince of Ontario and is among the most complete inCanada. Cases were defined as those cancers withinInternational Classification of Diseases (ICD) codes140-208, and including code 225, newly diagnosed inthe relevant time period among male employees withat least 1 year of continuous service. The relevant timeperiod for Linkage was 1970-1988 for the retirees and1973-1988 for the active workers. Only the first pri-mary tumor in an individual was eligible; previous ornew basal or squamous cancers of the skin were dis-regarded (they are not registered by the Ontario Can-cer Registry).
In the triutility study (25), it was decided that ma-lignant melanoma of the skin and choroid (ICD codes172 and 190.6), all malignant and benign brain tumors(ICD codes 191 and 225), and all hematologic malig-nancies (ICD codes 200-208) were of a priori interestfor risk from exposure to magnetic fields, and theywere regarded as "a priori cancers" for the presentanalysis.
Selection of controls was made from the files ofOntario Hydro according to an equal probability (ran-dom) selection among all employees. The matchingcriteria used were the same year of birth, being alive inthe year of diagnosis of the case, and having noevidence of prior diagnosis of any cancer (includingICD code 225) except basal or squamous cancer of theskin. The aim was to select four controls for cancersdefined as of a priori interest and one control for eachother cancer.
Information on both cases and controls was obtainedfrom the relevant sources in Ontario Hydro files. Per-sonal identifying information was used to ensure reli-able identification and included the full name and dateof birth. An attempt was also made to collect theOntario Health Insurance Number from the companymedical files to facilitate the resolution of uncertainlinkages with the Ontario Cancer Registry. A completeoccupational history up to the date of diagnosis of the(relevant) case was also obtained. These data includeda complete record of all occupations within OntarioHydro until the date the individual left or retired fromthe company. The occupational histories were codedby job title and job site. Those who retired prior to thedate of the diagnosis of the case were presumed tohave had no subsequent relevant occupational expo-sure. Those who left the company prior to the date ofthe diagnosis of the case and prior to the normalretirement date would have had an opportunity for
relevant occupational exposure, but no details of suchexposure were available.
Evaluation of exposure to electric and magneticfields
Each study subject was assigned an exposure toelectric and magnetic fields using a job exposure ma-trix that took into account the job title, work location,and calendar time. The job exposure matrix was cre-ated from direct measurements of worker exposureunder usual working conditions using the Positronmodel 378108 personal exposure monitor (PositronIndustries, Montreal, Quebec, Canada). As measure-ments could not be made on the actual study subjects,895 workers in the current work force were selectedfor monitoring according to job title for 5 workingdays. A listing of job titles held by the cases andcontrols in the study was prepared from the workhistories. The list, with no identification of case andcontrol status, was structured in terms of the frequencyof job titles and used as the basis for selection ofworkers to be monitored. The number of workers witha specific job title selected for monitoring was propor-tional to the frequency with which it appeared in thelist of job titles. It became apparent during this processthat the site of work was an important parameterinfluencing the level of exposure, so whenever possi-ble measurements were made at the same sites orsimilar sites as described in the job histories. In total,260 unique job titles at 140 different work sites weresampled.
Because the number of job titles for all study sub-jects exceeded the number that could feasibly be mea-sured, job titles were subsequently grouped into jobcategories. The job categories for the job exposurematrix were derived by first preparing an occupationalprofile of each of the 260 monitored job titles. Eachjob was reviewed against a set of 29 factors describingthe type of activities (e.g., professional, managerial,clerical, trades, work with electric system or not) andwork environments (e.g., time spent near high voltage/high current equipment, seasonal variations, workinside or outside, work within a specific location,travel to different locations) that applied to the job.This process reduced the original 260 job titles to 110groups with identical occupational profiles. The 110groups were then analyzed and combined into final jobexposure matrix categories, based on the distributionof arithmetic and geometric means for electric andmagnetic field exposures, on the profiles, and on con-sideration of past changes in these factors. This re-sulted in 17 job categories in the job exposure matrix.An examination of job category with regard to worklocation revealed that the type of work location for 11
Am J Epidemiol Vol. 144, No. 2, 1996
by guest on February 24, 2016http://aje.oxfordjournals.org/
Dow
nloaded from

152 Miller et al.
job categories could be used to provide estimates ofexposure stratified by work location.
Once the job categories were established, arithmeticand geometric means of electric and magnetic fieldexposures were calculated from the daily work periodsof sampled workers and entered into the job exposurematrix. The jobs held by study subjects were individ-ually coded as to their appropriate job category usingthe above-mentioned occupational profiles developedin consultation with staff knowledgeable about jobsand work practices.
To determine the extent to which historical expo-sures in relevant jobs had changed, the historicalrecords of the company (and relevant current andretired supervisory personnel) were consulted. Thisprocess had to be extended back in time to the date ofhire of the oldest cases and controls. This included theperiod 1949-1959 when the 25-Hz and 66%-Hz com-ponents of the electric transmission and distributionsystems were converted to 60 Hz. Past exposures toelectric and magnetic fields were judged to have dif-fered from present if changes had occurred in exposuresources, work sites, or work procedures. Adjustmentsfor sources were judged to be the major factor andwere derived for the years back to 1950 for five typesof site or facility. The source adjustment factors werebased on a combination of data available from OntarioHydro archives. These included peak power loads at anumber of specific points in the Ontario Hydro systemand overall system data, such as the total energygenerated, operating voltages, and total lengths oftransmission and distribution circuits. These were usedto estimate average voltages and currents in differentparts of the system through the period 1950-1990.Prior to 1950 no further adjustments were madebecause of increasing difficulties in locating specificload data and an increasing uncertainty in the assump-tions of the source models.
To convert these data into estimates of individualexposure for each study subject, we applied the expo-sure estimates of the appropriate cells in the job ex-posure matrix for the relevant job titles and worklocations in the individuals' work history to the daysworked, which were then summed to produce a cumu-lative life exposure index. These indices are availablein terms of cumulative arithmetic and cumulative geo-metric means for both electric and magnetic fieldexposure estimates.
Potential occupational confounders
The basic data on potential occupational confound-ers were developed by an industrial hygienist at On-tario Hydro from a job title list developed before theestablishment of the electric and magnetic fields' job
exposure matrix, based on all known exposure to car-cinogens classified by the International Agency forResearch on Cancer as in categories 1, 2A, and 2B.For ionizing radiation, quantitative estimates of occu-pational exposure were available from the OntarioHydro Radiation Dose Information System, which ismaintained in accordance with the Atomic EnergyControl Act.
Because the triutility analysis showed that specialattention needed to be paid to exposure to leukemo-gens (25), a secondary list of job titles and work sitesrelated only to the cases of leukemia and correspond-ing controls was developed. This list, blind as to caseand control status, was submitted to an occupationalmedicine specialist, knowledgeable in terms of poten-tially hazardous exposures of the work place. Job titleswith "possible" or "probable" exposure to carcinogenswere first identified. These job titles were then recom-bined into individual work histories (still blind as tocase or control status), and the sets were reclassified,identifying those for whom exposure to potential leu-kemogens was possible or probable. Following thisclassification process, the lists were examined by anoccupational hygienist independent of Ontario Hydro,and consultations were held with occupational hygien-ists in Ontario Hydro.
Analysis
The study was initially analyzed in the univariatemode, providing unadjusted estimates of odds ratioswith the estimated cumulative exposure to electric andmagnetic fields being the primary exposures of inter-est. Exposures to electric and magnetic fields weremeasured as continuous variables. In the subsequentlogistic regression analysis, these measurements werecategorized into tertiles, based on the distribution ofexposures in the controls, to estimate odds ratios andtheir corresponding 95 percent confidence intervals foreach of the higher levels of exposure in comparisonwith the lower reference level. All dose-response re-lations were tested by the x* test for trend, and thestatistical significance was determined by the p valuecalculated accordingly.
The effect of potential confounding variables wasevaluated using conditional logistic regression tech-niques appropriate to matched studies. Socioeconomicstatus was classified by a five-category scheme felt torepresent the employee status at the time of hire.Potential confounders were categorized or consideredas continuous variables as appropriate to the datacollected. For example, three levels of exposure toionizing radiation were defined, with 0 = no exposure(used as the reference comparison), 1 = less than 5rems, and 2 = 5 or more rems of exposure.
Am J Epidemiol Vol. 144, No. 2, 1996
by guest on February 24, 2016http://aje.oxfordjournals.org/
Dow
nloaded from

Leukemia and Occupational Exposure to Electric and Magnetic Fields 153
The potential occupational confounders for whichadjustment was made in the analysis varied by cancersite in the light of published information on risk. Forleukemia, the potential occupational confounders forwhich adjustment was made were ionizing radiation,(2,4-dichlorophenoxy)acetic acid (2,4-D), (2,4,5-tri-chlorophenoxy)acetic acid (2,4,5-T), and benzene. Fornon-Hodgkin's lymphoma, adjustment was for (2,4-dichlorophenoxy)acetic acid and (2,4,5-trichlorophe-noxy)acetic acid exposure. For brain cancer, adjust-ment was for ionizing radiation; for melanoma,sunlight; and for lung cancer, ionizing radiation, as-bestos, cadmium, and cadmium compounds.
Evaluation of the combined effects of electric andmagnetic fields was made by analyzing the fields ascontinuous variables and by categorizing the expo-sures simultaneously into a 3 X 3 matrix, with theboundaries of the tertiles of exposures the same aswhen the exposures were considered alone. As termsfor interaction between electric and magnetic fieldswere significant for the risk of leukemia, these termswere included in the final model.
RESULTS
There were 1,484 eligible cancer cases for the study.Of these, 233 were "a priori cancers" and 1,251 werecancers of other sites. Of the a priori cancers, 230 werematched to four controls, two to three controls, andone to two controls. The remainder were matched toone control, resulting in a total of 2,179 controls and atotal study population of 3,663 subjects.
Pensioners comprised 46.2 percent of the 3,663 sub-jects; 40.6 percent of the population were still activelyworking at the utility at the time of diagnosis, theremainder having left before becoming pensioners. Atthe end of the period of observation (December 31,1988), 57.4 percent of the cases were known to bedeceased. Of the 221 cases among workers who hadleft the utility, 55.7 percent were deceased. More thanhalf of the study subjects were born before 1920. Themajority of the cancers (66.4 percent) were diagnosedafter 1980. The average ages when first employed atOntario Hydro were 31.8 years for both the cases andcontrols. Less than 10 percent of the study populationstarted working at the utility prior to 1930, and themajority were hired after 1945, which coincided witha period of provincewide recruitment and enhancedelectricity generation. Fifty percent of the cases and 54percent of the controls ceased working for the utility in1980 or more recently. Only about 13 percent had lessthan 10 years of employment at the utility. Sixty-ninepercent of the cases and 64 percent of the controls hadat least 20 years of employment at the utility.
Table 1 shows the frequency distributions of cumu-
TABLE 1. Distribution of cumulative exposures to electricand magnetic fields among Ontario electric utility worker*,1970-1988
0-4.95-9.910-24.925-49.950-99.9100-249250-499500-6991,000-2,4992,500-4,999£5,000
Total
0-0.090.1-0.240.25-0.490.5-0.991.0-2.42.5-4.95.0-9.910-24.925-49.950-99.9100-249.9£250
Total
Case
No.
a
%
Controls
No.
Cumulative electric (VAn-years)
01
2243
127476470197147
10
1,484
0.00.11.52.98.6
32.131.713.39.90.10.0
04
45116236692638218227
30
2,179
Cumulative magnetic (fiT-yoais)
04
1346
260383415195675545
1
1,484
0.00.30.93.1
17.525.828.013.14.53.73.00.1
05
3187
410591588250
916758
1
2,179
%
0.00.22.15.3
10.831.729.310.010.40.10.0
0.00.21.44.0
18.827.127.011.54.23.12.70.0
lative arithmetic (for simplicity referred to subse-quently as "cumulative") field measurements for allcases and controls. The median and mean exposures ofcases and controls to both electric and magnetic fieldswere similar.
Of the 233 cancers in sites of a priori interest, 140were hematopoietic malignancies, 35 were brain tu-mors (including both malignant and benign), and 58were malignant melanoma of the skin (table 2). Of the140 hematopoietic malignancies, 50 were leukemias.The largest numbers of the other cancer sites werelung (n - 263) and prostate (n = 244). Of the 50 casesof leukemia, 13 were acute myeloid leukemia (ICDcodes 205.0 and 205.9), eight were chronic myeloidleukemia, 19 were chronic lymphoid leukemia (ICDcode 204.1), and 10 were "unspecified" leukemia. Thecategory acute nonlymphoid leukemia is a combina-tion of ICD codes 205.0, 205.3, 205.9, 206.0, 207.0,207.2, 207.8, 208.0, and 208.9 and includes the 13acute myeloid leukemia cases and seven of the un-specified.
Odds ratios for cancer sites and cumulative expo-sures to electric fields are presented in table 3. Unad-
Am J Epidemiol Vol. 144, No. 2, 1996
by guest on February 24, 2016http://aje.oxfordjournals.org/
Dow
nloaded from
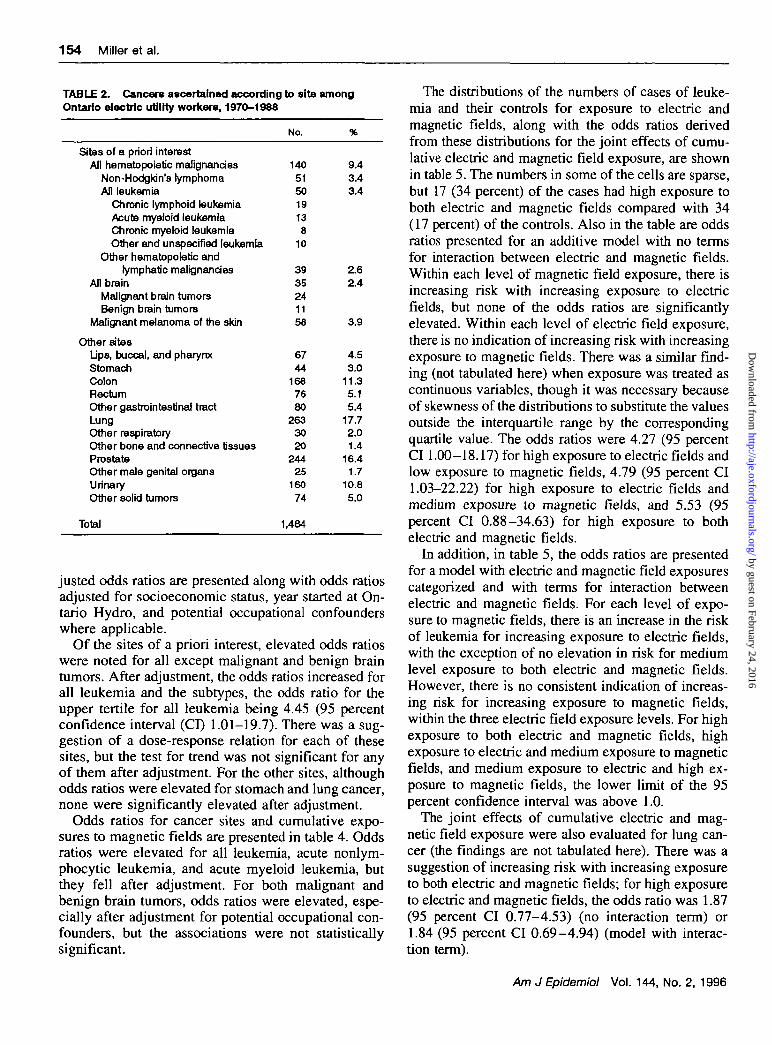
154 Miller et al.
TABLE 2. Cancers ascertained according to site amongOntario electric utility workers, 1970-1988
Sites of a priori interestAH hematopoietic malignancies
Non-Hodgkin's lymphomaAll leukemia
Chronic lymphoid leukemiaAcute myeloid leukemiaChronic myeloid leukemiaOther and unspecified leukemia
Other hematopoietic andlymphatic malignancies
ATI brainMalignant brain tumorsBenign brain tumors
Malignant melanoma of the skin
Other sitesLips, buccal, and pharynxStomachColonRectumOther gastrointestinal tractLungOther respiratoryOther bone and connective tissuesProstateOther male genital organsUrinaryOther solid tumors
Total
No.
140515019138
10
3935241158
6744
1687680
2633020
24425
16074
1,484
%
9.43.43.4
2.62.4
3.9
4.53.0
11.35.15.4
17.72.01.4
16.41.7
10.85.0
justed odds ratios are presented along with odds ratiosadjusted for socioeconomic status, year started at On-tario Hydro, and potential occupational confounderswhere applicable.
Of the sites of a priori interest, elevated odds ratioswere noted for all except malignant and benign braintumors. After adjustment, the odds ratios increased forall leukemia and the subtypes, the odds ratio for theupper tertile for all leukemia being 4.45 (95 percentconfidence interval (CI) 1.01-19.7). There was a sug-gestion of a dose-response relation for each of thesesites, but the test for trend was not significant for anyof them after adjustment. For the other sites, althoughodds ratios were elevated for stomach and lung cancer,none were significantly elevated after adjustment.
Odds ratios for cancer sites and cumulative expo-sures to magnetic fields are presented in table 4. Oddsratios were elevated for all leukemia, acute nonlym-phocytic leukemia, and acute myeloid leukemia, butthey fell after adjustment. For both malignant andbenign brain tumors, odds ratios were elevated, espe-cially after adjustment for potential occupational con-founders, but the associations were not statisticallysignificant.
The distributions of the numbers of cases of leuke-mia and their controls for exposure to electric andmagnetic fields, along with the odds ratios derivedfrom these distributions for the joint effects of cumu-lative electric and magnetic field exposure, are shownin table 5. The numbers in some of the cells are sparse,but 17 (34 percent) of the cases had high exposure toboth electric and magnetic fields compared with 34(17 percent) of the controls. Also in the table are oddsratios presented for an additive model with no termsfor interaction between electric and magnetic fields.Within each level of magnetic field exposure, there isincreasing risk with increasing exposure to electricfields, but none of the odds ratios are significantlyelevated. Within each level of electric field exposure,there is no indication of increasing risk with increasingexposure to magnetic fields. There was a similar find-ing (not tabulated here) when exposure was treated ascontinuous variables, though it was necessary becauseof skewness of the distributions to substitute the valuesoutside the interquartile range by the correspondingquartile value. The odds ratios were 4.27 (95 percentCI 1.00-18.17) for high exposure to electric fields andlow exposure to magnetic fields, 4.79 (95 percent CI1.03-22.22) for high exposure to electric fields andmedium exposure to magnetic fields, and 5.53 (95percent CI 0.88-34.63) for high exposure to bothelectric and magnetic fields.
In addition, in table 5, the odds ratios are presentedfor a model with electric and magnetic field exposurescategorized and with terms for interaction betweenelectric and magnetic fields. For each level of expo-sure to magnetic fields, there is an increase in the riskof leukemia for increasing exposure to electric fields,with the exception of no elevation in risk for mediumlevel exposure to both electric and magnetic fields.However, there is no consistent indication of increas-ing risk for increasing exposure to magnetic fields,within the three electric field exposure levels. For highexposure to both electric and magnetic fields, highexposure to electric and medium exposure to magneticfields, and medium exposure to electric and high ex-posure to magnetic fields, the lower limit of the 95percent confidence interval was above 1.0.
The joint effects of cumulative electric and mag-netic field exposure were also evaluated for lung can-cer (the findings are not tabulated here). There was asuggestion of increasing risk with increasing exposureto both electric and magnetic fields; for high exposureto electric and magnetic fields, the odds ratio was 1.87(95 percent CI 0.77-4.53) (no interaction term) or1.84 (95 percent CI 0.69-4.94) (model with interac-tion term).
Am J Epidemiol Vol. 144, No. 2, 1996
by guest on February 24, 2016http://aje.oxfordjournals.org/
Dow
nloaded from

Leukemia and Occupational Exposure to Electric and Magnetic Fields 155
TABLE 3. Odd* ratio* for exposure to cumulative electric flatd* among
Site of a priori interestAll hematopoietic malignancies
Non-Hodgkin's lymphomaAll leukemiaAcute nonlymphoid leukemiaAcute myeiokd leukemiaChronic tymphoid leukemia
Malignant brain tumorsBenign brain tumorsMalignant melanoma of the skin
Other sitesLip, buccal, and pharynxStomachColonProstateLung
All cancers
0-171V/ATL.v/rn-
years,*no. ofcases
351411433
126
22
1915515157
413
No.o*cases
50171363642
18
249
5610099
524
Ontario electric utility workers, 1970-1988
Exposu re level
172-344 V/m-years
ORt
1.941.691.603.671.881.250.420.731.51
0.680.580.801.231.37
1.15
AdjustedOR*
1.802.142.079.999.601.250.571.411.10
0.470.520.611.161.20
1.02
95%Clt
0.96-3.400.69-6.620.59-7.220.58-1720.21-4380.07-21.20.10-3.170.10-19.50.40-3.06
0.13-1.720.14-1.990.31-1.220.67-2.010.66-2.17
0.83-1.27
No. ofcases
552026107
1083
18
24206193
107
547
i345 V/m-years
OR
1.85£093.504.663.002.530.680.981.21
0.701.520.781.191.89
1.21
AdjustedOR*
1.652.444.457.89
24.537.180.990.530.87
0.352.020.541.171.46
0.98
95% a
0.79-3.440.72-8.291.01-19.70.43-1430.55-1,0980.31-1690.16-6.240.03-8.100.30-2.48
0.07-1.880.29-13.90.23-1.270.62-2.220.75-2.84
0.76-1.27
* Referent level.t OR, odds ratio; Cl, confidence interval.% Adjusted for socioeconomic status, year of first hire in Ontario Hydro, and potential occupational confounders (non-HodgWn's lymphoma-
(2,4-dchk>rophenoxy)acetic add (2,4-D) and (2,4,5-trichk>rophenoxy)acetic add (2,4,5-T); ieukemias: ionizing radiation, 2,4-D, 2,4,5-T, andbenzene; brain cancer ionizing radiation; melanoma: sunlight lung cancer ionizing radiation, asbestos, cadmium, and cadmium compounds).
The risk of leukemia in relation to the job titles heldfor s i year is examined in table 6. Only for operators,for power line maintainers, and for technical, mainte-nance, and security workers is there an indication of anelevation in risk, but the numbers of cases and controlsin each category are small. For job sites (table 7), therewere also small numbers in each category, thoughthere was an indication of increased risk in area of-fices, in hydroelectric, nuclear, and thermal generationstations, and in transformer stations.
DISCUSSION
The results of the present analysis have to be inter-preted with caution. This is because the Ontario Hydrostudy was planned with the objective of contributing toa triutility study, and it was expected that only thecombined data set would have sufficient statisticalpower to address the study objectives (25). However,because of the larger Ontario Hydro work force thanthat of Hydro Quebec and the absence of person-yearsof experience of the workers who had left the corpo-ration or retired in Electricite de France, the OntarioHydro component of the joint study contributed nearlytwice as many subjects as from Hydro Quebec and
almost as many as from Electricity de France. Inaddition, the Ontario Hydro component contributedthe majority of the subjects with high level exposure tomagnetic fields in the triutility analysis (25), as theexposures in France were lower than those in Canada.
The present analysis shows associations for all leu-kemia and its subtypes with increasing electric fieldexposure, with a dominant effect of electric field ex-posure on leukemia when both electric and magneticfield exposures are considered together. The paucity ofnumbers of cases and controls did not permit a similaranalysis for the leukemia subtypes. The present anal-ysis also confirms the triutility analysis (25) in show-ing associations for all leukemia, acute nonlympho-blastic leukemia, and acute myeloid leukemia withexposure to cumulative magnetic field exposure, whenconsidered alone. However, these became nonsignifi-cant after adjustment for socioeconomic status, year ofhire, and potential occupational confounders, and it ispossible that these odds ratios were elevated onlybecause of the incomplete correlation between electricand magnetic field exposure (r = 0.37 for the leuke-mia cases and 0.47 for their controls).
Unlike magnetic fields, electric fields are signifi-cantly perturbed by the body of the worker wearing the
Am J Epidemiol Vol. 144, No. 2, 1996
by guest on February 24, 2016http://aje.oxfordjournals.org/
Dow
nloaded from

156 Miller et al.
TABLE 4. Odds ratios for exposure
Site of a priori interestAD hematopoietic malignancies
Non-Hodgkin's lymphomaAll leukemiaAcute nontymphoid leukemiaAcute myetoid leukemiaChronic rymphold leukemia
Malignant brain tumorsBenign brain tumorsMalignant melanoma of the skin
Other sitesUp, buccal, and pharynxStomachColonProstateLung
All cancers
to cumulative magnetic fields among Ontario electric utility workers, 1970-1988
0-3.1nT(iT-
yeare,*no. ofcases
38131030473
21
219
617263
444
No. ofcases
49191665674
19
1914527894
466
32-7 nT-yeara
ORt
1.371.412.043.041.0O§1.221.111.920.95
0.702.230.870.931.36
1.04
AdjustedORt
1.231571.671.931.00§0.491.275.380.96
0.472.230.750.930.93
0.92
Exposure level
95%Clt
0.73-2.080.54-2.980.58-^.760.27-13.7
0.06-4.240.32-5.410.42-69.30.42-2.20
0.16-1.320.49-10.20.40-1.430.57-1.540.56-1.54
0.76-1.12
No. o)cases
5319241189
104
18
27215594
106
574
OR
1.461.772.845.024.311.621.332.591.06
0.961.840.620.961.96
1.21
£7.1 nT-years
AdjustedOR*
1.231.291.562.873.810.252.365.641.05
0.68ZOO0.460.91152
1.01
95% Cl
0.69-2500.46-3.640.47-5.140.42-19.80.31-48.90.01-4.630.52-10.80.30-1050.38-2.86
0.23-2.020.42-S.530.23-0.930.54-1.550.69-2.15
0.82-1.24
* Referent level.t OR, odds ratio; Cl, confidence interval.i Adjusted for socioeconomic status, year of first hire in Ontario Hydro, and potential occupational confounders (non-Hodgkin's lymphoma:
(2,4-dichlorophenoxy)acetic acid (2,4-D) and (2,4,5-trichlorophenoxy)acetic add (2,4,5-T); leukemias: ionizing radiation, 2,4-D, 2,4,5-T, andbenzene; brain cancer ionizing radation; melanoma: sunlight lung cancer ionizing radation, asbestos, cadmium, and cadmium compounds).
§ Referent (as there were no cases in the 0-3-nT category).
TABLE 5. Odds rat ios* for all leukemia for the interaction between electric and magnetic fields amongOntario electric utility workers, 1970-1988
Magneticfields
0-3.1 nT-years3.2-7 nT-years£7.1 nT-years
0-3.1 (iT-years3.2-7 |iT-years27.1 nT-years
0-3.1 nT-years3.2-7 jiT-years£7.1 nT-years
No.
cases
461
526
18
17
No.
controls
461511
272020
12534
ORt
0-171 V/m-years
1.00§1.161.10
172-344 V/m-years
1.421.651.57
2345 V/m-years
3.173.693.51
Electric fields
95% Clt
0.40-3.400.32-3.78
0.45-^4.520.34-8.020.29-8.51
0.82-12.30.65-20.80.56-21.9
OR*
1.00§4.841.20
4.981.247.83
16.311.311.2
95% Cl
0.89-26.30.11-135
0.77-32.30.10-15.01.06-58.0
0.50-5331.52-84.31.30-975
* Adjusted for sodoeconomic status, year of first hire in Ontario Hydro, and potential occupational confounders(ionizing radation, (2,4-cf chlorophenoxy)acetic add, (2,4,5-trichlorophenoxy)acetic add, and benzene),
f OR, odds ratio; Cl, confidence interval.i Model includes terms for the interaction between electric and magnetic fields.§ Referent for the odds ratios in this column.
monitor, so that the resultant reading is influenced bynot only the ambient electric field strength and direc-tion but also the wearing position of the monitor
(normally at the waist in this study), the physicalcharacteristics of the worker, and the body posture(e.g., standing, bending, arms extended). The larger
Am J Epidemiol Vol. 144, No. 2, 1996
by guest on February 24, 2016http://aje.oxfordjournals.org/
Dow
nloaded from

Leukemia and Occupational Exposure to Electric and Magnetic Fields 157
TABLE 6. Odds ratios for all leukemia cases and Job title (ever held) among Ontario electric utilityworkers, 1970-1988
Job title
Clerk, professional, and manager}Control maintainer/technitianCustomer service representativeForestersInspectorMeter readerOperatorsPower line maintainerPower maintenance electricianStockkeeperSupervisors (technical and trade)Truck driverTechnical, maintenance, and securityTechnician (other)Protection and control technicianTrade (general)
No. ofcases
15310015
161281
1364
11
No. ofcontrols
8534773
2042
68
483
4839
654
Oddsratio*
1.00
3.341.89
0.70
2.370.99
1.06
95%Clt
0.48-23.00.60-5.92
0.22-2.20
0.56-10.10.26-3.82
0.24-4.63
* Adjusted for duration of employment In job title,t Cl, confidence interval,t Referent group.
TABLE 7. Odds ratios for all leukemia cases and job site among Ontario electric utility workers,1970-1988
Job site
Heliport, administration, and inspection^Area officeControl centerConstructionDistrict officeHydroelectric generation stationNuclear generation stationRegional officeService centerTechnical facilityThermal generation stationsTransformer stationWarehouse
No. erfcases
640
18175250672
No. ofcontrols
34180
653
312014111
23203
Oddsralk>»
1.002.69
1.07
2.332.910.41
2.054.00
95%Clf
0.26-27.6
0.29-4.00
0.33-16.70.18-46.20.04-4.13
0.26-16.10.64-24.8
* Adjusted for duration of employment in job site,t Cl, confidence interval.i Referent group.
uncertainties inherent in assessing electric field expo-sure relative to magnetic field exposure may translateto a greater extent of misclassification, when assigningworkers to exposure groups, and thus would be ex-pected to diminish the magnitude of the observedassociation. Thus, the associations that exist in prac-tice may be even stronger than those reported in thepresent study.
A detailed analysis by job title and type of worklocation was performed. No significant associationswere noted by job title or by work site, though therewere some jobs and sites with suggestive increases inrisk.
As cases were ascertained by record linkage to theOntario Cancer Registry, there was no mechanism foridentifying cases in subjects who might have left theprovince. Some confidence that this is not a majorissue is gained from the fact that, for those who wereretired, the standard mechanisms within Ontario Hy-dro identified deaths and the cause of death. We knowof no reason why underascertainment of cases mayhave been biased with regard to exposure.
In the report on the triutility analysis (25), doubt wascast on the causality of the association of magneticfield exposure with leukemia, because it seemed to bemainly present in the Ontario Hydro component of the
Am J Epidemiol Vol. 144, No. 2, 1996
by guest on February 24, 2016http://aje.oxfordjournals.org/
Dow
nloaded from

158 Miller et al.
study and because there was no consistent evidence ofan exposure-response relation. In the present analysis,however, an increasing risk of leukemia with increas-ing exposure to electric fields has been demonstrated.
The absence of an association with leukemia fromexposure to magnetic fields in the other components ofthe triutility study data (25) requires comment. Asalready indicated, the numbers of cases and controls inHydro Quebec were substantially lower than for On-tario Hydro, and thus an association could easily havebeen missed by chance alone. The absence of anassociation in the Electricity de France data may bedue to 1) more than 75 percent of their study popula-tion's being in the exposure category for magneticfields below the median and 2) the absence of data onretired workers.
Further, there were differences in the way the jobexposure matrix for electric and magnetic field expo-sure was constructed within Ontario Hydro comparedwith Hydro Quebec and Electricity de France (25). InHydro Quebec and Electricity de France, decisionswere made in advance on the likely high exposure jobtitles to be monitored. In Ontario Hydro, the workersmonitored corresponded to those titles in the case-control data set, and job site information was includedin the job exposure matrix. This showed that, for someworkers with anticipated low exposure (such as pro-fessionals, managers, clerks, and storekeepers), if theyworked in a site such as hydroelectric stations andtransformer stations with high exposure in general,they also had high exposure. Thus, although in allthree utilities the same measuring instrument was usedand every effort was made to ensure that monitoringrepresented a typical worker performing his usualrange of activities, there may have been greater op-portunity for misclassification of exposure in the othertwo utilities than in Ontario Hydro. This suppositionwas confirmed by an analysis of Ontario Hydro datausing a specially constructed data set that minimizedjob site information in the job exposure matrix and,thus, was more comparable to the process used indeveloping the job exposure matrix for Hydro Qu6becand Electricity de France, which showed lower oddsratios compared with the findings presented here. Forexample, the odds ratio of 1.56 for all leukemia withexposure to the upper tertile of magnetic fields in table4 fell to 0.97 when site data were eliminated.
Our findings for leukemia are largely compatiblewith those in the published literature. A recent Swed-ish study (26) was anomalous in showing elevated riskonly for chronic lymphoid leukemia. Although oddsratios were elevated for chronic lymphoid leukemia inthe present study, the effect was mainly for electricfields and was less than for risks of acute nonlymphoid
leukemia and its component acute myeloid leukemia.A case-control study of nonchronic lymphoid leuke-mia in a primarily retired population of AmericanTelephone and Telegraph workers found nonsignifi-cant increased risks compatible with those in thepresent study (27). There were similar findings in astudy of Norwegian workers (28).
Two cohort studies of electric utility workers haverecently been reported from the United States (29, 30)and one from Norway (31). The first study reported noincreased risk for leukemia (29). However, as all "non-electric workers" were grouped together for the pur-pose of exposure assessment, and exposures to "elec-tric workers" were assigned on the basis of job titleonly, exposure assessment may have been substan-tially less precise than for the present study. Thesecond study (30) also reported no excess risk forleukemia (except in a subset of "electricians") but didfind an excess of brain tumors related to high levelexposure to magnetic fields. An excess risk for astro-cytomas was reported in the triutility analysis (25), butonly a nonsignificant excess risk for malignant braintumors with exposure to magnetic fields was found inthe present analysis, with no risk from exposure toelectric fields. The Norwegian study (31) was small(only 5,088 men) and did not involve measurements ofelectric or magnetic field exposure. There was anassociation of estimated magnetic field exposure withmelanoma, but not with leukemia or brain tumors.
It is not clear why there should be a discrepancyamong the studies. We may have failed to see asignificant brain tumor association because of lowpower. The findings in table 4 are, however, compat-ible with those from the US (30) study. In the US (30)study, the inability to fully characterize leukemia casesby histologic type and differences in exposure assess-ment methods may account for their failure to find anassociation with leukemia. However, none of thesestudies developed a job exposure matrix with attentionto job site. The present study suggests that failure toutilize job site information could lead to substantialmisclassification of past exposure and, thus, attenuatedassociations.
In the present study, of the sites not of a prioriinterest, only for lung cancer was there a suggestion ofassociation with exposure to electric and magneticfields. An association has been noted between lungcancer and pulsed electromagnetic field exposure inthe Hydro Quebec and Electricity de France data com-bined (32). Pulsed electromagnetic field exposure hasso far not been evaluated with Ontario Hydro data.
An issue that needs further exploration is the mostbiologically relevant exposure metric to use in thesetypes of studies. Smith (33) has commented upon the
Am J Epidemiol Vol. 144, No. 2, 1996
by guest on February 24, 2016http://aje.oxfordjournals.org/
Dow
nloaded from

Leukemia and Occupational Exposure to Electric and Magnetic Fields 159
nonlinear relations for peak exposure intensity andcumulative exposure, the former being generally asso-ciated with acute health effects and the latter beingoften used for chronic diseases. However, the relevantexposure metric will depend on the biologic process,especially the stage of carcinogenicity at which elec-tric and magnetic fields act. Exposure metrics relatedto peak and intermittent exposures remain to be ex-plored in the Ontario Hydro data.
In conclusion, this study confirms the previouslyobserved associations between estimated exposure tomagnetic fields and certain types of leukemia in theOntario Hydro component of the triutility study (25).Uniquely, it demonstrates significant associations withcumulative electric field exposure and the occurrenceof all leukemia, with suggestions that the risk maymainly relate to acute nonlymphoblastic leukemia andits component acute myeloid leukemia. Exposure-response relations are present for these associations.The findings from the study suggest that failure toincorporate job site may have resulted in misclassifi-cation in previous studies and that the associations ofleukemia with magnetic field exposure noted in pre-vious studies may have been driven by concomitantexposures to electric fields.
ACKNOWLEDGMENTS
This study was supported by Ontario Hydro by means ofa contract with the University of Toronto.
The authors acknowledge the contributions of Drs. JimPurdham and Michael Wills to the evaluation of potentialoccupational confounders in this study; of Dr. A. M. Muc,who directed the exposure assessment data collection andassigned job titles to appropriate occupational groups; ofDr. K. E. Donnelly, who developed the historical adjust-ment factors for electric and magnetic field exposure; oftechnician Jack Hartwell who assigned type-of-site infor-mation for work periods; and of technicians Larry Rankineand John Whitman who visited work sites to obtain workercooperation and distribute and collect personal monitors.They also acknowledge the contribution of the director (Dr.E. Holowaty) and staff of the Ontario Cancer Registry inperforming and clarifying the record linkages that resultedin die identification of cancers for the analysis.
REFERENCES
1. Wertheimer N, Leeper E. Electrical wiring configurations andchildhood cancer. Am J Epidemiol 1979; 109:273-84.
2. Fulton JP, Cobb S, Preble L, et al. Electrical wiring configu-rations and childhood leukemia in Rhode Island. Am J Epi-demiol 1980;l 11:292-6.
3. Wertheimer N, Leeper E. Adult cancer related to electricalwires near the home. Int J Epidemiol 1982; 11:345-55.
4. Tomenius L. 50-Hz electromagnetic environment and the in-cidence of childhood tumors in Stockholm County. Bioelec-tromagnetics 1986;7:191-207.
5. McDowall ME. Mortality of persons resident in the vicinity ofelectricity transmission facilities. Br J Cancer 1986;53:271-9.
6. Severson RK, Stevens RG, Kaune WT, et al. Acute nonlym-phocytic leukemia and residential exposure to power fre-quency magnetic fields. Am J Epidemiol 1988;128:10-20.
7. Savitz DA, Wachtel H, Barnes FA, et al. Case-control study ofchildhood cancer and exposure to 60-Hz magnetic fields. AmJ Epidemiol 1988;128:21-38.
8. Milham S. Mortality from leukemia in workers exposed toelectrical and magnetic fields. (Letter). N Engl J Med 1982;307:249.
9. Wright WE, Peters JM, Mack TM. Leukaemia in workersexposed to electrical and magnetic fields. (Letter). Lancet1982;2:1160-4.
10. McDowall ME. Leukaemia mortality in electrical workers inEngland and Wales. (Letter). Lancet 1983; 1:246.
11. Coleman M, Bell J, Skeet R. Leukaemia incidence in electricalworkers. (Letter). Lancet 1983;l:982-3.
12. Vagero D, Olin R. Incidence of cancer in the electronicsindustry: using the new Swedish Cancer Environment Regis-try as a screening instrument. Br J Ind Med 1983;40:188-92.
13. Pearce NE, Sheppart AR, Howard JK, et al. Leukaemia inelectrical workers in New Zealand. (Letter). Lancet 1985;1:811-12.
14. Milham S. Silent keys: leukaemia mortality in amateur radiooperators. (Letter). Lancet 1985;1:811.
15. Milham S. Mortality in workers exposed to electromagneticfields. Environ Health Perspect 1985;62:297-300.
16. Calle E, Savitz DA. Leukemia in occupational groups withpresumed exposure to electrical and magnetic fields. (Letter).N Engl J Med 1985;313:1476-7.
17. Gilman PA, Ames RG, McCawley A. Leukemia risk amongwhite male coal miners. J Occup Med 1985;27:669-71.
18. Vagero D, Ahlbom A, Olin R, et al. Cancer morbidity amongworkers in the telecommunications industry. Br J Ind Med1985;42:191-5.
19. Olin R, Vagero D, Ahlbom A. Mortality experience of elec-trical engineers. Br J Ind Med 1985;42:211-12.
20. Tornqvist S, Norell S, Ahlbom A, et al. Cancer in the electricpower industry. Br J Ind Med 1986;43:212-13.
21. Lin RS, Dischinger PC, Conde J, et al. Occupational exposureto electromagnetic fields and the occurrence of brain tumors:an analysis of possible associations. J Occup Med 1985;27:413-19.
22. Thomas TL, Stolley PD, Stemhagen A, et al. Brain tumormortality among men with electrical and electronics jobs: acase-control study. J Natl Cancer Inst 1987;79:233-8.
23. Speers MA, Dobbins JG, Miller VS. Occupational exposuresand brain cancer mortality: a preliminary study of East Texasresidents. Am J Ind Med 1988; 13:629-38.
24. Milham S Jr. Increased mortality in amateur radio operatorsdue to lymphatic and hematopoietic malignancies. Am J Epi-demiol 1988;127:50-4.
25. TheYiault G, Goldberg M, Miller AB, et al. Cancer risksassociated with occupational exposure to magnetic fieldsamong electric utility workers in Ontario and Quebec, Canada,and France: 1970-1989. Am J Epidemiol 1994; 139:550-72.
26. Floderus B, Persson T, Stenlund C, et al. Occupational expo-sure to electromagnetic fields in relation to leukemia and braintumours. A case-control study in Sweden. Cancer CausesControl 1993;4:465-76.
27. Matanoski GM, Elliott EA, Breysse PN, et al. Leukemia intelephone linemen. Am J Epidemiol 1993; 137:609-19.
28. Tynes T, Andersen A, Langmark F. Incidence of cancer inNorwegian workers potentially exposed to electromagneticfields. Am J Epidemiol 1992;136:81-8.
29. Sahl JD, Kelsh MA, Greenland S. Cohort and nested case-
Am J Epidemiol Vol. 144, No. 2, 1996
by guest on February 24, 2016http://aje.oxfordjournals.org/
Dow
nloaded from

160 Miller et al.
control studies of hematopoietic cancers and brain canceramong electric utility workers. Epidemiology 1993;4:104-14.
30. Savitz DA, Loomis DP. Magnetic field exposure in relation toleukemia and brain cancer mortality among electric utilityworkers. Am J Epidemiol 1995; 141:123-34.
31. Tynes T, Reitan JB, Andersen A. Incidence of cancer amongworkers in Norwegian hydroelectric power companies. Scand
J Work Environ Health 1994;20:339-44.32. Armstrong B, Th6riault G, Gunnel P, et al. Association be-
tween exposure to pulsed electromagnetic fields and cancer inelectrical utility workers in Quebec, Canada, and France. AmJ Epidemiol 1994; 140:805-20.
33. Smith TJ. Occupational exposure and dose over time: limita-tions of cumulative exposure. Am J Ind Med 1992;21:35-51.
Am J Epidemiol Vol. 144, No. 2, 1996
by guest on February 24, 2016http://aje.oxfordjournals.org/
Dow
nloaded from