Common University Data Ontario – 2015
30
Common University Data Ontario – 2015 Western University
-
Upload
khangminh22 -
Category
Documents
-
view
1 -
download
0
Transcript of Common University Data Ontario – 2015

Common University Data Ontario – 2015
Western University

W e s t e r n U n i v e r s i t y 2 | 3 0 C o m m o n U n i v e r s i t y D a t a O n t a r i o – 2 0 1 5
This document provides CUDO information for Western Main Campus only. Information for
the affiliated university colleges (Brescia, Huron and King's) is available on their respective
websites.
Past Common University Data Ontario
2008 : http://www.uwo.ca/pvp/common_university2008/index.htm
2009 : http://www.uwo.ca/pvp/common_university2009/index.htm
2010 : http://www.uwo.ca/pvp/common_university2010/index.htm
2011 : http://www.ipb.uwo.ca/documents/cudo2011.pdf
2012 : http://www.ipb.uwo.ca/documents/cudo2012.pdf
2013 : http://www.ipb.uwo.ca/documents/cudo2013.pdf
2014 : http://www.ipb.uwo.ca/documents/cudo2014.pdf

W e s t e r n U n i v e r s i t y 3 | 3 0 C o m m o n U n i v e r s i t y D a t a O n t a r i o – 2 0 1 5
Table of Contents
A. General Information
1. Address information
2. Qualifications Offered / Awarded
3. Degrees Conferred by Program
4. Male Enrolment by Program
5. Female Enrolment by Program
6. Total Enrolment by Program
7. Full-time Enrolment by Immigration Status
B. Admission
1. Applicants and Registrants by Program
2. Program Undergraduate Admission Requirements
3. Secondary School Averages of Full-Time, First Year Students
4. Application Fees
5. Admission in Winter, Spring, Summer Terms
6. Deferred Admission
C. Transfer Admission from Other Postsecondary Institutions
1. Enrolment of Transfer Students
2. Transfer Students
3. Policy on Transfer Credit
D. Library Collections
1. Library Collections

W e s t e r n U n i v e r s i t y 4 | 3 0 C o m m o n U n i v e r s i t y D a t a O n t a r i o – 2 0 1 5
E. Student Life
1. Residence of First-Time, First Year Students in Previous Year
2. Percentage of Full-Time Undergraduate Students Who Live on Campus
3. Extracurricular Activities Offered
4. Housing
F. Student Experience Information
1a. The NSSE (National Survey of Student Engagement) - Evaluation
1b. The NSSE (National Survey of Student Engagement) - Would Repeat
2a. Results from the CGPSS (Canadian Graduate Professional Student Survey) - Would recommend or choose
again?
2a. Results from the CGPSS (Canadian Graduate Professional Student Survey) - Overall Quality
G. Annual Student Expenses
1. First Year Average Undergraduate Arts and Science Full‐Time Tuition, Ancillary Fees, Room and Board and Other
Expense
2. First Year Domestic Tuition and Ancillary Fees by Program
H. Instructional Faculty and Class Size
1. Number of Instructional Faculty Members (Excluding Clinicians) in Each Category
2. Undergraduate Class Size by Year Level
I. University Revenue and Expenses
1. University Revenue
2. University Expenses
J. Research
1. Research Awards by Granting Council

W e s t e r n U n i v e r s i t y 5 | 3 0 C o m m o n U n i v e r s i t y D a t a O n t a r i o – 2 0 1 5
K. Other Useful Information
1. Academic Plans
2. Key Performance Indicators, Employment Rate of Graduates in Undergraduates Programs
2A. Key Performance Indicators, Degree Completion Rate for Undergraduate Cohort, New Year 1 Students
3. Retention Rates

W e s t e r n U n i v e r s i t y 6 | 3 0 C o m m o n U n i v e r s i t y D a t a O n t a r i o – 2 0 1 5
A1 - Address information
Institution
Western University
Mailing Address
1151 Richmond Street, London, Ontario, Canada N6A 5B8
Admissions Information
Room 3140, Western Services Building, London, Ontario, Canada N6A 5B8
Phone: 519-661-2100
Fax: 519-661-3710
Email: [email protected]
Main Phone Number
519-661-2111
Internet Address
http://www.uwo.ca/

W e s t e r n U n i v e r s i t y 7 | 3 0 C o m m o n U n i v e r s i t y D a t a O n t a r i o – 2 0 1 5
A2 - Qualifications Offered/Awarded
Number of qualifications offered / awarded, calendar year 2014
DEGREE LEVEL
Undergraduate
Certificate
Undergraduate
Diploma
Bachelor's
Degree
1st Professional
Degree
Graduate
Certificate
Graduate
Diploma
Master's
Degree
Doctoral
Degree
No. awarded in calendar year 2014 0 193 5,012 988 0 0 1,864 349
Notes:
1. Includes all degrees/diplomas/certificates that are offered/awarded.
2. 1st Professional Degree refers to second entry programs and includes: Law, Medicine, Dentistry, Optometry,
Veterinary Medicine, Theology, Consecutive Education.
3. Excludes affiliated colleges.
Source: Official government degrees awarded data OR Institutional submissions to government on degrees
awarded (unless otherwise noted).

W e s t e r n U n i v e r s i t y 8 | 3 0 C o m m o n U n i v e r s i t y D a t a O n t a r i o – 2 0 1 5
A3 - Degrees Conferred by Program
Number of degrees conferred in the calendar year 2014.
PROGRAM
Bachelor's and 1st
Professional Degree Master's Degree Doctoral Degree
1. Agriculture & Biological Science 385 57 15
2. Business & Commerce 1,171 320 15
3. Computer Science 40 34 11
4. Dentistry 76 * 0
5. Education 617 205 9
6. Engineering 297 199 69
7. Fine & Applied Arts 152 53 9
8. Food Science & Nutrition 8 0 0
9. Humanities 553 265 35
10. Journalism 0 32 0
11. Kinesiology, Recreation & Phys. Educ. 286 44 11
12. Law 176 10 0
13. Mathematics 44 64 26
14. Medicine 908 116 47
15. Nursing 286 24 *
16. Other Arts & Science 64 0 0
17. Other Health Professions 0 15 *
18. Physical Science 90 47 31
19. Social Science 819 154 41
20. Therapy & Rehabilitation 26 221 23
21. Not Reported 2 1 0
22. TOTAL: DEGREES CONFERRED TO CANADIAN STUDENTS 5,789 1,518 287
23. TOTAL: DEGREES CONFERRED TO INTERNATIONAL STUDENTS 211 345 62
24. TOTAL DEGREES CONFERRED 6,000 1,863 349
Notes:
1. Excludes certificates and diplomas.
2. To ensure confidentiality, cell counts less-than or equal-to 5 are suppressed and displayed as "*". If one cell in a
column is suppressed, the total is rounded to the nearest multiple of 3.
3. Excludes affiliated colleges.
Source: Official government degrees awarded data.
W e s t e r n U n i v e r s i t y 9 | 3 0 C o m m o n U n i v e r s i t y D a t a O n t a r i o – 2 0 1 5
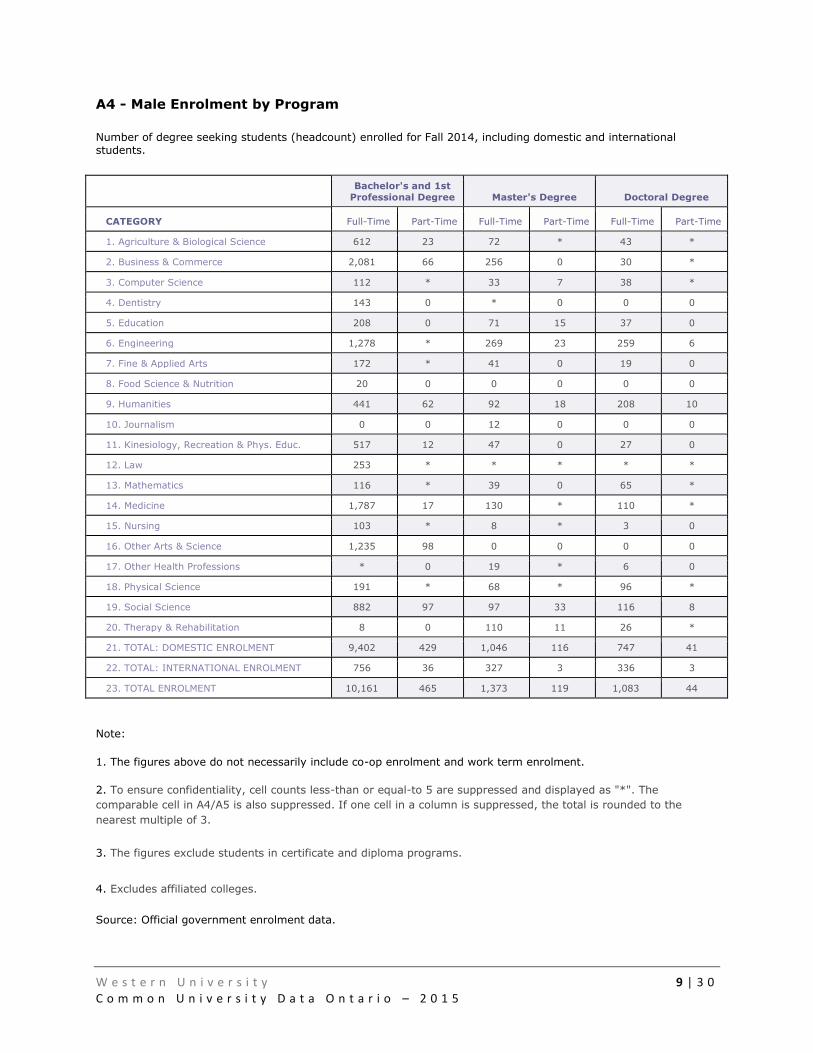
A4 - Male Enrolment by Program
Number of degree seeking students (headcount) enrolled for Fall 2014, including domestic and international students.
Bachelor's and 1st
Professional Degree Master's Degree Doctoral Degree
CATEGORY Full-Time Part-Time Full-Time Part-Time Full-Time Part-Time
1. Agriculture & Biological Science 612 23 72 * 43 *
2. Business & Commerce 2,081 66 256 0 30 *
3. Computer Science 112 * 33 7 38 *
4. Dentistry 143 0 * 0 0 0
5. Education 208 0 71 15 37 0
6. Engineering 1,278 * 269 23 259 6
7. Fine & Applied Arts 172 * 41 0 19 0
8. Food Science & Nutrition 20 0 0 0 0 0
9. Humanities 441 62 92 18 208 10
10. Journalism 0 0 12 0 0 0
11. Kinesiology, Recreation & Phys. Educ. 517 12 47 0 27 0
12. Law 253 * * * * *
13. Mathematics 116 * 39 0 65 *
14. Medicine 1,787 17 130 * 110 *
15. Nursing 103 * 8 * 3 0
16. Other Arts & Science 1,235 98 0 0 0 0
17. Other Health Professions * 0 19 * 6 0
18. Physical Science 191 * 68 * 96 *
19. Social Science 882 97 97 33 116 8
20. Therapy & Rehabilitation 8 0 110 11 26 *
21. TOTAL: DOMESTIC ENROLMENT 9,402 429 1,046 116 747 41
22. TOTAL: INTERNATIONAL ENROLMENT 756 36 327 3 336 3
23. TOTAL ENROLMENT 10,161 465 1,373 119 1,083 44
Note:
1. The figures above do not necessarily include co-op enrolment and work term enrolment.
2. To ensure confidentiality, cell counts less-than or equal-to 5 are suppressed and displayed as "*". The
comparable cell in A4/A5 is also suppressed. If one cell in a column is suppressed, the total is rounded to the
nearest multiple of 3.
3. The figures exclude students in certificate and diploma programs.
4. Excludes affiliated colleges.
Source: Official government enrolment data.
W e s t e r n U n i v e r s i t y 1 0 | 3 0 C o m m o n U n i v e r s i t y D a t a O n t a r i o – 2 0 1 5
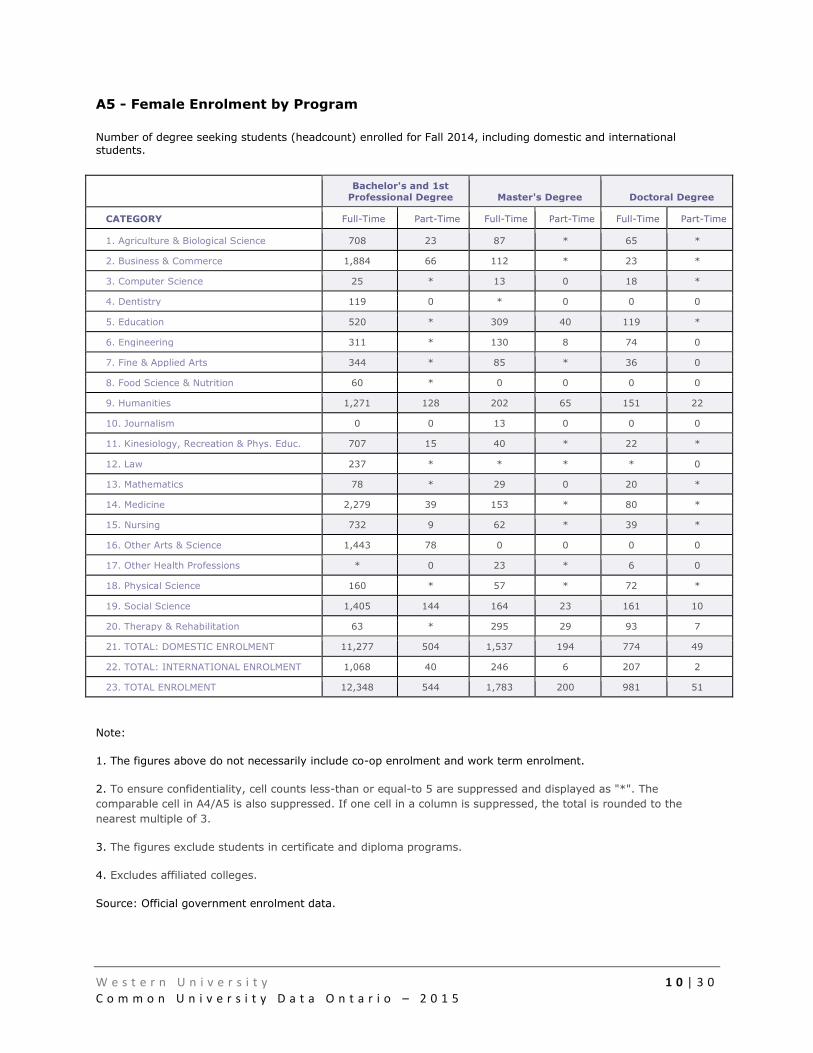
A5 - Female Enrolment by Program
Number of degree seeking students (headcount) enrolled for Fall 2014, including domestic and international students.
Bachelor's and 1st
Professional Degree Master's Degree Doctoral Degree
CATEGORY Full-Time Part-Time Full-Time Part-Time Full-Time Part-Time
1. Agriculture & Biological Science 708 23 87 * 65 *
2. Business & Commerce 1,884 66 112 * 23 *
3. Computer Science 25 * 13 0 18 *
4. Dentistry 119 0 * 0 0 0
5. Education 520 * 309 40 119 *
6. Engineering 311 * 130 8 74 0
7. Fine & Applied Arts 344 * 85 * 36 0
8. Food Science & Nutrition 60 * 0 0 0 0
9. Humanities 1,271 128 202 65 151 22
10. Journalism 0 0 13 0 0 0
11. Kinesiology, Recreation & Phys. Educ. 707 15 40 * 22 *
12. Law 237 * * * * 0
13. Mathematics 78 * 29 0 20 *
14. Medicine 2,279 39 153 * 80 *
15. Nursing 732 9 62 * 39 *
16. Other Arts & Science 1,443 78 0 0 0 0
17. Other Health Professions * 0 23 * 6 0
18. Physical Science 160 * 57 * 72 *
19. Social Science 1,405 144 164 23 161 10
20. Therapy & Rehabilitation 63 * 295 29 93 7
21. TOTAL: DOMESTIC ENROLMENT 11,277 504 1,537 194 774 49
22. TOTAL: INTERNATIONAL ENROLMENT 1,068 40 246 6 207 2
23. TOTAL ENROLMENT 12,348 544 1,783 200 981 51
Note:
1. The figures above do not necessarily include co-op enrolment and work term enrolment.
2. To ensure confidentiality, cell counts less-than or equal-to 5 are suppressed and displayed as "*". The
comparable cell in A4/A5 is also suppressed. If one cell in a column is suppressed, the total is rounded to the
nearest multiple of 3.
3. The figures exclude students in certificate and diploma programs.
4. Excludes affiliated colleges.
Source: Official government enrolment data.

W e s t e r n U n i v e r s i t y 1 1 | 3 0 C o m m o n U n i v e r s i t y D a t a O n t a r i o – 2 0 1 5
A6 - Total Enrolment by Program
Number of degree seeking students (headcount) enrolled for Fall 2014, including domestic and international students.
Bachelor's and 1st
Professional Degree Master's Degree Doctoral Degree
CATEGORY Full-Time Part-Time Full-Time Part-Time Full-Time Part-Time
1. Agriculture & Biological Science 1,320 46 159 * 108 *
2. Business & Commerce 3,965 132 368 * 53 *
3. Computer Science 137 19 46 7 56 9
4. Dentistry 262 0 9 0 0 0
5. Education 728 * 380 55 156 *
6. Engineering 1,589 44 399 31 333 6
7. Fine & Applied Arts 516 26 126 * 55 0
8. Food Science & Nutrition 80 * 0 0 0 0
9. Humanities 1,712 190 294 83 359 32
10. Journalism 0 0 25 0 0 0
11. Kinesiology, Recreation & Phys. Educ. 1,224 27 87 * 49 *
12. Law 490 * 9 7 * *
13. Mathematics 194 10 68 0 85 *
14. Medicine 4,066 56 283 6 190 *
15. Nursing 835 11 70 9 42 *
16. Other Arts & Science 2,678 176 0 0 0 0
17. Other Health Professions * 0 42 11 12 0
18. Physical Science 351 21 125 7 168 *
19. Social Science 2,287 241 261 56 277 18
20. Therapy & Rehabilitation 71 * 405 40 119 8
21. TOTAL: DOMESTIC ENROLMENT 20,682 933 2,583 310 1,524 90
22. TOTAL: INTERNATIONAL ENROLMENT 1,827 76 573 9 543 5
23. TOTAL ENROLMENT 22,506 1,009 3,156 319 2,067 95
Note:
1. The figures above do not necessarily include co-op enrolment and work term enrolment.
2. To ensure confidentiality, cell counts less-than or equal-to 5 are suppressed and displayed as "*". The
comparable cell in A4/A5 is also suppressed. If one cell in a column is suppressed, the total is rounded to the
nearest multiple of 3.
3. The figures exclude students in certificate and diploma programs.
4. Excludes affiliated colleges.
Source: Official government enrolment data.

W e s t e r n U n i v e r s i t y 1 2 | 3 0 C o m m o n U n i v e r s i t y D a t a O n t a r i o – 2 0 1 5
A7 - Full-Time Enrolment by Immigration Status
Number of degree seeking international full-time students (headcount) enrolled for Fall 2014.
Bachelor's and 1st
Professional Degree Master's Degree Doctoral Degree
NUMBER Canadian Student Visa Canadian Student Visa Canadian Student Visa
Number of Students 20,681 1,826 2,583 573 1,523 543
Note:
1. The figures above do not necessarily include co-op enrolment and work term enrolment.
2. The figures exclude students in certificate and diploma programs.
3. Excludes affiliated colleges.
Source: Official government enrolment data.

W e s t e r n U n i v e r s i t y 1 3 | 3 0 C o m m o n U n i v e r s i t y D a t a O n t a r i o – 2 0 1 5
B1 - Applicants and Registrants by Program
Full time, first year applicants and registrants in first entry programs by type and program, Fall 2014
PROGRAM
Attended an Ontario
Secondary School in the
previous year
All Others (Non-Secondary
School) Total
Arts/Humanities/Social Science
1. Total applicants (first choice) 1,549 729 2,278
2. Total registrants (first choice) 463 146 609
3. Total applications (all choices) 7,658 2,795 10,453
4. Total registrants (all choices) 819 230 1,049
Science
5. Total applicants (first choice) 1,467 497 1,964
6. Total registrants (first choice) 490 122 612
7. Total applications (all choices) 8,013 2,052 10,065
8. Total registrants (all choices) 1,189 232 1,421
Commerce/Mgmt/Business Admin
9. Total applicants (first choice) 887 881 1,768
10. Total registrants (first choice) 234 203 437
11. Total applications (all choices) 4,457 2,557 7,014
12. Total registrants (all choices) 506 338 844
Phys/Health Ed/Recreation
13. Total applicants (first choice) 527 122 649
14. Total registrants (first choice) 195 34 229
15. Total applications (all choices) 2,112 343 2,455
16. Total registrants (all choices) 336 44 380
Engineering & Applied Science
17. Total applicants (first choice) 448 355 803
18. Total registrants (first choice) 160 86 246
19. Total applications (all choices) 3,201 1,445 4,646
20. Total registrants (all choices) 351 145 496
Fine & Applied Arts
21. Total applicants (first choice) 26 8 34
22. Total registrants (first choice) 0 0 0
23. Total applications (all choices) 142 36 178
24. Total registrants (all choices) 0 0 0
Household Science
25. Total applicants (first choice) 46 34 80
26. Total registrants (first choice) 12 6 18
27. Total applications (all choices) 335 185 520
28. Total registrants (all choices) 22 10 32

W e s t e r n U n i v e r s i t y 1 4 | 3 0 C o m m o n U n i v e r s i t y D a t a O n t a r i o – 2 0 1 5
PROGRAM
Attended an Ontario
Secondary School in the
previous year
All Others (Non-Secondary
School) Total
Music
29. Total applicants (first choice) 89 30 119
30. Total registrants (first choice) 42 8 50
31. Total applications (all choices) 433 114 547
32. Total registrants (all choices) 82 14 96
Nursing
33. Total applicants (first choice) 493 368 861
34. Total registrants (first choice) 30 26 56
35. Total applications (all choices) 2,179 995 3,174
36. Total registrants (all choices) 63 34 97
Other Degrees
37. Total applicants (first choice) 893 215 1,108
38. Total registrants (first choice) 341 49 390
39. Total applications (all choices) 4,222 736 4,958
40. Total registrants (all choices) 635 83 718
Note:
1. To ensure confidentiality, cell counts less-than or equal-to 5 are suppressed and displayed as "*". If one cell in a
row is suppressed, the total is rounded to the nearest multiple of 3.
2. ‘Other degrees’ include programs in Health Science and Information and Media Studies.
3. Excludes affiliated colleges.
Source: OUAC.

W e s t e r n U n i v e r s i t y 1 5 | 3 0 C o m m o n U n i v e r s i t y D a t a O n t a r i o – 2 0 1 5
B2 - Program Undergraduate Admission Requirements
The following URL will link you to OUAC's eINFO, which will provide you with general information on universities'
programs, including admission requirements:
http://www.electronicinfo.ca
For more detailed information, and up-to-date policy on admission requirements, please go to the following
website:
http://welcome.uwo.ca/preview/admissions/index.html
B3 - Secondary School Averages of Full-Time, First Year Students
The following tables show the percentage of full-time, first year students by average range and program, Fall 2014. Averages are based on final grades for Grade 12 university destination courses.
Percent with entering average of…
PROGRAM / ENTERING
AVERAGE 95%+
Between
90% and
94%
Between
85% and
89%
Between
80% and
84%
Between
75% and
79%
Between
70% and
74%
Below
70%
Overall
Average
1. Arts 6.3% 32.7% 45.8% 14.6% * * 0.0% 88.4%
2. Science 21.4% 44.0% 27.1% 7.5% 0.0% 0.0% 0.0% 91.0%
3. Business & Commerce 10.9% 40.9% 41.6% 6.6% * 0.0% 0.0% 89.8%
4. Physical Education 3.6% 21.0% 57.0% 18.0% 0.0% * 0.0% 87.4%
5. Engineering 10.1% 39.2% 47.0% 3.7% 0.0% 0.0% 0.0% 89.6%
6. Household Science 0.0% * 63.6% * * 0.0% 0.0% 85.9%
7. Music * 33.0% 29.3% 31.7% 0.0% 0.0% 0.0% 87.4%
8. Nursing * 46.0% 50.9% 0.0% 0.0% 0.0% 0.0% 89.5%
9. Other Degrees 4.2% 31.1% 48.8% 15.7% * 0.0% 0.0% 88.2%
10. Overall 11.0% 36.5% 41.0% 11.1% 0.2% 0.1% 0.0% 89.3%
Note:
1. ‘Other degrees’ include programs in Health Science and Information and Media Studies. ‘Arts’ includes Social
Science.
2. To ensure confidentiality, cell counts less-than or equal-to 5 are suppressed and displayed as "*".
3. Excludes affiliated colleges.
Source: OUAC.

W e s t e r n U n i v e r s i t y 1 6 | 3 0 C o m m o n U n i v e r s i t y D a t a O n t a r i o – 2 0 1 5
B4 - Application Fees
The following chart shows 2015-16 application fees charged by OUAC.
Fee Type 101 Secondary School 105 Non-Secondary
Application $150.00 $155.00
Additional choices $50.00 $50.00
Application (if outside Canada) $150.00 $165.00
Note: The 'application' fee applies to the initial three university/program choices. The 'additional choices' fee must
be paid for each university/program choice beyond the initial three.
Source: OUAC
B5 - Admission in Winter, Spring, Summer Terms
2015-2016
Are first-time, first-year students accepted for terms other than the fall?
No
Source: Western University
B6 - Deferred Admission
2015-2016
Does your institution allow students to postpone enrolment after admission?
If yes, maximum period of postponement:
Yes One Year
Source: Western University

W e s t e r n U n i v e r s i t y 1 7 | 3 0 C o m m o n U n i v e r s i t y D a t a O n t a r i o – 2 0 1 5
C1 - Enrolment of Transfer Students
Question Answer
Do you enrol transfer students in first entry undergraduate programs? Yes
If yes, may transfer students earn advanced standing credit by transferring credits earned from course
work completed at other colleges/universities?
Yes
C2 - Transfer Students
Number of students who applied and enrolled as degree-seeking transfer students in Fall 2014.
Type Applicants Registered Applicants
Transfer Students 1,169 90
NOTE:
1. Transfer students are those who attended another postsecondary institution.
2. Excludes affiliated colleges.
Source: OUAC
C3 - Policy on Transfer Credit
The following URL will link you to specific policies on transfer students:
http://welcome.uwo.ca/admissions/admission_requirements/index.html
Source: Western University

W e s t e r n U n i v e r s i t y 1 8 | 3 0 C o m m o n U n i v e r s i t y D a t a O n t a r i o – 2 0 1 5
D1 - Library Collections
The following are the number of holdings in 2011-2012 for each of the following categories:
MATERIAL Number of Holdings
1. Monograph Volumes - Print 2,457,869
2. Monograph Volumes - Electronic 881,912
3. Microform units 4,175,097
4. Manuscripts and Archives (linear metres) 4,495
5. Printed Music Scores 90,605
6. Cartographic Materials 279,568
7. Graphic Materials 1,652,000
8. Audio Materials 71,062
9. Film & Video Materials 10,480
10. Serials - Print & Microform 6,862
11. Serials - Electronic 83,507
Students entering Ontario universities today have access to a growing variety of world-class electronic information resources that are accessible to them 24x7x365. Our libraries are leaders in transforming traditional library
services by adopting innovative technological solutions such as ScholarsPortal, a shared gateway to scholarly resources and RACER, a province-wide interlibrary loan service. Through these resources and services our libraries are preparing students for today’s world of information. Our libraries also provide a wide array of unique resources, services, and facilities. For more detailed information, click here: http://spotdocs.scholarsportal.info/display/sp/home
Source: OCUL

W e s t e r n U n i v e r s i t y 1 9 | 3 0 C o m m o n U n i v e r s i t y D a t a O n t a r i o – 2 0 1 5
E1 - Residence of First-Time, First Year Students in Previous Year
The following table shows the percentage of first time, full-time, first year students enrolled in Fall 2014 by where they resided in the previous year. Based on home address.
Residence Percent
Percent from Ontario 81.38%
Percent from Rest of Canada 8.16%
Percent from outside Canada 10.46%
Source: OUAC
E2 - Percentage of Full-Time Undergraduate Students Who Live on Campus, Fall
2014
Student Type % of Students Who Live on Campus
First Year 76.35%
Total Undergraduate 22.55%
Source: Western University
E3 - Extracurricular Activities Offered
A large number of extracurricular activities are offered. The following link is provided.
http://welcome.uwo.ca/preview/studentexperience/index.html
Source: Western University
E4 - Housing
The mix and variety of housing, including residence guarantee information is provided in the following link:
http://www.residenceatwestern.ca/
Source: Western University

W e s t e r n U n i v e r s i t y 2 0 | 3 0 C o m m o n U n i v e r s i t y D a t a O n t a r i o – 2 0 1 5
F1a - The NSSE (National Survey of Student Engagement) - Evaluation
Results from 2014 NSSE Survey
How would you evaluate your entire educational experience at this institution?
YEAR Excellent Good Fair Poor
1. First Year 40.0% 46.0% 13.0% 2.0%
2. Senior Year 41.0% 47.0% 11.0% 2.0%
Note:
1. NSSE is conducted every 3 years; all Ontario universities participate in the survey.
2. Excludes affiliated colleges.
F1b - The NSSE (National Survey of Student Engagement) - Would Repeat
Results from 2014 NSSE Survey
If you could start over again, would you go to the same institution you are now attending?
YEAR Definitely Yes Probably Yes Probably No Definitely No
1. First Year 51.0% 39.0% 8.0% 2.0%
2. Senior Year 45.0% 38.0% 14.0% 4.0%
Note:
1. NSSE is conducted every 3 years; all Ontario universities participate in the survey.
2. Excludes affiliated colleges.

W e s t e r n U n i v e r s i t y 2 1 | 3 0 C o m m o n U n i v e r s i t y D a t a O n t a r i o – 2 0 1 5
F2a - Results from the CGPSS (Canadian Graduate Professional Student Survey)
2013 Survey
Would recommend or choose again ?
Note:
1. CGPSS is conducted every 3 years; all Ontario universities with graduate programs participate in the survey. 2. The results were presented in 5 groups: Doctoral Total, Masters Total, Masters Professional, Masters Research, Total Doctoral and Masters. 3. Excludes affiliated colleges. Source: Western University
Definitely Probably Maybe Probably Not Definitely Not
Doctoral Total
If you were to start your graduate/professional
career again, would you select this same
university? 25.9% 37.3% 23.1% 10.6% 3.0%
Would you recommend this university to
someone considering your program? 35.7% 32.3% 19.3% 8.9% 3.7%
Masters Total
If you were to start your graduate/professional
career again, would you select this same
university? 32.4% 39.3% 16.0% 9.2% 3.1%
Would you recommend this university to
someone considering your program? 45.9% 29.2% 14.6% 7.2% 3.2%
Masters Professional
If you were to start your graduate/professional
career again, would you select this same
university? 33.6% 38.3% 15.7% 9.5% 2.9%
Would you recommend this university to
someone considering your program? 46.9% 27.2% 15.3% 6.8% 3.8%
Masters Research
If you were to start your graduate/professional
career again, would you select this same
university? 31.0% 40.4% 16.4% 9.0% 3.3%
Would you recommend this university to
someone considering your program? 44.6% 31.5% 13.8% 7.7% 2.4%
Total Masters and Doctoral
If you were to start your graduate/professional
career again, would you select this same
university? 29.5% 38.4% 19.2% 9.9% 3.1%
Would you recommend this university to
someone considering your program? 41.3% 30.6% 16.8% 8.0% 3.4%

W e s t e r n U n i v e r s i t y 2 2 | 3 0 C o m m o n U n i v e r s i t y D a t a O n t a r i o – 2 0 1 5
F2b - Results from the CGPSS (Canadian Graduate Professional Student Survey)
2013 Survey
Overall Quality Ratings
Note:
1. CGPSS is conducted every 3 years; all Ontario universities with graduate programs participate in the survey. 2. The results were presented in 5 groups: Doctoral Total, Masters Total, Masters Professional, Masters Research, Total Doctoral and Masters. 3. Excludes affiliated colleges. Source: Western University
Excellent Very Good Good Fair Poor
Doctoral Total
your academic experience at this university? 25.7% 40.7% 21.1% 8.4% 4.1%
your student life experience at this university? 19.8% 31.9% 29.4% 14.0% 5.0%
your graduate/professional program at this university? 24.0% 35.1% 25.6% 10.5% 4.7%
your overalll experience at this university? 22.1% 36.8% 26.1% 11.8% 3.2%
Masters Total
your academic experience at this university? 25.9% 39.9% 23.0% 7.3% 4.0%
your student life experience at this university? 21.4% 33.3% 26.6% 12.9% 5.7%
your graduate/professional program at this university? 24.7% 35.4% 24.3% 10.7% 4.8%
your overalll experience at this university? 22.4% 39.4% 24.5% 10.3% 3.5%
Masters Professional
your academic experience at this university? 22.5% 40.3% 24.0% 9.0% 4.2%
your student life experience at this university? 18.5% 33.7% 25.3% 16.1% 6.4%
your graduate/professional program at this university? 21.4% 37.3% 24.5% 11.5% 5.4%
your overalll experience at this university? 19.5% 40.1% 24.4% 12.4% 3.6%
Masters Research
your academic experience at this university? 30.2% 39.4% 21.7% 5.1% 3.6%
your student life experience at this university? 25.1% 32.9% 28.3% 8.8% 4.9%
your graduate/professional program at this university? 29.0% 33.1% 24.1% 9.7% 4.1%
your overalll experience at this university? 26.0% 38.4% 24.6% 7.5% 3.4%
Total Masters and Doctoral
your academic experience at this university? 25.8% 40.2% 22.2% 7.8% 4.0%
your student life experience at this university? 20.7% 32.7% 27.9% 13.4% 5.4%
your graduate/professional program at this university? 24.4% 35.3% 24.9% 10.6% 4.8%
your overalll experience at this university? 22.2% 38.2% 25.2% 11.0% 3.4%

W e s t e r n U n i v e r s i t y 2 3 | 3 0 C o m m o n U n i v e r s i t y D a t a O n t a r i o – 2 0 1 5
G1 - First Year Average Undergraduate Arts and Science Full-Time Tuition,
Ancillary Fees, Room and Board and Other Expenses 2015-16
Domestic International
Tuition Fees $6,154.00 $22,817.00
Ancillary Fees $1,422.74 $1,422.74
Room and Board (on campus) $10,640 - $13,760 $10,640 - $13,760
Room only (on-campus) $7,640.00 - $8,670 $7,640.00 - $8,670
Board only (on-campus meal plan) $1,900-$2,480 $1,900-$2,480
Books and Supplies $1,526.00 $1,526.00
Transportation (off-campus) $500.00 $500.00
Other Expenses *
$612.00
NOTE: These expenses are for the full 2015-16 academic year, which refers to the period of time generally
extending from September to June, usually equated to two semesters or three trimesters. Ancillary fees include
only charges that all full-time students must pay that are not included in tuition (e.g., registration, health, or
activity fees) and do not include optional fees (e.g., parking, laboratory use).
Source: COU and Western University
G2 - First Year Domestic Tuition and Ancillary Fees by Program 2015-2016
PROGRAM NAME Tuition Fees Ancillary Fees Total Fees
1. Arts and Science $6,154.00 $1,372.74 $7,526.74
2. Environmental Science/Studies $6,154.00 $1,372.74 $7,526.74
3. Household & Food Science $6,154.00 $1,372.74 $7,526.74
4. Music $6,154.00 $1,372.74 $7,526.74
5. Physical & Health Educ./Kinesiology $6,154.00 $1,372.74 $7,526.74
6. Social Work $6,183.00 $1,364.33 $7,547.33
7. Business & Commerce $24,905.00 $1,372.74 $26,277.74
8. Computer Science $6,154.00 $1,372.74 $7,526.74
9. Computer, Electrical Software Eng. $11,802.00 $1,372.74 $13,174.74
10. Dentistry $33,923.00 $1,372.74 $35,295.74
11. Education (excluding AQs) $7,395.00 $1,372.74 $8,767.74
12. Engineering / Applied Science $11,802.00 $1,372.74 $13,174.74
13. Law $19,342.00 $1,372.74 $20,714.74
14. Medicine $23,927.00 $1,372.74 $25,299.74
15. Nursing $6,154.00 $1,372.74 $7,526.74
Source: COU and Western University

W e s t e r n U n i v e r s i t y 2 4 | 3 0 C o m m o n U n i v e r s i t y D a t a O n t a r i o – 2 0 1 5
H1 - Number of Instructional Faculty Members (Excluding Clinicians) in Each
Category for Fall 2014
FACULTY MEMBER CATEGORY Full-Time Part-Time (FTE) Total FTEs (est)
1. Total number of instructional faculty 1,290
2. Total number who are women 455
3. Total number with doctorate, first professional, or other terminal degree 1,257
Note: Only full-time counts are reported. Excludes affiliated colleges.
Source: Western University.
H2a - Undergraduate Class Size by Year Level (Sections), Fall 2014
1st Year 2nd Year 3rd Year 4th Year
SIZE (#) (%) (#) (%) (#) (%) (#) (%)
1. < 30 students 134 35.7% 488 44.4% 476 57.6% 398 71.8%
2. 30-60 students 38 10.1% 262 23.8% 221 26.7% 121 21.8%
3. 61-100 students 50 13.3% 189 17.2% 89 10.8% 27 4.9%
4. 101-250 students 91 24.3% 122 11.1% 33 4.0% 8 1.4%
5. 251+ students 62 16.5% 39 3.5% 8 1.0% 0
6. TOTAL 375 100.0% 1,100 100.0% 827 100.0% 554 100.0%
Note: Excludes affiliated colleges.
Source: Western University.
H2b - Undergraduate Class Size by Year Level (Sub Sections), Fall 2014
1st Year 2nd Year 3rd Year 4th Year
SIZE (#) (%) (#) (%) (#) (%) (#) (%)
1. < 20 students 340 35.8% 328 38.6% 178 47.0% 78 54.5%
2. 20-40 students 420 44.2% 415 48.9% 145 38.3% 44 30.8%
3. 41+ students 190 20.0% 106 12.5% 56 14.8% 21 14.7%
4. TOTAL 950 100.0% 849 100.0% 379 100.0% 143 100.0%
Note: Excludes affiliated colleges.
Source: Western University.

W e s t e r n U n i v e r s i t y 2 5 | 3 0 C o m m o n U n i v e r s i t y D a t a O n t a r i o – 2 0 1 5
I1 - University Revenue
Revenue for the Fiscal Year Ended 2014 ($000s)
REVENUE TYPE Operating Other NC Subtotal Ancillary
Entities
Consolidated
Sponsored
Research
Entities Not
Consolidated
Sponsored
Research
Subtotal
Sponsored
Research Trust Capital
Total
Expendable
Funds Endowment
1. MTCU: Basic Formula
Grant 209,839 0 209,839 0 0 0 0 0 0 209,839 0
2. MTCU: Non-Formula
Grant n/a n/a n/a n/a n/a n/a n/a n/a n/a n/a n/a
3. MTCU: Other Grants
and Contracts 59,325 0 59,325 0 3,039 0 3,039 4,944 5,258 72,566 0
4. Ontario (excl MTCU):
Government Grants and
Contracts 13,436 951 14,387 129 14,037 2,335 16,372 0 0 30,888 0
5. Subtotal: Ontario
Grants and Contracts 282,600 951 283,551 129 17,076 2,335 19,411 4,944 5,258 313,293 0
6. Federal Government
Grants and Contracts 1,076 311 1,387 782 102,441 8,607 111,048 566 0 113,783 0
7. Municipal
Government Grants and
Contracts 41 52 93 240 0 0 0 2 0 335 0
8. Other Provinces
Government Grants and
Contracts 12 0 12 0 449 0 449 0 0 461 0
9. Foreign Government
Grants and Contracts 999 0 999 0 4,149 906 5,055 0 0 6,054 0
10. Tuition Fees 295,259 0 295,259 0 0 0 0 0 0 295,259 0
11. Miscellaneous Fees 28,316 0 28,316 63,340 0 0 0 0 0 91,656 0
12. Borrowings 0 0 0 0 0 0 0 0 0 0 0
13. Donations and Non-
Govt. Grants &
Contracts 17,880 4,366 22,246 430 65,454 35,341 100,795 22,524 1,653 147,648 13,747
14. Sales of Services
and Products 0 0 0 58,983 0 0 0 0 0 58,983 0
15. Investment
Income: Endowment 0 0 0 0 393 0 393 15,018 0 15,411 58,315
16. Investment
Income: Other 1,730 42 1,772 318 30 0 30 51,543 10,128 63,791 0
17. Miscellaneous 7,236 19 7,255 0 205 0 205 1,156 484 9,100 0
18. TOTAL 635,149 18,962 654,111 124,222 190,197 47,189 237,386 95,753 17,523 1,128,995 72,062
Note:
1. COFO data is updated annually in January/February, so the data presented here is not necessarily the latest data
available. For the most recent COFO data please go tohttp://cou.on.ca/cofo
2. Excludes affiliated colleges.
Source: COU. COFO-UO Financial Report

W e s t e r n U n i v e r s i t y 2 6 | 3 0 C o m m o n U n i v e r s i t y D a t a O n t a r i o – 2 0 1 5
I2 - University Expenses
Expenses for the Fiscal Year Ended 2014 ($000s)
Expense Type Operating Other NC
Subtotal Ancillary
Entities
Consolidated Sponsored
Research
Entities Not
Consolidated Sponsored
Research
Subtotal
Sponsored
Research
Trust Capital Total
i) Academic
Ranks 218,134 3,986 222,120 0 8,526 0 8,526 3,666 0 234,312
ii) Other
Instruction and Research
26,605 224 26,829 0 44,340 0 44,340 535 0 71,704
iii) Other Salaries
& Wages 141,863 5,396 147,259 32,478 25,039 26,008 51,047 1,656 0 232,440
Total Salaries
and Wages 386,602 9,606 396,208 32,478 77,905 26,008 103,913 5,857 0 538,456
Employee Benefits
83,704 1,126 84,830 4,876 10,301 3,562 13,863 1,213 0 104,782
Total Salaries
and Benefits 470,306 10,732 481,038 37,354 88,206 29,570 117,776 7,070 0 643,238
Library
Acquisitions 13,890 12 13,902 0 12 0 12 714 0 14,628
Equipment and
Furniture Purchases
11,534 308 11,842 4,558 29,475 812 30,287 5,495 6,255 58,437
Equipment
Rental and
Maintenance
8,585 364 8,949 1,654 1,679 0 1,679 194 0 12,476
Printing and Duplicating
3,793 232 4,025 233 278 0 278 34 0 4,570
Materials and
Supplies 9,014 3,025 12,039 7,049 21,084 8,487 29,571 1,759 0 50,418
Communications 2,036 147 2,183 148 797 0 797 54 0 3,182
Professional Fees 4,250 312 4,562 501 5,121 0 5,121 130 0 10,314
Costs of Goods
Sold 0 0 0 29,562 0 0 0 0 0 29,562
Travel 20,106 1,918 22,024 953 9,865 1 9,866 983 0 33,826
Utilities 21,699 52 21,751 5,976 291 0 291 0 0 28,018
Renovations and
Alterations 2,362 98 2,460 6,788 7,482 0 7,482 405 10,621 27,756
Externally
Contracted
Services
4,475 638 5,113 370 9,215 0 9,215 182 0 14,880
Scholarships, Bursaries, etc.
46,582 13 46,595 0 6,567 0 6,567 15,844 0 69,006
Debt
Repayments 5,890 0 5,890 1,461 0 0 0 0 0 7,351
Interest 100 10 110 6,268 0 0 0 0 5,077 11,455
Building, Land
and Site Services 0 1 1 1,707 377 0 377 0 45,553 47,638
Other
Operational
Expenditures
21,666 1,480 23,146 3,825 5,486 8,319 13,805 2,485 0 43,261
Internal Cost Allocations
-8,989 633 -8,356 12,075 16,702 0 16,702 0 -
20,421 0
External Cost
Recoveries -44,879 -2,239 -47,118 0 -319 0 -319 -576 0 -48,013
TOTAL 592,420 17,736 610,156 120,482 202,318 47,189 249,507 34,773 47,085 1,062,003
Note:
1. COFO data is updated annually in January/February, so the data presented here is not necessarily the latest data
available. For the most recent COFO data please go tohttp://cou.on.ca/cofo
2. Excludes affiliated colleges.
Source: COU. COFO-UO Financial Report

W e s t e r n U n i v e r s i t y 2 7 | 3 0 C o m m o n U n i v e r s i t y D a t a O n t a r i o – 2 0 1 5
J1 - Research Awards, by Granting Council
2014-15
COUNCIL # Awards Funding ($)
1. Social Sciences and Humanities Research Council of Canada (SSHRC) 239 $8,047,473.02
2. Natural Science and Engineering Research Council of Canada (NSERC) 737 $27,044,903.00
3. Canadian Institutes of Health Research (CIHR) 250 $27,062,322.00
Notes:
1. The figures exclude Canada Research Chairs (CRCs) and National Centres of Excellence (NCE) and include
affiliates, where appropriate.
SSHRC: All Payments by Program Activity. Excludes indirect costs.
NSERC: Grants and Scholarships by University/College
CIHR: CIHR Funding Database. Funding Type: All
2. Excludes affiliated colleges.
Sources: Social Sciences and Humanities Research Council of Canada (SSHRC), Natural Science and Engineering
Research Council of Canada (NSERC) and Canadian Institutes of Health Research (CIHR).

W e s t e r n U n i v e r s i t y 2 8 | 3 0 C o m m o n U n i v e r s i t y D a t a O n t a r i o – 2 0 1 5
K1 - Academic Plans
The following is a link to the university's academic plans.
http://www.ipb.uwo.ca/documents/engaging_the_future_update.pdf
K2 - Key Performance Indicators, Employment Rate of 2012 Graduates in
Undergraduate Programs
PROGRAM Employment Rate (2 years) Employment Rate (6 months)
1. Agriculture & Biological Science 86.67% 76.47%
2. Business & Commerce 96.70% 91.64%
3. Computer Science 90.91% 81.82%
4. Dentistry 100.00% 100.00%
5. Education 95.30% 87.32%
6. Engineering 95.83% 90.14%
7. Fine & Applied Arts 86.21% 96.15%
8. Food Science & Nutrition 66.67% 100.00%
9. Humanities 92.06% 82.73%
10. Kinesiology, Recreation & Phys. Educ. 98.11% 94.00%
11. Law 100.00% 92.68%
12. Mathematics 100.00% 80.00%
13. Medicine and Related Programs 100.00% 100.00%
14. Nursing 98.77% 97.59%
15. Other Arts & Science 81.25% 84.62%
16. Other Health Professions 92.86% 80.73%
17. Physical Science 82.35% 81.82%
18. Social Science 90.56% 87.04%
19. Theology n/a n/a
20. Therapy & Rehabilitation * *
21. OVERALL AVERAGE 94.00% 88.52%
Notes:
1. Employment Rates: The employment rate is defined as the number of employed persons expressed as a percentage of the labour force where the labour force is those persons who were employed, or unemployed but looking for work. To determine employment rates of recent graduates, Ontario universities conducted a survey of all graduates of undergraduate degree programs. Graduates were asked questions regarding their employment situation six months and two years after graduation.
2. To ensure confidentiality, cells representing counts less-than or equal-to 5 are suppressed and displayed as "*".
3. Excludes affiliated colleges.
Source: MTCU and Western University.

W e s t e r n U n i v e r s i t y 2 9 | 3 0 C o m m o n U n i v e r s i t y D a t a O n t a r i o – 2 0 1 5
K2A - Key Performance Indicators, Degree Completion Rate for Undergraduate
Cohort, New Year 1 Students
Total Graduates in 2013, who were enrolled in full time year 1 undergraduate studies in Fall 2006
PROGRAM Graduation Rate
1. Business & Commerce 85.3%
2. Dentistry 96.3%
3. Education 99.2%
4. Engineering 77.6%
5. Fine & Applied Arts 81.7%
6. Food Science & Nutrition 100.0%
7. Humanities 84.1%
8. Kinesiology, Recreation & Phys. Educ. 84.3%
9. Law 97.4%
10. Medicine and Related Programs 100.0%
11. Nursing 91.3%
12. Other Arts & Science 76.4%
13. Other Health Professions 81.8%
14. Social Science n/a
15. Theology n/a
16. Therapy & Rehabilitation n/a
Note:
1. To ensure confidentiality, cells representing counts less-than or equal-to 5 are suppressed and displayed as "*".
2. Graduation Rates: The MTCU has calculated graduation rates using a single entering cohort of students and
determining whether or not they graduated within seven years. The methodology employed involves the selection
of all new full-time, Year One undergraduate students on the official Fall 2006 enrolment file, who have a valid
(and unique) student ID number, and were seeking either a bachelors or first professional degree. The subset was
then matched against the records for students who received a degree (in any program) from the same institution
during the most current seven year period (2006 to 2013).
3. Excludes affiliated colleges.
Source: MTCU and Western University.
W e s t e r n U n i v e r s i t y 3 0 | 3 0 C o m m o n U n i v e r s i t y D a t a O n t a r i o – 2 0 1 5
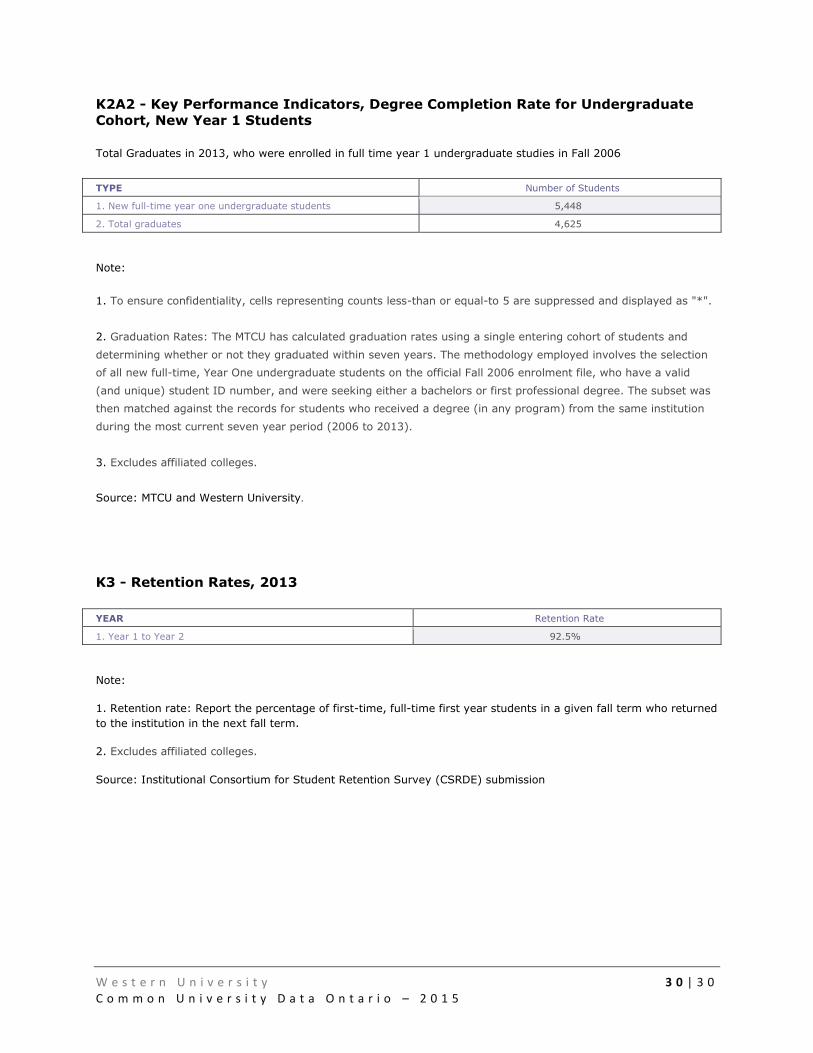
K2A2 - Key Performance Indicators, Degree Completion Rate for Undergraduate
Cohort, New Year 1 Students
Total Graduates in 2013, who were enrolled in full time year 1 undergraduate studies in Fall 2006
TYPE Number of Students
1. New full-time year one undergraduate students 5,448
2. Total graduates 4,625
Note:
1. To ensure confidentiality, cells representing counts less-than or equal-to 5 are suppressed and displayed as "*".
2. Graduation Rates: The MTCU has calculated graduation rates using a single entering cohort of students and
determining whether or not they graduated within seven years. The methodology employed involves the selection
of all new full-time, Year One undergraduate students on the official Fall 2006 enrolment file, who have a valid
(and unique) student ID number, and were seeking either a bachelors or first professional degree. The subset was
then matched against the records for students who received a degree (in any program) from the same institution
during the most current seven year period (2006 to 2013).
3. Excludes affiliated colleges.
Source: MTCU and Western University.
K3 - Retention Rates, 2013
YEAR Retention Rate
1. Year 1 to Year 2 92.5%
Note:
1. Retention rate: Report the percentage of first-time, full-time first year students in a given fall term who returned
to the institution in the next fall term.
2. Excludes affiliated colleges.
Source: Institutional Consortium for Student Retention Survey (CSRDE) submission