Slides of BCL
39
Slides of BCL www.beijingcitylab.com How to cite Author(s), Year, Title, Slides at Beijing City Lab, http://www.beijingcitylab.com E.g. Long Y, 2014, Automated identification and characterization of parcels (AICP) with OpenStreetMap and Points of Interest, Slides at Beijing City Lab, http://www.beijingcitylab.com 56 ID of the slides
-
Upload
khangminh22 -
Category
Documents
-
view
0 -
download
0
Transcript of Slides of BCL
Slides of BCLwww.beijingcitylab.com
How to citeAuthor(s), Year, Title, Slides at Beijing City Lab, http://www.beijingcitylab.comE.g. Long Y, 2014, Automated identification and characterization of parcels (AICP) with OpenStreetMap and Points of Interest, Slides at Beijing City Lab, http://www.beijingcitylab.com
56ID of the slides

&& | 2015.6
C-IMAGE : City Cognitive Mapping Through Geo-Tagged PhotosBCL 2015, ��
.����$��(&���

2
How to extract and understand the holistic image of the city from the public?
1) How to extract the holistic cognition and collect the scattered perceptions from the public through modern techniques? 2) How to apply the abstracted knowledge relates to practical objects, such as urban form, function, or activities?
Google Glass by Matthew Clarke, Security Camera by iconoci, iPhone by Jason Schmitt, and iPad by Edward Boatman from The Noun Project
1 Introduction
2 Literature Review • Cognitive Mapping Stream
• the image of the city (1960s) • the psychological maps (1970s) • the evaluative image (1990s)
• Computation Stream • City Pulse Project • What makes Paris look like Paris
3 Method Statement • Research Objects
• texts vs. photos • machine-taken photos vs. human-
taken photos • social net-work based provider vs.
geolocation-based provider • Acquisition of Data
• preparations • download from Panoramio via its
data API • download from Flickr via its photo
search API • storage and maintenance
4 Application • C-IMAGE as Urban Form Identification
• C-IMAGE and Traditional 5 elements
���%������ ���$� �����'

3
C-IMAGE:
To Collaborate Crowd-sourcing data and Create City’s Cognition from the Citizens with Computation technology.
1 Introduction
2 Literature Review • Cognitive Mapping Stream
• the image of the city (1960s) • the psychological maps (1970s) • the evaluative image (1990s)
• Computation Stream • City Pulse Project • What makes Paris look like Paris
3 Method Statement • Research Objects
• texts vs. photos • machine-taken photos vs. human-
taken photos • social net-work based provider vs.
geolocation-based provider • Acquisition of Data
• preparations • download from Panoramio via its
data API • download from Flickr via its photo
search API • storage and maintenance
4 Application • C-IMAGE as Urban Form Identification
• C-IMAGE and Traditional 5 elements

4
1) .� 7�30��-�:Mental Map; 2) 5�(&�,�'�/ 3) �21�9 4�*8"� 4) )6����������
!: #%+�(&�,��� this conventional city image theory sets a complete example in using cognitive mapping to study public perceptions towards city. But it is relatively low efficient comparing to today’s producing rate based on modern technology.
The Boston Image derived from Verbal Interviews, The Image of the City (Kevin Lynch, 1960, P146)
Path
Edge
District
Node
Landmark
1 Introduction
2 Literature Review • Cognitive Mapping Stream
• the image of the city (1960s) • the psychological maps (1970s) • the evaluative image (1990s)
• Computation Stream • City Pulse Project • What makes Paris look like Paris
3 Method Statement • Research Objects
• texts vs. photos • machine-taken photos vs. human-
taken photos • social net-work based provider vs.
geolocation-based provider • Acquisition of Data
• preparations • download from Panoramio via its
data API • download from Flickr via its photo
search API • storage and maintenance
4 Application • C-IMAGE as Urban Form Identification
• C-IMAGE and Traditional 5 elements • Comparison with the City Problem
Map

5
1) geo-tagged photos (google street) 2) online survey 3) safety, class and uniqueness 3) still relatively low efficient (it may take many years)
Summary: this project used google street views as its research object and online voting techniques to measure the Inequality of city’s perceptions
The Collaborative Image of The City: Mapping the Inequality of Urban Perception, Philip Salesses, Katja Schechtner, Cesar A. Hidalgo, 2013
top left: locations of street views collected from New York Citytop middle: the website used to collect votesright: Identifying places associated with different urban perceptions
bottom left: Map of NYC showing statistically significant clusters of high and low Q score for the perceptions of safety, class, and uniqueness
1 Introduction
2 Literature Review • Cognitive Mapping Stream
• the image of the city (1960s) • the psychological maps (1970s) • the evaluative image (1990s)
• Computation Stream • City Pulse Project • What makes Paris look like Paris
3 Method Statement • Research Objects
• texts vs. photos • machine-taken photos vs. human-
taken photos • social net-work based provider vs.
geolocation-based provider • Acquisition of Data
• preparations • download from Panoramio via its
data API • download from Flickr via its photo
search API • storage and maintenance
4 Application • C-IMAGE as Urban Form Identification
• C-IMAGE and Traditional 5 elements • Comparison with the City Problem
Map

6
How to access the subjective cognition of physical environment? (access)
photos > texts: closer to perception, no language barrier, no vague words human-taken photos > machine-taken photos: cognition of personal preference, wider coverage
image source: http://www.gettyimages.cn/2857626
• the image of the city (1960s) • the psychological maps (1970s) • the evaluative image (1990s)
• Computation Stream • City Pulse Project • What makes Paris look like Paris
3 Method Statement • Research Objects
• texts vs. photos • machine-taken photos vs. human-
taken photos • social net-work based provider vs.
geolocation-based provider • Acquisition of Data
• preparations • download from Panoramio via its
data API • download from Flickr via its photo
search API • storage and maintenance
4 Application • C-IMAGE as Urban Form Identification
• C-IMAGE and Traditional 5 elements • Comparison with the City Problem
Map • Agent-led Changes vs. Agentless
Changes • C-IMAGE as Urban Function &
Activities Identification • 102 Attributes to seven Urban
Perceptions • Typology from the seven-perception
C-IMAGE • Tokyo vs. Shanghai
��!"�����

7
500 m
500 m
min lon, min lat
max lon, max lat
1) find the city boundary and cut into 500 X 500 meter cell 2) send request, and receive Json file to retrieve the data 3) typical data information: upload_date, owner_name, owner_id, photo_id, longitude, latitude, height, width, photo_title, owner_url, photo_url, photo_file_url
Summary: C-IMAGE has downloaded 26 cities covering North America, Asia, Europe, with over 2 million photos
San Francisco
• the image of the city (1960s) • the psychological maps (1970s) • the evaluative image (1990s)
• Computation Stream • City Pulse Project • What makes Paris look like Paris
3 Method Statement • Research Objects
• texts vs. photos • machine-taken photos vs. human-
taken photos • social net-work based provider vs.
geolocation-based provider • Acquisition of Data
• preparations • download from Panoramio via its
data API • download from Flickr via its photo
search API • storage and maintenance
4 Application • C-IMAGE as Urban Form Identification
• C-IMAGE and Traditional 5 elements • Comparison with the City Problem
Map • Agent-led Changes vs. Agentless
Changes • C-IMAGE as Urban Function &
Activities Identification • 102 Attributes to seven Urban
Perceptions • Typology from the seven-perception
C-IMAGE • Tokyo vs. Shanghai

8
1) find the city boundary and cut into 500 X 500 meter cell 2) send request, and receive Json file to retrieve the data 3) typical data information: upload_date, owner_name, owner_id, photo_id, longitude, latitude, height, width, photo_title, owner_url, photo_url, photo_file_url
Summary: C-IMAGE has downloaded 26 cities covering North America, Asia, Europe, with over 2 million photos (thesis p35)
To see the complete plots of the cities from here: http://liuliu.us/projects/cimage/city-gallery/
Photos from Panoramio around 24 million for the European countries
• the image of the city (1960s) • the psychological maps (1970s) • the evaluative image (1990s)
• Computation Stream • City Pulse Project • What makes Paris look like Paris
3 Method Statement • Research Objects
• texts vs. photos • machine-taken photos vs. human-
taken photos • social net-work based provider vs.
geolocation-based provider • Acquisition of Data
• preparations • download from Panoramio via its
data API • download from Flickr via its photo
search API • storage and maintenance
4 Application • C-IMAGE as Urban Form Identification
• C-IMAGE and Traditional 5 elements • Comparison with the City Problem
Map • Agent-led Changes vs. Agentless
Changes • C-IMAGE as Urban Function &
Activities Identification • 102 Attributes to seven Urban
Perceptions • Typology from the seven-perception
C-IMAGE • Tokyo vs. Shanghai

9
1) find the city boundary and cut into 500 X 500 meter cell 2) send request, and receive Json file to retrieve the data 3) typical data information: upload_date, owner_name, owner_id, photo_id, longitude, latitude, height, width, photo_title, owner_url, photo_url, photo_file_url
Summary: C-IMAGE has downloaded 26 cities covering North America, Asia, Europe, with over 2 million photos (thesis p35)
To see the complete plots of the cities from here: http://liuliu.us/projects/cimage/city-gallery/
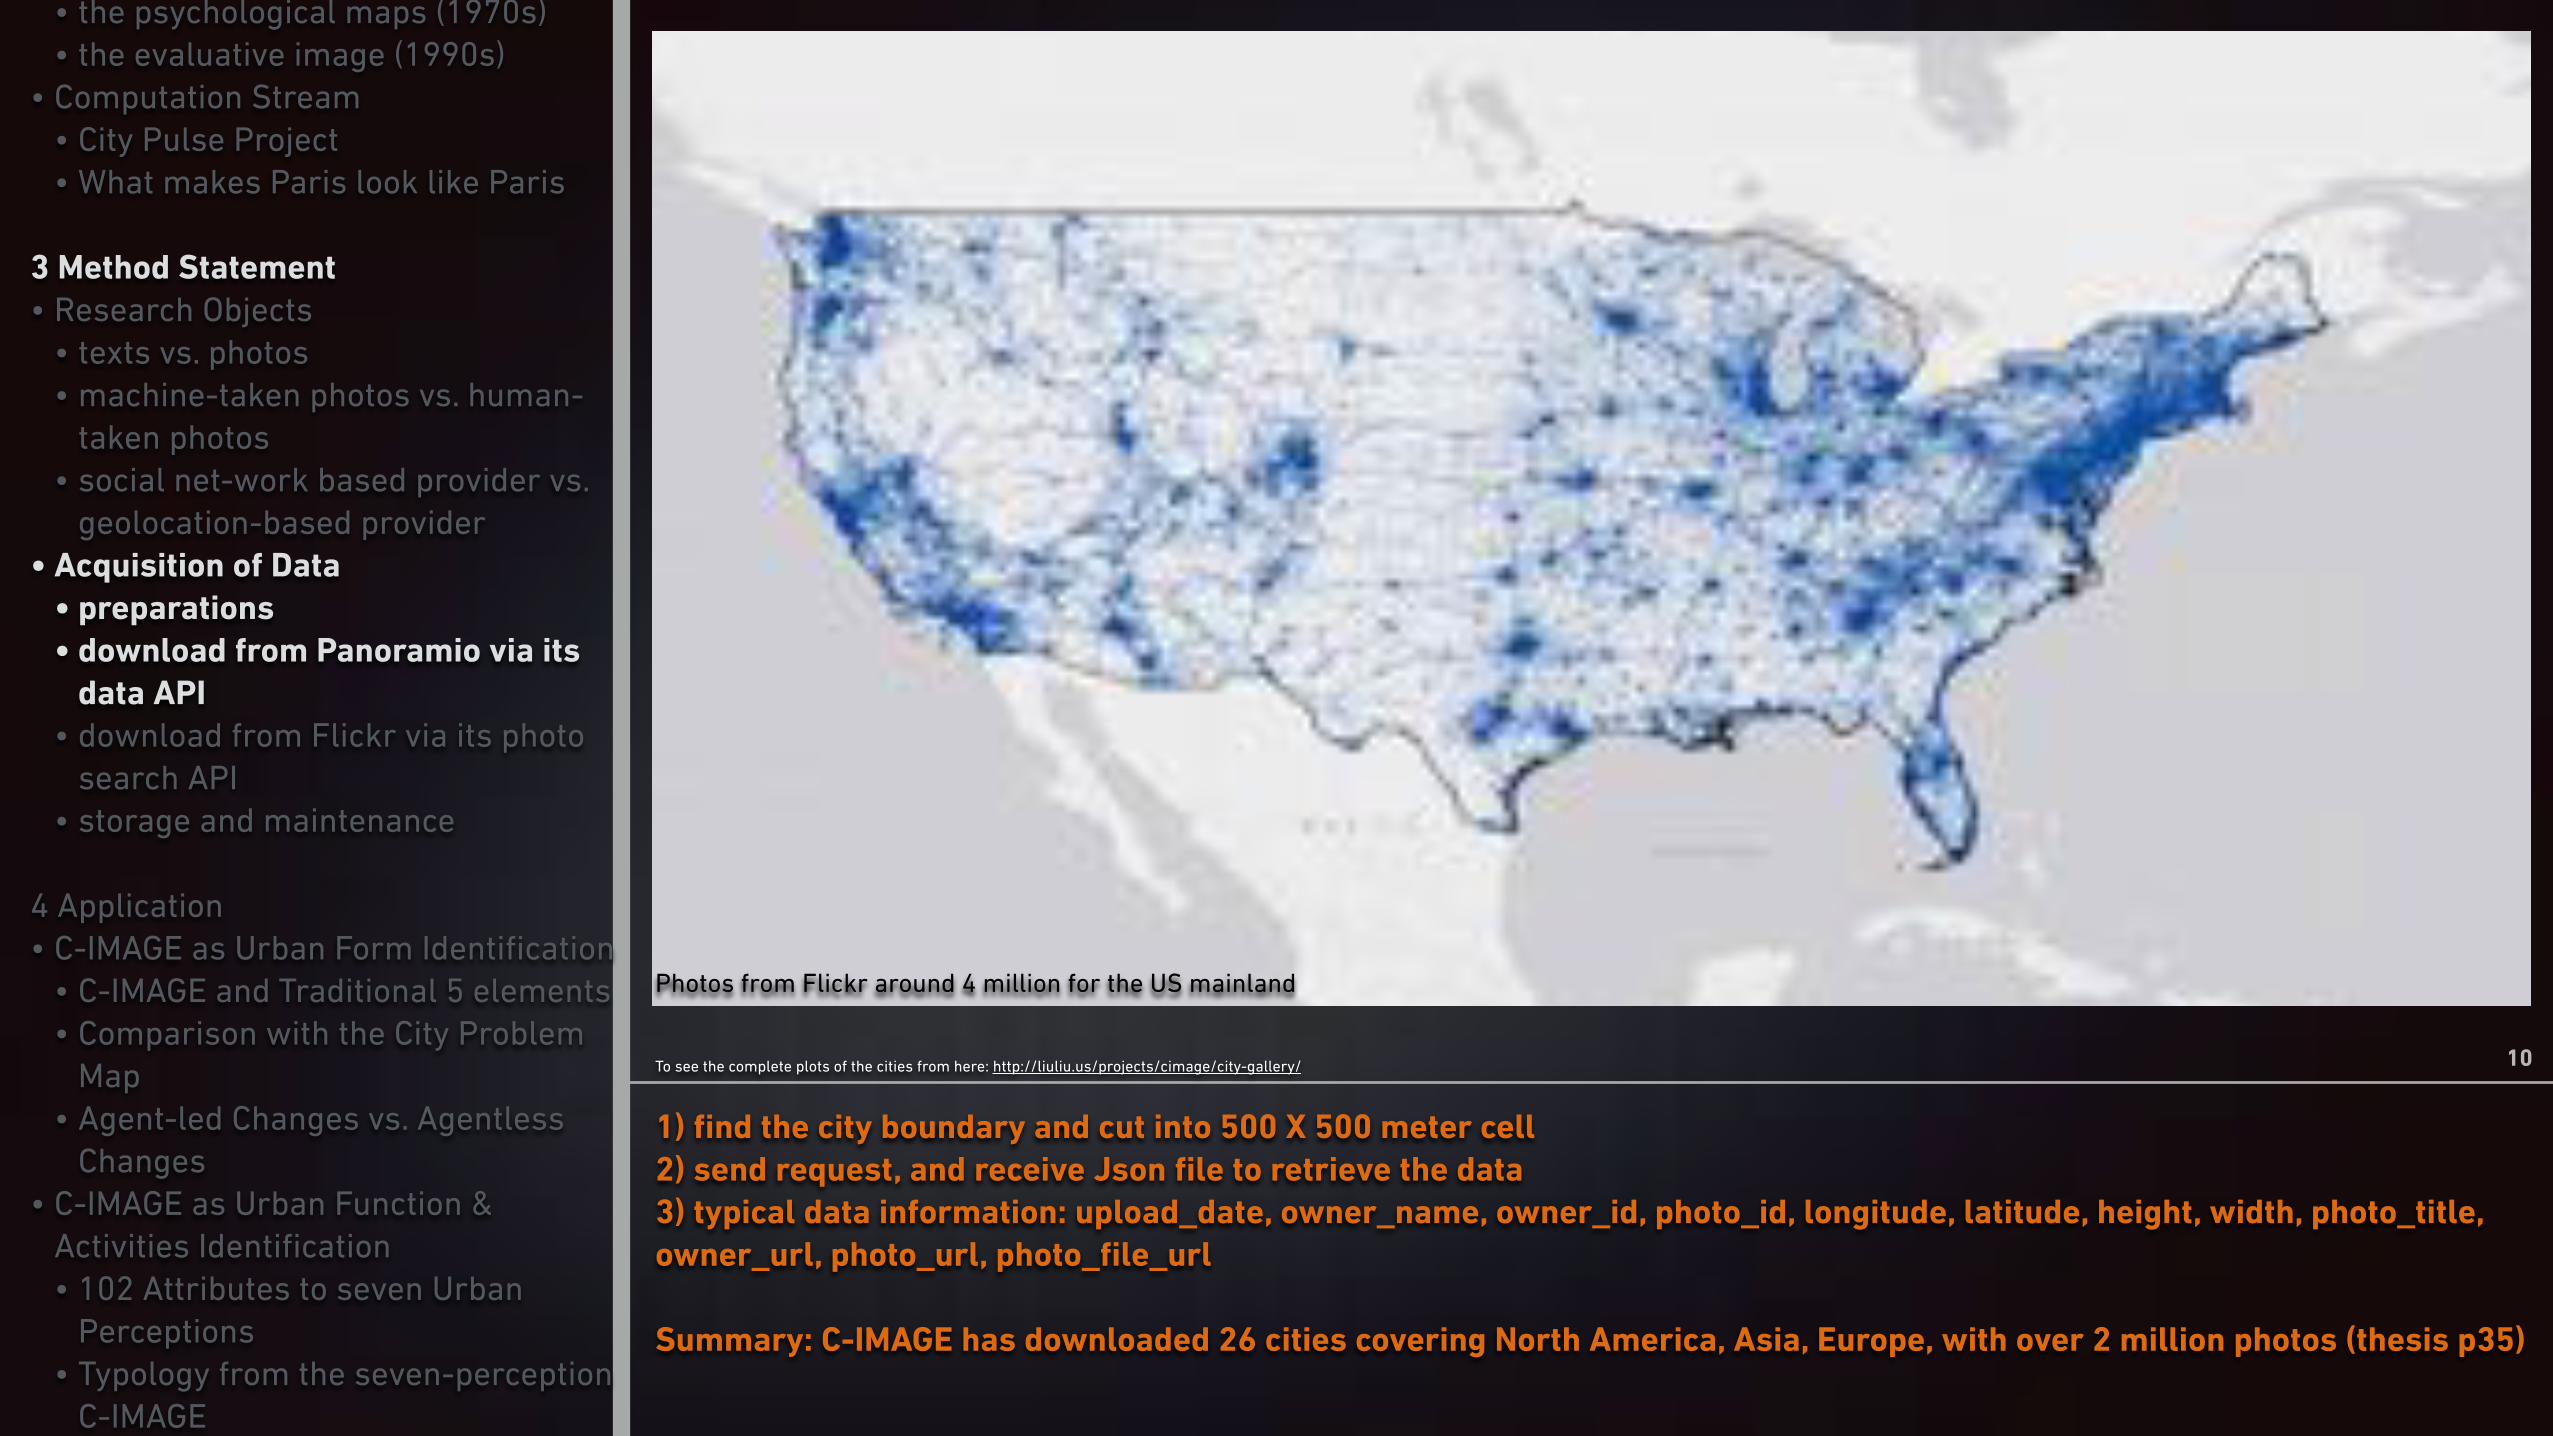
Photos from Panoramio around 4 million for the US mainland
• the image of the city (1960s) • the psychological maps (1970s) • the evaluative image (1990s)
• Computation Stream • City Pulse Project • What makes Paris look like Paris
3 Method Statement • Research Objects
• texts vs. photos • machine-taken photos vs. human-
taken photos • social net-work based provider vs.
geolocation-based provider • Acquisition of Data
• preparations • download from Panoramio via its
data API • download from Flickr via its photo
search API • storage and maintenance
4 Application • C-IMAGE as Urban Form Identification
• C-IMAGE and Traditional 5 elements • Comparison with the City Problem
Map • Agent-led Changes vs. Agentless
Changes • C-IMAGE as Urban Function &
Activities Identification • 102 Attributes to seven Urban
Perceptions • Typology from the seven-perception
C-IMAGE • Tokyo vs. Shanghai
10
1) find the city boundary and cut into 500 X 500 meter cell 2) send request, and receive Json file to retrieve the data 3) typical data information: upload_date, owner_name, owner_id, photo_id, longitude, latitude, height, width, photo_title, owner_url, photo_url, photo_file_url
Summary: C-IMAGE has downloaded 26 cities covering North America, Asia, Europe, with over 2 million photos (thesis p35)
To see the complete plots of the cities from here: http://liuliu.us/projects/cimage/city-gallery/
Photos from Flickr around 4 million for the US mainland
• the image of the city (1960s) • the psychological maps (1970s) • the evaluative image (1990s)
• Computation Stream • City Pulse Project • What makes Paris look like Paris
3 Method Statement • Research Objects
• texts vs. photos • machine-taken photos vs. human-
taken photos • social net-work based provider vs.
geolocation-based provider • Acquisition of Data
• preparations • download from Panoramio via its
data API • download from Flickr via its photo
search API • storage and maintenance
4 Application • C-IMAGE as Urban Form Identification
• C-IMAGE and Traditional 5 elements • Comparison with the City Problem
Map • Agent-led Changes vs. Agentless
Changes • C-IMAGE as Urban Function &
Activities Identification • 102 Attributes to seven Urban
Perceptions • Typology from the seven-perception
C-IMAGE • Tokyo vs. Shanghai

11
1) find the city boundary and cut into 500 X 500 meter cell 2) send request, and receive Json file to retrieve the data 3) typical data information: upload_date, owner_name, owner_id, photo_id, longitude, latitude, height, width, photo_title, owner_url, photo_url, photo_file_url
Summary: C-IMAGE has downloaded 26 cities covering North America, Asia, Europe, with over 2 million photos (thesis p35)
To see the complete plots of the cities from here: http://liuliu.us/projects/cimage/city-gallery/
• the image of the city (1960s) • the psychological maps (1970s) • the evaluative image (1990s)
• Computation Stream • City Pulse Project • What makes Paris look like Paris
3 Method Statement • Research Objects
• texts vs. photos • machine-taken photos vs. human-
taken photos • social net-work based provider vs.
geolocation-based provider • Acquisition of Data
• preparations • download from Panoramio via its
data API • download from Flickr via its photo
search API • storage and maintenance
4 Application • C-IMAGE as Urban Form Identification
• C-IMAGE and Traditional 5 elements • Comparison with the City Problem
Map • Agent-led Changes vs. Agentless
Changes • C-IMAGE as Urban Function &
Activities Identification • 102 Attributes to seven Urban
Perceptions • Typology from the seven-perception
C-IMAGE • Tokyo vs. Shanghai
12
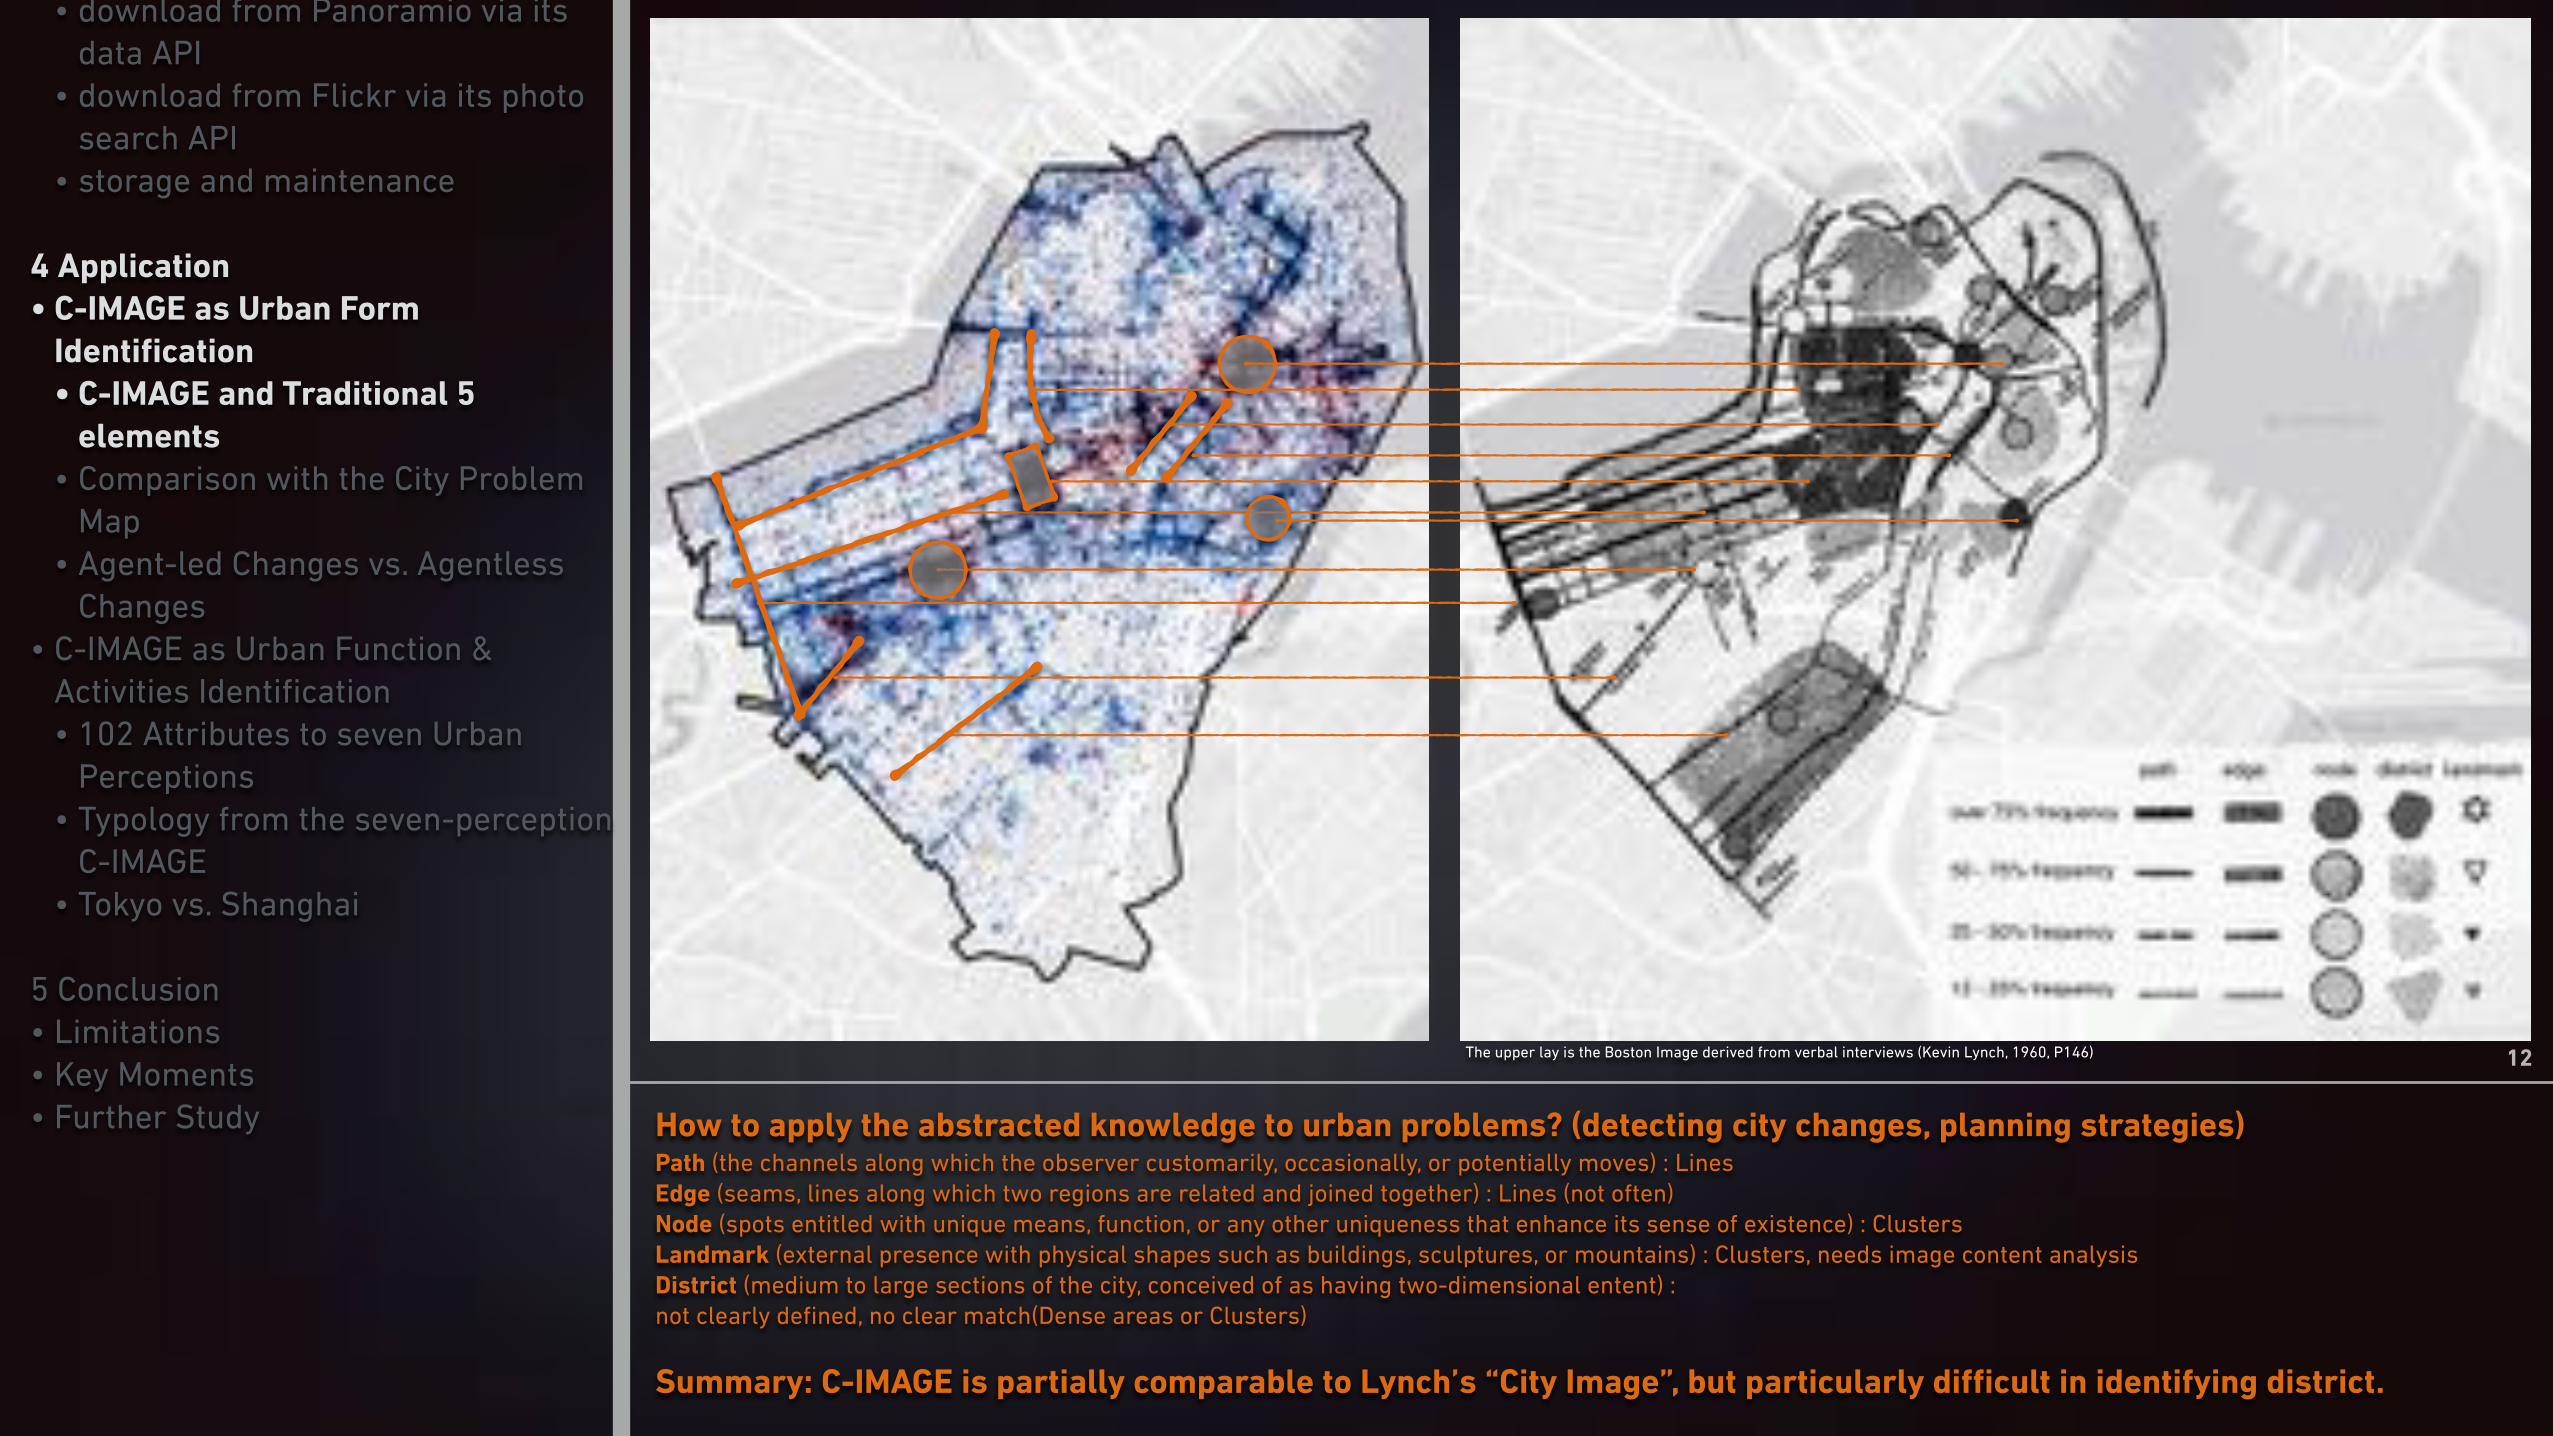
How to apply the abstracted knowledge to urban problems? (detecting city changes, planning strategies) Path (the channels along which the observer customarily, occasionally, or potentially moves) : Lines Edge (seams, lines along which two regions are related and joined together) : Lines (not often) Node (spots entitled with unique means, function, or any other uniqueness that enhance its sense of existence) : Clusters Landmark (external presence with physical shapes such as buildings, sculptures, or mountains) : Clusters, needs image content analysis District (medium to large sections of the city, conceived of as having two-dimensional entent) : not clearly defined, no clear match(Dense areas or Clusters)
Summary: C-IMAGE is partially comparable to Lynch’s “City Image”, but particularly difficult in identifying district.
The upper lay is the Boston Image derived from verbal interviews (Kevin Lynch, 1960, P146)
• preparations • download from Panoramio via its
data API • download from Flickr via its photo
search API • storage and maintenance
4 Application • C-IMAGE as Urban Form
Identification • C-IMAGE and Traditional 5
elements • Comparison with the City Problem
Map • Agent-led Changes vs. Agentless
Changes • C-IMAGE as Urban Function &
Activities Identification • 102 Attributes to seven Urban
Perceptions • Typology from the seven-perception
C-IMAGE • Tokyo vs. Shanghai
5 Conclusion • Limitations • Key Moments • Further Study

13
1) all the changes in image is a reflection of urban changes during the past six decades 2) most of the difference in the comparison can link to a specific planning activity, e.g. Prudential, Big Dig 2) some planning activities may not lead to an improvement from the comparison, e.g. West End 3) some changes have improved the perceptional environment without being led by an agent, e.g. Southwest Corridor Park
Summary: C-IMAGE is able to detect urban changes both from agent-led and agent-less basis.
The upper lay is the map of problems in the Image of Boston (Kevin Lynch, 1960, P146)
Boston Common
Scollay Square
• preparations • download from Panoramio via its
data API • download from Flickr via its photo
search API • storage and maintenance
4 Application • C-IMAGE as Urban Form
Identification • C-IMAGE and Traditional 5 elements • Comparison with the City Problem
Map • Agent-led Changes vs. Agentless
Changes • C-IMAGE as Urban Function &
Activities Identification • 102 Attributes to seven Urban
Perceptions • Typology from the seven-perception
C-IMAGE • Tokyo vs. Shanghai
5 Conclusion • Limitations • Key Moments • Further Study

14
1) all the changes in image is a reflection of urban changes during the past six decades 2) most of the difference in the comparison can link to a specific planning activity, e.g. Prudential, Big Dig 2) some planning activities may not lead to an improvement from the comparison, e.g. West End 3) some changes have improved the perceptional environment without being led by an agent, e.g. Southwest Corridor Park
Summary: C-IMAGE is able to detect urban changes both from agent-led and agent-less basis.
Big Dig (1982-2007)
Waterfront Redevelopment(1964- )
Post Office Square(1992, 1997)
Southwest Corridor Park (1970s)
Newbury Street (1970s)
Prudential Center (1960 -1964)
Renovation of Faneuil Hall Mktpl(1976)
The upper lay is the map of problems in the Image of Boston (Kevin Lynch, 1960, P146)
• preparations • download from Panoramio via its
data API • download from Flickr via its photo
search API • storage and maintenance
4 Application • C-IMAGE as Urban Form
Identification • C-IMAGE and Traditional 5 elements • Comparison with the City Problem
Map • Agent-led Changes vs. Agentless
Changes • C-IMAGE as Urban Function &
Activities Identification • 102 Attributes to seven Urban
Perceptions • Typology from the seven-perception
C-IMAGE • Tokyo vs. Shanghai
5 Conclusion • Limitations • Key Moments • Further Study

15
Newbury Street “During the past decades, Newbury street has developed its distinctive character that makes it one of the most elegant streets in Boston” (The city observed, Boston: a guide to the architecture of the hub, Lyndon & Wingwall, 1982)
Summary: Such agent-less changes often take time and C-IMAGE is ideal monitor to witness its birth.
1954-1959, image source: http://hdl.handle.net/1721.3/34336 google street view, July, 2011
• preparations • download from Panoramio via its
data API • download from Flickr via its photo
search API • storage and maintenance
4 Application • C-IMAGE as Urban Form
Identification • C-IMAGE and Traditional 5 elements • Comparison with the City Problem
Map • Agent-led Changes vs. Agentless
Changes • C-IMAGE as Urban Function &
Activities Identification • 102 Attributes to seven Urban
Perceptions • Typology from the seven-perception
C-IMAGE • Tokyo vs. Shanghai
5 Conclusion • Limitations • Key Moments • Further Study

16
Southwest Corridor Park “The Boston Southwest Corridor began as a highway project and ended as a community design project.” (The Quality of Participatory Design: The effects of Citizen Input on the Design of the Boston Southwest Corridor, Crewe, 2001)
Summary: The comparison from C-IMAGE provides a direct support to the quality of participatory design.
The map of Southwest Corridor Park from Southwest Corridor Park Conservancy, http://www.swcpc.org/swcpmap.asp?whatsection=SE
• preparations • download from Panoramio via its
data API • download from Flickr via its photo
search API • storage and maintenance
4 Application • C-IMAGE as Urban Form
Identification • C-IMAGE and Traditional 5 elements • Comparison with the City Problem
Map • Agent-led Changes vs. Agentless
Changes • C-IMAGE as Urban Function &
Activities Identification • 102 Attributes to seven Urban
Perceptions • Typology from the seven-perception
C-IMAGE • Tokyo vs. Shanghai
5 Conclusion • Limitations • Key Moments • Further Study

17
1 Sailing / Boating 2 Driving 6 Vocationing / Touring
17 Eating 19 Socializing 22 Competing
28 Farming 30 Shopping 32 Working
40 Railroad 41 Trees 48 Asphalt
case of Boston To see the complete plots of the cities from here: http://wednesday.csail.mit.edu/cityimage/cimage/result_plot/
• preparations • download from Panoramio via its
data API • download from Flickr via its photo
search API • storage and maintenance
4 Application • C-IMAGE as Urban Form Identification
• C-IMAGE and Traditional 5 elements • Comparison with the City Problem
Map • Agent-led Changes vs. Agentless
Changes • C-IMAGE as Urban Function &
Activities Identification • 102 Attributes to seven Urban
Perceptions • Typology from the seven-perception
C-IMAGE • Tokyo vs. Shanghai
5 Conclusion • Limitations • Key Moments • Further Study
“Recognizing City Identity via Attribute Analysis of Geo-tagged Images” Bolei Zhou, Liu Liu, Aude Oliva, Antonio Torralba Computer Vision - ECCV 2014

18
50 Shingles
case of Boston
51 Carpet 57 Wood
61 Sand 62 Rock / Stone 65 Glass
68 Running Water 70 Ice 71 Snow
80 Matte 83 Dry 96 Mostly Vertical Components
To see the complete plots of the cities from here: http://wednesday.csail.mit.edu/cityimage/cimage/result_plot/
How to materialize the information from that cognition? (extract)
SUN attribute database: consists of 102 scene attributes labeled on 14,340 images from 717 categories from it ImageNet —> Deep convolutional network —> 4096 deep learning features (vector) —> SVM classifier (lib SVM)
Summary: through this technology, all the photos are tagged with a 102 dimensional vector indicating which scene its content belongs to.
• preparations • download from Panoramio via its
data API • download from Flickr via its photo
search API • storage and maintenance
4 Application • C-IMAGE as Urban Form Identification
• C-IMAGE and Traditional 5 elements • Comparison with the City Problem
Map • Agent-led Changes vs. Agentless
Changes • C-IMAGE as Urban Function &
Activities Identification • 102 Attributes to seven Urban
Perceptions • Typology from the seven-perception
C-IMAGE • Tokyo vs. Shanghai
5 Conclusion • Limitations • Key Moments • Further Study

19
50 Shingles 51 Carpet 57 Wood
61 Sand 62 Rock / Stone 65 Glass
68 Running Water 70 Ice 71 Snow
80 Matte 83 Dry 96 Mostly Vertical Components
1 Sailing / Boating 2 Driving 6 Vocationing / Touring
17 Eating 19 Socializing 22 Competing
28 Farming 30 Shopping 32 Working
40 Railroad 41 Trees 48 Asphalt
How to materialize the information from that cognition? (extract)
SUN attribute database: consists of 102 scene attributes labeled on 14,340 images from 717 categories from it ImageNet —> Deep convolutional network —> 4096 deep learning features (vector) —> SVM classifier (lib SVM)
Summary: through this technology, all the photos are tagged with a 102 dimensional vector indicating which scene its content belongs to.
case of Boston To see the complete plots of the cities from here: http://wednesday.csail.mit.edu/cityimage/cimage/result_plot/
• preparations • download from Panoramio via its
data API • download from Flickr via its photo
search API • storage and maintenance
4 Application • C-IMAGE as Urban Form Identification
• C-IMAGE and Traditional 5 elements • Comparison with the City Problem
Map • Agent-led Changes vs. Agentless
Changes • C-IMAGE as Urban Function &
Activities Identification • 102 Attributes to seven Urban
Perceptions • Typology from the seven-perception
C-IMAGE • Tokyo vs. Shanghai
5 Conclusion • Limitations • Key Moments • Further Study

20
1 sailing boating
14 diving
27 spectating/being in an audience
40 railroad
53 tiles
66 waves/surf
92 enclosed area
2 driving 3 bilking 4 transporting things or people 5 sunbathing 6 vacationing/
touring 7 hiking 8 climbing 9 camping 10 reading 11 studying/learning 12 teaching 13 research
15 swimming 16 bathing 17 eating 18 cleaning 19 socilizing 20 cogregating 21 waiting in line/queue 22 competing 23 sports 24 exercising 25 playing 26 gaming
28 farming 29 construcing/building 30 shopping 31 medical
activity 32 working 33 using tools 34 digging 35 conducting business 36 praying 37 fencing 38 railing 39 wire
41 trees 42 grass 43 vegetation 44 shrubbery 45 foliage 46 leaves 47 flowers 48 asphalt 49 pavement 50 shingles 51 carpet 52 brick
54 concrete 55 metal 56 paper 57 wood (not part of a tree)
58 vinyl/linoleum
59 rubber/plastic 60 cloth 61 sand 62 rock/stone 63 dirt/soil 64 marble 65 glass
67 ocean 68 running water 69 still water 70 ice 71 snow 72 clouds 73 smoke 74 fire 75 natural light 76 direct sun/
sunny77 electric/
indoor lighting 78 aged/worn
79 glossy 80 matte 81 sterile 82 moist/damp 83 dry 84 dirty 85 rusty 86 warm 87 cold 88 natural 89 man-made
93 far-away horizon 94 no horizon 95 rugged scene
96 mostly vertical
components
97 mostly horizontal
components98 symmetrical 99 cluttered
space 100 scary 101 soothing 102 stressful
90 open area 91 semi-enclosed area
Green Perception: this is the most frequent scene, including a wide variety of categories such as vegetation, trees, etc. Water Perception: it refers to photos that contain a large proportion of water in their contents. Transportation Perception: it means photos contains vehicles. High-rises Perception: it only stands for an impression of high buildings, not definitely related to the real height of the building. Architecture Perception: mostly it is representing historical buildings or traditional characterized buildings, such as churches. Socializing Perception: this category means photo that are related with a wide range of activities varying from a small group to larger ones. Athletic Perception: in theory, it is a subset of socializing activities but sometimes it will be treated as green space.
Summary: The principle to the generalization is based on 1) to be related to urban contents, and 2) distinguishable with others
• preparations • download from Panoramio via its
data API • download from Flickr via its photo
search API • storage and maintenance
4 Application • C-IMAGE as Urban Form Identification
• C-IMAGE and Traditional 5 elements • Comparison with the City Problem
Map • Agent-led Changes vs. Agentless
Changes • C-IMAGE as Urban Function &
Activities Identification • 102 Attributes to seven Urban
Perceptions • Typology from the seven-perception
C-IMAGE • Tokyo vs. Shanghai
5 Conclusion • Limitations • Key Moments • Further Study

21
1 sailing boating
14 diving
27 spectating/being in an audience
40 railroad
53 tiles
66 waves/surf
92 enclosed area
2 driving 3 bilking
4 transporting
things or people
5 sunbathing 6 vacationing/touring 8 climbing 9 camping 10 reading 11 studying/
learning 12 teaching 13 research
15 swimming
16 bathing 17 eating 18 cleaning19
socilizing20
cogregating
21 waiting in line/queue
22 competing
23 sports 24 exercising
25 playing 26 gaming
28 farming 29 construcing/building
30 shopping
31 medical activity 32 working 33 using tools 34 digging
35 conducting business
36 praying 37 fencing 38 railing 39 wire
41 trees 42 grass 43 vegetation
44 shrubbery
45 foliage 46 leaves 47 flowers 48 asphalt 49 pavement
50 shingles 51 carpet 52 brick
54 concrete 55 metal 56 paper 57 wood (not part of a tree)
58 vinyl/linoleum
59 rubber/plastic 60 cloth 61 sand 62 rock/stone 63 dirt/soil 64 marble 65 glass
67 ocean 68 running water
69 still water
70 ice 71 snow 72 clouds 73 smoke 74 fire 75 natural light 76 direct sun/sunny
77 electric/indoor lighting
78 aged/worn
79 glossy 80 matte 81 sterile 82 moist/damp 83 dry 84 dirty 85 rusty 86 warm 87 cold 88 natural 89 man-made
93 far-away horizon 94 no horizon 95 rugged scene
96 mostly vertical
components
97 mostly horizontal
components98 symmetrical 99 cluttered
space 100 scary 101 soothing 102 stressful
90 open area 91 semi-enclosed area
7 hiking
Green Perception: this is the most frequent scene, including a wide variety of categories such as vegetation, trees, etc. Water Perception: it refers to photos that contain a large proportion of water in their contents. Transportation Perception: it means photos contains vehicles. High-rises Perception: it only stands for an impression of high buildings, not definitely related to the real height of the building. Architecture Perception: mostly it is representing historical buildings or traditional characterized buildings, such as churches. Socializing Perception: this category means photo that are related with a wide range of activities varying from a small group to larger ones. Athletic Perception: in theory, it is a subset of socializing activities but sometimes it will be treated as green space.
Summary: The principle to the generalization is based on 1) to be related to urban contents, and 2) distinguishable with others
• preparations • download from Panoramio via its
data API • download from Flickr via its photo
search API • storage and maintenance
4 Application • C-IMAGE as Urban Form Identification
• C-IMAGE and Traditional 5 elements • Comparison with the City Problem
Map • Agent-led Changes vs. Agentless
Changes • C-IMAGE as Urban Function &
Activities Identification • 102 Attributes to seven Urban
Perceptions • Typology from the seven-perception
C-IMAGE • Tokyo vs. Shanghai
5 Conclusion • Limitations • Key Moments • Further Study

22
22 competing23 sports24 exercising25 playing40 railroad2 driving3 bilking
4 transporting
things or people
48 asphalt49 pavement
27 spectating/being in an audience
17 eating19 socilizing
20 cogregating
21 waiting in line/queue
30 shopping
35 conducting business60 cloth1 sailing
boating14 diving66 waves/
surf15
swimming67 ocean68 running
water69 still water
36 praying50 shingles52 brick64 marble78 aged/worn
96 mostly vertical
components9 camping28 farming41 trees42 grass43 vegetation
44 shrubbery45 foliage46 leaves47 flowers 7 hiking
Green Perception Water Perception Transportation Perception High-rises Perception Architecture Perception Socializing Perception Athletic Perception
case of London To see the complete plots of the cities from here: http://wednesday.csail.mit.edu/cityimage/cimage/result_plot/cityAttribute/
• preparations • download from Panoramio via its
data API • download from Flickr via its photo
search API • storage and maintenance
4 Application • C-IMAGE as Urban Form Identification
• C-IMAGE and Traditional 5 elements • Comparison with the City Problem
Map • Agent-led Changes vs. Agentless
Changes • C-IMAGE as Urban Function &
Activities Identification • 102 Attributes to seven Urban
Perceptions • Typology from the seven-perception
C-IMAGE • Tokyo vs. Shanghai
5 Conclusion • Limitations • Key Moments • Further Study
Green Perception: this is the most frequent scene, including a wide variety of categories such as vegetation, trees, etc. Water Perception: it refers to photos that contain a large proportion of water in their contents. Transportation Perception: it means photos contains vehicles. High-rises Perception: it only stands for an impression of high buildings, not definitely related to the real height of the building. Architecture Perception: mostly it is representing historical buildings or traditional characterized buildings, such as churches. Socializing Perception: this category means photo that are related with a wide range of activities varying from a small group to larger ones. Athletic Perception: in theory, it is a subset of socializing activities but sometimes it will be treated as green space.
Summary: The principle to the generalization is based on 1) to be related to urban contents, and 2) distinguishable with others

23
London, UK

24
Paris, France

25
Boston, US

26
San Francisco, US

27
Toronto, Canada

28
Hong Kong, China

29
Tokyo, Japan

30
Beijing, China

31
Shanghai, China

32
Infographics based on the seven-category of image contents 1) Green Perception Dominated City: it refers to cities full of green perceptions in its center. 2) Green and High-rises Separated City: it means the high-rises perceptions and green ones are concentrated separately. 3) Green and High-rises Perceptions mixed City: the cities are mixture of both green perceptions and high-rises perceptions. 4) High-rises Perception dominated City: it is mostly covered by high-rises perpections overwhelmingly.
Summary: According to the seven categorized C-IMAGE, cities display different types in its holistic perception.
Shanghai (High-rises Perception dominated city)
Singapore (Green Perception Dominated City) Toronto (Green and High-rises Separated city)
Paris (Green and High-rises Perceptions mixed city)
• preparations • download from Panoramio via its
data API • download from Flickr via its photo
search API • storage and maintenance
4 Application • C-IMAGE as Urban Form Identification
• C-IMAGE and Traditional 5 elements • Comparison with the City Problem
Map • Agent-led Changes vs. Agentless
Changes • C-IMAGE as Urban Function &
Activities Identification • 102 Attributes to seven Urban
Perceptions • Typology from the seven-
perception C-IMAGE • Tokyo vs. Shanghai
5 Conclusion • Limitations • Key Moments • Further Study

33
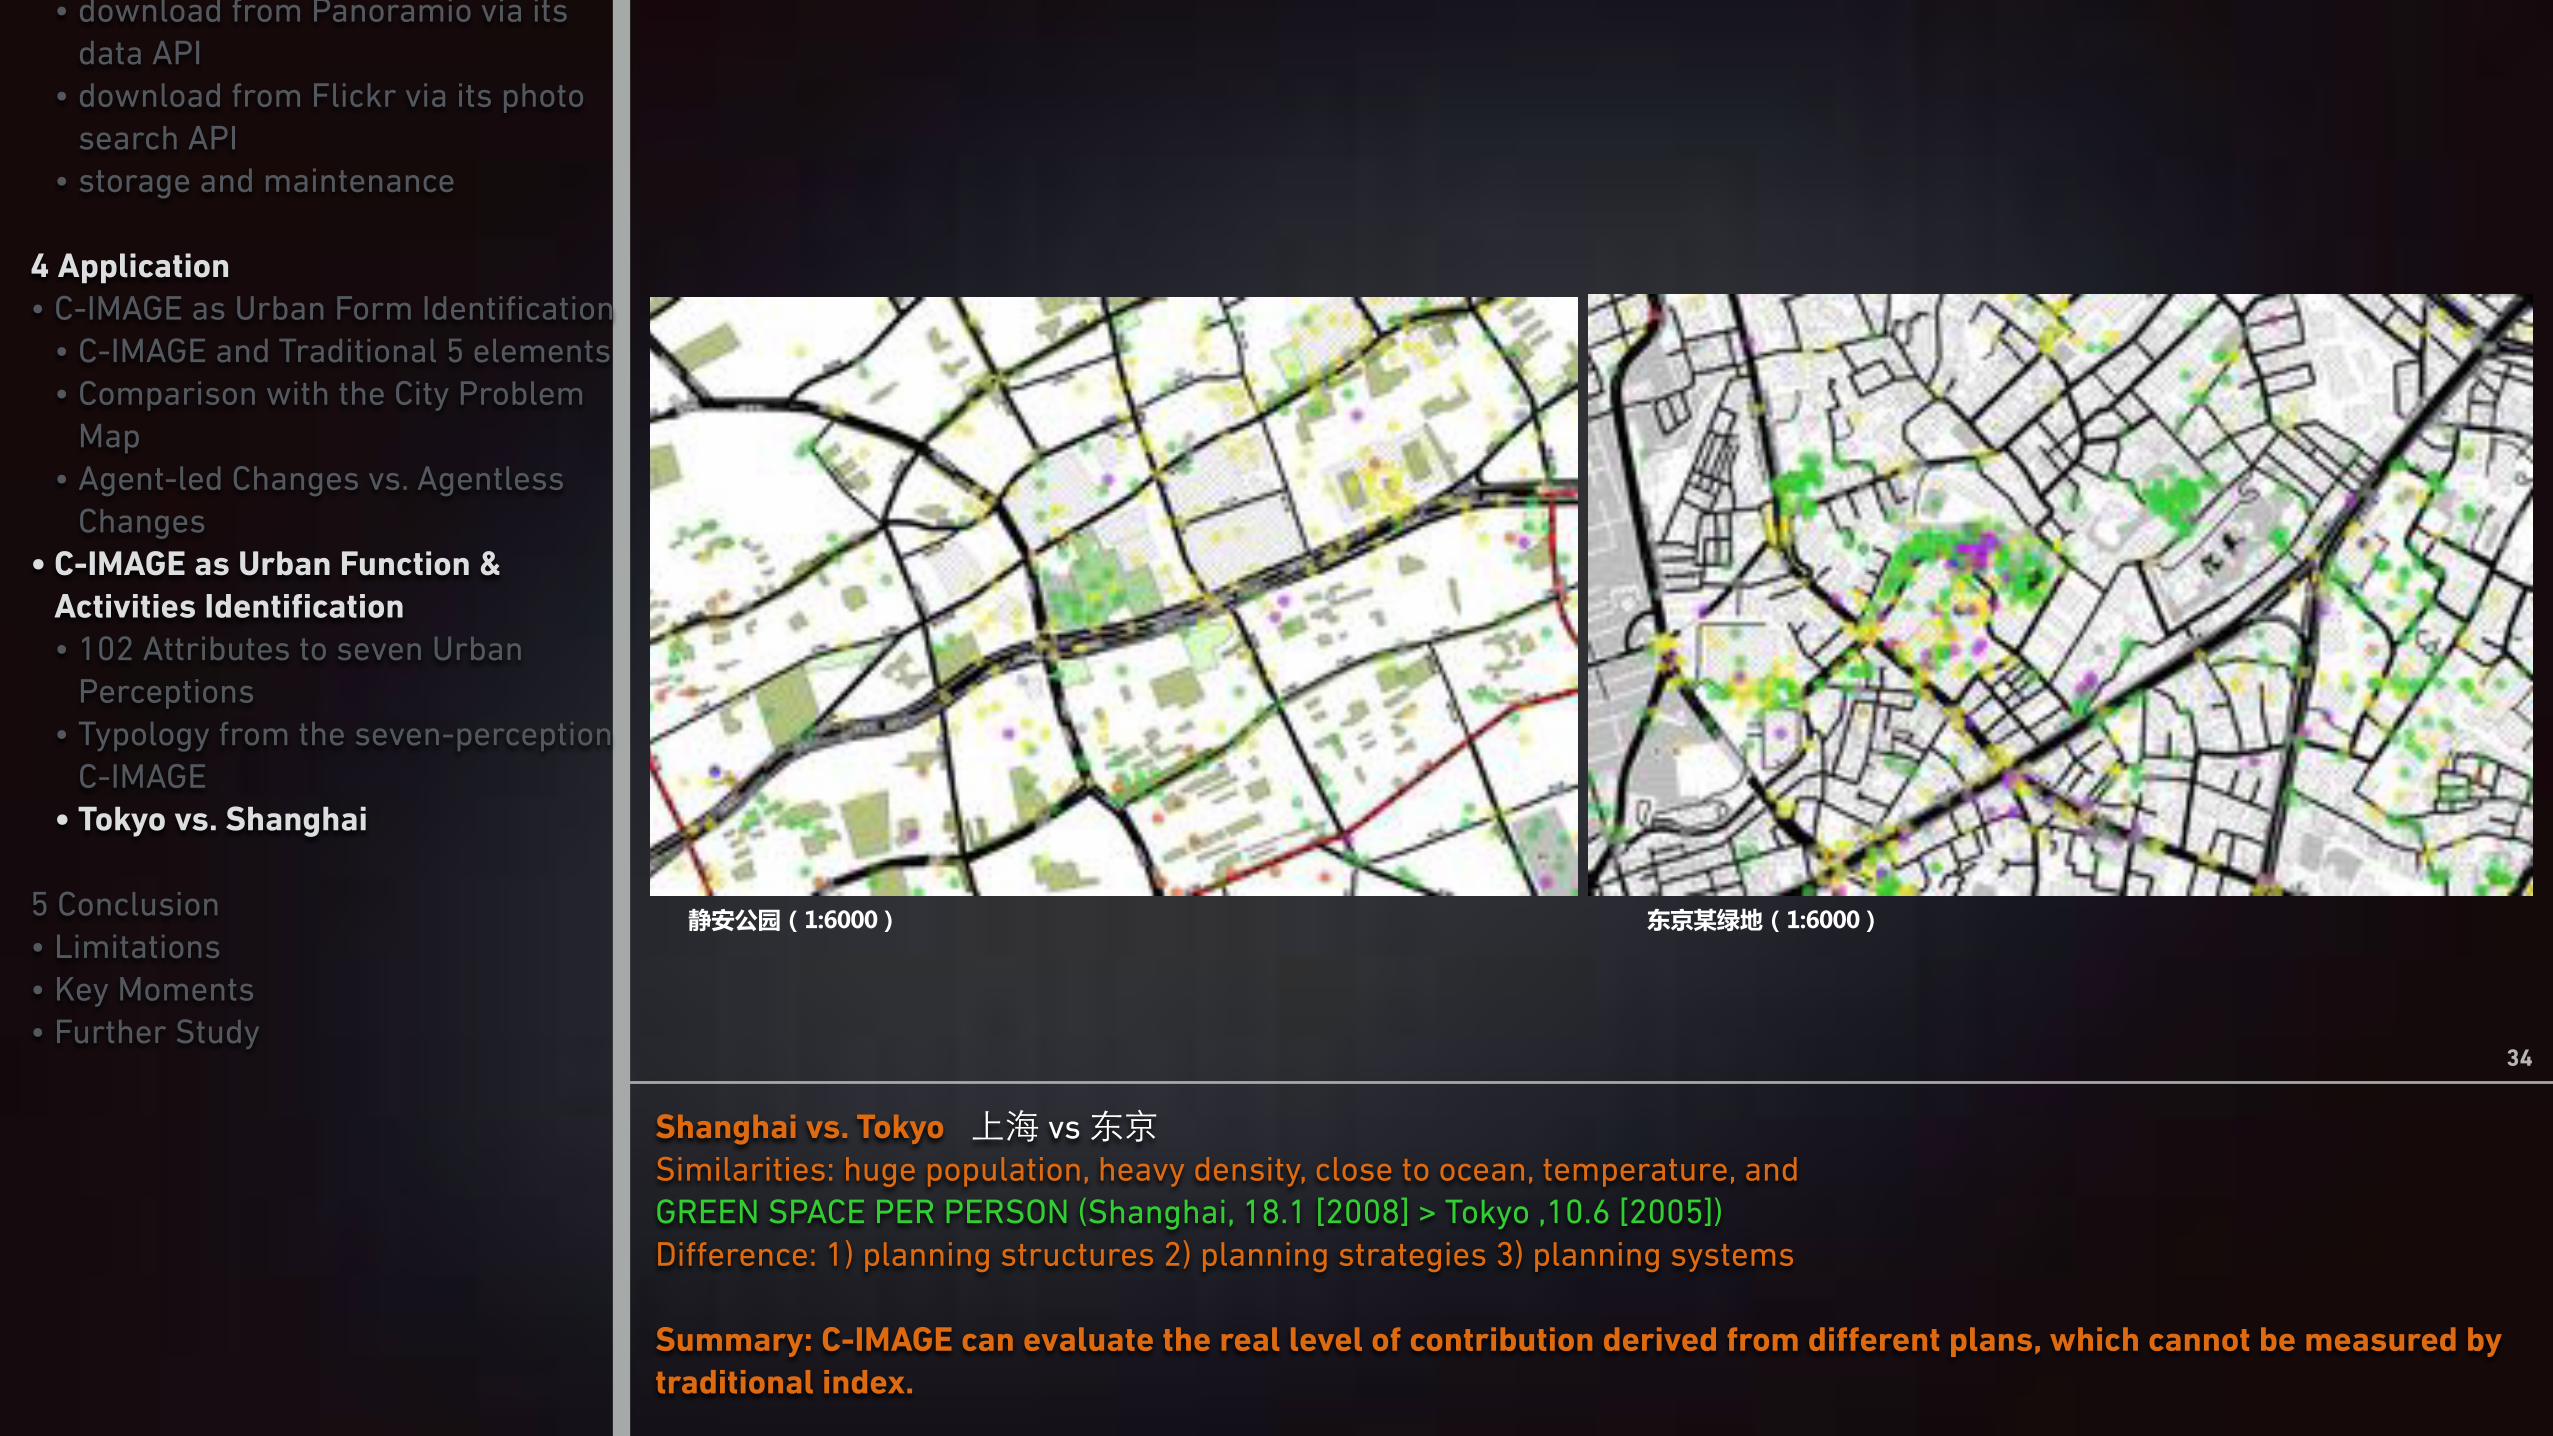
Shanghai vs. Tokyo Similarities: huge population, heavy density, close to ocean, temperature, and GREEN SPACE PER PERSON (Shanghai, 18.1 [2008] > Tokyo ,10.6 [2005]) Difference: 1) planning structures 2) planning strategies 3) planning systems
Summary: C-IMAGE can evaluate the real level of contribution derived from different plans, which cannot be measured by traditional index.
Shanghai (proportion of Green Perceptions: 35%)
Tokyo (proportion of Green Perceptions: 53%)
bottom left image source: http://www.panoramio.com/photo/95511176 bottom right image source: http://www.panoramio.com/photo/5844316top right image sources: http://skyblueskye.com/wp-content/uploads/2013/03/DSCN0084.jpg
• preparations • download from Panoramio via its
data API • download from Flickr via its photo
search API • storage and maintenance
4 Application • C-IMAGE as Urban Form Identification
• C-IMAGE and Traditional 5 elements • Comparison with the City Problem
Map • Agent-led Changes vs. Agentless
Changes • C-IMAGE as Urban Function &
Activities Identification • 102 Attributes to seven Urban
Perceptions • Typology from the seven-perception
C-IMAGE • Tokyo vs. Shanghai
5 Conclusion • Limitations • Key Moments • Further Study
�� vs ��
34
Shanghai vs. Tokyo Similarities: huge population, heavy density, close to ocean, temperature, and GREEN SPACE PER PERSON (Shanghai, 18.1 [2008] > Tokyo ,10.6 [2005]) Difference: 1) planning structures 2) planning strategies 3) planning systems
Summary: C-IMAGE can evaluate the real level of contribution derived from different plans, which cannot be measured by traditional index.
• preparations • download from Panoramio via its
data API • download from Flickr via its photo
search API • storage and maintenance
4 Application • C-IMAGE as Urban Form Identification
• C-IMAGE and Traditional 5 elements • Comparison with the City Problem
Map • Agent-led Changes vs. Agentless
Changes • C-IMAGE as Urban Function &
Activities Identification • 102 Attributes to seven Urban
Perceptions • Typology from the seven-perception
C-IMAGE • Tokyo vs. Shanghai
5 Conclusion • Limitations • Key Moments • Further Study
�� vs ��
��� �������������������

35
Shanghai vs. Tokyo Similarities: huge population, heavy density, close to ocean, temperature, and GREEN SPACE PER PERSON (Shanghai, 18.1 [2008] > Tokyo ,10.6 [2005]) Difference: 1) planning structures 2) planning strategies 3) planning systems
Summary: C-IMAGE can evaluate the real level of contribution derived from different plans, which cannot be measured by traditional index.
• preparations • download from Panoramio via its
data API • download from Flickr via its photo
search API • storage and maintenance
4 Application • C-IMAGE as Urban Form Identification
• C-IMAGE and Traditional 5 elements • Comparison with the City Problem
Map • Agent-led Changes vs. Agentless
Changes • C-IMAGE as Urban Function &
Activities Identification • 102 Attributes to seven Urban
Perceptions • Typology from the seven-perception
C-IMAGE • Tokyo vs. Shanghai
5 Conclusion • Limitations • Key Moments • Further Study
�� vs ��
� ��������� �������������

36
Shanghai vs. Tokyo Similarities: huge population, heavy density, close to ocean, temperature, and GREEN SPACE PER PERSON (Shanghai, 18.1 [2008] > Tokyo ,10.6 [2005]) Difference: 1) planning structures 2) planning strategies 3) planning systems
Summary: C-IMAGE can evaluate the real level of contribution derived from different plans, which cannot be measured by traditional index.
• preparations • download from Panoramio via its
data API • download from Flickr via its photo
search API • storage and maintenance
4 Application • C-IMAGE as Urban Form Identification
• C-IMAGE and Traditional 5 elements • Comparison with the City Problem
Map • Agent-led Changes vs. Agentless
Changes • C-IMAGE as Urban Function &
Activities Identification • 102 Attributes to seven Urban
Perceptions • Typology from the seven-perception
C-IMAGE • Tokyo vs. Shanghai
5 Conclusion • Limitations • Key Moments • Further Study
�� vs ��

Thanks!

C-IMAGE : City Cognitive Mapping Through Geo-Tagged Photos& # | 2014.10BCL 2014, Beijing
.������$��(&���


![Straight Lines Slides [Compatibility Mode]](https://static.fdokumen.com/doc/165x107/6316ee6071e3f2062906978b/straight-lines-slides-compatibility-mode.jpg)