Sleep Deprivation Effects on Cognitive Flexibility in Dynamic ...
294
1 AWARD NUMBER: W81XWH-16-1-0319 TITLE: Sleep Deprivation Effects on Cognitive Flexibility in Dynamic Decision Making Environments PRINCIPAL INVESTIGATOR: CONTRACTING ORGANIZATION: Hans P.A. Van Dongen, PhD Washington State University REPORT DATE: November 2019 TYPE OF REPORT: Final Report PREPARED FOR: U.S. Army Medical Research and Materiel Command Fort Detrick, Maryland 21702-5012 DISTRIBUTION STATEMENT: Approved for Public Release; Distribution Unlimited The views, opinions and/or findings contained in this report are those of the author(s) and should not be construed as an official Department of the Army position, policy or decision unless so designated by other documentation.
-
Upload
khangminh22 -
Category
Documents
-
view
22 -
download
0
Transcript of Sleep Deprivation Effects on Cognitive Flexibility in Dynamic ...
1
AWARD NUMBER: W81XWH-16-1-0319
TITLE: Sleep Deprivation Effects on Cognitive Flexibility in Dynamic Decision Making Environments
PRINCIPAL INVESTIGATOR:
CONTRACTING ORGANIZATION:
Hans P.A. Van Dongen, PhD
Washington State University
REPORT DATE: November 2019
TYPE OF REPORT: Final Report
PREPARED FOR: U.S. Army Medical Research and Materiel Command Fort Detrick, Maryland 21702-5012
DISTRIBUTION STATEMENT: Approved for Public Release; Distribution Unlimited
The views, opinions and/or findings contained in this report are those of the author(s) and should not be construed as an official Department of the Army position, policy or decision unless so designated by other documentation.

REPORT DOCUMENTATION PAGE Form Approved OMB No. 0704-0188
Public reporting burden for this collection of information is estimated to average 1 hour per response, including the time for reviewing instructions, searching existing data sources, gathering and maintaining the data needed, and completing and reviewing this collection of information. Send comments regarding this burden estimate or any other aspect of this collection of information, including suggestions for reducing this burden to Department of Defense, Washington Headquarters Services, Directorate for Information Operations and Reports (0704-0188), 1215 Jefferson Davis Highway, Suite 1204, Arlington, VA 22202-4302. Respondents should be aware that notwithstanding any other provision of law, no person shall be subject to any penalty for failing to comply with a collection of information if it does not display a currently valid OMB control number. PLEASE DO NOT RETURN YOUR FORM TO THE ABOVE ADDRESS. 1. REPORT DATE Nov 2019
2. REPORT TYPEFinal
3. DATES COVERED15 Jul 2016 – 14 Jul 2019
4. TITLE AND SUBTITLESleep Deprivation Effects on Cognitive Flexibility in Dynamic Decision MakingEnvironments
5a. CONTRACT NUMBER
5b. GRANT NUMBER W81XWH-16-1-0319 5c. PROGRAM ELEMENT NUMBER
6. AUTHOR(S)Hans P.A. Van Dongen, Kimberly A. Honn, Paul Whitney, John M. Hinson,Darian Lawrence-Sidebottom, Anthony Stenson, Courtney A. Kurinec,Devon A. Hansen, Matthew E. Layton
5d. PROJECT NUMBER
5e. TASK NUMBER
E-Mail: [email protected]
5f. WORK UNIT NUMBER
7. PERFORMING ORGANIZATION NAME(S) AND ADDRESS(ES) AND ADDRESS(ES)Washington State UniversityOffice of Research Support and OperationsLighty 280, PO Box 641060Washington State UniversityPullman, WA 99164-1060
8. PERFORMING ORGANIZATION REPORTNUMBER
9. SPONSORING / MONITORING AGENCY NAME(S) AND ADDRESS(ES) 10. SPONSOR/MONITOR’S ACRONYM(S)U.S. Army Medical Research and Materiel CommandFort Detrick, Maryland 21702-5012
11. SPONSOR/MONITOR’S REPORTNUMBER(S)
12. DISTRIBUTION / AVAILABILITY STATEMENTApproved for Public Release; Distribution Unlimited
13. SUPPLEMENTARY NOTES
14. ABSTRACTSleep loss, which is common in military operations, causes significant deficits in situational awareness and decision making,but the underlying mechanisms are not well understood. In this project, healthy young adults were assigned to laboratory-based sleep deprivation or a control condition. Study participants were tested on a suite of performance tasks, specificallydeveloped for the study, while well-rested and during 38 hours of sleep deprivation. We found that impairments due to sleepdeprivation could not be explained as mere downstream consequences of degraded vigilant attention. Reduced binding ofacquired knowledge may also contribute to sleep deprivation-induced deficits. Expectation-driven cognitive processing mayhave both advantageous or disadvantageous consequences, depending on the context. However, cognitive flexibility trainingdid not appear to be a viable countermeasure for the effects of sleep deprivation on situational awareness and decisionmaking. Based on our findings, we developed a novel framework for understanding the effects of sleep deprivation onoperationally relevant task performance. This provides a foundation for future interventions to increase resilience againstoperational performance impairment and help improve the safety and success of US military missions around the globe, andcould benefit millions of Americans who are frequently deprived of sleep due to medical conditions or professional demands.15. SUBJECT TERMSsleep deprivation, performance impairment, attentional control, situational awareness, mission success, resilience
16. SECURITY CLASSIFICATION OF: 17. LIMITATIONOF ABSTRACT
18. NUMBEROF PAGES
19a. NAME OF RESPONSIBLE PERSON USAMRMC
a. REPORT
Unclassified
b. ABSTRACT
Unclassified
c. THIS PAGE
Unclassified Unclassified 294
19b. TELEPHONE NUMBER (include areacode)
Standard Form 298 (Rev. 8-98) Prescribed by ANSI Std. Z39.18
3
TABLE OF CONTENTS
Page
1. Introduction…………………………………………………………................. 4
2. Keywords……………………………………………………………................ 7
3. Accomplishments………..…………………………………………................ 8
4. Impact…………………………...…………………………………….............. 37
5. Changes/Problems...….………………………………………………........... 39
6. Products…………………………………….……….….…………….............. 40
7. Participants & Other Collaborating Organizations…………….................. 47
8. Special Reporting Requirements……………………………………........... 60
9. References............................................................................................... 61
10. Appendices....…………………………………………................................. 65
4
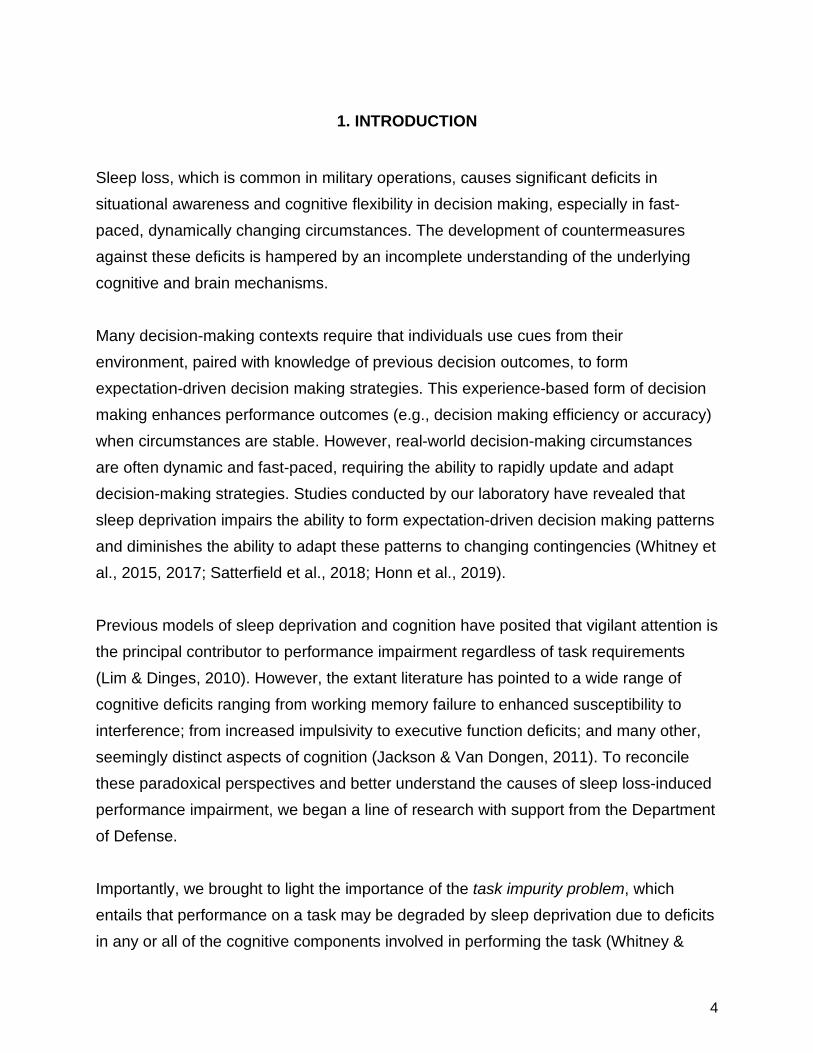
1. INTRODUCTION
Sleep loss, which is common in military operations, causes significant deficits in situational awareness and cognitive flexibility in decision making, especially in fast-paced, dynamically changing circumstances. The development of countermeasures against these deficits is hampered by an incomplete understanding of the underlying cognitive and brain mechanisms. Many decision-making contexts require that individuals use cues from their environment, paired with knowledge of previous decision outcomes, to form expectation-driven decision making strategies. This experience-based form of decision making enhances performance outcomes (e.g., decision making efficiency or accuracy) when circumstances are stable. However, real-world decision-making circumstances are often dynamic and fast-paced, requiring the ability to rapidly update and adapt decision-making strategies. Studies conducted by our laboratory have revealed that sleep deprivation impairs the ability to form expectation-driven decision making patterns and diminishes the ability to adapt these patterns to changing contingencies (Whitney et al., 2015, 2017; Satterfield et al., 2018; Honn et al., 2019). Previous models of sleep deprivation and cognition have posited that vigilant attention is the principal contributor to performance impairment regardless of task requirements (Lim & Dinges, 2010). However, the extant literature has pointed to a wide range of cognitive deficits ranging from working memory failure to enhanced susceptibility to interference; from increased impulsivity to executive function deficits; and many other, seemingly distinct aspects of cognition (Jackson & Van Dongen, 2011). To reconcile these paradoxical perspectives and better understand the causes of sleep loss-induced performance impairment, we began a line of research with support from the Department of Defense. Importantly, we brought to light the importance of the task impurity problem, which entails that performance on a task may be degraded by sleep deprivation due to deficits in any or all of the cognitive components involved in performing the task (Whitney &

5
Hinson, 2010). Thus, for example, a working memory task may be impacted by sleep deprivation because of degraded working memory function, or because of degraded other cognitive processes such as stimulus encoding or sustained attention. Correctly interpreting the effect of sleep deprivation on task performance necessitates a decomposition of the effects of sleep deprivation on the dissociable components of cognition that make up performance of the task (Jackson et al., 2013). As part of this line of research, we showed that sleep deprivation substantially degrades sustained attention (Hudson et al., 2019), attentional arousal (Ratcliff & Van Dongen, 2009), the fidelity of information processing (Chavali et al., 2017), and the quality of information stored in memory (Ratcliff & Van Dongen, 2018). However, the effects of sleep deprivation are negligible for semantic encoding (Honn et al., 2018), working memory scanning (Tucker et al., 2010), and resistance to proactive interference (Tucker et al., 2010; Fournier et al., 2018). Our previous studies further indicated that sleep loss causes significant impairment in attentional control, which refers to the ability to allocate attention to goal-relevant information. That is, we observed profound deficits in decision making during sleep deprivation when changing circumstances required the reallocation of attentional resources. This occurred in an AX continuous performance task (AX-CPT) paradigm, which required subjects to make a conditioned response to a particular cue-probe combination (A–X) and then adjust to a switch of the valid cue-probe combination (Whitney et al., 2017). It also happened in go/no-go reversal learning tasks, in which subjects were to use response accuracy feedback to learn a given stimulus-response mapping and subsequently adapt to an unannounced reversal of the stimulus-response mapping (Whitney et al., 2015; Honn et al., 2019). Through the assessment of genetic polymorphisms associated with inter-individual differences in vulnerability to impairment on these tasks, we showed that the deficits in attentional control exposed by these studies were independent of the deficits in sustained attention caused by sleep loss (Whitney et al., 2017; Satterfield et al., 2018). These findings revealed that sleep deprivation produces multiple, distinct impairments in
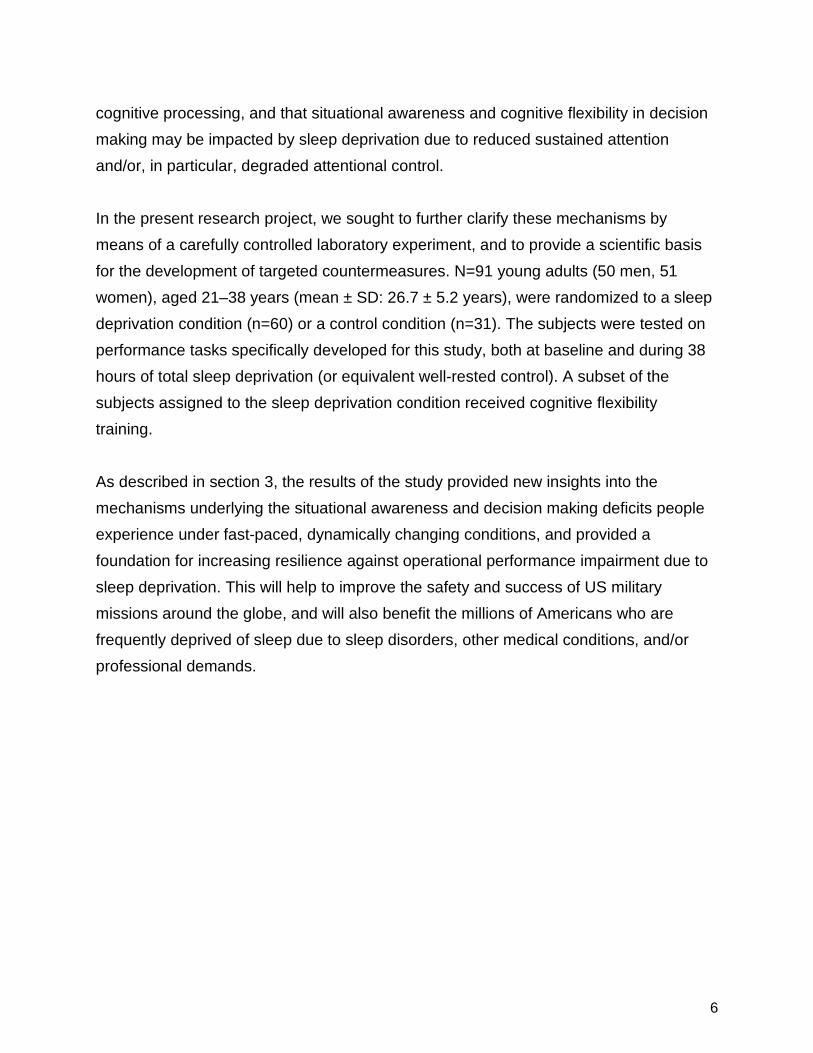
6
cognitive processing, and that situational awareness and cognitive flexibility in decision making may be impacted by sleep deprivation due to reduced sustained attention and/or, in particular, degraded attentional control. In the present research project, we sought to further clarify these mechanisms by means of a carefully controlled laboratory experiment, and to provide a scientific basis for the development of targeted countermeasures. N=91 young adults (50 men, 51 women), aged 21–38 years (mean ± SD: 26.7 ± 5.2 years), were randomized to a sleep deprivation condition (n=60) or a control condition (n=31). The subjects were tested on performance tasks specifically developed for this study, both at baseline and during 38 hours of total sleep deprivation (or equivalent well-rested control). A subset of the subjects assigned to the sleep deprivation condition received cognitive flexibility training. As described in section 3, the results of the study provided new insights into the mechanisms underlying the situational awareness and decision making deficits people experience under fast-paced, dynamically changing conditions, and provided a foundation for increasing resilience against operational performance impairment due to sleep deprivation. This will help to improve the safety and success of US military missions around the globe, and will also benefit the millions of Americans who are frequently deprived of sleep due to sleep disorders, other medical conditions, and/or professional demands.

7
2. KEYWORDS
Sleep deprivation, performance impairment, attentional control, situational awareness, mission success, resilience

8
3. ACCOMPLISHMENTS
What were the major goals of the project? Sleep loss, which is common in military operations, causes significant deficits in situational awareness and cognitive flexibility in decision making, especially in fast-paced, dynamically changing circumstances. The development of countermeasures against these deficits is hampered by an incomplete understanding of the underlying cognitive and brain mechanisms. To address this issue and develop a foundation to increase resilience against operational performance impairment due to sleep deprivation, we sought to address the following specific aims: Aim 1: Demonstrate dissociable effects of sleep loss on vigilant attention and dynamic attentional control and isolate their influences in operationally relevant performance. Aim 2: Show that effects of sleep loss on the use of proactive and reactive control are responsible for failures of situational awareness and risky decision errors. Aim 3: Explore cognitive flexibility training as a method to protect against sleep loss-induced failures of situational awareness and risky decision errors. In a carefully controlled, laboratory sleep deprivation experiment, we significantly refined our understanding of the underlying mechanisms and formed a knowledge base for the development of targeted countermeasures. This contributes significantly to our long-term objective of establishing a scientific framework for improving the safety and success of US military missions. Stated goals not met: none.
9
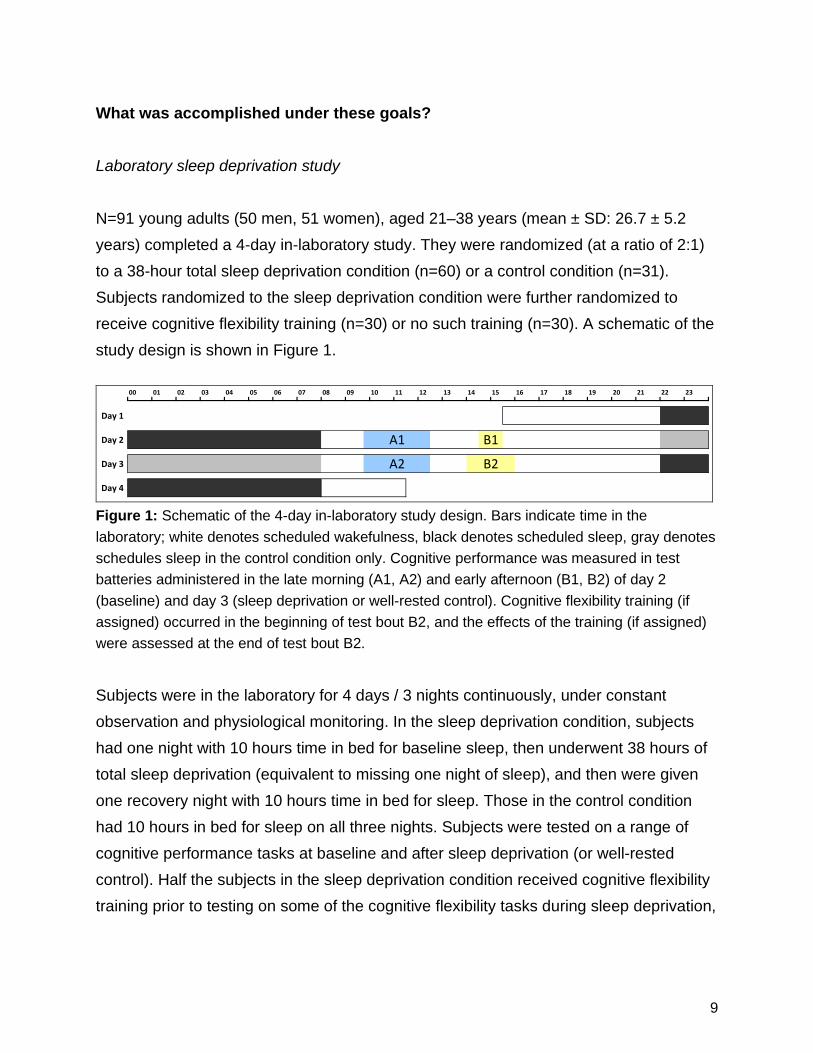
What was accomplished under these goals? Laboratory sleep deprivation study N=91 young adults (50 men, 51 women), aged 21–38 years (mean ± SD: 26.7 ± 5.2 years) completed a 4-day in-laboratory study. They were randomized (at a ratio of 2:1) to a 38-hour total sleep deprivation condition (n=60) or a control condition (n=31). Subjects randomized to the sleep deprivation condition were further randomized to receive cognitive flexibility training (n=30) or no such training (n=30). A schematic of the study design is shown in Figure 1.
Day 1
Day 2
Day 3
Day 4
B2A2
A1
2312 13 14 15 16 17 2220 2104 05 1806 07 08 09 10 1100 01 02 03 19
B1
Figure 1: Schematic of the 4-day in-laboratory study design. Bars indicate time in the laboratory; white denotes scheduled wakefulness, black denotes scheduled sleep, gray denotes schedules sleep in the control condition only. Cognitive performance was measured in test batteries administered in the late morning (A1, A2) and early afternoon (B1, B2) of day 2 (baseline) and day 3 (sleep deprivation or well-rested control). Cognitive flexibility training (if assigned) occurred in the beginning of test bout B2, and the effects of the training (if assigned) were assessed at the end of test bout B2. Subjects were in the laboratory for 4 days / 3 nights continuously, under constant observation and physiological monitoring. In the sleep deprivation condition, subjects had one night with 10 hours time in bed for baseline sleep, then underwent 38 hours of total sleep deprivation (equivalent to missing one night of sleep), and then were given one recovery night with 10 hours time in bed for sleep. Those in the control condition had 10 hours in bed for sleep on all three nights. Subjects were tested on a range of cognitive performance tasks at baseline and after sleep deprivation (or well-rested control). Half the subjects in the sleep deprivation condition received cognitive flexibility training prior to testing on some of the cognitive flexibility tasks during sleep deprivation,

10
which included an operationally relevant task requiring situational awareness and cognitive flexibility. New paradigm for understanding deficits in situational awareness and cognitive flexibility in decision making due to sleep deprivation The central premise of our study was that sleep deprivation induces changes in attentional control that are critically involved in loss of situational awareness and in poor decision making. We argued that the effects of these changes will be especially profound when individuals making decisions are weighing risks in fast-paced, dynamically changing circumstances such as military encounters. Based on the data obtained in through this project, we identified how sleep deprivation affects the fundamental attentional control processes that govern both the development of situational awareness and the flexible updating of situational awareness based on changing conditions. To understand how situational awareness of current goals and conditions is constructed, we must understand: (1) how people use environmental cues, including feedback arising from the outcomes of actions, to associate current goals and task elements within the focus of attention, and (2) how people manage the inherent tradeoff of balancing the maintenance of current task-relevant information in the focus of attention versus updating of information to adapt to shifting events, goals and contingencies. High OPTEMPO tasks, in which multiple related decisions must be made over time and circumstances can change unpredictably, are especially challenging for managing the maintenance-updating tradeoff in the control of attention. Multiple lines of existing evidence (Braver et al., 2009; Jimura & Braver, 2010; Cools & D’Esposito, 2011; Armbruster et al., 2012; Braver, 2012; Whitney et al., 2017; Whitney et al., 2019) indicate that processes of binding goals and task elements into a coherent situational model, and the ability to update the situational model, are highly dependent on the neural pathways among the hippocampus (HPC), prefrontal cortex (PFC), and striatum. During early experiences with a novel task environment, the ability to
11
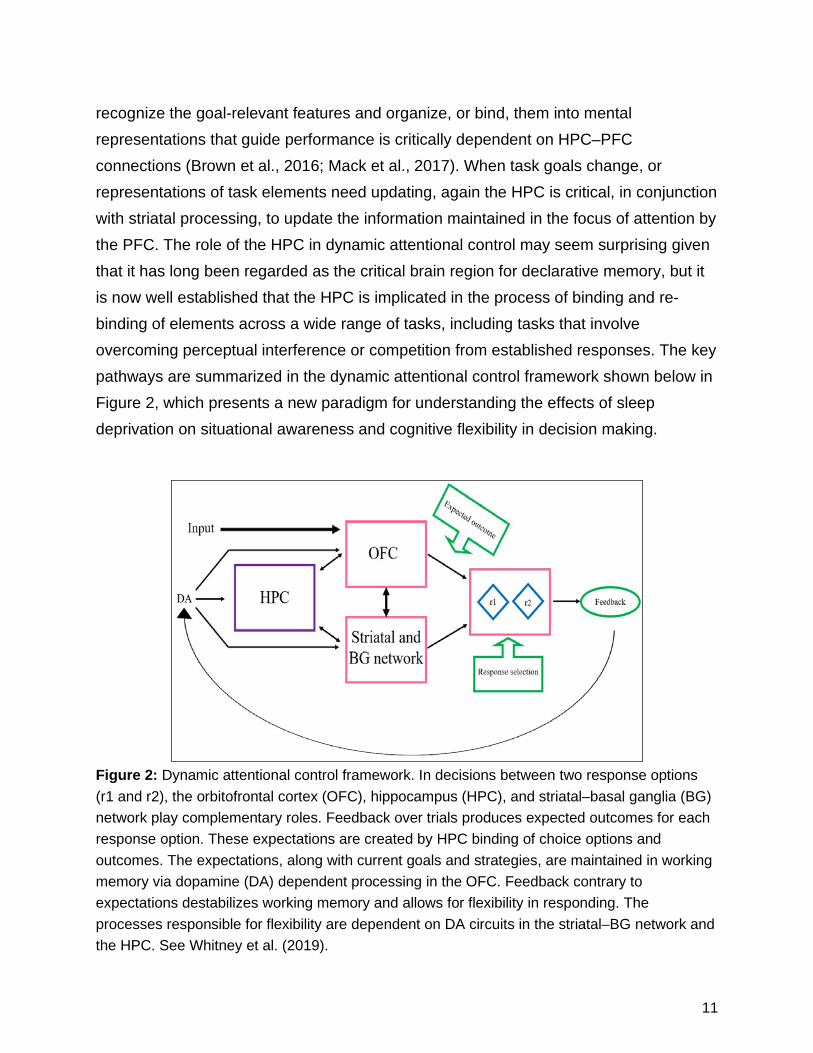
recognize the goal-relevant features and organize, or bind, them into mental representations that guide performance is critically dependent on HPC–PFC connections (Brown et al., 2016; Mack et al., 2017). When task goals change, or representations of task elements need updating, again the HPC is critical, in conjunction with striatal processing, to update the information maintained in the focus of attention by the PFC. The role of the HPC in dynamic attentional control may seem surprising given that it has long been regarded as the critical brain region for declarative memory, but it is now well established that the HPC is implicated in the process of binding and re-binding of elements across a wide range of tasks, including tasks that involve overcoming perceptual interference or competition from established responses. The key pathways are summarized in the dynamic attentional control framework shown below in Figure 2, which presents a new paradigm for understanding the effects of sleep deprivation on situational awareness and cognitive flexibility in decision making.
Figure 2: Dynamic attentional control framework. In decisions between two response options (r1 and r2), the orbitofrontal cortex (OFC), hippocampus (HPC), and striatal–basal ganglia (BG) network play complementary roles. Feedback over trials produces expected outcomes for each response option. These expectations are created by HPC binding of choice options and outcomes. The expectations, along with current goals and strategies, are maintained in working memory via dopamine (DA) dependent processing in the OFC. Feedback contrary to expectations destabilizes working memory and allows for flexibility in responding. The processes responsible for flexibility are dependent on DA circuits in the striatal–BG network and the HPC. See Whitney et al. (2019).

12
The data we obtained through our study are consistent with the conclusion that the effects of sleep deprivation on multiple cognitive tasks can be understood in terms of a bias produced with the dynamic attentional control pathways displayed in Figure 2. Because sleep deprivation leaves the ability to maintain and use information in the focus of attention, or working memory, relatively spared, but impairs binding of contingencies and cognitive flexibility, performance under sleep deprivation is characterized by perseveration on familiar and well-established patterns. What this implies for situational awareness in operational contexts is that sleep-deprived people will be especially error-prone when conditions are dynamically changing and highly trained responses no longer fit the current circumstances. Both developing choice–outcome associations and adapting to shifting response contingencies are clearly manifested in the laboratory tasks we have used in our previous research and in the data collected through the present project. Our data show that when sleep-deprived, subjects have slower and less effective acquisition of choice–outcome associations, and those associations, when established, may be less flexible than those of rested subjects. That is, in general sleep-deprived subjects can maintain their current task association in the focus of attention, but this maintenance comes at the expense of updating the current associations to match decision feedback and changing contingencies in the environment. The evidence we collected in support of this new paradigm is described in the sections below. Sleep deprivation does not necessarily change risk seeking/avoidance or framing bias, but risky decision making is impacted by more than just declines in vigilant attention We investigated the effects of sleep deprivation on the Framed Gambling Task (FGT), which is a risky decision making task that requires the acquisition of knowledge from outcomes of gamble choices to obtain optimal performance (e.g., Wilson et al., 2018a; Wilson et al., 2018b). To help understand the results we obtained in the present study, we first discuss the results of an earlier laboratory study with healthy adult subjects (study 2 in Satterfield et al., 2015), in which the task was administered twice: once
13
during baseline, and once 24 hours later after 26 hours of wakefulness (n=8) or well-rested control (n=9). On every trial in each test bout, a choice was offered between a sure option (e.g., gain $50) on the one hand, and one of two gamble options on the other hand. Of the two gamble options, one was a good gamble and the other a bad gamble, as defined by expected (average) gains or losses. The two gamble options were differentiated visually (i.e., a blue deck labeled “x” and a green deck labeled “y”), but initially, the expected outcomes for each of the gamble options was ambiguous. Subjects thus had to acquire knowledge about the probabilistic gains and losses obtained from choices of these options in order to determine which gambles were advantageous and which were disadvantageous, versus the alternative sure option. The sure option was included to create a framing bias in decision making – when the sure option is a loss, people are predisposed to choose the gamble, whereas then the sure option is a gain, people are predisposed to avoid gambling (Tversky & Kahneman, 1981; Kühberger, 1998; Levin et al., 1998). Optimal decision making on the FGT requires that subjects overcome the pre-existing framing bias and only gamble when the gamble is a good choice but not when it is a bad choice. By design, the good gamble option in the FGT was always the better choice, even if a sure gain was the alternative; and the bad gamble was always the worse choice, even if a sure loss was the alternative. Thus, performance on the FGT was deemed accurate if the subject gambles when the good gamble is offered and takes the sure option when the bad gamble is offered. To be able to perform accurately, subjects had to acquire, maintain, and update information about the gamble options. Probe questions were included to determine whether subjects had accurate estimations of the good and bad gamble outcomes. The task contained 4 blocks of 18 trials each. The probe questions appeared after trial block to measure knowledge acquisition over time.

14
As shown in Figure 3, performance on the FGT was not significantly degraded by sleep deprivation. As expected, accurate choices improved across trial blocks (of 18 trials) during each test bout (repeated-measures ANOVA, effect of trial block, F1,15=7.05, p=0.018). Accuracy also improved across test bouts (effect of test bout, F2,30=11.94, p<0.001), in both the sleep deprivation and control groups. The effects of sleep deprivation were not statistically significant (effect of session by group, F1,15=0.012, p=0.915; effect of session by group by block, F2,30=0.640, p=0.534).
Figure 3: FGT accuracy (means ± SE) over three blocks of 18 trials each during test bout 1 (baseline) and test bout 2 (sleep deprivation or well-rested control) in the sleep deprivation group (red) and the control group (blue).
There was a positive correlation between choice accuracy and the accuracy of gamble estimates as assessed with the probe questions (r=0.61, p<0.001). Thus, sleep-deprived subjects, like well-rested subjects, obtained the required choice feedback information and were able to update and maintain accurate knowledge on which to base their gamble choices, allowing them to make accurate gambles and overcome their pre-existing framing bias.
These results must be interpreted with the understanding that the FGT implemented in the earlier study did not have any response deadline – i.e., decision making on each trial was not time-limited. However, the time pressures often associated with making decisions in real-world contexts may contribute to errors in decision making, especially
0.0
0.2
0.4
0.6
0.8
1.0
1 2 3
Acc
urac
y
Trial block
0.0
0.2
0.4
0.6
0.8
1.0
1 2 3
Accu
racy
Trial block
Test bout 1 Test bout 2
15
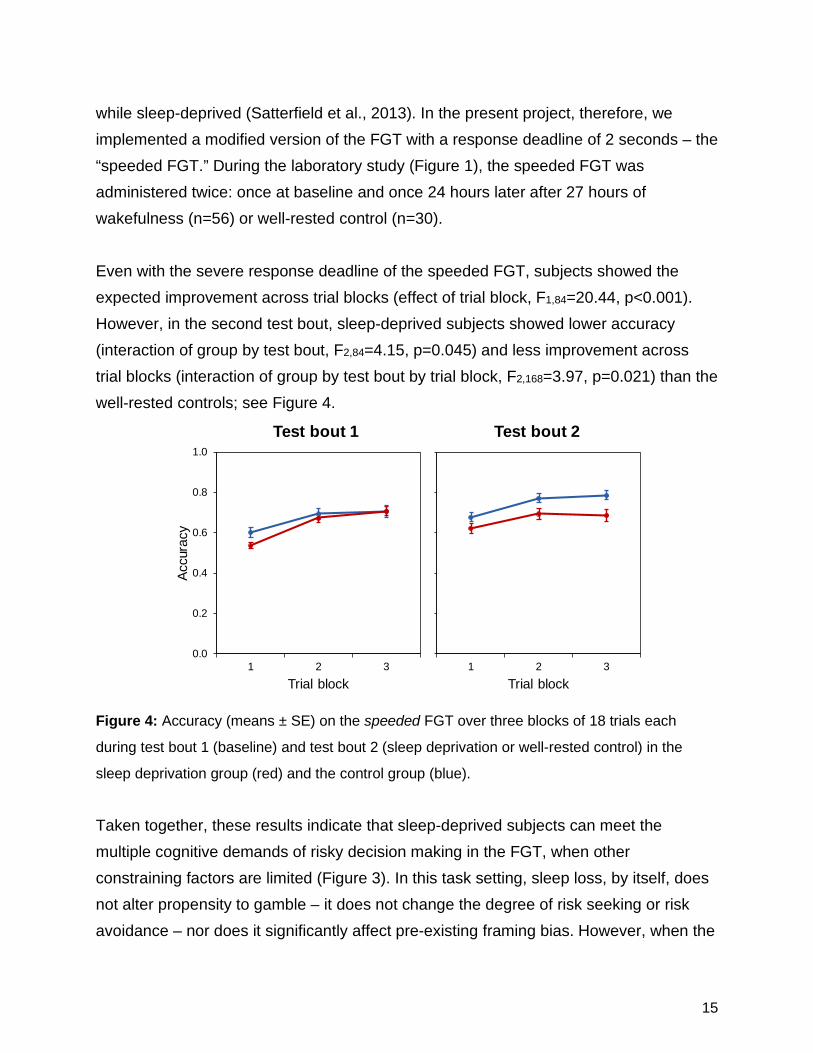
while sleep-deprived (Satterfield et al., 2013). In the present project, therefore, we implemented a modified version of the FGT with a response deadline of 2 seconds – the “speeded FGT.” During the laboratory study (Figure 1), the speeded FGT was administered twice: once at baseline and once 24 hours later after 27 hours of wakefulness (n=56) or well-rested control (n=30). Even with the severe response deadline of the speeded FGT, subjects showed the expected improvement across trial blocks (effect of trial block, F1,84=20.44, p<0.001). However, in the second test bout, sleep-deprived subjects showed lower accuracy (interaction of group by test bout, F2,84=4.15, p=0.045) and less improvement across trial blocks (interaction of group by test bout by trial block, F2,168=3.97, p=0.021) than the well-rested controls; see Figure 4.
Figure 4: Accuracy (means ± SE) on the speeded FGT over three blocks of 18 trials each
during test bout 1 (baseline) and test bout 2 (sleep deprivation or well-rested control) in the
sleep deprivation group (red) and the control group (blue).
Taken together, these results indicate that sleep-deprived subjects can meet the multiple cognitive demands of risky decision making in the FGT, when other constraining factors are limited (Figure 3). In this task setting, sleep loss, by itself, does not alter propensity to gamble – it does not change the degree of risk seeking or risk avoidance – nor does it significantly affect pre-existing framing bias. However, when the
0.0
0.2
0.4
0.6
0.8
1.0
1 2 3
Accu
racy
Trial block
0.0
0.2
0.4
0.6
0.8
1.0
1 2 3
Accu
racy
Trial block
Test bout 1 Test bout 2

16
time available to acquire, update, and utilize task-relevant information is constrained by a decision making deadline, impairment due to sleep deprivation emerges (Figure 4). While some sleep-deprived subjects remain resilient in the face of this challenge, more individuals begin to show compromised performance when a response deadline is imposed. Furthermore, the probe questions revealed that accurate choice outcome information, while necessary, is not sufficient for optimal decision making performance on the FGT. Under conditions with minimal task constraints, sleep-deprived individuals can acquire and properly utilize risky decision making task information. Time pressure changes this, suggesting that time pressure interacts with sleep deprivation to degrade the acquisition of task-relevant information, or the utilization of this information, or both. Poor task performance during sleep deprivation has previously been attributed to a generic, downstream effect of the deterioration of vigilant attention (Lim & Dinges, 2010). While this would seem to be inconsistent with the lack of a sleep deprivation effect on FGT accuracy in the task version without response deadline, in that version of the task it is possible that sleep-deprived subjects are able to maintain accuracy because of a speed–accuracy tradeoff. However, this does not explain how sleep-deprived subjects are able to acquire and utilize task-relevant knowledge on the task equally well as well-rested subjects – these aspects of the task are not implicated in the effects of sleep deprivation based on whether or not the task has a response deadline. As such, the effects of sleep deprivation on speeded FGT performance cannot be attributed to downstream effects of the deterioration of vigilant attention alone. Rather, it appears that sleep-deprived individuals are slower and less effective in acquiring, updating, and maintaining associative bindings between choices and outcomes of those choices.

17
Sleep deprivation-induced reduction in knowledge acquisition contributes to, but does not fully explain, errors in decision making As we have shown previously (Whitney et al., 2015; Satterfield et al., 2018; Honn et al., 2019), sleep deprivation causes errors in decision making on traditional reversal-learning tasks that require subjects to make decisions based on acquired knowledge, then to update relevant knowledge to accommodate a reversal in task contingencies. In this project, we investigated this further. During the laboratory study (Figure 1), we administered the Two-Card Reversal (TCR) task, in which subjects were required to learn through feedback which of two decks of gamble options more consistently resulted in gains and which more consistently resulted in losses. There were five trial blocks of 12 trials each. Over halfway through the task (immediately before the fourth trial block), the deck contingencies reversed without warning. Prior to this reversal, we probed subjects’ knowledge of the values associated with the decks. The TCR task was administered twice: once at baseline and once 24 hours later after 26 hours of wakefulness (n=44) or well-rested control (n=24). Regardless of test bout or condition, performance improved over trial block in the pre-reversal phase (repeated-measures ANOVA with Greenhouse-Geisser correction on degrees of freedom, effect of trial block, F2.41,149.30=52.36, p<0.001). As expected, the subjects also exhibited an immediate decline in accuracy when the deck contingencies reversed (Bonferroni-adjusted contrasts, pairwise comparison between trial block 3 and trial block 4: mean difference ± SE: 0.327 ± 0.037, p<0.01). During test bout 2, we found that overall performance was worse in the sleep deprivation group as compared to the well-rested control group (pairwise comparison between sleep deprivation group and control group in test bout 2: mean difference ± SE: 0.10 ± 0.034, p=0.004). Moreover, pre-reversal performance improved from test bout 1 to test bout 2 in the control group (pairwise comparison between session 1 and session 2 in blocks 1–3 in the control group: mean difference ± SE: 0.075 ± 0.029, p=0.014), but not in the sleep deprivation group (p=0.34). See Figure 5.

18
Compared to well-rested controls, poorer performance in the sleep deprivation group was accompanied by poorer knowledge of the deck outcomes (t62.73=3.77, p<0.001). In a linear regression model with condition, level of knowledge, and their interaction, knowledge was the only significant predictor of performance in test bout 2 (t62=3.45, p<0.001). Thus, subjects made more advantageous decisions when they demonstrated more explicit knowledge of the deck contingencies.
Figure 5: TCR task performance accuracy (means ± SE) over five trial blocks of 12 trials each, with reversal of contingencies immediately before trial block 4, during test bout 1 (baseline) and test bout 2 (sleep deprivation or well-rested control) in the sleep deprivation group (red) and the control group (blue).
These results suggest that for most individuals, sleep deprivation hinders the ability to accumulate decision-relevant knowledge, which causes errors in decision making. However, knowledge alone may not be sufficient to ensure effective TCR task performance. As shown in Figure 6, several subjects in the sleep deprivation group showed adequate knowledge of the deck choices before the reversal, but nonetheless failed to make advantageous decision on the TCR task. Only about 60% of sleep-deprived subjects in the highest tertile of level of knowledge were also in the highest
0.0
0.2
0.4
0.6
0.8
1.0
1 2 3 4 5
Accu
racy
Trial block
0.0
0.2
0.4
0.6
0.8
1.0
1 2 3 4 5
Accu
racy
Trial block
Test bout 1 Test bout 2

19
tertile of decision making performance. This suggests that an additional process other than knowledge acquisition is also necessary for good TCR task performance.
Figure 6: Relationship between level of knowledge, which is the estimated difference between
decks (calculated as good deck estimation – bad deck estimation) and performance accuracy
on the TCR task during the second test bout, in sleep-deprived individuals (red) and well-rested
controls (blue). The actual difference between the good and bad decks is 100.
Expanding on our previous investigations into the effects of sleep deprivation on cognitive flexibility (Whitney et al., 2015; Honn et al., 2019), we also administered a simplified go/no-go reversal learning (GNGr) task, in which subjects used outcome feedback for decisions to detect and adapt to an unannounced reversal of the go and no-go response mappings. The specifics of the task are described elsewhere (Whitney et al., 2015). Here we reduced the stimulus sets to a bare minimum of two pairs of numbers, i.e., as simple and undemanding as possible while avoiding a ceiling effect in performance. In addition, we announced in advance and provided extensive practice with the pre-reversal stimulus sets during an additional phase of trial blocks at the beginning of the task. Further, after each trial in the practice phase we asked subjects to recall and report the stimulus that was presented. There were 32 trials in the practice
0.0
0.2
0.4
0.6
0.8
1.0
-100 -50 0 50 100 150 200
Bout
2 a
ccur
acy
Test bout 2 estimated difference between decks ($)

20
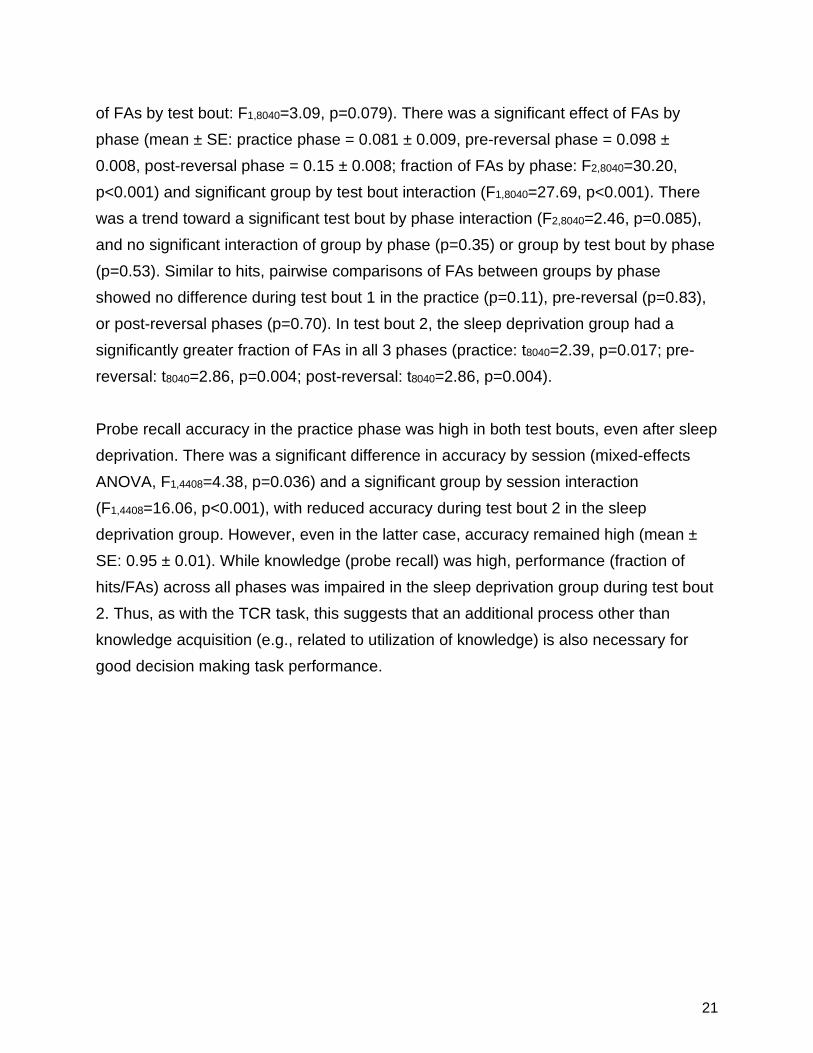
phase, 40 or 48 trials in the pre-reversal phase (depending on task version, so that the reversal would not happen at the same point in the task each day), and 40 trials in the post-reversal phase. For analysis, each phase was divided into 4 trial blocks. This version of the GNGr task was administered twice: once at baseline and once 24 hours later after 27 hours of wakefulness (n=45) or well-rested control (n=25). Even on this simplified GNGr task, sleep-deprived subjects showed impairment in the pre- and post-reversal phases during test bout 2; see Figure 7. The fraction of hits (correct responses to “go” stimuli) were analyzed with a mixed-effects ANOVA with fixed effects for group (sleep deprivation or control), test bout (1 or 2), and phase (practice, pre-reversal, and post-reversal), and their interactions, with a random effect over subjects on the intercept. There was a trend towards more hits in the control group than the sleep deprivation group (mean ± SE: control group = 0.89 ± 0.026, sleep deprivation group = 0.83 ± 0.020; fraction of hits by group: F1,8040=3.23, p=0.072). There was a significant effect of hits by test bout (mean ± SE: test bout 1 = 0.88 ± 0.017, test bout 2 = 0.84 ± 0.017; fraction of hits by test bout: F1,8040=36.41, p<0.001) and by phase, with the highest rate of hits pre-reversal (mean ± SE: practice phase = 0.84 ± 0.017, pre-reversal phase = 0.90 ± 0.017, post-reversal phase = 0.83 ± 0.017; fraction of hits by phase: F2,8040=38.81, p<0.001). There was also a group by test bout interaction, with the sleep deprivation group performing worse in test bout 2 (fraction of hits by group by test bout: F1,8040=48.83, p<0.001). There was no significant interaction of group by phase (p=0.58), test bout by phase (p=0.87), or group by test bout by phase (p=0.93). Pairwise comparisons between groups by phase showed no difference during test bout 1 in the practice (p=0.71), pre-reversal (p=0.75), or post-reversal phases (p=0.79). In test bout 2, the sleep deprivation group had a significantly lower fraction of hits in all 3 phases (practice: t8040=3.06, p=0.002; pre-reversal: t8040=3.20, p=0.001; post-reversal: t8040=2.86, p=0.004). Similarly, there was a trend towards significance for false alarms (FAs; incorrect responses to “no go” stimuli) by group (mean ± SE: control group = 0.096 ± 0.011, sleep deprivation group = 0.12 ± 0.009; fraction of FAs by group: F1,8040=3.08, p=0.079) and by test bout (mean ± SE: test bout 1 = 0.10 ± 0.008, test bout 2 = 0.12 ± 0.008; fraction
21
of FAs by test bout: F1,8040=3.09, p=0.079). There was a significant effect of FAs by phase (mean ± SE: practice phase = 0.081 ± 0.009, pre-reversal phase = 0.098 ± 0.008, post-reversal phase = 0.15 ± 0.008; fraction of FAs by phase: F2,8040=30.20, p<0.001) and significant group by test bout interaction (F1,8040=27.69, p<0.001). There was a trend toward a significant test bout by phase interaction (F2,8040=2.46, p=0.085), and no significant interaction of group by phase (p=0.35) or group by test bout by phase (p=0.53). Similar to hits, pairwise comparisons of FAs between groups by phase showed no difference during test bout 1 in the practice (p=0.11), pre-reversal (p=0.83), or post-reversal phases (p=0.70). In test bout 2, the sleep deprivation group had a significantly greater fraction of FAs in all 3 phases (practice: t8040=2.39, p=0.017; pre-reversal: t8040=2.86, p=0.004; post-reversal: t8040=2.86, p=0.004). Probe recall accuracy in the practice phase was high in both test bouts, even after sleep deprivation. There was a significant difference in accuracy by session (mixed-effects ANOVA, F1,4408=4.38, p=0.036) and a significant group by session interaction (F1,4408=16.06, p<0.001), with reduced accuracy during test bout 2 in the sleep deprivation group. However, even in the latter case, accuracy remained high (mean ± SE: 0.95 ± 0.01). While knowledge (probe recall) was high, performance (fraction of hits/FAs) across all phases was impaired in the sleep deprivation group during test bout 2. Thus, as with the TCR task, this suggests that an additional process other than knowledge acquisition (e.g., related to utilization of knowledge) is also necessary for good decision making task performance.

22
0.0
0.2
0.4
0.6
0.8
1.0
1 2 3 4 5 6 7 8 9 10 11 12
Frac
tion
of H
its /
FAs
Trial BlocksPractice Pre-Reversal Post-Reversal
0.0
0.2
0.4
0.6
0.8
1.0
1 2 3 4 5 6 7 8 9 10 11 12
Frac
tion
of H
its /
FAs
Test bout 1
HitsFAs
Test bout 2
Trial BlocksPractice Pre-Reversal Post-Reversal
Figure 7: Means (± SE) for hits (responses to go stimuli) and false alarms (FAs; responses to no-go stimuli) on a simplified go/no-go reversal learning task at baseline (test bout 1) and after sleep deprivation or well-rested control (test bout 2), in sleep-deprived individuals (red) and well-rested controls (blue).
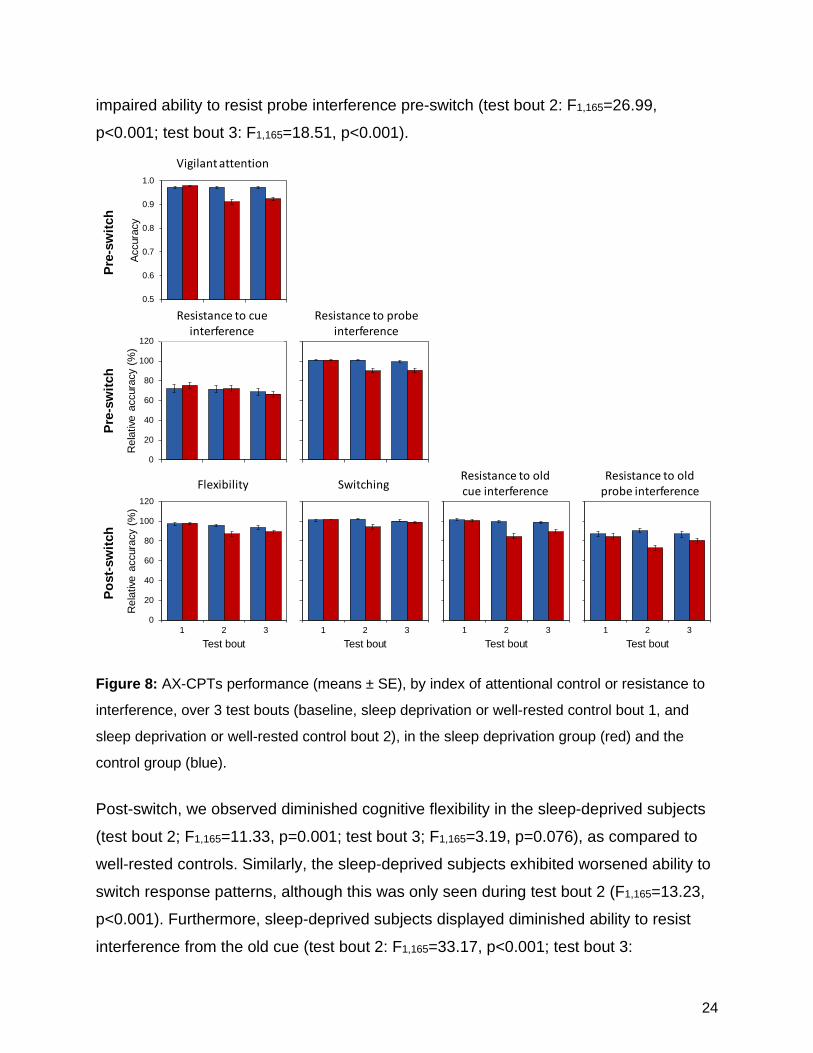
Advantages and costs of expectation-driven processing during sleep deprivation We posit that good decisions must be driven by informative expectations (e.g., from experience-based knowledge) regarding the relationship between choices and outcomes. Without developing these expectations, people are unlikely to use choice outcome feedback to 1) develop good decision making patterns based on experience, and 2) adapt to changing circumstances. Expectation-driven decision making has been studied in a variety of contexts using the continuous performance task with switch (AX-version; AX-CPTs), and we have previously implemented this task (Whitney et al., 2017). The AX-CPTs requires that subjects make speeded responses to probe letters that are preceded by a cue. In the pre-switch phase, subjects are instructed to respond with a left mouse click to the target pair (A-X) and with a right mouse click to all other pairs of letters (e.g., A-Y). The A-X target pair is presented 70% of the time, such that individuals form expectation-driven response patterns based on the expectation that the cue “A” predicts the probe “X”. About half-way through the task, the subjects are instructed to respond with a left mouse click to a new target pair (B-Y) and with a right mouse click to all other pairs (including the old target pair). Distractor trials are

23
presented throughout the task to measure the ability to resist interference on non-target trials that contain the cue “A” or the probe “X”. For the purposes of the present project, we developed novel indices of attentional
control, vigilant attention, and adaptive decision making. Accuracy on pre-switch A-X
trials is used an index of vigilant attention, and all other indices are accuracy on other
trial types normalized to pre-switch A-X accuracy because this index of vigilant attention
reflects the upper threshold of performance (as declines in attention have downstream
consequences for all trial types in this task). Pre-switch accuracy on trials with a target
cue and a non-target probe, and with a non-target cue and a target probe, measure
resistance to cue interference and resistance to probe interference, respectively. Post-
switch accuracy on the new-target trials (B-X) measures cognitive flexibility. Accuracy
on A-X trials post-switch is a measure of the ability to switch response patterns.
Accuracy on post-switch A-Y trials is a measure of resistance to interference from the
old cue, and accuracy on post-switch B-X trials is a measure of resistance to
interference from the old probe. In the present study, the AX-CPTs was administered at
baseline (test bout 1), after 25.5 hours of sleep deprivation (n=55) or well-rested control
(n=30) (test bout 2), and again after 30 hours of sleep deprivation or well-rested control
(test bout 3).
The performance of individuals who employ expectation-driven decision making on the
AX-CPTs is characterized by lesser resistance to cue interference versus probe
interference, meaning that subjects have formed the expectation that a cue “A” will be
followed by a probe “X”. We observed this pattern in both well-rested and sleep-
deprived subjects during all three of the test bouts; see Figure 8. There were no
significant between-group differences in test bout 1, before any subjects were sleep
deprived. However, several between-group differences emerged during sleep
deprivation (test bouts 2 and 3). Planned contrasts between the sleep deprivation and
control groups revealed that the sleep deprivation group exhibited reduced vigilant
attention during sleep deprivation (test bout 2: F1,165=33.85, p<0.001; test bout 3:
F1,165=22.21, p<0.001), as expected. Furthermore, sleep deprivation resulted in
24
impaired ability to resist probe interference pre-switch (test bout 2: F1,165=26.99,
p<0.001; test bout 3: F1,165=18.51, p<0.001).
0
20
40
60
80
100
120
1 2 3
Rel
ative
acc
urac
y (%
)
Test bout
0.5
0.6
0.7
0.8
0.9
1.0
1 2 3
Accu
racy
Test bout
0
20
40
60
80
100
120
1 2 3
Rel
ative
acc
urac
y (%
)
Test bout
0
20
40
60
80
100
120
1 2 3
Rel
ative
acc
urac
y (%
)
Test bout
0
20
40
60
80
100
120
1 2 3
Rel
ative
acc
urac
y (%
)
Test bout
0
20
40
60
80
100
120
1 2 3
Rel
ative
acc
urac
y (%
)
Test bout
0
20
40
60
80
100
120
1 2 3
Rel
ative
acc
urac
y (%
)
Test bout
Pre-
switc
hPr
e-sw
itch
Post
-sw
itch
Vigilant attention
Resistance to cue interference
Resistance to probe interference
Resistance to old cue interference
Resistance to old probe interferenceFlexibility Switching
Figure 8: AX-CPTs performance (means ± SE), by index of attentional control or resistance to
interference, over 3 test bouts (baseline, sleep deprivation or well-rested control bout 1, and
sleep deprivation or well-rested control bout 2), in the sleep deprivation group (red) and the
control group (blue). Post-switch, we observed diminished cognitive flexibility in the sleep-deprived subjects
(test bout 2; F1,165=11.33, p=0.001; test bout 3; F1,165=3.19, p=0.076), as compared to
well-rested controls. Similarly, the sleep-deprived subjects exhibited worsened ability to
switch response patterns, although this was only seen during test bout 2 (F1,165=13.23,
p<0.001). Furthermore, sleep-deprived subjects displayed diminished ability to resist
interference from the old cue (test bout 2: F1,165=33.17, p<0.001; test bout 3:

25
F1,165=13.59, p<0.001). A similar pattern was observed for the ability to resist
interference from the old probe (test bout 2: F1,165=19.63, p<0.001; test bout 3:
F1,165=2.80, p=0.096).
These results indicate that sleep-deprived individuals can develop expectations
regarding choice outcomes; however, this is at the expense of increased vulnerability to
interference. Furthermore, sleep-deprived individuals have difficulty adjusting their
expectations to accommodate a change in task contingencies, as we have shown
previously (Whitney et al., 2017).
In the laboratory study, we also implemented another task that requires subjects to form
expectations based on the pairing of a cue and a probe. In the novel Vigilance and
Attentional Control (VAC) task, subjects are instructed to respond differently (with left or
right mouse clicks) to images of a “friend” (e.g., a smiley face) and a “foe” (e.g., a mean
face), and responses must be made within a 500 ms window. In the first 80 trials, 64
trials begin with a hint regarding the upcoming probe stimulus (the word “friend” or “foe”
shown on screen before the presentation of the stimulus; the other 16 trials show “no
hint” before the trial stimulus is presented). In this phase, the hints are 75% reliable,
most often reflecting the upcoming probe. In the second phase of the task, which
includes 48 “hint” trials and 16 “no hint” trials, the hints are 66% unreliable, most often
not reflecting the upcoming probe. Due to the short response window, the formation of
expectations based on the cue being valid is advantageous to responding quickly and
accurately in the first phase of the task. However, in the second phase, reliance on the
cues is disadvantageous to accuracy, so expectations should be updated to reflect a
low cue-validity. The VAC was administered twice: once at baseline and once 24 hours
later after 31 hours of wakefulness (n=44) or well-rested control (n=27).
Overall performance on the VAC is measured by accuracy in responding to the probe,
and accuracy on specific trial types can reveal the functioning of specific components of
attention and attentional control. Vigilant attention is measured as accuracy on no-cue
trial types. Expectation-driven control may be broken up into two distinct measures; an
26
advantage of control and a cost of control. Specifically, the use of the cue to form an
expectation regarding the probe describes a top-down decision making strategy. In the
VAC, the use of a top-down strategy should result in good performance when a cue
accurately predicts a probe (i.e., when the cue and probe are matched) – the most
frequent trial type in the first phase. Therefore, our index for advantage of control was
derived from the difference in accuracy between the matched trial type and the no-cue
trial type. Furthermore, if an individual is relying on a top-down decision making
strategy, this should result in poor performance when a cue does not accurately predict
a probe (i.e., when the cue and probe are mismatched). Thus, our index of cost of
control was calculated from the difference between the mismatched trial type and the
no-cue trial type.
Figure 9 displays our observations for the VAC. As expected, sleep-deprived individuals exhibited reduced vigilant attention, as compared to well-rested controls, during test bout 2 (vigilant attention accuracy analyzed with a mixed-effects ANOVA by session, reversal, and condition: test bout by task phase by group interaction: F1,69=11.21, p=0.001). However, there was no effect on the advantage index of control (Test bout by task phase by group interaction: p=0.21). Two possible sources may contribute to this: 1) expectation-driven top-down processing, and 2) automatic response priming. If subjects used a strong, expectation-driven top-down control strategy, we would expect there to be large costs to performance on mismatched trials (as calculated by the index of cost). However, we found no effect on the cost index (Test bout by task phase by group interaction: p=0.11).

27
Figure 9: Indices (means ± SE) of vigilant attention (top panels), expectation-driven control
advantage (bottom panels, solid lines), and expectation-driven control cost (bottom panels,
dashed lines) in the first (primarily cue valid) phase and the second (primarily cue invalid) phase
of the VAC, during test bout 1 (baseline) and test bout 2 (sleep deprivation or well-rested
control) in the sleep deprivation group (red) and the control group (blue).
In the AX-CPTs and VAC, we gained converging evidence that deterioration of vigilant attention during sleep deprivation impacts decision making performance on some trial types. However, we obtained different results regarding the use of experience-based expectations. On the AX-CPTs, sleep-deprived subjects exhibited decision making patterns consistent with top-down expectation-driven processing. However, they also exhibited decreased ability to resist interference, which suggests that the use of expectation-driven processing while sleep-deprived may increase the risk of making errors when there is conflicting information. On the VAC, on the other hand, we did not observe these effects. This suggests that subjects did not employ strong expectation-
0.0
0.2
0.4
0.6
0.8
1.0
Cue valid phase Cue invalid phase
Accu
racy
0.0
0.2
0.4
0.6
0.8
1.0
Cue valid phase Cue invalid phase
Accu
racy
-0.2
-0.1
0.0
0.1
0.2
Cue valid phase Cue invalid phase
Adva
ntag
e/co
st in
dex
-0.2
-0.1
0.0
0.1
0.2
Cue valid phase Cue invalid phase
Inde
x va
lue
Test bout 1 Test bout 2
Vigi
lant
atte
ntio
nAd
vant
age
and
cost
Advantage indexCost index

28
driven processing on the VAC, as compared to the AX-CPTs. This could be due to a difference in the salience of cues or stimuli, frequency of predictive cues, or task demands. The results of a recently completed, different sleep deprivation study, in which we employed a version of the attention network test (ANT), may shed light on this issue. The ANT measures the ability to use an alerting cue to detect a stimulus (alerting effect), to use a spatial cue to shift the location of visual attention (orienting effect), and to manage response conflict (conflict effect) (Weaver et al., 2013). In this in-laboratory study with 14 healthy adult subjects (Salih et al., 2019), the task was administered twice: once during baseline, once 24 hours later after 26 hours of wakefulness, and once another 24 hours later after recovery sleep. Consistent with earlier findings (Jugovac & Cavallero, 2011; Martella et al., 2011; Whitney et al., 2017), sleep deprivation did not significantly degrade the alerting effect on the ANT. In this study, sleep deprivation also did not significantly reduce the orienting effect. However, there was marked impairment in the conflict effect during sleep deprivation (F2,26=4.74, p=0.018). Thus, sleep deprivation did not reduce subjects’ ability to detect a stimulus and shift visual attention in response to cues. However, subjects experienced considerable difficulty managing response conflict while deprived of sleep. This finding is consistent with recent evidence from our group (Whitney et al., 2017) that sleep deprivation causes profound deficits in cognitive flexibility. Taken together, these findings reveal that sleep deprivation impacts attentional control and resistance to interference to different degrees in different task paradigms. We observed poor cognitive flexibility and a strong interference effect on the AX-CPTs, whereas the VAC displayed relatively small effects of sleep deprivation. On the ANT, we found that interference from conflicting information caused marked performance impairment in sleep-deprived individuals, but this effect was not observed in earlier work from our group and others on a Sternberg working memory task (Habeck et al., 2004; Tucker et al., 2010). While the deterioration of vigilant attention due to sleep deprivation causes substantial performance deficits on a variety of tasks (Lim & Dinges, 2010;

29
Hudson et al., 2019), the consequences of sleep deprivation for cognitive flexibility and resistance of interference appear to be driven by distinct mechanisms of attentional control (Whitney et al., 2017; Whitney et al., 2019) and the extent to which individuals use expectation-driven processing during task performance. Implications for operationally more complex settings To examine the effects of sleep deprivation on task performance and the underlying cognitive processes in operationally more complex contexts, we developed the Situational Awareness of Risk Dynamics (SARD) task. In the SARD, subjects are presented with treasure chests from three different zones of an island (see Figure 10). On each trial, the subject is given the option to open the treasure chest (play) or to pass on the treasure chest. Opening a chest costs $100 of hypothetical money, but if it has treasure, a sum of $600 is awarded. If the chest has poison, $500 is lost. Through feedback, subjects must determine which zone is more advantageous to play (the “good” zone), which zone is more advantageous to avoid and should be passed (the “bad” zone), and which zone offers no advantage either way (the “neutral” zone). Partway through the task, the zones are switched unannounced and subjects must update their representations of these zones and their associated risks. The SARD consists of 5 blocks of 30 trials. In the laboratory study of the present project, the SARD was administered twice: once at baseline and once 24 hours later after 26 hours of wakefulness (n=55) or well-rested control (n=31).
Figure 10: Situational Awareness of Risk Dynamics (SARD) task. Treasure chests containing either treasure or poison appear in three different zones of an island. The three zones are

30
associated with different levels of risk: in one zone it is advantageous to “play,” in another it is advantageous to “pass,” and in the last it is equally advantageous to play or pass. The locations of these different risk levels switch partway the task.
As expected, subjects’ performance improved over blocks of trials. With practice, subjects played more from the good zone (“hits”, repeated-measures ANOVA, effect of blocks, F1,84=32.70, p<0.001) and less from the bad zone (“false alarms”, effect of blocks, F1,84=139.80, p<0.001). The unannounced switching of the zones had a significant effect on performance, with subjects showing an immediate decrease in good choices as evidenced by a decrease in hits (F1,84=53.41, p<0.001) and increase in false alarms (F1,84=92.21, p<0.001). Importantly, sleep deprivation had a significant impact on hits (group by test bout interaction, F1,84=4.94, p=0.029) and false alarms (F1,84=9.79, p=0.002). In test bout 1, the groups chose to play from the good zones and avoid the bad zones at similar rates. However, in test bout 2, sleep-deprived subjects played less often from the good zones (p<0.001) and played more often from the bad zones (p=0.003) compared to well-rested controls. See Figure 11.
Figure 11: Means (± SE) for hits (playing from the good zone) and false alarms (FAs; playing
from the bad zone) in the pre- and post-switch phases of the SARD, at baseline (test bout 1)
and after sleep deprivation or well-rested control (test bout 2), in sleep-deprived individuals (red)
and well-rested controls (blue).
0
20
40
60
80
100
Pre-switch Post-switch
Rat
e (%
)
0
20
40
60
80
100
Pre-switch Post-switch
Rat
e (%
)
Test bout 1 Test bout 2
HitsFAs
31
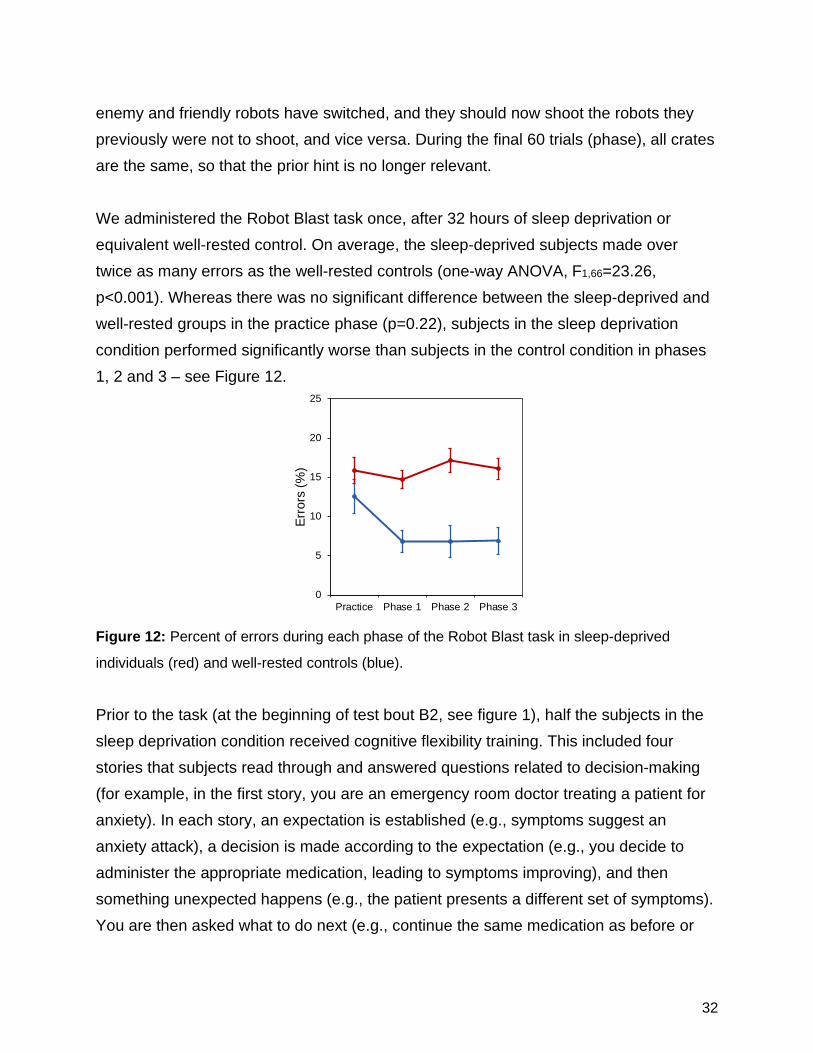
There were no significant effects of condition, test bout, or their interaction on subjects’ propensity to play the neutral zone. In both test bouts, sleep-deprived subjects and well-rested controls played the neutral zone slightly less than 50% of the time, indicating they had some awareness of the probabilities associated with the neutral zone. As such, the poorer overall task performance, both pre- and post-switch, in the sleep-deprived subjects was not attributable to a generic increase in risk-taking behavior. These findings suggest that, in operationally more complex environments, sleep-deprived subjects continue to show an impaired ability to effectively acquire and update situational awareness when risks change dynamically. To investigate the effectiveness of a potential countermeasure against such impairments, we developed a performance tasks called Robot Blast, in which subjects move through a simulated environment in which they must shoot “enemy” robots and not shoot “friendly” robot. The subject moves past a continuous row of crates. Each crate is either a tall metal crate or a short wooden crate. The subject approaches each crate, turns to face it, and the door opens to reveal either a friendly robot or an enemy robot. If an enemy robot appears and the subject does not shoot the robot within 500 ms, the robot shoots back and the subject sees feedback of losing 1 point; but if the subject shoots the enemy robot, the subject sees feedback of gaining 1 point. Similarly, if a friendly robot appears and the subject incorrectly shoots the robot, the subject loses 1 point; but if the subject withholds, the subject gains 1 point. Prior to the task, subjects are shown images of the enemy and friendly robots and given a hint (e.g., “We suspect that the enemies are hiding in tall metal crates. Use this tip to your advantage!”). They are then presented with a one-question quiz asking where the hint suggested the enemy robots would be hiding; an incorrect response results in a prompt to try again and subjects must correctly respond in order to begin the task. In the first 20 trials (practice phase), the type of crate predicts the type of robot inside 100% of the time. In the next 120 trials (phase 1), the type of crate predicts the type of robot inside 80% of the time. Then there is a reversal, and during the next 40 trials (phase 2), the type of crate incorrectly predicts the type of robot inside 80% of the time. Subsequently, subjects enter a new simulated environment and are instructed that the
32
enemy and friendly robots have switched, and they should now shoot the robots they previously were not to shoot, and vice versa. During the final 60 trials (phase), all crates are the same, so that the prior hint is no longer relevant. We administered the Robot Blast task once, after 32 hours of sleep deprivation or equivalent well-rested control. On average, the sleep-deprived subjects made over twice as many errors as the well-rested controls (one-way ANOVA, F1,66=23.26, p<0.001). Whereas there was no significant difference between the sleep-deprived and well-rested groups in the practice phase (p=0.22), subjects in the sleep deprivation condition performed significantly worse than subjects in the control condition in phases 1, 2 and 3 – see Figure 12.
Figure 12: Percent of errors during each phase of the Robot Blast task in sleep-deprived
individuals (red) and well-rested controls (blue).
Prior to the task (at the beginning of test bout B2, see figure 1), half the subjects in the sleep deprivation condition received cognitive flexibility training. This included four stories that subjects read through and answered questions related to decision-making (for example, in the first story, you are an emergency room doctor treating a patient for anxiety). In each story, an expectation is established (e.g., symptoms suggest an anxiety attack), a decision is made according to the expectation (e.g., you decide to administer the appropriate medication, leading to symptoms improving), and then something unexpected happens (e.g., the patient presents a different set of symptoms). You are then asked what to do next (e.g., continue the same medication as before or
0
5
10
15
20
25
Practice Phase 1 Phase 2 Phase 3
Erro
rs (%
)
33
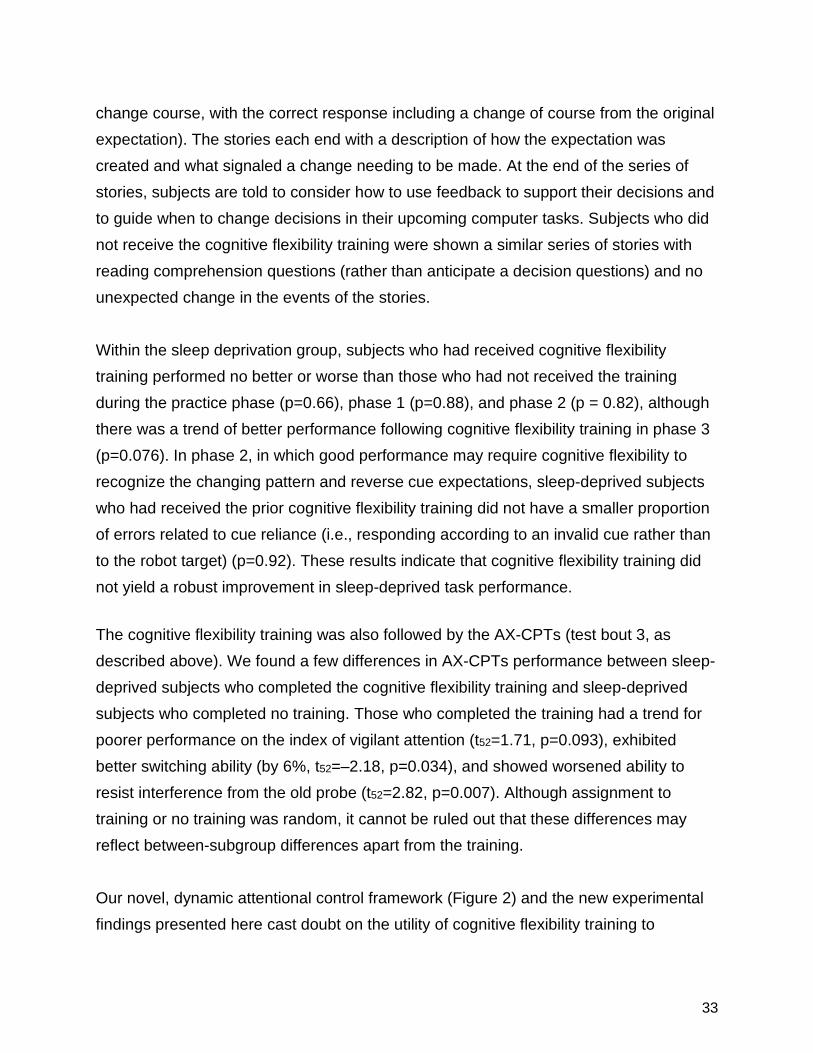
change course, with the correct response including a change of course from the original expectation). The stories each end with a description of how the expectation was created and what signaled a change needing to be made. At the end of the series of stories, subjects are told to consider how to use feedback to support their decisions and to guide when to change decisions in their upcoming computer tasks. Subjects who did not receive the cognitive flexibility training were shown a similar series of stories with reading comprehension questions (rather than anticipate a decision questions) and no unexpected change in the events of the stories. Within the sleep deprivation group, subjects who had received cognitive flexibility training performed no better or worse than those who had not received the training during the practice phase (p=0.66), phase 1 (p=0.88), and phase 2 (p = 0.82), although there was a trend of better performance following cognitive flexibility training in phase 3 (p=0.076). In phase 2, in which good performance may require cognitive flexibility to recognize the changing pattern and reverse cue expectations, sleep-deprived subjects who had received the prior cognitive flexibility training did not have a smaller proportion of errors related to cue reliance (i.e., responding according to an invalid cue rather than to the robot target) (p=0.92). These results indicate that cognitive flexibility training did not yield a robust improvement in sleep-deprived task performance.
The cognitive flexibility training was also followed by the AX-CPTs (test bout 3, as described above). We found a few differences in AX-CPTs performance between sleep-deprived subjects who completed the cognitive flexibility training and sleep-deprived subjects who completed no training. Those who completed the training had a trend for poorer performance on the index of vigilant attention (t52=1.71, p=0.093), exhibited better switching ability (by 6%, t52=–2.18, p=0.034), and showed worsened ability to resist interference from the old probe (t52=2.82, p=0.007). Although assignment to training or no training was random, it cannot be ruled out that these differences may reflect between-subgroup differences apart from the training. Our novel, dynamic attentional control framework (Figure 2) and the new experimental findings presented here cast doubt on the utility of cognitive flexibility training to
34
overcome the deficits produced by sleep deprivation in performance tasks that require acquisition and updating of situational awareness. Indeed, based on the effects of cognitive flexibility training on performance of the Robot Blast task and the AX-CPTs, there is no strong support for implementation of cognitive flexibility training as a countermeasure to the impact of sleep deprivation. What opportunities for training and professional development has the project provided? The project provided significant opportunities for graduate education and professional development: • A postdoctoral researcher in the Department of Psychology at Washington State
University, Courtney Kurinec, is developing a new line of research based in part on the present project. Her work focuses on the binding of information into memory and factors that perturb this process. The study we conducted and the cognitive tasks we embedded provided a unique opportunity to investigate a reversible perturbation (i.e., sleep deprivation) and its impact on memory and decision making.
• A Ph.D. student in the Neuroscience program at Washington State University, Darian
Lawrence-Sidebottom, was involved in dissertation research integrated with the project. This included training in the management and processing of biosamples for subject screening and (ultimately) biomarker assessment; recording and scoring of sleep (polysomnography); recording and processing of galvanic skin conductance; programming of cognitive performance tasks in E-Prime software; data reduction and statistical analysis; and writing manuscripts. The graduate student was involved in the project under the direct mentorship of the PI and Co-PIs of the project, and training and experience was gained on a daily basis and in considerable depth. During all three years of the project, the graduate student presented her work at national conferences on sleep science.

35
• A Ph.D. student in the Experimental Psychology program (with Quantitative Concentration) at Washington State University, Samantha Riedy, was involved with the project as a sleep specialist and assistant statistician. The project offered unique opportunities to study the cognitive, psychometric, and statistical characteristics of performance outcomes on the various cognitive tests. Shortly after the end of Year 1 of the project, the student earned her M.S. degree on a thesis involving a detailed study of metrics of sustained attention. During all three years of the project, the graduate student presented her work at national conferences on sleep science. She also presented at an international conference on fatigue risk management.
• A Ph.D. student in the Experimental Psychology program at Washington State
University, Amanda Hudson, was involved in this project to review the literature on sustained attention and sleep deprivation, on which she published a paper. She also received training in recording of sleep (polysomnography); recording and processing of galvanic skin conductance; programming of cognitive performance tasks in E-Prime software; and data reduction and statistical analysis. The graduate student was involved in the project under the direct mentorship of the PI and one of the co-PIs of the project, and training and experience was gained on a daily basis.
• A Ph.D. student in the Experimental Psychology program at Washington State
University, Anthony Stenson, was involved in several of the cognitive performance tests developed for and employed in this project. He received training on the programming of cognitive performance tasks in E-Prime software; data reduction and statistical analysis; cognitive model development; and manuscript writing. The graduate student was involved in the project under the direct mentorship of two Co-PIs of the project, and training and experience was gained in considerable depth.
• Five post-baccalaureate research assistants – Regan Permito, Elizabeth Lewis,
Myles Finlay, Lillian Skeiky, and Rachael Muck – were involved in the project during all stages of subject recruitment and screening and laboratory investigation and logistics. They were also each assigned a subset of the data collected in the study for independent processing and analysis under the supervision of the PI and Co-PIs.
36
This post-baccalaureate training opportunity is offered because the experience gained is widely considered of significant benefit for applications to graduate and medical school – the vast majority of postbaccalaureate trainees in our laboratory go on (after a year or two) to enroll in Ph.D. and M.D. programs across the country. So far, three of the post-baccalaureate research assistants have presented their work at national conferences.
• More than two dozen undergraduate students were involved in the project, providing
around-the-clock staffing and constant behavioral monitoring during the 24/7 laboratory experimentation of the project. Records show that the experience gained in the laboratory helps these students significantly with their applications for graduate and medical school (or other endeavors they choose to pursue).
How were the results disseminated to communities of interest? The results of the project have led to a paradigm shift in our understanding of the effects of sleep deprivation on situational awareness and decision making. This new paradigm has been presented to stakeholders in military and civilian settings at conferences and meetings across the US. In addition, several manuscripts are in development for publication in the scientific literature. The results of the project have also led to the development of a novel, brief performance test for the detection of deficits in both sustained attention and cognitive flexibility, which will be further developed as a diagnostic tool for clinically relevant cognitive impairment in sleep disorders.

37
4. IMPACT
What was the impact on other disciplines? The data we collected have resulted in the development of a novel framework for the cognitive mechanisms that underlie errors in dynamic decision making during sleep deprivation (see Figure 2). Furthermore, we developed a suite of novel performance tasks that allow us to differentiate deficits in cognitive processes underlying operationally relevant decision making. In the field of cognitive psychology, our data point to a need to shift away from the dual mechanisms of attentional control view (Braver, 2012), in which discrete modes of control are present or absent in particular task settings, and where comprise of these discrete elements accounts for differences in observed performance. As an alternative, our results indicate that the focus should be on the various cognitive control demands of tasks that will include separable effects of vigilant attention, acquisition, retention and updating of information in working memory, and resistance to interference (Whitney et al., 2019). In the field of sleep science, this work represents a paradigm shift in understanding the effects of sleep deprivation on cognitive performance and brain function (Honn et al., 2019). What was the impact on technology transfer? Nothing to Report. What was the impact on society beyond science and technology? One of the pervasive – but poorly understood – effects of sleep deprivation on society is its disastrous impact on situational awareness and decision making. Errors in decision making cannot be explained solely by the currently well-known effects of sleep loss such as attentional lapsing. Well-known examples of deterioration of decision-making capabilities include the Space Shuttle Challenger accident and the nuclear meltdown at

38
Chernobyl; other examples abound. This project revealed basic cognitive mechanisms that underlie this phenomenon, and provided a cohesive framework (Figure 2) for ongoing and future studies to help develop countermeasures and improve safety in 24/7 operational settings.

39
5. CHANGES/PROBLEMS
Changes in approach and reasons for change Nothing to Report. Actual or anticipated problems or delays and actions or plans to resolve them Nothing to Report. Changes that had a significant impact on expenditures Nothing to Report. Significant changes in use or care of human subjects, vertebrate animals, biohazards, and/or select agents Nothing to Report. Significant changes in use or care of human subjects Nothing to Report. Significant changes in use or care of vertebrate animals Nothing to Report. (Not Applicable.) Significant changes in use of biohazards and/or select agents Nothing to Report. (Not Applicable.)
40
6. PRODUCTS
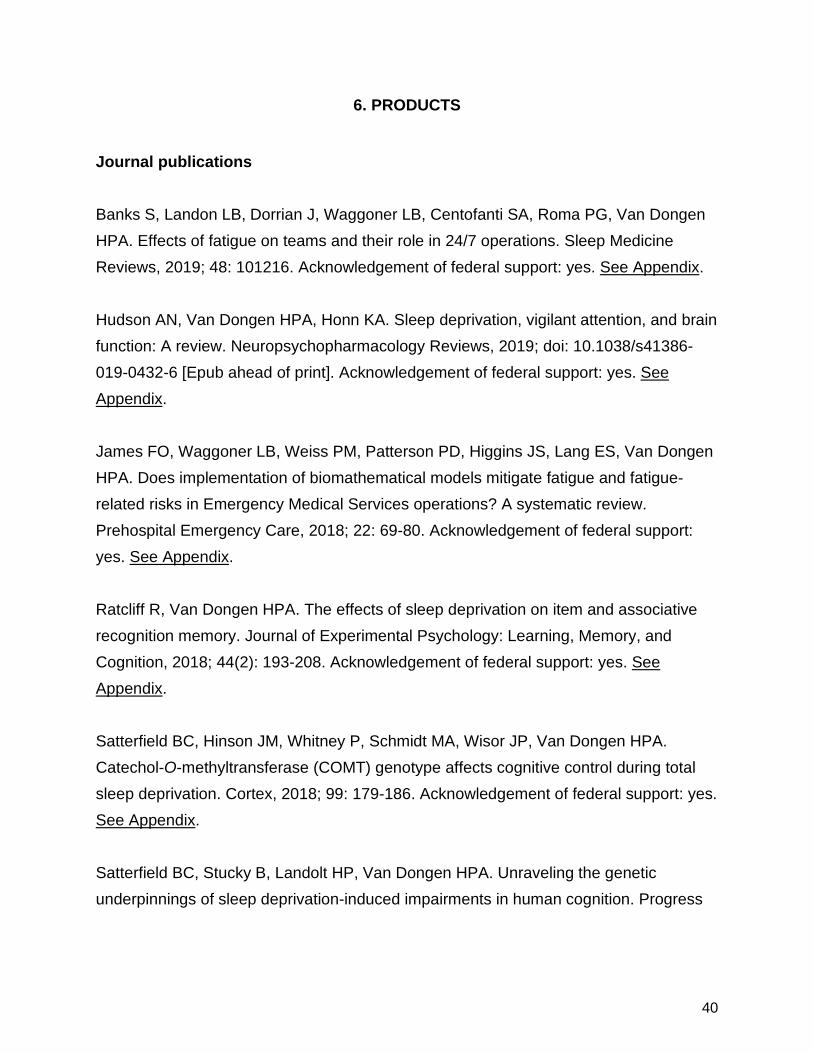
Journal publications Banks S, Landon LB, Dorrian J, Waggoner LB, Centofanti SA, Roma PG, Van Dongen HPA. Effects of fatigue on teams and their role in 24/7 operations. Sleep Medicine Reviews, 2019; 48: 101216. Acknowledgement of federal support: yes. See Appendix. Hudson AN, Van Dongen HPA, Honn KA. Sleep deprivation, vigilant attention, and brain function: A review. Neuropsychopharmacology Reviews, 2019; doi: 10.1038/s41386-019-0432-6 [Epub ahead of print]. Acknowledgement of federal support: yes. See Appendix. James FO, Waggoner LB, Weiss PM, Patterson PD, Higgins JS, Lang ES, Van Dongen HPA. Does implementation of biomathematical models mitigate fatigue and fatigue-related risks in Emergency Medical Services operations? A systematic review. Prehospital Emergency Care, 2018; 22: 69-80. Acknowledgement of federal support: yes. See Appendix. Ratcliff R, Van Dongen HPA. The effects of sleep deprivation on item and associative recognition memory. Journal of Experimental Psychology: Learning, Memory, and Cognition, 2018; 44(2): 193-208. Acknowledgement of federal support: yes. See Appendix. Satterfield BC, Hinson JM, Whitney P, Schmidt MA, Wisor JP, Van Dongen HPA. Catechol-O-methyltransferase (COMT) genotype affects cognitive control during total sleep deprivation. Cortex, 2018; 99: 179-186. Acknowledgement of federal support: yes. See Appendix. Satterfield BC, Stucky B, Landolt HP, Van Dongen HPA. Unraveling the genetic underpinnings of sleep deprivation-induced impairments in human cognition. Progress

41
in Brain Research, 2019; 246: 127-158. Acknowledgement of federal support: yes. See Appendix. Satterfield BC, Wisor JP, Schmidt MA, Van Dongen HPA. Time-on-task effect during sleep deprivation in healthy young adults is modulated by dopamine transporter genotype. Sleep, 2017; 40(12): zsx167. Acknowledgement of federal support: yes. See Appendix. Skene DJ, Skornyakov E, Chowdhury NR, Gajula RP, Middleton B, Satterfield BC, Porter KI, Van Dongen HPA, Gaddameedhi S. Separation of circadian- and behavior-driven metabolite rhythms in humans provides a window on peripheral oscillators and metabolism. Proceedings of the National Academy of Sciences, 2018; 115(3): 7825-7830. Acknowledgement of federal support: yes. See Appendix. Skornyakov E, Gaddameedhi S, Paech GM, Sparrow AR, Satterfield BC, Shattuck NL, Layton ME, Karatsoreos I, Van Dongen HPA. Cardiac autonomic activity during simulated shift work. Industrial Health, 2019; 57: 118-132. Acknowledgement of federal support: yes. See Appendix. Vanderheyden WM, Van Dongen HPA, Frank MG, Gerstner JR. Sleep pressure regulates mushroom body neural-glial interactions in Drosophila. Matters Select, 2019; 201903000008. Acknowledgement of federal support: yes. See Appendix. Walsh MM, Gunzelmann G, Van Dongen HPA. Computational cognitive modeling of the temporal dynamics of fatigue from sleep loss. Psychonomic Bulletin & Review, 2017; 24: 1785-1807. Acknowledgement of federal support: yes. See Appendix. Whitney P, Hinson JM, Nusbaum AT. A dynamic attentional control framework for understanding sleep deprivation effects on cognition. Progress in Brain Research, 2019; 246: 111-126. Acknowledgement of federal support: yes. See Appendix.
42
Books or other non-periodical, one-time publications Ph.D. dissertations: Satterfield BC. Genetic markers of inter-individual and task-dependent differences in neurobehavioral impairment during total sleep deprivation. Ph.D. dissertation, 2017, Washington State University, accepted. Acknowledgement of federal support: yes. Skornyakov S. Sleep, autonomic nervous system, and neurobehavioral outcomes. Ph.D. dissertation, 2017, Washington State University, accepted. Acknowledgement of federal support: yes. Conference abstracts: Honn KA, Van Dongen H. Paradoxical effect of stimulus density on PVT time-on-task effect during sleep deprivation. Sleep, 2018; 41 (Abstract Suppl.): A84. Acknowledgement of federal support: yes. See Appendix. Satterfield BC, Wisor JP, Schmidt MA, Van Dongen H. DAT1 genotype modulates the time-on-task effect on the PVT during total sleep deprivation. Sleep, 2017; 40 (Abstract Suppl.): A1-A2. Acknowledgement of federal support: yes. See Appendix. Sherazi NA, Riedy SM, Satterfield BC, Schmidt MA, Wisor JP, Van Dongen H. TLR4 genotype is associated with nocturnal sleep duration and consolidation. Sleep, 2018; 41 (Abstract Suppl.): A9. Acknowledgement of federal support: yes. See Appendix. Van Dongen HPA, Gaddameedhi S, Crooks E, Chowdhury NR, Gajula RP, Middleton B, Satterfield BC, Porter K, Skene DJ. Internal desynchrony of central and peripheral circadian rhythms during simulated night shift work. Sleep Science, 2019; 12 (Suppl. 3): 71. Acknowledgement of federal support: yes. See Appendix.

43
Other publications, conference papers, and presentations Invited lectures: Honn KA. Fatigue and accident risk: from momentary attentional lapses to prolonged decision-making impairments. Invited lecture at NASA Ames Research Center; Mountain View, California, June 2018. Van Dongen HPA. Cognitive deficits associated with sleep deprivation. Invited lecture at the Idaho Sleep Professionals Association conference; Boise, Idaho, October 2018. Van Dongen HPA. Impairments in cognitive performance and emotion regulation due to sleep deprivation. Invited symposium presentation at the SLEEP 2017 conference; Boston, Massachusetts, June 2017. Van Dongen HPA. Individual differences in the effects of sleep deprivation on performance: Cognitive and genetic differentiation of bottom-up and top-down brain processes. Invited lecture at the University of Helsinki; Helsinki, Finland, September 2018. Van Dongen HPA. Individual susceptibility to fatigue: impacts for the transportation industry. Invited lecture at the Fatigue in Transportation Forum; Montreal, Canada, June 2018. Van Dongen HPA. New insights into cognitive impairment due to sleep deficiency in healthy individuals and patients with sleep disorders. Invited lecture at the Woolcock Institute of Medical Research; Sydney, Australia, October 2018. Van Dongen HPA. Shift work, sleep loss, and managing fatigue risk. Invited lecture at the 2018 Northwest Safety & Health Summit; Anchorage, Alaska, May 2018.
44
Van Dongen HPA. Sleep deprivation: Effects on health, performance, and safety. Invited lecture at the 2017 Northwest Safety & Health Summit; Spokane, Washington, May 2017. Van Dongen HPA. Sleep deprivation and the impact on safety. Invited lecture at the Washington Logging Safety Conference; Grand Mound, Washington, January 2019. Oral presentations at conferences: Honn KA. More than just nodding off: the relationship between sleepiness and accidents. Oral presentation at the World Sleep 2017 conference; Prague, Czech Republic, October 2017. Honn KA. Paradoxical effect of stimulus density on PVT time-on-task effect during sleep deprivation. Oral presentation at the SLEEP 2018 conference; Baltimore, Maryland, June 2018. Lawrence-Sidebottom D. Stability of interindividual differences in top-down attentional control. Oral presentation at the Inland Northwest Research Symposium; Spokane, Washington, April 2019. Van Dongen HPA. Catechol-O-methyltransferase (COMT) genotype affects dynamic decision making during sleep deprivation. Oral presentation at the Military Health System Research Symposium; Orlando, Florida, August 2018. Van Dongen HPA. Dealing with multiple dimensions of fitness for duty in biomarker development. Oral presentation at the Sleep DownUnder 2018 conference; Brisbane, Australia, October 2018. Van Dongen HPA. Impaired cognitive flexibility due to sleep deprivation predicts degraded deadly force decision-making in high-fidelity law enforcement simulations. Oral presentation at the SLEEP 2017 conference; Boston, Massachusetts, June 2017.
45
Van Dongen HPA. Sleep deprivation and loss of situational awareness: Mechanisms and mitigation strategies. Oral presentation at the SLEEP 2019 conference; San Antonio, Texas, June 2019. Van Dongen HPA. Toward a common metric for risk assessment across diverse factors in fatigue risk management systems: Quantifying human performance in terms of signal-to-noise ratio. Oral presentation at the 10th International Conference on Managing Fatigue; San Diego, California, March 2017. Whitney P. Sleep deprivation effects on a novel form of cognitive flexibility. Oral presentation at the 60th Annual Meeting of the Psychonomic Society; Montréal, Québec, Canada, November 2019. Website(s) or other Internet site(s) Nothing to Report. Technologies or techniques Nothing to Report. Inventions, patent applications, and/or licenses Nothing to Report. Other Products

46
Nothing to Report.

47
7. PARTICIPANTS & OTHER COLLABORATING ORGANIZATIONS
What individuals have worked on the project?
Name: Hans P.A. Van Dongen, Ph.D. Project Role: PI Researcher Identifier: ORCID ID: 0000-0002-4678-2971
Contribution to Project: Dr. Van Dongen oversaw the project and coordinated all personnel activities and tasks.
Name: Kimberly A. Honn, Ph.D. Project Role: Co-PI Researcher Identifier: ORCID ID: 0000-0001-8911-6277
Contribution to Project:
Dr. Honn oversaw the laboratory experimentation and the development of the operationally relevant cognitive flexibility task.
Name: Matthew E. Layton, M.D., Ph.D. Project Role: Co-PI Researcher Identifier: ORCID ID: 0000-0002-3287-9203
Contribution to Project: Dr. Layton served as physician of record for the study and oversaw subject health and well-being.
Name: Paul Whitney, Ph.D. Project Role: Co-PI Researcher Identifier: ORCID ID: 0000-0003-1973-5261
Contribution to Project:
Dr. Whitney contributed key expertise on the measurement of cognitive flexibility and developed the cognitive flexibility training intervention.
Name: John M. Hinson, Ph.D. Project Role: Co-PI Researcher Identifier: ORCID ID: 0000-0002-5012-5974
Contribution to Project:
Dr. Hinson contributed critical expertise on decision making, led the development of performance task, and implemented skin conductance procedures.

48
Name: Devon A. Hansen, Ph.D. Project Role: Assistant Research Professor Researcher Identifier: Washington State University ID: 10064965
Contribution to Project:
Dr. Hansen helped develop study procedures, standing operating procedures, and recruitment and screening protocols.
Name: Naghmana Sherazi, M.A. Project Role: Study Coordinator Researcher Identifier: Washington State University ID: 11506109
Contribution to Project: Ms. Sherazi coordinated staffing and logistics for the study.
Name: Patricia Grossman Project Role: Nurse Practitioner Researcher Identifier: Washington State University ID: 11573115
Contribution to Project:
Ms. Grossman assisted the physician of record for the study with the oversight of subject health and well-being.
Name: Dawn DePriest Project Role: Nurse Practitioner Researcher Identifier: Washington State University ID: 11458230
Contribution to Project:
Dr. DePriest assisted the physician of record for the study with the oversight of subject health and well-being.
Name: Sue Weeks Project Role: Nurse Practitioner Researcher Identifier: Washington State University ID: 10573510
Contribution to Project:
Ms. Weeks assisted the physician of record for the study with the oversight of subject health and well-being.

49
Name: Darian Sidebottom Project Role: Ph.D. Student Researcher Identifier: Washington State University ID: 11357866
Contribution to Project:
Ms. Sidebottom programmed and processed cognitive performance tasks for the study. She also managed biosamples for screening sessions and contributed to the laboratory experimentation.
Name: Samantha Riedy, M.S., RPSGT Project Role: Ph.D. Student Researcher Identifier: Washington State University ID: 11365976
Contribution to Project:
Ms. Riedy served as the designated sleep technologist for the study, overseeing recording and scoring of sleep.
Name: Amanda Hudson, M.S. Project Role: Ph.D. Student Researcher Identifier: Washington State University ID: 11624214
Contribution to Project:
Ms. Hudson monitored subjects in the laboratory, administered performance tasks, performed physiological recordings, processed data, and published a review paper.
Name: Julie Erwin, M.S. Project Role: Research Associate Researcher Identifier: Washington State University ID: 11657249
Contribution to Project:
Ms. Erwin coordinated staffing and logistics for the study, conducted screening sessions, and performed laboratory set-up for the experiment.
Name: Mark McCauley Project Role: Research Operations Engineer Researcher Identifier: Washington State University ID: 11331753
Contribution to Project: Mr. McCauley provided technological support during laboratory experimentation.

50
Name: Regan Permito Project Role: Postbaccalaureate Research Assistant Researcher Identifier: Washington State University ID: 11498976
Contribution to Project: Ms. Permito conducted screening sessions and performed laboratory set-up for the experiment.
Name: Elizabeth Lewis Project Role: Postbaccalaureate Research Assistant Researcher Identifier: Washington State University ID: 11499707
Contribution to Project:
Ms. Lewis monitored subjects in the laboratory, administered performance tasks, and performed physiological recordings.
Name: Myles Finlay Project Role: Postbaccalaureate Research Assistant Researcher Identifier: Washington State University ID: 11546225
Contribution to Project:
Mr. Finlay conducted screening sessions, performed laboratory set-up for the experiment, and assisted with polysomnographic recordings.
Name: Lillian Skeiky Project Role: Postbaccalaureate Research Assistant Researcher Identifier: Washington State University ID: 11656455
Contribution to Project: Ms. Skeiky conducted screening sessions and performed laboratory set-up for the experiment.
Name: Rachael Muck Project Role: Postbaccalaureate Research Assistant Researcher Identifier: Washington State University ID: 11441657
Contribution to Project:
Ms. Muck conducted screening sessions and performed laboratory set-up for the experiment. She also conducted genotyping analyses.

51
Name: Michael Burrows Project Role: Research Assistant Researcher Identifier: Washington State University ID: 11651609
Contribution to Project:
Mr. Burrows monitored subjects in the laboratory, administered performance tasks, and performed physiological recordings.
Name: Roxanne Bataller Project Role: Undergraduate Research Assistant Researcher Identifier: Washington State University ID: 11474968
Contribution to Project:
Ms. Bataller monitored subjects in the laboratory, administered performance tasks, and performed physiological recordings.
Name: Katie Christanson Project Role: Undergraduate Research Assistant Researcher Identifier: Washington State University ID: 11583062
Contribution to Project:
Ms. Christanson monitored subjects in the laboratory, administered performance tasks, and performed physiological recordings.
Name: Sara Delane Project Role: Undergraduate Research Assistant Researcher Identifier: Washington State University ID: 11622588
Contribution to Project:
Ms. Delane monitored subjects in the laboratory, administered performance tasks, and performed physiological recordings.
Name: Elizabeth Dotson Project Role: Research Assistant Researcher Identifier: Washington State University ID: 11094140
Contribution to Project:
Ms. Dotson monitored subjects in the laboratory, administered performance tasks, and performed physiological recordings.

52
Name: Karly Dougherty Project Role: Undergraduate Research Assistant Researcher Identifier: Washington State University ID: 11594060
Contribution to Project:
Ms. Dougherty monitored subjects in the laboratory, administered performance tasks, and performed physiological recordings.
Name: Rebecca Dunne Project Role: Undergraduate Research Assistant Researcher Identifier: Washington State University ID: 11622585
Contribution to Project:
Ms. Dunne monitored subjects in the laboratory, administered performance tasks, and performed physiological recordings.
Name: Nicholas Ensroth Project Role: Undergraduate Research Assistant Researcher Identifier: Washington State University ID: 11594012
Contribution to Project:
Mr. Ensroth monitored subjects in the laboratory, administered performance tasks, and performed physiological recordings.
Name: Anna Franzella Project Role: Undergraduate Research Assistant Researcher Identifier: Washington State University ID: 11656937
Contribution to Project:
Ms. Franzella monitored subjects in the laboratory, administered performance tasks, and performed physiological recordings.
Name: Adelyn Glock Project Role: Undergraduate Research Assistant Researcher Identifier: Washington State University ID: 11643865
Contribution to Project:
Ms. Glock monitored subjects in the laboratory, administered performance tasks, and performed physiological recordings.

53
Name: Derrik Gratz Project Role: Undergraduate Research Assistant Researcher Identifier: Washington State University ID: 11599911
Contribution to Project:
Mr. Gratz monitored subjects in the laboratory, administered performance tasks, and performed physiological recordings.
Name: Cynthia Hernandez Project Role: Undergraduate Research Assistant Researcher Identifier: Washington State University ID: 11465731
Contribution to Project:
Ms. Hernandez monitored subjects in the laboratory, administered performance tasks, and performed physiological recordings.
Name: Anna Hubbell Project Role: Undergraduate Research Assistant Researcher Identifier: Washington State University ID: 11599385
Contribution to Project:
Ms. Hubbell monitored subjects in the laboratory, administered performance tasks, and performed physiological recordings.
Name: Amanda Kiefer Project Role: Undergraduate Research Assistant Researcher Identifier: Washington State University ID: 11698233
Contribution to Project:
Ms. Kiefer monitored subjects in the laboratory, administered performance tasks, and performed physiological recordings.
Name: Sarah Kwate Project Role: Undergraduate Research Assistant Researcher Identifier: Washington State University ID: 11459552
Contribution to Project:
Ms. Kwate monitored subjects in the laboratory, administered performance tasks, and performed physiological recordings.

54
Name: Emily Mathis Project Role: Undergraduate Research Assistant Researcher Identifier: Washington State University ID: 11698242
Contribution to Project:
Ms. Mathis monitored subjects in the laboratory, administered performance tasks, and performed physiological recordings.
Name: Madeline McDougal Project Role: Undergraduate Research Assistant Researcher Identifier: Washington State University ID: 11643204
Contribution to Project:
Ms. McDougal monitored subjects in the laboratory, administered performance tasks, and performed physiological recordings.
Name: Riley Meister Project Role: Undergraduate Research Assistant Researcher Identifier: Washington State University ID: 11600345
Contribution to Project:
Mr. Meister monitored subjects in the laboratory, administered performance tasks, and performed physiological recordings.
Name: Mari Metter Project Role: Undergraduate Research Assistant Researcher Identifier: Washington State University ID: 11509648
Contribution to Project:
Ms. Metter monitored subjects in the laboratory, administered performance tasks, and performed physiological recordings.
Name: Amelia Mills Project Role: Undergraduate Research Assistant Researcher Identifier: Washington State University ID: 11524215
Contribution to Project:
Ms. Mills monitored subjects in the laboratory, administered performance tasks, and performed physiological recordings.

55
Name: Cecilia Moeller Project Role: Undergraduate Research Assistant Researcher Identifier: Washington State University ID: 11582073
Contribution to Project:
Ms. Moeller monitored subjects in the laboratory, administered performance tasks, and performed physiological recordings.
Name: Amy Morse Project Role: Undergraduate Research Assistant Researcher Identifier: Washington State University ID: 11652577
Contribution to Project:
Ms. Morse monitored subjects in the laboratory, administered performance tasks, and performed physiological recordings.
Name: Deena Oubari Project Role: Undergraduate Research Assistant Researcher Identifier: Washington State University ID: 11698224
Contribution to Project:
Ms. Oubari monitored subjects in the laboratory, administered performance tasks, and performed physiological recordings.
Name: Dustin Parmiter Project Role: Undergraduate Research Assistant Researcher Identifier: Washington State University ID: 11698327
Contribution to Project:
Mr. Parmiter monitored subjects in the laboratory, administered performance tasks, and performed physiological recordings.
Name: Leilani Pendilla Project Role: Undergraduate Research Assistant Researcher Identifier: Washington State University ID: 11571141
Contribution to Project:
Ms. Pendilla monitored subjects in the laboratory, administered performance tasks, and performed physiological recordings.

56
Name: Mary Paterson Project Role: Undergraduate Research Assistant Researcher Identifier: Washington State University ID: 11695706
Contribution to Project:
Ms. Paterson monitored subjects in the laboratory, administered performance tasks, and performed physiological recordings.
Name: Samia Quidwai Project Role: Undergraduate Research Assistant Researcher Identifier: Washington State University ID: 11470835
Contribution to Project:
Ms. Quidwai monitored subjects in the laboratory, administered performance tasks, and performed physiological recordings.
Name: Nathaniel Rough Project Role: Research Assistant Researcher Identifier: Washington State University ID: 11621282
Contribution to Project:
Mr. Rough monitored subjects in the laboratory, administered performance tasks, and performed physiological recordings.
Name: Erika Santacruz Project Role: Undergraduate Research Assistant Researcher Identifier: Washington State University ID: 11437499
Contribution to Project:
Ms. Santacruz monitored subjects in the laboratory, administered performance tasks, and performed physiological recordings.
Name: Jonah Scott Project Role: Undergraduate Research Assistant Researcher Identifier: Washington State University ID: 11698308
Contribution to Project:
Mr. Scott monitored subjects in the laboratory, administered performance tasks, and performed physiological recordings.

57
Name: Kelli Singer Project Role: Undergraduate Research Assistant Researcher Identifier: Washington State University ID: 11584759
Contribution to Project:
Ms. Singer monitored subjects in the laboratory, administered performance tasks, and performed physiological recordings.
Name: Amanda Sursely Project Role: Undergraduate Research Assistant Researcher Identifier: Washington State University ID: 11413082
Contribution to Project:
Ms. Sursely monitored subjects in the laboratory, administered performance tasks, and performed physiological recordings.
Name: Hailey Swearingen Project Role: Undergraduate Research Assistant Researcher Identifier: Washington State University ID: 11599921
Contribution to Project:
Ms. Swearingen monitored subjects in the laboratory, administered performance tasks, and performed physiological recordings.
Name: Christopher Thomas Project Role: Undergraduate Research Assistant Researcher Identifier: Washington State University ID: 115399331
Contribution to Project:
Mr. Thomas monitored subjects in the laboratory, administered performance tasks, and performed physiological recordings.
Name: Brian T. Ward Project Role: Undergraduate Research Assistant Researcher Identifier: Washington State University ID: 11593977
Contribution to Project:
Mr. Ward monitored subjects in the laboratory, administered performance tasks, and performed physiological recordings.

58
Name: Madelaine R. Wiersma Project Role: Undergraduate Research Assistant Researcher Identifier: Washington State University ID: 11499681
Contribution to Project:
Ms. Wiersma monitored subjects in the laboratory, administered performance tasks, and performed physiological recordings.
Name: Austin Yeo Project Role: Undergraduate Research Assistant Researcher Identifier: Washington State University ID: 11643073
Contribution to Project:
Mr. Yeo monitored subjects in the laboratory, administered performance tasks, and performed physiological recordings.
Name: Katie O’Brien Project Role: Undergraduate Research Intern Researcher Identifier: Washington State University ID: 11556260
Contribution to Project:
Ms. O’Brien monitored subjects in the laboratory, administered performance tasks, and performed physiological recordings.
Name: Senada Karmaj Project Role: Undergraduate Research Intern Researcher Identifier: Washington State University ID: 11594148
Contribution to Project:
Ms. Karmaj monitored subjects in the laboratory, administered performance tasks, and performed physiological recordings.

59
Has there been a change in the active other support of the PD/PI(s) or senior/key personnel since the last reporting period? Nothing to Report. What other organizations were involved as partners? Nothing to Report.

60
8. SPECIAL REPORTING REQUIREMENTS
Nothing to Report.

61
9. REFERENCES
Armbruster DJ, Ueltzhöffer K, Basten U, Fiebach CJ. Prefrontal cortical mechanisms
underlying individual differences in cognitive flexibility and stability. Journal of Cognitive Neuroscience, 2012; 24(12): 2385-2399.
Braver TS. The variable nature of cognitive control: A dual mechanisms framework. Trends in Cognitive Science, 2012; 16(2): 106-113.
Braver TS, Paxton JL, Locke HS, Barch DM. Flexible neural mechanisms of cognitive control within human prefrontal cortex. Proceedings of the National Academy of Sciences, 2009; 106(18): 7351-7356.
Brown TI, Carr VA, LaRocque KF, Favila SE, Gordon AM, Bowles B, Bailenson JN, Wagner AD. Prospective representation of navigational goals in the human hippocampus. Science, 2016; 352(6291): 1323-1326.
Chavali VP, Riedy SM, Van Dongen HPA. Signal-to-noise ratio in PVT performance as a cognitive measure of the effect of sleep deprivation on the fidelity of information processing. Sleep, 2017; 40(3): zsx016.
Cools R, D’Esposito M. Inverted-U-shaped dopamine actions on human working memory and cognitive control. Biological Psychiatry, 2011; 69(12): e113-e125.
Fournier LR, Grant DA, Stubblefield AM, Van Dongen HPA. Action plan interrupted: Resolution of proactive interference while coordinating execution of multiple action plans during sleep deprivation. Psychological Research, 2018, doi: 10.1007/s00426-108-1054-z [Epub ahead of print].
Habeck C, Rakitin BC, Moeller J, Scarmeas N, Zarahn E, Brown T, Stern Y. An event-related fMRI study of the neurobehavioral impact of sleep deprivation on performance of a delayed-match-to-sample task. Cognitive Brain Research, 2004; 18(3): 306-321.
Honn KA, Grant DA, Hinson JM, Whitney P, Van Dongen HPA. Total sleep deprivation does not significantly degrade semantic encoding. Chronobiology International, 2018; 35(6): 746-749.
Honn KA, Hinson JM, Whitney P, Van Dongen HPA. Cognitive flexibility: A distinct element of performance impairment due to sleep deprivation. Accident Analysis and Prevention, 2019; 126: 191-197.
62
Hudson AN, Van Dongen HPA, Honn KA. Sleep deprivation, vigilant attention, and brain function: A review. Neuropsychopharmacology, 2019: doi: 10.1038/s41386-019-0432-6 [Epub ahead of print].
Jackson MJ, Van Dongen HPA. Cognitive effects of sleepiness. In Thorpy MJ, Billiard M (Eds.), Sleepiness: Causes, Consequences and Treatment. Cambridge University Press, 2011: 72-81.
Jackson ML, Gunzelmann G, Whitney P, Hinson JM, Belenky G, Rabat A, Van Dongen HPA. Deconstructing and reconstructing cognitive performance in sleep deprivation. Sleep Medicine Reviews, 2013; 17(3): 215-225.
Jimura K, Braver T. Age-related shifts in brain activity dynamics during task switching. Cerebral Cortex, 2010; 20(6): 1420-1431.
Jugovac D, Cavallero C. Twenty-four hours of total sleep deprivation selectively impairs attentional networks. Experimental Psychology, 2011; 59(3): 115-123.
Kühberger A. The influence of framing on risky decisions: A meta-analysis. Organizational Behavior and Human Decision Processes, 1998; 75(1): 23-55.
Levin I, Schneider S, Gaeth G. All frames are not created equal: A typology and critical analysis of framing effects. Organizational Behavior and Human Decision Processes, 1998; 76(2): 149-188.
Lim J, Dinges D. A meta-analysis of the impact of short-term sleep deprivation on cognitive variables. Psychological Bulletin, 2010; 136(3): 375-389.
Mack V, Koros E, Schuler M, Stierstorfer B, Jaeger S, Tautermann C, Arban R, Lamla T. Elevated GPR85 expression in rat hippocampus impairs spatial short-term memory by an unknown molecular mechanism. Schizophrenia Bulletin, 2017; 43: S148-S148.
Martella D, Casagrande M, Lupianez J. Alerting, orienting and executive control: The effects of sleep deprivation on attentional networks. Experimental Brain Research, 2011; 210(1): 81-89.
Ratcliff R, Van Dongen HPA. Sleep deprivation affects multiple distinct cognitive processes. Psychonomic Bulletin & Review, 2009; 16(4): 742-751.
Ratcliff R, Van Dongen HPA. The effects of sleep deprivation on item and associative recognition memory. Journal of Experimental Psychology, 2018; 44(2): 193-208.

63
Salih R, Stenson A, Sidebottom D, Hinson J, Whitney P, Van Dongen H, Hansen D. Acute total sleep deprivation impairs the ability to manage response conflict. Sleep, 2019; 42: A87-A88.
Satterfield BC, Hinson JM, Whitney P, Schmidt MA, Wisor JP, Van Dongen HPA. Catechol-O-methyltransferase (COMT) genotype affects cognitive control during total sleep deprivation. Cortex, 2018; 99: 179-186.
Satterfield BC & Van Dongen HPA. Occupational fatigue, underlying sleep and circadian mechanisms, and approaches to fatigue risk management. Fatigue: Biomedicine, Health & Behavior, 2013; 1(3): 118-136.
Satterfield BC, Wisor JP, Field SA, Schmidt MA, Van Dongen HPA. TNFα G308A polymorphism is associated with resilience to sleep deprivation-induced psychomotor vigilance performance impairment in healthy young adults. Brain, Behavior, and Immunity, 2015; 66-74.
Tucker AM, Whitney P, Belenky G, Hinson JM, Van Dongen HPA. Effects of sleep deprivation on dissociated components of executive functioning. Sleep, 2010; 33(1): 47-57.
Tversky A, Kahneman D. The framing of decisions and the psychology of choice. Science, 1981; 211(4481): 453-458.
Weaver B, Bédard M, McAuliffe J. Evaluation of a 10-minute version of the Attention Network Test. Clinical Neuropsychology, 2013; 27: 1281-1299.
Whitney P, Hinson J. Measurement of cognition in studies of sleep deprivation. Progress in Brain Research, 2010; 185: 37-48.
Whitney P, Hinson JM, Jackson ML, Van Dongen HPA. Feedback blunting: Total sleep deprivation impairs decision making that requires updating based on feedback. Sleep, 2015; 38(5): 745-754.
Whitney P, Hinson JM, Nusbaum AT. A dynamic attentional control framework for understanding sleep deprivation effects on cognition. Progress in Brain Research, 2019; 246: 111-126.
Whitney P, Hinson JM, Satterfield BM, Grant DA, Honn KA, Van Dongen HPA. Sleep deprivation diminishes attentional control effectiveness and impairs flexible adaptation to changing conditions. Scientific Reports, 2017; 7(1): 16020.

64
Wilson CG, Nusbaum AT, Whitney P, Hinson JM. Age-differences in cognitive flexibility when overcoming a preexisting bias through feedback. Journal of Clinical and Experimental Neuropsychology, 2018a; 40(6): 586-594.
Wilson CG, Nusbaum AT, Whitney P, Hinson JM. Trait anxiety impairs cognitive flexibility when overcoming a task acquired response and a preexisting bias. PLoS One, 2018b; 13: e0204694.

65
10. APPENDICES
Conference abstract: Honn KA, Van Dongen H. Paradoxical effect of stimulus density on PVT time-on-task effect during sleep deprivation. Sleep 41 (Abstract Suppl.): A84.
66
Conference abstract: Satterfield BC, Wisor JP, Schmidt MA, Van Dongen H. DAT1 genotype modulates the time-on-task effect on the PVT during total sleep deprivation. Sleep 40 (Abstract Suppl.): A1-A2.
67
Conference abstract: Sherazi NA, Riedy SM, Satterfield BC, Schmidt MA, Wisor JP, Van Dongen H. TLR4 genotype is associated with nocturnal sleep duration and consolidation. Sleep 41 (Abstract Suppl.): A9.

68
Conference abstract: Van Dongen HPA, Gaddameedhi S, Crooks E, Chowdhury NR, Gajula RP, Middleton B, Satterfield BC, Porter K, Skene DJ. Internal desynchrony of central and peripheral circadian rhythms during simulated night shift work. Sleep Science, 2019; 12 (Suppl. 3): 71.
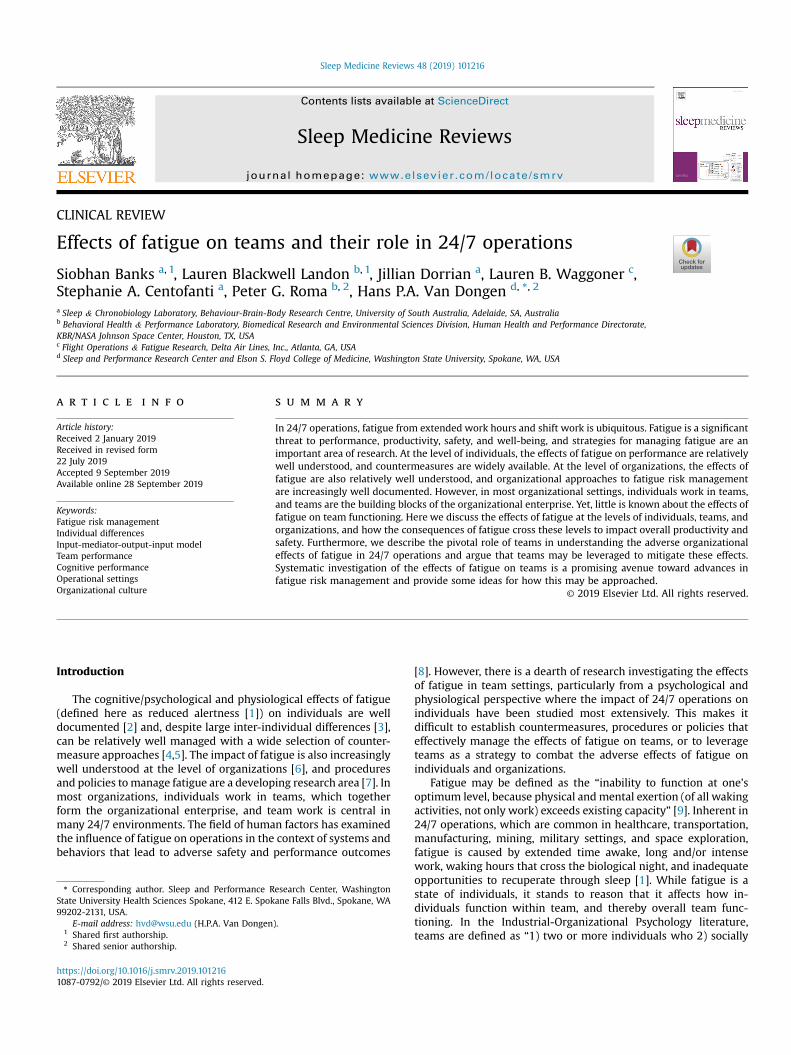
lable at ScienceDirect
Sleep Medicine Reviews 48 (2019) 101216
Contents lists avai
Sleep Medicine Reviews
journal homepage: www.elsevier .com/locate /smrv
CLINICAL REVIEW
Effects of fatigue on teams and their role in 24/7 operations
Siobhan Banks a, 1, Lauren Blackwell Landon b, 1, Jillian Dorrian a, Lauren B. Waggoner c,Stephanie A. Centofanti a, Peter G. Roma b, 2, Hans P.A. Van Dongen d, *, 2
a Sleep & Chronobiology Laboratory, Behaviour-Brain-Body Research Centre, University of South Australia, Adelaide, SA, Australiab Behavioral Health & Performance Laboratory, Biomedical Research and Environmental Sciences Division, Human Health and Performance Directorate,KBR/NASA Johnson Space Center, Houston, TX, USAc Flight Operations & Fatigue Research, Delta Air Lines, Inc., Atlanta, GA, USAd Sleep and Performance Research Center and Elson S. Floyd College of Medicine, Washington State University, Spokane, WA, USA
a r t i c l e i n f o
Article history:Received 2 January 2019Received in revised form22 July 2019Accepted 9 September 2019Available online 28 September 2019
Keywords:Fatigue risk managementIndividual differencesInput-mediator-output-input modelTeam performanceCognitive performanceOperational settingsOrganizational culture
* Corresponding author. Sleep and Performance RState University Health Sciences Spokane, 412 E. Spok99202-2131, USA.
E-mail address: [email protected] (H.P.A. Van Dongen1 Shared first authorship.2 Shared senior authorship.
https://doi.org/10.1016/j.smrv.2019.1012161087-0792/© 2019 Elsevier Ltd. All rights reserved.
s u m m a r y
In 24/7 operations, fatigue from extended work hours and shift work is ubiquitous. Fatigue is a significantthreat to performance, productivity, safety, and well-being, and strategies for managing fatigue are animportant area of research. At the level of individuals, the effects of fatigue on performance are relativelywell understood, and countermeasures are widely available. At the level of organizations, the effects offatigue are also relatively well understood, and organizational approaches to fatigue risk managementare increasingly well documented. However, in most organizational settings, individuals work in teams,and teams are the building blocks of the organizational enterprise. Yet, little is known about the effects offatigue on team functioning. Here we discuss the effects of fatigue at the levels of individuals, teams, andorganizations, and how the consequences of fatigue cross these levels to impact overall productivity andsafety. Furthermore, we describe the pivotal role of teams in understanding the adverse organizationaleffects of fatigue in 24/7 operations and argue that teams may be leveraged to mitigate these effects.Systematic investigation of the effects of fatigue on teams is a promising avenue toward advances infatigue risk management and provide some ideas for how this may be approached.
© 2019 Elsevier Ltd. All rights reserved.
Introduction
The cognitive/psychological and physiological effects of fatigue(defined here as reduced alertness [1]) on individuals are welldocumented [2] and, despite large inter-individual differences [3],can be relatively well managed with a wide selection of counter-measure approaches [4,5]. The impact of fatigue is also increasinglywell understood at the level of organizations [6], and proceduresand policies to manage fatigue are a developing research area [7]. Inmost organizations, individuals work in teams, which togetherform the organizational enterprise, and team work is central inmany 24/7 environments. The field of human factors has examinedthe influence of fatigue on operations in the context of systems andbehaviors that lead to adverse safety and performance outcomes
esearch Center, Washingtonane Falls Blvd., Spokane, WA
).
[8]. However, there is a dearth of research investigating the effectsof fatigue in team settings, particularly from a psychological andphysiological perspective where the impact of 24/7 operations onindividuals have been studied most extensively. This makes itdifficult to establish countermeasures, procedures or policies thateffectively manage the effects of fatigue on teams, or to leverageteams as a strategy to combat the adverse effects of fatigue onindividuals and organizations.
Fatigue may be defined as the “inability to function at one'soptimum level, because physical and mental exertion (of all wakingactivities, not only work) exceeds existing capacity” [9]. Inherent in24/7 operations, which are common in healthcare, transportation,manufacturing, mining, military settings, and space exploration,fatigue is caused by extended time awake, long and/or intensework, waking hours that cross the biological night, and inadequateopportunities to recuperate through sleep [1]. While fatigue is astate of individuals, it stands to reason that it affects how in-dividuals function within team, and thereby overall team func-tioning. In the Industrial-Organizational Psychology literature,teams are defined as “1) two or more individuals who 2) socially

S. Banks et al. / Sleep Medicine Reviews 48 (2019) 1012162
interact; 3) possess common goals; 4) are brought together toperform organizationally relevant tasks; 5) exhibit in-terdependencies with respect to workflow, goals, and outcomes; 6)have different roles and responsibilities; and 7) are togetherembedded in an encompassing organizational system, withboundaries and linkages to the broader system context, and taskenvironment” [10]. This literature also provides us with frame-works through which the impact of fatigue on teams and teamdynamics can be systematically studied.
The primary goals of this paper are to highlight the relevance ofteams in fatigue-susceptible, 24/7 operations, to describe theknowledge gaps in how fatigue affects teams, and to highlight theopportunity presented by operationally relevant integration of fa-tigue and team research. We step through what is known, andunknown, about the effects of fatigue at the individual, team, andorganizational levels. We then draw this knowledge together inorder to provide structure and clarity to this interdisciplinary issueand outline avenues for further research.
Fatigue at the level of the individual
Impact of fatigue on individual performance
Individuals bring to the workplace a collection of knowledge,skills, and abilities on which they build to perform work tasks.These attributes are often assumed to constitute a stable founda-tion for individuals' contributions to the organizational mission.However, fatigue can have a dramatic impact on an individual'scapacity to wield his/her knowledge, skills, and abilities effectively.In fact, fatigue appears to degrade task performance across a widerange of neurobehavioral functions [2], which can be grouped intothree domains that are seen as key to the investigation of teamperformance (see next section): affect, cognition, and behavior.
Fatigue-related deficits in the domain of affect include reducedempathy, degraded ability to read facial expressions, emotionalinstability and amplified emotional responsiveness, impaired self-regulation, reduced positive affect and/or increased negativeaffect, reduced alertness, poor morale, and loss of motivation.Fatigue-related deficits in the domain of cognition include cogni-tive slowing, attentional failures, difficulties in memory recall, poordecision making, loss of situational awareness, reduced creativity,errors in task performance, and increased risk of accidents. Fatigue-related deficits in the domain of behavior include (physical) inac-tivity, perseveration (i.e., inflexible repetition of actions that are nolonger responsive to the situation), poorly calibrated risk taking(overly risk seeking or overly risk averse), overreacting to provo-cations, distractibility, degraded quantity and quality of commu-nication, and increased probability of falling asleep unintentionally.These and many additional effects have been extensively docu-mented and discussed in the literature, and there are multiple re-views of the topic (e.g., [2,11e13]).
The effects of fatigue on neurobehavioral performance arerelatively well understood, but people do not all suffer the exactsame neurobehavioral consequences of fatigue. For one, there isconsiderable variability among persons in the magnitude of per-formance impairment due to fatigue [14]. This variability consti-tutes a trait [3,15], which does not appear to be predicted by otherindividual differences such as gender, intelligence, or personality,although genetic background may be modestly predictive [16].Counterintuitively, whereas aging reduces tolerance to working in24/7 operations overall [17], older age has been found to bemoderately protective of performance impairment due to fatigue[18].
While it would seem reasonable to assume that individuals withhigh vulnerability to fatigue may self-select out of fatigue-inducing
work conditions, this does not appear to be the case, even amonghighly select work forces such as jet fighter pilots [14]. Reasons forthis may include domestic, educational, financial, social and/orlifestyle drivers of job and workplace selection, or the presence ofpunitive work policies that discourage workers from reporting fa-tigue. Another reasonmay be that there is considerable discrepancybetween individuals' subjective estimates of fatigue or sleepinessand their objectively assessed level of neurobehavioral perfor-mance impairment [19]. Thus, workers may not be able to recog-nize their vulnerability and may think that they are functioningwell despite being fatigued.
Another individual characteristic that determines the impact offatigue, albeit indirectly, is morningness/eveningness or “chro-notype” [20]. That is, some individuals prefer to get up early in themorning and go to bed early in the evening (i.e., morning-types),and some prefer to get up and go to bed later (i.e., evening-types)e a characteristic that is driven by individual differences in thetiming of the biological clock [21]. As misalignment between sleep/wake and work schedules on the one hand, and the timing of thebiological clock on the other hand, is a major driver of fatigue, itfollows that different shift work schedules may have differentfatiguing effects for morning-types as compared to evening-types[22]. Conversely, aligning work schedules with the timing of thebiological clock improves sleep [23] and, by extension, may help tomitigate fatigue and associated performance deficits.
Task framework and operational context
Importantly, the level of vulnerability to fatigue that each indi-vidual brings to the workplace depends on the task at hand [14]. Adistinction can be made between tasks that predominantly 1)involve bottom-up processing of information generated by the taskenvironment, as is the case in tasks that require continuousmonitoring of systems and acutely detecting anomalies; versus 2)engage top-down attentional control to stay focused and facilitatedecision making. Job tasks that depend substantially on bottom-upprocessing of inflowing information are common in operationalsettings with a high degree of automation. Laboratory analogs ofthese kinds of tasks have been studied extensively in the context offatigue [24,25]. Chief among them is the psychomotor vigilance test(PVT), which has revealed that natural variability in cognitiveprocessing speed is much increased under conditions of fatiguefrom sleep loss and/or circadian misalignment [26]. This perfor-mance “instability,”which is commonly described as an increase in“lapses of attention,” has been theorized to be caused by transientunresponsiveness of neuronal networks due to excessive prior use[27]. It has been hypothesized that the extent to which an indi-vidual is susceptible to this phenomenon depends on the capacity(or level of redundancy) in the neuronal networks underlyingcognitive processing in the task at hand [28].
The transient unresponsiveness of neuronal networks associ-ated with fatigue leads to brief disruptions in task performance, ofwhich the moment-to-moment timing during a task is unpredict-able [26]. Reason's “Swiss Cheese Model” of accident causationposits that errors and accidents happenwhenmultiple potentiatingfactors come together in space and time [8]. Lapses of attention dueto fatigue represent one such factor, but due to their unpredictabletiming they rarely coincide with other factors, which implies a falsesense of resilience and safety. Yet, because lapses of attention mayoccur at any moment, a fatigue-related accident can happen anytime regardless of past performance and safety. This is particularlyproblematic in operational settings that rely heavily on reliablesystems monitoring [1] and leads to rare but catastrophic accidentsin safety-sensitive settings (e.g., the Chernobyl reactor meltdownand the Space Shuttle Challenger launch accident) [29].
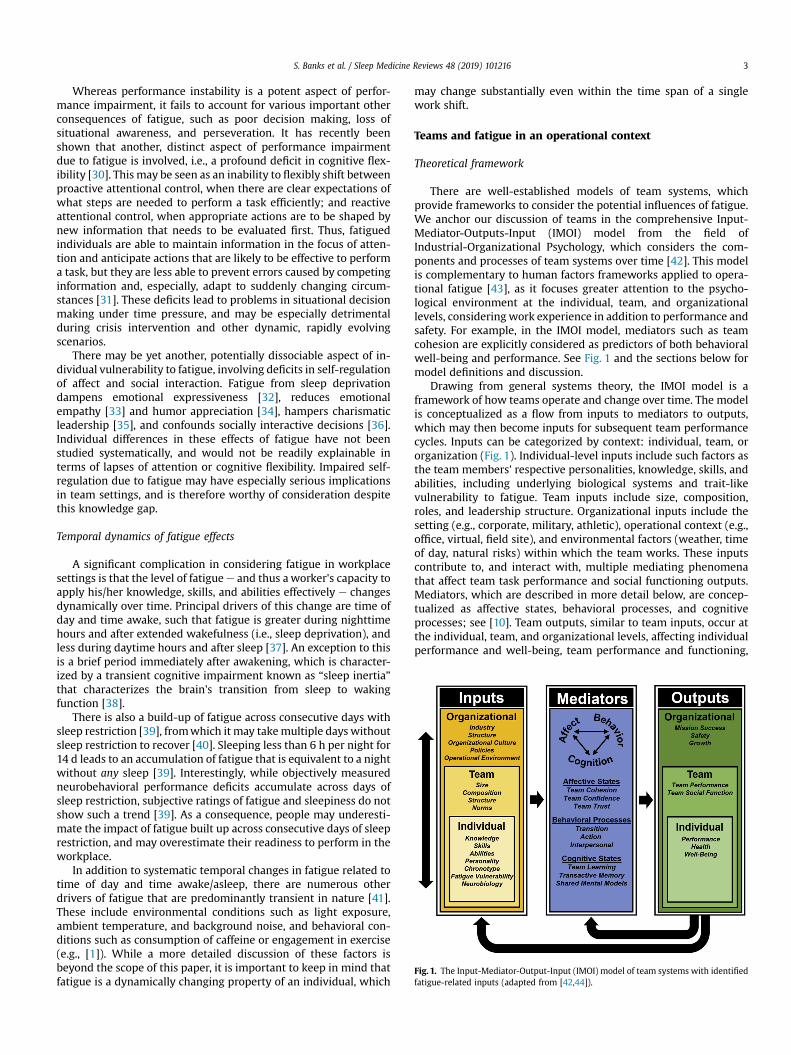
Fig. 1. The Input-Mediator-Output-Input (IMOI) model of team systems with identifiedfatigue-related inputs (adapted from [42,44]).
S. Banks et al. / Sleep Medicine Reviews 48 (2019) 101216 3
Whereas performance instability is a potent aspect of perfor-mance impairment, it fails to account for various important otherconsequences of fatigue, such as poor decision making, loss ofsituational awareness, and perseveration. It has recently beenshown that another, distinct aspect of performance impairmentdue to fatigue is involved, i.e., a profound deficit in cognitive flex-ibility [30]. This may be seen as an inability to flexibly shift betweenproactive attentional control, when there are clear expectations ofwhat steps are needed to perform a task efficiently; and reactiveattentional control, when appropriate actions are to be shaped bynew information that needs to be evaluated first. Thus, fatiguedindividuals are able to maintain information in the focus of atten-tion and anticipate actions that are likely to be effective to performa task, but they are less able to prevent errors caused by competinginformation and, especially, adapt to suddenly changing circum-stances [31]. These deficits lead to problems in situational decisionmaking under time pressure, and may be especially detrimentalduring crisis intervention and other dynamic, rapidly evolvingscenarios.
There may be yet another, potentially dissociable aspect of in-dividual vulnerability to fatigue, involving deficits in self-regulationof affect and social interaction. Fatigue from sleep deprivationdampens emotional expressiveness [32], reduces emotionalempathy [33] and humor appreciation [34], hampers charismaticleadership [35], and confounds socially interactive decisions [36].Individual differences in these effects of fatigue have not beenstudied systematically, and would not be readily explainable interms of lapses of attention or cognitive flexibility. Impaired self-regulation due to fatigue may have especially serious implicationsin team settings, and is therefore worthy of consideration despitethis knowledge gap.
Temporal dynamics of fatigue effects
A significant complication in considering fatigue in workplacesettings is that the level of fatiguee and thus aworker's capacity toapply his/her knowledge, skills, and abilities effectively e changesdynamically over time. Principal drivers of this change are time ofday and time awake, such that fatigue is greater during nighttimehours and after extended wakefulness (i.e., sleep deprivation), andless during daytime hours and after sleep [37]. An exception to thisis a brief period immediately after awakening, which is character-ized by a transient cognitive impairment known as “sleep inertia”that characterizes the brain's transition from sleep to wakingfunction [38].
There is also a build-up of fatigue across consecutive days withsleep restriction [39], fromwhich it may takemultiple days withoutsleep restriction to recover [40]. Sleeping less than 6 h per night for14 d leads to an accumulation of fatigue that is equivalent to a nightwithout any sleep [39]. Interestingly, while objectively measuredneurobehavioral performance deficits accumulate across days ofsleep restriction, subjective ratings of fatigue and sleepiness do notshow such a trend [39]. As a consequence, people may underesti-mate the impact of fatigue built up across consecutive days of sleeprestriction, and may overestimate their readiness to perform in theworkplace.
In addition to systematic temporal changes in fatigue related totime of day and time awake/asleep, there are numerous otherdrivers of fatigue that are predominantly transient in nature [41].These include environmental conditions such as light exposure,ambient temperature, and background noise, and behavioral con-ditions such as consumption of caffeine or engagement in exercise(e.g., [1]). While a more detailed discussion of these factors isbeyond the scope of this paper, it is important to keep in mind thatfatigue is a dynamically changing property of an individual, which
may change substantially even within the time span of a singlework shift.
Teams and fatigue in an operational context
Theoretical framework
There are well-established models of team systems, whichprovide frameworks to consider the potential influences of fatigue.We anchor our discussion of teams in the comprehensive Input-Mediator-Outputs-Input (IMOI) model from the field ofIndustrial-Organizational Psychology, which considers the com-ponents and processes of team systems over time [42]. This modelis complementary to human factors frameworks applied to opera-tional fatigue [43], as it focuses greater attention to the psycho-logical environment at the individual, team, and organizationallevels, considering work experience in addition to performance andsafety. For example, in the IMOI model, mediators such as teamcohesion are explicitly considered as predictors of both behavioralwell-being and performance. See Fig. 1 and the sections below formodel definitions and discussion.
Drawing from general systems theory, the IMOI model is aframework of how teams operate and change over time. The modelis conceptualized as a flow from inputs to mediators to outputs,which may then become inputs for subsequent team performancecycles. Inputs can be categorized by context: individual, team, ororganization (Fig. 1). Individual-level inputs include such factors asthe team members' respective personalities, knowledge, skills, andabilities, including underlying biological systems and trait-likevulnerability to fatigue. Team inputs include size, composition,roles, and leadership structure. Organizational inputs include thesetting (e.g., corporate, military, athletic), operational context (e.g.,office, virtual, field site), and environmental factors (weather, timeof day, natural risks) within which the team works. These inputscontribute to, and interact with, multiple mediating phenomenathat affect team task performance and social functioning outputs.Mediators, which are described in more detail below, are concep-tualized as affective states, behavioral processes, and cognitiveprocesses; see [10]. Team outputs, similar to team inputs, occur atthe individual, team, and organizational levels, affecting individualperformance and well-being, team performance and functioning,
S. Banks et al. / Sleep Medicine Reviews 48 (2019) 1012164
andmission success and safety, respectively. As amission continuesover time, a team repeats these IMOI cycles, with the outcome ofeach episode feeding back to shape the team's mediating processesand states while becoming a contextual input for the next teamperformance episode.
Potential impacts of fatigue on teams
It is assumed that the effects of fatigue on the team originatewith an individual. Within the IMOI model, fatigue can be seen asan input variable that may influence mediators which contribute tothe team's outputs. For simplicity in this discussion, fatigue will beconsidered in the context of established teams operating at a steadystate of task performance capacity and social functioning. In sodoing, it is assumed that the team possesses the necessaryknowledge, skills, and abilities to be effective; is cohesive, confi-dent, and trusting of each other; has established norms and sharedunderstanding related to executing tasks and interacting with eachother; and has performed effectively in previous task cycles. Later,how fatigue might affect teams at different points in their lifecyclewill also be considered.
Team inputs
Within the IMOI framework, fatigue can impact the team at boththe individual input and team input levels. At the individual inputlevel, a team member's compromised ability to develop, retain, orapply the knowledge, skills, and abilities required for effectiveperformance could adversely affect team processes and outputs.For example, fatigued individuals' reduced propensity to commu-nicate contributes to errors in team-based operations [45].
At the team input level, the inclusion or introduction of afatigued individual may change the team composition. If one ormore team members experience a significant reduction in neuro-behavioral capacity due to fatigue, then the team size is effectivelyreduced, which reduces the available pool of knowledge, skills, andabilities needed to complete the tasks as designed for the team asoriginally sized. A redistribution of effort and/or increased work-load across the remaining team members may be less detrimentalin relatively large and/or less interdependent teams, but couldcritically compromise performance in demanding, time-pressured,safety-critical, and interdependent tasks in small, high-performingteams, for example in emergency response to an onboard fire in asubmarine or space vehicle. For less time-pressured tasks, the teammay show resilience to critical failure from degraded performanceof a fatigued team member by slowing down, but this may createdelays. Chronic fatigue in one or more team members may reduceschedule flexibility over time, as the team continues to be func-tionally understaffed, potentially resulting in failure to completesome mission tasks and longer-term goals.
Fatigue may also have functional effects on team structure,specifically role assignments and leadership positions. If a team,especially a small, high-performing team, has clearly delineatedroles and expertise with limited redundancy, then the diminishedcapacity or functional loss of a team member due to fatigue couldbe devastating. Effective leadership and structured roles supportperformance of team processes and team cohesion [46], and afatigued leader may partially or totally abdicate the leadershipposition (e.g., [47]) as fatigue negatively affects self-regulation,motivation, communication, and other characteristics needed foreffective leadership. Studies of fatigued leaders have revealed thatthey are more impatient, irritable, and hostile, with these negativeattributes persisting over time [48]. These personal characteristicsthen impact the rest of the team, reducing trust, motivation, andultimately performance. Notably, individuals' awareness of the
untoward effects of their fatigue on others is limited [48]. Acompromised leader who fully asserts authority under diminishedcapacity for judgment and decision-making without recognizinghis/her impairment and without any countermeasures or safe-guarding procedures in place is a risk factor for organizationalerrors and accidents.
Team mediators (processes and states)
Team mediators fall into three categories: affective states,cognitive states, and behavioral processes ([44]; Fig. 1). Each cate-gory includes multiple subcomponents (see below) [49]. The af-fective and cognitive mediators are considered “emergent states,”that is, they are inherently team/social phenomena that developthrough dynamic interactions among the team members and tendto stabilize over time [10,42]. Behavioral processes within the teamsystem are also inherently team/social-based, but involve overtlyobservable actions (e.g., conflict management) that can contributeto team performance outputs in their own right and also serve asobjective indicators of emergent affective and cognitive states. Themediator phase in the IMOI model is where the negative effects ofindividuals' fatigue are expressed and ultimately shape team per-formance and functioning.
Affective states
In the team context, “affective states” is a broad term encom-passing bonding to the team and its task; confidence in teammembers' knowledge, skills, and abilities; and emotional processesand reactions [10]. Teams in 24/7 operational contexts such asmilitary, spaceflight, transportation, and mining often live andwork together over extended periods, increasing the influence ofaffective factors since team members must often act as coworkers,roommates, friends, and social support [50]. Many studies havefound that team cohesion, which can be broken down into taskcohesion (i.e., working well together, shared goal commitment) andsocial cohesion (i.e., living well together, shared attachment andliking) [51,52], is positively related to team performance (e.g.,[53,54]). Similarly, team confidence is composed of team efficacy(i.e., shared belief in capability to perform a task) and team potency(i.e., shared belief in a teams' general capability to achieve missionsuccess; [44]). Finally, team trust and team psychological safetyallow team members to be vulnerable, open, and challenge eachother, and these factors are also positively related to team perfor-mance [55].
It is unknown exactly how fatigue may impact these emergentaffective states of a team at any point in its lifecycle. However, it isnot difficult to imagine their formation, maintenance, or repair maysuffer when influenced by a fatigued team member's emotionalinstability, inattention, poor self-regulation, or outsized emotionalresponses. If fatigue exerts added pressure to an already stressedsystem, then it may cause a team to reach dysfunctional levels ofreduced team cohesion more easily [56]. Notably, the cohesion andperformance relationship strengthens over time [53,54]; thus, afatigue disruption may cause a downward spiral as mediator andoutput interact over time.
The limited literature on team affect and fatigue has focusedprimarily on behavioral indicators of cohesion and trust, such asdecreased team effectiveness over time as seen in fewer leadershipmessages andmore puerile communication in one laboratory studyof simulated US Navy watch teams restricted to 6.5 h of sleep forfour days [57]. In studies using anonymous partners, participantswere less likely to place trust in the anonymous partner [36] andmore likely to engage in socially influenced deception [58] aftertotal sleep deprivation. However, fatigue studies have not directly

S. Banks et al. / Sleep Medicine Reviews 48 (2019) 101216 5
assessed team affective states at the subjective level by using sur-veys explicitly asking whether an individual or team believes theteam is cohesive, has confidence, or is trustworthy. Using obser-vational ratings of behaviors, “big data” analyses of communica-tions, physiological indicators, or monitoring physical movementsand interactions, may all be used to provide convergent measuresof these affective states in addition to subjective measures [59], butthis has received very little attention in the literature examiningteam functioning under fatigue.
Cognitive states
Team cognitive states may also suffer from individuals' fatigue-related cognitive decrements. As operational teams perform tasksand may even live together, they must problem-solve in both theprofessional and social arenas. Shared understanding (i.e., a sharedmental model) of the team's goals, processes, and norms, andshared situational awareness, support team performance [60].Other team cognition that supports performance and team func-tioning (e.g., cohesion) includes transactive memory systems (i.e.,knowing who on the team knows what and leveraging the collec-tive team memory) and team learning (i.e., reflecting on past per-formance to adapt and improve; [44]). As fatigue may cause loss ofsituational awareness [31] and decreases the cognitive processingof information [61], team members' shared understanding maybegin to disintegrate, while the collective memory of the team'sexpertise and lessons learned from past performance episodes mayerode or become less accessible. We are not aware of any empiricalresearch systematically examining these complex team cognitivestates under conditions of fatigue.
Behavioral processes
Behavioral processes are influenced by team affective andcognitive states, each team members' individual knowledge, skills,and abilities, and fatigue. Fatigue may cause a team to lose effi-ciency and effectiveness in executing team behavioral processesdue to individual impairments in attention, motivation, workingmemory, processing speed, risk taking, and/or cognitive flexibility.During a team task, teams progress through a series of behavioraltransition and action processes, with interpersonal processes as anever-present third dynamic [42]. Foundational team-oriented be-haviors such as communication are woven throughout these pro-cesses. For example, a study of US Army teams during a 36-hartillery fire operation simulation found that after 24 h, teamsstopped communication upon receipt of relevant info, and perfor-mance was decremented accordingly [62].
Behavioral transition processes include mission analysisformulation and planning, goal specification, and strategy forma-tion, while behavioral action processes include monitoring prog-ress toward goals, systems monitoring, team monitoring andbackup/supporting behavior, and general coordination. For behav-ioral transition processes, fatigue may impair judgment anddecision-making and cognitive flexibility, thereby negativelyimpacting the team as the members synthesize and prioritize in-formation. In high-consequence, dynamic environments thatchange rapidly over time, impairments in re-planning and strate-gizing based on new informationmay have serious safety outcomes[63]. One study of professional football and basketball teams foundthat travel stressors (e.g., eastward travel, distance traveled, fre-quency of travel, back-to-back travel) resulted in more risk-takingand poor judgment and decision-making as evidenced by ahigher number of team-level penalties [64]. This study also found apartial mediating effect of team concentration and an overallnegative effect of travel stressors on team performance (i.e.,
difference in score, difference in performance during the game).However, the team may be able to overcome individual-level fa-tigue effects on behavioral processes. For example, in a laboratorystudy of team decision-making, errors and processing timeincreased at the individual level but these effects were attenuatedby team membership [65].
Behavioral action processes follow behavioral transition pro-cesses, such that the team begins to implement identified plans andstrategies to reach agreed-upon goals. Behavioral action processesrequire considerable attentional resources as team membersmonitor progress, systems, and each other. In a well-orchestratedteam, members maintain situational awareness and a shared un-derstanding, which allow them to efficiently and effectively coor-dinate actions in the proper sequence. Once fatigue disrupts thisprocess, errors in coordination and backup behavior may occur.Poor decision-making and reduced situational awareness at theindividual level is also particularly critical during behavioral actionprocesses, as team members constantly make decisions regardingwhat to monitor, what and when to communicate to others, whento step in to provide backup, and how and when to execute inter-dependent actions. There is little research in this area. A US AirForce study of a 36-h air battle management task showed thatteams sought more visual information when fatigued, but thatoverall performance did not decrease [66]. While little research hasexamined fatigue on team-level action processes, several studieshave considered fatigued team communication, which is requiredfor many coordinating actions. Generally, fatigued teams exhibitless communication [62,67].
For the behavioral interpersonal processes of conflict manage-ment, motivation and confidence building, and affect management,fatigue may prevent deployment of team-established strategies ofmanaging relationships, as poor self-regulation and amplifiedemotional responses cause team members to simply ignore thosestrategies [68]. The well-documented fatigue effects on motivation,mood, empathy, morale, self-regulation, and other affective andinterpersonal factors [2] strongly suggest that a fatigued team willexperience an increase in conflict and a reduction in prosocial be-haviors. For example, laboratory studies found sleep quantity to benegatively related to unethical behavior, while a field study oforganizational employees found that sleep quantity and qualitypredicted unethical behavior [68]. Other studies found sleepquantity to predict helping and prosocial behaviors directed towardthe organization but not toward individuals, while a student sam-ple found that sleep quantity predicted prosocial behaviorsdirected at both individuals and organizations [69,70]. Reducedprosocial behaviors may also exacerbate fatigue. For example, res-idential support workers on night shifts reported less sleep whencolleagues did not provide backup behavior in the form of assis-tance in completing tasks [71]. These few studies examining teambehavioral processes and fatigue have not examined all potentialeffects on the process subtypes, and there has not been muchreplication to support strong conclusions.
Team outputs (and the cyclical nature of teamwork)
Team outputs are grouped into two categories: team perfor-mance and team functioning. Team performance may be measuredby, depending on the setting, patient mortality rates, military tar-gets hit, space monitoring equipment installed, etc. Team func-tioning may be gauged by team cohesion and team confidencemetrics. These outcomes determine team output, and also affectthe individual teammembers' performance, safety, and well-being.Often the metric of primary interest in operational environments isthe ultimate team performance; that is, did the team complete thetask and the mission, and did they do it safely? Fatigue may

S. Banks et al. / Sleep Medicine Reviews 48 (2019) 1012166
influence operational outcomes directly (e.g., failure to detect atarget resulting in a miss), but in a team setting, fatigue acting onthe team processes also drives later team outcomes.
A team that is particularly reliant on each member performing aunique and critical role may suffer significantly if one or moremembers are unable to fully contribute. However, it is possible thatthe effects of fatigue on team tasks only impact individual pro-cesses (e.g., information gathering) without significant conse-quences to overall team processes (e.g., information sharing,coordination) or outputs (e.g., task completion) [72]. In otherwords, a team may be able to overcome the negative effects of fa-tigue on one or more members to accomplish task and missionobjectives. In effect, each member of the team can serve as a po-tential layer of risk mitigation in Reason's “Swiss Cheese Model” ofaccident causation. Many team settings have developed informalprocesses of fatigue proofing to do exactly that [73].
Industry-based studies support the importance of teams formanaging safety-critical performance [74] and team-level protec-tion against threats from fatigued team members [75,76]. At thesame time, fatigue may erode prosocial behaviors and the ability tobe a “good team member” [77]. As such, if a team member isidentified as fatigued, other team members may strategicallyredistribute tasks, add backups and checks, and prompt increases incommunication. Training a team in how to perform these mitiga-tion strategies, while also maintaining a cohesive environment inwhich members are able to expect and accept performance dec-rements andmaintain trust in all teammembers, is challenging butmay have long-lasting, positive consequences.
Indeed, team outputs evolve, flowing naturally into the nextepisode of team performance and creating a new set of inputs forthe next IMOI cycle ([42]; Fig. 1). For example, team performancepredicts team cohesion [54], and each task is also an opportunityfor the team to practice or learn skills and processes, preparingthem for the next application of those skills and processes. Eachepisode may also influence fatigue (e.g., through the time on taskeffect [1], or by impacting on subsequent sleep [78]), which mayresult in a teammember or members beginning the next task morefatigued. For example, astronauts have reported worry related totasks performed inadequately earlier in the day affecting sleep thatnight [56].
Over time, a team that experiences a pattern of poor perfor-mance will also experience a decrease in team cohesion, trust, andconfidence, which leads to another decrease in performance and anincreased likelihood of accidents, and so on e until ultimately, theoverall mission is at risk of failure. In the case of a new or formingteam, disruption due to fatigue during an early IMOI episode couldprevent the team from ever becoming a well-functioning, high-performing unit. To develop strategies to avoid or reverse such afatigue-induced downward spiral and mitigate the risks of fatigueon performance and safety in team settings, understanding thenuances of how fatigue influences the components and processesof team systems is critical.
Organizational context
Operational framework for managing fatigue
As represented in the IMOI framework (Fig. 1), the effects of anindividual who is fatigued can ripple through an operation. Forexample, in the commercial aviation environment, an error from asingle fatigued air traffic controller can result in process changes forothers in the air traffic controller's team. In turn, this can result indelays in landings and take-offs and disruption of the schedulingand flow of an entire airport. This can then have follow-on effectsfor plane scheduling at destination airports, influencing the flow of
the larger airline system. In any tightly connected organizationalsystem, ripple effects from a single fatigued individual can impacton organizational integrity through changes in productivity, safety,staffing, turnover, recruitment, retention, quality control, andaccountability [79,80].
The traditional approach to fatigue management at the organi-zational level has focused on hours-of-service (HOS) regulationsprescribing limits on shift duration, mandatory breaks, and time off[6]. Such regulations seek to structure working time arrangementsto prevent excessive time awake and time on task, and to allowsufficient sleep opportunity. However, HOS regulatory approacheshave been criticized for failing to sufficiently consider factors suchas time of day [6,80,81]. Importantly, HOS regulations prescribeindividual behavior, and only consider their behavior at work.Unlike other workplace hazards (e.g., toxic exposure), not all factorsthat influence fatigue occur within the work environment.
Managing fatigue is therefore increasingly seen as a shared re-sponsibility of both the individual worker and the employer [7,82].In many parts of the world, Occupational Safety and Health regu-lations identify this shared duty tomanage fatigue by employer andemployee [80,82]. Typically, responsibility for fatigue managementcenters on the regulator, the operator, and the individual worker[82]. The employee's duty to be fit for work is more complicated forfatigue than it is for other sources of impairment (e.g., alcohol orother drugs), as it is often not possible to completely remove fatiguefrom a workplace (especially in 24/7 operations). Moreover, fatigueis a dynamically changing state (often increasing across the dura-tion of a work shift), and it cannot be easily assessed objectively.
Given these challenges, current best practice in fatigue man-agement in large-scale industrial settings involves the develop-ment of a fatigue risk management system (FRMS) [6]. Based onthe “Swiss Cheese Model” of accident causation, the FRMSframework acknowledges that no single means to prevent errorsor incidents is perfect, and there must be multiple, overlapping,and redundant levels of protection [7,82]. Teams are a natural partof this framework, as team members monitor each other, coor-dinate schedules and work flow, and support other team mem-bers to maintain performance effectiveness and enhance erroravoidance. Team members may also need to be understandingtoward teammates reducing workload due to fatigue. While it iswidely recognized that an effective and mature workplace cultureis essential in this context [82], the role of teams and the impli-cations for team behavioral processes have not been given anysystematic consideration.
Teams and fatigue management
What is currently missing from the FRMS framework is explicitreference to the way in which team dynamics inform fatiguemanagement and vice versa. There is a need for a conceptual modelfor the incorporation of teams in FRMS. Current thinking by Le Coze[83] and others suggests building on Normal Accidents Theory [84].According to Normal Accidents Theory, there are two main char-acteristics of systems e complexity and coupling e that contributeto incidents and accidents. Complexity denotes the number ofcomponents that make up a system, including people, groups, andtechnologies. Coupling denotes the interconnectivity (in space,time, or otherwise) between the components that make up thesystem. The theory posits that in systems where catastrophicevents are possible, highly complex and tightly coupled systemshave a higher, if not inevitable (or “normal”), risk of unintendedoutcomes or system failures. Highly complex, tightly coupled sys-tems cannot easily withstand the impact of an unexpected occur-rence (e.g., due to performance failure of a fatigued individual),because other parts of the system must react immediately. The
Practice points
� Teams are in a critical, central position between in-
dividuals and organizations, but a largely overlooked
component of understanding and mitigating the impact
of fatigue on performance and safety outcomes.
� Compared to individuals, teams have greater potential to
successfully self-monitor fatigue and provide protection
against its adverse consequences.
� Multi-level study designs encompassing individual-,
team-, and organizational-level effects that incorporate
both qualitative and quantitative measures are needed to
move this field forward.
� Established team models, such as the Input-Mediator-
Output-Input (IMOI) model (Fig. 1), and applicable the-
ories, such as Normal Accidents Theory, provide useful
frameworks for understanding and managing the impact
of fatigued individuals on teams and organizations. These
frameworks may complement extant perspectives on fa-
tigue risk management such as Reason's “Swiss Cheese
Model” and fatigue risk management systems (FRMS).
� Organizations would do well to acknowledge and
embrace the role of teams and team processes as part of a
FRMS. For example, a FRMS could incorporate a process
to facilitate team supporting behavior, such as moni-
toring teammates, enable non-punitive reporting of
teammate impairment, and encouraging team work-
arounds to compensate for a teammate's diminished ca-
pacity due to fatigue.
S. Banks et al. / Sleep Medicine Reviews 48 (2019) 101216 7
effects can snowball and, due to high complexity, results in loss ofpredictability and manageability in many or all aspects of a system.Furthermore, anticipation of risk is predicated on the ability topredict system behaviors and outcomes. This is a challenge inhighly complex, tightly coupling systems, which are thus associatedwith increased risk exposure for an organization.
Normal Accidents Theory provides a potentially useful way tothink about the incorporation of teams in FRMS. The “SwissCheese Model” foundation for FRMS emphasizes redundancy.However, from the perspective of Normal Accidents Theory,redundancy may increase coupling and complexity, which mayactually increase risk rather than safety [83]. Given the inherentcomplexity of 24/7 operations, the ideal environment for FRMSwould be connected in a way that is neither too loose to bemanageable nor too tight to be vulnerable. Teams and theircharacteristics (size, composition, roles, etc., as described previ-ously) could be considered a means to control the degrees ofcomplexity and coupling of an organization e thereby providinga strategy to manage fatigue risks in addition to, and to someextent orthogonal to, the redundancy of layers of protectioncalled for by the “Swiss Cheese Model” [84]. Organizations couldtake readily steps to harness this strategy, for example bydesigning work spaces and the regulatory environment toencourage team work. That said, optimal use of this approachwould require new research to better understand the dynamicsof teams and organizations as systems.
Pivotal role of teams in understanding and managing theconsequences of fatigue
Whereas fatigue can have major consequences for organiza-tional outcomes (productivity, safety, and profitability), efforts tomitigate the effects of fatigue are predominantly aimed atdetecting and preventing or mitigating fatigue at the level ofindividuals, not teams. In part, the focus on individuals is a resultof the difficulty in assessing and managing the functioning of ateam beyond that of the separate individuals in the team. And inpart, it follows from how organizations, and society in general,tend to deal with rewards and accountability. Teams are notcommonly the specific target of rewards and accountability.Rather, rewards (such as salary and promotion) are bestowedupon individuals based primarily on their personal contributionsto the organization. Accountability is usually assigned to desig-nated individuals in the context of their organizational role andresponsibility (e.g., leadership position). Not surprisingly, effortsto understand and manage fatigue have historically focused onindividuals as well, with HOS regulations and fatigue counter-measure strategies pertaining to people as independent entitiesrather than as teams e even though the dynamics of teams andtheir operational functioning may have greater impact on theorganization as a whole.
A systems-level understanding of fatigue and the role of teamswith regard to fatigue would provide a novel platform for fatiguemanagement design and decision-making. Research into teamswould enable better prediction of the potential flow-on effects of afatigued individual (or individuals) within a system, as well as theusefulness of fatigue control measures such as sending someone offduty or changing their work tasks. Notably, some people are moreintegral to the functioning of a team or system than others. Thelevel of influence of each person within the team can be describedthrough factors such as team context (e.g., structure, leadershiproles) and team affective states (e.g., cohesion, trust) [10,85]. In alarger system, this can be conceptualized as centrality e certainpeople will be more centralized, and exert more influence onothers. Taking out a highly centralized person could significantly
destabilize a system, but an effective team structure may help toreduce the degree of coupling in the system and thereby mitigatethe impact of centrality.
The current absence of team-level considerations in fatiguemanagement is an important gap, especially since many of thenecessary conditions for successful fatigue management rely oninteractions between people and teams. Changes in behavior at ateam level could act as a fatigue countermeasure, but there is alsothe potential for such changes to increase risk in a highly interde-pendent team system (e.g., not completing one's own tasks whileengaging in backup behavior for a fatigued teammate, notcommunicating adequately [86]). A better understanding is neededof how these interactions and behaviors change in the context ofthe team as well as the larger organizational system, especially inhighly complex and tightly coupled systems where small changescan have large, widely felt consequences.
In conclusion, fatigue affects individual safety and performanceas well as organizational effectiveness. Most organizationsencourage if not require team work, yet little is known about howfatigue affects teams and how teams affect fatigue outcomes. Thereis an urgent need to build the empirical knowledge base regardingthe role of teams in fatigue risk management, through multi-disciplinary research using established frameworks in the respec-tive sciences of fatigue and teams. A better understanding of theunderlying phenomena will form the basis for recommendationsregarding the inclusion of team dynamics as part of comprehensiveFRMS. The integration of team science into organizational-levelfatigue risk management practices and policies is a formidablechallenge, but given the importance of teams and teamwork in 24/7 operational settings, the importance thereof cannot beoverstated.

Research agenda
Teams could be used to provide additional levers for fatigue
prevention and fatigue risk management. Focusing on
teams provides an opportunity for better outcomes at the
individual level (e.g., fatigue, performance, health, andwell-
being) as well as at the organizational level (e.g., safety,
productivity, and profitability). To take advantage of this
opportunity, a number of knowledge gaps need to be
addressed:
1. There is inadequate knowledge about how fatigue im-
pacts team-level processes and how the team itself
contributes to the fatigue of its constituent members.
Well-established team frameworks such as the IMOI
model provide a foundation for generating testable hy-
potheses and building an empirical knowledge base on
the effects of fatigue in teams.
2. Even with a focus on teams, the contributions of in-
dividuals and their inter-individual differences must be
considered. To this end, an evidence-based under-
standing of individual- and team-level differences in
vulnerability and resilience to fatigue and subsequent
effects on team and social processes and outcomes is
critical.
3. It is not known how fatigue and team effects on perfor-
mance outcomes affect organizations over repeat team
performance cycles, or how regulatory and/or organiza-
tional fatigue risk management policies and practices
affect team processes and outputs. Consequently, it is
also unknown how best to leverage teams to make
organizational fatigue management approaches more
effective. There is a need for research on how organiza-
tions influence teams and how individuals and teams
influence organizations in the context of 24/7 operations
and the fatigue that is commonly associated with such
operations.
Addressing these knowledge gaps calls for the integration
of fatigue science with team science and a highly multi-
disciplinary research approach. Fatigue and team scien-
tists may form partnerships to leverage the best research
methodologies of each field. Conducting team research is
inherently challenging and resource-intensive, as is fatigue
research. Coupling these challenges with the additional
need to examine both acute and chronic effects requires
careful attention to sound experimental design, but could
be exceptionally impactful when done well.
* The most important references are denoted by an asterisk.
S. Banks et al. / Sleep Medicine Reviews 48 (2019) 1012168
Author contributions
PGR, SB, LBL, and HVD conceived the project. SB, LBL, HVD, JD,LBW, PGR, and SAC wrote the paper.
Acknowledgments
Manuscript preparation for all authors was supported byUniversity of South Australia, Alliances Development funding. LBLand PGR are supported by KBR's Human Health and PerformanceContract NNJ15HK11B through the National Aeronautics andSpace Administration. LBW is supported by Delta Air Lines, Inc.SAC is supported by National Health and Medical Research,
Australia project grant APP1099077. HVD is supported byCongressionally Directed Medical Research Program, UnitedStates; Delta Air Lines, Inc., United States grant W81XWH-16-1-0319. The authors of this report are entirely responsible for itscontent and the decision to submit the work for publication. Theviews expressed in this document do not represent the officialpositions of University of South Australia, the National Aero-nautics and Space Administration, the US Department of Defense,US Government, KBR, or Delta Air Lines. The authors have nointerests that may be perceived as conflicting with the workpresented or proposed here.
References
[1] Satterfield BC, Van Dongen HPA. Occupational fatigue, underlying sleep andcircadian mechanisms, and approaches to fatigue risk management. FatigueBiomed Health Behav 2013;1:118e36.
[2] Killgore WD. Effects of sleep deprivation on cognition. Prog Brain Res2010;185:105e29.
[3] Van Dongen HPA, Baynard MD, Maislin G, Dinges DF. Systematic interindi-vidual differences in neurobehavioral impairment from sleep loss: evidenceof trait-like differential vulnerability. Sleep 2004;27:423e33.
[4] Åkerstedt T, Ficca G. Alertness-enhancing drugs as a countermeasure to fa-tigue in irregular work hours. Chronobiol Int 1997;14:145e58.
[5] Caldwell JA. Fatigue in the aviation environment: an overview of the causesand effects as well as recommended countermeasures. Aviat Space EnvironMed 1997;68:932e8.
[6] Honn KA, Van Dongen HPA, Dawson D. Working Time Society consensus:prescriptive rule sets and risk management-based approaches for the man-agement of fatigue-related risk in working time arrangements. Ind Health2019;57:264e80.
*[7] Dawson D, McCulloch K. Managing fatigue: it's about sleep. Sleep Med Rev2005;9:365e80.
*[8] Reason J. Human error. New York: Cambridge University Press; 1990.[9] Gander PH, Purnell HM, Garden A, Woodward A. Work patterns and fatigue-
related risk among junior doctors. Occup Environ Med 2007;64:733e8.[10] Kozlowski SW, Ilgen DR. Enhancing the effectiveness of work groups and
teams. Psychol Sci Public Interest 2006;7:77e124.[11] Pilcher JJ, Huffcutt AI. Effects of sleep deprivation on performance: a meta-
analysis. Sleep 1996;19:318e26.[12] Harrison Y, Horne JA. The impact of sleep deprivation on decision making: a
review. J Exp Psychol Appl 2000;6:236e49.[13] Durmer JS, Dinges DF. Neurocognitive consequences of sleep deprivation.
Semin Neurol 2005;25:117e29.[14] Van Dongen HPA, Caldwell Jr JA, Caldwell JL. Individual differences in
cognitive vulnerability to fatigue in the laboratory and in the workplace. ProgBrain Res 2011;190:145e53.
[15] Rupp TL, Wesensten NJ, Balkin TJ. Trait-like vulnerability to total and partialsleep loss. Sleep 2012;35:1163e72.
[16] Satterfield BC, Stucky B, Landolt HP, Van Dongen HPA. Unraveling the geneticunderpinnings of sleep deprivation-induced impairments in human cogni-tion. Prog Brain Res 2019;246:127e58.
[17] H€arm€a M. Individual differences in tolerance to shiftwork: a review. Ergo-nomics 1993;36:101e9.
[18] Forsman P, Van Dongen HPA. Age effects and individual differences in cognitiveimpairment due to sleep loss. Ref Modul Neurosci Biobehav Psychol 2017:1e5.
[19] Leproult R, Colecchia EF, Berardi AM, Stickgold R, Kosslyn SM, Van Cauter E.Individual differences in subjective and objective alertness during sleepdeprivation are stable and unrelated. Am J Physiol e Regul Integr CompPhysiol 2003;284:R280e90.
[20] Kerkhof GA. Inter-individual differences in the human circadian system: areview. Biol Psychol 1985;20:83e112.
[21] Kerkhof GA, Van Dongen HPA. Morning-type and evening-type individualsdiffer in the phase position of their endogenous circadian oscillator. NeurosciLett 1996;218:153e6.
[22] Van Dongen HPA. Shift work and inter-individual differences in sleep andsleepiness. Chronobiol Int 2006;23:1139e47.
[23] Vetter C, Fischer D, Matera JL, Roenneberg T. Aligning work and circadiantime in shift workers improves sleep and reduces circadian disruption. CurrBiol 2015;25:907e11.
[24] Bjerner B, Holm Å, Swensson Å. Diurnal variation in mental performance: astudy of three-shift workers. Br J Ind Med 1955;12:103e10.
[25] Wilkinson RT. Interaction of lack of sleep with knowledge of results, repeatedtesting, and individual differences. J Exp Psychol 1961;62:263e71.
[26] Doran S, Van Dongen HPA, Dinges DF. Sustained attention performanceduring sleep deprivation: evidence of state instability. Arch Ital Biol2001;139:253e67.
S. Banks et al. / Sleep Medicine Reviews 48 (2019) 101216 9
[27] Van Dongen HPA, Belenky G, Krueger JM. A local, bottom-up perspective onsleep deprivation and neurobehavioral performance. Curr Top Med Chem2011;11:2414e22.
[28] Jackson ML, Gunzelmann G, Whitney P, Hinson JM, Belenky G, Rabat A, et al.Deconstructing and reconstructing cognitive performance in sleep depriva-tion. Sleep Med Rev 2013;17:215e25.
*[29] Van Dongen HPA, Hursh SR. Fatigue, performance, errors, and accidents. In:Kryger MH, Roth T, Dement WC, editors. Principles and practice of sleepmedicine. 5th ed. Philadelphia: W.B. Saunders; 2011. p. 753e9.
[30] Honn KA, Hinson JM, Whitney P, Van Dongen HPA. Cognitive flexibility: adistinct element of performance impairment due to sleep deprivation. AccidAnal Prev 2019;126:191e7.
[31] Whitney P, Hinson JM, Satterfield BC, Grant DA, Honn KA, Van Dongen HPA.Sleep deprivation diminishes attentional control effectiveness and impairsflexible adaptation to changing conditions. Sci Rep 2017;7:16020.
[32] Minkel J, Htaik O, Banks S, Dinges D. Emotional expressiveness in sleep-deprived healthy adults. Behav Sleep Med 2011;9:5e14.
[33] Guadagni V, Burles F, Ferrara M, Iaria G. The effects of sleep deprivation onemotional empathy. J Sleep Res 2014;23:657e63.
[34] Killgore WD, McBride SA, Killgore DB, Balkin TJ. The effects of caffeine,dextroamphetamine, and modafinil on humor appreciation during sleepdeprivation. Sleep 2006;29:841e7.
[35] Barnes CM, Guarana CL, Nauman S, Kong DT. Too tired to inspire or beinspired: sleep deprivation and charismatic leadership. J Appl Psychol2016;101:1191e9.
[36] Anderson C, Dickinson DL. Bargaining and trust: the effects of 36-h total sleepdeprivation on socially interactive decisions. J Sleep Res 2010;19:54e63.
[37] Daan S, Beersma D, Borb�ely AA. Timing of human sleep: recovery processgated by a circadian pacemaker. Am J Physiol e Regul Integr Comp Physiol1984;246:R161e83.
[38] Tassi P, Muzet A. Sleep inertia. Sleep Med Rev 2000;4:341e53.[39] Van Dongen HPA, Maislin G, Mullington JM, Dinges DF. The cumulative cost
of additional wakefulness: dose-response effects on neurobehavioral func-tions and sleep physiology from chronic sleep restriction and total sleepdeprivation. Sleep 2003;26:117e26.
[40] Belenky G, Wesensten NJ, Thorne DR, Thomas ML, Sing HC, Redmond DP,et al. Patterns of performance degradation and restoration during sleep re-striction and subsequent recovery: a sleep dose-response study. J Sleep Res2003;12:1e12.
[41] Gabehart RJ, Van Dongen HPA. Circadian rhythms in sleepiness, alertness,and performance. In: Kryger MH, Roth T, Dement WC, editors. Principlesand practice of sleep medicine. 6th ed. Philadelphia: Elsevier; 2017.p. 388e95.
*[42] Ilgen DR, Hollenbeck JR, Johnson M, Jundt D. Teams in organizations: frominput-process-output models to IMOI models. Annu Rev Psychol 2005;56:517e43.
[43] Klein G. Naturalistic decision making. Hum Factors 2008;50:456e60.[44] Mathieu J, Maynard MT, Rapp T, Gilson L. Team effectiveness 1997e2007: a
review of recent advancements and a glimpse into the future. J Manag2008;34:410e76.
[45] American College of Obstetricians and Gynecologists. AMOG committeeopinion number 730: fatigue and patient safety. Obstet Gynecol 2018;131:e78e81.
[46] Morgeson FP, DeRue DS, Karam EP. Leadership in teams: a functionalapproach to understanding leadership structures and processes. J Manag2010;36:5e39.
[47] Haslam DR, Abraham P. Sleep loss and military performance. In: Belenky G,editor. Contributions in military studies, no. 62. Contemporary studies incombat psychiatry. New York: Greenwood Press; 1987. p. 167e84.
[48] Guarana CL, Barnes CM. Lack of sleep and the development of leader-followerrelationships over time. Organ Behav Hum Decis Process 2017;141:57e73.
*[49] Grossman R, Friedman SB, Kalra S. Teamwork processes and emergent states.In: Salas E, Rico R, Passmore J, editors. The Wiley blackwell handbook of thePsychology of team working and collaborative processes. Chichester, UK:Wiley-Blackwell; 2017. p. 245e69.
[50] Roma PG, Bedwell WL. Key factors and threats to team dynamics in long-duration extreme environments. In: Salas E, Vessey WB, Landon LB, edi-tors. Team dynamics over time. Bingley, UK: Emerald Publishing Limited;2017. p. 155e87.
[51] Carron AV, Widmeyer WN, Brawley LR. The development of an instrument toassess cohesion in sport teams: the Group Environment Questionnaire.J Sport Psychol 1985;7:244e66.
[52] MacCoun RJ, Kier E, Belkin A. Does social cohesion determine motivation incombat? An old question with an old answer. Armed Forces Soc 2006;32:646e54.
[53] Beal DJ, Cohen RR, Burke MJ, McLendon CL. Cohesion and performance ingroups: a meta-analytic clarification of construct relations. J Appl Psychol2003;88:989e1004.
[54] Mathieu JE, Kukenberger MR, D'Innocenzo L, Reilly G. Modeling reciprocalteam cohesion-performance relationships, as impacted by shared leadershipand members' competence. J Appl Psychol 2015;100:713e34.
*[55] De Jong BA, Dirks KT, Gillespie N. Trust and team performance: a meta-analysis of main effects, moderators, and covariates. J Appl Psychol2016;101:1134e50.
[56] Stuster J. Behavioral issues associated with long duration space expeditions:review and analysis of astronaut journals. Experiment 01-e104 (journals).Phase 2 Final Report. Houston: National Aeronautics and Space Administra-tion; 2016.
[57] Sparrow A, Smith K, Skornvakov E, Shattuck N, Matsangas P, VanDongen HPA. A pilot study of team communication in simulated Navy watchschedules. Sleep Wake Res Netherlands 2015;26:48e51.
[58] Welsh DT, Ellis AP, Christian MS, Mai KM. Building a self-regulatory model ofsleep deprivation and deception: the role of caffeine and social influence.J Appl Psychol 2014;99:1268e77.
[59] Salas E, Grossman R, Hughes AM, Coultas CW. Measuring team cohesion:observations from the science. Hum Factors 2015;57:365e74.
*[60] DeChurch LA, Mesmer-Magnus JR. The cognitive underpinnings of effectiveteamwork: a meta-analysis. J Appl Psychol 2010;95:32e53.
[61] Chavali VP, Riedy SM, Van Dongen HPA. Signal-to-Noise Ratio in PVT per-formance as a cognitive measure of the effect of sleep deprivation on thefidelity of information processing. Sleep 2017;40:zsx016.
[62] Fletcher A, Wesensten NJ, Kandelaars K, Balkin TJ. In: Measuring and pre-dicting sleep and performance during military operations. Silver Spring, MD:Walter Reed Army Institute of Research; 2012.
[63] Whitney P, Hinson JM, Jackson ML, Van Dongen HPA. Feedback blunting:total sleep deprivation impairs decision making that requires updating basedon feedback. Sleep 2015;38:745e54.
[64] Taylor EC, Bernerth JB, Maurer JD. Running on empty: the effects of aggregatetravel stress on team performance. J Bus Psychol 2017;32:513e31.
[65] Baranski JV, Thompson MM, Lichacz FM, McCann C, Gil V, Past�o L, et al. Ef-fects of sleep loss on team decision making: motivational loss or motivationalgain? Hum Factors 2007;49:646e60.
[66] Whitmore J, Chaiken S, Fischer J, Harrison R, Harville D. Sleep loss andcomplex team performance. Report no. AFRL-RH-BR-TR-2008-0005. BrooksCity-Base, TX: Air Force Research Laboratory Human Effectiveness Direc-torate; 2008.
[67] Carmichael L, Kennedy JL, Mead LC. Some recent approaches to the experi-mental study of human fatigue. Proc Natl Acad Sci 1949;35:691e6.
[68] Barnes CM. Working in our sleep: sleep and self-regulation in organizations.Organ Psychol Rev 2012;2:234e57.
[69] Barnes CM, Schaubroeck J, Huth M, Ghumman S. Lack of sleep and unethicalconduct. Organ Behav Hum Decis Process 2011;115:169e80.
[70] Barnes CM, Ghumman S, Scott BA. Sleep and organizational citizenshipbehavior: the mediating role of job satisfaction. J Occup Health Psychol2013;18:16e26.
[71] Dorrian J, Grant C, Banks S. An industry case study of ‘stand-up’and ‘sleep-over’ night shifts in disability support: residential support worker perspec-tives. Appl Ergon 2017;58:110e8.
[72] Faber NS, H€ausser JA, Kerr NL. Sleep deprivation impairs and caffeine en-hances my performance, but not always our performance: how acting in agroup can change the effects of impairments and enhancements. PersonalSoc Psychol Rev 2017;21:3e28.
*[73] Dawson D, Chapman J, Thomas M. Fatigue-proofing: a new approach toreducing fatigue-related risk using the principles of error management. SleepMed Rev 2012;16:167e75.
[74] Naweed A, Balakrishnan G, Dorrian J. Going solo: hierarchical task analysis ofthe second driver in “two-up”(multi-person) freight rail operations. ApplErgon 2018;70:202e31.
[75] Thomas MJ, Ferguson SA. Prior sleep, prior wake, and crew performanceduring normal flight operations. Aviat Space Environ Med 2010;81:665e70.
[76] Dorrian J, Lamond N, van den Heuvel C, Pincombe J, Rogers AE, Dawson D.A pilot study of the safety implications of Australian nurses' sleep and workhours. Chronobiol Int 2006;23:1149e63.
[77] Dorrian J, Centofanti S, Smith A, McDermott KD. Self-regulation and socialbehavior during sleep deprivation. Prog Brain Res 2019;246:73e110.
[78] Horne J. Recovery sleep following different visual conditions during totalsleep deprivation in man. Biol Psychol 1976;4:107e18.
[79] Barnes CM, Hollenbeck JR. Sleep deprivation and decision-making teams:burning the midnight oil or playing with fire? Acad Manag Rev 2009;34:56e66.
[80] Lerman SE, Eskin E, Flower DJ, George EC, Gerson B, Hartenbaum N, et al.Fatigue risk management in the workplace. J Occup Environ Med 2012;54:231e58.
[81] Jones C, Dorrian J, Dawson D. Legal implications of fatigue in the Australiantransportation industries. J Ind Relat 2003;45:344e59.
*[82] Gander P, Hartley L, Powell D, Cabon P, Hitchcock E, Mills A, et al. Fatigue riskmanagement: organizational factors at the regulatory and industry/companylevel. Accid Anal Prev 2011;43:573e90.
[83] Le Coze JC. 1984e2014. Normal accidents. Was Charles Perrow right for thewrong reasons? J Contingencies Crisis Manag 2015;23:275e86.
*[84] Perrow C. Normal accidents: living with high risk systems. New York: BasicBooks; 1984.
[85] Balkundi P, Harrison DA. Ties, leaders, and time in teams: strong inferenceabout network structure's effects on team viability and performance. AcadManag J 2006;49:49e68.
[86] Patterson PD, Pfeiffer AJ, Weaver MD, Krackhardt D, Arnold RM, Yealy DM,et al. Network analysis of team communication in a busy emergencydepartment. BMC Health Serv Res 2013;13:109.

NEUROPSYCHOPHARMACOLOGY REVIEWS
Sleep deprivation, vigilant attention, and brain function:a reviewAmanda N. Hudson1, Hans P. A. Van Dongen 1 and Kimberly A. Honn1
Vigilant attention is a major component of a wide range of cognitive performance tasks. Vigilant attention is impaired by sleepdeprivation and restored after rest breaks and (more enduringly) after sleep. The temporal dynamics of vigilant attention deficitsacross hours and days are driven by physiologic, sleep regulatory processes—a sleep homeostatic process and a circadian process.There is also evidence of a slower, allostatic process, which modulates the sleep homeostatic setpoint across days and weeks and isresponsible for cumulative deficits in vigilant attention across consecutive days of sleep restriction. There are large inter-individualdifferences in vulnerability to sleep loss, and these inter-individual differences constitute a pronounced human phenotype.However, this phenotype is multi-dimensional; vulnerability in terms of vigilant attention impairment can be dissociated fromvulnerability in terms of other cognitive processes such as attentional control. The vigilance decrement, or time-on-task effect—adecline in performance across the duration of a vigilant attention task—is characterized by progressively increasing responsevariability, which is exacerbated by sleep loss. This variability, while crucial to understanding the impact of sleep deprivation onperformance in safety-critical tasks, is not well explained by top-down regulatory mechanisms, such as the homeostatic andcircadian processes. A bottom-up, neuronal pathway-dependent mechanism involving use-dependent, local sleep may be the maindriver of response variability. This bottom-up mechanism may also explain the dissociation between cognitive processes withregard to trait vulnerability to sleep loss.
Neuropsychopharmacology (2020) 45:21–30; https://doi.org/10.1038/s41386-019-0432-6
INTRODUCTIONThe study of vigilant attention in the context of sleep deprivationhas yielded far-reaching insights into the effects of sleepdeprivation on cognition and the brain. The primary focus of thisreview is to provide an overview of inter-related findings on sleepdeprivation and vigilant attention, and review how these findingshave shaped our understanding of the neurocognitive effects ofsleep deprivation and, by extension, sleep.Vigilant attention, also called sustained attention, refers to the
ability to maintain stable, focused attention across a time interval[1]. Vigilant attention is typically measured with (computerized)performance tasks requiring responses to target signals. In thepsychology literature, deficits in vigilant attention have beenstudied in the context of Signal Detection Theory [2], whichprovides a “discriminability” measure of an individual’s perfor-mance on a stimulus detection task while accounting for theindividual’s willingness to respond. The concept of discriminabilityis directly related to the concept of signal-to-noise ratio [3], whichmay be seen as a measure of the fidelity of information processingin the brain [4]. Deficits in vigilant attention are also commonlydescribed in terms of the time-on-task effect, or vigilancedecrement, which is a decline in timely or correct responsesacross the duration of a vigilant attention performance task [5].A variety of task paradigms have been used to measure vigilant
attention, including simple reaction time tasks, go/no-go tasks,and two-alternative forced choice tasks, all of which typically
require subjects to make speeded, accurate responses to visual orauditory stimuli. Historically, performance tasks employed to studyvigilant attention required responding to relatively infrequentlyappearing target signals or events (e.g., occurring less than once aminute) across extended periods of time (an hour or more) [6].High workload—operationalized as a relatively high rate of targetsignals—can increase the vigilance decrement, so that sensitivityto deficits in vigilant attention can be retained in shorter tasks byincreasing the stimulus density (although the vigilance decrementmay be reduced again if stimuli are presented as often as everyfew seconds) [7]. As such, shorter tasks (less than an hour induration) are currently favored in studies of vigilant attention.Vigilance deficits have previously been posited to be the result
of neural habituation to repeated stimulation [8]. However, studiesbased on event-related potentials have cast doubt on this idea [9].It has also been proposed that the vigilance decrement arises fromunder-stimulation or boredom due to the monotonous nature ofstereotypical vigilance tasks [10, 11]. At the level of brainfunctioning, though, it is not evident why under-stimulationwould lead to a vigilance decrement. Even more puzzling, fromthis perspective, is the pivotal observation that sleep deprivationcauses significant impairment in vigilant attention [12–15] andacceleration of the vigilant decrement [16–19]. As we shall see,this phenomenon suggests an alternative explanation for thevigilance decrement (and an alternative view of what constitutes“boredom” at the level of brain function).
Received: 8 March 2019 Revised: 13 May 2019 Accepted: 31 May 2019Published online: 8 June 2019
1Sleep and Performance Research Center and Elson S. Floyd College of Medicine, Washington State University, Spokane, WA, USACorrespondence: Kimberly A. Honn ([email protected])Shared senior authorship: Kimberly A. Honn, Hans P. A. Van Dongen.
www.nature.com/npp
© American College of Neuropsychopharmacology 2019
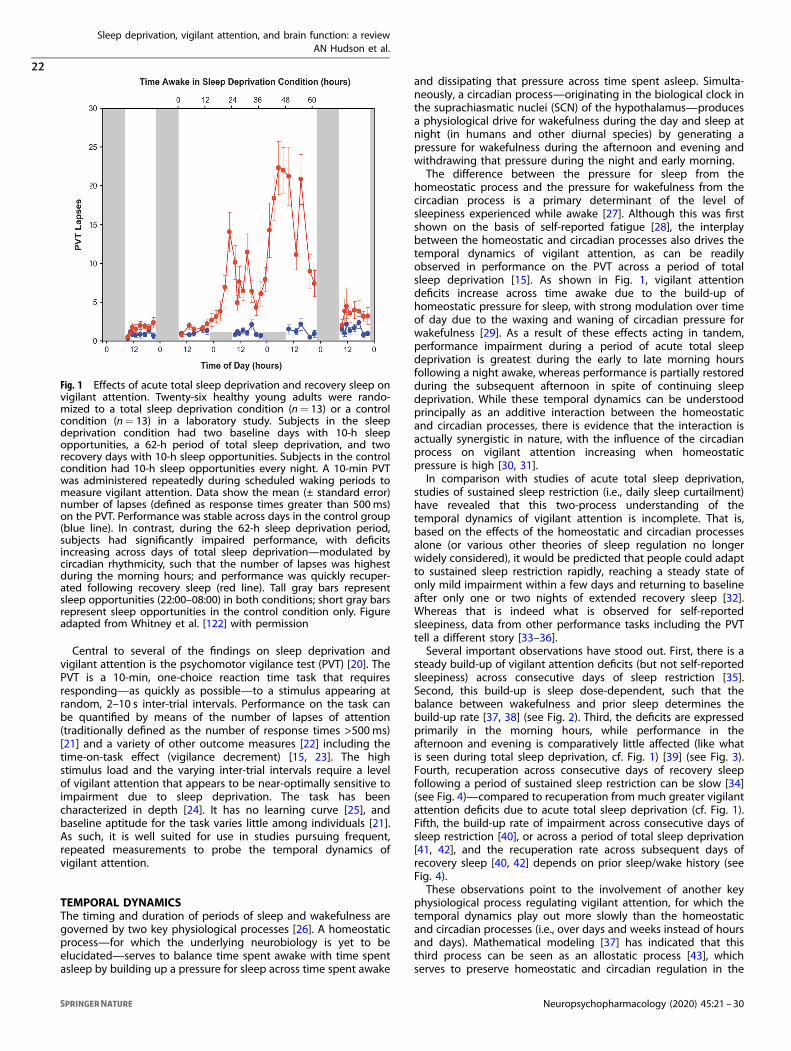
Central to several of the findings on sleep deprivation andvigilant attention is the psychomotor vigilance test (PVT) [20]. ThePVT is a 10-min, one-choice reaction time task that requiresresponding—as quickly as possible—to a stimulus appearing atrandom, 2–10 s inter-trial intervals. Performance on the task canbe quantified by means of the number of lapses of attention(traditionally defined as the number of response times >500ms)[21] and a variety of other outcome measures [22] including thetime-on-task effect (vigilance decrement) [15, 23]. The highstimulus load and the varying inter-trial intervals require a levelof vigilant attention that appears to be near-optimally sensitive toimpairment due to sleep deprivation. The task has beencharacterized in depth [24]. It has no learning curve [25], andbaseline aptitude for the task varies little among individuals [21].As such, it is well suited for use in studies pursuing frequent,repeated measurements to probe the temporal dynamics ofvigilant attention.
TEMPORAL DYNAMICSThe timing and duration of periods of sleep and wakefulness aregoverned by two key physiological processes [26]. A homeostaticprocess—for which the underlying neurobiology is yet to beelucidated—serves to balance time spent awake with time spentasleep by building up a pressure for sleep across time spent awake
and dissipating that pressure across time spent asleep. Simulta-neously, a circadian process—originating in the biological clock inthe suprachiasmatic nuclei (SCN) of the hypothalamus—producesa physiological drive for wakefulness during the day and sleep atnight (in humans and other diurnal species) by generating apressure for wakefulness during the afternoon and evening andwithdrawing that pressure during the night and early morning.The difference between the pressure for sleep from the
homeostatic process and the pressure for wakefulness from thecircadian process is a primary determinant of the level ofsleepiness experienced while awake [27]. Although this was firstshown on the basis of self-reported fatigue [28], the interplaybetween the homeostatic and circadian processes also drives thetemporal dynamics of vigilant attention, as can be readilyobserved in performance on the PVT across a period of totalsleep deprivation [15]. As shown in Fig. 1, vigilant attentiondeficits increase across time awake due to the build-up ofhomeostatic pressure for sleep, with strong modulation over timeof day due to the waxing and waning of circadian pressure forwakefulness [29]. As a result of these effects acting in tandem,performance impairment during a period of acute total sleepdeprivation is greatest during the early to late morning hoursfollowing a night awake, whereas performance is partially restoredduring the subsequent afternoon in spite of continuing sleepdeprivation. While these temporal dynamics can be understoodprincipally as an additive interaction between the homeostaticand circadian processes, there is evidence that the interaction isactually synergistic in nature, with the influence of the circadianprocess on vigilant attention increasing when homeostaticpressure is high [30, 31].In comparison with studies of acute total sleep deprivation,
studies of sustained sleep restriction (i.e., daily sleep curtailment)have revealed that this two-process understanding of thetemporal dynamics of vigilant attention is incomplete. That is,based on the effects of the homeostatic and circadian processesalone (or various other theories of sleep regulation no longerwidely considered), it would be predicted that people could adaptto sustained sleep restriction rapidly, reaching a steady state ofonly mild impairment within a few days and returning to baselineafter only one or two nights of extended recovery sleep [32].Whereas that is indeed what is observed for self-reportedsleepiness, data from other performance tasks including the PVTtell a different story [33–36].Several important observations have stood out. First, there is a
steady build-up of vigilant attention deficits (but not self-reportedsleepiness) across consecutive days of sleep restriction [35].Second, this build-up is sleep dose-dependent, such that thebalance between wakefulness and prior sleep determines thebuild-up rate [37, 38] (see Fig. 2). Third, the deficits are expressedprimarily in the morning hours, while performance in theafternoon and evening is comparatively little affected (like whatis seen during total sleep deprivation, cf. Fig. 1) [39] (see Fig. 3).Fourth, recuperation across consecutive days of recovery sleepfollowing a period of sustained sleep restriction can be slow [34](see Fig. 4)—compared to recuperation from much greater vigilantattention deficits due to acute total sleep deprivation (cf. Fig. 1).Fifth, the build-up rate of impairment across consecutive days ofsleep restriction [40], or across a period of total sleep deprivation[41, 42], and the recuperation rate across subsequent days ofrecovery sleep [40, 42] depends on prior sleep/wake history (seeFig. 4).These observations point to the involvement of another key
physiological process regulating vigilant attention, for which thetemporal dynamics play out more slowly than the homeostaticand circadian processes (i.e., over days and weeks instead of hoursand days). Mathematical modeling [37] has indicated that thisthird process can be seen as an allostatic process [43], whichserves to preserve homeostatic and circadian regulation in the
Fig. 1 Effects of acute total sleep deprivation and recovery sleep onvigilant attention. Twenty-six healthy young adults were rando-mized to a total sleep deprivation condition (n= 13) or a controlcondition (n= 13) in a laboratory study. Subjects in the sleepdeprivation condition had two baseline days with 10-h sleepopportunities, a 62-h period of total sleep deprivation, and tworecovery days with 10-h sleep opportunities. Subjects in the controlcondition had 10-h sleep opportunities every night. A 10-min PVTwas administered repeatedly during scheduled waking periods tomeasure vigilant attention. Data show the mean (± standard error)number of lapses (defined as response times greater than 500ms)on the PVT. Performance was stable across days in the control group(blue line). In contrast, during the 62-h sleep deprivation period,subjects had significantly impaired performance, with deficitsincreasing across days of total sleep deprivation—modulated bycircadian rhythmicity, such that the number of lapses was highestduring the morning hours; and performance was quickly recuper-ated following recovery sleep (red line). Tall gray bars representsleep opportunities (22:00–08:00) in both conditions; short gray barsrepresent sleep opportunities in the control condition only. Figureadapted from Whitney et al. [122] with permission
Sleep deprivation, vigilant attention, and brain function: a reviewAN Hudson et al.
22
Neuropsychopharmacology (2020) 45:21 – 30
1234567890();,:

face of chronic sleep insufficiency. Another, equivalent way tounderstand the third process is that it shifts the setpoint of thehomeostatic process around which the interplay of the pressuresfor sleep and wakefulness takes place. Thus, sustained sleep
Fig. 2 Vigilant attention and self-reported sleepiness under conditions of sustained sleep restriction. Forty-eight healthy young adults wereassigned to 3 days of acute total sleep deprivation (0 h time in bed [TIB]; n= 13; black) or 14 days of sustained sleep restriction withrandomization to 4 h TIB per day (n= 13; red), 6 h TIB per day (n= 13; yellow), or 8 h TIB per day (n= 9; green), in the laboratory. The 10-minPVT and the Stanford Sleepiness Scale (SSS) [123] were administered repeatedly during scheduled waking periods to measure vigilantattention and subjective sleepiness, respectively. Data show the daily means (±standard error) for the number of lapses (defined as responsetimes >500ms) on the PVT and the self-reported sleepiness score on the SSS, relative to baseline. The horizontal gray bands represent themean (±standard error) in the total sleep deprivation condition following 1 night and 2 nights with 0 h TIB. In the 8-h TIB condition, lapses ofattention were relatively rare and subjective sleepiness was stable and low across the study duration. In the 6 and 4-h TIB conditions, therewas a steady build-up of vigilant attention deficits on the PVT across the 14 days of sleep restriction, in a sleep dose–response manner—suchthat impairment in the 4-h TIB condition reached levels equivalent to 2–3 days of acute total sleep deprivation. However, there was no steadybuild-up of self-reported sleepiness on the SSS, and no systematic dose–response effect—such that subjective sleepiness in the 4 and 6 h TIBconditions stabilized at a much lower level than seen in the total sleep deprivation condition. Figure adapted from Van Dongen et al. [35] withpermission
Fig. 3 Vigilant attention deficits after sustained sleep restriction as afunction of sleep dose and time of day. In a laboratory study, 90healthy adults were randomized to one of 18 sustained nocturnalsleep restriction conditions with or without daytime naps of variousdurations, with the total sleep opportunity ranging from 4.2 to 8.2 hper day. A 10-min PVT was administered repeatedly duringscheduled waking periods to measure vigilant attention. Data showthe estimated means for the number of PVT lapses (defined asresponse times >500ms) after 8 days of sleep restriction, relative tobaseline, for daily total time in bed (TIB) of 4.2 h (red), 5.2 h (orange),6.2 h (yellow), and 8.2 h (green). The data reveal that thedose–response effect of sleep restriction is most pronounced inthe morning hours, while the circadian drive for wakefulnessprovides a degree of protected against vigilant attention deficitsin the afternoon (the “wake maintenance zone” [124]). Figureadapted from Mollicone et al. [39] with permission
Fig. 4 Effects of sustained sleep restriction and prior wakeextension on vigilant attention. In a laboratory study, 24 healthyyoung adults were assigned to 7 days of sustained sleep restrictionto 3 h time in bed (TIB) per day (SR1–7), followed by 5 days ofrecovery sleep at 8 h TIB per day (R1–5). In the days prior to thelaboratory study, they were randomized to a week of sleepextension to 10 h TIB per day (n= 12; black) or keeping theirhabitual sleep schedule (n= 12; red). A 5-min PVT was administeredrepeatedly during scheduled waking periods in the laboratory tomeasure vigilant attention. Data show the daily means (±standarderror) for the number of PVT lapses (defined as response times>500ms). In the prior habitual sleep condition, there was a steadybuild-up of vigilant attention deficits across days of sleep restriction,and a gradual recuperation across recovery days. In the prior sleepextension condition, however, the build-up of deficits across days ofsleep restriction was attenuated, and recuperation across recoverydays was accelerated. These results show long-term effects of sleeprestriction and extension indicative of an allostatic processmodulating the setpoint of the sleep homeostatic process. Figureadapted from Rupp et al. [40] with permission
Sleep deprivation, vigilant attention, and brain function: a reviewAN Hudson et al.
23
Neuropsychopharmacology (2020) 45:21 – 30

restriction gradually shifts the homeostatic setpoint, whileconsecutive days of extended recovery sleep gradually shift itback. Interestingly, this means that people’s sleep/wake historymay enduringly influence their baseline state and, as such, theirvulnerability to vigilant attention deficits due to sleep loss[40, 42, 44].Vigilant attention is affected by a spectrum of other,
predominantly transient, factors, including ambient temperature,light exposure, physical activity and posture, hunger, andenvironmental noise and other distractions [29]. The influencesof these and other factors are integrated with homeostatic,circadian, and allostatic processes; recent evidence suggests thatthis may occur through orexinergic/hypocretinergic neurons inthe lateral hypothalamus [45]. Vigilant attention is also signifi-cantly affected by sleep inertia, a brief period of disorientation andcognitive impairment immediately after awakening from (deep,non-REM) sleep [46]. The temporal dynamics and underlyingmechanisms of these factors are generally poorly understood, andthey are outside the scope of this paper. They have considerablepractical relevance, though, especially in work settings wheremanaging vigilant attention is critically important for productivityand safety.
INTER-INDIVIDUAL DIFFERENCESThere is wide variability among people in how much vigilantattention performance impairment they exhibit while deprived ofsleep [15, 47–50]. The same inter-individual differences in vigilantattention performance impairment are seen under conditions oftotal sleep deprivation and sustained sleep restriction [51], andthey are quite substantial (see Fig. 5). Importantly, these inter-individual differences in vulnerability to sleep loss are highlyreplicable and stable within individuals [41, 51], indicating thatthey are a trait, or phenotype. Furthermore, a study in twinsdemonstrated that vulnerability to sleep loss is heritable [52].Extensive attempts have been made to find predictors of
phenotypic vulnerability to sleep loss. Baseline levels of vigilantattention performance are to some (limited) extent predictive ofperformance impairment during total sleep deprivation [53]; as areseveral aspects of brain functioning as characterized throughfunctional neuroimaging [54], which continue to be the subject ofinvestigation [55].Much attention has been paid to genetic predictors of
phenotypic vulnerability to sleep loss, of which several have beendiscovered—predominantly genetic variants of genes associatedwith adenosinergic mechanisms that may underlie the homeo-static process [56, 57] and genetic variants of clock genes involvedin circadian rhythmicity [58, 59]. Complex biobehavioral traits tendto involve multitudes of genes, generally making it difficult toexplain even a small percentage of the observed phenotypicvariance [60]. Nonetheless, vigilant attention impairment due tosleep loss is a strongly expressed phenotype [61] (see Fig. 5), andat least one gene has been identified that predicts a relativelysubstantial portion of inter-individual variability in psychomotorvigilance impairment due to sleep loss. This concerns a singlenucleotide polymorphism of the TNFα gene, which was found toexplain 6.4% of the variance in PVT performance during total sleepdeprivation [62]. Moreover, two genetic variants of the dopami-nergic system—a variable number tandem repeat polymorphismof the DAT1 gene and a single nucleotide polymorphism of theDRD2 gene— together explained 15% of the variance in PVTperformance during total sleep deprivation [63].However, the phenotype of cognitive vulnerability due to sleep
deprivation is not a unitary phenomenon. A surprise finding in thestudy that first established inter-individual differences in vulner-ability to sleep loss as a phenotype [41] was the task-dependenceof the trait. That is, trait inter-individual differences in vigilantattention deficits as measured on the PVT were not congruent
with inter-individual differences in performance deficits on anumber of other cognitive tasks, and also not with inter-individualdifferences in self-reported sleepiness. This paradoxical resultexposed the issue that overall performance impairment on acognitive task may be caused by deficits in any of the underlyingcognitive processes—a conundrum known as the “task impurityproblem” [64]. This highlighted the importance of decomposingtask performance into the constituent cognitive processes andexamining the effects of sleep deprivation on these processesseparately [65, 66].Efforts to explore this issue further revealed that various
cognitive processes, such as working memory scanning, resistingproactive interference, semantic encoding, and motor actionplanning, may be resilient to degradation caused by sleepdeprivation [67–70]—suggesting that performance impairmentfrom sleep loss on a range of cognitive tasks may be drivenprimarily by underlying deficits in vigilant attention [71]. Interest-ingly, a recent study of human gene expression during total sleepdeprivation suggested a distinction between a large number ofgenes for which the expression profiles were non-specificallyinfluenced by time awake, and a smaller group of genes for whichthe expression profiles appeared to be more closely related to thelevel of performance impairment on the PVT in particular [72]. It iscurrently unknown whether similar gene expression patternswould emerge with respect to other performance tasks for whichperformance impairment reflects deficits in vigilant attention.These intriguing results aside, at least one other cognitive
process is also greatly affected by sleep deprivation,
Fig. 5 Inter-individual differences in vigilant attention deficitsduring periods of total sleep deprivation following two differentconditions for prior sleep/wake history. Twenty-one healthy youngadults were each exposed to 36 h of acute total sleep deprivation inthe laboratory on three separate occasions. In the week prior toeach laboratory sleep deprivation session, subjects were rando-mized to a week of sleep restriction to 6 h time in bed (TIB) per day(one session) or sleep extension to 12 h TIB per day (two sessions). A20-min PVT was administered repeatedly during scheduled wakingperiods in the laboratory to measure vigilant attention. Data showmean (±standard error) lapses of attention (response times ≥500ms), averaged across the final 24 h of each 36-h sleep deprivationperiod. While the effect of prior sleep restriction was evident (red),and consistent with the idea of a shifting homeostatic setpoint dueto prior sleep/wake history, the effect was small compared toidiosyncratic, trait inter-individual differences in vulnerability tosleep deprivation (green; 95% range). Trait inter-individual differ-ences in vulnerability to vigilant impairment due to sleep depriva-tion dominated the data set, explaining 67.5% of the variance [41]
Sleep deprivation, vigilant attention, and brain function: a reviewAN Hudson et al.
24
Neuropsychopharmacology (2020) 45:21 – 30
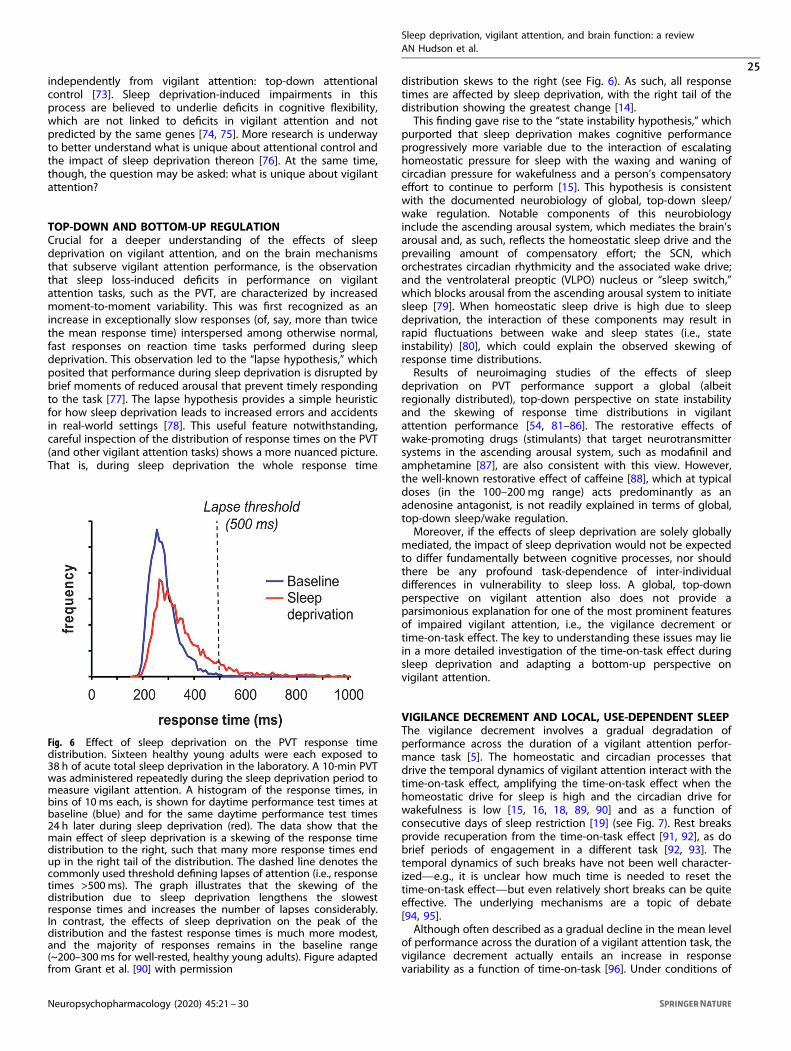
independently from vigilant attention: top-down attentionalcontrol [73]. Sleep deprivation-induced impairments in thisprocess are believed to underlie deficits in cognitive flexibility,which are not linked to deficits in vigilant attention and notpredicted by the same genes [74, 75]. More research is underwayto better understand what is unique about attentional control andthe impact of sleep deprivation thereon [76]. At the same time,though, the question may be asked: what is unique about vigilantattention?
TOP-DOWN AND BOTTOM-UP REGULATIONCrucial for a deeper understanding of the effects of sleepdeprivation on vigilant attention, and on the brain mechanismsthat subserve vigilant attention performance, is the observationthat sleep loss-induced deficits in performance on vigilantattention tasks, such as the PVT, are characterized by increasedmoment-to-moment variability. This was first recognized as anincrease in exceptionally slow responses (of, say, more than twicethe mean response time) interspersed among otherwise normal,fast responses on reaction time tasks performed during sleepdeprivation. This observation led to the “lapse hypothesis,” whichposited that performance during sleep deprivation is disrupted bybrief moments of reduced arousal that prevent timely respondingto the task [77]. The lapse hypothesis provides a simple heuristicfor how sleep deprivation leads to increased errors and accidentsin real-world settings [78]. This useful feature notwithstanding,careful inspection of the distribution of response times on the PVT(and other vigilant attention tasks) shows a more nuanced picture.That is, during sleep deprivation the whole response time
distribution skews to the right (see Fig. 6). As such, all responsetimes are affected by sleep deprivation, with the right tail of thedistribution showing the greatest change [14].This finding gave rise to the “state instability hypothesis,” which
purported that sleep deprivation makes cognitive performanceprogressively more variable due to the interaction of escalatinghomeostatic pressure for sleep with the waxing and waning ofcircadian pressure for wakefulness and a person’s compensatoryeffort to continue to perform [15]. This hypothesis is consistentwith the documented neurobiology of global, top-down sleep/wake regulation. Notable components of this neurobiologyinclude the ascending arousal system, which mediates the brain’sarousal and, as such, reflects the homeostatic sleep drive and theprevailing amount of compensatory effort; the SCN, whichorchestrates circadian rhythmicity and the associated wake drive;and the ventrolateral preoptic (VLPO) nucleus or “sleep switch,”which blocks arousal from the ascending arousal system to initiatesleep [79]. When homeostatic sleep drive is high due to sleepdeprivation, the interaction of these components may result inrapid fluctuations between wake and sleep states (i.e., stateinstability) [80], which could explain the observed skewing ofresponse time distributions.Results of neuroimaging studies of the effects of sleep
deprivation on PVT performance support a global (albeitregionally distributed), top-down perspective on state instabilityand the skewing of response time distributions in vigilantattention performance [54, 81–86]. The restorative effects ofwake-promoting drugs (stimulants) that target neurotransmittersystems in the ascending arousal system, such as modafinil andamphetamine [87], are also consistent with this view. However,the well-known restorative effect of caffeine [88], which at typicaldoses (in the 100–200 mg range) acts predominantly as anadenosine antagonist, is not readily explained in terms of global,top-down sleep/wake regulation.Moreover, if the effects of sleep deprivation are solely globally
mediated, the impact of sleep deprivation would not be expectedto differ fundamentally between cognitive processes, nor shouldthere be any profound task-dependence of inter-individualdifferences in vulnerability to sleep loss. A global, top-downperspective on vigilant attention also does not provide aparsimonious explanation for one of the most prominent featuresof impaired vigilant attention, i.e., the vigilance decrement ortime-on-task effect. The key to understanding these issues may liein a more detailed investigation of the time-on-task effect duringsleep deprivation and adapting a bottom-up perspective onvigilant attention.
VIGILANCE DECREMENT AND LOCAL, USE-DEPENDENT SLEEPThe vigilance decrement involves a gradual degradation ofperformance across the duration of a vigilant attention perfor-mance task [5]. The homeostatic and circadian processes thatdrive the temporal dynamics of vigilant attention interact with thetime-on-task effect, amplifying the time-on-task effect when thehomeostatic drive for sleep is high and the circadian drive forwakefulness is low [15, 16, 18, 89, 90] and as a function ofconsecutive days of sleep restriction [19] (see Fig. 7). Rest breaksprovide recuperation from the time-on-task effect [91, 92], as dobrief periods of engagement in a different task [92, 93]. Thetemporal dynamics of such breaks have not been well character-ized—e.g., it is unclear how much time is needed to reset thetime-on-task effect—but even relatively short breaks can be quiteeffective. The underlying mechanisms are a topic of debate[94, 95].Although often described as a gradual decline in the mean level
of performance across the duration of a vigilant attention task, thevigilance decrement actually entails an increase in responsevariability as a function of time-on-task [96]. Under conditions of
Fig. 6 Effect of sleep deprivation on the PVT response timedistribution. Sixteen healthy young adults were each exposed to38 h of acute total sleep deprivation in the laboratory. A 10-min PVTwas administered repeatedly during the sleep deprivation period tomeasure vigilant attention. A histogram of the response times, inbins of 10 ms each, is shown for daytime performance test times atbaseline (blue) and for the same daytime performance test times24 h later during sleep deprivation (red). The data show that themain effect of sleep deprivation is a skewing of the response timedistribution to the right, such that many more response times endup in the right tail of the distribution. The dashed line denotes thecommonly used threshold defining lapses of attention (i.e., responsetimes >500ms). The graph illustrates that the skewing of thedistribution due to sleep deprivation lengthens the slowestresponse times and increases the number of lapses considerably.In contrast, the effects of sleep deprivation on the peak of thedistribution and the fastest response times is much more modest,and the majority of responses remains in the baseline range(~200–300ms for well-rested, healthy young adults). Figure adaptedfrom Grant et al. [90] with permission
Sleep deprivation, vigilant attention, and brain function: a reviewAN Hudson et al.
25
Neuropsychopharmacology (2020) 45:21 – 30

sleep deprivation, the increase in response variability over time-on-task is accelerated [15]. The effects of sleep deprivation andtime-on-task on response variability are thus similar and interact-ing—and also involve overlapping brain areas as seen infunctional neuroimaging experiments [97]—which has beeninterpreted as evidence that these effects may essentially be thesame [19]. However, whereas the time-on-task effect can beovercome by a mere rest break, the effect of sleep deprivation canonly be undone by a period of sleep.This paradox may be resolved by considering “local sleep
theory,” which posits that sleep may be expressed locally in thebrain—at the level of neuronal/glial assemblies, such as corticalcolumns—in a bottom-up, use-dependent manner [98]. In thelocal sleep state, neuronal/glial assemblies show synchronizedfiring patterns typical of the sleeping brain, with short bursts ofhigh activity followed by brief periods of inactivity that arecharacteristic of slow wave sleep [99–101]. Furthermore, theyshow altered neuronal input–output relationships resulting inhigh-amplitude evoked responses typical of the sleeping brain[102], which are reversible and show homeostatic and use-dependent properties that are also typical of the sleeping brain[102–104]. However, they can do so independent of the states ofneighboring neuronal/glial assemblies and independent ofthe global brain state [102]. For a review of local sleep theory,see ref. [98].Local sleep theory’s relevance for vigilant attention has been
illustrated in a whisker-twitching experiment in rats, in whichspecific whisker barrels (i.e., cortical columns) exhibited evokedresponses characteristic of sleep, while other whisker barrelssimultaneously exhibited evoked responses characteristic of
wakefulness and while the whole organism was functionallyawake. The probability of a whisker barrel entering the local sleepstate increased with time spent in the wake state and the intensityof stimulation of the associated whisker, indicating a homeostatic,use-dependent process [102]. Notably, rats trained to monitor andrespond to stimulation of a specific whisker showed greaterperformance impairment (more failures to respond) when thecorresponding whisker barrel had been driven into the local sleepstate [103]. Similarly, in humans implanted with intracranialelectrodes to record single neurons, local changes in neuronalactivity were observed immediately prior to lapses of attention onthe PVT [105]. Collectively, these results suggest that repeatedstimulation of the same neuronal circuitry produces local sleep inthat circuitry, which results in degraded information processingand increased variability in task performance [19].This bottom-up perspective on performance impairment in
vigilant attention tasks may explain a number of otherwiseunexplained phenomena at the intersection of human vigilantattention and sleep deprivation [106]. Although task performancein humans is unlikely to rely critically on information processing byonly a single cortical column, there are components of cognitivepathways with relatively sparse circuitry—such as visuospatialmental operations in the precuneus and posterior cingulate cortex[107]—which represent a potential bottleneck for cognitiveprocessing. Extended and/or intensive use of such circuitrythrough sleep deprivation and/or task performance may resultin expression of local sleep and consequent degradation ofinformation processing, leading to a steady increase in perfor-mance instability [19]. This would explain the pervasive linkbetween the vigilance decrement and monotony (i.e., persistentuse of the same brain circuitry) [108, 109], and suggests that whatis commonly experienced as “boredom” during monotonous tasksmay actually be an epiphenomenon of the occurrence oflocal sleep.During a rest break (or after switching to another task not
critically affected by the same bottleneck for cognitive proces-sing), the specific circuitry involved in the prior task can recoverthrough local sleep (without any overt impact, since that circuitryis no longer being relied upon). Thus, a rest break may beconceptualized as an opportunity for local sleep to overcome thetime-on-task effect, functionally equivalent to how global sleepovercomes the overall effect of sleep deprivation on cognitiveperformance.People may vary in the degree of sparsity of circuits that are
potential bottlenecks for cognitive processing. That is, they maydiffer from each other in how much or how little redundancy thereis in the capacity to process information—and this level ofredundancy (or “cognitive capacity”) may be dissimilar acrossdistinct circuits in a given individual’s brain. This would provide aplausible explanation for why different cognitive processes arefound to be differentially affected by sleep deprivation [66] andwhy there is considerable task-dependence in the inter-individualdifferences in vulnerability to sleep deprivation [55]. It has alsobeen suggested as an explanation for developmental changes invulnerability to vigilant attention performance impairment inadolescents [110].Furthermore, local sleep theory predicts that the effect of sleep
deprivation on cognitive performance is modulated by informa-tion processing load (or “task load”). For example, it has beenshown that performance deficits on a visual short-term memorytask occur especially in individuals who fail to maintain baselinelevels of brain activation in the precuneus and posterior cingulatecortex (as observed through functional neuroimaging) while sleepdeprived and under high processing load [111]—presumablybecause these individuals have less redundancy in that task-critical neuronal circuitry and thus suffer the consequences oflocal sleep induced by sleep deprivation and informationprocessing load more strongly [55].
Fig. 7 Effect of sustained sleep restriction on the time-on-taskeffect. Following a baseline period, 66 healthy young adults wereassigned to 7 days of sustained sleep restriction or extension, withdaily time in bed (TIB) randomized to 3 h (n= 18; red), 5 h (n= 16;orange), 7 h (n= 16; green), or 9 h (n= 16; blue), which was followedby 3 days of recovery sleep at 8 h TIB daily. A 10-min PVT wasadministered repeatedly during scheduled waking periods tomeasure vigilant attention. Data show average response times per1-min bin (not drawn to scale on the time axis) during a baseline day(BL), during the 7 days of experimental sleep restriction or extension(E1–7), and during the 3 recovery days (R1–3). In each of theconditions, there was a general increase of the 1-min averageresponse time across the 10-min task duration, which was reset bythe rest breaks between the test bouts. This time-on-task effect wasexacerbated as a function of consecutive days of sleep restriction,with shorter sleep durations corresponding to greater time-on-taskeffects in a dose–response manner. The time-on-task effect wasdiminished across consecutive recovery days. Figure adapted fromVan Dongen et al. [19] with permission
Sleep deprivation, vigilant attention, and brain function: a reviewAN Hudson et al.
26
Neuropsychopharmacology (2020) 45:21 – 30

This same line of reasoning may provide an explanation for thecounterintuitive observation that performance on the relatively brief(i.e., 10-min) PVT is more sensitive to sleep deprivation thanperformance on classical vigilant attention performance tasks withinfrequent critical signals and much longer task duration. Specifi-cally, the PVT has a much higher stimulus density and thus presentsa greater information processing load, persistently engaging thesame neuronal circuitry [19]. Intriguingly, it would follow that thePVT has been such a useful tool for research on sleep deprivationand vigilant attention [24] because it probes the susceptibility of akey attentional network in the brain to local sleep by very effectivelyinducing local sleep in that network, with definite, readilyinterpretable consequences for the response time distribution.This theoretical account of sleep deprivation and vigilant
attention has been supported by research based on cognitive
modeling [112, 113]. Additionally, a (simplified) model for theneurobiological underpinnings, which combines bottom-up andtop-down views on vigilant attention, has been proposed (seeFig. 8).
FUTURE RESEARCH DIRECTIONSThe conceptual model shown in Fig. 8 of the neurobiologicalunderpinnings of vigilant attention deficits and the impact ofsleep deprivation, time-on-task, rest breaks, and recovery sleep is,of course, an oversimplification of the mechanisms underlyingsleep regulation and cognition. Modern experimental techniquessuch as optogenetics and chemogenetics are sketching anincreasingly complex picture of the regulatory mechanismsinvolved [45, 114]. Nonetheless, evidence has been accumulating
ATP Adenosine
Glial cell
P2X7R
P1R
NFκB
ADA
Postsynapticneuron
Presynapticneuron
CellActivity
IL1R
TNFR
TrkR
SRSs
BDNF
TNFα
IL1β
SCN
VLPO
LC
LDTPPTRaphe
Thalamus
BF
TMN
LH
Fig. 8 Conceptual model pertaining to the effects of sleep deprivation on vigilant attention. Left: The ascending arousal system (AAS)promotes global arousal throughout the cortex by means of wide-ranging projections (red pathways). These projections originate fromcholinergic structures in the brainstem (PPT, pedunculopontine tegmental nucleus; LDT, laterodorsal tegmental nucleus) and basal forebrain(BF), monoaminergic structures in the BF and hypothalamus (e.g., LC locus coeruleus; TMN tuberomammillary nucleus; raphe nuclei), andorexinergic/hypocretinergic neurons in the lateral hypothalamus (LH), modulated by circadian rhythmicity generated in the suprachiasmaticnucleus (SCN). The strength of arousal from these projections, through interaction between cortical glutamatergic excitatory neurons, andGABAergic inhibitory neurons in the cortex (not shown), instantiates the homeostatic and circadian processes reflecting prior wakefulness andtime of day and mediates the propensity for local sleep at the level of neuronal/glial assemblies. This propensity is manifested as a consequenceof intense neuronal use in support of information processing during vigilant attention task performance, in task-activated cortical areas suchas the precuneus (magnifying glass). Right: Information processing in a neuronal/glial assembly triggers a series of biochemical processes thatinduce the local sleep state. Synaptic transmission is associated with increased local metabolic activity and energy transfer and release ofadenosine triphosphate (ATP) from presynaptic neurons and glial cells into the extracellular space. Breakdown of extracellular ATP to recoverthe energy captured in the phosphoryl groups results in use-dependent accumulation of adenosine. Binding of adenosine at postsynapticadenosine receptors (P1R purine type 1 receptors) promotes local sleep, thereby fundamentally altering the neuronal assembly’s synaptictransmission. As a consequence, the fidelity of task-relevant information processing is degraded in a use-dependent manner, modulated bythe strength of subcortical arousal from the AAS. This gives rise to the time-on-task effect (vigilance decrement) in interaction with thehomeostatic and circadian processes. A rest break (or switching to a task that does not intensively use the same neuronal/glial assemblies)allows adenosine levels to decay (e.g., through the enzymatic action of ADA, adenosine deaminase), thereby resetting the time-on-task effect.Binding of ATP, prior to breakdown, to purine type 2X7 receptors (P2X7R) leads to release of a cascade of sleep regulatory substances (SRSs),such as interleukin-1β (IL-1β), tumor necrosis factor α (TNFα), and brain-derived neurotrophic factor (BDNF). Sustained wakefulness allows SRSsto accumulate and, via their receptors and nuclear factor κB (NF-κB), causes the density of postsynaptic adenosine receptors to increase. Thisleads to a build-up of the propensity for use-dependent local sleep across consecutive days of wake extension. Across days of recovery sleep,adenosine receptors downregulate and the baseline propensity for local sleep is gradually restored. Left and right: Through mechanisms yet tobe elucidated, accumulation of SRSs across the cortex reflecting the collective states of neuronal/glial assemblies is signaled to subcorticalcircuits (transparent downward arrows), influencing in particular the ventrolateral preoptic nucleus (VLPO). In response, the VLPO blocks theAAS and induces local sleep across the whole cortex (i.e., global sleep), which enables restoration of baseline SRS concentrations and allowsrecuperation from prior information processing deficits across neuronal/glial assemblies. Figure adapted from a schematic in Van Dongenet al. [19], with visual elements derived from Saper et al. [79] and Davis et al. [125]
Sleep deprivation, vigilant attention, and brain function: a reviewAN Hudson et al.
27
Neuropsychopharmacology (2020) 45:21 – 30
for many of the individual components of the model in Fig. 8, suchas the top-down regulation of neuronal activity by the homeo-static and circadian processes [115], the bottom-up, use-dependent drive for local sleep in neuronal/glial assemblies[102], the variability in cognitive processing due to local sleep[103], the binding of extracellular ATP to purine type 2 (X7)receptors [116], key aspects of the signaling mechanisms involvingsleep regulatory substances [117, 118], and the upregulation ofpurine type 1 (A1) receptors in response to prior sleep loss [119].Even so, the proposed neurobiological integration of the
bottom-up and top-down aspects depicted in Fig. 8 awaitsexperimental confirmation. This facet of the model could beinvestigated, for example, by measuring performance on asequence of alternating cognitive tasks, one being a vigilantattention task, such as the PVT, and another being a taskassociated with intense use of a different neuronal pathway,during sleep deprivation. By comparing the result with sleep-deprived performance on just the PVT, extended to match for totalduration of performance testing, the interaction between bottom-up, use-dependent regulation of the time-on-task effect and top-down, homeostatic regulation of the sleep deprivation effectwould be exposed.The model of Fig. 8 would predict that continued testing on the
extended PVT results in progressively worsening performance (perthe time-on-task effect), as has been found [120]. However, even ifthe other task exhibits a time-on-task effect also, the model wouldnot predict that performance would continue to worsen across thesequence of alternating tasks. Rather, it would predict thattemporarily engaging in the other task allows the neuronsspecifically used intensively in the PVT to recover so as to resetthe time-on-task effect. Thus, the other task would effectivelyserve as a “rest break” for the PVT. If this prediction does not holdtrue, then the model needs to be revised.Several other important implications to the specifics of the
interplay between local and global processes remain to beinvestigated. For example, if performance of a vigilant attentiontask, such as the PVT, induces the local sleep state, does that thenalso influence the global homeostatic process, such that repeatedperformance of the PVT across a period of sleep deprivation wouldaccelerate the build-up of sleep pressure (as compared to notperforming the task during sleep deprivation)? And if so, what isthe signaling mechanism for this local-to-global interaction? Also,would it work the same way for performance tasks that do notrequire much vigilant attention, but rather rely critically on, say,attentional control or emotional control? Might this explain why aday full of social interaction can make one feel particularly sleepy?And could addressing these issues shed any light on whysustained sleep restriction leads to cumulative deficits in cognitiveperformance, but not in homeostatic sleep markers (e.g., deltapower in the non-REM EEG or theta power in the waking EEG[32, 35])—suggesting a fundamental distinction between theregulation of sleep and wakefulness versus the regulation ofwaking alertness and performance?Sleep deprivation represents a powerful, reversible intervention
that allows for the probing of vigilant attention and other aspectsof cognition, as well as the underlying mechanisms [61, 73].Ultimately, research on sleep deprivation, vigilant attention, andbrain function may help to determine fixed and/or malleableconnections between specific neuronal pathways with specificcognitive processes, which may yield new insights with respect tothe elusive mind-body problem [121].
FUNDING AND DISCLOSUREThis work was supported by the Office of the Assistant Secretary ofDefense for Health Affairs, through the Peer Reviewed MedicalResearch Program under award no. W81XWH-16-1-0319 andthrough the FY17, Broad Agency Announcement for Extramural
Medical Research under award no. W81XWH-18-1-0100. Opinions,interpretations, conclusions and recommendations are those ofthe authors and are not necessarily endorsed by the Departmentof Defense. This work was also supported by Defense UniversityResearch Instrumentation Program grant N00014-17-1-2990 andin part by NIH grant R01HL105768 (Fig. 1) and NASA grant NAG9-1161 (Fig. 5). The authors declare that they have no conflict ofinterest.
ACKNOWLEDGEMENTSWe thank James Krueger, Radhika Basheer, and Christopher Davis for their helpfulsuggestions with regard to local sleep theory and Fig. 8.
ADDITIONAL INFORMATION
Publisher’s note: Springer Nature remains neutral with regard to jurisdictional claimsin published maps and institutional affiliations.
REFERENCES1. Warm J, Parasuraman R, Matthews G. Vigilance requires hard mental work and is
stressful. Hum Factors. 2008;50:433–41.2. Green DM, Swets JA. Signal detection theory and psychophysics. New York City,
NY: Wiley; 1966.3. Rieke F, Warland D, de Ruyter van Steveninck RR, Bialek W. Spikes: exploring the
neural code. Cambridge, MA: MIT Press; 1998.4. Chavali VP, Riedy SM, Van Dongen HPA. Signal-to-noise ratio in PVT perfor-
mance as a cognitive measure of the effect of sleep deprivation on the fidelityof information processing. Sleep. 2017;40:zsx016.
5. Mackworth JF. Performance decrement in vigilance, threshold, and high-speedperceptual motor tasks. Can J Psychol. 1964;18:209–23.
6. Broadbent DE. Perception and communication. London: Pergamon; 1958.7. Parasuraman R, Davies DR. A taxonomic analysis of vigilance. In: Mackie RR, ed.
Vigilance: theory, operational performance and physiological correlates. NewYork, NY: Plenum; 1977. p. 559–74.
8. Mackworth JF. Vigilance and habituation. Baltimore: Penguin; 1969.9. Parasuraman R. Sustained attention: a multifactorial approach. In: Posner M,
Marin O, ed. Attention and performance XI. Hillsdale, NJ: Lawrence Erlbaum;1985. p. 493–511.
10. Manly T, Robertson IH, Galloway M, Hawkins K. The absent mind: furtherinvestigations of sustained attention to response. Neuropsychologia.1999;37:661–70.
11. Pattyn N, Neyt X, Henderickx D, Soetens E. Psychophysiological investigation ofvigilance decrement: boredom or cognitive fatigue? Physiol Behav.2008;93:369–78.
12. Kjellberg A. Sleep deprivation and some aspects of performance II. Lapses andother attentional effects. Waking Sleep. 1977;1:145–8.
13. Horne JA, Anderson NR, Wilkinson RT. Effects of sleep deprivation on signaldetection measures of vigilance: implications for sleep function. Sleep.1983;6:347–58.
14. Dinges DF, Kribbs NB. Performing while sleepy: effects of experimentally-induced sleepiness. In: Monk TF, ed. Sleep, sleepiness, and performance. NewYork, NY: Wiley; 1991. p. 97–128.
15. Doran SM, Van Dongen HPA, Dinges DF. Sustained attention performanceduring sleep deprivation: evidence of state instability. Arch Ital Biol.2001;139:253–67.
16. Wilkinson RT. Effects of up to 60 hours’ sleep deprivation on different types ofwork. Ergonomics. 1964;7:175–86.
17. Kribbs NB, Dinges DF. Vigilance decrement and sleepiness. In: Harsh JR, OgilvieRD, eds. Sleep onset mechanisms. Washington, DC: American PsychologicalAssociation; 1994. p. 113–25.
18. Wesensten NJ, Belenky G, Thorne DR, Kautz MA, Balkin TJ. Modafinil vs. caffeine:effects on fatigue during sleep deprivation. Aviat Space Environ Med.2004;75:520–5.
19. Van Dongen HPA, Belenky G, Krueger JM. Investigating the temporal dynamicsand underlying mechanisms of cognitive fatigue. In: Ackerman PL, ed. Cognitivefatigue: multidisciplinary perspective on current research and future applica-tions. Washington, DC: American Psychological Association; 2011. p. 127–47.
20. Dinges DF, Powell JW. Microcomputer analyses of performance on a portable,simple visual RT task during sustained operations. Behav Res Meth Ins C.1985;17:652–5.
Sleep deprivation, vigilant attention, and brain function: a reviewAN Hudson et al.
28
Neuropsychopharmacology (2020) 45:21 – 30
21. Dorrian J, Rogers NL, Dinges DF. Psychomotor vigilance performance: neuro-cognitive assay sensitive sleep loss. In: Kushida CA, ed. Sleep deprivation: clinicalissues, pharmacology, and sleep loss effects. New York, NY: Marcel Dekker; 2005.p. 39–70.
22. Basner M, Dinges DF. Maximizing sensitivity of the psychomotor vigilance test(PVT) to sleep loss. Sleep. 2011;34:581–91.
23. Lim J, Wu WC, Detre JA, Dinges DF, Rao H. Imaging brain fatigue from sustainedmental workload: an ASL perfusion study of the time-on-task effect. Neuro-image. 2010;49:3426–35.
24. Lim J, Dinges DF. Sleep deprivation and vigilant attention. Ann N Y Acad Sci.2008;1129:305–22.
25. Basner M, Hermosillo E, Nasrini J, McGuire S, Saxena S, Moore TM, et al. Repe-ated administration effects on psychomotor vigilance test performance. Sleep.2018;41:zsx187.
26. Borbély AA. A two process model of sleep regulation. Hum Neurobiol.1982;1:195–204.
27. Achermann P, Borbély AA. Simulation of daytime vigilance by the additiveinteraction of a homeostatic and a circadian process. Biol Cybern.1994;71:115–21.
28. Daan S, Beersma DG, Borbély AA. Timing of human sleep: recovery processgated by circadian pacemaker. Am J Physiol. 1984;246:R161–83.
29. Gabehart RJ, Van Dongen HPA. Circadian rhythms in sleepiness, alertness, andperformance. In: Kryger MH, Roth T, Dement WC, eds. Principles and practice ofsleep medicine. 6th ed. Philadelphia: Elsevier; 2016. p. 388–95.
30. Dijk DJ, Duffy JF, Czeisler CA. Circadian and sleep/wake dependent aspects ofsubjective alertness and cognitive performance. J Sleep Res. 1992;1:112–7.
31. Van Dongen HPA, Dinges DF. Investigating the interaction between thehomeostatic and circadian processes of sleep-wake regulation for the predictionof waking neurobehavioural performance. J Sleep Res. 2003;12:181–7.
32. Van Dongen HPA, Rogers NL, Dinges DF. Sleep debt: theoretical and empiricalissues. Sleep Biol Rhythms. 2003;1:5–13.
33. Dinges DF, Pack F, Williams K, Gillen KA, Powell JW, Ott GE, et al. Cumulativesleepiness, mood disturbance, and psychomotor vigilance performance decre-ments during a week of sleep restricted to 4–5 hours per night. Sleep.1997;20:267–77.
34. Belenky G, Wesensten N, Thorne DR, Thomas ML, Sing HC, Redmond DP, et al.Patterns of performance degradation and restoration during sleep restrictionand subsequent recovery: a sleep dose–response study. J Sleep Res.2003;12:1–12.
35. Van Dongen HPA, Maislin G, Mullington JM, Dinges DF. The cumulative cost ofadditional wakefulness: dose–response effects on neurobehavioral functionsand sleep physiology from chronic sleep restriction and total sleep deprivation.Sleep. 2003;26:117–26.
36. Banks S, Van Dongen HPA, Maislin G, Dinges DF. Neurobehavioral dynamicsfollowing chronic sleep restriction: dose–response effects of one night forrecovery. Sleep. 2010;33:1013–26.
37. McCauley P, Kalachev LV, Smith AD, Belenky G, Dinges DF, Van Dongen HPA. Anew mathematical model for the homeostatic effects of sleep loss on neuro-behavioral performance. J Theor Biol. 2009;256:227–39.
38. McHill AW, Hull JT, Wang W, Czeisler CA, Klerman EB. Chronic sleep curtailment,even without extended (>16-h) wakefulness, degrades human vigilance per-formance. Proc Natl Acad Sci USA. 2017;115:6070–5.
39. Mollicone DJ, Van Dongen HPA, Rogers NL, Banks S, Dinges DF. Time of daymodulates the effects of chronic sleep restriction on neurobehavioral perfor-mance. Aviat Space Environ Med. 2010;81:735–44.
40. Rupp TL, Wesensten NJ, Bliese PD, Balkin TJ. Banking sleep: realization of ben-efits during subsequent sleep restriction and recovery. Sleep. 2009;32:311–21.
41. Van Dongen HPA, Baynard MD, Maislin G, Dinges DF. Systematic interindividualdifferences in neurobehavioral impairment from sleep loss: evidence of trait-likedifferential vulnerability. Sleep. 2004;27:423–33.
42. Arnal PJ, Sauvet F, Leger D, van Beers P, Bayon V, Bougard C, et al. Benefits ofsleep extension on sustained attention and sleep pressure before and duringtotal sleep deprivation and recovery. Sleep. 2015;38:1935–43.
43. Karatsoreos IN, McEwen BS. Psychobiological allostasis: resistance, resilience andvulnerability. Trends Cogn Sci. 2011;15:576–84.
44. Grant DA, Van Dongen HPA. Individual differences in sleep duration andresponses to sleep loss. In: Shaw P, Tafti M, Thorpy MJ, eds. The genetic basis ofsleep and sleep disorders. Cambridge, UK: Cambridge University Press; 2013.p. 189–96.
45. Eban-Rothschild A, Appelbaum L, de Lecea L. Neuronal mechanisms for sleep/wake regulation and modulatory drive. Neuropsychopharmacology.2018;43:937–52.
46. Dinges DF. Are you awake? Cognitive performance and reverie during thehypnopompic state. In: Bootzin RR, Kihlstrom JF, Schacter DL, eds. Sleep and
cognition. Washington, DC: American Psychological Association; 1990.p. 159–75.
47. Wilkinson RT. Interaction of lack of sleep with knowledge of results, repeatedtesting, and individual differences. J Exp Psychol. 1961;62:263–71.
48. Leproult R, Colecchia EF, Berardi AM, Stickgold R, Kosslyn SM, Van Cauter E.Individual differences in subjective and objective alertness during sleep depri-vation are stable and unrelated. Am J Physiol Regul Integr Comp Physiol.2003;284:R280–90.
49. Frey DJ, Badia P, Wright KP. Inter- and intra-individual variability in performancenear the circadian nadir during sleep deprivation. J Sleep Res. 2004;13:305–15.
50. Van Dongen HPA, Caldwell JA Jr., Caldwell JL. Investigating systematic individualdifferences in sleep-deprived performance on a high-fidelity flight simulator.Beh Res Methods. 2006;38:333–43.
51. Rupp TL, Wesensten NJ, Balkin TJ. Trait-like vulnerability to total and partialsleep loss. Sleep. 2012;35:1163–72.
52. Kuna ST, Maislin G, Pack FM, Staley B, Hachadoorian R, Coccaro EF, et al. Her-itability of performance deficit accumulation during acute sleep deprivation intwins. Sleep. 2012;35:1223–33.
53. Patanaik A, Chee KK, Chua ECP, Gooley JJ, Chee MWL. Classifying vulnerability tosleep deprivation using baseline measures of psychomotor vigilance. Sleep.2015;38:723–34.
54. Chee MWL, Tan JC. Lapsing when sleep deprived: neural activation character-istics of resistant and vulnerable individuals. Neuroimage. 2010;51:835–43.
55. Chee MWL, Van Dongen HPA. Functional imaging of inter-individual differencesin response to sleep deprivation. In: Nofzinger E, Maquet P, Thorpy MJ, eds.Neuroimaging of sleep and sleep disorders. Cambridge, UK: Cambridge Uni-versity Press; 2013. p. 154–62.
56. Rétey JV, Martin A, Gottselig JM, Khatami R, Dürr R, Achermann P, et al. Ade-nosinergic mechanisms contribute to individual differences in sleepdeprivation-induced changes in neurobehavioral function and brain rhythmicactivity. J Neurosci. 2006;26:10472–79.
57. Bachmann V, Klaus F, Bodenmann S, Schäfer N, Brugger P, Huber S, et al.Functional ADA polymorphism increases sleep depth and reduces vigilantattention in humans. Cereb Cortex. 2012;22:962–70.
58. Viola AU, Archer SN, James LM, Groeger JA, Lo JC, Skene DJ, et al. PER3 poly-morphism predicts sleep structure and waking performance. Curr Biol.2007;17:613–8.
59. Pellegrino R, Halil Kavakli O, Goel N, Cardinale CJ, Dinges DF, Kuna ST, et al. Anovel BHLHE41 variant is associated with short sleep and resistance to sleepdeprivation in humans. Sleep. 2014;37:1327–36.
60. Gibson G. Rare and common variants: twenty arguments. Nat Rev Genet.2012;13:135–45.
61. Satterfield BC, Stucky B, Landolt HP, Van Dongen HPA. Unraveling the geneticunderpinnings of sleep deprivation-induced impairments in human cognition.Prog Brain Res. 2019;246:127–58.
62. Satterfield BC, Wisor JP, Field SA, Schmidt MA, Van Dongen HPA. TNFα G308Apolymorphism is associated with resilience to sleep deprivation-induced psy-chomotor vigilance performance impairment in healthy young adults. Brain BehImmun. 2015;47:66–74.
63. Holst SC, Müller T, Valomon A, Seebauer B, Berger W, Landolt HP. Functionalpolymorphisms in dopaminergic genes modulate neurobehavioral and neuro-physiological consequences of sleep deprivation. Sci Rep. 2017;7:45982.
64. Whitney P, Hinson JM. Measurement of cognition in studies of sleep depriva-tion. Prog Brain Res. 2010;185:37–48.
65. Ratcliff R, Van Dongen HPA. Sleep deprivation affects multiple distinct cognitiveprocesses. Psychon Bull Rev. 2009;16:742–51.
66. Jackson ML, Gunzelmann G, Whitney P, Hinson JM, Belenky G, Rabat A, et al.Deconstructing and reconstructing cognitive performance in sleep deprivation.Sleep Med Rev. 2013;17:215–25.
67. Habeck C, Rakitin BC, Moeller J, Scarmeas N, Zarahn E, Brown T. An event-relatedfMRI study of the neurobehavioral impact of sleep deprivation on performanceof a delayed-match-to-sample task. Cogn Brain Res. 2004;18:306–21.
68. Tucker AM, Whitney P, Belenky G, Hinson JM, Van Dongen HPA. Effects of sleepdeprivation on dissociated components of executive functioning. Sleep.2010;33:47–57.
69. Honn KA, Grant DA, Hinson JM, Whitney P, Van Dongen HPA. Total sleepdeprivation does not significantly degrade semantic encoding. Chronobiol Int.2018;35:746–9.
70. Fournier LR, Hansen DA, Stubblefield AM, Van Dongen HPA. Action plan inter-rupted: resolution of proactive interference while coordinating execution ofmultiple action plans during sleep deprivation. Psychol Res. 2018; epub aheadof print, https://doi.org/10.1007/s00426-018-1054-z.
71. Lim J, Dinges DF. A meta-analysis of the impact of short-term sleep deprivationon cognitive variables. Psychol Bull. 2010;136:375–89.
Sleep deprivation, vigilant attention, and brain function: a reviewAN Hudson et al.
29
Neuropsychopharmacology (2020) 45:21 – 30
72. Uyhelji HA, Kupfer DM, White VL, Jackson ML, Van Dongen HPA. Exploring geneexpression biomarker candidates for neurobehavioral impairment from totalsleep deprivation. BMC Genom. 2018;19:341.
73. Whitney P, Hinson JM, Satterfield BC, Grant DA, Honn KA, Van Dongen HPA.Sleep deprivation diminishes attentional control effectiveness and impairsflexible adaptation to changing conditions. Sci Rep. 2017;7:16020.
74. Satterfield BC, Hinson JM, Whitney P, Schmidt MA, Wisor JP, Van Dongen HPA.Catechol-O-methyltransferase (COMT) genotype affects cognitive control duringtotal sleep deprivation. Cortex. 2018;99:179–86.
75. Honn KA, Hinson JM, Whitney P, Van Dongen HPA. Cognitive flexibility: a distinctelement of performance impairment due to sleep deprivation. Accid Anal Prev.2019;126:191–7.
76. Whitney P, Hinson JM, Nusbaum AT. A dynamic attentional control frameworkfor understanding sleep deprivation effects on cognition. Prog Brain Res.2019;246:111–26.
77. Williams HL, Lubin A, Goodnow JJ. Impaired performance with acute sleep loss.Psychol Monogr. 1959;73:1–26.
78. Van Dongen HPA, Balkin TJ, Hursh SR. Performance deficits during sleep lossand their operational consequences. In: Kryger MH, Roth T, Dement WC, eds.Principles and practice of sleep medicine. 6th ed. Philadelphia: Elsevier; 2016.p. 682–8.
79. Saper CB, Scammell TE, Lu J. Hypothalamic regulation of sleep and circadianrhythms. Nature. 2005;437:1257–63.
80. Phillips AJK, Robinson PA. A quantitative model of sleep-wake dynamics basedon the physiology of the brainstem ascending arousal system. J Biol Rhythms.2007;22:167–79.
81. Portas CM, Rees G, Howseman AM, Josephs O, Turner R, Frith CD. A specific rolefor the thalamus in mediating the interaction of attention and arousal inhumans. J Neurosci. 1998;18:8979–89.
82. Drummond SPA, Bischoff-Grethe A, Dinges DF, Ayalon I, Mednick SC, Meloy MJ.The neural basis of the psychomotor vigilance task. Sleep. 2005;28:1059–68.
83. Chee MWL, Tan JC, Zheng H, Parimal S, Weissman DH, Zagorondnov V, et al.Lapsing during sleep deprivation is associated with distributed changes in brainactivation. J Neurosci. 2008;28:5519–28.
84. Tomasi D, Wang RL, Telang F, Boronikolas V, Jayne MC, Wang GJ, et al.Impairment of attentional networks after 1 night of sleep deprivation. CerebCortex. 2009;19:233–40.
85. Tucker AM, Rakitin BC, Basner RC, Gazes Y, Steffener J, Stern Y. fMRI activationduring failures to respond key to understanding performance changes withsleep deprivation. Behav Brain Res. 2011;218:73–9.
86. De Havas JA, Parimal S, Soon CS, Chee MW. Sleep deprivation reduces defaultmode network connectivity and anti-correlation during rest and task perfor-mance. Neuroimage. 2012;59:1745–51.
87. Killgore WD, Rupp TL, Grugle NL, Reichardt RM, Lipizzi EL, Balkin TJ. Effects ofdextroamphetamine, caffeine and modafinil on psychomotor vigilance testperformance after 44 h of continuous wakefulness. J Sleep Res. 2008;17:309–21.
88. Paech M, Banks S, Pajcin M, Grant C, Johnson K, Kamimori GH, et al. Caffeineadministration at night during extended wakefulness effectively mitigatesperformance impairment but not subjective assessments of fatigue and slee-piness. Pharm Biochem Behav. 2016;145:27–32.
89. Angus RG, Heslegrave RJ. Effects of sleep loss on sustained cognitive perfor-mance during a command and control simulation. Behav Res Meth Ins C.1985;17:55–67.
90. Grant DA, Honn KA, Layton ME, Riedy SM, Van Dongen HPA. 3-minute smart-phone-based and tablet based psychomotor vigilance tests for the assessmentof reduced alertness due to sleep deprivation. Behav Res Methods.2017;49:1020–9.
91. Bergum BO, Lehr DJ. Vigilance performance as a function of interpolated rest. JAppl Psychol. 1962;46:425–7.
92. Ralph BC, Onderwater K, Thomson DR, Smilek D. Disrupting monotony whileincreasing demand: benefits of rest and intervening tasks on vigilance. PsycholRes. 2017;81:432–44.
93. Ariga A, Lleras A. Brief and rare mental “breaks” keep you focused: deactivationand reactivation of task goals preempt vigilance decrements. Cognition.2011;118:439–43.
94. Helton WS, Russell PN. Rest is best: the role of rest and task interruptions onvigilance. Cognition. 2015;134:165–73.
95. Haubert A, Walsh M, Boyd R, Morris M, Wiedbusch M, Krusmark M, et al. Rela-tionship of event-related potentials to the vigilance decrement. Front Psychol.2018;9:237.
96. Bills AG. Blocking: a new principle in mental fatigue. Am J Psychol.1931;43:230–45.
97. Asplund CL, Chee MW. Time-on-task and sleep deprivation effects are evi-denced in overlapping brain areas. Neuroimage. 2013;82:326–35.
98. Krueger JM, Rector DM, Roy S, Van Dongen HPA, Belenky G, Panksepp J. Sleep asa fundamental property of neuronal assemblies. Nat Rev Neurosci. 2008;9:910–9.
99. Vyazovskiy VV, Olcese U, Hanlon EC, Nir Y, Cirelli C, Tononi G. Local sleep inawake rats. Nature. 2011;472:443–7.
100. Hinard V, Mikhail C, Pradervand S, Curie T, Houtkooper RH, Auwerx J, et al. Keyelectrophysiological, molecular, and metabolic signatures of sleep and wake-fulness revealed in primary cortical cultures. J Neurosci. 2012;32:12506–17.
101. Jewett KA, Taishi P, Sengupta P, Roy S, Davis CJ. Tumor necrosis factor enhancesthe sleep-like state and electrical stimulation induces a wake-like state in co-cultures of neurons and glia. Eur J Neurosci. 2015;42:2078–90.
102. Rector DM, Topchiy IA, Carter KM, Rojas MJ. Local functional state differencesbetween rat cortial columns. Brain Res. 2005;1047:45–55.
103. Krueger JM, Huang YH, Rector DM, Buysse DJ. Sleep: a synchrony of cell activity-driven small network states. Eur J Neurosci. 2013;38:2199–209.
104. Murphy M, Huber R, Esser S, Riedner BA, Massimini M, Ferrarelli F, et al. Thecortical topography of local sleep. Curr Top Med Chem. 2011;11:2438–46.
105. Nir Y, Andrillon T, Marmelshtein A, Suthana N, Cirelli C, Tononi G, et al. Selectiveneuronal lapses precede human cognitive lapses following sleep deprivation.Nat Med. 2017;23:1474–80.
106. Van Dongen HPA, Belenky G, Krueger JM. A local, bottom-up perspective onsleep deprivation and neurobehavioral performance. Curr Top Med Chem.2011;11:2414–22.
107. Cavanna A, Trimble M. The precuneus: a review of its functional anatomy andbehavioural correlates. Brain. 2006;129:564–83.
108. Robertson IH, Garavan H. Vigilant attention. In: Gazzaniga MS, ed. The cognitiveneurosciences. Cambridge, MA: MIT Press; 2004. p. 631–40.
109. Hancock PA. In search of vigilance: the problem of iatrogenically created psy-chological phenomena. Am Psychol. 2013;68:97–109.
110. Campbell IG, Van Dongen HPA, Gainer M, Karmouta E, Feinberg I. Differentialand interacting effects of age and sleep restriction on daytime sleepiness andvigilance in adolescence: a longitudinal study. Sleep. 2018;41:zsy177.
111. Chee MW, Chuah YM. Functional neuroimaging and behavioral correlates ofcapacity decline in visual short-term memory after sleep deprivation. Proc NatlAcad Sci USA. 2007;104:9487–92.
112. Ratcliff R, Van Dongen HPA. Diffusion model for one-choice reaction-time tasksand the cognitive effects of sleep deprivation. Proc Natl Acad Sci USA.2011;108:11285–90.
113. Walsh MM, Gunzelmann G, Van Dongen HPA. Computational cognitive mod-eling of the temporal dynamics of fatigue from sleep loss. Psychon Bull Rev.2017;24:1785–807.
114. Varin C, Bonnavion P. Pharmacosynthetic deconstruction of sleep-wake circuitsin the brain. Handb Exp Pharmacol. 2019; epub ahead of print, https://doi.org/10.1007/164_2018_183.
115. Fuller PM, Gooley JJ, Saper CB. Neurobiology of the sleep-wake cycle: sleeparchitecture, circadian regulation, and regulatory feedback. J Biol Rhythms.2006;21:482–93.
116. Krueger JM, Taishi P, De A, Davis CJ, Winters BD, Clinton J, et al. ATP and thepurine type 2 X7 receptor affect sleep. J Appl Physiol. 2010;109:1318–27.
117. Yasuda K, Churchill L, Yasuda T, Blindheim K, Falter M, Krueger JM. Unilateralcortical application of interleukin-1β (IL1β) induces asymmetry in Fos- and IL1β-immunoreactivity: implication for sleep regulation. Brain Res. 2007;1131:44–59.
118. Vanderheyden WM, Goodman AG, Taylor RH, Frank MG, Van Dongen HPA,Gerstner JR. Astrocyte expression of the Drosophila TNF-alpha homologue, Eiger,regulates sleep in flies. PLoS Genet. 2018;14:e1007724.
119. Elmenhorst D, Meyer PT, Winz OH, Matusch A, Ermert J, Coenen HH, et al. Sleepdeprivation increases A1 adenosine receptor binding in the human brain: apositron emission tomography study. J Neurosci. 2007;27:2410–5.
120. Veksler BZ, Gunzelmann G. Functional equivalence of sleep loss and time ontask effects in sustained attention. Cogn Sci. 2018;42:600–32.
121. Young RM. The mind–body problem. In: Olby RC, Cantor GN, Christie JR, HodgesMJS, eds. Companion to the history of modern science. London: Taylor andFrancis; 1996. p. 702–11.
122. Whitney P, Hinson JM, Jackson ML, Van Dongen HPA. Feedback blunting: totalsleep deprivation impairs decision making that requires updating based onfeedback. Sleep. 2015;38:745–54.
123. Hoddes E, Zarcone V, Smythe H, Phillips R, Dement WC. Quantification ofsleepiness: a new approach. Psychophysiology. 1973;10:431–6.
124. Strogatz SH, Kronauer RE, Czeisler CA. Circadian pacemaker interferes with sleeponset at specific times each day: role in insomnia. Am J Physiol. 1987;253:R172–8.
125. Davis CJ, Taishi P, Honn KA, Koberstein JN, Krueger JM. P2X7 receptors inbody temperature, locomotor activity, and brain mRNA and IncRNA responsesto sleep deprivation. Am J Physiol Regul Integr Comp Physiol. 2016;311:R1004–12.
Sleep deprivation, vigilant attention, and brain function: a reviewAN Hudson et al.
30
Neuropsychopharmacology (2020) 45:21 – 30
DOES IMPLEMENTATION OF BIOMATHEMATICAL MODELS MITIGATE FATIGUE
AND FATIGUE-RELATED RISKS IN EMERGENCY MEDICAL SERVICES OPERATIONS?A SYSTEMATIC REVIEW
Francine O. James, PhD, Lauren B. Waggoner, PhD, Patricia M. Weiss, MLIS,P. Daniel Patterson, PhD, NRP, J. Stephen Higgins, PhD,
Eddy S. Lang, MDCM, CCFP (EM), Hans P. A. Van Dongen, PhD
ABSTRACT
Background: Work schedules like those of Emergency Med-ical Services (EMS) personnel have been associated withincreased risk of fatigue-related impairment. Biomathemat-ical modeling is a means of objectively estimating the poten-tial impacts of fatigue on performance, which may be usedin the mitigation of fatigue-related safety risks. In the con-
Received August 31, 2017 from Institutes for Behavior Resources,Inc., Baltimore, Maryland (FOJ, LBW); Health Sciences Library Sys-tem, University of Pittsburgh, Pittsburgh, Pennsylvania (PMW);Department of Emergency Medicine, School of Medicine, Uni-versity of Pittsburgh, Pittsburgh, Pennsylvania (PDP); NationalHighway Traffic Safety Administration, U.S. Department of Trans-portation, Washington, District of Columbia (JSH); Departmentof Emergency Medicine, Cumming School of Medicine, Univer-sity of Calgary, Alberta, Canada (ESL); Sleep and PerformanceResearch Center and Elson S. Floyd College of Medicine, WashingtonState University, Spokane, Washington (HPAVD). Revision receivedSeptember 19, 2017; accepted for publication September 20, 2017.
Work performed on this manuscript was supported with fundingfrom the U.S. Department of Transportation, National Highway Traf-fic Safety Administration to the National Association of State EMSOfficials (NASEMSO): contract/grant number: DTNH2215R00029.The views contained in this article are those of the authors and notnecessarily those of the National Highway Traffic Safety Adminis-tration. HVD reported support from CDMRP grant W81XWH-16-1-0319.
Authors P. M. Weiss, H. Van Dongen, J. S. Higgins, E. S. Lang, and P.D. Patterson contributed to the conception of the design of this work.Authors P. M. Weiss, F. O. James, L. B. Waggoner, and P. D. Patter-son contributed to acquisition of study data. All authors contributedto the analysis, interpretation, drafting of the manuscript, and pro-viding critically important intellectual content. All authors reviewedand approved the final version and agree to be accountable for allaspects of the work.
Supplemental data for this article can be accessed on the publisher’swebsite.
Address correspondence to P. Daniel Patterson, PhD, NRP, Univer-sity of Pittsburgh, School of Medicine, Department of EmergencyMedicine, Iroquois Bldg., Suite 400A, Pittsburgh, PA 15261, USA.Email: [email protected]
Published with license by Taylor & Francis © 2018 Francine O. James,Lauren B. Waggoner, Patricia M. Weiss, P. Daniel Patterson, J. StephenHiggins, Eddy S. Lang, and Hans P. A. Van Dongen
doi: 10.1080/10903127.2017.1384875
text of EMS operations, our objective was to assess the evi-dence in the literature regarding the effectiveness of usingbiomathematical models to help mitigate fatigue and fatigue-related risks. Methods: A systematic review of the evi-dence evaluating the use of biomathematical models tomanage fatigue in EMS personnel or similar shift work-ers was performed. Procedures proposed by the Grading ofRecommendations, Assessment, Development, and Evalua-tion (GRADE) methodology were used to summarize andrate the certainty in the evidence. Potential bias attachedto retained studies was documented using the CochraneCollaboration’s Risk of Bias tool for experimental studies.Results: The literature search strategy, which focused onboth EMS personnel and non-EMS shift workers, yieldedn = 2,777 unique records. One paper, which investigatednon-EMS shift workers, met inclusion criteria. As part of alarger effort, managers and dispatchers of a trucking oper-ation were provided with monthly biomathematical modelanalyses of predicted fatigue in the driver workforce, andeducated on how they could reduce predicted fatigue bymeans of schedule adjustments. The intervention showed asignificant reduction in the number and cost of vehicular acci-dents during the period in which biomathematical model-ing was used. The overall GRADE assessment of evidencequality was very low due to risk of bias, indirectness, impre-cision, and publication bias. Conclusions: This systematicreview identified no studies that investigated the impact ofbiomathematical models in EMS operations. Findings fromone study of non-EMS shift workers were favorable towarduse of biomathematical models as a fatigue mitigationscheduling aid, albeit with very low quality of evidence per-taining to EMS operations. We propose three focus areasof research priorities that, if addressed, could help bet-ter elucidate the utility and impact of biomathematicalmodels as a fatigue-mitigation tool in the EMS environ-ment. Key words: fatigue risk management; biomathemat-ical models of fatigue and performance; shift work; safety
PREHOSPITAL EMERGENCY CARE 2018;22:69–80
BACKGROUND
Fatigue-related cognitive impairment results from theinteraction of multiple factors including sleep history,time awake, and time of day (1, 2). Studies of diverseshift worker groups show that work scheduling prac-tices can create conditions that exacerbate the risk of
69
70 PREHOSPITAL EMERGENCY CARE FEBRUARY 2018 VOLUME 22 / NUMBER S1
fatigue-related cognitive impairment (3). The workschedules of Emergency Medical Services (EMS) per-sonnel are notable for 12-hour and 24-hour shifts (4),which increases the risk of fatigue-related impairmentand occupational injuries (5).
Biomathematical modeling is a tool for fatigue riskmanagement in operations that involve shift workerswho are at risk of negative safety outcomes. Thesemodels are widely used in aviation, rail, maritime,and other high-risk industries to estimate the riskof being impaired by fatigue (6). While a numberof different biomathematical models of fatigue havebeen developed, they all generally take into accountthe relationships between factors that contribute tofatigue, including sleep history, time awake, and timeof day (7). These models produce predictions of alert-ness, performance, or risk of impairment for givenwork/rest or wake/sleep schedules. They are there-fore useful when making decisions regarding shiftscheduling, including the duration and timing of dutyperiods and rest opportunities.
At their core, biomathematical fatigue models makeuse of equations capturing the temporal regulation ofsleep and sleepiness (8, 9) and perform mathematicalcalculations on the established relationships betweenwake/sleep or work/rest schedules and two neurobi-ological processes that drive fatigue (7). One of theseprocesses is the homeostatic process, which (throughbrain mechanisms that are yet to be fully elucidated)tracks sleep history and current time awake. The home-ostatic process causes sleepiness when sleep and wakeamounts are out of balance due to relatively excessivewakefulness (8). The other process is referred to as thecircadian process, which (through the biological clockin the suprachiasmatic nuclei of the hypothalamus)drives wakefulness during the day and sleep at night(10). The interaction of the homeostatic and circadianprocesses, through the effects of sleep history and timeawake on the one hand and time of day on the otherhand, produces a net level of fatigue (11), which fluctu-ates over time yet manifests prominently during night-time wakefulness and after sleep deprivation (9, 12). Akey feature of biomathematical models is their ability toprovide quantitative predictions of the relative risk offatigue across hours and days of given wake/sleep orwork/rest schedules (7). This is particularly importantgiven that individuals’ own ability to estimate theirfatigue-related risk is generally poor (13, 14).
High-risk industries have used biomathematicalmodeling for over 30 years to predict fatigue risk (6, 15).The development of these models was accelerated inthe 1990s when the U.S. Army and other groups aroundthe globe increased use of modeling to simulate andinvestigate changes in human behavior under differ-ent sleep conditions (15). While different biomathemat-ical models were developed and tested, all were basedon the same fundamental concepts of the homeostatic
and circadian processes and produced nearly identi-cal predictions of fatigue risk (2, 16). Early versionsof biomathematical models did not account for thecumulative build-up of fatigue across consecutive daysof partial sleep restriction, which is a phenomenonthat was discovered in the early 2000s (14, 17). Recentresearch addressed this issue (15, 18, 19), and modern-day biomathematical models can predict fatigue riskfor a wide variety of wake/sleep and work/rest sched-ules (7). Current versions of these models provide ameans of objectively estimating the potential impactsof fatigue on performance and safety, which can beused to help mitigate fatigue-related risks (20).
In shift work settings, the utility of biomathemati-cal fatigue models is realized when making decisionsabout shift schedules (21). They are often used to adjustplanned work schedules to reduce exposure to fatiguerisk, especially in 24/7 operations (2, 6). In U.S. militaryapplications and space flight, biomathematical mod-eling is used as a part of the mission planning pro-cess (22). The Federal Railroad Administration (FRA)mandates that modeling is employed in mitigatingfatigue risk in passenger rail personnel schedules (23).The Federal Aviation Administration (FAA) recentlyemployed biomathematical modeling in the develop-ment of updated duty and flight time regulations, andallows carriers to use biomathematical modeling as akey ingredient in proposals for “alternative methods ofcompliance” (i.e., operations that are outside the scopeof the standard hours of service regulations but aredemonstrably safer) (24). Commercial airlines in theU.S. routinely include assessments of fatigue risk pro-duced from biomathematical modeling as part of tripschedule planning in operations (25).
The extent to which biomathematical models havebeen applied, tested, and evaluated in the EMS settingis unknown. Given significant growth and successfulapplication of biomathematical modeling as part offatigue risk management in safety-critical operations,a review of the evidence testing biomathematicalmodels with EMS personnel or other shift workers iswarranted. We sought to systematically review the evi-dence for the effectiveness of biomathematical modelsfor fatigue mitigation. Our review was guided by theresearch question developed a priori by a panel ofexperts assembled to address fatigue risk managementin EMS: “In EMS personnel or similar worker groups,does implementation of model-based fatigue risk man-agement mitigate fatigue, fatigue-related risks, and/orimprove sleep?” (PROSPERO 2016: CRD42016040112)(26).
METHODS
We used a systematic review study design of 5databases and one website: PubMed/Medline, theCumulative Index to Nursing and Allied Health

F. O. James et al. BIOMATHEMATICAL MODELS FOR FATIGUE RISK MANAGEMENT 71
Literature (CINAHL), Scopus, PsycINFO, the Pub-lished International Literature on Traumatic Stress(PILOTS), and the publications section of the NationalInstitute of Justice (NIJ) website. The details of ourmethodology, study protocol, and procedures forreviewing published and unpublished literature aredescribed in a separate publication (27). In this paper,we describe the components of our protocol unique tothis systematic review.
Study Design
We assessed publications that described use of ran-domized controlled trials, quasi-experimental studies(i.e., before and after designs) (28) and observationalstudy designs. Publications that describe the use ofmodeling but include no intervention or quantifiableoutcome were not considered to have met the inclusioncriteria for this review.
Types of Participants
The definition of our target population was developedby a panel of experts and is inclusive of diverse shiftworker groups: “EMS personnel or similar worker groups,defined as shift workers whose job activity requires multipleepisodes of intense concentration and attention to detailper shift, with serious adverse consequences potentiallyresulting from lapses in concentration” (26). We excludedliterature that involved non-shift worker “healthyvolunteers” and other non-shift worker populations.
Types of Interventions
We retained studies that reported tests or evaluationsof the effectiveness of a biomathematical model inthe operational setting to address fatigue and fatigue-related risks. We excluded research if the aim of thestudy was to calibrate the biomathematical modelrather than test the impact of the model on operationaloutcomes such as personnel performance or safety orpatient safety.
Types of Outcome Measures
The outcomes of interest for our research question wereselected a priori by a panel of experts prior to the execu-tion of the search for literature (26). The panel reachedagreement on seven outcome categories: patient safety,personnel safety, personnel performance, acute fatigue,sleep and/or sleep quality, indicators of long termhealth, and cost to the system. Outcome selection wasguided by procedures proposed by the Grading of Rec-ommendations, Assessment, Development, and Evalu-ation (GRADE) framework (27, 29).
Search Methods for Studies
A research librarian (PMW) performed searches of fivebibliographic database products and one website. Themethods of our search strategies are published in aseparate publication (27). In that paper, we identifyall sources searched, the search terms incorporated,and the description of search vocabulary. For the sys-tematic review described here, the search incorporatedmultiple terms covering each of three concepts: emer-gency medical services and other critical shift-basedoccupations; fatigue, sleep, and sleep disorders; andmodels of multiple types and simulations. All searchesincluded literature from January 1980 to September2016. See Online Supplemental Material for searchstrategy details specific to this systematic review.
Data Collection and Selection of Studies
Screening
Two investigators (FOJ and LBW) independentlyscreened titles and abstracts to identify potentiallyrelevant publications. Three investigators (FOJ, LBW,and PDP) adjudicated disagreements based on thefollowing inclusion criteria: a) the study describes thepopulation of interest; b) the study describes use of abiomathematical model as the primary intervention ofinterest; and c) the title and/or abstract describes oneor more outcomes of interest. The Kappa statistic wasused to determine inter-rater agreement.
Full-Text Review
Two investigators (FOJ and LBW) worked indepen-dently to abstract key information from full-textarticles. The abstracted information included studydesign, participant characteristics, intervention char-acteristics, comparisons, outcome measures, and keyfindings. The study’s principal investigator (PDP)verified abstractions, and disagreements were handledwith discussion. We systematically excluded non-peerreviewed literature including book chapters, confer-ence abstracts, newsletters, and similar publications,dissertations and theses. Two investigators (FOJ andLBW) searched bibliographies to identify potentiallyrelevant research.
Risk of Bias Assessment
Two investigators (FOJ and LBW) documented biasof the retained research across six domains with theCochrane Collaboration’s risk of bias tool for experi-mental studies (29). The Cochrane risk of bias tool out-lines the assessment of bias across six domains: 1) selec-tion bias (i.e., random sequence generation and alloca-tion concealment); 2) performance bias (i.e., blindingof participants and personnel); 3) detection bias (i.e.,
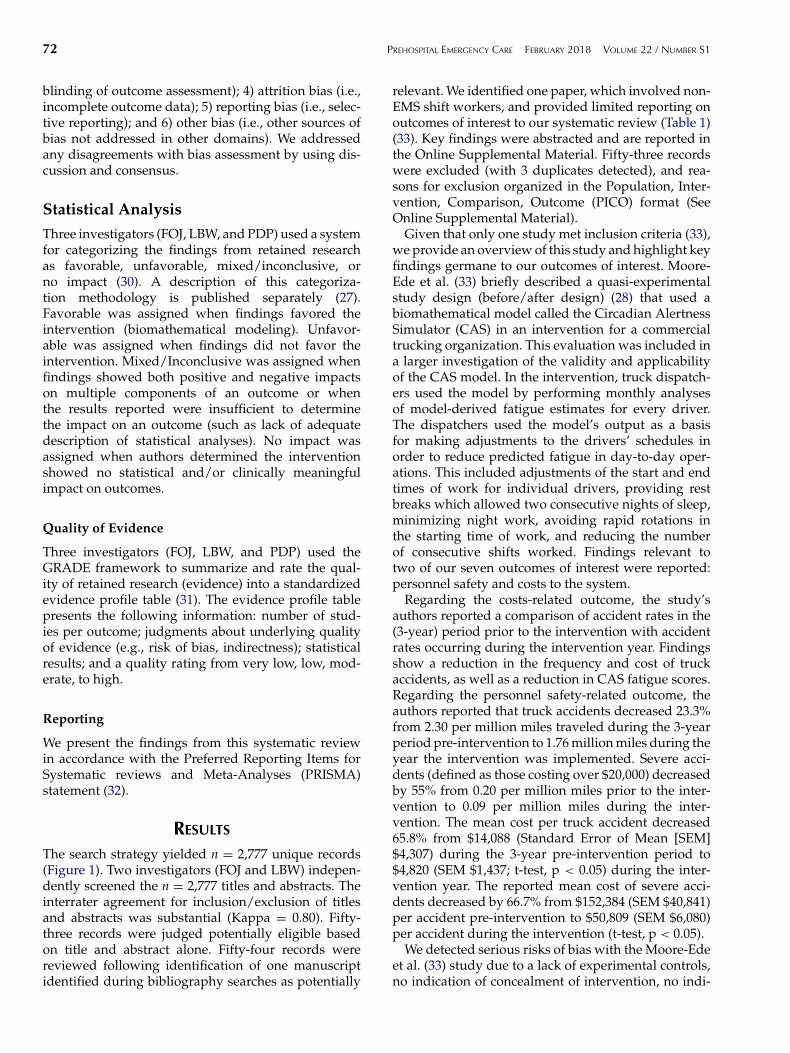
72 PREHOSPITAL EMERGENCY CARE FEBRUARY 2018 VOLUME 22 / NUMBER S1
blinding of outcome assessment); 4) attrition bias (i.e.,incomplete outcome data); 5) reporting bias (i.e., selec-tive reporting); and 6) other bias (i.e., other sources ofbias not addressed in other domains). We addressedany disagreements with bias assessment by using dis-cussion and consensus.
Statistical Analysis
Three investigators (FOJ, LBW, and PDP) used a systemfor categorizing the findings from retained researchas favorable, unfavorable, mixed/inconclusive, orno impact (30). A description of this categoriza-tion methodology is published separately (27).Favorable was assigned when findings favored theintervention (biomathematical modeling). Unfavor-able was assigned when findings did not favor theintervention. Mixed/Inconclusive was assigned whenfindings showed both positive and negative impactson multiple components of an outcome or whenthe results reported were insufficient to determinethe impact on an outcome (such as lack of adequatedescription of statistical analyses). No impact wasassigned when authors determined the interventionshowed no statistical and/or clinically meaningfulimpact on outcomes.
Quality of Evidence
Three investigators (FOJ, LBW, and PDP) used theGRADE framework to summarize and rate the qual-ity of retained research (evidence) into a standardizedevidence profile table (31). The evidence profile tablepresents the following information: number of stud-ies per outcome; judgments about underlying qualityof evidence (e.g., risk of bias, indirectness); statisticalresults; and a quality rating from very low, low, mod-erate, to high.
Reporting
We present the findings from this systematic reviewin accordance with the Preferred Reporting Items forSystematic reviews and Meta-Analyses (PRISMA)statement (32).
RESULTS
The search strategy yielded n = 2,777 unique records(Figure 1). Two investigators (FOJ and LBW) indepen-dently screened the n = 2,777 titles and abstracts. Theinterrater agreement for inclusion/exclusion of titlesand abstracts was substantial (Kappa = 0.80). Fifty-three records were judged potentially eligible basedon title and abstract alone. Fifty-four records werereviewed following identification of one manuscriptidentified during bibliography searches as potentially
relevant. We identified one paper, which involved non-EMS shift workers, and provided limited reporting onoutcomes of interest to our systematic review (Table 1)(33). Key findings were abstracted and are reported inthe Online Supplemental Material. Fifty-three recordswere excluded (with 3 duplicates detected), and rea-sons for exclusion organized in the Population, Inter-vention, Comparison, Outcome (PICO) format (SeeOnline Supplemental Material).
Given that only one study met inclusion criteria (33),we provide an overview of this study and highlight keyfindings germane to our outcomes of interest. Moore-Ede et al. (33) briefly described a quasi-experimentalstudy design (before/after design) (28) that used abiomathematical model called the Circadian AlertnessSimulator (CAS) in an intervention for a commercialtrucking organization. This evaluation was included ina larger investigation of the validity and applicabilityof the CAS model. In the intervention, truck dispatch-ers used the model by performing monthly analysesof model-derived fatigue estimates for every driver.The dispatchers used the model’s output as a basisfor making adjustments to the drivers’ schedules inorder to reduce predicted fatigue in day-to-day oper-ations. This included adjustments of the start and endtimes of work for individual drivers, providing restbreaks which allowed two consecutive nights of sleep,minimizing night work, avoiding rapid rotations inthe starting time of work, and reducing the numberof consecutive shifts worked. Findings relevant totwo of our seven outcomes of interest were reported:personnel safety and costs to the system.
Regarding the costs-related outcome, the study’sauthors reported a comparison of accident rates in the(3-year) period prior to the intervention with accidentrates occurring during the intervention year. Findingsshow a reduction in the frequency and cost of truckaccidents, as well as a reduction in CAS fatigue scores.Regarding the personnel safety-related outcome, theauthors reported that truck accidents decreased 23.3%from 2.30 per million miles traveled during the 3-yearperiod pre-intervention to 1.76 million miles during theyear the intervention was implemented. Severe acci-dents (defined as those costing over $20,000) decreasedby 55% from 0.20 per million miles prior to the inter-vention to 0.09 per million miles during the inter-vention. The mean cost per truck accident decreased65.8% from $14,088 (Standard Error of Mean [SEM]$4,307) during the 3-year pre-intervention period to$4,820 (SEM $1,437; t-test, p < 0.05) during the inter-vention year. The reported mean cost of severe acci-dents decreased by 66.7% from $152,384 (SEM $40,841)per accident pre-intervention to $50,809 (SEM $6,080)per accident during the intervention (t-test, p < 0.05).
We detected serious risks of bias with the Moore-Edeet al. (33) study due to a lack of experimental controls,no indication of concealment of intervention, no indi-
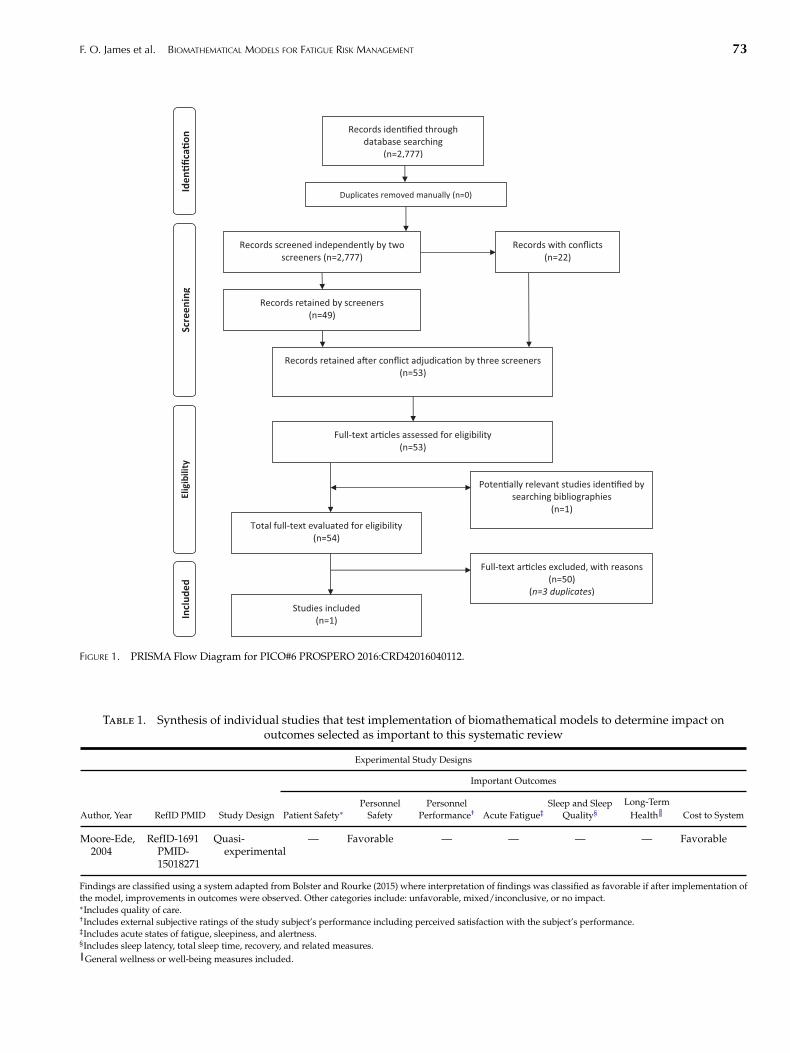
F. O. James et al. BIOMATHEMATICAL MODELS FOR FATIGUE RISK MANAGEMENT 73
Records iden�fied through database searching
(n=2,777)
Scre
enin
g In
clud
ed
Elig
ibili
ty
Iden
�fica
�on
Duplicates removed manually (n=0)
Records screened independently by two screeners (n=2,777)
Full-text ar�cles assessed for eligibility (n=53)
Poten�ally relevant studies iden�fied by searching bibliographies
(n=1)
Total full-text evaluated for eligibility (n=54)
Studies included (n=1)
Records with conflicts (n=22)
Records retained by screeners (n=49)
Records retained a�er conflict adjudica�on by three screeners (n=53)
Full-text ar�cles excluded, with reasons (n=50)
(n=3 duplicates)
FIGURE 1. PRISMA Flow Diagram for PICO#6 PROSPERO 2016:CRD42016040112.
Table 1. Synthesis of individual studies that test implementation of biomathematical models to determine impact onoutcomes selected as important to this systematic review
Experimental Study Designs
Important Outcomes
Author, Year RefID PMID Study Design Patient Safety∗Personnel
SafetyPersonnel
Performance† Acute Fatigue‡Sleep and Sleep
Quality§Long-Term
Health║ Cost to System
Moore-Ede,2004
RefID-1691PMID-15018271
Quasi-experimental
— Favorable — — — — Favorable
Findings are classified using a system adapted from Bolster and Rourke (2015) where interpretation of findings was classified as favorable if after implementation ofthe model, improvements in outcomes were observed. Other categories include: unfavorable, mixed/inconclusive, or no impact.∗Includes quality of care.†Includes external subjective ratings of the study subject’s performance including perceived satisfaction with the subject’s performance.‡Includes acute states of fatigue, sleepiness, and alertness.§Includes sleep latency, total sleep time, recovery, and related measures.║General wellness or well-being measures included.
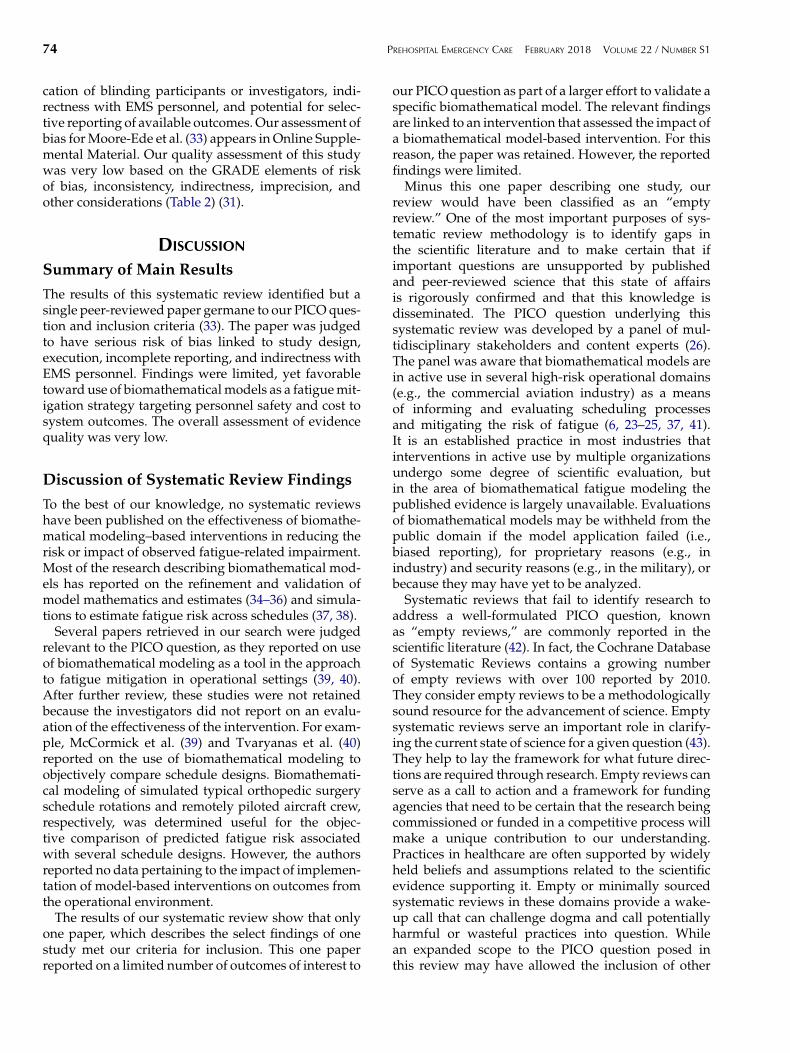
74 PREHOSPITAL EMERGENCY CARE FEBRUARY 2018 VOLUME 22 / NUMBER S1
cation of blinding participants or investigators, indi-rectness with EMS personnel, and potential for selec-tive reporting of available outcomes. Our assessment ofbias for Moore-Ede et al. (33) appears in Online Supple-mental Material. Our quality assessment of this studywas very low based on the GRADE elements of riskof bias, inconsistency, indirectness, imprecision, andother considerations (Table 2) (31).
DISCUSSION
Summary of Main Results
The results of this systematic review identified but asingle peer-reviewed paper germane to our PICO ques-tion and inclusion criteria (33). The paper was judgedto have serious risk of bias linked to study design,execution, incomplete reporting, and indirectness withEMS personnel. Findings were limited, yet favorabletoward use of biomathematical models as a fatigue mit-igation strategy targeting personnel safety and cost tosystem outcomes. The overall assessment of evidencequality was very low.
Discussion of Systematic Review Findings
To the best of our knowledge, no systematic reviewshave been published on the effectiveness of biomathe-matical modeling–based interventions in reducing therisk or impact of observed fatigue-related impairment.Most of the research describing biomathematical mod-els has reported on the refinement and validation ofmodel mathematics and estimates (34–36) and simula-tions to estimate fatigue risk across schedules (37, 38).
Several papers retrieved in our search were judgedrelevant to the PICO question, as they reported on useof biomathematical modeling as a tool in the approachto fatigue mitigation in operational settings (39, 40).After further review, these studies were not retainedbecause the investigators did not report on an evalu-ation of the effectiveness of the intervention. For exam-ple, McCormick et al. (39) and Tvaryanas et al. (40)reported on the use of biomathematical modeling toobjectively compare schedule designs. Biomathemati-cal modeling of simulated typical orthopedic surgeryschedule rotations and remotely piloted aircraft crew,respectively, was determined useful for the objec-tive comparison of predicted fatigue risk associatedwith several schedule designs. However, the authorsreported no data pertaining to the impact of implemen-tation of model-based interventions on outcomes fromthe operational environment.
The results of our systematic review show that onlyone paper, which describes the select findings of onestudy met our criteria for inclusion. This one paperreported on a limited number of outcomes of interest to
our PICO question as part of a larger effort to validate aspecific biomathematical model. The relevant findingsare linked to an intervention that assessed the impact ofa biomathematical model-based intervention. For thisreason, the paper was retained. However, the reportedfindings were limited.
Minus this one paper describing one study, ourreview would have been classified as an “emptyreview.” One of the most important purposes of sys-tematic review methodology is to identify gaps inthe scientific literature and to make certain that ifimportant questions are unsupported by publishedand peer-reviewed science that this state of affairsis rigorously confirmed and that this knowledge isdisseminated. The PICO question underlying thissystematic review was developed by a panel of mul-tidisciplinary stakeholders and content experts (26).The panel was aware that biomathematical models arein active use in several high-risk operational domains(e.g., the commercial aviation industry) as a meansof informing and evaluating scheduling processesand mitigating the risk of fatigue (6, 23–25, 37, 41).It is an established practice in most industries thatinterventions in active use by multiple organizationsundergo some degree of scientific evaluation, butin the area of biomathematical fatigue modeling thepublished evidence is largely unavailable. Evaluationsof biomathematical models may be withheld from thepublic domain if the model application failed (i.e.,biased reporting), for proprietary reasons (e.g., inindustry) and security reasons (e.g., in the military), orbecause they may have yet to be analyzed.
Systematic reviews that fail to identify research toaddress a well-formulated PICO question, knownas “empty reviews,” are commonly reported in thescientific literature (42). In fact, the Cochrane Databaseof Systematic Reviews contains a growing numberof empty reviews with over 100 reported by 2010.They consider empty reviews to be a methodologicallysound resource for the advancement of science. Emptysystematic reviews serve an important role in clarify-ing the current state of science for a given question (43).They help to lay the framework for what future direc-tions are required through research. Empty reviews canserve as a call to action and a framework for fundingagencies that need to be certain that the research beingcommissioned or funded in a competitive process willmake a unique contribution to our understanding.Practices in healthcare are often supported by widelyheld beliefs and assumptions related to the scientificevidence supporting it. Empty or minimally sourcedsystematic reviews in these domains provide a wake-up call that can challenge dogma and call potentiallyharmful or wasteful practices into question. Whilean expanded scope to the PICO question posed inthis review may have allowed the inclusion of other

F. O. James et al. BIOMATHEMATICAL MODELS FOR FATIGUE RISK MANAGEMENT 75
Tabl
e2.
GR
AD
Eev
iden
cepr
ofile
tabl
e
Qua
lity
asse
ssm
ent
№of
stud
ies
Stud
yd
esig
nR
isk
ofbi
asIn
cons
iste
ncy
Ind
irec
tnes
sIm
prec
isio
nO
ther
cons
ider
atio
nsIm
pact
/E
ffec
tQ
ualit
yIm
port
ance
Pati
entS
afet
y
0—
IMPO
RTA
NT
Pers
onne
lSaf
ety
1E
xper
imen
tal
stud
yd
esig
n∗Se
riou
s† ,‡N
otse
riou
sSe
riou
s§Se
riou
s║R
elev
antd
ata
are
held
priv
ate
and
unpu
blis
hed
.#
The
num
ber
oftr
uck
acci
den
tsd
ecre
ased
23.3
%fr
om2.
30pe
rm
illio
nm
iles
trav
eled
dur
ing
ath
ree-
year
pre-
inte
rven
tion
peri
odto
1.76
mill
ion
mile
sd
urin
gth
ein
terv
enti
onye
ar.
The
num
ber
ofse
vere
acci
den
tsd
ecre
ased
by55
%fr
om0.
20pe
rm
illio
nm
iles
prio
rto
the
inte
rven
tion
to0.
09pe
rm
illio
nm
iles
dur
ing
the
inte
rven
tion
.
⊕©
©©
VE
RY
LO
WIM
POR
TAN
T
Pers
onne
lPer
form
ance
0—
IMPO
RTA
NT
Slee
p/
Slee
pQ
ualit
y
0—
IMPO
RTA
NT
Ind
icat
ors
ofL
ong-
Term
Hea
lth
0—
IMPO
RTA
NT
(Con
tinu
edon
next
page
)

76 PREHOSPITAL EMERGENCY CARE FEBRUARY 2018 VOLUME 22 / NUMBER S1
Cos
tto
Syst
em
1E
xper
imen
tal
stud
yd
esig
n∗Se
riou
s† ,‡N
otse
riou
sSe
riou
s§Se
riou
s║R
elev
antd
ata
are
held
priv
ate
and
unpu
blis
hed
.#
The
mea
nco
stpe
rtr
uck
acci
den
td
ecre
ased
65.8
%fr
om$1
4,08
8(S
EM
$4,3
07)d
urin
ga
thre
e-ye
arpr
e-in
terv
enti
onpe
riod
to$4
,820
(SE
M$1
,437
;t-
test
p<
0.05
)dur
ing
the
one-
year
inte
rven
tion
.The
mea
nco
stof
“sev
erit
yac
cid
ents
”(o
ver
$20,
000
cost
)d
ecre
ased
by66
.7%
from
$152
,384
(SE
M$4
0,84
1)pe
rac
cid
entp
re-i
nter
vent
ion
to$5
0,80
9(S
EM
$6,0
80)p
erac
cid
entd
urin
gth
ein
terv
enti
onpe
riod
(t-t
estp
<
0.05
).
⊕©
©©
VE
RY
LO
WIM
POR
TAN
T
Acu
teFa
tigu
e
0—
IMPO
RTA
NT
EX
PL
AN
AT
ION
S∗ Q
uasi
-exp
erim
enta
lstu
dy
des
ign.
† Exp
erim
enta
l:L
ack
ofbl
ind
ing
ofpa
rtic
ipan
tsan
d/
orpe
rson
nel.
‡ Exp
erim
enta
l:L
ack
ofbl
ind
ing
ofou
tcom
eas
sess
men
t.§ Sh
iftw
orke
rsot
her
than
EM
Spe
rson
nel.
║Sa
mpl
esi
ze:a
)one
orga
niza
tion
;b)u
nkno
wn
num
ber
ofin
div
idua
lpar
tici
pant
s.# Po
tent
ialf
orse
lect
ive
outc
ome
repo
rtin
g.

F. O. James et al. BIOMATHEMATICAL MODELS FOR FATIGUE RISK MANAGEMENT 77
biomathematical modeling papers, they would haveall lacked that critical element of evaluation of effec-tiveness. That component was seminal to the spirit ofthe original PICO question that guided this systematicreview and staying the course was essential to remainfaithful to the needs of the panel stakeholders evenif only one study was ultimately deemed to meet theestablished inclusion criteria.
Even though this systematic review on the use ofbiomathematical modeling for mitigation of schedule-related fatigue risk was near-empty, biomathemati-cal modeling is currently employed in a number ofregulated operations, including rail and aviation (6),with the list of adopters growing steadily. Despite theincreasingly wide-spread use of biomathematical mod-eling in safety-sensitive, 24/7 operations, however,studies of their effectiveness in controlled pre-postinvestigations or other scientifically rigorous studydesigns have not been published. In industries alreadyemploying modeling as a fatigue risk managementapproach, data sets exist that may be informative aboutthe effectiveness of biomathematical model use. Giventhat such data sets would also include potentially sensi-tive data on work hours and operational performance,they are often considered proprietary and critical tocorporate or organizational strategies and may there-fore not be available for analysis and publication. Like-wise, modeling efforts conducted by regulators andaccident investigators are usually reported directly toindividual organizations, and the data contained inthese reports are cleaned of all confidential material ormarked classified, and thus remain unpublished. Assuch, it is plausible that biomathematical modeling formanaging fatigue risk in high-risk industries is morewidely used and more thoroughly characterized thanwhat is depicted in the peer-reviewed literature.
Prospective use of Biomathematical Modelsof Fatigue in EMS
The main utility of biomathematical models of fatigueis in their ability to include the interaction of factorsthat contribute to physiological fatigue that wouldbe difficult and inefficient—if not impossible—tofully consider otherwise. Objective metrics estimatingpredicted fatigue risk allow for the comparison ofscheduling solutions, and biomathematical model-ing tools may be useful in prospective and retroac-tive analyses of planned shift schedules (41). Thiswould be analogous to the approach described bythe International Civil Aviation Organization, wherebiomathematical modeling may be used for predictiveand reactive hazard identification in duty and flightschedules as part of a comprehensive Fatigue RiskManagement System (44). However, biomathemati-cal modeling-based solutions for addressing fatiguerisk in EMS operations will require consideration forindustry-specific shift work schedules, sleep patterns,
and obstacles to obtain sleep. For example, use ofbiomathematical models with EMS-specific data mayhelp set boundaries around expected sleep times (e.g.,to occur before/after duty times, or during knownperiods of interim release) (6, 45).
Calibration of sleep estimates and model predictionsto the EMS environment is important, given that formany personnel, on-duty sleep opportunities may bedriven by task load rather than scheduled break oppor-tunities. Moreover, it is estimated that one half of EMSpersonnel work 24-hour shifts and that about one thirdof personnel work multiple EMS jobs (4). Probabilisticestimates of likely sleep times for EMS personnel ontypical duty schedules may be used to refine sleep esti-mates used in model-based analyses (25). Where thebiological basis of fatigue risk includes sleep loss, thisis a critical consideration for EMS personnel.
We propose 3 focus areas as research priorities that ifaddressed, could help determine the utility and impactof biomathematical models as a fatigue-mitigation toolin the EMS environment.
Research Priority 1: Which specific outcomes, if any,of the EMS operational environment are predicted bybiomathematical modeling estimates? Addressing thisresearch question would help to validate the util-ity of the modeling approach in EMS operations.Biomathematical models can estimate the physiolog-ical likelihood of fatigue related impairment, yet thismay not directly relate to negative outcomes in theEMS work environment (7, 41). Planned, natural, orexisting safety barriers (e.g., safety alarms, teamwork)may catch many operational errors before they occuror have a measurable impact. The added benefit ofbiomathematical modeling, or the unique contribu-tion of a model, should be explored. A prospectivelydesigned study could capture reliable sleep dataand the occurrence of adverse events. A study thatuses a quasi-experimental design (e.g., a before/afterstudy design) would be more feasible and possi-bly more attractive to the EMS administrator thandesigns that require randomization to 2 or moreconditions (28).
Research Priority 2: How does EMS personnel sleep dura-tion vary by duty period duration, start time, and opera-tion type? Given the known contribution of sleep lossto the risk of fatigue-related impairment, sleep esti-mates are an essential aspect for any modeling-basedanalysis and prediction (46). Sleep estimates for EMSmust take on-duty sleep into account, especially con-sidering the prevalence of 24-hour duty periods. Datafrom actigraphy- and/or sleep diary-based, naturalis-tic studies can inform the development of customizedprobabilistic distribution of sleep times across EMSduty period types (47), which would improve modelbased analysis of available schedules.
Research Priority 3: What is the unique contribu-tion of biomathematical modeling to improvements inpersonnel sleep and organizational outcomes like safety
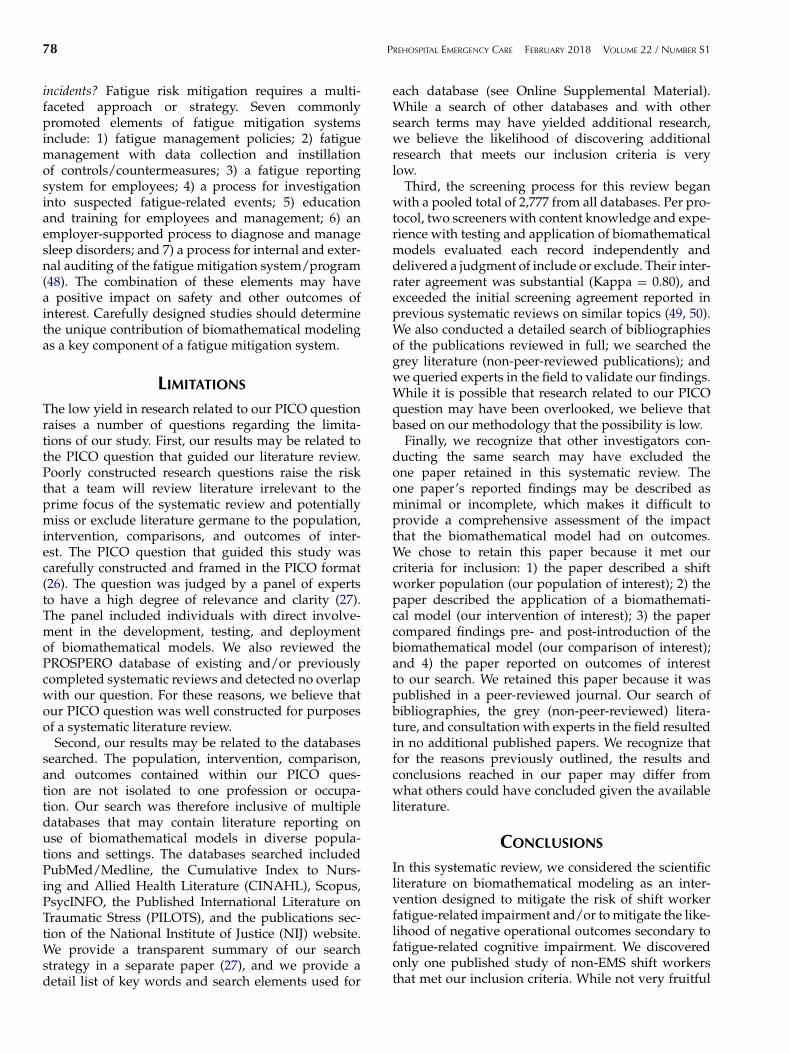
78 PREHOSPITAL EMERGENCY CARE FEBRUARY 2018 VOLUME 22 / NUMBER S1
incidents? Fatigue risk mitigation requires a multi-faceted approach or strategy. Seven commonlypromoted elements of fatigue mitigation systemsinclude: 1) fatigue management policies; 2) fatiguemanagement with data collection and instillationof controls/countermeasures; 3) a fatigue reportingsystem for employees; 4) a process for investigationinto suspected fatigue-related events; 5) educationand training for employees and management; 6) anemployer-supported process to diagnose and managesleep disorders; and 7) a process for internal and exter-nal auditing of the fatigue mitigation system/program(48). The combination of these elements may havea positive impact on safety and other outcomes ofinterest. Carefully designed studies should determinethe unique contribution of biomathematical modelingas a key component of a fatigue mitigation system.
LIMITATIONS
The low yield in research related to our PICO questionraises a number of questions regarding the limita-tions of our study. First, our results may be related tothe PICO question that guided our literature review.Poorly constructed research questions raise the riskthat a team will review literature irrelevant to theprime focus of the systematic review and potentiallymiss or exclude literature germane to the population,intervention, comparisons, and outcomes of inter-est. The PICO question that guided this study wascarefully constructed and framed in the PICO format(26). The question was judged by a panel of expertsto have a high degree of relevance and clarity (27).The panel included individuals with direct involve-ment in the development, testing, and deploymentof biomathematical models. We also reviewed thePROSPERO database of existing and/or previouslycompleted systematic reviews and detected no overlapwith our question. For these reasons, we believe thatour PICO question was well constructed for purposesof a systematic literature review.
Second, our results may be related to the databasessearched. The population, intervention, comparison,and outcomes contained within our PICO ques-tion are not isolated to one profession or occupa-tion. Our search was therefore inclusive of multipledatabases that may contain literature reporting onuse of biomathematical models in diverse popula-tions and settings. The databases searched includedPubMed/Medline, the Cumulative Index to Nurs-ing and Allied Health Literature (CINAHL), Scopus,PsycINFO, the Published International Literature onTraumatic Stress (PILOTS), and the publications sec-tion of the National Institute of Justice (NIJ) website.We provide a transparent summary of our searchstrategy in a separate paper (27), and we provide adetail list of key words and search elements used for
each database (see Online Supplemental Material).While a search of other databases and with othersearch terms may have yielded additional research,we believe the likelihood of discovering additionalresearch that meets our inclusion criteria is verylow.
Third, the screening process for this review beganwith a pooled total of 2,777 from all databases. Per pro-tocol, two screeners with content knowledge and expe-rience with testing and application of biomathematicalmodels evaluated each record independently anddelivered a judgment of include or exclude. Their inter-rater agreement was substantial (Kappa = 0.80), andexceeded the initial screening agreement reported inprevious systematic reviews on similar topics (49, 50).We also conducted a detailed search of bibliographiesof the publications reviewed in full; we searched thegrey literature (non-peer-reviewed publications); andwe queried experts in the field to validate our findings.While it is possible that research related to our PICOquestion may have been overlooked, we believe thatbased on our methodology that the possibility is low.
Finally, we recognize that other investigators con-ducting the same search may have excluded theone paper retained in this systematic review. Theone paper’s reported findings may be described asminimal or incomplete, which makes it difficult toprovide a comprehensive assessment of the impactthat the biomathematical model had on outcomes.We chose to retain this paper because it met ourcriteria for inclusion: 1) the paper described a shiftworker population (our population of interest); 2) thepaper described the application of a biomathemati-cal model (our intervention of interest); 3) the papercompared findings pre- and post-introduction of thebiomathematical model (our comparison of interest);and 4) the paper reported on outcomes of interestto our search. We retained this paper because it waspublished in a peer-reviewed journal. Our search ofbibliographies, the grey (non-peer-reviewed) litera-ture, and consultation with experts in the field resultedin no additional published papers. We recognize thatfor the reasons previously outlined, the results andconclusions reached in our paper may differ fromwhat others could have concluded given the availableliterature.
CONCLUSIONS
In this systematic review, we considered the scientificliterature on biomathematical modeling as an inter-vention designed to mitigate the risk of shift workerfatigue-related impairment and/or to mitigate the like-lihood of negative operational outcomes secondary tofatigue-related cognitive impairment. We discoveredonly one published study of non-EMS shift workersthat met our inclusion criteria. While not very fruitful
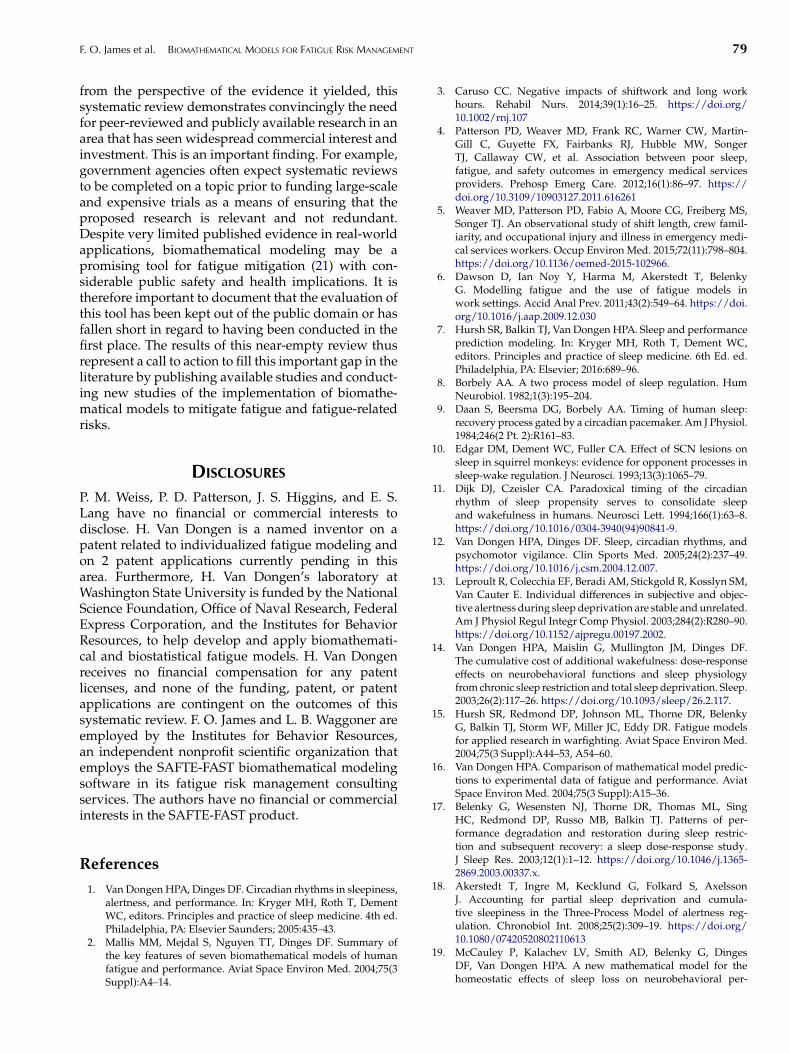
F. O. James et al. BIOMATHEMATICAL MODELS FOR FATIGUE RISK MANAGEMENT 79
from the perspective of the evidence it yielded, thissystematic review demonstrates convincingly the needfor peer-reviewed and publicly available research in anarea that has seen widespread commercial interest andinvestment. This is an important finding. For example,government agencies often expect systematic reviewsto be completed on a topic prior to funding large-scaleand expensive trials as a means of ensuring that theproposed research is relevant and not redundant.Despite very limited published evidence in real-worldapplications, biomathematical modeling may be apromising tool for fatigue mitigation (21) with con-siderable public safety and health implications. It istherefore important to document that the evaluation ofthis tool has been kept out of the public domain or hasfallen short in regard to having been conducted in thefirst place. The results of this near-empty review thusrepresent a call to action to fill this important gap in theliterature by publishing available studies and conduct-ing new studies of the implementation of biomathe-matical models to mitigate fatigue and fatigue-relatedrisks.
DISCLOSURES
P. M. Weiss, P. D. Patterson, J. S. Higgins, and E. S.Lang have no financial or commercial interests todisclose. H. Van Dongen is a named inventor on apatent related to individualized fatigue modeling andon 2 patent applications currently pending in thisarea. Furthermore, H. Van Dongen’s laboratory atWashington State University is funded by the NationalScience Foundation, Office of Naval Research, FederalExpress Corporation, and the Institutes for BehaviorResources, to help develop and apply biomathemati-cal and biostatistical fatigue models. H. Van Dongenreceives no financial compensation for any patentlicenses, and none of the funding, patent, or patentapplications are contingent on the outcomes of thissystematic review. F. O. James and L. B. Waggoner areemployed by the Institutes for Behavior Resources,an independent nonprofit scientific organization thatemploys the SAFTE-FAST biomathematical modelingsoftware in its fatigue risk management consultingservices. The authors have no financial or commercialinterests in the SAFTE-FAST product.
References
1. Van Dongen HPA, Dinges DF. Circadian rhythms in sleepiness,alertness, and performance. In: Kryger MH, Roth T, DementWC, editors. Principles and practice of sleep medicine. 4th ed.Philadelphia, PA: Elsevier Saunders; 2005:435–43.
2. Mallis MM, Mejdal S, Nguyen TT, Dinges DF. Summary ofthe key features of seven biomathematical models of humanfatigue and performance. Aviat Space Environ Med. 2004;75(3Suppl):A4–14.
3. Caruso CC. Negative impacts of shiftwork and long workhours. Rehabil Nurs. 2014;39(1):16–25. https://doi.org/10.1002/rnj.107
4. Patterson PD, Weaver MD, Frank RC, Warner CW, Martin-Gill C, Guyette FX, Fairbanks RJ, Hubble MW, SongerTJ, Callaway CW, et al. Association between poor sleep,fatigue, and safety outcomes in emergency medical servicesproviders. Prehosp Emerg Care. 2012;16(1):86–97. https://doi.org/10.3109/10903127.2011.616261
5. Weaver MD, Patterson PD, Fabio A, Moore CG, Freiberg MS,Songer TJ. An observational study of shift length, crew famil-iarity, and occupational injury and illness in emergency medi-cal services workers. Occup Environ Med. 2015;72(11):798–804.https://doi.org/10.1136/oemed-2015-102966.
6. Dawson D, Ian Noy Y, Harma M, Akerstedt T, BelenkyG. Modelling fatigue and the use of fatigue models inwork settings. Accid Anal Prev. 2011;43(2):549–64. https://doi.org/10.1016/j.aap.2009.12.030
7. Hursh SR, Balkin TJ, Van Dongen HPA. Sleep and performanceprediction modeling. In: Kryger MH, Roth T, Dement WC,editors. Principles and practice of sleep medicine. 6th Ed. ed.Philadelphia, PA: Elsevier; 2016:689–96.
8. Borbely AA. A two process model of sleep regulation. HumNeurobiol. 1982;1(3):195–204.
9. Daan S, Beersma DG, Borbely AA. Timing of human sleep:recovery process gated by a circadian pacemaker. Am J Physiol.1984;246(2 Pt. 2):R161–83.
10. Edgar DM, Dement WC, Fuller CA. Effect of SCN lesions onsleep in squirrel monkeys: evidence for opponent processes insleep-wake regulation. J Neurosci. 1993;13(3):1065–79.
11. Dijk DJ, Czeisler CA. Paradoxical timing of the circadianrhythm of sleep propensity serves to consolidate sleepand wakefulness in humans. Neurosci Lett. 1994;166(1):63–8.https://doi.org/10.1016/0304-3940(94)90841-9.
12. Van Dongen HPA, Dinges DF. Sleep, circadian rhythms, andpsychomotor vigilance. Clin Sports Med. 2005;24(2):237–49.https://doi.org/10.1016/j.csm.2004.12.007.
13. Leproult R, Colecchia EF, Beradi AM, Stickgold R, Kosslyn SM,Van Cauter E. Individual differences in subjective and objec-tive alertness during sleep deprivation are stable and unrelated.Am J Physiol Regul Integr Comp Physiol. 2003;284(2):R280–90.https://doi.org/10.1152/ajpregu.00197.2002.
14. Van Dongen HPA, Maislin G, Mullington JM, Dinges DF.The cumulative cost of additional wakefulness: dose-responseeffects on neurobehavioral functions and sleep physiologyfrom chronic sleep restriction and total sleep deprivation. Sleep.2003;26(2):117–26. https://doi.org/10.1093/sleep/26.2.117.
15. Hursh SR, Redmond DP, Johnson ML, Thorne DR, BelenkyG, Balkin TJ, Storm WF, Miller JC, Eddy DR. Fatigue modelsfor applied research in warfighting. Aviat Space Environ Med.2004;75(3 Suppl):A44–53, A54–60.
16. Van Dongen HPA. Comparison of mathematical model predic-tions to experimental data of fatigue and performance. AviatSpace Environ Med. 2004;75(3 Suppl):A15–36.
17. Belenky G, Wesensten NJ, Thorne DR, Thomas ML, SingHC, Redmond DP, Russo MB, Balkin TJ. Patterns of per-formance degradation and restoration during sleep restric-tion and subsequent recovery: a sleep dose-response study.J Sleep Res. 2003;12(1):1–12. https://doi.org/10.1046/j.1365-2869.2003.00337.x.
18. Akerstedt T, Ingre M, Kecklund G, Folkard S, AxelssonJ. Accounting for partial sleep deprivation and cumula-tive sleepiness in the Three-Process Model of alertness reg-ulation. Chronobiol Int. 2008;25(2):309–19. https://doi.org/10.1080/07420520802110613
19. McCauley P, Kalachev LV, Smith AD, Belenky G, DingesDF, Van Dongen HPA. A new mathematical model for thehomeostatic effects of sleep loss on neurobehavioral per-
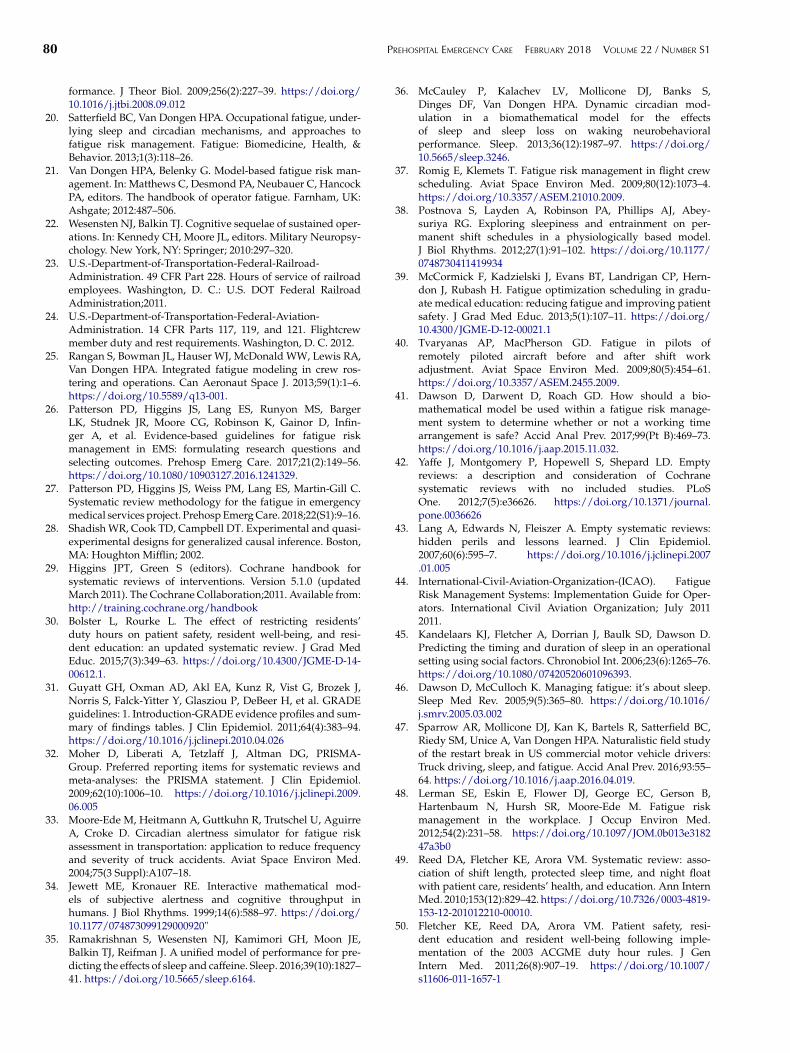
80 PREHOSPITAL EMERGENCY CARE FEBRUARY 2018 VOLUME 22 / NUMBER S1
formance. J Theor Biol. 2009;256(2):227–39. https://doi.org/10.1016/j.jtbi.2008.09.012
20. Satterfield BC, Van Dongen HPA. Occupational fatigue, under-lying sleep and circadian mechanisms, and approaches tofatigue risk management. Fatigue: Biomedicine, Health, &Behavior. 2013;1(3):118–26.
21. Van Dongen HPA, Belenky G. Model-based fatigue risk man-agement. In: Matthews C, Desmond PA, Neubauer C, HancockPA, editors. The handbook of operator fatigue. Farnham, UK:Ashgate; 2012:487–506.
22. Wesensten NJ, Balkin TJ. Cognitive sequelae of sustained oper-ations. In: Kennedy CH, Moore JL, editors. Military Neuropsy-chology. New York, NY: Springer; 2010:297–320.
23. U.S.-Department-of-Transportation-Federal-Railroad-Administration. 49 CFR Part 228. Hours of service of railroademployees. Washington, D. C.: U.S. DOT Federal RailroadAdministration;2011.
24. U.S.-Department-of-Transportation-Federal-Aviation-Administration. 14 CFR Parts 117, 119, and 121. Flightcrewmember duty and rest requirements. Washington, D. C. 2012.
25. Rangan S, Bowman JL, Hauser WJ, McDonald WW, Lewis RA,Van Dongen HPA. Integrated fatigue modeling in crew ros-tering and operations. Can Aeronaut Space J. 2013;59(1):1–6.https://doi.org/10.5589/q13-001.
26. Patterson PD, Higgins JS, Lang ES, Runyon MS, BargerLK, Studnek JR, Moore CG, Robinson K, Gainor D, Infin-ger A, et al. Evidence-based guidelines for fatigue riskmanagement in EMS: formulating research questions andselecting outcomes. Prehosp Emerg Care. 2017;21(2):149–56.https://doi.org/10.1080/10903127.2016.1241329.
27. Patterson PD, Higgins JS, Weiss PM, Lang ES, Martin-Gill C.Systematic review methodology for the fatigue in emergencymedical services project. Prehosp Emerg Care. 2018;22(S1):9–16.
28. Shadish WR, Cook TD, Campbell DT. Experimental and quasi-experimental designs for generalized causal inference. Boston,MA: Houghton Mifflin; 2002.
29. Higgins JPT, Green S (editors). Cochrane handbook forsystematic reviews of interventions. Version 5.1.0 (updatedMarch 2011). The Cochrane Collaboration;2011. Available from:http://training.cochrane.org/handbook
30. Bolster L, Rourke L. The effect of restricting residents’duty hours on patient safety, resident well-being, and resi-dent education: an updated systematic review. J Grad MedEduc. 2015;7(3):349–63. https://doi.org/10.4300/JGME-D-14-00612.1.
31. Guyatt GH, Oxman AD, Akl EA, Kunz R, Vist G, Brozek J,Norris S, Falck-Yitter Y, Glasziou P, DeBeer H, et al. GRADEguidelines: 1. Introduction-GRADE evidence profiles and sum-mary of findings tables. J Clin Epidemiol. 2011;64(4):383–94.https://doi.org/10.1016/j.jclinepi.2010.04.026
32. Moher D, Liberati A, Tetzlaff J, Altman DG, PRISMA-Group. Preferred reporting items for systematic reviews andmeta-analyses: the PRISMA statement. J Clin Epidemiol.2009;62(10):1006–10. https://doi.org/10.1016/j.jclinepi.2009.06.005
33. Moore-Ede M, Heitmann A, Guttkuhn R, Trutschel U, AguirreA, Croke D. Circadian alertness simulator for fatigue riskassessment in transportation: application to reduce frequencyand severity of truck accidents. Aviat Space Environ Med.2004;75(3 Suppl):A107–18.
34. Jewett ME, Kronauer RE. Interactive mathematical mod-els of subjective alertness and cognitive throughput inhumans. J Biol Rhythms. 1999;14(6):588–97. https://doi.org/10.1177/074873099129000920"
35. Ramakrishnan S, Wesensten NJ, Kamimori GH, Moon JE,Balkin TJ, Reifman J. A unified model of performance for pre-dicting the effects of sleep and caffeine. Sleep. 2016;39(10):1827–41. https://doi.org/10.5665/sleep.6164.
36. McCauley P, Kalachev LV, Mollicone DJ, Banks S,Dinges DF, Van Dongen HPA. Dynamic circadian mod-ulation in a biomathematical model for the effectsof sleep and sleep loss on waking neurobehavioralperformance. Sleep. 2013;36(12):1987–97. https://doi.org/10.5665/sleep.3246.
37. Romig E, Klemets T. Fatigue risk management in flight crewscheduling. Aviat Space Environ Med. 2009;80(12):1073–4.https://doi.org/10.3357/ASEM.21010.2009.
38. Postnova S, Layden A, Robinson PA, Phillips AJ, Abey-suriya RG. Exploring sleepiness and entrainment on per-manent shift schedules in a physiologically based model.J Biol Rhythms. 2012;27(1):91–102. https://doi.org/10.1177/0748730411419934
39. McCormick F, Kadzielski J, Evans BT, Landrigan CP, Hern-don J, Rubash H. Fatigue optimization scheduling in gradu-ate medical education: reducing fatigue and improving patientsafety. J Grad Med Educ. 2013;5(1):107–11. https://doi.org/10.4300/JGME-D-12-00021.1
40. Tvaryanas AP, MacPherson GD. Fatigue in pilots ofremotely piloted aircraft before and after shift workadjustment. Aviat Space Environ Med. 2009;80(5):454–61.https://doi.org/10.3357/ASEM.2455.2009.
41. Dawson D, Darwent D, Roach GD. How should a bio-mathematical model be used within a fatigue risk manage-ment system to determine whether or not a working timearrangement is safe? Accid Anal Prev. 2017;99(Pt B):469–73.https://doi.org/10.1016/j.aap.2015.11.032.
42. Yaffe J, Montgomery P, Hopewell S, Shepard LD. Emptyreviews: a description and consideration of Cochranesystematic reviews with no included studies. PLoSOne. 2012;7(5):e36626. https://doi.org/10.1371/journal.pone.0036626
43. Lang A, Edwards N, Fleiszer A. Empty systematic reviews:hidden perils and lessons learned. J Clin Epidemiol.2007;60(6):595–7. https://doi.org/10.1016/j.jclinepi.2007.01.005
44. International-Civil-Aviation-Organization-(ICAO). FatigueRisk Management Systems: Implementation Guide for Oper-ators. International Civil Aviation Organization; July 20112011.
45. Kandelaars KJ, Fletcher A, Dorrian J, Baulk SD, Dawson D.Predicting the timing and duration of sleep in an operationalsetting using social factors. Chronobiol Int. 2006;23(6):1265–76.https://doi.org/10.1080/07420520601096393.
46. Dawson D, McCulloch K. Managing fatigue: it’s about sleep.Sleep Med Rev. 2005;9(5):365–80. https://doi.org/10.1016/j.smrv.2005.03.002
47. Sparrow AR, Mollicone DJ, Kan K, Bartels R, Satterfield BC,Riedy SM, Unice A, Van Dongen HPA. Naturalistic field studyof the restart break in US commercial motor vehicle drivers:Truck driving, sleep, and fatigue. Accid Anal Prev. 2016;93:55–64. https://doi.org/10.1016/j.aap.2016.04.019.
48. Lerman SE, Eskin E, Flower DJ, George EC, Gerson B,Hartenbaum N, Hursh SR, Moore-Ede M. Fatigue riskmanagement in the workplace. J Occup Environ Med.2012;54(2):231–58. https://doi.org/10.1097/JOM.0b013e318247a3b0
49. Reed DA, Fletcher KE, Arora VM. Systematic review: asso-ciation of shift length, protected sleep time, and night floatwith patient care, residents’ health, and education. Ann InternMed. 2010;153(12):829–42. https://doi.org/10.7326/0003-4819-153-12-201012210-00010.
50. Fletcher KE, Reed DA, Arora VM. Patient safety, resi-dent education and resident well-being following imple-mentation of the 2003 ACGME duty hour rules. J GenIntern Med. 2011;26(8):907–19. https://doi.org/10.1007/s11606-011-1657-1

1
Online Supplement Appendix A – Search strategies
PubMed (National Library of Medicine) 1 Emergency Medical Services [mh] OR Emergency Medical Technicians[mh] OR Emergency
Responders[mh] OR Firefighters[mh] OR Police[mh] OR Correctional Officer*[tiab] OR Correctional Officer*[ot] OR Emergency Health Service*[tiab] OR Emergency Health Service*[ot] OR Emergency Medical Service*[tiab] OR Emergency Medical Service*[ot] OR Emergency Medicine Technician*[tiab] OR Emergency Medicine Technician*[ot] OR Emergency Responder*[tiab] OR Emergency Responder*[ot] OR Emergicenter*[tiab] OR Emergicenter*[ot] OR Fire fighter*[tiab] OR Fire fighter*[ot] OR Firefighter*[tiab] OR Firefighter*[ot] OR Fireman[tiab] OR Fireman[ot] OR Firemen[tiab] OR Firemen[ot] OR Firewoman[tiab] OR Firewoman[ot] OR Firewomen[tiab] OR Firewomen[ot] OR First Responder*[tiab] OR First Responder*[ot] OR Law Enforcement [tiab] OR Law Enforcement [ot] OR Medical Emergency Service*[tiab] OR Medical Emergency Service*[ot] OR Paramedic*[tiab] OR Paramedic*[ot] OR Police Force*[tiab] OR Police Force*[ot] OR Police*[tiab] OR Police*[ot] OR Prehospital Emergency[tiab] OR Prehospital Emergency[ot] OR Prehospital Emergency Care[tiab] OR Prehospital Emergency Care[ot] OR public safety[tiab] OR public safety[ot]
2 Aerospace Medicine[mh] OR Air Ambulances[mh] OR Ambulances[mh] OR Automobile Driving[mh] OR Aviation[mh] OR Motor Vehicles[mh] OR Railroads[mh] OR Ships[mh] OR Transportation[mh] OR Transportation of Patients[mh] OR Air Traffic Control*[tiab] OR Air Traffic Control*[ot] OR Ambulance driver*[tiab] OR Ambulance driver*[ot] OR Ambulance*[tiab] OR Ambulance*[ot] OR Aviation[tiab] OR Aviation[ot] OR Boat*[tiab] OR Boat*[ot] OR Bus driver*[tiab] OR Bus driver*[ot] OR Bus[tiab] OR Bus[ot] OR Driver*[tiab] OR Driver*[ot] OR Driving[tiab] OR Driving[ot] OR Navigator*[tiab] OR Navigator*[ot] OR Pilot*[tiab] OR Pilot*[ot] OR Railroad*[tiab] OR Railroad*[ot] OR Ship*[tiab] OR Ship*[ot] OR Subway*[tiab] OR Subway*[ot] OR Train[tiab] OR Train[ot] OR Trains[tiab] OR Trains[ot] OR Truck drivers[tiab] OR Truck drivers[ot] OR Truck driver[tiab] OR Truck driver[ot] OR Truck*[tiab] OR Truck*[ot] OR Trucker*[tiab] OR Trucker*[ot]
3 Nuclear Power Plants[mh] OR Nuclear Power Plant*[tiab] OR Nuclear Power Plant*[ot] 4 Military Personnel[mh] OR Air Force Personnel[tiab] OR Air Force Personnel[ot] OR Armed Forces
Personnel[tiab] OR Armed Forces Personnel[ot] OR Army Personnel[tiab] OR Army Personnel[ot] OR Coast Guard[tiab] OR Coast Guard[ot] OR Marine*[tiab] OR Marine*[ot] OR Military[tiab] OR Military[ot] OR Navy Personnel[tiab] OR Navy Personnel[ot] OR Sailor*[tiab] OR Sailor*[ot] OR Soldier*[tiab] OR Soldier*[ot] OR Submariner*[tiab] OR Submariner*[ot]
5 Health Personnel[mh:noexp] OR Nurses[mh] OR Pharmacists[mh] OR Physicians[mh] OR Medical Staff, Hospital[mh] OR Nursing Staff, Hospital[mh] OR Internship and Residency[mh] OR interns[tiab] OR interns[ot] OR residents[tiab] OR residents[ot] OR internship[tiab] OR internship[ot] OR residency[tiab] OR residency[ot] OR house staff[tiab] OR house staff[ot] OR Allied Health Personnel[tiab] OR Allied Health Personnel[ot] OR Doctor*[tiab] OR Doctor*[ot] OR Health Care Provider*[tiab] OR Health Care Provider*[ot] OR Healthcare Provider*[tiab] OR Healthcare Provider*[ot] OR Nurs*[tiab] OR Nurs*[ot] OR Pharmacist*[tiab] OR Pharmacist*[ot] OR Physician*[tiab] OR Physician*[ot]
6 shift work*[tiab] OR shift work*[ot] OR shiftwork*[tiab] OR shiftwork*[ot] 7 1 OR 2 OR 3 OR 4 OR 5 OR 6 8 Fatigue[mh] OR fatigue[tiab] OR fatigue[ot] OR Sleep[mh] OR sleep[tiab] OR sleep[ot] 9 7 AND 8

2
10 Decision Support Techniques[mh] OR Decision Support Technique[ti] OR Decision Support Technique[ot] OR Decision Support Technic*[ti] OR Decision Support Technic*[ot] OR Decision Aid*[ti] OR Decision Aid*[ot] OR Decision Support Model*[ti] OR Decision Support Model*[ot] OR Decision Analysis[ti] OR Decision Analysis[ot] OR Decision Analyses[ti] OR Decision Analyses[ot] OR Decision Modeling[ti] OR Decision Modeling[ot] OR Clinical Prediction Rule*[ti] OR Clinical Prediction Rule*[ot] OR Models, Biological[mh] OR Biologic Model*[ti] OR Biologic Model*[ot] OR Biological Model*[ti] OR Biological Model*[ot] OR Task Performance and Analysis[mh] OR Task Performance*[ti] OR Task Performance*[ot] OR Critical Incident Technique*[ti] OR Critical Incident Technique*[ot] OR Critical Incident Technic*[ti] OR Critical Incident Technic*[ot] OR Data Interpretation, Statistical[mh] OR Statistical Data Interpretation[ti] OR Statistical Data Interpretation[ot] OR Statistical Data Analysis[ti] OR Statistical Data Analysis[ot] OR Statistical Data Analyses[ti] OR Models, Theoretical[mh] OR Theoretical Model*[ti] OR Theoretical Model*[ot] OR Experimental Model[ti] OR Experimental Model[ot] OR Experimental Models[ti] OR Experimental Models[ot] OR Mathematical Model[ti] OR Mathematical Model[ot] OR Mathematical Models[ti] OR Mathematical Models[ot] OR Theoretical Study[ti] OR Theoretical Study[ot] OR Theoretical Studies[ti] OR Theoretical Studies[ot] OR Models, Statistical[mh] OR Statistical Model*[ti] OR Statistical Model*[ot] OR Probabilistic Model*[ti] OR Probabilistic Model*[ot] OR Polynomial Model*[ti] OR Polynomial Model*[ot] OR Two-Parameter Model*[ti] OR Two-Parameter Model*[ot] OR Two Parameter Model*[ti] OR Two Parameter Model*[ot] OR Binomial Model*[ti] OR Binomial Model*[ot] OR Computer Simulation[mh] OR Computer Simulation[ot] OR simulation[ti] OR simulation[ot] OR biomathematical[ti] OR biomathematical[ot]
11 9 AND 10 12 ((patient OR patients) NOT (Sleep Wake Disorders[mh] OR Sleep[mh] OR sleep[tiab] OR sleep[ot] OR
Fatigue[mh] OR fatigue[tiab] OR fatigue[ot])) 13 11 NOT 12 14 (("Infant"[Mesh] OR "Child"[Mesh] OR "Adolescent"[Mesh]) NOT "Adult"[Mesh]) 15 13 NOT 14 16 (Animals[mh] NOT Humans[mh]) 17 15 NOT 16 18 Filters: Publication date from 1980/01/01 to 2017/12/31
Scopus (Elsevier B.V.)
1 INDEXTERMS("Correctional Officer*") OR TITLE-ABS("Correctional Officer*") OR
AUTHKEY("Correctional Officer*") OR INDEXTERMS("Emergency Medical Services ") OR TITLE-ABS("Emergency Medical Services ") OR AUTHKEY("Emergency Medical Services ") OR INDEXTERMS("Emergency Medical Technicians") OR TITLE-ABS("Emergency Medical Technicians") OR AUTHKEY("Emergency Medical Technicians") OR INDEXTERMS("Emergency Responders") OR TITLE-ABS("Emergency Responders") OR AUTHKEY("Emergency Responders") OR INDEXTERMS("Firefighters") OR TITLE-ABS("Firefighters") OR AUTHKEY("Firefighters") OR INDEXTERMS("Police") OR TITLE-ABS("Police") OR AUTHKEY("Police") OR INDEXTERMS("Correctional Officer*") OR TITLE-ABS("Correctional Officer*") OR AUTHKEY("Correctional Officer*") OR INDEXTERMS("Emergency Health Service*") OR TITLE-ABS("Emergency Health Service*") OR AUTHKEY("Emergency Health Service*") OR INDEXTERMS("Emergency Medical Service*") OR TITLE-ABS("Emergency Medical Service*") OR AUTHKEY("Emergency Medical Service*") OR INDEXTERMS("Emergency Medicine Technician*") OR TITLE-ABS("Emergency Medicine Technician*") OR AUTHKEY("Emergency Medicine Technician*") OR INDEXTERMS("Emergency Responder*") OR TITLE-ABS("Emergency Responder*") OR AUTHKEY("Emergency Responder*") OR INDEXTERMS("Emergicenter*") OR TITLE-ABS("Emergicenter*") OR AUTHKEY("Emergicenter*") OR INDEXTERMS("Fire fighter*") OR TITLE-ABS("Fire fighter*") OR AUTHKEY("Fire fighter*") OR INDEXTERMS("Firefighter*") OR TITLE-ABS("Firefighter*") OR AUTHKEY("Firefighter*") OR INDEXTERMS("Fireman") OR TITLE-ABS("Fireman")

3
OR AUTHKEY("Fireman") OR INDEXTERMS("Firemen") OR TITLE-ABS("Firemen") OR AUTHKEY("Firemen") OR INDEXTERMS("Firewoman") OR TITLE-ABS("Firewoman") OR AUTHKEY("Firewoman") OR INDEXTERMS("Firewomen") OR TITLE-ABS("Firewomen") OR AUTHKEY("Firewomen") OR INDEXTERMS("First Responder*") OR TITLE-ABS("First Responder*") OR AUTHKEY("First Responder*") OR INDEXTERMS("Law Enforcement ") OR TITLE-ABS("Law Enforcement ") OR AUTHKEY("Law Enforcement ") OR INDEXTERMS("Medical Emergency Service*") OR TITLE-ABS("Medical Emergency Service*") OR AUTHKEY("Medical Emergency Service*") OR INDEXTERMS("Paramedic*") OR TITLE-ABS("Paramedic*") OR AUTHKEY("Paramedic*") OR INDEXTERMS("Police Force*") OR TITLE-ABS("Police Force*") OR AUTHKEY("Police Force*") OR INDEXTERMS("Police*") OR TITLE-ABS("Police*") OR AUTHKEY("Police*") OR INDEXTERMS("Prehospital Emergency") OR TITLE-ABS("Prehospital Emergency") OR AUTHKEY("Prehospital Emergency") OR INDEXTERMS("Prehospital Emergency Care") OR TITLE-ABS("Prehospital Emergency Care") OR AUTHKEY("Prehospital Emergency Care") OR INDEXTERMS("public safety") OR TITLE-ABS("public safety") OR AUTHKEY("public safety")
2 INDEXTERMS("Aerospace Medicine") OR TITLE-ABS("Aerospace Medicine") OR AUTHKEY("Aerospace Medicine") OR INDEXTERMS("Air Ambulances") OR TITLE-ABS("Air Ambulances") OR AUTHKEY("Air Ambulances") OR INDEXTERMS("Ambulances") OR TITLE-ABS("Ambulances") OR AUTHKEY("Ambulances") OR INDEXTERMS("Automobile Driving") OR TITLE-ABS("Automobile Driving") OR AUTHKEY("Automobile Driving") OR INDEXTERMS("Aviation") OR TITLE-ABS("Aviation") OR AUTHKEY("Aviation") OR INDEXTERMS("Motor Vehicles") OR TITLE-ABS("Motor Vehicles") OR AUTHKEY("Motor Vehicles") OR INDEXTERMS("Railroads") OR TITLE-ABS("Railroads") OR AUTHKEY("Railroads") OR INDEXTERMS("Ships") OR TITLE-ABS("Ships") OR AUTHKEY("Ships") OR INDEXTERMS("Transportation") OR TITLE-ABS("Transportation") OR AUTHKEY("Transportation") OR INDEXTERMS("Transportation of Patients") OR TITLE-ABS("Transportation of Patients") OR AUTHKEY("Transportation of Patients") OR INDEXTERMS("Air Traffic Control*") OR TITLE-ABS("Air Traffic Control*") OR AUTHKEY("Air Traffic Control*") OR INDEXTERMS("Ambulance driver*") OR TITLE-ABS("Ambulance driver*") OR AUTHKEY("Ambulance driver*") OR INDEXTERMS("Ambulance*") OR TITLE-ABS("Ambulance*") OR AUTHKEY("Ambulance*") OR INDEXTERMS("Aviation") OR TITLE-ABS("Aviation") OR AUTHKEY("Aviation") OR INDEXTERMS("Boat*") OR TITLE-ABS("Boat*") OR AUTHKEY("Boat*") OR INDEXTERMS("Bus driver*") OR TITLE-ABS("Bus driver*") OR AUTHKEY("Bus driver*") OR INDEXTERMS("Bus") OR TITLE-ABS("Bus") OR AUTHKEY("Bus") OR INDEXTERMS("Driver*") OR TITLE-ABS("Driver*") OR AUTHKEY("Driver*") OR INDEXTERMS("Driving") OR TITLE-ABS("Driving") OR AUTHKEY("Driving") OR INDEXTERMS("Navigator*") OR TITLE-ABS("Navigator*") OR AUTHKEY("Navigator*") OR INDEXTERMS("Pilot*") OR TITLE-ABS("Pilot*") OR AUTHKEY("Pilot*") OR INDEXTERMS("Railroad*") OR TITLE-ABS("Railroad*") OR AUTHKEY("Railroad*") OR INDEXTERMS("Ship*") OR TITLE-ABS("Ship*") OR AUTHKEY("Ship*") OR INDEXTERMS("Subway*") OR TITLE-ABS("Subway*") OR AUTHKEY("Subway*") OR INDEXTERMS("Train") OR TITLE-ABS("Train") OR AUTHKEY("Train") OR INDEXTERMS("Trains") OR TITLE-ABS("Trains") OR AUTHKEY("Trains") OR INDEXTERMS("Truck drivers") OR TITLE-ABS("Truck drivers") OR AUTHKEY("Truck drivers") OR INDEXTERMS("Truck driver") OR TITLE-ABS("Truck driver") OR AUTHKEY("Truck driver") OR INDEXTERMS("Truck*") OR TITLE-ABS("Truck*") OR AUTHKEY("Truck*") OR INDEXTERMS("Trucker*") OR TITLE-ABS("Trucker*") OR AUTHKEY("Trucker*")
3 INDEXTERMS("Nuclear Power Plants") OR TITLE-ABS("Nuclear Power Plants") OR AUTHKEY("Nuclear Power Plants") OR INDEXTERMS("Nuclear Power Plant*") OR TITLE-ABS("Nuclear Power Plant*") OR AUTHKEY("Nuclear Power Plant*")
4 INDEXTERMS("Military Personnel") OR TITLE-ABS("Military Personnel") OR AUTHKEY("Military Personnel") OR INDEXTERMS("Air Force Personnel") OR TITLE-ABS("Air Force Personnel") OR AUTHKEY("Air Force Personnel") OR INDEXTERMS("Armed Forces Personnel") OR TITLE-ABS("Armed Forces Personnel") OR AUTHKEY("Armed Forces Personnel") OR INDEXTERMS("Army Personnel") OR TITLE-ABS("Army Personnel") OR AUTHKEY("Army Personnel") OR INDEXTERMS("Coast Guard") OR TITLE-ABS("Coast Guard") OR AUTHKEY("Coast Guard") OR INDEXTERMS("Marine*") OR TITLE-ABS("Marine*") OR AUTHKEY("Marine*") OR INDEXTERMS("Military") OR TITLE-ABS("Military") OR AUTHKEY("Military") OR INDEXTERMS("Navy Personnel") OR TITLE-ABS("Navy Personnel") OR AUTHKEY("Navy Personnel") OR INDEXTERMS("Sailor*") OR TITLE-ABS("Sailor*") OR

4
AUTHKEY("Sailor*") OR INDEXTERMS("Soldier*") OR TITLE-ABS("Soldier*") OR AUTHKEY("Soldier*") OR INDEXTERMS("Submariner*") OR TITLE-ABS("Submariner*") OR AUTHKEY("Submariner*")
5 INDEXTERMS("Health Personnel") OR TITLE-ABS("Health Personnel") OR AUTHKEY("Health Personnel") OR INDEXTERMS("Nurses") OR TITLE-ABS("Nurses") OR AUTHKEY("Nurses") OR INDEXTERMS("Pharmacists") OR TITLE-ABS("Pharmacists") OR AUTHKEY("Pharmacists") OR INDEXTERMS("Physicians") OR TITLE-ABS("Physicians") OR AUTHKEY("Physicians") OR INDEXTERMS("hospital medical staff") OR TITLE-ABS("hospital medical staff") OR AUTHKEY("hospital medical staff") OR INDEXTERMS("Internship and Residency") OR TITLE-ABS("Internship and Residency") OR AUTHKEY("Internship and Residency") OR INDEXTERMS("resident*") OR TITLE-ABS("resident*") OR AUTHKEY("resident*") OR INDEXTERMS("interns") OR TITLE-ABS("interns") OR AUTHKEY("interns") OR INDEXTERMS("residents") OR TITLE-ABS("residents") OR AUTHKEY("residents") OR INDEXTERMS("internship") OR TITLE-ABS("internship") OR AUTHKEY("internship") OR INDEXTERMS("residency") OR TITLE-ABS("residency") OR AUTHKEY("residency") OR INDEXTERMS("house staff") OR TITLE-ABS("house staff") OR AUTHKEY("house staff") OR INDEXTERMS("Allied Health Personnel") OR TITLE-ABS("Allied Health Personnel") OR AUTHKEY("Allied Health Personnel") OR INDEXTERMS("Doctor*") OR TITLE-ABS("Doctor*") OR AUTHKEY("Doctor*") OR INDEXTERMS("Health Care Provider*") OR TITLE-ABS("Health Care Provider*") OR AUTHKEY("Health Care Provider*") OR INDEXTERMS("Healthcare Provider*") OR TITLE-ABS("Healthcare Provider*") OR AUTHKEY("Healthcare Provider*") OR INDEXTERMS("Nurs*") OR TITLE-ABS("Nurs*") OR AUTHKEY("Nurs*") OR INDEXTERMS("Pharmacist*") OR TITLE-ABS("Pharmacist*") OR AUTHKEY("Pharmacist*") OR INDEXTERMS("Physician*") OR TITLE-ABS("Physician*") OR AUTHKEY("Physician*")
6 INDEXTERMS("shiftwork") OR TITLE-ABS("shiftwork") OR AUTHKEY("shiftwork") OR INDEXTERMS("shift work") OR TITLE-ABS("shift work") OR AUTHKEY("shift work") OR INDEXTERMS("shift worker") OR TITLE-ABS("shift worker") OR AUTHKEY("shift worker")
7 #1 OR #2 OR #3 OR #4 OR #5 OR #6 8 INDEXTERMS("Fatigue") OR TITLE-ABS("Fatigue") OR AUTHKEY("Fatigue") OR INDEXTERMS("Sleep")
OR TITLE-ABS("Sleep") OR AUTHKEY("Sleep") 9 #7 AND #8 10 INDEXTERMS("Decision Support Technique*") OR TITLE("Decision Support Technique*") OR
AUTHKEY("Decision Support Technique*") OR INDEXTERMS("Decision Support Model*") OR TITLE("Decision Support Model*") OR AUTHKEY("Decision Support Model*") OR INDEXTERMS("Decision Aid*") OR TITLE("Decision Aid*") OR AUTHKEY("Decision Aid*") OR INDEXTERMS("Decision Analysis") OR TITLE("Decision Analysis") OR AUTHKEY("Decision Analysis") OR INDEXTERMS("Decision Analyses") OR TITLE("Decision Analyses") OR AUTHKEY("Decision Analyses") OR INDEXTERMS("Decision Modeling") OR TITLE("Decision Modeling") OR AUTHKEY("Decision Modeling") OR INDEXTERMS("Clinical Prediction Rule*") OR TITLE("Clinical Prediction Rule*") OR AUTHKEY("Clinical Prediction Rule*") OR INDEXTERMS("Biologic Model*") OR TITLE("Biologic Model*") OR AUTHKEY("Biologic Model*") OR INDEXTERMS("Biological Model*") OR TITLE("Biological Model*") OR AUTHKEY("Biological Model*") OR INDEXTERMS("Task Performance and Analysis") OR TITLE("Task Performance and Analysis") OR AUTHKEY("Task Performance and Analysis") OR INDEXTERMS("Task Performance*") OR TITLE("Task Performance*") OR AUTHKEY("Task Performance*") OR INDEXTERMS("Critical Incident Technique*") OR TITLE("Critical Incident Technique*") OR AUTHKEY("Critical Incident Technique*") OR INDEXTERMS("Theoretical Model*") OR TITLE("Theoretical Model*") OR AUTHKEY("Theoretical Model*") OR INDEXTERMS("Experimental Model*") OR TITLE("Experimental Model*") OR AUTHKEY("Experimental Model*") OR

5
INDEXTERMS("Mathematical Model*") OR TITLE("Mathematical Model*") OR AUTHKEY("Mathematical Model*") OR INDEXTERMS("Models, Statistical") OR TITLE("Models, Statistical") OR AUTHKEY("Models, Statistical") OR INDEXTERMS("Statistical Model*") OR TITLE("Statistical Model*") OR AUTHKEY("Statistical Model*") OR INDEXTERMS("Probabilistic Model*") OR TITLE("Probabilistic Model*") OR AUTHKEY("Probabilistic Model*") OR INDEXTERMS("Polynomial Model*") OR TITLE("Polynomial Model*") OR AUTHKEY("Polynomial Model*") OR INDEXTERMS("Two-Parameter Model*") OR TITLE("Two-Parameter Model*") OR AUTHKEY("Two-Parameter Model*") OR INDEXTERMS("Two Parameter Model*") OR TITLE("Two Parameter Model*") OR AUTHKEY("Two Parameter Model*") OR INDEXTERMS("Binomial Model*") OR TITLE("Binomial Model*") OR AUTHKEY("Binomial Model*") OR INDEXTERMS("Biomathematical model*") OR TITLE("Biomathematical model*") OR AUTHKEY("Biomathematical model*") OR INDEXTERMS("Computer Simulation") OR TITLE("Computer Simulation") OR AUTHKEY("Computer Simulation") OR INDEXTERMS("simulation") OR TITLE("simulation") OR AUTHKEY("simulation") OR INDEXTERMS("two process model*") OR TITLE("two process model*") OR AUTHKEY("two process model*") OR INDEXTERMS("two-process model*") OR TITLE("two-process model*") OR AUTHKEY("two-process model*") OR INDEXTERMS("Statistical Data Interpretation") OR TITLE("Statistical Data Interpretation") OR AUTHKEY("Statistical Data Interpretation") OR INDEXTERMS("Statistical Data Analysis") OR TITLE("Statistical Data Analysis") OR AUTHKEY("Statistical Data Analysis") OR INDEXTERMS("Statistical Data Analyses") OR TITLE("Statistical Data Analyses") OR AUTHKEY("Statistical Data Analyses") OR INDEXTERMS("Theoretical Study") OR TITLE("Theoretical Study") OR AUTHKEY("Theoretical Study") OR INDEXTERMS("Theoretical Studies") OR TITLE("Theoretical Studies") OR AUTHKEY("Theoretical Studies")
11 #9 AND #10 12 ALL (“metal*”) OR ALL (“iron”) OR ALL (“steel “) OR ALL (“aluminum”) OR ALL (“titanium”) OR ALL
(“strut”) OR ALL (“blade*”) OR ALL (“rotor*”) OR ALL (“voltage”) OR ALL (“capacitor”) OR ALL (“mechanical”) OR ALL (“heat”) OR ALL (“laser”) OR ALL (“welding”) OR ALL (“transformer”) OR ALL (“beam*”) OR ALL (“turbo*”) OR ALL (“turbine*”) OR ALL (“therm*”) OR ALL (“liquid*”) OR ALL (“electrical”) OR ALL (“water”) OR ALL (“magnetic”) OR ALL (“fiber*”) OR ALL (“optic*”) OR ALL (“price”) OR ALL (“pricing”) OR ALL (“axle*”) OR ALL (“crack*”) OR ALL (“railroad*”) OR ALL (“container*”) OR ALL (“road*”) OR ALL (“route*”) OR ALL (“traffic”) OR ALL (“transport”) OR ALL (“transportation”)
13 #11 AND NOT #12 14 [#13] AND NOT INDEX(medline) 15 [#14] AND PUBYEAR > 1979
PsycINFO (Ovid Technologies) 1 Corrections Officers/ OR correctional officer$.mp. OR Emergency Services/ OR emergency health service$.mp. OR
emergency medical service$.mp. OR emergency medicine technician$.mp. OR Rescue Workers/ OR First Responders/ OR first responder$.mp. OR emergency responder$.mp. OR Fire Fighters/ OR fire fighter$.mp. OR firefighter$.mp. OR Law Enforcement/ OR law enforcement .mp. OR medical emergency service$.mp. OR Allied Health Personnel/ OR paramedic$.mp. OR Police Personnel/ OR police force$.mp. OR police$.mp. OR prehospital emergency care.mp. OR public safety.mp.
2 exp Transportation/ OR Aerospace Personnel/ OR Aviation/ OR Aircraft Pilots/ OR pilot$.mp. OR Air Traffic Control/ OR Air Traffic Control$.mp. OR Ambulance$.mp. OR Drivers/ OR driver$.mp. OR driving.mp. OR Motor Vehicles/ OR (bus or buses).mp. OR truck$.mp. OR ship$.mp. OR boat$.mp. OR Railroad Trains/ OR railroad$.mp. OR subway$.mp. OR navigator$.mp.
3 nuclear power.mp. 4 exp Military Personnel/ OR military.mp. OR air force.mp. OR armed forces.mp. OR army.mp. OR coast guard.mp. OR
marine$.mp. OR navy.mp. OR sailor$.mp. OR soldier$.mp. OR submariner$.mp.

6
5 Medical Personnel/ OR Health Personnel/ OR Military Medical Personnel/ OR Allied Health Personnel/ OR Nurses/ OR Pharmacists/ OR Physicians/ OR health care provider$.mp. OR healthcare provider$.mp. OR Clinicians/ OR doctor$.mp. OR physician$.mp. OR nurs$.mp. OR pharmacist$.mp. OR Medical Residency/ OR Medical Internship/ OR residents.mp. OR interns.mp. OR internship.mp. OR residency.mp. OR house staff.mp.
6 shiftwork.mp. OR shift work.mp. OR shift worker.mp. OR Workday Shifts/ 7 OR/1-6 8 Fatigue/ OR fatigue.mp. OR Sleep/ OR sleep.mp. 9 7 AND 8 10 Binomial Model$.mp. OR Biologic$ Model$.mp. OR Biological Model$.mp. OR Biomathematical model$.mp. OR Clinical
Prediction Rule$.mp. OR Critical Incident Technique$.mp. OR Decision Aid$.mp. OR Decision Analyses.mp. OR Decision Analysis.mp. OR Decision Modeling.mp. OR Decision Support Model$.mp. OR Decision Support Technique$.mp. OR Decision Support Systems/ OR Experimental Model$.mp. OR Models/ OR Mathematical Modeling/ OR Mathematical Model$.mp. OR Polynomial Model$.mp. OR Probabilistic Model$.mp. OR exp Simulation/ OR simulation.mp. OR Statistical Model$.mp. OR Task Performance.mp. OR Theoretical Model$.mp. OR Two Parameter Model$.mp. OR two-process model$.mp. OR Computer Simulation/ OR Statistical Data Interpretation.mp. OR Statistical Data Analysis.mp. OR Statistical Data Analyses.mp. OR Statistical Analysis/ OR Theoretical Study.mp. OR Theoretical Studies.mp.
11 9 AND 10 12 limit 11 to yr="1980 -Current" 13 limit 12 to animal 14 limit 12 to human 15 13 NOT 14 16 12 NOT 15 17 limit 16 to (100 childhood <birth to age 12 yrs> or 120 neonatal <birth to age 1 mo> or 140 infancy <2 to 23 mo> or 160
preschool age <age 2 to 5 yrs> or 180 school age <age 6 to 12 yrs> or 200 adolescence <age 13 to 17 yrs>)
18 limit 16 to ("300 adulthood <age 18 yrs and older>" or 320 young adulthood <age 18 to 29 yrs> or 340 thirties <age 30 to 39 yrs> or 360 middle age <age 40 to 64 yrs> or "380 aged <age 65 yrs and older>" or "390 very old <age 85 yrs and older>")
19 17 NOT 18 20 16 NOT 19
CINAHL (EBSCO Industries, Inc.) S1 (MH "Emergency Medical Services") OR (MH "Emergency Medical Technicians ") OR (MH "Emergicenter*") OR (MH
"Paramedic*") OR (MH "Prehospital Care") OR "correctional officer*" OR "emergency health service*" OR "emergency medical service*" OR "emergency medicine technician*" OR "emergency responder*" OR "firefighters" OR "fire fighter*" OR "firefighter*" OR "fireman" OR "firemen" OR "first responder*" OR "law enforcement " OR "medical emergency service*" OR "police" OR "police force*" OR "police*" OR "prehospital care" OR "prehospital emergency" OR "prehospital emergency care" OR "public safety"
S2 (MH "Aerospace Medicine") OR (MH "Ambulances") OR (MH "Automobile Driving") OR (MH "Aviation") OR (MH "Motor Vehicles") OR (MH "Railroads") OR (MH "Ships") OR (MH "Transportation") OR (MH "Transportation of Patients") OR (MH "Aeromedical Transport ") OR (MH "Pilots") OR "ambulance*" OR "railroad*" OR "subway*" OR "train" OR "trains" OR "ship*" OR "boat*" OR "air traffic control*" OR "driver*" OR "driving" OR "navigator*" OR "pilot*" OR "truck*"
S3 (MH "Nuclear Power Plants") OR "nuclear power " S4 (MH "Military Personnel+") OR "air force personnel" OR "armed forces personnel" OR "army personnel" OR "coast guard"
OR "marine*" OR "military" OR "navy personnel" OR "sailor*" OR "soldier*" OR "submarine*"

7
S5 (MH "Health Personnel") OR (MH "Internship and Residency") OR (MH "Interns and Residents") OR (MH "Physicians") OR (MH "Physicians, Emergency") OR (MH "Medical Staff, Hospital ") OR (MH "Nurses") OR (MH "Nursing Staff, Hospital ") OR (MH "Pharmacists") OR "health care provider*" OR "healthcare provider*" OR "residen*" OR "intern*" OR "house staff" OR "physician*" OR "doctor*" OR "nurs*" OR "pharmacist*"
S6 (MH "Shiftwork") OR "shiftwork" OR "shift work" OR (MH "Shift Workers") OR "shift worker*") S7 S1 OR S2 OR S3 OR S4 OR S5 OR S6 S8 (MH "Fatigue") OR "fatigue" OR "lassitude" OR "tiredness" OR "exhaustion" S9 (MH "Sleep") OR "sleep" S10 "sleep quality" OR "quality of sleep" OR "sleep inertia" OR "sleep latency" OR "sleep homeostasis" OR "sleep health" OR
"sleep hygiene" OR "sleep-wake cycle" OR "sleep pressure" OR "sleep time" OR "sleep parameters" OR "sleep pattern"
S11 (MH "Sleep Stages") OR "sleep stage*" OR "sleep phase*" OR "drowsiness" OR "sleepiness" OR (MH "Relaxation") OR (MH "Rejuvenation")
S12 (MH "Sleep, REM") OR "rem sleep" OR "rhombencephalic sleep" OR "fast-wave sleep" OR "fast wave sleep" OR "paradoxical sleep"
S13 (MH "Melatonin") OR (MH "Chronobiology Disorders") OR (MH "Biological Clocks") OR (MH "Light") OR (MH "Lighting") OR (MH "Circadian Rhythm") OR "melatonin" OR "chronobiolog*" OR "biological clock*" OR "biologic clock*" OR "biologic* oscillator*" OR "biologic* pacemaker*" OR "endogenous oscillator*" OR "circadian rhythm*" OR "twenty-four hour rhythm*" OR "twenty four hour rhythm*" OR "ultradian rhythm*" OR "diurnal rhythm*" OR "nyctohemeral rhythm*" OR "24-hour rhythm*"
S14 (MH "Chronotherapy") OR "sleep phase chronotherap*" OR "phase advance chronotherap*" OR "phase delay chronotherap*"
S15 (MH "Wakefulness") OR (MH "Arousal") OR (MH "Attention") OR "wakefulness" OR "arousal" OR "alertness" OR "vigilance"
S16 (MH "Sleep Deprivation") OR "sleep deprivation*" OR "sleep fragmentation*" OR "insufficient sleep syndrome*" S17 (MH "Sleep Disorders, Circadian Rhythm") OR (MH "Sleep-Wake Transition Disorders") OR "disturbed nyctohemeral
rhythm*" OR "circadian rhythm sleep disorder*" OR "sleep wake cycle disorder*" OR "sleep-wake schedule disorder*" OR "sleep wake schedule disorder*" OR "shift-work sleep disorder*" OR "shift work sleep disorder*" OR "non-24 hour sleep-wake disorder*" OR "non 24 hour sleep wake disorder*" OR "non twenty-four hour sleep-wake disorder*" OR "nonorganic sleep wake cycle disorder*" OR "advanced sleep phase syndrome*" OR "delayed sleep phase syndrome*" OR "delayed sleep-phase syndrome*"
S18 (MH "Disorders of Excessive Somnolence") OR (MH "Sleep Disorders$") OR "excessive somnolence disorder*" OR "hypersomnolence" OR "hypersomnia" OR "sleep wake disorder*" OR "subwakefulness syndrome*" OR "sleep disorder*" OR "sleep related neurogenic tachypnea" OR "sleep-related neurogenic tachypnea" OR "long sleeper syndrome" OR "short sleeper syndrome" OR "short sleep phenotype"
S19 (MH "Insomnia") OR "sleep initiation and maintenance disorders" OR "disorders of initiating and maintaining sleep" OR "dims" OR "early awakening" OR "insomnia*" OR "sleep initiation dysfunction" OR "sleeplessness"
S20 (MH "Sleep Arousal Disorders") OR "sleep arousal disorder" OR "confusional arousal*" S21 (MH "Sleep Disorders, Intrinsic") OR "intrinsic sleep disorder*" OR "sleep state misperception*" OR "post-traumatic
hypersomnia" OR "posttraumatic hypersomnia"
S22 (MH "Dyssomnias") OR "dyssomnia*" OR "environmental sleep disorder*" OR "extrinsic sleep disorder*" OR "limit-setting sleep disorder*" OR "limit setting sleep disorder*" OR "nocturnal eating-drinking syndrome*" OR "nocturnal eating drinking syndrome*" OR "adjustment sleep disorder*" OR "inadequate sleep hygiene"
S23 S8 OR S9 OR S10 OR S11 OR S12 OR S13 OR S14 OR S15 OR S16 OR S17 OR S18 OR S19 OR S20 OR S21 OR S22
S24 S7 AND S23

8
S25 "Binomial Model*" OR "Biologic* Model*" OR "Biological Model*" OR "Biomathematical model*" OR "Clinical Prediction Rule*" OR "Critical Incident Technique*" OR "Decision Aid*" OR "Decision Analyses" OR "Decision Analysis" OR "Decision Modeling" OR "Decision Support Model*" OR "Decision Support Technique*" OR "Decision Support Systems" OR "Experimental Model*" OR "Goodness of Fit" OR "goodness of fit" OR "Goodness-of-fit" OR "Model*" OR "Mathematical Modeling" OR "Mathematical Model*" OR "Polynomial Model*" OR "Probabilistic Model*" OR "exp Simulation" OR "simulation" OR "Statistical Model*" OR "Task Performance" OR "Theoretical Model*" OR "Two Parameter Model*" OR "two-process model*" OR (MH "Models, Biological") OR (MH "Models, Statistical") OR (MH "Critical Incidents Method") OR (MH "Decision Support Systems, Clinical") OR (MH "Decision Support Techniques") OR (MH "Decision Support Systems, Management") OR (MH "Decision Making, Computer Assisted") OR (MH "Goodness of Fit Chi Square Test") OR (MH "Simulations") OR (MH "Computer Simulation") OR (MH "Task Performance and Analysis")
S26 S24 AND S25 S27 Limiters - Published Date: 19800101-20171231
PILOTS (ProQuest)
((fatigue OR sleep*) AND (model* OR simulation OR biomathematical)) NOT (chronic fatigue OR compassion fatigue) National Institute of Justice Publications and Multimedia (https://nij.gov/publications/pages/welcome.aspx)
((fatigue OR sleep*) AND (model* OR simulation OR biomathematical)) NOT (chronic fatigue OR compassion fatigue)
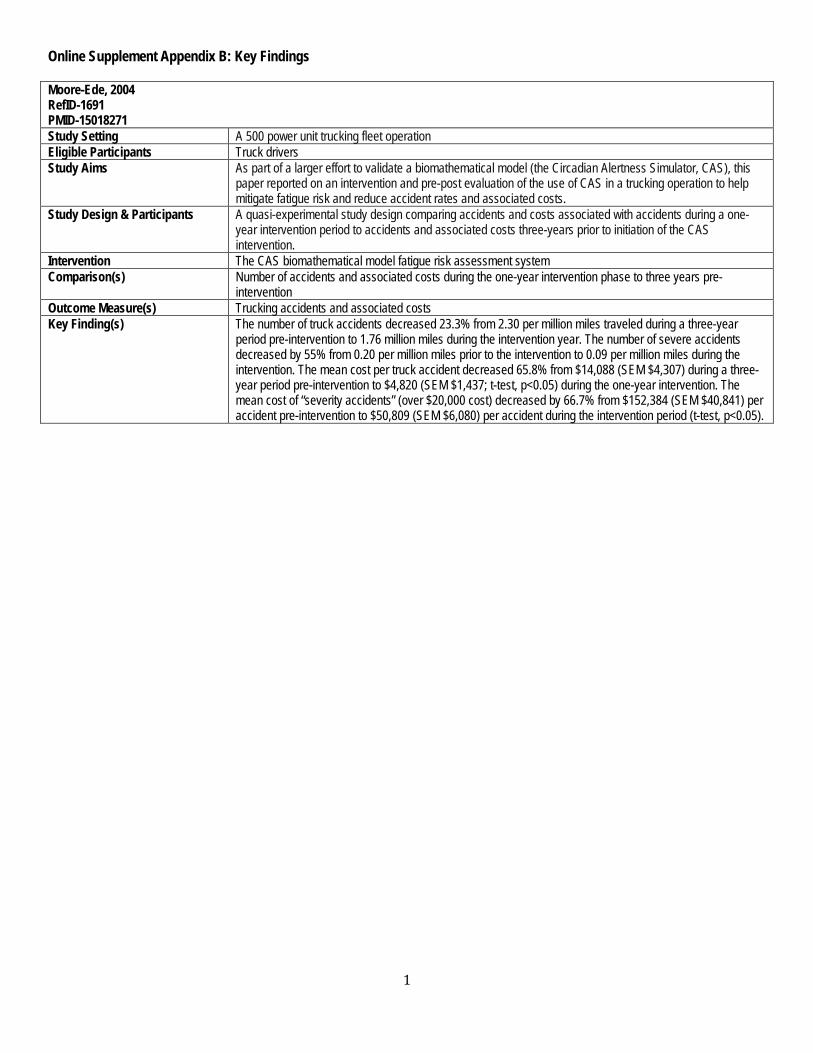
1
Online Supplement Appendix B: Key Findings Moore-Ede, 2004 RefID-1691 PMID-15018271 Study Setting A 500 power unit trucking fleet operation Eligible Participants Truck drivers Study Aims As part of a larger effort to validate a biomathematical model (the Circadian Alertness Simulator, CAS), this
paper reported on an intervention and pre-post evaluation of the use of CAS in a trucking operation to help mitigate fatigue risk and reduce accident rates and associated costs.
Study Design & Participants A quasi-experimental study design comparing accidents and costs associated with accidents during a one-year intervention period to accidents and associated costs three-years prior to initiation of the CAS intervention.
Intervention The CAS biomathematical model fatigue risk assessment system Comparison(s) Number of accidents and associated costs during the one-year intervention phase to three years pre-
intervention Outcome Measure(s) Trucking accidents and associated costs Key Finding(s) The number of truck accidents decreased 23.3% from 2.30 per million miles traveled during a three-year
period pre-intervention to 1.76 million miles during the intervention year. The number of severe accidents decreased by 55% from 0.20 per million miles prior to the intervention to 0.09 per million miles during the intervention. The mean cost per truck accident decreased 65.8% from $14,088 (SEM $4,307) during a three-year period pre-intervention to $4,820 (SEM $1,437; t-test, p<0.05) during the one-year intervention. The mean cost of “severity accidents” (over $20,000 cost) decreased by 66.7% from $152,384 (SEM $40,841) per accident pre-intervention to $50,809 (SEM $6,080) per accident during the intervention period (t-test, p<0.05).
1
Online Supplement Appendix C: Exclusions with reasons RefID 61 PMID n/a Citation/Reference Åkerstedt T, Axelsson J, Kecklund G (2007) Individual validation of model predictions of
sleepiness and sleep hours. Somnologie - Schlafforsch und Schlafmedizin 11: 169–174 Available: http://link.springer.com/10.1007/s11818-007-0315-7 Accessed 8 May 2017.
Exclusion Criteria Reviewer’s Justification -Population of interest -Interventions of interest No intervention tested -Comparisons of interest -Outcomes of interest RefID 62 PMID 7761737 Citation/Reference Åkerstedt T, Folkard S. Validation of the S and C components of the three-process model
of alertness regulation. Sleep. 1995 Jan;18(1):1-6. PubMed PMID: 7761737 Exclusion Criteria Reviewer’s Justification -Population of interest -Interventions of interest No intervention tested -Comparisons of interest -Outcomes of interest RefID 122 PMID 16964748 Citation/Reference Armentrout JJ, Holland DA, O'Toole KJ, Ercoline WR. Fatigue and related human factors in
the near crash of a large military aircraft. Aviat Space Environ Med. 2006 Sep;77(9):963-70. PubMed PMID: 16964748
Exclusion Criteria Reviewer’s Justification -Population of interest -Interventions of interest No intervention tested -Comparisons of interest -Outcomes of interest

2
RefID 218 PMID 15018270 Citation/Reference Belyavin AJ, Spencer MB. Modeling performance and alertness: the QinetiQ approach.
Aviat Space Environ Med. 2004 Mar;75(3 Suppl):A93-103; discussion 104-6. PubMed PMID: 15018270
Exclusion Criteria Reviewer’s Justification -Population of interest -Interventions of interest No intervention tested -Comparisons of interest -Outcomes of interest RefID 264 PMID 17539442 Citation/Reference Bliese PD, McGurk D, Thomas JL, Balkin TJ, Wesensten N. Discontinuous growth
modeling of adaptation to sleep setting changes: individual differences and age. Aviat Space Environ Med. 2007 May;78(5):485-92. PubMed PMID: 17539442
Exclusion Criteria Reviewer’s Justification -Population of interest -Interventions of interest No intervention tested -Comparisons of interest -Outcomes of interest RefID 366 PMID 22239930 Citation/Reference Cabon P, Deharvengt S, Grau JY, Maille N, Berechet I, Mollard R. Research and
guidelines for implementing Fatigue Risk Management Systems for the French regional airlines. Accid Anal Prev. 2012 Mar;45 Suppl:41-4. doi: 10.1016/j.aap.2011.09.024. Epub 2011 Nov 5. PubMed PMID: 22239930
Exclusion Criteria Reviewer’s Justification -Population of interest -Interventions of interest No intervention tested -Comparisons of interest -Outcomes of interest

3
RefID 427 PMID 24024304 Citation/Reference Chandler JF, Arnold RD, Phillips JB, Turnmire AE. Predicting individual differences in
response to sleep loss: application of current techniques. Aviat Space Environ Med. 2013 Sep;84(9):927-37. PubMed PMID: 24024304
Exclusion Criteria Reviewer’s Justification -Population of interest -Interventions of interest No intervention tested -Comparisons of interest -Outcomes of interest RefID 445 PMID 20220612 Citation/Reference Chen CK, Lin C, Hou TH, Wang SH, Lin HM. A study of operating room scheduling that
integrates multiple quantitative and qualitative objectives. J Nurs Res. 2010 Mar;18(1):62-74. doi: 10.1097/JNR.0b013e3181d0365f. PubMed PMID: 20220612
Exclusion Criteria Reviewer’s Justification -Population of interest -Interventions of interest No intervention tested -Comparisons of interest -Outcomes of interest RefID 575 PMID 26026969 Citation/Reference Darwent D, Dawson D, Paterson JL, Roach GD, Ferguson SA. Managing fatigue: It really
is about sleep. Accid Anal Prev. 2015 Sep;82:20-6. doi: 10.1016/j.aap.2015.05.009. Epub 2015 May 27. PubMed PMID: 26026969
Exclusion Criteria Reviewer’s Justification -Population of interest -Interventions of interest No intervention tested -Comparisons of interest -Outcomes of interest

4
RefID 576 PMID 20175402 Citation/Reference Darwent D, Dawson D, Roach GD. Prediction of probabilistic sleep distributions following
travel across multiple time zones. Sleep. 2010 Feb;33(2):185-95. PubMed PMID: 20175402; PubMed Central PMCID: PMC2816963
Exclusion Criteria Reviewer’s Justification -Population of interest -Interventions of interest No intervention tested -Comparisons of interest -Outcomes of interest RefID 577 PMID 22239923 Citation/Reference Darwent D, Dawson D, Roach GD. A model of shiftworker sleep/wake behaviour. Accid
Anal Prev. 2012 Mar;45 Suppl:6-10. doi: 10.1016/j.aap.2011.09.017. Epub 2011 Oct 5. PubMed PMID: 22239923
Exclusion Criteria Reviewer’s Justification -Population of interest -Interventions of interest No intervention tested -Comparisons of interest -Outcomes of interest RefID 593 PMID 11209874 Citation/Reference Dawson D, Fletcher A. A quantitative model of work-related fatigue: background and
definition. Ergonomics. 2001 Feb 10;44(2):144-63. PubMed PMID: 11209874 Exclusion Criteria Reviewer’s Justification -Population of interest -Interventions of interest No intervention tested -Comparisons of interest -Outcomes of interest

5
RefID 613 PMID 17517914 Citation/Reference Dean DA 2nd, Fletcher A, Hursh SR, Klerman EB. Developing mathematical models of
neurobehavioral performance for the "real world". J Biol Rhythms. 2007 Jun;22(3):246-58. Review. PubMed PMID: 17517914
Exclusion Criteria Reviewer’s Justification -Population of interest -Interventions of interest No intervention tested -Comparisons of interest -Outcomes of interest RefID 614 PMID 19543382 Citation/Reference Dean DA 2nd, Forger DB, Klerman EB. Taking the lag out of jet lag through model-based
schedule design. PLoS Comput Biol. 2009 Jun;5(6):e1000418. doi: 10.1371/journal.pcbi.1000418. Epub 2009 Jun 19. PubMed PMID: 19543382; PubMed Central PMCID: PMC2691990
Exclusion Criteria Reviewer’s Justification -Population of interest -Interventions of interest No intervention tested -Comparisons of interest -Outcomes of interest RefID 649 PMID 15018272 Citation/Reference Dijk DJ, Larkin W. Fatigue and performance models: general background and commentary
on the circadian alertness simulator for fatigue risk assessment in transportation. Aviat Space Environ Med. 2004 Mar;75(3 Suppl):A119-21. PubMed PMID: 15018272
Exclusion Criteria Reviewer’s Justification -Population of interest -Interventions of interest No intervention tested -Comparisons of interest -Outcomes of interest

6
RefID 680 PMID 22239925 Citation/Reference Dorrian J, Darwent D, Dawson D, Roach GD. Predicting pilot's sleep during layovers using
their own behaviour or data from colleagues: implications for biomathematical models. Accid Anal Prev. 2012 Mar;45 Suppl:17-21. doi: 10.1016/j.aap.2011.09.019. Epub 2011 Oct 24. PubMed PMID: 22239925
Exclusion Criteria Reviewer’s Justification -Population of interest -Interventions of interest No intervention tested -Comparisons of interest -Outcomes of interest RefID 819 PMID 15018280 Citation/Reference Folkard S, Åkerstedt T. Trends in the risk of accidents and injuries and their implications for
models of fatigue and performance. Aviat Space Environ Med. 2004 Mar;75(3 Suppl):A161-7. Review. PubMed PMID: 15018280
Exclusion Criteria Reviewer’s Justification -Population of interest -Interventions of interest No intervention tested -Comparisons of interest -Outcomes of interest RefID 820 PMID 10643755 Citation/Reference Folkard S, Åkerstedt T, Macdonald I, Tucker P, Spencer MB. Beyond the three-process
model of alertness: estimating phase, time on shift, and successive night effects. J Biol Rhythms. 1999 Dec;14(6):577-87. Review. PubMed PMID: 10643755
Exclusion Criteria Reviewer’s Justification -Population of interest -Interventions of interest No intervention tested -Comparisons of interest -Outcomes of interest
7
RefID 845 PMID n/a Citation/Reference French J. A model to predict fatigue degraded performance. In Human Factors and Power
Plants, 2002. Proceedings of the 2002 IEEE 7th Conference on 2002 (pp. 4-4). IEEE. Exclusion Criteria Reviewer’s Justification -Population of interest -Interventions of interest -Comparisons of interest -Outcomes of interest
Conference proceeding
RefID 880 PMID 15586782 Citation/Reference Garbarino S, Mascialino B, Penco MA, Squarcia S, De Carli F, Nobili L, Beelke M, Cuomo
G, Ferrillo F. Professional shift-work drivers who adopt prophylactic naps can reduce the risk of car accidents during night work. Sleep. 2004 Nov 1;27(7):1295-302. PubMed PMID: 15586782
Exclusion Criteria Reviewer’s Justification -Population of interest -Interventions of interest No intervention tested -Comparisons of interest -Outcomes of interest RefID 981 PMID n/a Citation/Reference Gundel A, Drescher J, Turowski J. Alertness in airline pilots during night flights:
Assessment of alertness using EEG measures. Engineering psychophysiology. Issues and applications Mahwah: LEA. 2000:177-87.
Exclusion Criteria Reviewer’s Justification -Population of interest -Interventions of interest No intervention tested -Comparisons of interest -Outcomes of interest

8
RefID 982 PMID n/a Citation/Reference Gunzelmann G, Veksler BZ, Walsh MM, Gluck KA. Understanding and predicting the
cognitive effects of sleep loss through simulation. Translational Issues in Psychological Science. 2015 Mar;1(1):106.
Exclusion Criteria Reviewer’s Justification -Population of interest -Interventions of interest No intervention tested -Comparisons of interest -Outcomes of interest RefID 1163 PMID 25329575 Citation/Reference Ingre M, Van Leeuwen W, Klemets T, Ullvetter C, Hough S, Kecklund G, Karlsson D,
Åkerstedt T. Validating and extending the three process model of alertness in airline operations. PLoS One. 2014 Oct 20;9(10):e108679. doi: 10.1371/journal.pone.0108679. eCollection 2014. PubMed PMID: 25329575; PubMed Central PMCID: PMC4203690
Exclusion Criteria Reviewer’s Justification -Population of interest -Interventions of interest No intervention tested -Comparisons of interest -Outcomes of interest RefID 1199 PMID 10643756 Citation/Reference Jewett ME, Kronauer RE. Interactive mathematical models of subjective alertness and
cognitive throughput in humans. J Biol Rhythms. 1999 Dec;14(6):588-97. Review. PubMed PMID: 10643756
Exclusion Criteria Reviewer’s Justification -Population of interest -Interventions of interest No intervention tested -Comparisons of interest -Outcomes of interest
9
RefID 1235 PMID 17190711 Citation/Reference Kandelaars KJ, Fletcher A, Dorrian J, Baulk SD, Dawson D. Predicting the timing and
duration of sleep in an operational setting using social factors. Chronobiol Int. 2006;23(6):1265-76. PubMed PMID: 17190711.
Exclusion Criteria Reviewer’s Justification -Population of interest -Interventions of interest No intervention tested -Comparisons of interest -Outcomes of interest RefID 1236 PMID 16491583 Citation/Reference Kandelaars KJ, Fletcher A, Eitzen GE, Roach GD, Dawson D. Layover sleep prediction for
cockpit crews during transmeridian flight patterns. Aviat Space Environ Med. 2006 Feb;77(2):145-50. PubMed PMID: 16491583
Exclusion Criteria Reviewer’s Justification -Population of interest -Interventions of interest No intervention tested -Comparisons of interest -Outcomes of interest RefID 1317 PMID 27623842 Citation/Reference Klerman EB, Beckett SA, Landrigan CP. Applying mathematical models to predict resident
physician performance and alertness on traditional and novel work schedules. BMC Med Educ. 2016 Sep 13;16(1):239. doi: 10.1186/s12909-016-0751-9. PubMed PMID: 27623842; PubMed Central PMCID: PMC5022151
Exclusion Criteria Reviewer’s Justification -Population of interest -Interventions of interest No intervention tested -Comparisons of interest -Outcomes of interest

10
RefID 1323 PMID n/a Citation/Reference Kobayashi T. Sleep package model mathematical model for a sleep pattern. Computers &
industrial engineering. 1994 Sep 1;27(1-4):385-8. Exclusion Criteria Reviewer’s Justification -Population of interest -Interventions of interest No intervention tested -Comparisons of interest -Outcomes of interest RefID 1540 PMID 15018262 Citation/Reference Mallis MM, Mejdal S, Nguyen TT, Dinges DF. Summary of the key features of seven
biomathematical models of human fatigue and performance. Aviat Space Environ Med. 2004 Mar;75(3 Suppl):A4-14. PubMed PMID: 15018262
Exclusion Criteria Reviewer’s Justification -Population of interest -Interventions of interest No intervention tested -Comparisons of interest -Outcomes of interest RefID 1612 PMID 24293775 Citation/Reference McCauley P, Kalachev LV, Mollicone DJ, Banks S, Dinges DF, Van Dongen HPA. Dynamic
circadian modulation in a biomathematical model for the effects of sleep and sleep loss on waking neurobehavioral performance. Sleep. 2013 Dec 1;36(12):1987-97. doi: 10.5665/sleep.3246. PubMed PMID: 24293775; PubMed Central PMCID: PMC3825450
Exclusion Criteria Reviewer’s Justification -Population of interest -Interventions of interest No intervention tested -Comparisons of interest -Outcomes of interest

11
RefID 1681 PMID 19194521 Citation/Reference Mollicone DJ, Van Dongen HPA, Rogers NL, Dinges DF. Response Surface Mapping of
Neurobehavioral Performance: Testing the Feasibility of Split Sleep Schedules for Space Operations. Acta Astronaut. 2008;63(7-10):833-840. PubMed PMID: 19194521; PubMed Central PMCID: PMC2633932
Exclusion Criteria Reviewer’s Justification -Population of interest -Interventions of interest No intervention tested -Comparisons of interest -Outcomes of interest RefID 1745 PMID 11669116 Citation/Reference Nechaev AP. Work and rest planning as a way of crew member error management. Acta
Astronaut. 2001 Aug-Nov;49(3-10):271-8. PubMed PMID: 11669116 Exclusion Criteria Reviewer’s Justification -Population of interest -Interventions of interest No intervention tested -Comparisons of interest -Outcomes of interest RefID 2009 PMID 22306977 Citation/Reference Postnova S, Layden A, Robinson PA, Phillips AJ, Abeysuriya RG. Exploring sleepiness and
entrainment on permanent shift schedules in a physiologically based model. J Biol Rhythms. 2012 Feb;27(1):91-102. doi: 10.1177/0748730411419934. PubMed PMID: 22306977
Exclusion Criteria Reviewer’s Justification -Population of interest -Interventions of interest No intervention tested -Comparisons of interest -Outcomes of interest

12
RefID 2011 PMID 23308206 Citation/Reference Postnova S, Robinson PA, Postnov DD. Adaptation to shift work: physiologically based
modeling of the effects of lighting and shifts' start time. PLoS One. 2013;8(1):e53379. doi: 10.1371/journal.pone.0053379. Epub 2013 Jan 4. PubMed PMID: 23308206; PubMed Central PMCID: PMC3537665
Exclusion Criteria Reviewer’s Justification -Population of interest -Interventions of interest No intervention tested -Comparisons of interest -Outcomes of interest RefID 2016 PMID 25479259 Citation/Reference Powell DM, Spencer MB, Petrie KJ. Comparison of in-flight measures with predictions of a
bio-mathematical fatigue model. Aviat Space Environ Med. 2014 Dec;85(12):1177-84. doi: 10.3357/ASEM.3806.2014. PubMed PMID: 25479259
Exclusion Criteria Reviewer’s Justification -Population of interest -Interventions of interest No intervention tested -Comparisons of interest -Outcomes of interest RefID 2030 PMID 21376901 Citation/Reference Pruchnicki SA, Wu LJ, Belenky G. An exploration of the utility of mathematical modeling
predicting fatigue from sleep/wake history and circadian phase applied in accident analysis and prevention: the crash of Comair Flight 5191. Accid Anal Prev. 2011 May;43(3):1056-61. doi: 10.1016/j.aap.2010.12.010. Epub 2011 Jan 17. PubMed PMID: 21376901
Exclusion Criteria Reviewer’s Justification -Population of interest -Interventions of interest No intervention tested -Comparisons of interest -Outcomes of interest

13
RefID 2045 PMID 19485104 Citation/Reference Rabinowitz YG, Breitbach JE, Warner CH. Managing aviator fatigue in a deployed
environment: the relationship between fatigue and neurocognitive functioning. Mil Med. 2009 Apr;174(4):358-62. PubMed PMID: 19485104
Exclusion Criteria Reviewer’s Justification -Population of interest -Interventions of interest No intervention tested -Comparisons of interest -Outcomes of interest RefID 2053 PMID 15018281 Citation/Reference Raslear TG, Coplen M. Fatigue models as practical tools: diagnostic accuracy and decision
thresholds. Aviat Space Environ Med. 2004 Mar;75(3 Suppl):A168-72. PubMed PMID: 15018281
Exclusion Criteria Reviewer’s Justification -Population of interest -Interventions of interest No intervention tested -Comparisons of interest -Outcomes of interest RefID 2054 PMID 21531251 Citation/Reference Raslear TG, Hursh SR, Van Dongen HPA. Predicting cognitive impairment and accident
risk. Prog Brain Res. 2011;190:155-67. doi: 10.1016/B978-0-444-53817-8.00010-4. Review. PubMed PMID: 21531251
Exclusion Criteria Reviewer’s Justification -Population of interest -Interventions of interest No intervention tested -Comparisons of interest -Outcomes of interest

14
RefID 2071 PMID 15018282 Citation/Reference Reifman J. Alternative methods for modeling fatigue and performance. Aviat Space Environ
Med. 2004 Mar;75(3 Suppl):A173-80. Review. PubMed PMID: 15018282 Exclusion Criteria Reviewer’s Justification -Population of interest -Interventions of interest No intervention tested -Comparisons of interest -Outcomes of interest RefID 2097 PMID 15018266 Citation/Reference Roach GD, Fletcher A, Dawson D. A model to predict work-related fatigue based on hours
of work. Aviat Space Environ Med. 2004 Mar;75(3 Suppl):A61-9; discussion A70-4. PubMed PMID: 15018266
Exclusion Criteria Reviewer’s Justification -Population of interest -Interventions of interest No intervention tested -Comparisons of interest -Outcomes of interest RefID 2110 PMID 20027860 Citation/Reference Romig E, Klemets T. Fatigue risk management in flight crew scheduling. Aviat Space
Environ Med. 2009 Dec;80(12):1073-4. PubMed PMID: 20027860 Exclusion Criteria Reviewer’s Justification -Population of interest -Interventions of interest No intervention tested -Comparisons of interest -Outcomes of interest

15
RefID 2241 PMID n/a Citation/Reference Bakar NB. Review of Workforce Fatigue Models in Workplace. IJCRB. 2011 Jul:693. Exclusion Criteria Reviewer’s Justification -Population of interest -Interventions of interest No intervention tested -Comparisons of interest -Outcomes of interest RefID 2501 PMID 19456006 Citation/Reference Tvaryanas AP, MacPherson GD. Fatigue in pilots of remotely piloted aircraft before and
after shift work adjustment. Aviat Space Environ Med. 2009 May;80(5):454-61. PubMed PMID: 19456006
Exclusion Criteria Reviewer’s Justification -Population of interest -Interventions of interest -Comparisons of interest No test of biomathematical modelling intervention in operational environment. -Outcomes of interest RefID 2528 PMID 26387894 Citation/Reference van den Berg MJ, Signal TL, Mulrine HM, Smith AA, Gander PH, Serfontein W. Monitoring
and Managing Cabin Crew Sleep and Fatigue During an Ultra-Long Range Trip. Aerosp Med Hum Perform. 2015 Aug;86(8):705-13. doi: 10.3357/AMHP.4268.2015. PubMed PMID: 26387894
Exclusion Criteria Reviewer’s Justification -Population of interest -Interventions of interest No intervention tested -Comparisons of interest -Outcomes of interest

16
RefID 2532 PMID 15018263 Citation/Reference Van Dongen HPA. Comparison of mathematical model predictions to experimental data of
fatigue and performance. Aviat Space Environ Med. 2004 Mar;75(3 Suppl):A15-36. PubMed PMID: 15018263
Exclusion Criteria Reviewer’s Justification -Population of interest -Interventions of interest No intervention tested -Comparisons of interest -Outcomes of interest RefID 2533 PMID 20175396 Citation/Reference Van Dongen HP. Predicting sleep/wake behavior for model-based fatigue risk
management. Sleep. 2010 Feb;33(2):144-5. PubMed PMID: 20175396; PubMed Central PMCID: PMC2817900
Exclusion Criteria Reviewer’s Justification -Population of interest -Interventions of interest No intervention tested -Comparisons of interest -Outcomes of interest RefID 2604 PMID n/a Citation/Reference Walters B, French J, Barnes MJ. Modeling the effects of crew size and crew fatigue on the
control of tactical unmanned aerial vehicles (TUAVs). InSimulation Conference, 2000. Proceedings. Winter 2000 (Vol. 1, pp. 920-924). IEEE.
Exclusion Criteria Reviewer’s Justification -Population of interest -Interventions of interest No intervention tested -Comparisons of interest -Outcomes of interest
17
RefID 1149 PMID n/a Citation/Reference (French)
Hurdiel R, McCauley P, Van Dongen HPA, Pezé T, Theunynck D. Sommeil et prédiction mathématique de performances cognitives en situation réelle de course au large en solitaire. Science & Sports. 2013 Sep 30;28(4):207-10.
Exclusion Criteria Reviewer’s Justification -Population of interest -Interventions of interest No intervention tested. -Comparisons of interest -Outcomes of interest RefID n/a PMID 24404236 Citation/Reference McCormick F, Kadzielski J, Evans BT, Landrigan CP, Herndon J, Rubash H. Fatigue
optimization scheduling in graduate medical education: reducing fatigue and improving patient safety. J Grad Med Educ. 2013 Mar;5(1):107-11. doi: 10.4300/JGME-D-12-00021.1. PubMed PMID: 24404236; PubMed Central PMCID: PMC3613293
Exclusion Criteria Reviewer’s Justification -Population of interest -Interventions of interest No intervention tested -Comparisons of interest -Outcomes of interest

1
Online Supplement Appendix D: Risk of bias table Moore-Ede, 2004 RefID-1691 PMID-15018271 Domain Support for judgment Review authors’ judgment Selection bias. Random sequence generation.
Describe the method used to generate the allocation sequence in sufficient detail to allow an assessment of whether it should produce comparable groups.
No description of randomization is provided. Intervention and control data were drawn from the same population (trucking operations). Control data were derived from operational data collected prior to the start of the intervention.
Allocation concealment.
Describe the method used to conceal the allocation sequence in sufficient detail to determine whether intervention allocations could have been foreseen in advance of, or during, enrolment.
No method to conceal allocation sequence is described. Intervention data were derived from operations occurring within intervention year (April 2001 – March 2002). Control data were drawn from operations occurring within a period that preceded intervention (April 1998 – March 2001).
Performance bias. Blinding of participants and personnel Assessments should be made for each main outcome (or class of outcomes).
Describe all measures used, if any, to blind study participants and personnel from knowledge of which intervention a participant received. Provide any information relating to whether the intended blinding was effective.
Intervention is provided (to drivers’ fatigue risk from their schedules) via dispatchers. No effort to blind dispatchers to intervention is described. No effort to blind drivers to intervention condition is described.
Detection bias. Blinding of outcome assessment Assessments should be made for each main outcome (or class of outcomes).
Describe all measures used, if any, to blind outcome assessors from knowledge of which intervention a participant received. Provide any information relating to whether the intended blinding was effective.
No efforts to blind outcome assessors from knowledge of condition are described. Assessors were part of the intervention (i.e. provided coaching to dispatchers who implemented the intervention) and were aware of the experimental conditions.
Attrition bias. Incomplete outcome data Assessments should be made for each main outcome (or class of outcomes).
Describe the completeness of outcome data for each main outcome, including attrition and exclusions from the analysis. State whether attrition and exclusions were reported, the numbers in each intervention group (compared with total randomized participants), reasons for attrition/exclusions where reported, and any re-inclusions in analyses performed by the review authors.
Outcome measures of interest were: accident rate/million miles, cost per accident, annual cost for severity accidents. No data are provided on attrition or exclusions. Overall size of intervention group is not reported.
Reporting bias. Selective reporting. State how the possibility of selective outcome
reporting was examined by the review authors, and what was found.
Selective outcome reporting bias is not addressed by the authors.
Other bias. Other sources of bias.
State any important concerns about bias not addressed in the other domains in the tool. If particular questions/entries were pre-specified in the review’s protocol, responses should be provided for each question/entry.
A number of safety/effectiveness-related outcomes would exist in operations. Justification for the specific outcomes selected is not provided. Commercial interests of investigators/authors
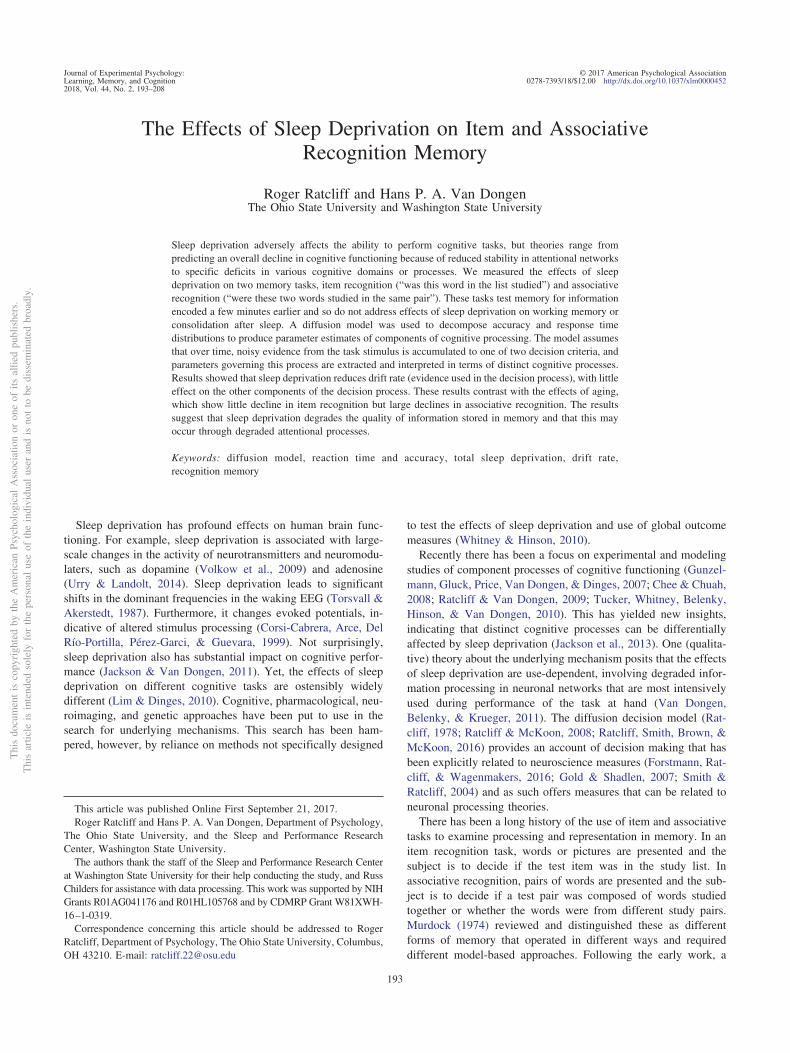
The Effects of Sleep Deprivation on Item and AssociativeRecognition Memory
Roger Ratcliff and Hans P. A. Van DongenThe Ohio State University and Washington State University
Sleep deprivation adversely affects the ability to perform cognitive tasks, but theories range frompredicting an overall decline in cognitive functioning because of reduced stability in attentional networksto specific deficits in various cognitive domains or processes. We measured the effects of sleepdeprivation on two memory tasks, item recognition (“was this word in the list studied”) and associativerecognition (“were these two words studied in the same pair”). These tasks test memory for informationencoded a few minutes earlier and so do not address effects of sleep deprivation on working memory orconsolidation after sleep. A diffusion model was used to decompose accuracy and response timedistributions to produce parameter estimates of components of cognitive processing. The model assumesthat over time, noisy evidence from the task stimulus is accumulated to one of two decision criteria, andparameters governing this process are extracted and interpreted in terms of distinct cognitive processes.Results showed that sleep deprivation reduces drift rate (evidence used in the decision process), with littleeffect on the other components of the decision process. These results contrast with the effects of aging,which show little decline in item recognition but large declines in associative recognition. The resultssuggest that sleep deprivation degrades the quality of information stored in memory and that this mayoccur through degraded attentional processes.
Keywords: diffusion model, reaction time and accuracy, total sleep deprivation, drift rate,recognition memory
Sleep deprivation has profound effects on human brain func-tioning. For example, sleep deprivation is associated with large-scale changes in the activity of neurotransmitters and neuromodu-laters, such as dopamine (Volkow et al., 2009) and adenosine(Urry & Landolt, 2014). Sleep deprivation leads to significantshifts in the dominant frequencies in the waking EEG (Torsvall &Akerstedt, 1987). Furthermore, it changes evoked potentials, in-dicative of altered stimulus processing (Corsi-Cabrera, Arce, DelRío-Portilla, Pérez-Garci, & Guevara, 1999). Not surprisingly,sleep deprivation also has substantial impact on cognitive perfor-mance (Jackson & Van Dongen, 2011). Yet, the effects of sleepdeprivation on different cognitive tasks are ostensibly widelydifferent (Lim & Dinges, 2010). Cognitive, pharmacological, neu-roimaging, and genetic approaches have been put to use in thesearch for underlying mechanisms. This search has been ham-pered, however, by reliance on methods not specifically designed
to test the effects of sleep deprivation and use of global outcomemeasures (Whitney & Hinson, 2010).
Recently there has been a focus on experimental and modelingstudies of component processes of cognitive functioning (Gunzel-mann, Gluck, Price, Van Dongen, & Dinges, 2007; Chee & Chuah,2008; Ratcliff & Van Dongen, 2009; Tucker, Whitney, Belenky,Hinson, & Van Dongen, 2010). This has yielded new insights,indicating that distinct cognitive processes can be differentiallyaffected by sleep deprivation (Jackson et al., 2013). One (qualita-tive) theory about the underlying mechanism posits that the effectsof sleep deprivation are use-dependent, involving degraded infor-mation processing in neuronal networks that are most intensivelyused during performance of the task at hand (Van Dongen,Belenky, & Krueger, 2011). The diffusion decision model (Rat-cliff, 1978; Ratcliff & McKoon, 2008; Ratcliff, Smith, Brown, &McKoon, 2016) provides an account of decision making that hasbeen explicitly related to neuroscience measures (Forstmann, Rat-cliff, & Wagenmakers, 2016; Gold & Shadlen, 2007; Smith &Ratcliff, 2004) and as such offers measures that can be related toneuronal processing theories.
There has been a long history of the use of item and associativetasks to examine processing and representation in memory. In anitem recognition task, words or pictures are presented and thesubject is to decide if the test item was in the study list. Inassociative recognition, pairs of words are presented and the sub-ject is to decide if a test pair was composed of words studiedtogether or whether the words were from different study pairs.Murdock (1974) reviewed and distinguished these as differentforms of memory that operated in different ways and requireddifferent model-based approaches. Following the early work, a
This article was published Online First September 21, 2017.Roger Ratcliff and Hans P. A. Van Dongen, Department of Psychology,
The Ohio State University, and the Sleep and Performance ResearchCenter, Washington State University.
The authors thank the staff of the Sleep and Performance Research Centerat Washington State University for their help conducting the study, and RussChilders for assistance with data processing. This work was supported by NIHGrants R01AG041176 and R01HL105768 and by CDMRP Grant W81XWH-16–1-0319.
Correspondence concerning this article should be addressed to RogerRatcliff, Department of Psychology, The Ohio State University, Columbus,OH 43210. E-mail: [email protected]
Thi
sdo
cum
ent
isco
pyri
ghte
dby
the
Am
eric
anPs
ycho
logi
cal
Ass
ocia
tion
oron
eof
itsal
lied
publ
ishe
rs.
Thi
sar
ticle
isin
tend
edso
lely
for
the
pers
onal
use
ofth
ein
divi
dual
user
and
isno
tto
bedi
ssem
inat
edbr
oadl
y.
Journal of Experimental Psychology:Learning, Memory, and Cognition
© 2017 American Psychological Association
2018, Vol. 44, No. 2, 193–2080278-7393/18/$12.00 http://dx.doi.org/10.1037/xlm0000452
193

number of studies have provided evidence for this distinction(Clark & Shiffrin, 1992; Hockley, 1991, 1994; Hockley & Cristi,1996; Humphreys, 1976, 1978; Malmberg & Xu, 2007). Theoriesthat attempted to deal with item and associative recognition andrecall have produced integrated models that have common repre-sentations for all the kinds of information but different retrievalmechanisms (Gillund & Shiffrin, 1984; Murdock, 1982; Shiffrin &Steyvers, 1997). More recently, in research in aging, a sharpdistinction has been drawn between item and associative recogni-tion. The general finding is that associative recognition declineswith age but item recognition is largely spared (Balota, Dolan, &Duchek, 2000; Craik, 1983, 1986, 1994; Gordon & Clark, 1974;Naveh-Benjamin, 2000; for further discussion see Ratcliff, Thapar,& McKoon, 2011; McKoon & Ratcliff, 2012). The generality ofthe associative recognition decline relative to item recognition wassupported by Old and Naveh-Benjamin (2008) in a meta-analysisof data from 90 studies.
There is an extensive body of literature on sleep deprivation andmemory, but most of the research has focused on the role of sleepin memory consolidation after the memories have been acquired.Yet, obtaining sufficient sleep beforehand may also be important,in order to be able to encode memories effectively (Walker &Stickgold, 2006), retain them reliably during task performance(Habeck et al., 2005), and recall them accurately when probed(e.g., Tantawy, Tallawy, Farghaly, Farghaly, & Hussein, 2013;Mograss, Guillem, Brazzini-Poisson, & Godbout, 2009). Viceversa, acute sleep deprivation appears to degrade some or all ofthese aspects of memory task performance (e.g., Nilsson, Bäck-man, & Karlsson, 1989). The underlying mechanisms, however,have not been fully elucidated. At the neuronal level, it remainsunknown whether the effects of sleep deprivation are global andnonspecific, or local and specific (Chee & Van Dongen, 2013).Insight into this issue may be gained by considering item recog-nition and associative recognition tasks, which have clearly de-fined shared and distinct features and may or may not be affectedby sleep deprivation differentially.
If forming associations is more difficult or associations in mem-ory are more fragile (i.e., more easily disrupted), then associativerecognition should show more decline during sleep deprivationthan item recognition. To date there have been few studies of itemor associative recognition memory and sleep deprivation, and nohead to head comparison has been made. For item recognition,Harrison and Horne (2000) presented two lists of 12 pictures (at10 s per picture) and followed this with a test list of 48 pictures,half old and half new. Subjects were asked whether they had seeneach test picture before (recognition). If so, they were then askedto specify whether it was included in List A or List B (i.e., listdiscrimination or in their terms, temporal memory). There was nosignificant effect of sleep deprivation on recognition (though d=fell from about 2.8 to 2.3) but there was a decline in list discrim-ination performance. This pattern suggests that item recognitionmay not decline with sleep deprivation, but tasks that requirebinding (item to list context as in Harrison and Horne or item toitem as in associative recognition) may decline. Other studiesusing a few lists of pictures have found declines in recognitionmemory (Mograss, Guillem, Brazzini-Poisson, & Godbout, 2009;Williams, Gieseking, & Lubin, 1966). But there have not beenstudies like those in the list-learning memory area with multiple
lists and comparisons other than the Harrison and Horne (2000)study that compare different forms of memory.
Diffusion Model
The diffusion model is designed to explain the cognitive pro-cesses involved in making simple two-choice decisions. The modelseparates the quality of evidence entering a decision from thedecision criteria and from nondecision processes. This allows adirect comparison across tasks and across subject groups in com-ponents such as the quality of evidence used in the decisionprocess and how much evidence is needed for a decision. Themodel can be seen as decomposing accuracy and reaction time(RT) data for correct and error responses into distinct cognitiveprocesses. The model has provided successful explanations ofperformance in many paradigms in cognitive psychology anddifferent subject populations. For example, it has been used toexamine processing in children (Ratcliff, Love, Thompson, &Opfer, 2012), sleep-deprived individuals (Ratcliff & Van Dongen,2009), aphasic individuals (Ratcliff, Perea, Colangelo, & Bu-chanan, 2004), hypoglycemic individuals (Geddes et al., 2010),individuals with depression (White, Ratcliff, Vasey, & McKoon,2010), and individual differences (Pe, Vandekerckhove, & Kup-pens, 2013; Ratcliff, Thapar, & McKoon, 2010; Schmiedek et al.,2007). It has also been used to examine decision processes inneurophysiology (Forstmann et al., 2016), including single-cellrecordings (Hanes & Schall, 1996; Ratcliff, Cherian, & Segraves,2003), EEG (Philiastides, Ratcliff, & Sajda, 2006), MEG (Wen-zlaff, Bauer, Maess, & Heekeren, 2011), and fMRI (Heekeren,Marrett, & Ungerleider, 2008).
In the decision process of the diffusion model, informationabout a stimulus is accumulated over time from a starting point ztoward one of two response criteria, or boundaries, a and 0 (seeFigure 1). A response is executed when the amount of accumulatedevidence reaches one of the boundaries. The rate at which infor-mation is accumulated is labeled “drift rate” (v) and it is deter-mined by the quality of the information available from the matchbetween a test probe and memory. Within-trial variability (noise)in the accumulation of information from the starting point to theboundaries results in processes with the same mean drift rateterminating at different times (producing RT distributions) andsometimes terminating at the wrong boundary (producing errors).
The total RT for a stimulus is the time taken by this decisionprocess plus other, nondecision, processes (e.g., test probe encod-ing and accessing memory with it, and response execution). Non-decision processes are combined into one distribution in the model,the time taken by them (mean value Ter). Drift rates, boundaries,and nondecision times are the three main components of the modelused in understanding differences between tasks, among subjectpopulations, from experimental manipulations such as sleep depri-vation, and due to individual differences.
The values of the components of processing are assumed to varyfrom trial to trial, under the assumption that subjects cannotaccurately set the same parameter values from one trial to another(e.g., Laming, 1968; Ratcliff, 1978). Across-trial variability in driftrate is normally distributed with SD �, across-trial variability instarting point is uniformly distributed with range sz, and across-trial variability in the nondecision component is uniformly distrib-uted with range st. This across-trial variability allows the model to
Thi
sdo
cum
ent
isco
pyri
ghte
dby
the
Am
eric
anPs
ycho
logi
cal
Ass
ocia
tion
oron
eof
itsal
lied
publ
ishe
rs.
Thi
sar
ticle
isin
tend
edso
lely
for
the
pers
onal
use
ofth
ein
divi
dual
user
and
isno
tto
bedi
ssem
inat
edbr
oadl
y.
194 RATCLIFF AND VAN DONGEN
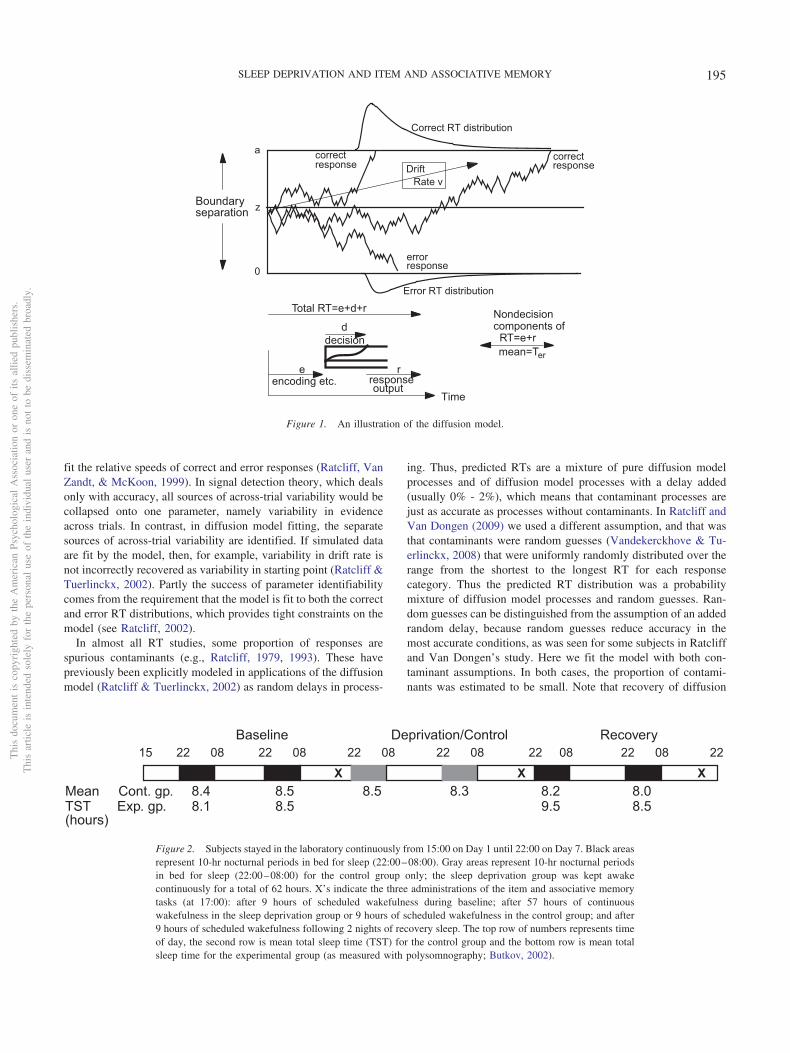
fit the relative speeds of correct and error responses (Ratcliff, VanZandt, & McKoon, 1999). In signal detection theory, which dealsonly with accuracy, all sources of across-trial variability would becollapsed onto one parameter, namely variability in evidenceacross trials. In contrast, in diffusion model fitting, the separatesources of across-trial variability are identified. If simulated dataare fit by the model, then, for example, variability in drift rate isnot incorrectly recovered as variability in starting point (Ratcliff &Tuerlinckx, 2002). Partly the success of parameter identifiabilitycomes from the requirement that the model is fit to both the correctand error RT distributions, which provides tight constraints on themodel (see Ratcliff, 2002).
In almost all RT studies, some proportion of responses arespurious contaminants (e.g., Ratcliff, 1979, 1993). These havepreviously been explicitly modeled in applications of the diffusionmodel (Ratcliff & Tuerlinckx, 2002) as random delays in process-
ing. Thus, predicted RTs are a mixture of pure diffusion modelprocesses and of diffusion model processes with a delay added(usually 0% - 2%), which means that contaminant processes arejust as accurate as processes without contaminants. In Ratcliff andVan Dongen (2009) we used a different assumption, and that wasthat contaminants were random guesses (Vandekerckhove & Tu-erlinckx, 2008) that were uniformly randomly distributed over therange from the shortest to the longest RT for each responsecategory. Thus the predicted RT distribution was a probabilitymixture of diffusion model processes and random guesses. Ran-dom guesses can be distinguished from the assumption of an addedrandom delay, because random guesses reduce accuracy in themost accurate conditions, as was seen for some subjects in Ratcliffand Van Dongen’s study. Here we fit the model with both con-taminant assumptions. In both cases, the proportion of contami-nants was estimated to be small. Note that recovery of diffusion
15 22 08 22 08 22 08 22 08 22 08 22 08 22
XXXMean Cont. gp. 8.4 8.5 8.5 8.3 8.2 8.0TST Exp. gp. 8.1 8.5 9.5 8.5
Baseline Deprivation/Control Recovery
(hours)
Figure 2. Subjects stayed in the laboratory continuously from 15:00 on Day 1 until 22:00 on Day 7. Black areasrepresent 10-hr nocturnal periods in bed for sleep (22:00–08:00). Gray areas represent 10-hr nocturnal periodsin bed for sleep (22:00–08:00) for the control group only; the sleep deprivation group was kept awakecontinuously for a total of 62 hours. X’s indicate the three administrations of the item and associative memorytasks (at 17:00): after 9 hours of scheduled wakefulness during baseline; after 57 hours of continuouswakefulness in the sleep deprivation group or 9 hours of scheduled wakefulness in the control group; and after9 hours of scheduled wakefulness following 2 nights of recovery sleep. The top row of numbers represents timeof day, the second row is mean total sleep time (TST) for the control group and the bottom row is mean totalsleep time for the experimental group (as measured with polysomnography; Butkov, 2002).
0
z
a correct correct
error
Correct RT distribution
Error RT distribution
DriftRate v
response
responseresponse
Boundaryseparation
Time
Total RT=e+d+r
e
d
mean=Ter
r
decision
encoding etc. responseoutput
Nondecisioncomponents of RT=e+r
Figure 1. An illustration of the diffusion model.
Thi
sdo
cum
ent
isco
pyri
ghte
dby
the
Am
eric
anPs
ycho
logi
cal
Ass
ocia
tion
oron
eof
itsal
lied
publ
ishe
rs.
Thi
sar
ticle
isin
tend
edso
lely
for
the
pers
onal
use
ofth
ein
divi
dual
user
and
isno
tto
bedi
ssem
inat
edbr
oadl
y.
195SLEEP DEPRIVATION AND ITEM AND ASSOCIATIVE MEMORY
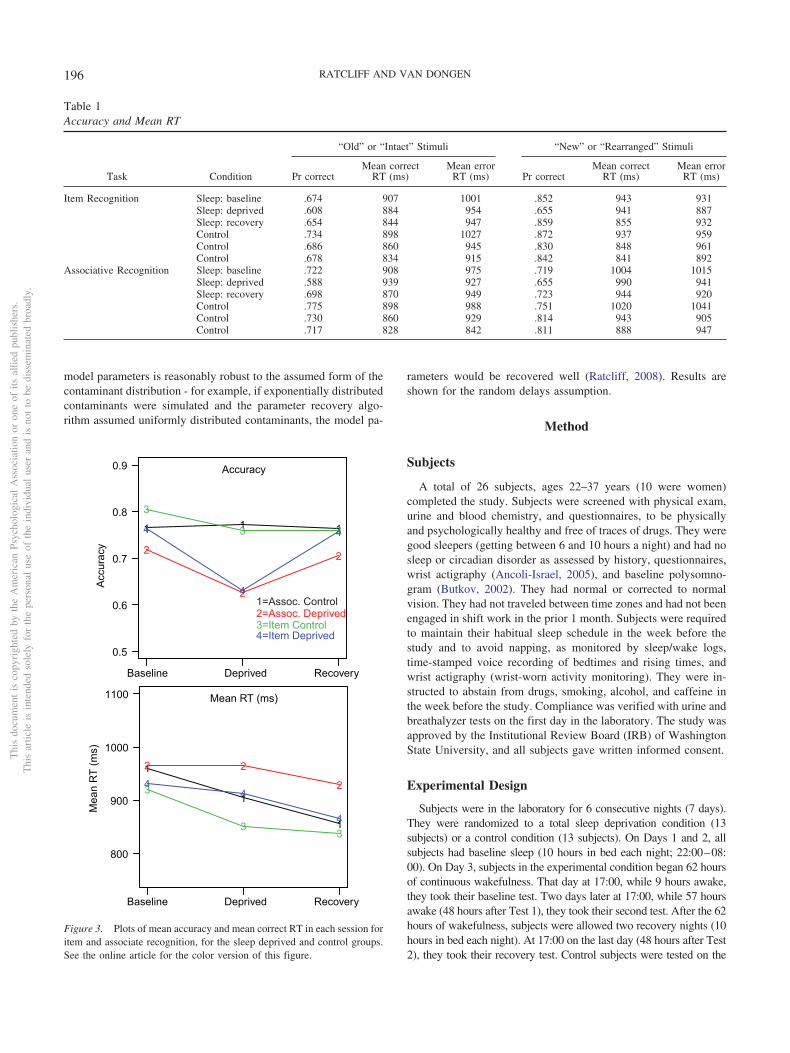
model parameters is reasonably robust to the assumed form of thecontaminant distribution - for example, if exponentially distributedcontaminants were simulated and the parameter recovery algo-rithm assumed uniformly distributed contaminants, the model pa-
rameters would be recovered well (Ratcliff, 2008). Results areshown for the random delays assumption.
Method
Subjects
A total of 26 subjects, ages 22–37 years (10 were women)completed the study. Subjects were screened with physical exam,urine and blood chemistry, and questionnaires, to be physicallyand psychologically healthy and free of traces of drugs. They weregood sleepers (getting between 6 and 10 hours a night) and had nosleep or circadian disorder as assessed by history, questionnaires,wrist actigraphy (Ancoli-Israel, 2005), and baseline polysomno-gram (Butkov, 2002). They had normal or corrected to normalvision. They had not traveled between time zones and had not beenengaged in shift work in the prior 1 month. Subjects were requiredto maintain their habitual sleep schedule in the week before thestudy and to avoid napping, as monitored by sleep/wake logs,time-stamped voice recording of bedtimes and rising times, andwrist actigraphy (wrist-worn activity monitoring). They were in-structed to abstain from drugs, smoking, alcohol, and caffeine inthe week before the study. Compliance was verified with urine andbreathalyzer tests on the first day in the laboratory. The study wasapproved by the Institutional Review Board (IRB) of WashingtonState University, and all subjects gave written informed consent.
Experimental Design
Subjects were in the laboratory for 6 consecutive nights (7 days).They were randomized to a total sleep deprivation condition (13subjects) or a control condition (13 subjects). On Days 1 and 2, allsubjects had baseline sleep (10 hours in bed each night; 22:00–08:00). On Day 3, subjects in the experimental condition began 62 hoursof continuous wakefulness. That day at 17:00, while 9 hours awake,they took their baseline test. Two days later at 17:00, while 57 hoursawake (48 hours after Test 1), they took their second test. After the 62hours of wakefulness, subjects were allowed two recovery nights (10hours in bed each night). At 17:00 on the last day (48 hours after Test2), they took their recovery test. Control subjects were tested on the
Table 1Accuracy and Mean RT
Task Condition
“Old” or “Intact” Stimuli “New” or “Rearranged” Stimuli
Pr correctMean correct
RT (ms)Mean error
RT (ms) Pr correctMean correct
RT (ms)Mean error
RT (ms)
Item Recognition Sleep: baseline .674 907 1001 .852 943 931Sleep: deprived .608 884 954 .655 941 887Sleep: recovery .654 844 947 .859 855 932Control .734 898 1027 .872 937 959Control .686 860 945 .830 848 961Control .678 834 915 .842 841 892
Associative Recognition Sleep: baseline .722 908 975 .719 1004 1015Sleep: deprived .588 939 927 .655 990 941Sleep: recovery .698 870 949 .723 944 920Control .775 898 988 .751 1020 1041Control .730 860 929 .814 943 905Control .717 828 842 .811 888 947
1 1 1
0.5
0.6
0.7
0.8
0.9
2
2
2
3
3 34
4
4
1
1
1
800
900
1000
1100
2 2
23
33
44
4
Baseline Deprived Recovery
Acc
urac
yM
ean
RT
(ms)
1=Assoc. Control2=Assoc. Deprived3=Item Control4=Item Deprived
Mean RT (ms)
Accuracy
Baseline Deprived Recovery
Figure 3. Plots of mean accuracy and mean correct RT in each session foritem and associate recognition, for the sleep deprived and control groups.See the online article for the color version of this figure.
Thi
sdo
cum
ent
isco
pyri
ghte
dby
the
Am
eric
anPs
ycho
logi
cal
Ass
ocia
tion
oron
eof
itsal
lied
publ
ishe
rs.
Thi
sar
ticle
isin
tend
edso
lely
for
the
pers
onal
use
ofth
ein
divi
dual
user
and
isno
tto
bedi
ssem
inat
edbr
oadl
y.
196 RATCLIFF AND VAN DONGEN

same days and at the same time of day, but they had sleep (10 hoursin bed; 22:00–08:00) each night throughout the study.
Subjects continually stayed inside the isolated, environmentallycontrolled laboratory during the study, and were behaviorally moni-tored at all times by trained research assistants. The laboratory wastemperature controlled (21°C) with fixed light levels (�100 lux)during scheduled wakefulness and lights off during scheduled sleepperiods. Each person had an isolated room for sleep and performancetesting. Meals were provided every 4 waking hours. Between testbouts and meals, subjects were permitted only nonvigorous activities.Subjects were monitored throughout the experiment, and no visitors,phone calls, live TV or radio, or Internet access were allowed. Besidesthe memory tasks, a number of other performance tests were admin-istered throughout the experiment (Whitney, Hinson, Jackson, & VanDongen, 2015). Figure 2 shows details of the design, including themean number of hours of sleep for the two groups as measured withpolysomnography (Butkov, 2002).
All sleep periods were recorded with digital polysomnography(Nihon Kohden, Foothill Ranch, CA), and total sleep times wereassessed per the criteria of the American Academy of Sleep Medicine(Iber, Ancoli-Israel, Chesson, & Quan, 2007). The data in Figure 2show that all subjects were well-rested after the two baseline nights,and the sleep deprivation group shows the expected increase in sleepduration in the first recovery night (night 5) following the 62-hr sleepdeprivation period. Subjects were kept awake with nonvigorous ac-tivities and social interaction. This method has been used many timesin previous studies; for a demonstration that the sleep deprivationintervention was successful, see Whitney et al. (2015).
Procedure
Cognitive performance was tested on an item and associativerecognition memory task. The design is within subjects for sessionsand memory tasks (and variables within tasks) and between subjectsfor the sleep deprivation and control groups. The task had 15 study-test blocks. For each block, the study list consisted of eight high-frequency and eight low-frequency word pairs, each displayed for 3 sin the upper left corner of an LCD monitor, followed by a 100-msblank screen and then the next pair. From a viewing distance of 57cm, the median edge-to-edge width of the word pairs was 6.0 degreesand the height was 0.5 degrees. The words were shown in clearlyvisible, light characters presented against a dark background. Half ofthe high-frequency pairs were presented once and half twice; likewise,half of the low-frequency pairs were presented once and half twice.
The pairs were presented in random order. Each study block wasimmediately followed by one of two types of test blocks: three-itemrecognition or 12 associative recognition blocks. No word was re-peated within a session, but the same pools were used from session tosession with completely different randomizations (so a new word initem recognition in one session could be a member of an intact pair inassociative recognition in the next session). The test type was cuedafter the study list so that subjects could not differentially encode thestimulus and the test type was randomized across lists.
Item recognition test blocks consisted of the 32 words from the 16word pairs plus 32 new words that had not appeared in the study pairs,presented in random order. Subjects were asked to press the ?/ key onthe keyboard if the test word had been in any of the immediatelypreceding study pairs, and the Z key if not. These keys were alsolabeled “Yes” and “No”, respectively. The test words remained on thescreen until a response was made. After each response there was a500-ms blank screen and then the next item was presented.
Associative recognition test blocks consisted of 16 pairs of words,all of which had appeared in a study pair: four intact low-frequencypairs, four intact high-frequency pairs, four rearranged low-frequencypairs, and four rearranged high-frequency pairs. Subjects were askedto press the ?/ (“Yes”) key if the two words of a test pair had occurredin the same pair in the study list and the Z (“No”) key if the words hadoccurred in different pairs. The words in the test pairs always occu-pied the same position as in the study list: If a word was the first ofa pair in the study list, it was the first of a test pair, whether the pairwas intact or rearranged. For each test pair, the first word wasdisplayed for 300 ms and then the second word was presented im-mediately below the first. This was done to reduce the variability inRTs that could occur if reading times included both words. Bothwords remained on the screen until a response was made.
Table 2Diffusion Model Parameters for Item Recognition
Condition a Ter(sec) � sz po st(sec) z v �2
Control 1 .161 .639 .224 .060 .003 .177 .070 .222 61.7Control 2 .151 .604 .282 .020 .003 .159 .073 .196 65.0Control 3 .138 .607 .219 .063 .003 .153 .070 .197 66.0Sleep 1 (baseline) .171 .615 .229 .077 .003 .173 .077 .195 69.9Sleep 2 (deprived) .151 .569 .175 .058 .007 .305 .071 .084 75.5Sleep 3 (recovery) .157 .594 .230 .072 .008 .188 .076 .228 51.0
Note. a � boundary separation; z � starting point; Ter � nondecision component of response time; � �standard deviation in drift across trials; sz � range of the distribution of starting point (z); st � range of thedistribution of nondecision times; po � proportion of contaminants; �2 � chi-square; v � the mean of absolutevalues of drift rates for studied items and new items from Table 3.
Table 3Drift Rates for Item Recognition
Condition vHF1 vLF1 vHF2 vLF2 vHFN vLFN
Control 1 .082 .154 .143 .292 �.260 �.402Control 2 .007 .146 .131 .346 �.199 �.349Control 3 .067 .175 .082 .345 �.180 �.333Sleep 1 (baseline) .087 .113 .140 .264 �.205 �.361Sleep 2 (deprived) .020 .063 .092 .116 �.070 �.142Sleep 3 (recovery) .073 .178 .145 .334 �.239 �.401
Note. HF � High Frequency; LF � Low Frequency; 1 � One Presen-tation; 2 � Two Presentations; N � New Item.
Thi
sdo
cum
ent
isco
pyri
ghte
dby
the
Am
eric
anPs
ycho
logi
cal
Ass
ocia
tion
oron
eof
itsal
lied
publ
ishe
rs.
Thi
sar
ticle
isin
tend
edso
lely
for
the
pers
onal
use
ofth
ein
divi
dual
user
and
isno
tto
bedi
ssem
inat
edbr
oadl
y.
197SLEEP DEPRIVATION AND ITEM AND ASSOCIATIVE MEMORY
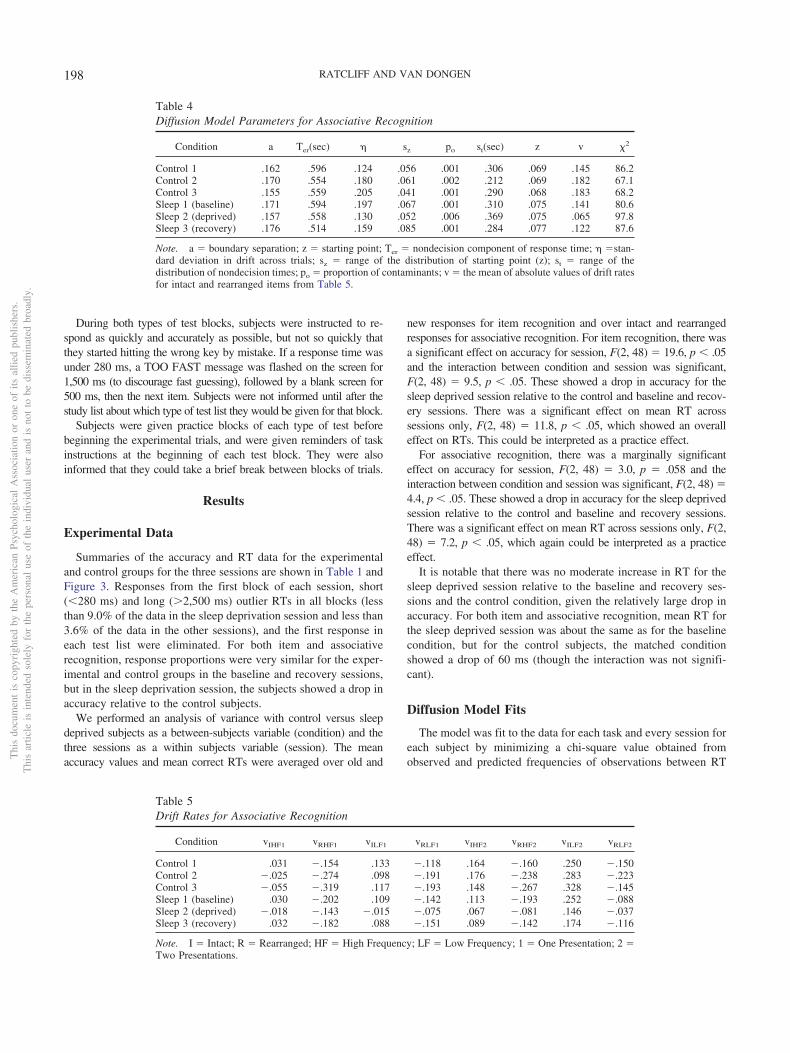
During both types of test blocks, subjects were instructed to re-spond as quickly and accurately as possible, but not so quickly thatthey started hitting the wrong key by mistake. If a response time wasunder 280 ms, a TOO FAST message was flashed on the screen for1,500 ms (to discourage fast guessing), followed by a blank screen for500 ms, then the next item. Subjects were not informed until after thestudy list about which type of test list they would be given for that block.
Subjects were given practice blocks of each type of test beforebeginning the experimental trials, and were given reminders of taskinstructions at the beginning of each test block. They were alsoinformed that they could take a brief break between blocks of trials.
Results
Experimental Data
Summaries of the accuracy and RT data for the experimentaland control groups for the three sessions are shown in Table 1 andFigure 3. Responses from the first block of each session, short(�280 ms) and long (�2,500 ms) outlier RTs in all blocks (lessthan 9.0% of the data in the sleep deprivation session and less than3.6% of the data in the other sessions), and the first response ineach test list were eliminated. For both item and associativerecognition, response proportions were very similar for the exper-imental and control groups in the baseline and recovery sessions,but in the sleep deprivation session, the subjects showed a drop inaccuracy relative to the control subjects.
We performed an analysis of variance with control versus sleepdeprived subjects as a between-subjects variable (condition) and thethree sessions as a within subjects variable (session). The meanaccuracy values and mean correct RTs were averaged over old and
new responses for item recognition and over intact and rearrangedresponses for associative recognition. For item recognition, there wasa significant effect on accuracy for session, F(2, 48) � 19.6, p � .05and the interaction between condition and session was significant,F(2, 48) � 9.5, p � .05. These showed a drop in accuracy for thesleep deprived session relative to the control and baseline and recov-ery sessions. There was a significant effect on mean RT acrosssessions only, F(2, 48) � 11.8, p � .05, which showed an overalleffect on RTs. This could be interpreted as a practice effect.
For associative recognition, there was a marginally significanteffect on accuracy for session, F(2, 48) � 3.0, p � .058 and theinteraction between condition and session was significant, F(2, 48) �4.4, p � .05. These showed a drop in accuracy for the sleep deprivedsession relative to the control and baseline and recovery sessions.There was a significant effect on mean RT across sessions only, F(2,48) � 7.2, p � .05, which again could be interpreted as a practiceeffect.
It is notable that there was no moderate increase in RT for thesleep deprived session relative to the baseline and recovery ses-sions and the control condition, given the relatively large drop inaccuracy. For both item and associative recognition, mean RT forthe sleep deprived session was about the same as for the baselinecondition, but for the control subjects, the matched conditionshowed a drop of 60 ms (though the interaction was not signifi-cant).
Diffusion Model Fits
The model was fit to the data for each task and every session foreach subject by minimizing a chi-square value obtained fromobserved and predicted frequencies of observations between RT
Table 4Diffusion Model Parameters for Associative Recognition
Condition a Ter(sec) � sz po st(sec) z v �2
Control 1 .162 .596 .124 .056 .001 .306 .069 .145 86.2Control 2 .170 .554 .180 .061 .002 .212 .069 .182 67.1Control 3 .155 .559 .205 .041 .001 .290 .068 .183 68.2Sleep 1 (baseline) .171 .594 .197 .067 .001 .310 .075 .141 80.6Sleep 2 (deprived) .157 .558 .130 .052 .006 .369 .075 .065 97.8Sleep 3 (recovery) .176 .514 .159 .085 .001 .284 .077 .122 87.6
Note. a � boundary separation; z � starting point; Ter � nondecision component of response time; � �stan-dard deviation in drift across trials; sz � range of the distribution of starting point (z); st � range of thedistribution of nondecision times; po � proportion of contaminants; v � the mean of absolute values of drift ratesfor intact and rearranged items from Table 5.
Table 5Drift Rates for Associative Recognition
Condition vIHF1 vRHF1 vILF1 vRLF1 vIHF2 vRHF2 vILF2 vRLF2
Control 1 .031 �.154 .133 �.118 .164 �.160 .250 �.150Control 2 �.025 �.274 .098 �.191 .176 �.238 .283 �.223Control 3 �.055 �.319 .117 �.193 .148 �.267 .328 �.145Sleep 1 (baseline) .030 �.202 .109 �.142 .113 �.193 .252 �.088Sleep 2 (deprived) �.018 �.143 �.015 �.075 .067 �.081 .146 �.037Sleep 3 (recovery) .032 �.182 .088 �.151 .089 �.142 .174 �.116
Note. I � Intact; R � Rearranged; HF � High Frequency; LF � Low Frequency; 1 � One Presentation; 2 �Two Presentations.
Thi
sdo
cum
ent
isco
pyri
ghte
dby
the
Am
eric
anPs
ycho
logi
cal
Ass
ocia
tion
oron
eof
itsal
lied
publ
ishe
rs.
Thi
sar
ticle
isin
tend
edso
lely
for
the
pers
onal
use
ofth
ein
divi
dual
user
and
isno
tto
bedi
ssem
inat
edbr
oadl
y.
198 RATCLIFF AND VAN DONGEN

quantiles, using a general simplex minimization routine (Nelder &Mead, 1965). In this procedure, the values of all the parameters,including the variability parameters, are estimated simultaneously,fitting the model to all the data from all the conditions of anexperiment. The minimization routine adjusts the parameters of themodel until it finds the parameter estimates that give the minimumchi-square value (see Ratcliff & Childers, 2015; Ratcliff & Tuer-linckx, 2002).
With the best-fitting parameter values, the model accounted wellfor the data, as shown by the chi-square values (averaged oversubjects) in Tables 2 and 4. These values are only a little higherthan the critical values, namely, 71.0 for item recognition (df � 53)and 93.9 for associative recognition (df � 73). Ratcliff, Thapar,Gomez, and McKoon (2004) discussed the quality of fits of the
0.0 0.2 0.4 0.6 0.8 1.00.0
0.2
0.4
0.6
0.8
1.0
0 500 1000 15000
500
1000
1500
0 500 1000 15000
500
1000
1500
0 500 15000
500
1000
1500
2000
0.2 0.4 0.6 0.8 1.0
0.2
0.4
0.6
0.8
1.0
0 400 800 12000
200400600800
10001200
0 500 1000 15000
500
1000
1500
0 1000 2000 30000
500
1000
1500
2000
2500
3000
Experimental Values
Theo
retic
al V
alue
s
Accuracy
0.1 Quantile RT
Accuracy
0.1 Quantile RT
0.5 Quantile RT0.5 Quantile RT
0.9 Quantile RT 0.9 Quantile RT
Item Recognition Associative Recognition
Figure 4. Plots of accuracy and the .1, .5 (median), and .9 RT quantilesfor correct responses (x-axis) and predicted values from fits of thediffusion model (y-axis) for item and associative recognition (for RTs,only values from conditions with greater than 15 responses are plot-ted).
2
214
2
3
33 3
Baseline Deprived Recovery
0.0
0.5
1.0
1.5
Drif
t Rat
e
2
41 1
4
2
Drift rate
14
3
0.06
0.08
0.10
0.12
0.14
0.16
0.182
431
1
42
2
Baseline Deprived Recovery
Bou
ndar
y S
epar
atio
n
1
Baseline Deprived Recovery
Non
deci
sion
Tim
e
Nondecision Time
33 3
0
100
200
300
400
500
600
700
44 41 1
2
Boundary Separation
1=Assoc. control2=Assoc.deprived3=Item control4=Item deprived
Figure 5. Plots of drift rate, boundary separation, and nondecision time asa function of session for item and associate recognition, for the sleepdeprived and control groups. See the online article for the color version ofthis figure.
Thi
sdo
cum
ent
isco
pyri
ghte
dby
the
Am
eric
anPs
ycho
logi
cal
Ass
ocia
tion
oron
eof
itsal
lied
publ
ishe
rs.
Thi
sar
ticle
isin
tend
edso
lely
for
the
pers
onal
use
ofth
ein
divi
dual
user
and
isno
tto
bedi
ssem
inat
edbr
oadl
y.
199SLEEP DEPRIVATION AND ITEM AND ASSOCIATIVE MEMORY
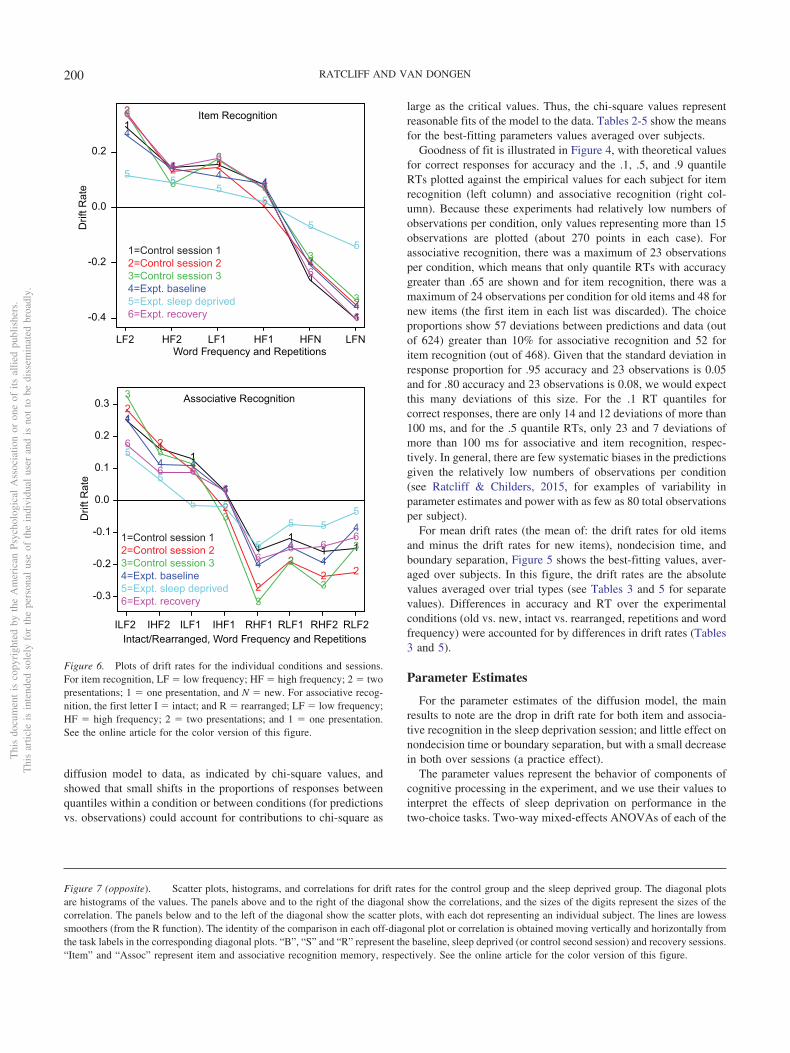
diffusion model to data, as indicated by chi-square values, andshowed that small shifts in the proportions of responses betweenquantiles within a condition or between conditions (for predictionsvs. observations) could account for contributions to chi-square as
large as the critical values. Thus, the chi-square values representreasonable fits of the model to the data. Tables 2-5 show the meansfor the best-fitting parameters values averaged over subjects.
Goodness of fit is illustrated in Figure 4, with theoretical valuesfor correct responses for accuracy and the .1, .5, and .9 quantileRTs plotted against the empirical values for each subject for itemrecognition (left column) and associative recognition (right col-umn). Because these experiments had relatively low numbers ofobservations per condition, only values representing more than 15observations are plotted (about 270 points in each case). Forassociative recognition, there was a maximum of 23 observationsper condition, which means that only quantile RTs with accuracygreater than .65 are shown and for item recognition, there was amaximum of 24 observations per condition for old items and 48 fornew items (the first item in each list was discarded). The choiceproportions show 57 deviations between predictions and data (outof 624) greater than 10% for associative recognition and 52 foritem recognition (out of 468). Given that the standard deviation inresponse proportion for .95 accuracy and 23 observations is 0.05and for .80 accuracy and 23 observations is 0.08, we would expectthis many deviations of this size. For the .1 RT quantiles forcorrect responses, there are only 14 and 12 deviations of more than100 ms, and for the .5 quantile RTs, only 23 and 7 deviations ofmore than 100 ms for associative and item recognition, respec-tively. In general, there are few systematic biases in the predictionsgiven the relatively low numbers of observations per condition(see Ratcliff & Childers, 2015, for examples of variability inparameter estimates and power with as few as 80 total observationsper subject).
For mean drift rates (the mean of: the drift rates for old itemsand minus the drift rates for new items), nondecision time, andboundary separation, Figure 5 shows the best-fitting values, aver-aged over subjects. In this figure, the drift rates are the absolutevalues averaged over trial types (see Tables 3 and 5 for separatevalues). Differences in accuracy and RT over the experimentalconditions (old vs. new, intact vs. rearranged, repetitions and wordfrequency) were accounted for by differences in drift rates (Tables3 and 5).
Parameter Estimates
For the parameter estimates of the diffusion model, the mainresults to note are the drop in drift rate for both item and associa-tive recognition in the sleep deprivation session; and little effect onnondecision time or boundary separation, but with a small decreasein both over sessions (a practice effect).
The parameter values represent the behavior of components ofcognitive processing in the experiment, and we use their values tointerpret the effects of sleep deprivation on performance in thetwo-choice tasks. Two-way mixed-effects ANOVAs of each of the
1
1 1
1
1
1
LF2 HF2 LF1 HF1 HFN LFN
-0.4
-0.2
0.0
0.2
2
2 2
2
2
2
3
3
3
3
3
3
4
44
4
4
4
5 55
5
5
5
6
66
6
6
6
Word Frequency and Repetitions
1=Control session 12=Control session 23=Control session 34=Expt. baseline5=Expt. sleep deprived6=Expt. recovery
Drif
t Rat
e
1
11
1
11
1 1
ILF2 IHF2 ILF1 IHF1 RHF1 RLF1 RHF2 RLF2
-0.3
-0.2
-0.1
0.0
0.1
0.2
0.3 2
2
2
2
2
22 2
3
33
3
3
3
3
3
4
4 4
4
4
44
4
5
5
5 5
5
5 55
6
6 6
6
66 6
61=Control session 12=Control session 23=Control session 34=Expt. baseline5=Expt. sleep deprived6=Expt. recovery
Intact/Rearranged, Word Frequency and Repetitions
Item Recognition
Associative Recognition
Drif
t Rat
e
Figure 6. Plots of drift rates for the individual conditions and sessions.For item recognition, LF � low frequency; HF � high frequency; 2 � twopresentations; 1 � one presentation, and N � new. For associative recog-nition, the first letter I � intact; and R � rearranged; LF � low frequency;HF � high frequency; 2 � two presentations; and 1 � one presentation.See the online article for the color version of this figure.
Figure 7 (opposite). Scatter plots, histograms, and correlations for drift rates for the control group and the sleep deprived group. The diagonal plotsare histograms of the values. The panels above and to the right of the diagonal show the correlations, and the sizes of the digits represent the sizes of thecorrelation. The panels below and to the left of the diagonal show the scatter plots, with each dot representing an individual subject. The lines are lowesssmoothers (from the R function). The identity of the comparison in each off-diagonal plot or correlation is obtained moving vertically and horizontally fromthe task labels in the corresponding diagonal plots. “B”, “S” and “R” represent the baseline, sleep deprived (or control second session) and recovery sessions.“Item” and “Assoc” represent item and associative recognition memory, respectively. See the online article for the color version of this figure.
Thi
sdo
cum
ent
isco
pyri
ghte
dby
the
Am
eric
anPs
ycho
logi
cal
Ass
ocia
tion
oron
eof
itsal
lied
publ
ishe
rs.
Thi
sar
ticle
isin
tend
edso
lely
for
the
pers
onal
use
ofth
ein
divi
dual
user
and
isno
tto
bedi
ssem
inat
edbr
oadl
y.
200 RATCLIFF AND VAN DONGEN
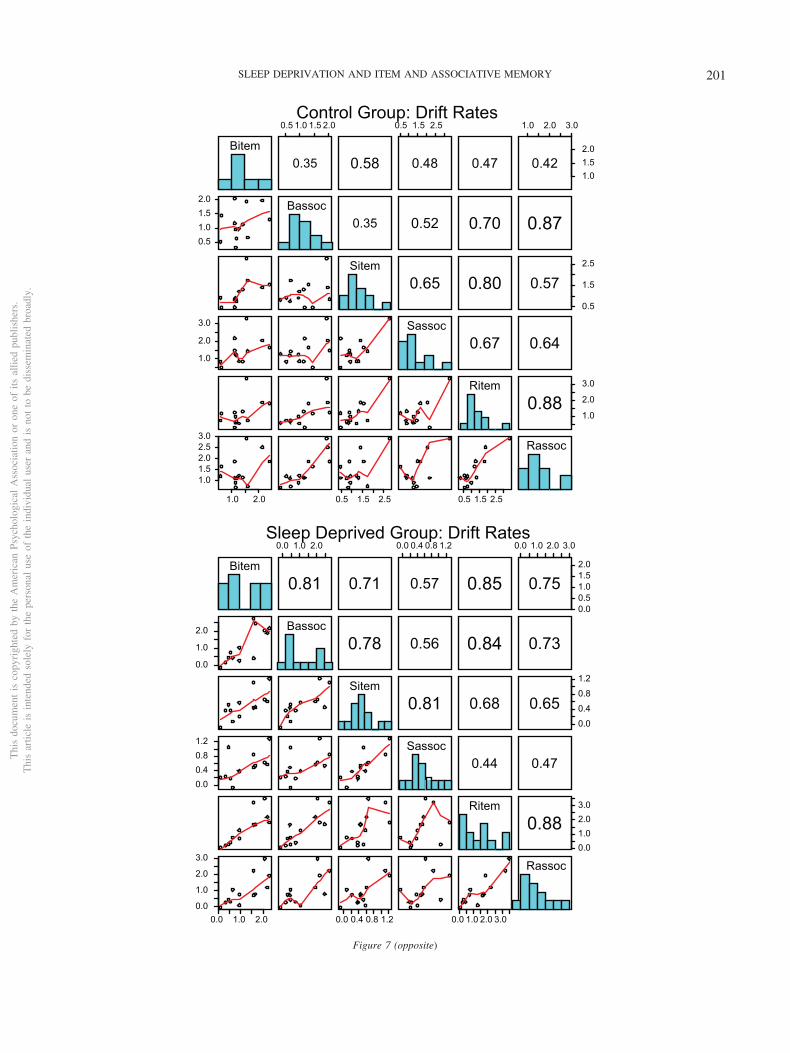
Bitem
0.5 1.0 1.5 2.0
0.35 0.58
0.5 1.5 2.5
0.48 0.47
1.0 2.0 3.0
1.01.52.0
0.42
0.51.01.52.0 Bassoc
0.35 0.52 0.70 0.87
Sitem0.65 0.80
0.5
1.5
2.5
0.57
1.0
2.0
3.0 Sassoc0.67 0.64
Ritem
1.0
2.0
3.0
0.88
1.0 2.0
1.01.52.02.53.0
0.5 1.5 2.5 0.5 1.5 2.5
Rassoc
Control Group: Drift Rates
Bitem
0.0 1.0 2.0
0.81 0.71
0.0 0.4 0.8 1.2
0.57 0.85
0.0 1.0 2.0 3.0
0.00.51.01.52.0
0.75
0.0
1.0
2.0 Bassoc0.78 0.56 0.84 0.73
Sitem0.81 0.68
0.0
0.4
0.8
1.2
0.65
0.00.40.81.2 Sassoc
0.44 0.47
Ritem
0.01.02.03.0
0.88
0.0 1.0 2.00.0
1.0
2.0
3.0
0.0 0.4 0.8 1.2 0.0 1.0 2.0 3.0
Rassoc
Sleep Deprived Group: Drift Rates
Figure 7 (opposite)
Thi
sdo
cum
ent
isco
pyri
ghte
dby
the
Am
eric
anPs
ycho
logi
cal
Ass
ocia
tion
oron
eof
itsal
lied
publ
ishe
rs.
Thi
sar
ticle
isin
tend
edso
lely
for
the
pers
onal
use
ofth
ein
divi
dual
user
and
isno
tto
bedi
ssem
inat
edbr
oadl
y.
201SLEEP DEPRIVATION AND ITEM AND ASSOCIATIVE MEMORY
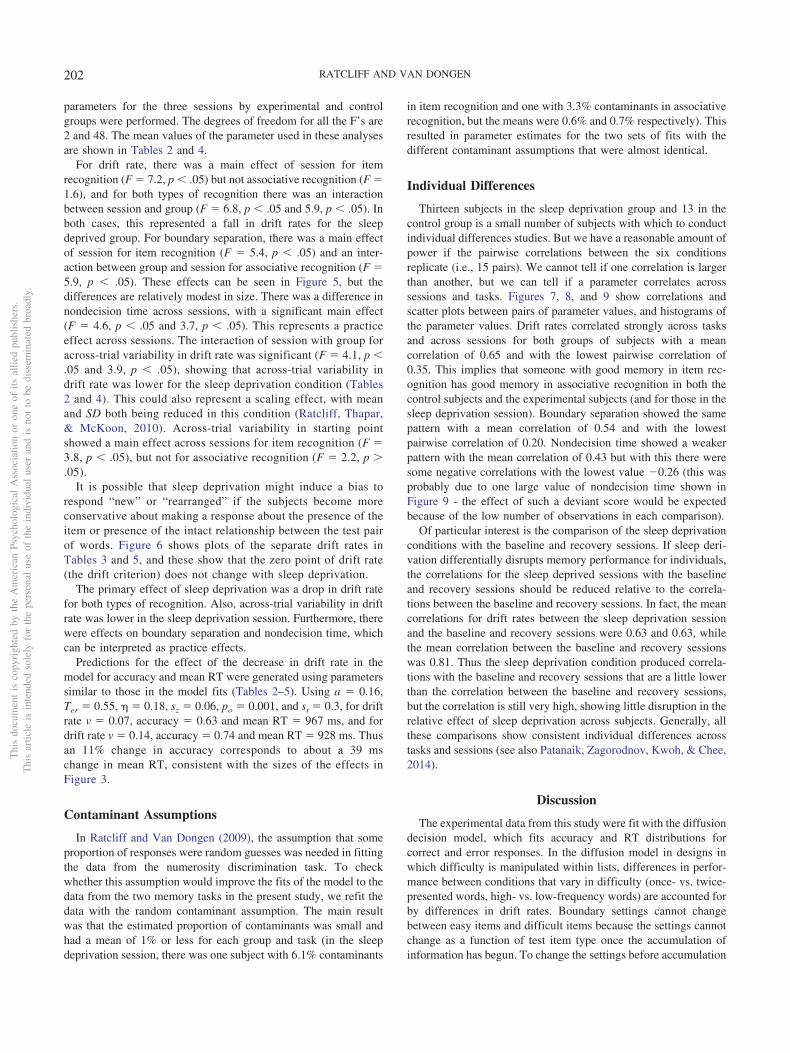
parameters for the three sessions by experimental and controlgroups were performed. The degrees of freedom for all the F’s are2 and 48. The mean values of the parameter used in these analysesare shown in Tables 2 and 4.
For drift rate, there was a main effect of session for itemrecognition (F � 7.2, p � .05) but not associative recognition (F �1.6), and for both types of recognition there was an interactionbetween session and group (F � 6.8, p � .05 and 5.9, p � .05). Inboth cases, this represented a fall in drift rates for the sleepdeprived group. For boundary separation, there was a main effectof session for item recognition (F � 5.4, p � .05) and an inter-action between group and session for associative recognition (F �5.9, p � .05). These effects can be seen in Figure 5, but thedifferences are relatively modest in size. There was a difference innondecision time across sessions, with a significant main effect(F � 4.6, p � .05 and 3.7, p � .05). This represents a practiceeffect across sessions. The interaction of session with group foracross-trial variability in drift rate was significant (F � 4.1, p �.05 and 3.9, p � .05), showing that across-trial variability indrift rate was lower for the sleep deprivation condition (Tables2 and 4). This could also represent a scaling effect, with meanand SD both being reduced in this condition (Ratcliff, Thapar,& McKoon, 2010). Across-trial variability in starting pointshowed a main effect across sessions for item recognition (F �3.8, p � .05), but not for associative recognition (F � 2.2, p �.05).
It is possible that sleep deprivation might induce a bias torespond “new” or “rearranged” if the subjects become moreconservative about making a response about the presence of theitem or presence of the intact relationship between the test pairof words. Figure 6 shows plots of the separate drift rates inTables 3 and 5, and these show that the zero point of drift rate(the drift criterion) does not change with sleep deprivation.
The primary effect of sleep deprivation was a drop in drift ratefor both types of recognition. Also, across-trial variability in driftrate was lower in the sleep deprivation session. Furthermore, therewere effects on boundary separation and nondecision time, whichcan be interpreted as practice effects.
Predictions for the effect of the decrease in drift rate in themodel for accuracy and mean RT were generated using parameterssimilar to those in the model fits (Tables 2–5). Using a � 0.16,Ter � 0.55, � � 0.18, sz � 0.06, po � 0.001, and st � 0.3, for driftrate v � 0.07, accuracy � 0.63 and mean RT � 967 ms, and fordrift rate v � 0.14, accuracy � 0.74 and mean RT � 928 ms. Thusan 11% change in accuracy corresponds to about a 39 mschange in mean RT, consistent with the sizes of the effects inFigure 3.
Contaminant Assumptions
In Ratcliff and Van Dongen (2009), the assumption that someproportion of responses were random guesses was needed in fittingthe data from the numerosity discrimination task. To checkwhether this assumption would improve the fits of the model to thedata from the two memory tasks in the present study, we refit thedata with the random contaminant assumption. The main resultwas that the estimated proportion of contaminants was small andhad a mean of 1% or less for each group and task (in the sleepdeprivation session, there was one subject with 6.1% contaminants
in item recognition and one with 3.3% contaminants in associativerecognition, but the means were 0.6% and 0.7% respectively). Thisresulted in parameter estimates for the two sets of fits with thedifferent contaminant assumptions that were almost identical.
Individual Differences
Thirteen subjects in the sleep deprivation group and 13 in thecontrol group is a small number of subjects with which to conductindividual differences studies. But we have a reasonable amount ofpower if the pairwise correlations between the six conditionsreplicate (i.e., 15 pairs). We cannot tell if one correlation is largerthan another, but we can tell if a parameter correlates acrosssessions and tasks. Figures 7, 8, and 9 show correlations andscatter plots between pairs of parameter values, and histograms ofthe parameter values. Drift rates correlated strongly across tasksand across sessions for both groups of subjects with a meancorrelation of 0.65 and with the lowest pairwise correlation of0.35. This implies that someone with good memory in item rec-ognition has good memory in associative recognition in both thecontrol subjects and the experimental subjects (and for those in thesleep deprivation session). Boundary separation showed the samepattern with a mean correlation of 0.54 and with the lowestpairwise correlation of 0.20. Nondecision time showed a weakerpattern with the mean correlation of 0.43 but with this there weresome negative correlations with the lowest value �0.26 (this wasprobably due to one large value of nondecision time shown inFigure 9 - the effect of such a deviant score would be expectedbecause of the low number of observations in each comparison).
Of particular interest is the comparison of the sleep deprivationconditions with the baseline and recovery sessions. If sleep deri-vation differentially disrupts memory performance for individuals,the correlations for the sleep deprived sessions with the baselineand recovery sessions should be reduced relative to the correla-tions between the baseline and recovery sessions. In fact, the meancorrelations for drift rates between the sleep deprivation sessionand the baseline and recovery sessions were 0.63 and 0.63, whilethe mean correlation between the baseline and recovery sessionswas 0.81. Thus the sleep deprivation condition produced correla-tions with the baseline and recovery sessions that are a little lowerthan the correlation between the baseline and recovery sessions,but the correlation is still very high, showing little disruption in therelative effect of sleep deprivation across subjects. Generally, allthese comparisons show consistent individual differences acrosstasks and sessions (see also Patanaik, Zagorodnov, Kwoh, & Chee,2014).
Discussion
The experimental data from this study were fit with the diffusiondecision model, which fits accuracy and RT distributions forcorrect and error responses. In the diffusion model in designs inwhich difficulty is manipulated within lists, differences in perfor-mance between conditions that vary in difficulty (once- vs. twice-presented words, high- vs. low-frequency words) are accounted forby differences in drift rates. Boundary settings cannot changebetween easy items and difficult items because the settings cannotchange as a function of test item type once the accumulation ofinformation has begun. To change the settings before accumulation
Thi
sdo
cum
ent
isco
pyri
ghte
dby
the
Am
eric
anPs
ycho
logi
cal
Ass
ocia
tion
oron
eof
itsal
lied
publ
ishe
rs.
Thi
sar
ticle
isin
tend
edso
lely
for
the
pers
onal
use
ofth
ein
divi
dual
user
and
isno
tto
bedi
ssem
inat
edbr
oadl
y.
202 RATCLIFF AND VAN DONGEN

Bitem
0.12 0.16 0.20
0.59 0.53
0.12 0.18
0.67 0.64
0.12 0.18 0.24
0.12
0.16
0.20
0.74
0.12
0.16
0.20Bassoc
0.45 0.41 0.35 0.38
Sitem0.39 0.79
0.10
0.15
0.20
0.25
0.77
0.12
0.16
0.20 Sassoc0.37 0.61
Ritem
0.10
0.14
0.18
0.81
0.12 0.16 0.200.12
0.16
0.20
0.24
0.10 0.20 0.080.120.16
Rassoc
Control Group: Boundary Separation
Bitem
0.14 0.18 0.22
0.55 0.46
0.14 0.20
0.63 0.83
0.14 0.18 0.22
0.10
0.14
0.18
0.22
0.56
0.14
0.18
0.22 Bassoc0.67 0.28 0.52 0.36
Sitem0.45 0.66
0.100.120.140.160.18
0.20
0.16
0.20
0.24 Sassoc0.75 0.24
Ritem
0.10
0.14
0.18
0.22
0.50
0.10 0.16 0.22
0.14
0.18
0.22
0.10 0.14 0.18 0.10 0.16 0.22
Rassoc
Sleep Deprived Group: Boundary Separation
Figure 8. Scatter plots, histograms, and correlations for boundary separation. Details are the same as for Figure7. See the online article for the color version of this figure.
Thi
sdo
cum
ent
isco
pyri
ghte
dby
the
Am
eric
anPs
ycho
logi
cal
Ass
ocia
tion
oron
eof
itsal
lied
publ
ishe
rs.
Thi
sar
ticle
isin
tend
edso
lely
for
the
pers
onal
use
ofth
ein
divi
dual
user
and
isno
tto
bedi
ssem
inat
edbr
oadl
y.
203SLEEP DEPRIVATION AND ITEM AND ASSOCIATIVE MEMORY

Bitem
0.45 0.60 0.75
0.37 0.30
0.450.550.65
0.46 0.52
0.40 0.55 0.70
0.60
0.70
0.80
0.35
0.500.600.70 Bassoc
0.81 0.68 0.40 0.74
Sitem0.69 0.62
0.55
0.60
0.65
0.70
0.84
0.45
0.55
0.65 Sassoc0.70 0.89
Ritem
0.50
0.60
0.70
0.61
0.6 0.7 0.80.400.500.600.70
0.6 0.7 0.5 0.6 0.7
Rassoc
Control Group: Nondecision Time
Bitem
0.55 0.65
0.38 0.69
0.3 0.5 0.7
0.63 0.27
0.5 0.6
0.50
0.60
0.70
-0.26
0.550.600.65 Bassoc
0.51 0.35 -0.19 -0.24
Sitem0.76 0.35
0.45
0.55
0.65
-0.08
0.2
0.4
0.6 Sassoc0.20 -0.28
Ritem
0.500.550.600.65
0.69
0.5 0.6 0.7
0.45
0.55
0.65
0.45 0.55 0.65 0.5 0.6
Rassoc
Sleep Deprived Group: Nondecision Time
Figure 9. Scatter plots, histograms, and correlations for nondecision time. Details are the same as for Figure7. See the online article for the color version of this figure.
Thi
sdo
cum
ent
isco
pyri
ghte
dby
the
Am
eric
anPs
ycho
logi
cal
Ass
ocia
tion
oron
eof
itsal
lied
publ
ishe
rs.
Thi
sar
ticle
isin
tend
edso
lely
for
the
pers
onal
use
ofth
ein
divi
dual
user
and
isno
tto
bedi
ssem
inat
edbr
oadl
y.
204 RATCLIFF AND VAN DONGEN

began would require knowing whether a test item was easy ordifficult, something that cannot be known until after informationhas been accumulated. As expected, differences in accuracy andRT between once- and twice-presented words and high- and low-frequency words were all explained by differences in drift rates.Note that all parameters of the model were allowed to varybetween sessions, because practice could alter any of the param-eters.
The diffusion model analysis indicates that the quality of storedinformation in memory that drives the decision process is reducedin the sleep deprivation condition relative to the control group andrelative to the baseline and recovery sessions. This implicatesreduced quality of encoding during study of the word lists, reducedmaintenance (retention) of stored information in memory, or re-duced ability to retrieve information from memory (or combina-tions of these) as the main processes affected by sleep deprivation.Because item and associative information require somewhat dif-ferent retrieval processes, a deficit in encoding or maintenance isthe more plausible.
There were mainly nonsignificant effects of sleep deprivation onboundary separation and nondecision time, and results were mostconsistent with practice effects on these components of processing(cf. Dutilh, Kryptos, & Wagenmakers, 2011; Dutilh, Vandekerck-hove, Tuerlinckx, & Wagenmakers, 2009; Petrov, Van Horn, &Ratcliff, 2011; Ratcliff, Thapar, & McKoon, 2006). The only othersystematic effect was a decrease in across-trial variability in driftrate for the sleep deprivation condition in both item and associativerecognition. These results suggest that other decision-making pro-cesses are not significantly affected by sleep deprivation in thesetasks.
Ratcliff and Van Dongen (2009) examined the effects of sleepdeprivation on performance in a numerosity discrimination taskusing a diffusion model analysis. They found a drop in drift ratesfor the sleep deprived condition along with an increase in thenumber of contaminants (though there were large individual dif-ferences), as well as smaller but significant changes in boundaryseparation and across-trial variability in both nondecision time andstarting point. The present study replicated the drop in drift rates,but the other effects were not obtained. This may be due to smallernumbers of observations - two tasks were presented per 45 min.session, while in Ratcliff and Van Dongen (2009) the one task tookthe whole session. The effect of sleep deprivation on drift rate hasalso been observed (Ratcliff & Van Dongen, 2011) on a psy-chomotor vigilance test (PVT), which is a simple RT task designedto measure sustained attention (Lim & Dinges, 2008). Havingfound this effect again in our present study of two types ofrecognition memory tasks, we may see a trend emerging, suggest-ing that reduced drift rate may be a universal feature of the impactof sleep deprivation on cognitive performance.
Recent studies have suggested that memory task performancedeficits during sleep deprivation are due to deficits in attentionalprocessing and memory maintenance, whereas memory encodingand retrieval seem to be relatively unaffected by sleep deprivation(Rakitin, Tucker, Basner, & Stern, 2012; Wee, Asplund, & Chee,2013). However, evidence to the contrary, namely that the encod-ing phase is affected by sleep deprivation, has also been reported(Tucker et al., 2011). The present study sheds some light on theseissues through a head-to-head comparison of item and associativerecognition memory (though the Tucker and Wee studies address
somewhat different working memory processing). We found thatthe effects of sleep deprivation on diffusion model parameterswere similar for the two types of recognition memory, suggestingshared mechanisms underlying the effects of sleep deprivation onthe two tasks. This was corroborated by consistency (correlation)of model parameter changes due to sleep deprivation for the twotasks. There is overlap between brain regions activated duringmemory task performance and brain regions associated with atten-tional processes, raising the possibility that performance deficits inmemory tasks are due to attentional deficits (Jackson & VanDongen, 2011). Indeed, our results are more consistent with anexplanation of performance impairment in terms of degraded at-tentional processes than in terms of item or associative memoryimpairment per se.
A recently proposed, qualitative theory posits that the effects ofsleep deprivation are use-dependent, involving degraded informa-tion processing in neuronal networks that are most intensively usedduring performance of a given task (Van Dongen, Belenky, &Krueger, 2011). In the context of this theory, our quantitativediffusion modeling results suggest that attentional processes arethe most intensively used processes in both recognition memorytasks. Sleep deprivation is well known to degrade task perfor-mance in tasks with a high attentional demand (Lim & Dinges,2008).
It is noteworthy in this regard that our present results differ fromthose found earlier in aging, which reduces drift rates in associa-tive recognition but not item recognition (Ratcliff, Thapar, &McKoon, 2011). In contrast with sleep deprivation, therefore, thebreakdown of associative memory in aging may not be related tononspecific impairment in attention, but rather to impairment ofspecific processes involved in associative memory. Using a batteryof neuropsychological tests, Harrison and colleagues compared agroup of young adults subjected to 36 hours of sleep deprivation toa group of healthy, alert, non-sleep-deprived people aged about 60years (Harrison, Horne, & Rothwell, 2000). They observed that 36hours of sleep deprivation in the young adult group producedeffects on prefrontal cortex-mediated performance similar to thosefound in the nonsleep deprived older group. Our findings and thoseof others (Tucker, Stern, Basner, & Rakitin, 2011) are inconsistentwith the idea that the effects of sleep deprivation on cognitiveperformance are comparable to those of aging.
References
Ancoli-Israel, S. (2005). Actigraphy. In M. H. Kryger, T. Roth, & W. C.Dement (Eds.), Principles and Practice of Sleep Medicine (4th ed., pp.1459–1467). Philadelphia, PA: Elsevier Saunders.
Balota, D. A., Dolan, P. O., & Duchek, J. M. (2000). Memory changes inhealthy young and older adults. In E. Tulving, & F. I. M. Craik (Eds.),Handbook of Memory, (pp. 395–410). New York, NY: Oxford Univer-sity Press.
Butkov, N. (2002). Polysomnography. In T. L. Lee-Chiong, M. J. Sateia, &M. A. Carskadon (Eds.), Sleep Medicine (pp. 605–637). Philadelphia:Hanley & Belfus.
Chee, M. W. L., & Chuah, L. Y. (2008). Functional neuroimaging insightsinto how sleep and sleep deprivation affect memory and cognition.Current Opinion in Neurology, 24, 417–423. http://dx.doi.org/10.1097/WCO.0b013e3283052cf7
Chee, M. W. L., & Van Dongen, H. P. A. (2013). Functional imaging ofinter-individual differences in response to sleep deprivation. In E. Nofz-inger, P. Maquet, & M. J. Thorpy (Eds.), Neuroimaging of Sleep and
Thi
sdo
cum
ent
isco
pyri
ghte
dby
the
Am
eric
anPs
ycho
logi
cal
Ass
ocia
tion
oron
eof
itsal
lied
publ
ishe
rs.
Thi
sar
ticle
isin
tend
edso
lely
for
the
pers
onal
use
ofth
ein
divi
dual
user
and
isno
tto
bedi
ssem
inat
edbr
oadl
y.
205SLEEP DEPRIVATION AND ITEM AND ASSOCIATIVE MEMORY
Sleep Disorders (pp. 154–162). Cambridge, England: Cambridge Univer-sity Press. http://dx.doi.org/10.1017/CBO9781139088268.021
Clark, S. E., & Shiffrin, R. M. (1992). Cuing effects and associativeinformation in recognition memory. Memory and Cognition, 20, 580–598.
Corsi-Cabrera, M., Arce, C., Del Río-Portilla, I. Y., Pérez-Garci, E., &Guevara, M. A. (1999). Amplitude reduction in visual event-relatedpotentials as a function of sleep deprivation. Sleep: Journal of SleepResearch and Sleep Medicine, 22, 181–189.
Craik, F. I. M. (1983). On the transfer of information from temporary topermanent memory. Philosophical Transactions of the Royal Society ofLondon B, 302, 341–359.
Craik, F. I. M. (1986). A functional account of age differences in memory.In F. Klix, & H. Hagendorf (Eds.), Human memory and cognitivecapabilities, mechanisms, and performances. Amsterdam, the Nether-lands: Elsevier.
Craik, F. I. M. (1994). Memory changes in normal aging. Current Direc-tions in Psychological Science, 3, 155–158.
Dutilh, G., Krypotos, A.-M., & Wagenmakers, E.-J. (2011). Task-related vs.stimulus-specific practice: A diffusion model account. Experimental Psy-chology, 58, 434–442. http://dx.doi.org/10.1027/1618-3169/a000111
Dutilh, G., Vandekerckhove, J., Tuerlinckx, F., & Wagenmakers, E.-J.(2009). A diffusion model decomposition of the practice effect. Psycho-nomic Bulletin & Review, 16, 1026–1036. http://dx.doi.org/10.3758/16.6.1026
Forstmann, B. U., Ratcliff, R., & Wagenmakers, E.-J. (2016). Sequentialsampling models in cognitive neuroscience: Advantages, applications,and extensions. Annual Review of Psychology, 67, 641–666. http://dx.doi.org/10.1146/annurev-psych-122414-033645
Geddes, J., Ratcliff, R., Allerhand, M., Childers, R., Wright, R. J., Frier,B. M., & Deary, I. J. (2010). Modeling the effects of hypoglycemia ona two-choice task in adult humans. Neuropsychology, 24, 652–660.http://dx.doi.org/10.1037/a0020074
Gillund, G., & Shiffrin, R. M. (1984). A retrieval model for both recog-nition and recall. Psychological Review, 91, 1–67.
Gold, J. I., & Shadlen, M. N. (2007). The neural basis of decision making.Annual Review of Neuroscience, 30, 535–574. http://dx.doi.org/10.1146/annurev.neuro.29.051605.113038
Gordon, S. K., & Clark, W. C. (1974). Adult age differences in word andnonsense syllable recognition memory and response criterion. Journal ofGerontology, 29, 659–665.
Gunzelmann, G., Gluck, K. A., Price, S., Van Dongen, H. P. A., & Dinges,D. F. (2007). Decreased arousal as a result of sleep deprivation: Theunraveling of cognitive control. In W. D. Gray (Ed.), Integrated Modelsof Cognitive Systems (pp. 243–253). New York, NY: Oxford UniversityPress. http://dx.doi.org/10.1093/acprof:oso/9780195189193.003.0017
Habeck, C., Rakitin, B. C., Moeller, J., Scarmeas, N., Zarahn, E., Brown,T., & Stern, Y. (2005). An event-related fMRI study of the neuralnetworks underlying the encoding, maintenance, and retrieval phase in adelayed-match-to-sample task. Cognitive Brain Research, 23, 207–220.http://dx.doi.org/10.1016/j.cogbrainres.2004.10.010
Hanes, D. P., & Schall, J. D. (1996). Neural control of voluntary movementinitiation. Science, 274, 427–430. http://dx.doi.org/10.1126/science.274.5286.427
Harrison, Y., & Horne, J. A. (2000). Sleep loss and temporal memory. TheQuarterly Journal of Experimental Psychology A: Human ExperimentalPsychology, 53, 271–279. http://dx.doi.org/10.1080/713755870
Harrison, Y., Horne, J. A., & Rothwell, A. (2000). Prefrontal neuropsy-chological effects of sleep deprivation in young adults—A model forhealthy aging? Sleep, 23, 1067–1073. http://dx.doi.org/10.1093/sleep/23.8.1f
Heekeren, H. R., Marrett, S., & Ungerleider, L. G. (2008). The neuralsystems that mediate human perceptual decision making. Nature Re-views Neuroscience, 9, 467–479. http://dx.doi.org/10.1038/nrn2374
Hockley, W. E. (1991). Recognition memory for item and associativeinformation: A comparison of forgetting rates. In S. Lewandowsky, &W. E. Hockley (Eds.), Relating theory and data: Essays in humanmemory in honor of Bennet B. Murdock (pp. 227–248). Hillsdale, NewJersey: Lawrence Erlbaum Associates, Inc.
Hockley, W. E. (1994). Reflections of the mirror effect for item andassociative recognition. Memory and Cognition, 22, 713–722.
Hockley, W. E., & Cristi, C. (1996). Tests of encoding tradeoffs betweenitem and associative information. Memory and Cognition, 24, 202–216.
Humphreys, M. S. (1976). Relational information and the context effect inrecognition memory. Memory and Cognition, 4, 221–232.
Humphreys, M. S. (1978). Item and relational information: A case forcontext independent retrieval. Journal of Verbal Learning and VerbalBehavior, 17, 175–187.
Iber, C., Ancoli-Israel, S., Chesson, A. L., & Quan, S. F. (2007). TheAASM manual for the scoring of sleep and associated events. Rules,terminology and technical specifications. Westchester, IL: AmericanAcademy of Sleep Medicine.
Jackson, M. L., Gunzelmann, G., Whitney, P., Hinson, J. M., Belenky, G.,Rabat, A., & Van Dongen, H. P. A. (2013). Deconstructing and recon-structing cognitive performance in sleep deprivation. Sleep MedicineReviews, 17, 215–225. http://dx.doi.org/10.1016/j.smrv.2012.06.007
Jackson, M. L., & Van Dongen, H. P. A. (2011). Cognitive effects ofsleepiness. In M. J. Thorpy, & M. Billiard (Eds.), Sleepiness: Causes,Consequences and Treatment (pp. 72–81). Cambridge, England: Cam-bridge University Press. http://dx.doi.org/10.1017/CBO9780511762697.009
Laming, D. R. J. (1968). Information theory of choice reaction time. NewYork, NY: Wiley.
Lim, J., & Dinges, D. F. (2008). Sleep deprivation and vigilant attention.Annals of the New York Academy of Sciences, 1129, 305–322. http://dx.doi.org/10.1196/annals.1417.002
Lim, J., & Dinges, D. F. (2010). A meta-analysis of the impact of short-term sleep deprivation on cognitive variables. Psychological Bulletin,136, 375–389. http://dx.doi.org/10.1037/a0018883
Malmberg, K. J., & Xu, J. (2007). On the flexibility and on the fallibilityof associative memory. Memory & Cognition, 35, 545–556.
McKoon, G., & Ratcliff, R. (2012). Aging and IQ effects on associativerecognition and priming in item recognition. Journal of Memory andLanguage, 66, 416–437. http://dx.doi.org/10.1016/j.jml.2011.12.001
Mograss, M. A., Guillem, F., Brazzini-Poisson, V., & Godbout, R. (2009).The effects of total sleep deprivation on recognition memory processes:A study of event-related potential. Neurobiology of Learning and Mem-ory, 91, 343–352. http://dx.doi.org/10.1016/j.nlm.2009.01.008
Murdock, B. B. (1974). Human memory: Theory and data. Potomac,Maryland: Erlbaum.
Murdock, B. B. (1982). A theory for the storage and retrieval of item andassociative information. Psychological Review, 89, 609–626.
Naveh-Benjamin, M. (2000). Adult age differences in memory perfor-mance: Tests of an associative deficit hypothesis. Journal of Experimen-tal Psychology: Learning, Memory, and Cognition, 26, 1170–1187.
Nelder, J. A., & Mead, R. (1965). A simplex method for function mini-mization. The Computer Journal, 7, 308–313. http://dx.doi.org/10.1093/comjnl/7.4.308
Nilsson, L. G., Bäckman, L., & Karlsson, T. (1989). Priming and cuedrecall in elderly, alcohol intoxicated and sleep deprived subjects: A caseof functionally similar memory deficits. Psychological Medicine, 19,423–433. http://dx.doi.org/10.1017/S0033291700012460
Old, S. R., & Naveh-Benjamin, M. (2008). Differential effects of aging onitem and associative measures of memory: A meta-analysis. Psychologyand Aging, 23, 104–118.
Patanaik, A., Zagorodnov, V., Kwoh, C. K., & Chee, M. W. (2014).Predicting vulnerability to sleep deprivation using diffusion model pa-
Thi
sdo
cum
ent
isco
pyri
ghte
dby
the
Am
eric
anPs
ycho
logi
cal
Ass
ocia
tion
oron
eof
itsal
lied
publ
ishe
rs.
Thi
sar
ticle
isin
tend
edso
lely
for
the
pers
onal
use
ofth
ein
divi
dual
user
and
isno
tto
bedi
ssem
inat
edbr
oadl
y.
206 RATCLIFF AND VAN DONGEN

rameters. Journal of Sleep Research, 23, 576–584. http://dx.doi.org/10.1111/jsr.12166
Pe, M. L., Vandekerckhove, J., & Kuppens, P. (2013). A diffusion modelaccount of the relationship between the emotional flanker task andrumination and depression. Emotion, 13, 739–747.
Petrov, A. A., Van Horn, N. M., & Ratcliff, R. (2011). Dissociable perceptual-learning mechanisms revealed by diffusion-model analysis. PsychonomicBulletin & Review, 18, 490–497. http://dx.doi.org/10.3758/s13423-011-0079-8
Philiastides, M. G., Ratcliff, R., & Sajda, P. (2006). Neural representationof task difficulty and decision making during perceptual categorization:A timing diagram. The Journal of Neuroscience, 26, 8965–8975. http://dx.doi.org/10.1523/JNEUROSCI.1655-06.2006
Rakitin, B. C., Tucker, A. M., Basner, R. C., & Stern, Y. (2012). Theeffects of stimulus degradation after 48 hours of total sleep deprivation.Sleep: Journal of Sleep and Sleep Disorders Research, 35, 113–121.http://dx.doi.org/10.5665/sleep.1598
Ratcliff, R. (1978). A theory of memory retrieval. Psychological Review,85, 59–108. http://dx.doi.org/10.1037/0033-295X.85.2.59
Ratcliff, R. (1979). Group reaction time distributions and an analysis ofdistribution statistics. Psychological Bulletin, 86, 446–461. http://dx.doi.org/10.1037/0033-2909.86.3.446
Ratcliff, R. (1993). Methods for dealing with reaction time outliers. Psy-chological Bulletin, 114, 510–532. http://dx.doi.org/10.1037/0033-2909.114.3.510
Ratcliff, R. (2002). A diffusion model account of response time andaccuracy in a brightness discrimination task: Fitting real data and failingto fit fake but plausible data. Psychonomic Bulletin & Review, 9,278–291. http://dx.doi.org/10.3758/BF03196283
Ratcliff, R. (2008). Modeling aging effects on two-choice tasks: Responsesignal and response time data. Psychology and Aging, 23, 900–916.http://dx.doi.org/10.1037/a0013930
Ratcliff, R., Cherian, A., & Segraves, M. (2003). A comparison of macaquebehavior and superior colliculus neuronal activity to predictions frommodels of two-choice decisions. Journal of Neurophysiology, 90, 1392–1407. http://dx.doi.org/10.1152/jn.01049.2002
Ratcliff, R., & Childers, R. (2015). Individual differences and fittingmethods for the two-choice diffusion model. Decision, 2, 237–279.http://dx.doi.org/10.1037/dec0000030
Ratcliff, R., Love, J., Thompson, C. A., & Opfer, J. E. (2012). Children arenot like older adults: A diffusion model analysis of developmentalchanges in speeded responses. Child Development, 83, 367–381. http://dx.doi.org/10.1111/j.1467-8624.2011.01683.x
Ratcliff, R., & McKoon, G. (2008). The diffusion decision model: Theoryand data for two-choice decision tasks. Neural Computation, 20, 873–922. http://dx.doi.org/10.1162/neco.2008.12-06-420
Ratcliff, R., Perea, M., Colangelo, A., & Buchanan, L. (2004). A diffusionmodel account of normal and impaired readers. Brain and Cognition, 55,374–382. http://dx.doi.org/10.1016/j.bandc.2004.02.051
Ratcliff, R., Smith, P. L., Brown, S. D., & McKoon, G. (2016). Diffusiondecision model: Current issues and history. Trends in Cognitive Sci-ences, 20, 260–281. http://dx.doi.org/10.1016/j.tics.2016.01.007
Ratcliff, R., Thapar, A., Gomez, P., & McKoon, G. (2004). A diffusionmodel analysis of the effects of aging in the lexical-decision task.Psychology and Aging, 19, 278–289. http://dx.doi.org/10.1037/0882-7974.19.2.278
Ratcliff, R., Thapar, A., & McKoon, G. (2006). Aging, practice, andperceptual tasks: A diffusion model analysis. Psychology and Aging, 21,353–371. http://dx.doi.org/10.1037/0882-7974.21.2.353
Ratcliff, R., Thapar, A., & McKoon, G. (2010). Individual differences,aging, and IQ in two-choice tasks. Cognitive Psychology, 60, 127–157.http://dx.doi.org/10.1016/j.cogpsych.2009.09.001
Ratcliff, R., Thapar, A., & McKoon, G. (2011). Effects of aging and IQ onitem and associative memory. Journal of Experimental Psychology:General, 140, 464–487. http://dx.doi.org/10.1037/a0023810
Ratcliff, R., & Tuerlinckx, F. (2002). Estimating parameters of the diffu-sion model: Approaches to dealing with contaminant reaction times andparameter variability. Psychonomic Bulletin & Review, 9, 438–481.http://dx.doi.org/10.3758/BF03196302
Ratcliff, R., & Van Dongen, H. P. A. (2009). Sleep deprivation affectsmultiple distinct cognitive processes. Psychonomic Bulletin & Review,16, 742–751. http://dx.doi.org/10.3758/PBR.16.4.742
Ratcliff, R., & Van Dongen, H. P. A. (2011). Diffusion model for one-choice reaction-time tasks and the cognitive effects of sleep deprivation.Proceedings of the National Academy of Sciences of the United States ofAmerica, 108, 11285–11290. http://dx.doi.org/10.1073/pnas.1100483108
Ratcliff, R., Van Zandt, T., & McKoon, G. (1999). Connectionist anddiffusion models of reaction time. Psychological Review, 106, 261–300.http://dx.doi.org/10.1037/0033-295X.106.2.261
Schmiedek, F., Oberauer, K., Wilhelm, O., Süss, H.-M., & Wittmann,W. W. (2007). Individual differences in components of reaction timedistributions and their relations to working memory and intelligence.Journal of Experimental Psychology: General, 136, 414–429. http://dx.doi.org/10.1037/0096-3445.136.3.414
Shiffrin, R. M., & Steyvers, M. (1997). A model for recognition memory:REM: Retrieving effectively from memory. Psychonomic Bulletin andReview, 4, 145–166.
Smith, P. L., & Ratcliff, R. (2004). Psychology and neurobiology of simpledecisions. Trends in Neurosciences, 27, 161–168. http://dx.doi.org/10.1016/j.tins.2004.01.006
Tantawy, A. O., Tallawy, H. N., Farghaly, H. R., Farghaly, W. M., &Hussein, A. S. (2013). Impact of nocturnal sleep deprivation on declar-ative memory retrieval in students at an orphanage: A psychoneurora-diological study. Neuropsychiatric Disease and Treatment, 9, 403–408.
Torsvall, L., & Akerstedt, T. (1987). Sleepiness on the job: Continuouslymeasured EEG changes in train drivers. Electroencephalography &Clinical Neurophysiology, 66, 502–511. http://dx.doi.org/10.1016/0013-4694(87)90096-4
Tucker, A. M., Rakitin, B. C., Basner, R. C., Gazes, Y., Steffener, J., &Stern, Y. (2011). fMRI activation during failures to respond key tounderstanding performance changes with sleep deprivation. BehaviouralBrain Research, 218, 73–79. http://dx.doi.org/10.1016/j.bbr.2010.11.012
Tucker, A. M., Stern, Y., Basner, R. C., & Rakitin, B. C. (2011). Theprefrontal model revisited: Double dissociations between young sleepdeprived and elderly subjects on cognitive components of performance.Sleep: Journal of Sleep and Sleep Disorders Research, 34, 1039–1050.http://dx.doi.org/10.5665/SLEEP.1158
Tucker, A. M., Whitney, P., Belenky, G., Hinson, J. M., & Van Dongen,H. P. A. (2010). Effects of sleep deprivation on dissociated componentsof executive functioning. Sleep: Journal of Sleep and Sleep DisordersResearch, 33, 47–57. http://dx.doi.org/10.1093/sleep/33.1.47
Urry, E., & Landolt, H. P. (2014). Adenosine, caffeine, and performance:From cognitive neuroscience of sleep to sleep pharmacogenetics. Cur-rent Topics in Behavioral Neurosciences, 25, 331–366. http://dx.doi.org/10.1007/7854_2014_274
Vandekerckhove, J., & Tuerlinckx, F. (2008). Diffusion model analysiswith MATLAB: A DMAT primer. Behavior Research Methods, 40,61–72. http://dx.doi.org/10.3758/BRM.40.1.61
Van Dongen, H. P. A., Belenky, G., & Krueger, J. M. (2011). A local,bottom-up perspective on sleep deprivation and neurobehavioral perfor-mance. Current Topics in Medicinal Chemistry, 11, 2414–2422. http://dx.doi.org/10.2174/156802611797470286
Volkow, N. D., Tomasi, D., Wang, G. J., Telang, F., Fowler, J. S., Wang,R. L., . . . Swanson, J. M. (2009). Hyperstimulation of striatal D2
Thi
sdo
cum
ent
isco
pyri
ghte
dby
the
Am
eric
anPs
ycho
logi
cal
Ass
ocia
tion
oron
eof
itsal
lied
publ
ishe
rs.
Thi
sar
ticle
isin
tend
edso
lely
for
the
pers
onal
use
ofth
ein
divi
dual
user
and
isno
tto
bedi
ssem
inat
edbr
oadl
y.
207SLEEP DEPRIVATION AND ITEM AND ASSOCIATIVE MEMORY

receptors with sleep deprivation: Implications for cognitive impairment.NeuroImage, 45, 1232–1240. http://dx.doi.org/10.1016/j.neuroimage.2009.01.003
Walker, M. P., & Stickgold, R. (2006). Sleep, memory, and plasticity.Annual Review of Psychology, 57, 139–166. http://dx.doi.org/10.1146/annurev.psych.56.091103.070307
Wee, N., Asplund, C. L., & Chee, M. W. L. (2013). Sleep deprivationaccelerates delay-related loss of visual short-term memories withoutaffecting precision. Sleep: Journal of Sleep and Sleep Disorders Re-search, 36, 849–856. http://dx.doi.org/10.5665/sleep.2710
Wenzlaff, H., Bauer, M., Maess, B., & Heekeren, H. R. (2011). Neuralcharacterization of the speed-accuracy tradeoff in a perceptual decision-making task. The Journal of Neuroscience, 31, 1254–1266. http://dx.doi.org/10.1523/JNEUROSCI.4000-10.2011
White, C. N., Ratcliff, R., Vasey, M. W., & McKoon, G. (2010). Usingdiffusion models to understand clinical disorders. Journal of Mathemat-ical Psychology, 54, 39–52. http://dx.doi.org/10.1016/j.jmp.2010.01.004
Whitney, P., & Hinson, J. M. (2010). Measurement of cognition in studiesof sleep deprivation. Progress in Brain Research, 185, 37–48. http://dx.doi.org/10.1016/B978-0-444-53702-7.00003-8
Whitney, P., Hinson, J. M., Jackson, M. L., & Van Dongen, H. P. A.(2015). Feedback blunting: Total sleep deprivation impairs decisionmaking that requires updating based on feedback. Sleep: Journal ofSleep and Sleep Disorders Research, 38, 745–754. http://dx.doi.org/10.5665/sleep.4668
Williams, H. L., Gieseking, C. F., & Lubin, A. (1966). Some effects ofsleep loss on memory. Perceptual and Motor Skills, 23, 1287–1293.http://dx.doi.org/10.2466/pms.1966.23.3f.1287
Received August 22, 2014Revision received June 1, 2017
Accepted June 5, 2017 �
Call for Nominations
The Publications and Communications (P&C) Board of the American Psychological Associationhas opened nominations for the editorships of the Journal of Experimental Psychology: AnimalLearning and Cognition, Neuropsychology, and Psychological Methods for the years 2020 to 2025.Ralph R. Miller, PhD, Gregory G. Brown, PhD, and Lisa L. Harlow, PhD, respectively, are theincumbent editors.
Candidates should be members of APA and should be available to start receiving manuscripts inearly 2019 to prepare for issues published in 2020. Please note that the P&C Board encouragesparticipation by members of underrepresented groups in the publication process and would partic-ularly welcome such nominees. Self-nominations are also encouraged.
Search chairs have been appointed as follows:
● Journal of Experimental Psychology: Animal Learning and Cognition, Chair: Stevan E.Hobfoll, PhD
● Neuropsychology, Chair: Stephen M. Rao, PhD● Psychological Methods, Chair: Mark B. Sobell, PhD
Candidates should be nominated by accessing APA’s EditorQuest site on the Web. Using yourbrowser, go to https://editorquest.apa.org. On the Home menu on the left, find “Guests/Supporters.”Next, click on the link “Submit a Nomination,” enter your nominee’s information, and click“Submit.”
Prepared statements of one page or less in support of a nominee can also be submitted by e-mail toSarah Wiederkehr, P&C Board Editor Search Liaison, at [email protected].
Deadline for accepting nominations is Monday, January 8, 2018, after which phase one vetting willbegin.
Thi
sdo
cum
ent
isco
pyri
ghte
dby
the
Am
eric
anPs
ycho
logi
cal
Ass
ocia
tion
oron
eof
itsal
lied
publ
ishe
rs.
Thi
sar
ticle
isin
tend
edso
lely
for
the
pers
onal
use
ofth
ein
divi
dual
user
and
isno
tto
bedi
ssem
inat
edbr
oadl
y.
208 RATCLIFF AND VAN DONGEN
www.sciencedirect.com
c o r t e x 9 9 ( 2 0 1 8 ) 1 7 9e1 8 6
Available online at
ScienceDirect
Journal homepage: www.elsevier.com/locate/cortex
Note
Catechol-O-methyltransferase (COMT) genotypeaffects cognitive control during total sleepdeprivation
Brieann C. Satterfield a,1, John M. Hinson b,*, Paul Whitney b,Michelle A. Schmidt a, Jonathan P. Wisor a and Hans P.A. Van Dongen a
a Sleep and Performance Research Center and Elson S. Floyd College of Medicine, Washington State University,
Spokane, WA, USAb Department of Psychology, Washington State University, Pullman, WA, USA
a r t i c l e i n f o
Article history:
Received 5 May 2017
Reviewed 18 August 2017
Revised 10 October 2017
Accepted 14 November 2017
Action editor Ahmad Hariri
Published online 26 November 2017
Keywords:
Adaptive decision making
Dopamine
Neurobehavioral performance
Phenotype
Reversal learning
* Corresponding author. Department of PsycE-mail addresses: bsatterfield@psychiat
(P. Whitney), [email protected] (M.A. Sch1 Present address: Department of Psychia
85724-0001, USA.https://doi.org/10.1016/j.cortex.2017.11.0120010-9452/© 2017 Elsevier Ltd. All rights rese
a b s t r a c t
Adaptive decision making is profoundly impaired by total sleep deprivation (TSD). This
suggests that TSD impacts fronto-striatal pathways involved in cognitive control, where
dopamine is a key neuromodulator. In the prefrontal cortex (PFC), dopamine is catabolized
by the enzyme catechol-O-methyltransferase (COMT). A functional polymorphism
(Val158Met) influences COMT's enzymatic activity, resulting in markedly different levels of
prefrontal dopamine. We investigated the effect of this polymorphism on adaptive decision
making during TSD. Sixty-six healthy young adults participated in one of two in-laboratory
studies. After a baseline day, subjects were randomized to either a TSD group (n ¼ 32) with
38 h or 62 h of extended wakefulness or a well-rested control group (n ¼ 34) with 10 h
nighttime sleep opportunities. Subjects performed a go/no-go reversal learning (GNGr) task
at well-rested baseline and again during TSD or equivalent control. During the task, sub-
jects were required to learn stimuluseresponse relationships from accuracy feedback. The
stimuluseresponse relationships were reversed halfway through the task, which required
subjects to learn the new stimuluseresponse relationships from accuracy feedback. Per-
formance on the GNGr task was quantified by discriminability (d0) between go and no-go
stimuli before and after the stimuluseresponse reversal. GNGr performance did not
differ between COMT genotypes when subjects were well-rested. However, TSD exposed a
significant vulnerability to adaptive decision making impairment in subjects with the Val
allele. Our results indicate that sleep deprivation degrades cognitive control through a
fronto-striatal, dopaminergic mechanism.
© 2017 Elsevier Ltd. All rights reserved.
hology, Washington Statery.arizona.edu (B.C. Sattmidt), [email protected]
try, College of Medicine,
rved.
University, P.O. Box 644820, Pullman, WA, 99164-4820, USA.erfield), [email protected] (J.M. Hinson), [email protected](J.P. Wisor), [email protected] (H.P.A. Van Dongen).University of Arizona, 1501 N. Campbell, Rm. 7304A, Tucson, AZ,

c o r t e x 9 9 ( 2 0 1 8 ) 1 7 9e1 8 6180
1. Introduction
Sleep deprivation affects neurobehavioral performance across
a variety of cognitive domains in differential ways (Killgore,
2010; Lim & Dinges, 2010). There are large, trait-like inter-indi-
vidual differences in cognitive responses to sleep deprivation
(Van Dongen, Baynard, Maislin, & Dinges, 2004), underlaid by
systematic inter-individual differences in sleep/wake homeo-
stasis (R�etey et al., 2006; Van Dongen, Bender & Dinges, 2012)
and partially determined by a number of genetic variants
(Bodenmann et al., 2012; Goel, Banks, Ling, Mignot, & Dinges,
2011; Satterfield, Wisor, Field, Schmidt, & Van Dongen, 2015;
Viola et al., 2007). While the reasons why different cognitive
functions are affected by sleep deprivation differentially have
been discussed theoretically (Van Dongen, Belenky, & Krueger,
2011), they largely remain to be studied experimentally
(Jackson et al., 2013).
Vigilant attention is among the cognitive functions most
widely studied in this context. It is substantially degraded by
total sleep deprivation (TSD), causing significant instability in
performance (Doran, Van Dongen, & Dinges, 2001; Lim &
Dinges, 2008). However, impairment in vigilant attention is
dissociable from impairment in other aspects of cognition
(Jackson et al., 2013; Tucker, Whitney, Belenky, Hinson, & Van
Dongen, 2010). We recently demonstrated that adaptive de-
cision making, in addition to e and distinct from e vigilant
attention, is profoundly degraded by TSD (Whitney, Hinson,
Jackson, & Van Dongen, 2015). This effect cannot be
explained as a mere function of lapses in vigilant attention e
we showed that masking as much as 40% of the feedback on
the GNGr (simulating an overabundance of attentional lapses)
did not produce the level of impairment on the GNGr that we
saw during TSD (Whitney et al., 2015, supplement). The
neurobiological mechanisms underlying the specific effect of
sleep deprivation on adaptive decision making are as yet
unknown.
Adaptive decision making requires cognitive control to
balance cognitive stability e the ability to maintain task-
relevant information in the focus of attention e with cogni-
tive flexibility e the ability to update task-relevant information
based on changes in contingencies, while at the same time
suppressing irrelevant information in order to appropriately
adapt behavior (Braver, 2012; Cools & Robbins, 2004). On a
reversal learning task that requires adaptive decision making,
we previously found that cognitive flexibility is considerably
impacted by TSD, while stability is relatively maintained
compared to well-rested baseline (Whitney et al., 2015). This
finding points to the involvement of fronto-striatal pathways
subserving cognitive control (Botvinick & Braver, 2015; Cole &
Schneider, 2007; Cools, 2016; Klanker, Feenstra, Denys, Lo, &
Tsing, 2013). Notably, damage to the orbital frontal cortex
(OFC) results in impaired cognitive flexibility similar to our
finding during TSD (Fellows, 2007; Frank & Claus, 2006).
Dopamine is a key neuromodulator in the fronto-striatal
circuits involved in cognitive control (Floresco, Zhang, &
Enomoto, 2009; Frank & Claus, 2006; Izquierdo et al., 2016;
Klanker et al., 2013; Waltz, 2017). The prefrontal cortex (PFC)
in particular is sensitive to fluctuations in dopamine, with
marked downstream effects on cognitive performance. The
association between PFC-mediated cognition and dopami-
nergic tone shows an inverted-U relationship (Cools &
D'Esposito, 2011; Cools & Robbins, 2004; Fallon, Williams-
Gray, Barker, Owen, & Hampshire, 2013). That is, both sub-
and supra-optimal dopamine levels in the PFC and/or the
striatum result in cognitive performance deficits. While this is
readily noticeable in psychiatric and neurological disorders
such as schizophrenia and Parkinson's disease (Cools, Barker,
Sahakian, & Robbins, 2001; Cools & Robbins, 2004; Tunbridge,
Harrison, & Weinberger, 2006), it can also be observed in non-
clinical populations as a consequence of genetic poly-
morphisms of the dopaminergic system (Klanker et al., 2013;
Savitz, Solms, & Ramesar, 2006).
Within the PFC, dopamine levels are modulated by the
enzyme catechol-O-methyltransferase (COMT). COMT is
localized in the extrasynaptic spaces, where it metabolizes
dopamine and renders it inactive (Chen et al., 2004; Savitz
et al., 2006). The gene coding for COMT contains a single
nucleotide polymorphism (SNP), which involves a valine (Val)
to methionine (Met) substitution at codon 158 (Val158Met)
(Lachman et al., 1996). The Met and Val alleles differentially
affect COMT's enzymatic activity and thus influence PFC
dopamine levels. TheMet allele reduces the enzymatic activity
of COMT three-to four-fold relative to the Val allele, leading to
increased dopamine availability (Chen et al., 2004; Lachman
et al., 1996; Weinshilboum, Otterness, & Szumlanski, 1999).
Associations between COMT Val158Met genotypes and dif-
ferences in PFC functioning and cognitive performance under
well-rested conditions have been well established (Cools &
D'Esposito, 2011; Dickinson & Elvevag, 2009; Klanker et al.,
2013; Mione et al., 2015).
Altered dopaminergic signaling in fronto-striatal circuits
thatmediate cognitive controlmay be part of themechanisms
underlying the substantial impairment in adaptive decision
making previously documented during TSD (Whitney et al.,
2015). Here we investigate whether the COMT Val158Met
polymorphism mediates the impact of TSD on adaptive deci-
sion making.
2. Methods
We assessed adaptive decision making during TSD using a
reversal learning paradigm (Whitney et al., 2015). N ¼ 66
subjects each participated in one of two in-laboratory studies.
In each study, subjects were assigned to either a TSD group
(n ¼ 32) or a well-rested control group (n ¼ 34). Subjects per-
formed a go/no-go reversal learning (GNGr) task, measuring
adaptive decision making, once at baseline and once during
TSD or well-rested control. Subjects were grouped by COMT
genotype to investigate genotypeephenotype relationships
associated with impairment in adaptive decision making
during TSD.
2.1. Subjects
N ¼ 66 healthy young adults (26.2 ± 4.5 years; 27 females)
participated in one of two in-laboratory studies conducted in
the Sleep and Performance Research Center at Washington
State University Spokane. Subjects underwent rigorous

c o r t e x 9 9 ( 2 0 1 8 ) 1 7 9e1 8 6 181
screening procedures, which included physical examination,
history, blood and urine chemistry, breathalyzer test, baseline
polysomnography, and a battery of questionnaires (see
supplemental material for further screening details).
The studies were approved by the Institutional Review
Board (IRB) of Washington State University. Subjects provided
written informed consent and were financially compensated
for their time.
2.2. Study design
Study 1: Forty-one healthy young adults (26.5 ± 4.7 years; 17
females) participated in a 4-day (3-night) laboratory study. All
subjects had one baseline day with a 10 h sleep opportunity
(22:00e08:00). They were then randomized to either a TSD
condition (n ¼ 20) with 38 h of extended wakefulness followed
by a 10 h recovery sleep opportunity (22:00e08:00) on the third
night, or a well-rested control condition (n ¼ 21) with a 10 h
sleep opportunity (22:00e08:00) on both the second and third
nights. The laboratory conditions are described in the
supplemental material.
Subjects performed the GNGr task twice during the study,
once at baseline (6 h awake) and again 24 h later during TSD
(30 h awake) or well-rested control (6 h awake). Both task
administrations occurred at 14:00. Two equivalent versions of
the GNGr task, which differed only in the specific stimuli
presented, were administered in randomized, counter-
balanced order. The GNGr task was the first of three perfor-
mance tasks in a larger test battery.
Additionally, subjects performed a 10 min psychomotor
vigilance test (PVT; Lim & Dinges, 2008) as a measure of vigi-
lant attention. The PVT was administered every 2e4 h during
scheduled wakefulness. Here we used the PVT test bouts that
were administered immediately prior to the GNGr, at 13:00
during baseline (5 h awake) and again 24 h later during SD
(29 h awake) or well-rested control (5 h awake). See the
supplemental material for a description of the PVT.
Study 1 has been described elsewhere (Chavali, Riedy, &
Van Dongen, 2017), but the GNGr data and genotypeepheno-
type relationships presented here have not been published
before.
Study 2: Twenty-five healthy young adults (25.8 ± 4.1 years;
10 females) participated in a 7-day (6-night) laboratory study.
All subjects had two baseline days, each with a 10 h sleep
opportunity (22:00e08:00). They were then randomized to
either a TSD condition (n ¼ 12) with 62 h of extended wake-
fulness or a well-rested control condition (n ¼ 13) with two
10 h sleep opportunities (22:00e08:00). The study ended with
two 10 h recovery sleep opportunities (22:00e08:00). The lab-
oratory conditions are described in the supplemental
material.
Subjects performed an abbreviated version of the GNGr
task during the first day in the laboratory for practice.
Following, subjects performed the GNGr task three times
during the study, once at baseline (7 h wake), again 48 h later
during TSD (55 h wake) or well-rested control (7 h wake), and
again another 48 h later after recovery sleep. Each task
administration occurred at 15:20. Three equivalent versions of
the GNGr task, which differed only in the specific stimuli
presented, where administered in randomized,
counterbalanced order. Data from the third task administra-
tion (after recovery sleep) are not included here.
Subjects also performed a 10 min PVT every 2 h during
scheduled wakefulness. Here we used the PVT test bouts that
were administered immediately prior to the GNGr, at 15:00
during baseline (7 h awake) and again 48 h later during SD
(55 h awake) or well-rested control (7 h awake). See
supplemental material for a description of the PVT.
Study 2, including the GNGr data and subject sample, has
been reported on previously (Whitney et al., 2015), but the
genotypeephenotype relationships presented here have not
been published before.
2.3. Reversal learning task
We employed a reversal learning task to measure adaptive
decision making (Whitney et al., 2015). The specific task we
used was a go/no-go reversal learning (GNGr) task, which was
based on a standard go/no-go paradigm requiring subjects to
respond to a specific set of stimuli (go stimuli) while with-
holding a response to a different set of stimuli (no-go stimuli).
The probability of go and no-go stimuli was the same.
Importantly, subjects were required to use accuracy feedback,
provided in the form of hypothetical monetary gains and
losses, to learn stimuluseresponse mappings. Additionally,
approximately halfway through the task there was a reversal
of contingencies, and subjects were to use accuracy feedback
to learn the new stimuluseresponse mappings and adjust
their response behavior.
Subjects performed the GNGr task on a desktop computer
in their individual bedrooms. Prior to each task administra-
tion, subjects were presented with an instruction screen
explaining how to perform the task. They were told that the
goal of the task was to earn as much hypothetical money as
possible. At the beginning of the task, four two-digit numbers
were assigned to the go stimulus set and four two-digit
numbers were assigned to the no-go stimulus set. Subjects
were unaware of which numbers belonged to which stimulus
set, and were required to learn the correct stimuluseresponse
relationships from accuracy feedback. The reversal of the
stimuluseresponse relationships approximately halfway
through the task was not announced; subjects were required
to discover the new stimuluseresponse relationships through
accuracy feedback. See Fig. 1.
In both studies, subjects were given 4 practice trials at the
beginning of each test bout, which were excluded from anal-
ysis. In study 1, subjects performed two versions of the GNGr,
with either 56 or 64 pre-reversal trials. In study 2, subjects
performed an additional version of the task, which had 60 pre-
reversal trials. After the reversal, there were 40 post-reversal
trials, regardless of the task version. For analysis purposes,
data were grouped into 4 pre-reversal trial blocks (with 14, 15
or 16 trials in each block) and 4 post-reversal trial blocks (with
10 trials per block).
A signal detection framework (Stanislaw & Todorov, 1999)
was used to calculate the discriminability index (d0) as a
measure of subjects' ability to discriminate between go and
no-go stimuli. Hits and false alarmswere assessed and used to
calculate the d0 value for each pre-reversal and each post-
reversal trial block. Each subject's d0 values were used as the

Get Ready
+
4000 ms
750 ms
422500 ms
Response Detected
Feedback
2500 ms
Fig. 1 e Schematic of the go/no-go reversal learning (GNGr)
task. In each trial, subjects were given a get ready cue. The
stimulus was then presented on the computer screen for
750 ms, during which the subjects were required to either
respond or withhold a response. After each provided or
withheld response, subjects were given accuracy feedback
in the form of a monetary gain or loss. Subjects began the
task with a hypothetical $2.00. If the response (or lack of
response) was correct for the presented stimulus, subjects
earned $0.20. If the response (or lack of response) was
incorrect, subjects lost $0.20. At some point during the
task, unannounced, the responseestimulus contingencies
were reversed. Both before and after the reversal, subjects
had to learn the stimuluseresponse contingencies from
the accuracy feedback.
c o r t e x 9 9 ( 2 0 1 8 ) 1 7 9e1 8 6182
primary outcomemeasure of GNGr performance. Hit and false
alarm rates were considered as secondary outcomemeasures.
2.4. Genotyping
Fromeach subject, a venouswhole blood samplewas collected
in a Vacutainer tube coated with ethylenediaminetetraacetic
dipotassium dihydrate (K2EDTA) during a pre-study screening
session. The blood samples were aliquoted and immediately
stored at �80 �C until time of analysis. Details of the assay for
the Val158Met SNP are provided in the supplemental material.
2.5. Statistical analysis
The genotype distribution in our subject sample was exam-
ined for deviation from HardyeWeinberg equilibrium using a
c2 goodness-of-fit test. Logistic regression was used to test
COMT genotypes in the sample for differences in gender and
race/ethnicity distributions; one-way analysis of variance
(ANOVA) was used to test for age differences.
The discriminability index, d0, was used as the primary
outcomemeasure of GNGr task performance. Hit rate (percent
of correct responses to go stimuli) and false alarm rate
(percent of incorrect responses to no-go stimuli) were analyzed
as secondary outcome measures. Data were aggregated (not
averaged) across the four pre-reversal trial blocks (pre-
reversal phase) and across the four post-reversal trial blocks
(post-reversal phase), separately for each subject in each of
the two studies. The first administration of the task, during
baseline, was labeled session 1. As the experimental circum-
stances in the two study conditions (TSD and control) were
identical at baseline, the session 1 data were pooled across the
two conditions. The second administration of the task, during
TSD or well-rested control, was labeled session 2. In our sta-
tistical analysis framework, the session 2 data were differen-
tiated by condition. The same statistical framework was used
for lapses (response times � 500 ms) on the PVT (see
supplemental material).
To analyze the primary and secondary outcomemeasures,
therefore,mixed-effects ANOVAwas usedwith fixed effects of
session, session by condition interaction, phase, session by
phase interaction, and session by condition by phase inter-
action. In addition, fixed effects were included for COMT ge-
notype (Met/Met, Val/Met, Val/Val), alone and in interaction
with the other fixed effects (see Table S1). Because the dura-
tion of wakefulness during TSDwas different between the two
studies, study number was included as a covariate. GNGr task
version was also included as a covariate. A random effect over
subjects was placed on the intercept. The primary statistical
outcome of interest was the interaction between condition
and COMT genotype.
The mixed-effects ANOVA was repeated controlling for
age, gender, race/ethnicity, and menstrual cycle, respectively,
to confirm robustness of the results.
3. Results
The demographics and COMT Val158Met genotypes of our
subject sample are shown in Table 1. The genotype distribu-
tions are presented in Table 2. The variant allele (Met) was in
the subject population at a frequency of .48. The ancestral
allele (Val) was in our subject population at a frequency of .52.
The allele frequencies were found to be in HardyeWeinberg
equilibrium (c21<.01, p ¼ .99) and similar to those reported in
the literature (Jawinski et al., 2016; Valomon et al., 2014). The
genotype distributions did not vary significantly by age
(F2,63 ¼ 1.71, p ¼ .19), gender (c22 ¼ .66, p ¼ .72), or race/
ethnicity (c22 ¼ 1.95, p ¼ .38).
Fig. 2 shows the discriminability index (d0) data for pre- and
post-reversal performance on the GNGr task during session 1
(baseline) and session 2 (TSD or well-rested control), by COMT
genotype. During session 1 (Fig. 2, left), GNGr performance was
similar for all subjects, regardless of genotype. During session
2, however, marked genotype differences emerged in the TSD
condition, as compared to the control condition (Fig. 2, right).
In the control group, all COMT genotypes showed
improved performance during session 2 as compared to ses-
sion 1, reflecting the practice effect previously observed for
the GNGr task (Whitney et al., 2015). In the TSD group, subjects
homozygous for the Met allele also showed improved perfor-
mance, but subjects heterozygous or homozygous for the Val
allele showed poor performance, both pre- and post-reversal,
during session 2 as compared to session 1 (Fig. 2). We previ-
ously found that TSD causes considerable performance defi-
cits on the GNGr task (Whitney et al., 2015). The present
results reveal that the Met allele of COMT Val158Met provides
resilience to this effect, while carriers of the Val allele are

Table 1 e Subject demographics and COMT Val158Met genotypes.
Study 1 Study 2 Combined
TSD Control Total TSD Control Total TSD Control Total
n 20 21 41 12 13 25 32 34 66
Age (mean ± SD) 26.5 ± 4.8 26.5 ± 4.8 26.5 ± 4.7 26.6 ± 4.4 25.2 ± 3.8 25.8 ± 4.1 26.5 ± 4.1 26.0 ± 4.4 26.2 ± 4.5
Gender
Female 9 8 17 7 3 10 16 11 27
Male 11 13 24 5 10 15 16 23 39
Race/ethnicity
Caucasian 19 21 40 7 10 17 26 31 57
Mixeda 1 0 1 3 1 4 4 1 5
American Indian 0 0 0 0 1 1 0 1 1
Asian 0 0 0 1 0 1 1 0 1
Hispanic 0 0 0 1 0 1 1 0 1
Pacific Islander 0 0 0 0 1 1 0 1 1
Genotype
Met/Met 4 8 12 1 2 3 5 10 15
Val/Met 11 8 19 6 8 14 17 16 33
Val/Val 5 5 10 5 3 8 10 8 18
a Subjects reporting more than one race were classified as mixed.
Table 2 e COMT Val158Met genotype counts andfrequencies in the overall sample.
COMT Genotype
Met/Met Val/Met Val/Val
Genotype count
Expecteda 15 32.9 18
Observed 15 33 18
Genotype frequency
Expecteda .23 .5 .27
Observed .23 .5 .27
Publishedb .33 .46 .22
a Calculated based on HardyeWeinberg equilibrium.b Valomon et al. (2014), 115 healthy subjects.
c o r t e x 9 9 ( 2 0 1 8 ) 1 7 9e1 8 6 183
particularly vulnerable. Especially in subjects homozygous for
the Val allele, post-reversal performance was profoundly
impacted, to the point of performing no better than chance.
Our statistical results are shown in the supplemental
material (Table S1). Focusing here on the primary statistical
0
.5
1.0
1.5
2.0
2.5
(ytilibani
mircsiD
d')
Met/MetVal/MetVal/Val
(ytilibani
mircsiD
d’)
0
.5
1.0
1.5
2.0
2.5
(ytilibani
m irc siD
d')
Dis
crim
inab
ility
(d’
)Met/MetVal/MetVal/Val
PreReversal
PostReversal
PreRevers
Baseline
Session 1
Fig. 2 e Means (±standard errors) for the discriminability index (
COMT genotype. Left: session 1 (baseline), pooled over conditio
identical. Right: session 2, differentiated between the well-reste
outcome of interest, there was a significant interaction be-
tween session 2 condition and COMT genotype (F2,973 ¼ 4.41,
p ¼ .012), indicating that the COMT genotype effect was spe-
cific to TSD. Also, when the session 2 data were expressed
relative to the session 1 (baseline) data, the same pattern of
results was seen (see Fig. S1). The finding also held true when
controlling for age, gender, race/ethnicity, and menstrual
cycle. There were no statistically significant effects in the
absence of TSD during session 1 (see Fig. S2). Analysis of hit
rates and false alarm rates further confirmed our finding (see
Fig. S3).
The proportion of variance explained by COMT genotype in
GNGr pre-reversal performance impairment during TSD was
3.89%. Furthermore, the proportion of variance explained by
COMT genotype in post-reversal performance impairment
during TSD was as much as 8.35%. This is substantial
compared to variance explained by gene polymorphisms
during TSD as previously reported for vigilant attention
(Satterfield et al., 2015).
Met/MetVal/MetVal/Val
Well-Rested Sleep-Deprived
alPost
ReversalPre
ReversalPost
Reversal
Session 2
d0) on the GNGr task, pre- and post-reversal, as a function of
ns (N ¼ 66) as the experimental circumstances were
d control condition (n ¼ 34) and the TSD condition (n ¼ 32).
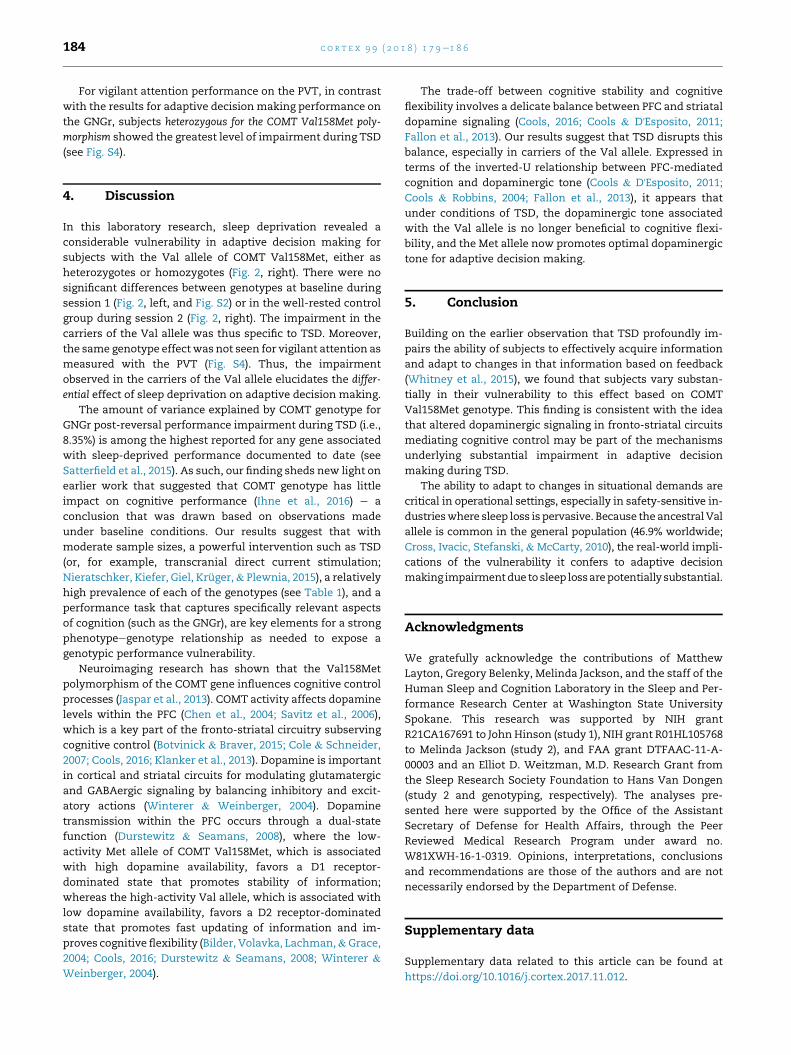
c o r t e x 9 9 ( 2 0 1 8 ) 1 7 9e1 8 6184
For vigilant attention performance on the PVT, in contrast
with the results for adaptive decision making performance on
the GNGr, subjects heterozygous for the COMT Val158Met poly-
morphism showed the greatest level of impairment during TSD
(see Fig. S4).
4. Discussion
In this laboratory research, sleep deprivation revealed a
considerable vulnerability in adaptive decision making for
subjects with the Val allele of COMT Val158Met, either as
heterozygotes or homozygotes (Fig. 2, right). There were no
significant differences between genotypes at baseline during
session 1 (Fig. 2, left, and Fig. S2) or in the well-rested control
group during session 2 (Fig. 2, right). The impairment in the
carriers of the Val allele was thus specific to TSD. Moreover,
the same genotype effect was not seen for vigilant attention as
measured with the PVT (Fig. S4). Thus, the impairment
observed in the carriers of the Val allele elucidates the differ-
ential effect of sleep deprivation on adaptive decision making.
The amount of variance explained by COMT genotype for
GNGr post-reversal performance impairment during TSD (i.e.,
8.35%) is among the highest reported for any gene associated
with sleep-deprived performance documented to date (see
Satterfield et al., 2015). As such, our finding sheds new light on
earlier work that suggested that COMT genotype has little
impact on cognitive performance (Ihne et al., 2016) e a
conclusion that was drawn based on observations made
under baseline conditions. Our results suggest that with
moderate sample sizes, a powerful intervention such as TSD
(or, for example, transcranial direct current stimulation;
Nieratschker, Kiefer, Giel, Kruger,& Plewnia, 2015), a relatively
high prevalence of each of the genotypes (see Table 1), and a
performance task that captures specifically relevant aspects
of cognition (such as the GNGr), are key elements for a strong
phenotypeegenotype relationship as needed to expose a
genotypic performance vulnerability.
Neuroimaging research has shown that the Val158Met
polymorphism of the COMT gene influences cognitive control
processes (Jaspar et al., 2013). COMT activity affects dopamine
levels within the PFC (Chen et al., 2004; Savitz et al., 2006),
which is a key part of the fronto-striatal circuitry subserving
cognitive control (Botvinick & Braver, 2015; Cole & Schneider,
2007; Cools, 2016; Klanker et al., 2013). Dopamine is important
in cortical and striatal circuits for modulating glutamatergic
and GABAergic signaling by balancing inhibitory and excit-
atory actions (Winterer & Weinberger, 2004). Dopamine
transmission within the PFC occurs through a dual-state
function (Durstewitz & Seamans, 2008), where the low-
activity Met allele of COMT Val158Met, which is associated
with high dopamine availability, favors a D1 receptor-
dominated state that promotes stability of information;
whereas the high-activity Val allele, which is associated with
low dopamine availability, favors a D2 receptor-dominated
state that promotes fast updating of information and im-
proves cognitive flexibility (Bilder, Volavka, Lachman,&Grace,
2004; Cools, 2016; Durstewitz & Seamans, 2008; Winterer &
Weinberger, 2004).
The trade-off between cognitive stability and cognitive
flexibility involves a delicate balance between PFC and striatal
dopamine signaling (Cools, 2016; Cools & D'Esposito, 2011;
Fallon et al., 2013). Our results suggest that TSD disrupts this
balance, especially in carriers of the Val allele. Expressed in
terms of the inverted-U relationship between PFC-mediated
cognition and dopaminergic tone (Cools & D'Esposito, 2011;Cools & Robbins, 2004; Fallon et al., 2013), it appears that
under conditions of TSD, the dopaminergic tone associated
with the Val allele is no longer beneficial to cognitive flexi-
bility, and the Met allele now promotes optimal dopaminergic
tone for adaptive decision making.
5. Conclusion
Building on the earlier observation that TSD profoundly im-
pairs the ability of subjects to effectively acquire information
and adapt to changes in that information based on feedback
(Whitney et al., 2015), we found that subjects vary substan-
tially in their vulnerability to this effect based on COMT
Val158Met genotype. This finding is consistent with the idea
that altered dopaminergic signaling in fronto-striatal circuits
mediating cognitive control may be part of the mechanisms
underlying substantial impairment in adaptive decision
making during TSD.
The ability to adapt to changes in situational demands are
critical in operational settings, especially in safety-sensitive in-
dustrieswhere sleep loss is pervasive. Because the ancestralVal
allele is common in the general population (46.9% worldwide;
Cross, Ivacic, Stefanski, & McCarty, 2010), the real-world impli-
cations of the vulnerability it confers to adaptive decision
making impairmentdue tosleep lossarepotentially substantial.
Acknowledgments
We gratefully acknowledge the contributions of Matthew
Layton, Gregory Belenky, Melinda Jackson, and the staff of the
Human Sleep and Cognition Laboratory in the Sleep and Per-
formance Research Center at Washington State University
Spokane. This research was supported by NIH grant
R21CA167691 to John Hinson (study 1), NIH grant R01HL105768
to Melinda Jackson (study 2), and FAA grant DTFAAC-11-A-
00003 and an Elliot D. Weitzman, M.D. Research Grant from
the Sleep Research Society Foundation to Hans Van Dongen
(study 2 and genotyping, respectively). The analyses pre-
sented here were supported by the Office of the Assistant
Secretary of Defense for Health Affairs, through the Peer
Reviewed Medical Research Program under award no.
W81XWH-16-1-0319. Opinions, interpretations, conclusions
and recommendations are those of the authors and are not
necessarily endorsed by the Department of Defense.
Supplementary data
Supplementary data related to this article can be found at
https://doi.org/10.1016/j.cortex.2017.11.012.

c o r t e x 9 9 ( 2 0 1 8 ) 1 7 9e1 8 6 185
r e f e r e n c e s
Bilder, R. M., Volavka, J., Lachman, H. M., & Grace, A. A. (2004). Thecatechol-O-methyltransferase polymorphism: Relations to thetonic-phasic dopamine hypothesis and neuropsychiatricphenotypes. Neuropsychopharmacology, 29(11), 1943e1961.https://doi.org/10.1038/sj.npp.1300542yr1300542.
Bodenmann, S., Hohoff, C., Freitag, C., Deckert, J., R�etey, J. V.,Bachmann, V., et al. (2012). Polymorphisms of ADORA2Amodulate psychomotor vigilance and the effects of caffeine onneurobehavioral performance and sleep EEG after sleepdeprivation. British Journal of Pharmacology, 165(6), 1904e1913.https://doi.org/10.1111/j.1476-5381.2011.01689.x.
Botvinick, M., & Braver, T. S. (2015). Motivation and cognitivecontrol: From behavior to neural mechanism. Annual Review ofPsychology, 66, 83e113. https://doi.org/10.1146/annurev-psych-010814-015044.
Braver, T. S. (2012). The variable nature of cognitive control: Adual mechanisms framework. Trends in Cognitive Sciences, 16(2),106e113. https://doi.org/10.1016/j.tics.2011.12.010.
Chavali, V. P., Riedy, S. M., & Van Dongen, H. P. A. (2017). Signal-to-noise ratio in PVT performance as a cognitive measure ofthe effect of sleep deprivation on the fidelity of informationprocessing. Sleep, 40(3), zsx016. https://doi.org/10.1093/sleep/zsx016.
Chen, J., Lipska, B. K., Halim, N., Ma, Q. D., Matsumoto, M.,Melhem, S., et al. (2004). Functional analysis of geneticvariation in catechol-O-methyltransferase (COMT): Effects onmRNA, protein, and enzyme activity in postmortem humanbrain. American Journal of Human Genetics, 75(5), 807e821.https://doi.org/10.1086/425589.
Cole, M. W., & Schneider, W. (2007). The cognitive controlnetwork: Integrated cortical regions with dissociablefunctions. NeuroImage, 37, 343e360. https://doi.org/10.1016/j.neuroimage.2007.03.071.
Cools, R. (2016). The costs and benefits of brain dopamine forcognitive control. WIREs Cognitive Science, 7, 317e329. https://doi.org/10.1002/wcs.1401.
Cools, R., Barker, R. A., Sahakian, B. J., & Robbins, T. W. (2001).Mechanisms of cognitive set flexibility in Parkinson's disease.Brain, 124, 2503e2512. https://doi.org/10.1093/brain/124.12.2503.
Cools, R., & D'Esposito, M. (2011). Inverted-U shaped dopamineactions on human working memory and cognitive control.Biological Psychiatry, 69(12), e113ee125. https://doi.org/10.1016/j.biopsych.2011.03.028.
Cools, R., & Robbins, T. W. (2004). Chemistry of the adaptive mind.Philosophical Transactions of the Royal Society A Mathematical,Physical, and Engineering Sciences, 362(1825), 2871e2888. https://doi.org/10.1098/rsta.2004.1468.
Cross, D. S., Ivacic, L. C., Stefanski, E. L., & McCarty, C. A. (2010).Population based allele frequencies of disease associatedpolymorphisms in the Personalized Medicine ResearchProject. BMC Genetics, 11, 51e65. https://doi.org/10.1186/1471-2156-11-51.
Dickinson, D., & Elvevag, B. (2009). Genes, cognition and brainthrough a COMT lens. Neuroscience, 164, 72e87. https://doi.org/10.1016/j.neuroscience.2009.05.014.
Doran, S. M., Van Dongen, H. P. A., & Dinges, D. F. (2001).Sustained attention performance during sleep deprivation:Evidence of state instability. Archives Italiennes de Biologie,139(3), 253e267.
Durstewitz, D., & Seamans, J. K. (2008). The dual-state theory ofprefrontal cortex dopamine function with relevance tocatechol-O-methyltransferase genotypes and schizophrenia.Biological Psychiatry, 64(9), 739e749. https://doi.org/10.1016/j.biopsych.2008.05.015.
Fallon, S. J., Williams-Gray, C. H., Barker, R. A., Owen, A. M., &Hampshire, A. (2013). Prefrontal dopamine levels determinethe balance between cognitive stability and flexibility. CerebralCortex, 23(2), 361e369. https://doi.org/10.1093/cercor/bhs025.
Fellows, L. K. (2007). The role of orbitofrontal cortex in decisionmaking: A component process account. Annals of the New YorkAcademy of Sciences, 1121(1), 421e430. https://doi.org/10.1196/annals.1401.023.
Floresco, S. B., Zhang, Y., & Enomoto, T. (2009). Neural circuitssubserving behavioral flexibility and their relevance toschizophrenia. Behavioural Brain Research, 204(2), 396e409.https://doi.org/10.1016/j.bbr.2008.12.001.
Frank, M. J., & Claus, E. D. (2006). Anatomy of a decision: Striato-orbitofrontal interactions in reinforcement learning, decisionmaking, and reversal. Psychological Review, 113(2), 300e326.https://doi.org/10.1037/0033-295X.113.2.300.
Goel, N., Banks, S., Ling, L., Mignot, E., & Dinges, D. F. (2011).Catechol-O-methyltransferase Val158Met polymorphismassociates with individual differences in sleep physiologicresponse to chronic sleep loss. PLoS One, 6(12), e29283. https://doi.org/10.1371/journal.pone.0029283.
Ihne, J., Gallagher, N. M., Sullivan, M., Callicot, J. H., & Green, A. E.(2016). Is less really more: Does prefrontal efficiency genotypeactually confer better performance when working memorybecomes difficult? Cortex, 74, 79e95. https://doi.org/10.1016/j.cortex.2015.10.025.
Izquierdo, A., Brigman, J. L., Radke, A. K., Rudebeck, P. H., &Holmes, A. (2017). The neural basis of reversal learning: Anupdated perspective. Neuroscience, 345, 12e26. https://doi.org/10.1016/j.neuroscience.2016.03.021.
Jackson, M. L., Gunzelmann, G., Whitney, P., Hinson, J. M.,Belenky, G., Rabat, A., et al. (2013). Deconstructing andreconstructing cognitive performance in sleep deprivation.Sleep Medicine Reviews, 17(3), 215e225. https://doi.org/10.1016/j.smrv.2012.06.007.
Jaspar, M., Genon, S., Muto, V., Meyer, C., Manard, M.,Dideberg, V., et al. (2013). Modulating effect of COMT genotypeon the brain regions underlying proactive control processduring inhibition. Cortex, 50, 148e161. https://doi.org/10.1016/j.cortex.2013.06.003.
Jawinski, P., Tegelkamp, S., Sander, C., Hantzsch, M., Huang, J.,Mauche, N., et al. (2016). Time to wake up: No impact of COMTVal158Met gene variation on circadian preferences, arousalregulation and sleep. Chronobiology International, 33(7), 1e13.https://doi.org/10.1080/07420528.2016.1178275.
Killgore, W. D. S. (2010). Effects of sleep deprivation on cognition.Progress in Brain Research, 185, 105e129. https://doi.org/10.1016/B978-0-444-53702-7.00007-5.
Klanker, M., Feenstra, M., Denys, D., Lo, C., & Tsing, N. (2013).Dopaminergic control of cognitive flexibility in humans andanimals. Frontiers in Neuroscience, 7, 201. https://doi.org/10.3389/fnins.2013.00201.
Lachman, H. M., Papolos, D. F., Saito, T., Yu, Y.-M.,Szumlanski, C. L., & Weinshilboum, R. M. (1996). Humancatechol-O-methyltransferase pharmacogenetics: Descriptionof a functional polymorphism and its potential application toneuropsychiatric disorders. Pharmacogenetics, 6(3), 243e250.https://doi.org/10.1097/00008571-199606000-00007.
Lim, J., & Dinges, D. F. (2008). Sleep deprivation and vigilantattention. Annals of the New York Academy of Sciences, 1129,305e322. https://doi.org/10.1196/annals.1417.002.
Lim, J., & Dinges, D. F. (2010). A meta-analysis of the impact ofshort-term sleep deprivation on cognitive variables.Psychological Bulletin, 136(3), 375e389. https://doi.org/10.1037/a0018883.
Mione, V., Canterini, S., Brunamonti, E., Pani, P., Donno, F.,Fiorenza, M. T., et al. (2015). Both the COMT Val158Met single-nucleotide polymorphism and sex-dependent differences

c o r t e x 9 9 ( 2 0 1 8 ) 1 7 9e1 8 6186
influence response inhibition. Frontiers in BehavioralNeuroscience, 9, 127.
Nieratschker, V., Kiefer, C., Giel, K., Kruger, R., & Plewnia, C.(2015). The COMT Val/Met polymorphism modulates effects oftDCS on response inhibition. Brain Stimulation, 8, 283e288.https://doi.org/10.1016/j.brs.2014.11.009.
R�etey, J. V., Adam, M., Gottselig, J. M., Khatami, R., Durr, R.,Achermann, P., et al. (2006). Adenosinergic mechanismscontribute to individual differences in sleep deprivation-induced changes in neurobehavioral function and brainrhythmic activity. Journal of Neuroscience, 26(41), 10472e10479.https://doi.org/10.1523/jneurosci.1538-06.2006.
Satterfield, B. C., Wisor, J. P., Field, S. A., Schmidt, M. A., & VanDongen, H. P. A. (2015). TNFa G308A polymorphism isassociated with resilience to sleep deprivation-inducedpsychomotor vigilance performance impairment in healthyyoung adults. Brain, Behavior, and Immunity, 47, 66e74. https://doi.org/10.1016/j.bbi.2014.12.009.
Savitz, J., Solms, M., & Ramesar, R. (2006). The molecular geneticsof cognition: Dopamine, COMT and BDNF. Genes, Brain andBehavior, 5(4), 311e328. https://doi.org/10.1111/j.1601-183X.2005.00163.x.
Stanislaw, H., & Todorov, N. (1999). Calculation of signal detectiontheory measures. Behavior Research Methods, Instruments, &Computers, 31(1), 137e149. https://doi.org/10.3758/BF03207704.
Tucker, A. M., Whitney, P., Belenky, G., Hinson, J. M., & VanDongen, H. P. A. (2010). Effects of sleep deprivation ondissociated components of executive functioning. Sleep, 33(1),47e57. https://doi.org/10.1093/sleep/33.1.47.
Tunbridge, E. M., Harrison, P. J., & Weinberger, D. R. (2006).Catechol-O-methyltransferase, cognition, and psychosis:Val158Met and beyond. Biological Psychiatry, 60(2), 141e151.https://doi.org/10.1016/j.biopsych.2005.10.024.
Valomon, A., Holst, S. C., Bachmann, V., Viola, A. U., Schmidt, C.,Zurcher, J., et al. (2014). Genetic polymorphisms of DAT1 andCOMT differentially associate with actigraphy-derivedsleepewake cycles in young adults. Chronobiology International,31(5), 705e714. https://doi.org/10.3109/07420528.2014.896376.
Van Dongen, H. P. A., Baynard, M. D., Maislin, G., & Dinges, D. F.(2004). Systematic interindividual differences inneurobehavioral impairment from sleep loss: Evidence oftrait-like differential vulnerability. Sleep, 27(3), 423e433.https://doi.org/10.1093/sleep/27.3.423.
Van Dongen, H. P. A., Belenky, G., & Krueger, J. M. (2011). A local,bottom-up perspective on sleep deprivation andneurobehavioral performance. Current Topics in MedicinalChemistry, 11, 2414e2422. https://doi.org/10.2174/156802611797470286.
Van Dongen, H. P. A., Bender, A. M., & Dinges, D. F. (2012).Systematic individual differences in sleep homeostatic andcircadian rhythm contributions to neurobehavioralimpairment during sleep deprivation. Accident Analysis andPrevention, 45S, 11e16. https://doi.org/10.1016/j.aap.2011.09.018.
Viola, A. U., Archer, S. N., James, L. M., Groeger, J. A., Lo, J. C. Y.,Skene, D. J., et al. (2007). PER3 polymorphism predicts sleepstructure and waking performance. Current Biology, 17(7),603e618. https://doi.org/10.1016/j.cub.2007.01.073.
Waltz, J. A. (2017). The neural underpinnings of cognitiveflexibility and their disruption in psychotic illness.Neuroscience, 345, 203e217. https://doi.org/10.1016/j.neuroscience.2016.06.005.
Weinshilboum, R. M., Otterness, D. M., & Szumlanski, C. L. (1999).Methylation pharmacogenetics: Catechol-O-methyltransferase, thiopurine methyltransferase, andhistamine N-methyltransferase. Annual Review of Pharmacologyand Toxicology, 39, 19e52. https://doi.org/10.1146/annurev.pharmtox.39.1.19.
Whitney, P., Hinson, J. M., Jackson, M. L., & Van Dongen, H. P. A.(2015). Feedback blunting: Total sleep deprivation impairsdecision making that requires updating based on feedback.Sleep, 38(5), 745e754. https://doi.org/10.5665/sleep.4668.
Winterer, G., & Weinberger, D. R. (2004). Genes, dopamine andcortical signal-to-noise ratio in schizophrenia. Trends inNeurosciences, 27(11), 683e690. https://doi.org/10.1016/j.tins.2004.08.002.
SUPPLEMENTAL MATERIAL
Catechol-O-Methyltransferase (COMT) Genotype Affects Cognitive Control during Total
Sleep Deprivation
Brieann C. Satterfield, PhD, John M. Hinson, PhD, Paul Whitney, PhD,
Michelle A. Schmidt, MS, Jonathan P. Wisor, PhD, Hans P.A. Van Dongen, PhD
S1. Subject Screening
Subjects eligible to participate in the study met the following criteria: age 22–40 y;
physically and psychologically healthy; no sleep or circadian disorders; no current or past
relevant history of psychiatric illness; no current drug or medical treatment (except hormonal
contraceptives); no significant abnormalities in blood or urine; no history of moderate to severe
brain injury; no history of learning disability; not a current smoker or tobacco user; no history of
drug or alcohol abuse in the last year and no history of methamphetamine abuse; free of traces of
drugs and alcohol; not pregnant; no previous adverse reactions to sleep deprivation; not vision
impaired (unless corrected to normal); proficient English speaker; no travel across time zones
one month prior to study participation; and no shift work three months prior to study
participation. Study 2 included intravenous (IV) blood draws and performance testing on an
auditory task and on a high-fidelity driving simulator, which required the following additional
eligibility criteria: suitable veins for IV insertion; no history of blood draw complications; no
blood donation within 2 months prior to study participation; no plans to donate blood within 2
2
months after study completion; not hearing impaired (unless corrected to normal); in possession
of valid driver’s license; and not susceptible to simulator adaptation syndrome.
Subjects reported to wake up between 06:00 and 09:00 regularly and to have habitual
sleep durations between 6 and 10 h per night. Menstrual cycle phase in female subjects, which is
potentially relevant for dopamine-dependent cognitive processes as they may be modulated by
estrogen levels (Jacobs & D’Esposito, 2011), was not assessed. However, after study completion,
female subjects reported whether or not menstruation had occurred during study participation.
In the week prior to the in-laboratory experiment, subjects were instructed to keep their
habitual bed and wake times. This was verified with wrist actigraphy (Actiwatch-2, Phillips
Respironics, Bend, OR), sleep diary, and subjects calling in their bed and wake times on a time-
stamped voice-mail box. During this period subjects were to refrain from napping and abstain
from caffeine, tobacco, alcohol, and drugs. Prior to admission to the laboratory, subjects were
confirmed to be free of drugs and alcohol via urinalysis and breathalyzer test.
S2. Laboratory Conditions
Both studies were conducted in a strictly controlled laboratory environment, with up to
four subjects participating at one time. Subjects were each assigned their own bedroom for
sleeping and performance testing. Light levels were fixed below 100 lux during scheduled
wakefulness; lights were off during scheduled sleep periods. The ambient temperature was
maintained at 21 ± 1 °C at all times. Subjects were not allowed to perform any strenuous activity
during the study. They were isolated from the outside environment – they did not have any
contact with individuals outside the laboratory and did not have access to live radio or television.
Additionally, subjects did not have access to phones, personal computers, the internet, or video
3
games. Between scheduled times for sleep, meals, and performance testing, subjects could watch
DVDs, play board or card games, and interact with other subjects and the research staff. Subjects
were continuously monitored by trained research assistants.
S3. Psychomotor Vigilance Test
The psychomotor vigilance test (PVT) is a standard measure of vigilant attention with
high sensitivity to sleep deprivation (Lim & Dinges, 2008). A 10 min PVT was administered
every 2–4 h over the course of the TSD period. During the task, subjects were asked to respond
to a visual stimulus (a millisecond counter) as quickly as possibly by pressing a button on a
response box, while avoiding false starts. The stimulus appeared on the screen at intervals that
varied randomly between 2 and 10 s. Vigilant attention impairment was quantified as the number
of attentional lapses (response times ≥ 500 ms) in each 10 min test bout. Here, we focused on the
PVT test bouts immediately preceding each administration of the GNGr task. For study 1, this
was at 13:00 on days 2 and 3. For study 2, this was at 15:00 on days 3 and 5. Due to equipment
failure, one subject in study 2 was missing the PVT test bout during SD.
Analogous to the analyses performed for the GNGr task, the number of lapses on the
PVT was analyzed using mixed-effects ANOVA with fixed effects of session (test bout) and
session by condition interaction. In addition, fixed effects were included for COMT genotype
(Met/Met, Val/Met, Val/Val), alone and in interaction with the other fixed effects (cf. Table S1).
Study number was included as a covariate, and a random effect over subjects was placed on the
intercept. The statistical outcome of interest was the interaction between condition and COMT
genotype.
Fig. S4 shows attentional lapses on the PVT, on the test bouts immediately prior to the
GNGr administrations, as a function of genotype. During baseline (session 1), PVT performance
4
was similar for all subjects, regardless of genotype. During SD or well-rested control (session 2),
subjects in the SD condition had significantly more PVT lapses (F1,59=53.80, P<0.001). There
was also a significant interaction between COMT genotype and condition (F2,59=7.77, P=0.001).
Unlike GNGr performance, subjects homozygous for the Val allele were not the group most
vulnerable to TSD. Rather, heterozygous subjects (Val/Met) exhibited markedly more PVT
lapses compared to the homozygous groups (Met/Met and Val/Val). This result implies that the
impact of COMT genotype on the effect of GNGr performance during TSD was not mediated by
COMT’s effect on vigilant attention.
S4. Genotyping
Subjects’ whole blood samples were red-cell depleted, during which time genomic DNA
(gDNA) was extracted. The gDNA samples were assayed for the Val158Met SNP of the COMT
gene (rs4680, chromosome 22). The Taqman Drug Metabolism Assay (Assay ID:
C__25746809_50; ThermoFisher Scientific, Waltham, MA) was used to determine COMT
genotype. Real-time PCR procedures were performed per manufacturer protocol using
VIC/FAM context sequence
CCAGCGGATGGTGGATTTCGCTGGC[A/G]GAAGGACAAGGTGTGCATGCCTGA. Wet
DNA was used in a 96-well plate with a final reaction volume of 25 µl. Samples were assayed in
duplicate. All plates included a no-DNA negative control. Allelic discrimination analysis was
performed using MJ Opticon Monitor Analysis Software v3.1 (Bio-Rad Laboratories, Hercules,
CA).

5
References
Jacobs E. and D’Esposito M., Estrogen shapes dopamine-dependent cognitive processes:
Implications for women’s health, Journal of Neuroscience 31 (14), 2011, 5286–5293,
http://doi.org/10.1523/jneurosci.6394-10.2011.
Lim J. and Dinges D.F., Sleep deprivation and vigilant attention. Annals of the New York
Academy of Sciences 1129, 2008, 305–322, http://doi.org/10.1196/annals.1417.002.
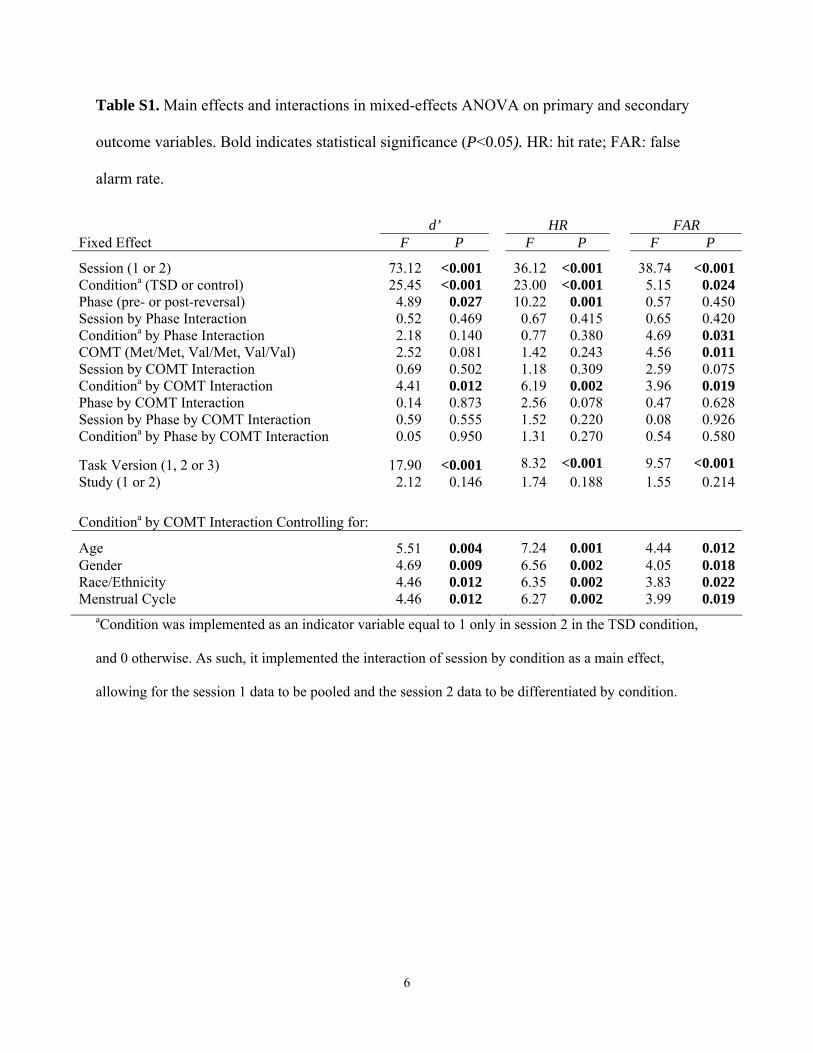
6
Table S1. Main effects and interactions in mixed-effects ANOVA on primary and secondary
outcome variables. Bold indicates statistical significance (P<0.05). HR: hit rate; FAR: false
alarm rate.
d’ HR FAR Fixed Effect F P F P F P
Session (1 or 2) 73.12 <0.001 36.12 <0.001 38.74 <0.001Conditiona (TSD or control) 25.45 <0.001 23.00 <0.001 5.15 0.024Phase (pre- or post-reversal) 4.89 0.027 10.22 0.001 0.57 0.450Session by Phase Interaction 0.52 0.469 0.67 0.415 0.65 0.420Conditiona by Phase Interaction 2.18 0.140 0.77 0.380 4.69 0.031COMT (Met/Met, Val/Met, Val/Val) 2.52 0.081 1.42 0.243 4.56 0.011Session by COMT Interaction 0.69 0.502 1.18 0.309 2.59 0.075Conditiona by COMT Interaction 4.41 0.012 6.19 0.002 3.96 0.019Phase by COMT Interaction 0.14 0.873 2.56 0.078 0.47 0.628Session by Phase by COMT Interaction 0.59 0.555 1.52 0.220 0.08 0.926Conditiona by Phase by COMT Interaction 0.05 0.950 1.31 0.270 0.54 0.580
Task Version (1, 2 or 3) 17.90 <0.001 8.32 <0.001 9.57 <0.001Study (1 or 2) 2.12 0.146 1.74 0.188 1.55 0.214
Conditiona by COMT Interaction Controlling for:
Age 5.51 0.004 7.24 0.001 4.44 0.012Gender 4.69 0.009 6.56 0.002 4.05 0.018Race/Ethnicity 4.46 0.012 6.35 0.002 3.83 0.022Menstrual Cycle 4.46 0.012 6.27 0.002 3.99 0.019
aCondition was implemented as an indicator variable equal to 1 only in session 2 in the TSD condition,
and 0 otherwise. As such, it implemented the interaction of session by condition as a main effect,
allowing for the session 1 data to be pooled and the session 2 data to be differentiated by condition.
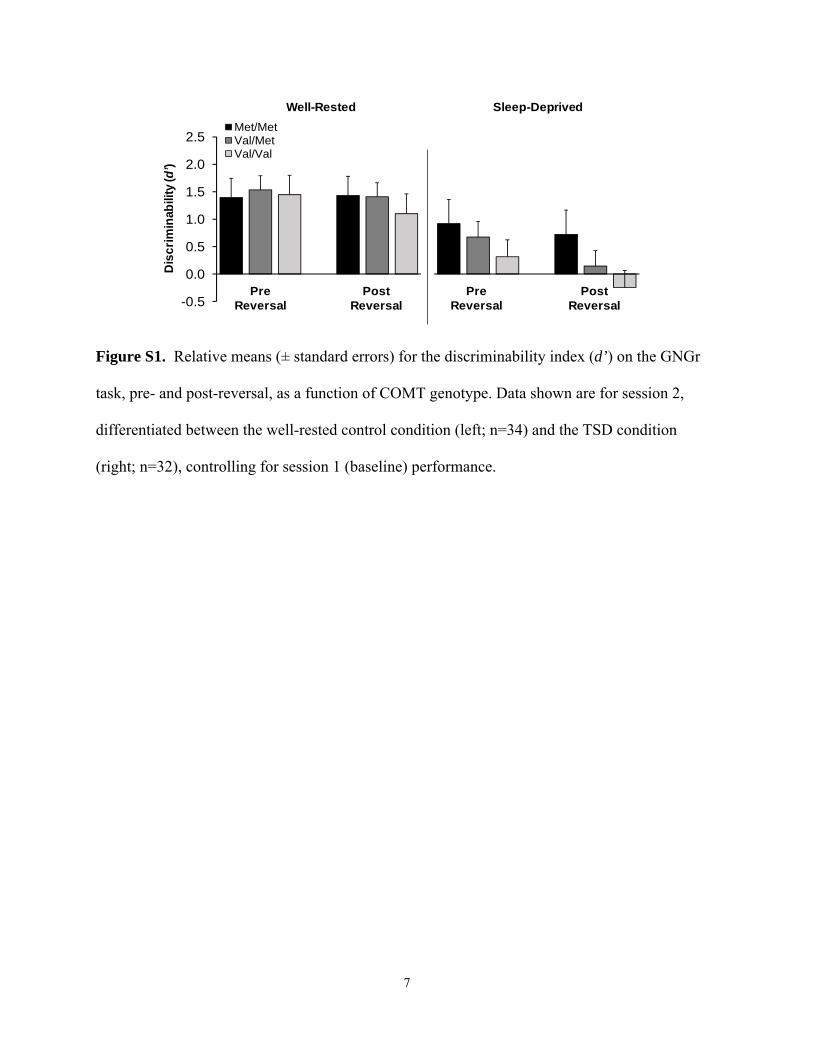
7
-0.5
0.0
0.5
1.0
1.5
2.0
2.5
Dis
crim
inab
ility
(d'
)D
isc
rim
inab
ility
(d’)
Well-Rested Sleep-Deprived
PreReversal
PostReversal
Met/MetVal/MetVal/Val
PostReversal
PreReversal
Figure S1. Relative means (± standard errors) for the discriminability index (d’) on the GNGr
task, pre- and post-reversal, as a function of COMT genotype. Data shown are for session 2,
differentiated between the well-rested control condition (left; n=34) and the TSD condition
(right; n=32), controlling for session 1 (baseline) performance.
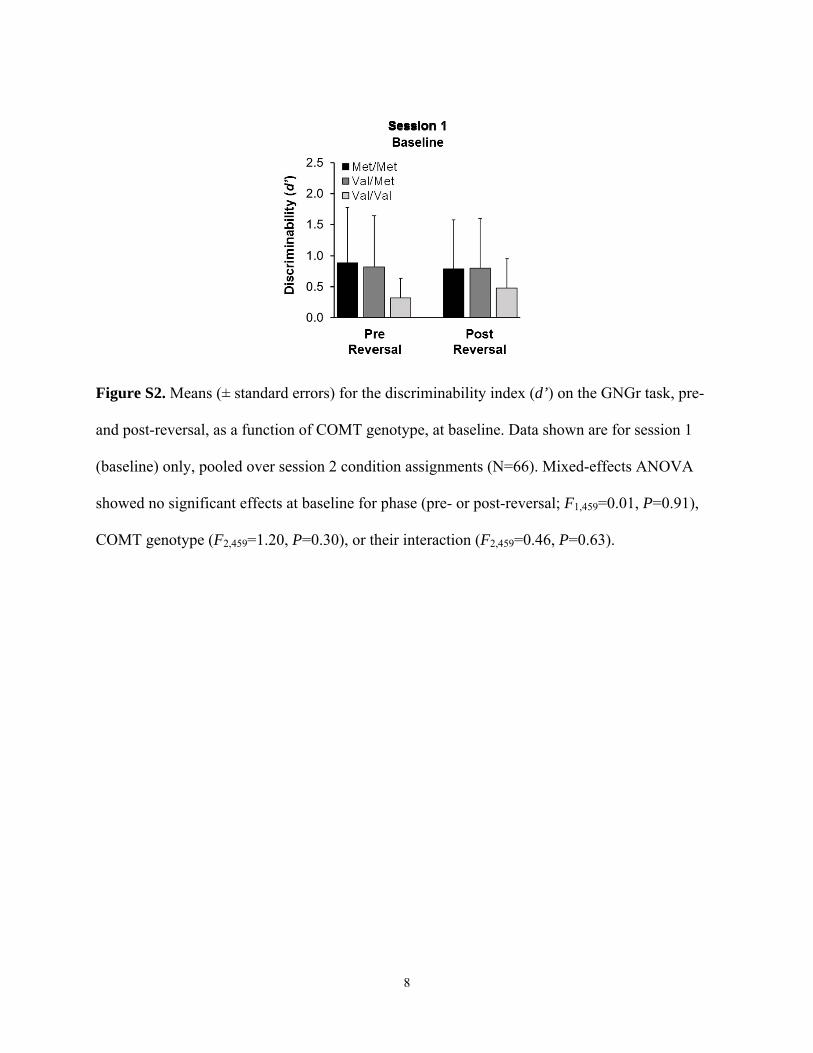
8
Figure S2. Means (± standard errors) for the discriminability index (d’) on the GNGr task, pre-
and post-reversal, as a function of COMT genotype, at baseline. Data shown are for session 1
(baseline) only, pooled over session 2 condition assignments (N=66). Mixed-effects ANOVA
showed no significant effects at baseline for phase (pre- or post-reversal; F1,459=0.01, P=0.91),
COMT genotype (F2,459=1.20, P=0.30), or their interaction (F2,459=0.46, P=0.63).

9
0.0
0.2
0.4
0.6
0.8
1.0
1 2 3 4 1 2 3 4
Fra
ctio
n o
f H
its/F
als
e A
larm
s
Trial Block
0.0
0.2
0.4
0.6
0.8
1.0
1 2 3 4 1 2 3 4
Fra
ctio
n o
f H
its/F
als
e A
larm
s
Trial Block
Re
ve
rsa
l
Trial Block
Re
ve
rsa
l
Fra
cti
on
of H
its
/Fa
lse
Ala
rms
Sleep-DeprivedWell-Rested
Trial Block
Met/MetVal/MetVal/Val
Figure S3. Means (± standard errors) for hit rates (solid lines) and false alarm rates (dashed
lines) for each trial block of the GNGr task, before (pre-) and after (post-) reversal of the
stimulus-response relationships in session 2. For the well-rested controls (left), before the
reversal, hits increased and false alarms decreased across trial blocks, regardless of genotype.
After the reversal, there was a transient decrease in hits and increase in false alarms; however,
subjects quickly recover. For the TSD group (right), before the reversal, hits increased and false
alarms decreased across trials more slowly than for the controls. After the reversal, there was a
decrease in hits and an increase in false alarms, from which subjects in the TSD group did not
recover. The effects of TSD were particularly pronounced in subjects homozygous for the Val
allele, who no longer managed to exceed chance performance after the reversal.
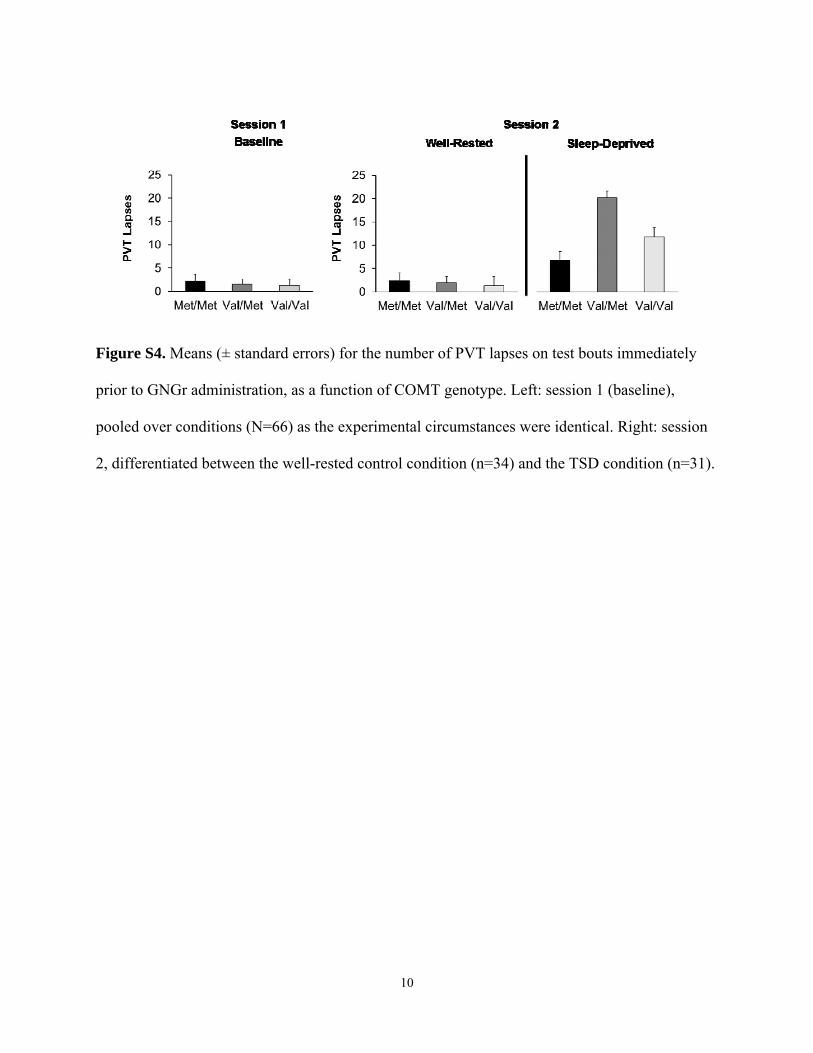
10
Figure S4. Means (± standard errors) for the number of PVT lapses on test bouts immediately
prior to GNGr administration, as a function of COMT genotype. Left: session 1 (baseline),
pooled over conditions (N=66) as the experimental circumstances were identical. Right: session
2, differentiated between the well-rested control condition (n=34) and the TSD condition (n=31).
CHAPTER
Unraveling the geneticunderpinnings of sleepdeprivation-inducedimpairments in humancognition
6Brieann C. Satterfielda, Benjamin Stuckyb, Hans-Peter Landoltb
Hans P.A. Van Dongenc,*aSocial, Cognitive, and Affective Neuroscience Laboratory, College of Medicine Department
of Psychiatry, University of Arizona, Tucson, AZ, United StatesbHuman Sleep Psychopharmacology Laboratory, Institute of Pharmacology and Toxicology,
University Center of Competence Sleep & Health Zurich, University of Zurich, Zurich, SwitzerlandcSleep and Performance Research Center, and Elson S. Floyd College of Medicine,
Washington State University, Spokane, WA, United States
*Corresponding author: Tel. +1-509-358-7755; Fax: +1-509-358-7810,
e-mail address: [email protected]
AbstractThe biobehavioral phenomena of sleep and cognition involve complex phenotype-genotype
associations, i.e., complex relationships between observable traits and the genetic variants that
contribute to the expression of those traits. There is a general belief that investigating such
relationships requires large sample sizes. However, sleep- and cognition-related phenotype-
genotype associations may be strengthened through carefully controlled laboratory studies
that amplify a given cognitive phenotype by perturbing the biobehavioral system through
sleep deprivation and/or pharmacogenetic interventions. Utilization of performance tasks that
dissociate cognitive processes allows for cognitive endophenotyping, that is, making precise
measurements that capture the essence of a cognitive phenotype. This enables assessment of
the genetic underpinnings of cognitive impairment due to sleep deprivation without necessar-
ily requiring large samples. Theory-driven gene selection, selective population sampling
techniques to avoid underrepresentation of rare genetic variants, and modern statistical tech-
niques informed by prior knowledge further enhance statistical power. Here we illustrate these
approaches on the basis of recent findings, supplemented with some new results, as well as a
discussion of modern regression methods for statistical analysis. Ongoing research employing
these methods is driving advancements in the understanding of the genetic underpinnings of
cognitive impairment associated with sleep loss.
Progress in Brain Research, Volume 246, ISSN 0079-6123, https://doi.org/10.1016/bs.pbr.2019.03.026
© 2019 Elsevier B.V. All rights reserved.127

KeywordsInter-individual differences, Gene polymorphisms, Gene expression, Cognitive impairment,
Sleep loss, Endophenotyping, Pharmacogenetics, Phenotype-genotype relationships
1 IntroductionEven in normal, healthy human populations, inter-individual differences in complex
biobehavioral phenomena such as sleep and cognition can be surprisingly trait-like
(Deary, 2012; Kane and Engle, 2002; Landolt, 2011; Van Dongen et al., 2005).
While this suggests profound phenotypic variability with strong genetic influence,
complex traits typically involve multitudes of genes, most of which have variants
that are too rare to contribute substantially to the population variance and/or
represent very small effect sizes (Gibson, 2012). This is a problem for phenotype-
genotype association studies, which aim to assess the relationship between the
expression of a particular behavior or trait (phenotype) and the underlying genetic
information that contributes to the manifestation of that behavior or trait (genotype).
In such studies, it is generally difficult to explain much of the observed phenotypic
variance, which has led to the conventional wisdom that phenotype-genotype
association studies require very large sample sizes to reach statistical significance
(e.g., Gottlieb et al., 2015).
Studying large samples addresses at least three critical issues:
• Rare variants. Many genetic mutations such as single nucleotide polymorphisms
(SNPs) and other genetic variants occur infrequently, such that individuals
homozygous (or even heterozygous) for these variants may be quite uncommon.
Studying large samples increases the likelihood of capturing these individuals.
• Missed associations. Genetic variants that are rare in the sample at hand and/or
that have weak influence on the biobehavioral phenomenon of interest produce
small effect sizes. Studying large samples increases statistical power to detect
them, which is especially important if adjustment of the statistical significance
level is needed when multiple genes are being considered (multiple comparisons
problem).
• Spurious findings. In the context of small effect sizes, there is considerable
potential for spurious phenotype-genotype associations when the sample size is
small, either because the sample is not sufficiently representative of the larger
population from which it is drawn (generalizability problem) or because of
random chance (replicability problem). Studying larger samples helps to
statistically mitigate these problems.
For studies of sleep and cognition, where phenotyping may require elaborate mea-
surement procedures in the laboratory and the research is usually labor-intensive,
studying large samples is a slow and costly process. Also, if there is large heteroge-
neity across the population, then studying large samples does not adequately address
128 CHAPTER 6 Genetics of sleep loss and cognitive impairment
the generalizability problem, potentially turning it into a missed associations prob-
lem instead (as the differential effects in distinct subsamples may simply cancel each
other out across the larger sample). The advent of genome-wide association studies
(GWASs) has revealed that even in studies involving very large sample sizes, the
genetic underpinnings of complex traits often remain elusive (Manolio et al.,
2009). However, with such large-scale studies, the precision of phenotyping often
suffers (e.g., Oexle, 2018).
In this paper we focus on alternative approaches to investigating phenotype-
genotype associations in sleep and cognition that do not necessarily require large
samples. Specifically, we focus on studies of the impairing effects of sleep depriva-
tion on cognitive performance, which have been shown to be highly trait-like
(Van Dongen et al., 2004a), to illustrate a number of complementary research
methods. These research methods include:
Systems perturbation: The typically small effect sizes in phenotype-genotype
associations may be increased by amplifying the expression of the phenotype
and/or the effect of the genotype. Either or both could be achieved by
perturbing the biobehavioral system through experimental intervention. Sleep
deprivation is a good example of this, representing a powerful perturbation
of sleep homeostasis with strong effects on cognitive performance and on
post-deprivation recovery sleep (e.g., Bodenmann et al., 2012). Cognitive
challenges can further amplify the effects of sleep deprivation to expose
phenotype-genotype relationships (Satterfield et al., 2017; Whitney et al., 2017).
Pharmacogenetic approaches involving pharmacological interventions on the
neurotransmitter systems underlying sleep regulation provide additional means
of perturbing the system, producing large effect sizes in phenotype observations
and manifestly revealing genotype relationships with relatively small sample
sizes (Urry and Landolt, 2015).
Theory-driven genotyping: The multiple comparisons problem of investigating
phenotype-genotype associations may be mitigated by limiting the focus on a
small number of genes of interest, selected on the basis of their a priori expected
involvement in the biobehavioral phenomenon of interest (e.g., Holst et al.,
2017). This approach is particularly powerful in the context of pharmacogenetics
(i.e., the study of drug responses in relation to genetic factors). Pharmacogenetics
provides a basis for the use of pharmacological agents to perturb systems for
which the underlying mechanisms are already partially known or suspected,
thereby providing a strong justification for a priori selection of specific target
genes (e.g., Bodenmann et al., 2009b). Theoretical considerations pertaining
to the involvement of specific genes can also be used to inform statistical
regression models used to estimate phenotype-genotype relationships
(Huang et al., 2011; Wang et al., 2013).
Selective sampling: The challenge of dealing with rare genetic variants may
be circumvented by selective sampling. That is, the risk of undersampling of
uncommon genotypes can be addressed directly by prospectively selecting
1291 Introduction
subjects from each of the different genotypes (i.e., homozygous mutant,
heterozygous, and homozygous common) of the gene of interest (e.g., Viola et al.,
2007). It could also be addressed indirectly by oversampling of portions of
the distribution of inter-individual differences in a given biobehavioral
phenomenon (e.g., Allebrandt et al., 2010). Care should be taken not to sample
exclusively from the extremes of the genotype distribution (e.g., only
homozygotes) or the phenotype distribution (e.g., only the phenotypic extremes),
as the phenotype-genotype association may be nonlinear and could be
obscured or misinterpreted this way. Although selective sampling precludes
assessment of the amount of population variance explained by a particular gene,
it can be particularly effective for studying underlying mechanisms (e.g., R�eteyet al., 2007).
Cognitive endophenotyping: Paradoxically, inter-individual differences in the
phenotypic effects of sleep deprivation on cognitive performance have been
found to be outcome-specific (e.g., Van Dongen et al., 2011a,b). Research into
this issue has revealed the importance of considering distinct components of
cognition (Jackson et al., 2013), which are differentially vulnerable to
impairment due to sleep deprivation (Honn et al., 2018). This points to the
importance of cognitive endophenotyping, by which we mean the dissociation of
phenotypic outcomes that are more neurocognitively specific than the overall
biobehavioral phenomenon (i.e., performance impairment) and may therefore
have more well-defined genetic connections. Cognitive performance tasks
designed to assess such endophenotypic outcomes or “cognitive
endophenotypes” may help to establish strong phenotype-genotype relationships
(Grant et al., 2018; Satterfield et al., 2018; Whitney et al., 2017).
Here, we illustrate these approaches to studying phenotype-genotype associations
using data from laboratory studies of the effects of sleep deprivation on cognitive
performance. We show that robust findings can be achieved with relatively small
samples by (1) using theory-driven selection of gene targets and pharmacogenetic
perturbations to amplify phenotype-genotype associations, (2) outcome-specific
endophenotyping of cognitive responses to sleep deprivation, and (3) application
of cutting-edge statistical techniques informed in part by prior knowledge.
2 Pharmacogenetics to elucidate molecular-geneticcontributions to sleep deprivation and cognitionBoth sleep and cognition can be modulated with pharmacological interventions, and
an experimental pharmacogenetic approach is a powerful tool to examine phenotype-
genotype relationships between sleep deprivation and cognition. By examining
the interactions of extended wakefulness and pharmacologically induced network
modulations at different time scales, distinct molecular-genetic mechanisms under-
lying the consequences of sleep loss on cognitive functioning can be elucidated.
130 CHAPTER 6 Genetics of sleep loss and cognitive impairment
The daily alternation between wakefulness and sleep constitutes a fundamental
temporal rhythm, which is tightly regulated by the fine-tuned interplay between
homeostatic and circadian processes (Achermann and Borb�ely, 2016). Sleep need
accumulates during wakefulness and dissipates during sleep (homeostatic process),
whereas the circadian clock determines when sleep occurs as a function of time of
day (circadian process). The interaction between the two processes determines daily
fluctuations in subjective state, mood, alertness, and cognition (Boivin et al., 1997;
Schmidt et al., 2007). Both homeostatic and circadian influences also affect brain
electrical activity in a vigilance state-specific manner. Power (energy) in the electro-
encephalogram (EEG), especially in the theta range (�4–8Hz), provides a reliablebiomarker of accumulated sleep need induced by sustained wakefulness
(Bodenmann and Landolt, 2010; Finelli et al., 2001; Holst et al., 2017).
Conscious decisions and optimal interactions with the environment require alert
wakefulness, and sleep is essential for maintaining optimal cognitive functioning.
Extended wakefulness characteristically alters long-range temporal correlations
(LRTCs) in the EEG alpha band (�8–12Hz), where overall signal power is virtuallyunchanged as a function of time awake (Holst et al., 2017; Meisel et al., 2017). The
LRTCs slowly decay over seconds and reflect cortico-cortical connectivity and
balanced cortical excitation and inhibition (E-I balance) (Meisel et al., 2017). The
maintenance of an optimal E-I balance allows brain networks to function properly,
and normal LRTCs are associated with optimal decision making and working
memory task performance.
It has been proposed that sleep deprivation disrupts information processing by
intrusions of sleep-like events into wakefulness (Doran et al., 2001; Nir et al.,
2017; Van Dongen et al., 2011a,b; Vyazovskiy et al., 2011). LRTCs decline across
prolonged wakefulness and normalize following recovery sleep, suggesting that
sleep maintains LRTCs in the human brain and reorganizes cortical networks for op-
timal cognitive functioning (Meisel et al., 2017). Genetic factors contribute up to
60% to the strength of LRTC (Linkenkaer-Hansen et al., 2007) and can be pharma-
cologically modulated (Meisel et al., 2015; Yang et al., 2012). The monitoring of
spontaneous brain activity and its modulation by pharmacological interventions in
genetically characterized individuals may establish sleep-wake dependent timescales
of information processing in cortical networks with link to cognition and reveal
biomarkers of E-I balance and cortical dynamics during prolonged wakefulness.
2.1 System perturbations with pharmacological interventionsand sleep deprivationPharmacogenetic approaches can be used to probe the causality of phenotype-
genotype associations. The use of careful behavioral phenotyping and sleep dep-
rivation opens the possibility for a closer examination of the effects of different
pharmacological interventions on neurobehavioral performance. Stimulants have
been of particular interest in the study of sleep deprivation and cognition. Stimu-
lants are unique from a pure cognitive perspective because they offer direct
1312 Pharmacogenetics to elucidate molecular-genetic contributions
manipulation of specific signaling pathways that may underlie different aspects of
cognition, and thus can offer insight into neurocognitive mechanisms that are
impacted by sleep loss. For example, caffeine’s main mode of action is adenosi-
nergic, whereas modafinil and dextroamphetamine act upon different aspects of
the dopaminergic system. Killgore et al. (2009) found that caffeine, modafinil,
and dextroamphetamine had differential effects on three executive function tasks
following 45–50h of sleep deprivation. Both modafinil and dextroamphetamine
reduced the total number of moves required to complete the Tower of London,
a task that involves planning and visuospatial working memory (Shallice,
1982), whereas caffeine was not found to be effective. Conversely, only caffeine
significantly improved performance on the Tower of Hanoi, a task that involves
planning, strategy, and response inhibition (Welsh et al., 1999). Individuals who
received modafinil had significantly better performance on the Wisconsin Card
Sorting Task (WCST), purportedly a measure of mental set-shifting (Killgore
et al., 2009; Puente, 1985), although the WCST is complex and known to recruit
several neurocognitive systems (Berman et al., 1995).
These results suggest that different stimulants may have different effects on var-
ious aspects of executive function, allowing a better understanding of the underlying
cognitive processes based on the pharmacological effects of each (Killgore et al.,
2009). In a follow-up study, none of the stimulants were found to significantly
improve decision-making performance on the Iowa Gambling Task (Killgore
et al., 2012). Similarly, Wesensten et al. (2005) found little effect of stimulants
on a range of executive function tasks. Lack of significant findings may be contri-
butable to the “task impurity” problem that any performance task involves a number
of interrelated cognitive processes, which must be distinguished to understand the
causal factors determining performance in any given circumstance (Whitney and
Hinson, 2010). This highlights the importance of employing neurocognitive assess-
ment batteries that offer distinct, and dissociable, measures of cognitive functioning,
as will be discussed later.
2.2 Theory-driven selection of gene targets: Proof of conceptA pharmacogenetic approach has been successfully applied to deconstruct a role for a
distinct adenosine receptor subtype and adenosinergic-dopaminergic mechanisms in
regulating cerebral activity and neurobehavioral performance during sleep depriva-
tion. Consistent with a long-proposed role for adenosine and its binding sites in
sleep-wake regulation (Porkka-Heiskanen et al., 1997; Radulovacki, 2005), caffeine,
which is an adenosine antagonist, attenuates EEG markers of sleep homeostasis in
wakefulness and sleep (Landolt et al., 2004). Some individuals are very sensitive
to caffeine’s stimulant effects, whereas others are not. In part these individual
differences are genetically determined (Yang et al., 2010).
Caffeine blocks adenosine A1 and A2A receptors in the central nervous system
without preferred specificity (Lazarus et al., 2017). However, basic pharmacogenetic
work in transgenic mice demonstrated that functional A2A receptors are indispens-
able for the promotion of wakefulness by the stimulant (Huang et al., 2005).
132 CHAPTER 6 Genetics of sleep loss and cognitive impairment

Translating these insights to humans, complementary observational and laboratory
studies confirmed that common variants of the A2A receptor gene (ADORA2A) mod-
ulate the effectiveness of caffeine to counteract the consequences of sleep loss
on EEG activity and neurobehavioral performance. Table 1 summarizes a step-wise,
pharmacogenetic approach to further elucidating a role for adenosine A2A receptors
in regulating neurophysiological and neurobehavioral markers of sleep homeostasis
after sleep deprivation.
2.3 Selective sampling: Proof of conceptFirst, 20,343 university students were addressed with a brief internet questionnaire
about self-rated caffeine sensitivity and sleep, and 4329 individuals responded.
Habitual caffeine consumption was associated with subjectively reduced sleep
quality in caffeine sensitive respondents, but not in caffeine insensitive respondents
(R�etey et al., 2007). Intriguingly, in a laboratory study of 22 individuals from this
sample, a night of sleep deprivation increased frontal EEG theta activity and impaired
neurobehavioral function more in self-rated caffeine-sensitive than in caffeine-
insensitive men (R�etey et al., 2006). Double-blind administration of the stimulant
(2 times 200mg across a 12-h interval) during prolonged wakefulness confirmed
the classification of caffeine sensitivity based on the questionnaire. Thus, caffeine
counteracted the differences between the phenotypic groups, although the caffeine
concentration in saliva did not differ (R�etey et al., 2006, 2007).
The genetic sequence of ADORA2Awas not the same in caffeine sensitive versus
insensitive individuals. More specifically, the C allele of the functional c.1976T>C
SNP of ADORA2A (SNP-ID: rs5751876) appeared to be more frequent in sensitive
individuals (n¼58), whereas the T allele of this polymorphism occurred more
frequently in insensitive individuals (n¼84) (R�etey et al., 2007). By contrast, the
prevalence of the C/T genotype was the same in sensitive and insensitive subjects.
These findings were further corroborated in the laboratory (Bodenmann et al., 2012)
and confirmed by an independent GWAS (Byrne et al., 2012). Together, these find-
ings suggest an important role for A2A receptors in sleep-wake regulation and
sleep-dependent neurobehavioral performance.
Conceptually, the experimental roadmap outlined above (Table 1) highlights
the usefulness of self-classification to estimate a subjective phenotype as an initial
step in large-scale epidemiological studies, followed up by physiological studies
aimed to provide insights into the molecular bases of sleep deprivation and
cognition. Furthermore, the example of variation in caffeine sensitivity has impli-
cations for clinical studies of novel pharmacological interventions targeting A2A
receptors, such as in chronic sleep restriction (Doty et al., 2017) and insomnia
(Korkutata et al., 2018). The proof of concept presented above suggests that such
studies could yield clearer outcomes if participants were subdivided and analyzed
by their genotypes for ADORA2A and other genes of interest (Chen et al., 2013).
These genes may hint to pharmacogenetic markers of individual responses to novel
compounds and offer a unique opportunity for personalized sleep-wake medicine
(Holst et al., 2016).
1332 Pharmacogenetics to elucidate molecular-genetic contributions

Table 1 Step-wise elucidation of a role for adenosine A2A receptors and dopamine transporters in regulating neurophysiological andneurobehavioral markers of sleep homeostasis after sleep deprivation using a translational pharmacogenetic approach.
Conventionalmethod Additional methods
Samplesize Outcome(s) Genetic approach References
Basicpharmacogenetics
Perturbation Tens/experiment(mice)
Sleep-wake neurophysiology Genetic engineering Wisor et al. (2001), Hayaishiet al. (2004) and Huanget al. (2005)
Observational Theory-driven genotyping n¼94–102 Caffeine-induced anxiety N/A Alsene et al. (2003) andChilds et al. (2008)
Selective sampling n¼20,343 Sleep-wake habits, self-rated caffeine sensitivity
N/A R�etey et al. (2007)
Selective sampling n¼4329 Caffeine consumption andsleep quality in extremes ofcaffeine sensitivity
N/A R�etey et al. (2007)
Humanpharmacology
Selective sampling,perturbation, deepphenotyping, within- andbetween-subjects variance
n¼12–32 Interaction of sleepdeprivation and caffeine incaffeine sensitive andinsensitive individuals
N/A Landolt et al. (2004),Gottselig et al. (2006),R�etey et al. (2006), andLandolt et al. (2012)
Humanpharmacogenetics
Theory-driven genotyping,perturbation, deepphenotyping, within- andbetween-subjects variance
n¼22–504 Interaction of sleepdeprivation and caffeine ingenetically characterizedindividuals
ADORA2Ac.1976T>C SNPADORA2Ahaplotype DAT1VNTR
R�etey et al. (2007),Bodenmann et al. (2012),and Holst et al. (2014)
Replication,observational
n¼2402 Coffee-attributed sleepdisturbance
GWAS in twins Byrne et al. (2012)
Back-translation,pharmacologicalinnovation
Tens/experiment(mice)
Sleep-wakeneurophysiology, bodytemperature and heart ratemeasurement
N/A Korkutata et al. (2018)
Perturbation approaches include sleep deprivation and pharmacological interventions. Deep phenotyping in humans includes subjective state questionnaires combined withneurophysiology (EEG quantification in waking and sleep) and neuropsychological assessment of sustained attention and executive functioning. ADORA2A¼human gene encodingthe adenosine A2A receptor; DAT1¼human gene encoding the dopamine transporter; GWAS¼genome-wide association study; N/A¼not applicable; SNP¼single nucleotidepolymorphism; VNTR¼variable number tandem repeats.
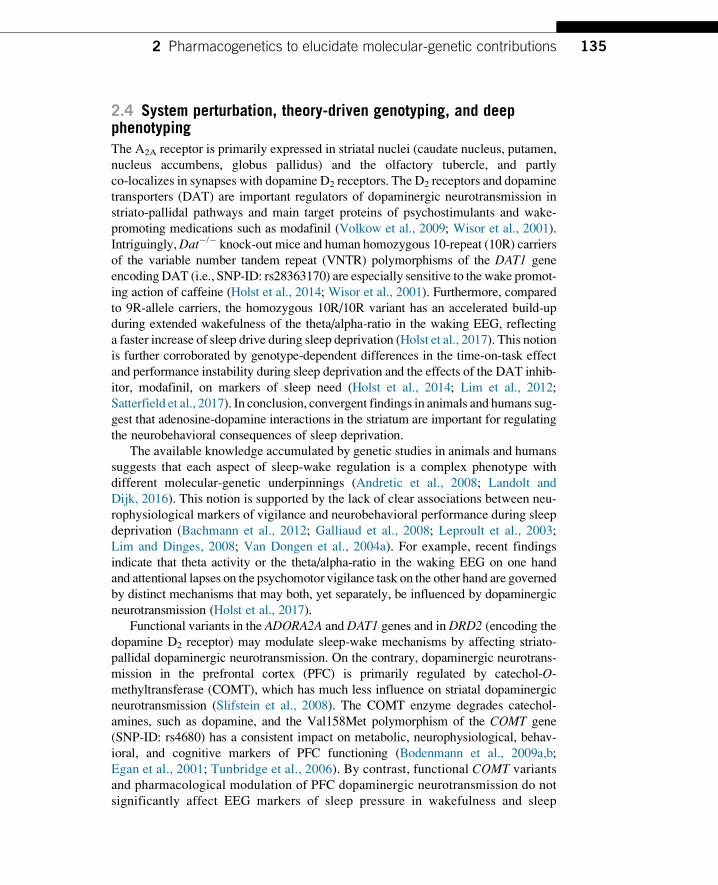
2.4 System perturbation, theory-driven genotyping, and deepphenotypingThe A2A receptor is primarily expressed in striatal nuclei (caudate nucleus, putamen,
nucleus accumbens, globus pallidus) and the olfactory tubercle, and partly
co-localizes in synapses with dopamine D2 receptors. The D2 receptors and dopamine
transporters (DAT) are important regulators of dopaminergic neurotransmission in
striato-pallidal pathways and main target proteins of psychostimulants and wake-
promoting medications such as modafinil (Volkow et al., 2009; Wisor et al., 2001).
Intriguingly,Dat�/� knock-out mice and human homozygous 10-repeat (10R) carriers
of the variable number tandem repeat (VNTR) polymorphisms of the DAT1 gene
encodingDAT (i.e., SNP-ID: rs28363170) are especially sensitive to the wake promot-
ing action of caffeine (Holst et al., 2014; Wisor et al., 2001). Furthermore, compared
to 9R-allele carriers, the homozygous 10R/10R variant has an accelerated build-up
during extended wakefulness of the theta/alpha-ratio in the waking EEG, reflecting
a faster increase of sleep drive during sleep deprivation (Holst et al., 2017). This notion
is further corroborated by genotype-dependent differences in the time-on-task effect
and performance instability during sleep deprivation and the effects of the DAT inhib-
itor, modafinil, on markers of sleep need (Holst et al., 2014; Lim et al., 2012;
Satterfield et al., 2017). In conclusion, convergent findings in animals and humans sug-
gest that adenosine-dopamine interactions in the striatum are important for regulating
the neurobehavioral consequences of sleep deprivation.
The available knowledge accumulated by genetic studies in animals and humans
suggests that each aspect of sleep-wake regulation is a complex phenotype with
different molecular-genetic underpinnings (Andretic et al., 2008; Landolt and
Dijk, 2016). This notion is supported by the lack of clear associations between neu-
rophysiological markers of vigilance and neurobehavioral performance during sleep
deprivation (Bachmann et al., 2012; Galliaud et al., 2008; Leproult et al., 2003;
Lim and Dinges, 2008; Van Dongen et al., 2004a). For example, recent findings
indicate that theta activity or the theta/alpha-ratio in the waking EEG on one hand
and attentional lapses on the psychomotor vigilance task on the other hand are governed
by distinct mechanisms that may both, yet separately, be influenced by dopaminergic
neurotransmission (Holst et al., 2017).
Functional variants in the ADORA2A and DAT1 genes and inDRD2 (encoding thedopamine D2 receptor) may modulate sleep-wake mechanisms by affecting striato-
pallidal dopaminergic neurotransmission. On the contrary, dopaminergic neurotrans-
mission in the prefrontal cortex (PFC) is primarily regulated by catechol-O-methyltransferase (COMT), which has much less influence on striatal dopaminergic
neurotransmission (Slifstein et al., 2008). The COMT enzyme degrades catechol-
amines, such as dopamine, and the Val158Met polymorphism of the COMT gene
(SNP-ID: rs4680) has a consistent impact on metabolic, neurophysiological, behav-
ioral, and cognitive markers of PFC functioning (Bodenmann et al., 2009a,b;
Egan et al., 2001; Tunbridge et al., 2006). By contrast, functional COMT variants
and pharmacological modulation of PFC dopaminergic neurotransmission do not
significantly affect EEG markers of sleep pressure in wakefulness and sleep
1352 Pharmacogenetics to elucidate molecular-genetic contributions
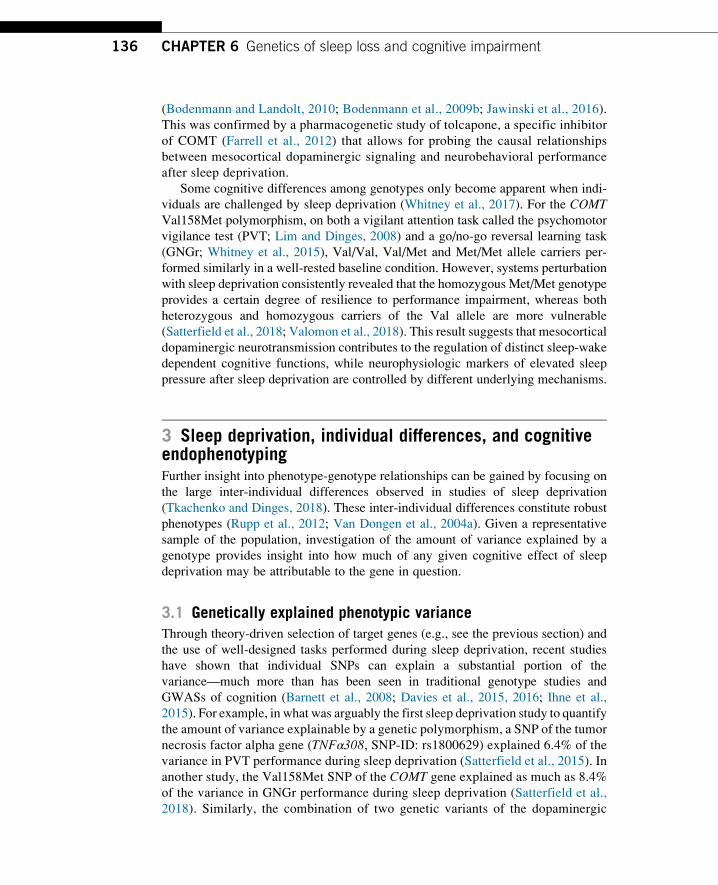
(Bodenmann and Landolt, 2010; Bodenmann et al., 2009b; Jawinski et al., 2016).
This was confirmed by a pharmacogenetic study of tolcapone, a specific inhibitor
of COMT (Farrell et al., 2012) that allows for probing the causal relationships
between mesocortical dopaminergic signaling and neurobehavioral performance
after sleep deprivation.
Some cognitive differences among genotypes only become apparent when indi-
viduals are challenged by sleep deprivation (Whitney et al., 2017). For the COMTVal158Met polymorphism, on both a vigilant attention task called the psychomotor
vigilance test (PVT; Lim and Dinges, 2008) and a go/no-go reversal learning task
(GNGr; Whitney et al., 2015), Val/Val, Val/Met and Met/Met allele carriers per-
formed similarly in a well-rested baseline condition. However, systems perturbation
with sleep deprivation consistently revealed that the homozygous Met/Met genotype
provides a certain degree of resilience to performance impairment, whereas both
heterozygous and homozygous carriers of the Val allele are more vulnerable
(Satterfield et al., 2018; Valomon et al., 2018). This result suggests that mesocortical
dopaminergic neurotransmission contributes to the regulation of distinct sleep-wake
dependent cognitive functions, while neurophysiologic markers of elevated sleep
pressure after sleep deprivation are controlled by different underlying mechanisms.
3 Sleep deprivation, individual differences, and cognitiveendophenotypingFurther insight into phenotype-genotype relationships can be gained by focusing on
the large inter-individual differences observed in studies of sleep deprivation
(Tkachenko and Dinges, 2018). These inter-individual differences constitute robust
phenotypes (Rupp et al., 2012; Van Dongen et al., 2004a). Given a representative
sample of the population, investigation of the amount of variance explained by a
genotype provides insight into how much of any given cognitive effect of sleep
deprivation may be attributable to the gene in question.
3.1 Genetically explained phenotypic varianceThrough theory-driven selection of target genes (e.g., see the previous section) and
the use of well-designed tasks performed during sleep deprivation, recent studies
have shown that individual SNPs can explain a substantial portion of the
variance—much more than has been seen in traditional genotype studies and
GWASs of cognition (Barnett et al., 2008; Davies et al., 2015, 2016; Ihne et al.,
2015). For example, in what was arguably the first sleep deprivation study to quantify
the amount of variance explainable by a genetic polymorphism, a SNP of the tumor
necrosis factor alpha gene (TNFα308, SNP-ID: rs1800629) explained 6.4% of the
variance in PVT performance during sleep deprivation (Satterfield et al., 2015). In
another study, the Val158Met SNP of the COMT gene explained as much as 8.4%
of the variance in GNGr performance during sleep deprivation (Satterfield et al.,
2018). Similarly, the combination of two genetic variants of the dopaminergic
136 CHAPTER 6 Genetics of sleep loss and cognitive impairment
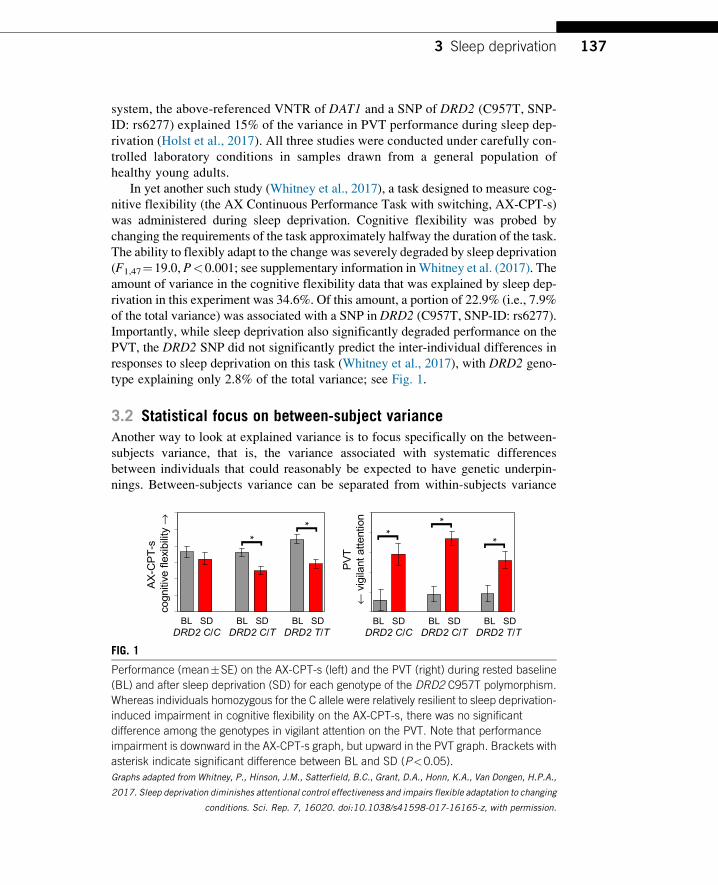
system, the above-referenced VNTR of DAT1 and a SNP of DRD2 (C957T, SNP-
ID: rs6277) explained 15% of the variance in PVT performance during sleep dep-
rivation (Holst et al., 2017). All three studies were conducted under carefully con-
trolled laboratory conditions in samples drawn from a general population of
healthy young adults.
In yet another such study (Whitney et al., 2017), a task designed to measure cog-
nitive flexibility (the AX Continuous Performance Task with switching, AX-CPT-s)
was administered during sleep deprivation. Cognitive flexibility was probed by
changing the requirements of the task approximately halfway the duration of the task.
The ability to flexibly adapt to the change was severely degraded by sleep deprivation
(F1,47¼19.0, P<0.001; see supplementary information inWhitney et al. (2017). The
amount of variance in the cognitive flexibility data that was explained by sleep dep-
rivation in this experiment was 34.6%. Of this amount, a portion of 22.9% (i.e., 7.9%
of the total variance) was associated with a SNP in DRD2 (C957T, SNP-ID: rs6277).Importantly, while sleep deprivation also significantly degraded performance on the
PVT, the DRD2 SNP did not significantly predict the inter-individual differences in
responses to sleep deprivation on this task (Whitney et al., 2017), with DRD2 geno-
type explaining only 2.8% of the total variance; see Fig. 1.
3.2 Statistical focus on between-subject varianceAnother way to look at explained variance is to focus specifically on the between-
subjects variance, that is, the variance associated with systematic differences
between individuals that could reasonably be expected to have genetic underpin-
nings. Between-subjects variance can be separated from within-subjects variance
BL SD BL SD BL SDDRD2 C/C DRD2 C/T DRD2 T/T
*[
*[
AX
-CP
T-s
co
gniti
ve fle
xibi
lity
→
BL SD BL SD BL SDDRD2 C/C DRD2 C/T DRD2 T/T
PV
T ←
vigi
lant
atte
ntio
n * [
*[*[
FIG. 1
Performance (mean�SE) on the AX-CPT-s (left) and the PVT (right) during rested baseline
(BL) and after sleep deprivation (SD) for each genotype of the DRD2 C957T polymorphism.
Whereas individuals homozygous for the C allele were relatively resilient to sleep deprivation-
induced impairment in cognitive flexibility on the AX-CPT-s, there was no significant
difference among the genotypes in vigilant attention on the PVT. Note that performance
impairment is downward in the AX-CPT-s graph, but upward in the PVT graph. Brackets with
asterisk indicate significant difference between BL and SD (P<0.05).
Graphs adapted from Whitney, P., Hinson, J.M., Satterfield, B.C., Grant, D.A., Honn, K.A., Van Dongen, H.P.A.,
2017. Sleep deprivation diminishes attentional control effectiveness and impairs flexible adaptation to changing
conditions. Sci. Rep. 7, 16020. doi:10.1038/s41598-017-16165-z, with permission.
1373 Sleep deprivation
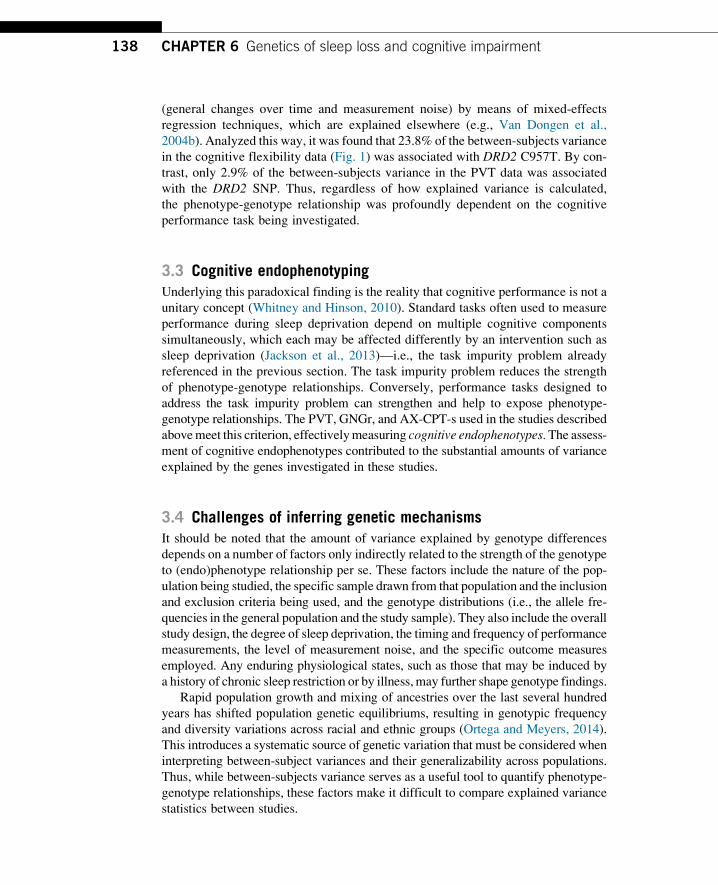
(general changes over time and measurement noise) by means of mixed-effects
regression techniques, which are explained elsewhere (e.g., Van Dongen et al.,
2004b). Analyzed this way, it was found that 23.8% of the between-subjects variance
in the cognitive flexibility data (Fig. 1) was associated with DRD2 C957T. By con-
trast, only 2.9% of the between-subjects variance in the PVT data was associated
with the DRD2 SNP. Thus, regardless of how explained variance is calculated,
the phenotype-genotype relationship was profoundly dependent on the cognitive
performance task being investigated.
3.3 Cognitive endophenotypingUnderlying this paradoxical finding is the reality that cognitive performance is not a
unitary concept (Whitney and Hinson, 2010). Standard tasks often used to measure
performance during sleep deprivation depend on multiple cognitive components
simultaneously, which each may be affected differently by an intervention such as
sleep deprivation (Jackson et al., 2013)—i.e., the task impurity problem already
referenced in the previous section. The task impurity problem reduces the strength
of phenotype-genotype relationships. Conversely, performance tasks designed to
address the task impurity problem can strengthen and help to expose phenotype-
genotype relationships. The PVT, GNGr, and AX-CPT-s used in the studies described
abovemeet this criterion, effectivelymeasuring cognitive endophenotypes.The assess-ment of cognitive endophenotypes contributed to the substantial amounts of variance
explained by the genes investigated in these studies.
3.4 Challenges of inferring genetic mechanismsIt should be noted that the amount of variance explained by genotype differences
depends on a number of factors only indirectly related to the strength of the genotype
to (endo)phenotype relationship per se. These factors include the nature of the pop-
ulation being studied, the specific sample drawn from that population and the inclusion
and exclusion criteria being used, and the genotype distributions (i.e., the allele fre-
quencies in the general population and the study sample). They also include the overall
study design, the degree of sleep deprivation, the timing and frequency of performance
measurements, the level of measurement noise, and the specific outcome measures
employed. Any enduring physiological states, such as those that may be induced by
a history of chronic sleep restriction or by illness, may further shape genotype findings.
Rapid population growth and mixing of ancestries over the last several hundred
years has shifted population genetic equilibriums, resulting in genotypic frequency
and diversity variations across racial and ethnic groups (Ortega and Meyers, 2014).
This introduces a systematic source of genetic variation that must be considered when
interpreting between-subject variances and their generalizability across populations.
Thus, while between-subjects variance serves as a useful tool to quantify phenotype-
genotype relationships, these factors make it difficult to compare explained variance
statistics between studies.
138 CHAPTER 6 Genetics of sleep loss and cognitive impairment
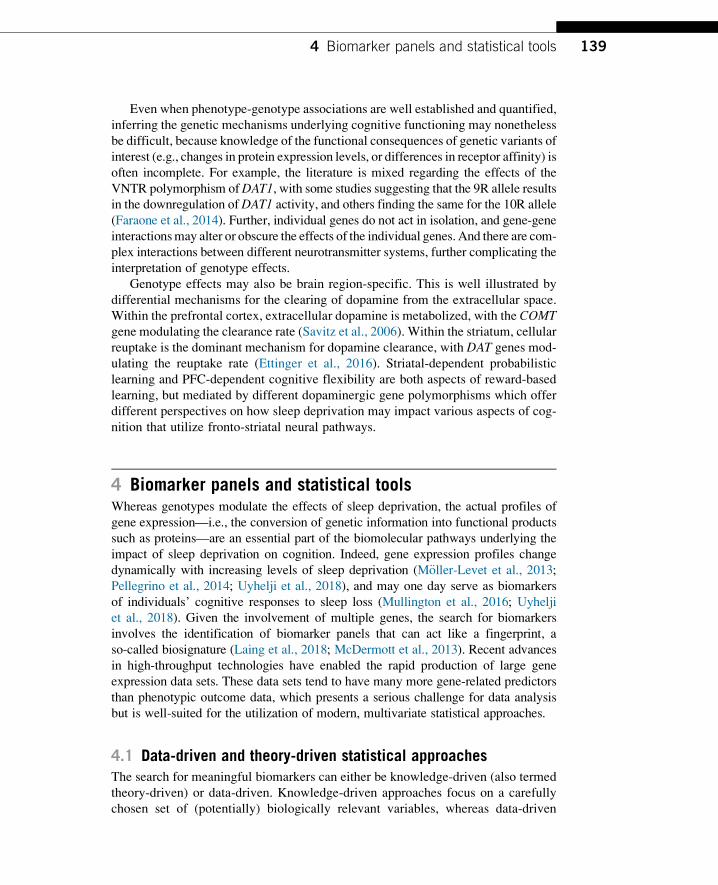
Even when phenotype-genotype associations are well established and quantified,
inferring the genetic mechanisms underlying cognitive functioning may nonetheless
be difficult, because knowledge of the functional consequences of genetic variants of
interest (e.g., changes in protein expression levels, or differences in receptor affinity) is
often incomplete. For example, the literature is mixed regarding the effects of the
VNTR polymorphism ofDAT1, with some studies suggesting that the 9R allele results
in the downregulation ofDAT1 activity, and others finding the same for the 10R allele
(Faraone et al., 2014). Further, individual genes do not act in isolation, and gene-gene
interactionsmay alter or obscure the effects of the individual genes. And there are com-
plex interactions between different neurotransmitter systems, further complicating the
interpretation of genotype effects.
Genotype effects may also be brain region-specific. This is well illustrated by
differential mechanisms for the clearing of dopamine from the extracellular space.
Within the prefrontal cortex, extracellular dopamine is metabolized, with the COMTgene modulating the clearance rate (Savitz et al., 2006). Within the striatum, cellular
reuptake is the dominant mechanism for dopamine clearance, with DAT genes mod-
ulating the reuptake rate (Ettinger et al., 2016). Striatal-dependent probabilistic
learning and PFC-dependent cognitive flexibility are both aspects of reward-based
learning, but mediated by different dopaminergic gene polymorphisms which offer
different perspectives on how sleep deprivation may impact various aspects of cog-
nition that utilize fronto-striatal neural pathways.
4 Biomarker panels and statistical toolsWhereas genotypes modulate the effects of sleep deprivation, the actual profiles of
gene expression—i.e., the conversion of genetic information into functional products
such as proteins—are an essential part of the biomolecular pathways underlying the
impact of sleep deprivation on cognition. Indeed, gene expression profiles change
dynamically with increasing levels of sleep deprivation (M€oller-Levet et al., 2013;Pellegrino et al., 2014; Uyhelji et al., 2018), and may one day serve as biomarkers
of individuals’ cognitive responses to sleep loss (Mullington et al., 2016; Uyhelji
et al., 2018). Given the involvement of multiple genes, the search for biomarkers
involves the identification of biomarker panels that can act like a fingerprint, a
so-called biosignature (Laing et al., 2018; McDermott et al., 2013). Recent advances
in high-throughput technologies have enabled the rapid production of large gene
expression data sets. These data sets tend to have many more gene-related predictors
than phenotypic outcome data, which presents a serious challenge for data analysis
but is well-suited for the utilization of modern, multivariate statistical approaches.
4.1 Data-driven and theory-driven statistical approachesThe search for meaningful biomarkers can either be knowledge-driven (also termed
theory-driven) or data-driven. Knowledge-driven approaches focus on a carefully
chosen set of (potentially) biologically relevant variables, whereas data-driven
1394 Biomarker panels and statistical tools

strategies explore patterns in the data that are not readily apparent from theory
or human reasoning. Both these approaches have advantages and disadvantages.
The theory-driven approach is often concerned with testing of an a-priori stated
hypothesis, where mitigating type I error (the probability of reporting false positive
findings) becomes important. This can be achieved by limiting the number of hypoth-
eses (e.g., by investigating only one or a small number of carefully selected genes),
and/or by applying a type I error adjustment for multiple comparisons during statistical
testing. The latter may involve adjusting the significance level of each test, such that
the Family-Wise Error Rate (FWER) is controlled. The FWER seeks to limit the prob-
ability of any false positives among a set of tests. While statistically powerful,
the theory-driven approach has a fundamental limitation, captured by the words of
Einstein (quoted in Salam et al., 1990): “It is the theory which decides what can be
observed.” In other words, this approach may miss important features of the data
set that are not in the focus of investigation.
By contrast, data-driven investigations attempt to identify the potentially inter-
esting features of the data set (Jaeger and Halliday, 1998). This approach emphasizes
controlling the type II error (the probability of failure to report true positive findings).
Strict control of type I error (like in theory-driven research) would be too restrictive
in this context, and is therefore not commonly applied in data-driven research. How-
ever, the type I error cannot be entirely neglected, as that could lead to too many false
positives in the results, rendering the data analysis uninformative. To address this
issue, alternative type I error control methods have been developed (Benjamini
and Hochberg, 1995). These include false discovery rate (FDR) methods, which seek
to curb the expected proportion of false positive findings among all reported findings
from a study; and Per-Family Error Rate (PFER) methods, which aim to limit the
expected total number of false positive findings being reported.While poised to yield
rich findings, the data-driven approach has a fundamental limitation as well, in that
the results may not reflect any concrete biological mechanisms or lead to significant
new insights.
4.2 Exploratory statistical techniques: Proof of conceptModern statistical methods allow the theory- and data-driven approaches to be
combined by including prior knowledge into exploratory statistical techniques
(McDermott et al., 2013). Here we discuss a set of modern, multivariate statistical
tools called penalized regression, and review its contributions and pitfalls in the
identification of biomarker panels. For illustration purposes, we show different ways
to apply these methods in the statistical environment “R” (version 3.5.1), using a
gene expression data set that is publicly available (NCBI GEO online repository;
accession number GSE98582). The data were collected in the laboratory in a rela-
tively small sample of 17 healthy young adults, 11 of which were subjected to
62h of total sleep deprivation and 6 of which served as well-rested controls. To mea-
sure cognitive impairment due to sleep deprivation, subjects performed a PVT at
intervals of 2–4h during scheduled wakefulness. Blood samples were taken and gene
140 CHAPTER 6 Genetics of sleep loss and cognitive impairment
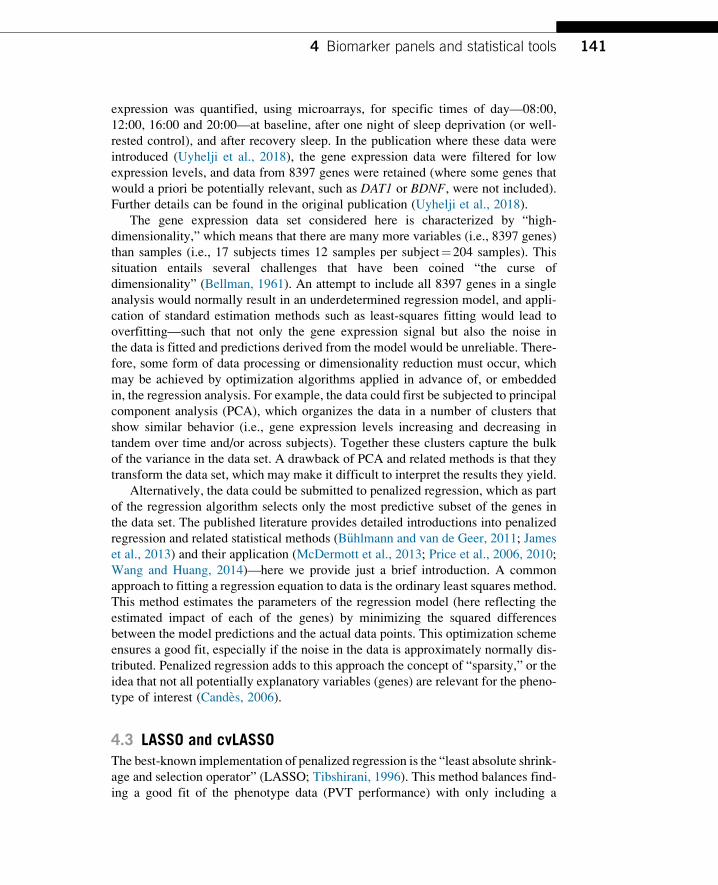
expression was quantified, using microarrays, for specific times of day—08:00,
12:00, 16:00 and 20:00—at baseline, after one night of sleep deprivation (or well-
rested control), and after recovery sleep. In the publication where these data were
introduced (Uyhelji et al., 2018), the gene expression data were filtered for low
expression levels, and data from 8397 genes were retained (where some genes that
would a priori be potentially relevant, such as DAT1 or BDNF, were not included).Further details can be found in the original publication (Uyhelji et al., 2018).
The gene expression data set considered here is characterized by “high-
dimensionality,” which means that there are many more variables (i.e., 8397 genes)
than samples (i.e., 17 subjects times 12 samples per subject¼204 samples). This
situation entails several challenges that have been coined “the curse of
dimensionality” (Bellman, 1961). An attempt to include all 8397 genes in a single
analysis would normally result in an underdetermined regression model, and appli-
cation of standard estimation methods such as least-squares fitting would lead to
overfitting—such that not only the gene expression signal but also the noise in
the data is fitted and predictions derived from the model would be unreliable. There-
fore, some form of data processing or dimensionality reduction must occur, which
may be achieved by optimization algorithms applied in advance of, or embedded
in, the regression analysis. For example, the data could first be subjected to principal
component analysis (PCA), which organizes the data in a number of clusters that
show similar behavior (i.e., gene expression levels increasing and decreasing in
tandem over time and/or across subjects). Together these clusters capture the bulk
of the variance in the data set. A drawback of PCA and related methods is that they
transform the data set, which may make it difficult to interpret the results they yield.
Alternatively, the data could be submitted to penalized regression, which as part
of the regression algorithm selects only the most predictive subset of the genes in
the data set. The published literature provides detailed introductions into penalized
regression and related statistical methods (B€uhlmann and van de Geer, 2011; James
et al., 2013) and their application (McDermott et al., 2013; Price et al., 2006, 2010;
Wang and Huang, 2014)—here we provide just a brief introduction. A common
approach to fitting a regression equation to data is the ordinary least squares method.
This method estimates the parameters of the regression model (here reflecting the
estimated impact of each of the genes) by minimizing the squared differences
between the model predictions and the actual data points. This optimization scheme
ensures a good fit, especially if the noise in the data is approximately normally dis-
tributed. Penalized regression adds to this approach the concept of “sparsity,” or the
idea that not all potentially explanatory variables (genes) are relevant for the pheno-
type of interest (Candes, 2006).
4.3 LASSO and cvLASSOThe best-known implementation of penalized regression is the “least absolute shrink-
age and selection operator” (LASSO; Tibshirani, 1996). This method balances find-
ing a good fit of the phenotype data (PVT performance) with only including a
1414 Biomarker panels and statistical tools
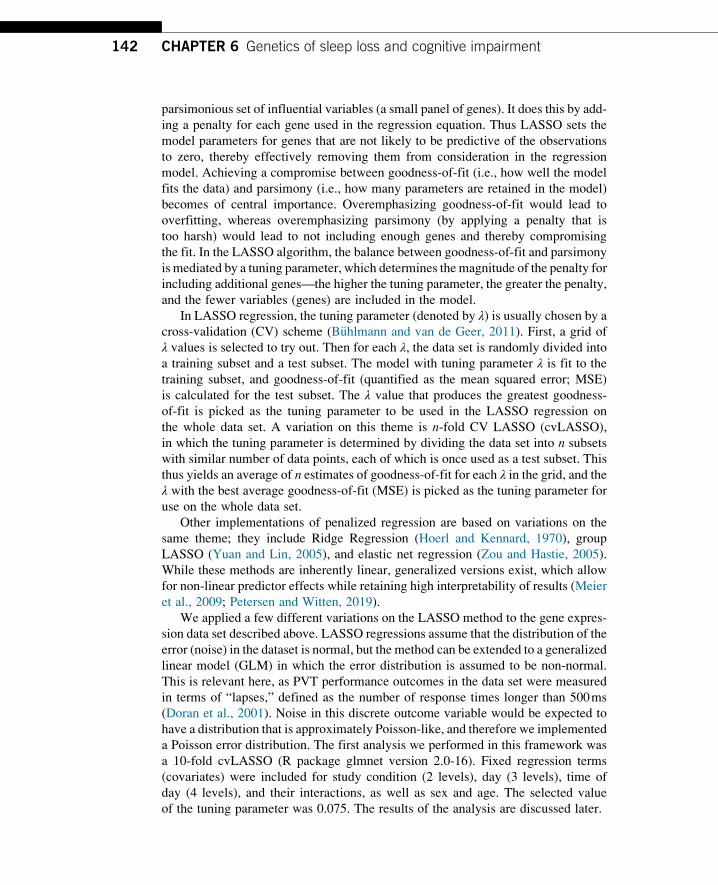
parsimonious set of influential variables (a small panel of genes). It does this by add-
ing a penalty for each gene used in the regression equation. Thus LASSO sets the
model parameters for genes that are not likely to be predictive of the observations
to zero, thereby effectively removing them from consideration in the regression
model. Achieving a compromise between goodness-of-fit (i.e., how well the model
fits the data) and parsimony (i.e., how many parameters are retained in the model)
becomes of central importance. Overemphasizing goodness-of-fit would lead to
overfitting, whereas overemphasizing parsimony (by applying a penalty that is
too harsh) would lead to not including enough genes and thereby compromising
the fit. In the LASSO algorithm, the balance between goodness-of-fit and parsimony
is mediated by a tuning parameter, which determines the magnitude of the penalty for
including additional genes—the higher the tuning parameter, the greater the penalty,
and the fewer variables (genes) are included in the model.
In LASSO regression, the tuning parameter (denoted by λ) is usually chosen by across-validation (CV) scheme (B€uhlmann and van de Geer, 2011). First, a grid of
λ values is selected to try out. Then for each λ, the data set is randomly divided into
a training subset and a test subset. The model with tuning parameter λ is fit to the
training subset, and goodness-of-fit (quantified as the mean squared error; MSE)
is calculated for the test subset. The λ value that produces the greatest goodness-
of-fit is picked as the tuning parameter to be used in the LASSO regression on
the whole data set. A variation on this theme is n-fold CV LASSO (cvLASSO),
in which the tuning parameter is determined by dividing the data set into n subsets
with similar number of data points, each of which is once used as a test subset. This
thus yields an average of n estimates of goodness-of-fit for each λ in the grid, and theλ with the best average goodness-of-fit (MSE) is picked as the tuning parameter for
use on the whole data set.
Other implementations of penalized regression are based on variations on the
same theme; they include Ridge Regression (Hoerl and Kennard, 1970), group
LASSO (Yuan and Lin, 2005), and elastic net regression (Zou and Hastie, 2005).
While these methods are inherently linear, generalized versions exist, which allow
for non-linear predictor effects while retaining high interpretability of results (Meier
et al., 2009; Petersen and Witten, 2019).
We applied a few different variations on the LASSO method to the gene expres-
sion data set described above. LASSO regressions assume that the distribution of the
error (noise) in the dataset is normal, but the method can be extended to a generalized
linear model (GLM) in which the error distribution is assumed to be non-normal.
This is relevant here, as PVT performance outcomes in the data set were measured
in terms of “lapses,” defined as the number of response times longer than 500ms
(Doran et al., 2001). Noise in this discrete outcome variable would be expected to
have a distribution that is approximately Poisson-like, and therefore we implemented
a Poisson error distribution. The first analysis we performed in this framework was
a 10-fold cvLASSO (R package glmnet version 2.0-16). Fixed regression terms
(covariates) were included for study condition (2 levels), day (3 levels), time of
day (4 levels), and their interactions, as well as sex and age. The selected value
of the tuning parameter was 0.075. The results of the analysis are discussed later.
142 CHAPTER 6 Genetics of sleep loss and cognitive impairment

4.4 Stability selection LASSOOne problemwith the cvLASSOmethod is that the presence of noisy (i.e., biologically
unrelated) genes in the data set may lead to less meaningful results (Wang and Huang,
2014). This is an issue of stability, which entails that findings in one part of the data set
should also be found in the remaining part of the data set (B€uhlmann and van de
Geer, 2018). Stability Selection LASSO is a recently developed approach to identify-
ing stable results in LASSO regression analysis (Meinshausen and B€uhlmann, 2010).
This method considers the selection probabilities of the different variables, essentially
asking how often the different genes are selected in subsets of the data set. Genes are
retained in the model based on a pre-specified selection probability cutoff. This strategy
naturally allows for control of type I error in terms of PFER (Meinshausen and
B€uhlmann, 2010). Alternatively, confidence intervals can be used for gene selection
(Stucky and van de Geer, 2018; van de Geer et al., 2014). The second analysis of
the gene expression data set we performed was a Stability Selection LASSO regression
(R package stabs version 0.6-3). In addition to a Poisson error distribution, fixed
regression terms were included for study condition, day, time of day, and their interac-
tions, as well as sex and age. The PFER threshold was set to 1 (i.e., allowing no more
than1 false positive), and a pre-specified selection probability cutoff of 0.6 was used.
The selection probabilities of the top 30 genes are shown in Fig. 2; only genes to the
right of the gray vertical line were retained. The results of this analysis are further
discussed below.
FIG. 2
Illustration of Stability Selection LASSO regression results. The selection probabilities for
the top 30 genes are shown; the selection probability cutoff of 0.6 used in the analysis is
indicated by the gray vertical line. The genes starting with LOC are unnamed and are identified
here by their gene id number.
1434 Biomarker panels and statistical tools
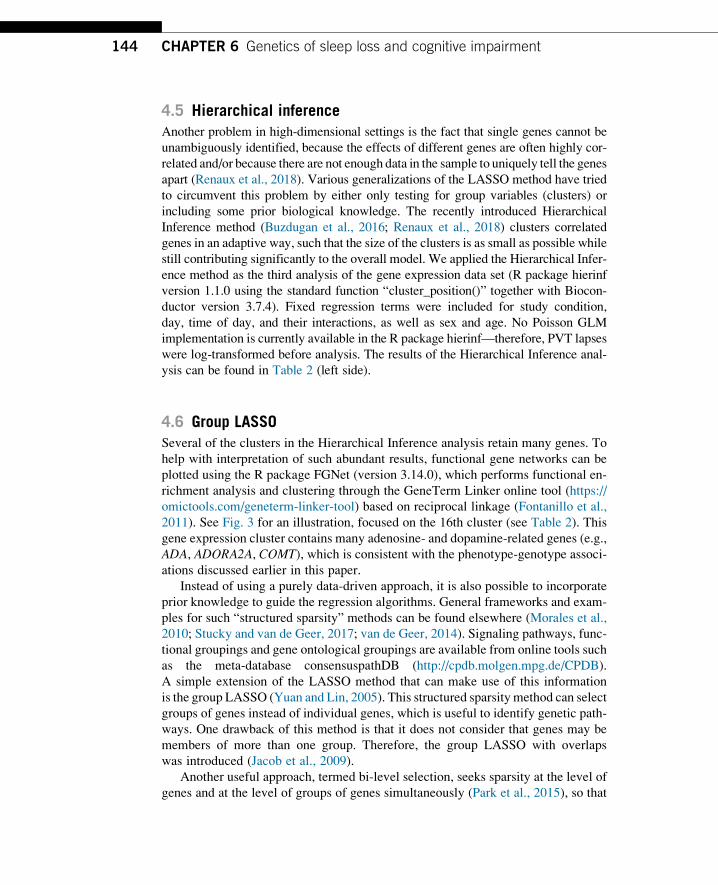
4.5 Hierarchical inferenceAnother problem in high-dimensional settings is the fact that single genes cannot be
unambiguously identified, because the effects of different genes are often highly cor-
related and/or because there are not enough data in the sample to uniquely tell the genes
apart (Renaux et al., 2018). Various generalizations of the LASSO method have tried
to circumvent this problem by either only testing for group variables (clusters) or
including some prior biological knowledge. The recently introduced Hierarchical
Inference method (Buzdugan et al., 2016; Renaux et al., 2018) clusters correlated
genes in an adaptive way, such that the size of the clusters is as small as possible while
still contributing significantly to the overall model. We applied the Hierarchical Infer-
ence method as the third analysis of the gene expression data set (R package hierinf
version 1.1.0 using the standard function “cluster_position()” together with Biocon-
ductor version 3.7.4). Fixed regression terms were included for study condition,
day, time of day, and their interactions, as well as sex and age. No Poisson GLM
implementation is currently available in the R package hierinf—therefore, PVT lapses
were log-transformed before analysis. The results of the Hierarchical Inference anal-
ysis can be found in Table 2 (left side).
4.6 Group LASSOSeveral of the clusters in the Hierarchical Inference analysis retain many genes. To
help with interpretation of such abundant results, functional gene networks can be
plotted using the R package FGNet (version 3.14.0), which performs functional en-
richment analysis and clustering through the GeneTerm Linker online tool (https://
omictools.com/geneterm-linker-tool) based on reciprocal linkage (Fontanillo et al.,
2011). See Fig. 3 for an illustration, focused on the 16th cluster (see Table 2). This
gene expression cluster contains many adenosine- and dopamine-related genes (e.g.,
ADA, ADORA2A, COMT), which is consistent with the phenotype-genotype associ-
ations discussed earlier in this paper.
Instead of using a purely data-driven approach, it is also possible to incorporate
prior knowledge to guide the regression algorithms. General frameworks and exam-
ples for such “structured sparsity” methods can be found elsewhere (Morales et al.,
2010; Stucky and van de Geer, 2017; van de Geer, 2014). Signaling pathways, func-
tional groupings and gene ontological groupings are available from online tools such
as the meta-database consensuspathDB (http://cpdb.molgen.mpg.de/CPDB).
A simple extension of the LASSO method that can make use of this information
is the group LASSO (Yuan and Lin, 2005). This structured sparsity method can select
groups of genes instead of individual genes, which is useful to identify genetic path-
ways. One drawback of this method is that it does not consider that genes may be
members of more than one group. Therefore, the group LASSO with overlaps
was introduced (Jacob et al., 2009).
Another useful approach, termed bi-level selection, seeks sparsity at the level of
genes and at the level of groups of genes simultaneously (Park et al., 2015), so that
144 CHAPTER 6 Genetics of sleep loss and cognitive impairment

Table 2 Hierarchical inference results for the relationship between gene expression profiles and PVT performance, and comparison withcvLASSO, stability selection LASSO, and oGEL results.
Hierarchical inference results Shared members
NumberPvalue R2 Cluster
Potentially interestingmembers cvLASSO
Stabilityselection oGEL
1 0.001 0.13 FCRL3 [1] FCRL3 FCRL3 No element No element
2 0.001 0.15 MT-TA [1] No element No element No element
3 0.005 0.24 USP24,…,[62] SLC17A7 LINC01356, GBP1 GBP1 RPS26P15, GBP1, LINC01356
4 0.007 0.23 PRKAB1,…,[252]
TNFRSF1A, UBE2N NUP37, ACRBP No element Unknown.393
5 0.008 0.14 KIAA1715 [1] No element No element No element
6 0.011 0.30 ABI1,…,[505] COMTD1, GLUD2, AMPD3,TNFAIP3, PIK3AP1, UBE4A,PIK3C2A, UBE2L6
EIF3F, KMT2A, RARRES3,TMEM138, WDR74, OSBP,IFITM3, HBB, DKFZp779M0652,KRTAP5-7, VPS37C
IFITM3 NLRP6, RARRES3, KMT2A,TPT1-AS1, unknown.186,KBTBD4, VPS37C
7 0.012 0.13 PI3 [1] No element No element No element
8 0.013 0.21 TMUB1,…,[126]
GRINA, ERICH1,TNFRSF10C
PROSC No element PTP4A3
9 0.014 0.14 Unknown.9 [1] Unknown.9 No element No element Unknown.9
10 0.015 0.15 SNORD56B [1] No element No element No element
11 0.016 0.17 CDK11A,…,[31]
TNFRSF14, TNFRSF25 TNFRSF25 TNFRSF25 MAD2L2
12 0.019 0.20 UBR5,…,[62] KRT18 No element KRT18
13 0.024 0.23 ADSL,…,[505] PIK3IP1, CYP2D6, UBE2E2,UBE2E1, PIK3CA, PIK3R4,PIK3CB
ZNF654, PPP4R2, GLT8D1,NEK4, RASSF1, SLC9A9,EIF4ENIF1, RABL2B, HSPBAP1,GHRL
Unknown Unknown.550, GPR27, TFG,RNU6-736P, unknown,unknown.492, DVL3, NICN1,GLT8D1
14 0.025 0.17 SNORD116-2,SNORD116-6[2]
No element No element No element
Continued

Table 2 Hierarchical inference results for the relationship between gene expression profiles and PVT performance, and comparison withcvLASSO, stability selection LASSO, and oGEL results.—cont’d
Hierarchical inference results Shared members
NumberPvalue R2 Cluster
Potentially interestingmembers cvLASSO
Stabilityselection oGEL
15 0.029 0.24 EDC4,…,[252] ADAT1 TERF2IP, TXNL4B, VPS4A,PSMB10, LOC642533, EDC4
No element TERF2IP, FAM192A, C16orf80,FAM96B
16 0.029 0.19 FKBP1A,…,[252]
ADA, ADARB1, COMT,SPECC1L-ADORA2A,ADORA2A, UBE2D3P1,UBE2V1, UBE2G2, UBE2L3
CCT8, SNORA80A, APOL6,RNA5SP474, CABIN1,C21orf33, TMEM191C, SEPT5-GP1BB
No element RNA5SP474, RN7SKP111,MAP3K7CL, CCT8, KRTAP12-4, SEPT5-GP1BB.1,TMEM191C, CABIN1, APOL6
17 0.029 0.13 CD7,…,[63] PIK3C3 DLGAP1-AS1 No element No element
18 0.031 0.18 ACO1,…,[63] UBE2R2 No element No element Unknown.488, TGFBR1
19 0.033 0.19 GDAP2,…,[31] No element No element No element
20 0.033 0.33 NRF1,…,[252] POLR2J, UBE3C, UBE2H ZNF394, NSUN5, TMEM209,FAM185A, POLR2J2, POLR2J3
POLR2J RASA4CP, STYXL1, ZNF394,TMEM209, CNOT4
21 0.034 0.26 GSTM4,…,[3] GSTM4 No element No element GSTM4
22 0.034 0.22 GPR171,…,[252]
TNFSF10, UBE2K, CYP4V2,TNIP2
RUFY3, CCR2, MIR4800,TMEM41A
No element CCR2, RUFY3, unknown.212,unknown.37
23 0.049 0.20 MAK,…,[125] GABBR1, GCLC DNPH1, OARD1, HIST1H3B,HIST1H1C, NEU1
No element HIST1H4I, unknown.136,TAF11, SYNCRIP
Rows correspond to significant clusters from Hierarchical Inference. On the left side of the table, cluster numbers, P values, aggregated explained variances (R2), cluster descriptors and thenumber of cluster members (in square brackets), and some potentially interesting members are shown for illustration purposes. On the right side of the table, the clusters are compared toresults from the other methods used for analysis of the data set.

sparse pathways with relatively few members can be identified. One implementation
thereof is Group Exponential LASSO (GEL; Breheny, 2015). Again a version with
overlaps exists, called the overlapping Group Exponential LASSO (oGEL). The
fourth (and last) analysis of the gene expression data set we performed here was
an oGEL analysis based on 10-fold cvLASSO regression, as implemented in the
R package grpregOverlap (version 2.2). It is not yet possible to include fixed regres-
sion terms within this implementation; therefore, study condition, time of day, sex,
and age were not controlled for in this analysis. Table 3 shows the gene groups (path-
ways) selected by the analysis.
The results of the four analyses of the gene expression data set are compared in
Table 2. There are large differences in the findings, which is not unusual in case of
high-dimensionality. However, some of the genes in the data set were identified con-
sistently across the different methods. For example, all four analyses identified the
guanylate binding protein 1 (GBP1) gene. A SNP of GBP1 (SNP-ID: rs10801703)
was found to be associated with caffeine-induced insomnia in a GWAS study (Byrne
et al., 2012), suggesting it is a candidate for further study. Tumor necrosis factor
receptor superfamily member 25 (TNFRSF25), which is part of the tumor necrosis
factor-mediated signaling pathway, was also identified repeatedly. Related genes
were shown to be affected by sleep deprivation (Maret et al., 2007) and have been
proposed as biomarkers for acute total sleep deprivation (Laing et al., 2018;
Satterfield et al., 2015). Histone-lysine N-methyltransferase 2A (KMT2A) is anothernotable finding, as it might play a crucial role in prefrontal synaptic plasticity and
working memory (Jakovcevski et al., 2015), which could have negative downstream
consequences on cognitive performance during sleep deprivation.
In the original analysis of the gene expression data set (Uyhelji et al., 2018),
28 genes were identified for which the expression was specifically associated with
PVT performance impairment due to sleep deprivation (and not just sleep deprivation
per se). Of these, 13 were identified by cvLASSO (POTEKP, SPDYE2, andWWC3) oras members in Hierarchical Inference clusters (ODF2L, IPMK, LPCAT2, LITAF,AP1G1,KCNJ15,ETS2,RAB7A,FLOT1,ELOVL5, STEAP4, SPDYE8P, and SDCBP).
FIG. 3
Illustration of a functional gene network plot for the Hierarchical Inference method.
Results are shown for the 16th significant cluster (see Table 2). Different colors
(yellow and red) indicate different biological processes found in the cluster based on the
R package FGNet (version 3.14.0) using the GeneTerm Linker tool.
1474 Biomarker panels and statistical tools
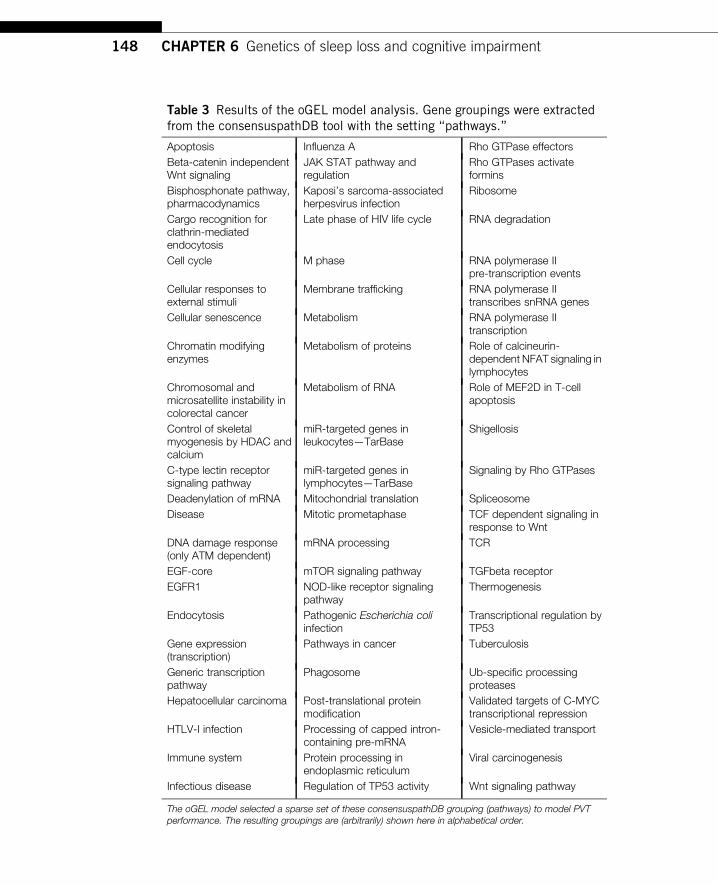
Table 3 Results of the oGEL model analysis. Gene groupings were extractedfrom the consensuspathDB tool with the setting “pathways.”
Apoptosis Influenza A Rho GTPase effectors
Beta-catenin independentWnt signaling
JAK STAT pathway andregulation
Rho GTPases activateformins
Bisphosphonate pathway,pharmacodynamics
Kaposi’s sarcoma-associatedherpesvirus infection
Ribosome
Cargo recognition forclathrin-mediatedendocytosis
Late phase of HIV life cycle RNA degradation
Cell cycle M phase RNA polymerase IIpre-transcription events
Cellular responses toexternal stimuli
Membrane trafficking RNA polymerase IItranscribes snRNA genes
Cellular senescence Metabolism RNA polymerase IItranscription
Chromatin modifyingenzymes
Metabolism of proteins Role of calcineurin-dependent NFAT signaling inlymphocytes
Chromosomal andmicrosatellite instability incolorectal cancer
Metabolism of RNA Role of MEF2D in T-cellapoptosis
Control of skeletalmyogenesis by HDAC andcalcium
miR-targeted genes inleukocytes—TarBase
Shigellosis
C-type lectin receptorsignaling pathway
miR-targeted genes inlymphocytes—TarBase
Signaling by Rho GTPases
Deadenylation of mRNA Mitochondrial translation Spliceosome
Disease Mitotic prometaphase TCF dependent signaling inresponse to Wnt
DNA damage response(only ATM dependent)
mRNA processing TCR
EGF-core mTOR signaling pathway TGFbeta receptor
EGFR1 NOD-like receptor signalingpathway
Thermogenesis
Endocytosis Pathogenic Escherichia coliinfection
Transcriptional regulation byTP53
Gene expression(transcription)
Pathways in cancer Tuberculosis
Generic transcriptionpathway
Phagosome Ub-specific processingproteases
Hepatocellular carcinoma Post-translational proteinmodification
Validated targets of C-MYCtranscriptional repression
HTLV-I infection Processing of capped intron-containing pre-mRNA
Vesicle-mediated transport
Immune system Protein processing inendoplasmic reticulum
Viral carcinogenesis
Infectious disease Regulation of TP53 activity Wnt signaling pathway
The oGEL model selected a sparse set of these consensuspathDB grouping (pathways) to model PVTperformance. The resulting groupings are (arbitrarily) shown here in alphabetical order.
148 CHAPTER 6 Genetics of sleep loss and cognitive impairment
This convergence across different analysis methods makes these genes strong candi-
dates for further study. This could include investigation of new data fromdifferent sam-
ples, and it may involve inclusion of genes previously determined to be potentially
relevant as fixed (unpenalized) regression terms for specific hypothesis testing and
further discovery.
5 ConclusionIn this paper we outlined a roadmap for the investigation of phenotype-genotype
relationships in sleep deprivation and its effects on cognitive performance showed
the power of cognitive endophenotyping by focusing on specific cognitive functions
and illustrated modern statistical tools to address the high-dimensionality of gene
expression data sets that is typical in this domain. Application of the methods
described here does not obviate the need for replication studies (or rather, extension
studies; see Zatz, 2000) and investigations of generalizability to other populations
(e.g., children or older adults or patients with sleep disorders or other medical condi-
tions) to further unravel the genetic underpinnings of human sleep deprivation and its
effects on cognition. We also did not cover twin study paradigms, which provide an-
other powerful strategy for studying phenotype-genotype associations (e.g., Pellegrino
et al., 2014).
Systems biology approaches beyond the scope of this paper will be needed to fur-
ther clarify the mechanisms implicated in the results of phenotype-genotype analyses,
as genetic, neural, cognitive, and behavioral systems do not work in isolation, but
rather in complex interacting frameworks. Also, translational research will be needed
to understand how results apply to real-world settings and real-world performance
tasks, where sleep deprivation and cognitive functioning interact with circumstantial
and environmental factors that may profoundly shape performance outcomes (Riggs
et al., 2018). This, in turn, may yield new insights into the underlying mechanisms.
AcknowledgmentsThis work was supported by Congressionally Directed Medical Research Program Grant
W81XWH-17-C-0088 to W.D.S. Killgore (B.C.S.); Swiss National Science Foundation Grant
320030_163439, Clinical Research Priority Program “Sleep & Health” of the University of
Z€urich, the Z€urich Center for Integrative Human Physiology, and the Neuroscience Center
Z€urich (B.S. and H.P.L.); and Congressionally Directed Medical Research Program Grants
W81XWH-16-1-0319 and W81XWH-18-1-0100 and Defense University Research Instru-
mentation ProgramGrant N00014-17-1-2990 (H.P.A.V.D.). The data used to calculate the var-
iance explained by DRD2 C957T genotype was taken from a study supported by Office of
Naval Research Grant N00014-13-1-0302. The publicly available gene expression data set
came from research supported by Federal Aviation Administration Grant DTFAAC-11-
A-00003 and National Institutes of Health grant R01-HL105768. We thank Renaux Claude
(Seminar for Statistics, ETH Zurich) for valuable methodological suggestions, and an anon-
ymous reviewer for helpful feedback on an earlier version of this paper.
149Acknowledgments

ReferencesAchermann, P., Borb�ely, A.A., 2016. Sleep homeostasis and models of sleep regulation. In:
Kryger, M.H., Roth, T., Dement, W.C. (Eds.), Principles and Practice of Sleep Medicine,
sixth ed. Elsevier, Philadelphia, pp. 377–387.Allebrandt, K.V., Teder-Laving, M., Akyol, M., Pichler, I., M€uller-Myhsok, B.,
Pramstaller, P., Merrow, M., …Roenneberg, T., 2010. CLOCK gene variants associate
with sleep duration in two independent populations. Biol. Psychiatry 67, 1040–1047.https://doi.org/10.1016/j.biopsych.2009.12.026.
Alsene, K., Deckert, J., Sand, P., deWit, H., 2003. Association between A2A receptor gene poly-
morphisms and caffeine-induced anxiety. Neuropsychopharmacology 28, 1694–1702.https://doi.org/10.1038/sj.npp.1300232.
Andretic, R., Franken, P., Tafti, M., 2008. Genetics of sleep. Annu. Rev. Genet. 42, 361–388.https://doi.org/10.1146/annurev.genet.42.110807.091541.
Bachmann, V., Klaus, F., Bodenmann, S., Sch€afer, N., Brugger, P., Huber, S., …
Landolt, H.-P., 2012. Functional ADA polymorphism increases sleep depth and reduces
vigilant attention in humans. Cereb. Cortex 22, 962–970. https://doi.org/10.1093/cercor/bhr173.
Barnett, J.H., Scoriels, L., Munafo, M.R., 2008. Meta-analysis of the cognitive effects of the
catechol-O-methyltransferase gene Val158/108Met polymorphism. Biol. Psychiatry
64, 137–144. https://doi.org/10.1016/j.biopsych.2008.01.005.Bellman, R., 1961. Adaptive Control Processes: A Guided Tour. Princeton University Press,
Princeton, NJ.
Benjamini, Y., Hochberg, Y., 1995. Controlling the false discovery rate: a practical and pow-
erful approach to multiple testing. J. R. Stat. Soc. B. Methodol. 57, 289–300. https://doi.org/10.2307/2346101.
Berman, K.F., Ostrem, J.L., Randolph, C., Gold, J., Goldberg, T.E., Coppola, R., …
Weinberger, D.R., 1995. Physiological activation of a cortical network during perfor-
mance of the Wisconsin Card Sorting Test: a positron emission tomography study.
Neuropsychologia 33, 1027–1046.Bodenmann, S., Landolt, H.-P., 2010. Effects of modafinil on the sleep EEG depend on
Val158Met genotype of COMT. Sleep 33, 1027–1035. https://doi.org/10.1093/sleep/
33.8.1027.
Bodenmann, S., Rusterholz, T., Durr, R., Stoll, C., Bachmann, V., Geissler, E.,…Landolt, H.-P.,
2009a. The functional Val158Met polymorphism of COMT predicts interindividual
differences in brain oscillations in young men. J. Neurosci. 29, 10855–10862. https://doi.org/10.1523/JNEUROSCI.1427-09.2009.
Bodenmann, S., Xu, S., Luhmann, U.F.O., Arand, M., Berger, W., Jung, H.H., Landolt, H.-P.,
2009b. Pharmacogenetics of modafinil after sleep loss: catechol-O-methyltransferase
genotype modulates waking functions but not recovery sleep. Clin. Pharmacol. Ther.
85, 296–304. https://doi.org/10.1038/clpt.2008.222.Bodenmann, S., Hohoff, C., Freitag, C., Deckert, J., R�etey, J.V., Bachmann, V., Landolt, H.-P.,
2012. Polymorphisms of ADORA2A modulate psychomotor vigilance and the effects of
caffeine on neurobehavioural performance and sleep EEG after sleep deprivation. Br. J.
Pharmacol. 165, 1904–1913. https://doi.org/10.1111/j.1476-5381.2011.01689.x.Boivin, D.B., Czeisler, C.A., Dijk, D.-J., Duffy, J.F., Folkard, S., Minors, D.S., …
Waterhouse, J.M., 1997. Complex interaction of the sleep-wake cycle and circadian phase
modulates mood in healthy subjects. Arch. Gen. Psychiatry 54, 145–152. https://doi.org/10.1001/archpsyc.1997.01830140055010.
150 CHAPTER 6 Genetics of sleep loss and cognitive impairment
Breheny, P., 2015. The group exponential lasso for bi-level variable selection. Biometrics
71, 731–740. https://doi.org/10.1111/biom.12300.
B€uhlmann, P., van de Geer, S.A., 2011. Statistics for High-Dimensional DataMethods, Theory
and Applications. Springer, Berlin. https://doi.org/10.1007/978-3-642-20192-9.
B€uhlmann, P., van de Geer, S.A., 2018. Statistics for big data: a perspective. Stat. Probab. Lett.
136, 37–41. https://doi.org/10.1016/j.spl.2018.02.016.Buzdugan, L., Kalisch, M., Navarro, A., Schunk, D., Fehr, E., B€uhlmann, P., 2016. Assessing
statistical significance in multivariable genome wide association analysis. Bioinformatics
32, 1990–2000. https://doi.org/10.1093/bioinformatics/btw128.
Byrne, E.M., Johnson, J., McRae, A.F., Nyholt, D.R., Medland, S.E., Gehrman, P.R., …
Martin, N.G., 2012. A genome-wide association study of caffeine-related sleep distur-
bance: confirmation of a role for a common variant in the adenosine receptor. Sleep
35, 967–975. https://doi.org/10.5665/sleep.1962.Candes, E.J., 2006. Modern statistical estimation via oracle inequalities. Acta Numer.
15, 257–325. https://doi.org/10.1017/s0962492906230010.Chen, J.-F., Eltzschig, H.K., Fredholm, B.B., 2013. Adenosine receptors as drug targets—what
are the challenges? Nat. Rev. Drug Discov. 12, 265–286. https://doi.org/10.1038/nrd3955.adenosine.
Childs, E., Hohoff, C., Deckert, J., Xu, K., Badner, J., de Wit, H., 2008. Association between
ADORA2A and DRD2 polymorphisms and caffeine-induced anxiety.
Neuropsychopharmacology 33, 2791–2800. https://doi.org/10.1038/npp.2008.17.Davies, G., Armstrong, N., Bis, J.C., Bressler, J., Chouraki, V., Giddaluru, S., …Deary, I.J.,
2015. Genetic contributions to variation in general cognitive function: a meta-analysis of
genome-wide association studies in the CHARGE consortium (N¼53,949). Mol. Psychi-
atry 20, 183–192. https://doi.org/10.1038/mp.2014.188.
Davies, G., Marioni, R.E., Liewald, D.C., Hill, W.D., Hagenaars, S.P., Harris, S.E., …
Deary, I.J., 2016. Genome-wide association study of cognitive functions and educational
attainment in UK biobank (N¼112,151). Mol. Psychiatry 21, 758–767. https://doi.org/10.1038/mp.2016.45.
Deary, I.J., 2012. Intelligence. Annu. Rev. Psychol. 63, 453–482. https://doi.org/10.1146/annurev-psych-120710-100353.
Doran, S.M., Van Dongen, H.P.A., Dinges, D.F., 2001. Sustained attention performance dur-
ing sleep deprivation: evidence of state instability. Arch. Ital. Biol. 139, 253–267.Doty, T.J., So, C.J., Bergman, E.M., Trach, S.K., Ratcliffe, R.H., Yarnell, A.M., …
Quartana, P.J., 2017. Limited efficacy of caffeine and recovery costs during and following
5 days of chronic sleep restriction. Sleep 40, zsx171. https://doi.org/10.1093/sleep/zsx171.
Egan, M.F., Goldberg, T.E., Kolachana, B.S., Callicott, J.H., Mazzanti, C.M., Straub, R.E.,
…Weinberger, D.R., 2001. Effect of COMT Val108/158Met genotype on frontal lobe
function and risk for schizophrenia. Neuroscience 98, 6917–6922. https://doi.org/
10.1073/pnas.111134598.
Ettinger, U., Merten, N., Kambeitz, J., 2016. Meta-analysis of the association of the SLC6A3
3’-UTR VNTR with cognition. Neurosci. Biobehav. Rev. 60, 72–81. https://doi.org/10.1016/j.neubiorev.2015.09.021.
Faraone, S., Spencer, T., Madras, B., Zhang-James, Y., Biederman, J., 2014. Functional effects
of dopamine transporter gene genotypes on in vivo dopamine transporter functioning: a
meta-analysis. Mol. Psychiatry 19, 880–889. https://doi.org/10.1038/mp.2013.126.
Farrell, S.M., Tunbridge, E.M., Braeutigam, S., Harrison, P.J., 2012. COMT Val(158)met geno-
type determines the direction of cognitive effects produced by catechol-O-methyltransferase
inhibition. Biol. Psychiatry 71, 538–544. https://doi.org/10.1016/j.biopsych.2011.12.023.
151References
Finelli, L.A., Borb�ely, A.A., Achermann, P., 2001. Functional topography of the human non-
REM sleep electroencephalogram. Eur. J. Neurosci. 13, 2282–2290. https://doi.org/
10.1046/j.0953-816X.2001.01597.x.
Fontanillo, C., Nogales-Cadenas, R., Pascual-Montano, A., de Las Rivas, J., 2011. Functional
analysis beyond enrichment: non-redundant reciprocal linkage of genes and biological
terms. PLoS ONE 6, e24289. https://doi.org/10.1371/journal.pone.0024289.
Galliaud, E., Taillard, J., Sagaspe, P., Valtat, C., Bioulac, B., Philip, P., 2008. Sharp and
sleepy: evidence for dissociation between sleep pressure and nocturnal performance.
J. Sleep Res. 17, 11–15. https://doi.org/10.1111/j.1365-2869.2008.00629.x.Gibson, G., 2012. Rare and common variants: twenty arguments. Nat. Rev. Genet.
13, 135–145. https://doi.org/10.1038/nrg3118.Gottlieb, D.J., Hek, K., Chen, T.H., Watson, N.F., Eiriksdottir, G., Byrne, E.M., …
Tiemeier, H., 2015. Novel loci associated with usual sleep duration: the CHARGE con-
sortium genome-wide association study. Mol. Psychiatry 20, 1232–1239. https://doi.org/10.1038/mp.2014.133.
Gottselig, J.M., Adam, M., R�etey, J.V., Khatami, R., Achermann, P., Landolt, H.-P., 2006.
Random number generation during sleep deprivation: effects of caffeine on response
maintenance and stereotypy. J. Sleep Res. 15, 31–40. https://doi.org/10.1111/j.1365-2869.2006.00497.x.
Grant, L.K., Cain, S.W., Chang, A.M., Saxena, R., Czeisler, C.A., Anderson, C., 2018.
Impaired cognitive flexibility during sleep deprivation among carriers of the brain derived
neurotrophic factor (BDNF) Val66Met allele. Behav. Brain Res. 338, 51–55. https://doi.org/10.1016/j.bbr.2017.09.025.
Hayaishi, O., Urade, Y., Eguchi, N., Huang, Z.-L., 2004. Genes for prostaglandin synthase and
receptor as well as adenosine A2A receptor are involved in the homeostatic regulation of
NREM sleep. Arch. Ital. Biol. 142, 533–539.Hoerl, E., Kennard, R.W., 1970. Ridge regression: biased estimation for nonorthogonal prob-
lems. Dent. Tech. 12, 55–67. https://doi.org/10.2307/1271436.Holst, S.C., Bersagliere, A., Bachmann, V., Berger, W., Achermann, P., Landolt, H.-P., 2014.
Dopaminergic role in regulating neurophysiological markers of sleep homeostasis in
humans. J. Neurosci. 34, 566–573. https://doi.org/10.1523/jneurosci.4128-13.2014.Holst, S.C., Valomon, A., Landolt, H.-P., 2016. Sleep pharmacogenetics: personalized sleep-
wake therapy. Annu. Rev. Pharmacol. 56, 577–603. https://doi.org/10.1146/annurev-
pharmtox-010715-103801.
Holst, S.C., M€uller, T., Valomon, A., Seebauer, B., Berger, W., Landolt, H.-P., 2017. Func-
tional polymorphisms in dopaminergic genes modulate neurobehavioral and neurophysi-
ological consequences of sleep deprivation. Sci. Rep. 7, 45982. https://doi.org/10.1038/
srep45982.
Honn, K.A., Hinson, J.M., Whitney, P., Van Dongen, H.P.A., 2018. Cognitive flexibility:
a distinct element of performance impairment due to sleep deprivation. Accid. Anal.
Prev. Advance online publication. https://www.sciencedirect.com/science/article/pii/
S0001457518300708?via%3Dihub.
Huang, Z.L., Qu, W.M., Eguchi, N., Chen, J.F., Schwarzschild, M.A., Fredholm, B.B., …
Hayaishi, O., 2005. Adenosine A2A, but not A1, receptors mediate the arousal effect of
caffeine. Nat. Neurosci. 8, 858–859. https://doi.org/10.1038/nn1491.Huang, J., Zhang, T., Metaxas, D., 2011. Learning with structured sparsity. J. Mach. Learn.
Res. 12, 3371–3412. https://doi.org/10.1145/1553374.1553429.
152 CHAPTER 6 Genetics of sleep loss and cognitive impairment
Ihne, J.L., Gallagher, N.M., Sullivan, M., Callicott, J.H., Green, A.E., 2015. Is less really more:
does a prefrontal efficiency genotype actually confer better performance when working
memory becomes difficult? Cortex 74, 79–95. https://doi.org/10.1016/j.cortex.2015.10.025.Jackson, M.L., Gunzelmann, G., Whitney, P., Hinson, J.M., Belenky, G., Rabat, A., Van
Dongen, H.P.A., 2013. Deconstructing and reconstructing cognitive performance in sleep
deprivation. Sleep Med. Rev. 17, 215–225. https://doi.org/10.1016/j.smrv.2012.06.007.
Jacob, L., Guillaume Obozinski, G., Vert, J.-P., 2009. Group lasso with overlap and graph
lasso. In: Bottou, L., Littman, M. (Eds.), Proceedings of the 26th Annual International
Conference on Machine Learning. Association for Computer Machinery, Montreal,
pp. 433–440. https://doi.org/10.1145/1553374.Jaeger, R.G., Halliday, T.R., 1998. On confirmatory versus exploratory research.
Herpatologica 54, S64–S66.Jakovcevski, M., Ruan, H., Shen, E.Y., Dincer, A., Javidfar, B., Ma, Q.,…Akbarian, S., 2015.
Neuronal Kmt2a/Mll1 histone methyltransferase is essential for prefrontal synaptic plas-
ticity and working memory. J. Neurosci. 35, 5097–5108. https://doi.org/10.1523/jneur-osci.3004-14.2015.
James, G., Witten, D., Hastie, T., Tibshirani, R., 2013. An Introduction to Statistical Learning:
With Applications in R. Springer, New York. https://doi.org/10.1007/978-1-4614-7138-7.
Jawinski, P., Tegelkamp, S., Sander, C., Hantzsch, M., Huang, J., Mauche, N.,…Hensch, T.,
2016. Time to wake up: no impact of COMT Val158Met gene variation on circadian pref-
erences, arousal regulation and sleep. Chronobiol. Int. 33, 1–13. https://doi.org/
10.1080/07420528.2016.1178275.
Kane, M.J., Engle, R.W., 2002. The role of prefrontal cortex in working-memory capacity,
executive attention, and general fluid intelligence: an individual-differences perspective.
Psychon. Bull. Rev. 9, 637–671. https://doi.org/10.3758/bf03196323.Killgore, W.D.S., Kahn-Greene, E.T., Grugle, N.L., Killgore, D.B., Balkin, T.J., 2009. Sus-
taining executive functions during sleep deprivation: a comparison of caffeine, dextroam-
phetamine, and modafinil. Sleep 32, 205–216. https://doi.org/10.1093/sleep/32.2.205.Killgore,W.D.S., Grugle, N.L., Balkin, T.J., 2012. Gambling when sleep deprived: dont bet on
stimulants. Chronobiol. Int. 29, 43–54. https://doi.org/10.3109/07420528.2011.635230.Korkutata, M., Saitoh, T., Cherasse, Y., Ioka, S., Duo, F., Qin, R., …Lazarus, M., 2018.
Enhancing endogenous adenosine A2A receptor signaling induces slow-wave sleep with-
out affecting body temperature and cardiovascular function. Neurophamacology
144, 122–132. https://doi.org/10.1016/j.neuropharm.2018.10.022.
Laing, E.E., M€oller-Levet, C.S., Dijk, D.-J., Archer, S.N., 2018. Identifying and validating
blood mRNA biomarkers for acute and chronic insufficient sleep in humans: a machine
learning approach. Sleep 42, zsy186. https://doi.org/10.1093/sleep/zsy186.
Landolt, H.-P., 2011. Genetic determination of sleep EEG profiles in healthy humans. Prog.
Brain Res. 193, 51–61. https://doi.org/10.1016/b978-0-444-53839-0.00004-1.Landolt, H.-P., Dijk, D.-J., 2016. Genetics and genomic basis of sleep. In: Kryger, M.H.,
Roth, T., Dement, W.C. (Eds.), Principles and Practice of Sleep Medicine, sixth ed.
Elsevier, Philadelphia, pp. 311–324. https://doi.org/10.1016/b978-0-323-24288-
2.00030-1.
Landolt, H.-P., R�etey, J.V., T€onz, K., Gottselig, J.H., Khatami, R., Buckelm€uller, I.,
Achermann, P., 2004. Caffeine attenuates waking and sleep electroencephalographic
markers of sleep homeostasis in humans. Neuropsychopharmacology 29, 1933–1939.https://doi.org/10.1038/sj.npp.1300526.
153References

Landolt, H.-P., R�etey, J.V., Adam,M., 2012. Reduced neurobehavioral impairment from sleep
deprivation in older adults: contribution of adenosinergic mechanisms. Front. Neurol.
3, 1–11. https://doi.org/10.3389/fneur.2012.00062.Lazarus, M., Chen, J.-F., Huang, Z.-L., Urade, Y., Fredholm, B.B., 2017. Adenosine and
sleep. In: Handbook of Experimental Pharmacology. Springer, Berlin. Advance online
publicationhttps://doi.org/10.1007/164_2018_95.
Leproult, R., Colecchia, E.F., Berardi, A.M., Stickgold, R., Kosslyn, S.M., Van Cauter, E.,
2003. Individual differences in subjective and objective alertness during sleep deprivation
are stable and unrelated. Am. J. Physiol. Regul. Integr. Comp. Physiol. 284, R280–R290.https://doi.org/10.1152/ajpregu.00197.2002.
Lim, J., Dinges, D.F., 2008. Sleep deprivation and vigilant attention. Ann. N. Y. Acad. Sci.
1129, 305–322. https://doi.org/10.1196/annals.1417.002.Lim, J., Ebstein, R., Tse, C.Y., Monakhov, M., Lai, P.S., Dinges, D.F., Kwok, K., 2012.
Dopaminergic polymorphisms associated with time-on-task declines and fatigue in the
psychomotor vigilance test. PLoS ONE 7, e33767. https://doi.org/10.1371/journal.
pone.0033767.
Linkenkaer-Hansen, K., Smit, D.J.A., Barkil, A., van Beijsterveldt, T.E.M., Brussaard, A.B.,
Boomsma, D.I., … de Geus, E.J.C., 2007. Genetic contributions to long-range temporal
correlations in ongoing oscillations. J. Neurosci. 27, 13882–13889. https://doi.org/
10.1523/jneurosci.3083-07.2007.
Manolio, T.A., Collins, F.S., Cox, N.J., Goldstein, D.B., Hindorff, L.A., Hunter, D.J., …
Visscher, P.M., 2009. Finding the missing heritability of complex diseases. Nature
461, 747–753. https://doi.org/10.1038/nature08494.Maret, S., Dorsaz, S., Gurcel, L., Pradervand, S., Petit, B., Pfister, C., …Tafti, M., 2007.
Homer1a is a core brain molecular correlate of sleep loss. Proc. Natl. Acad. Sci. U.S.A.
104, 20090–20095. https://doi.org/10.1073/pnas.0710131104.McDermott, J.E., Wang, J., Mitchell, H., Webb-Robertson, B.J., Hafen, R., Ramey, J.,
Rodland, K.D., 2013. Challenges in biomarker discovery: combining expert insights with
statistical analysis of complex omics data. Expert Opin. Med. Diagn. 7, 37–51. https://doi.org/10.1517/17530059.2012.718329.
Meier, L., van de Geer, S., B€uhlmann, P., 2009. High-dimensional additive modeling. Ann.
Stat. 37, 3779–3821. https://doi.org/10.1214/09-AOS692.Meinshausen, N., B€uhlmann, P., 2010. Stability selection. J. R. Stat. Soc. B. Methodol.
72, 417–473. https://doi.org/10.1111/j.1467-9868.2010.00740.x.Meisel, C., Schulze-Bonhage, A., Freestone, D., Cook, M.J., Achermann, P., Plenz, D., 2015.
Intrinsic excitability measures track antiepileptic drug action and uncover increasing/
decreasing excitability over the wake/sleep cycle. Proc. Natl. Acad. Sci. U.S.A.
112, 14694–14699. https://doi.org/10.1073/pnas.1513716112.Meisel, C., Bailey, K., Achermann, P., Plenz, D., 2017. Decline of long-range temporal cor-
relations in the human brain during sustained wakefulness. Sci. Rep. 7, 11825. https://doi.
org/10.1038/s41598-017-12140-w.
M€oller-Levet, C.S., Archer, S.N., Bucca, G., Laing, E.E., Slak, A., Kabiljo, R.,…Dijk, D.-J.,
2013. Effects of insufficient sleep on circadian rhythmicity and expression amplitude of
the human blood transcriptome. Proc. Natl. Acad. Sci. U.S.A. 110, E1132–E1141. https://doi.org/10.1073/pnas.1217154110.
Morales, J., Micchelli, C.A., Pontil, M., 2010. A family of penalty functions for structured
sparsity. Adv. Neural Inf. Process. Syst. 32, 1612–1623.
154 CHAPTER 6 Genetics of sleep loss and cognitive impairment
Mullington, J.M., Abbott, S.M., Carroll, J.E., Davis, C.J., Dijk, D.-J., Dinges, D.F.,…Zee, P.C.,
2016. Developing biomarker arrays predicting sleep and circadian-coupled risks to health.
Sleep 39, 727–736. https://doi.org/10.5665/sleep.5616.Nir, Y., Andrillon, T., Marmelshtein, A., Suthana, N., Cirelli, C., Tononi, G., Fried, I., 2017.
Selective neuronal lapses precede human cognitive lapses following sleep deprivation.
Nat. Med. 23, 1474–1480. https://doi.org/10.1038/nm.4433.
Oexle, K., 2018. Power versus phenotyping precision of genome-wide association studies on
sleep traits. Sleep 41, zsy211. https://doi.org/10.1093/sleep/zsy211.
Ortega, V.E., Meyers, D.A., 2014. Pharmacogenetics: implications of race and ethnicity on
defining genetic profiles for personalized medicine. J. Allergy Clin. Immunol.
133, 16–26. https://doi.org/10.1016/j.jaci.2013.10.040.Park, H., Niida, A., Miyano, S., Imoto, S., 2015. Sparse overlapping group lasso for integra-
tive multi-omics analysis. J. Comput. Biol. 22, 73–84. https://doi.org/10.1089/cmb.
2014.0197.
Pellegrino, R., Kavakli, I.H., Goel, N., Cardinale, C.J., Dinges, D.F., Kuna, S.T.,… Pack, A.I.,
2014. A novel BHLHE41 variant is associated with short sleep and resistance to sleep
deprivation in humans. Sleep 37, 327–1336. https://doi.org/10.5665/sleep.3924.Petersen, A., Witten, D., 2019. Data-adaptive additive modeling. Stat. Med. 38, 583–600.
https://doi.org/10.1002/sim.7859.
Porkka-Heiskanen, T., Strecker, R.E., Thakkar, M., Bjorkum, A.A., Greene, R.W.,
McCarley, R.W., 1997. Adenosine: a mediator of the sleep-inducing effects of prolonged
wakefulness. Science 276, 1265–1268.Price, A.L., Patterson, N.J., Plenge, R.M., Weinblatt, M.E., Shadick, N.A., Reich, D., 2006.
Principal components analysis corrects for stratification in genome-wide association
studies. Nat. Genet. 38, 904–909. https://doi.org/10.1038/ng1847.Price, A.L., Zaitlen, N.A., Reich, D., Patterson, N., 2010. New approaches to population
stratification in genome-wide association studies. Nat. Rev. Genet. 11, 459–463.https://doi.org/10.1038/nrg2813.
Puente, A.E., 1985. Wisconsin card sorting test. Test Critiques 4, 677–682.Radulovacki, M., 2005. Adenosine sleep theory: how I postulated it. Neurol. Res. 27, 137–138.
https://doi.org/10.1179/016164105X21814.
Renaux, C., Buzdugan, L., Kalisch, M., B€uhlmann, P., 2018. Hierarchical Inference for
Genome-Wide Association Studies: A View on Methodology With Software. Advance
online publication. https://arxiv.org/pdf/1805.02988.pdf.
R�etey, J.V., Adam, M., Gottselig, J.M., Khatami, R., D€urr, R., Achermann, P., Landolt, H.-P.,
2006. Adenosinergic mechanisms contribute to individual differences in sleep
deprivation-induced changes in neurobehavioral function and brain rhythmic activity.
J. Neurosci. 26, 10472–10479. https://doi.org/10.1523/jneurosci.1538-06.2006.R�etey, J.V., Adam,M., Khatami, R., Luhmann, U.F.O., Jung, H.H., Berger,W., Landolt, H.-P.,
2007. A genetic variation in the adenosine A2A receptor gene (ADORA2A) contributes to
individual sensitivity to caffeine effects on sleep. Clin. Pharmacol. Ther. 81, 692–698.https://doi.org/10.1038/sj.clpt.6100102.
Riggs, D.W., Yeager, R.A., Bhatnagar, A., 2018. Defining the human envirome: an omics
approach for assessing the environmental risk of cardiovascular disease. Circ. Res.
122, 1259–1275. https://doi.org/10.1161/circresaha.117.311230.Rupp, T.L., Wesensten, N.J., Balkin, T.J., 2012. Trait-like vulnerability to total and partial
sleep loss. Sleep 35, 1163–1172. https://doi.org/10.5665/sleep.2010.
155References
Salam, A., Dirac, P.A.M., Evans, J., Watts, G., 1990. Unification of Fundamental Force: The
First of the 1988 Dirac Memorial Lectures. Cambridge University Press, New York.
Satterfield, B.C., Wisor, J.P., Field, S.A., Schmidt, M.A., Van Dongen, H.P.A., 2015. TNFαG308A polymorphism is associated with resilience to sleep deprivation-induced psycho-
motor vigilance performance impairment in healthy young adults. Brain Behav. Immun.
47, 66–74. https://doi.org/10.1016/j.bbi.2014.12.009.Satterfield, B.C., Wisor, J.P., Schmidt, M.A., Van Dongen, H.P.A., 2017. Time-on-task effect
during sleep deprivation in healthy young adults is modulated by dopamine transporter
genotype. Sleep 40, zsx167. https://doi.org/10.1093/sleep/zsx167.
Satterfield, B.C., Hinson, J.M., Whitney, P., Schmidt, M.A., Wisor, J.P., Van Dongen, H.P.A.,
2018. Catechol-O-methyltransferase (COMT) genotype affects cognitive control during
total sleep deprivation. Cortex 99, 179–186. https://doi.org/10.1016/j.cortex.2017.11.012.Savitz, J., Solms, M., Ramesar, R., 2006. The molecular genetics of cognition: dopamine,
COMT and BDNF. Genes Brain Behav. 5, 311–328. https://doi.org/10.1111/j.1601-
183X.2005.00163.x.
Schmidt, C., Collette, F., Cajochen, C., Peigneux, P., 2007. A time to think: circadian rhythms
in human cognition. Cogn. Neuropsychol. 24, 755–789. https://doi.org/
10.1080/02643290701754158.
Shallice, T., 1982. Specific impairments of planning. Philos. Trans. R. Soc. Lond. B Biol. Sci.
298, 199–209. https://doi.org/10.1098/rstb.1982.0082.Slifstein, M., Kolachana, B., Simpson, E., Tabares, P., Cheng, B., Duvall, M., …Abi-
Dargham, A., 2008. COMT genotype predicts cortical-limbic D1 receptor availability
measured with [11C]NNC112 and PET. Mol. Psychiatry 13, 821–827. https://doi.org/10.1038/mp.2008.19.
Stucky, B., van de Geer, S.A., 2017. Sharp oracle inequalities for square root regularization.
J. Mach. Learn. Res. 18, 1–29.Stucky, B., van de Geer, S.A., 2018. Asymptotic confidence regions for high-dimensional
structured sparsity. IEEE Trans. Signal Process. 66, 2178–2190. https://doi.org/
10.1109/tsp.2018.2807399.
Tibshirani, R., 1996. Regression shrinkage and selection via the lasso. J. R. Stat. Soc. B. Meth-
odol. 58, 267–288. https://doi.org/10.1111/j.1467-9868.2011.00771.x.Tkachenko, O., Dinges, D.F., 2018. Interindividual variability in neurobehavioral response to
sleep loss: a comprehensive review. Neurosci. Biobehav. Rev. 89, 29–48. https://doi.org/10.1016/j.neubiorev.2018.03.017.
Tunbridge, E.M., Harrison, P.J., Weinberger, D.R., 2006. Catechol-O-methyltransferase, cog-
nition, and psychosis: Val158Met and beyond. Biol. Psychiatry 60, 141–151. https://doi.org/10.1016/j.biopsych.2005.10.024.
Urry, E., Landolt, H.-P., 2015. Adenosine, caffeine, and performance: from cognitive neuro-
science of sleep to sleep pharmacogenetics. Top. Behav. Neurosci. 25, 331–366.Uyhelji, H.A., Kupfer, D.M., White, V.L., Jackson, M.L., Van Dongen, H.P.A., Burian, D.M.,
2018. Exploring gene expression biomarker candidates for neurobehavioral impairment
from total sleep deprivation. BMC Genet. 19, 341. https://doi.org/10.1186/s12864-018-
4664-3.
Valomon, A., Holst, S.C., Borrello, A., Weigend, S., M€uller, T., Berger, W.,…Landolt, H.-P.,
2018. Effects of COMT genotype and tolcapone on lapses of sustained attention after sleep
deprivation in healthy young men. Neuropsychopharmacology 43, 1599–1607. https://doi.org/10.1038/s41386-018-0018-8.
van de Geer, S.A., 2014. Weakly decomposable regularization penalties and structured spar-
sity. Scand. J. Stat. 41, 72–86. https://doi.org/10.1111/sjos.12032.
156 CHAPTER 6 Genetics of sleep loss and cognitive impairment

van de Geer, S.A., B€uhlmann, P., Ritov, Y., Dezeure, R., 2014. On asymptotically optimal
confidence regions and tests for high-dimensional models. Ann. Stat. 42, 1166–1202.https://doi.org/10.1214/14-aos1221.
Van Dongen, H.P.A., Baynard, M.D., Maislin, G., Dinges, D.F., 2004a. Systematic interindi-
vidual differences in neurobehavioral impairment from sleep loss: evidence of trait-like
differential vulnerability. Sleep 27, 423–433. https://doi.org/10.1093/sleep/27.3.423.Van Dongen, H.P.A., Olofsen, E., Dinges, D.F., Maislin, G., 2004b. Mixed-model regression
analysis and dealing with interindividual differences. Methods Enzymol. 384, 139–171.https://doi.org/10.1016/S0076-6879(04)84010-2.
Van Dongen, H.P.A., Vitellaro, K.M., Dinges, D.F., 2005. Individual differences in adult hu-
man sleep and wakefulness: leitmotif for a research agenda. Sleep 28, 479–498. https://doi.org/10.1093/sleep/28.4.479.
Van Dongen, H.P.A., Caldwell, J.A., Caldwell, J.L., 2011a. Individual differences in cognitive
vulnerability to fatigue in the laboratory and in the workplace. Prog. Brain Res.
190, 145–153. https://doi.org/10.1016/B978-0-444-53817-8.00009-8.Van Dongen, H.P.A., Belenky, G., Krueger, J.M., 2011b. A local, bottom-up perspective on
sleep deprivation and neurobehavioral performance. Curr. Top. Med. Chem.
11, 2414–2422. https://doi.org/10.2174/156802611797470286.Viola, A.U., Archer, S.N., James, L., Groeger, J.A., Lo, J.C.Y., Skene, D.J., …Dijk, D.-J.,
2007. PER3 polymorphism predicts sleep structure and waking performance. Curr. Biol.
17, 613–618. https://doi.org/10.1016/j.cub.2007.01.073.Volkow, N.D., Fowler, J.S., Logan, J., Alexoff, D., Zhu,W., Telang, F.,…Apelskog-Torres, K.,
2009. Effects of modafinil on dopamine and dopamine transporters in the male human brain:
clinical implications. JAMA 301, 1148–1154. https://doi.org/10.1001/jama.2009.351.
Vyazovskiy, V.V., Olcese, U., Hanlon, E., Nir, Y., Cirelli, C., Tononi, G., 2011. Local sleep in
awake rats. Nature 472, 443–447. https://doi.org/10.1038/nature10009.local.Wang, Y.X., Huang, H., 2014. Review on statistical methods for gene network reconstruction
using expression data. J. Theor. Biol. 362, 53–61. https://doi.org/10.1016/j.
jtbi.2014.03.040.
Wang, Z., Xu, W., Lucas, F.A.S., Liu, Y., 2013. Incorporating prior knowledge into Gene Net-
work Study. Bioinformatics 29, 2633–2640. https://doi.org/10.1093/bioinformatics/btt443.
Welsh, M.C., Satterlee-Cartmell, T., Stine, M., 1999. Towers of Hanoi and London: contribu-
tion of working memory and inhibition to performance. Brain Cogn. 41, 231–242. https://doi.org/10.1006/brcg.1999.1123.
Wesensten, N.J., Killgore, W.D.S., Balkin, T.J., 2005. Performance and alertness effects of
caffeine, dextroamphetamine, and modafinil during sleep deprivation. J. Sleep Res.
14, 255–266. https://doi.org/10.1111/j.1365-2869.2005.00468.x.Whitney, P., Hinson, J.M., 2010. Measurement of cognition in studies of sleep deprivation.
Prog. Brain Res. 184, 37–48. https://doi.org/10.1016/B978-0-444-53702-7.00003-8.Whitney, P., Hinson, J.M., Jackson, M.L., Van Dongen, H.P.A., 2015. Feedback blunting: To-
tal sleep deprivation impairs decision making that requires updating based on feedback.
Sleep 38, 745–754. https://doi.org/10.5665/sleep.4668.Whitney, P., Hinson, J.M., Satterfield, B.C., Grant, D.A., Honn, K.A., Van Dongen, H.P.A.,
2017. Sleep deprivation diminishes attentional control effectiveness and impairs flexible
adaptation to changing conditions. Sci. Rep. 7, 16020. https://doi.org/10.1038/s41598-
017-16165-z.
Wisor, J.P., Nishino, S., Sora, I., Uhl, G.H., Mignot, E., Edgar, D.M., 2001. Dopaminergic role
in stimulant-induced wakefulness. J. Neurosci. 21, 1787–1794. https://doi.org/10.1523/jneurosci.21-05-01787.2001.
157References
Yang, A., Palmer, A.A., de Wit, H., 2010. Genetics of caffeine consumption and responses to
caffeine. Psychopharmacology (Berl) 211, 245–257. https://doi.org/10.1007/s00213-010-1900-1.
Yang, H., Shew, W.L., Roy, R., Plenz, D., 2012. Maximal variability of phase synchrony in
cortical networks with neuronal avalanches. J. Neurosci. 32, 1061–1072. https://doi.org/10.1523/jneurosci.2771-11.2012.
Yuan, M., Lin, Y., 2005. Model selection and estimation in regression with grouped variables.
J. R. Stat. Soc. B. Methodol. 68, 49–67. https://doi.org/10.1111/j.1467-9868.2005.00532.x.Zatz, M., 2000. On the acceptance of new experimental findings in science: is replication the
key? J. Biol. Rhythms 15, 275–276. https://doi.org/10.1177/074873000129001332.Zou, H., Hastie, T., 2005. Regularization and variable selection via the elastic net. J. R. Stat.
Soc. B. Methodol. 67, 301–320. https://doi.org/10.1111/j.1467-9868.2005.00503.x.
158 CHAPTER 6 Genetics of sleep loss and cognitive impairment

1
pii: zsx167 http://dx.doi.org/10.1093/sleep/zsx167
SLEEP, Vol. 40, No. 12, 2017 Time-on-Task Effect and DAT1—Satterfield et al.
ORIGINAL ARTICLE
Time-on-Task Effect During Sleep Deprivation in Healthy Young Adults Is Modulated by Dopamine Transporter GenotypeBrieann C. Satterfield, PhD1; Jonathan P. Wisor, PhD1; Michelle A. Schmidt, MS1; Hans P.A. Van Dongen, PhD1
1Sleep and Performance Research Center and Elson S. Floyd College of Medicine, Washington State University, Spokane, WA
Brieann C. Satterfield is now at Department of Psychiatry, College of Medicine, University of Arizona, Tucson, AZ
Study Objectives: The time-on-task (TOT) effect and total sleep deprivation (TSD) have similar effects on neurobehavioral functioning, including increased performance instability during tasks requiring sustained attention. The TOT effect is exacerbated by TSD, suggesting potentially overlapping mechanisms. We probed these mechanisms by investigating genotype–phenotype relationships on psychomotor vigilance test (PVT) performance for 3 a-priori selected genes previously linked to the TOT effect and/or TSD: dopamine active transporter 1 (DAT1), catechol-O-methyltransferase (COMT), and tumor necrosis factor alpha (TNFα).Methods: N = 82 healthy adults participated in 1 of 3 laboratory studies. A 10-min PVT was administered repeatedly during 38 h of TSD. We assessed changes in response time (RT) across each minute of the PVT as a function of time awake and genotype. Additionally, cumulative relative RT frequency distributions were constructed to examine changes in performance from the first to the second 5 min of the PVT as a function of genotype.Results: DAT1, COMT, and TNFα were associated with differences in the build-up of the TOT effect across the 10-min PVT. DAT1 additionally modulated the interaction between TSD and the TOT effect. Subjects homozygous for the DAT1 10-repeat allele were relatively protected against TOT deficits on the PVT during TSD compared to carriers of the 9-repeat allele.Conclusions: DAT1 is known to regulate dopamine reuptake and is highly expressed in the striatum. Our results implicate striatal dopamine in mechanisms involved in performance instability that appear to be common to TSD and the TOT effect. Furthermore, DAT1 may be a candidate biomarker of resilience to the build-up of performance impairment across TOT due to TSD.Keywords: cognitive performance, fatigue, vigilance decrement, mental workload, dopamine active transporter 1 (DAT1), catechol-O-methyltransferase (COMT), tumor necrosis factor alpha (TNFα), striatum, psychomotor vigilance test (PVT), total sleep deprivation.
INTRODUCTIONThe “time-on-task effect” or “vigilance decrement” refers to a progressive decrement of performance across the duration of a cognitive task. The phenomenon tends to be particularly pro-nounced during sustained engagement in a vigilance task,1 and a rest break provides recuperation.2 The time-on-task (TOT) effect is a critical determinant of productivity and safety in systems monitoring, transportation, and security operations.3–9 Yet, the neurobiological mechanisms underlying the TOT effect remain unclear.10
Importantly, the TOT effect entails an increase in performance “variability” over the duration of a task.11 On the psychomotor vigilance test (PVT)—a vigilance task with a well-documented TOT effect12—this is observed as a steady increase in the stand-ard deviation of response times (RTs) across the 10-min dur-ation of the task.13 Interestingly, increased RT variability is also a hallmark of how sleep deprivation affects performance on the PVT.14 Moreover, the TOT effect interacts with sleep depriv-ation, such that prior sleep loss amplifies the increase in RT variability from the TOT effect.13 This interaction has been observed for sleep loss from total sleep deprivation (TSD) as well as sustained sleep restriction15,16 and suggests that the effects of TOT and sleep loss on vigilance task performance may have shared underlying mechanisms.13,15,17,18
It has been posited that the effects on vigilance performance due to TOT, sleep loss, and their interaction may collectively be the result of sleep-regulatory processes induced by sustained use of neuronal networks subserving task performance.15 Specifically, it has been speculated that these effects are caused by failure in cognitive pathways to adequately process information due to local, use-dependent expression of a neuronal, sleep-like state.19 This “local sleep”20 would lead to cognitive instability during otherwise functional wakefulness, thus presumably giving rise to the observed performance variability.21 Neuroimaging stud-ies have provided findings that appear to be consistent with this view,19,22,23 but more conclusive evidence is needed.
We set out to further examine the idea that the effects of TOT and sleep loss on vigilance task performance have shared underlying mechanisms, by investigating genetic polymor-phisms implicated in the TOT effect or the performance varia-bility associated with sleep deprivation. A priori we selected 3 genes of interest:
• DAT1: The dopamine transporter 1 gene (DAT1, also known as the dopamine active transporter or SLC6A3) has a polymor-phism involving a variable number tandem repeat (VNTR) of 40 base pairs in the 3′ untranslated region, of which the 9- and 10-repeat alleles are the most common in the popu-
Statement of SignificanceThe time-on-task effect—the performance decrement across the duration of a performance task—is substantially amplified by sleep deprivation. Both the time-on-task effect and sleep deprivation are characterized by performance instability, separately and in interaction, suggesting overlapping mechanisms. Previous work implicated dopamine active transporter 1 (DAT1) genotype in the magnitude of the time-on-task effect. We showed that DAT1 is also associated with the amplification of performance instability due to interaction between the time-on-task effect and sleep deprivation, implicating DAT1 in shared underlying mechanisms. DAT1 is highly expressed in the striatum, where dopaminergic cognition-related mechanisms intertwine with adenosinergic mechanisms of sleep/wake homeostasis, thus suggesting that the striatum is involved in performance instability from time-on-task and sleep deprivation.
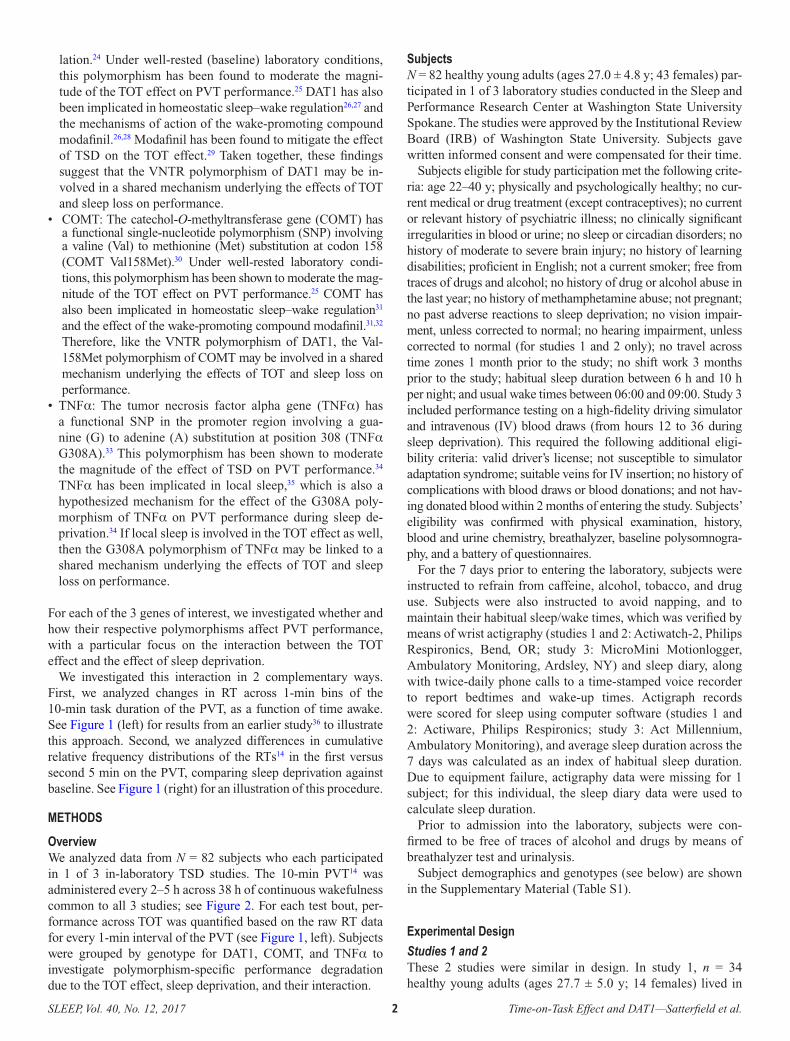
2SLEEP, Vol. 40, No. 12, 2017 Time-on-Task Effect and DAT1—Satterfield et al.
lation.24 Under well-rested (baseline) laboratory conditions, this polymorphism has been found to moderate the magni-tude of the TOT effect on PVT performance.25 DAT1 has also been implicated in homeostatic sleep–wake regulation26,27 and the mechanisms of action of the wake-promoting compound modafinil.26,28 Modafinil has been found to mitigate the effect of TSD on the TOT effect.29 Taken together, these findings suggest that the VNTR polymorphism of DAT1 may be in-volved in a shared mechanism underlying the effects of TOT and sleep loss on performance.
• COMT: The catechol-O-methyltransferase gene (COMT) has a functional single-nucleotide polymorphism (SNP) involving a valine (Val) to methionine (Met) substitution at codon 158 (COMT Val158Met).30 Under well-rested laboratory condi-tions, this polymorphism has been shown to moderate the mag-nitude of the TOT effect on PVT performance.25 COMT has also been implicated in homeostatic sleep–wake regulation31 and the effect of the wake-promoting compound modafinil.31,32 Therefore, like the VNTR polymorphism of DAT1, the Val-158Met polymorphism of COMT may be involved in a shared mechanism underlying the effects of TOT and sleep loss on performance.
• TNFα: The tumor necrosis factor alpha gene (TNFα) has a functional SNP in the promoter region involving a gua-nine (G) to adenine (A) substitution at position 308 (TNFα G308A).33 This polymorphism has been shown to moderate the magnitude of the effect of TSD on PVT performance.34 TNFα has been implicated in local sleep,35 which is also a hypothesized mechanism for the effect of the G308A poly-morphism of TNFα on PVT performance during sleep de-privation.34 If local sleep is involved in the TOT effect as well, then the G308A polymorphism of TNFα may be linked to a shared mechanism underlying the effects of TOT and sleep loss on performance.
For each of the 3 genes of interest, we investigated whether and how their respective polymorphisms affect PVT performance, with a particular focus on the interaction between the TOT effect and the effect of sleep deprivation.
We investigated this interaction in 2 complementary ways. First, we analyzed changes in RT across 1-min bins of the 10-min task duration of the PVT, as a function of time awake. See Figure 1 (left) for results from an earlier study36 to illustrate this approach. Second, we analyzed differences in cumulative relative frequency distributions of the RTs14 in the first versus second 5 min on the PVT, comparing sleep deprivation against baseline. See Figure 1 (right) for an illustration of this procedure.
METHODS
OverviewWe analyzed data from N = 82 subjects who each participated in 1 of 3 in-laboratory TSD studies. The 10-min PVT14 was administered every 2–5 h across 38 h of continuous wakefulness common to all 3 studies; see Figure 2. For each test bout, per-formance across TOT was quantified based on the raw RT data for every 1-min interval of the PVT (see Figure 1, left). Subjects were grouped by genotype for DAT1, COMT, and TNFα to investigate polymorphism-specific performance degradation due to the TOT effect, sleep deprivation, and their interaction.
SubjectsN = 82 healthy young adults (ages 27.0 ± 4.8 y; 43 females) par-ticipated in 1 of 3 laboratory studies conducted in the Sleep and Performance Research Center at Washington State University Spokane. The studies were approved by the Institutional Review Board (IRB) of Washington State University. Subjects gave written informed consent and were compensated for their time.
Subjects eligible for study participation met the following crite-ria: age 22–40 y; physically and psychologically healthy; no cur-rent medical or drug treatment (except contraceptives); no current or relevant history of psychiatric illness; no clinically significant irregularities in blood or urine; no sleep or circadian disorders; no history of moderate to severe brain injury; no history of learning disabilities; proficient in English; not a current smoker; free from traces of drugs and alcohol; no history of drug or alcohol abuse in the last year; no history of methamphetamine abuse; not pregnant; no past adverse reactions to sleep deprivation; no vision impair-ment, unless corrected to normal; no hearing impairment, unless corrected to normal (for studies 1 and 2 only); no travel across time zones 1 month prior to the study; no shift work 3 months prior to the study; habitual sleep duration between 6 h and 10 h per night; and usual wake times between 06:00 and 09:00. Study 3 included performance testing on a high-fidelity driving simulator and intravenous (IV) blood draws (from hours 12 to 36 during sleep deprivation). This required the following additional eligi-bility criteria: valid driver’s license; not susceptible to simulator adaptation syndrome; suitable veins for IV insertion; no history of complications with blood draws or blood donations; and not hav-ing donated blood within 2 months of entering the study. Subjects’ eligibility was confirmed with physical examination, history, blood and urine chemistry, breathalyzer, baseline polysomnogra-phy, and a battery of questionnaires.
For the 7 days prior to entering the laboratory, subjects were instructed to refrain from caffeine, alcohol, tobacco, and drug use. Subjects were also instructed to avoid napping, and to maintain their habitual sleep/wake times, which was verified by means of wrist actigraphy (studies 1 and 2: Actiwatch-2, Philips Respironics, Bend, OR; study 3: MicroMini Motionlogger, Ambulatory Monitoring, Ardsley, NY) and sleep diary, along with twice-daily phone calls to a time-stamped voice recorder to report bedtimes and wake-up times. Actigraph records were scored for sleep using computer software (studies 1 and 2: Actiware, Philips Respironics; study 3: Act Millennium, Ambulatory Monitoring), and average sleep duration across the 7 days was calculated as an index of habitual sleep duration. Due to equipment failure, actigraphy data were missing for 1 subject; for this individual, the sleep diary data were used to calculate sleep duration.
Prior to admission into the laboratory, subjects were con-firmed to be free of traces of alcohol and drugs by means of breathalyzer test and urinalysis.
Subject demographics and genotypes (see below) are shown in the Supplementary Material (Table S1).
Experimental Design
Studies 1 and 2These 2 studies were similar in design. In study 1, n = 34 healthy young adults (ages 27.7 ± 5.0 y; 14 females) lived in

3SLEEP, Vol. 40, No. 12, 2017 Time-on-Task Effect and DAT1—Satterfield et al.
the laboratory for 4 days (3 nights). In study 2, n = 36 healthy young adults (ages 26.6 ± 4.8 y; 22 females) likewise lived in the laboratory for 4 days (3 nights). During both studies, sub-jects had a baseline day with a 10-h sleep opportunity (22:00–08:00), subsequently underwent 38 h of TSD, and then had a 10-h recovery sleep opportunity (22:00–08:00). During the 38 h of TSD, the PVT was administered 12 times at 2–5 h intervals (see Figure 2). Studies 1 and 2 have previously been described elsewhere.34,37
Study 3In study 3, n = 12 healthy young adults (ages 26.6 ± 4.4 y; 7 females) lived in the laboratory for 7 days (6 nights). Subjects had 2 baseline days, each with a 10-h sleep opportunity (22:00–08:00), subsequently underwent 62 h of TSD—of which only the first 38 h were used for analysis here—and then had 2 recovery days with 10-h sleep opportunities (22:00–08:00). During the first 38 h of TSD, the PVT was administered 12 times at 2–5 h intervals (see Figure 2). Study 3 has previously been described elsewhere.38
Figure 1—Illustration of analysis approaches. Left: mean RT (±standard error) in 1-min bins for each of twelve 10-min PVTs administered at 3-h intervals across 38 h of total sleep deprivation in an earlier study (16 healthy subjects).36 The graph shows the increase in mean RT across the 1-min bins in each test bout, with the rate of change increasing substantially with progressing time awake. Data are plotted against the start times of the PVT bouts; placement of the 1-min bins in each test bout is not to scale on the clock time axis. Graph modified from Grant et al.36 with permission from Springer Science+Business Media. Right: cumulative relative RT frequency distributions, showing on the ordinate the number of responses (expressed relative to the grand total number of responses) that is equal to or faster than a given RT on the abscissa. The curves shown here represent cumulative relative RT frequency distributions in the first 5 min (solid curve) versus second 5 min (dashed curve) of the 10-min PVT under conditions of sleep deprivation (simulated based on the diffusion model for one-choice reaction-time tasks43 using exaggerated parameter values for illustration purposes). The yellow-shaded area contains the fastest RTs, where the 2 curves begin to separate (notice they start at the same point on the RT axis in this illustration). The purple-shaded portion shows the heart of the cumulative relative frequency distributions, where the curves are separating progressively. Notice that the vertical separation is maximal at ~500 ms, which coincides with the cut-off traditionally used to define lapses of attention (ie, RTs ≥ 500 ms) on the PVT.14 The red-shaded area shows the slower RTs or lapse domain, where the curves begin to approach each other again (ultimately asymptoting on 1 if the abscissa were extended). PVT = psychomotor vigilance test; RT = response time.
Figure 2—Simplified schematic of the laboratory study design. After 1 (studies 1 and 2) or 2 (study 3) baseline days with 10 h sleep oppor-tunities (22:00–08:00), subjects were kept awake for at least 38 h under constant behavioral monitoring. The PVT was administered at 2–5 h intervals throughout scheduled wakefulness. Test bouts serving as baseline (hours 1–14 of wakefulness) are indicated with a black square; test bouts capturing nighttime sleep deprivation (hours 15–24 of wakefulness) are indicated with a blue diamond; and test bouts capturing day-time sleep deprivation (hours 25–38 of wakefulness) are indicated with a red circle. Gray denotes scheduled wakefulness, and black indicates a baseline sleep opportunity (starting at 22:00 on the preceding day). Subjects went to bed for recovery sleep at 22:00 on day 3 (studies 1 and 2) or were kept awake for an additional 24 h (study 3) (not shown). PVT = psychomotor vigilance test.
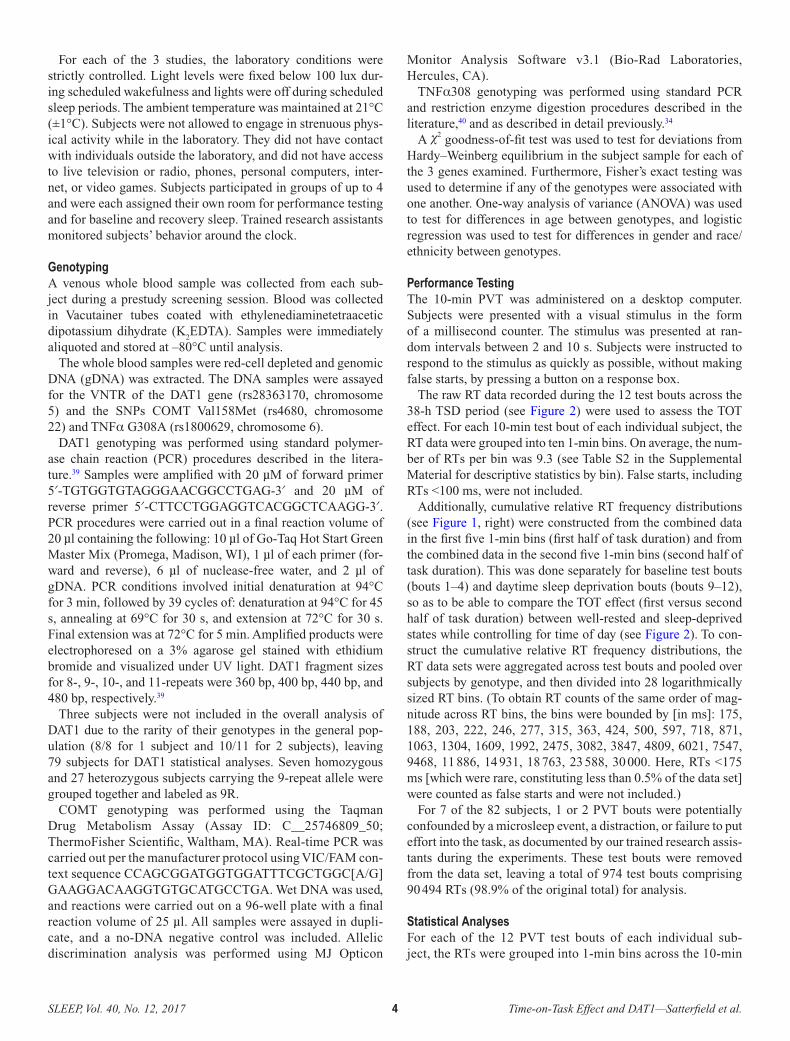
4SLEEP, Vol. 40, No. 12, 2017 Time-on-Task Effect and DAT1—Satterfield et al.
For each of the 3 studies, the laboratory conditions were strictly controlled. Light levels were fixed below 100 lux dur-ing scheduled wakefulness and lights were off during scheduled sleep periods. The ambient temperature was maintained at 21°C (±1°C). Subjects were not allowed to engage in strenuous phys-ical activity while in the laboratory. They did not have contact with individuals outside the laboratory, and did not have access to live television or radio, phones, personal computers, inter-net, or video games. Subjects participated in groups of up to 4 and were each assigned their own room for performance testing and for baseline and recovery sleep. Trained research assistants monitored subjects’ behavior around the clock.
GenotypingA venous whole blood sample was collected from each sub-ject during a prestudy screening session. Blood was collected in Vacutainer tubes coated with ethylenediaminetetraacetic dipotassium dihydrate (K
2EDTA). Samples were immediately
aliquoted and stored at –80°C until analysis.The whole blood samples were red-cell depleted and genomic
DNA (gDNA) was extracted. The DNA samples were assayed for the VNTR of the DAT1 gene (rs28363170, chromosome 5) and the SNPs COMT Val158Met (rs4680, chromosome 22) and TNFα G308A (rs1800629, chromosome 6).
DAT1 genotyping was performed using standard polymer-ase chain reaction (PCR) procedures described in the litera-ture.39 Samples were amplified with 20 µM of forward primer 5′-TGTGGTGTAGGGAACGGCCTGAG-3′ and 20 µM of reverse primer 5′-CTTCCTGGAGGTCACGGCTCAAGG-3′. PCR procedures were carried out in a final reaction volume of 20 µl containing the following: 10 µl of Go-Taq Hot Start Green Master Mix (Promega, Madison, WI), 1 µl of each primer (for-ward and reverse), 6 µl of nuclease-free water, and 2 µl of gDNA. PCR conditions involved initial denaturation at 94°C for 3 min, followed by 39 cycles of: denaturation at 94°C for 45 s, annealing at 69°C for 30 s, and extension at 72°C for 30 s. Final extension was at 72°C for 5 min. Amplified products were electrophoresed on a 3% agarose gel stained with ethidium bromide and visualized under UV light. DAT1 fragment sizes for 8-, 9-, 10-, and 11-repeats were 360 bp, 400 bp, 440 bp, and 480 bp, respectively.39
Three subjects were not included in the overall analysis of DAT1 due to the rarity of their genotypes in the general pop-ulation (8/8 for 1 subject and 10/11 for 2 subjects), leaving 79 subjects for DAT1 statistical analyses. Seven homozygous and 27 heterozygous subjects carrying the 9-repeat allele were grouped together and labeled as 9R.
COMT genotyping was performed using the Taqman Drug Metabolism Assay (Assay ID: C__25746809_50; ThermoFisher Scientific, Waltham, MA). Real-time PCR was carried out per the manufacturer protocol using VIC/FAM con-text sequence CCAGCGGATGGTGGATTTCGCTGGC[A/G]GAAGGACAAGGTGTGCATGCCTGA. Wet DNA was used, and reactions were carried out on a 96-well plate with a final reaction volume of 25 µl. All samples were assayed in dupli-cate, and a no-DNA negative control was included. Allelic discrimination analysis was performed using MJ Opticon
Monitor Analysis Software v3.1 (Bio-Rad Laboratories, Hercules, CA).
TNFα308 genotyping was performed using standard PCR and restriction enzyme digestion procedures described in the literature,40 and as described in detail previously.34
A χ2 goodness-of-fit test was used to test for deviations from Hardy–Weinberg equilibrium in the subject sample for each of the 3 genes examined. Furthermore, Fisher’s exact testing was used to determine if any of the genotypes were associated with one another. One-way analysis of variance (ANOVA) was used to test for differences in age between genotypes, and logistic regression was used to test for differences in gender and race/ethnicity between genotypes.
Performance TestingThe 10-min PVT was administered on a desktop computer. Subjects were presented with a visual stimulus in the form of a millisecond counter. The stimulus was presented at ran-dom intervals between 2 and 10 s. Subjects were instructed to respond to the stimulus as quickly as possible, without making false starts, by pressing a button on a response box.
The raw RT data recorded during the 12 test bouts across the 38-h TSD period (see Figure 2) were used to assess the TOT effect. For each 10-min test bout of each individual subject, the RT data were grouped into ten 1-min bins. On average, the num-ber of RTs per bin was 9.3 (see Table S2 in the Supplemental Material for descriptive statistics by bin). False starts, including RTs <100 ms, were not included.
Additionally, cumulative relative RT frequency distributions (see Figure 1, right) were constructed from the combined data in the first five 1-min bins (first half of task duration) and from the combined data in the second five 1-min bins (second half of task duration). This was done separately for baseline test bouts (bouts 1–4) and daytime sleep deprivation bouts (bouts 9–12), so as to be able to compare the TOT effect (first versus second half of task duration) between well-rested and sleep-deprived states while controlling for time of day (see Figure 2). To con-struct the cumulative relative RT frequency distributions, the RT data sets were aggregated across test bouts and pooled over subjects by genotype, and then divided into 28 logarithmically sized RT bins. (To obtain RT counts of the same order of mag-nitude across RT bins, the bins were bounded by [in ms]: 175, 188, 203, 222, 246, 277, 315, 363, 424, 500, 597, 718, 871, 1063, 1304, 1609, 1992, 2475, 3082, 3847, 4809, 6021, 7547, 9468, 11 886, 14 931, 18 763, 23 588, 30 000. Here, RTs <175 ms [which were rare, constituting less than 0.5% of the data set] were counted as false starts and were not included.)
For 7 of the 82 subjects, 1 or 2 PVT bouts were potentially confounded by a microsleep event, a distraction, or failure to put effort into the task, as documented by our trained research assis-tants during the experiments. These test bouts were removed from the data set, leaving a total of 974 test bouts comprising 90 494 RTs (98.9% of the original total) for analysis.
Statistical AnalysesFor each of the 12 PVT test bouts of each individual sub-ject, the RTs were grouped into 1-min bins across the 10-min
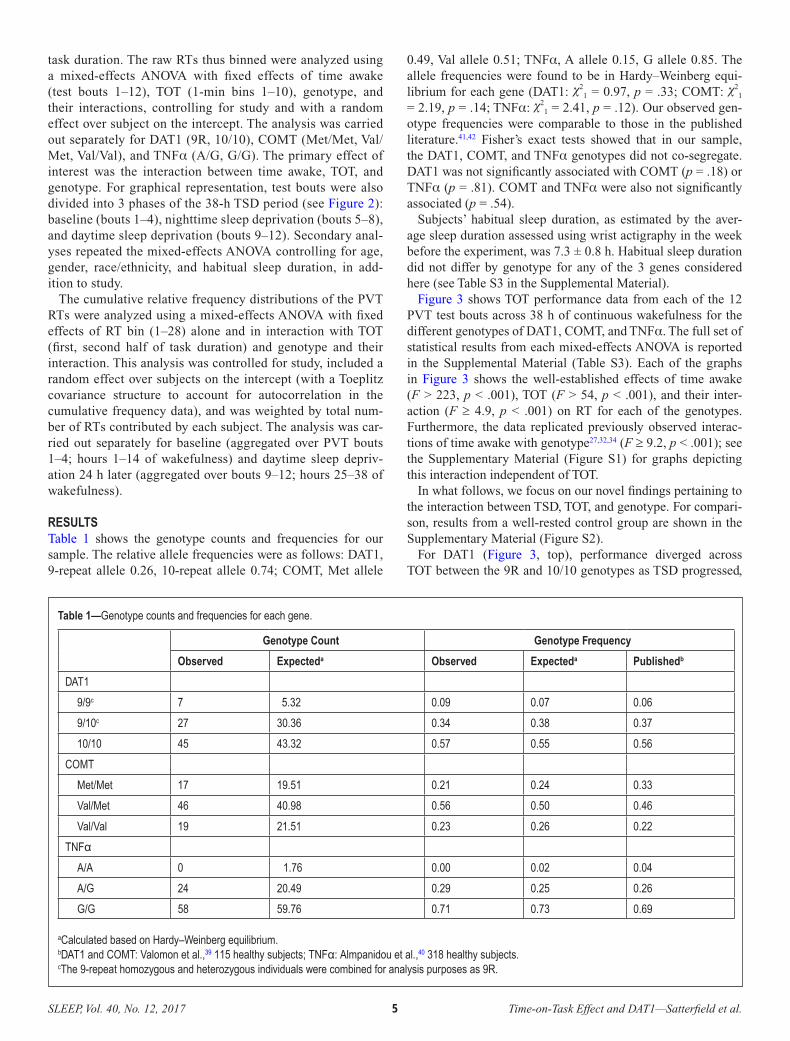
5SLEEP, Vol. 40, No. 12, 2017 Time-on-Task Effect and DAT1—Satterfield et al.
task duration. The raw RTs thus binned were analyzed using a mixed-effects ANOVA with fixed effects of time awake (test bouts 1–12), TOT (1-min bins 1–10), genotype, and their interactions, controlling for study and with a random effect over subject on the intercept. The analysis was carried out separately for DAT1 (9R, 10/10), COMT (Met/Met, Val/Met, Val/Val), and TNFα (A/G, G/G). The primary effect of interest was the interaction between time awake, TOT, and genotype. For graphical representation, test bouts were also divided into 3 phases of the 38-h TSD period (see Figure 2): baseline (bouts 1–4), nighttime sleep deprivation (bouts 5–8), and daytime sleep deprivation (bouts 9–12). Secondary anal-yses repeated the mixed-effects ANOVA controlling for age, gender, race/ethnicity, and habitual sleep duration, in add-ition to study.
The cumulative relative frequency distributions of the PVT RTs were analyzed using a mixed-effects ANOVA with fixed effects of RT bin (1–28) alone and in interaction with TOT (first, second half of task duration) and genotype and their interaction. This analysis was controlled for study, included a random effect over subjects on the intercept (with a Toeplitz covariance structure to account for autocorrelation in the cumulative frequency data), and was weighted by total num-ber of RTs contributed by each subject. The analysis was car-ried out separately for baseline (aggregated over PVT bouts 1–4; hours 1–14 of wakefulness) and daytime sleep depriv-ation 24 h later (aggregated over bouts 9–12; hours 25–38 of wakefulness).
RESULTSTable 1 shows the genotype counts and frequencies for our sample. The relative allele frequencies were as follows: DAT1, 9-repeat allele 0.26, 10-repeat allele 0.74; COMT, Met allele
0.49, Val allele 0.51; TNFα, A allele 0.15, G allele 0.85. The allele frequencies were found to be in Hardy–Weinberg equi-librium for each gene (DAT1: χ2
1 = 0.97, p = .33; COMT: χ21
= 2.19, p = .14; TNFα: χ21 = 2.41, p = .12). Our observed gen-
otype frequencies were comparable to those in the published literature.41,42 Fisher’s exact tests showed that in our sample, the DAT1, COMT, and TNFα genotypes did not co-segregate. DAT1 was not significantly associated with COMT (p = .18) or TNFα (p = .81). COMT and TNFα were also not significantly associated (p = .54).
Subjects’ habitual sleep duration, as estimated by the aver-age sleep duration assessed using wrist actigraphy in the week before the experiment, was 7.3 ± 0.8 h. Habitual sleep duration did not differ by genotype for any of the 3 genes considered here (see Table S3 in the Supplemental Material).
Figure 3 shows TOT performance data from each of the 12 PVT test bouts across 38 h of continuous wakefulness for the different genotypes of DAT1, COMT, and TNFα. The full set of statistical results from each mixed-effects ANOVA is reported in the Supplemental Material (Table S3). Each of the graphs in Figure 3 shows the well-established effects of time awake (F > 223, p < .001), TOT (F > 54, p < .001), and their inter-action (F ≥ 4.9, p < .001) on RT for each of the genotypes. Furthermore, the data replicated previously observed interac-tions of time awake with genotype27,32,34 (F ≥ 9.2, p < .001); see the Supplementary Material (Figure S1) for graphs depicting this interaction independent of TOT.
In what follows, we focus on our novel findings pertaining to the interaction between TSD, TOT, and genotype. For compari-son, results from a well-rested control group are shown in the Supplementary Material (Figure S2).
For DAT1 (Figure 3, top), performance diverged across TOT between the 9R and 10/10 genotypes as TSD progressed,
Table 1—Genotype counts and frequencies for each gene.
Genotype Count Genotype Frequency
Observed Expecteda Observed Expecteda Publishedb
DAT1
9/9c 7 5.32 0.09 0.07 0.06
9/10c 27 30.36 0.34 0.38 0.37
10/10 45 43.32 0.57 0.55 0.56
COMT
Met/Met 17 19.51 0.21 0.24 0.33
Val/Met 46 40.98 0.56 0.50 0.46
Val/Val 19 21.51 0.23 0.26 0.22
TNFα A/A 0 1.76 0.00 0.02 0.04
A/G 24 20.49 0.29 0.25 0.26
G/G 58 59.76 0.71 0.73 0.69
aCalculated based on Hardy–Weinberg equilibrium.bDAT1 and COMT: Valomon et al.,39 115 healthy subjects; TNFα: Almpanidou et al.,40 318 healthy subjects.cThe 9-repeat homozygous and heterozygous individuals were combined for analysis purposes as 9R.
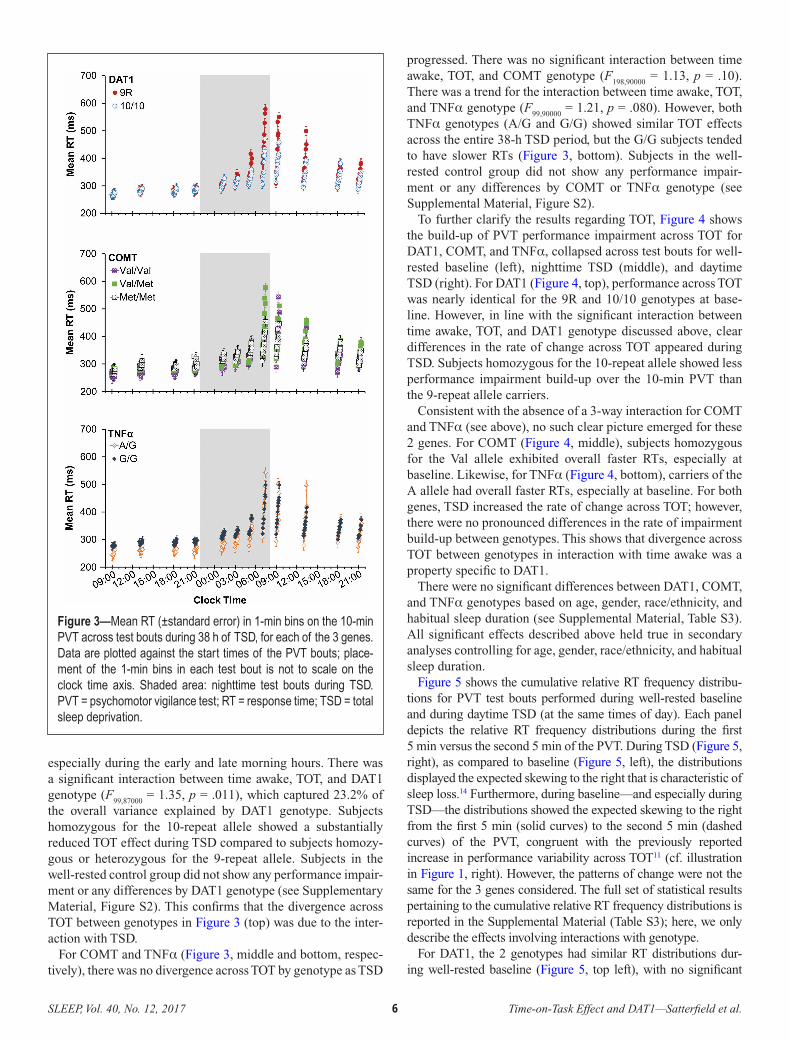
6SLEEP, Vol. 40, No. 12, 2017 Time-on-Task Effect and DAT1—Satterfield et al.
especially during the early and late morning hours. There was a significant interaction between time awake, TOT, and DAT1 genotype (F
99,87000 = 1.35, p = .011), which captured 23.2% of
the overall variance explained by DAT1 genotype. Subjects homozygous for the 10-repeat allele showed a substantially reduced TOT effect during TSD compared to subjects homozy-gous or heterozygous for the 9-repeat allele. Subjects in the well-rested control group did not show any performance impair-ment or any differences by DAT1 genotype (see Supplementary Material, Figure S2). This confirms that the divergence across TOT between genotypes in Figure 3 (top) was due to the inter-action with TSD.
For COMT and TNFα (Figure 3, middle and bottom, respec-tively), there was no divergence across TOT by genotype as TSD
progressed. There was no significant interaction between time awake, TOT, and COMT genotype (F
198,90000 = 1.13, p = .10).
There was a trend for the interaction between time awake, TOT, and TNFα genotype (F
99,90000 = 1.21, p = .080). However, both
TNFα genotypes (A/G and G/G) showed similar TOT effects across the entire 38-h TSD period, but the G/G subjects tended to have slower RTs (Figure 3, bottom). Subjects in the well-rested control group did not show any performance impair-ment or any differences by COMT or TNFα genotype (see Supplemental Material, Figure S2).
To further clarify the results regarding TOT, Figure 4 shows the build-up of PVT performance impairment across TOT for DAT1, COMT, and TNFα, collapsed across test bouts for well-rested baseline (left), nighttime TSD (middle), and daytime TSD (right). For DAT1 (Figure 4, top), performance across TOT was nearly identical for the 9R and 10/10 genotypes at base-line. However, in line with the significant interaction between time awake, TOT, and DAT1 genotype discussed above, clear differences in the rate of change across TOT appeared during TSD. Subjects homozygous for the 10-repeat allele showed less performance impairment build-up over the 10-min PVT than the 9-repeat allele carriers.
Consistent with the absence of a 3-way interaction for COMT and TNFα (see above), no such clear picture emerged for these 2 genes. For COMT (Figure 4, middle), subjects homozygous for the Val allele exhibited overall faster RTs, especially at baseline. Likewise, for TNFα (Figure 4, bottom), carriers of the A allele had overall faster RTs, especially at baseline. For both genes, TSD increased the rate of change across TOT; however, there were no pronounced differences in the rate of impairment build-up between genotypes. This shows that divergence across TOT between genotypes in interaction with time awake was a property specific to DAT1.
There were no significant differences between DAT1, COMT, and TNFα genotypes based on age, gender, race/ethnicity, and habitual sleep duration (see Supplemental Material, Table S3). All significant effects described above held true in secondary analyses controlling for age, gender, race/ethnicity, and habitual sleep duration.
Figure 5 shows the cumulative relative RT frequency distribu-tions for PVT test bouts performed during well-rested baseline and during daytime TSD (at the same times of day). Each panel depicts the relative RT frequency distributions during the first 5 min versus the second 5 min of the PVT. During TSD (Figure 5, right), as compared to baseline (Figure 5, left), the distributions displayed the expected skewing to the right that is characteristic of sleep loss.14 Furthermore, during baseline—and especially during TSD—the distributions showed the expected skewing to the right from the first 5 min (solid curves) to the second 5 min (dashed curves) of the PVT, congruent with the previously reported increase in performance variability across TOT11 (cf. illustration in Figure 1, right). However, the patterns of change were not the same for the 3 genes considered. The full set of statistical results pertaining to the cumulative relative RT frequency distributions is reported in the Supplemental Material (Table S3); here, we only describe the effects involving interactions with genotype.
For DAT1, the 2 genotypes had similar RT distributions dur-ing well-rested baseline (Figure 5, top left), with no significant
Figure 3—Mean RT (±standard error) in 1-min bins on the 10-min PVT across test bouts during 38 h of TSD, for each of the 3 genes. Data are plotted against the start times of the PVT bouts; place-ment of the 1-min bins in each test bout is not to scale on the clock time axis. Shaded area: nighttime test bouts during TSD. PVT = psychomotor vigilance test; RT = response time; TSD = total sleep deprivation.

7SLEEP, Vol. 40, No. 12, 2017 Time-on-Task Effect and DAT1—Satterfield et al.
genotype interactions. During TSD, however, the distribution curves for the DAT1 genotypes diverged (Figure 5, top right). There was a significant interaction of RT bin by genotype (F
28,4235 = 1.61, p = .022). The RT distributions diverged in the
lapse domain (Figure 5, top right, red-shaded area). In the 9R group, longer RTs occurred more frequently during the second 5 min (dashed red line) than during the first 5 min (solid red line), whereas this was not seen in the 10/10 group (dashed versus solid blue line). This is consistent with the results of Figure 3 (top) and Figure 4 (top) indicating that subjects homozygous for the 10-repeat allele exhibited a significantly reduced TOT effect dur-ing TSD compared to subjects homozygous or heterozygous for the 9-repeat allele. Figure 5 (top right) elucidates that this group difference was due to relatively greater skewing of the RT distribu-tion due to interaction of TSD with the TOT effect in the subjects homozygous or heterozygous for the 9-repeat allele of DAT1.
For COMT and TNFα, in contrast to DAT1, a significant gen-otype difference in the cumulative relative RT frequency dis-tribution was already apparent during well-rested baseline. For COMT (Figure 5, middle left), there was a significant interac-tion of RT bin by genotype (F
56,4345 = 2.24, p < .001). For TNFα
(Figure 5, bottom left), there was also a significant interaction of RT bin by genotype (F
28,4400 = 15.76, p < .001). Subjects
homozygous for the Val allele of the Val158Met polymorphism of COMT, and especially subjects carrying the A allele of the G308A polymorphism of TNFα, produced fast RTs more fre-quently at baseline.
TSD further amplified these genotype differences for COMT and TNFα. For COMT (Figure 5, middle right), there was again a significant interaction of RT bin by genotype (F
56,4345 = 1.73, p
= .001). For TNFα (Figure 5, bottom right), there was also again a significant interaction of RT bin by genotype (F
28,4400 = 3.37, p
Figure 4—Mean RT (±standard error) in 1-min bins on the 10-min PVT, collapsed over intervals of time awake, for each of the 3 genes. Left panels correspond to the baseline period (09:00–21:59; from 1 up to 14 h wakefulness); middle panels correspond to the nighttime TSD period (23:00–07:59; from 15 up to 23 h wakefulness); right panels correspond to the daytime TSD period (09:00–21:59; from 25 up to 38 h wakefulness). Trend lines are included to depict the general rate of change in RTs across the 10-min PVT. PVT = psychomotor vigilance test; RT = response time; TOT = time-on-task; TSD = total sleep deprivation.

8SLEEP, Vol. 40, No. 12, 2017 Time-on-Task Effect and DAT1—Satterfield et al.
< .001). After TSD, as during baseline, subjects homozygous for the COMT Val allele and carriers of the TNFα A allele produced fast RTs more often relative to the other COMT and TNFα gen-otypes, during both the first 5 min and the second 5 min of the PVT. In contrast to DAT1, the differences between the COMT and TNFα genotypes were most prominent in the heart of the RT distribution (Figure 5, middle and bottom right, purple-shaded area) and vanished in the lapse domain. This is consistent with the lack of significant interactions between TSD, TOT, and COMT or TNFα genotype in Figure 3 (middle and bottom, respectively) and Figure 4 (middle and bottom, respectively).
DISCUSSIONIn this study, we observed systematic interaction of the TOT effect with TSD. Matching earlier findings,12,13,15–17 both TOT and TSD increased RT mean and RT variability on the PVT; moreover, TSD amplified the changes across TOT. The similar-ities of the TOT and TSD effects on PVT performance, as well as their interplay, suggest that there may be shared underlying mechanisms.15,17 To examine this possibility, we investigated 3 genetic polymorphisms, selected a priori because of previously documented associations with TOT or TSD25,34: DAT1 (VNTR), COMT (Val158Met), and TNFα (G308A). For all 3 genes, we
Figure 5—Cumulative relative RT frequency distributions for each gene during the baseline period (left panels) and the daytime TSD period (right panels). Solid curves correspond to performance during the first 5 min (1–5) of the 10-min PVT; dashed curves correspond to perfor-mance during the second 5 min (6–10) of the 10-min PVT. The yellow-shaded area contains the fastest RTs; the purple-shaded area shows the heart of the cumulative relative frequency distributions; and the red-shaded area shows the slower RTs or lapse domain (cf. Figure 1, right). PVT = psychomotor vigilance test; RT = response time; TSD = total sleep deprivation.

9SLEEP, Vol. 40, No. 12, 2017 Time-on-Task Effect and DAT1—Satterfield et al.
observed effects of polymorphisms on the RT distribution, especially during TSD (Figure 5). However, only DAT1 geno-type affected the interaction between TOT and TSD (Figures 3 and 4). Specifically, compared to carriers of the DAT1 9-repeat allele, subjects homozygous for the 10-repeat allele were rela-tively protected against TOT-induced performance deficits dur-ing TSD.
In line with our findings, Holst and colleagues27 recently reported that the DAT1 10-repeat allele confers resilience to PVT performance impairment across 40 h of TSD. They did not report DAT1 genotype modulation of the interaction between TSD and TOT. To investigate the TOT effect, however, they divided the task duration into quintiles and characterized each quintile by the number of responses in the lapse domain or by the variability in RTs. This approach yields considerably less statistical power than using the individual RTs in 1-min bins, and may have obscured a TSD by TOT by DAT1 genotype inter-action in their study. In contrast, Lim and colleagues25 found that subjects homozygous for the 10-repeat allele of DAT1 and subjects homozygous for the Val allele of COMT Val158Met are relatively resilient to the decline of performance across TOT on a 20-min PVT under well-rested baseline conditions. These results are consistent with our findings, in that increasing the task duration from 10 to 20 min would be expected to enhance the TOT effect similar to what TSD did in our study. Thus, the present study extends and integrates the work of Holst and col-leagues27 and that of Lim and colleagues.25
Whereas COMT and TNFα were associated with genotype differences in the heart of the RT distribution (Figure 5, middle and bottom right, purple-shaded area), DAT1 was associated with genotype differences in the lapse domain of the RT dis-tribution (Figure 5, top right, red-shaded area). This distinc-tion may be interpreted by means of a cognitive model called the diffusion model of one-choice reaction-time tests,43 which abstractly describes performance on the PVT as a one-bound-ary diffusion process symbolizing the accumulation of stimulus information (evidence) until a decision criterion is reached and a response is initiated. The rate of evidence accumulation is rep-resented by a drift ratio parameter, while the decision criterion is represented by a boundary separation parameter. Differences in the boundary separation parameter impact the heart of the RT distribution, and differences in the drift ratio parameter impact the lapse domain of the RT distribution (see Supplemental Material, Figure S3).
In the context of our study, this cognitive modeling perspec-tive implies that the COMT and TNFα polymorphisms may be associated with differences in the propensity to respond earli-est after the detection of a stimulus.44 This suggests that even though subjects were instructed to respond to PVT stimuli as quickly as possible, without making false starts, there may have been systematic differences among them in the level of effective cognitive control. In line with this interpretation is the observation that the COMT and TNFα genotypes influenced the RT distribution both at baseline and after TSD (Figure 5, middle and bottom). Also in line with this interpretation is that TNFα G308A has been linked with cognitive control45; and, more indirectly, that COMT activity is localized predominantly in the prefrontal cortex,46 which has been linked with cognitive control as well.47
The DAT1 polymorphism, on the other hand, appears to be associated with a differential rate of evidence accumulation (Figure 5, top; cf. Supplemental Material, Figure S3, left). The rate of evidence accumulation during PVT performance is a strong correlate of the fidelity of information processing.37 Both the rate of evidence accumulation and the fidelity of informa-tion processing on the PVT have been shown to be affected sub-stantially by TSD.37,43 Our finding that DAT1 genotype affected the interaction between TOT and TSD (Figures 3 and 4)—and may thus be involved in shared mechanisms underlying both TSD and TOT—leads to 2 central hypotheses: (1) the TOT effect, like TSD, involves degradation of the fidelity of infor-mation processing; and (2) the degree to which TSD, TOT, and their interaction degrade the fidelity of information processing is modulated by dopaminergic mechanisms.
These hypotheses are compatible with results from studies of sleep deprivation and striatal dopamine.48,49 DAT1, the dopa-mine transporter 1, is highly localized to the striatum, where it regulates dopamine levels via reuptake from the synaptic cleft to the presynaptic terminal.50 Neuroimaging studies have shown that sleep deprivation does not change synaptic dopamine or dopamine transporter expression within the striatum over time.48 However, the DAT1 VNTR polymorphism modulates the expression of the transporter between subjects, and although the literature is mixed on whether the 9- and 10-repeat alleles increase or decrease the transporter’s expression, a meta-analy-sis concluded that the 9-repeat allele increases it.51 The implica-tion is that subjects homozygous for the DAT1 10-repeat allele are expected to have increased synaptic dopamine levels in the striatum compared to carriers of the 9-repeat allele. DAT1 knock-out studies in rodents28 and pharmacologic blocking studies in humans52 have shown that increased synaptic dopa-mine levels promote wakefulness. A recent neuroimaging study found that DAT1 genotype modulates neural responses during sleep loss and alters cognitive functioning.53 Taken together, the literature suggests that increased dopamine availability in the striatum may be causally related to the relatively improved PVT performance in subjects homozygous for the DAT1 10-repeat allele, as compared to carriers of the 9-repeat allele, during TSD and across TOT.
In the striatum, dopamine D2 receptors are co-local-
ized and functionally interact with adenosine A2A
receptors (ADORA2A).54 Adenosine has been implicated in mediating the effects of sleep deprivation,55 and has been hypothesized to be involved in the effects of TOT as well.19 Activation of the A
2A receptor modulates dopaminergic neurotransmission in
an antagonistic manner.54 As such, increased dopamine levels in subjects homozygous for the DAT1 10-repeat allele could potentially provide relative resilience to the interacting effects of TSD and TOT on performance simply by counteracting the antagonistic effect of adenosine. This would suggest that a striatal adenosinergic/dopaminergic mechanism underlies the cognitive impact of TSD interacting with TOT. A previously reported effect of polymorphisms of the ADORA2A gene on psychomotor vigilance performance during sleep loss56 is con-gruent with this idea.
It should be noted that the subject sample of our study con-sisted only of young adult women and men (ages 22–40) with limited racial and ethnic diversity. We do not know to what extent
10SLEEP, Vol. 40, No. 12, 2017 Time-on-Task Effect and DAT1—Satterfield et al.
our results may generalize to other populations. Additionally, we note that our sample size was modest, which is of concern when effect sizes are small (as if often the case in studies of cogni-tion57). However, the effects of time awake and time-on-task, alone and in interaction, on PVT performance produce robust phenotypes (see Figures 3 and 4). DAT1 is therefore a promis-ing candidate biomarker of resilience to psychomotor vigilance performance impairment due to TSD, TOT, and their interaction.
REFERENCES1. Davies DR, Parasuraman R. The Psychology of Vigilance. London:
Academic Press; 1982.2. Lim J, Kwok K. The effects of varying break length on attention and
time on task. Hum Factors. 2016; 58(3): 472–481.3. Hancock PA, Hart SG. Defeating terrorism: what can human factors/
ergonomics offer? Ergon Des. 2002; 10(1): 6–16.4. McFadden SM, Vimalachandran A, Blackmore E. Factors affecting per-
formance on a target monitoring task employing an automatic tracker. Ergonomics. 2004; 47(3): 257–280.
5. Caldwell JA. Fatigue in aviation. Travel Med Infect Dis. 2005; 3(2): 85–96.6. Basner M, Rubinstein J, Fomberstein KM, et al. Effects of night work,
sleep loss and time on task on simulated threat detection performance. Sleep. 2008; 31(9): 1251–1259.
7. Satterfield BC, Van Dongen HPA. Occupational fatigue, underlying sleep and circadian mechanisms, and approaches to fatigue risk manage-ment. Fatigue. 2013; 246(3): 118–136.
8. Verster JC, Roth T. Vigilance decrement during the on-the-road driv-ing tests: the importance of time-on-task in psychopharmacological research. Accid Anal Prev. 2013; 58: 244–248.
9. Van Dongen HPA, Balkin TJ, Hursh SR. Performance deficits during sleep loss and their operational consequences. In: Kryger MH, Roth T, Dement WC, eds. Principles and Practices of Sleep Medicine. 6th ed. Philadelphia, PA: Elsevier B.V.; 2016: 682–688.
10. Ackerman PL, ed. Cognitive Fatigue: Multidisciplinary Perspective on Current Research and Future Applications. Washington, DC: American Psychological Association; 2011.
11. Bills AG. Blocking: a new principle of mental fatigue. Am J Psychol. 1931; 43(2): 230–245.
12. Kribbs NB, Dinges DF. Vigilance decrement and sleepiness. In: Ogilvie RD, Harsh JR, eds. Sleep Onset: Normal and Abnormal Processes. Washington, DC: American Psychological Association; 1994: 113–125.
13. Doran SM, Van Dongen HPA, Dinges DF. Sustained attention perfor-mance during sleep deprivation: evidence of state instability. Arch Ital Biol. 2001; 139(3): 253–267.
14. Lim J, Dinges DF. Sleep deprivation and vigilant attention. Ann N Y Acad Sci. 2008; 1129: 305–322.
15. Van Dongen HPA, Belenky G, Krueger JM. Investigating the tem-poral dynamics and underlying mechanisms of cognitive fatigue. In: Ackerman PL, ed. Cognitive Fatigue: Mulitidisciplinary Perspectives on Current Research and Future Applications. Washington, DC: American Psychological Association; 2011: 127–147.
16. Honn KA, Riedy SM, Grant DA. Validation of a portable, touch-screen psychomotor vigilance test. Aerosp Med Hum Perform. 2015; 86(5): 428–434.
17. Gunzelmann G, Moore LR, Gluck KA, Van Dongen HPA, Dinges DF. Fatigue in sustained attention: generalizing mechanisms for time awake to time one task. In: Ackerman PL, ed. Cognitive Fatigue: Mulitidisciplinary Perspectives on Current Research and Future Applications. Washington, DC: American Psychological Association; 2011: 83–101.
18. Veksler BZ, Gunzelmann G. Functional equivalence of sleep loss and time on task effects in sustained attention. Cognitive Sci. 2017 [Published online ahead of print March 22, 2017]. doi:10.1111/cogs.12489.
19. Van Dongen HPA, Belenky G, Krueger JM. A local, bottom-up perspec-tive on sleep deprivation and neurobehavioral performance. Curr Top Med Chem. 2011; 11(19): 2414–2422.
20. Krueger JM, Rector DM, Roy S, Van Dongen HPA, Belenky G, Panksepp J. Sleep as a fundamental property of neuronal assemblies. Nat Rev Neurosci. 2008; 9(12): 910–919.
21. Van Dongen HPA, Rector DM, Belenky G, Krueger JM. Sleep, a local-ized phenomenon of the brain. In: Kryger MH, ed. Atlas of Clinical Sleep Medicine. Philadelphia, PA: Elsevier Saunders; 2010: 27–29.
22. Lim J, Wu WC, Wang J, Detre JA, Dinges DF, Rao H. Imaging brain fatigue from sustained mental workload: an ASL perfusion study of the time-on-task effect. Neuroimage. 2010; 49(4): 3426–3435.
23. Asplund CL, Chee MWL. Time-on-task and sleep deprivation effects are evidenced in overlapping brain areas. Neuroimage. 2013; 82: 326–335.
24. Vandenbergh DJ, Persico AM, Hawkins AL, et al. Human dopamine transporter gene (DAT1) maps to chromosome 5p15.3 and displays a VNTR. Genomics. 1992; 14(4): 1104–1106.
25. Lim J, Ebstein R, Tse CY, et al. Dopaminergic polymorphisms asso-ciated with time-on-task declines and fatigue in the Psychomotor Vigilance Test. PLoS One. 2012; 7(3): e33767.
26. Holst SC, Müller T, Valomon A, Seebauer B, Berger W, Landolt HP. Functional polymorphisms in dopaminergic genes modulate neurobe-havioral and neurophysiological consequences of sleep deprivation. Sci Rep. 2017; 7: 45982.
27. Holst SC, Bersagliere A, Bachmann V, Berger W, Achermann P, Landolt HP. Dopaminergic role in regulating neurophysiological markers of sleep homeostasis in humans. J Neurosci. 2014; 34(2): 566–573.
28. Wisor JP, Nishino S, Sora I, Uhl GH, Mignot E, Edgar DM. Dopaminergic role in stimulant-induced wakefulness. J Neurosci. 2001; 21(5): 1787–1794.
29. Wesensten NJ, Belenky G, Thorne DR, Kautz MA, Balkin TJ. Modafinil vs. caffeine: effects on fatigue during sleep deprivation. Aviat Space Environ Med. 2004; 75(6): 520–525.
30. Lachman HM, Papolos DF, Saito T, Yu YM, Szumlanski CL, Weinshilboum RM. Human catechol-O-methyltransferase pharmacogenet-ics: description of a functional polymorphism and its potential application to neuropsychiatric disorders. Pharmacogenetics. 1996; 6(3): 243–250.
31. Goel N, Banks S, Lin L, Mignot E, Dinges DF. Catechol-O-methyltransferase Val158Met polymorphism associates with individual differences in sleep physiologic responses to chronic sleep loss. PLoS One. 2011; 6(12): e29283.
32. Bodenmann S, Xu S, Luhmann UF, et al. Pharmacogenetics of modafinil after sleep loss: catechol-O-methyltransferase genotype modulates wak-ing functions but not recovery sleep. Clin Pharmacol Ther. 2009; 85(3): 296–304.
33. Wilson AG, di Giovine FS, Blakemore AI, Duff GW. Single base poly-morphism in the human tumour necrosis factor alpha (TNF alpha) gene detectable by NcoI restriction of PCR product. Hum Mol Genet. 1992; 1(5): 353.
34. Satterfield BC, Wisor JP, Field SA, Schmidt MA, Van Dongen HPA. TNFα G308A polymorphism is associated with resilience to sleep deprivation-induced psychomotor vigilance performance impairment in healthy young adults. Brain Behav Immun. 2015; 47: 66–74.
35. Churchill L, Rector DM, Yasuda K, et al. Tumor necrosis factor alpha: activity dependent expression and promotion of cortical column sleep in rats. Neuroscience. 2008; 156(1): 71–80.
36. Grant DA, Honn KA, Layton ME, Riedy SM, Van Dongen HPA. 3-min-ute smartphone-based and tablet-based psychomotor vigilance tests for the assessment of reduced alertness due to sleep deprivation. Behav Res Methods. 2017; 49(3): 1020–1029.
37. Chavali VP, Riedy SM, Van Dongen HPA. Signal-to-noise ratio in PVT performance as a cognitive measure of the effect of sleep deprivation on the fidelity of information processing. Sleep. 2017; 40(3): zsx016. doi:10.1093/sleep/zsx016.
38. Whitney P, Hinson JM, Jackson ML, Van Dongen HPA. Feedback blunt-ing: total sleep deprivation impairs decision making that requires updat-ing based on feedback. Sleep. 2015; 38(5): 745–754.
39. Felten A, Montag C, Markett S, Walter NT, Reuter M. Genetically deter-mined dopamine availability predicts disposition for depression. Brain Behav. 2011; 1(2): 109–118.
40. Ozen S, Alikasifoglu M, Bakkaloglu A, et al. Tumour necrosis factor alpha G→A -238 and G→A -308 polymorphisms in juvenile idiopathic arthritis. Rheumatology (Oxford). 2002; 41(2): 223–227.
11SLEEP, Vol. 40, No. 12, 2017 Time-on-Task Effect and DAT1—Satterfield et al.
41. Valomon A, Holst SC, Bachmann V, et al. Genetic polymorphisms of DAT1 and COMT differentially associate with actigraphy-derived sleep-wake cycles in young adults. Chronobiol Int. 2014; 31(5): 705–714.
42. Almpanidou P, Hadjigeorgiou G, Gourgoulianis K, Papadimitriou A. Association of tumor necrosis factor-α gene polymorphism (-308) and obstructive sleep apnea-hypopnea syndrome. Hippokratia. 2012; 16(3): 217–220.
43. Ratcliff R, Van Dongen HPA. Diffusion model for one-choice reac-tion-time tasks and the cognitive effects of sleep deprivation. Proc Natl Acad Sci USA. 2011; 108(27): 11285–11290.
44. Lucci G, Berchicci M, Perri RL, Spinelli D, Di Russo F. Effect of target probability on pre-stimulus brain activity. Neuroscience. 2016; 322: 121–128.
45. Beste C, Güntürkün O, Baune BT, Domschke K, Falkenstein M, Konrad C. Double dissociated effects of the functional TNF-α -308G/A poly-morphism on processes of cognitive control. Neuropsychologia. 2011; 49(2): 196–202.
46. Tunbridge EM, Harrison PJ, Weinberger DR. Catechol-O-methyltransferase, cognition, and psychosis: Val158Met and beyond. Biol Psychiatry. 2006; 60(2): 141–151.
47. Braver TS. The variable nature of cognitive control: a dual mechanisms framework. Trends Cogn Sci. 2012; 16(2): 106–113.
48. Volkow ND, Tomasi D, Wang GJ, et al. Evidence that sleep deprivation downregulates dopamine D2R in ventral striatum in the human brain. J Neurosci. 2012; 32(19): 6711–6717.
49. Tomasi D, Wang GJ, Volkow ND. Association between striatal dopamine D2/D3 receptors and brain activation during visual attention: effects of sleep deprivation. Transl Psychiatry. 2016; 6(5): e828.
50. Ettinger U, Merten N, Kambeitz J. Meta-analysis of the association of the SLC6A3 3’-UTR VNTR with cognition. Neurosci Biobehav Rev. 2016; 60: 72–81.
51. Faraone S, Spencer T, Madras B, Zhang-James Y, Biederman J. Functional effects of dopamine transporter gene genotypes on in vivo dopamine transporter functioning: A meta-analysis. Mol Psychiatry. 2014; 19(8): 880–889.
52. Volkow ND, Wang G-J, Fowler JS, et al. Therapeutic doses of oral meth-ylphenidate significantly increase extracellular dopamine in the human brain. J Neurosci. 2001; 21(2): 243–251.
53. Greer SM, Goldstein AN, Knutson B, Walker MP. A genetic polymor-phism of the human dopamine transporter determines the impact of sleep deprivation on brain responses to rewards and punishments. J Cogn Neurosci. 2016; 28(6): 803–810.
54. Hillion J, Canals M, Torvinen M, et al. Coaggregation, cointernaliza-tion, and codesensitization of adenosine A
2A receptors and dopamine D
2
receptors. J Biol Chem. 2002; 20(17): 18091–18097.55. Basheer R, Strecker RE, Thakkar MM, McCarley RW. Adenosine and
sleep-wake regulation. Prog Neurobiol. 2004; 73(6): 379–396.
56. Bodenmann S, Hohoff C, Freitag C, et al. Polymorphisms of ADORA2A modulate psychomotor vigilance and the effects of caffeine on neu-robehavioural performance and sleep EEG after sleep deprivation. Br J Pharmacol. 2012; 165(6): 1904–1913.
57. Bishop DV. Genes, cognition, and communication: insights from neu-rodevelopmental disorders. Ann N Y Acad Sci. 2009; 1156: 1–18.
SUPPLEMENTARY MATERIALSupplementary data are available at SLEEP online.
FUNDINGThe research was supported by ONR grant N00014-13-1-0302 to Hans Van Dongen (study 1), NIH grant R21CA167691 to John Hinson (study 2), NIH grant R01HL105768 to Melinda Jackson and FAA grant DTFAAC-11-A-00003 to Hans Van Dongen (study 3), and CDMRP grant W81XWH-16-1-0319 to Hans Van Dongen (analyses).
ACKNOWLEDGMENTSWe gratefully acknowledge the contributions of Matthew Layton, Gregory Belenky, John Hinson, Paul Whitney, Melinda Jackson, Devon Grant, and the staff of the Human Sleep and Cognition Laboratory in the Sleep and Performance Research Center at Washington State University Spokane.
SUBMISSION & CORRESPONDENCE INFORMATIONSubmitted for publication May, 2017Submitted in final revised form August, 2017Accepted for publication September, 2017Address correspondence to: Hans P.A. Van Dongen, PhD, Director, Sleep and Performance Research Center, Washington State University Spokane, PO Box 1495, Spokane, WA 99210-1495. Telephone: +1-509-358-7755; Fax: +1-509-358-7810; Email: [email protected]
ALL WORK CONDUCTED ATSleep and Performance Research Center, Washington State University Spokane, PO Box 1495, Spokane, WA, 99210-1495
DISCLOSURE STATEMENTThe experiments were conducted at Washington State University Spokane. This work was supported by the Office of Naval Research, National Institutes of Health, Federal Aviation Administration, and Congressionally Directed Medical Research Program. The authors have no conflicts of interest to disclose.

1
Supplemental Material
Time-on-Task Effect during Sleep Deprivation in Healthy Young Adults Is Modulated by
Dopamine Transporter Genotype
Brieann C. Satterfield, PhDa,b, Jonathan P. Wisor, PhDa, Michelle A. Schmidt, MSa,
Hans P.A. Van Dongen, PhDa
a Sleep and Performance Research Center and Elson S. Floyd College of Medicine, Washington
State University, Spokane, WA, USA
b Currently at the Department of Psychiatry, College of Medicine, University of Arizona,
Tucson, AZ, USA

2
Table S1. Subject demographics and genotypes for the three studies used for analysis. Subjects
in a well-rested control group (used only in the supplemental material, Fig. S1) are indicated in
parentheses. The TNFα308 assay failed for 1 control subject, leaving 57 subjects for analysis.
Note that DAT1 8/8 and 10/11 genotypes are included here for representation of our sample;
these genotypes were excluded from analysis. SD: standard deviation.
Study 1
n=34
(n=15)
Study 2
n=36
(n=30)
Study 3
n=12
(n=13)
Total
N=82
(N=58)
Sex
Female 14 (9) 22 (12) 7 (3) 43 (24)
Male 20 (6) 14 (18) 5 (10) 39 (34)
Age (mean ± SD) 27.7 ± 5.0
(26.3 ± 4.3)
26.6 ± 4.8
(26.4 ± 4.9)
26.6 ± 4.4
(25.2 ± 3.8)
27.0 ± 4.8
(26.1 ± 4.5)
Race/Ethnicity
Caucasian 30 (14) 33 (30) 7 (10) 70 (53)
Hispanic 0 (0) 1 (0) 1 (0) 2 (0)
African-American 1 (0) 0 (0) 0 (0) 1 (0)
Asian 0 (0) 0 (0) 1 (0) 1 (0)
American Indian 0 (0) 0 (0) 0 (1) 0 (1)
Pacific Islander 0 (0) 0 (0) 0 (1) 0 (1)
Mixed 1 (1) 2 (0) 3 (1) 6 (2)
Undisclosed 2 (0) 0 (0) 0 (0) 2 (0)
DAT1
8/8 1 (1) 0 (0) 0 (0) 1 (1)
9/9 4 (0) 2 (3) 1 (1) 7 (4)
9/10 10 (4) 14 (12) 3 (2) 27 (18)
10/10 19 (10) 18 (15) 8 (10) 45 (35)
10/11 0 (0) 2 (0) 0 (0) 2 (0)
COMT
Met/Met 9 (3) 7 (11) 1 (2) 17 (16)
Val/Met 19 (9) 21 (12) 6 (8) 46 (29)
Val/Val 6 (3) 8 (7) 5 (3) 19 (13)
TNFα
A/A 0 (0) 0 (0) 0 (0) 0 (0)
A/G 8 (5) 14 (7) 2 (3) 24 (15)
G/G 26 (10) 22 (22) 10 (10) 58 (42)
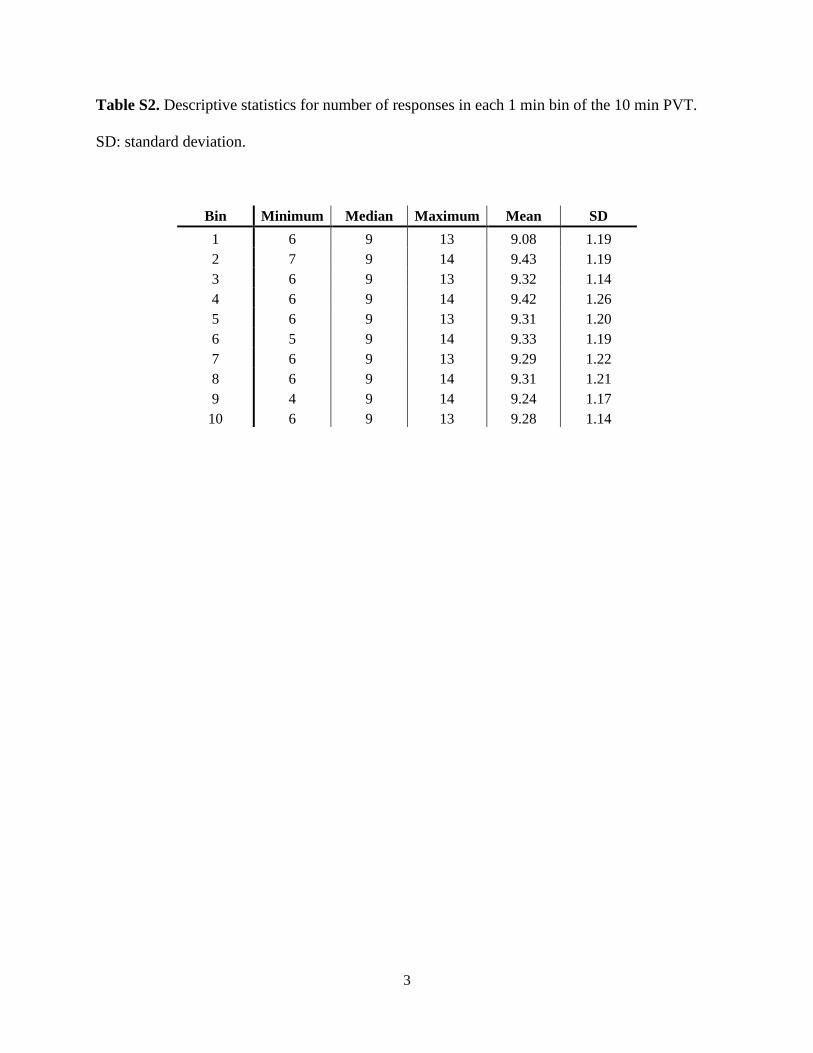
3
Table S2. Descriptive statistics for number of responses in each 1 min bin of the 10 min PVT.
SD: standard deviation.
Bin Minimum Median Maximum Mean SD
1 6 9 13 9.08 1.19
2 7 9 14 9.43 1.19
3 6 9 13 9.32 1.14
4 6 9 14 9.42 1.26
5 6 9 13 9.31 1.20
6 5 9 14 9.33 1.19
7 6 9 13 9.29 1.22
8 6 9 14 9.31 1.21
9 4 9 14 9.24 1.17
10 6 9 13 9.28 1.14

4
Table S3. Summary of statistical results for the TSD group discussed in the main text. Bold
indicates statistical significance (P<0.05). df: degrees of freedom; RT: response time; TOT: time
on task; TSD: total sleep deprivation.
DAT1 COMT TNFα
Genotype Analyses χ2 / F df P χ2 / F df P χ2 / F df P
Gender <0.01 1 0.97 1.15 2 0.56 0.59 1 0.44
Race/Ethnicity 2.01 1 0.16 1.59 2 0.45 2.22 1 0.14
Age (F test) <0.01 1, 77 0.95 1.43 2, 79 0.25 0.81 1, 80 0.37
Sleep Duration (F test) 0.10 1, 77 0.75 0.29 2, 79 0.75 0.14 1, 80 0.71
Time-on-Task Analyses F df P F df P F df P
Time Awake (bout) 321.66 11, 86772 <0.001 223.02 11, 90055 <0.001 296.57 11, 90174 <0.001
TOT (bin) 81.01 9, 86772 <0.001 54.59 9, 90055 <0.001 75.33 9, 90174 <0.001
Genotype 3.18 1, 86772 0.075 1.04 2, 90055 0.352 1.52 1, 90174 0.217
Time Awake x TOT 7.56 99, 86772 <0.001 4.9 99, 90055 <0.001 7.01 99, 90174 <0.001
Time Awake x Genotype 21.9 11,86772 <0.001 9.2 22, 90055 <0.001 9.20 11, 90174 <0.001
TOT x Genotype 3.07 9, 86772 0.001 2.93 18, 90055 <0.001 2.16 9, 90174 0.022
Time Awake x TOT x Genotype 1.35 99, 86772 0.011 1.13 198, 90055 0.103 1.21 99, 90174 0.08
Study 2.86 2, 86772 0.057 2.09 2, 90055 0.124 2.55 2, 90174 0.078
RT Distribution Analyses F df P F df P F df P
Baseline
RT bin 4353.28 27, 4235 <0.001 3664.3
3 27, 4345 <0.001 3869.53 27, 4400 <0.001
RT bin x 5 min block 2.95 28, 4235 <0.001 2.02 28, 4235 0.001 3.02 28, 4400 <0.001
RT bin x Genotype 0.54 28, 4235 0.976 2.24 56, 4235 <0.001 15.76 28, 4400 <0.001
RT bin x 5 min block x Genotype 0.05 28, 4235 >0.999 0.17 56, 4345 >0.999 0.09 28, 4400 >0.999
Study 0.68 2, 4235 0.508 1.36 2, 4345 0.258 0.42 2, 4400 0.655
Daytime TSD
RT bin 4804.49 27, 4235 <0.001 4134 27, 4345 <0.001 4213.75 27, 4400 <0.001
RT bin x 5 min block 17.99 28, 4235 <0.001 16.17 28, 4345 <0.001 17.72 28, 4400 <0.001
RT bin x Genotype 1.6 28, 4235 0.022 1.73 56, 4345 0.001 3.37 28, 4400 <0.001
RT bin x 5 min block x Genotype 0.15 28, 4235 >0.999 0.11 56, 4345 >0.999 0.34 28, 4400 >0.999
Study 1.58 2, 4235 0.206 1.07 2, 4345 0.344 1.51 2, 4400 0.222

5
Figure S1. Mean RT (± standard error) on the 10 min PVT across test bouts during 38 h of TSD,
for each of the three genes, collapsed across TOT. Shaded area: nighttime test bouts during TSD.
PVT: psychomotor vigilance test; RT: response time; TOT: time-one-task; TSD: total sleep
deprivation.
200
250
300
350
400
450
500
6 9 12 15 18 21 24 27 30 33 36 39 42 45200
200
250
300
350
400
450
500
6 9 12 15 18 21 24 27 30 33 36 39 42 45200
200
250
300
350
400
450
500
6 9 12 15 18 21 24 27 30 33 36 39 42 45200
DAT1
COMT
TNFα
200
300
400
500
600
700
6 9 12 15 18 21 24 27 30 33 36 39 42 45
9R10/10
200
200
300
400
500
600
700
6 9 12 15 18 21 24 27 30 33 36 39 42 45
Val/ValVal/MetMet/Met
200
200
300
400
500
600
700
6 9 12 15 18 21 24 27 30 33 36 39 42 45
A/GG/G
200
Mea
n RT
(ms)
Mea
n RT
(ms)
Mea
n RT
(ms)
Clock Time
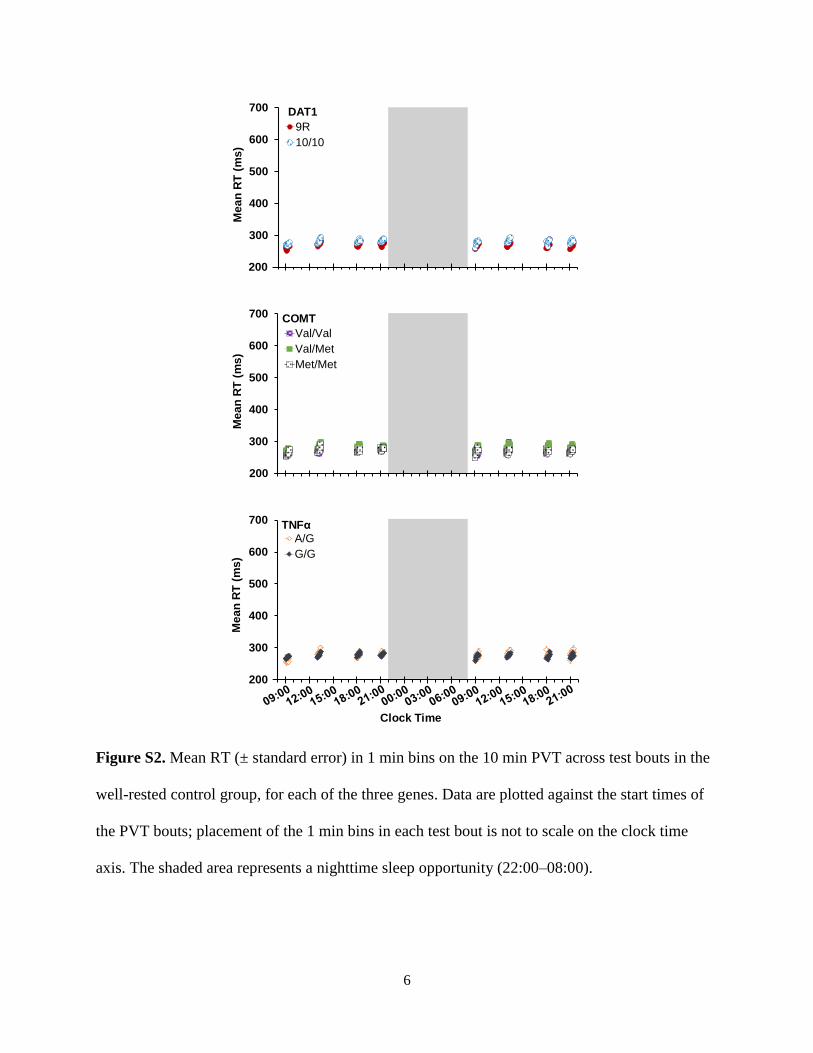
6
Figure S2. Mean RT (± standard error) in 1 min bins on the 10 min PVT across test bouts in the
well-rested control group, for each of the three genes. Data are plotted against the start times of
the PVT bouts; placement of the 1 min bins in each test bout is not to scale on the clock time
axis. The shaded area represents a nighttime sleep opportunity (22:00–08:00).
200
300
400
500
600
700
6 9 12 15 18 21 24 27 30 33 36 39 42 45200
200
300
400
500
600
700
6 9 12 15 18 21 24 27 30 33 36 39 42 45200
200
300
400
500
600
700
6 9 12 15 18 21 24 27 30 33 36 39 42 45200
200
300
400
500
600
700
6 9 12 15 18 21 24 27 30 33 36 39 42 45
9R10/10
200
DAT1
Mea
n RT
(ms)
Mea
n RT
(ms)
Mea
n RT
(ms)
Clock Time
200
300
400
500
600
700
6 9 12 15 18 21 24 27 30 33 36 39 42 45
Val/ValVal/MetMet/Met
200
200
300
400
500
600
700
6 9 12 15 18 21 24 27 30 33 36 39 42 45
A/GG/G
200
COMT
TNFα

7
Figure S3. Computer simulations of cumulative relative RT frequency distributions using the
diffusion model for the PVT.37 These simulations are based on model parameters fixed at values
previously observed for TSD (Table S1 in the PVT diffusion model publication37) but with
varying drift ratio v/η (left panel) or boundary separation a (right panel). In the left panel,
resilience to performance impairment is simulated by changing drift ratio from v/η=1.38
(previously observed TSD value) to v/η=1.61 (20% toward previously observed baseline value).
This manipulation affects RTs in the lapse domain of the distribution (red-shaded area). In the
right panel, resilience to performance impairment is simulated by changing boundary separation
from a=0.120 (previously observed TSD value) to a=0.111 (previously observed baseline value).
This manipulation primarily affects RTs in the heart of the distribution (purple-shaded area). The
yellow-shaded area contains the fastest RTs; the purple-shaded area shows the heart of the
cumulative relative frequency distributions; and the red-shaded area shows the slower RTs or
lapse domain (cf. Fig. 1, right).
0.00.10.20.30.40.50.60.70.80.91.0
0 200 400 600 800 10000
0.10.20.30.40.50.60.70.80.9
1
0 200 400 600 800 1000
Cum
ulat
ive
Rel
ativ
e R
T Fr
eque
ncy
RT (ms) RT (ms)
v/η=1.61
v/η=1.38
a=0.111
a=0.120
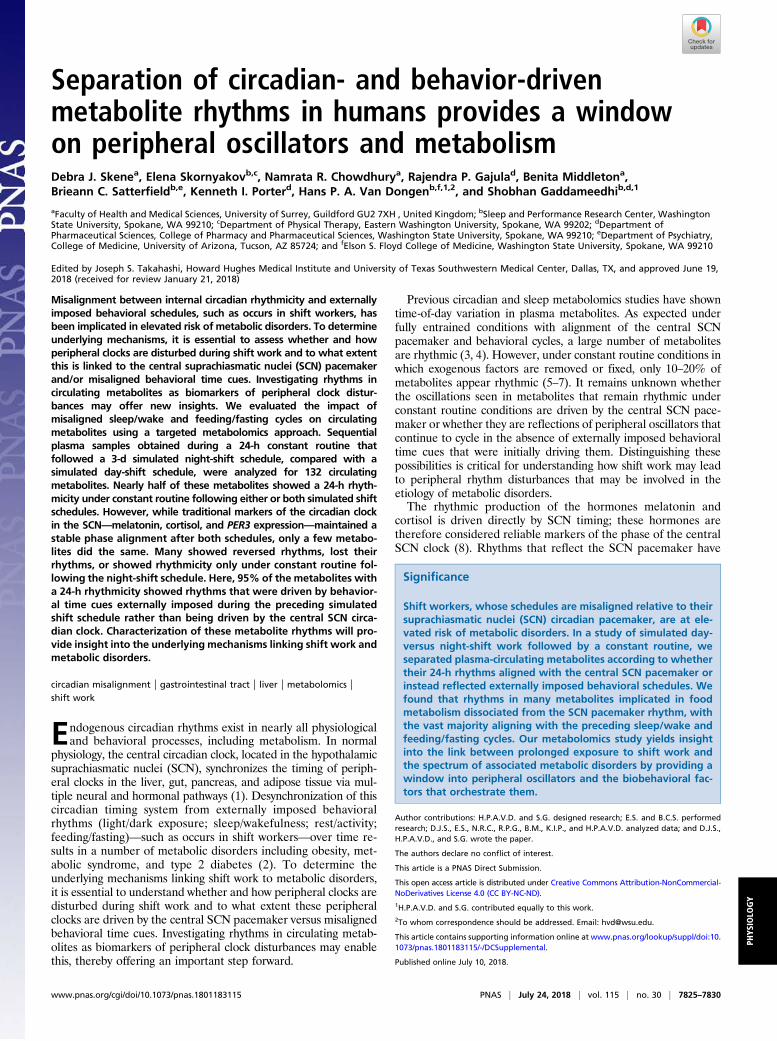
Separation of circadian- and behavior-drivenmetabolite rhythms in humans provides a windowon peripheral oscillators and metabolismDebra J. Skenea, Elena Skornyakovb,c, Namrata R. Chowdhurya, Rajendra P. Gajulad, Benita Middletona,Brieann C. Satterfieldb,e, Kenneth I. Porterd, Hans P. A. Van Dongenb,f,1,2, and Shobhan Gaddameedhib,d,1
aFaculty of Health and Medical Sciences, University of Surrey, Guildford GU2 7XH , United Kingdom; bSleep and Performance Research Center, WashingtonState University, Spokane, WA 99210; cDepartment of Physical Therapy, Eastern Washington University, Spokane, WA 99202; dDepartment ofPharmaceutical Sciences, College of Pharmacy and Pharmaceutical Sciences, Washington State University, Spokane, WA 99210; eDepartment of Psychiatry,College of Medicine, University of Arizona, Tucson, AZ 85724; and fElson S. Floyd College of Medicine, Washington State University, Spokane, WA 99210
Edited by Joseph S. Takahashi, Howard Hughes Medical Institute and University of Texas Southwestern Medical Center, Dallas, TX, and approved June 19,2018 (received for review January 21, 2018)
Misalignment between internal circadian rhythmicity and externallyimposed behavioral schedules, such as occurs in shift workers, hasbeen implicated in elevated risk of metabolic disorders. To determineunderlying mechanisms, it is essential to assess whether and howperipheral clocks are disturbed during shift work and to what extentthis is linked to the central suprachiasmatic nuclei (SCN) pacemakerand/or misaligned behavioral time cues. Investigating rhythms incirculating metabolites as biomarkers of peripheral clock distur-bances may offer new insights. We evaluated the impact ofmisaligned sleep/wake and feeding/fasting cycles on circulatingmetabolites using a targeted metabolomics approach. Sequentialplasma samples obtained during a 24-h constant routine thatfollowed a 3-d simulated night-shift schedule, compared with asimulated day-shift schedule, were analyzed for 132 circulatingmetabolites. Nearly half of these metabolites showed a 24-h rhyth-micity under constant routine following either or both simulated shiftschedules. However, while traditional markers of the circadian clockin the SCN—melatonin, cortisol, and PER3 expression—maintained astable phase alignment after both schedules, only a few metabo-lites did the same. Many showed reversed rhythms, lost theirrhythms, or showed rhythmicity only under constant routine fol-lowing the night-shift schedule. Here, 95% of the metabolites witha 24-h rhythmicity showed rhythms that were driven by behavior-al time cues externally imposed during the preceding simulatedshift schedule rather than being driven by the central SCN circa-dian clock. Characterization of these metabolite rhythms will pro-vide insight into the underlying mechanisms linking shift work andmetabolic disorders.
circadian misalignment | gastrointestinal tract | liver | metabolomics |shift work
Endogenous circadian rhythms exist in nearly all physiologicaland behavioral processes, including metabolism. In normal
physiology, the central circadian clock, located in the hypothalamicsuprachiasmatic nuclei (SCN), synchronizes the timing of periph-eral clocks in the liver, gut, pancreas, and adipose tissue via mul-tiple neural and hormonal pathways (1). Desynchronization of thiscircadian timing system from externally imposed behavioralrhythms (light/dark exposure; sleep/wakefulness; rest/activity;feeding/fasting)—such as occurs in shift workers—over time re-sults in a number of metabolic disorders including obesity, met-abolic syndrome, and type 2 diabetes (2). To determine theunderlying mechanisms linking shift work to metabolic disorders,it is essential to understand whether and how peripheral clocks aredisturbed during shift work and to what extent these peripheralclocks are driven by the central SCN pacemaker versus misalignedbehavioral time cues. Investigating rhythms in circulating metab-olites as biomarkers of peripheral clock disturbances may enablethis, thereby offering an important step forward.
Previous circadian and sleep metabolomics studies have showntime-of-day variation in plasma metabolites. As expected underfully entrained conditions with alignment of the central SCNpacemaker and behavioral cycles, a large number of metabolitesare rhythmic (3, 4). However, under constant routine conditions inwhich exogenous factors are removed or fixed, only 10–20% ofmetabolites appear rhythmic (5–7). It remains unknown whetherthe oscillations seen in metabolites that remain rhythmic underconstant routine conditions are driven by the central SCN pace-maker or whether they are reflections of peripheral oscillators thatcontinue to cycle in the absence of externally imposed behavioraltime cues that were initially driving them. Distinguishing thesepossibilities is critical for understanding how shift work may leadto peripheral rhythm disturbances that may be involved in theetiology of metabolic disorders.The rhythmic production of the hormones melatonin and
cortisol is driven directly by SCN timing; these hormones aretherefore considered reliable markers of the phase of the centralSCN clock (8). Rhythms that reflect the SCN pacemaker have
Significance
Shift workers, whose schedules are misaligned relative to theirsuprachiasmatic nuclei (SCN) circadian pacemaker, are at ele-vated risk of metabolic disorders. In a study of simulated day-versus night-shift work followed by a constant routine, weseparated plasma-circulating metabolites according to whethertheir 24-h rhythms aligned with the central SCN pacemaker orinstead reflected externally imposed behavioral schedules. Wefound that rhythms in many metabolites implicated in foodmetabolism dissociated from the SCN pacemaker rhythm, withthe vast majority aligning with the preceding sleep/wake andfeeding/fasting cycles. Our metabolomics study yields insightinto the link between prolonged exposure to shift work andthe spectrum of associated metabolic disorders by providing awindow into peripheral oscillators and the biobehavioral fac-tors that orchestrate them.
Author contributions: H.P.A.V.D. and S.G. designed research; E.S. and B.C.S. performedresearch; D.J.S., E.S., N.R.C., R.P.G., B.M., K.I.P., and H.P.A.V.D. analyzed data; and D.J.S.,H.P.A.V.D., and S.G. wrote the paper.
The authors declare no conflict of interest.
This article is a PNAS Direct Submission.
This open access article is distributed under Creative Commons Attribution-NonCommercial-NoDerivatives License 4.0 (CC BY-NC-ND).1H.P.A.V.D. and S.G. contributed equally to this work.2To whom correspondence should be addressed. Email: [email protected].
This article contains supporting information online at www.pnas.org/lookup/suppl/doi:10.1073/pnas.1801183115/-/DCSupplemental.
Published online July 10, 2018.
www.pnas.org/cgi/doi/10.1073/pnas.1801183115 PNAS | July 24, 2018 | vol. 115 | no. 30 | 7825–7830
PHYS
IOLO
GY

also been observed in the expression of core clock genes, such asPeriod3 (PER3), that can be measured in blood-borne cells (9).Previous studies in both simulated (10, 11) and real-world (12,13) shift work have shown that the rhythms of these circadianmarkers are resistant to phase shifting, indicating that the en-dogenous SCN rhythm is slow to adapt to shift work schedules.As such, exposure to a night-shift schedule produces misalign-ment between behavioral rhythms and the rhythm of the centralSCN pacemaker.In a between-groups, in-laboratory study, we assigned healthy
volunteers (ages 22–34 y) to 3 d of either a simulated night-shiftschedule (seven subjects) or a simulated day-shift (i.e., control)schedule (seven subjects). In each group, this was followed by a24-h constant routine protocol, during which blood was drawn at 3-hintervals to measure plasma metabolite profiles using a targetedliquid chromatography/mass spectrometry (LC/MS) metabolomicsapproach (SI Appendix, Fig. S1). We thus characterized 24-h
rhythms in metabolites, free of exogenous factors, after the cen-tral SCN clock and behaviorally induced rhythms were experi-mentally misaligned (night-shift condition) or aligned (day-shiftcondition). This allowed us to assess whether oscillations observedin metabolites are driven by the central SCN pacemaker—orwhether they are the signature of shifted behavioral rhythmsduring the preceding days of shift work.
ResultsDuring the constant routine after 3 d of simulated shift work, thedim light melatonin onset (DLMO) and the 24-h rhythm ofplasma cortisol (traditional markers of the central SCN pace-maker) as well as the 24-h rhythm in clock gene PER3 expressionall showed relatively little phase difference between the day-shiftand night-shift conditions (SI Appendix, Figs. S2–S4). A delayof ∼2 h was observed after the night-shift condition, regardlessof which rhythm marker was used, which is congruent with a
LysoPCaC18:1
Arg LysoPCaC18:2
C18:1
PCaaC42:2
PCaaC40:2
Ile
Taurine
SerotoninOrn
Sarcosine
Rhythmic in BothDay Shift and
Night Shift Conditions
PCaaC32:0PCaaC36:0
PCaaC30:0PCaaC32:3
ProSMC18:0 SMC18:1
PCaaC36:6PCaeC34:3 PCae
C30:0
PCaaC36:5
LysoPCaC26:0
Rhythmic inDay Shift
Condition Only
Rhythmic inNight Shift
Condition Only
C2
PCaaC
24:0
LysoPCaC
16:1LysoPC
aC18:0
LysoPCaC
20:3
PCaeC
36:0Kynurenine
ThrAla
Lys
PCaeC
34:2
Gln
His
LysoPCaC
28:0
Phe
PCaeC
38:2
LysoPCaC
20:4
LysoPCaC
26:1
LysoPCaC
17:0Leu
PCaeC44:3
PCaaC36:4PCaaC40:5
PCaaC36:2
C14:2
CitTrp
PCaeC36:4PCaeC36:5
PCaaC34:3PCaeC34:1
PCaaC34:2C9
Glu
C5-DC(C6-OH)C3-DC(C4-OH)
PCaaC38:4PCaaC34:1
Cortisol
DLMO
Acrophase in Day Shift Condition
Acrophase in Day Shift Condition
Acr
opha
se in
Nig
ht S
hift
Con
ditio
n Acrophase in
Night Shift C
ondition
18 0 6 12 18
18 0 6 12 18
180
612
1818
12 6
0 18
PCaeC34:0PCaaC32:1SMC20:2
Fig. 1. Timing of the peak of the 24-h rhythm (acrophase) during constant routine following the day-shift condition and following the night-shift conditionin 27 metabolites with significant 24-h rhythmicity for both conditions (Bottom Left), in 19 metabolites with significant 24-h rhythmicity for the day-shiftcondition only (Top), and in 19 metabolites with significant 24-h rhythmicity for the night-shift condition only (Right). Time is indicated as clock time in hours(0 = midnight). Red: metabolites. Black: timing of melatonin onset (DLMO) and timing of cortisol peak (for reference). The dashed diagonal line indicateswhere metabolites would fall if the timing of their rhythmicity during constant routine was unperturbed by the night-shift condition relative to the day-shiftcondition.
7826 | www.pnas.org/cgi/doi/10.1073/pnas.1801183115 Skene et al.
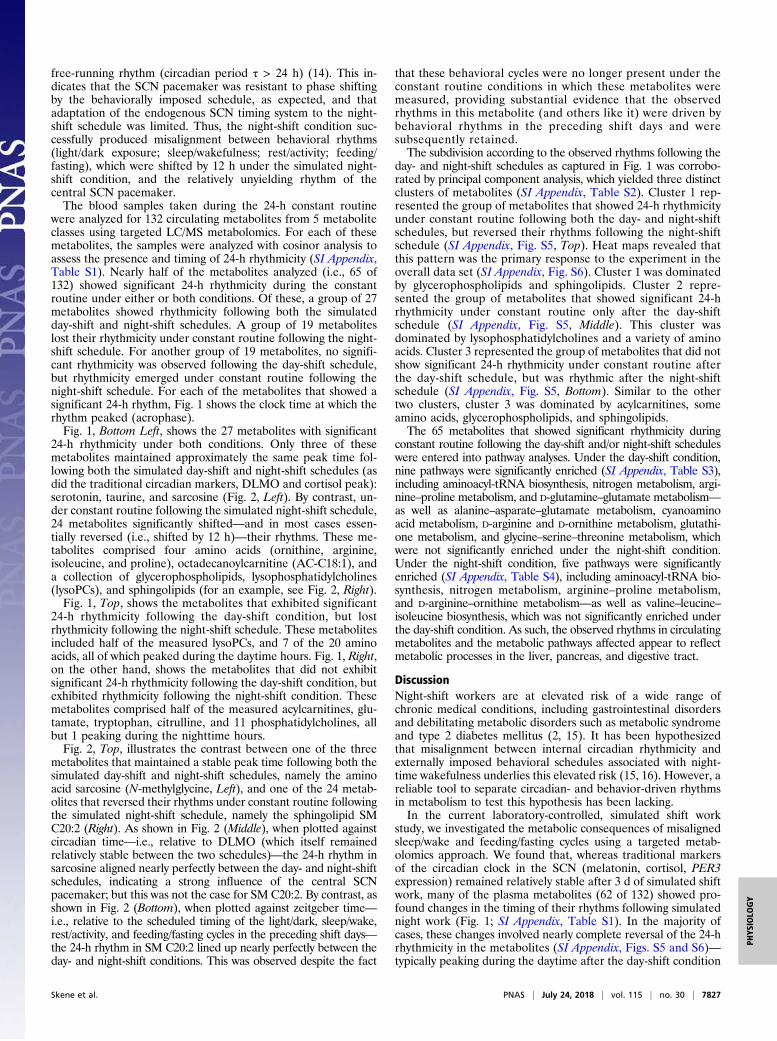
free-running rhythm (circadian period τ > 24 h) (14). This in-dicates that the SCN pacemaker was resistant to phase shiftingby the behaviorally imposed schedule, as expected, and thatadaptation of the endogenous SCN timing system to the night-shift schedule was limited. Thus, the night-shift condition suc-cessfully produced misalignment between behavioral rhythms(light/dark exposure; sleep/wakefulness; rest/activity; feeding/fasting), which were shifted by 12 h under the simulated night-shift condition, and the relatively unyielding rhythm of thecentral SCN pacemaker.The blood samples taken during the 24-h constant routine
were analyzed for 132 circulating metabolites from 5 metaboliteclasses using targeted LC/MS metabolomics. For each of thesemetabolites, the samples were analyzed with cosinor analysis toassess the presence and timing of 24-h rhythmicity (SI Appendix,Table S1). Nearly half of the metabolites analyzed (i.e., 65 of132) showed significant 24-h rhythmicity during the constantroutine under either or both conditions. Of these, a group of 27metabolites showed rhythmicity following both the simulatedday-shift and night-shift schedules. A group of 19 metaboliteslost their rhythmicity under constant routine following the night-shift schedule. For another group of 19 metabolites, no signifi-cant rhythmicity was observed following the day-shift schedule,but rhythmicity emerged under constant routine following thenight-shift schedule. For each of the metabolites that showed asignificant 24-h rhythm, Fig. 1 shows the clock time at which therhythm peaked (acrophase).Fig. 1, Bottom Left, shows the 27 metabolites with significant
24-h rhythmicity under both conditions. Only three of thesemetabolites maintained approximately the same peak time fol-lowing both the simulated day-shift and night-shift schedules (asdid the traditional circadian markers, DLMO and cortisol peak):serotonin, taurine, and sarcosine (Fig. 2, Left). By contrast, un-der constant routine following the simulated night-shift schedule,24 metabolites significantly shifted—and in most cases essen-tially reversed (i.e., shifted by 12 h)—their rhythms. These me-tabolites comprised four amino acids (ornithine, arginine,isoleucine, and proline), octadecanoylcarnitine (AC-C18:1), anda collection of glycerophospholipids, lysophosphatidylcholines(lysoPCs), and sphingolipids (for an example, see Fig. 2, Right).Fig. 1, Top, shows the metabolites that exhibited significant
24-h rhythmicity following the day-shift condition, but lostrhythmicity following the night-shift schedule. These metabolitesincluded half of the measured lysoPCs, and 7 of the 20 aminoacids, all of which peaked during the daytime hours. Fig. 1, Right,on the other hand, shows the metabolites that did not exhibitsignificant 24-h rhythmicity following the day-shift condition, butexhibited rhythmicity following the night-shift condition. Thesemetabolites comprised half of the measured acylcarnitines, glu-tamate, tryptophan, citrulline, and 11 phosphatidylcholines, allbut 1 peaking during the nighttime hours.Fig. 2, Top, illustrates the contrast between one of the three
metabolites that maintained a stable peak time following both thesimulated day-shift and night-shift schedules, namely the aminoacid sarcosine (N-methylglycine, Left), and one of the 24 metab-olites that reversed their rhythms under constant routine followingthe simulated night-shift schedule, namely the sphingolipid SMC20:2 (Right). As shown in Fig. 2 (Middle), when plotted againstcircadian time—i.e., relative to DLMO (which itself remainedrelatively stable between the two schedules)—the 24-h rhythm insarcosine aligned nearly perfectly between the day- and night-shiftschedules, indicating a strong influence of the central SCNpacemaker; but this was not the case for SM C20:2. By contrast, asshown in Fig. 2 (Bottom), when plotted against zeitgeber time—i.e., relative to the scheduled timing of the light/dark, sleep/wake,rest/activity, and feeding/fasting cycles in the preceding shift days—the 24-h rhythm in SM C20:2 lined up nearly perfectly between theday- and night-shift conditions. This was observed despite the fact
that these behavioral cycles were no longer present under theconstant routine conditions in which these metabolites weremeasured, providing substantial evidence that the observedrhythms in this metabolite (and others like it) were driven bybehavioral rhythms in the preceding shift days and weresubsequently retained.The subdivision according to the observed rhythms following the
day- and night-shift schedules as captured in Fig. 1 was corrobo-rated by principal component analysis, which yielded three distinctclusters of metabolites (SI Appendix, Table S2). Cluster 1 rep-resented the group of metabolites that showed 24-h rhythmicityunder constant routine following both the day- and night-shiftschedules, but reversed their rhythms following the night-shiftschedule (SI Appendix, Fig. S5, Top). Heat maps revealed thatthis pattern was the primary response to the experiment in theoverall data set (SI Appendix, Fig. S6). Cluster 1 was dominatedby glycerophospholipids and sphingolipids. Cluster 2 repre-sented the group of metabolites that showed significant 24-hrhythmicity under constant routine only after the day-shiftschedule (SI Appendix, Fig. S5, Middle). This cluster wasdominated by lysophosphatidylcholines and a variety of aminoacids. Cluster 3 represented the group of metabolites that did notshow significant 24-h rhythmicity under constant routine afterthe day-shift schedule, but was rhythmic after the night-shiftschedule (SI Appendix, Fig. S5, Bottom). Similar to the othertwo clusters, cluster 3 was dominated by acylcarnitines, someamino acids, glycerophospholipids, and sphingolipids.The 65 metabolites that showed significant rhythmicity during
constant routine following the day-shift and/or night-shift scheduleswere entered into pathway analyses. Under the day-shift condition,nine pathways were significantly enriched (SI Appendix, Table S3),including aminoacyl-tRNA biosynthesis, nitrogen metabolism, argi-nine–proline metabolism, and D-glutamine–glutamate metabolism—
as well as alanine–asparate–glutamate metabolism, cyanoaminoacid metabolism, D-arginine and D-ornithine metabolism, glutathi-one metabolism, and glycine–serine–threonine metabolism, whichwere not significantly enriched under the night-shift condition.Under the night-shift condition, five pathways were significantlyenriched (SI Appendix, Table S4), including aminoacyl-tRNA bio-synthesis, nitrogen metabolism, arginine–proline metabolism,and D-arginine–ornithine metabolism—as well as valine–leucine–isoleucine biosynthesis, which was not significantly enriched underthe day-shift condition. As such, the observed rhythms in circulatingmetabolites and the metabolic pathways affected appear to reflectmetabolic processes in the liver, pancreas, and digestive tract.
DiscussionNight-shift workers are at elevated risk of a wide range ofchronic medical conditions, including gastrointestinal disordersand debilitating metabolic disorders such as metabolic syndromeand type 2 diabetes mellitus (2, 15). It has been hypothesizedthat misalignment between internal circadian rhythmicity andexternally imposed behavioral schedules associated with night-time wakefulness underlies this elevated risk (15, 16). However, areliable tool to separate circadian- and behavior-driven rhythmsin metabolism to test this hypothesis has been lacking.In the current laboratory-controlled, simulated shift work
study, we investigated the metabolic consequences of misalignedsleep/wake and feeding/fasting cycles using a targeted metab-olomics approach. We found that, whereas traditional markersof the circadian clock in the SCN (melatonin, cortisol, PER3expression) remained relatively stable after 3 d of simulated shiftwork, many of the plasma metabolites (62 of 132) showed pro-found changes in the timing of their rhythms following simulatednight work (Fig. 1; SI Appendix, Table S1). In the majority ofcases, these changes involved nearly complete reversal of the 24-hrhythmicity in the metabolites (SI Appendix, Figs. S5 and S6)—typically peaking during the daytime after the day-shift condition
Skene et al. PNAS | July 24, 2018 | vol. 115 | no. 30 | 7827
PHYS
IOLO
GY
and during the nighttime after the night-shift condition (e.g., Fig.2, Right). In other instances, 24-h rhythms were seen only afterthe day-shift condition, peaking during the daytime, or only afterthe night-shift condition, peaking during the nighttime (SI Ap-pendix, Fig. S5). Although with 14 subjects our sample was rel-atively small, these effects were robust and highly statisticallysignificant. Importantly, the altered rhythms persisted underconstant routine conditions in the absence of any externallyimposed rhythms. This provides strong evidence that most of themetabolite rhythms observed were driven by behavioral timecues—from the light/dark exposure, sleep/wakefulness, rest/ac-tivity, and/or feeding/fasting cycles—during the preceding simu-lated shift schedules. Exogenous, behavioral time cues associatedwith externally imposed schedules thus have the capacity to driveendogenous rhythmicity in metabolism, likely by impacting onperipheral oscillators (17, 18) and dissociating them from therhythm of the central SCN pacemaker.The mechanisms linking shift work with an increased risk of
type 2 diabetes are not well understood. Although metabolicprofiling (metabolomics) has been used to investigate pre-diabetic/obese and type 2 diabetic phenotypes (19–21), this hasbeen limited to single-time-point samples. To assess the in-teraction between circadian timing and metabolic physiology, we
recently compared 24-h metabolite rhythms in overweight/obeseindividuals and in individuals with type 2 diabetes to age- andweight-matched controls (4). Several metabolites, includingproline, sarcosine, and lysoPC a C18:1 and C18:2, exhibited ro-bust daily rhythms in the majority of participants in all studygroups and showed a progressive change in concentration fromlean to overweight/obese to type 2 diabetes groups. Isoleucineand valine rhythms were lost in patients with type 2 diabetescompared with controls. These metabolites may play a role or actas biomarkers in the progression from a healthy weight to obesitywith type 2 diabetes. In the current study, rhythms in proline,lysoPC a C18:1 and C18:2, leucine, and isoleucine were alteredby externally imposed behavioral time cues (Fig. 1), and pathwayanalysis implicated proline metabolism and biosynthesis ofbranched-chain amino acids (leucine, isoleucine, valine) as im-pacted by simulated night-shift work (SI Appendix, Table S4).Whether these metabolite rhythms and pathways reflecting dis-rupted circadian rhythms in peripheral metabolism due to sim-ulated night-shift work link to the metabolic phenotype of type 2diabetes remains to be studied.In addition to type 2 diabetes, shift work has been linked to
a host of other chronic medical conditions, including renal dys-function (22, 23) and various types of cancer (24–27). There is
Sarcosine (N-methylglycine) Sphingolipid SM C20:2
Con
cent
ratio
n (
M) 7
6
5
4
3
0.7
0.6
0.5
0.4
midnight 03 06 09 12 15 18 21 24 midnight 03 06 09 12 15 18 21 24Clock Time Clock Time
Con
cent
ratio
n (
M) 7
6
5
4
3
0.7
0.6
0.5
0.4
DLMO 03 06 09 12 15 18 21 24 DLMO 03 06 09 12 15 18 21 24Circadian Time Circadian Time
Con
cent
ratio
n (
M) 7
6
5
4
3
0.7
0.6
0.5
0.4
lights-on 03 06 09 12 15 18 21 24 lights-on 03 06 09 12 15 18 21 24Zeitgeber Time Zeitgeber Time
Fig. 2. Three representations of the cosinor fits for two example metabolites: a biogenic amine, sarcosine (N-methylglycine, Left); and a sphingolipid, SM C20:2(Right). (Top) By clock time (i.e., time of day, relative to midnight). (Middle) By circadian time (relative to the timing of melatonin onset, DLMO). (Bottom) Byzeitgeber time (i.e., time awake, relative to lights on). Orange/red: constant routine after simulated day-shift condition. Purple/blue: constant routine aftersimulated night-shift condition. Circles: group means (±SE). Curves: cosinor fits. Red and blue markers: timing of acrophase (and 95% confidence interval).
7828 | www.pnas.org/cgi/doi/10.1073/pnas.1801183115 Skene et al.

evidence that the kidneys have their own circadian oscillators(28), and it is possible that disruption of these peripheral oscil-lators leads to renal disease (29). Consistent with this possibility,we found that tryptophan and kynurenine, markers of renalfunction (30), were altered by prior exposure to simulatednight-shift work. Peripheral clocks are also critically involvedin the coordination of cellular processes such as cell cycles,DNA repair, and apoptosis (31). Animal models with exter-nally disturbed circadian rhythms show dysregulation of theseprocesses, promoting tumorigenesis and tumor growth (32–34). Our pathway analyses revealed that some of the majorcomponents of amino acid metabolism—including cyanoaminoacid, glycine, serine, threonine, alanine, and glutathionepathways—were enriched under the day-shift condition butnot under the night-shift condition (SI Appendix, Tables S3and S4). These pathways have the capacity to influencecancer-cell gene-expression patterns, cell proliferation, andtumor microenvironments (35), and glutathione in particularplays a role in protection against oxidative stress, increasedmitochondrial respiration, and protection from cell death (36).Our targeted metabolomics approach was not specifically fo-cused on such effects, but the results suggest that alteredmetabolite rhythms after exposure to night-shift work couldbe involved in the development of a wide range of chronicdiseases (37).Of the 65 metabolites that showed 24-h rhythmicity under
constant routine following either or both simulated shift sched-ules, only 3 maintained a rhythm after both schedules in which astable phase alignment was kept relative to traditional markersof the central SCN clock (melatonin, cortisol, PER3 expression;SI Appendix, Figs. S2–S4). These metabolites—taurine, seroto-nin, and sarcosine (N-methylglycine; Fig. 2, Left)—thus appearto be resistant to externally imposed behavioral rhythms. Theirtemporal profiles may be controlled by the SCN clock (38), orthey may be generally slower to adapt to shifted temporal cues.The observed 24-h rhythms in the other 62 metabolites, most ofwhich are bioactive lipids, amino acids, acylcarnitines, and othercompounds implicated in metabolic processes and energy me-tabolism, provide a window on peripheral clock function in theliver, pancreas, and digestive tract. Although our study involvedacute exposure to simulated night-shift work in healthy non–shift-working volunteers inside the laboratory, and the resultstherefore do not readily generalize to real-world shift-worksettings, our data nonetheless provide clues about whichmetabolic pathways to target for further research. Such re-search could, on the one hand, aim to identify early stagebiomarkers of the pathophysiology of metabolic disordersassociated with shift work and, on the other hand, aim toelucidate underlying mechanisms and enable the develop-ment of new therapeutic interventions to promote long-termshift worker health.The 24-h duration of our constant routine protocol was rela-
tively short, which is a limitation of the study. Even so, our re-sults were robust to any transient effects from physiologicaladjustment to the constant routine procedures that may haveoccurred (SI Appendix, Materials and Methods). Also, the tar-geted metabolomics approach that we used (3, 4) did not coverthe entire metabolome. As such, we do not know whether otherclasses of metabolites (e.g., polar metabolites) would show asimilar predominance of synchronization to behavioral time cuesrather than the central SCN pacemaker. While our targetedapproach is restrictive in that regard, it is quantitative and reli-able (39) and, compared with whole-metabolome analyses, canbe more readily confirmed and validated in other laboratories.Through our targeted metabolomics approach, we were thusable to separate circadian- and behavior-driven rhythms in me-tabolism. The behavior-driven rhythms that we observed may
have been influenced by the experimentally imposed time cues inlight/dark exposure, sleep/wakefulness, rest/activity, and/or feed-ing/fasting; our experimental paradigm did not allow us to disen-tangle these external factors. However, night-shift workerstypically experience changes in these behavioral time cues intandem, as their work schedules force them to shift their wake-fulness—and thereby also their activity and feeding patterns andexposure to light—into the night.Time-restricted feeding has been proposed as a potential strat-
egy to restore normal peripheral clock rhythmicity in metabolicpathways disturbed by circadian misalignment (40). In mousemodels, feeding restriction during the inactive part of the day re-sults in ∼12-h phase shifting in core clock genes in peripheral tis-sues such as the liver (17, 41) within a time span of just 2 d (42).Time-restricted feeding patterns also affect the mouse metabolome(43), but the phase shifting in peripheral oscillators appears to beindependent of clock gene expression in the central SCN pace-maker (17, 42). Initial laboratory studies in humans suggest thattime-restricted feeding may help to address abnormalities in glu-cose metabolism in night-shift workers (44). Our current finding ofsimulated night-shift work inducing changes in the timing of me-tabolite rhythms, indicative of disturbed peripheral clock functionin the liver, pancreas, and digestive tract, provides a mechanisticfoundation for this type of intervention and a quantitative tool todetermine its effectiveness.
Materials and MethodsClinical Study. The study was approved by the Institutional Review Board ofWashington State University. Participants gave written, informed consent.They had to meet defined inclusion criteria to be deemed eligible for thestudy (SI Appendix, Materials and Methods).
In-Laboratory Experiment. The 7-d in-laboratory experiment (SI Appendix, Fig.S1) was conducted under controlled conditions (constant ambient temper-ature of 21 ± 1 °C, constant light level of less than 50 lx during scheduledwakefulness) in the Sleep and Performance Research Center at WashingtonState University Spokane. The study consisted of a baseline day and nightfollowed by assignment to either a 3-d simulated day-shift schedule (sleepopportunity: 22:00–06:00) or, after a transition nap (sleep opportunity:14:00–18:00), to a 3-d simulated night-shift schedule (sleep opportunity:10:00–18:00). During the simulated shift days, breakfast, lunch, and dinnerwere provided at 1.5, 7, and 13.5 h of scheduled wakefulness, respectively.The 3-d simulated shift schedule was followed by a 24-h constant routineprotocol, which involved controlled environmental conditions with fixedsemirecumbent posture, hourly identical snacks, and sustained wakefulnessto investigate rhythms free of exogenous factors (45). The study concludedwith a recovery day.
During the 24-h constant routine, blood samples were taken through ani.v. catheter at intervals of 1–3 h (SI Appendix, Fig. S1). The samples wereused for targeted LC/MS metabolomics and cortisol and PER3 assays. Addi-tional i.v. blood samples were taken hourly during the baseline day (18:30–21:30) and during the constant routine (18:30–01:30) for melatonin assays (SIAppendix, Fig. S1).
Analyses. See SI Appendix, Materials and Methods for details of the targetedLC/MS metabolomics analysis; melatonin, cortisol, and PER3 assays; andstatistical analyses.
ACKNOWLEDGMENTS. We thank the staff of the human sleep laboratory inthe Sleep and Performance Research Center at Washington State UniversitySpokane for their help conducting the clinical study; Dr. Matthew Layton forserving as physician of record for the clinical study; and the MetabolomicsCore Facility at the University of Surrey. This work was supported by start-upfunds from the College of Pharmacy and Pharmaceutical Sciences atWashington State University (to S.G.) and in part by Congressionally DirectedMedical Research Program Award W81XWH-16-1-0319 (to H.P.A.V.D.);National Institutes of Health Grant R00ES022640 (to S.G.); UK Biotechnologyand Biological Sciences Research Council Grant BB/I019405/1 (to D.J.S.); andEuropean Union FP7-HEALTH-2011 EuRhythDia Grant 278397 (to D.J.S.).
Skene et al. PNAS | July 24, 2018 | vol. 115 | no. 30 | 7829
PHYS
IOLO
GY

1. Reppert SM, Weaver DR (2002) Coordination of circadian timing in mammals. Nature418:935–941.
2. Kecklund G, Axelsson J (2016) Health consequences of shift work and insufficientsleep. BMJ 355:i5210.
3. Davies SK, et al. (2014) Effect of sleep deprivation on the human metabolome. ProcNatl Acad Sci USA 111:10761–10766.
4. Isherwood CM, Van der Veen DR, Johnston JD, Skene DJ (2017) Twenty-four-hourrhythmicity of circulating metabolites: Effect of body mass and type 2 diabetes.FASEB J 31:5557–5567.
5. Dallmann R, Viola AU, Tarokh L, Cajochen C, Brown SA (2012) The human circadianmetabolome. Proc Natl Acad Sci USA 109:2625–2629.
6. Kasukawa T, et al. (2012) Human blood metabolite timetable indicates internal bodytime. Proc Natl Acad Sci USA 109:15036–15041.
7. Chua EC, et al. (2013) Extensive diversity in circadian regulation of plasma lipids andevidence for different circadian metabolic phenotypes in humans. Proc Natl Acad SciUSA 110:14468–14473.
8. Arendt J, Skene DJ (2005) Melatonin as a chronobiotic. Sleep Med Rev 9:25–39.9. Viola AU, et al. (2007) PER3 polymorphism predicts sleep structure and waking per-
formance. Curr Biol 17:613–618.10. Lee C, Smith MR, Eastman CI (2006) A compromise phase position for permanent
night shift workers: Circadian phase after two night shifts with scheduled sleep andlight/dark exposure. Chronobiol Int 23:859–875.
11. James FO, Cermakian N, Boivin DB (2007) Circadian rhythms of melatonin, cortisol,and clock gene expression during simulated night shift work. Sleep 30:1427–1436.
12. Hansen JH, Geving IH, Reinertsen RE (2010) Adaptation rate of 6-sulfatoxymelatoninand cognitive performance in offshore fleet shift workers: A field study. Int ArchOccup Environ Health 83:607–615.
13. Boivin DB, Boudreau P, James FO, Kin NM (2012) Photic resetting in night-shift work:Impact on nurses’ sleep. Chronobiol Int 29:619–628.
14. Wever RA (1979) The Circadian System of Man (Springer, New York).15. James SM, Honn KA, Gaddameedhi S, Van Dongen HPA (2017) Shift work: Disrupted
circadian rhythms and sleep—Implications for health and well-being. Curr Sleep MedRep 3:104–112.
16. Leproult R, Holmbäck U, Van Cauter E (2014) Circadian misalignment augmentsmarkers of insulin resistance and inflammation, independently of sleep loss. Diabetes63:1860–1869.
17. Damiola F, et al. (2000) Restricted feeding uncouples circadian oscillators in peripheraltissues from the central pacemaker in the suprachiasmatic nucleus. Genes Dev 14:2950–2961.
18. Wehrens SMT, et al. (2017) Meal timing regulates the human circadian system. CurrBiol 27:1768–1775.e3.
19. Newgard CB, et al. (2009) A branched-chain amino acid-related metabolic signaturethat differentiates obese and lean humans and contributes to insulin resistance. CellMetab 9:311–326.
20. Suhre K, et al. (2010) Metabolic footprint of diabetes: A multiplatform metabolomicsstudy in an epidemiological setting. PLoS One 5:e13953.
21. Wang-Sattler R, et al. (2012) Novel biomarkers for pre-diabetes identified by me-tabolomics. Mol Syst Biol 8:615.
22. Charles LE, et al. (2013) Association between shiftwork and glomerular filtration ratein police officers. J Occup Environ Med 55:1323–1328.
23. Sasaki S, et al. (2014) Short sleep duration increases the risk of chronic kidney diseasein shift workers. J Occup Environ Med 56:1243–1248.
24. Parent MÉ, El-Zein M, Rousseau MC, Pintos J, Siemiatycki J (2012) Night work and therisk of cancer among men. Am J Epidemiol 176:751–759.
25. He C, Anand ST, Ebell MH, Vena JE, Robb SW (2015) Circadian disrupting exposuresand breast cancer risk: A meta-analysis. Int Arch Occup Environ Health 88:533–547.
26. Lin X, et al. (2015) Night-shift work increases morbidity of breast cancer and all-causemortality: A meta-analysis of 16 prospective cohort studies. Sleep Med 16:1381–1387.
27. Rao D, Yu H, Bai Y, Zheng X, Xie L (2015) Does night-shift work increase the risk ofprostate cancer? A systematic review and meta-analysis. OncoTargets Ther 8:2817–2826.
28. Stow LR, Gumz ML (2011) The circadian clock in the kidney. J Am Soc Nephrol 22:598–604.
29. Martino TA, et al. (2008) Circadian rhythm disorganization produces profound car-diovascular and renal disease in hamsters. Am J Physiol Regul Integr Comp Physiol294:R1675–R1683.
30. Pawlak D, Tankiewicz A, Mysliwiec P, Buczko W (2002) Tryptophan metabolism viathe kynurenine pathway in experimental chronic renal failure. Nephron 90:328–335.
31. Fu L, Kettner NM (2013) The circadian clock in cancer development and therapy. ProgMol Biol Transl Sci 119:221–282.
32. Lee S, Donehower LA, Herron AJ, Moore DD, Fu L (2010) Disrupting circadian ho-meostasis of sympathetic signaling promotes tumor development in mice. PLoS One5:e10995.
33. Van Dycke KC, et al. (2015) Chronically alternating light cycles increase breast cancerrisk in mice. Curr Biol 25:1932–1937.
34. Papagiannakopoulos T, et al. (2016) Circadian rhythm disruption promotes lung tu-morigenesis. Cell Metab 24:324–331.
35. Pavlova NN, Thompson CB (2016) The emerging hallmarks of cancer metabolism. CellMetab 23:27–47.
36. Circu ML, Aw TY (2012) Glutathione and modulation of cell apoptosis. BiochimBiophys Acta 1823:1767–1777.
37. McGinnis GR, YoungME (2016) Circadian regulation of metabolic homeostasis: Causesand consequences. Nat Sci Sleep 8:163–180.
38. Panda S, et al. (2002) Coordinated transcription of key pathways in the mouse by thecircadian clock. Cell 109:307–320.
39. Siskos AP, et al. (2017) Interlaboratory reproducibility of a targeted metabolomicsplatform for analysis of human serum and plasma. Anal Chem 89:656–665.
40. Panda S (2016) Circadian physiology of metabolism. Science 354:1008–1015.41. Davidson AJ, Poole AS, Yamazaki S, Menaker M (2003) Is the food-entrainable cir-
cadian oscillator in the digestive system? Genes Brain Behav 2:32–39.42. Stokkan KA, Yamazaki S, Tei H, Sakaki Y, Menaker M (2001) Entrainment of the
circadian clock in the liver by feeding. Science 291:490–493.43. Chaix A, Zarrinpar A, Miu P, Panda S (2014) Time-restricted feeding is a preventative
and therapeutic intervention against diverse nutritional challenges. Cell Metab 20:991–1005.
44. Grant CL, et al. (2017) Timing of food intake during simulated night shift impactsglucose metabolism: A controlled study. Chronobiol Int 34:1003–1013.
45. Duffy JF, Dijk DJ (2002) Getting through to circadian oscillators: Why use constantroutines? J Biol Rhythms 17:4–13.
7830 | www.pnas.org/cgi/doi/10.1073/pnas.1801183115 Skene et al.
www.pnas.org/cgi/doi/10.1073/pnas. 1
Supplementary Information for Separation of circadian- and behavior-driven metabolite rhythms in humans provides a window on peripheral oscillators and metabolism Debra J. Skene, Elena Skornyakov, Namrata R. Chowdhury, Rajendra P. Gajula, Benita Middleton, Brieann C. Satterfield, Kenneth Porter, Hans P.A. Van Dongen, Shobhan Gaddameedhi Hans P.A. Van Dongen, Ph.D. Email: [email protected] This PDF file includes:
Supplementary text Figs. S1 to S6 Tables S1 to S4 References for SI reference citations
1801183115

2
Materials and Methods Clinical study. N=14 volunteers (10 men, 4 women) aged between 22 y and 34 y (mean ± SD: 25.8 ± 3.2 y) with a body mass index (BMI) of 25.7 ± 3.2 kg/m2 completed the study. The participants were randomized to either the simulated day shift condition (7 participants) or the simulated night shift condition (7 participants); see Fig. S1. There was a small age difference between the two groups (day shift condition: 24.0 ± 2.2 y; night shift condition: 27.6 ± 3.2 y; t12=2.4, p=0.031). The groups were not significantly different with regard to BMI (day shift condition: 25.9 ± 3.4 kg/m2; night shift condition: 25.6 ± 3.3 kg/m2; t12=0.14, p=0.89) or sex distribution (day shift condition: 4 men; night shift condition: 6 men; χ
12=1.4, p=0.24).
Participants were screened to be physically and psychologically healthy with no medical or drug treatment, as verified by physical examination, blood chemistry, urinalysis, and questionnaires. They reported good habitual sleep, between 6 and 10 hours in duration and habitually getting up between 06:00 and 09:00, and were no extreme morning- or evening-types as assessed by questionnaire (Composite Scale of Morningness). They showed no evidence of any sleep or circadian disorders as assessed by nocturnal polysomnography (1) and validated questionnaires (Pittsburgh Sleep Quality Index, Sleep Disorders Questionnaire, Epworth Sleepiness Scale). They had no history of drug or alcohol abuse, were free of traces of alcohol and drugs as assessed by drug screen and breathalyzer, and did not smoke. They were not involved in shift work within three months of entering the study, and did not travel across time zones within one month of entering the study. Women were not pregnant as assessed by blood-based assay. Participants maintained a regular sleep/wake schedule in the week prior to the in-laboratory experiment, with bedtimes and wake times within 30 minutes from their self-reported habitual schedule. This was confirmed by means of wrist actigraphy, sleep diary, and participants calling a time-stamped voice mail recorder upon waking and before going to bed. In the week prior to the study, participants were requested to abstain from alcohol and caffeine. Targeted metabolomics analysis. Although targeted metabolomics does not provide a complete assessment of the entire metabolome, it covers important metabolite classes, and the results obtained are quantifiable and highly reproducible across laboratories (2). Targeted metabolomics is also well suited for high throughput of large number of samples as generated by time-series circadian studies. Metabolites were quantified in the plasma samples collected at 3-h intervals during the 24-h constant routine using the AbsoluteIDQ p180 targeted metabolomics kit (Biocrates Life Sciences AG, Innsbruck, Austria) and a Waters Xevo TQ-S mass spectrometer coupled to an Acquity UPLC system (Waters Corporation, Milford, MA, USA). Plasma samples (10 μl) were prepared according to the manufacturer’s instructions adding several stable isotope–labeled standards to the samples prior to the derivatization and extraction steps. Using LC/MS (liquid chromatography/mass spectrometry), 184 metabolites from 5 different compound classes (acylcarnitines, amino acids, biogenic amines, glycerophospholipids, and sphingolipids) were quantified. The samples were run on 2×96-well plates. Sample order was randomized and three levels of quality control (QC) were run on each plate. Data were normalized between the plates using the

3
results of quality control level 2 (QC2) repeats across the plate (n=4) and between plates (n=2) using Biocrates METIDQ software (QC2 correction). Metabolites where >25% samples were below the limit of detection, below the lower limit of quantification, above the upper limit of quantification, or blank out of range, or where the QC2 coefficient of variance was >30%, were excluded. This was the case for 52 metabolites. The remaining 132 quantified metabolites comprised 10 acylcarnitines, 20 amino acids, 7 biogenic amines, 81 glycerophospholipids, and 14 sphingolipids. Plasma melatonin. Melatonin levels were measured in the plasma samples collected hourly at baseline (18:30–21:30) and during the constant routine (18:30–01:30) using RIA (IB88111, IBL, Minneapolis, MN, USA) performed in duplicate by KMI Diagnostics, Inc. (Minneapolis, MN, USA). Plasma cortisol. Cortisol levels were measured in the plasma samples collected at 3-h intervals during the 24-h constant routine using ELISA (ADI-900-097, Enzo Life Sciences, Farmingdale, NY, USA) following the manufacturer’s instructions. Assays were performed in triplicate. Standards were used as per the kit manual. Analyses were performed using MyAssays software as recommended (https://www.myassays.com/corticosterone-(enzo).assay). PER3 expression. PER3 transcript levels were measured in the plasma samples collected at 3-h intervals during the 24-h constant routine using nCounter multiplexed assay (NanoString Technologies, Seattle, WA, USA). RNA was measured directly with no amplification or other enzymatic processing. 100 ng of total RNA was used for the assay. Analysis was performed using nSolver 3.0 software (NanoString Technologies, Seattle, WA, USA). Genes with an expectancy of less than 10 counts with 90% occurrence or more were removed. Background values were subtracted and data were normalized with overall geometric mean of internal control genes. Statistical analysis. Cosinor analysis to investigate 24-h rhythmicity in all of the metabolites, cortisol, and PER3 expression, was performed across all participants in both conditions using linear mixed-effects regression (3). Regression coefficients for mesor (center level), acrophase (timing of peak), and amplitude (difference between mesor and level at acrophase) were assessed (Table S1) and used for statistical testing. Rhythm significance in each of the two conditions was determined by testing amplitude against zero using t test, with a one-sided type I error threshold of 0.05. 95% confidence intervals for acrophase were computed using the delta method. Differences between conditions in acrophase, amplitude and mesor were evaluated using t test, with a two-sided type I error threshold of 0.05. The cosinor analyses for metabolites were repeated after removal of data from the first 3 h of the 24-h constant routine period, in order to verify robustness to any transient effects from physiological adjustment to the constant routine procedures. This resulted in minor differences in acrophase estimates (mean ± SD: 38 ± 34 min) and did not substantively affect any of the findings. Separately, the cosinor analyses for metabolites were repeated with time awake added as a regression term. Out of the 132 metabolites analyzed, 115 did not show a significant effect of time awake. For the 17 metabolites that did show a significant effect of time awake, the levels of 7 metabolites decreased and the levels of 10 metabolites increased across the 24-h constant

4
routine. In all cases, the total change over time was small relative to the 24-h overall average. The constant routine procedure and the increasing sleep pressure associated with 24-h sustained wakefulness did not produce any substantive confounds in the metabolites’ temporal profiles. The timing of dim light melatonin onset (DLMO) was analyzed with non-linear mixed-effects regression of a Taylor series approximation of the melatonin curve (Fig. S2). Differences between conditions were evaluated using t test. Differences between baseline and constant routine were evaluated using paired-sample t test. Although this methodology does not require the definition of a threshold to estimate timing differences, we used a conventional 10 pg/ml threshold (4) to define the DLMO. Principal component analysis (PCA) was based on scree plot to determine how many factors to retain, and used varimax rotation to assess factor loadings. All statistical analyses were implemented in SAS version 9.4. Pathway analyses were performed for the day shift and night shift conditions separately (Tables S3, S4) using the MetaboAnalyst 3.0 database (5). Enriched pathways were identified using a false discovery rate (FDR) threshold of 0.05.
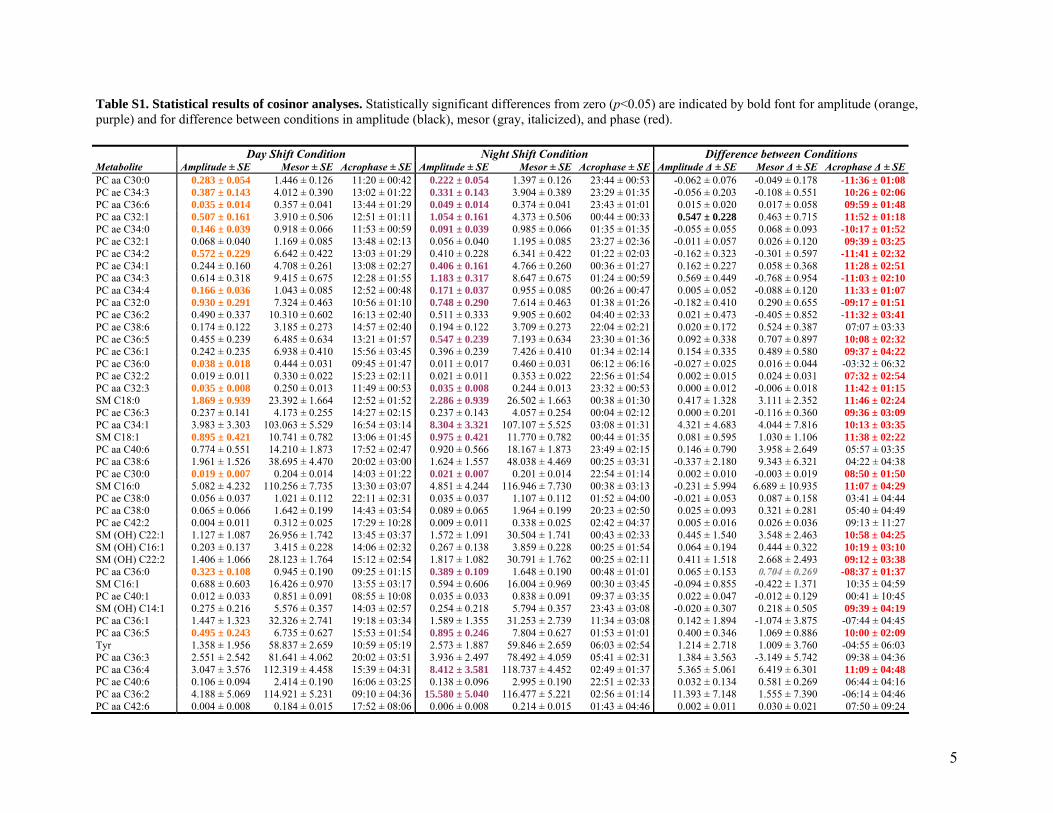
5
Table S1. Statistical results of cosinor analyses. Statistically significant differences from zero (p<0.05) are indicated by bold font for amplitude (orange, purple) and for difference between conditions in amplitude (black), mesor (gray, italicized), and phase (red). Day Shift Condition Night Shift Condition Difference between Conditions Metabolite Amplitude ± SE Mesor ± SE Acrophase ± SE Amplitude ± SE Mesor ± SE Acrophase ± SE Amplitude Δ ± SE Mesor Δ ± SE Acrophase Δ ± SEPC aa C30:0 0.283 ± 0.054 1.446 ± 0.126 11:20 ± 00:42 0.222 ± 0.054 1.397 ± 0.126 23:44 ± 00:53 -0.062 ± 0.076 -0.049 ± 0.178 -11:36 ± 01:08PC ae C34:3 0.387 ± 0.143 4.012 ± 0.390 13:02 ± 01:22 0.331 ± 0.143 3.904 ± 0.389 23:29 ± 01:35 -0.056 ± 0.203 -0.108 ± 0.551 10:26 ± 02:06PC aa C36:6 0.035 ± 0.014 0.357 ± 0.041 13:44 ± 01:29 0.049 ± 0.014 0.374 ± 0.041 23:43 ± 01:01 0.015 ± 0.020 0.017 ± 0.058 09:59 ± 01:48PC aa C32:1 0.507 ± 0.161 3.910 ± 0.506 12:51 ± 01:11 1.054 ± 0.161 4.373 ± 0.506 00:44 ± 00:33 0.547 ± 0.228 0.463 ± 0.715 11:52 ± 01:18PC ae C34:0 0.146 ± 0.039 0.918 ± 0.066 11:53 ± 00:59 0.091 ± 0.039 0.985 ± 0.066 01:35 ± 01:35 -0.055 ± 0.055 0.068 ± 0.093 -10:17 ± 01:52PC ae C32:1 0.068 ± 0.040 1.169 ± 0.085 13:48 ± 02:13 0.056 ± 0.040 1.195 ± 0.085 23:27 ± 02:36 -0.011 ± 0.057 0.026 ± 0.120 09:39 ± 03:25PC ae C34:2 0.572 ± 0.229 6.642 ± 0.422 13:03 ± 01:29 0.410 ± 0.228 6.341 ± 0.422 01:22 ± 02:03 -0.162 ± 0.323 -0.301 ± 0.597 -11:41 ± 02:32PC ae C34:1 0.244 ± 0.160 4.708 ± 0.261 13:08 ± 02:27 0.406 ± 0.161 4.766 ± 0.260 00:36 ± 01:27 0.162 ± 0.227 0.058 ± 0.368 11:28 ± 02:51PC aa C34:3 0.614 ± 0.318 9.415 ± 0.675 12:28 ± 01:55 1.183 ± 0.317 8.647 ± 0.675 01:24 ± 00:59 0.569 ± 0.449 -0.768 ± 0.954 -11:03 ± 02:10PC aa C34:4 0.166 ± 0.036 1.043 ± 0.085 12:52 ± 00:48 0.171 ± 0.037 0.955 ± 0.085 00:26 ± 00:47 0.005 ± 0.052 -0.088 ± 0.120 11:33 ± 01:07PC aa C32:0 0.930 ± 0.291 7.324 ± 0.463 10:56 ± 01:10 0.748 ± 0.290 7.614 ± 0.463 01:38 ± 01:26 -0.182 ± 0.410 0.290 ± 0.655 -09:17 ± 01:51PC ae C36:2 0.490 ± 0.337 10.310 ± 0.602 16:13 ± 02:40 0.511 ± 0.333 9.905 ± 0.602 04:40 ± 02:33 0.021 ± 0.473 -0.405 ± 0.852 -11:32 ± 03:41PC ae C38:6 0.174 ± 0.122 3.185 ± 0.273 14:57 ± 02:40 0.194 ± 0.122 3.709 ± 0.273 22:04 ± 02:21 0.020 ± 0.172 0.524 ± 0.387 07:07 ± 03:33PC ae C36:5 0.455 ± 0.239 6.485 ± 0.634 13:21 ± 01:57 0.547 ± 0.239 7.193 ± 0.634 23:30 ± 01:36 0.092 ± 0.338 0.707 ± 0.897 10:08 ± 02:32PC ae C36:1 0.242 ± 0.235 6.938 ± 0.410 15:56 ± 03:45 0.396 ± 0.239 7.426 ± 0.410 01:34 ± 02:14 0.154 ± 0.335 0.489 ± 0.580 09:37 ± 04:22PC ae C36:0 0.038 ± 0.018 0.444 ± 0.031 09:45 ± 01:47 0.011 ± 0.017 0.460 ± 0.031 06:12 ± 06:16 -0.027 ± 0.025 0.016 ± 0.044 -03:32 ± 06:32PC ae C32:2 0.019 ± 0.011 0.330 ± 0.022 15:23 ± 02:11 0.021 ± 0.011 0.353 ± 0.022 22:56 ± 01:54 0.002 ± 0.015 0.024 ± 0.031 07:32 ± 02:54PC aa C32:3 0.035 ± 0.008 0.250 ± 0.013 11:49 ± 00:53 0.035 ± 0.008 0.244 ± 0.013 23:32 ± 00:53 0.000 ± 0.012 -0.006 ± 0.018 11:42 ± 01:15SM C18:0 1.869 ± 0.939 23.392 ± 1.664 12:52 ± 01:52 2.286 ± 0.939 26.502 ± 1.663 00:38 ± 01:30 0.417 ± 1.328 3.111 ± 2.352 11:46 ± 02:24PC ae C36:3 0.237 ± 0.141 4.173 ± 0.255 14:27 ± 02:15 0.237 ± 0.143 4.057 ± 0.254 00:04 ± 02:12 0.000 ± 0.201 -0.116 ± 0.360 09:36 ± 03:09PC aa C34:1 3.983 ± 3.303 103.063 ± 5.529 16:54 ± 03:14 8.304 ± 3.321 107.107 ± 5.525 03:08 ± 01:31 4.321 ± 4.683 4.044 ± 7.816 10:13 ± 03:35SM C18:1 0.895 ± 0.421 10.741 ± 0.782 13:06 ± 01:45 0.975 ± 0.421 11.770 ± 0.782 00:44 ± 01:35 0.081 ± 0.595 1.030 ± 1.106 11:38 ± 02:22PC aa C40:6 0.774 ± 0.551 14.210 ± 1.873 17:52 ± 02:47 0.920 ± 0.566 18.167 ± 1.873 23:49 ± 02:15 0.146 ± 0.790 3.958 ± 2.649 05:57 ± 03:35PC aa C38:6 1.961 ± 1.526 38.695 ± 4.470 20:02 ± 03:00 1.624 ± 1.557 48.038 ± 4.469 00:25 ± 03:31 -0.337 ± 2.180 9.343 ± 6.321 04:22 ± 04:38PC ae C30:0 0.019 ± 0.007 0.204 ± 0.014 14:03 ± 01:22 0.021 ± 0.007 0.201 ± 0.014 22:54 ± 01:14 0.002 ± 0.010 -0.003 ± 0.019 08:50 ± 01:50SM C16:0 5.082 ± 4.232 110.256 ± 7.735 13:30 ± 03:07 4.851 ± 4.244 116.946 ± 7.730 00:38 ± 03:13 -0.231 ± 5.994 6.689 ± 10.935 11:07 ± 04:29PC ae C38:0 0.056 ± 0.037 1.021 ± 0.112 22:11 ± 02:31 0.035 ± 0.037 1.107 ± 0.112 01:52 ± 04:00 -0.021 ± 0.053 0.087 ± 0.158 03:41 ± 04:44PC aa C38:0 0.065 ± 0.066 1.642 ± 0.199 14:43 ± 03:54 0.089 ± 0.065 1.964 ± 0.199 20:23 ± 02:50 0.025 ± 0.093 0.321 ± 0.281 05:40 ± 04:49PC ae C42:2 0.004 ± 0.011 0.312 ± 0.025 17:29 ± 10:28 0.009 ± 0.011 0.338 ± 0.025 02:42 ± 04:37 0.005 ± 0.016 0.026 ± 0.036 09:13 ± 11:27SM (OH) C22:1 1.127 ± 1.087 26.956 ± 1.742 13:45 ± 03:37 1.572 ± 1.091 30.504 ± 1.741 00:43 ± 02:33 0.445 ± 1.540 3.548 ± 2.463 10:58 ± 04:25SM (OH) C16:1 0.203 ± 0.137 3.415 ± 0.228 14:06 ± 02:32 0.267 ± 0.138 3.859 ± 0.228 00:25 ± 01:54 0.064 ± 0.194 0.444 ± 0.322 10:19 ± 03:10SM (OH) C22:2 1.406 ± 1.066 28.123 ± 1.764 15:12 ± 02:54 1.817 ± 1.082 30.791 ± 1.762 00:25 ± 02:11 0.411 ± 1.518 2.668 ± 2.493 09:12 ± 03:38PC aa C36:0 0.323 ± 0.108 0.945 ± 0.190 09:25 ± 01:15 0.389 ± 0.109 1.648 ± 0.190 00:48 ± 01:01 0.065 ± 0.153 0.704 ± 0.269 -08:37 ± 01:37SM C16:1 0.688 ± 0.603 16.426 ± 0.970 13:55 ± 03:17 0.594 ± 0.606 16.004 ± 0.969 00:30 ± 03:45 -0.094 ± 0.855 -0.422 ± 1.371 10:35 ± 04:59PC ae C40:1 0.012 ± 0.033 0.851 ± 0.091 08:55 ± 10:08 0.035 ± 0.033 0.838 ± 0.091 09:37 ± 03:35 0.022 ± 0.047 -0.012 ± 0.129 00:41 ± 10:45SM (OH) C14:1 0.275 ± 0.216 5.576 ± 0.357 14:03 ± 02:57 0.254 ± 0.218 5.794 ± 0.357 23:43 ± 03:08 -0.020 ± 0.307 0.218 ± 0.505 09:39 ± 04:19PC aa C36:1 1.447 ± 1.323 32.326 ± 2.741 19:18 ± 03:34 1.589 ± 1.355 31.253 ± 2.739 11:34 ± 03:08 0.142 ± 1.894 -1.074 ± 3.875 -07:44 ± 04:45PC aa C36:5 0.495 ± 0.243 6.735 ± 0.627 15:53 ± 01:54 0.895 ± 0.246 7.804 ± 0.627 01:53 ± 01:01 0.400 ± 0.346 1.069 ± 0.886 10:00 ± 02:09Tyr 1.358 ± 1.956 58.837 ± 2.659 10:59 ± 05:19 2.573 ± 1.887 59.846 ± 2.659 06:03 ± 02:54 1.214 ± 2.718 1.009 ± 3.760 -04:55 ± 06:03PC aa C36:3 2.551 ± 2.542 81.641 ± 4.062 20:02 ± 03:51 3.936 ± 2.497 78.492 ± 4.059 05:41 ± 02:31 1.384 ± 3.563 -3.149 ± 5.742 09:38 ± 04:36PC aa C36:4 3.047 ± 3.576 112.319 ± 4.458 15:39 ± 04:31 8.412 ± 3.581 118.737 ± 4.452 02:49 ± 01:37 5.365 ± 5.061 6.419 ± 6.301 11:09 ± 04:48PC ae C40:6 0.106 ± 0.094 2.414 ± 0.190 16:06 ± 03:25 0.138 ± 0.096 2.995 ± 0.190 22:51 ± 02:33 0.032 ± 0.134 0.581 ± 0.269 06:44 ± 04:16PC aa C36:2 4.188 ± 5.069 114.921 ± 5.231 09:10 ± 04:36 15.580 ± 5.040 116.477 ± 5.221 02:56 ± 01:14 11.393 ± 7.148 1.555 ± 7.390 -06:14 ± 04:46PC aa C42:6 0.004 ± 0.008 0.184 ± 0.015 17:52 ± 08:06 0.006 ± 0.008 0.214 ± 0.015 01:43 ± 04:46 0.002 ± 0.011 0.030 ± 0.021 07:50 ± 09:24
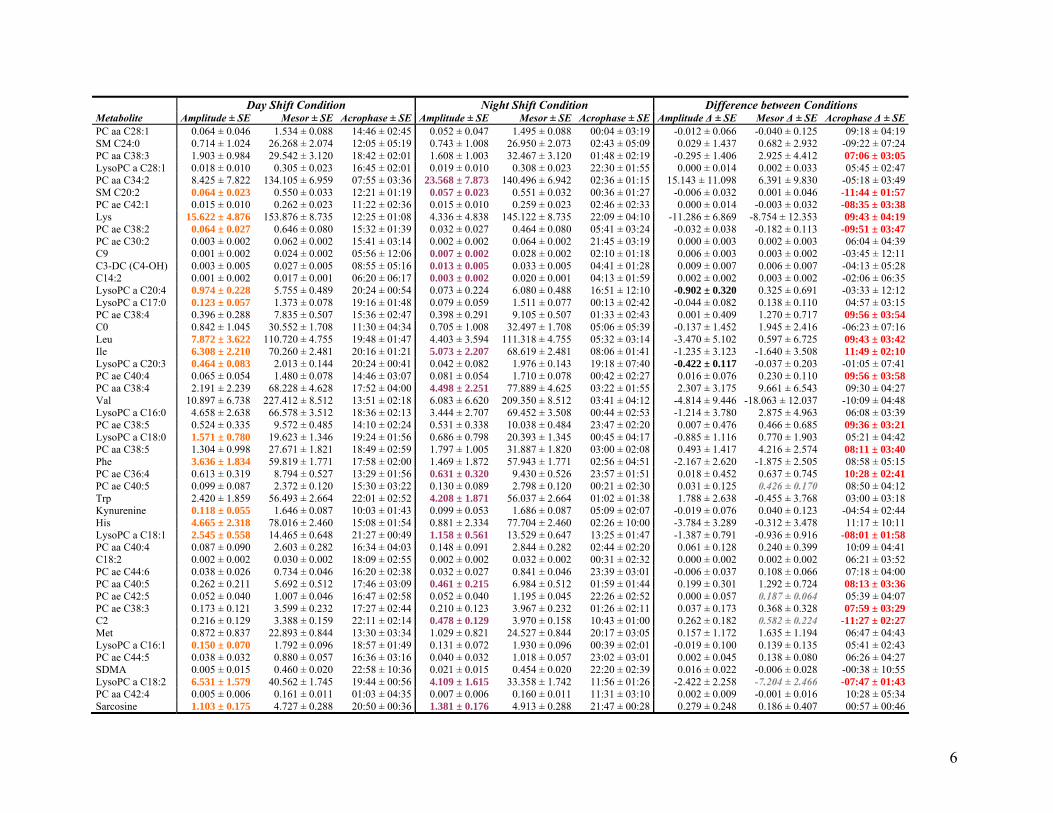
6
Day Shift Condition Night Shift Condition Difference between Conditions Metabolite Amplitude ± SE Mesor ± SE Acrophase ± SE Amplitude ± SE Mesor ± SE Acrophase ± SE Amplitude Δ ± SE Mesor Δ ± SE Acrophase Δ ± SEPC aa C28:1 0.064 ± 0.046 1.534 ± 0.088 14:46 ± 02:45 0.052 ± 0.047 1.495 ± 0.088 00:04 ± 03:19 -0.012 ± 0.066 -0.040 ± 0.125 09:18 ± 04:19SM C24:0 0.714 ± 1.024 26.268 ± 2.074 12:05 ± 05:19 0.743 ± 1.008 26.950 ± 2.073 02:43 ± 05:09 0.029 ± 1.437 0.682 ± 2.932 -09:22 ± 07:24PC aa C38:3 1.903 ± 0.984 29.542 ± 3.120 18:42 ± 02:01 1.608 ± 1.003 32.467 ± 3.120 01:48 ± 02:19 -0.295 ± 1.406 2.925 ± 4.412 07:06 ± 03:05LysoPC a C28:1 0.018 ± 0.010 0.305 ± 0.023 16:45 ± 02:01 0.019 ± 0.010 0.308 ± 0.023 22:30 ± 01:55 0.000 ± 0.014 0.002 ± 0.033 05:45 ± 02:47PC aa C34:2 8.425 ± 7.822 134.105 ± 6.959 07:55 ± 03:36 23.568 ± 7.873 140.496 ± 6.942 02:36 ± 01:15 15.143 ± 11.098 6.391 ± 9.830 -05:18 ± 03:49SM C20:2 0.064 ± 0.023 0.550 ± 0.033 12:21 ± 01:19 0.057 ± 0.023 0.551 ± 0.032 00:36 ± 01:27 -0.006 ± 0.032 0.001 ± 0.046 -11:44 ± 01:57PC ae C42:1 0.015 ± 0.010 0.262 ± 0.023 11:22 ± 02:36 0.015 ± 0.010 0.259 ± 0.023 02:46 ± 02:33 0.000 ± 0.014 -0.003 ± 0.032 -08:35 ± 03:38Lys 15.622 ± 4.876 153.876 ± 8.735 12:25 ± 01:08 4.336 ± 4.838 145.122 ± 8.735 22:09 ± 04:10 -11.286 ± 6.869 -8.754 ± 12.353 09:43 ± 04:19PC ae C38:2 0.064 ± 0.027 0.646 ± 0.080 15:32 ± 01:39 0.032 ± 0.027 0.464 ± 0.080 05:41 ± 03:24 -0.032 ± 0.038 -0.182 ± 0.113 -09:51 ± 03:47PC ae C30:2 0.003 ± 0.002 0.062 ± 0.002 15:41 ± 03:14 0.002 ± 0.002 0.064 ± 0.002 21:45 ± 03:19 0.000 ± 0.003 0.002 ± 0.003 06:04 ± 04:39C9 0.001 ± 0.002 0.024 ± 0.002 05:56 ± 12:06 0.007 ± 0.002 0.028 ± 0.002 02:10 ± 01:18 0.006 ± 0.003 0.003 ± 0.002 -03:45 ± 12:11C3-DC (C4-OH) 0.003 ± 0.005 0.027 ± 0.005 08:55 ± 05:16 0.013 ± 0.005 0.033 ± 0.005 04:41 ± 01:28 0.009 ± 0.007 0.006 ± 0.007 -04:13 ± 05:28C14:2 0.001 ± 0.002 0.017 ± 0.001 06:20 ± 06:17 0.003 ± 0.002 0.020 ± 0.001 04:13 ± 01:59 0.002 ± 0.002 0.003 ± 0.002 -02:06 ± 06:35LysoPC a C20:4 0.974 ± 0.228 5.755 ± 0.489 20:24 ± 00:54 0.073 ± 0.224 6.080 ± 0.488 16:51 ± 12:10 -0.902 ± 0.320 0.325 ± 0.691 -03:33 ± 12:12LysoPC a C17:0 0.123 ± 0.057 1.373 ± 0.078 19:16 ± 01:48 0.079 ± 0.059 1.511 ± 0.077 00:13 ± 02:42 -0.044 ± 0.082 0.138 ± 0.110 04:57 ± 03:15PC ae C38:4 0.396 ± 0.288 7.835 ± 0.507 15:36 ± 02:47 0.398 ± 0.291 9.105 ± 0.507 01:33 ± 02:43 0.001 ± 0.409 1.270 ± 0.717 09:56 ± 03:54C0 0.842 ± 1.045 30.552 ± 1.708 11:30 ± 04:34 0.705 ± 1.008 32.497 ± 1.708 05:06 ± 05:39 -0.137 ± 1.452 1.945 ± 2.416 -06:23 ± 07:16Leu 7.872 ± 3.622 110.720 ± 4.755 19:48 ± 01:47 4.403 ± 3.594 111.318 ± 4.755 05:32 ± 03:14 -3.470 ± 5.102 0.597 ± 6.725 09:43 ± 03:42Ile 6.308 ± 2.210 70.260 ± 2.481 20:16 ± 01:21 5.073 ± 2.207 68.619 ± 2.481 08:06 ± 01:41 -1.235 ± 3.123 -1.640 ± 3.508 11:49 ± 02:10LysoPC a C20:3 0.464 ± 0.083 2.013 ± 0.144 20:24 ± 00:41 0.042 ± 0.082 1.976 ± 0.143 19:18 ± 07:40 -0.422 ± 0.117 -0.037 ± 0.203 -01:05 ± 07:41PC ae C40:4 0.065 ± 0.054 1.480 ± 0.078 14:46 ± 03:07 0.081 ± 0.054 1.710 ± 0.078 00:42 ± 02:27 0.016 ± 0.076 0.230 ± 0.110 09:56 ± 03:58PC aa C38:4 2.191 ± 2.239 68.228 ± 4.628 17:52 ± 04:00 4.498 ± 2.251 77.889 ± 4.625 03:22 ± 01:55 2.307 ± 3.175 9.661 ± 6.543 09:30 ± 04:27Val 10.897 ± 6.738 227.412 ± 8.512 13:51 ± 02:18 6.083 ± 6.620 209.350 ± 8.512 03:41 ± 04:12 -4.814 ± 9.446 -18.063 ± 12.037 -10:09 ± 04:48LysoPC a C16:0 4.658 ± 2.638 66.578 ± 3.512 18:36 ± 02:13 3.444 ± 2.707 69.452 ± 3.508 00:44 ± 02:53 -1.214 ± 3.780 2.875 ± 4.963 06:08 ± 03:39PC ae C38:5 0.524 ± 0.335 9.572 ± 0.485 14:10 ± 02:24 0.531 ± 0.338 10.038 ± 0.484 23:47 ± 02:20 0.007 ± 0.476 0.466 ± 0.685 09:36 ± 03:21LysoPC a C18:0 1.571 ± 0.780 19.623 ± 1.346 19:24 ± 01:56 0.686 ± 0.798 20.393 ± 1.345 00:45 ± 04:17 -0.885 ± 1.116 0.770 ± 1.903 05:21 ± 04:42PC aa C38:5 1.304 ± 0.998 27.671 ± 1.821 18:49 ± 02:59 1.797 ± 1.005 31.887 ± 1.820 03:00 ± 02:08 0.493 ± 1.417 4.216 ± 2.574 08:11 ± 03:40Phe 3.636 ± 1.834 59.819 ± 1.771 17:58 ± 02:00 1.469 ± 1.872 57.943 ± 1.771 02:56 ± 04:51 -2.167 ± 2.620 -1.875 ± 2.505 08:58 ± 05:15PC ae C36:4 0.613 ± 0.319 8.794 ± 0.527 13:29 ± 01:56 0.631 ± 0.320 9.430 ± 0.526 23:57 ± 01:51 0.018 ± 0.452 0.637 ± 0.745 10:28 ± 02:41PC ae C40:5 0.099 ± 0.087 2.372 ± 0.120 15:30 ± 03:22 0.130 ± 0.089 2.798 ± 0.120 00:21 ± 02:30 0.031 ± 0.125 0.426 ± 0.170 08:50 ± 04:12Trp 2.420 ± 1.859 56.493 ± 2.664 22:01 ± 02:52 4.208 ± 1.871 56.037 ± 2.664 01:02 ± 01:38 1.788 ± 2.638 -0.455 ± 3.768 03:00 ± 03:18Kynurenine 0.118 ± 0.055 1.646 ± 0.087 10:03 ± 01:43 0.099 ± 0.053 1.686 ± 0.087 05:09 ± 02:07 -0.019 ± 0.076 0.040 ± 0.123 -04:54 ± 02:44His 4.665 ± 2.318 78.016 ± 2.460 15:08 ± 01:54 0.881 ± 2.334 77.704 ± 2.460 02:26 ± 10:00 -3.784 ± 3.289 -0.312 ± 3.478 11:17 ± 10:11LysoPC a C18:1 2.545 ± 0.558 14.465 ± 0.648 21:27 ± 00:49 1.158 ± 0.561 13.529 ± 0.647 13:25 ± 01:47 -1.387 ± 0.791 -0.936 ± 0.916 -08:01 ± 01:58PC aa C40:4 0.087 ± 0.090 2.603 ± 0.282 16:34 ± 04:03 0.148 ± 0.091 2.844 ± 0.282 02:44 ± 02:20 0.061 ± 0.128 0.240 ± 0.399 10:09 ± 04:41C18:2 0.002 ± 0.002 0.030 ± 0.002 18:09 ± 02:55 0.002 ± 0.002 0.032 ± 0.002 00:31 ± 02:32 0.000 ± 0.002 0.002 ± 0.002 06:21 ± 03:52PC ae C44:6 0.038 ± 0.026 0.734 ± 0.046 16:20 ± 02:38 0.032 ± 0.027 0.841 ± 0.046 23:39 ± 03:01 -0.006 ± 0.037 0.108 ± 0.066 07:18 ± 04:00PC aa C40:5 0.262 ± 0.211 5.692 ± 0.512 17:46 ± 03:09 0.461 ± 0.215 6.984 ± 0.512 01:59 ± 01:44 0.199 ± 0.301 1.292 ± 0.724 08:13 ± 03:36PC ae C42:5 0.052 ± 0.040 1.007 ± 0.046 16:47 ± 02:58 0.052 ± 0.040 1.195 ± 0.045 22:26 ± 02:52 0.000 ± 0.057 0.187 ± 0.064 05:39 ± 04:07PC ae C38:3 0.173 ± 0.121 3.599 ± 0.232 17:27 ± 02:44 0.210 ± 0.123 3.967 ± 0.232 01:26 ± 02:11 0.037 ± 0.173 0.368 ± 0.328 07:59 ± 03:29C2 0.216 ± 0.129 3.388 ± 0.159 22:11 ± 02:14 0.478 ± 0.129 3.970 ± 0.158 10:43 ± 01:00 0.262 ± 0.182 0.582 ± 0.224 -11:27 ± 02:27Met 0.872 ± 0.837 22.893 ± 0.844 13:30 ± 03:34 1.029 ± 0.821 24.527 ± 0.844 20:17 ± 03:05 0.157 ± 1.172 1.635 ± 1.194 06:47 ± 04:43LysoPC a C16:1 0.150 ± 0.070 1.792 ± 0.096 18:57 ± 01:49 0.131 ± 0.072 1.930 ± 0.096 00:39 ± 02:01 -0.019 ± 0.100 0.139 ± 0.135 05:41 ± 02:43PC ae C44:5 0.038 ± 0.032 0.880 ± 0.057 16:36 ± 03:16 0.040 ± 0.032 1.018 ± 0.057 23:02 ± 03:01 0.002 ± 0.045 0.138 ± 0.080 06:26 ± 04:27SDMA 0.005 ± 0.015 0.460 ± 0.020 22:58 ± 10:36 0.021 ± 0.015 0.454 ± 0.020 22:20 ± 02:39 0.016 ± 0.022 -0.006 ± 0.028 -00:38 ± 10:55LysoPC a C18:2 6.531 ± 1.579 40.562 ± 1.745 19:44 ± 00:56 4.109 ± 1.615 33.358 ± 1.742 11:56 ± 01:26 -2.422 ± 2.258 -7.204 ± 2.466 -07:47 ± 01:43PC aa C42:4 0.005 ± 0.006 0.161 ± 0.011 01:03 ± 04:35 0.007 ± 0.006 0.160 ± 0.011 11:31 ± 03:10 0.002 ± 0.009 -0.001 ± 0.016 10:28 ± 05:34Sarcosine 1.103 ± 0.175 4.727 ± 0.288 20:50 ± 00:36 1.381 ± 0.176 4.913 ± 0.288 21:47 ± 00:28 0.279 ± 0.248 0.186 ± 0.407 00:57 ± 00:46
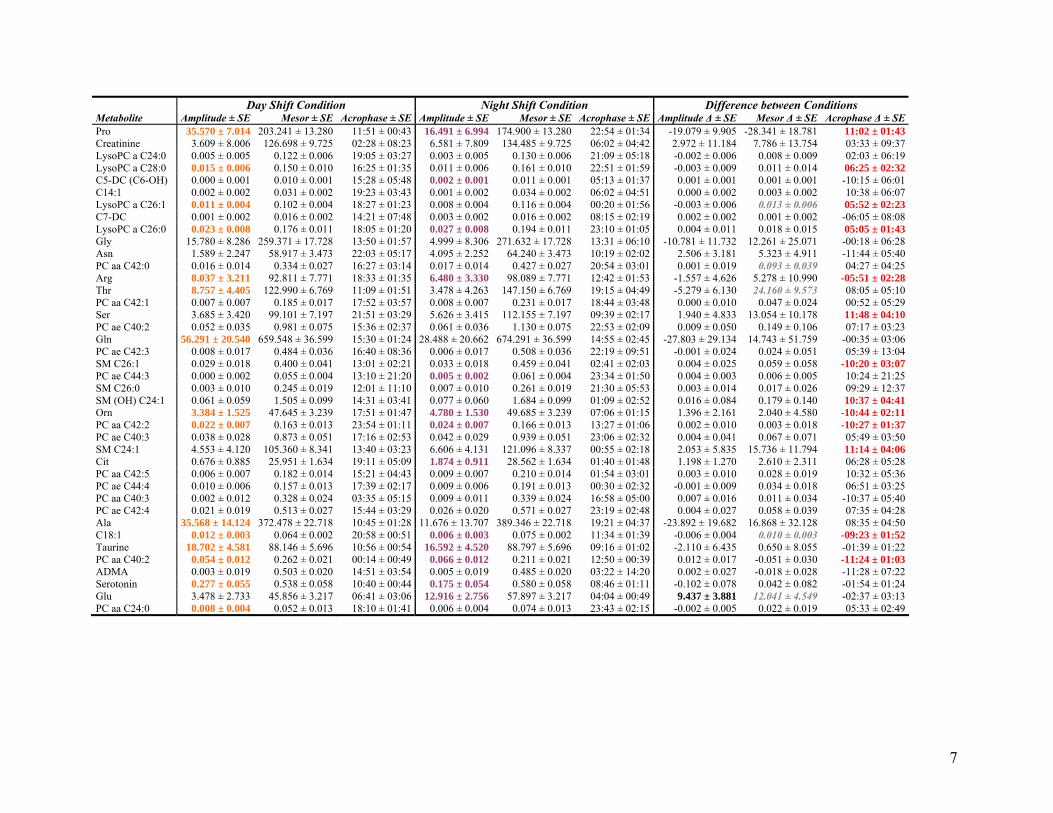
7
Day Shift Condition Night Shift Condition Difference between Conditions Metabolite Amplitude ± SE Mesor ± SE Acrophase ± SE Amplitude ± SE Mesor ± SE Acrophase ± SE Amplitude Δ ± SE Mesor Δ ± SE Acrophase Δ ± SEPro 35.570 ± 7.014 203.241 ± 13.280 11:51 ± 00:43 16.491 ± 6.994 174.900 ± 13.280 22:54 ± 01:34 -19.079 ± 9.905 -28.341 ± 18.781 11:02 ± 01:43Creatinine 3.609 ± 8.006 126.698 ± 9.725 02:28 ± 08:23 6.581 ± 7.809 134.485 ± 9.725 06:02 ± 04:42 2.972 ± 11.184 7.786 ± 13.754 03:33 ± 09:37LysoPC a C24:0 0.005 ± 0.005 0.122 ± 0.006 19:05 ± 03:27 0.003 ± 0.005 0.130 ± 0.006 21:09 ± 05:18 -0.002 ± 0.006 0.008 ± 0.009 02:03 ± 06:19LysoPC a C28:0 0.015 ± 0.006 0.150 ± 0.010 16:25 ± 01:35 0.011 ± 0.006 0.161 ± 0.010 22:51 ± 01:59 -0.003 ± 0.009 0.011 ± 0.014 06:25 ± 02:32C5-DC (C6-OH) 0.000 ± 0.001 0.010 ± 0.001 15:28 ± 05:48 0.002 ± 0.001 0.011 ± 0.001 05:13 ± 01:37 0.001 ± 0.001 0.001 ± 0.001 -10:15 ± 06:01C14:1 0.002 ± 0.002 0.031 ± 0.002 19:23 ± 03:43 0.001 ± 0.002 0.034 ± 0.002 06:02 ± 04:51 0.000 ± 0.002 0.003 ± 0.002 10:38 ± 06:07LysoPC a C26:1 0.011 ± 0.004 0.102 ± 0.004 18:27 ± 01:23 0.008 ± 0.004 0.116 ± 0.004 00:20 ± 01:56 -0.003 ± 0.006 0.013 ± 0.006 05:52 ± 02:23C7-DC 0.001 ± 0.002 0.016 ± 0.002 14:21 ± 07:48 0.003 ± 0.002 0.016 ± 0.002 08:15 ± 02:19 0.002 ± 0.002 0.001 ± 0.002 -06:05 ± 08:08LysoPC a C26:0 0.023 ± 0.008 0.176 ± 0.011 18:05 ± 01:20 0.027 ± 0.008 0.194 ± 0.011 23:10 ± 01:05 0.004 ± 0.011 0.018 ± 0.015 05:05 ± 01:43Gly 15.780 ± 8.286 259.371 ± 17.728 13:50 ± 01:57 4.999 ± 8.306 271.632 ± 17.728 13:31 ± 06:10 -10.781 ± 11.732 12.261 ± 25.071 -00:18 ± 06:28Asn 1.589 ± 2.247 58.917 ± 3.473 22:03 ± 05:17 4.095 ± 2.252 64.240 ± 3.473 10:19 ± 02:02 2.506 ± 3.181 5.323 ± 4.911 -11:44 ± 05:40PC aa C42:0 0.016 ± 0.014 0.334 ± 0.027 16:27 ± 03:14 0.017 ± 0.014 0.427 ± 0.027 20:54 ± 03:01 0.001 ± 0.019 0.093 ± 0.039 04:27 ± 04:25Arg 8.037 ± 3.211 92.811 ± 7.771 18:33 ± 01:35 6.480 ± 3.330 98.089 ± 7.771 12:42 ± 01:53 -1.557 ± 4.626 5.278 ± 10.990 -05:51 ± 02:28Thr 8.757 ± 4.405 122.990 ± 6.769 11:09 ± 01:51 3.478 ± 4.263 147.150 ± 6.769 19:15 ± 04:49 -5.279 ± 6.130 24.160 ± 9.573 08:05 ± 05:10PC aa C42:1 0.007 ± 0.007 0.185 ± 0.017 17:52 ± 03:57 0.008 ± 0.007 0.231 ± 0.017 18:44 ± 03:48 0.000 ± 0.010 0.047 ± 0.024 00:52 ± 05:29Ser 3.685 ± 3.420 99.101 ± 7.197 21:51 ± 03:29 5.626 ± 3.415 112.155 ± 7.197 09:39 ± 02:17 1.940 ± 4.833 13.054 ± 10.178 11:48 ± 04:10PC ae C40:2 0.052 ± 0.035 0.981 ± 0.075 15:36 ± 02:37 0.061 ± 0.036 1.130 ± 0.075 22:53 ± 02:09 0.009 ± 0.050 0.149 ± 0.106 07:17 ± 03:23Gln 56.291 ± 20.540 659.548 ± 36.599 15:30 ± 01:24 28.488 ± 20.662 674.291 ± 36.599 14:55 ± 02:45 -27.803 ± 29.134 14.743 ± 51.759 -00:35 ± 03:06PC ae C42:3 0.008 ± 0.017 0.484 ± 0.036 16:40 ± 08:36 0.006 ± 0.017 0.508 ± 0.036 22:19 ± 09:51 -0.001 ± 0.024 0.024 ± 0.051 05:39 ± 13:04SM C26:1 0.029 ± 0.018 0.400 ± 0.041 13:01 ± 02:21 0.033 ± 0.018 0.459 ± 0.041 02:41 ± 02:03 0.004 ± 0.025 0.059 ± 0.058 -10:20 ± 03:07PC ae C44:3 0.000 ± 0.002 0.055 ± 0.004 13:10 ± 21:20 0.005 ± 0.002 0.061 ± 0.004 23:34 ± 01:50 0.004 ± 0.003 0.006 ± 0.005 10:24 ± 21:25SM C26:0 0.003 ± 0.010 0.245 ± 0.019 12:01 ± 11:10 0.007 ± 0.010 0.261 ± 0.019 21:30 ± 05:53 0.003 ± 0.014 0.017 ± 0.026 09:29 ± 12:37SM (OH) C24:1 0.061 ± 0.059 1.505 ± 0.099 14:31 ± 03:41 0.077 ± 0.060 1.684 ± 0.099 01:09 ± 02:52 0.016 ± 0.084 0.179 ± 0.140 10:37 ± 04:41Orn 3.384 ± 1.525 47.645 ± 3.239 17:51 ± 01:47 4.780 ± 1.530 49.685 ± 3.239 07:06 ± 01:15 1.396 ± 2.161 2.040 ± 4.580 -10:44 ± 02:11PC aa C42:2 0.022 ± 0.007 0.163 ± 0.013 23:54 ± 01:11 0.024 ± 0.007 0.166 ± 0.013 13:27 ± 01:06 0.002 ± 0.010 0.003 ± 0.018 -10:27 ± 01:37PC ae C40:3 0.038 ± 0.028 0.873 ± 0.051 17:16 ± 02:53 0.042 ± 0.029 0.939 ± 0.051 23:06 ± 02:32 0.004 ± 0.041 0.067 ± 0.071 05:49 ± 03:50SM C24:1 4.553 ± 4.120 105.360 ± 8.341 13:40 ± 03:23 6.606 ± 4.131 121.096 ± 8.337 00:55 ± 02:18 2.053 ± 5.835 15.736 ± 11.794 11:14 ± 04:06Cit 0.676 ± 0.885 25.951 ± 1.634 19:11 ± 05:09 1.874 ± 0.911 28.562 ± 1.634 01:40 ± 01:48 1.198 ± 1.270 2.610 ± 2.311 06:28 ± 05:28PC aa C42:5 0.006 ± 0.007 0.182 ± 0.014 15:21 ± 04:43 0.009 ± 0.007 0.210 ± 0.014 01:54 ± 03:01 0.003 ± 0.010 0.028 ± 0.019 10:32 ± 05:36PC ae C44:4 0.010 ± 0.006 0.157 ± 0.013 17:39 ± 02:17 0.009 ± 0.006 0.191 ± 0.013 00:30 ± 02:32 -0.001 ± 0.009 0.034 ± 0.018 06:51 ± 03:25PC aa C40:3 0.002 ± 0.012 0.328 ± 0.024 03:35 ± 05:15 0.009 ± 0.011 0.339 ± 0.024 16:58 ± 05:00 0.007 ± 0.016 0.011 ± 0.034 -10:37 ± 05:40PC ae C42:4 0.021 ± 0.019 0.513 ± 0.027 15:44 ± 03:29 0.026 ± 0.020 0.571 ± 0.027 23:19 ± 02:48 0.004 ± 0.027 0.058 ± 0.039 07:35 ± 04:28Ala 35.568 ± 14.124 372.478 ± 22.718 10:45 ± 01:28 11.676 ± 13.707 389.346 ± 22.718 19:21 ± 04:37 -23.892 ± 19.682 16.868 ± 32.128 08:35 ± 04:50C18:1 0.012 ± 0.003 0.064 ± 0.002 20:58 ± 00:51 0.006 ± 0.003 0.075 ± 0.002 11:34 ± 01:39 -0.006 ± 0.004 0.010 ± 0.003 -09:23 ± 01:52Taurine 18.702 ± 4.581 88.146 ± 5.696 10:56 ± 00:54 16.592 ± 4.520 88.797 ± 5.696 09:16 ± 01:02 -2.110 ± 6.435 0.650 ± 8.055 -01:39 ± 01:22PC aa C40:2 0.054 ± 0.012 0.262 ± 0.021 00:14 ± 00:49 0.066 ± 0.012 0.211 ± 0.021 12:50 ± 00:39 0.012 ± 0.017 -0.051 ± 0.030 -11:24 ± 01:03ADMA 0.003 ± 0.019 0.503 ± 0.020 14:51 ± 03:54 0.005 ± 0.019 0.485 ± 0.020 03:22 ± 14:20 0.002 ± 0.027 -0.018 ± 0.028 -11:28 ± 07:22Serotonin 0.277 ± 0.055 0.538 ± 0.058 10:40 ± 00:44 0.175 ± 0.054 0.580 ± 0.058 08:46 ± 01:11 -0.102 ± 0.078 0.042 ± 0.082 -01:54 ± 01:24Glu 3.478 ± 2.733 45.856 ± 3.217 06:41 ± 03:06 12.916 ± 2.756 57.897 ± 3.217 04:04 ± 00:49 9.437 ± 3.881 12.041 ± 4.549 -02:37 ± 03:13PC aa C24:0 0.008 ± 0.004 0.052 ± 0.013 18:10 ± 01:41 0.006 ± 0.004 0.074 ± 0.013 23:43 ± 02:15 -0.002 ± 0.005 0.022 ± 0.019 05:33 ± 02:49

8
Table S2. Factor loadings from PCA.
Metabolite Cluster
1 Cluster
2 Cluster
3 PC aa C30:0 0.8518 0.1871 0.2281 PC ae C34:3 0.8342 0.3633 0.1602 PC aa C36:6 0.7950 0.0338 0.4794 PC aa C32:1 0.7771 0.1239 0.2063 PC ae C34:0 0.7743 0.3940 0.1596 PC ae C32:1 0.7708 0.2725 0.3604 PC ae C34:2 0.7694 0.4099 0.3130 PC ae C34:1 0.7619 0.4193 0.4420 PC aa C34:3 0.7608 0.3060 0.3267 PC aa C34:4 0.7437 0.4689 0.0047 PC aa C32:0 0.7379 0.2883 0.4098 PC ae C36:2 0.7331 0.4612 0.3077 PC ae C38:6 0.7312 0.3603 0.4370 PC ae C36:5 0.7272 0.5836 0.0472 PC ae C36:1 0.7160 0.5763 0.2829 PC ae C36:0 0.7129 0.3017 0.2942 PC ae C32:2 0.7086 0.2015 0.4913 PC aa C32:3 0.7044 0.4713 0.2549 SM C18:0 0.7040 0.3772 0.4558 PC ae C36:3 0.7007 0.4249 0.4666 PC aa C34:1 0.6952 0.4040 0.2757 SM C18:1 0.6876 0.4463 0.3568 PC aa C40:6 0.6852 0.1248 0.5070 PC aa C38:6 0.6771 0.0591 0.6163 PC ae C30:0 0.6765 0.4455 0.1348 SM C16:0 0.6719 0.3283 0.5753 PC ae C38:0 0.6568 0.0768 0.6182 PC aa C38:0 0.6536 0.0670 0.6482 PC ae C42:2 0.6526 0.3882 0.4630 SM (OH) C22:1 0.6415 0.4816 0.4380 SM (OH) C16:1 0.6407 0.4038 0.4867 SM (OH) C22:2 0.6398 0.4895 0.4906 PC aa C36:0 0.6364 -0.1855 0.1928 SM C16:1 0.6325 0.4272 0.5032 PC ae C40:1 0.6224 0.2105 0.4994 SM (OH) C14:1 0.6059 0.4065 0.4829 PC aa C36:1 0.6038 0.4676 0.2980 PC aa C36:5 0.6006 0.4545 0.1752 Tyr 0.5937 0.5115 0.4079 PC aa C36:3 0.5929 0.5389 0.3012 PC aa C36:4 0.5864 0.5849 0.1162 PC ae C40:6 0.5835 0.3392 0.5614 PC aa C36:2 0.5752 0.1542 0.0777 PC aa C42:6 0.5705 0.4315 0.4773 PC aa C28:1 0.5585 0.5120 0.3395 SM C24:0 0.5489 0.4493 0.4599 PC aa C38:3 0.5359 0.5314 0.1815 lysoPC a C28:1 0.5358 0.3585 0.2409 PC aa C34:2 0.5352 0.0475 0.0478 SM C20:2 0.5285 0.4055 0.4675 PC ae C42:1 0.5183 0.4020 0.3981 Lys 0.5147 0.5114 0.1668 PC ae C38:2 0.5067 0.2276 0.1580 PC ae C30:2 0.4774 0.4564 0.3445 C9 0.4332 0.1441 –0.0103 C3-DC (C4-OH) 0.3010 0.0349 –0.0235 C14:2 0.2665 0.1879 0.1665 lysoPC a C20:4 –0.0101 0.8838 0.0602 lysoPC a C17:0 0.2864 0.8296 0.2469 PC ae C38:4 0.3753 0.8175 0.1354 C0 0.3445 0.8027 0.0215 Leu 0.2036 0.7949 0.1873 Ile 0.2252 0.7934 0.2380 lysoPC a C20:3 0.1669 0.7794 0.1466 PC ae C40:4 0.3375 0.7766 0.3024 PC aa C38:4 0.4443 0.7762 0.0559
Metabolite Cluster
1 Cluster
2 Cluster
3 Val 0.2820 0.7706 0.2088 lysoPC a C16:0 0.3401 0.7566 0.3287 PC ae C38:5 0.4991 0.7449 0.3058 lysoPC a C18:0 0.3910 0.7336 0.2591 PC aa C38:5 0.4294 0.7327 0.1785 Phe 0.3547 0.7179 0.3995 PC ae C36:4 0.5722 0.7163 0.2003 PC ae C40:5 0.4230 0.7104 0.3644 Trp 0.4416 0.7099 0.3124 Kynurenine 0.3481 0.7064 0.2498 His 0.2715 0.7023 0.5296 lysoPC a C18:1 0.1288 0.6988 0.3888 PC aa C40:4 0.5389 0.6968 –0.0272 C18:2 0.1301 0.6828 0.2898 PC ae C44:6 0.0024 0.6476 0.4994 PC aa C40:5 0.5144 0.6450 0.1565 PC ae C42:5 0.1487 0.6444 0.5004 PC ae C38:3 0.5709 0.6400 0.2987 C2 –0.0428 0.6349 0.2986 Met 0.3304 0.6123 0.4065 lysoPC a C16:1 0.2532 0.6080 0.5139 PC ae C44:5 –0.0678 0.5912 0.5636 SDMA 0.0753 0.5766 0.4849 lysoPC a C18:2 0.1529 0.5692 0.3447 PC aa C42:4 0.4164 0.5664 0.3682 Sarcosine 0.2643 0.4963 0.2836 Pro –0.0636 0.4846 0.2859 Creatinine 0.1462 0.4673 –0.0016 lysoPC a C24:0 0.2961 0.4662 0.2215 lysoPC a C28:0 0.2359 0.3732 –0.0828 C5-DC (C6-OH) 0.2712 0.3677 0.1028 C14:1 0.3511 0.3515 0.3229 lysoPC a C26:1 0.2674 0.3429 0.0106 C7-DC 0.1548 0.2932 0.0932 lysoPC a C26:0 0.0894 0.2112 –0.0397 Gly 0.1471 0.2560 0.8531 Asn 0.1228 0.2160 0.8246 PC aa C42:0 0.2630 0.2063 0.8094 Arg 0.1752 0.0219 0.7967 Thr 0.0952 0.2863 0.7950 PC aa C42:1 0.3999 0.2064 0.7844 Ser 0.2149 0.1890 0.7754 PC ae C40:2 0.5535 0.1970 0.7526 Gln 0.2074 0.3683 0.7501 PC ae C42:3 0.5508 0.2333 0.7270 SM C26:1 0.5956 0.0428 0.7198 PC ae C44:3 0.3615 0.3515 0.7115 SM C26:0 0.5380 0.1611 0.7081 SM (OH) C24:1 0.5193 0.2893 0.7012 Orn 0.0616 0.2104 0.6993 PC aa C42:2 0.3804 0.1259 0.6988 PC ae C40:3 0.5572 0.3702 0.6665 SM C24:1 0.5633 0.2955 0.6659 Cit 0.1145 0.4092 0.6645 PC aa C42:5 0.5529 0.3062 0.6595 PC ae C44:4 0.0064 0.4185 0.6519 PC aa C40:3 0.5093 0.3241 0.6490 PC ae C42:4 0.1840 0.5706 0.6283 Ala 0.4101 0.3311 0.5538 C18:1 0.0213 0.4960 0.5286 Taurine 0.0607 0.0395 0.4872 PC aa C40:2 0.3014 0.1923 0.4706 ADMA 0.1413 0.4010 0.4461 Serotonin 0.1649 -0.1272 0.3241 Glu PC aa C24:0
0.1356 –0.2173
0.2405 0.1859
0.2728 –0.2533

9
Table S3. Pathway analysis for the simulated day shift schedule.
Pathway Total Expected Hits p –log(p) Holm p FDR Impact Aminoacyl-tRNA biosynthesis 75 0.467 8 3.30·10-9 19.53 2.64·10-7 2.64·10-7 0.113 Nitrogen metabolism 39 0.243 5 2.29·10-6 12.99 1.81·10-4 9.16·10-5 0.008 Alanine, aspartate and glutamate metabolism 24 0.150 4 9.66·10-6 11.55 7.53·10-4 2.58·10-4 0.486 Arginine and proline metabolism 77 0.480 5 6.87·10-5 9.59 5.29·10-3 1.37·10-3 0.312 Cyanoamino acid metabolism 16 0.100 3 0.0001 9.17 7.94·10-3 1.67·10-3 0 D-Arginine and D-ornithine metabolism 8 0.050 2 0.0010 6.91 0.075 0.013 0 Glutathione metabolism 38 0.237 3 0.0015 6.54 0.107 0.017 0.011 D-glutamine and D-glutamate metabolism 11 0.069 2 0.0019 6.25 0.141 0.019 0.139 Glycine, serine and threonine metabolism 48 0.299 3 0.0029 5.86 0.206 0.025 0.420 Taurine and hypotaurine metabolism 20 0.125 2 0.0065 5.04 0.458 0.052 0.363 Sphingolipid metabolism 25 0.156 2 0.0100 4.60 0.701 0.073 0.010 Methane metabolism 34 0.212 2 0.0181 4.01 1.000 0.121 0.018 Porphyrin and chlorophyll metabolism 104 0.648 3 0.0244 3.71 1.000 0.150 0 Primary bile acid biosynthesis 47 0.293 2 0.0333 3.40 1.000 0.191 0.016 Cysteine and methionine metabolism 56 0.349 2 0.0460 3.08 1.000 0.245 0.012 Linoleic acid metabolism 15 0.093 1 0.0898 2.41 1.000 0.449 0 Sulfur metabolism 18 0.112 1 0.1068 2.24 1.000 0.489 0 Purine metabolism 92 0.573 2 0.1100 2.21 1.000 0.489 0 Selenoamino acid metabolism 22 0.137 1 0.1290 2.05 1.000 0.543 0 Thiamine metabolism 24 0.150 1 0.1399 1.97 1.000 0.560 0 Valine, leucine and isoleucine biosynthesis 27 0.168 1 0.1561 1.86 1.000 0.595 0 Alpha-linolenic acid metabolism 29 0.181 1 0.1667 1.79 1.000 0.606 0 Glycerophospholipid metabolism 39 0.243 1 0.2179 1.52 1.000 0.743 0.101 Butanoate metabolism 40 0.249 1 0.2228 1.50 1.000 0.743 0 Histidine metabolism 44 0.274 1 0.2424 1.42 1.000 0.776 0.001 Lysine degradation 47 0.293 1 0.2567 1.36 1.000 0.790 0 Pyrimidine metabolism 60 0.374 1 0.3160 1.15 1.000 0.928 0 Arachidonic acid metabolism 62 0.386 1 0.3247 1.12 1.000 0.928 0 Tryptophan metabolism 79 0.492 1 0.3947 0.93 1.000 1.000 0.057
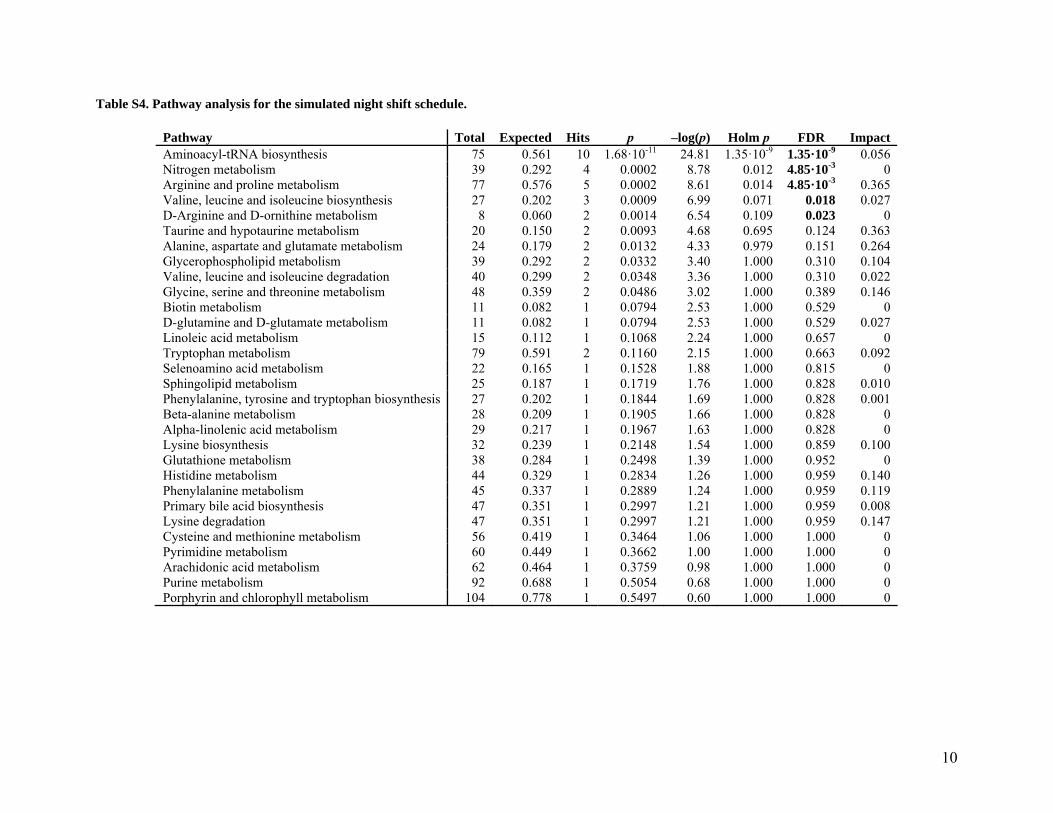
10
Table S4. Pathway analysis for the simulated night shift schedule.
Pathway Total Expected Hits p –log(p) Holm p FDR Impact Aminoacyl-tRNA biosynthesis 75 0.561 10 1.68·10-11 24.81 1.35·10-9 1.35·10-9 0.056 Nitrogen metabolism 39 0.292 4 0.0002 8.78 0.012 4.85·10-3 0 Arginine and proline metabolism 77 0.576 5 0.0002 8.61 0.014 4.85·10-3 0.365 Valine, leucine and isoleucine biosynthesis 27 0.202 3 0.0009 6.99 0.071 0.018 0.027 D-Arginine and D-ornithine metabolism 8 0.060 2 0.0014 6.54 0.109 0.023 0 Taurine and hypotaurine metabolism 20 0.150 2 0.0093 4.68 0.695 0.124 0.363 Alanine, aspartate and glutamate metabolism 24 0.179 2 0.0132 4.33 0.979 0.151 0.264 Glycerophospholipid metabolism 39 0.292 2 0.0332 3.40 1.000 0.310 0.104 Valine, leucine and isoleucine degradation 40 0.299 2 0.0348 3.36 1.000 0.310 0.022 Glycine, serine and threonine metabolism 48 0.359 2 0.0486 3.02 1.000 0.389 0.146 Biotin metabolism 11 0.082 1 0.0794 2.53 1.000 0.529 0 D-glutamine and D-glutamate metabolism 11 0.082 1 0.0794 2.53 1.000 0.529 0.027 Linoleic acid metabolism 15 0.112 1 0.1068 2.24 1.000 0.657 0 Tryptophan metabolism 79 0.591 2 0.1160 2.15 1.000 0.663 0.092 Selenoamino acid metabolism 22 0.165 1 0.1528 1.88 1.000 0.815 0 Sphingolipid metabolism 25 0.187 1 0.1719 1.76 1.000 0.828 0.010 Phenylalanine, tyrosine and tryptophan biosynthesis 27 0.202 1 0.1844 1.69 1.000 0.828 0.001 Beta-alanine metabolism 28 0.209 1 0.1905 1.66 1.000 0.828 0 Alpha-linolenic acid metabolism 29 0.217 1 0.1967 1.63 1.000 0.828 0 Lysine biosynthesis 32 0.239 1 0.2148 1.54 1.000 0.859 0.100 Glutathione metabolism 38 0.284 1 0.2498 1.39 1.000 0.952 0 Histidine metabolism 44 0.329 1 0.2834 1.26 1.000 0.959 0.140 Phenylalanine metabolism 45 0.337 1 0.2889 1.24 1.000 0.959 0.119 Primary bile acid biosynthesis 47 0.351 1 0.2997 1.21 1.000 0.959 0.008 Lysine degradation 47 0.351 1 0.2997 1.21 1.000 0.959 0.147 Cysteine and methionine metabolism 56 0.419 1 0.3464 1.06 1.000 1.000 0 Pyrimidine metabolism 60 0.449 1 0.3662 1.00 1.000 1.000 0 Arachidonic acid metabolism 62 0.464 1 0.3759 0.98 1.000 1.000 0 Purine metabolism 92 0.688 1 0.5054 0.68 1.000 1.000 0 Porphyrin and chlorophyll metabolism 104 0.778 1 0.5497 0.60 1.000 1.000 0
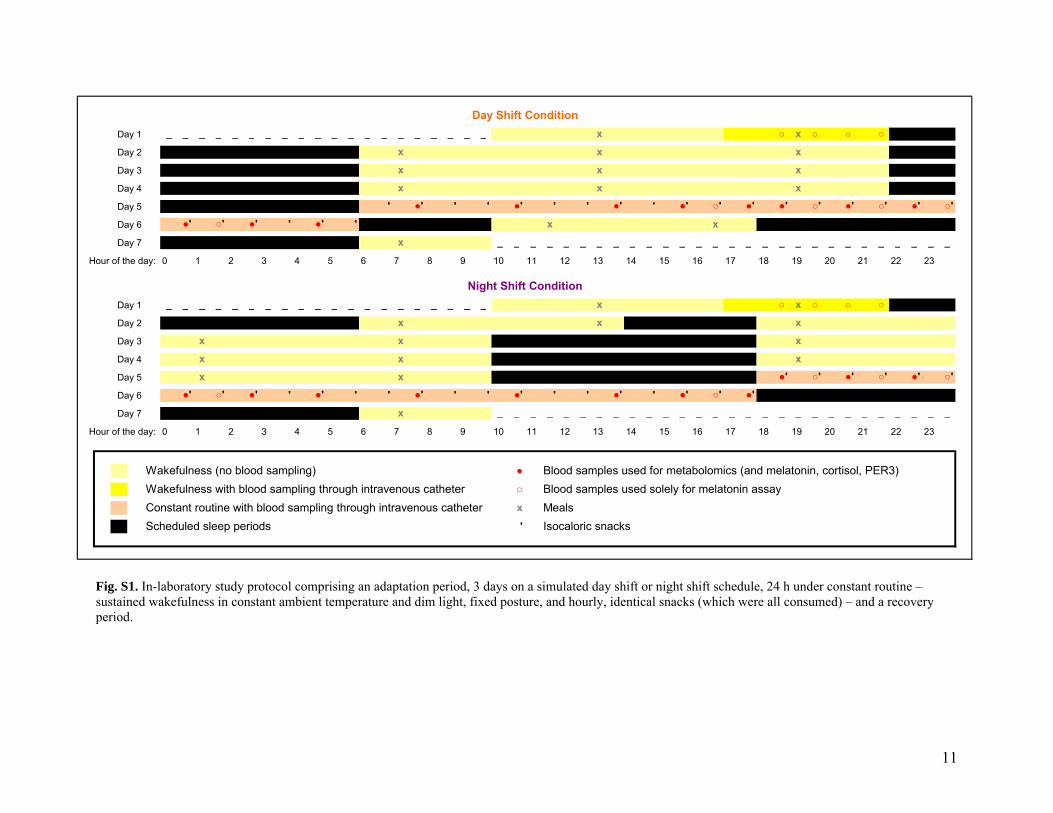
11
‗ ‗ ‗ ‗ ‗ ‗ ‗ ‗ ‗ ‗ ‗ ‗ ‗ ‗ ‗ ‗ ‗ ‗ ‗ ‗ x ○ x ○ ○ ○ x x x x x x x x x
' ●' ' ' ●' ' ' ●' ' ●' ○' ●' ●' ○' ●' ○' ●' ○' ●' ○' ●' ' ●' ' x x
x ‗ ‗ ‗ ‗ ‗ ‗ ‗ ‗ ‗ ‗ ‗ ‗ ‗ ‗ ‗ ‗ ‗ ‗ ‗ ‗ ‗ ‗ ‗ ‗ ‗ ‗ ‗ ‗
‗ ‗ ‗ ‗ ‗ ‗ ‗ ‗ ‗ ‗ ‗ ‗ ‗ ‗ ‗ ‗ ‗ ‗ ‗ ‗ x ○ x ○ ○ ○ x x x
x x x x x x x x ●' ○' ●' ○' ●' ○'
●' ○' ●' ' ●' ' ' ●' ' ' ●' ' ' ●' ' ●' ○' ●' x ‗ ‗ ‗ ‗ ‗ ‗ ‗ ‗ ‗ ‗ ‗ ‗ ‗ ‗ ‗ ‗ ‗ ‗ ‗ ‗ ‗ ‗ ‗ ‗ ‗ ‗ ‗ ‗
Wakefulness (no blood sampling) ● Blood samples used for metabolomics (and melatonin, cortisol, PER3)Wakefulness with blood sampling through intravenous catheter ○ Blood samples used solely for melatonin assayConstant routine with blood sampling through intravenous catheter x MealsScheduled sleep periods ' Isocaloric snacks
Hour of the day:
Hour of the day:
Day Shift Condition
Night Shift Condition
0 1 2 3 4 5 6 7 8 9 10 11 12 13 14 15 16 17 18 19 20 21 22 23
0 1 2 3 4 5 6 7 8 9 10 11 12 13 14 15 16 17 18 19 20 21 22 23
Day 1
Day 2
Day 3
Day 4
Day 5
Day 6
Day 7
Day 1
Day 6
Day 7
Day 2
Day 3
Day 4
Day 5
Fig. S1. In-laboratory study protocol comprising an adaptation period, 3 days on a simulated day shift or night shift schedule, 24 h under constant routine – sustained wakefulness in constant ambient temperature and dim light, fixed posture, and hourly, identical snacks (which were all consumed) – and a recovery period.
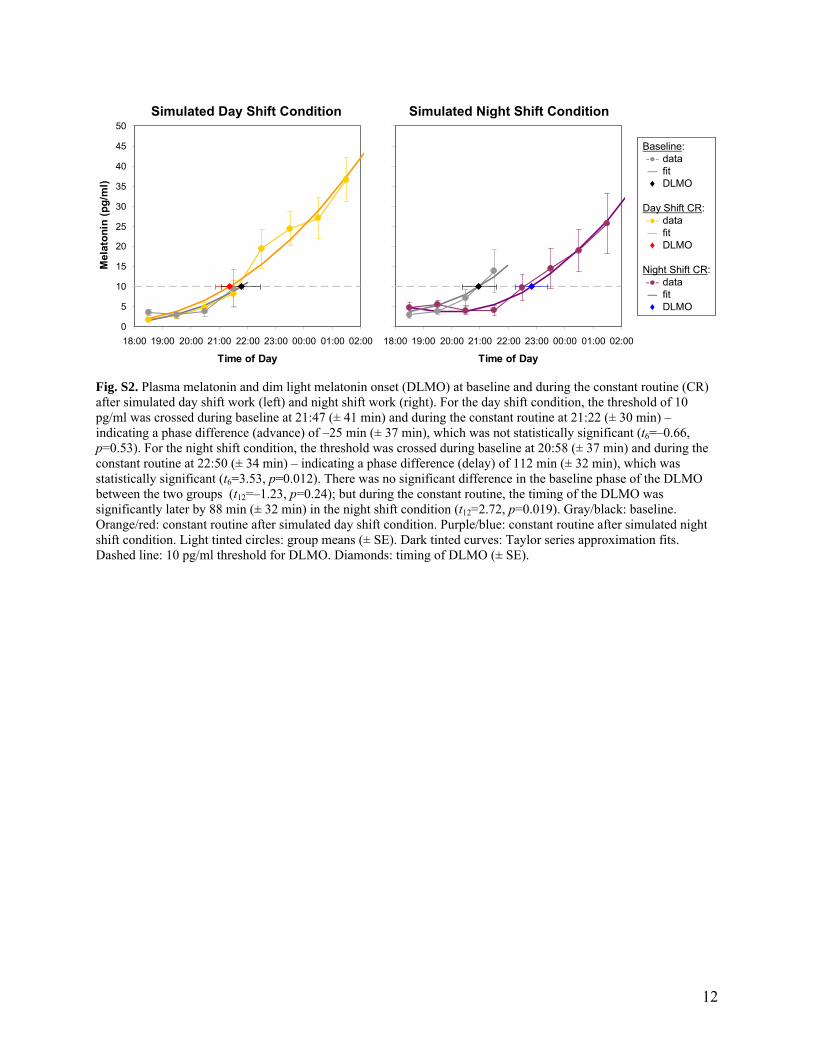
12
Simulated Day Shift Condition Simulated Night Shift Condition
0
5
10
15
20
25
30
35
40
45
50
18:00 19:00 20:00 21:00 22:00 23:00 00:00 01:00 02:00
Time of DayM
elat
on
in (
pg
/ml)
0
5
10
15
20
25
30
35
40
45
50
18:00 19:00 20:00 21:00 22:00 23:00 00:00 01:00 02:00
Time of Day
Mel
ato
nin
(p
g/m
l)
Baseline:datafitDLMO
Day Shift CR:datafitDLMO
Night Shift CR: datafitDLMO
-●-―♦
-●-―♦
-●-―♦
Fig. S2. Plasma melatonin and dim light melatonin onset (DLMO) at baseline and during the constant routine (CR) after simulated day shift work (left) and night shift work (right). For the day shift condition, the threshold of 10 pg/ml was crossed during baseline at 21:47 (± 41 min) and during the constant routine at 21:22 (± 30 min) – indicating a phase difference (advance) of –25 min (± 37 min), which was not statistically significant (t6=–0.66, p=0.53). For the night shift condition, the threshold was crossed during baseline at 20:58 (± 37 min) and during the constant routine at 22:50 (± 34 min) – indicating a phase difference (delay) of 112 min (± 32 min), which was statistically significant (t6=3.53, p=0.012). There was no significant difference in the baseline phase of the DLMO between the two groups (t12=–1.23, p=0.24); but during the constant routine, the timing of the DLMO was significantly later by 88 min (± 32 min) in the night shift condition (t12=2.72, p=0.019). Gray/black: baseline. Orange/red: constant routine after simulated day shift condition. Purple/blue: constant routine after simulated night shift condition. Light tinted circles: group means (± SE). Dark tinted curves: Taylor series approximation fits. Dashed line: 10 pg/ml threshold for DLMO. Diamonds: timing of DLMO (± SE).
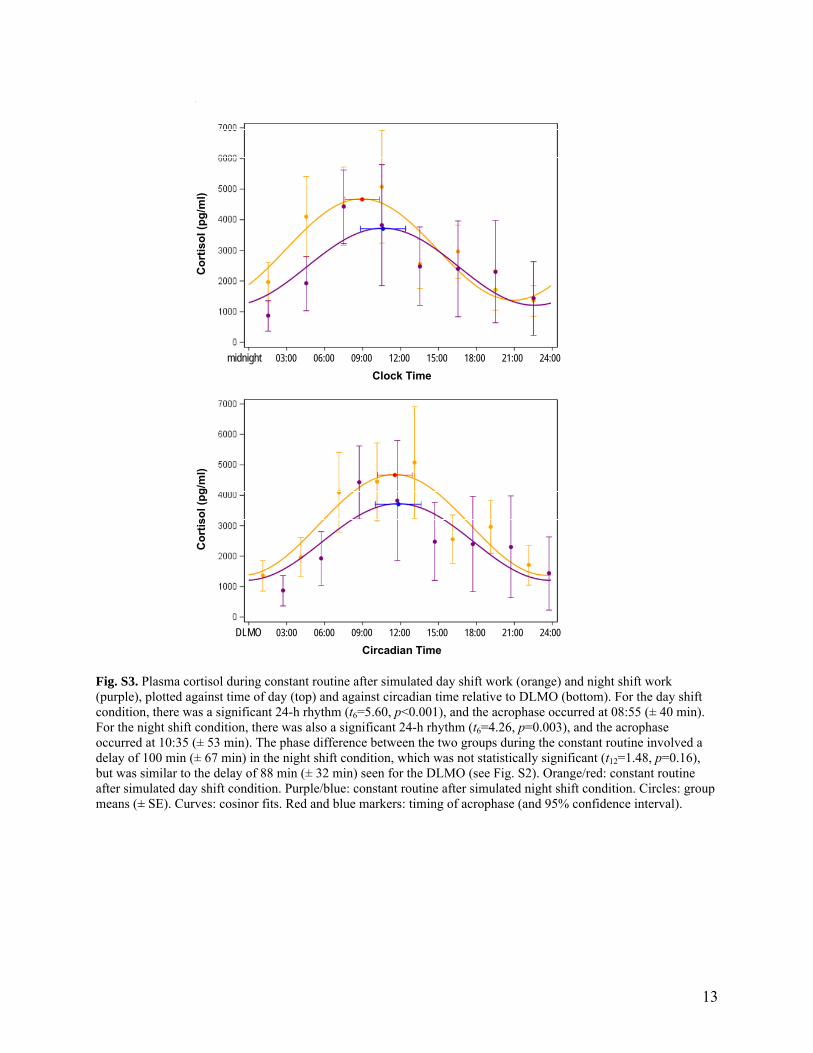
13
Clock Time
midnight 03:00 06:00 09:00 12:00 15:00 18:00 21:00 24:00
Co
rtis
ol (
pg
/ml)
Circadian Time
DLMO 03:00 06:00 09:00 12:00 15:00 18:00 21:00 24:00
Co
rtis
ol (
pg
/ml)
Fig. S3. Plasma cortisol during constant routine after simulated day shift work (orange) and night shift work (purple), plotted against time of day (top) and against circadian time relative to DLMO (bottom). For the day shift condition, there was a significant 24-h rhythm (t6=5.60, p<0.001), and the acrophase occurred at 08:55 (± 40 min). For the night shift condition, there was also a significant 24-h rhythm (t6=4.26, p=0.003), and the acrophase occurred at 10:35 (± 53 min). The phase difference between the two groups during the constant routine involved a delay of 100 min (± 67 min) in the night shift condition, which was not statistically significant (t12=1.48, p=0.16), but was similar to the delay of 88 min (± 32 min) seen for the DLMO (see Fig. S2). Orange/red: constant routine after simulated day shift condition. Purple/blue: constant routine after simulated night shift condition. Circles: group means (± SE). Curves: cosinor fits. Red and blue markers: timing of acrophase (and 95% confidence interval).
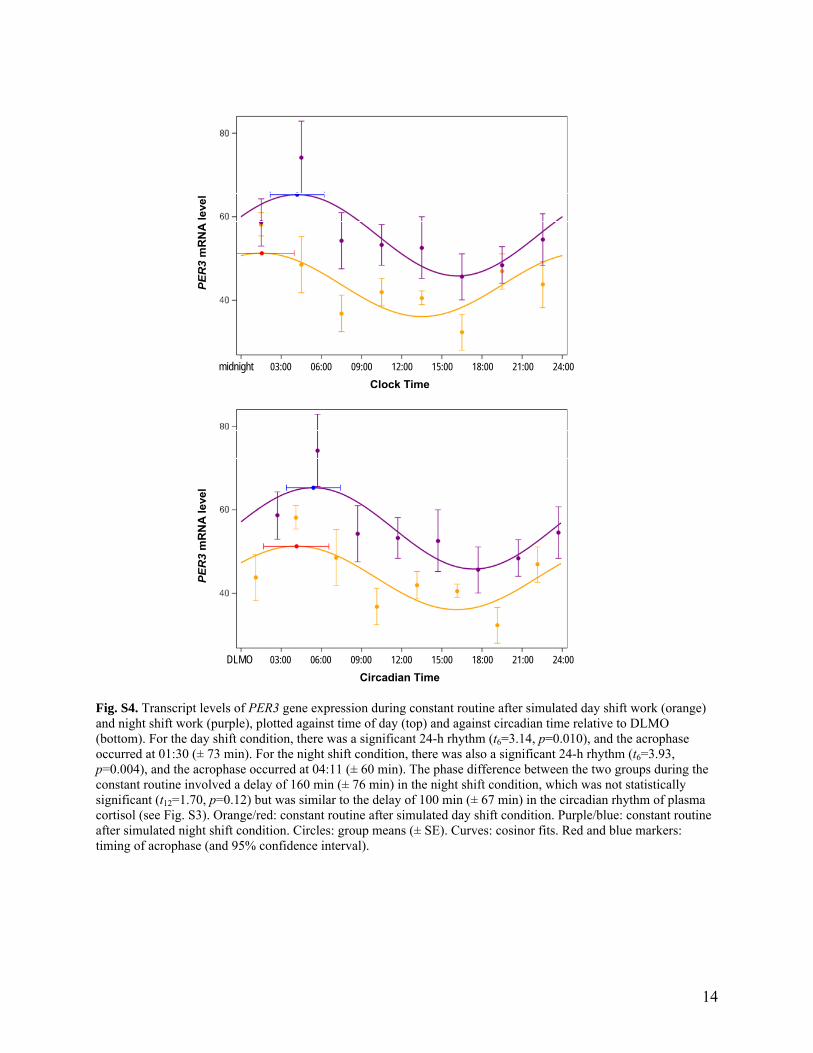
14
Clock Time
midnight 03:00 06:00 09:00 12:00 15:00 18:00 21:00 24:00
PER
3m
RN
A l
eve
l
Circadian Time
DLMO 03:00 06:00 09:00 12:00 15:00 18:00 21:00 24:00
PER
3m
RN
A l
eve
l
Fig. S4. Transcript levels of PER3 gene expression during constant routine after simulated day shift work (orange) and night shift work (purple), plotted against time of day (top) and against circadian time relative to DLMO (bottom). For the day shift condition, there was a significant 24-h rhythm (t6=3.14, p=0.010), and the acrophase occurred at 01:30 (± 73 min). For the night shift condition, there was also a significant 24-h rhythm (t6=3.93, p=0.004), and the acrophase occurred at 04:11 (± 60 min). The phase difference between the two groups during the constant routine involved a delay of 160 min (± 76 min) in the night shift condition, which was not statistically significant (t12=1.70, p=0.12) but was similar to the delay of 100 min (± 67 min) in the circadian rhythm of plasma cortisol (see Fig. S3). Orange/red: constant routine after simulated day shift condition. Purple/blue: constant routine after simulated night shift condition. Circles: group means (± SE). Curves: cosinor fits. Red and blue markers: timing of acrophase (and 95% confidence interval).

15
Clock Time
midnight 03:00 06:00 09:00 12:00 15:00 18:00 21:00 24:00
Cluster 1
03:00 06:00 09:00 12:00 15:00 18:00 21:00 24:00
Zeitgeber Time
lights on 03:00 06:00 09:00 12:00 15:00 18:00 21:00 24:00
Cluster 1
03:00 06:00 09:00 12:00 15:00 18:00 21:00 24:00
Clock Time
midnight 03:00 06:00 09:00 12:00 15:00 18:00 21:00 24:00
Cluster 2
03:00 06:00 09:00 12:00 15:00 18:00 21:00 24:00
Zeitgeber Time
lights on 03:00 06:00 09:00 12:00 15:00 18:00 21:00 24:00
Cluster 2
03:00 06:00 09:00 12:00 15:00 18:00 21:00 24:00
Clock Time
midnight 03:00 06:00 09:00 12:00 15:00 18:00 21:00 24:00
Cluster 3
03:00 06:00 09:00 12:00 15:00 18:00 21:00 24:00
Zeitgeber Time
lights on 03:00 06:00 09:00 12:00 15:00 18:00 21:00 24:00
Cluster 3
03:00 06:00 09:00 12:00 15:00 18:00 21:00 24:00
Fig. S5. Temporal profiles of the three principal component clusters of the metabolites measured during constant routine, plotted against clock time (time of day, left) and against zeitgeber time (time in constant routine since scheduled awakening, right). Orange/red: constant routine after simulated day shift schedule. Purple/blue: constant routine after simulated night shift schedule. Circles: group means (± SE). Curves: cosinor fits. Red and blue markers: timing of acrophase (and 95% confidence interval).

16
Fig. S6. Heat maps of metabolites during the 24-h constant routine, plotted as Z scores (standard deviations away from the mean) against clock time in 6-h blocks. The dominant response to the experiment was a complete reversal of 24-h rhythmicity following the simulated night shift schedule. Red/green continuum indicates Z score (see scale on top). Order of metabolites is based on factor loadings from PCA (Table S2). D = day shift condition; N = night shift condition. 03 = 00:00–06:00; 09 = 06:00–12:00; 15 = 12:00–18:00; 21 = 18:00–24:00.
17
References 1. Iber C, Ancoli-Israel S, Chesson AL, Quan SF (2007). The AASM Manual for the Scoring
of Sleep and Associated Events. Rules, Terminology and Technical Specifications. Westchester: American Academy of Sleep Medicine.
2. Siskos AP, Jain P, Römisch-Margl W, Bennett M, Achaintre D, Asad Y, Marney L, Richardson L, Koulman A, Griffin JL, Raynaud F, Scalbert A, Adamski J, Prehn C, Keun HC (2017). Interlaboratory reproducibility of a targeted metabolomics platform for analysis of human serum and plasma. Anal Chem 89(1):656–665.
3. Mikulich SK, Zerbe GO, Jones RH, Crowley TJ (2003). Comparing linear and nonlinear mixed model approaches to cosinor analysis. Stat Med 22:3195–3211.
4. Benloucif S, Burgess HJ, Klerman EB, Lewy AJ, Middleton B, Murphy PJ, Parry BL, Revell VL (2008). Measuring melatonin in humans. J Clin Sleep Med 4:66–69.
5. Xia J, Wishart DS (2016). Using MetaboAnalyst 3.0 for comprehensive metabolomics data analysis. Curr Protoc Bioinformatics 55:14.10.1–14.10.91.

Cardiac autonomic activity during simulated shift work
Elena SKORNYAKOV1, 2, Shobhan GADDAMEEDHI1, 3, Gemma M. PAECH1, Amy R. SPARROW1, 4, Brieann C. SATTERFIELD1, 5, Nita L. SHATTUCK6,
Matthew E. LAYTON1, 4, Ilia KARATSOREOS1, 7 and Hans P. A. VAN DONGEN1, 4*
1Sleep and Performance Research Center, Washington State University, USA2Department of Physical Therapy, Eastern Washington University, USA3Department of Pharmaceutical Sciences, College of Pharmacy and Pharmaceutical Sciences, Washington State University, USA
4Elson S. Floyd College of Medicine, Washington State University, USA5Social, Cognitive, and Affective Neuroscience Laboratory, Department of Psychiatry, College of Medicine, University of Arizona, USA
6Naval Postgraduate School, USA7Department of Integrative Physiology and Neuroscience, Washington State University, USA
Received February 22, 2018 and accepted July 3, 2018 Published online in J-STAGE August 8, 2018
Abstract: Shift work leads to adverse health outcomes including increased risk of cardiovascular disease. Heart rate (HR) and heart rate variability (HRV) are measures of cardiac autonomic activ-ity and markers of cardiovascular disease and mortality. To investigate the effects of shift work on cardiac autonomic activity, we assessed the influence of simulated night work on HR and HRV, and dissociated the direct effects of circadian misalignment from those of sleep displacement and al-tered physical activity patterns. A total of 29 subjects each participated in one of two in-laboratory, simulated shift work studies. In both studies, EKG was continuously monitored via Holter monitors to measure HR and the high frequency (HF) component of HRV (HF-HRV). We found endogenous circadian rhythmicity in HR and HF-HRV. Sleep and waking physical activity, both displaced during simulated night work, had more substantial, and opposite, effects on HR and HF-HRV. Our findings show systematic but complex, interacting effects of time of day, sleep/wake state, and physical activity on cardiac autonomic activity. These effects need to be taken into account when evaluating HR and HRV in shift work settings and when interpreting these measures of cardiac autonomic activity as markers of cardiovascular disease.
Key words: Night shift, Human sleep, Circadian misalignment, Parasympathetic nervous system, Sym-pathetic nervous system, Vagal tone, Heart rate variability
Introduction
Shift work has substantial negative effects on long-term health1). Shift work is associated with hypertension, myocardial infarction, diabetes, and obesity2). Furthermore,
*To whom correspondence should be addressed.E-mail: [email protected]
©2019 National Institute of Occupational Safety and Health
Industrial Health 2019, 57, 118–132 Original Article
This is an open-access article distributed under the terms of the Creative Commons Attribution Non-Commercial No Derivatives (by-nc-nd) License. (CC-BY-NC-ND 4.0: https://creativecommons.org/licenses/by-nc-nd/4.0/)
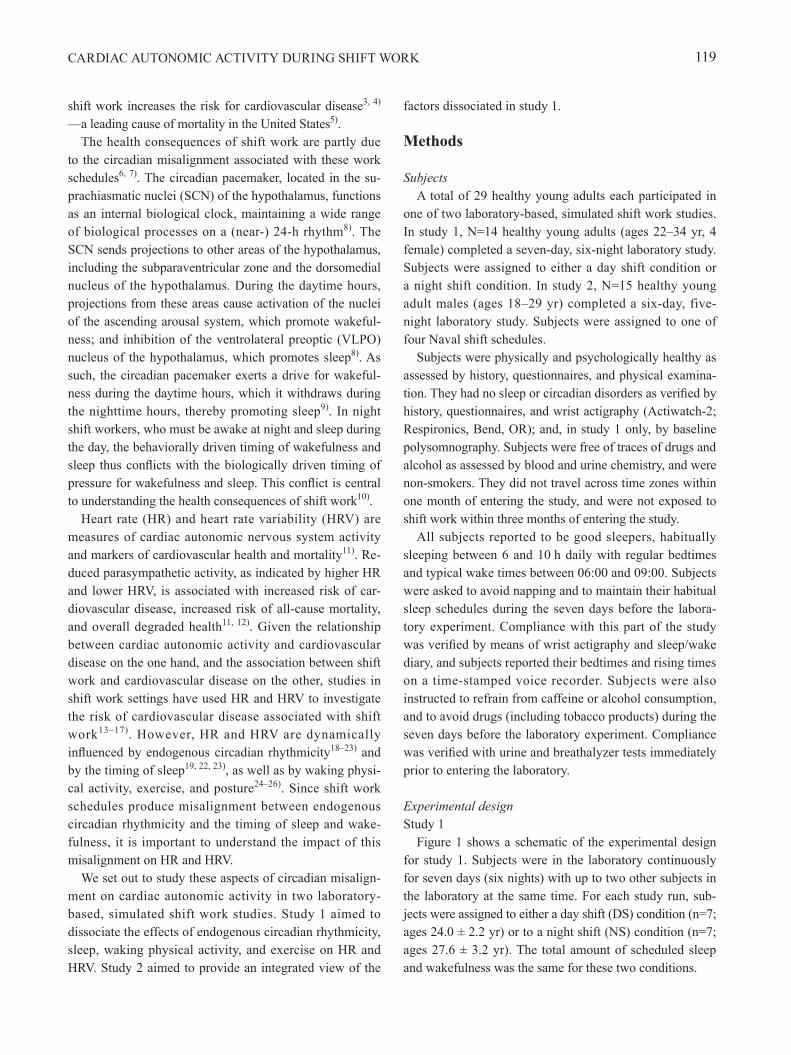
CARDIAC AUTONOMIC ACTIVITY DURING SHIFT WORK 119
shift work increases the risk for cardiovascular disease3, 4)
—a leading cause of mortality in the United States5).The health consequences of shift work are partly due
to the circadian misalignment associated with these work schedules6, 7). The circadian pacemaker, located in the su-prachiasmatic nuclei (SCN) of the hypothalamus, functions as an internal biological clock, maintaining a wide range of biological processes on a (near-) 24-h rhythm8). The SCN sends projections to other areas of the hypothalamus, including the subparaventricular zone and the dorsomedial nucleus of the hypothalamus. During the daytime hours, projections from these areas cause activation of the nuclei of the ascending arousal system, which promote wakeful-ness; and inhibition of the ventrolateral preoptic (VLPO) nucleus of the hypothalamus, which promotes sleep8). As such, the circadian pacemaker exerts a drive for wakeful-ness during the daytime hours, which it withdraws during the nighttime hours, thereby promoting sleep9). In night shift workers, who must be awake at night and sleep during the day, the behaviorally driven timing of wakefulness and sleep thus conflicts with the biologically driven timing of pressure for wakefulness and sleep. This conflict is central to understanding the health consequences of shift work10).
Heart rate (HR) and heart rate variability (HRV) are measures of cardiac autonomic nervous system activity and markers of cardiovascular health and mortality11). Re-duced parasympathetic activity, as indicated by higher HR and lower HRV, is associated with increased risk of car-diovascular disease, increased risk of all-cause mortality, and overall degraded health11, 12). Given the relationship between cardiac autonomic activity and cardiovascular disease on the one hand, and the association between shift work and cardiovascular disease on the other, studies in shift work settings have used HR and HRV to investigate the risk of cardiovascular disease associated with shift work13–17). However, HR and HRV are dynamically influenced by endogenous circadian rhythmicity18–23) and by the timing of sleep19, 22, 23), as well as by waking physi-cal activity, exercise, and posture24–26). Since shift work schedules produce misalignment between endogenous circadian rhythmicity and the timing of sleep and wake-fulness, it is important to understand the impact of this misalignment on HR and HRV.
We set out to study these aspects of circadian misalign-ment on cardiac autonomic activity in two laboratory-based, simulated shift work studies. Study 1 aimed to dissociate the effects of endogenous circadian rhythmicity, sleep, waking physical activity, and exercise on HR and HRV. Study 2 aimed to provide an integrated view of the
factors dissociated in study 1.
Methods
SubjectsA total of 29 healthy young adults each participated in
one of two laboratory-based, simulated shift work studies. In study 1, N=14 healthy young adults (ages 22–34 yr, 4 female) completed a seven-day, six-night laboratory study. Subjects were assigned to either a day shift condition or a night shift condition. In study 2, N=15 healthy young adult males (ages 18–29 yr) completed a six-day, five-night laboratory study. Subjects were assigned to one of four Naval shift schedules.
Subjects were physically and psychologically healthy as assessed by history, questionnaires, and physical examina-tion. They had no sleep or circadian disorders as verified by history, questionnaires, and wrist actigraphy (Actiwatch-2; Respironics, Bend, OR); and, in study 1 only, by baseline polysomnography. Subjects were free of traces of drugs and alcohol as assessed by blood and urine chemistry, and were non-smokers. They did not travel across time zones within one month of entering the study, and were not exposed to shift work within three months of entering the study.
All subjects reported to be good sleepers, habitually sleeping between 6 and 10 h daily with regular bedtimes and typical wake times between 06:00 and 09:00. Subjects were asked to avoid napping and to maintain their habitual sleep schedules during the seven days before the labora-tory experiment. Compliance with this part of the study was verified by means of wrist actigraphy and sleep/wake diary, and subjects reported their bedtimes and rising times on a time-stamped voice recorder. Subjects were also instructed to refrain from caffeine or alcohol consumption, and to avoid drugs (including tobacco products) during the seven days before the laboratory experiment. Compliance was verified with urine and breathalyzer tests immediately prior to entering the laboratory.
Experimental designStudy 1
Figure 1 shows a schematic of the experimental design for study 1. Subjects were in the laboratory continuously for seven days (six nights) with up to two other subjects in the laboratory at the same time. For each study run, sub-jects were assigned to either a day shift (DS) condition (n=7; ages 24.0 ± 2.2 yr) or to a night shift (NS) condition (n=7; ages 27.6 ± 3.2 yr). The total amount of scheduled sleep and wakefulness was the same for these two conditions.

E SKORNYAKOV et al.120
Industrial Health 2019, 57, 118–132
On the first day, subjects entered the laboratory at 10:00. Meals were provided at 13:00 and 19:00. This day included an 8-h nighttime sleep opportunity (22:00–06:00).
At 8:45 on the second day, shortly after awakening from baseline sleep, subjects completed an exercise protocol. This protocol encompassed a 15-min stepping exercise, which involved stepping on and off an 8-inch step bench to the sound of a beat (50 bpm). For 30 min before and after the stepping exercise, subjects were seated in a con-trolled posture (upright with feet flat on the floor, hands in their lap, and back flat against the back rest of the chair) while avoiding physical movements as much as possible.
Condition assignment (DS or NS) was announced at 11:50 on the second day. Time in the study up until condi-tion announcement served as the baseline period.
Subjects assigned to the DS condition followed a simulated day shift schedule for three days, with daytime wakefulness (06:00–22:00) and nighttime sleep opportuni-ties (22:00–06:00). Meals were provided at 07:00, 13:00 and 19:00 each simulated DS day. At 08:45 on the second simulated DS day, subjects again completed the exercise protocol described above.
Subjects assigned to the NS condition first received a 4-h prophylactic nap opportunity (14:00–18:00) on the second day in the laboratory, in order to transition to a simulated night shift schedule. They then followed the night shift schedule for three days, with nighttime wake-fulness (18:00–10:00) and daytime sleep opportunities (10:00–18:00). Meals were provided at 19:00, 01:00 and 07:00 each simulated NS day. At 20:45 on the second
simulated NS day, subjects again completed the exercise protocol described above.
On the fifth day in the laboratory, all subjects were exposed to a 24-h constant routine protocol. This protocol allowed for measuring the endogenous circadian rhythm in HR and HRV18–20). In the DS condition, the 24-h constant routine started at 6:00; in the NS condition, it started at 18:00. During the constant routine, subjects were kept awake at all times. They remained seated in a semi-reclined position, with the exception of brief bathroom breaks. They received hourly equicaloric snacks (80 calories per snack; 40% carbohydrate, 30% protein, 30% dietary fat). One subject in the DS condition did not con-sume the hourly snacks during the last 6 h of the constant routine; this subject’s HR and HRV data recorded during this period were not used for analyses.
After the constant routine, subjects in the DS condition received a 4-h nap opportunity (06:00–10:00), followed by a 12-h nighttime recovery sleep period (18:00–06:00). Subjects in the NS condition had a 12-h nighttime recov-ery sleep period right after the constant routine. All sub-jects were discharged from the laboratory on the seventh day at 10:00.
Blood samples were collected at 1-h intervals across a 3-h period right before bedtime (18:30–21:30) on the baseline day. Blood samples were also collected at 3-h intervals throughout the 24-h constant routine, and at 1 h intervals during a 7-h portion of the constant routine (18:30–01:30; Fig. 1). Blood samples were analyzed for markers of endogenous circadian timing; melatonin levels
Fig. 1. Schematic of the design of study 1, showing the day shift (top) and night shift (bottom) conditions simulated in the laboratory. In each panel, days progress from top to bottom, and time of day progresses from left to right. Orange, 24-h constant routine period; dark green, wakefulness during third shift day used for analyses; dark gray, sleep opportunity during third shift day used for analyses; light green, baseline wakefulness period used for analyses; light gray, baseline sleep opportunity used for analyses; yellow, other scheduled wakefulness; black, other scheduled sleep opportunities. Red markings, stepping exercise; filled black circles, blood sampling times.

CARDIAC AUTONOMIC ACTIVITY DURING SHIFT WORK 121
were quantified using RIA (IB88111, KMI Diagnostics Inc., Minneapolis, MN, USA), and cortisol levels were quantified using ELISA (ADI-900-097, Enzo Life Sci-ences, Farmingdale, NY, USA). During the baseline blood sampling period and throughout the 24-h constant routine, subjects were seated in a semi-reclined position.
In both conditions, sleep and nap opportunities were recorded with digital polysomnography (Nihon Kohden, Foothill Ranch, CA, USA). Activity levels were recorded continuously using wrist actigraphy (Actiwatch-2; Respi-ronics, Bend, OR, USA).
Study 2Figure 2 shows a schematic of the experimental design
for study 2. Subjects were in the laboratory continuously for six days (five nights) with up to seven other subjects in the laboratory at the same time. Simulating around-the-clock Naval shift schedules (watch sections), subjects were assigned to one of four conditions as previously described27):
5/15-A: a “5/15” backward rotating watch section, with 6.5-h sleep opportunities beginning at 00:30 on Day 2, 22:30 on Day 2, 18:30 on Day 3, and split sleep at 19:00 (2 h) on Day 4 and 03:00 (4.5 h) on Day 5 (n=4; ages 25.0 ± 2.2 yr);
5/15-B: a “5/15” backward rotating watch section equiva-
lent to the 5/15-A watch section, but shifted by two days in the four-day rotation cycle (n=4; ages 22.3 ± 3.8 yr);
3/9-S: a “3/9” non-rotating watch section, with 6.5-h split sleep opportunities beginning at 21:00 (2 h) and 4:00 (4.5 h) each day (n=3; ages 23.7 ± 1.5 yr);
3/9-C: a “3/9” non-rotating watch section, with 6.5-h consolidated sleep opportunities beginning at 22:30 each day (n=4; 24.0 ± 3.4 yr).
After four simulated watch section days, all subjects received an 11.5-h recovery sleep opportunity. Subjects were discharged from the laboratory on Day 6 (Fig. 2).
Subjects assigned to the 5/15-A and 5/15-B watch sec-tions were in the laboratory at the same time. Likewise, subjects assigned to the 3/9-S and 3/9-C watch sections were in the laboratory at the same time. Condition assign-ment was announced at the beginning of the study. The total amount of scheduled sleep and wakefulness was the same for these four conditions.
Subjects slept in bunk beds in a shared sleeping area; they were instructed to try to sleep during scheduled sleep opportunities and to minimize the sleep disturbance of others. They received three meals and a snack each watch section day. Subjects were scheduled to stand simulated watch duties (i.e., simulated watchstanding) for an average of 6 h per watch section day (Fig. 2). During simulated
Fig. 2. Schematic of the design of study 2, showing each of the four watch sections simulated in the laboratory. In each panel, days progress from top to bottom and time of day progresses from left to right. Black, scheduled sleep opportunities; orange, watchstanding periods; yellow, other scheduled wakefulness periods. Red dotted lines, 24-h period used for analyses.

E SKORNYAKOV et al.122
Industrial Health 2019, 57, 118–132
watchstanding, subjects performed continuous, cogni-tively demanding computer tasks while seated at a desk, including tests on psychomotor vigilance, reaction time, perseveration, memory, response inhibition, and decision-making processes. In all four conditions, activity levels were recorded continuously using wrist actigraphy (Ac-tiwatch-2; Respironics, Bend, OR, USA) to assess sleep/wake patterns (reported elsewhere)27).
Both studiesIn both studies, to enable experimental control over the
simulated shift work conditions, subjects remained isolated from the outside world. They had no exposure to natural daylight and no visitors, phone calls, e-mail, internet access, live television, radio, or other contact with the external environment. Caffeine, alcohol, and tobacco were not allowed. During scheduled wakefulness, light exposure was fixed, with illuminance set below 50 lux in study 1 and below 100 lux in study 2. Ambient temperature was kept at 22 ± 1 °C (mean ± SD) during both studies, except during the constant routine in study 1 when it was 24 ± 1 °C.
Cognitive performance tests were administered at least every 2 h during scheduled wakefulness. Subjects performed the same types and the same number of perfor-mance tests regardless of condition assignment in study 1, and likewise in study 2. Between performance tests, meals, and sleep opportunities, subjects were allowed to read, watch movies, play games, and talk with other study participants and research staff. Beside the stepping exercise in study 1, subjects were not allowed to engage in vigorous physical activity. Trained research assistants carefully monitored the subjects 24 h per day and kept them awake during scheduled waking periods.
Both studies conformed with the Recommendations from the Declaration of Helsinki of 1983. The studies were approved by the Institutional Review Board of Washing-ton State University. All subjects gave written, informed consent, and were financially compensated for their time.
MeasurementsHR and HRV
In both studies, electrocardiography (EKG) was re-corded at 4,096 Hz with a Holter monitor (DMS 300-3A; Bravo, Huntington Beach, CA, USA) using standard 5-lead electrode placement. The EKG was recorded continuously, with the exception of a portion of the sec-ond simulated shift day in study 1 (not relevant for data analyses) and brief periods around scheduled shower op-portunities. The EKG was manually reviewed and ectopic
beats were removed. The EKG records were then analyzed using CardioScan software (version 11.4; Stateline, NV, USA). EKG data were binned into 5-min epochs. Epochs with movement artifact were removed.
For each epoch, the average HR and the high frequency (HF) component of the HRV power spectrum were cal-culated. The HF component of HRV (HF-HRV) included frequencies ranging from 0.15 to 0.40 Hz, as proposed by the American Heart Association28). There is broad concen-sus that HF-HRV represents parasympathetic activity29). We did not consider a low frequency (LF) component of the HRV power spectrum, previously believed to reflect mostly sympathetic activity30), as there is mounting uncer-tainty regarding the reliability of that interpretation29, 31).
In study 1, the EKG data from 15:00 to 22:00 on the first day in the laboratory were used to determine baseline HR and HF-HRV during wakefulness (Fig. 1, light green bars). The EKG data from 22:00 on the first day to 06:00 on the second day were used to determine baseline HR and HF-HRV during sleep (Fig. 1, light gray bars). The EKG data from the third simulated shift day were used to com-pare HR and HF-HRV between the simulated DS or NS schedules. Data from 06:00 to 22:00 in the DS condition and from 18:00 to 10:00 in the NS condition were used to determine HR and HF-HRV during simulated shift work when subjects were awake (Fig. 1, dark green bars). Data from 22:00 to 6:00 in the DS condition and from 10:00 to 18:00 in the NS condition were used to determine HR and HF-HRV during simulated shift work when subjects were scheduled to sleep (Fig. 1, dark gray bars). The EKG recordings obtained during the 24-h constant routine were used to assess the endogenous circadian rhythm in HR and HF-HRV. Epochs recorded during the constant routine that overlapped with neurobehavioral testing (15 min every 2 h, beginning 2 h after waking), intravenous (iv) catheter insertion or removal for blood sampling, or bathroom breaks (and 5 min intervals after bathroom breaks) were discarded.
In study 2, only the 24-h period from 12:00 on the sec-ond day until 12:00 on the third day was used for analysis of HR and HF-HRV in each of the four watch sections (Fig. 2, red dotted lines). This 24-h period is representative of the differences between the watch sections, and serves to illustrate the complex interactions of multiple factors influencing cardiac autonomic activity. Due to technical failure, the data from one subject in the 3/9-S watch sec-tion was lost. With regard to the EKG recordings, there-fore, the sample size for study 2 was N=14.

CARDIAC AUTONOMIC ACTIVITY DURING SHIFT WORK 123
Activity levels and sleepActigraphic data were analyzed using Actiware software
(version 6.0; Respironics, Bend, OR, USA). The number of activity counts, recorded in 1-min epochs, was averaged into 5-min bins. For study 1, the 5-min bins from 15:00 until 22:00 on the first day in the laboratory were used as estimates of waking physical activity at baseline (Fig. 1, light green bars). The 5-min bins from the third simulated shift day were used as estimates of waking physical activ-ity during shift work: from 06:00 to 22:00 in the DS con-dition, and from 18:00 to 10:00 in the NS condition (Fig. 1, dark green bars).
Polysomnographic recordings of sleep periods in study 1 were scored according to the criteria of the American Academy of Sleep Medicine32). Total sleep time (TST) was assessed for the baseline night (Fig. 1, light gray bars) and for the sleep period of the third simulated shift day (Fig. 1, dark gray bars).
Statistical analysisStatistical analyses were performed using SAS (version
9.3; SAS Institute, Inc., Cary, NC, USA). Unless noted otherwise, data were analyzed with mixed-effects analysis of variance33) (ANOVA). For study 1, subject-specific baseline values for wake (average over 15:00 to 22:00 on day 1; Fig. 1, light green bars) and sleep (average over 22:00 day 1 to 06:00 day 2; Fig. 1, light gray bars) were included as a covariate in analyses of HR and HF-HRV for wakefulness and sleep, respectively, during simulated shift work. Analyses focused on physical activity included the 5-min averages of activity counts from actigraphy as co-variate. For study 2 analyses, watch section (5/15-A, 5/15-B, 3/9-S, 3/9-C) was included as a covariate. All mixed-effects analyses included a random effect on the intercept over subjects to account for idiosyncratic inter-individual differences in the magnitude of the signals analyzed. Estimates are provided as marginal mean ± SE (unless otherwise noted). Figures show raw hourly means and SEs by condition.
Circadian rhythmicity was analyzed with a non-linear, mixed-effects regression implementation of cosinor analy-sis34); the 5% data with the most extreme residuals were excluded. Rhythm parameters, which included amplitude, acrophase (timing of the peak), and mesor (center value), were tested and compared between conditions with t tests embedded in the cosinor analysis. Statistical testing for an effect of time awake was done using linear mixed-effects regression; this analysis was applied to the residuals of the cosinor analysis across the two conditions in order to
avoid colinearity in parameter estimation.HR and HF-HRV data were analyzed based on 5-min
epochs. However, for data from the stepping exercise in study 1, the three 5-min epochs covering each exercise session were averaged into a single 15-min bin, and the data collected prior to each exercise session were also averaged into 15-min bins, beginning 15 min after sched-uled awakening (in order to exclude potential confounds due to sleep inertia35)). Reactivity to the stepping exercise was quantified as the difference between the 15-min bin containing the exercise session and the 15-min bin imme-diately pre-exercise.
Results
Effects of simulated shift work on HR and HF-HRV during constant routine
The constant routine protocol in study 1 allowed for measuring the endogenous circadian rhythms of HR and HRV. Before focusing on the HR and HF-HRV data, we considered the effect of the simulated shift work that pre-ceded the constant routine protocol (Fig. 1) on the timing of the circadian pacemaker. We found that markers of the circadian pacemaker, melatonin and cortisol, did not show a substantial shift in timing comparing DS to NS36).
Despite the constant conditions under which the HR and HF-HRV data were measured, these data showed pro-nounced rhythms in both conditions (Fig. 3). Regardless of condition, HR was high during the afternoon hours and low during the nighttime hours. HF-HRV peaked earlier in the day than HR—especially in the NS condition, which showed an HF-HRV rhythm that was approximately in-verse to the HR rhythm. Cosinor analysis confirmed signifi-cant 24-h rhythmicity in HR in the DS condition (t13=6.67, p<0.001) and the NS condition (t13=19.77, p<0.001). The amplitude of the 24-h rhythm was 1.0 bpm (± 0.2 bpm) for the DS condition and 3.0 bpm (± 0.2 bpm) for the NS condition. The difference between conditions of 2.0 bpm was statistically significant (t12=9.27, p<0.001). The mesor (center value) was 64.6 bpm (± 3.4 bpm) in the DS condi-tion and 64.4 bpm (± 3.4 bpm) in the NS condition, which was not significantly different (t12=0.03, p=0.97).The acro-phase (peak) of the 24-h rhythm in HR occurred at 14:34 (± 34 min) in the DS condition and at 16:43 (± 10 min) in the NS condition. The 129 min delay in the NS condition relative to the DS condition was statistically significant (t12=3.61, p=0.004). After accounting for 24-h rhythmicity, there was no evidence of an effect of time awake in the HR data of the two conditions (t13=0.37, p=0.72).

E SKORNYAKOV et al.124
Industrial Health 2019, 57, 118–132
Cosinor analysis also confirmed significant 24-h circa-dian rhythmicity in HF-HRV in the DS condition (t13=4.81, p=0.001) and the NS condition (t13=8.32, p<0.001). The amplitude of the 24-h rhythm was 42.4 ms2 (± 8.8 ms2) for the DS condition and 82.2 ms2 (± 9.9 ms2) for the NS condition. The difference between conditions of 39.8 ms2 was statistically significant (t12=3.01, p=0.011). The mesor (center value) was 569.5 ms2 (± 117.9 ms2) in the DS con-dition and 545.3 ms2 (± 117.9 ms2) in the NS condition, which was not significantly different (t12=0.15, p=0.89). The acrophase (peak) of the 24-h rhythm of HF-HRV occurred at 11:16 (± 53 min) in the DS condition and at 05:53 (± 24 min) in the NS condition. The 323 min ad-vance in the NS condition relative to the DS condition was statistically significant (t12=5.50, p<0.001). The difference in the acrophase is substantial, but visual inspection of the data (Fig. 3) suggests that some outliers that remained in the data may have skewed the cosinor fit in the DS condi-tion, resulting in an apparent delay of the estimate of the acrophase of HF-HRV in that condition. Potentially con-nected, after accounting for 24-h rhythmicity, there was a small but statistically significant effect of time awake in the HF-HRV data (t13=2.21, p=0.046), with HF-HRV decreasing by 1.6 ms2 (± 0.7 ms2) for every hour awake.
Effects of simulated shift work on HR and HF-HRV during wakefulness and sleep
The simulated shift work period preceding the constant routine protocol in study 1 allowed for measuring the effects of shifted wakefulness and sleep periods on HR and HRV. Before investigating the effects of wakefulness and sleep, we examined the polysomnographic records of
nighttime baseline sleep (Fig. 1, light gray bars) and night-time or daytime sleep at the end of the three-day simulated shift work period (Fig. 1, dark gray bars). Baseline TST was 416.1 min (± 15.5 min) for the DS condition and 431.4 min (± 15.5 min) for the NS condition, which was not significantly different (F1,12=0.49, p=0.50). TST for the third simulated shift day was 441.1 min (± 16.6 min) in the DS condition (i.e., nighttime sleep) and 392.4 min (± 16.6 min) in the NS condition (i.e., daytime sleep). Thus, daytime sleep in the NS condition was 48.7 min (± 23.5) min shorter than nighttime sleep in the DS condi-tion; the difference approached statistical significance (F1,12=4.32, p=0.060).
The temporal profiles of HR and HF-HRV during the baseline day and night (Fig. 1, light green and light gray bars, respectively) and during the wakefulness and sleep periods of the third simulated shift day (Fig. 1, dark green and dark gray bars, respectively) are shown in Fig. 4. Mixed-effects ANOVA of the HR data during baseline wakefulness, as a function of condition and time of day, showed no significant main effect of condition (F1,986=0.01, p=0.92). There was, however, a significant main effect of time of day (F83,986=13.64, p<0.001), with substantial changes in HR over time in both conditions. HR was lowest around hours 17:00 and 18:00, when subjects were mostly seated for baseline blood sampling procedures. The interaction of condition by time of day was also significant (F83,986=1.45, p=0.007). HR was slightly greater in the NS condition around hour 15:00. Overall, HR during baseline wakefulness was comparable between the two conditions.
For scheduled sleep at baseline, there was no significant main effect of condition on HR (F1,1067=1.85, p=0.17),
Fig. 3. HR (left) and HF-HRV (right) during the 24-h constant routine for the day shift (DS) and night shift (NS) condi-tions. Dots represent observed means; error bars indicate ± 1 standard error. Curves represent fitted 24-h rhythms. Data and curves are projected onto a 24-h axis from midnight to midnight.

CARDIAC AUTONOMIC ACTIVITY DURING SHIFT WORK 125
but there was a significant main effect of time in bed (F95,1067=3.82, p<0.001), with HR gradually decreasing over time in bed. The interaction of condition by time in bed was also significant (F95,1067=1.30, p=0.032). The NS condition displayed a greater decrease in HR than the DS condition as time in bed progressed (Fig. 4, top left).
During wakefulness on the third day of simulated shift work, there was a trend for a main effect of condition on HR after controlling for baseline (F1,2173=3.15, p=0.076). HR was greater in the DS condition (73.2 ± 1.5 bpm) than in the NS condition (69.5 ± 1.5 bpm). There was also a significant main effect of time awake (F191,2173=10.10, p<0.001). As during baseline, there were substantial changes in HR over time that were common to both condi-tions. The interaction of condition by time awake was also significant (F190,2173=1.59, p<0.001). The DS condition
had greater HR than the NS condition about halfway through the simulated work day.
For scheduled sleep during the third day of simulated shift work, there was a trend for a main effect of condi-tion on HR after controlling for baseline (F1,1055=3.01, p=0.083). There was also a significant main effect of time in bed (F95,1055=1.28, p=0.043) and a significant interac-tion of condition by time in bed (F95,1055=2.15, p<0.001). HR decreased across the nighttime sleep period in the DS condition, whereas it initially increased and then decreased during the daytime sleep period in the NS condition (Fig. 4, bottom left).
The HF-HRV data were essentially a mirror image of the HR data. Mixed-effects ANOVA of the HF-HRV data during baseline wakefulness, as a function of condition and time of day, showed no significant main effect of con-
Fig. 4. HR (left panels) and HF-HRV (right panels) for the day shift (DS; orange) and night shift (NS; black) conditions at baseline (top panels) and during simulated shift work (bottom panels). For the bottom panels, the top axis indicates time of day for the night shift condition, and the bottom axis indicates time of day for the day shift condition. Dots represent observed means; error bars indicate ± 1 standard error. Orange horizontal bar, scheduled sleep opportunity for the DS condition; black horizontal bar, scheduled sleep opportunity for the NS condition.

E SKORNYAKOV et al.126
Industrial Health 2019, 57, 118–132
dition on HF-HRV (F1,986=0.15, p=0.70). There was, how-ever, a significant main effect of time of day (F83,986=4.24, p<0.001), with substantial changes in HF-HRV over time in both conditions. HF-HRV was highest around hours 17:00 and 18:00, when subjects were mostly seated for baseline blood sampling procedures. The interaction of condition by time of day was not significant (F83,986=0.81, p=0.89). HF-HRV during baseline wakefulness was com-parable between conditions.
For HF-HRV during scheduled sleep at baseline, there was no significant main effect of condition (F1,1067=0.54, p=0.46) and no significant main effect of time in bed (F95,1067=0.86, p=0.82). There was, however, a significant interaction of condition by time in bed (F95,1067=1.41, p=0.008). The NS condition displayed a greater increase in HF-HRV than the DS condition as time in bed progressed (Fig. 4, top right).
During wakefulness on the third day of simulated shift work, there was a significant main effect of condition on HF-HRV after controlling for baseline (F1,2174=5.32, p=0.021) and a significant main effect of time awake (F191,2174=4.83, p<0.001). As during baseline, there were substantial changes in HF-HRV over time that were com-mon to both conditions. The interaction of condition by time awake was also significant (F190,2174=1.62, p<0.001). The DS condition had lower HF-HRV than the NS condi-tion for the larger part of the simulated shift day, begin-ning a few hours after awakening.
For scheduled sleep during the third day of simulated shift work, there was no significant main effect of condi-tion on HF-HRV after controlling for baseline (F1,1055=0.18, p=0.67). There was also no significant main effect of time in bed (F95,1055=0.82, p=0.89) and no significant interac-tion of condition by time in bed (F95,1055=0.87, p=0.80). Despite the lack of statistical significance when account-ing for baseline differences, the pattern of HF-HRV during sleep on the third shift day was similar (but mirrored) to that of HR for both conditions (Fig. 4, bottom right).
Effects of physical activity on HR and HF-HRVFigure 5 shows the average number of activity counts
per minute during wakefulness for the DS and NS condi-tions, at baseline (Fig. 1, light green bars) and during sim-ulated shift work (Fig. 1, dark green bars). Mixed-effects ANOVA of the activity data during baseline wakefulness, as a function of condition and time of day, showed no significant main effect of condition (F1,996=2.42, p=0.12). There was, however, a significant main effect of time of day (F83,996=15.11, p<0.001) and a significant interaction
of condition by time of day (F83,996=1.33, p=0.029). Dur-ing wakefulness on the third day of simulated shift work, there was likewise no significant main effect of condition (F1,2101=0.02, p=0.89). There was, however, a significant main effect of time awake (F191,2101=4.43, p<0.001), as well as a significant interaction of condition by time awake (F191,2101=1.40, p<0.001). The DS condition exhibited greater activity than the NS condition halfway through the simulated shift day (Fig. 5, bottom panel). Overall, the differences in activity between the two conditions were small.
Mixed-effects ANOVA with average activity counts from wrist actigraphy as a covariate revealed that base-line activity was a significant covariate of both baseline HR (F1,985=233.47, p<0.001) and baseline HF-HRV (F1,985=25.35, p<0.001). An increase of one activity count was associated with an increase of HR by 0.022 bpm (± 0.001 bpm) and a decrease of HF-HRV by 0.43 ms2
Fig. 5. Mean number of activity counts for the day shift (DS; orange) and night shift (NS; black) conditions at baseline (top) and during simulated shift work (bottom). Squares represent observed means; error bars indicate ± 1 standard error. Orange horizontal bar, scheduled sleep opportunity for the DS condition; black hori-zontal bar, scheduled sleep opportunity for the NS condition; light green horizontal bar, blood sampling period requiring subjects to be seated most of the time.
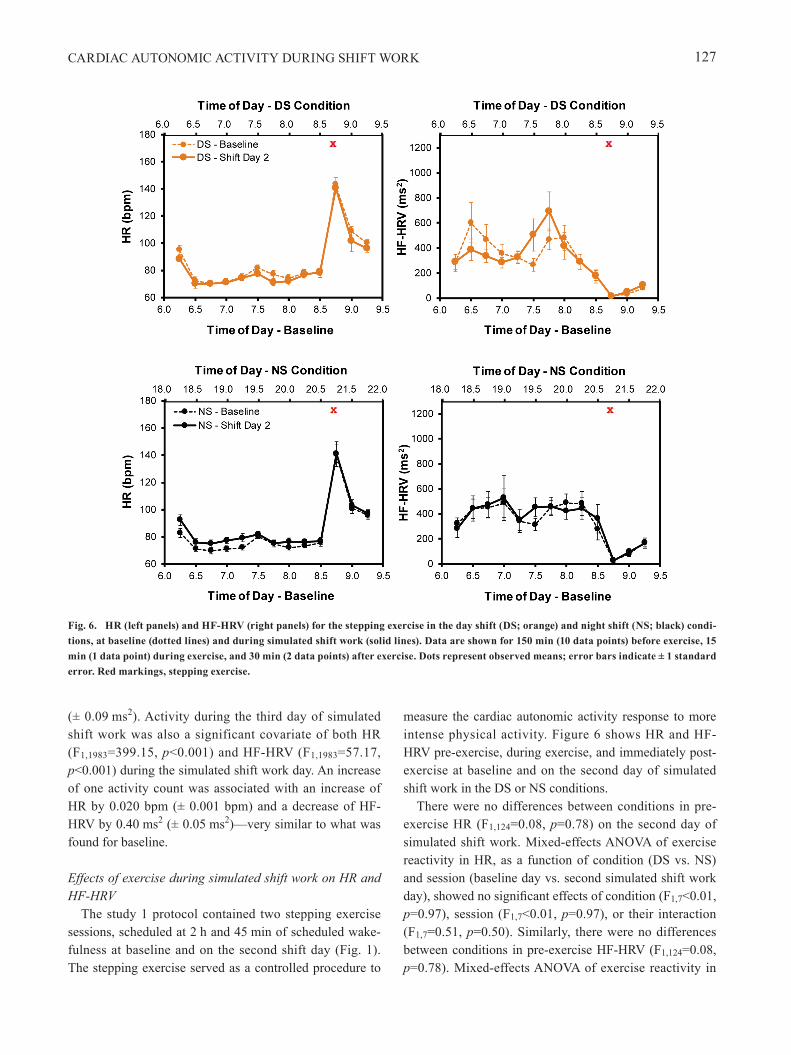
CARDIAC AUTONOMIC ACTIVITY DURING SHIFT WORK 127
(± 0.09 ms2). Activity during the third day of simulated shift work was also a significant covariate of both HR (F1,1983=399.15, p<0.001) and HF-HRV (F1,1983=57.17, p<0.001) during the simulated shift work day. An increase of one activity count was associated with an increase of HR by 0.020 bpm (± 0.001 bpm) and a decrease of HF-HRV by 0.40 ms2 (± 0.05 ms2)—very similar to what was found for baseline.
Effects of exercise during simulated shift work on HR and HF-HRV
The study 1 protocol contained two stepping exercise sessions, scheduled at 2 h and 45 min of scheduled wake-fulness at baseline and on the second shift day (Fig. 1). The stepping exercise served as a controlled procedure to
measure the cardiac autonomic activity response to more intense physical activity. Figure 6 shows HR and HF-HRV pre-exercise, during exercise, and immediately post-exercise at baseline and on the second day of simulated shift work in the DS or NS conditions.
There were no differences between conditions in pre-exercise HR (F1,124=0.08, p=0.78) on the second day of simulated shift work. Mixed-effects ANOVA of exercise reactivity in HR, as a function of condition (DS vs. NS) and session (baseline day vs. second simulated shift work day), showed no significant effects of condition (F1,7<0.01, p=0.97), session (F1,7<0.01, p=0.97), or their interaction (F1,7=0.51, p=0.50). Similarly, there were no differences between conditions in pre-exercise HF-HRV (F1,124=0.08, p=0.78). Mixed-effects ANOVA of exercise reactivity in
Fig. 6. HR (left panels) and HF-HRV (right panels) for the stepping exercise in the day shift (DS; orange) and night shift (NS; black) condi-tions, at baseline (dotted lines) and during simulated shift work (solid lines). Data are shown for 150 min (10 data points) before exercise, 15 min (1 data point) during exercise, and 30 min (2 data points) after exercise. Dots represent observed means; error bars indicate ± 1 standard error. Red markings, stepping exercise.

E SKORNYAKOV et al.128
Industrial Health 2019, 57, 118–132
HF-HRV also showed no significant effects of condition (F1,7=0.42, p=0.54), session (F1,7=2.11, p=0.19), or their interaction (F1,7=1.15, p=0.32).
Combined effects of endogenous circadian rhythm, sleep/wake state, and physical activity on HR and HF-HRV
In study 2, which involved laboratory-based shift work schedules simulating real-world, around-the-clock Naval operations (Fig. 2), we set out to assess the combined and interacting effects of the circadian pacemaker, sleep/wake state, and physical activity on HR and HF-HRV. Figure 7 shows mean HR and HF-HRV for each watch section across time of day, from 12:00 on the second day until 12:00 on the third day.
Mixed-effects ANOVA of HR, as a function of time of day and state (scheduled sleep versus wake vs. simulated watchstanding), with watch section as a co-variate, showed a significant main effect of time of day (F287,3173=4.20, p<0.001) and a significant main effect of state (F2,3173=639.63, p<0.001). There was also a signifi-cant interaction of time of day by state (F358,3173=2.83, p<0.001). There was no significant effect of watch section as a covariate (F3,3173=1.98, p=0.12).
Mixed-effects ANOVA of HF-HRV showed no signifi-cant main effect of time of day (F287,3173=1.10, p=0.12). There was, however, a significant main effect of state (F2,3173=85.01, p<0.001) and a significant interaction of time of day by state (F358,3173=1.29, p<0.001). There was no significant effect of watch section as a covariate (F3,3173=2.16, p=0.090).
Discussion
As has been demonstrated previously, cardiac auto-nomic activity is dynamically influenced by endogenous circadian rhythmicity18–21) and by the timing of sleep19, 23), as well as by waking physical activity, exercise, and posture22, 24–26). However, how these factors combine and interact under conditions of shift work, when there is misalignment between endogenous circadian rhythmic-ity and the timing of sleep and wakefulness, is not well documented. We investigated this issue in two laboratory-based, simulated shift work studies of HR and HRV, with study 1 (Fig. 1) dissociating the effects of endogenous circadian rhythmicity, sleep, waking physical activity, and exercise, and study 2 (Fig. 2) illustrating their interactions.
The constant routine procedure in study 1 permitted an assessment of the effect of simulated shift work on the endogenous circadian rhythm in HR and HF-HRV,
while eliminating confounds known to influence cardiac autonomic activity, including sleep, food intake, physical activity, and posture. In line with previous field research that showed a lack of adaptation in circadian timing, even among permanent night shift workers37), we found that the timing of endogenous circadian markers (melatonin and cortisol) after exposure to three days of simulated shift work remained similar for the DS and NS conditions36). The HR and HF-HRV data collected under constant routine showed significant 24-h rhythmicity that was congruent with the well-established circadian rhythm in cardiac autonomic activity18–21, 38), and also similar for the DS and NS conditions (Fig. 3). It follows that the HR and HF-HRV rhythms were not produced by the preceding shift schedule, but rather reflected endogenous rhythmicity
Fig. 7. HR (left panels) and HF-HRV (right panels) for the 5/15-A (yellow), 5/15-B (purple), 3/9-S (red), and 3/9-C (blue) watch sec-tions. Dots represent observed means; error bars indicate ± 1 stan-dard error. Black horizontal bars, scheduled sleep opportunities; orange horizontal bars, scheduled watchstanding.

CARDIAC AUTONOMIC ACTIVITY DURING SHIFT WORK 129
driven by the circadian pacemaker.The simulated shift days in study 1 permitted an as-
sessment of the effects of wakefulness versus sleep, and temporal displacement of sleep, on HR and HF-HRV. During wakefulness on the third simulated shift day, the NS condition exhibited somewhat lower HR and higher HF-HRV than the DS condition, whereas there were no such differences between conditions at baseline (Fig. 4). This is consistent with a previous study that measured HR in simulated shift schedules, which also found lower waking HR in a night shift schedule as compared to a day shift schedule39). The negligible shifting of endogenous circadian timing in the NS condition indicates that this modulation may be influenced by the circadian rhythmic-ity of autonomic activity itself, potentially via projections from the SCN to the paraventricular nucleus (PVN) of the hypothalamus40). Also, during nighttime hours, activity in the nuclei of the ascending arousal system, including the locus coeruleus, is reduced, and is further inhibited by the VLPO nucleus of the hypothalamus8). Inhibition of the locus coeruleus, the major noradrenergic center of the brain, leads to disinhibition of parasympathetic nuclei41), consistent with our findings of lower HR and higher HF-HRV during nighttime wakefulness in the NS condition.
The magnitude of changes in HR and HF-HRV over waking time was considerable (Fig. 4), especially when compared to the amplitude of the endogenous circadian rhythm (Fig. 3). This implies that there was substantial modulation of cardiac autonomic activity by other fac-tors, such as physical activity and posture. Our actigraphy findings indicate that the systematic fluctuations in HR and HF-HRV across waking time (Fig. 4) could be largely explained by systematic variations in activity levels (Fig. 5). The relatively minor difference in activity levels between the DS and NS conditions halfway through the simulated shift day (Fig. 5, bottom), which is also reflected in HR (Fig. 4, bottom left), may be related to the opposite effect of the circadian pacemaker for the two conditions. That is, during this time in the simulated shift work protocol, the circadian pacemaker would have exerted a drive for wakefulness (and potentially more physical activity) in the DS condition and a drive for sleep (and potentially more sedentary behavior) in the NS condition. It should be noted, however, that in both conditions the overall level of physical activity, and the effect thereof on cardiac autonomic activity, was modest. This is corroborated by the results of the stepping exercise (Fig. 6), which increased HR and decreased HF-HRV regardless of condition to a much greater extent than the variations seen in response to regular waking physical
activity (Fig. 4).The overall impact of sleep on cardiac autonomic activ-
ity was about the same for the DS and NS conditions after correcting for baseline differences (Fig. 4), and similar to what has been found in previous work39, 42). However, the temporal dynamics of HR and HF-HRV across the sleep period were not the same between the two conditions. The stages of sleep are distributed differently in daytime sleep compared to nighttime sleep43–45), and there are well-studied relationships between different sleep stages and cardiac autonomic activity46, 47). While beyond the scope of this paper, the different dynamics of HR and HF-HRV during the sleep period could thus be due to differences in sleep architecture between nighttime and daytime sleep. It is also possible that the effect of sleep on cardiac autonomic activity is modulated by endogenous circadian rhythmicity directly.
Our findings in study 1 indicate that behavioral factors, such as sleep, posture, and physical activity, may dominate temporal changes in cardiac autonomic activity relative to endogenous circadian rhythmicity. This was confirmed in study 2, which allowed for an integrated view of the cardiac autonomic activity modulators that were dissoci-ated in study 1. In study 2, we found that regardless of the time of day, HR was lowest and HF-HRV was highest during scheduled sleep, and vice versa, during scheduled wakefulness (Fig. 7). The magnitude of change between scheduled sleep and scheduled wakefulness was larger than the magnitude of change between sedentary simulated watchstanding periods and other waking periods. Thus, in the laboratory-based, simulated shift schedules of study 2, sleep was the dominant driver of HR and HRV.
LimitationsOur studies have some limitations that warrant consid-
eration. Subjects were healthy young adults, free from clinically significant medical conditions including sleep disorders such as obstructive sleep apnea (OSA). OSA, which typically increases in severity during daytime sleep48), modifies cardiac autonomic activity49). As such, our results do not generalize to shift workers with OSA. Additionally, caffeine use was not permitted in our stud-ies, though caffeine is commonly consumed by real-world shift workers50) as a fatigue countermeasure. We did not address whether or how stimulants or other medications modulate cardiac autonomic activity in shift work settings. Eating habits—or even a single meal—can also alter HR and HRV51). Our studies were not designed to assess the impact of meal timing or meal composition on cardiac au-

E SKORNYAKOV et al.130
Industrial Health 2019, 57, 118–132
tonomic activity, and any such effects are therefore inter-twined with other factors modulating HR and HRV (espe-cially in comparisons between waking and sleep). Further, we did not study the effects of chronic exposure to shift work, which over time may trigger allostatic mechanisms that modify autonomic activity to maintain homeostasis in the face of the recurring stress of shift work52). This could ultimately result in allostatic overload, potentially leading to cardiovascular disease53).
ConclusionOur simulated shift work studies investigated the
separate and combined effects of various factors affecting cardiac autonomic activity. We found that sleep, physical activity, and exercise are powerful modulators of HR and HRV, whereas the effect of endogenous circadian rhyth-micity is comparatively small. In the published literature, some field studies measuring cardiac autonomic activ-ity showed a decrease in parasympathetic activity and/or an increase in sympathetic activity during night shift work15, 16, 54, 55). Other studies found the opposite13, 17) or no difference between day and night shift schedules14, 56). These field studies, however, did not systematically ac-count for the effects of activity, posture, stress, workload, use of stimulants such as caffeine, and/or presence of medical conditions affecting autonomic activity. In field research, these effects may be intertwined and act as confounds, which may explain some of the discrepancies in the published literature. Without measuring and control-ling or accounting for such factors, therefore, the results of field studies of cardiac autonomic activity must be inter-preted carefully—and conclusions regarding cardiovascu-lar disease or risk based on measures of cardiac autonomic activity should be drawn with caution.
Acknowledgements
We thank the staff of the Sleep and Performance Re-search Center at Washington State University for their as-sistance in data collection. Study 1 was partially supported by start-up funds from the College of Pharmacy and Phar-maceutical Sciences at Washington State University (Gad-dameedhi). Study 2 was supported by Naval Postgraduate School award N62271-13-M-1228 (Van Dongen). Data analysis was supported by Congressionally Directed Medi-cal Research Program award W81XWH-16-1-0319.
References
1) Honn KA, Garde AH, Fischer FM, Van Dongen HPA (2016) 22nd International Symposium on Shiftwork and Working Time: Challenges and solutions for healthy working hours. Chronobiol Int 33, 581–8. [Medline] [CrossRef]
2) Brum MCB, Filho FFD, Schnorr CC, Bottega GB, Rodrigues TC (2015) Shift work and its association with metabolic disorders. Diabetol Metab Syndr 7, 45. [Medline] [CrossRef]
3) Vyas MV, Garg AX, Iansavichus AV, Costella J, Donner A, Laugsand LE, Janszky I, Mrkobrada M, Parraga G, Hackam DG (2012) Shift work and vascular events: systematic review and meta-analysis. BMJ 345, e4800. [Medline] [CrossRef]
4) Vetter C, Devore EE, Wegrzyn LR, Massa J, Speizer FE, Kawachi I, Rosner B, Stampfer MJ, Schernhammer ES (2016) Association between rotating night shift work and risk of coronary heart disease among women. JAMA 315, 1726–34. [Medline] [CrossRef]
5) Mozaffarian D, Benjamin EJ, Go AS, Arnett DK, Blaha MJ, Cushman M, Das SR, de Ferranti S, Després JP, Fullerton HJ, Howard VJ, Huffman MD, Isasi CR, Jiménez MC, Judd SE, Kissela BM, Lichtman JH, Lisabeth LD, Liu S, Mackey RH, Magid DJ, McGuire DK, Mohler ER 3rd, Moy CS, Muntner P, Mussolino ME, Nasir K, Neumar RW, Nichol G, Palaniappan L, Pandey DK, Reeves MJ, Rodriguez CJ, Rosamond W, Sorlie PD, Stein J, Towfighi A, Turan TN, Virani SS, Woo D, Yeh RW Turner MB, Writing Group Members American Heart Association Statistics Committee Stroke Statistics Subcommittee (2016) Heart disease and stroke statistics-2016 update: a report from the American Heart Association. Circulation 133, e38–360. [Medline]
6) Åkerstedt T (2003) Shift work and disturbed sleep/wakefulness. Occup Med (Lond) 53, 89–94. [Medline] [CrossRef]
7) Baron KG, Reid KJ (2014) Circadian misalignment and health. Int Rev Psychiatry 26, 139–54. [Medline] [CrossRef]
8) Moore RY (1997) Circadian rhythms: basic neurobiology and clinical applications. Annu Rev Med 48, 253–66. [Medline] [CrossRef]
9) Lavie P (2001) Sleep-wake as a biological rhythm. Annu Rev Psychol 52, 277–303. [Medline] [CrossRef]
10) James SM, Honn KA, Gaddameedhi S, Van Dongen HPA (2017) Shift work: disrupted circadian rhythms and sleep—implications for health and well-being. Curr Sleep Med Rep 3, 104–12. [Medline] [CrossRef]
11) Thayer JF, Lane RD (2007) The role of vagal function in the risk for cardiovascular disease and mortality. Biol Psychol 74, 224–42. [Medline] [CrossRef]
12) Thayer JF, Åhs F, Fredrikson M, Sollers JJ 3rd, Wager TD (2012) A meta-analysis of heart rate variability and neuroimaging studies: implications for heart rate variability as a marker of stress and health. Neurosci Biobehav Rev

CARDIAC AUTONOMIC ACTIVITY DURING SHIFT WORK 131
36, 747–56. [Medline] [CrossRef] 13) Furlan R, Barbic F, Piazza S, Tinelli M, Seghizzi P,
Malliani A (2000) Modifications of cardiac autonomic profile associated with a shift schedule of work. Circulation 102, 1912–6. [Medline] [CrossRef]
14) Ito H, Nozaki M, Maruyama T, Kaji Y, Tsuda Y (2001) Shift work modifies the circadian patterns of heart rate variability in nurses. Int J Cardiol 79, 231–6. [Medline] [CrossRef]
15) Kunikullaya KU, Kirthi SK, Venkatesh D, Goturu J (2010) Heart rate variability changes in business process outsourcing employees working in shifts. Indian Pacing Electrophysiol J 10, 439–46. [Medline]
16) Amirian I, Toftegård Andersen L, Rosenberg J, Gögenur I (2014) Decreased heart rate variability in surgeons during night shifts. Can J Surg 57, 300–4. [Medline] [CrossRef]
17) Lee S, Kim H, Kim DH, Yum M, Son M (2015) Heart rate variability in male shift workers in automobile manufacturing factories in South Korea. Int Arch Occup Environ Health 88, 895–902. [Medline] [CrossRef]
18) Kräuchi K, Wirz-Justice A (1994) Circadian rhythm of heat production, heart rate, and skin and core temperature under unmasking conditions in men. Am J Physiol 267, R819–29. [Medline]
19) Burgess HJ, Trinder J, Kim Y, Luke D (1997) Sleep and circadian influences on cardiac autonomic nervous system activity. Am J Physiol 273, H1761–8. [Medline]
20) Kerkhof GA, Van Dongen HPA, Bobbert AC (1998) Absence of endogenous circadian rhythmicity in blood pressure? Am J Hypertens 11, 373–7. [Medline] [CrossRef]
21) Van Dongen HPA, Maislin G, Kerkhof GA (2001) Repeated assessment of the endogenous 24-hour profile of blood pressure under constant routine. Chronobiol Int 18, 85–98. [Medline] [CrossRef]
22) Scheer FA, Hu K, Evoniuk H, Kelly EE, Malhotra A, Hilton MF, Shea SA (2010) Impact of the human circadian system, exercise, and their interaction on cardiovascular function. Proc Natl Acad Sci USA 107, 20541–6. [Medline] [CrossRef]
23) Boudreau P, Yeh WH, Dumont GA, Boivin DB (2012) A circadian rhythm in heart rate variability contributes to the increased cardiac sympathovagal response to awakening in the morning. Chronobiol Int 29, 757–68. [Medline] [CrossRef]
24) Vybiral T, Bryg RJ, Maddens ME, Boden WE (1989) Effect of passive tilt on sympathetic and parasympathetic components of heart rate variability in normal subjects. Am J Cardiol 63, 1117–20. [Medline] [CrossRef]
25) Sipinková I, Hahn G, Meyer M, Tadlánek M, Hájek J (1997) Effect of respiration and posture on heart rate variability. Physiol Res 46, 173–9. [Medline]
26) Javorka M, Zila I, Balhárek T, Javorka K (2002) Heart rate recovery after exercise: relations to heart rate variability and complexity. Braz J Med Biol Res 35, 991–1000. [Medline] [CrossRef]
27) Skornyakov E, Shattuck NL, Winser MA, Matsangas P, Sparrow AR, Layton ME, Gabehart RJ, Van Dongen HPA (2017) Sleep and performance in simulated Navy watch schedules. Accid Anal Prev 99 Pt B, 422–7. [Medline] [CrossRef]
28) Malik M (1996) Heart rate variability. Ann Noninvasive Electrocardiol 1, 151–81. [CrossRef]
29) Berntson GG, Bigger JT Jr, Eckberg DL, Grossman P, Kaufmann PG, Malik M, Nagaraja HN, Porges SW, Saul JP, Stone PH, van der Molen MW (1997) Heart rate variability: origins, methods, and interpretive caveats. Psychophysiology 34, 623–48. [Medline] [CrossRef]
30) Akselrod S, Gordon D, Ubel FA, Shannon DC, Berger AC, Cohen RJ (1981) Power spectrum analysis of heart rate fluctuation: a quantitative probe of beat-to-beat cardiovascular control. Science 213, 220–2. [Medline] [CrossRef]
31) Houle MS, Billman GE (1999) Low-frequency component of the heart rate variability spectrum: a poor marker of sympathetic activity. Am J Physiol 276, H215–23. [Medline]
32) Iber C, Ancoli-Israel S, Chesson Jr AL, Quan SF (2007) The AASM manual for the scoring of sleep and associated events. Rules, terminology and technical specifications. American Academy of Sleep Medicine, Westchester.
33) Van Dongen HPA, Maislin G, Dinges DF (2004) Dealing with inter-individual differences in the temporal dynamics of fatigue and performance: importance and techniques. Aviat Space Environ Med 75 Suppl, A147–54. [Medline]
34) Mikulich SK, Zerbe GO, Jones RH, Crowley TJ (2003) Comparing linear and nonlinear mixed model approaches to cosinor analysis. Stat Med 22, 3195–211. [Medline] [CrossRef]
35) Dinges DF (1990) Are you awake? Cognitive performance and reverie during the hypnopompic state. In: Sleep and Cognition, Bootzin RR, Kihlstrom JF and Schacter DL (Eds.), 159–75, American Psychological Association, Washington, DC.
36) Skene DJ, Skornyakov E, Chowdhury NR, Gajula RP, Middleton B, Satterfield BC, Porter KI, Van Dongen HPA, Gaddameedhi S (2018) Separation of circadian- and behavior-driven metabolite rhythms in humans provides a window on peripheral oscillators and metabolism. Proceedings of the National Academy of Sciences, 115, 7825–30.
37) Folkard S (2008) Do permanent night workers show circadian adjustment? A review based on the endogenous melatonin rhythm. Chronobiol Int 25, 215–24. [Medline] [CrossRef]
38) Glos M, Fie tze I , Blau A, Baumann G, Penzel T (2014) Cardiac autonomic modulation and sleepiness: physiological consequences of sleep deprivation due to 40 h of prolonged wakefulness. Physiol Behav 125, 45–53. [Medline] [CrossRef]
39) Morris CJ, Purvis TE, Hu K, Scheer FA (2016) Circadian misalignment increases cardiovascular disease risk factors

E SKORNYAKOV et al.132
Industrial Health 2019, 57, 118–132
in humans. Proc Natl Acad Sci USA 113, E1402–11. [Medline] [CrossRef]
40) Benarroch EE (2006) Basic Neurosciences with Clinical Applications. Mayo Foundation for Medical Education and Research, Rochester.
41) Samuels ER, Szabadi E (2008) Functional neuroanatomy of the noradrenergic locus coeruleus: its roles in the regulation of arousal and autonomic function part I: principles of functional organisation. Curr Neuropharmacol 6, 235–53. [Medline] [CrossRef]
42) van Amelsvoort LG, Schouten EG, Maan AC, Swenne KA, Kok FJ (2001) 24-hour heart rate variability in shift workers: impact of shift schedule. J Occup Health 43, 32–8. [CrossRef]
43) Kerkhof GA, Lancel M (1991) EEG slow wave activity, REM sleep, and rectal temperature during night and day sleep in morning-type and evening-type subjects. Psychophysiology 28, 678–88. [Medline] [CrossRef]
44) Van Dongen HP, Belenky G, Vila BJ (2011) The efficacy of a restart break for recycling with optimal performance depends critically on circadian timing. Sleep 34, 917–29. [Medline] [CrossRef]
45) Torsvall L, Åkerstedt T, Gillander K, Knutsson A (1989) Sleep on the night shift: 24-hour EEG monitoring of spontaneous sleep/wake behavior. Psychophysiology 26, 352–8. [Medline] [CrossRef]
46) Boudreau P, Yeh WH, Dumont GA, Boivin DB (2013) Circadian variation of heart rate variability across sleep stages. Sleep 36, 1919–28. [Medline] [CrossRef]
47) Jurysta F, van de Borne P, Migeotte PF, Dumont M, Lanquart JP, Degaute JP, Linkowski P (2003) A study of the dynamic interactions between sleep EEG and heart rate variability in healthy young men. Clin Neurophysiol 114,
2146–55. [Medline] [CrossRef] 48) Paciorek M, Korczyński P, Bielicki P, Byśkiniewicz K,
Zieliński J, Chazan R (2011) Obstructive sleep apnea in shift workers. Sleep Med 12, 274–7. [Medline] [CrossRef]
49) Aydin M, Altin R, Ozeren A, Kart L, Bilge M, Unalacak M (2004) Cardiac autonomic activity in obstructive sleep apnea: time-dependent and spectral analysis of heart rate variability using 24-hour Holter electrocardiograms. Tex Heart Inst J 31, 132–6. [Medline]
50) Buchvold HV, Pallesen S, Øyane NMF, Bjorvatn B (2015) Associations between night work and BMI, alcohol, smoking, caffeine and exercise—a cross-sectional study. BMC Public Health 15, 1112. [Medline] [CrossRef]
51) Sauder KA, Johnston ER, Skulas-Ray AC, Campbell TS, West SG (2012) Effect of meal content on heart rate variability and cardiovascular reactivity to mental stress. Psychophysiology 49, 470–7. [Medline] [CrossRef]
52) McEwen BS, Karatsoreos IN (2015) Sleep deprivation and circadian disruption: stress, allostasis, and allostatic load. Sleep Med Clin 10, 1–10. [Medline] [CrossRef]
53) McEwen BS (2006) Protective and damaging effects of stress mediators: central role of the brain. Dialogues Clin Neurosci 8, 367–81. [Medline]
54) Yamauchi H, Iwamoto M, Harada N (2001) Physiological effects of shift work on hospital nurses. J Hum Ergol (Tokyo) 30, 251–4. [Medline]
55) Yamauchi H (2004) Effects of night work on urinary excretion rates of 6-sulfatoxymelatonin, norepinephrine and estriol in pregnant women. Ind Health 42, 268–76. [Medline] [CrossRef]
56) Freitas J, Lago P, Puig J, Carvalho MJ, Costa O, de Freitas AF (1997) Circadian heart rate variability rhythm in shift workers. J Electrocardiol 30, 39–44. [Medline] [CrossRef]
DOI: 10.19185/matters.201903000008 Matters Select (ISSN: 2297-9239) | 1
select
[email protected]@wsu.edu
DisciplinesNeuroscience
KeywordsGliaAstrocyteSleep HomeostasisSleep DeprivationFruit Fly
Type of ObservationStandalone
Type of LinkStandard Data
Submitted Feb 6, 2019 Published Mar 22, 2019
3 x
Triple Blind Peer ReviewThe handling editor, the re-viewers, and the authors areall blinded during the reviewprocess.
Full Open AccessSupported by the VeluxFoundation, the University ofZurich, and the EPFL Schoolof Life Sciences.
4.0
Creative Commons 4.0This observation is dis-tributed under the termsof the Creative CommonsAttribution 4.0 InternationalLicense.
Sleep pressure regulates mushroom bodyneural-glial interactions in DrosophilaWilliam M Vanderheyden, Hans P A Van Dongen, Marcos G Frank, Jason R GerstnerBiomedical Sciences, Washington State University - Elson S. Floyd College of Medicine; Sleep and Performance ResearchCenter, Washington State University - Elson S. Floyd College of Medicine
AbstractSleep is a behavior that exists broadly across animal phyla, from flies to humans, andis necessary for normal brain function. Recent studies in both vertebrates and inver-tebrates have suggested a role for glial cells in sleep regulatory processes. Changes inneural-glial interactions have been shown to be critical for synaptic plasticity and cir-cuit function. Here, we wanted to test the hypothesis that changes in sleep pressurealters neural-glial interactions. In the fruit fly, Drosophila melanogaster, sleep is knownto be regulated by mushroom body (MB) circuits. We used the technique GFP Recon-stitution Across Synaptic Partners (GRASP) to test whether changes in sleep pressureaffect neural-glial interactions between MB neurons and astrocytes, a specialized glialcell type known to regulate sleep in flies and mammals. The MB-astrocyte GRASP sig-nal was reduced after 24 h of sleep deprivation, whereas the signal returned to baselinelevels following 72 h of recovery. Social enrichment, which increases sleep drive, simi-larly reduced the MB-astrocyte GRASP signal. We did not observe any changes in theMB-astrocyte GRASP signal over time-of-day, or following paraquat exposure or starva-tion. These data suggest that changes in sleep pressure are linked to dynamic changesin neural-glial interactions between astrocytes and neuronal sleep circuits, which arenot caused by normal rest-activity cycles or stressors.
IntroductionSleep is a ubiquitous behavior exhibited broadly throughout animal phyla, yet its func-tions remain enigmatic. Fundamental properties of sleep function may be revealed bydetermining phylogenetically conserved mechanisms associated with sleep behavioracross evolutionarily distant species. Sleep is affected both by the amount of time spentawake, as well as experience-dependent changes in synaptic plasticity. Sleep regulatoryprocesses have largely focused on the role of neurons; however, glial cells also play animportant role in sleep, across invertebrates and vertebrates alike, including humans [1][2] [3] [4] [5] [6] [7].
The fruit fly Drosophila melanogaster is a powerful model for exploring neural and glialprocesses that regulate sleep. For example, sleep in Drosophila has been shown to beregulated independently by mushroom body (MB) neural circuits [8] [9] as well as glialcells [1] [4] [6] [10] [11]. However, it is currently unclear how MB neurons and glialcells physically interact as a result of changes in sleep pressure. The GFP Reconstitu-tion Across Synaptic Partners (GRASP) technique is a method that labels the membranecontact of two cell types by complementary fragments of the green fluorescent protein(GFP) molecule [12]. Here we use the GRASP technique to label interactions betweenMB neurons and astrocytes, a specific glial cell type known to regulate sleep in flies andmammals [1] [2] [5]. Determining that changes in neural-glial interactions are associ-ated with sleep pressure would provide a new model system to test functional aspectsof sleep-regulatory molecular events that may be conserved across species.
ObjectiveTo determine whether changes in sleep pressure regulate mushroom body neural-glialinteractions in flies.

Sleep pressure regulates mushroom body neural-glial interactions in Drosophila
DOI: 10.19185/matters.201903000008 Matters Select (ISSN: 2297-9239) | 2
a
Figure LegendFigure 1. Increased sleep pressure decreases neural-glial interactions betweenmushroom body neurons and astrocytes in Drosophila melanogaster.
(A) Representative image of MB-astrocyte GRASP signal in baseline (non-sleep de-prived) condition.
(B) Representative image of MB-astrocyte GRASP signal after 24 h of sleep deprivation(SD).
(C) Representative image ofMB-astrocyte GRASP signal after 72 h of recovery following24 h of SD. Scale bar 25 µm.

Sleep pressure regulates mushroom body neural-glial interactions in Drosophila
DOI: 10.19185/matters.201903000008 Matters Select (ISSN: 2297-9239) | 3
(D)Average CTCF signal in groups from the 24 h of baseline (non-sleep deprived) condi-tion, after 24 h of sleep deprivation (SD), and after 72 h of recovery following 24 h of SD.One-way ANOVA revealed a significant effect of sleep loss on GRASP signal (P<0.0001).Tukey multiple comparisons test showed a significant reduction in GRASP signal after24 h of SD when compared to both baseline (*P<0.001) and after 72 h of recovery fol-lowing 24 h of SD (*P<0.001).
(E) Average sleep amount (min) per 24 h day in groups from the 24 h of baseline (non-sleep deprived) condition, during 24 h of sleep deprivation (SD), and for the final 24h period after 72 h of recovery following 24 h of SD. One-way ANOVA confirmed asignificant effect of sleep loss (P<0.0001). Tukey multiple comparisons test showed asignificant reduction in sleep during SD when compared to baseline (*P<0.001) and dur-ing 72 h of recovery following 24 h of SD (*P<0.001).
(F) Diurnal measures of MB-astrocyte GRASP signal in flies on a 12:12 light-dark cycle.One-way ANOVA indicated no significant changes across time-of-day (P=0.22). ZT0(zeitgeber time 0) = lights on, ZT12 = lights off.
(G) Stress induced by 24 h of paraquat treatment (0.1 mM) or by 24 h of starvationdid not affect MB-astrocyte GRASP signal compared to control flies. One-way ANOVA(P=0.08); Tukey multiple comparisons tests among conditions (n.s.).
(H) Representative image of MB-astrocyte GRASP signal in control (isolated flies).
(I) Representative image of MB-astrocyte GRASP signal in flies following social enrich-ment (enriched flies). Scale bar 25 µm.
(J) Effect of social enrichment (enriched flies) on MB-astrocyte GRASP signal comparedto control (isolated flies). T-test (*P<0.01).
(K) Total sleep amount (min) in the 24 h day from MB-astrocyte GRASP flies followingsocial enrichment (enriched flies) compared to control (isolated flies). T-test (*P<0.0001).
Results & DiscussionOur GRASP studies utilized flies harboring mb247-splitGFP11 (specific to MB neurons)[13] [14] and the UAS-splitGFP1-10 expressed in glia, using the astrocyte-directed Alrm-GAL4 driver [15]. MB neural-glial interactions are quantified by the presence of a GFPfluorescent signal, which is triggered upon contact of the individual GRASP compo-nents [12]. MB-astrocyte GRASP flies also express Ds-Red under control of the mb247MB neuronal promoter, which labels the whole MB region of the fly brain. MB-astrocyteGRASP flies were subjected to 24 h of mechanical sleep deprivation [16] and brains wereharvested and examined for changes in GFP signal compared to control (undisturbed)flies using confocal microscopy (Fig. 1A–C). All flies were examined at the same time-of-day (ZT0, lights-on). MB-astrocyte GRASP flies showed a significant reduction inGFP signal (Corrected Total Cell Fluorescence, see methods) following sleep depriva-tion compared to control flies (Fig. 1D). Following 72 h of recovery after 24 h of sleepdeprivation, we observed that the GFP signal returned to control levels (Fig. 1D). ThisMB-astrocyte GRASP response to sleep deprivation and recovery closely resembled theamount of sleep observed under these conditions (Fig. 1E).
To determine whether the changes in MB-astrocyte GRASP signal may have been influ-enced by the normal sleep-wake cycle, we performed brain dissections on MB-astrocyteGRASP flies at multiple times-of-day. We did not find any differences in the diurnalprofile of GFP signal (Fig. 1F), indicating that the observed differences in MB-astrocyteGRASP signal were due to changes in sleep pressure, and not normal sleep-wake cycles.To rule out the possibility that the differences in GFP signal were caused by stress effects,we examined MB-astrocyte GRASP flies for changes in GFP signal following paraquattreatment and starvation stressors. We did not observe any differences in GFP signalin stressor-treated MB-astrocyte GRASP flies compared to control flies (Fig. 1G). To de-termine whether the decreases in MB-astrocyte GRASP signal were due to increases insleep pressure, and not a nonspecific artifact of mechanical sleep deprivation, we tested

Sleep pressure regulates mushroom body neural-glial interactions in Drosophila
DOI: 10.19185/matters.201903000008 Matters Select (ISSN: 2297-9239) | 4
flies following a social enrichment paradigm, which is known to increase sleep drivein flies [17]. Compared to control (isolated flies), MB-astrocyte GRASP flies subjectedto social enrichment (enriched flies) showed a significant reduction in GFP signal (Fig.1H–J) in tandem with a significant increase in sleep (Fig. 1K), pointing to sleep pressureas the specific driver of the changes in MB-astrocyte GRASP signal.
Sleep deprivation is detrimental to cognitive functioning [18], including learning andmemory [19], as well as overall health [20]. Yet, we lack a fundamental understandingof sleep function [21]. The fly model is a powerful tool to understand sleep regula-tory processes and functions [22]. Here, we used the GRASP technique to show thatincreases in sleep pressure decrease neural-glial interactions between MB neurons andastrocytes. Dynamic changes in neural-glial interactionsmay influence sleep homeosta-sis through glial uptake of neurotransmitters, efficiency of gliotransmission, and glialprocesses underlying metabolic support of neurons. Future studies examining phyloge-netically conserved molecular pathways in regulating the dynamic relationship of sleeppressure with sleep deprivation- and experience-dependent changes in neural-glial in-teractions will help to better understand the functional roles for sleep behavior.
ConclusionsThis study shows that changes in sleep pressure regulate MB neural-glial interactionsin flies.
LimitationsWe used Drosophila melanogaster to test whether changes in sleep pressure regulatechanges in neural-glial interactions. The current studies are limited to MB neuronsand astrocytes, and we have not determined whether other sleep circuits or other glialcells are responsive to changes in sleep pressure. Our studies are also limited to theGRASP technique, and alternative strategies, such as immunohistochemistry againstneural-glial extra-cellular matrix proteins or cell adhesion molecules [23] or electronmicroscopy-based morphological studies [24] may provide alternative means to exam-ine sleep-dependent changes in neural-glial interactions. More research is needed tofully understand the time constants of the changes at the neural-glial interface. Thesechanges may take place at time scales ranging from milliseconds to hours, and perhapseven days. Our study was limited to assessing the effects of acute (24 h) sleep depriva-tion. Our studies are also limited to the fly model, and testing vertebrate models is desir-able in order to determine whether the observed changes in neural-glial interactions arephylogenetically conserved. Recent studies demonstrated sleep-dependent changes inthe astrocyte glutamate transporter, GLT1, apposition to hypothalamic neurons in mice[25]. However, these studies did not conclude whether the changes were due to a redis-tribution of GLT1 protein in astrocytes, or to structural changes of astrocyte processes(e.g., extension/retraction) onto these neurons.
Alternative Explanations
ConjecturesFuture studies using, e.g., RNAi-based strategies to knock down cell type-specific targetproteins involved in cell growth or morphology or the maintenance of the extracel-lular matrix in our model will be needed to determine mechanisms underlying sleep-dependent changes in neural-glial interactions. In addition, since theMB is an importantbrain region for learning and memory processes in flies [26], testing whether changesin neural-glial interactions are important for cognitive function would be a worthwhiledirection for future studies.

Sleep pressure regulates mushroom body neural-glial interactions in Drosophila
DOI: 10.19185/matters.201903000008 Matters Select (ISSN: 2297-9239) | 5
Additional Information
Methods
Fly stocks
Alrm-Gal4 stocks were obtained from the Bloomington Drosophila Stock Center (Indi-ana University). The mb247-DsRed; mb247-splitGFP11, UAS-splitGFP1-10/TM3sb flieswere obtained from T. Riemensperger and A. Fiala (University of Göttingen).
Fly husbandry
Flies were cultured at 25℃, 60% humidity, maintained on a 12:12 Light:Dark cycle, onNutri-fly Bloomington Formulation fly food (Genesee Scientific, San Diego, CA). Newlyeclosed virgin female flies were collected from culture vials daily under CO2 anesthesiaand housed in groups of approximately 30 prior to experimentation.
Sleep analysis
Female flies 4–7 days after eclosion were used for all sleep studies. Flies were mouthaspirated into 5 mm × 65 mm (outside diameter × length) polycarbonate recording tubes(Trikinetics, Waltham, MA) with food (Bloomington Nutri-fly formula) on one end andyarn plugs on the other. Sleep parameters were continuously evaluated using the Triki-netics Drosophila activity monitoring system (DAMS; Trikinetics, Waltham, MA) as de-scribed previously [27]. One acclimatization day was followed by 2 days of baselinesleep recording, one 24 h period of mechanical sleep deprivation, and 72 h of recov-ery sleep. Sleep deprivation was performed using a Sleep Nullifying Apparatus (SNAP),which produces waking without nonspecifically activating stress responses [16], as de-scribed previously [27].
Imaging
Drosophila brains were dissected in phosphate-buffered saline (0.9% NaCl, 10 mmNaH2PO4, pH 7.2) containing 0.3% Triton X-100 (PBS-T) and fixed in 4% paraformalde-hyde, washed, and mounted on cover slips. Optical sections were collected with a Le-ica DMi8 laser scanning confocal microscope. For each experiment, calibration on themicroscope was held constant by establishing a signal threshold value for the controlgroup. GRASP intensity levels were measured using Corrected Total Cell Fluorescence(CTCF). The corrected total fluorescence = Integrated Fluorescence density – (Area ofROI multiplied by Mean Fluorescence of background) and was calculated in max pro-jected image stacks with the region of interest (ROI) around the mushroom bodies.
Stress and starvation
Virgin female flies were collected as described above. 4–7 days after eclosion, animalswere mouth aspirated into 5 mm × 65 mm (outside diameter × length) polycarbonaterecording tubes (Trikinetics, Waltham, MA) containing 0.1 mM Paraquat in minimalmedia (2% agar, 5% sucrose in ddH2O) or starvation food (2% agar in ddH2O). Animalswere housed for 24 h on these media and afterwards were rapidly dissected at ZT0 forimaging of GRASP signal.
Social enrichment
To standardize the environmental conditions during critical periods of brain develop-ment, virgin female flies were collected upon eclosion and maintained in same-sex vialscontaining approximately 30 flies for 2 days. This protocol kept environmental con-ditions constant between subsequently isolated and enriched flies for the first 2 daysof adult life. 3 day old flies were then divided into a socially isolated group, in whichflies were individually housed in 5 mm × 65 mm plastic tubes, and a socially enrichedgroup, consisting of 50 female flies housed in a single vial. After 5 days of social enrich-ment/isolation, flies were placed into clean 5 mm × 65 mm plastic tubes and sleep wasrecorded for 3 days using the Trikinetics DAMS.
Data analysis

6
Statistics were calculated using Graphpad Prism software. Student’s t-test, one-wayANOVA, two-way ANOVA, and Tukey post-hoc analysis were used for analyses. Sleepdata were analyzed by averaging across multiple experiments. Flies that did not survivethe entire experimental paradigm were removed from data analysis.
Funding Statement
HVD and MGF were supported by CDMRP grant W81XWH-18-1-0100. This work wasalso supported by NIH grant MH099544 (MGF).
Acknowledgements
We would like to thank the Washington State University Microscopy Core Facility foruse of core facility microscopes and T. Riemensperger and A. Fiala for providing themb247-DsRed; mb247-splitGFP11, UAS-splitGFP1-10/TM3sb flies. We would also liketo thank R. Taylor for technical assistance.
Ethics Statement
Not Applicable.
7
Citations
[1] Jason R. Gerstner et al. “Normal sleep requires the astrocytebrain-type fatty acid binding protein FABP7”. In: Science Advances3.4 (2017), e1602663. doi: 10.1126/sciadv.1602663. url:https://doi.org/10.1126/sciadv.1602663.
[2] Michael M. Halassa et al. “Astrocytic Modulation of SleepHomeostasis and Cognitive Consequences of Sleep Loss”. In:Neuron 61.2 (2009), pp. 213–219. doi:10.1016/j.neuron.2008.11.024. url: https://doi.org/10.1016/j.neuron.2008.11.024.
[3] Menachem Katz et al. “Glia Modulate a Neuronal Circuit forLocomotion Suppression during Sleep in C. elegans”. In: CellReports 22.10 (2018), pp. 2575–2583. doi:10.1016/j.celrep.2018.02.036. url: https://doi.org/10.1016/j.celrep.2018.02.036.
[4] Robin Fropf, Hong Zhou, and Jerry C.P. Yin. “The clock geneperiod differentially regulates sleep and memory in Drosophila”.In: Neurobiology of Learning and Memory 153 (2018), pp. 2–12.doi: 10.1016/j.nlm.2018.02.016. url:https://doi.org/10.1016/j.nlm.2018.02.016.
[5] Jerome Clasadonte et al. “Connexin 43-Mediated AstroglialMetabolic Networks Contribute to the Regulation of theSleep-Wake Cycle”. In: Neuron 95.6 (2017), 1365–1380.E5. doi:10.1016/j.neuron.2017.08.022. url: https://doi.org/10.1016/j.neuron.2017.08.022.
[6] W-F Chen et al. “A neuron–glia interaction involving GABAtransaminase contributes to sleep loss in sleepless mutants”. In:Molecular Psychiatry 20.2 (2014), pp. 240–251. doi:10.1038/mp.2014.11. url:https://doi.org/10.1038/mp.2014.11.
[7] William M. Vanderheyden et al. “Astrocyte expression of theDrosophila TNF-alpha homologue, Eiger, regulates sleep in flies”.In: PLOS Genetics 14.10 (2018), e1007724. doi:10.1371/journal.pgen.1007724. url: https://doi.org/10.1371/journal.pgen.1007724.
[8] Jena L. Pitman et al. “A dynamic role for the mushroom bodies inpromoting sleep in Drosophila”. In: Nature 441.7094 (2006),pp. 753–756. doi: 10.1038/nature04739. url:https://doi.org/10.1038/nature04739.
[9] William J. Joiner et al. “Sleep in Drosophila is regulated by adultmushroom bodies”. In: Nature 441.7094 (2006), pp. 757–760. doi:10.1038/nature04811. url:https://doi.org/10.1038/nature04811.
[10] Gregory Artiushin et al. “Endocytosis at the Drosophilablood–brain barrier as a function for sleep”. In: eLife 7 (2018),e43326. doi: 10.7554/elife.43326. url:https://doi.org/10.7554/elife.43326.
[11] Bethany A. Stahl et al. “The Taurine Transporter Eaat2 Functionsin Ensheathing Glia to Modulate Sleep and Metabolic Rate”. In:Current Biology 28.22 (2018), 3700–3708.e4. doi:10.1016/j.cub.2018.10.039. url:https://doi.org/10.1016/j.cub.2018.10.039.
[12] Evan H. Feinberg et al. “GFP Reconstitution Across SynapticPartners (GRASP) Defines Cell Contacts and Synapses in LivingNervous Systems”. In: Neuron 57.3 (2008), pp. 353–363. doi:10.1016/j.neuron.2007.11.030. url: https://doi.org/10.1016/j.neuron.2007.11.030.
[13] Ulrike Pech et al. “Localization of the contacts between Kenyoncells and aminergic neurons in theDrosophila melanogasterbrainusing splitGFP reconstitution”. In: Journal of ComparativeNeurology 521 (2013), pp. 3992–4026. doi:10.1002/cne.23388. url:https://doi.org/10.1002/cne.23388.
[14] Ulrike Pech et al. “Mushroom body miscellanea: transgenicDrosophila strains expressing anatomical and physiologicalsensor proteins in Kenyon cells”. In: Frontiers in Neural Circuits 7(2013), p. 147. doi: 10.3389/fncir.2013.00147. url:https://doi.org/10.3389/fncir.2013.00147.
[15] Johnna Doherty et al. “Ensheathing Glia Function as Phagocytesin the Adult Drosophila Brain”. In: Journal of Neuroscience 29.15(2009), pp. 4768–4781. doi:10.1523/jneurosci.5951-08.2009. url: https://doi.org/10.1523/jneurosci.5951-08.2009.
[16] Paul J. Shaw et al. “Stress response genes protect against lethaleffects of sleep deprivation in Drosophila”. In: Nature 417.6886(2002), pp. 287–291. doi: 10.1038/417287a. url:https://doi.org/10.1038/417287a.
[17] Indrani Ganguly-Fitzgerald, Jeff Donlea, and Paul J. Shaw.“Waking Experience Affects Sleep Need in Drosophila”. In:Science 313.5794 (2006), pp. 1775–1781. doi:10.1126/science.1130408. url:https://doi.org/10.1126/science.1130408.
[18] Melinda L. Jackson et al. “Deconstructing and reconstructingcognitive performance in sleep deprivation”. In: Sleep MedicineReviews 17.3 (2013), pp. 215–225. doi:10.1016/j.smrv.2012.06.007. url: https://doi.org/10.1016/j.smrv.2012.06.007.
[19] Susanne Diekelmann and Jan Born. “The memory function ofsleep”. In: Nature Reviews Neuroscience 11.2 (2010), pp. 114–126.doi: 10.1038/nrn2762. url:https://doi.org/10.1038/nrn2762.
[20] Goran Medic, Micheline Wille, and Michiel E. H. Hemels. “Short-and long-term health consequences of sleep disruption”. In:Nature and Science of Sleep 9 (2017), pp. 151–161. doi:10.2147/nss.s134864. url:https://doi.org/10.2147/nss.s134864.
[21] James M. Krueger et al. “Sleep function: Toward elucidating anenigma”. In: Sleep Medicine Reviews 28 (2016), pp. 46–54. doi:10.1016/j.smrv.2015.08.005. url: https://doi.org/10.1016/j.smrv.2015.08.005.
[22] Jeffrey M Donlea. “Roles for sleep in memory: insights from thefly”. In: Current Opinion in Neurobiology 54 (2019), pp. 120–126.doi: 10.1016/j.conb.2018.10.006. url: https://doi.org/10.1016/j.conb.2018.10.006.
[23] Motomi Matsuno et al. “Long-Term Memory Formation inDrosophila Requires Training-Dependent Glial Transcription”. In:Journal of Neuroscience 35.14 (2015), pp. 5557–5565. doi:10.1523/jneurosci.3865-14.2015. url: https://doi.org/10.1523/jneurosci.3865-14.2015.
[24] Michele Bellesi et al. “Effects of sleep and wake on astrocytes:clues from molecular and ultrastructural studies”. In: BMCBiology 13.1 (2015), p. 66. doi:10.1186/s12915-015-0176-7. url:https://doi.org/10.1186/s12915-015-0176-7.
[25] Chantalle Briggs, Michiru Hirasawa, and Kazue Semba. “SleepDeprivation Distinctly Alters Glutamate Transporter 1Apposition and Excitatory Transmission to Orexin and MCHNeurons”. In: Journal of Neuroscience 38.10 (2018), pp. 2505–2518.doi: 10.1523/jneurosci.2179-17.2018. url:https://doi.org/10.1523/jneurosci.2179-17.2018.
[26] Paola Cognigni, Johannes Felsenberg, and Scott Waddell. “Do theright thing: neural network mechanisms of memory formation,expression and update in Drosophila”. In: Current Opinion inNeurobiology 49 (2018), pp. 51–58. doi:10.1016/j.conb.2017.12.002. url: https://doi.org/10.1016/j.conb.2017.12.002.
[27] Paul J. Shaw et al. “Correlates of Sleep and Waking in Drosophilamelanogaster”. In: Science 287.5459 (2000), pp. 1834–1837. doi:10.1126/science.287.5459.1834. url: https://doi.org/10.1126/science.287.5459.1834.
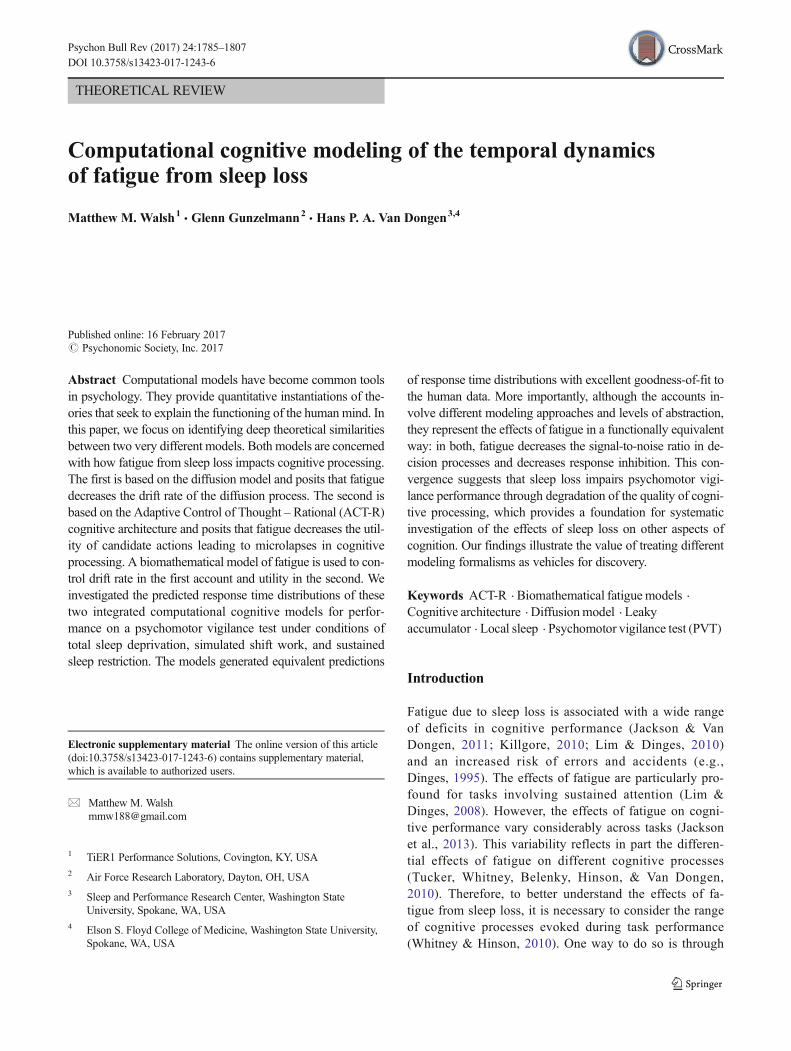
THEORETICAL REVIEW
Computational cognitive modeling of the temporal dynamicsof fatigue from sleep loss
Matthew M. Walsh1& Glenn Gunzelmann2
& Hans P. A. Van Dongen3,4
Published online: 16 February 2017# Psychonomic Society, Inc. 2017
Abstract Computational models have become common toolsin psychology. They provide quantitative instantiations of the-ories that seek to explain the functioning of the human mind. Inthis paper, we focus on identifying deep theoretical similaritiesbetween two very different models. Both models are concernedwith how fatigue from sleep loss impacts cognitive processing.The first is based on the diffusion model and posits that fatiguedecreases the drift rate of the diffusion process. The second isbased on the Adaptive Control of Thought – Rational (ACT-R)cognitive architecture and posits that fatigue decreases the util-ity of candidate actions leading to microlapses in cognitiveprocessing. A biomathematical model of fatigue is used to con-trol drift rate in the first account and utility in the second. Weinvestigated the predicted response time distributions of thesetwo integrated computational cognitive models for perfor-mance on a psychomotor vigilance test under conditions oftotal sleep deprivation, simulated shift work, and sustainedsleep restriction. The models generated equivalent predictions
of response time distributions with excellent goodness-of-fit tothe human data. More importantly, although the accounts in-volve different modeling approaches and levels of abstraction,they represent the effects of fatigue in a functionally equivalentway: in both, fatigue decreases the signal-to-noise ratio in de-cision processes and decreases response inhibition. This con-vergence suggests that sleep loss impairs psychomotor vigi-lance performance through degradation of the quality of cogni-tive processing, which provides a foundation for systematicinvestigation of the effects of sleep loss on other aspects ofcognition. Our findings illustrate the value of treating differentmodeling formalisms as vehicles for discovery.
Keywords ACT-R . Biomathematical fatigue models .
Cognitive architecture . Diffusionmodel . Leakyaccumulator . Local sleep . Psychomotor vigilance test (PVT)
Introduction
Fatigue due to sleep loss is associated with a wide rangeof deficits in cognitive performance (Jackson & VanDongen, 2011; Killgore, 2010; Lim & Dinges, 2010)and an increased risk of errors and accidents (e.g.,Dinges, 1995). The effects of fatigue are particularly pro-found for tasks involving sustained attention (Lim &Dinges, 2008). However, the effects of fatigue on cogni-tive performance vary considerably across tasks (Jacksonet al., 2013). This variability reflects in part the differen-tial effects of fatigue on different cognitive processes(Tucker, Whitney, Belenky, Hinson, & Van Dongen,2010). Therefore, to better understand the effects of fa-tigue from sleep loss, it is necessary to consider the rangeof cognitive processes evoked during task performance(Whitney & Hinson, 2010). One way to do so is through
Electronic supplementary material The online version of this article(doi:10.3758/s13423-017-1243-6) contains supplementary material,which is available to authorized users.
* Matthew M. [email protected]
1 TiER1 Performance Solutions, Covington, KY, USA2 Air Force Research Laboratory, Dayton, OH, USA3 Sleep and Performance Research Center, Washington State
University, Spokane, WA, USA4 Elson S. Floyd College of Medicine, Washington State University,
Spokane, WA, USA
Psychon Bull Rev (2017) 24:1785–1807DOI 10.3758/s13423-017-1243-6
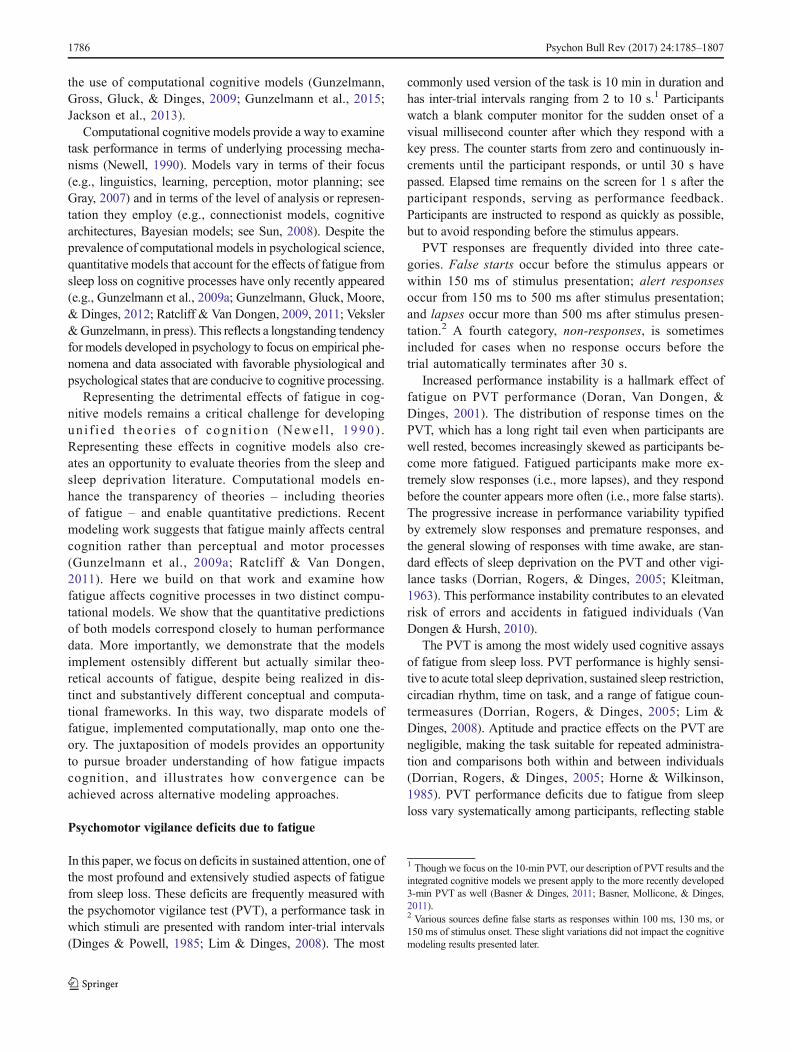
the use of computational cognitive models (Gunzelmann,Gross, Gluck, & Dinges, 2009; Gunzelmann et al., 2015;Jackson et al., 2013).
Computational cognitive models provide a way to examinetask performance in terms of underlying processing mecha-nisms (Newell, 1990). Models vary in terms of their focus(e.g., linguistics, learning, perception, motor planning; seeGray, 2007) and in terms of the level of analysis or represen-tation they employ (e.g., connectionist models, cognitivearchitectures, Bayesian models; see Sun, 2008). Despite theprevalence of computational models in psychological science,quantitative models that account for the effects of fatigue fromsleep loss on cognitive processes have only recently appeared(e.g., Gunzelmann et al., 2009a; Gunzelmann, Gluck, Moore,& Dinges, 2012; Ratcliff & Van Dongen, 2009, 2011; Veksler&Gunzelmann, in press). This reflects a longstanding tendencyfor models developed in psychology to focus on empirical phe-nomena and data associated with favorable physiological andpsychological states that are conducive to cognitive processing.
Representing the detrimental effects of fatigue in cog-nitive models remains a critical challenge for developingun i f i ed theo r i e s o f cogn i t ion (Newel l , 1990) .Representing these effects in cognitive models also cre-ates an opportunity to evaluate theories from the sleep andsleep deprivation literature. Computational models en-hance the transparency of theories – including theoriesof fatigue – and enable quantitative predictions. Recentmodeling work suggests that fatigue mainly affects centralcognition rather than perceptual and motor processes(Gunzelmann et al., 2009a; Ratcliff & Van Dongen,2011). Here we build on that work and examine howfatigue affects cognitive processes in two distinct compu-tational models. We show that the quantitative predictionsof both models correspond closely to human performancedata. More importantly, we demonstrate that the modelsimplement ostensibly different but actually similar theo-retical accounts of fatigue, despite being realized in dis-tinct and substantively different conceptual and computa-tional frameworks. In this way, two disparate models offatigue, implemented computationally, map onto one the-ory. The juxtaposition of models provides an opportunityto pursue broader understanding of how fatigue impactscognition, and illustrates how convergence can beachieved across alternative modeling approaches.
Psychomotor vigilance deficits due to fatigue
In this paper, we focus on deficits in sustained attention, one ofthe most profound and extensively studied aspects of fatiguefrom sleep loss. These deficits are frequently measured withthe psychomotor vigilance test (PVT), a performance task inwhich stimuli are presented with random inter-trial intervals(Dinges & Powell, 1985; Lim & Dinges, 2008). The most
commonly used version of the task is 10 min in duration andhas inter-trial intervals ranging from 2 to 10 s.1 Participantswatch a blank computer monitor for the sudden onset of avisual millisecond counter after which they respond with akey press. The counter starts from zero and continuously in-crements until the participant responds, or until 30 s havepassed. Elapsed time remains on the screen for 1 s after theparticipant responds, serving as performance feedback.Participants are instructed to respond as quickly as possible,but to avoid responding before the stimulus appears.
PVT responses are frequently divided into three cate-gories. False starts occur before the stimulus appears orwithin 150 ms of stimulus presentation; alert responsesoccur from 150 ms to 500 ms after stimulus presentation;and lapses occur more than 500 ms after stimulus presen-tation.2 A fourth category, non-responses, is sometimesincluded for cases when no response occurs before thetrial automatically terminates after 30 s.
Increased performance instability is a hallmark effect offatigue on PVT performance (Doran, Van Dongen, &Dinges, 2001). The distribution of response times on thePVT, which has a long right tail even when participants arewell rested, becomes increasingly skewed as participants be-come more fatigued. Fatigued participants make more ex-tremely slow responses (i.e., more lapses), and they respondbefore the counter appears more often (i.e., more false starts).The progressive increase in performance variability typifiedby extremely slow responses and premature responses, andthe general slowing of responses with time awake, are stan-dard effects of sleep deprivation on the PVT and other vigi-lance tasks (Dorrian, Rogers, & Dinges, 2005; Kleitman,1963). This performance instability contributes to an elevatedrisk of errors and accidents in fatigued individuals (VanDongen & Hursh, 2010).
The PVT is among the most widely used cognitive assaysof fatigue from sleep loss. PVT performance is highly sensi-tive to acute total sleep deprivation, sustained sleep restriction,circadian rhythm, time on task, and a range of fatigue coun-termeasures (Dorrian, Rogers, & Dinges, 2005; Lim &Dinges, 2008). Aptitude and practice effects on the PVT arenegligible, making the task suitable for repeated administra-tion and comparisons both within and between individuals(Dorrian, Rogers, & Dinges, 2005; Horne & Wilkinson,1985). PVT performance deficits due to fatigue from sleeploss vary systematically among participants, reflecting stable
1 Though we focus on the 10-min PVT, our description of PVT results and theintegrated cognitive models we present apply to the more recently developed3-min PVT as well (Basner & Dinges, 2011; Basner, Mollicone, & Dinges,2011).2 Various sources define false starts as responses within 100 ms, 130 ms, or150 ms of stimulus onset. These slight variations did not impact the cognitivemodeling results presented later.
1786 Psychon Bull Rev (2017) 24:1785–1807

inter-individual differences in vulnerability to sleep loss (VanDongen, Baynard, Maislin, & Dinges, 2004).
Biomathematical models of the temporal dynamicsof fatigue
Biomathematical models of fatigue describe and predictchanges in the level of fatigue over the course of hours anddays. Different models account for different sets of fatiguefactors, but all instantiate two primary processes of sleep reg-ulation (Hursh &VanDongen, 2010; Mallis, Mejdal, Nguyen,& Dinges, 2004). A homeostatic process controls the increas-ing drive for sleep with continuous time awake, and a circa-dian process promotes wakefulness during the day and sleepat night (Borbély & Achermann, 1999). Together these twoprimary processes produce dynamic changes in the level offatigue. The homeostatic process is modulated by chronicsleep restriction across days (Hursh et al., 2004; McCauleyet al., 2009, 2013).
Biomathematical models of fatigue are not specificallyconcerned with cognitive mechanisms of task perfor-mance. Rather, model outputs are typically scaled to ageneric summary measure of performance such as an ef-fectiveness score, or a selected outcome measure such asthe number of lapses on the PVT. The basic trends pro-duced by the models are observed in a variety of tasks.However, because the outputs of biomathematical modelsare fitted to specific tasks and measures using existingdata, their ability to predict performance in novel tasksis limited. In addition, biomathematical models of fatigueare generally silent about underlying changes in cognitiveprocessing caused by sleep loss and circadian rhythmicity.
Computational cognitive models of fatigue
Two classes of computational models have recently been usedto account for the cognitive effects of fatigue. The first isbased on a diffusion process that simulates the accumulationof evidence during simple and two-alternative forced-choicetasks (Laming, 1968; Ratcliff &McKoon, 2008; Stone, 1960).In this model, evidence accumulates stochastically untilreaching a decision threshold, at which time a response isinitiated. By varying parameter values in the diffusion model,researchers have reproduced the effects of various experimen-tal manipulations on choice accuracy and response time dis-tributions (e.g., Ratcliff & McKoon, 2008).
Ratcliff and Van Dongen (2011) showed that fatigue maybe simulated by adjusting a composite diffusionmodel param-eter, drift rate divided by drift rate variability. Varying thiscomposite parameter allowed the diffusion model to capturechanges in the response time distribution for individualsperforming the PVT with increasing time awake (Ratcliff &Van Dongen, 2011). The same approach accounted for the
effects of fatigue in a two-choice numerosity discriminationtask (Ratcliff & Van Dongen, 2009).
The second class of models uses a cognitive architecture toaccount for how fatigue affects specific components of cogni-tion (e.g., Gunzelmann et al., 2009a). Cognitive architecturesare general theories of cognition that specify foundational in-formation processing mechanisms and how they interact withone another (Gluck, 2010). In the cognitive architecture usedhere, Adaptive Control of Thought – Rational (ACT-R), in-formation enters the system through perceptual modules, af-fects processing throughout a collection of internal modules,and ultimately causes the manual module to issue a motorresponse (Anderson, 2007).
Gunzelmann et al. (2009a) developed an account of howfatigue selectively impairs information processing mecha-nisms in ACT-R. Briefly, fatigue reduced the utility of candi-date behaviors, causing them probabilistically to fall belowthe threshold for action (cf. Gartenberg et al., 2014). Thisintegrated account captured changes in the complete PVT re-sponse time distribution, including false starts, alert responses,lapses, and sleep attacks (Gunzelmann et al., 2009a). Thesame account made realistic predictions of the effects of fa-tigue on dual-task performance (e.g., Gunzelmann, Byrne,Gluck, & Moore, 2009) and lane deviation in driving(Gunzelmann, Moore, Salvucci, & Gluck, 2011).
Overview
Despite the many experiments that have documented the ef-fects of fatigue on cognitive performance, and the increasinglywidespread use of biomathematical models of fatigue inreal-world applications, computational accounts of how fatigueaffects cognitive processing mechanisms remain limited (cf.,Gunzelmann et al., 2015). Further, there has been no attemptat a comparative analysis of the few available computationalcognitive models of fatigue. Several basic questions remainunresolved: How does fatigue impact cognitive processes?How do different cognitive models account for the effects offatigue? And how do these models relate to one another and totheories of fatigue from the sleep research literature?
We developed and compared two computational cognitiveaccounts of the effects of fatigue on cognition – a diffusionmodel and an ACT-R model – and we used the PVT as a testbed for evaluating these accounts. The diffusion model isbased on that of Ratcliff and Van Dongen (2011), which weaugmented with a leaky accumulator (Usher & McClelland,2001) to capture false starts. Additionally, we merged the dif-fusion model with a biomathematical model of fatigue(McCauley et al., 2013) to systematically vary parameters inthe diffusionmodel that are affected by sleep loss. The ACT-Rmodel is based on that of Gunzelmann et al. (2009a). Weupdated their model for the latest release of the architecture,ACT-R 7.0 (Anderson, 2007), and fitted it to new data sets.
Psychon Bull Rev (2017) 24:1785–1807 1787
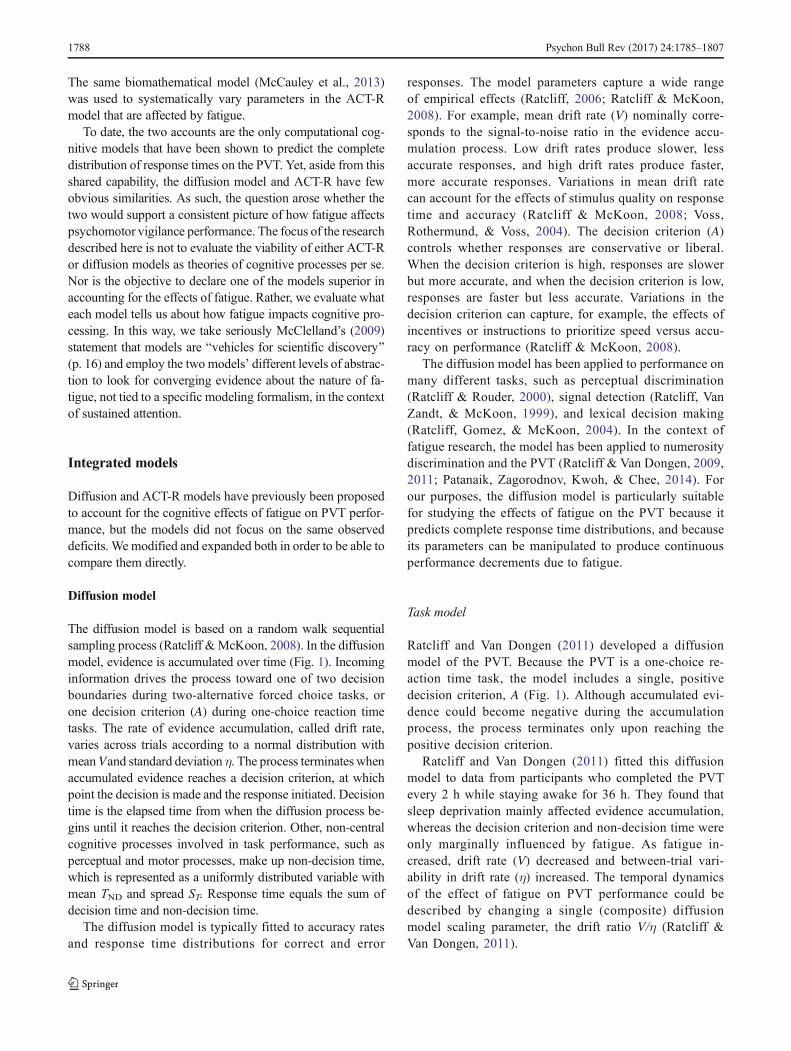
The same biomathematical model (McCauley et al., 2013)was used to systematically vary parameters in the ACT-Rmodel that are affected by fatigue.
To date, the two accounts are the only computational cog-nitive models that have been shown to predict the completedistribution of response times on the PVT. Yet, aside from thisshared capability, the diffusion model and ACT-R have fewobvious similarities. As such, the question arose whether thetwo would support a consistent picture of how fatigue affectspsychomotor vigilance performance. The focus of the researchdescribed here is not to evaluate the viability of either ACT-Ror diffusion models as theories of cognitive processes per se.Nor is the objective to declare one of the models superior inaccounting for the effects of fatigue. Rather, we evaluate whateach model tells us about how fatigue impacts cognitive pro-cessing. In this way, we take seriously McClelland’s (2009)statement that models are Bvehicles for scientific discovery^(p. 16) and employ the two models’ different levels of abstrac-tion to look for converging evidence about the nature of fa-tigue, not tied to a specific modeling formalism, in the contextof sustained attention.
Integrated models
Diffusion and ACT-R models have previously been proposedto account for the cognitive effects of fatigue on PVT perfor-mance, but the models did not focus on the same observeddeficits. We modified and expanded both in order to be able tocompare them directly.
Diffusion model
The diffusion model is based on a random walk sequentialsampling process (Ratcliff &McKoon, 2008). In the diffusionmodel, evidence is accumulated over time (Fig. 1). Incominginformation drives the process toward one of two decisionboundaries during two-alternative forced choice tasks, orone decision criterion (A) during one-choice reaction timetasks. The rate of evidence accumulation, called drift rate,varies across trials according to a normal distribution withmeanVand standard deviation η. The process terminates whenaccumulated evidence reaches a decision criterion, at whichpoint the decision is made and the response initiated. Decisiontime is the elapsed time from when the diffusion process be-gins until it reaches the decision criterion. Other, non-centralcognitive processes involved in task performance, such asperceptual and motor processes, make up non-decision time,which is represented as a uniformly distributed variable withmean TND and spread ST. Response time equals the sum ofdecision time and non-decision time.
The diffusion model is typically fitted to accuracy ratesand response time distributions for correct and error
responses. The model parameters capture a wide rangeof empirical effects (Ratcliff, 2006; Ratcliff & McKoon,2008). For example, mean drift rate (V) nominally corre-sponds to the signal-to-noise ratio in the evidence accu-mulation process. Low drift rates produce slower, lessaccurate responses, and high drift rates produce faster,more accurate responses. Variations in mean drift ratecan account for the effects of stimulus quality on responsetime and accuracy (Ratcliff & McKoon, 2008; Voss,Rothermund, & Voss, 2004). The decision criterion (A)controls whether responses are conservative or liberal.When the decision criterion is high, responses are slowerbut more accurate, and when the decision criterion is low,responses are faster but less accurate. Variations in thedecision criterion can capture, for example, the effects ofincentives or instructions to prioritize speed versus accu-racy on performance (Ratcliff & McKoon, 2008).
The diffusion model has been applied to performance onmany different tasks, such as perceptual discrimination(Ratcliff & Rouder, 2000), signal detection (Ratcliff, VanZandt, & McKoon, 1999), and lexical decision making(Ratcliff, Gomez, & McKoon, 2004). In the context offatigue research, the model has been applied to numerositydiscrimination and the PVT (Ratcliff & Van Dongen, 2009,2011; Patanaik, Zagorodnov, Kwoh, & Chee, 2014). Forour purposes, the diffusion model is particularly suitablefor studying the effects of fatigue on the PVT because itpredicts complete response time distributions, and becauseits parameters can be manipulated to produce continuousperformance decrements due to fatigue.
Task model
Ratcliff and Van Dongen (2011) developed a diffusionmodel of the PVT. Because the PVT is a one-choice re-action time task, the model includes a single, positivedecision criterion, A (Fig. 1). Although accumulated evi-dence could become negative during the accumulationprocess, the process terminates only upon reaching thepositive decision criterion.
Ratcliff and Van Dongen (2011) fitted this diffusionmodel to data from participants who completed the PVTevery 2 h while staying awake for 36 h. They found thatsleep deprivation mainly affected evidence accumulation,whereas the decision criterion and non-decision time wereonly marginally influenced by fatigue. As fatigue in-creased, drift rate (V) decreased and between-trial vari-ability in drift rate (η) increased. The temporal dynamicsof the effect of fatigue on PVT performance could bedescribed by changing a single (composite) diffusionmodel scaling parameter, the drift ratio V/η (Ratcliff &Van Dongen, 2011).
1788 Psychon Bull Rev (2017) 24:1785–1807

Task model extension
The model of Ratcliff and Van Dongen (2011) makespredictions about the complete response time distribution.However, because the model pertains to processing afterthe stimulus appears, it does not produce false starts.Increased numbers of false starts under conditions of sleeploss are an important phenomenon, as false starts indicatethat fatigue-related performance impairments cannot beexplained solely by general slowing or reduced motiva-tion (Doran, Van Dongen, & Dinges, 2001). Here we ex-panded the diffusion model to also predict the proportionof false starts.
In a typical diffusion model, the decision process isinitiated when a stimulus is presented. This is problematicbecause, in theory, it would necessitate a separate decisionprocess to detect trial onset and to initiate the primarydecision process associated with the trial. Further compli-cating matters, in tasks where different types of stimulinecessitate different decision processes (e.g., numerosityjudgments vs. lexical decisions), the pre-trial decisionprocess would need to include multiple boundaries asso-ciated with deciding which of the tasks to perform. Toavoid this basic dilemma, we expanded the model so thatthe diffusion process began immediately after feedbackfrom the preceding trial disappeared (i.e., in anticipationof the next stimulus). The diffusion process persistedthroughout the pre-stimulus interval and after the stimulusappeared. Although this may seem counterintuitive, webelieve that it represents a plausible characterization ofdecision processes. The change allows multiple processesto operate in parallel, with irrelevant processes remainingessentially dormant until the appropriate stimuli movetheir drift rates from zero.
Conceptually, the signal-to-noise ratio in the PVTshould be zero during the pre-stimulus interval and greaterthan zero once the stimulus appears. To produce these dy-namics, we allowed V to take on positive values once the
stimulus appeared, and we fixed it to zero during the pre-stimulus interval. Due to within-trial stochastic variability,the diffusion process is equally likely to move upward ordownward at each point in time when V is zero. The noisyaccumulation of evidence during the pre-stimulus intervalallows the diffusion process to occasionally reach the de-cision criterion before the stimulus appears and therebycause a false start.
Preliminary simulations with this model extension con-firmed that stochasticity alone caused the diffusion pro-cess to nearly always reach the decision criterion prema-turely, and the predicted number of false starts farexceeded what is typically seen. Therefore, we imple-mented an additional process based on the intrinsic decaypresent in neural integrator models (Abbott, 1991; Cain &Shea-Brown, 2012; Goldman, Compte, & Wang, 2009;Robinson, 1989; Smith & Ratcliff, 2009). We used theleaky competing accumulator model (LCA; Ossmy et al.,2013; Usher & McClelland, 2001), in which the diffusionprocess depends on two opposing forces: accumulation ofevidence from a stimulus drives the process toward thedecision criterion, while decay (or leakage) pulls the pro-cess back to zero with a certain decay rate, λ.
Decay can be seen as controlling response inhibition.When the value of λ is high, the diffusion process tendsto return to zero and is thus more robust against noise(greater inhibition), whereas when the value of decay islow, the diffusion process is more sensitive to noise (lessinhibition). Because decay rate depends on the simulationstep size, we sometimes refer to the diffusion process’sintegration time constant instead, which does not dependon the simulation step size. The integration time constantis the time it takes for the diffusion process to reach 1 –1/e of its final (asymptotic) value given a signal of con-stant intensity.
The frequency of false starts is jointly determined bythe value of λ and by the decision criterion, A (Fig. 2).With the LCA process implemented, the diffusion model
Fig. 1 Three sample trajectories from a one-criterion diffusion process with mean drift rate V. Evidence accumulation starts at 0 and terminates uponreaching criterion A. Histograms show example densities of response times
Psychon Bull Rev (2017) 24:1785–1807 1789
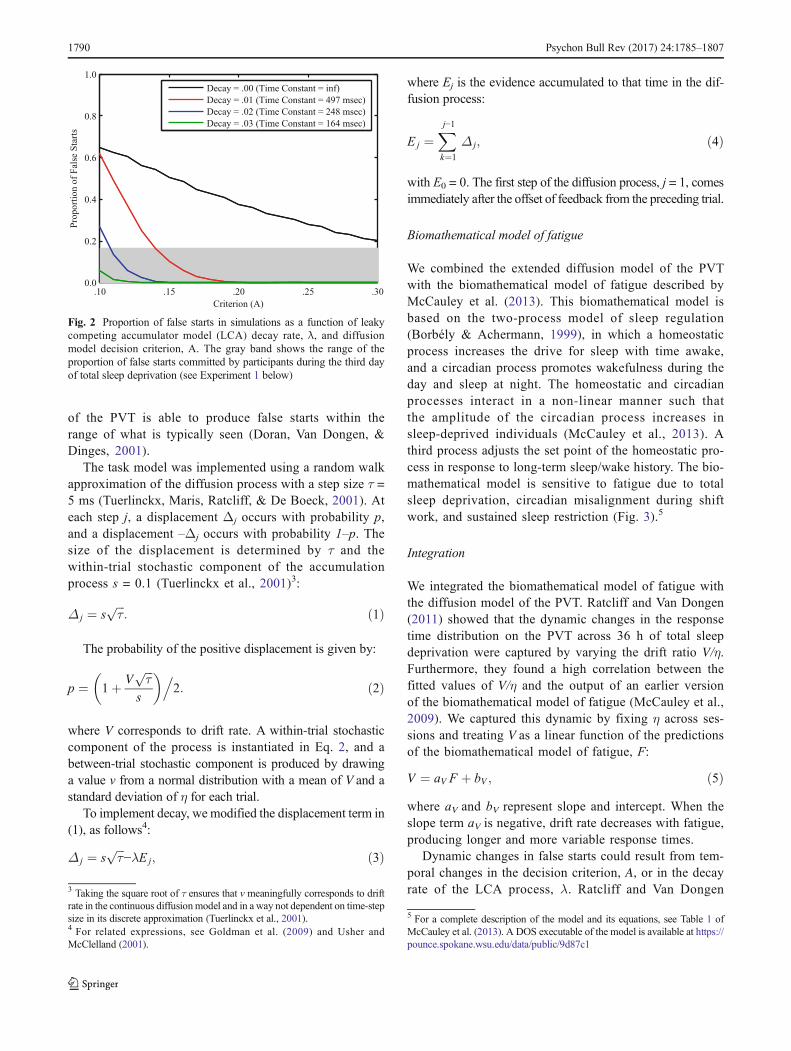
of the PVT is able to produce false starts within therange of what is typically seen (Doran, Van Dongen, &Dinges, 2001).
The task model was implemented using a random walkapproximation of the diffusion process with a step size τ =5 ms (Tuerlinckx, Maris, Ratcliff, & De Boeck, 2001). Ateach step j, a displacement Δj occurs with probability p,and a displacement –Δj occurs with probability 1–p. Thesize of the displacement is determined by τ and thewithin-trial stochastic component of the accumulationprocess s = 0.1 (Tuerlinckx et al., 2001)3:
Δ j ¼ sffiffiffiτ
p: ð1Þ
The probability of the positive displacement is given by:
p ¼ 1þ Vffiffiffiτ
ps
� �.2: ð2Þ
where V corresponds to drift rate. A within-trial stochasticcomponent of the process is instantiated in Eq. 2, and abetween-trial stochastic component is produced by drawinga value v from a normal distribution with a mean of V and astandard deviation of η for each trial.
To implement decay, we modified the displacement term in(1), as follows4:
Δ j ¼ sffiffiffiτ
p−λE j; ð3Þ
where Ej is the evidence accumulated to that time in the dif-fusion process:
E j ¼Xj−1
k¼1
Δ j; ð4Þ
with E0 = 0. The first step of the diffusion process, j = 1, comesimmediately after the offset of feedback from the preceding trial.
Biomathematical model of fatigue
We combined the extended diffusion model of the PVTwith the biomathematical model of fatigue described byMcCauley et al. (2013). This biomathematical model isbased on the two-process model of sleep regulation(Borbély & Achermann, 1999), in which a homeostaticprocess increases the drive for sleep with time awake,and a circadian process promotes wakefulness during theday and sleep at night. The homeostatic and circadianprocesses interact in a non-linear manner such thatthe amplitude of the circadian process increases insleep-deprived individuals (McCauley et al., 2013). Athird process adjusts the set point of the homeostatic pro-cess in response to long-term sleep/wake history. The bio-mathematical model is sensitive to fatigue due to totalsleep deprivation, circadian misalignment during shiftwork, and sustained sleep restriction (Fig. 3).5
Integration
We integrated the biomathematical model of fatigue withthe diffusion model of the PVT. Ratcliff and Van Dongen(2011) showed that the dynamic changes in the responsetime distribution on the PVT across 36 h of total sleepdeprivation were captured by varying the drift ratio V/η.Furthermore, they found a high correlation between thefitted values of V/η and the output of an earlier versionof the biomathematical model of fatigue (McCauley et al.,2009). We captured this dynamic by fixing η across ses-sions and treating V as a linear function of the predictionsof the biomathematical model of fatigue, F:
V ¼ aV F þ bV ; ð5Þwhere aV and bV represent slope and intercept. When theslope term aV is negative, drift rate decreases with fatigue,producing longer and more variable response times.
Dynamic changes in false starts could result from tem-poral changes in the decision criterion, A, or in the decayrate of the LCA process, λ. Ratcliff and Van Dongen
.10 .15 .20 .25 .300.0
0.2
0.4
0.6
0.8
1.0
Criterion (A)
Pro
po
rtio
no
fF
alse
Sta
rts
Decay = .00 (Time Constant = inf)
Decay = .01 (Time Constant = 497 msec)
Decay = .02 (Time Constant = 248 msec)
Decay = .03 (Time Constant = 164 msec)
Fig. 2 Proportion of false starts in simulations as a function of leakycompeting accumulator model (LCA) decay rate, λ, and diffusionmodel decision criterion, A. The gray band shows the range of theproportion of false starts committed by participants during the third dayof total sleep deprivation (see Experiment 1 below)
3 Taking the square root of τ ensures that v meaningfully corresponds to driftrate in the continuous diffusionmodel and in a way not dependent on time-stepsize in its discrete approximation (Tuerlinckx et al., 2001).4 For related expressions, see Goldman et al. (2009) and Usher andMcClelland (2001).
5 For a complete description of the model and its equations, see Table 1 ofMcCauley et al. (2013). A DOS executable of the model is available at https://pounce.spokane.wsu.edu/data/public/9d87c1
1790 Psychon Bull Rev (2017) 24:1785–1807
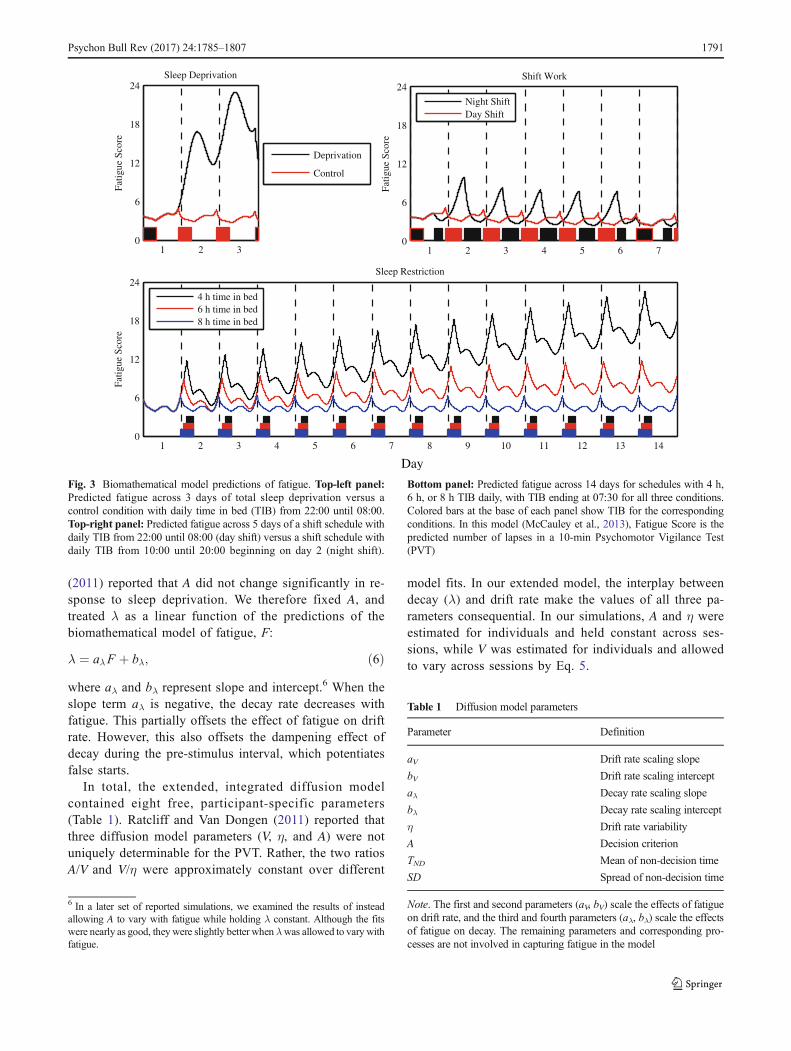
(2011) reported that A did not change significantly in re-sponse to sleep deprivation. We therefore fixed A, andtreated λ as a linear function of the predictions of thebiomathematical model of fatigue, F:
λ ¼ aλF þ bλ; ð6Þwhere aλ and bλ represent slope and intercept.6 When theslope term aλ is negative, the decay rate decreases withfatigue. This partially offsets the effect of fatigue on driftrate. However, this also offsets the dampening effect ofdecay during the pre-stimulus interval, which potentiatesfalse starts.
In total, the extended, integrated diffusion modelcontained eight free, participant-specific parameters(Table 1). Ratcliff and Van Dongen (2011) reported thatthree diffusion model parameters (V, η, and A) were notuniquely determinable for the PVT. Rather, the two ratiosA/V and V/η were approximately constant over different
model fits. In our extended model, the interplay betweendecay (λ) and drift rate make the values of all three pa-rameters consequential. In our simulations, A and η wereestimated for individuals and held constant across ses-sions, while V was estimated for individuals and allowedto vary across sessions by Eq. 5.
6 In a later set of reported simulations, we examined the results of insteadallowing A to vary with fatigue while holding λ constant. Although the fitswere nearly as good, they were slightly better when λwas allowed to vary withfatigue.
Table 1 Diffusion model parameters
Parameter Definition
aV Drift rate scaling slope
bV Drift rate scaling intercept
aλ Decay rate scaling slope
bλ Decay rate scaling intercept
η Drift rate variability
A Decision criterion
TND Mean of non-decision time
SD Spread of non-decision time
Note. The first and second parameters (aV, bV) scale the effects of fatigueon drift rate, and the third and fourth parameters (aλ, bλ) scale the effectsof fatigue on decay. The remaining parameters and corresponding pro-cesses are not involved in capturing fatigue in the model
1 2 30
6
12
18
24
Fatig
ueSc
ore
Sleep Deprivation
Deprivation
Control
1 2 3 4 5 6 70
6
12
18
24
Fat
igue
Scor
e
Shift Work
Night ShiftDay Shift
1 2 3 4 5 6 7 8 9 10 11 12 13 140
6
12
18
24
Fati
gue
Sco
re
Sleep Restriction
4 h time in bed6 h time in bed8 h time in bed
Day
Fig. 3 Biomathematical model predictions of fatigue. Top-left panel:Predicted fatigue across 3 days of total sleep deprivation versus acontrol condition with daily time in bed (TIB) from 22:00 until 08:00.Top-right panel: Predicted fatigue across 5 days of a shift schedule withdaily TIB from 22:00 until 08:00 (day shift) versus a shift schedule withdaily TIB from 10:00 until 20:00 beginning on day 2 (night shift).
Bottom panel: Predicted fatigue across 14 days for schedules with 4 h,6 h, or 8 h TIB daily, with TIB ending at 07:30 for all three conditions.Colored bars at the base of each panel show TIB for the correspondingconditions. In this model (McCauley et al., 2013), Fatigue Score is thepredicted number of lapses in a 10-min Psychomotor Vigilance Test(PVT)
Psychon Bull Rev (2017) 24:1785–1807 1791

Adaptive Control of Thought – Rational (ACT-R)
The cognitive architecture ACT-R (Anderson, 2007) containsa set of specialized information processing modules (Fig. 4).These include a visual module for locating and identifyingobjects in the visual field, a manual module for producingmotor responses, a declarative module for storing and retriev-ing information in memory, an imaginal module for holdingcurrent problem representations, a goal module for maintain-ing information about context and intent, and a proceduralmodule for coordinating other modules’ behavior. Buffers al-low information and commands to pass from the specializedinformation processing modules to the central proceduralmodule and back.
In ACT-R, procedural knowledge is represented in the formof production rules. Each rule has a set of conditions that mustbe met for it to be selected, and a set of actions that modify theexternal world and the internal state of the architecture. Eachrule also has real-valued utility, corresponding to the rewardthe rule is expected to lead to with respect to task performanceand completion. Cognitive performance unfolds across a se-quence of production cycles lasting on the order of tens ofmilliseconds. During each cycle, conditions for different pro-ductions are compared against the contents of the buffers, andthe production with the highest utility is selected and enacted.The resulting state of the world and architecture, representedby the contents of the buffers, serves as the starting point forthe next production cycle.
ACT-R has been used to model cognitive performanceon dozens of laboratory tasks (see Anderson, 2007) and to
simulate complex skills such as air traffic control, algebraproblem solving, and driving (Anderson et al., 2004;Salvucci, 2006). In the context of fatigue research, ACT-Rhas been applied to dual-tasking (Gunzelmann et al.,2009b), arithmetic retrieval (Gunzelmann et al., 2012),driving (Gunzelmann et al., 2011), flying (Gunzelmann &Gluck, 2009), and the PVT (Gunzelmann et al., 2009a).Like the diffusion model, ACT-R is particularly suitablefor studying the effects of fatigue on the PVT because itpredicts complete response time distributions, and becauseits parameters can be manipulated to produce continuousperformance decrements due to fatigue.
Task model
Gunzelmann et al. (2009a) developed an ACT-R model of thePVT. The model contains four productions: (1) wait for thestimulus to appear, (2) attend to the stimulus, (3) respond, and(4) press key. Each production is eligible for selection in cer-tain conditions.Wait is eligible when nothing is present on thescreen, attend is eligible when the stimulus is present on thescreen but has not yet been attended, respond is eligible whenthe stimulus is present on the screen and has been attended,and press key is always eligible. Thus, during each productioncycle a choice is made between one of the first three produc-tions, and the press key production. Logistically distributednoise is added to production utilities (Ui),
U0i ¼ Ui þ εi; ð7Þ
Declarative Module(Prefrontal Cortex)
Goal Module(Anterior Cingulate)
Imaginal Module(Parietal Cortex)
Procedural Module(Caudate Nucleus)
Visual Module(Fusiform Gyrus)
Manual Module(Motor Cortex)
External World
Visual Buffer
Goal Buffer
Declarative Buffer
Imaginal Buffer
Manual Buffer
Fig. 4 Schematic representation of the modules and buffers of the Adaptive Control of Thought – Rational (ACT-R) cognitive architecture and theirassociations with brain regions
1792 Psychon Bull Rev (2017) 24:1785–1807
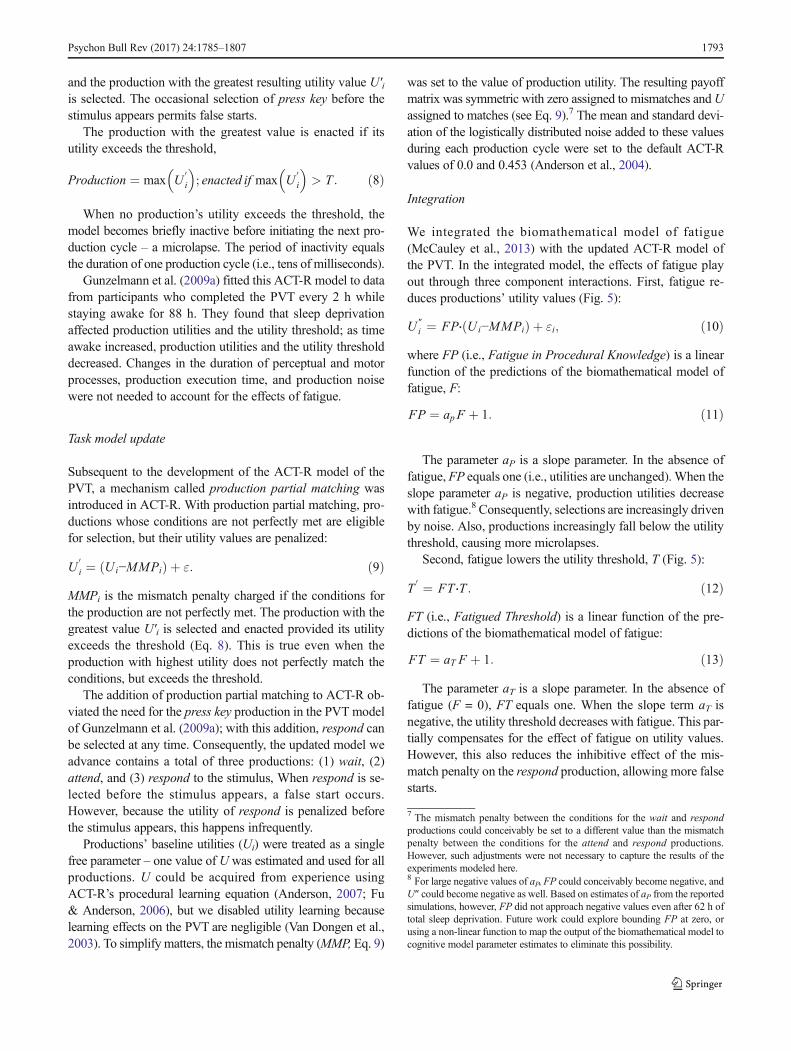
and the production with the greatest resulting utility value U′iis selected. The occasional selection of press key before thestimulus appears permits false starts.
The production with the greatest value is enacted if itsutility exceeds the threshold,
Production ¼ max U0i
� �; enacted if max U
0i
� �> T : ð8Þ
When no production’s utility exceeds the threshold, themodel becomes briefly inactive before initiating the next pro-duction cycle – a microlapse. The period of inactivity equalsthe duration of one production cycle (i.e., tens of milliseconds).
Gunzelmann et al. (2009a) fitted this ACT-R model to datafrom participants who completed the PVT every 2 h whilestaying awake for 88 h. They found that sleep deprivationaffected production utilities and the utility threshold; as timeawake increased, production utilities and the utility thresholddecreased. Changes in the duration of perceptual and motorprocesses, production execution time, and production noisewere not needed to account for the effects of fatigue.
Task model update
Subsequent to the development of the ACT-R model of thePVT, a mechanism called production partial matching wasintroduced in ACT-R. With production partial matching, pro-ductions whose conditions are not perfectly met are eligiblefor selection, but their utility values are penalized:
U0i ¼ Ui−MMPið Þ þ ε: ð9Þ
MMPi is the mismatch penalty charged if the conditions forthe production are not perfectly met. The production with thegreatest value U′i is selected and enacted provided its utilityexceeds the threshold (Eq. 8). This is true even when theproduction with highest utility does not perfectly match theconditions, but exceeds the threshold.
The addition of production partial matching to ACT-R ob-viated the need for the press key production in the PVT modelof Gunzelmann et al. (2009a); with this addition, respond canbe selected at any time. Consequently, the updated model weadvance contains a total of three productions: (1) wait, (2)attend, and (3) respond to the stimulus, When respond is se-lected before the stimulus appears, a false start occurs.However, because the utility of respond is penalized beforethe stimulus appears, this happens infrequently.
Productions’ baseline utilities (Ui) were treated as a singlefree parameter – one value of U was estimated and used for allproductions. U could be acquired from experience usingACT-R’s procedural learning equation (Anderson, 2007; Fu& Anderson, 2006), but we disabled utility learning becauselearning effects on the PVT are negligible (Van Dongen et al.,2003). To simplify matters, the mismatch penalty (MMP, Eq. 9)
was set to the value of production utility. The resulting payoffmatrix was symmetric with zero assigned to mismatches andUassigned to matches (see Eq. 9).7 The mean and standard devi-ation of the logistically distributed noise added to these valuesduring each production cycle were set to the default ACT-Rvalues of 0.0 and 0.453 (Anderson et al., 2004).
Integration
We integrated the biomathematical model of fatigue(McCauley et al., 2013) with the updated ACT-R model ofthe PVT. In the integrated model, the effects of fatigue playout through three component interactions. First, fatigue re-duces productions’ utility values (Fig. 5):
U ″i ¼ FP⋅ Ui−MMPið Þ þ εi; ð10Þ
where FP (i.e., Fatigue in Procedural Knowledge) is a linearfunction of the predictions of the biomathematical model offatigue, F:
FP ¼ apF þ 1: ð11Þ
The parameter aP is a slope parameter. In the absence offatigue, FP equals one (i.e., utilities are unchanged). When theslope parameter aP is negative, production utilities decreasewith fatigue.8 Consequently, selections are increasingly drivenby noise. Also, productions increasingly fall below the utilitythreshold, causing more microlapses.
Second, fatigue lowers the utility threshold, T (Fig. 5):
T0 ¼ FT ⋅T : ð12Þ
FT (i.e., Fatigued Threshold) is a linear function of the pre-dictions of the biomathematical model of fatigue:
FT ¼ aT F þ 1: ð13Þ
The parameter aT is a slope parameter. In the absence offatigue (F = 0), FT equals one. When the slope term aT isnegative, the utility threshold decreases with fatigue. This par-tially compensates for the effect of fatigue on utility values.However, this also reduces the inhibitive effect of the mis-match penalty on the respond production, allowing more falsestarts.
7 The mismatch penalty between the conditions for the wait and respondproductions could conceivably be set to a different value than the mismatchpenalty between the conditions for the attend and respond productions.However, such adjustments were not necessary to capture the results of theexperiments modeled here.8 For large negative values of aP, FP could conceivably become negative, andU″ could become negative as well. Based on estimates of aP from the reportedsimulations, however, FP did not approach negative values even after 62 h oftotal sleep deprivation. Future work could explore bounding FP at zero, orusing a non-linear function to map the output of the biomathematical model tocognitive model parameter estimates to eliminate this possibility.
Psychon Bull Rev (2017) 24:1785–1807 1793
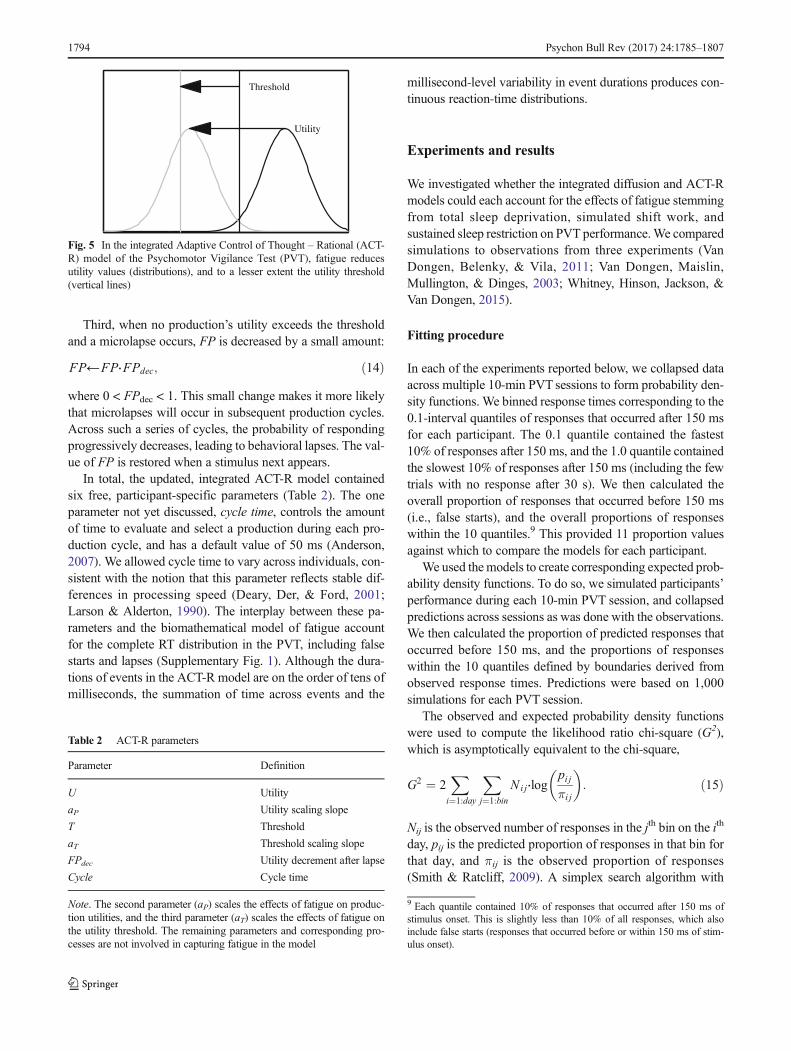
Third, when no production’s utility exceeds the thresholdand a microlapse occurs, FP is decreased by a small amount:
FP←FP⋅FPdec; ð14Þwhere 0 < FPdec < 1. This small change makes it more likelythat microlapses will occur in subsequent production cycles.Across such a series of cycles, the probability of respondingprogressively decreases, leading to behavioral lapses. The val-ue of FP is restored when a stimulus next appears.
In total, the updated, integrated ACT-R model containedsix free, participant-specific parameters (Table 2). The oneparameter not yet discussed, cycle time, controls the amountof time to evaluate and select a production during each pro-duction cycle, and has a default value of 50 ms (Anderson,2007). We allowed cycle time to vary across individuals, con-sistent with the notion that this parameter reflects stable dif-ferences in processing speed (Deary, Der, & Ford, 2001;Larson & Alderton, 1990). The interplay between these pa-rameters and the biomathematical model of fatigue accountfor the complete RT distribution in the PVT, including falsestarts and lapses (Supplementary Fig. 1). Although the dura-tions of events in the ACT-R model are on the order of tens ofmilliseconds, the summation of time across events and the
millisecond-level variability in event durations produces con-tinuous reaction-time distributions.
Experiments and results
We investigated whether the integrated diffusion and ACT-Rmodels could each account for the effects of fatigue stemmingfrom total sleep deprivation, simulated shift work, andsustained sleep restriction on PVT performance.We comparedsimulations to observations from three experiments (VanDongen, Belenky, & Vila, 2011; Van Dongen, Maislin,Mullington, & Dinges, 2003; Whitney, Hinson, Jackson, &Van Dongen, 2015).
Fitting procedure
In each of the experiments reported below, we collapsed dataacross multiple 10-min PVT sessions to form probability den-sity functions. We binned response times corresponding to the0.1-interval quantiles of responses that occurred after 150 msfor each participant. The 0.1 quantile contained the fastest10% of responses after 150 ms, and the 1.0 quantile containedthe slowest 10% of responses after 150 ms (including the fewtrials with no response after 30 s). We then calculated theoverall proportion of responses that occurred before 150 ms(i.e., false starts), and the overall proportions of responseswithin the 10 quantiles.9 This provided 11 proportion valuesagainst which to compare the models for each participant.
We used the models to create corresponding expected prob-ability density functions. To do so, we simulated participants’performance during each 10-min PVT session, and collapsedpredictions across sessions as was done with the observations.We then calculated the proportion of predicted responses thatoccurred before 150 ms, and the proportions of responseswithin the 10 quantiles defined by boundaries derived fromobserved response times. Predictions were based on 1,000simulations for each PVT session.
The observed and expected probability density functionswere used to compute the likelihood ratio chi-square (G2),which is asymptotically equivalent to the chi-square,
G2 ¼ 2Xi¼1:day
Xj¼1:bin
N i j⋅logpi jπi j
� �: ð15Þ
Nij is the observed number of responses in the jth bin on the ith
day, pij is the predicted proportion of responses in that bin forthat day, and πij is the observed proportion of responses(Smith & Ratcliff, 2009). A simplex search algorithm with
Table 2 ACT-R parameters
Parameter Definition
U Utility
aP Utility scaling slope
T Threshold
aT Threshold scaling slope
FPdec Utility decrement after lapse
Cycle Cycle time
Note. The second parameter (aP) scales the effects of fatigue on produc-tion utilities, and the third parameter (aT) scales the effects of fatigue onthe utility threshold. The remaining parameters and corresponding pro-cesses are not involved in capturing fatigue in the model
9 Each quantile contained 10% of responses that occurred after 150 ms ofstimulus onset. This is slightly less than 10% of all responses, which alsoinclude false starts (responses that occurred before or within 150 ms of stim-ulus onset).
Utility
Threshold
Fig. 5 In the integrated Adaptive Control of Thought – Rational (ACT-R) model of the Psychomotor Vigilance Test (PVT), fatigue reducesutility values (distributions), and to a lesser extent the utility threshold(vertical lines)
1794 Psychon Bull Rev (2017) 24:1785–1807
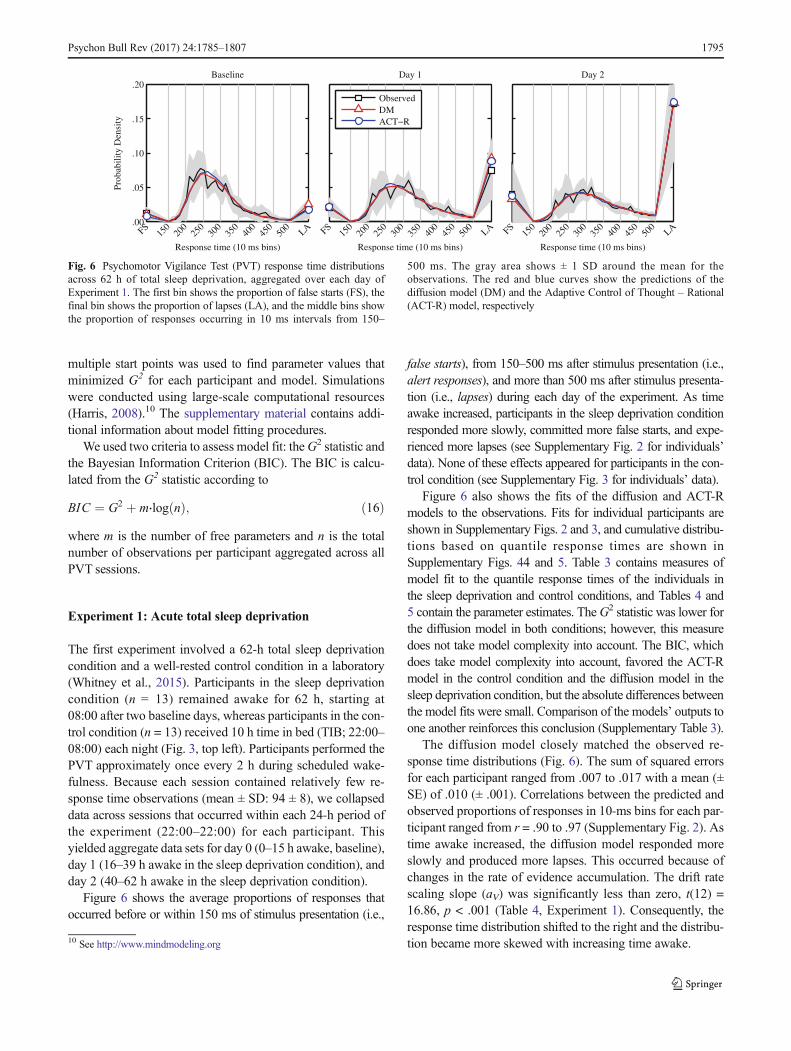
multiple start points was used to find parameter values thatminimized G2 for each participant and model. Simulationswere conducted using large-scale computational resources(Harris, 2008).10 The supplementary material contains addi-tional information about model fitting procedures.
We used two criteria to assess model fit: theG2 statistic andthe Bayesian Information Criterion (BIC). The BIC is calcu-lated from the G2 statistic according to
BIC ¼ G2 þ m⋅log nð Þ; ð16Þwhere m is the number of free parameters and n is the totalnumber of observations per participant aggregated across allPVT sessions.
Experiment 1: Acute total sleep deprivation
The first experiment involved a 62-h total sleep deprivationcondition and a well-rested control condition in a laboratory(Whitney et al., 2015). Participants in the sleep deprivationcondition (n = 13) remained awake for 62 h, starting at08:00 after two baseline days, whereas participants in the con-trol condition (n = 13) received 10 h time in bed (TIB; 22:00–08:00) each night (Fig. 3, top left). Participants performed thePVT approximately once every 2 h during scheduled wake-fulness. Because each session contained relatively few re-sponse time observations (mean ± SD: 94 ± 8), we collapseddata across sessions that occurred within each 24-h period ofthe experiment (22:00–22:00) for each participant. Thisyielded aggregate data sets for day 0 (0–15 h awake, baseline),day 1 (16–39 h awake in the sleep deprivation condition), andday 2 (40–62 h awake in the sleep deprivation condition).
Figure 6 shows the average proportions of responses thatoccurred before or within 150 ms of stimulus presentation (i.e.,
false starts), from 150–500 ms after stimulus presentation (i.e.,alert responses), and more than 500 ms after stimulus presenta-tion (i.e., lapses) during each day of the experiment. As timeawake increased, participants in the sleep deprivation conditionresponded more slowly, committed more false starts, and expe-rienced more lapses (see Supplementary Fig. 2 for individuals’data). None of these effects appeared for participants in the con-trol condition (see Supplementary Fig. 3 for individuals’ data).
Figure 6 also shows the fits of the diffusion and ACT-Rmodels to the observations. Fits for individual participants areshown in Supplementary Figs. 2 and 3, and cumulative distribu-tions based on quantile response times are shown inSupplementary Figs. 44 and 5. Table 3 contains measures ofmodel fit to the quantile response times of the individuals inthe sleep deprivation and control conditions, and Tables 4 and5 contain the parameter estimates. TheG2 statistic was lower forthe diffusion model in both conditions; however, this measuredoes not take model complexity into account. The BIC, whichdoes take model complexity into account, favored the ACT-Rmodel in the control condition and the diffusion model in thesleep deprivation condition, but the absolute differences betweenthe model fits were small. Comparison of the models’ outputs toone another reinforces this conclusion (Supplementary Table 3).
The diffusion model closely matched the observed re-sponse time distributions (Fig. 6). The sum of squared errorsfor each participant ranged from .007 to .017 with a mean (±SE) of .010 (± .001). Correlations between the predicted andobserved proportions of responses in 10-ms bins for each par-ticipant ranged from r = .90 to .97 (Supplementary Fig. 2). Astime awake increased, the diffusion model responded moreslowly and produced more lapses. This occurred because ofchanges in the rate of evidence accumulation. The drift ratescaling slope (aV) was significantly less than zero, t(12) =16.86, p < .001 (Table 4, Experiment 1). Consequently, theresponse time distribution shifted to the right and the distribu-tion became more skewed with increasing time awake.10 See http://www.mindmodeling.org
Baseline Day 1
ObservedDMACT−R
Day 2
FS15
020
025
030
035
040
045
050
0LA
Response time (10 ms bins)
FS15
020
025
030
035
040
045
050
0LA
Response time (10 ms bins)
FS15
020
025
030
035
040
045
050
0LA
Response time (10 ms bins)
.00
.05
.10
.15
.20
Prob
abili
tyD
ensi
ty
Fig. 6 Psychomotor Vigilance Test (PVT) response time distributionsacross 62 h of total sleep deprivation, aggregated over each day ofExperiment 1. The first bin shows the proportion of false starts (FS), thefinal bin shows the proportion of lapses (LA), and the middle bins showthe proportion of responses occurring in 10 ms intervals from 150–
500 ms. The gray area shows ± 1 SD around the mean for theobservations. The red and blue curves show the predictions of thediffusion model (DM) and the Adaptive Control of Thought – Rational(ACT-R) model, respectively
Psychon Bull Rev (2017) 24:1785–1807 1795
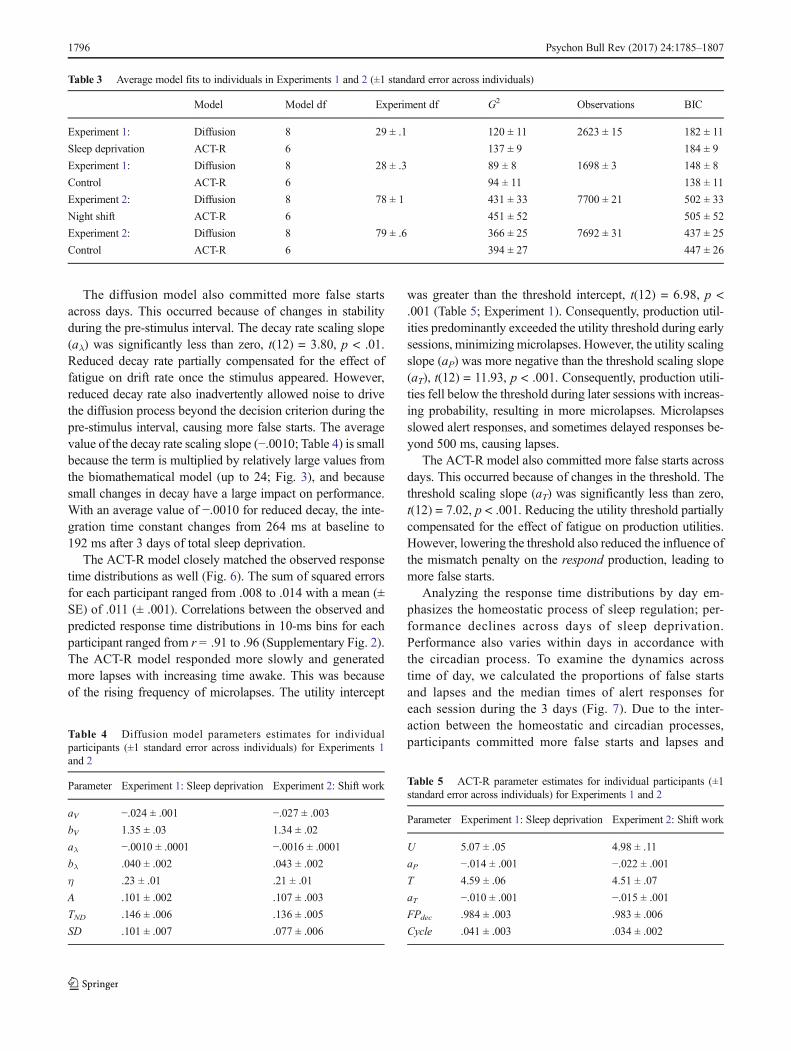
The diffusion model also committed more false startsacross days. This occurred because of changes in stabilityduring the pre-stimulus interval. The decay rate scaling slope(aλ) was significantly less than zero, t(12) = 3.80, p < .01.Reduced decay rate partially compensated for the effect offatigue on drift rate once the stimulus appeared. However,reduced decay rate also inadvertently allowed noise to drivethe diffusion process beyond the decision criterion during thepre-stimulus interval, causing more false starts. The averagevalue of the decay rate scaling slope (−.0010; Table 4) is smallbecause the term is multiplied by relatively large values fromthe biomathematical model (up to 24; Fig. 3), and becausesmall changes in decay have a large impact on performance.With an average value of −.0010 for reduced decay, the inte-gration time constant changes from 264 ms at baseline to192 ms after 3 days of total sleep deprivation.
The ACT-R model closely matched the observed responsetime distributions as well (Fig. 6). The sum of squared errorsfor each participant ranged from .008 to .014 with a mean (±SE) of .011 (± .001). Correlations between the observed andpredicted response time distributions in 10-ms bins for eachparticipant ranged from r = .91 to .96 (Supplementary Fig. 2).The ACT-R model responded more slowly and generatedmore lapses with increasing time awake. This was becauseof the rising frequency of microlapses. The utility intercept
was greater than the threshold intercept, t(12) = 6.98, p <.001 (Table 5; Experiment 1). Consequently, production util-ities predominantly exceeded the utility threshold during earlysessions, minimizingmicrolapses. However, the utility scalingslope (aP) was more negative than the threshold scaling slope(aT), t(12) = 11.93, p < .001. Consequently, production utili-ties fell below the threshold during later sessions with increas-ing probability, resulting in more microlapses. Microlapsesslowed alert responses, and sometimes delayed responses be-yond 500 ms, causing lapses.
The ACT-R model also committed more false starts acrossdays. This occurred because of changes in the threshold. Thethreshold scaling slope (aT) was significantly less than zero,t(12) = 7.02, p < .001. Reducing the utility threshold partiallycompensated for the effect of fatigue on production utilities.However, lowering the threshold also reduced the influence ofthe mismatch penalty on the respond production, leading tomore false starts.
Analyzing the response time distributions by day em-phasizes the homeostatic process of sleep regulation; per-formance declines across days of sleep deprivation.Performance also varies within days in accordance withthe circadian process. To examine the dynamics acrosstime of day, we calculated the proportions of false startsand lapses and the median times of alert responses foreach session during the 3 days (Fig. 7). Due to the inter-action between the homeostatic and circadian processes,participants committed more false starts and lapses and
Table 3 Average model fits to individuals in Experiments 1 and 2 (±1 standard error across individuals)
Model Model df Experiment df G2 Observations BIC
Experiment 1: Diffusion 8 29 ± .1 120 ± 11 2623 ± 15 182 ± 11
Sleep deprivation ACT-R 6 137 ± 9 184 ± 9
Experiment 1: Diffusion 8 28 ± .3 89 ± 8 1698 ± 3 148 ± 8
Control ACT-R 6 94 ± 11 138 ± 11
Experiment 2: Diffusion 8 78 ± 1 431 ± 33 7700 ± 21 502 ± 33
Night shift ACT-R 6 451 ± 52 505 ± 52
Experiment 2: Diffusion 8 79 ± .6 366 ± 25 7692 ± 31 437 ± 25
Control ACT-R 6 394 ± 27 447 ± 26
Table 4 Diffusion model parameters estimates for individualparticipants (±1 standard error across individuals) for Experiments 1and 2
Parameter Experiment 1: Sleep deprivation Experiment 2: Shift work
aV −.024 ± .001 −.027 ± .003
bV 1.35 ± .03 1.34 ± .02
aλ −.0010 ± .0001 −.0016 ± .0001
bλ .040 ± .002 .043 ± .002
η .23 ± .01 .21 ± .01
A .101 ± .002 .107 ± .003
TND .146 ± .006 .136 ± .005
SD .101 ± .007 .077 ± .006
Table 5 ACT-R parameter estimates for individual participants (±1standard error across individuals) for Experiments 1 and 2
Parameter Experiment 1: Sleep deprivation Experiment 2: Shift work
U 5.07 ± .05 4.98 ± .11
aP −.014 ± .001 −.022 ± .001
T 4.59 ± .06 4.51 ± .07
aT −.010 ± .001 −.015 ± .001
FPdec .984 ± .003 .983 ± .006
Cycle .041 ± .003 .034 ± .002
1796 Psychon Bull Rev (2017) 24:1785–1807

they responded more slowly during the early morninghours. As instantiated in the biomathematical model ofMcCauley et al. (2013), the circadian process interactednonlinearly with the homeostatic process, such thattime-of-day effects were greater in the sleep deprivationcondition than in the control condition.
The diffusion and ACT-R models reproduced the effects ofthe circadian process and its interaction with the homeostaticprocess. Fits to the proportion of false starts (diffusion model:r = .92 ACT-R: r = .92), lapses (diffusion model: r = .91;ACT-R: r = .91) and median response times (diffusion model:r = .95; ACT-R: r = .95) were close to the observations forboth models.
Experiment 2: Simulated night shift work
Night shift work is associated with increased fatigue and def-icits in cognitive performance due to circadian misalignment(Åkerstedt, 1988; Van Dongen, 2006). The second experimentwe modeled involved a simulated night shift condition and acontrol condition in a laboratory (Van Dongen et al., 2011c).
Participants in the night shift condition (n = 13) completedtwo 5-day night-time duty cycles with duty time spanningfrom 20:00 until 10:00 (Fig. 3, top right). The two duty cycleswere separated by a 34-h break from the primary task of driv-ing a high-fidelity driving simulator.11 The 34-h break includ-ed a 5-h nap opportunity from 10:00 until 15:00, a night ofsleep from 22:00 until 08:00, and another 5-h nap opportunityfrom 15:00 until 20:00. Participants in the control condition (n= 14) completed two 5-day daytime duty cycles with dutytime spanning from 08:00 until 22:00. The two duty cycleswere separated by a 34-h break from the primary task of driv-ing as well, but the sleep schedule was unaltered.
Participants performed the PVT eight times per duty day.Because each session contained relatively few observations(mean ± SD: 96 ± 1), we combined data from sessions thatoccurred at the same time of day across duty days and dutycycles. In the control condition, sessions occurred at 09:05,
Fig. 7 Proportion of false starts (top panel), proportion of lapses(middle panel), and median times of alert responses (bottom panel)for each session in Experiment 1. Filled shapes correspond to the 62-h
total sleep deprivation condition; open shapes correspond to the controlcondition (for which there was no testing during the nights). Error barsindicate ± 1 standard error
11 Figure 3 only shows the output of the biomathematical model through thefirst duty cycle and break. The output for the second duty cycle is nearlyidentical.
Psychon Bull Rev (2017) 24:1785–1807 1797
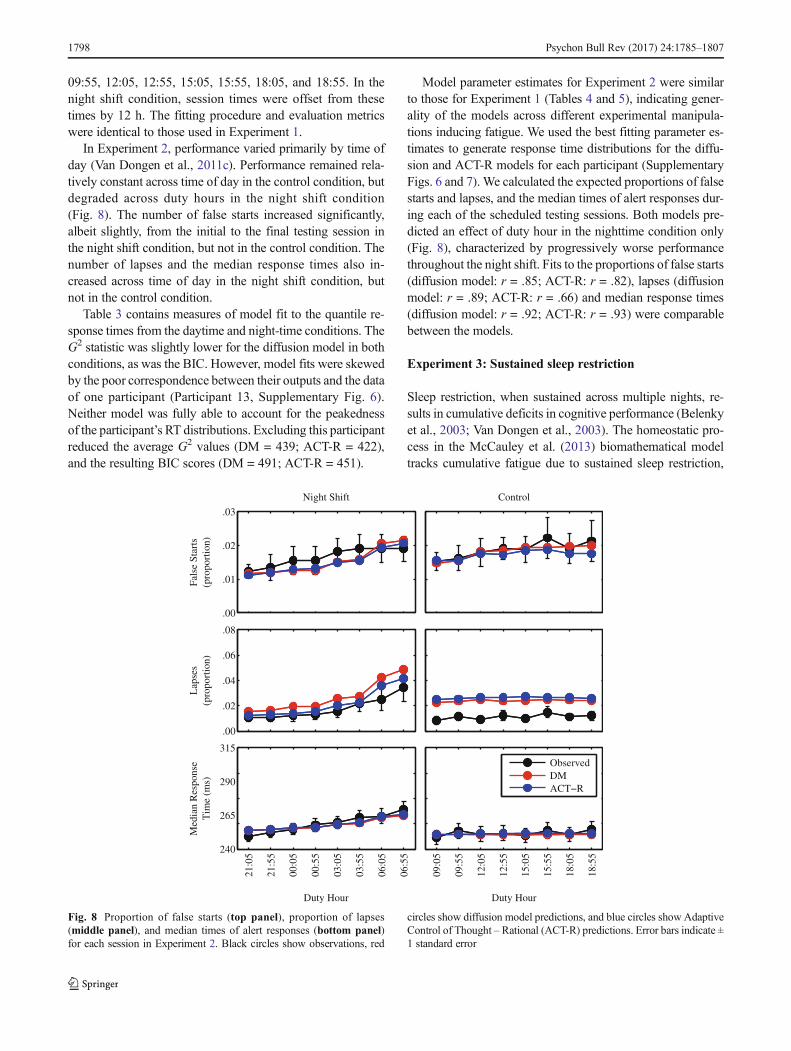
09:55, 12:05, 12:55, 15:05, 15:55, 18:05, and 18:55. In thenight shift condition, session times were offset from thesetimes by 12 h. The fitting procedure and evaluation metricswere identical to those used in Experiment 1.
In Experiment 2, performance varied primarily by time ofday (Van Dongen et al., 2011c). Performance remained rela-tively constant across time of day in the control condition, butdegraded across duty hours in the night shift condition(Fig. 8). The number of false starts increased significantly,albeit slightly, from the initial to the final testing session inthe night shift condition, but not in the control condition. Thenumber of lapses and the median response times also in-creased across time of day in the night shift condition, butnot in the control condition.
Table 3 contains measures of model fit to the quantile re-sponse times from the daytime and night-time conditions. TheG2 statistic was slightly lower for the diffusion model in bothconditions, as was the BIC. However, model fits were skewedby the poor correspondence between their outputs and the dataof one participant (Participant 13, Supplementary Fig. 6).Neither model was fully able to account for the peakednessof the participant’s RT distributions. Excluding this participantreduced the average G2 values (DM = 439; ACT-R = 422),and the resulting BIC scores (DM = 491; ACT-R = 451).
Model parameter estimates for Experiment 2 were similarto those for Experiment 1 (Tables 4 and 5), indicating gener-ality of the models across different experimental manipula-tions inducing fatigue. We used the best fitting parameter es-timates to generate response time distributions for the diffu-sion and ACT-R models for each participant (SupplementaryFigs. 6 and 7). We calculated the expected proportions of falsestarts and lapses, and the median times of alert responses dur-ing each of the scheduled testing sessions. Both models pre-dicted an effect of duty hour in the nighttime condition only(Fig. 8), characterized by progressively worse performancethroughout the night shift. Fits to the proportions of false starts(diffusion model: r = .85; ACT-R: r = .82), lapses (diffusionmodel: r = .89; ACT-R: r = .66) and median response times(diffusion model: r = .92; ACT-R: r = .93) were comparablebetween the models.
Experiment 3: Sustained sleep restriction
Sleep restriction, when sustained across multiple nights, re-sults in cumulative deficits in cognitive performance (Belenkyet al., 2003; Van Dongen et al., 2003). The homeostatic pro-cess in the McCauley et al. (2013) biomathematical modeltracks cumulative fatigue due to sustained sleep restriction,
ObservedDMACT−R
21:0
5
21:5
5
00:0
5
00:5
5
03:0
5
03:5
5
06:0
5
06:5
5
Duty Hour
Night Shift
09:0
5
09:5
5
12:0
5
12:5
5
15:0
5
15:5
5
18:0
5
18:5
5
Duty Hour
Control
Fals
e St
arts
(pro
port
ion)
.00
.01
.02
.03
Lap
ses
(pro
port
ion)
.00
.02
.04
.06
.08
Med
ian
Res
pons
eT
ime
(ms)
240
265
290
315
Fig. 8 Proportion of false starts (top panel), proportion of lapses(middle panel), and median times of alert responses (bottom panel)for each session in Experiment 2. Black circles show observations, red
circles show diffusion model predictions, and blue circles show AdaptiveControl of Thought – Rational (ACT-R) predictions. Error bars indicate ±1 standard error
1798 Psychon Bull Rev (2017) 24:1785–1807

and can thus capture the resulting deficits. The third experi-ment we modeled involved restricting sleep to 4, 6, or 8 h TIBeach night over 14 days (Van Dongen et al., 2003). The ex-periment began after 3 days of baseline adaptation, and con-tinued for 14 consecutive days (Fig. 3, bottom).
To examine whether the integrated diffusion and ACT-Rmodels extend to sustained sleep restriction, we generatedpredictions using the parameter sets recovered from the totalsleep deprivation condition of Experiment 1. We followed thisapproach because the published data on sustained sleep re-striction only included the number of lapses, which was notadequate to fit the model. We collapsed predictions acrossPVT sessions that occurred within each 24-h period ofExperiment 3, and computed the expected proportions of falsestarts and lapses, and the median response times, for the threeexperiment conditions (Fig. 9). In agreement with the resultsfrom Van Dongen et al. (2003), both models predicteddose-dependent, mounting impairment across days for partic-ipants in the 4- and 6-h conditions, but not for participants inthe 8-h condition (see also Belenky et al., 2003).
Alternate parameterizations
In the preceding sections, we considered theoretically-constrained parameterizations of each model. The model fitsprovided evidence that allowing two parameters (v and λ in
the diffusion model and Utility and Threshold in the ACT-Rmodel) to vary with fatigue was sufficient to capture the ef-fects of fatigue on PVT performance. We next examinedwhether these parameterizations were adequate by fitting var-iants of the diffusion and ACT-R models where each param-eter was allowed to vary alone with fatigue, or all combina-tions of two parameters were allowed to vary with fatigue.
For this purpose we used the data from the sleep depriva-tion condition of Experiment 1, where the effects of fatiguewere most substantial. We fitted 21 versions of the diffusionmodel (six where one parameter varied and 15 where all com-binations of two parameters varied) and 11 versions of theACT-R model (four where one parameter varied and sevenwhere all combinations of two parameters varied). We com-pared fits among diffusion model variants and ACT-R modelvariants using BIC scores calculated from the G2 values(Supplementary Tables 4 and 5).
Of the diffusion models, the best fitting variant was theone used in the previous sections, in which drift rate anddecay varied with fatigue (BIC = 182). Other variants thatperformed well included ones where fatigue affected driftrate alone (BIC = 190), drift rate and drift rate variability(BIC = 191), and drift rate and decision criterion (BIC =193). Of the ACT-R models, the best fitting variant wasthe one used in the previous sections as well, in whichutility and threshold varied with fatigue (BIC = 184). All
4 h TIB6 h TIB8 h TIB
1 2 3 4 5 6 7 8 9 10 11 12 13 14
Day
Diffusion Model
1 2 3 4 5 6 7 8 9 10 11 12 13 14
Day
ACT−R
Fals
e St
arts
(pro
port
ion)
.00
.02
.04
.06
.08
Lap
ses
(pro
port
ion)
.00
.06
.12
.18
.24
Med
ian
Res
pons
eT
ime
(ms)
265
280
295
310
325
Fig. 9 Proportion of false starts (top panel), proportion of lapses (middle panel), and median time of alert responses (bottom panel) for each day inExperiment 3
Psychon Bull Rev (2017) 24:1785–1807 1799
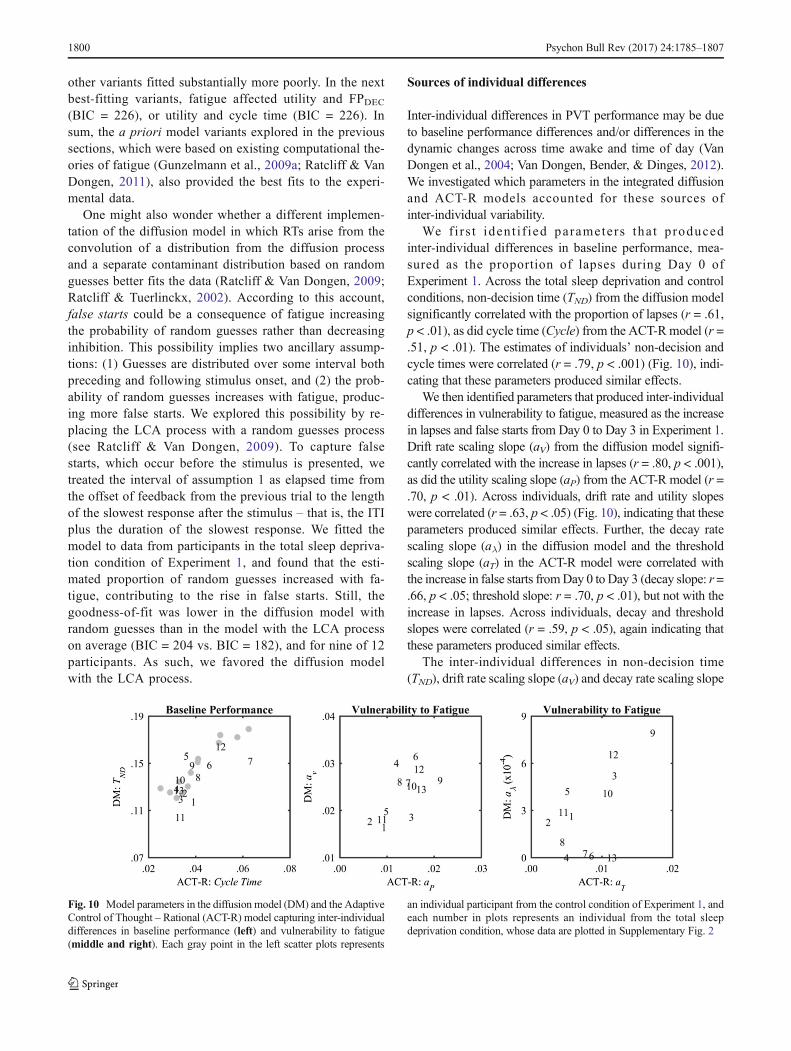
other variants fitted substantially more poorly. In the nextbest-fitting variants, fatigue affected utility and FPDEC(BIC = 226), or utility and cycle time (BIC = 226). Insum, the a priori model variants explored in the previoussections, which were based on existing computational the-ories of fatigue (Gunzelmann et al., 2009a; Ratcliff & VanDongen, 2011), also provided the best fits to the experi-mental data.
One might also wonder whether a different implemen-tation of the diffusion model in which RTs arise from theconvolution of a distribution from the diffusion processand a separate contaminant distribution based on randomguesses better fits the data (Ratcliff & Van Dongen, 2009;Ratcliff & Tuerlinckx, 2002). According to this account,false starts could be a consequence of fatigue increasingthe probability of random guesses rather than decreasinginhibition. This possibility implies two ancillary assump-tions: (1) Guesses are distributed over some interval bothpreceding and following stimulus onset, and (2) the prob-ability of random guesses increases with fatigue, produc-ing more false starts. We explored this possibility by re-placing the LCA process with a random guesses process(see Ratcliff & Van Dongen, 2009). To capture falsestarts, which occur before the stimulus is presented, wetreated the interval of assumption 1 as elapsed time fromthe offset of feedback from the previous trial to the lengthof the slowest response after the stimulus – that is, the ITIplus the duration of the slowest response. We fitted themodel to data from participants in the total sleep depriva-tion condition of Experiment 1, and found that the esti-mated proportion of random guesses increased with fa-tigue, contributing to the rise in false starts. Still, thegoodness-of-fit was lower in the diffusion model withrandom guesses than in the model with the LCA processon average (BIC = 204 vs. BIC = 182), and for nine of 12participants. As such, we favored the diffusion modelwith the LCA process.
Sources of individual differences
Inter-individual differences in PVT performance may be dueto baseline performance differences and/or differences in thedynamic changes across time awake and time of day (VanDongen et al., 2004; Van Dongen, Bender, & Dinges, 2012).We investigated which parameters in the integrated diffusionand ACT-R models accounted for these sources ofinter-individual variability.
We f i r s t iden t i f ied parameters tha t producedinter-individual differences in baseline performance, mea-sured as the proportion of lapses during Day 0 ofExperiment 1. Across the total sleep deprivation and controlconditions, non-decision time (TND) from the diffusion modelsignificantly correlated with the proportion of lapses (r = .61,p < .01), as did cycle time (Cycle) from the ACT-R model (r =.51, p < .01). The estimates of individuals’ non-decision andcycle times were correlated (r = .79, p < .001) (Fig. 10), indi-cating that these parameters produced similar effects.
We then identified parameters that produced inter-individualdifferences in vulnerability to fatigue, measured as the increasein lapses and false starts from Day 0 to Day 3 in Experiment 1.Drift rate scaling slope (aV) from the diffusion model signifi-cantly correlated with the increase in lapses (r = .80, p < .001),as did the utility scaling slope (aP) from the ACT-R model (r =.70, p < .01). Across individuals, drift rate and utility slopeswere correlated (r = .63, p < .05) (Fig. 10), indicating that theseparameters produced similar effects. Further, the decay ratescaling slope (aλ) in the diffusion model and the thresholdscaling slope (aT) in the ACT-R model were correlated withthe increase in false starts fromDay 0 to Day 3 (decay slope: r =.66, p < .05; threshold slope: r = .70, p < .01), but not with theincrease in lapses. Across individuals, decay and thresholdslopes were correlated (r = .59, p < .05), again indicating thatthese parameters produced similar effects.
The inter-individual differences in non-decision time(TND), drift rate scaling slope (aV) and decay rate scaling slope
Fig. 10 Model parameters in the diffusion model (DM) and the AdaptiveControl of Thought – Rational (ACT-R) model capturing inter-individualdifferences in baseline performance (left) and vulnerability to fatigue(middle and right). Each gray point in the left scatter plots represents
an individual participant from the control condition of Experiment 1, andeach number in plots represents an individual from the total sleepdeprivation condition, whose data are plotted in Supplementary Fig. 2
1800 Psychon Bull Rev (2017) 24:1785–1807

(aλ) of the diffusion model were all moderately interrelated(TND vs. aV: r = .45; TND vs. aλ: r = .05; aV vs. aλ: r = .17). Theindividual differences in cycle time (Cycle), utility scalingslope (aP) and threshold scaling slope (aT) of the ACT-Rmod-el were also moderately interrelated, with the exception of aPand aT, which were strongly interrelated (Cycle vs. aP: r = .52;Cycle vs. aT: r = .42; aP vs. aT: r = .92).
Taken together, these observations suggest that individualdifferences in baseline performance are fundamentally distinctfrom individual differences in vulnerability to performanceimpairment from sleep loss (Van Dongen et al., 2004).12 Therelatively weak interrelationships among the individual sub-jects’ diffusion model parameters also suggest that individualdifferences in degradation of the decision process (after stim-ulus presentation) and degradation of inhibition (before stim-ulus presentation) during sleep deprivation are distinct, whichmay be indicative of different mechanistic pathways. Thiswould not seem to be confirmed by the ACT-R model, inwhich individual differences in degradation of the decisionprocess and degradation of inhibition are highly correlated.However, strong interrelationships between individual differ-ences in parameter estimates may also be caused by intrinsiccorrelation among the parameter estimates in the modelfitting. An experimental manipulation of the PVT that delib-erately dissociates the decision process from the inhibitionprocess will be needed to resolve this issue.
Discussion
Fatigue from sleep loss degrades cognitive performance. Theeffects of fatigue are especially pronounced for tasks that in-volve sustained attention, such as the PVT (for others, see e.g.,Killgore, 2010). The PVT is commonly used in sleep researchbecause of its high sensitivity to fatigue from sleep loss andcircadian rhythms. This sensitivity suggests that understand-ing the mechanisms associated with performance degradationon the PVT may provide insight regarding the impact of sleeploss and circadian rhythms on cognition more generally.
We used two computational cognitive models to study howfatigue affects cognitive performance: the first is based on thediffusion model (Ratcliff & Van Dongen, 2011), and the sec-ond on ACT-R (Gunzelmann et al., 2009a). We integratedeach cognitive model with a biomathematical model of fatigue(McCauley et al., 2013). We then investigated the perfor-mance of the integrated models across three PVT experimentsthat measured the effects of fatigue arising from total sleepdeprivation, simulated shift work, and sustained sleep restric-tion. The integrated diffusion and ACT-R models reproduced
three key phenomena in the PVT under conditions of fatigue:increased lapses, increased false starts, and slower alert re-sponses. The two models were also able to account for thecomplete response time distribution in detail.
We did not reject either model; that was neither the aim norwere we prompted by our findings to do so. Both modelsprovided excellent fits to a wide range of empirical data.They involve fundamentally different levels of abstraction,but we found that they account for the effects of fatigue insurprisingly equivalent ways. This result may have broaderimplications than would rejecting either model. Juxtaposingthe two models and examining why they produce such similaroutcomes despite their substantive differences is informativeboth theoretically and from an applied computational point ofview.
Mechanistic effects of fatigue
That the same biomathematical model was used to inducefatigue in the diffusion and ACT-R models did not mean,prima facie, that the two integrated accounts would yield con-verging results. Each account’s predictions emerged from in-teractions among (1) the biomathematical model, (2) the cog-nitive processing mechanisms instantiated in the accounts,and (3) the manner in which fatigue impacted these mecha-nisms. Thus, although using different biomathematicalmodels would produce varying results, using the same modeldoes not guarantee convergence. This further depends on howfatigue impacted processing mechanisms in each account, aswe discuss next.
With regard to their theoretical basis, the diffusion andACT-R models are quite distinct. The diffusion model is de-void of specifics about the performance task at hand. Theonset of a stimulus drives the continuous accumulation ofevidence toward a decision criterion. The ACT-R model, incontrast, contains a set of cognitive processes thought to beinvolved in performing a given task. The onset of a stimulusalters which processes occur and in what order.
The diffusion and ACT-R models are also quite distinct interms of their computational implementations. The modelsdiffer in whether they treat the decision to respond as a unitaryor repeated event. Decision time in the diffusion model isdetermined by the duration of the diffusion process, which isimplemented as one ongoing process. Slow responses arisefrom low values of the drift rate, which prolong decision time.In contrast, decision time in the ACT-R model corresponds toaggregate time across multiple, short-duration production cy-cles preceding selection of the attend and respond produc-tions. The duration of one production cycle is relatively brief(between 30 and 50 ms, Table 5). But because a productioncan be enacted only when its value exceeds the utility thresh-old, many production cycles may occur before the model re-sponds. Slow responses arise from reduced utility values,
12 Even so, it has been reported that baseline diffusion model drift rate can beused to predict PVT performance during total sleep deprivation (Patanaiket al., 2015).
Psychon Bull Rev (2017) 24:1785–1807 1801

which tend to cause microlapses and thereby increase thenumber of production cycles.
Related to this, the diffusion and ACT-R models differ inwhether they treat evidence accumulation as continuous ordiscrete. In the diffusion model, a response is initiated whenaccumulated evidence exceeds the decision criterion. If a re-sponse has not yet occurred and drift rate is positive, the prob-ability of responding increases over time. In the ACT-R mod-el, a response is initiated when the utility value of the respondproduction exceeds that of all other productions and the utilitythreshold. If a response has not yet occurred and the state hasnot changed, the probability of responding during the nextproduction cycle essentially remains the same (Eq. 10).
Against the backdrop of these differences, the accountscapture the detrimental effects of fatigue through two essen-tially identical component interactions (Table 6). First, in bothmodels, fatigue reduces the signal-to-noise ratio in the deci-sion process, albeit in computationally different ways. In thediffusion model, the signal-to-noise ratio in the decision pro-cess is reduced because of the decreasing mean drift ratio,which nominally corresponds to the signal-to-noise ratio inthe evidence accumulation process (Ratcliff & Van Dongen,2011). In ACT-R, the signal-to-noise ratio in the decision pro-cess is reduced because of the decreasing production utilitiesrelative to the utility threshold. In both models, dynamic de-creases in the signal-to-noise ratio produce increasinglyskewed response time distributions with longer right tails.
Second, in both models, fatigue reduces response inhibi-tion – the ability to suppress actions that are inappropriate inthe current context and that interfere with goal-driven behav-ior (Mostofsky & Simmonds, 2008) – but again in computa-tionally different ways. In the diffusion model, the reductionin response inhibition arises from the decreasing decay rate inthe LCA component. As decay decreases, so too does thesuppression of responses prior to stimulus onset. In ACT-R,the reduction in response inhibition arises from the decreasingutility threshold. This allows actions that were previously sup-pressed on the basis of their low utility to be enacted. In bothmodels, dynamic changes to response inhibition partiallycompensate for the primary effect of fatigue and increase theprobability that a response will eventually be made after thestimulus appears. These changes also cause more responses tooccur before the stimulus appears.
The sufficiency of these two mechanisms in accounting forthe effects of fatigue on cognitive performance is shown byour simulations of experiments involving total sleep depriva-tion, circadian misalignment, and sleep restriction (see above,Experiments 1, 2, and 3). The necessity of the two mecha-nisms is corroborated by our exploration of alternate modelvariants (see above, Alternate parameterizations ). Allowingonly a single parameter or any other combination of two pa-rameters in each model to vary with fatigue reduced the good-ness of fit. It is also noteworthy that the relationship between
how the models implemented fatigue, evident at the grouplevel, held at the level of individual participants. The positivecorrelations between parameter values in the two modelsacross individuals (drift rate slope and utility slope; decayslope and threshold slope) provide further evidence for equiv-alent effects in the two modeling frameworks.
The ACT-R model can be thought of as approximating adiscrete diffusion process with 38-ms time steps τ (i.e., themean duration of a production cycle), a decision criterion of0:1
ffiffiffiτ
p, and a decay of 1.0.13 For all combinations of utility
and threshold in the ACT-R model, there is a correspondingdrift rate in the diffusion model that yields an identical proba-bility of the process terminating after one step (Fig. 11). As seenin the figure, decreasing utilitywith fatigue in the ACT-Rmodelhas the same effect as decreasing drift rate in the diffusionmodel, a point confirmed in an earlier model mimicry simula-tion study (Fisher, Walsh, Blaha, &Gunzelmann, 2015). This isnot to say that ACT-R is merely a special case of the diffusionmodel (or vice versa). The two approaches are motivated byentirely different considerations, and they are implemented incompletely different ways. Yet despite these differences, theconceptual relationship between utility and threshold in theACT-R model, and drift rate in the diffusion model underliestheir similar behavior with respect to the PVT.
There is also a relationship between threshold in theACT-R model and decay in the diffusion model. Decaydampens accumulated evidence, which arises from both signaland noise. When decay is low, the probability of noise drivingthe decision process beyond the decision criterion increases.Likewise, utilities in ACT-R reflect a production’s underlyingvalue in addition to noise (Eq. 7). When threshold is low, theprobability of noise causing a non-matching production toexceed the threshold increases.
Although the diffusion and ACT-R models describe themechanisms underlying PVT performance at different levelsof abstraction and in distinct ways, they capture the detrimen-tal effects of fatigue through essentially equivalent componentinteractions. The insight gained here from comparing thetwo modeling frameworks – that fatigue reduces thesignal-to-noise ratio in the decision process (after stimuluspresentation) as well as response inhibition (both before andafter stimulus presentation) during performance of the PVT –is a new finding.
Relationship to neuronal theories of fatigue
The substantial convergence between models helps to con-strain possibilities for the neuronal mechanisms underlyingthe effects of fatigue on PVT performance. The wide
13 Setting decay to 1.0 renders the process memoryless, and setting the deci-sion criterion to 0:1
ffiffiffiτ
pcauses the process to terminate immediately once
positive evidence is accumulated.
1802 Psychon Bull Rev (2017) 24:1785–1807
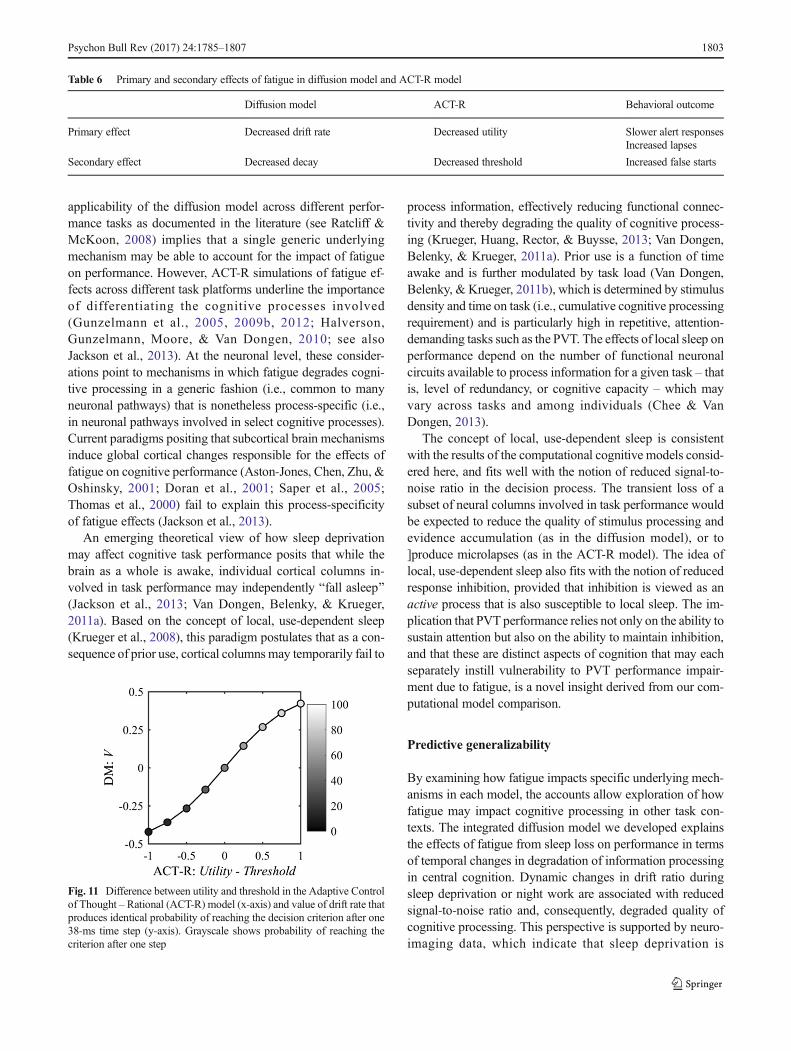
applicability of the diffusion model across different perfor-mance tasks as documented in the literature (see Ratcliff &McKoon, 2008) implies that a single generic underlyingmechanism may be able to account for the impact of fatigueon performance. However, ACT-R simulations of fatigue ef-fects across different task platforms underline the importanceof differentiating the cognitive processes involved(Gunzelmann et al., 2005, 2009b, 2012; Halverson,Gunzelmann, Moore, & Van Dongen, 2010; see alsoJackson et al., 2013). At the neuronal level, these consider-ations point to mechanisms in which fatigue degrades cogni-tive processing in a generic fashion (i.e., common to manyneuronal pathways) that is nonetheless process-specific (i.e.,in neuronal pathways involved in select cognitive processes).Current paradigms positing that subcortical brain mechanismsinduce global cortical changes responsible for the effects offatigue on cognitive performance (Aston-Jones, Chen, Zhu, &Oshinsky, 2001; Doran et al., 2001; Saper et al., 2005;Thomas et al., 2000) fail to explain this process-specificityof fatigue effects (Jackson et al., 2013).
An emerging theoretical view of how sleep deprivationmay affect cognitive task performance posits that while thebrain as a whole is awake, individual cortical columns in-volved in task performance may independently Bfall asleep^(Jackson et al., 2013; Van Dongen, Belenky, & Krueger,2011a). Based on the concept of local, use-dependent sleep(Krueger et al., 2008), this paradigm postulates that as a con-sequence of prior use, cortical columnsmay temporarily fail to
process information, effectively reducing functional connec-tivity and thereby degrading the quality of cognitive process-ing (Krueger, Huang, Rector, & Buysse, 2013; Van Dongen,Belenky, & Krueger, 2011a). Prior use is a function of timeawake and is further modulated by task load (Van Dongen,Belenky, & Krueger, 2011b), which is determined by stimulusdensity and time on task (i.e., cumulative cognitive processingrequirement) and is particularly high in repetitive, attention-demanding tasks such as the PVT. The effects of local sleep onperformance depend on the number of functional neuronalcircuits available to process information for a given task – thatis, level of redundancy, or cognitive capacity – which mayvary across tasks and among individuals (Chee & VanDongen, 2013).
The concept of local, use-dependent sleep is consistentwith the results of the computational cognitive models consid-ered here, and fits well with the notion of reduced signal-to-noise ratio in the decision process. The transient loss of asubset of neural columns involved in task performance wouldbe expected to reduce the quality of stimulus processing andevidence accumulation (as in the diffusion model), or to]produce microlapses (as in the ACT-R model). The idea oflocal, use-dependent sleep also fits with the notion of reducedresponse inhibition, provided that inhibition is viewed as anactive process that is also susceptible to local sleep. The im-plication that PVT performance relies not only on the ability tosustain attention but also on the ability to maintain inhibition,and that these are distinct aspects of cognition that may eachseparately instill vulnerability to PVT performance impair-ment due to fatigue, is a novel insight derived from our com-putational model comparison.
Predictive generalizability
By examining how fatigue impacts specific underlying mech-anisms in each model, the accounts allow exploration of howfatigue may impact cognitive processing in other task con-texts. The integrated diffusion model we developed explainsthe effects of fatigue from sleep loss on performance in termsof temporal changes in degradation of information processingin central cognition. Dynamic changes in drift ratio duringsleep deprivation or night work are associated with reducedsignal-to-noise ratio and, consequently, degraded quality ofcognitive processing. This perspective is supported by neuro-imaging data, which indicate that sleep deprivation is
Fig. 11 Difference between utility and threshold in the Adaptive Controlof Thought – Rational (ACT-R) model (x-axis) and value of drift rate thatproduces identical probability of reaching the decision criterion after one38-ms time step (y-axis). Grayscale shows probability of reaching thecriterion after one step
Table 6 Primary and secondary effects of fatigue in diffusion model and ACT-R model
Diffusion model ACT-R Behavioral outcome
Primary effect Decreased drift rate Decreased utility Slower alert responsesIncreased lapses
Secondary effect Decreased decay Decreased threshold Increased false starts
Psychon Bull Rev (2017) 24:1785–1807 1803

associated with a reduction in neuronal connectivity (Verweijet al., 2014) or available functional neuronal circuits, especial-ly those that are most intensively used for the task at hand(Chee & Asplund, 2013).
However, the integrated diffusion model does not elucidatewhich circuits are most intensively used during performanceof a given task. Thus, it is a priori unclear to what extent themodel’s predictions may generalize from one task to another.The integrated ACT-R model, on the other hand, is explicitregarding which aspects of cognition (i.e., ACT-R modules)are assumed to be involved in task performance, and howintensively. Furthermore, ACT-R modules have been linkedto specific brain regions (Borst & Anderson, 2013), suggest-ing which neuronal circuits may be involved in performanceof a given task. Most relevant for the PVT, production rulesare thought to be instantiated by networks involving basalganglia structures including the striatum, the pallidum, andthe thalamus (Anderson, 2007). The utility threshold and thecompensatory response to fatigue have been posited to beassociated with the thalamus (Gunzelmann et al., 2009a), assupported by findings of decreased thalamic activation duringsleep deprivation (Chee et al., 2008; Thomas et al., 2000).
As such, it is reasonable to assume that, while the a prioripredictive generalizability of the integrated diffusion model islimited to generic changes in scaled performance outcomesover time, the integrated ACT-R model could generalize tonovel tasks and contexts in terms of absolute performancepredictions (see Gunzelmann et al., 2015). Additionally, un-like the diffusion model, the scope of ACT-R extends beyondone- and two-alternative forced-choice tasks. As a first steptoward demonstrating these capabilities, we recently com-bined an ACT-R account of fatigue with validated ACT-Rmodels of multi-tasking and driving behavior to make a prioripredictions about the effects of extended wakefulness on taskperformance (Gunzelmann et al., 2009b; Gunzelmann et al.,2011; Khosroshahi, Salvucci, Veksler, & Gunzelmann, 2016).This is not to say the diffusionmodel cannot play an importantrole in simulations of complex tasks as well. For example, inthe driving domain, brake light detection can be modeled as asignal detection process. In this way, the diffusion model canbe used to simulate braking, one component of driving perfor-mance (Ratcliff & Strayer, 2014).
Integrated theories of cognition
Computational models have been applied to myriad topics incognitive science. Integrative and comparative approaches suchas those used here provide a pathway towards unification andthe development of a coherent whole (Newell, 1990). In thispaper, we integrated between cognitive capacities and a cogni-tive moderator, fatigue. To achieve this integration, we lever-aged existing cognitive computational models (Gunzelmannet al., 2009a; Ratcliff & Van Dongen, 2011) and a
biomathematical model of fatigue (McCauley et al., 2013).Such model reuse has been recommended as a practice to ac-celerate cognitive architecture research (see Gluck, 2010).
The constituent models had previously been validated inisolation, and many of the constraints that shaped their devel-opment, though typically unrelated to the PVT, limited thenumber of assumptions we needed to make in order to createan account of the effects of fatigue on PVT performance.Integrating existing models thus allowed us to reduce the dan-ger of the irrelevant-specification problem (Newell, 1990) –that is, needing to make a large number of under-constraineddesign decisions to allow the simulation to run.
Rather than adding new knowledge to the cognitive com-putational models (i.e., constructing new agents) to captureperformance under conditions of fatigue, we used the samecomputational cognitive models and adjusted the settings ofarchitectural parameters. Others have used this approach. Forexample, Ritter et al. (2007) adjusted the values of declarativememory and motor parameters to simulate the effects of caf-feine and anxiety on serial subtraction performance. Likewise,published accounts of arousal capture the effects of fatigue bymanipulating aspects of ACT-R’s utility calculation(Belavkin, 2001; Jongman, 1998; Gonzalez, Best, Healy,Kole, & Bourne, 2011). Our approach goes a step further bylinking parameter values with an underlying physiologicalaccount – the effects of fatigue on architectural parametersvary continuously over time and in the manner specified bya validated biomathematical model (McCauley et al., 2013).In doing so, the cumulative models get Bfurther down the list^(Newell, 1990, p. 16) of areas to be covered by a unifiedtheory of cognition.
The practice of implementing moderators by directlyadjusting parameter values, though suitable for studying fa-tigue in isolation, may prove to be impractical for studying thecombined effects of multiple moderators. One promising di-rection for future work is to integrate physiological models ofthe body –models that represent the combined effects of mul-tiple moderators – with cognitive architectures (Dancy, Ritter,Berry, & Klein, 2015). A similar approach has been used tomodel the combined and often conflicting effects of emotionssuch as fear, anger, sadness, and happiness on architecturalparameters (Hudlicka, 2007).
Integration is a potentially fruitful approach for leveragingmultiple non-overlapping models. This was the case for thediffusion and ACT-Rmodels, and the biomathematical model.However, the diffusion model and the ACT-R model accountfor the same decision process. When such a Bzone ofcontention^ exists, the typical approach is to try to falsifyone of the models (McClelland, 2009). In this regard, ourresults do not point to a clear victor. At the same time, themodels share an underlying theoretical interpretation, empha-sizing the complementary rather than contradictory nature oftheir mechanisms (see also, Lebiere, Gonzalez, & Warwick,
1804 Psychon Bull Rev (2017) 24:1785–1807

2009). Because both theories have utility in advancing ourunderstanding of the mechanisms of fatigue, we chose to focuson their shared perspective rather than their individual limita-tions. Only by determining how to best account for the effectsof fatigue on PVT performance using both modeling formal-isms did we recognized their theoretical correspondence.
Conclusion
The adverse effects of fatigue from sleep loss on cognitiveperformance are substantial, yet most computational modelsof performance do not include fatigue as a cognitive modera-tor. We leveraged existing models to explore how fatigue fromsleep loss affects cognitive processes. Integrating a biomathe-matical model of fatigue with computational cognitive modelsproduced a more comprehensive account than either approachalone: the integrated diffusion and ACT-R models captured indetail how fatigue impairs psychomotor vigilance perfor-mance. Juxtaposition of the integrated models, which provideaccounts of cognitive performance at fundamentally differentlevels of abstraction, revealed a surprisingly consistent pictureof how fatigue affects central cognition during PVT perfor-mance: (1) by reducing the signal-to-noise ratio in decisionprocesses, and (2) by reducing response inhibition. Further, byconsidering response inhibition as an active process, both ofthese effects can be seen as arising from the loss of processingresources due to local sleep. These findings advance our the-oretical understanding of fatigue and illustrate the synergy thatcan be achieved by comparing computational cognitivemodeling at different levels of abstraction, focusing not onlyon how they differ, but also on how and why they converge.
Acknowledgments The views expressed in this paper are those of theauthors and do not reflect the official policy or position of the Departmentof Defense or the US Government. This research was performed whileMatthew Walsh held a National Research Council ResearchAssociateship Award with the Air Force Research Laboratory’sCognitive Models and Agents Branch. Data collection was supportedby NIH grant R01HL105768, FAA award DTFAAC-11-A-00003, andFMCSA contract DTMC75-07-D-00006. Hans Van Dongen was sup-ported by CDMRP grant W81XWH-16-1-0319. The authors thankChristopher Fisher and Christopher Myers for their extremely construc-tive comments on earlier versions of this paper.
References
Abbott, L. F. (1991). Firing rate models for neural populations. In O.Benhard, C. Bosio, P. Guidice, & E. Tabet (Eds.), Neural networks:From biology to high energy physics (pp. 179–196). Pisa, Italy: ETSEditrice.
Åkerstedt, T. (1988). Sleepiness as a consequence of shift work. Sleep, 11,17–34.
Anderson, J. R. (2007). How can the human mind occur in the physicaluniverse. New York, NY: Oxford University Press.
Anderson, J. R., Bothell, D., Byrne, M. D., Douglass, S., Lebiere, C., &Qin, Y. (2004). An integrated theory of the mind. PsychologicalReview, 111, 1036–1060.
Aston-Jones, G., Chen, S., Zhu, Y., & Oshinsky, M. L. (2001). A neuralcircuit for circadian regulation of arousal. Nature Neuroscience, 4,732–738.
Basner, M., & Dinges, D. F. (2011). Maximizing sensitivity of the psy-chomotor vigilance test (PVT) to sleep loss. Sleep, 34, 581–591.
Basner, M., Mollicone, D., & Dinges, D. F. (2011). Validity and sensitiv-ity of a brief psychomotor vigilance test (PVT-B) to total and partialsleep deprivation. Acta Astronautica, 69, 949–959.
Belavkin, R. V. (2001). Modelling the inverted-U effect in ACT-R. In E.M. Altmann, A. Cleeremans, C. D. Schunn, & W. D. Gray (Eds.),Proceedings of the 4th International Conference on CognitiveModeling (pp. 275–276). Mahwah, NJ: Erlbaum.
Belenky, G., Wesensten, N. J., Thorne, D. R., Thomas,M. L., Sing, H. C.,Redmond, D. P., … Balkin, T. J. (2003). Patterns of performancedegradation and restoration during sleep restriction and subsequentrecovery: A sleep dose-response study. Journal of Sleep Research,12, 1-12
Borbély, A. A., & Achermann, P. (1999). Sleep homeostasis and modelsof sleep regulation. Journal of Biological Rhythms, 14, 557–568.
Borst, J. P., &Anderson, J. R. (2013). Usingmodel-based functionalMRIto locate working memory updates and declarative memory re-trievals in the fronto-parietal network. Proceedings of the NationalAcademy of Sciences of the USA, 110, 1628–1633.
Cain, N., & Shea-Brown, E. (2012). Computational models of decisionmaking: Integration, stability, and noise. Current Opinion inNeurobiology, 22, 1047–1053.
Chee, M.W. L., & Asplund, C. L. (2013). Neuroimaging of attention andalteration of processing capacity in sleep-deprived persons. In E.Nofzinger, P. Maquet, & M. J. Thorpy (Eds.), Neuroimaging ofSleep and Sleep Disorders (pp. 137–144). Cambridge, U.K.:Cambridge University Press.
Chee, M. W. L., Tan, J. C., Zheng, H., Parimal, S., Weissman, D. H.,Zagorodnov, V., & Dinges, D. F. (2008). Lapsing during sleep dep-rivation is associated with distributed changes in brain activation.The Journal of Neuroscience, 28, 5519–5528.
Chee, M. W. L., & Van Dongen, H. P. A. (2013). Functional imaging ofinter-individual differences in response to sleep deprivation. In E.Nofzinger, P. Maquet, & M. J. Thorpy (Eds.), Neuroimaging ofSleep and Sleep Disorders (pp. 154–162). Cambridge, U.K.:Cambridge University Press.
Dancy, C. L., Ritter, F. E., Berry, K. A., & Klein, L. C. (2015). Using acognitive architecture with a physiological substrate to representeffects of a psychological stressor on cognition. Computationaland Mathematical Organization Theory, 21, 90–114.
Deary, I. J., Der, G., & Ford, G. (2001). Reaction times and intelligencedifferences: A population-based cohort study. Intelligence, 29, 389–399.
Dinges, D. F. (1995). An overview of sleepiness and accidents. Journal ofSleep Research, 4, 4–14.
Dinges, D. F., & Powell, J. W. (1985). Microcomputer analyses of per-formance on a portable, simple visual RT task during sustainedoperations. Behavior Research Methods, Instruments, &Computers, 17, 652–655.
Doran, S. M., Van Dongen, H. P. A., & Dinges, D. F. (2001). Sustainedattention performance during sleep deprivation: Evidence of stateinstability.Archives of Italian Biology: Neuroscience, 139, 253–267.
Dorrian, J., Rogers, N. L., &Dinges, D. F. (2005). Psychomotor vigilanceperformance: Neurocognitive assay sensitive to sleep loss. In C.Kushida (Ed.), Sleep Deprivation. New York: Marcel Dekker.
Fisher, C. R., Walsh, M. M., Blaha, L. M., & Gunzelmann, G. (2015).ACT-R and LBAmodel mimicry reveals similarity across modelingformalisms. In D. Noelle et al. (Eds.), Proceedings of the 37th
Annual Cognitive Science Society Meeting (pp. 710–715). Austin,TX: Cognitive Science Society.
Psychon Bull Rev (2017) 24:1785–1807 1805

Fu, W. T., & Anderson, J. R. (2006). From recurrent choice to skilllearning: A reinforcement-learning model. Journal ofExperimental Psychology: General, 135, 184–206.
Gartenberg, D., Veksler, B., Gunzelmann, G., & Trafton, J. G. (2014). AnACT-R process model of the signal duration phenomenon of vigi-lance. In Proceedings of 58th annual meeting of the Human Factorsand Ergonomics Society.
Gluck, K. A. (2010). Cognitive architectures for human factors in avia-tion. In E. Salas & D. Maurino (Eds.), Human factors in aviation(2nd ed., pp. 375–400). New York: Elsevier.
Goldman, M. S., Compte, A., & Wang, Z.-J. (2009). Neural integratormodels. In L. R. Squire (Ed.), Encyclopedia of Neuroscience (pp.165–178). Oxford: Academic Press.
Gonzalez, C., Best, B., Healy, A. F., Kole, J. A., & Bourne, L. E. (2011).A cognitive modeling account of simultaneous learning and fatigueeffects. Cognitive Systems Research, 12, 19–32.
Gray, W. D. (Ed.)(2007). Integrated models of cognitive systems. NewYork: Oxford University Press.
Gunzelmann, G., Byrne, M. D., Gluck, K. A., & Moore, L. R. (2009).Using computational cognitive modeling to predict dual-task perfor-mance with sleep deprivation. Human Factors, 51, 251–260.
Gunzelmann, G., & Gluck, K. A. (2009). An Integrative approach tounderstanding and predicting the consequences of fatigue on cogni-tive performance. Cognitive Technology, 14, 14–25.
Gunzelmann, G., Gluck, K. A., Moore, L. R., & Dinges, D. F. (2012).Diminished access to declarative knowledge with sleep deprivation.Cognitive Systems Research, 13, 1–11.
Gunzelmann, G., Gluck, K. A., Van Dongen, H. P. A., O’Connor, R. M.,& Dinges, D. F. (2005). A neurobehaviorally inspired ACT-Rmodelof sleep deprivation: Decreased performance in psychomotor vigi-lance. In B. G. Bara, L. Barsalou, & M. Bucciarelli (Eds.),Proceedings of the 27th Annual Meeting of the Cognitive ScienceSociety (pp. 857–862). Mahwah, NJ: Lawrence ErlbaumAssociates.
Gunzelmann, G., Gross, J. B., Gluck, K. A., & Dinges, D. F. (2009). Sleepdeprivation and sustained attention performance. Integrating mathe-matical and cognitive modeling. Cognitive Science, 33, 880–910.
Gunzelmann, G., Moore, L. R., Salvucci, D. D., & Gluck, K. A. (2011).Sleep loss and driver performance: Quantitative predictions withzero free parameters. Cognitive Systems Research, 12, 154–163.
Gunzelmann, G., Veksler, B. Z., Walsh, M. M., & Gluck, K. A. (2015).Understanding and predicting the cognitive effects of sleep lossthrough simulation. Translational Issues in Psychological Science,1, 106–115.
Halverson, T., Gunzelmann, G., Moore, L. R., & Van Dongen, H. P. A.(2010). Modeling the effects of work shift on learning in a mentalorientation and rotation task. In D. D. Salvucci & G. Gunzelmann(Eds.), Proceedings of the 10th International Conference onCognitive Modeling (pp. 79–84). Philadelphia, PA: DrexelUniversity.
Harris, J. (2008). MindModeling@Home: A large-scale computationalcognitive modeling infrastructure. In Proceedings of the 6thAnnual Conference on Systems Engineering Research 2008 (pp.246-252). Los Angeles, CA.
Horne, J. A., & Wilkinson, S. (1985). Chronic sleep reduction: Daytimevigilance performance and EEG measures of sleepiness, with par-ticular reference to Bpractice^ effects. Psychophysiology, 22, 69–78.
Hudlicka, E. (2007). Reasons for emotions: Modeling emotions withintegrated cognitive systems. In W. D. Gray (Ed.), IntegratedModels of Cognitive Systems (pp. 263–278). New York: OxfordUniversity Press.
Hursh, S. R., Redmond, D. P., Johnson, M. L., Thorne, D. R., Belenky,G., Balkin, T. J.,… Eddy, D. R. (2004). Fatigue models for appliedresearch in warfighting. Aviation, Space, and EnvironmentalMedicine, 75, A44-A53.
Hursh, S. R., & Van Dongen, H. P. A. (2010). Fatigue and performancemodeling. In M. H. Kryger, T. Roth, & W. C. Dement (Eds.),
Principles and Practice of Sleep Medicine (5th ed., pp. 745–752).Elsevier Saunders: St. Louis, Missouri.
Jackson,M. L., Gunzelmann, G.,Whitney, P., Hinson, J.M., Belenky, G.,Rabat, A., & Van Dongen, H. P. A. (2013). Deconstructing andreconstructing cognitive performance in sleep deprivation. SleepMedicine Reviews, 17, 215–225.
Jackson, M. L., & Van Dongen, H. P. A. (2011). Cognitive effects ofsleepiness. In M. J. Thorpy & M. Billiard (Eds.), Sleepiness (pp.72–81). Cambridge, UK: Cambridge University Press.
Jongman, L. (1998). How to fatigue ACT-R? In Proceedings of theSecond European Conference on Cognitive Modelling (pp. 52–57). Nottingham, England: Nottingham University Press.
Khosroshahi, E. B., Salvucci, D. D., Veksler, B. Z., & Gunzelmann, G.(2016). Capturing the effects of moderate fatigue on driver perfor-mance. In Proceedings of the 14th International Conference onCognitive Modeling (pp. 163–168). University Park, PA: ThePennsylvania State University.
Killgore, W. D. (2010). Effects of sleep deprivation on cognition.Progress in Brain Research, 185, 105–129.
Kleitman, N. (1963). Deprivation of sleep. In N. Kleitman (Ed.), Sleepand Wakefulness (pp. 215–229). Chicago: University of ChicagoPress.
Krueger, J. M., Huang, Y. H., Rector, D. M., & Buysse, D. J. (2013).Sleep: A synchrony of cell activity-driven small network states.European Journal of Neuroscience, 38, 2199–2209.
Krueger, J. M., Rector, D. M., Roy, S., Van Dongen, H. P. A., Belenky,G., & Panksepp, J. (2008). Sleep as a fundamental property of neu-ronal assemblies. Nature Reviews Neuroscience, 9, 910–919.
Laming, D. R. J. (1968). Information theory of choice-reaction times.London: Academic Press.
Larson, G. E., & Alderton, D. L. (1990). Reaction time variability andintelligence: A ―worst performance‖ analysis of individual differ-ences. Intelligence, 14, 309–325.
Lebiere, C., Gonzalez, C., & Warwick, W. (2009). Convergence andconstraints revealed in a qualitative model comparison. Journal ofCognitive Engineering and Decision Making, 3, 131–155.
Lim, J., & Dinges, D. F. (2008). Sleep deprivation and vigilant attention.Annals of the New York Academy of Sciences, 1129, 305–322.
Lim, J., & Dinges, D. F. (2010). A meta-analysis of the impact of short-term sleep deprivation on cognitive variables. PsychologicalBulletin, 136, 375–389.
Mallis, M. M., Mejdal, S., Nguyen, T. T., & Dinges, D. F. (2004).Summary of the key features of seven biomathematical models ofhuman fatigue and performance. Aviation, Space, andEnvironmental Medicine, 75, A4–A14.
McCauley, P., Kalachev, L. V., Mollicone, D. J., Banks, S., Dinges, D. F.,& Van Dongen, H. P. A. (2013). Dynamic circadian modulation in abiomathematical model for the effects of sleep and sleep loss onwaking neurobehavioral performance. Sleep, 36, 1987–1997.
McCauley, P., Kalachev, L. V., Smith, A. D., Belenky, G., Dinges, D. F.,& Van Dongen, H. P. A. (2009). A new mathematical model for thehomeostatic effects of sleep loss on neurobehavioral performance.Journal of Theoretical Biology, 256, 227–239.
McClelland, J. L. (2009). The place of modeling in cognitive science.Topics in Cognitive Science, 1, 11–38.
Mostofsky, S. H., & Simmonds, D. J. (2008). Response inhibition andresponse selection: Two sides of the same coin. Journal of CognitiveNeuroscience, 5, 751–761.
Newell, A. (1990). Unified theories of cognition. Cambridge, MA:Cambridge University Press.
Ossmy, O., Moran, R., Pfeffer, T., Tsetsos, K., Usher, M., &Donner, T. H.(2013). The timescale of perceptual evidence integration can beadapted to the environment. Current Biology, 23, 981–986.
Patanaik, A., Kwoh, C. K., Chua, E. C., Gooley, J. J., & Chee, M. W.(2015). Classifying vulnerability to sleep deprivation using baselinemeasures of psychomotor vigilance. Sleep, 38, 723–734.
1806 Psychon Bull Rev (2017) 24:1785–1807

Patanaik, A., Zagorodnov, V., Kwoh, C. K., & Chee, M. W. L. (2014).Predicting vulnerability to sleep deprivation using diffusion modelparameters. Journal of Sleep Research, 23, 576–584.
Ratcliff, R. (2006). Modeling response signal and response time data.Cognitive Psychology, 53, 195–237.
Ratcliff, R., Gomez, P., & McKoon, G. (2004). Diffusion model accountof lexical decision. Psychological Review, 111, 159–182.
Ratcliff, R., &McKoon, G. (2008). The diffusion decisionmodel: Theoryand data for two-choice decision tasks. Neural Computation, 20,873–922.
Ratcliff, R., & Rouder, J. N. (2000). A diffusion model account ofmasking in letter identification. Journal of ExperimentalPsychology: Human Perception and Performance, 26, 127–140.
Ratcliff, R., & Strayer, D. (2014). Modeling simple driving tasks with aone-boundary diffusion model. Psychonomic Bulletin & Review, 21,577–589.
Ratcliff, R., & Tuerlinckx, F. (2002). Estimating parameters of thediffusion model: Approaches to dealing with contaminant reac-tion times and parameter variability. Psychonomic Bulletin &Review, 9, 438–481.
Ratcliff, R., & Van Dongen, H. P. A. (2009). Sleep deprivation affectsmultiple distinct cognitive processes. Psychonomic Bulletin &Review, 16, 742–751.
Ratcliff, R., & Van Dongen, H. P. A. (2011). Diffusion model for one-choice reaction-time tasks and the cognitive effects of sleep depri-vation. Proceedings of the National Academy of Sciences, 108,11285–11290.
Ratcliff, R., Van Zandt, T., & McKoon, G. (1999). Connectionist anddiffusion models of reaction time. Psychological Review, 106,261–300.
Ritter, F. E., Reifers, A. L., Klein, L. C., & Schoelles, M. J. (2007).Lessons from defining theories of stress. In W. D. Gray (Ed.),Integrated Models of Cognitive Systems (pp. 254–262). New York:Oxford University Press.
Robinson, D. A. (1989). Integrating with neurons. Annual Review ofNeuroscience, 12, 33–45.
Salvucci, D. D. (2006). Modeling driver behavior in a cognitive architec-ture. Human Factors, 48, 362–380.
Saper, C. B., Scammell, T. E., & Lu, J. (2005). Hypothalamic regulationof sleep and circadian rhythms. Nature, 437, 1257–1263.
Smith, P. L., & Ratcliff, R. (2009). An integrated theory of attention anddecision making in visual signal detection. Psychological Review,116, 283–317.
Stone, M. (1960). Models for choice reaction time. Psychometrika, 25,251–260.
Sun, R. (Ed.). (2008). Cambridge handbook of computationalpsychology. New York: Cambridge University Press.
Thomas, M., Sing, H., Belenky, G., Holcomb, H., Mayberg, H., Dannals,R.,… Redmond, D. (2000). Neural basis of alertness and cognitiveperformance impairments during sleepiness. I. Effects of 24 h ofsleep deprivation on waking human regional brain activity.Journal of Sleep Research, 9, 335-352.
Tucker, A. M., Whitney, P., Belenky, G., Hinson, J. M., & Van Dongen,H. P. A. (2010). Effects of sleep deprivation on dissociated compo-nents of executive functioning. Sleep, 33, 47–57.
Tuerlinckx, F., Maris, E., Ratcliff, R., & De Boeck, P. (2001). A compar-ison of four methods for simulating the diffusion process.Behavioral Research Methods, Instruments, & Computers, 33,443–456.
Usher, M., & McClelland, J. L. (2001). The time course of perceptualchoice: The leaky, competing accumulator model. PsychologicalReview, 108, 550–592.
Van Dongen, H. P. A. (2006). Shift work and inter-individual dif-ferences in sleep and sleepiness. Chronobiology International,23, 1139–1147.
Van Dongen, H. P. A., Baynard, M. D., Maislin, G., & Dinges, D. F.(2004). Systematic interindividual differences in neurobehavioralimpairment from sleep loss: Evidence of trait-like differential vul-nerability. Sleep, 27, 423–433.
Van Dongen, H. P. A., Belenky, G., & Krueger, J. M. (2011a). Alocal, bottom-up perspective on sleep deprivation and neurobe-havioral performance. Current Topics in Medicinal Chemistry,11, 2414–2422.
Van Dongen, H. P. A., Belenky, G., & Krueger, J. M. (2011b).Investigating the temporal dynamics and underlying mechanismsof cognitive fatigue. In P. L. Ackerman (Ed.), Cognitive Fatigue:Multidisciplinary Perspectives on Current Research and FutureApplications (pp. 127–147). Washington, D.C.: AmericanPsychological Association.
Van Dongen, H. P. A., Belenky, G., & Vila, B. J. (2011). The efficacy of arestart break for recycling with optimal performance depends criti-cally on circadian timing. Sleep, 34, 917–929.
Van Dongen, H. P. A., Bender, A.M., & Dinges, D. F. (2012). Systematicindividual differences in sleep homeostatic and circadian rhythmcontributions to neurobehavioral impairment during sleep depriva-tion. Accident Analysis and Prevention, 45S, 11–16.
Van Dongen, H. P. A., & Hursh, S. R. (2010). Fatigue, performance,errors and accidents. In M. H. Kryger, T. Roth, & W. C. Dement(Eds.), Principles and Practice of Sleep Medicine (5th ed., pp. 753–759). Philadelphia: Elsevier Saunders.
Van Dongen, H. P. A., Maislin, G., Mullington, J. M., & Dinges, D. F.(2003). The cumulative cost of additional wakefulness: Dose-response effects on neurobehavioral functions and sleep physiologyfrom chronic sleep restriction and total sleep deprivation. Sleep, 26,117–126.
Verweij, I. M., Romeijn, N., Smit, D. J., Piantoni, G., Van Someren, E. J.W., & van derWerf, Y. D. (2014). Sleep deprivation leads to a loss offunctional connectivity in frontal brain regions. BMC Neuroscience,15, 88.
Voss, A., Rothermund, K., & Voss, J. (2004). Interpreting the parametersof the diffusion model: An empirical validation. Memory &Cognition, 32, 1206–1220.
Whitney, P., & Hinson, J. M. (2010). Measurement of cognition in studiesof sleep deprivation. Progress in Brain Research, 185, 37–48.
Whitney, P., Hinson, J. M., Jackson, M. L., & Van Dongen, H. P. A.(2015). Feedback blunting: Total sleep deprivation impairs de-cision making that requires updating based on feedback. Sleep,38, 745–754.
Psychon Bull Rev (2017) 24:1785–1807 1807

CHAPTER
A dynamic attentionalcontrol framework forunderstanding sleepdeprivation effects oncognition
5Paul Whitneya,b,*, John M. Hinsona,b, Amy T. Nusbauma
aDepartment of Psychology, Washington State University, Pullman, WA, United StatesbSleep and Performance Research Center, Washington State University, Spokane, WA,
United States
*Corresponding author: Tel.: +1 509-335-3860, e-mail address: [email protected]
AbstractThe cognitive effects of sleep loss are often attributed to compromised functioning of the pre-
frontal cortex (PFC). However, compromised PFC functioning does not account for well-
known effects of sleep deprivation on vigilance. Furthermore, the executive attentional control
functions associated with the PFC show considerable variability in the effects of sleep depri-
vation. Evidence from neuroimaging suggests that sleep deprived people are sometimes able to
maintain performance on cognitive tasks by increasing PFC activation of task-relevant circuits
and by recruiting new circuits not typically involved in a particular cognitive operation. Still,
little is known about how such compensatory processes work on a functional level, or what
tradeoffs in processing they may entail. We propose a dynamic attentional control framework
to bridge the gap between the evidence on sleep deprived neural circuits and cognitive task
performance. We review evidence that shows that the pattern of preserved and compromised
task performance can be understood in terms of sleep deprivation’s influence on frontostriatal
circuitry such that the ability to maintain task-relevant information in the focus of attention is
relatively spared but the ability to update task-relevant information in response to changing
circumstances is more negatively affected. This framework helps account for why some tasks
are more affected by SD than others, and why individual differences in the effects of sleep
deprivation are task-specific.
KeywordsCognitive control, Cognitive flexibility, Individual differences, Dopamine, Gene polymor-
phisms, Cognitive impairment, Sleep loss
Progress in Brain Research, Volume 246, ISSN 0079-6123, https://doi.org/10.1016/bs.pbr.2019.03.015
© 2019 Elsevier B.V. All rights reserved.111

1 IntroductionThe impact of sleep deprivation (SD) on cognition is noteworthy not only because of
its ability to compromise performance, but also because of the variability of these
effects. Variability is manifest at two levels. First, some cognitive tasks are greatly
impaired by SD while others remain relatively unaffected (e.g., Killgore, 2010; Lim
and Dinges, 2010). Second, there are large individual differences in the extent to
which tasks are susceptible to impairment by sleep loss (Van Dongen et al.,
2004). Understanding both dimensions of the variability of SD effects is a challeng-
ing research problem, but one that is critical to efforts to mitigate the effects of
sleep loss, which can result in catastrophic errors particularly in round-the-clock,
high-pressure operational environments (e.g., Honn et al., 2018).
An apparent paradox has emerged from research on the task selectivity of SD
effects. Numerous investigators have argued that the prefrontal cortex (PFC) is
particularly vulnerable to sleep loss, and the executive attentional control functions
often considered to be the province of the PFC provide a potential way to account for
a wide range of operational errors (e.g., Harrison and Horne, 2000; Drummond et al.,
2000, 2004). However, while the PFC is highly engaged in our most complex and
sophisticated cognitive processes, several meta-analyses comparing the magnitude
of the effects of SD on cognitive tasks have found that more complex cognitive tasks
typically show less of an effect of SD than seemingly simple tasks that assess arousal
and vigilant attention (e.g., Lim and Dinges, 2010; Wickens et al., 2015).
Several general approaches suggest ways to resolve inconsistencies between the
PFC vulnerability hypothesis and the greater impact of SD on less complex tasks.
One suggestion is that SD has a large effect on simple, sustained attention and the
effects observed in more complex tasks are consequences of the downstream disrup-
tion of sustained attention (cf., Lim and Dinges, 2010; Ma et al., 2015). A second
suggestion is that the PFC vulnerability hypothesis is largely correct, but smaller
SD effects are observed on many complex tasks because these tasks are more arous-
ing and people engage in compensatory strategies to make their performance under
SD as resilient as possible (e.g., Drummond et al., 2004; Harrison and Horne, 2000).
From the compensatory processing perspective, the greater influence of SD on many
simple cognitive tasks stems from lower levels of arousal and higher level of
boredom engendered by such tasks. Of course, a third possibility is that SD has direct
and separate effects on both vigilance and PFC-related cognitive processing.
Our goal here is to review current evidence on PFC vulnerability to SD and its
effects on task performance and to offer a theoretical framework that holds promise
for organizing the relevant literature. Our framework suggests new approaches to
understanding both task variability and individual differences in susceptibility
to the effects of SD. We focus mainly on the effects of short-term, total SD because
the majority of relevant laboratory research uses a total SD manipulation. However,
concepts in this approach should be useful for synthesizing research on changes in
cognitive functions resulting from sleep restriction and circadian phase. Our theoret-
ical approach, a dynamic attentional control framework, draws on insights from both
112 CHAPTER 5 Dynamic attentional control and sleep deprivation

the PFC vulnerability hypothesis and the view that complex task performance can
break down as a function of the downstream effects of early attentional processes.
In addition, we integrate recent data on cognitive control and flexibility to provide
a better means of characterizing why some tasks are more affected by SD than
others and some reasons why this task variability is manifest differentially at
the individual level.
2 PFC functions and SDIn a review examining a broad range of complex tasks, Wickens et al. (2015) found
that total SD, sleep restriction, and performance during the circadian night all
impaired complex task performance, but these tasks were generally less degraded
than simple task performance. However, a major difficulty with interpreting the
finding that complex tasks generally have smaller SD effects than tests of simple
attention is that describing tasks as complex, or even as PFC-related tasks, is a very
coarse level of analysis. By their nature, tasks high in complexity depend on the
integration of multiple brain circuits and the coordination of multiple potentially
dissociable cognitive processes. Thus, it is unsurprising that data on the vulnerability
of complex tasks to SD present many inconsistencies. In this regard, while Lim and
Dinges (2010) showed that SD effects on complex tasks are generally smaller than
the effects on tests of vigilance and simple attention, their review also demonstrated
that the effect sizes in tasks of complex cognition varied substantially across studies
depending on the specific task used.
Can inconsistencies in the results on complex task performance be explained by
downstream effects of lapses of attention? It is likely that some declines in higher
level cognition during SD occur as a result of attentional lapses on the information
available for reasoning or complex judgments (cf., Lim and Dinges, 2010; Sturm and
Willmes, 2001). In addition, SD reduces activation in the salience network (medial
frontal cortex and insula), which is critical to attentional engagement of task critical
stimuli (Chen et al., 2016; Ma et al., 2015). However, there is convincing evidence
that disruption of early attentional processing is not the whole story. For example,
studies using tasks that require complex attentional control have shown large behav-
ioral effects of SD that are independent of sustained attention, as measured by the
PVT (Venkatraman et al., 2011; Whitney et al., 2015, 2017). In addition, neuroim-
aging data across a variety of cognitive tasks have shown that sleep loss alters
patterns of activation of the PFC and its connections to the parietal cortex (e.g.,
Chee et al., 2010; Drummond et al., 2000; Krause et al., 2017; Ma et al., 2015).
Processing in circuits that connect the frontal lobe regions to the basal ganglia,
i.e., the frontostriatal pathways, is of particular interest in attempts to understand
how SD affects cognition because several lines of neuroimaging evidence suggest
that these circuits are involved in compensatory efforts to maintain performance
under SD (e.g., Chuah et al., 2006; Drummond et al., 2004; Krause et al., 2017;
Nakashima et al., 2018; Schmidt, 2014). Similar claims have been made for
1132 PFC functions and SD
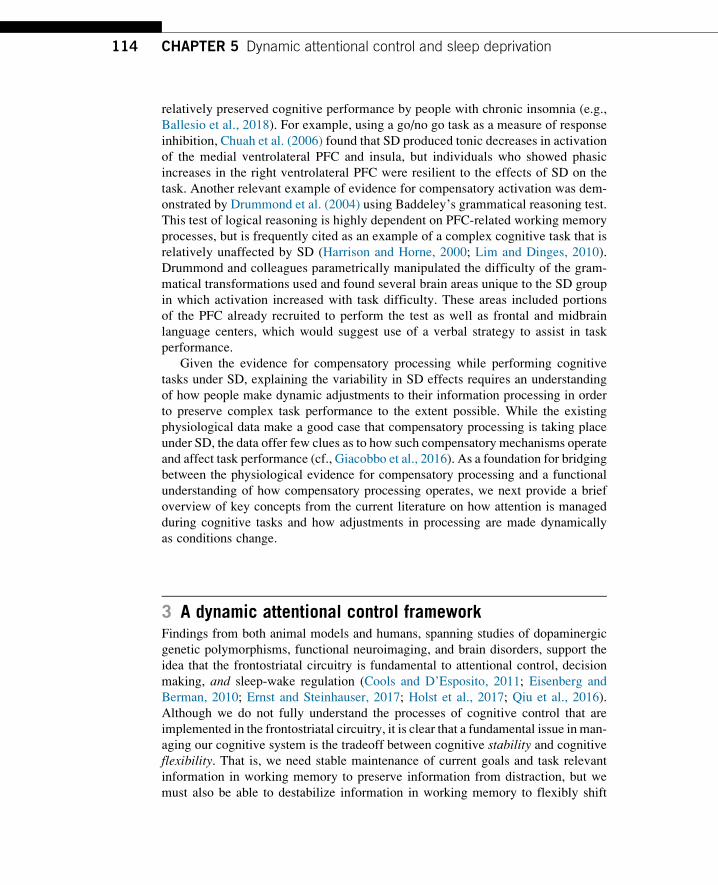
relatively preserved cognitive performance by people with chronic insomnia (e.g.,
Ballesio et al., 2018). For example, using a go/no go task as a measure of response
inhibition, Chuah et al. (2006) found that SD produced tonic decreases in activation
of the medial ventrolateral PFC and insula, but individuals who showed phasic
increases in the right ventrolateral PFC were resilient to the effects of SD on the
task. Another relevant example of evidence for compensatory activation was dem-
onstrated by Drummond et al. (2004) using Baddeley’s grammatical reasoning test.
This test of logical reasoning is highly dependent on PFC-related working memory
processes, but is frequently cited as an example of a complex cognitive task that is
relatively unaffected by SD (Harrison and Horne, 2000; Lim and Dinges, 2010).
Drummond and colleagues parametrically manipulated the difficulty of the gram-
matical transformations used and found several brain areas unique to the SD group
in which activation increased with task difficulty. These areas included portions
of the PFC already recruited to perform the test as well as frontal and midbrain
language centers, which would suggest use of a verbal strategy to assist in task
performance.
Given the evidence for compensatory processing while performing cognitive
tasks under SD, explaining the variability in SD effects requires an understanding
of how people make dynamic adjustments to their information processing in order
to preserve complex task performance to the extent possible. While the existing
physiological data make a good case that compensatory processing is taking place
under SD, the data offer few clues as to how such compensatory mechanisms operate
and affect task performance (cf., Giacobbo et al., 2016). As a foundation for bridging
between the physiological evidence for compensatory processing and a functional
understanding of how compensatory processing operates, we next provide a brief
overview of key concepts from the current literature on how attention is managed
during cognitive tasks and how adjustments in processing are made dynamically
as conditions change.
3 A dynamic attentional control frameworkFindings from both animal models and humans, spanning studies of dopaminergic
genetic polymorphisms, functional neuroimaging, and brain disorders, support the
idea that the frontostriatal circuitry is fundamental to attentional control, decision
making, and sleep-wake regulation (Cools and D’Esposito, 2011; Eisenberg and
Berman, 2010; Ernst and Steinhauser, 2017; Holst et al., 2017; Qiu et al., 2016).
Although we do not fully understand the processes of cognitive control that are
implemented in the frontostriatal circuitry, it is clear that a fundamental issue in man-
aging our cognitive system is the tradeoff between cognitive stability and cognitive
flexibility. That is, we need stable maintenance of current goals and task relevant
information in working memory to preserve information from distraction, but we
must also be able to destabilize information in working memory to flexibly shift
114 CHAPTER 5 Dynamic attentional control and sleep deprivation
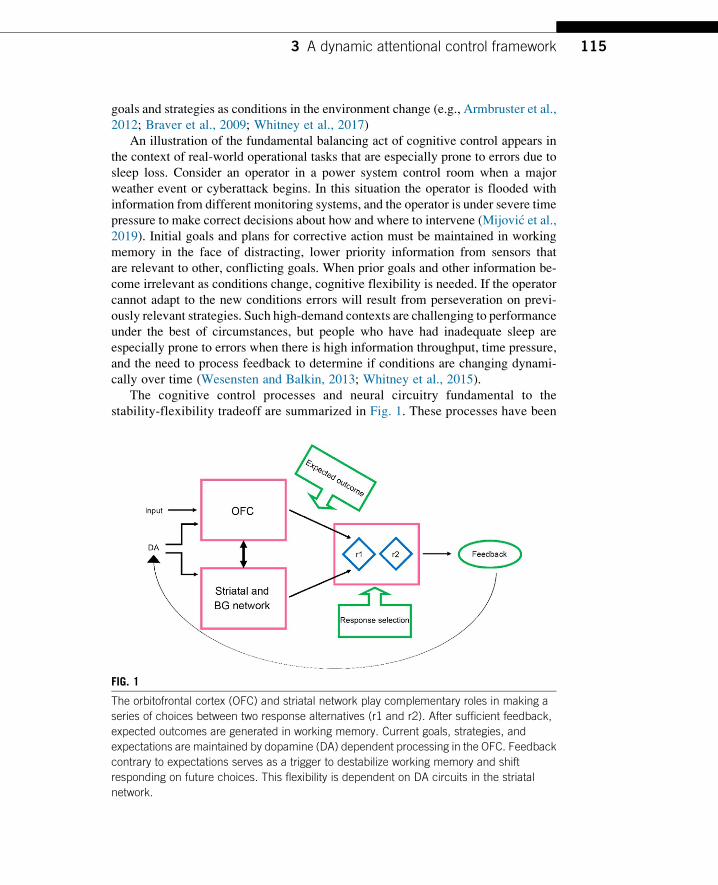
goals and strategies as conditions in the environment change (e.g., Armbruster et al.,
2012; Braver et al., 2009; Whitney et al., 2017)
An illustration of the fundamental balancing act of cognitive control appears in
the context of real-world operational tasks that are especially prone to errors due to
sleep loss. Consider an operator in a power system control room when a major
weather event or cyberattack begins. In this situation the operator is flooded with
information from different monitoring systems, and the operator is under severe time
pressure to make correct decisions about how and where to intervene (Mijovi�c et al.,2019). Initial goals and plans for corrective action must be maintained in working
memory in the face of distracting, lower priority information from sensors that
are relevant to other, conflicting goals. When prior goals and other information be-
come irrelevant as conditions change, cognitive flexibility is needed. If the operator
cannot adapt to the new conditions errors will result from perseveration on previ-
ously relevant strategies. Such high-demand contexts are challenging to performance
under the best of circumstances, but people who have had inadequate sleep are
especially prone to errors when there is high information throughput, time pressure,
and the need to process feedback to determine if conditions are changing dynami-
cally over time (Wesensten and Balkin, 2013; Whitney et al., 2015).
The cognitive control processes and neural circuitry fundamental to the
stability-flexibility tradeoff are summarized in Fig. 1. These processes have been
FIG. 1
The orbitofrontal cortex (OFC) and striatal network play complementary roles in making a
series of choices between two response alternatives (r1 and r2). After sufficient feedback,
expected outcomes are generated in working memory. Current goals, strategies, and
expectations are maintained by dopamine (DA) dependent processing in the OFC. Feedback
contrary to expectations serves as a trigger to destabilize working memory and shift
responding on future choices. This flexibility is dependent on DA circuits in the striatal
network.
1153 A dynamic attentional control framework
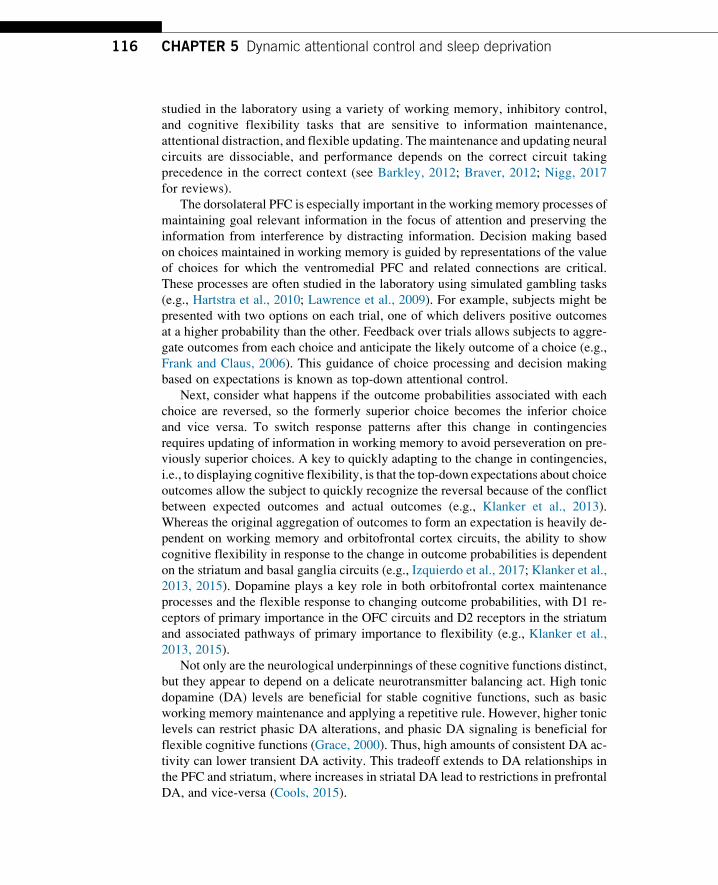
studied in the laboratory using a variety of working memory, inhibitory control,
and cognitive flexibility tasks that are sensitive to information maintenance,
attentional distraction, and flexible updating. The maintenance and updating neural
circuits are dissociable, and performance depends on the correct circuit taking
precedence in the correct context (see Barkley, 2012; Braver, 2012; Nigg, 2017
for reviews).
The dorsolateral PFC is especially important in the working memory processes of
maintaining goal relevant information in the focus of attention and preserving the
information from interference by distracting information. Decision making based
on choices maintained in working memory is guided by representations of the value
of choices for which the ventromedial PFC and related connections are critical.
These processes are often studied in the laboratory using simulated gambling tasks
(e.g., Hartstra et al., 2010; Lawrence et al., 2009). For example, subjects might be
presented with two options on each trial, one of which delivers positive outcomes
at a higher probability than the other. Feedback over trials allows subjects to aggre-
gate outcomes from each choice and anticipate the likely outcome of a choice (e.g.,
Frank and Claus, 2006). This guidance of choice processing and decision making
based on expectations is known as top-down attentional control.
Next, consider what happens if the outcome probabilities associated with each
choice are reversed, so the formerly superior choice becomes the inferior choice
and vice versa. To switch response patterns after this change in contingencies
requires updating of information in working memory to avoid perseveration on pre-
viously superior choices. A key to quickly adapting to the change in contingencies,
i.e., to displaying cognitive flexibility, is that the top-down expectations about choice
outcomes allow the subject to quickly recognize the reversal because of the conflict
between expected outcomes and actual outcomes (e.g., Klanker et al., 2013).
Whereas the original aggregation of outcomes to form an expectation is heavily de-
pendent on working memory and orbitofrontal cortex circuits, the ability to show
cognitive flexibility in response to the change in outcome probabilities is dependent
on the striatum and basal ganglia circuits (e.g., Izquierdo et al., 2017; Klanker et al.,
2013, 2015). Dopamine plays a key role in both orbitofrontal cortex maintenance
processes and the flexible response to changing outcome probabilities, with D1 re-
ceptors of primary importance in the OFC circuits and D2 receptors in the striatum
and associated pathways of primary importance to flexibility (e.g., Klanker et al.,
2013, 2015).
Not only are the neurological underpinnings of these cognitive functions distinct,
but they appear to depend on a delicate neurotransmitter balancing act. High tonic
dopamine (DA) levels are beneficial for stable cognitive functions, such as basic
working memory maintenance and applying a repetitive rule. However, higher tonic
levels can restrict phasic DA alterations, and phasic DA signaling is beneficial for
flexible cognitive functions (Grace, 2000). Thus, high amounts of consistent DA ac-
tivity can lower transient DA activity. This tradeoff extends to DA relationships in
the PFC and striatum, where increases in striatal DA lead to restrictions in prefrontal
DA, and vice-versa (Cools, 2015).
116 CHAPTER 5 Dynamic attentional control and sleep deprivation

Studies of single nucleotide polymorphisms (SNPs) related to dopaminergic ac-
tivity in the OFC and striatum provide important evidence for dopamine’s role in
attentional stability and flexibility. For example, COMT Val158Met codes for the
amount of the catechol-O-methyltransferase enzyme in the PFC. This enzyme alters
the levels of DA breakdown, with the Val allele resulting in higher amounts of en-
zymatic activity, translating into lower levels of baseline DA, and the Met allele
resulting in lower amounts of enzymatic activity, translating into higher levels of
baseline DA (Chen et al., 2004). Studies routinely find that the allele that offers
an advantage for working memory and other tasks requiring stable maintenance
of information the Met allele, is related to poorer performance on tasks that require
cognitive flexibility. Bruder et al. (2005) found a Met advantage on a letter-number
sequencing task, while Goldberg et al. (2003) found a Met advantage on an n-backtask in the 1-and-2-back conditions, both suggesting that Met alleles are related to
enhanced working memory abilities. However, Colzato et al. (2010) found that
Met carriers had increased switch costs on a task switching task and Krugel et al.
(2009) showed that Val homozygotes have enhanced performance on a reversal
learning task, in addition to increased striatal fMRI responses to both positive
and negative prediction errors. Thus, the benefits of Met alleles for working memory
performance may serve to limit cognitive flexibility.
With regard to the effects of SD on these cognitive control processes, the emerg-
ing pattern of evidence supports the hypothesis that SD has a greater effect on cog-nitive flexibility than on the maintenance of goal relevant information. The more
pronounced effect of SD on cognitive flexibility has important implications for
understanding both task variability and individual differences in the study of SD.
Evidence is beginning to emerge that variations in dopaminergic genes expressed
in the frontostriatal circuitry may help explain individual differences in the cognitive
effects of SD (e.g., Holst et al., 2017; see chapter “Unraveling the genetic under-
pinnings of sleep deprivation-induced impairments in human cognition” by
Van Dongen, this volume). Studies of several SNPs related to dopamine expression,
including BDNF, COMT, and DRD2 C957T, have found evidence of alleles that
show resilience to the effects of SD specific to tasks that involve cognitive flexibility
(Grant et al., 2018; Satterfield et al., 2018; Whitney et al., 2017).
Wide ranging evidence supports the notion that maintenance of task relevant in-
formation in the focus of attention is largely unimpaired by SD, at least within the
number of hours of wakefulness typically employed in studies of total SD (e.g.,
Giacobbo et al., 2016; Tucker et al., 2010; Whitney et al., 2015). Note that while
many tasks of working memory show a modest effect of SD on overall performance
(Wickens et al., 2015), performance on tests of working memory include both exec-
utive and non-executive components. For example, SD produces slower mean reac-
tion times on tests of working memory scanning in which people hold a memory set in
the focus of attention and respond whether a probe item is in the memory set
(Casement et al., 2006; Cui et al., 2015; Mu et al., 2005; Tucker et al., 2010). How-
ever, if working memory scanning is isolated from encoding and response speed by
computing the slope of reaction time over memory set size, we see that the process
1173 A dynamic attentional control framework
of scanning working memory is not affected by SD (Tucker et al., 2010). It is the
non-working memory components of performance that are affected by SD. Converg-
ing evidence for the preservation of working memory capacity under SD was
obtained by Giacobbo et al. (2016) who found that SD did not impair performance
on the backward digit span test. Similar results have been obtained across other mea-
sures of the ability to maintain stable representations in the focus of attention
(Casement et al., 2006; Cui et al., 2015; Tucker et al., 2011).
When interpreting the evidence for preserved working memory under SD it is
important to bear in mind the evidence for compensatory processing noted above.
In some cases, working memory and related executive processes may be preserved
though greater activation of relevant circuitry or recruiting additional areas (e.g.,
Chuah et al., 2006; Drummond et al., 2004). If cognitive stability is preserved, in
part through compensatory processing, does the compensatory activation produce
tradeoffs that limit other cognitive processing? We do not know the answer to this
question, but some interesting possibilities are raised by recent research on the neu-
roeconomics of cognitive effort (e.g., Westbrook and Braver, 2015). Attentional ef-
fort appears to be allocated based on a cost-benefit analysis of resources needed to
complete current goals versus the potential benefit of having resources available for
flexible use of resources as the context changes. If so, under SD the preservation of
cognitive stability could come at the cost of cognitive flexibility.
What is clear from existing evidence is that cognitive flexibility declines substan-
tially when people are sleep deprived. Two types of measures are commonly used to
study cognitive flexibility: reversal learning and task switching (e.g., Dajani and
Uddin, 2015). The power system control room example provided above to illustrate
the distinction between cognitive stability and cognitive flexibility is representative
of reversal learning in a natural context. Reversal learning tasks used in the labora-
tory typically involve learning novel stimulus-response pairings that must be updated
based on choice feedback. For example, subjects might learn that choice A in a gam-
bling game often leads to winning money, while choice B more often leads to losing
money. These contingencies then change so that choice B is now the better option
and subjects must update their choice patterns in order to be successful (e.g.,
Waltz and Gold, 2007).
When cognitive flexibility is studied with task switching, an individual is required
to alternate between multiple stimulus-response sets based on cues that are associated
with “rules.” One example of such a task switching procedure is a digit classification
task in which subjects are told that one trial cue (e.g., a blue star) means they should
report whether a number is odd/even and a different trial cue (e.g., a red circle) means
they should report whether a number is greater or less than five (e.g.,Wang et al., 2017).
Subjects must switch their response patterns based on which cue is present on a given
trial. The typical finding is that there is a switch cost manifest as slower or less accurate
task performance on trials after a switch in task compared to trials in which the preced-
ing trial involved the same task (e.g., Braver et al., 2003; Logan, 2003).
Whitney et al. (2015) investigated cognitive flexibility during SD using a reversal
learning task in which subjects learned from feedback which four digits, out of eight,
118 CHAPTER 5 Dynamic attentional control and sleep deprivation

they should respond to (go set) and which four digits that they should avoid respond-
ing to (no go set) under strict deadlines. The go and no sets were reversed without
warning after subjects had mastered the original stimulus-response patterns. Rested
subjects were able to detect and adapt to the reversal after 8–12 trials, but SD subjects
had not adapted to the reversal after 40 trials of the reversal phase. Using the digit
classification task switching procedure described above, Couyoumdjian et al. (2010)
found evidence for substantial impairment of cognitive flexibility in sleep deprived
subjects. Under SD, subjects had significantly larger switch costs than rested sub-
jects. Similarly, Slama et al. (2018) found detrimental effects of SD on task switching
but no effect on working memory.
4 “Complex cognition” and SD reconsideredAlthough neurophysiological evidence has provided support for the general idea that
higher-level decision making may be preserved under SD in part through compen-
satory processing, the mechanisms, benefits, and costs of such processing have been
left largely unspecified. The dynamic attentional control framework described here
may shed light on how and why some aspects of higher level cognition are more
affected by SD than others. For example, individual economic decision making, i.e.,
decisions involving risk, uncertainty, and relative and absolute value of monetary
outcomes, relies on the neurocognitive processes that are dependent on the PFC
(e.g., Lowe et al., 2017). Because of the presumed vulnerability of the PFC to sleep
loss (Killgore, 2010; Womack et al., 2013), it therefore follows that economic deci-
sion making should be impaired by SD. Nevertheless, laboratory studies have shown
that some decision making tasks that rely heavily on the PFC do not show consistent
SD effects, while other PFC dependent decision making tasks do show SD effects
(Womack et al., 2013).
One illustration of a decision making task that shows a surprising lack of compro-
mise by SD is delay discounting (Green andMyerson, 2004, 2010). Delay discounting
requires individuals to evaluate choices based on differences in delay andmagnitude of
options. For example, choice alternatives that are offered typically provide an imme-
diate payoff with a small amount of money versus a delayed payoff with a large
amount of money. A shift in preference for immediate options over more valuable
delayed options is a hallmark of impulsivity in decision making, where people fail
to adequately weigh future consequences of a choice, and it is predictive of risk taking
behavior in real life settings (Dalley and Robbins, 2017; Evenden, 1999; Madden and
Bickel, 2010). Yet, despite the fact that delay discounting tasks engage PFC processes
that are often presumed to be compromised by sleep loss, studies of SD report no
consistent alteration of delay discounting (Acheson et al., 2007; Demos et al., 2016;
Libedinsky et al., 2013). By this well-established laboratory measure, SD individuals
are not more impulsive or risk prone than they are when rested.
In contrast, studies employing the Iowa Gambling Task (IGT; Bechara et al.,
1997; Dunn et al., 2006), which also engages PFC processes, have consistently
1194 “Complex cognition” and SD reconsidered
reported impaired decision making during SD (Killgore et al., 2006, 2007). The IGT
involves gambling with hypothetical gains and losses from four simulated decks of
cards. Choices from two of the decks, designated as bad decks, produce frequent
large gains, but these gains are offset by occasional larger losses. Choices from
the other two decks, designated as good decks, produce frequent small gains, along
with infrequent smaller losses. To maximize gains over the course of the task, indi-
viduals must learn to choose the smaller, but more reliable, gains provided by the
good decks. The IGT shares the probabilistic uncertainty of many behavioral eco-
nomic tasks, i.e., a good choice does not always result in a good outcome, but it also
requires that individuals learn through outcome feedback which choices are advan-
tageous and which choices are disadvantageous. When performing the IGT, SD sub-
jects continue to make choices from bad decks rather than learning to make choices
that are advantageous in the long run (Killgore et al., 2006, 2007). This pattern of
choices is similar to that found when functions in some PFC regions, such as the
ventromedial PFC, are compromised (Bechara et al., 1997).
Why should two different decision making tasks that engage the PFC produce
such different patterns of performance impairment during SD? An initial suggestion
was that the IGT might activate affective processes that are also compromised by SD
and those affective processes are responsible for impaired decisionmaking (Killgore,
2010). This suggestion gained support from research using economic decision
making tasks manipulating the risk or uncertainty of choice options. One study ex-
amining choices of hypothetical monetary lotteries that contrasted different levels of
risk found that SD subjects showed increased preference for risks involving gains,
while also showing decreased preference for risks involving losses (McKenna
et al., 2007). The change in risk preference was consistent with another study using
risky economic decision making and fMRI which reported higher neural activation
for gains and lower neural activation for losses (Venkatraman et al., 2007). However,
subsequent research has cast doubt on the notion that affective biasing of value is
responsible for the compromise of decision making during SD. These recent studies
have found that risk preference, including the loss aversion bias that is characteristic
of most well-rested people, is not affected by SD (Maric et al., 2017; Mullette-
Gillman et al., 2015). Furthermore, it is not clear why delay discounting, which is
unaffected by sleep loss, would not engage affective processes that are operative
in other economic decision making tasks, as delay discounting is often used as
assessment of impulsivity (Madden and Bickel, 2010).
If biasing of the neural valuation signals does not explain when decision making
is compromised by SD, perhaps the influence of attentional control processes does.
Delay discounting may be less susceptible to SD because it places lower demands on
attentional control. Delay discounting tasks fully describe choice options, and do not
require updating of information based on past choices. Thus, there is no need for a
tradeoff between the stable maintenance of choice information and flexible updating.
On the other hand, the IGT requires continual updating of choice information based
on choice outcomes. In addition, the IGT has an implicit reversal learning element
that requires flexibility in attentional control for good performance. On early IGT
120 CHAPTER 5 Dynamic attentional control and sleep deprivation
trials subjects are given a long series of good outcomes from what is ultimately a bad
deck (Dunn et al., 2006). Almost all subjects develop an immediate preference for
this bad deck option based on these early trials. But subjects must overcome this
newly developed preference to maximize overall outcomes. The early reversal in
contingencies for the bad deck may be essential to group performance differences
obtained from the IGT (Fellows and Farah, 2003). Thus, the attentional control re-
quirements of the IGT, requiring a balance of stability and flexibility, may explain
why its performance is more readily compromised by sleep loss than is performance
on delay discounting, and a variety of other decision making tasks that do place great
demands on attentional control. This is not to say, that affective processes and val-
uation of outcomes do not play in role in SD effects on decisions about risk. Clearly,
affective processes are a part of risky decisions, and an important goal for future
research is to further understand how affective processes and cognitive control
processes mutually influence SD effects on decision making.
The dynamic attentional control explanation is also supported by more recent re-
search on risk and uncertainty in economic decision making. For example, although
risk preference may not be changed by SD, the means by which risk are evaluated
may change (Mullette-Gillman et al., 2015). More specifically, SDmay contribute to
use of a satisficing strategy, which reduces demands on attentional resources, instead
of relying on a more resource intensive maximizing strategy that is likely to be used
when people are well rested (Mullette-Gillman et al., 2015). For example, the atten-
tional control framework predicts that delay discounting during SD could be
impaired by imposing a restriction on the throughput of information used to make
decisions, such as by a decision deadline, or by otherwise challenging the allocation
of attentional resources by dual task or divided attention requirements. The effect of
sleep loss could be one of the multiple factors that influence the malleability of risk
preference in judgment (Hinson et al., 2003; Lempert and Phelps, 2016).
5 ConclusionsThe pattern of variability in SD effects across multiple cognitive tasks is consistent
with an asymmetry in the fundamental cognitive control balance between stability
and flexibility of information in the focus of attention. People who have experienced
significant sleep loss have particular difficulty with flexible updating of task sets and
processing strategies especially under fast-paced and dynamically changing condi-
tions. This conclusion is consistent with behavioral evidence, neuroimaging, and do-
paminergic genetic data related to the functioning of the frontostriatal circuitry.
In addition to accounting for the pattern of evidence on variability in SD effects,
the attentional control framework proposed here suggests that a task whose perfor-
mance does not appear to be compromised by sleep loss may be made more suscep-
tible to the effects of sleep loss by adding or increasing the attentional control
demands of the task. Taking the view that sleep loss is one of multiple situational
challenges that can trigger compensatory processes situates SD research firmly
1215 Conclusions
within a long tradition of research in cognitive neuroscience. We contend that
research on the selectivity of SD effects on cognition can help us understand how
the cognitive system is functionally organized and implemented in neural circuits,
just as the selectivity of the effects of brain lesions or other challenges have helped
us understand functional and neurophysiological aspects cognition in general (e.g.,
Miller and Cohen, 2001). The dynamic attentional control framework presented here
makes use of recent research on the cognitive neuroscience of attentional control to
better understand sleep deprivation effects on cognition. As we learn more about the
implications of sleep deprivation’s effect on the attentional stability-flexibility trade-
off, we believe that sleep research can become a major contributor to development
and testing of general theories of cognitive control.
AcknowledgmentsThis work was supported by CDMRP grant W81XWH-16-1-0319. We appreciate the helpful
comments of an anonymous reviewer who improved the clarity of the manuscript.
ReferencesAcheson, A., Richards, J.B., de Wit, H., 2007. Effects of sleep deprivation on impulsive be-
haviors in men and women. Physiol. Behav. 91, 579–587.Armbruster, D.J.N., Ueltzh€offer, K., Basten, U., Fiebach, C.J., 2012. Prefrontal cortical mech-
anisms underlying individual differences in cognitive flexibility and stability. J. Cogn.
Neurosci. 24, 2385–2399.Ballesio, A., Aquino, M.R.J.V., Feige, B., Johann, A.F., Kyle, S.D., Spiegelhalder, K., …
Baglioni, C., 2018. The effectiveness of behavioural and cognitive behavioural therapies
for insomnia on depressive and fatigue symptoms: a systematic review and network meta-
analysis. Sleep Med. Rev. 37, 114–129.Barkley, R.A., 2012. Executive Functions: What They Are, How They Work, and Why They
Evolved. Guilford Press, New York, NY, USA.
Bechara, A., Damasio, H., Tranel, D., Damasio, A.R., 1997. Deciding advantageously before
knowing the advantageous strategy. Science 275, 1293–1295.Braver, T.S., 2012. The variable nature of cognitive control: a dual mechanisms framework.
Trends Cogn. Sci. 16, 106–113.Braver, T.S., Reynolds, J.R., Donaldson, D.I., 2003. Neural mechanisms of transient and sus-
tained cognitive control during task switching. Neuron 39, 713–726.Braver, T.S., Paxton, J.L., Locke, H.S., Barch, D.M., 2009. Flexible neural mechanisms of
cognitive control within human prefrontal cortex. Proc. Natl. Acad. Sci. U. S. A.
106, 7351–7356.Bruder, G.E., Keilp, J.G., Xu, H., Shikhman, M., Schori, E., Gorman, J.M., Gilliam, T.C.,
2005. Catechol-O-methyltransferase (COMT) genotypes and working memory: associa-
tions with differing cognitive operations. Biol. Psychiatry 58, 901–907.Casement, M.D., Broussard, J.L., Mullington, J.M., Press, D.Z., 2006. The contribution of
sleep to improvements in working memory scanning speed: a study of prolonged sleep
restriction. Biol. Psychol. 72, 208–212.
122 CHAPTER 5 Dynamic attentional control and sleep deprivation

Chee, M.W.L., Tan, J.C., Parimal, S., Zagorodnov, V., 2010. Sleep deprivation and its effects
on object-selective attention. NeuroImage 49, 1903–1910.Chen, J., Lipska, B.K., Halim, N.,Ma,Q.D.,Matsumoto,M.,Melhem, S., …Weinberger, D.R.,
2004. Functional analysis of genetic variation in catechol-O-methyltransferase (COMT):
effects on mRNA, protein, and enzyme activity in postmortem human brain. Am. J.
Hum. Genet. 75, 807–821.Chen, T., Cai, W., Ryali, S., Supekar, K., Menon, V., 2016. Distinct global brain dynamics and
spatiotemporal organization of the salience network. PLoS Biol. 14, e1002469.
Chuah, Y.M.L., Venkatraman, V., Dinges, D.F., Chee, M.W.L., 2006. The neural basis of
interindividual variability in inhibitory efficiency after sleep deprivation. J. Neurosci.
26, 7156–7162.Colzato, L.S., Waszak, F., Nieuwenhuis, S., Posthuma, D., Hommel, B., 2010. The flexible
mind is associated with the catechol-O-methyltransferase (COMT) Val158Met polymor-
phism: evidence for a role of dopamine in the control of task-switching. Neuropsychologia
48, 2764–2768.Cools, R., 2015. The cost of dopamine for dynamic cognitive control. Curr. Opin. Behav. Sci.
4, 152–159.Cools, R., D’Esposito, M., 2011. Inverted-u–shaped dopamine actions on human working
memory and cognitive control. Biol. Psychiatry 69, e113–e125.Couyoumdjian, A., Sdoia, S., Tempesta, D., Curcio, G., Rastellini, E., De Gennaro, L.,
Ferrara, M., 2010. The effects of sleep and sleep deprivation on task-switching perfor-
mance. J. Sleep Res. 19, 64–70.Cui, J., Tkachenko, O., Gogel, H., Kipman, M., Preer, L.A., Weber, M., Divatia, S.C.,
Demers, L.A., Olson, E.A., Buchholz, J.L., Bark, J.S., Rosso, I.M., Rauch, S.L.,
Killgore, W.D., 2015. Microstructure of frontoparietal connections predicts individual re-
sistance to sleep deprivation. NeuroImage 106, 123–133.Dajani, D.R., Uddin, L.Q., 2015. Demystifying cognitive flexibility: implications for clinical
and developmental neuroscience. Trends Neurosci. 38, 571–578.Dalley, J.W., Robbins, T.W., 2017. Fractionating impulsivity: neuropsychiatric implications.
Nat. Rev. Neurosci. 18, 158–171.Demos, K.E., Hart, C.N., Sweet, L.H., Mailloux, K.A., Trautvetter, J., Williams, S.E.,
Wing, R.R., McCaffery, J.M., 2016. Partial sleep deprivation impacts impulsive action
but not impulsive decision-making. Physiol. Behav. 164, 214–219.Drummond, S.P., Brown, G.G., Gillin, J.C., Stricker, J.L., Wong, E.C., Buxton, R.B., 2000.
Altered brain response to verbal learning following sleep deprivation. Nature
403 (6770), 655–657.Drummond, S.P.A., Brown, G.G., Salamat, J.S., Gillin, J.C., 2004. Increasing task difficulty
facilitates the cerebral compensatory response to total sleep deprivation. Sleep 27 (3),
445–451.Dunn, B.D., Dalgleish, T., Lawrence, A.D., 2006. The somatic marker hypothesis: a critical
evaluation. Neurosci. Biobehav. Rev. 30, 239–271.Eisenberg, D.P., Berman, K.F., 2010. Executive function, neural circuitry, and genetic mech-
anisms in schizophrenia. Neuropsychopharmacology 35, 258–277.Ernst, B., Steinhauser, M., 2017. Top-down control over feedback processing: the probability
of valid feedback affects feedback-related brain activity. Brain Cogn. 115, 33–40.Evenden, J.L., 1999. Varieties of impulsivity. Psychopharmacology (Berl) 146, 348–361.Fellows, L.K., Farah, M.J., 2003. Ventromedial frontal cortex mediates affective shifting in
humans: evidence from a reversal learning paradigm. Brain 126, 1830–1837.
123References

Frank, M.J., Claus, E.D., 2006. Anatomy of a decision: striato-orbitofrontal interactions in re-
inforcement learning, decision making, and reversal. Psychol. Rev. 113, 300–326.Giacobbo, B.L., Correa, M.S., Vedovelli, K., de Souza, C.E.B., Spitza, L.M., Goncalves, L.,
…Bromberg, E., 2016. Could BDNF be involved in compensatory mechanisms to main-
tain cognitive performance despite acute sleep deprivation? An exploratory study. Int. J.
Psychophysiol. 99, 96–102.Goldberg, T.E., Egan, M.F., Gscheidle, T., Coppola, R., Weickert, T., Kolachana, B.S., …
Weinberger, D.R., 2003. Executive subprocesses in working memory: relationship to
catechol-O-methyltransferase Val158Met genotype and schizophrenia. Arch. Gen. Psy-
chiatry 60, 889–896.Grace, A.A., 2000. The tonic/phasic model of dopamine system regulation and its implications
for understanding alcohol and psychostimulant craving. Addiction 95 (Suppl. 2), 119–128.Grant, L.K., Cain, S.W., Chang, A.-M., Saxena, R., Czeisler, C.A., Anderson, C., 2018. Im-
paired cognitive flexibility during sleep deprivation among carriers of the brain derived
neurotrophic factor (BDNF) Val66Met allele. Behav. Brain Res. 338, 51–55.Green, L., Myerson, J., 2004. A discounting framework for choice with delayed and probabi-
listic rewards. Psychol. Bull. 130, 769–792.Green, L., Myerson, J., 2010. Experimental and correlational analyses of delay and probability
discounting. In: Madden, G.J., Bickel, W.K. (Eds.), Impulsivity: The Behavioral and Neu-
rological Science of Discounting. American Psychological Association, Washington,
D.C., pp. 67–92.Harrison, Y., Horne, J.A., 2000. The impact of sleep deprivation on decision making: a review.
J. Exp. Psychol. Appl. 6, 236–249.Hartstra, E., Oldenburg, J.F., Van Leijenhorst, L., Rombouts, S.A., Crone, E.A., 2010. Brain
regions involved in the learning and application of reward rules in a two-deck gambling
task. Neuropsychologia 48, 1438–1446.Hinson, J.M., Jameson, T.L., Whitney, P., 2003. Impulsive decision making and working
memory. J. Exp. Psychol. Learn. Mem. Cogn. 29, 298–306.Holst, S.C., M€uller, T., Valomon, A., Seebauer, B., Berger, W., Landolt, H.-P., 2017. Func-
tional polymorphisms in dopaminergic genes modulate neurobehavioral and neurophysi-
ological consequences of sleep deprivation. Sci. Rep. 7, 45982.
Honn, K.A., Hinson, J.M., Whitney, P., Van Dongen, H.P.A., 2018. Cognitive flexibility: a
distinct element of performance impairment due to sleep deprivation. Accid. Anal. Prev.
https://doi.org/10.1016/j.aap.2018.02.013.
Izquierdo, A., Brigman, J.L., Radke, A.K., Rudebeck, P.H., Holmes, A., 2017. The neural
basis of reversal learning: an updated perspective. Neuroscience 345, 12–26.Killgore, W.D.S., 2010. Effects of sleep deprivation on cognition. Prog. Brain Res.
185, 105–129.Killgore, W.D., Balkin, T.J., Wesensten, N.J., 2006. Impaired decision making following 49h
of sleep deprivation. J. Sleep Res. 15, 7–13.Killgore, W.D., Lipizzi, E.L., Kamimori, G.H., Balkin, T.J., 2007. Caffeine effects on risky
decision making after 75 hours of sleep deprivation. Aviat. Space Environ. Med.
78, 957–962.Klanker, M., Feenstra, M., Denys, D., 2013. Dopaminergic control of cognitive flexibility in
humans and animals. Front. Neurosci. 7, 201.
Klanker, M., Sandberg, T., Joosten, R., Willuhn, I., Feenstra, M., Denys, D., 2015. Phasic do-
pamine release induced by positive feedback predicts individual differences in reversal
learning. Neurbiol. Learn. Mem. 125, 135–145.
124 CHAPTER 5 Dynamic attentional control and sleep deprivation
Krause, A.J., Simon, E.B., Mander, B.A., Greer, S.M., Saletin, J.M., Goldstein-Piekarski,
A.N., Walker, M.P., 2017. The sleep-deprived human brain. Nat. Rev. Neurosci.
18, 404–418.Krugel, L.K., Biele, G., Mohr, P.N.C., Li, S.-C., Heekeren, H.R., 2009. Genetic variation in
dopaminergic neuromodulation influences the ability to rapidly and flexibly adapt deci-
sions. Proc. Natl. Acad. Sci. U. S. A. 106, 17951–17956.Lawrence, N.S., Jollant, F., O’Daly, O., Zelaya, F., Phillips, M.L., 2009. Distinct roles of pre-
frontal cortical subregions in the Iowa gambling task. Cereb. Cortex 19, 1134–1143.Lempert, K.M., Phelps, E.A., 2016. The malleability of intertemporal choice. Trends Cogn.
Sci. 20, 64–74.Libedinsky, C., Massar, S.A., Ling, A., Chee, W., Huettel, S.A., Chee, M.W., 2013. Sleep
deprivation alters effort discounting but not delay discounting of monetary rewards.
Sleep 36, 899–904.Lim, J., Dinges, D.F., 2010. A meta-analysis of the impact of short-term sleep deprivation on
cognitive variables. Psychol. Bull. 136 (3), 375–389.Logan, G.D., 2003. Executive control of thought and action: in search of the wild homunculus.
Curr. Dir. Psychol. Sci. 12, 45–48.Lowe, C.J., Safati, A., Hall, P.A., 2017. The neurocognitive consequences of sleep restriction:
a meta-analytic review. Neurosci. Biobehav. Rev. 80, 586–604.Ma, N., Dinges, D.F., Basner, M., Rao, H., 2015. How acute total sleep loss affects the attend-
ing brain: a meta-analysis of neuroimaging studies. Sleep 38, 233–240.Madden, G.J., Bickel, W.K., 2010. Impulsivity: The Behavioral and Neurological Science of
Discounting. American Psychological Association, Washington, D.C.
Maric, A., Montvai, E., Werth, E., Storz, M., Leemann, J., Weissengruber, S., Ruff, C.C.,
Huber, R., Poryazova, R., Baumann, C.R., 2017. Insufficient sleep: enhanced risk-seeking
relates to low local sleep intensity. Ann. Neurol. 82, 409–418.McKenna, B.S., Dickinson, D.L., Orff, H.J., Drummond, S.P., 2007. The effects of one night
of sleep deprivation on known-risk and ambiguous-risk decisions. J. Sleep Res.
16, 245–252.Mijovi�c, V., Tomasevi�c, N., Janev, V., Stanojevi�c, M., Vranes, S., 2019. Emergency man-
agement in critical infrastructures: a complex-event-processing paradigm. J. Syst. Sci.
Syst. Eng. 28 (1), 37–62Miller, E.K., Cohen, J.D., 2001. An integrative theory of prefrontal cortex function. Annu.
Rev. Neurosci. 24, 167–202.Mu, Q., Mishory, A., Johnson, K.A., Nahas, Z., Kozel, F.A., Yamanaka, K., Bohning, D.E.,
George, M.S., 2005. Decreased brain activation during a working memory task at rested
baseline is associated with vulnerability to sleep deprivation. Sleep 28, 433–446.Mullette-Gillman, O.A., Kurnianingsih, Y.A., Liu, J.C., 2015. Sleep deprivation alters choice
strategy without altering uncertainty or loss aversion preferences. Front. Neurosci. 6, 352.
Nakashima, A., Bouak, F., Lam, Q., Smith, I., Vartanian, O., 2018. Task switching following
24h of total sleep deprivation: a functional MRI study. Neuroreport 29 (2), 123–127.Nigg, J.T., 2017. Annual research review: on the relations among self-regulation, self-
control, executive functioning, effortful control, cognitive control, impulsivity, risk-
taking, and inhibition for developmental psychopathology. J. Child Psychol. Psychiatry
58, 361–383.Qiu, H., Zhong, R., Liu, H., Zhang, F., Li, S., Le, W., 2016. Chronic sleep deprivation exac-
erbates learning-memory disability and Alzheimer’s disease-like pathologies in AβPP(swe)/PS1(ΔE9) mice. J. Alzheimers Dis. 50, 669–685.
125References

Satterfield, B.C., Hinson, J.M., Whitney, P., Schmidt, M.A., Wisor, J.P., Van Dongen, H.P.A.,
2018. Catechol-O-methyltransferase (COMT) genotype affects cognitive control during
total sleep deprivation. Cortex 99, 179–186.Schmidt, M.H., 2014. The energy allocation function of sleep: a unifying theory of sleep, tor-
por, and continuous wakefulness. Neurosci. Biobehav. Rev. 47, 122–153.Slama, H., Chylinski, D.O., Deliens, G., Leproult, R., Schmitz, R., Peigneux, P., 2018. Sleep
deprivation triggers cognitive control impairments in task-goal switching. Sleep 41, 1–12.Sturm, W., Willmes, K., 2001. On the functional neuroanatomy of intrinsic and phasic alert-
ness. NeuroImage 14, S76–S84.Tucker, A.M., Whitney, P., Belenky, G., Hinson, J.M., Van Dongen, H.P.A., 2010. Effects of
sleep deprivation on dissociated components of executive functioning. Sleep 33, 47–57.Tucker, A.M., Stern, Y., Basner, R.C., Rakitin, B.C., 2011. The prefrontal model revisited:
double dissociations between young sleep deprived and elderly subjects on cognitive com-
ponents of performance. Sleep 34, 1039–1050.Van Dongen, H.P.A., Baynard, M.D., Maislin, G., Dinges, D.F., 2004. Systematic interindi-
vidual differences in neurobehavioral impairment from sleep loss: evidence of trait-like
differential vulnerability. Sleep 27, 423–433.Venkatraman, V., Chuah, Y.M.L., Huettel, S.A., Chee, M.W.L., 2007. Sleep deprivation
elevates expectation of gains and attenuates response to losses following risky decisions.
Sleep 30, 603–609.Venkatraman, V., Huettel, S.A., Chuah, L.Y.M., Payne, J.W., Chee, M.W.L., 2011. Sleep dep-
rivation biases the neural mechanisms underlying economic preferences. J. Neurosci.
31, 3712–3718.Waltz, J.A., Gold, J.M., 2007. Probabilistic reversal learning impairments in schizophrenia.
Schizophr. Res. 93, 296–303.Wang, Y., Chen, J., Yue, Z., 2017. Positive emotion facilitates cognitive flexibility: an fMRI
study. Front. Psychol. 8, 1832. https://doi.org/10.3389/fpsyg.2017.01832.
Wesensten, N.J., Balkin, T.J., 2013. The challenge of sleep management in military opera-
tions. US Army. Med. Dep. J. 109–118.Westbrook, A., Braver, T.S., 2015. Cognitive effort: a neuroeconomic approach. Cogn. Affect.
Behav. Neurosci. 15, 395–415.Whitney, P., Hinson, J.M., Jackson,M.L., Van Dongen, H.P.A., 2015. Feedback blunting: total
sleep deprivation impairs decision making that requires updating based on feedback. Sleep
38, 745–754.Whitney, P., Hinson, J.M., Satterfield, B.C., Grant, D.A., Honn, K.A., Dongen, H.P.A.V.,
2017. Sleep deprivation diminishes attentional control effectiveness and impairs flexible
adaptation to changing conditions. Sci. Rep. 7, 16020.
Wickens, C.D., Hutchins, S.D., Laux, L., Sebok, A., 2015. The impact of sleep disruption on
complex cognitive tasks: a meta-analysis. Hum. Factors 57, 930–946.Womack, S.D., Hook, J.N., Reyna, S.H., Ramos, M., 2013. Sleep loss and risk-taking
behavior: a review of the literature. Behav. Sleep Med. 11, 343–359.
126 CHAPTER 5 Dynamic attentional control and sleep deprivation