Selective modulations of attentional asymmetries after sleep deprivation
Upload
khangminh22Category
view
0download
0
Violence Exposure and Social Deprivation:
Neural Connectivity Correlates and Protective Factors
by
Leigh Gayle Goetschius
A dissertation submitted in partial fulfillment
of the requirement for the degree of
Doctor of Philosophy
(Psychology)
in the University of Michigan
2021
Doctoral Committee:
Professor Christopher S. Monk, Chair
Assistant Professor Adriene M. Beltz
Professor Ivo D. Dinov
Associate Professor Luke W. Hyde
Professor Vonnie C. McLoyd
Research Associate Professor Colter Mitchell

Leigh Gayle Goetschius
ORCID iD: 0000-0001-6814-5634
© Leigh Gayle Goetschius 2021

ii
Dedication
To the families who participated the Fragile Families and Child Wellbeing Study. Thank
you for sharing your lives for more than 20 years. This dissertation would not exist without them.

iii
Acknowledgements
This dissertation would not have been possible without help and support from many,
many people. First, I want to express how grateful I am for my primary advisor and mentor,
Chris Monk. You have helped me develop into a stronger researcher by pushing me to think
deeply and compassionately about research questions and data, to learn new methods for imaging
and statistical analysis, and to write clearly and concisely about what I find. Thank you for
letting me come to Michigan, work with you, and be a part of the SAND study – I have been
incredibly lucky to work with a rich, unique dataset. More than that, Chris has been a great
example of balancing rigorous work with a fulfilling personal life. I will always be especially
grateful for his support after the birth of my son and during the five months of the COVID-19
pandemic where our daycare was closed.
I also thank the other wonderful mentors that I have had while at the University of
Michigan that have formed my committee – Luke Hyde, Adriene Beltz, Vonnie McLoyd, Colter
Mitchell, and Ivo Dinov. Luke, thank you for helping me think through and interpret results.
Adriene, thank you for introducing me to novel methods, helping me to write about findings
using those methods in concise, snappy ways, and for supporting me while I was pregnant and a
new mom – you have been an outstanding role model in so many ways. Vonnie, thank you for
helping me incorporate social context into my work in thoughtful, meaningful ways and for
guiding my thinking about framing and discussing questions about early adversity, poverty and
the brain. Colter, thank you for helping me get to know and work with the FFCWS and dataset

iv
and your enthusiastic support of my projects and Ivo, thank you for providing support and
helpful comments about my [unreasonably long] dissertation.
I have been blessed with working with present and former members of the TaD Lab and
MiND Lab that were also excellent mentors and collaborators including Tyler Hein, Whit
Mattson, Arianna Gard, Jaime Muñoz-Velasquez, Hailey Dotterer, Melissa Peckins, Felicia
Hardi, and Sunghyun Hong. Thank you especially to Tyler and Whit for teaching me everything I
know about neuroimaging analysis. Thank you also, Tyler, for sharing your thoughts, insights,
and work on the dimensional models of adversity. I appreciate all of the time, effort, and help
you gave me both while you were at Michigan and since you have graduated. Additionally, I am
grateful for the outstanding research staff that have been part of the TaD Lab during my time at
Michigan, they have kept the lab moving smoothly and provided invaluable help.
I also want to thank my network of social support that I have had while in graduate
school at Michigan. Thank you to Kristi Chin, my best friend, lunch date, and biggest
cheerleader. Thank you for always listening to and supporting me. Being a graduate student
parent has been a rewarding, but challenging, experience that has been dramatically improved by
the support I have gotten from other graduate student moms including, Rachel Fine, Julia Rios,
Rachel Tomlinson, Felicia Hardi, and Amira Halawah. You all are awesome. I want to thank my
fellow 2016 Developmental Cohort, Valerie Freund, Ka Ip, Changé Kwesele, Lolita Moss, and
Nick Waters, and the other students who were on the Developmental Training Grant with me,
Kevin Constante, Michael Demidenko, and Petal Grower. Thank you all for your encouragement
and support for me as a scientist and a person. Thank you to my parents, Wendy and Alan Gayle,
sisters, Kathleen Gayle and Anna Henry, and brother-in-law John Henry. Your love and support
have been invaluable. Last, but definitely not least, I want to thank my husband and partner in

v
life, John, who has believed in, supported, and loved me through the challenges and triumphs of
the last 8 years, and our son, Major, whose unconditional love inspires me to be a better human.
The research presented in this dissertation would not have been possible without the
incredible resources at the University of Michigan including the expertise of those in the fMRI
lab, the training in and support for MRI analysis available through the Neuroimaging Initiative,
and the computational support from Advanced Research Computing. Without the research
support available from people like Bennet Fauber and Andy Jahn, I would be lost. This work
would have also not have been possible without the funding that I received from the University
of Michigan Rackham Graduate School, the Department of Psychology, and the NIH through
funding from the Developmental Training Grant (T32HD007109) and the SAND study
(R01MH103761& R01MH121079). I am grateful for the luxury of being able to train and do
research without having to worry about how survive financially.
Finally, this dissertation would not have been possible without the participation of the
families in the Fragile Families and Child Wellbeing Study and specifically those who
participated in the Study of Adolescent Neural Development. I want to thank them for sharing
their lives. I know that even the short time I spent working with them during data collection
helped me to put a face and a story to the questions I was asking in this dissertation. Hopefully
the results help in some way.

vi
Table of Contents
Dedication ...................................................................................................................................... ii
Acknowledgements ...................................................................................................................... iii
List of Tables ................................................................................................................................ vii
List of Figures ............................................................................................................................. viii
List of Appendices ........................................................................................................................ ix
Abstract .......................................................................................................................................... x
Chapter 1 : Introduction .................................................................................................................. 1 Chapter 2 : Childhood Violence Exposure and Social Deprivation Predict Adolescent Amygdala-
Orbitofrontal Cortex White Matter Connectivity ...................................................... 24 Chapter 3 : Association of Childhood Violence Exposure with Adolescent Neural Network
Density ....................................................................................................................... 53 Chapter 4 : School Connectedness as a Protective Factor Against Childhood Exposure to
Violence and Social Deprivation: A Longitudinal Study of Adaptive and Maladaptive
Outcomes ................................................................................................................... 72 Chapter 5 : General Discussion................................................................................................... 107
Appendices ................................................................................................................................. 124
References .................................................................................................................................. 167

vii
List of Tables
Table 2.1: Participant exclusions and demographics .................................................................... 44
Table 2.2: Descriptive statistics for the main continuous predictor variables and covariates ...... 45
Table 2.3: Stepwise regression predicting right amygdala–BA47 white matter ........................... 46
Table 2.4: Regression results from amygdala-prefrontal cortex white matter connectivity
predicting ipsilateral amygdala activation to threat faces adjusting for covariates. ..................... 48
Table 3.1: Table of frequently used acronyms .............................................................................. 66
Table 3.2: Logistic regression results for subgroup membership ................................................. 67
Table 3.3: Regression results for network density and node degree ............................................. 68
Table 4.1: Demographic characteristics ........................................................................................ 98
Table 4.2: Descriptive statistics and zero-order correlations ........................................................ 99
Table 4.3: Measurement model factor loadings .......................................................................... 100
Table 5.1: Rates of teen and parental psychopathology in SAND .............................................. 123
Supplemental Table 2.1: Internalizing psychopathology & white matter correlation ................ 126
Supplemental Table 2.2: Correlation of environmental measures with movement .................... 129
Supplemental Table 2.3: Regression results predicting right amygdala-BA10 white matter ..... 135
Supplemental Table 2.4: Regression results predicting left amygdala-BA10 white matter ....... 137
Supplemental Table 2.5: Regression results predicting left amygdala-BA11 white matter ....... 138
Supplemental Table 2.6: Regression results predicting left amygdala-BA25 white matter ....... 139
Supplemental Table 2.7: Regression results predicting left amygdala-BA47 white matter ....... 140
Supplemental Table 2.8: Regression results predicting right amygdala-BA11 white matter ..... 141
Supplemental Table 2.9: Regression results predicting right amygdala-BA25 white matter ..... 142
Supplemental Table 2.10: Amygdala-PFC white matter & amygdala activation ....................... 143
Supplemental Table 3.1: Participant demographics .................................................................... 152
Supplemental Table 3.2: MNI Coordinates for ROIs ................................................................. 153
Supplemental Table 3.3: Regression results for network density ............................................... 155
Supplemental Table 3.4: Non-significant node degree regression results .................................. 157
Supplemental Table 3.5: Node density adjusted for covariates .................................................. 159
Supplemental Table 3.6: Logistic regression results adjusted for covariates ............................. 160
Supplemental Table 3.7: Chapter 3 Supplemental Data ............................................................. 161

viii
List of Figures
Figure 1.1: Violence exposure and social deprivation conceptual figure ..................................... 22
Figure 1.2: Protective processes conceptual figure....................................................................... 23
Figure 2.1: Association between violence exposure and social deprivation. ............................... 50
Figure 2.2: White matter tracts from the left and right amygdalae ............................................... 51
Figure 2.3: Simple slopes plot for VExSD interaction predicting white matter ........................... 52
Figure 3.1: S-GIMME connectivity results .................................................................................. 70
Figure 3.2: Association between violence exposure and network density.................................... 71
Figure 4.1: Diagram of the main effects model including school connectedness....................... 102
Figure 4.2: Diagram of latent moderation model predicting psychopathology .......................... 103
Figure 4.3: Simple slopes plot for SCxSD interaction predicting externalizing symptoms ....... 104
Figure 4.4: Diagram of latent moderation model predicting positive function .......................... 105
Figure 4.5: Simple slopes plot for SCxSD interaction predicting positive function .................. 106
Supplemental Figure 2.1: Individual White Matter Streamlines ................................................ 134
Supplemental Figure 3.1: S-GIMME analytical steps ................................................................ 154

ix
List of Appendices
Appendix 1: Chapter 2 Supplemental Methods .......................................................................... 124
Appendix 2: Chapter 2 Supplemental Results ............................................................................ 135
Appendix 3: Chapter 3 Supplemental Methods .......................................................................... 144
Appendix 4: Chapter 3 Supplemental Results ............................................................................ 155
Appendix 5: Chapter 3 Supplemental Data ................................................................................ 161
Appendix 6: Data Processing and Analysis Code ....................................................................... 167

x
Abstract
Dimensions of early adversity, such as violence exposure and social deprivation, may
have different effects associated with socioemotional functioning in the developing brain and
different factors may be protective. This dissertation examined the downstream effects of
childhood violence exposure and social deprivation in data from the Fragile Families and Child
Wellbeing Study at birth, and ages 1, 3, 5, 9, and 15 years. Study one examined the association
between violence exposure, social deprivation, and amygdala-prefrontal cortex white matter
connectivity, a crucial circuit for emotion regulation. High violence exposure coupled with high
social deprivation related to less amygdala–OFC white matter connectivity. Violence exposure
was not associated with white matter connectivity when social deprivation was at mean or low
levels (i.e., relatively socially supportive contexts). Therefore, social deprivation may exacerbate
the effects of childhood violence exposure on the development of white matter connections
involved in emotion processing and regulation. Conversely, social support may buffer against
them. Study two investigated the association between violence exposure, social deprivation, and
adolescent resting-state functional connectivity in two resting-state networks involved in
socioemotional functioning (salience network, default mode network) using a person-specific
modeling approach. Childhood violence exposure, but not social deprivation, was associated
with reduced adolescent resting-state density of the salience and default mode networks. A data-
driven algorithm, blinded to childhood adversity, identified youth with heightened violence
exposure based on resting-state connectivity patterns. Childhood violence exposure was
associated with adolescent functional connectivity heterogeneity, which may reflect person-

xi
specific neural plasticity and should be considered when attempting to understand the impacts of
early adversity on the brain. Study three examined whether school connectedness was protective
against violence exposure and social deprivation when predicting symptoms of internalizing and
externalizing psychopathology and positive function and if school connectedness was uniformly
protective against both dimensions of adversity. Results suggest that school connectedness is
broadly related to better outcomes and may confer additional protection against social
deprivation. These findings highlight the important role that the school environment can play for
youth who have been exposed to adversity in other areas of their lives. Additionally, the
interactive effect of school connectedness with social deprivation, but not violence exposure,
supports modeling risk and resilience processes using dimensional frameworks to better identify
specific groups of youth that may benefit from interventions that boost social connectedness at
school in future research. Overall, this dissertation provides evidence for the complex and
person-specific ways through which risk and resilience relate to development and points to
considerations for future research. This research has implications for understanding how
dimensions of adversity affect the brain and behavior during development and what factors can
be protective, which can inform future neuroscience-informed policy interventions.

1
Chapters
Chapter 1: Introduction
Early adversity is a potent and unfortunately common public health concern that has
impacts on physical and mental health during childhood, adolescence, and throughout the
lifespan (Green et al., 2010). Altered neural development is a hypothesized mechanism for the
effects of early adversity (McLaughlin et al., 2014). This dissertation examines how childhood
exposure to adversity shapes the adolescent brain using computationally sophisticated methods
that more accurately assess neural development. Importantly, many children exposed to early
adversity do not experience negative outcomes (Masten, 2001). Thus, this dissertation also aims
to identify protective factors that promote resilience. This research has implications for
understanding how dimensions of adversity affect the brain during development and what factors
can be protective, which can inform future neuroscience-informed policy interventions.
Adverse childhood experiences (ACEs) consist of a broad set of negative exposures
during childhood including physical and sexual abuse, emotional and physical neglect, violence
in the home and neighborhood, institutional rearing, and chronic poverty (Felitti et al., 1998;
Hughes et al., 2017). According to recent statistics, approximately 58% percent of adolescents
experience one ACE, 1 in 4 children experience some form of child maltreatment, and
approximately 40% are exposed to violence in the home or neighborhood (Finkelhor et al., 2015;
McLaughlin, Greif Green, et al., 2012; Sacks & Murphy, 2018). These statistics are particularly
alarming due to the associations of experiences of early adversity with a whole host of negative
physical health outcomes, such as metabolic syndrome, heart disease, autoimmune conditions,
and some cancers, as well as mental health outcomes, such as increased risk for internalizing

2
disorders (i.e., anxiety and depression), externalizing disorder, and substance use disorders
(Green et al., 2010; Nusslock & Miller, 2016). This increased risk is present in childhood and
persists through adolescence into adulthood (Green et al., 2010).
Exposure to early adversity impacts individual development in complex,
multidimensional ways. Seminal theories of development and developmental psychopathology
highlight the influence of the ongoing, reciprocal interactions between an individual and their
environment, or context, throughout the lifespan in the development of adaptive and maladaptive
outcomes (Bronfenbrenner & Morris, 2007; Cicchetti & Lynch, 1993; Masten & Cicchetti, 2010;
Sameroff, 2010; Sroufe, 2009). Environmental risk and protective factors come from multiple,
nested systems ranging from micro (e.g., parenting behaviors) to macro (e.g., societal attitudes
and ideologies) (Bronfenbrenner & Morris, 2007). These contextual influences interact with
individual-level biological and psychological variables to shape patterns of biological, socio-
emotional and cognitive development (Masten & Cicchetti, 2010; Sroufe, 2009; Wiggins &
Monk, 2013). The complex and probabilistic way through which adversity impacts the individual
explains the existence of multiple different approaches that attempt to shed light on how early
adversity shapes development.
The prevailing approach to studying early adversity has been the cumulative risk model
(Evans et al., 2013; Felitti et al., 1998; Sameroff et al., 1987). In this approach, the number of
ACEs that a person has experienced are tallied to create an index of cumulative risk across
multiple domains. The hypothesized physiological mechanism through which adversity affects
the brain and behavior is the body’s general stress response, including the hypothalamic-
pituitary-adrenal axis (HPA axis) (Evans & Kim, 2007; Koss & Gunnar, 2018). In the normal
HPA axis response to stress, the hypothalamus releases corticotropin-releasing factor, which

3
binds to receptors in the pituitary gland releasing adrenocorticotropic hormone (ACTH). ACTH
then binds to receptors in the adrenal gland which stimulates the release of cortisol, a commonly
measured stress hormone (Hyman, 2009). The allostatic load model describes how this normal,
healthy response to stress theoretically becomes harmful (McEwen, 1998). Allostasis is
adaptation in the face of potentially stressful challenges which involves activation of neural,
neuroendocrine and neuroendocrine‐immune mechanisms. These allostatic processes are
adaptive in many cases. However, with chronic exposure to multiple ACEs, allostatic systems
may either be overstimulated or not perform normally, which has been termed allostatic load, or
the price of adaptation. Over time, chronic high allostatic load is posited to lead to the negative
health outcomes associated with early adversity (McEwen, 1998).
The cumulative risk framework has been instrumental in predicting which kids may be at
an increased risk for negative outcomes and has underscored the importance of preventing
exposure to early adversity when possible (Sameroff, 1999). However, it does not aim to identify
the mechanism(s) through which early adversity can “get under the skin” and influence neural
developmental (McLaughlin et al., 2014; Schilling et al., 2008). Additionally, there is
considerable heterogeneity in the effect of early adversity on later physical and mental health
outcomes (Hughes et al., 2017). Part of this heterogeneity in outcomes may be the result of
treating all ACEs as the same and, perhaps, taking a more precise approach may help to parse not
only the mechanisms of influence, but also the heterogeneity of effects.
Focusing on specific types or categories of experience is another approach to studying
early adversity which take steps towards identifying mechanisms of influence on neural
development. There are multiple ways to do this. One approach is to investigate a single type of
adversity. For example, child neglect is hypothesized to affect how the ventral striatum functions

4
(Hanson, Hariri, et al., 2015) and child abuse is posited to alter the structure and function of
brain regions, such as the medial prefrontal cortex (PFC) (Kaufman et al., 2000). However, this
does not account for the complex, co-occurring nature of adversities. Additionally, these
categorical studies are often conducted with samples where participants are preselected based on
exposure to extreme adversity (i.e., institutional rearing) or a history a trauma-related
psychopathology (i.e., PTSD) (Hyde et al., 2020; Teicher & Samson, 2016). Research in these
samples is necessary and important; however, findings may not be generalizable to populations
who experience less extreme, but more common, exposures to adversity (e.g., low-income
families) (Hyde et al., 2020; Thapar & Rutter, 2019). Another way is to look at multiple
categories of risk simultaneously (Trentacosta et al., 2013). This approach is designed to address
multiple sources of exposure to early adversity in a single individual, but categorical exposures
are often linked to distinct mechanisms and may miss common mechanisms that exist across
multiple types of experiences (McLaughlin et al., in press). An approach that may provide
specific insight into distinct and relatively global mechanisms of influence and account for the
co-occurring, multidimensional nature of early adversity is a dimensional model of adversity
(McLaughlin et al., 2014).
Theoretical Framework: Dimensional Model of Early Adversity
Dimensional models of adversity are a relatively recent approach where the complex
experiences of early adversity are broken down into core underlying dimensions that have at
least partially distinct impacts of development (McLaughlin et al., in press). In the dimensional
model of adversity and psychopathology (DMAP), one of the first and more prominent
dimensional models, adversity is broken down into the two correlated, but separable, dimensions
of threat and deprivation (McLaughlin et al., 2014). Threat is defined as experiences that pose a

5
threat to an individual’s physical integrity, and deprivation is defined as the absence of expected
input and complexity in an individual’s environment (Sheridan & McLaughlin, 2014). The threat
and deprivation dimensions in the DMAP approach are hypothesized to influence brain
development through both distinct and potentially more global mechanisms. Hypothesized
mechanisms through which dimensions of adversity affect neural development include global
stress mechanisms, such as upregulation of the HPA-axis, similar to cumulative risk models.
However, dimensions of adversity are also hypothesized to influence development in more
specific ways through experience-driven plasticity (McLaughlin et al., in press; Nelson &
Gabard-Durnam, 2020). Threat is posited to influence the development of neural structure and
function involving fear-learning and emotion regulation circuits including regions such as the
amygdala, hippocampus, and ventromedial PFC. Alternatively, deprivation is posited to influence
regions of the brain that are responsible for integrating complex social and cognitive stimuli
including the PFC, superior/inferior parietal cortex, and superior temporal cortex (McLaughlin et
al., 2014; Sheridan & McLaughlin, 2014). This theoretical framework emphasizes that, although
these are theoretically distinct dimensions, these experiences frequently co-occur, so it is
important to include both simultaneously in models predicting effects on the brain and behavior.
Additionally, the DMAP framework acknowledges that these are likely not the only dimensions
of early adversity and hypothesize that unpredictability of the environment may be another
(McLaughlin et al., in press, 2014).
In work building on the DMAP approach, two dimensions of adversity, violence exposure
and social deprivation, have been proposed to alter neural structure and function, cortisol
function, and behavior in distinct ways (Hein et al., 2020; Peckins et al., 2019). The constructs
included in these dimensions aim to account for multiple levels of proximity to the individual

6
(i.e., home, neighborhood) to more comprehensively index exposure (Figure 1.1.)
(Bronfenbrenner & Morris, 2007; Sameroff, 2010). The violence exposure dimension, which is
similar to the threat construct in DMAP, includes experiences of abuse, exposure to intimate
partner violence in the home, and community violence (Hein et al., 2020). Social deprivation is a
more specific construct than the general deprivation dimension in DMAP which includes
experiences of neglect, a lack of intimate partner support for the mother in the home, and a lack
of neighborhood cohesion (Hein et al., 2020). Social deprivation is posited to influence areas of
the brain involved in reward processing, such as the ventral striatum (Hanson, Hariri, et al.,
2015; Hein et al., 2020). Violence exposure in childhood, but not social deprivation, has been
associated with a blunted amygdala response to threatening stimuli, a reduced habituation, or
adaptation, of the amygdala’s response to threatening stimuli, and blunted cortisol reactivity
following a socially evaluated cold pressor task in adolescence (Hein et al., 2020; Peckins et al.,
2019). This blunted amygdala response and cortisol reactivity diverges from extant literature on
child abuse and general early adversity research which has largely found increased amygdala and
cortisol reactivity with early adversity (for amygdala meta-analysis see Hein & Monk, 2016; for
cortisol review see Koss & Gunnar, 2018). However, that may be due to differences in sample
composition because the youth in both of these studies were exposed to relatively high levels of
disadvantage. Previous research in samples exposed to higher levels of chronic adversity has
found similar blunted amygdala reactivity (Gard et al., 2017; Holz et al., 2017). Additionally, the
disparate findings may be due to a moderating variable in the environment, such as social
support. Childhood social deprivation has been associated with blunted ventral striatum, an area
of the brain involved in reward processing, to happy faces, a socially rewarding stimulus in
adolescence (Hein et al., 2020). It has also been shown to moderate the association between

7
violence exposure and adolescent cortisol reactivity such that, when social deprivation is high,
compared to mean and low levels of social deprivation, the cortisol response is even more
blunted (Peckins et al., 2019). Interestingly, the observed changes in brain function correlated
with both violence exposure and social deprivation do not relate to adolescent psychopathology
(Hein et al., 2020) suggesting that these neural changes may not necessarily be detrimental for
adolescent outcomes.
Previous work examining the dimensional effects of childhood violence exposure and
social deprivation on adolescent outcomes has provided important and useful insights, but also
identify directions for future research. This work shows that childhood violence exposure and
social deprivation are associated with differences in brain functions in single regions of interest
(ROIs) and the stress response in distinct ways. Additionally, it shows that violence exposure and
social deprivation can interact to predict adolescent outcomes meaning that the environment of
adversity is likely unique for each individual and that multiple factors influence how adversity
“gets under the skin”. We do not know; however, how these dimensions of adversity influence
how different regions of the brain are connected and communicating with each other. Given the
lack of associations between the neural correlates of violence exposure and social deprivation
and psychopathology, we also do not know what factors are promoting resilience and are helping
the teens adapt to their environment of adversity. Perhaps given the interaction seen in Peckins et
al. (2019), where low levels of social deprivation buffered against the effects of violence
exposure, social support may play a role. This dissertation examines how childhood exposure to
violence is associated with white matter connectivity between the amygdala and PFC, regions of
the brain involved in socioemotional function and emotion regulation, and how social
deprivation may influence observed associations (study 1). Additionally, this dissertation

8
examines how violence exposure and social deprivation are associated with differences in
resting-state functional connectivity using a person-specific modeling approach which helps
account for the unique way the individual is affected by the environment of adversity (study 2).
Lastly, this dissertation aims to determine what factors may be protective against these
dimensions of adversity to help promote resilience (study 3).
Theoretical Framework: The Brain as a System
Traditionally, the neural impact of early adversity has been evaluated by quantifying the
task-dependent activation of a single ROI, such as the amygdala or the correlation of activation
in a pair of ROIs, for example, the amygdala and the subgenual anterior cingulate cortex (ACC)
(for review see McCrory et al., 2017). These methods are effective in identifying individual and
group differences in localized areas of the brain, but these functional specialization approaches
do not provide information on how different regions communicate and how that communication
affects neural function (Stevens, 2009). The brain is a system where regions of the brain do not
act in isolation, but rather interact with each other to influence perception, emotion, and
cognition (Pessoa, 2018). The interconnections between elements of a system, in this case
between neural ROIs, yield critical information about its purpose and function and may be more
defining of the system than the elements themselves (Meadows, 2008). Thus, studying the
connections between regions of the brain and how they are functionally communicating provides
valuable information that is more than the sum of individual ROIs.
Neural connectivity can be studied at multiple scales which each provide unique insight
into the brain. Analyses of full systems and reductionist approaches provide complimentary
information and are characterized by their own strengths and weaknesses (Meadows, 2008). A
more precise focus on the interconnections between a small number of ROIs can be studied with

9
more depth, while a focus on the connections within larger networks or the whole brain, provides
a wider breadth of understanding about how the brain is structured and functions. Thus, the
analysis of patterns of integration and interactions of networks of ROIs, on multiple scales, may
provide a better representation of underlying neural activity than any single scale alone (Menon,
2011).
Connectivity between regions of the brain can be studied using several modalities. Two
such modalities are diffusion magnetic resonance imaging (dMRI) to assess white matter
connectivity and resting-state functional MRI (fMRI) to examine spontaneous, non-directed
functional connectivity (Huettel et al., 2009). Each of these methods provide unique but
complementing information regarding how regions of the brain are communicating.
White Matter Connectivity
White matter in the brain consists largely of myelinated axons (Le Bihan et al., 2001).
When myelin, a fatty-sheath, coats axons, electrical action potentials travel at a more rapid pace,
thus facilitating communication between neurons and, at a larger level, regions of the brain
(Nave & Werner, 2014). This makes differences in white matter connectivity relevant for
understanding neural function. Previous work has found that white matter connectivity between
two regions of the brain is related to how those regions function (Goetschius et al., 2019; Hein et
al., 2018; Swartz et al., 2013).
White matter connectivity can be measured using multiple approaches which each have
strengths and weaknesses. Traditional tractography analysis, such as deterministic tractography,
utilizes diffusion tensor imaging data to estimate white matter tracts based on diffusion tensors or
metrics such as fractional anisotropy (FA) (Sherbondy et al., 2008). However, the specificity at
which this task can be accomplished is not at the axonal level but rather is limited to voxel level

10
analyses. This leaves a degree of uncertainty in the estimated white matter connectivity that is
not accounted for (Barbas, 2015; Behrens et al., 2007). While still limited to the voxel level,
probabilistic tractography accounts for that uncertainty by creating a probability density function
at each voxel that quantifies the probability of the white matter connectivity between a seed
region and the rest of the brain (Behrens et al., 2007). Additionally, traditional tractography
methods largely focus on large white matter bundles, such as the uncinate fasciculus. This
provides important information regarding larger white matter tracts; however, it obscures the
variation of white matter between specific structures (i.e., between the amygdala and specific
regions of the PFC) which can give nuanced insight into the structure of the brain (Goetschius et
al., 2019). Last, traditional tractography methods such as tract-based spatial statistics (TBSS)
only analyze white matter that is common across all included participants in a “group mean FA
skeleton” (S. M. Smith et al., 2006). This is a conservative approach to analyzing dMRI data that
has advantages; however, it does not allow for the analysis of individual heterogeneity of white
matter connectivity in the same way that probabilistic tractography does. Probabilistic
tractography tracts white matter connectivity at the subject level, so the length and specific
trajectory of white matter tracts are free to vary across individuals (Behrens et al., 2007), making
probabilistic tractography potentially better able to model person-specific heterogeneity in white
matter. This dissertation uses probabilistic tractography to map white matter connectivity
between the amygdala and multiple regions of the PFC (study 1) – a circuit which underlies
emotion processing and regulation (Phelps & LeDoux, 2005) that is posited to be influenced by
exposure to early adversity (Gee et al., 2013).
Resting State Functional Connectivity

11
Resting state functional connectivity (rsFC) examines neural activity in a non-goal
directed state in terms of the integration and segregation of networks posited to underlie sensory,
cognitive, emotive, and motor processes (Biswal et al., 2010; Finn et al., 2015). Analysis of rsFC
is a powerful tool for understanding the human brain for multiple reasons. First, task-related
increases in brain metabolism are generally small compared to the amount of energy used while
the brain is at rest (Raichle & Mintun, 2006). Thus, studying rsFC may provide a richer source of
variation in neural activity that is consuming much of the metabolic resources used by the brain
(Fox & Greicius, 2010). Additionally, the relatively low cognitive demand and short duration of
time in the scanner necessary for rsFC analyses make it a more feasible method for widespread
use, including in pediatric and clinical populations (Fox & Greicius, 2010; Uddin & Menon,
2010). Last, rsFC networks have been reliably identified (Finn et al., 2015), even in children
(Supekar et al., 2009; Thomason et al., 2011), are posited to be related to the functional
architecture of the brain (Stevens, 2009), have been useful in predicting behavioral outcomes,
such as general intelligence (e.g. Finn et al., 2015), and may be helpful in predicting the presence
of psychopathology, such as depression (e.g. Greicius et al., 2007).
Much of the work with task-based fMRI focuses on group averages. Although this is
helpful for examining gross trends in activation, the brain’s functional organization varies in
meaningful ways across the individual. Resting-state functional connectivity network analysis
are capable of detecting person-specific modulations in the BOLD signal (Finn et al., 2015;
Gates et al., 2014), highlighting the utility of using these networks as a tool for studying the
individual. This dissertation focuses on two networks which have previously been associated
with early adversity: the default mode network (DMN) and the salience network (SN) (study 2).

12
A description of these networks can be found below and their modulations in the context of early
adversity can be found in the subsequent section.
Salience Network. The salience network is a neural network including the dorsal ACC,
dorsolateral PFC, orbitofrontal cortex, insular cortex, and limbic structures such as the amygdala,
substantia nigra, and ventral tegmental area (Menon, 2011; Seeley et al., 2007). It is involved in
identifying and integrating relevant emotional, reward, interoceptive, and autonomic input to
guide behavior. Through interaction with default mode and the central executive networks, the
salience network acts in response to novel stimuli to transmit relevant information to other areas
of the brain (Uddin, 2017a).
Default Mode Network. The default mode network is the most widely studied rsFC
network and includes the posterior cingulate cortex, medial prefrontal cortex, hippocampus,
angular gyrus, and the medial temporal lobe and is associated with self-referential introspective
activity (Menon, 2011). This task-negative network is generally attenuated during cognitive
tasks, typically in relation to the cognitive demands of the task. The DMN has also been linked
to internal thought and memory retrieval, social-cognitive processes, reward-based decision
making, and emotion regulation (Etkin et al., 2011; Menon, 2011; Rangel et al., 2008).
A Network Neuroscience Approach to Early Adversity
Swanson and Lichtman (2016, p. 197) in a review of network neuroscience state that,
“the greatest challenge today is extracting knowledge and understanding of nervous system
structure-function architecture from vast amounts of data.” This statement highlights the
complexity of getting an accurate picture of how the human brain works, but it can be argued
that an even greater challenge is to understand how that structure-function architecture is shaped
by the external social context within which the individual develops. Research on how early

13
adversity affects neural networks is a growing literature that includes work focused on both
individual networks and whole brain functional connectivity. This dissertation is focused largely
on socioemotional function, thus the network research reviewed here will focus on networks and
interconnections associated with socioemotional function (i.e., emotion processing and
regulation and reward processing).
Much of the socioemotional work on the association between early adversity and white
matter in the brain has focused on the uncinate fasciculus – the major bundle of white matter
connecting, among other regions, the PFC and subcortical regions (Olson et al., 2015). This
work, although limited, has found that early adversity is related to weaker “structural integrity”
of the uncinate fasciculus (UF) as measured using fractional anisotropy (FA) (Eluvathingal et al.,
2006; Govindan et al., 2010; Hanson, Knodt, et al., 2015; Ho et al., 2017; M. J. Kim et al., 2019).
Interestingly, this white matter connectivity has been shown to moderate associations between
early adversity and internalizing disorders, such that in individuals with higher UF “structural
integrity”, there is not an association between early life stress and anxiety (M. J. Kim et al.,
2019). Other white matter tracts of interest include the corpus callosum, inferior and superior
longitudinal fasciculi. Research on these tracts has also largely found decreased “structural
integrity” in individuals exposed to higher amounts of early adversity (Bick et al., 2015; Choi et
al., 2012; Huang et al., 2012). Relatively little research on the association between early
adversity and white matter connectivity has utilized more precise methods of white matter
tracking, such as probabilistic tractography. One exception is a study focusing on child poverty
that found decreased white matter connecting regions of the brain involved in socioemotional
function, such as the amygdala and prefrontal cortex (D.-J. Kim et al., 2019).

14
Comparatively more research has focused on the effects of early adversity on rsFC.
Connectivity involving SN has been a focus of rsFC research on early adversity. In individuals
with exposure to child maltreatment, increased connectivity has been observed within the
salience network, potentially reflecting an exaggerated salience attributed to typical events
(Thomason & Marusak, 2017). This modulation in the SN has been related to psychopathology,
such as anxiety disorders, and may partially explain the increased vulnerability for the
development of anxiety disorders in youth exposed to childhood maltreatment (Marusak, Etkin,
et al., 2015; McCrory et al., 2017; Uddin, 2017b). Enhanced SN segregation (increased
connectivity within the SN) has also been associated with blunted reward sensitivity, a
behavioral trait seen in the child maltreatment literature and may contribute to increased latent
vulnerability for anxiety disorders, substance use, and depression (Marusak, Etkin, et al., 2015;
McCrory et al., 2017). Early adversity has been shown to alter functional connectivity of limbic
structures in the salience network, such as the amygdala, and the prefrontal cortex which
mediated associations with internalizing disorders in adolescents (Herringa et al., 2013) and
adults (Cisler et al., 2013).
The DMN is another target for research examining the impact of early adversity. In adults
exposed to child maltreatment, the DMN has exhibited altered connectivity including decreased
segregation of DMN nodes and attenuated deactivation of the DMN during demanding cognitive
tasks (Philip, Sweet, Tyrka, Price, Bloom, et al., 2013; Philip, Sweet, Tyrka, Price, Carpenter, et
al., 2013). Impaired DMN deactivation is associated with major depression, which may provide
insight into why early adversity is associated with an increased vulnerability for depression
(McCrory et al., 2017; Menon, 2011). Decreased integration of the SN and DMN has been
found in both children and adults exposed to early life adversity, which may reflect an inabili1ty

15
to disengage attention from salient stimuli leading to an increased vulnerability for the
development of psychopathology (Marusak, Martin, et al., 2015; Teicher et al., 2014; Thomason
& Marusak, 2017). Previous work has found that this disruption may be driven by the anterior
and posterior insula (Marusak, Etkin, et al., 2015; McCrory et al., 2017; Menon, 2011).
Extant research aimed at understanding how early adversity affects white matter and
functional connectivity is limited in multiple ways. First, much of the work has used
retrospective reports of early adversity in cross-sectional studies (i.e., Hanson, Knodt, et al.,
2015; Marusak, Etkin, et al., 2015). Second, relatively few studies of neural correlates of early
adversity, let alone the neural connectivity correlates, have been done in samples experiencing
higher levels of chronic adversity (for examples of work in samples with higher levels of
adversity, see Gard et al., 2017; Hein, 2019; Holz et al., 2017). Last, no previous work on either
structural or functional network connectivity has used the dimensional approach to early
adversity which may better capture the heterogeneity of early adversity. This dissertation aims to
address these gaps by examining how two dimensions of adversity, violence exposure and social
deprivation, are prospectively associated with differences in white matter (study 1) and
functional connectivity (study 2) using data from a longitudinal sample of youth who come from
largely disadvantaged environments.
An understanding of how early adversity affects the structure and function of neural
circuits can help create neuroscience-informed policies and interventions. Although effects of
early adversity are frequently discussed in terms of their effects on physical and mental health
outcomes, the mechanism through which they work may be neural (Dufford et al., 2019; Farah,
2018). With an appropriate research design, understanding neural correlates of early adversity
can lead to the identification of neural mechanisms driving behavioral change. These

16
mechanisms can provide targets to help design and measure the efficacy of interventions (Farah,
2018). Neural markers can be more sensitive predictors than behavioral ones which may aid in
early identification of those at risk for negative outcomes (Pavlakis et al., 2015). Additionally,
evidence for differences in neural circuits based on exposure to early adversity that complement
behavioral findings provide converging evidence for how the environment affects the brain
(Farah, 2018). Multiple sources converging bolsters findings and provides more support for
specific theories and interventions. The benefits of neuroimaging research are often discussed in
terms of differences in single regions of the brain; however, as previously discussed, this may
oversimplify the complexity of the brain. Thus, early adversity-related differences in neural
circuits and networks may be of even more benefit to interventions and policy because they more
accurately model the complex brain (Dufford et al., 2019).
An important caveat to discuss when studying the neural correlates of early adversity is
that differences in the brain are not necessarily reflective of deficits or a “broken brain”
(Tolwinski, 2019). The brain is remarkably plastic, so alterations in neural circuitry may reflect
adaptations to the environment that improve outcomes in certain situations and promote
resilience (McEwen, 2016; Teicher et al., 2016). Additionally, it is possible that differences in the
brain that are associated with negative outcomes can be compensated for with environmental
interventions and support. This is particularly the case if identified early in development when
the brain is more plastic highlighting importance of research studying the effects of early
adversity on development (McEwen, 2012, 2016).
Resilience to Early Adversity
Across the lifespan, both risk and protective factors interact within the individual to shape
development (Cicchetti, 2010). These factors exist at multiple levels within the individual and

17
their environment (i.e., home, community, culture) and are person-specific as evidenced by
multifinality in developmental outcomes in response to adversity (Cicchetti & Lynch, 1993;
Cicchetti & Rogosch, 1996; Hughes et al., 2017). Contributing to individual differences in these
effects is resilience, or having positive outcomes in the context of adversity (Masten, 2001).
Factors promoting resilience include individual characteristics such as adaptable temperament, a
positive view of the self, and hopefulness for the future. Outside of the individual, environmental
factors such as high neighborhood quality, effective schools, and good health care seem to be
protective. In addition, many aspects of the individual’s social relationships appear to promote
positive outcomes suggesting that the presence of social support is a strong predictor of
resilience (Ceballo & McLoyd, 2002; Ozbay et al., 2007; Wright et al., 2013).
School connectedness, or how safe, happy, and secure a child feels in their school
environment, is an aspect of social support that has been linked not only to improved academic
outcomes, but also overall improved adaptive function (C. E. Foster et al., 2017). School
connectedness as a buffer is rooted in the risk and resilience framework, which posits that factors
that promote developmental competency may also promote resilience to early adversity (Luthar
et al., 2000). Previous research has found connectedness to school to be protective against
violence in the neighborhood (Hardaway et al., 2012). Additionally, it has been posited to
compensate for lower support in other areas of a youth’s life (e.g., the home or neighborhood)
(Loukas et al., 2010). School connectedness may be a particularly advantageous target for
interventions because it is a potentially socially modifiable factor (H. Foster & Brooks-Gunn,
2009; McNeely et al., 2002).
Protective factors can work through different processes that are defined based on who
they are protective for and how that protection differs across risk level (Luthar et al., 2000)

18
(Figure 1.2). They can be promotive, meaning that they promote positive outcomes for everyone
in all situations (Sameroff, 2010). This would be observed statistically as a main effect of a
certain factor. Additionally, these relationships can be more complex involving interactions
between multiple variables. For example, a protective variable can be protective-stabilizing,
where, in the context of increasing risk, having a certain attribute present results in no decrease
in rates of the positive outcome (H. Foster & Brooks-Gunn, 2009; Luthar et al., 2000).
Conversely, a protective variable can be protective but reactive, where it promotes positive
outcomes, but less so as environmental risk or stress increases (Luthar et al., 2000; Proctor,
2006). Lastly, factors can be protective-enhancing, where having that attribute is associated with
more positive outcomes as risk increases (Luthar et al., 2000). The different ways that protective
factors can promote resilience highlight the multidimensional nature of adversity and the need to
study them in multiple contexts and on multiple outcomes.
Current research on resilience, including the extant literature on the protective effects of
school connectedness, is limited. First, it often takes a deficit approach, meaning that it is
focused on alleviating or avoiding negative outcomes rather than promoting positive outcomes in
a strengths-based perspective (Masten & Cicchetti, 2016). Additionally, we know that the
environment of adversity is complex; however, much of the research on resilience treats
adversity as either a single construct or focuses on a single category of adversity. Both of these
methods may oversimplify the impact of early adversity and may obscure protective factors that
more selectively promote resilience. This dissertation aims to overcome both of those limitations
by examining how two dimensions of adversity, violence exposure and social deprivation,
predict both positive and negative developmental outcomes and how school connectedness may
influence those associations (study 3).

19
Specific Aims of this Dissertation
The purpose of this dissertation is to understand how early adversity shapes the brain and
behavior and what factors in the environment protect against adversity. Much of the research
examining this question has been done in white, middle-class samples using retrospective reports
of early adversity (Dufford et al., 2019; Falk et al., 2013). More research is needed which
prospectively asks these questions in samples that include families living in socioeconomically
disadvantaged contexts, who are more at risk for exposure to violence and social deprivation
(McLaughlin, Costello, et al., 2012; McLoyd, 1998).
All three chapters in this dissertation use data from the Fragile Families and Child
Wellbeing Study (FFCWS) (Reichman et al., 2001). The FFCWS is a population-based sample
of approximately 5000 children born in large US cities, with an oversample of non-marital births
which led to inclusion of a large proportion of low-income and minority families (Reichman et
al., 2001). These sample characteristics make the FFCWS an appropriate sample to examine how
early adversity prospectively shapes development. In the FFCWS, data were collected from the
mother, father (if available), the primary caregiver (most frequently the mother), and the focal
child at the birth of the focal child, and again when the child was 1, 3, 5, 9, and 15 years of age
through a combination of in-home and phone visits (Public Data Documentation for FFCWS,
2019). Variables used to measure early exposure to two dimensions of adversity, violence
exposure and social deprivation, were calculated from FFCWS data from waves at ages 3, 5, and
9 years (Figure 1.1). At age 15, a subsample of 237 teens and their families from Detroit, Toledo,
and Chicago, came to University of Michigan to participate in the Study of Adolescent Neural
Development (SAND Subsample). Informed consent was provided by the parent/legal guardian

20
and informed assent from the subject (UM IRBMED: HUM00074392). Diffusion (dMRI - white
matter connectivity) and resting-state MRI data were collected during this visit.
Study 1 (Chapter 2): Childhood violence exposure and social deprivation predict
adolescent amygdala-orbitofrontal cortex white matter connectivity [SAND Subsample]
Aim 1: Determine whether childhood violence exposure is associated with adolescent
amygdala-PFC (orbitofrontal and dorsomedial PFC) white matter function.
Aim 2: Determine whether childhood exposure to social deprivation moderates the
association between violence exposure and adolescent white matter.
Study 2 (Chapter 3): Neural sequelae of early adversity: Childhood violence exposure
predicts patterns of adolescent resting-state connectivity [SAND Subsample]
Aim 1: Determine if childhood exposure to violence or social deprivation are associated
with network density of the salience and default mode networks in adolescence.
Aim 2: Determine if childhood exposure to violence or social deprivation are associated
with node degree for 4 nodes in the salience network and 3 nodes in the default mode
network (per hemisphere) in adolescence.
Aim 3: Determine if data driven subgroups can be identified in the adolescent resting-
state MRI data and if subgroup membership is associated with childhood violence
exposure or social deprivation.
Study 3 (Chapter 4): School connectedness as a protective factor against childhood
exposure to violence and social deprivation: Evidence of resilience and risk from a
longitudinal sample [Full FFCWS Sample]

21
Aim 1: Determine whether childhood exposure to violence and social deprivation
predicts child or adolescent internalizing and externalizing psychopathology and
adolescent positive function.
Aim 2: Determine whether school connectedness at either age 9 or 15 moderates
observed associations between childhood dimensions of adversity and behavioral
outcomes.

22
Figure 1.1: Violence exposure and social deprivation conceptual figure
Composite scores for these dimensions were created from data collected from the FFCWS study
waves at ages 3, 5, 9.
Violence Exposure
Social Deprivation

23
Figure 1.2: Protective processes conceptual figure
Hypothetical plots representing the different definitions of protective processes.

24
Chapter 21: Childhood Violence Exposure and Social Deprivation Predict Adolescent
Amygdala-Orbitofrontal Cortex White Matter Connectivity
Childhood adversity is common and predicts a host of negative mental and physical
health outcomes (Sacks & Murphy, 2018). Such experiences also shape the neural circuitry
underlying emotion processing and regulation (Hein & Monk, 2017). Here, we examined a
predominantly low-income sample of adolescents who have been followed since birth to better
understand how specific dimensions of early adversity prospectively shape adolescent white
matter connectivity between the amygdala and subregions of the prefrontal cortex (PFC), as well
as the association between this white matter and amygdala reactivity during socioemotional
processing.
Examining dimensions of adversity, that are modeled separately from socioeconomic
status, may elucidate how complex experiences influence the brain and may contribute to
negative consequences (Amso & Lynn, 2017; McLaughlin et al., 2014). Previous research
highlighted two core dimensions – threat and deprivation – that have roots in neurobiological
research (McLaughlin et al., 2014). Further, behavioral research using this dimensional
framework found that modeling the dimensions as cumulative exposure compared to a binary
incidence variable (i.e., whether the person had experienced threat or deprivation) better
predicted child outcomes (Wolf & Suntheimer, 2019). The present study examined two similar
dimensions: (1) violence exposure and (2) social deprivation. Violence exposure is characterized
1 Chapter 2 corresponds to Goetschius et al., 2020 published in Developmental Cognitive Neuroscience

25
by witnessing or being the victim of home and community violence. Social deprivation is
defined as a lack of home and community emotional support (Hein, 2019). These dimensions
exist on continua: violence exposure ranges from low (i.e., safety) to high and social deprivation
from low (i.e., high levels of home/neighborhood support) to high (i.e., lack of support).
Violence exposure is posited to alter regions of the brain involved in fear learning and emotion
regulation, including the amygdala and PFC (McLaughlin et al., 2014). Compounding the stress
of violence exposure, co-occurring social deprivation may exacerbate the effects of violence
exposure and, conversely, low social deprivation (i.e., social support) may act as a buffer
(Sheridan et al., 2018; Sonuga‐Barke et al., 2010).
Diffusion MRI (dMRI) work in this area is limited and has yielded mixed results
(McLaughlin et al., 2019). Moreover, to date, the potential effects of different types of adversity
(i.e., threat versus deprivation) on white matter connectivity have not been investigated
simultaneously within the same analyses to understand how these complex exposures shape the
brain. Retrospective reports of early social deprivation (i.e., neglect) have been associated with
decreased strength of structural connections between the amygdala and PFC (Hanson, Knodt, et
al., 2015; Ho et al., 2017). Additionally, one study found that retrospective reports of threat,
specifically, trauma were associated with increased strength of the uncinate fasciculus (Gur et al.,
2019), the major bundle of white matter connecting the PFC and subcortical regions (Olson et
al., 2015). However, reported studies have also found null effects of threat, deprivation, or mixed
exposures on the fronto-amygdala white matter (Bick et al., 2015; Dennison et al., 2016; Park et
al., 2016). The vast majority of existing dMRI work examining adversity, though not all (D.-J.
Kim et al., 2019), has used diffusion tensor imaging (DTI) (Hanson, Knodt, et al., 2015; Ho et
al., 2017) which measures bundles of white matter in aggregate. Much of the DTI literature on

26
adversity has focused on the uncinate. However, DTI does not permit precise mapping of white
matter tracts between specific structures, such as the amygdala and particular PFC subregions.
Probabilistic tractography uses dMRI to precisely map white matter tracts between
structures (Behrens et al., 2007). This method, in a smaller subset of the current sample, showed
that amygdala white matter connectivity with the orbitofrontal cortex (OFC – Brodmann’s Area
(BA) 47, 11), dorsomedial PFC (BA10), and subgenual cingulate (BA25) was greater than
amygdala white matter connectivity with other PFC regions, such as the dorsal anterior cingulate
and dorsolateral PFC (Goetschius et al., 2019). Non-human primate studies also provide support
for specific amygdala connectivity with the OFC, dmPFC, and subgenual cingulate (Ray & Zald,
2012; Zikopoulos et al., 2017). Additionally, our previous work revealed that adolescents with
less white matter connectivity between the amygdala and the OFC (right BA47, left BA11) and
dmPFC (bilateral BA10), but not the dorsolateral PFC, anterior cingulate, or subgenual cingulate,
showed greater amygdala activation to threatening faces (Goetschius et al., 2019). Thus, the
OFC, dmPFC, and subgenual cingulate seem to be well-connected via white matter to the
amygdala. Additionally, amygdala–OFC and amygdala–dmPFC connectivity may play an
important role in emotion processing and regulation; however, the effect of dimensional
adversity on this white matter has not yet been examined.
Building on Goetschius et al. (2019), we used probabilistic tractography to assess
whether violence exposure across childhood (ages 3, 5, 9 years) predicted adolescent (15-17
years) amygdala–PFC white matter connectivity with a focus on OFC, dmPFC, and subgenual
cingulate subregions in a longitudinal, sample with a substantial representation of African
American and low-income participants — populations that are underrepresented in neuroimaging
research (Falk et al., 2013). We also examined whether the degree of social deprivation in

27
childhood predicted adolescent amygdala–PFC white matter microstructure through interaction
with violence exposure. We hypothesized the following: childhood violence exposure would be
associated with adolescent amygdala–PFC white matter connectivity; and the interaction
between childhood violence exposure and social deprivation would be associated with white
matter connectivity such that the effects of high violence exposure would be buffered by
decreasing social deprivation. In addition, because Goetschius et al. (2019) was conducted on a
smaller subsample (N = 141) of the data used in the present study, and utilized a different
diffusion data cleaning pipeline, we attempted to reproduce the associations observed between
amygdala–PFC white matter connectivity and amygdala activation in the current, full sample (N
= 152).
Materials & Methods
These hypotheses, variables, and analyses were preregistered with the Open Science
Framework (https://osf.io/spguw) and the data will be available on the NIMH Data Archive
(https://nda.nih.gov/edit_collection.html?id=2106). Prior to preregistering these hypotheses, we
had examined the diffusion MRI data on the 141 participants (Goetschius et al., 2019). In this
analysis, we examined how the probability of amygdala–PFC white matter connectivity
predicted amygdala reactivity to threatening faces; however, we had not evaluated any
associations between the early environment and diffusion MRI data.
Participants
One hundred eighty-three adolescents (15-17 years) sampled from the Detroit, MI,
Toledo, OH, and Chicago, IL sites of the Fragile Families and Childhood Wellbeing Study
(FFCWS) were included in the present study (see Table 2.1 for sample demographics and
exclusion criteria). The FFCWS is a population-based sample of children born in large US cities,

28
with an oversample of non-marital births (~3:1) (Reichman et al., 2001). When weighted, the
FFCWS represents children born at the turn of the century in American cities of 200,000 or
more. When not weighted (as here), given the oversample for non-marital births, the sample
represents mostly low-income, urban families. Given the demographics and sample sizes in
Detroit, Toledo and Chicago (Hein et al., 2018), a majority of the sample identified as African
American. FFCWS families were interviewed at the birth of the focal child, and again when the
child was 1, 3, 5, 9, and 15 years of age. The University of Michigan Medical School IRB
approved this study (UM IRBMED: HUM00074392). Informed consent was obtained from the
parent/legal guardian for both their participation and their teen’s participation and informed
assent from the adolescent. These data overlap with prior work from our research group: fMRI
and dMRI data, but no environmental data (Goetschius et al., 2019; Hein et al., 2018); violence
exposure and social deprivation composites, but no MRI (Peckins et al., 2019).
Behavioral Measures
Childhood Violence Exposure and Social Deprivation Composite Scores
Violence exposure and social deprivation were assessed using composite scores
calculated using data from the Fragile Families and Child Wellbeing study at ages 3, 5, and 9
years. Both constructs included primary caregiver or mother report of experiences that directly
(i.e., child physical and emotional abuse, child physical and emotional neglect) and indirectly
(i.e., intimate partner emotional, physical, or sexual violence against mother, intimate partner
support for mother, community violence, community support) affect the child. The primary
caregiver was primarily a biological parent or family member. One participant’s primary
caregiver was not a relative. No participants were in the foster care system. We considered
violence exposure to exist on a continuum where higher scores represented more violence

29
exposure, and lower scores represented more safety. We considered social deprivation to exist on
a continuum where higher scores (e.g., where the child experienced either more neglect or
witnessed less social support for their mother or less neighborhood social cohesion)
approximated deprivation and lower scores (e.g., where the child experienced less neglect or
witnessed more social support for their mother or more neighborhood social cohesion)
approximated social support. Our approach of including experiences with varying levels of
proximity to the child across multiple time points allowed us to comprehensively assess the
child’s cumulative, dimensional exposure to violence and social deprivation across childhood as
has been done in previous research (Hein, 2019; McLaughlin & Sheridan, 2016). With this
approach, we did not unpack the effect of proximal versus distal experiences, the effect of the
developmental timing of exposures; however, those are important future research directions.
These composite scores were first utilized in previous work from our group (Hein, 2019). All
items at each time point were weighted equally. See Appendix 1 for specific items and the scales
that they come from.
To calculate composite scores, the Z scores (zero-centered) for each of the childhood
experiences (child abuse, exposure to intimate partner violence, community violence, child
neglect, lack of romantic partner support, lack of neighborhood social cohesion) were summed
for each of the childhood experiences within a cumulative dimension (violence exposure and
social deprivation) (Song et al., 2013) and then divided by the number of childhood experiences
within a dimension for each participant, thus maximizing the number of participants and the
diversity of the sample by minimizing drop out due to missing data at any given wave. This
means that a score of 0 is approximately average for the sample for that dimension. Scores
greater than 0 represent higher than average violence or social deprivation and scores below 0

30
represent low violence or low social deprivation (i.e., social support). We then mean-centered the
scores for violence exposure and social deprivation and created an interaction term (Hein, 2019).
In our sample, violence exposure and social deprivation were correlated at r(181) = 0.50, t =
7.69, p < 0.001, but the variance inflation factor (VIF) was 1.326 (Figure 2.1, Table 2.2). VIF
reflects how much the estimated regression coefficients are increased due to collinear
independent variables. Cutoffs are typically between 5–10, therefore, based on the VIF reported
here, the multicollinearity of violence exposure and social deprivation was low (Craney &
Surles, 2002; Sheather, 2009).
Gender Identification (Faces) fMRI Task
During fMRI data collection, participants completed an event-related emotional faces
task in which they were instructed to identify to the gender of emotional faces displaying one of
five emotions: fearful, happy, sad, angry, neutral. Details of the task are in the Appendix 1 (and
see Goetschius et al., 2019; Hein et al., 2018). Participants who achieved less than 70% accuracy
on the Faces Task were excluded (N = 15). Average task accuracy was 94.74%.
Covariates
To address potential confounds, the present analyses adjusted for race/ethnicity, maternal
education at birth, and maternal marital status at birth. We controlled for maternal marital status
at birth due to the oversampling of non-marital births in the FFCWS study (Reichman et al.,
2001). Additionally, we adjusted for adolescent pubertal development, adolescent internalizing
psychopathology and adolescent life stress to ensure that observed effects were not driven by
these adolescent factors. Adolescent internalizing psychopathology was assessed using a multi-
method, multi-informant latent factor score constructed from the following measures: (1) K-
SADS (Kaufman et al., 1997) clinician report of past and current symptoms of dysthymia, social

31
phobia, generalized anxiety disorder, major depression, and phobia and (2) parent and child
report on the Mood and Feelings Questionnaire (Angold et al., 1987), Child Depression
Inventory (Helsel & Matson, 1984), and the Screen for Child Anxiety Related Disorders
(Birmaher et al., 1997) (See Appendix 1 and Hein, 2019 for more detail including the CFA fit
statistics). Current life stress was used as a covariate in the present analyses and was measured
using the Adolescent Life Events Scale (adapted for Shaw et al., 2003 from Farrell et al., 1998
and Masten et al., 1994). This scale assesses the experience of common adolescent stressful life
events in the past year. Descriptive statistics for all covariate variables are in Table 2.2. See
Appendix 1 for more information on how covariates were measured. All analyses were done with
and without covariates.
MR Measures - Adolescence
MR images were acquired using a GE Discovery MR750 3T scanner with an 8-channel
head coil located at the UM Functional MRI Laboratory. Head movement was minimized
through: (a) instructions to the participant and (b) padding and pillows placed around the head,
which are well-tolerated, yet limit motion. These procedures have been outlined in previous work
(Goetschius et al., 2019; Hein et al., 2018).
T1-weighted gradient echo images were taken before the functional scans using the same
field of view (FOV) and slices as the functional scans (TR = 9.0 seconds, TE = 1.8 seconds, TI =
400 ms, flip angle = 15, FOV = 22 cm; slice thickness = 3 mm; 256 x 256 matrix; 40 slices).
DMRI data were collected using a spin-echo EPI diffusion sequence (scan parameters: TR
7250ms, Minimum TE, 128x128 acquisition matrix, 22 cm FOV, 3 mm thick slices (no gap), 40
slices acquired using an alternating-increasing order, b value = 1000 s/mm2, 64 non-linear
directions, five b=0s/mm2 T2 images (b0) acquired). Functional MRI (fMRI) T2*-weighted

32
BOLD images were acquired using a reverse spiral sequence (Glover & Law, 2001) of 40
contiguous axial 3 mm slices (TR = 2000 ms, TE = 30 ms, flip angle = 90, FOV = 22 cm, voxel
size = 3.44mm x 3.44mm x 3mm, sequential ascending acquisition).
Slices were prescribed parallel to the AC-PC line (same locations as structural scans).
Images were reconstructed into a 64x64 matrix. Slices were acquired contiguously, which
optimized the effectiveness of the movement post-processing algorithms. Images were
reconstructed off-line using processing steps to remove distortions caused by magnetic field
inhomogeneity and other sources of misalignment to the structural data, which yields excellent
coverage of subcortical areas of interest.
dMRI Processing
Diffusion images were converted from DICOM to NIFTI format using MRIcron
(dcm2niix – 2MAY2016) for offline analysis using MRtrix (v.3.0.R3) (Veraart et al., 2016) and
the FSL (v. 5.0.9) FMRIB's Diffusion Toolbox (FDT) (v. 3.0) (Jenkinson et al., 2012) (see
Appendix 1 for more processing details).
DMRI data were then processed using probabilistic tractography in FSL. This involved
building a distribution of diffusion parameters at each voxel using bedpost (Hernández et al.,
2013) and estimating the probability of amygdala–PFC white matter connectivity for 4 PFC
ROIs bilaterally (8 total) using probtrackx (Hernandez-Fernandez et al., 2016) (Appendix 1).
Those ROIs were BA10, BA11, BA25, and BA47 and they were selected due to a previous
stronger likelihood of amygdala white matter connectivity in our previous work (Goetschius et
al., 2019). ROIs, including both seed amygdalae (AAL Atlas) and target PFC regions (TD
Brodmann’s Areas) were created from masks in WFU PickAtlas (Maldjian et al., 2003). The
maximum-likelihood of amygdala–PFC connectivity was then extracted for each individual from

33
a group-level peak (6mm sphere around peak point) identified for each ROI (Greening &
Mitchell, 2015) (details in Appendix 1). The MNI coordinates (x,y,z) for the peak for each target
are as follows: BA10 (left: -30, -4, -14; right: 32, -2, -12), BA11 (left: -30, -4, -14; right: 32, -2, -
14), BA25 (left: -16, 0, -14, right: 18, 0, -14), BA47: (left: -30, -4, -14; right: 34, 0, -20).
In the present study, we did not use waypoint or termination masks in the probabilistic
tractography analysis. Thus, we cannot guarantee that streamlines did not cross the midline or
enter the temporal pole. However, this does not appear to be the case for the measured
connections here based on the average streamline images (Supplemental Figure 2.1 in Appendix
1).
The dMRI processing approach used (i.e., from bedpostx through data extraction) was
identical to a previously reported analysis; however, the present study’s sample size was larger
(N=152 with both usable fMRI and dMRI data compared to N=141) because the dMRI data were
processed for artifacts using a different, more reliable, and automated method that allowed us to
retain more subjects (Andersson et al., 2017; Andersson & Sotiropoulos, 2016; Veraart et al.,
2016). Due to the increased sample size and different dMRI cleaning method, we needed to
reproduce the associations with amygdala activation seen in Goetschius et al. (2019).
fMRI Processing
First-level statistical analyses for functional activation were performed using the general
linear model implemented in SPM12. For each participant, conditions were modeled with the
SPM12 canonical hemodynamic response function. Incorrect trials were modeled as a separate
condition and were not included in subsequent analysis. A statistical image for each condition
contrast in the Faces Task at each voxel was generated. Mean activation was extracted for both
the left and right amygdala using MarsBaR (v. 0.44) (Brett et al., 2002) from the contrast image

34
representing a combination of threat (fear + anger) trials vs. baseline (Goetschius et al., 2019;
Hein et al., 2018). ROI masks used in the extraction were created using the left and right
amygdala from the AAL Atlas in WFU Pickatlas (Maldjian et al., 2003).
Statistical Analysis
Preregistered Analyses
To determine how childhood exposure to violence and social deprivation at ages 3, 5, and
9 years were associated with amygdala–PFC white matter connectivity, we performed eight
multiple regression analyses – one for each amygdala-PFC target pair (bilateral BA10, BA11,
BA25, BA47). In each regression analysis, we first ran the analysis without any covariates. Then,
we controlled for a list of preregistered covariates, including participant gender (male or female),
race (African American, Caucasian, or Other), maternal education at birth, maternal marital
status at birth). Additionally, in a separate analysis, we controlled for three variables that we did
not pre-register, pubertal status, current life stress, and the internalizing disorders latent factor
score (Hein, 2019), in addition to the preregistered covariates, though none of these variables
changed the overall effect. We used a Bonferroni-corrected significance threshold based on those
eight ROIs (p<0.05/8 tests per hemisphere = 0.0063). To interpret significant interactions, simple
slope and regions of significance analyses were conducted to determine the nature of the
interaction and ensure that the interaction was within our observable data using methods outlined
by Preacher et al., (2006).
Our main preregistered analysis plan proposed a structural equation model (SEM) where
childhood dimensions of early adversity predicted internalizing psychopathology in a way that
was mediated by amygdala–PFC white matter connectivity. We did not continue with this
analysis plan when white matter connectivity was not significantly associated with internalizing

35
psychopathology (Appendix 2). Thus, we proceeded with our secondary analysis plan to examine
the pieces of the SEM using multiple regression, including the violence exposure x social
deprivation interaction. We did not have adequate statistical power to perform a moderated-
mediation model to examine the interaction in a larger SEM framework given the likely small
effect size (Preacher et al., 2007).
Non-preregistered Analyses
Due to the use of an automated diffusion MRI data cleaning and artifact detection method
which increased sample size, we reproduced the associations between amygdala–PFC white
matter connectivity and amygdala activation that were previously reported where amygdala–
OFC (right BA47, left BA11) and amygdala–dmPFC (bilateral BA10) white matter connectivity
was associated with amygdala reactivity (Goetschius et al., 2019). To do this, we performed eight
regressions predicting ipsilateral amygdala activation to threat faces from amygdala–PFC white
matter connectivity – one for each amygdala-PFC target pair (bilateral BA10, BA11, BA47,
BA25). In these regressions, we used a Bonferroni-corrected significance threshold (p=0.05/8
tests=0.0063).
Results
Probabilistic tractography was used to estimate the white matter connecting the amygdala
with all eight PFC targets (bilateral BA10, BA11, BA25, BA47). For a visual representation, see
figure 2.2.
Violence Exposure x Social Deprivation predicted right hemisphere amygdala–OFC white
matter connectivity
The interaction between violence exposure and social deprivation significantly predicted the
probability of right hemisphere amygdala–BA47 (OFC) white matter connectivity (Table 2.3).

36
This association held when adjusting for our pre-registered covariates (gender, race, maternal
education at birth, and maternal marital status at birth) ( =-0.319, p=0.004) and non-
preregistered covariates (pubertal status, current life stress, and internalizing psychopathology in
addition to the preregistered covariates) ( =-0.317, p=0.005). Contrary to our preregistered
hypotheses, there were no main effects of violence exposure or social deprivation. To better
understand the interaction in the context of our data, simple slopes and regions of significance
are plotted in Figure 2.3. Simple slopes analysis revealed that when social deprivation was 0.78
or greater, violence exposure and probability of white matter were inversely related ( = -0.29, p
= 0.048). When social deprivation was 1 standard deviation below the mean, there was no
association between violence exposure and amygdala–OFC white matter connectivity ( = 0.02,
p = 0.209). Thus, in our data, at relatively high values of social deprivation, violence exposure
was related to a lower likelihood of amygdala–OFC connectivity, suggesting that violence
exposure had the greatest association with amygdala–OFC white matter connectivity when social
deprivation was also high.
Violence Exposure x Social Deprivation predicted right hemisphere amygdala–dmPFC
white matter connectivity
The interaction between violence exposure and social deprivation significantly predicted
the probability of right hemisphere amygdala–BA10 (dorsomedial prefrontal cortex - dmPFC)
white matter connectivity ( =-0.268, p=0.011). This interaction, however, did not remain
significant when controlling for the demographic covariates ( =-0.185, p=0.091) (Supplemental
Table 2.3 in Appendix 2). There were no main effects of violence exposure or social deprivation
on right hemisphere amygdala–BA10 white matter connectivity.

37
Greater amygdala–OFC and amygdala–dmPFC white matter connectivity was related to
attenuated amygdala reactivity
We reproduced results from previous analyses (Goetschius et al., 2019). The probability
of amygdala white matter connectivity significantly predicted ipsilateral amygdala activation to
threatening (fearful and angry) faces for the four PFC regions where it was previously related
(bilateral BA10, left BA11, right BA47), even when adjusting for the specified covariates, using
a hemisphere Bonferroni-corrected significance level (0.05/8 = 0.0063) such that increased
probability of white matter was associated with decreased amygdala activation (Table 2.4).
Additionally, amygdala–PFC white matter connectivity was not related to amygdala reactivity in
regions where it had not been related in our previous report (right BA11, bilateral BA25, left
BA47) (Supplemental Table 2.10 in Appendix 2).
Null findings
Violence exposure, social deprivation, or their interaction did not significantly predict the
likelihood of left hemisphere amygdala–BA10 white matter connectivity, left hemisphere
amygdala–BA47 white matter connectivity, bilateral amygdala–BA11 white matter connectivity,
or bilateral amygdala–BA25 white matter connectivity (Supplemental Tables 2.4-2.9 in
Appendix 2).
Discussion
Using an open science framework and preregistered hypotheses, the present study
examined how two dimensions of adversity - violence exposure and social deprivation - were
associated with structural connectivity between the amygdala and OFC in the right hemisphere, a
critical circuit for emotion processing and regulation. Whereas, contrary to our hypotheses, there
were no main effects of the two dimensions on white matter connectivity, the interaction of

38
violence exposure and social deprivation at ages 3, 5, and 9 prospectively predicted the degree of
right amygdala–OFC white matter connectivity in adolescence. Specifically, the combination of
more violence exposure and more social deprivation in childhood prospectively predicted less
amygdala–OFC white matter connectivity in adolescence; however, violence exposure was not
associated with white matter connectivity when social deprivation was at mean or low levels
(i.e., when children were in relatively socially supportive contexts). Thus, social deprivation may
exacerbate the effects of childhood violence exposure on the development of white matter
connections whereas social support may act as a buffer. This interaction remained even after
adjusting for gender, race, pubertal development, current internalizing psychopathology, current
life stress, maternal marital status at birth, and maternal education at birth. Importantly, the work
was conducted in a well-sampled cohort of adolescents with high rates of poverty and a large
proportion of African Americans, groups that are understudied in neuroimaging research (Falk et
al., 2013).
As a secondary objective, we reproduced in an expanded, overlapping sample
(Goetschius et al., 2019) the finding that increased amygdala–OFC and amygdala–dmPFC white
matter connectivity was associated with attenuated amygdala-reactivity to threat faces. This
association remained after adjusting for gender, race, pubertal development, current internalizing
psychopathology, current life stress, maternal marital status at birth, and maternal education at
birth. When considered in conjunction with the violence exposure by social deprivation
interaction, these findings suggest that early adversity shapes white matter connections that
modulate the amygdala, a structure involved in threat processing (Phelps & LeDoux, 2005).
The association between violence exposure and decreased amygdala–OFC white matter
connectivity in the context of social deprivation builds on prior work (for review, see

39
McLaughlin et al., 2019). Extant dMRI research indicates that child maltreatment or trauma are
generally, but not exclusively (Gur et al., 2019), associated with both weaker structural
connectivity within the uncinate fasciculus (Govindan et al., 2010; Hanson, Knodt, et al., 2015;
Ho et al., 2017) and weaker global structural connectivity, including within the OFC (Puetz et al.,
2017). Additionally, consistent with the present findings, fMRI work found that violence
exposure is associated with altered amygdala activation (Hein, 2019; McCrory et al., 2011) and
amygdala–PFC functional connectivity (Herringa et al., 2013; Kaiser et al., 2018). Further,
neural tract tracer research in nonhuman primates revealed that stress affects amygdala–OFC
structural connections via increased levels of dopamine (Zikopoulos et al., 2017) and that
amygdala–OFC connections serve as a primary inhibitory pathway for amygdala function (Ray
& Zald, 2012). Last, research examining the cortisol response to a social stressor in this sample
found a similar interaction where the effect violence exposure was exacerbated by high social
deprivation (Peckins et al., 2019). Taken together with the increased specificity provided by the
current study, childhood violence exposure, when combined with social deprivation, may act as a
potent stressor that is associated with decreased white matter in adolescence between the
amygdala and the OFC. Expanding on the current DMAP model, our results suggest that the
effect of violence exposure (a specific subtype of threat) on fronto-amygdala white matter may
depend on the concurrent degree of social deprivation or support.
Extant literature is consistent with the right hemisphere-specific effects of the present
study. Amygdala–OFC structural connections are posited to play a role in automatic emotion
regulation (Phillips et al., 2008) with right hemisphere connections being more heavily involved
in fear extinction learning (Gottfried & Dolan, 2004). Further, in healthy adults, greater right
hemisphere amygdala–OFC functional connectivity has been observed in response to

40
unpredictable threat (Gold et al., 2015), supporting the potential inhibitory role of the structural
connections observed here.
In addition to the exacerbating effects of social deprivation and violence exposure, the
present findings indicate that low social deprivation (i.e., social support) may exert a “protective-
stabilizing” (Proctor, 2006) effect against the negative behavioral sequelae of violence exposure
(H. Foster & Brooks-Gunn, 2009; Ozer, 2005). Consistent with the idea of a protective-
stabilizing factor, the present study found that social support was associated with a lessening of
the negative association between violence exposure and amygdala–OFC connectivity that was
observed in the context of social deprivation (i.e., low social support). The present findings
suggest that policies aimed at boosting social support for youth in high violence environments
may lessen the effect of violence exposure on a primary neural circuit for emotion regulation.
Similar to the interaction in the amygdala–OFC connectivity, we found a violence
exposure-social deprivation interaction when predicting right hemisphere amygdala-dmPFC
(BA10) connectivity. However, the association was not significant when adjusting for the
demographic covariates. BA47, the OFC ROI used, is rostrally bordered by the dmPFC (Petrides
& Pandya, 2002), and neighboring cortical regions are often connected (Bullmore & Sporns,
2012). Thus, amygdala-dmPFC tracts may pass through the OFC, explaining the weaker
association with the dmPFC.
Importantly, in contrast to our hypotheses, there were no main effects of childhood
violence exposure or social deprivation on adolescent amygdala–OFC, amygdala-dmPFC, or
amygdala–subgenual cingulate connectivity. Thus, it may not be fruitful to consider dimensions
of adversity in isolation and out of context of other salient ecological variables (McLaughlin &
Sheridan, 2016). Rather, in order to construct a more complete picture of how early adversity

41
influences the brain, it is important to measure and model the effects of multiple dimensions that
have been established to impact development.
The present study had limitations worth noting. First, due to the population-based
sampling methodology used in the FFCWS, youth were not preselected based on their ability or
willingness to participate in an MRI study, a common procedure in many neuroimaging studies.
Thus, 41 participants of the available sample were ineligible or refused to complete the dMRI
scan. Although it is a limitation that our full sample could not participate, the group of excluded
participants does not differ from the included participants on demographic factors. A second
limitation is that due to demographics of the current sample, our findings may not generalize to
more affluent, rural, or other race/ethnic populations. Third, due to changes in the FFCWS
questionnaire at year 15, we were unable to control for current life stress using the composite
scores we created for ages 3, 5, and 9 years (Hein, 2019). To compensate, we used a life stress
scale to control for current stress and found that it did not impact our main findings, suggesting
that the effects were unique to childhood, rather than adolescent, adversity. Additionally, the
FFCWS study did not collect data between ages 9 and 15, so it was not possible to prospectively
account for exposures during this important developmental period. Fifth, human neuroimaging
methods precluded us from determining how white matter may influence the direction of
signaling between the amygdala and OFC. Consistent with models from non-human primate
neural tract tracer research (Ray & Zald, 2012; Zikopoulos et al., 2017), we posit that the OFC
inhibits the amygdala; however, the influence may be bidirectional. Last, previous research
identified white matter tracts outside of those preregistered in the present study connecting the
amygdala and PFC that may be shaped by early adversity (Choi et al., 2012; Huang et al., 2012;
Jackowski et al., 2008). Additionally, although the present work used Brodmann’s Areas for ROI

42
selection, previous work has used different anatomical parcellations. Future research examining
potential effects of violence exposure and its interaction with social deprivation on additional
pathways and using more precise anatomical parcellations would help to better understand how
early adversity shapes the brain.
Results from the present study clarify possible directions for future research. Although
longitudinal environmental data was a strength of the present study, we only had imaging data at
one timepoint. Future research with longitudinal MRI data (Casey et al., 2018) may be able to
better examine potential directional relations between dimensional early adversity and the brain
by charting trajectories of development. Additionally, future research could characterize possible
effects of other dimensions of adversity. We conceptualized violence exposure and social
deprivation as composites made up of multiple timepoints in development and sources of
exposure to create a cumulative assessment of dimension exposure to violence and social
deprivation during childhood. However, it is likely that the proximity of exposure to the child
and its developmental timing influence the magnitude of its effect (Dunn et al., 2013). Future
research could work to break down the composites for each dimension to determine the
importance of source and timing of exposure. Last, the items included in the dimension
encompassing social deprivation – social support do not include all potential sources of social
support. Future research should work to account for additional sources of social support (i.e.,
school connectedness) which may influence white matter.
Conclusions
Exposures related to early adversity are complex and can be broken down into
dimensions which may affect brain development in different ways. The present study shows, for
the first time, that two dimensions of childhood adversity, violence exposure and social

43
deprivation, interact to predict adolescent white matter connecting right hemisphere amygdala–
OFC which is involved in socio-emotional function. High childhood violence exposure together
with high social deprivation led to a lower probability of amygdala–OFC white matter in
adolescence and, based on the negative correlation between amygdala–OFC white matter
connectivity and amygdala reactivity, potentially less OFC regulation of the amygdala to threat.
This association was not present with low social deprivation (i.e., social support), potentially
implicating social support as a neuroprotective factor.

44
Table 2.1: Participant exclusions and demographics
Reasons for Exclusions
Reason Number Excluded-Right Number Excluded-Left
No dMRI Data 41 41
Preprocessing outliers > 5% in diffusion
data1
1 1
No probabilistic tractography model
convergence
5 5
Less than 70% of voxels in PFC masks 1 1
Statistically influential outlier2 6 6
Poor fMRI data3 31 31
Demographic Characteristics – Included vs. Full Sample Comparison
Right Hemisphere Sample
(N=183)
Left Hemisphere Sample
(N=183)
Full Sample (N=237)
Age M = 15.85 yrs | SD = 0.52 yrs M = 15.85 yrs | SD = 0.53 yrs M = 15.88 yrs | SD =
0.54 yrs
Puberty M = 3.25 | SD = 0.58 M = 3.26 | SD = 0.59 M = 3.24 | SD = 0.59
Gender F = 98 | M = 85 F = 99 | M = 84 F = 125 | M = 112
Race African American: 132
Caucasian: 26
Other: 25
African American: 133
Caucasian: 26
Other: 24
African American: 170
Caucasian: 34
Other: 33
Annual
Income
$4,999 or less: 23
$5,000 to $19,999: 31
$20,000 to $39,999: 54
$40,000 to $69,999: 33
$70,000 or more: 28
Not Report/Missing: 14
$4,999 or less: 22
$5,000 to $19,999: 31
$20,000 to $39,999: 54
$40,000 to $69,999: 33
$70,000 or more: 28
Not Report/Missing: 15
$4,999 or less: 28
$5,000 to $19,999: 41
$20,000 to $39,999: 66
$40,000 to $69,999: 46
$70,000 or more: 35
Not Report/Missing: 21 1These outlier slices were detected using the automated diffusion MRI cleaning method from MRtrix (v.3.0.R3).
Slices with an average intensity four or more standard deviations lower than predicted by eddy's Gaussian process
model were marked as outlier slices and replaced with model predictions. 2The same number of participants were excluded in each hemisphere due to being a statistical outlier on their
violence exposure and social deprivation composite scores; however, only one of the participants is an outlier in both
hemispheres.
3These participants are only excluded for the analyses looking at the association between amygdala–PFC white
matter connectivity and amygdala activation. This is due to no functional MRI data (N=6), artifacts in the data
(N=7), less than 70% accuracy on the Faces task (N=15), or less that 70% of voxels included in the amygdala mask
(N=3)

45
Table 2.2: Descriptive statistics for the main continuous predictor variables and covariates
Predictor Mean (SD) Minimum - Maximum
Violence Exposure1 0.04 (0.53) -0.82 – 2.17
Social Deprivation1 0.03 (0.50) -0.76 – 2.67
Internalizing Psychopathology2 0.02 (0.42) -0.60 – 1.29
Current Life Stress3 10.13 (5.35) 0 – 25
Maternal Education4 2.13 (1.03) 1 – 4 1 To calculate composite scores, the Z scores (zero-centered) for each of the childhood experiences were
summed for each of the childhood experiences within a dimension (violence exposure and social
deprivation) and then divided by the number of childhood experiences within a dimension for each
participant. 2 This variable is a multi-method, multi-informant latent factor that is constructed from the following
measures: (1) K-SADS clinician report of past and current symptoms of dysthymia, social phobia,
generalized anxiety disorder, major depression, and phobia and (2) parent and child report on the Mood and
Feelings Questionnaire, Child Depression Inventory, and the Screen for Child Anxiety Related Disorders. 3 This variable is the sum of all of the items from the Adolescent Life Events Scale (ALES). 4 This is a self-report categorical variable with the following response options: 1 - less than high school, 2 -
high school or equivalent, 3 - some college/technical school, 4 - college or graduate school

46
Table 2.3: Stepwise regression predicting right amygdala–BA47 white matter
These additive models show the base model with only covariates, the R2 change when adding the
non-significant main effects of violence exposure and social deprivation, and then the R2 change
when adding the significant interaction between violence exposure and social deprivation when
predicting right amygdala–BA47 white matter connectivity. Predictor b b
95% CI
[LL, UL]
beta beta
95% CI
[LL, UL]
Fit Difference
(Intercept) 0.14 [0.02, 0.25]
Race_12 0.00 [-0.04, 0.05] 0.02 [-0.19, 0.23]
Race_22 -0.01 [-0.04, 0.03] -0.03 [-0.24, 0.18]
Gender 0.01 [-0.02, 0.04] 0.04 [-0.16, 0.24]
Pubertal Status 0.02 [-0.01, 0.05] 0.10 [-0.07, 0.26]
Maternal Education 0.00 [-0.02, 0.03] 0.03 [-0.16, 0.22]
Maternal Marital
Status
-0.00 [-0.00, 0.00] -0.10 [-0.26, 0.06]
Current Life Stress -0.00 [-0.02, 0.01] -0.07 [-0.23, 0.10]
Internalizing
Psychopathology
-0.01 [-0.05, 0.02] -0.08 [-0.25, 0.09]
R2 = .022
95%
CI[.00,.03]
(Intercept) 0.14 [0.02, 0.25]
Violence Exposure -0.00 [-0.03, 0.02] -0.01 [-0.19, 0.18]
Social Deprivation 0.01 [-0.02, 0.03] 0.04 [-0.14, 0.22]
Race_12 0.00 [-0.04, 0.05] 0.01 [-0.20, 0.23]
Race_22 -0.01 [-0.04, 0.03] -0.04 [-0.25, 0.18]
Gender 0.01 [-0.02, 0.04] 0.04 [-0.16, 0.24]
Pubertal Status 0.02 [-0.01, 0.05] 0.09 [-0.08, 0.26]
Maternal Education 0.00 [-0.02, 0.03] 0.03 [-0.16, 0.23]
Maternal Marital
Status
-0.00 [-0.00, 0.00] -0.10 [-0.26, 0.07]
Current Life Stress -0.00 [-0.02, 0.01] -0.06 [-0.23, 0.11]
Internalizing
Psychopathology
-0.01 [-0.05, 0.02] -0.08 [-0.25, 0.09]
R2 = .023 ΔR2 = .001
95%
CI[.00,.01]
95%
CI[-.01, .01]
(Intercept) 0.14 [0.03, 0.26]
Violence Exposure 0.01 [-0.02, 0.04] 0.07 [-0.12, 0.25]
Social Deprivation 0.02 [-0.01, 0.05] 0.13 [-0.06, 0.32]
Interaction1 -0.04* [-0.08, -0.01] -0.26 [-0.44, -0.08]
Race_12 0.01 [-0.03, 0.06] 0.07 [-0.15, 0.28]
Race_22 -0.01 [-0.04, 0.03] -0.05 [-0.26, 0.16]
Gender 0.01 [-0.02, 0.04] 0.04 [-0.16, 0.24]
Pubertal Status 0.02 [-0.01, 0.05] 0.09 [-0.08, 0.26]
Maternal Education 0.00 [-0.02, 0.03] 0.03 [-0.17, 0.22]

47
Maternal Marital
Status
-0.00 [-0.00, 0.00] -0.09 [-0.25, 0.07]
Current Life Stress -0.00 [-0.02, 0.01] -0.05 [-0.21, 0.12]
Internalizing
Psychopathology
-0.02 [-0.05, 0.01] -0.09 [-0.25, 0.08]
R2 = .069 ΔR2
= .046**
95%
CI[.00,.09]
95%
CI[-.01, .11]
Note. A significant b-weight indicates the beta-weight and semi-partial correlation are also significant. b
represents unstandardized regression weights. beta indicates the standardized regression weights. LL and
UL indicate the lower and upper limits of a confidence interval, respectively.
* Significant predictor using a Bonferroni corrected threshold (p<0.05/8 tests = 0.0063)
** indicates p < .01. 1Interaction between Violence Exposure/Victimization and Social Deprivation 2Dummy coded variables represented 3 category race variable (African American, Caucasian, Other)

48
Table 2.4: Regression results from amygdala-prefrontal cortex white matter connectivity
predicting ipsilateral amygdala activation to threat faces adjusting for covariates.
B SEB t p
Model: R. Amygdala Activation (Threat) ~ R. Amygdala-BA47 White Matter Connectivity
RAmy_BA47* -2.578 0.706 -0.290 -3.651 <0.001
Internalizing 0.184 0.146 0.115 1.261 0.209
Pubertal Status 0.068 0.120 0.059 0.570 0.569
Gender 0.177 0.150 0.131 1.182 0.239
Race_11 -0.030 0.204 -0.016 -0.149 0.882
Race_21 -0.013 0.160 -0.009 -0.082 0.935
Current Life Stress 0.017 0.011 0.139 1.614 0.110
Maternal Education -0.083 0.057 -0.124 -1.467 0.145
Maternal Marital Status 0.096 0.146 0.055 0.655 0.514
F(9, 139) = 2.746, p = 0.005, R2 = 0.151
Model: R. Amygdala Activation (Threat) ~ R. Amygdala-BA10 White Matter Connectivity
RAmy_BA10* -4.105 1.363 -0.249 -3.013 0.003
Internalizing 0.141 0.147 0.088 0.957 0.340
Pubertal Status 0.048 0.122 0.042 0.396 0.692
Gender 0.154 0.142 0.114 1.015 0.332
Race_11 -0.067 0.207 -0.036 -0.325 0.746
Race_21 0.024 0.164 0.016 0.148 0.883
Current Life Stress 0.020 0.011 0.163 1.881 0.062
Maternal Education -0.089 0.058 -0.133 -1.542 0.125
Maternal Marital Status 0.156 0.147 0.091 1.061 0.290
F(9, 139) = 2.238, p = 0.023, R2 = 0.127
Model: L. Amygdala Activation (Threat) ~ L. Amygdala-BA10 White Matter Connectivity
LAmy_BA10* -12.567 3.165 -0.322 -3.970 <0.001
Internalizing 0.175 0.130 0.122 1.342 0.182
Pubertal Status 0.006 0.104 0.006 0.054 0.958
Gender 0.077 0.131 0.065 0.590 0.556
Race_11 0.072 0.176 0.043 0.406 0.685
Race_21 0.119 0.140 0.091 0.864 0.389
Current Life Stress 0.012 0.009 0.112 1.287 0.200
Maternal Education -0.071 0.049 -0.120 -1.436 0.153
Maternal Marital Status 0.032 0.128 0.021 0.253 0.801
F(9, 140) = 2.789, p = 0.005, R2 = 0.152
Model: L. Amygdala Activation (Threat) ~ L. Amygdala-BA11 White Matter Connectivity
LAmy_BA11* -6.743 1.871 -0.290 -3.604 <0.001
Internalizing 0.129 0.130 0.090 0.991 0.323
Pubertal Status 0.062 0.106 0.062 0.587 0.558
Gender 0.158 0.132 0.132 1.192 0.235
Race_11 0.066 0.178 0.039 0.368 0.713
Race_21 0.103 0.139 0.079 .743 0.458
Current Life Stress 0.017 0.009 0.156 1.813 0.072
Maternal Education -0.078 0.050 -0.132 -1.556 0.122

49
Maternal Marital Status -0.010 0.130 -0.007 -0.80 0.936
F(9, 140) = 2.463, p = 0.012, R2 = 0.137
* significant at p<0.0063 (Bonferroni corrected significance level for 8 tests) 1Dummy coded variables represented 3 category race variable (African American, Caucasian,
Other)

50
Figure 2.1: Association between violence exposure and social deprivation.
To calculate composite scores, the Z scores (zero-centered) for each of the childhood experiences
were summed for each of the childhood experiences within a dimension (violence exposure and
social deprivation) and then divided by the number of childhood experiences within a dimension
for each participant. In our sample, violence exposure and social deprivation were correlated at
r(181) = 0.50, t = 7.69, p < 0.001, but the VIF was 1.326.

51
Figure 2.2: White matter tracts from the left and right amygdalae
For illustrative purposes, the Brodmann’s Area (BA) masks used as targets are superimposed on
the brain in different colors: BA10 (green), BA11 (blue), BA25 (yellow), BA47 (red).

52
Figure 2.3: Simple slopes plot for VExSD interaction predicting white matter
Plot illustrating the interaction between childhood violence exposure and social deprivation (ages
3, 5, 9) in predicting the probability of white matter connectivity between the amygdala and
orbitofrontal cortex (OFC – Brodmann’s Area 47) in the right hemisphere (adolescence).
The continuous moderator (social deprivation) has been plotted at a +/- 1 standard deviation (SD)
interval. A Johnson-Neyman interval shows that violence exposure and white matter connectivity
are significantly, inversely correlated when social deprivation = 0.78 and greater. The range of
social deprivation values (zero-centered where 0 is the mean) in the data are [-0.76 2.67]. This
figure illustrates that at relatively high values of social deprivation, violence exposure and
likelihood of amygdala–OFC connectivity are negatively correlated. Rug plots depict real data
points along axes.

53
Chapter 32: Association of Childhood Violence Exposure with Adolescent Neural Network
Density
Early adversity is an unfortunately common and detrimental public health issue. Adverse
childhood experiences (ACEs) negatively impact physical and mental health, and effects likely
persist into adulthood (Finkelhor et al., 2015; Green et al., 2010; Nusslock & Miller, 2016). Early
adverse environments have underlying dimensions, such as violence exposure (e.g.,
neighborhood violence) and social deprivation (e.g., neglect) (Hein, 2019; McLaughlin et al.,
2014), which have distinct neural correlates related to emotion, fear, and reward processing
(Goetschius, Hein, Mitchell, et al., 2020a; McLaughlin et al., 2014). For instance, violence
exposure and social deprivation are associated with blunted amygdala and ventral striatum
reactivity, respectively (Hein, 2019). However, it is unclear how these dimensions affect neural
circuitry. ACEs (not measured dimensionally) are associated with alterations in resting-state
functional connectivity (rsFC) of the salience network (SN; task-positive network, including the
anterior insula, involved in identifying and integrating salient input (Uddin, 2017a)) and the
default mode network (DMN; task-negative network, including the inferior parietal lobule,
linked to internal thought, memory, and social-cognitive processes (Menon, 2011)) (Marusak,
Etkin, et al., 2015; Marusak, Martin, et al., 2015; van der Werff et al., 2013), but inferences are
limited by relatively small, homogeneous samples focused on few brain regions using
retrospective reports of adversity (Falk et al., 2013). Thus, there are significant knowledge gaps
2 Chapter 3 corresponds to Goetschius et al., 2020 published in JAMA Network Open

54
concerning the ways in which early violence exposure and social deprivation prospectively
impact later functioning of neural circuits and how that varies across individuals.
Neural circuits are typically studied using a network framework, with key features
including density (i.e., number of connections (Beltz & Gates, 2017)) and node degree (i.e.,
number of connections involving a specific brain region (Sporns, 2010)) (Power et al., 2010).
Across development, network density increases between distal nodes and node degree increases
for hub regions, such as the anterior insula (Fair et al., 2009). Understanding how early adversity
relates to network density has significant potential for revealing how the environment affects
brain development (Sporns, 2010).
These effects are likely to be person-specific because there is considerable variability in
neural responses to environmental stress (Marder & Goaillard, 2006), and thus, mean-based
analyses may not accurately reflect an individual’s circuitry (Molenaar, 2004). Indeed, data from
recent neuroimaging projects, such as the Midnight Scan Club, have illustrated that the
organization of an individual’s rsFC is unique and qualitatively different from the group average
(Gordon et al., 2017). Moreover, consistent with behavioral studies of early adversity (Hughes et
al., 2017), average estimates of adversity’s effects on the brain often have high variances (Gee et
al., 2013; Hanson, Hariri, et al., 2015; Hanson, Nacewicz, et al., 2015). This begs the question of
whether there is valuable information about individual differences and their etiology – important
for eventual prevention and intervention – that is not being conveyed by mean-based
conclusions.
In the present study, we examined the association between dimensional indices of
childhood exposure and individualized adolescent rsFC networks. We employed a large,
longitudinal sample of adolescents with a substantial representation of African American and

55
low-income participants — who are often underrepresented in neuroimaging research (Falk et
al., 2013)– and a person-specific rsFC approach that detects only meaningful connections among
brain regions while identifying subgroups of participants that share network features (GIMME)
(Gates et al., 2010; Lane et al., 2019). We hypothesized that childhood violence exposure and
social deprivation would be associated with person-specific indices of SN and DMN density,
respectively. This study was pre-registered (https://osf.io/mrwhn/), and the data will be openly
available (https://nda.nih.gov/edit_collection.html?id=2106).
Materials & Methods
Participants were from the FFCWS, a population-based cohort study of children born in
large US cities, with an oversample of non-marital births as well as a large proportion of families
of color with low resources (Reichman et al., 2001). This study followed STROBE (acronym in
Table 3.1) reporting guidelines. In the FFCWS, data were collected from the primary caregiver
(94% biological mother) and focal child at their birth and at ages 1, 3, 5, 9, 15 years through in-
home visits and phone calls (Public Data Documentation | Fragile Families and Child Wellbeing
Study, 2019). Data for the violence exposure and social deprivation composites, which have been
previously reported (Goetschius, Hein, Mitchell, et al., 2020a; Hein, 2019; Peckins et al., 2019),
came from surveys collected at ages 3, 5, and 9. During Wave 6 (when focal child was
approximately age 15), 237 teens from Detroit, Toledo, and Chicago participated in a
supplementary visit where rsFC data were collected. RSFC data and their association with early
adversity have not been previously published. Due to the representative sampling of the FFCWS,
youth were not preselected based on their willingness to participate in an MRI study, a common
procedure in neuroimaging. This led to missing or incomplete MRI data (N=54), but the included

56
sample did not statistically differ from the recruited sample (Appendix 3 and Supplemental Table
3.1).
Participants & Procedure
Participants were 175 adolescents aged 15-17 years. Teens and their primary caregiver
came to a university lab and completed questionnaires regarding the focal child’s current life
stress, pubertal development, and other demographic variables. During an MRI scan, eight
minutes of data were collected while teens were instructed to remain still and focus on a white
fixation cross on a black screen. This study was approved by the University IRB. Participants
provided informed consent or assent.
Childhood Violence Exposure and Social Deprivation Measures
Violence exposure and social deprivation were each operationalized by composite z-
scores calculated from FFCWS data at ages 3, 5, and 9; thus, 0 is the approximate mean. Both
constructs included primary caregiver report of experiences that directly (i.e., physical abuse)
and indirectly (i.e., community support) affect the child (Appendix 3). Violence exposure was
operationalized as physical or emotional abuse directed at the child, exposure to intimate partner
violence, and witnessing or being victimized by community violence. Social deprivation was
operationalized as emotional or physical neglect, lack of romantic partner support for the mother,
and lack of neighborhood cohesion (Hein, 2019). To reflect a comprehensive assessment of
cumulative, dimensional childhood exposure to violence and social deprivation, both constructs
included experiences with several levels of proximity to the child (e.g., home, neighborhood) at
multiple ages (Hein, 2019; McLaughlin & Sheridan, 2016).
Covariates

57
To address potential confounds, sensitivity analyses adjusted for gender, race, pubertal
development (Carskadon & Acebo, 1993), adolescent life stress (Farrell et al., 1998; Masten et
al., 1994; Shaw et al., 2003), maternal education at birth, and maternal marital status at birth
(Reichman et al., 2001) (Appendix 3).
Neuroimaging Measures
MR Acquisition. MR data were acquired using a GE Discovery MR750 3T scanner with
an 8-channel head coil. Head movement was minimized through instructions to the participant
and padding placed around the head. Functional T2*-weighted BOLD images were acquired
using a reverse spiral sequence (Glover & Law, 2001) of 40 contiguous axial 3 mm slices
(Appendix 3).
Imaging Data Analysis. Preprocessing was primarily conducted in FSL (v.5.0.7) (Beltz
et al., 2019; Jenkinson et al., 2012). Structural images were skull-stripped and segmented.
Functional images were skull-stripped, spatially smoothed, registered to subject-specific
structural and MNI space, and corrected for motion using MCFLIRT (Jenkinson et al., 2002) and
ICA-AROMA (Pruim et al., 2015). Nuisance signal from white matter and CSF was removed.
Data were high-pass filtered. As an additional precaution against motion-related artifacts,
participants with an average relative framewise displacement (FD) greater than 0.5mm (prior to
motion preprocessing) were excluded (N=4) (Appendix 3).
Participant-specific time series (235 functional volumes) from seven ROIs per
hemisphere (14 total) were extracted. ROIs and their locations were selected using Neurosynth
(Yarkoni et al., 2011) and preregistered. Five bilateral ROIs defined the SN: amygdala, insula,
dACC, and dlPFC. Three bilateral ROIs defined the DMN: IPL, PCC, and MTG (Table 3.1 for

58
acronyms). ROIs were 6.5mm spheres around central coordinates (Supplemental Table 3.2 in
Appendix 2) linearly adjusted for participant brain volume.
GIMME. Subgrouping GIMME (S-GIMME; v0.5.1) (Gates et al., 2010, 2017; Lane et
al., 2019) in R (v3.5.1) was used for rsFC analyses (Supplemental Figure 3.1 in Appendix 3).
Beginning with an empty network, S-GIMME fits person-specific unified structural equation
models (Gates et al., 2010) in a data-driven manner by using Lagrange multiplier tests (Sörbom,
1989) to add directed connections among ROIs that are contemporaneous (occurring at the same
functional volume) or lagged (occurring at the previous volume, including autoregressives), and
that apply to the group-level (everyone in the sample), subgroup-level (everyone in a data-
derived subsample), or individual-level (unique to an individual). Importantly, S-GIMME is a
sparse mapping approach in which only connections that account for a significant amount of
variance are added to each participant’s network until the model fits the data well according to
standard fit indices (RMSEA≤0.05; SRMR≤0.05; CFI≥0.95; NNFI≥0.95) (Brown, 2006; Gates
& Molenaar, 2012). During model generation, connections that have become non-significant
with the addition of new connections are pruned. S-GIMME uses a community detection
algorithm (Walktrap) to detect subgroups of participants and determine their shared connectivity
patterns. S-GIMME has been described and validated in large-scale simulations and applied to
empirical data (Gates et al., 2014, 2017; Gates & Molenaar, 2012; Price et al., 2017). Network
density and node degree of only the contemporaneous connections were extracted from person-
specific S-GIMME networks, as lagged connections control for sequential dependencies (e.g.,
hemodynamic response function) (Gates et al., 2010; S. M. Smith, 2012).
Statistical Analysis

59
Inferential analyses were completed in R (v3.5.1) and examined whether childhood
adversity statistically predicted adolescent neural network features. First, binary logistic
regression was used to statistically predict S-GIMME-detected subgroup membership from
childhood violence exposure and social deprivation. Second, multiple regression was used to
statistically predict density (i.e., number of connections) within the SN, within the DMN, and
between the SN and DMN from childhood violence exposure and social deprivation. Third,
multiple regression was used to statistically predict node degree (i.e., number of connections
involving a specified node) for each of the 14 ROIs from violence exposure and social
deprivation using a Bonferroni-corrected significance threshold (p<0.004). In follow-up
sensitivity analyses, covariates were added to all regressions to assess the robustness of observed
effects.
Results
Analyses included 175 15-17-year-olds (Mage=15.88, SD=0.53; 56% female; 73% African
American). All person-specific resting state networks fit the data well, according to average
indices: RMSEA=.06, SRMR=.05, CFI=.93, NNFI=.96 (individual indices in Appendix 5).
Group-level connections were detected within and between the SN and DMN (Figure 3.1a), two
subgroups of participants with subgroup-level connections were identified (Figures 3.1b, 3.1c),
and all person-specific maps contained individual-level connections (Mindividual_connections =11.61,
SD=5.32). Final maps revealed that the first subgroup (N=42; Figure 3.1b, 3.1d) was
qualitatively homogeneous with 27 subgroup-level connections and few individual-level
connections (Mindividual_connections =5.60, SD=3.19), and that the second subgroup (N=133; Figure
3.1c, 3.1e) was qualitatively heterogeneous, with 8 subgroup-level connections and many

60
individual-level connections (Mindividual_connections =13.50, SD=4.36). Possible extreme outliers or
overfit models did not impact results (Appendix 4).
Violence Exposure was Associated with Neural Subgroup Membership
Violence exposure was associated with subgroup membership (b=1.12, p=0.030). With a
unit increase in violence exposure, participants were 3.06 times more likely to be classified in the
larger, heterogeneous subgroup (Table 3.2). In sensitivity analyses, the odds ratio was 2.54
(Supplemental Table 3.6 in Appendix 4). On average, members of the heterogeneous subgroup
experienced higher levels of childhood violence exposure (M=0.09, SD=0.53) than those in the
homogenous subgroup (M=-0.15, SD=0.43). Social deprivation was not associated with
subgroup membership (Table 3.2).
Violence Exposure was Associated with Density Within the SN and between the SN and
DMN
Childhood violence exposure was related to reduced density (i.e., sparsity) in the person-
specific maps ( =-0.25, p=0.005) (Figure 3.2). Specifically, violence exposure was associated
with sparsity within the SN (=-0.26, p=0.005) and between the SN and DMN (=-0.20,
p=0.023) (Table 3.3A), including in sensitivity analyses (Supplemental Table 3.3 in Appendix 4).
Violence exposure was not associated with DMN density, and social deprivation was not related
to network metrics (Table 3.3A).
Violence Exposure was Associated with Node Degree for Left IPL and Right Insula
Childhood violence exposure was related to reduced node degree for the right insula (=-
0.29, p=0.001) and left IPL (=-0.26, p=0.003) using a Bonferroni-corrected significance
threshold (Tables 3.3B and Supplemental Table 3.4 in Appendix 4), including in sensitivity

61
analyses (Supplemental Table 3.5 in Appendix 4). There were no significant associations with
social deprivation.
Discussion
Results from a predominantly under-studied and under-served sample with high rates of
poverty revealed that childhood violence exposure, but not social deprivation, was associated
with adolescent neural circuitry. Data-driven analyses identified a subset of teens with
heterogeneous patterns of connectivity (i.e., few shared and many individual connections) in two
key neural networks associated with salience detection, attention, and social-cognitive processes
(i.e., the SN and DMN) (Menon, 2011; Uddin, 2017a). This subgroup of teens was exposed to
more violence in childhood than the other subgroup, whose patterns of neural connectivity were
relatively more homogeneous (i.e., had many connections in common), suggesting that violence
exposure may lead to more person-specific alterations in neural circuitry. Beyond subgroups,
network density within the SN and between the SN and DMN was sparse for teens with high
violence exposure, likely due to few connections involving the right insula and the left IPL.
These effects could not be accounted for by social deprivation, in-scanner motion, race, gender,
pubertal development, current life stress, or maternal marital status or education at birth.
Findings regarding the neural network subgroups are noteworthy because the community
detection algorithm within GIMME detected rsFC patterns in the brain from exposures that
occurred at least 6 years earlier. Moreover, high childhood violence exposure in the subgroup
characterized by neural heterogeneity likely reflects the person-specific effects of early adversity
on the brain and suggests that research on the developmental sequelae of ACEs must consider
individual differences in neural compensatory responses to stress (Marder & Goaillard, 2006).
Although it important to replicate these findings in other samples, S-GIMME has reliably

62
classified subgroups in empirical data (Gates et al., 2017; Price et al., 2017), and there is
evidence from simulations that modeling connections at the subgroup-level, in addition to the
group-level, improves the validity and reliability of results (Gates et al., 2017).
Considering the sample as a whole, results also suggest that violence exposure is
associated with blunted connectivity within the SN and between the SN and DMN. As expected,
the observed reduced SN density in teens with heightened childhood violence exposure differs
from typical developmental patterns that show stronger rsFC within SN nodes and increased
density of connections with hub regions, such as the anterior insula, as the brain matures (Fair et
al., 2009; Menon, 2011). It is difficult, however, to align the present findings with previous work
that showed increased SN rsFC in trauma-exposed youth (Marusak, Etkin, et al., 2015; Marusak,
Martin, et al., 2015) because those samples were small, used different metrics of connectivity,
and had different sample compositions. Moreover, the current sample was likely experiencing
chronic adversity and research from animal models of chronic stress propose that, over time, the
body’s stress response (e.g. HPA-axis reactivity) becomes blunted or habituated to typical
stressors (McCarty, 2016). Previous research on HPA-axis reactivity in this sample revealed a
blunted cortisol response in teens exposed to heightened childhood violence exposure (M. K.
Peckins et al., 2019), and work in other high-risk samples shows blunted activation of the
amygdala, a SN node, to threatening stimuli (Gard et al., 2017; Holz et al., 2017). The present
study expands this notion to the function of threat detection neural circuits, and future research
should examine whether this is compensatory or even adaptive.
Beyond density, childhood violence exposure was associated with reduced node degree of
the right anterior insula and left IPL. These results are consistent with the extant literature
because the right anterior insula in the SN facilitates shifting between the DMN and central

63
executive network (Sridharan et al., 2008), which contributes to higher-level executive function
(Menon, 2011). Moreover, early life stress has been linked to insular connectivity within the SN
(Marusak, Etkin, et al., 2015), DMN (specifically the left IPL, which plays a role in working
memory (Philip et al., 2016)), and other neural ROIs (Teicher et al., 2014). These results also
illuminate differences in the way that the anterior insula is integrated within and between neural
networks in youth exposed to violence in their homes and neighborhoods using longitudinal data
from a population-based sample.
This study represents a person-specific approach to the neuroscientific investigation of
the sequelae of early adversity. Past research on early adversity and rsFC assumes that the same
connectivity patterns characterize all, or a majority of participants, but if this assumption is
violated (as is likely the case in studies of diverse populations and biopsychosocial phenomena),
then results may not accurately describe any individual(Eavani et al., 2015; Molenaar, 2004).
The presence of group- and subgroup-level connections in the current study suggests that there
was some consistency in the connections within and between the SN and DMN, aligning with an
assumption of homogeneity that is prevalent in rsFC research, but the large number of
individual-level connections, especially in adolescents with high early violence exposure, show
that there was also notable heterogeneity that required person-specific analyses to accurately
reflect rsFC, encouraging future research using person-specific modeling approaches.
Interestingly, all significant findings concerned violence exposure, and there were no detected
links between social deprivation and rsFC. This set of results could indicate that social
deprivation has a less salient influence on patterns of spontaneous neural fluctuations. Some
studies have identified links between social deprivation and functional connectivity, but they
concerned extreme, non-normative deprivation (i.e., previous institutionalization)(Chugani et al.,

64
2001; Gee et al., 2013). This deprivation may be qualitatively different from deprivation
operationalized in this study, and it may operate through different mechanisms. Additionally,
because a hypothesis driven approach to node selection was taken in this study, it is possible that
deprivation is associated with rsFC of SN or DMN nodes not measured here, with other networks
(e.g., central executive), or in different populations (e.g., with extreme or heightened variability
of deprivation). It is also tenable that there are other dimensions of adversity that would have
differential associations with rsFC (e.g., those linked to emotionality), which future research
should explore. Nonetheless, these findings present evidence for dimensional frameworks of
adversity(Hein, 2019; Sheridan & McLaughlin, 2014) because there were distinct neural
correlates for violence exposure.
Limitations
Based on the demographics of the sample (e.g., 72% African American, born in
Midwestern cities), it is not clear how findings will generalize beyond low-income, urban,
African American youth; nonetheless, the present work is vital because these populations are
often underrepresented in neuroimaging research and underserved by the medical
community(Falk et al., 2013). Resting-state fMRI was only collected at a single occasion in
adolescence; thus, it is unclear if connectivity patterns reflect stable or changing neural features.
Nor is it possible to know the direction of association (e.g., whether neural differences pre-date
exposure to adversity). Violence exposure and social deprivation composites were derived from
parent-reports. Exposures between the FFCWS collection waves at ages 9 and 15 could not be
accounted for in this study. Due to changes in the FFCWS questionnaire at year 15, current
adversity could not be controlled using the composite scores created for earlier ages (Hein,
2019). To compensate, a life stress scale was used as a covariate (that did not impact

65
associations). The ecology of poverty-related adversity is complex, and thus, there are
unmeasured variables that may explain these associations or contribute to cascades of risk (e.g.,
parental psychopathology).
Conclusions
In a prospective, longitudinal study, childhood violence exposure, but not social
deprivation, was associated with person-specific differences in how the adolescent brain
functions in regions involved in salience detection and higher-level cognitive processes. These
differences were potent enough that a data-driven algorithm, blind to child adversity, grouped
youth with heightened violence exposure together based on the heterogeneity of their neural
networks, suggesting that the impact of violence exposure may have divergent and personalized
associations with functional neural architecture. Findings have implications for understanding
how dimensions of adversity affect brain development, which can inform future neuroscience-
based policy interventions.

66
Table 3.1: Table of frequently used acronyms
ACE Adverse Childhood Experience
CFI Confirmatory Fit Index
dACC Dorsal Anterior Cingulate Cortex
dlPFC Dorsolateral Prefrontal Cortex
DMN Default Mode Network
FFCWS Fragile Families and Child Wellbeing Study
IPL Inferior Parietal Lobule
MTG Medial Temporal Gyrus
NNFI Non-Normed Fit Index
PCC Posterior Cingulate Cortex
RMSEA Root Mean Square Error of Approximation
ROI Region of Interest
rsFC Resting State Functional Connectivity
SN Salience Network
STROBE Strengthening the Reporting of Observational Studies in
Epidemiology
S-GIMME Subgrouping Group Iterative Multiple Model Estimation
SRMR Standard Root Mean Residual

67
Table 3.2: Logistic regression results for subgroup membership
Logistic regression results for association between violence exposure and social
deprivation and subgroup membership (heterogeneous or homogeneous subgroup)
while controlling for motion.
Predictor b SE Odds
Ratio
Odds Ratio
95% CI
[LL, UL]
(Intercept) 0.55 0.32 1.73 [0.90, 3.22]
Violence Exposure* 1.12 0.52 3.06 [1.17, 8.92]
Social Deprivation -0.49 0.46 0.61 [0.25, 1.54]
Motion1* 7.96 3.59 2860.05 [6.33, 8236598]
* Significant predictor of subgroup membership 1Motion indicated by mean relative framewise displacement

68
Table 3.3: Regression results for network density and node degree
Regression results for association between dimensional exposure to adversity and (A) network
density (i.e., number of connections modeled by network) and (B) node degree (i.e., the sum of
the modeled connections involving each node). For space, only significant nodes are reported
here. Results for all nodes are in the Appendix 4.
Predictor b
b
95% CI
[LL, UL]
beta
beta
95% CI
[LL, UL]
r Fit
Total Density
(Intercept) 41.88 [40.57, 43.19]
Violence Exposure* -3.08 [-5.20, -0.96] -0.25 [-0.41, -0.05] -.12
Social Deprivation 1.81 [-0.28, 3.91] 0.15 [-0.05, 0.30] .06
Motion 1* 12.98 [3.55, 22.40] 0.21 [0.06, 0.37] .17*
R2 = .075
95% CI[.01,.15]
Salience Network Density
(Intercept) 15.92 [15.47, 16.37]
Violence Exposure* -1.09 [-1.82, -0.36] -0.26 [-0.43, -0.08] -.11
Social Deprivation 0.65 [-0.08, 1.37] 0.15 [-0.02, 0.32] .07
Motion 1* 5.17 [1.91, 8.43] 0.24 [0.09, 0.39] .20
R2 = .088
95% CI[.02,.16]
Density Between Salience & Default Mode Networks
(Intercept) 16.03 [15.32, 16.74]
Violence Exposure* -1.33 [-2.48, -0.19] -0.20 [-0.38, -
0.03]
-.07
Social Deprivation 0.76 [-0.37, 1.90] 0.12 [-0.06, 0.29] .06
Motion 1* 8.58 [3.48, 13.67] 0.25 [0.10, 0.40] .23
R2 = .079
95% CI[.01,.15]
Default Mode Network Density (Intercept) 9.93 [9.50, 10.36]
Violence Exposure -0.66 [-1.35, 0.03] -0.17 [-0.35, 0.01] -.13
Social Deprivation 0.40 [-0.28, 1.09] 0.10 [-0.07, 0.28] .00
Motion 1 -0.77 [-3.85, 2.30] -0.04 [-0.19, 0.12] -.06
R2 = .024
95% CI[.00,.07]
B.
Predictor b b
95% CI
[LL, UL]
beta beta
95% CI
[LL, UL]
r Fit
Left Inferior Parietal Lobule Degree
(Intercept) 7.33 [6.98, 7.68]
Violence Exposure** -0.85 [-1.41, -0.28] -0.26 [-0.44, -
0.09]
-.17
Social Deprivation 0.49 [-0.07, 1.05] 0.15 [-0.02, 0.33] .03
Motion 1 1.16 [-1.35, 3.68] 0.07 [-0.08, 0.22] .03
R2 = .050

69
95% CI[.00,.11]
Right Insula Degree
(Intercept) 7.72 [7.48, 7.96]
Violence Exposure** -0.65 [-1.04, -0.26] -0.29 [-0.47, -
0.12]
-.16
Social Deprivation 0.42 [0.03, 0.80] 0.19 [0.01, 0.36] .06
Motion 1 1.38 [-0.36, 3.12] 0.12 [-0.03, 0.27] .08
R2 = .067
95% CI[.01,.14]
Note. b represents unstandardized regression weights. beta indicates the standardized regression
weights. r represents the zero-order correlation. LL and UL indicate the lower and upper limits of a
confidence interval, respectively.
* indicates significant predictor of network density at p<0.05.
** indicates significant predictor of node degree at a Bonferroni corrected p<0.05/14 nodes (p<0.004). 1Motion indicated by mean relative framewise displacement prior to motion correction

70
Figure 3.1: S-GIMME connectivity results
A) Connections fit at the group-level (i.e., statistically meaningful for 75% of sample); B)
Subgroup-level connections for first, relatively homogenous (i.e., many shared, common paths),
algorithm-detected subgroup (N=42); C) Subgroup-level connections for second, comparatively
heterogenous (i.e., few common paths), algorithm-detected subgroup (N=133); D) Individual-
level connections for illustrative participant in first subgroup which shows relatively fewer
individual level paths; E) Individual-level connections for illustrative participant in second
subgroup which shows comparatively more individual level paths. All connections are directed
and contemporaneous. Red nodes are part of the salience network. Blue nodes are part of the
default mode network.
E.D.

71
Figure 3.2: Association between violence exposure and network density
Association between childhood violence exposure and reduced network density (i.e., number of
connections modeled for each individual).

72
Chapter 4: School Connectedness as a Protective Factor Against Childhood Exposure to
Violence and Social Deprivation: A Longitudinal Study of Adaptive and Maladaptive
Outcomes
Recent data from the Center for Disease Control and Prevention (CDC) show that over
60% of adults have experienced at least one adverse childhood experience (ACE) with close to
25% of adults reporting exposure to three or more ACEs (Merrick et al., 2018). On average,
exposure to early adversity is associated with an increased risk for poor mental and physical
health outcomes across the lifespan (Green et al., 2010; Nusslock & Miller, 2016). However,
many children display resilience to early adversity and do not go on to develop poor outcomes
(Masten et al., 2004). Multiple environmental factors, including those outside of the home, such
as connectedness to school, have been posited to promote resilience (Barber & Olsen, 1997). The
present study examined child and adolescent connectedness to school as protective against
childhood exposure to early adversity. Consistent with prominent calls in the field (Masten &
Cicchetti, 2016), this study is precise in its measure of two dimensions of adversity that index
multiple levels of environmental exposure and examines resilience in terms of both the absence
of negative outcomes and the presence of positive outcomes.
Though a wealth of literature has examined the effects of either specific adversities (e.g.,
abuse, harsh parenting) or the cumulative effects of adversity broadly (i.e., cumulative risk
research), dimensional models of adversity propose that the complex experiences of early
adversity can be broken down into core underlying dimensions that influence neural and
behavioral development through both distinct, specific, and more common, global mechanisms

73
(McLaughlin et al., in press; McLaughlin & Sheridan, 2016). In the dimensional model of
adversity and psychopathology (DMAP), one of the first and more prominent dimensional
models, adversity is broken down into threat and deprivation (McLaughlin et al., 2014). We have
specifically adapted these constructs to examine the dimensional correlates of violence exposure
and social deprivation on child and adolescent functioning. Violence exposure, similar to the
threat construct in DMAP, includes experiences of abuse, exposure to intimate partner violence
in the home, and community violence (Hein et al., 2020). Social deprivation, which differs from
the DMAP dimension of deprivation, includes experiences of neglect, a lack of support in the
home, and a lack of a sense of cohesion and support in the neighborhood (Hein et al., 2020).
These dimensions are conceptually and statistically distinct (Hein et al., 2020; Lambert et al.,
2017; McLaughlin et al., 2014; Miller et al., 2018). For example, research has shown that
violence exposure is specifically linked to differences in areas of the brain involved in fear-
learning and emotion processing, while social deprivation has been related to differences in areas
involved in social reward processing (Hein et al., 2020; McLaughlin et al., 2019). However,
these dimensions coexist, are likely correlated, and interact with each other to create a unique
environment of adversity for each individual (Goetschius, Hein, Mitchell, et al., 2020b;
McLaughlin & Sheridan, 2016). Thus, it is important to assess exposure to both dimensions
simultaneously.
Early Adversity & Resilience
Equally important to our understanding of how early adversity shapes development is
understanding what factors help youth do well even when exposed to adverse environments.
Resilience is defined as having positive outcomes in the context of adversity and research on the
effects of early adversity has shown that “resilience is common” (Masten, 2001). Protective

74
factors that promote resilience to adversity can be internal factors, such as positive self-
perception, or external factors, such as social support in the home reflected by quality of
attachment or parenting (Luthar, Crossman, & Small, 2015; Masten, 2001). In the present study,
we examine the protective effects of an extrafamilial source of social support – school
connectedness.
Protective processes can differ depending on risk processes and domain of function
(National Research Council (US) & Institute of Medicine (US) Board on Children, Youth, and
Families, 2001), thus it is necessary to examine resilience effects not only in the context of
multiple dimensions of childhood adversity, but also multiple outcomes. As outlined briefly
above, evidence supports that dimensions of adversity shape development in ways that are at
least partially distinct, but there is a lack of work empirically testing protective processes within
this dimensional framework. Of equal importance to modeling the complexity of adversity in the
study of resilience is the selection of outcomes. Much of the research on resilience to early
adversity has focused on factors that mitigate negative function, such as symptoms of
psychopathology; however, it is important to determine whether specific factors promote
adaptive function using a strengths-based approach (Luthar et al., 2015; Masten & Cicchetti,
2016). Positive function (Kern et al., 2016), as measured in the present study, indexes qualities
such as optimism and perseverance, two qualities that promote positive outcomes (Chen &
Miller, 2012). However, successful adaptation can exist simultaneously with maladaptive factors
(Luthar et al., 2015). Thus, to gain greater understanding of protective processes, it is important
to evaluate factors in terms of both the presence of adaptive and the absence of maladaptive
outcomes.
School Connectedness as Hypothesized Protective Factor

75
Youth spend a majority of their day at school and thus their experiences there play a large
role in both socioemotional development and resilience (Masten & Cicchetti, 2016; Roeser,
Eccles, & Sameroff, 2000). Connectedness to school, defined as a youth’s sense of belonging or
closeness with others at their school, has been associated with positive adolescent outcomes
including reduced emotional distress, suicidality, violence, and substance use (Bond et al., 2007;
Brookmeyer et al., 2006; Kalu et al., 2020; Resnick et al., 1997). This extrafamilial source of
social support is posited to promote socioemotional function through the creation of supportive
relationships with teachers and peers (Loukas et al., 2006). School connectedness as a buffer is
rooted in the risk and resilience framework, which posits that factors that promote developmental
competency may also promote resilience to early adversity (Luthar et al., 2000).
The school environment is a salient source of protective factors for a number of reasons.
First, school context factors, such as connectedness, have been shown to buffer against the
detrimental effects of cumulative, unidimensional adversity constructs as well as specific
exposures, such as neighborhood violence and negative family relations (Hardaway et al., 2012;
Lensch et al., 2020; Loukas et al., 2010; Markowitz, 2017). Additionally, social support in the
school environment may compensate for low social support in other domains, such as in the
home (Barber & Olsen, 1997; H. Foster & Brooks-Gunn, 2009). Last, school connectedness is a
potentially socially modifiable factor, making it an attractive target for interventions (H. Foster &
Brooks-Gunn, 2009; McNeely et al., 2002).
There are number of limitations, however, in previous research examining the protective
effects of school connectedness. Most studies have focused solely on either externalizing
behaviors, such as conduct disorder (Klika et al., 2013; Loukas et al., 2010), or internalizing
behaviors (Lensch et al., 2020; Markowitz, 2017). Given the high comorbidity of internalizing

76
and externalizing disorders in children (Caron & Rutter, 1991; G. T. Smith et al., 2020),
surprisingly little research has examined the protective effects of school connectedness against
early adversity when predicting internalizing and externalizing simultaneously (Hardaway et al.,
2012). There is also a lack of work examining the buffering effects of school connectedness
when predicting positive function. In addition to addressing these limitations, the present study
adds to this area of research by examining school connectedness as a contributor to resilience in
the context of a dimensional model of adversity.
The Present Study
In the present study, we examined whether childhood exposure to two dimensions of
early adversity (composite across ages 3, 5, 9), violence exposure and social deprivation,
predicted latent variables indexing child (Age 9) and adolescent (Age 15) internalizing and
externalizing symptoms (4 separate variables) and adolescent positive function in youth from the
Fragile Families and Child Wellbeing Study (FFCWS), a longitudinal birth cohort study. We
hypothesized that both violence exposure and social deprivation would predict increased
internalizing and externalizing symptoms and decreased positive function. Additionally, we
tested whether connectedness to school in either childhood or adolescence was protective against
early adversity and whether this differed across dimensions of adversity or by the outcome
examined (i.e., internalizing symptoms, externalizing symptoms, or positive functioning) using a
latent variable moderation approach. We did not have specific hypotheses regarding whether
protective effects of school connectedness would be stronger for one dimension of adversity than
another; however, given the multidimensional nature of resilience, we did not assume it would be
uniformly protective.
Methods

77
Sample
In the present study, we used data from the FFCWS, a population-based, longitudinal,
birth-cohort study of approximately 5000 children born between 1998 and 2000 and their parents
across 20 U.S. cities. The FFCWS oversampled for non-marital births at an approximately 3:1
ratio (Reichman et al., 2001). When weighted, the FFCWS is representative of children born at
the turn of the century in American cities of 200,000 or more. When not weighted (as here),
given the oversample for non-marital births, the sample represents mostly low-income, urban
families. FFCWS families were interviewed at the birth of the focal child, and again when the
child was 1, 3, 5, 9, and 15 years of age through a combination of in-person interviews and
phone surveys.
Analyses in the present study use data from 3246 families primarily from the mother and
primary caregiver interviews at ages 3, 5, 9, and 15 and the focal child interviews at ages 9 and
15. Over the 3 waves where we used data from the primary caregiver survey (ages 3, 5, 9), an
average of 96% of respondents were mothers. Therefore, for parsimony, we refer to responses
from mothers and primary caregivers as maternal reports. Families were excluded if they were
missing data from all included variables from the year 3, 5, 9, and 15 waves (N=1167). Full
information maximum likelihood (FIML) estimation was used to account for missing data in
participants who were not missing all variables but were missing individual items (Kline, 2015;
Muthén & Muthén, 1998). See Table 4.1 for sample demographic information.
Previous work has separately examined dimensional models of adversity (Miller et al.,
2020) and school connectedness (Kalu et al., 2020) in the FFCWS sample. However, the present
study differs from that research in marked ways and is also the first to study them together. Our
dimensions of violence exposure and social deprivation and the method for measuring them are

78
distinct from previous work. Additionally, the work examining the beneficial effects of school
connectedness in the FFCWS sample only used data from girls in the wave at age 15 data, rather
than the full sample at both ages 9 and 15 as is done in the current study. Previous work in a
subsample of the FFCWS data from our lab has related childhood exposure to violence and
social deprivation to the brain using functional and diffusion MRI (Goetschius, Hein,
McLanahan, et al., 2020; Goetschius, Hein, Mitchell, et al., 2020b; Hein et al., 2020) and to the
stress hormone, cortisol (Peckins et al., 2019). This research used the same composite scores but
was done in a subsample of the FFCWS (N=237) that participated in a supplemental study that
collected, among other things, neuroimaging and hormone data. Examining the protective effects
of school connectedness on positive and negative adolescent function within a dimensional
framework of adversity in the FFCWS dataset is a novel contribution to the literature.
Measures
Childhood Violence Exposure and Social Deprivation Composite Scores
Violence exposure and social deprivation were assessed using composite scores
calculated using data from the Fragile Families and Child Wellbeing study at ages 3, 5, and 9
years. Both constructs included the maternal report of experiences that directly (i.e., child
physical and emotional abuse, child physical and emotional neglect) and indirectly (i.e., intimate
partner emotional, physical, or sexual violence, intimate partner support, community violence,
community support) affect the child. Our approach of including experiences with varying levels
of proximity to the child across multiple time points allowed us to comprehensively assess the
child’s cumulative, dimensional exposure to violence and social deprivation across childhood as
has been done in previous research (Hein et al., 2020; McLaughlin & Sheridan, 2016). These
composite scores were first utilized in previous work from our group (Hein et al., 2020).

79
Childhood Exposure to Violence. Included in this composite was the maternal report of
child physical and emotional abuse based on items from the Parent-Child Conflict Tactics Scale
(Straus et al., 1998) that have been used in previous research (Font & Berger, 2015; Hunt et al.,
2017). Five items were used to assess physical abuse including, “hit him/her on the bottom with
a hard object” and “shook him/her” and five items were used to assess emotional abuse including
whether the parent/caregiver has “sworn or cursed at,” or “called him/her dumb or lazy or some
other name like that.” Each item was rated on a 7-point Likert scale ranging from “never
happened” to “more than 20 times.” Maternal report of the child’s exposure to or victimization of
violence in the neighborhood (S. Zhang & Anderson, 2010) was also included in the composite.
This was measured using the maternal report of the child witnessing or being the victim of
beating, attacks with a weapon, shootings, and killings (witness only) on a 5-point Likert scale
ranging from “never” to “more than 10 times.” At age 9, the mother was not asked about whether
the child had witnessed killings or if they had been the victim of a shooting, so these items were
only included for ages 3 and 5 years. Lastly, we included maternal report of intimate partner
violence (IPV) (physical-2 items, emotional-3 items, or sexual-1 item) in the home at each wave
(Hunt et al., 2017). Each item was rated on a 3-point Likert scale ranging from “never” to
“often.” Physical IPV items included “he slapped or kicked you” and “he hit you with his fist or
a dangerous object.” Emotional IPV items included “he tried to isolate you from family and
friends,” and “he tried to prevent you from going to work and/or school.” The sexual IPV was
“he tried to make you have sex or do sexual things you didn’t want to do.” The child’s exposure
to IPV against the mother was coded as missing for a given wave if the child did not live with
their mother at least 50% of the time.

80
Childhood Exposure to Social Deprivation. Included in this composite was maternal
report of child physical and emotional neglect based on items from the CTS-PC (Straus et al.,
1998) that have been used in previous research (Font & Berger, 2015; Hunt et al., 2017). Four
items from the CTS-PC were used to assed physical neglect including whether the parent was
ever “so drunk or high that you had a problem taking care of your child.” One item, whether the
parent was “ever so caught up in your own problems that you were not able to show or tell your
child that you loved him/her,” was used to assess emotional neglect. These items from the CTS-
PC were reported on the same 7-point Likert scale as the items in the violence exposure
composite. Maternal report of social cohesion in the neighborhood was also included in this
composite (reverse coded such that higher scores corresponded to lower cohesion) (Donnelly et
al., 2016; Morenoff et al., 2001). This included 4 items, such as “this is a close-knit
neighborhood,” rated on a 5-point Likert scale ranging from “strongly agree” to “strongly
disagree.” Lastly, we included maternal report of the level of intimate partner support for each
wave using six items, such as “how frequently (the current romantic partner) expresses love and
affection (for the mother),” that were rated on a 3-point Likert scale ranging from “never” to
“often” (Manuel et al., 2012). This was also reverse coded such that higher scores corresponded
to less support. Child exposure to the mother’s intimate partner support was coded as missing for
a given wave if the child did not live with their mother at least 50% of the time.
Composite Score Calculation. To calculate composite scores, the Z scores for each of
the childhood experiences (child abuse, exposure to intimate partner violence, community
violence, child neglect, lack of romantic partner support, lack of neighborhood social cohesion)
were summed for each of the childhood experiences within a dimension (violence exposure and
social deprivation) (Song et al., 2013) and then divided by the number of childhood experiences

81
within a dimension for each participant, thus maximizing the number of participants and the
diversity of the sample by minimizing drop out due to missing data at any given wave. In our
sample, violence exposure and social deprivation were correlated at r = 0.400 with a variance
inflation factor (VIF) of 1.191. VIF reflects how much the estimated regression coefficients are
increased due to collinear independent variables. Cutoffs are typically between 5–10, therefore,
based on the VIF reported here, the multicollinearity of violence exposure and social deprivation
was low (Craney & Surles, 2002; Sheather, 2009).
Internalizing Symptoms
Child Internalizing Symptoms. Child (age 9) internalizing symptoms were measured
using maternal report on 28 items from the Child Behavior Checklist (CBCL) (Achenbach &
Edelbrock, 1983). These items came from three subscales; “anxious/depressed” (i.e., “Child cries
a lot”), “withdrawn/depressed” (i.e., Child enjoys very little), and “somatic complaints” (i.e.,
“Child has nightmares”). These items were rated on a three-point Likert scale ranging from 1-
“not true” to 3- “very true or often true.” Four items from these subscales were not included due
to very low endorsement (less than 20 responses for a category) which resulted in correlations
with other items which exceeded +/-0.985 due to one or more zero cells.
Adolescent Internalizing Symptoms. Adolescent internalizing symptoms in the FFCWS
were measured at age 15 using teen-report on five items for depression and five items for
anxiety. The items for depression were from the Center for Epidemiologic Studies Depression
Scale (CES-D) (Radloff, 1977) and include statements such as, “I feel I cannot shake off the
blues, even with help from my family and my friends.” Teens responded with their degree of
agreement based on the last four weeks on a four-point Likert scale ranging from 1- “strongly
agree” to 4- “strongly disagree.” The items for anxiety were adapted from the Brief Symptom

82
Inventory 18 (BSI-18) (Derogatis & Savitz, 2000) and include statements such as , “I have spells
of terror or panic.” Teens responded on a four-point Likert scale ranging from 1- “strongly agree”
to 4- “strongly disagree.” Items corresponding to both depression and anxiety were reverse coded
such that higher values represented more internalizing symptoms.
Externalizing Symptoms
Child Externalizing Symptoms. Child (age 9) externalizing symptoms were measured
using maternal report on 25 items from the Child Behavior Checklist (CBCL) (Achenbach &
Edelbrock, 1983). These items came from two subscales; “rule-breaking behavior” (i.e., “Child
lacks guilt”) and “aggressive behavior” (i.e., “Child argues a lot”). These items were rated on a
three-point Likert scale ranging from 1- “not true” to 3- “very true or often true.” Ten items from
these subscales were not included due to very low endorsement (less than 20 responses for a
category) which resulted in correlations with other items which exceeded +/-0.985 due to one or
more zero cells.
Adolescent Externalizing Symptoms. Adolescent externalizing symptoms were
measured at age 15 using teen-report of delinquency (6 items), impulsivity (6 items), and
substance use (5 items). The items for delinquency were adapted from the National Longitudinal
Study of Adolescent Health (Add Health - (Harris, 2013) and included items such as “painted
graffiti or signs on private property/public spaces.” Items were rated on a four-point Likert scale
ranging from 1- “never” to 4- “5 or more times.” Seven items from the delinquency scale were
not included due to very low endorsement (less than 20 responses for a category) which resulted
in correlations with other items which exceeded +/-0.985 due to one or more zero cells. The
items for impulsivity were adapted from the dysfunctional impulsivity items on Dickman’s
Impulsivity scale (Dickman, 1990), and included items such as, “I will often say whatever comes

83
into my head without thinking first.” Items were rated on a four-point Likert scale ranging from
1- “strongly agree” to 4- “strongly disagree.” Impulsivity items were reverse coded so that higher
scores represented increased impulsivity to match the delinquency scale. The items for substance
use were binary variables (yes/no) indexing cigarette use, alcohol use (more than 2 drinks
without parents), marijuana, illegal drugs other than marijuana, and taking prescription drugs
without a prescription.
Adolescent Positive Function
Adolescent positive function was measured at age 15 using teen-report on 20-items
adapted from the EPOCH Measure of Adolescent Wellbeing (Kern et al., 2016). These items
make up five subscales representing perseverance (i.e., “I finish whatever I begin”), optimism
(i.e., “I am optimistic about my future”), connectedness (i.e., “When something good happens to
me, I have people who I like to share the good news with”), happiness (i.e., “I feel happy”), and
engagement (i.e., “when I do an activity, I enjoy it so much that I lose track of time”). Teens
responded with their degree of agreement to the items based on the last 4 weeks on a four-point
Likert scale ranging from 1- “strongly agree” to 4- “strongly disagree.” These items were
recoded so that higher values represented more positive function.
School Connectedness
School connectedness was measured in the FFCWS via self-report at ages 9 and 15 years
based on questions developed for the Panel Study on Income Dynamics Child Development
Supplement (PSID-CDS) (The Panel Study of Income Dynamics Child Development Supplement:
User Guide for CDS-III, 2010). The focal child was asked if they “feel close to people at
school,” “feel like part of school,” are “happy to be at school,” and “feel safe at school.” At age
9, children responded on a five-point Likert scale with the frequency that they felt the above

84
questions ranging from “0 - not once in the past month” to “4 - every day.” At age 15, teens
responded on a five-point Likert scale with the degree of agreement with the same statements
ranging from “0 - strongly agree” to “4 - strongly disagree.” The Age 15 school connectedness
items were reverse coded so that higher scores represented more connectedness to be consistent
with the Age 9 items.
Covariates
Focal child sex at birth, self-reported race/ethnicity at age 15 (dummy coded – African
American, Caucasian, Latinx, Other), and average income-to-needs ratio across the study waves
were used as covariates in robustness checks. Self-reported race/ethnicity was coded using a set
of 3 dummy coded variables to represent the following groups: African American, Caucasian,
Hispanic/Latinx, and Other. The average income-to-needs ratio (referred to as poverty ratio in the
FFCWS data) is calculated by taking the average of (ℎ𝑜𝑢𝑠𝑒ℎ𝑜𝑙𝑑 𝑖𝑛𝑐𝑜𝑚𝑒
𝑝𝑜𝑣𝑒𝑟𝑡𝑦 𝑡ℎ𝑟𝑒𝑠ℎ𝑜𝑙𝑑) across the six study
waves. The poverty threshold accounts for household size and composition as well as inflation;
however, it does not differ geographically (U.S. Census Bureau, 2020).
Statistical Analysis
Analyses for the present study were done in a combination of R (v4.0.2) and Mplus
(v.8.4-Muthén & Muthén, 1998-2017). Data were cleaned in R and were prepared for analysis in
Mplus using the MplusAutomation package (v.0.7-3) (Hallquist & Wiley, 2018). The fit of the
measurement and structural models were assessed using accepted fit indices: RMSEA, CFI, TLI,
and SRMR (Hu & Bentler, 1999). The X2 value of these model are reported but were not
interpreted since X2 is likely inflated by the large sample size and thus the significant value
cannot be taken as an indicator of poor fit (Schermelleh-engel et al., 2003). To account for the
multisite design of the FFCWS, all measurement and structural models were clustered by city at

85
baseline and estimated using Taylor-series linearization using Type = Complex in Mplus. Cluster
effects could not be accounted for in the same way in the moderation models because they
required a different analysis type that allows for random slopes and models heterogeneity in the
residual variance (Muthén & Muthén, 1998).
Measurement Model
Latent variables were created using item level indicators to measure school
connectedness at age 9, school connectedness at age 15, internalizing symptoms at 9,
externalizing symptoms at 9, internalizing symptoms at age 15, externalizing symptoms at age
15, and positive function at age 15 (a single latent variable though there are subscales), in Mplus.
We used the WLSMV estimator because we had categorical as indicators of the latent factors
(Kline, 2015). Items were excluded if they did not have a standard YX loading of at least 0.4
(Kline, 2015). Standardized coefficients () are effect size estimates (Kline, 2015) and all factor
loadings reported in the present study are standardized.
Main Effects Models
We tested a model that estimated the main effects of childhood violence exposure,
childhood social deprivation, and child and adolescent school connectedness on our predicted
outcomes. It is tenable that internalizing symptoms, externalizing symptoms, or positive function
could influence how connected teens feel to school rather than how it specified in our
hypothesized model. Therefore, we also ran a reverse effects model where the outcome variables
predicted school connectedness at the same time point (e.g., age 9 internalizing symptoms
predicting age 9 school connectedness) and compared model fit and path estimates. All path
estimates reported in the present study are standard YX estimates. We used the WLSMV

86
estimator because we had categorical variables included the latent variables (Kline, 2015).
Models controlled for the demographic covariates listed above.
Moderation Models
Two moderation models were run. The first tested whether school connectedness at either
age 9 or age 15 moderated the association between childhood violence exposure and
internalizing and externalizing symptoms (age 9 and 15) or the association between childhood
social deprivation and internalizing and externalizing symptoms. The second tested whether
school connectedness at either age 9 or 15 moderated the association between childhood violence
exposure and adolescent positive function or the association between childhood social
deprivation and adolescent positive function. All moderation models were tested in Mplus using
a latent variable moderation approach (Maslowsky et al., 2015). In this approach, interaction
terms are created from an observed (i.e., social deprivation composite score) and a latent variable
(i.e., school connectedness at age 9) using the XWITH option along with ANALYSIS
TYPE=RANDOM which allows for random slopes that model heterogeneity in the residual
variance (Muthén & Muthén, 1998). We used the MLR estimator, because the WLSMV
estimator cannot be used with TYPE=RANDOM, and the Monte Carlo option for numerical
integration with 10000 randomly generated integration points (Muthén & Muthén, 1998). The fit
of these moderation models was assessed using a Satorra-Bentler scaled chi-square difference
test (TRd) using the log likelihood values for the main effects model verses the interaction model
(Satorra & Bentler, 2010). This was done because the traditional global fit indices are not
produced in Mplus when the analysis TYPE=RANDOM. Models controlled for demographic
covariates.

87
Simple Slopes Analysis. To interpret significant interactions, simple slope and regions of
significance analyses were conducted to determine the nature of the interaction and ensure that
the interaction was within our observable data using methods outlined by Preacher et al, (2006).
This was done in R using factor scores extracted from Mplus. Factor scores were extracted from
measurement models containing all of the latent variables in the model (e.g., school
connectedness at age 9, school connectedness at age 15, and adolescent positive function).
Interactions were plotted using the interactions (v1.1.1) toolbox in R (Long, 2019).
Results
Descriptive statistics for and zero-order correlations between childhood exposure to
violence and social deprivation as well as the factor scores representing child and adolescent
school connectedness, internalizing and externalizing psychopathology, and adolescent positive
function are in Table 4.2.
Measurement Model
The final measurement model using CFA to fit the Age 9 School Connectedness, Age 15
School Connectedness, Age 9 Internalizing Symptoms, Age 15 Internalizing Symptoms, Age 9
Externalizing Symptoms, Age 15 Externalizing Symptoms and Age 15 Positive Function items to
their respective factors fit the data well (Table 4.3 - RMSEA: 0.010, RMSEA 95% CI 0.009-0.010,
CFI = 0.935, TLI = 0.933, SRMR = 0.064, X2(4928) =6619.97). During the process of fitting the
CFA model, we discovered that three items from the internalizing subscales of CBCL did not
load well with the other items with standard factor loadings below the 0.4 threshold. These items
were excluded in the final measurement model. Additionally, we discovered that the engagement
subscale of the positive function (EPOCH) scale (4 items) did not load well with the rest of the
items from the other four subscales with standard factor loadings well below 0.4. Therefore, we

88
excluded the items from the engagement subscale from further analyses. All factor loadings in
the final measurement model had standard YX estimates of greater than 0.4.
Main Effects Models
The main effects model testing the main effects of childhood violence exposure,
childhood social deprivation, and child and adolescent school connectedness on our predicted
outcomes fit the data well (RMSEA=0.009, 95% CI 0.008-0.010, CFI = 0.928, TLI = 0.926,
SRMR = 0.065, X2(5602) =7094.661 - Figure 4.1). In this model, childhood violence exposure
predicted greater internalizing symptoms (age 9: =0.154, SE=0.030, p<0.001; age 15: =0.061,
SE=0.018, p=0.001), greater externalizing symptoms (age 9: =0.256, SE=0.021, p<0.001; age
15: =0.148, SE=0.012, p<0.001), and lower positive function at age 15 (=-0.031, SE=0.041,
p=0.029). Childhood social deprivation also predicted greater internalizing symptoms (age 9:
=0.212, SE=0.023, p<0.001; age 15: =0.079, SE=0.025, p=0.002) and externalizing symptoms
at age 9 (=0.128, SE=0.019, p<0.001) but not age 15. Social deprivation also predicted lower
positive function at age 15 (=-0.127, SE=0.022, p<0.001). School connectedness at age 9
predicted lower age 9 internalizing (=-0.141, SE=0.021, p<0.001) and externalizing (=-0.157,
SE=0.029, p<0.001) symptoms, but did not predict age 15 internalizing symptoms, externalizing
symptoms, or positive function. School connectedness at age 15 predicted lower age 15
internalizing (=-0.371, SE=0.016, p<0.001) and externalizing (=-0.289, SE=0.020, p<0.001)
symptoms as well as greater adolescent positive function (=0.567, SE=0.020, p<0.001).
The reverse effects model where the outcomes at age 15 (internalizing symptoms,
externalizing, symptoms, and positive adolescent function) predicted school connectedness at
age 15 and the outcomes at age 9 (internalizing and externalizing symptoms) predicted school
connectedness at age 9 fit the data worse than our hypothesized model (RMSEA=0.017, 95% CI:

89
0.016-0.017, CFI = 0.751, TLI = 0.745, SRMR = 0.115, X2(5611) =10745.500) and the
standardized path estimates were lower suggesting that our hypothesized model may be a better
fit for the data.
As a check, structural models were run separately for age 9 (RMSEA=0.010, 95% CI:
0.009-0.011, CFI = 0.950, TLI = 0.948, SRMR = 0.059, X2(2808) =3712.128) and for age 15
(RMSEA=0.021, 95% CI: 0.020-0.022, CFI = 0.897, TLI = 0.891, SRMR = 0.083, X2(1336)
=3301.428) and path estimates were similar. The only difference was that there was a main effect
of age 9 school connectedness (=0.178, SE=0.017, p<0.001) when age 15 school connectedness
was not in the model.
Moderation Models
A latent variable moderation model which included the interaction between school
connectedness at 15 and early adversity (violence exposure and social deprivation) was initially
tested for both for sets of outcomes; however, the moderation paths including school
connectedness at age 15 were non-significant. In order to retain a more parsimonious model,
those paths were removed in the final model.
Child and Adolescent Internalizing and Externalizing Symptoms as Outcome
This latent variable moderation model showed a significant interaction between social
deprivation and child school connectedness (age 9) when predicting child externalizing
symptoms (=0.073, SE=0.036, p=0.043 - Figure 4.2). This moderation model fit the data better
than the main effects model without interactions based on a Satorro-Bentler Scaled Chi-Square
Difference Test (TRd=18.765, df=8, p=0.016) and better than the moderation model with the
school connectedness at age 9 and social deprivation interaction path predicting child
externalizing symptoms set to 0 (TRd=6.515, df=1, p=0.011).

90
A simple slopes analysis revealed that at all conditional levels of age 9 school
connectedness that were tested (+1 standard deviation (SD), mean, -1 SD), social deprivation
was positively correlated with externalizing symptoms at age 9 (Figure 4.3). However, when
school connectedness was high (+1 SD), the slope of this association was steeper (b=0.162,
p<0.001) and the intercept was lower (intercept=-0.193) than when school connectedness was at
mean (b=0.123, p<0.001, intercept=-0.001) or low (b=0.0784, p=0.005, intercept=0.196) levels.
For ease of interpretation of these intervals, all variables were scaled such that the mean was 0
and SD was 1. An evaluation of Johnson-Neyman intervals showed that the interaction was
significant until social deprivation was 2.56 SD above the mean and when school connectedness
was greater than -1.55 SD below the mean. This suggests that school connectedness at age 9 was
protective against social deprivation but that the protective effects diminished when social
deprivation was moderately high (+2.56 SD). Additionally, when school connectedness at age 9
was low (-1.55 SD), it was not protective against social deprivation.
Adolescent Positive Function as Outcome
This latent variable moderation model showed a significant interaction between social
deprivation and school connectedness at age 9 when predicting adolescent positive function (=-
0.051, SE=0.026, p=0.045), even when accounting for the main effects of school connectedness
at age 9, school connectedness at age 15, social deprivation, violence exposure, and the
interaction between violence exposure and school connectedness at age 9 (Figure 4.4). This
moderation model fit the data better than the main effects model based on a Satorro-Bentler
Scaled Chi-Square Difference Test (TRd=7.088, df=2, p=0.029) and better than the moderation
model with the school connectedness at age 9 and social deprivation interaction set to 0
(TRd=6.603, df=1, p=0.010).

91
A simple slopes analysis revealed that at all conditional levels of age 9 school
connectedness that were tested (+1 SD, mean, -1 SD), social deprivation was negatively
correlated with positive adolescent function (Figure 4.5). However, when school connectedness
was high (+1 SD), the slope of this association was steeper (b=-0.150, p<0.001) and the intercept
was higher (intercept=0.209) than when school connectedness was at mean (b=-0.112, p<0.001,
intercept=-0.001) or low (b=-0.075, p=0.002, intercept=-0.210) levels. An evaluation of Johnson-
Neyman intervals showed that the interaction was significant until social deprivation was 2.83
SD above the mean and when school connectedness was greater than -1.41 SD below the mean.
For ease of interpretation of these intervals, all variables were scaled such that the mean was 0
and SD was 1. Similar to the interaction predicting externalizing symptoms at age 9, school
connectedness at age 9 was protective against social deprivation when predicting positive
adolescent function; however, it became less protective as social deprivation becomes more
extreme. Additionally, when school connectedness at age 9 was very low (-1.41 SD), it was not
protective against social deprivation.
Discussion
In the present study, we examined whether school connectedness was protective against
childhood exposure to violence and social deprivation based on multiple indices of child and
adolescent function in a longitudinal sample of close to 4,000 youth from the Fragile Families
and Child Wellbeing Study. We found that both child and adolescent school connectedness were
correlated with better concurrent outcomes (i.e., higher positive outcomes, lower negative
outcomes), even when accounting for the detrimental effects of violence exposure and social
deprivation. Additionally, we found that child school connectedness (age 9) specifically
interacted with childhood social deprivation, but not violence exposure, to moderate the

92
association with child externalizing symptoms and adolescent positive function. An analysis of
simple slopes for both interactions suggested that child school connectedness was a protective
but reactive factor against social deprivation, meaning that school connectedness was protective
against social deprivation, but that it became less protective as social deprivation became more
extreme (Luthar et al., 2000; Proctor, 2006).
Both child and adolescent school connectedness were promotive of contemporaneous
outcomes in all youth, regardless of their childhood exposure to violence or social deprivation.
Additionally, school connectedness at age 9 was a protective but reactive buffer against social
deprivation when predicting age 9 externalizing symptoms and even six years later when
predicting positive function. Protective but reactive effects confer protection against a risk factor,
but the buffering effect diminishes with increasing stress (Luthar et al., 2000). This pattern of
results suggests that the protective effect of age 9 school connectedness is reduced over time and
with increasing stress, which is consistent with previous work showing a decreasing promotive
effect size over time for late adolescent school connectedness (Markowitz, 2017). The residual
protective effect of age 9 school connectedness on positive function six years later supports
previous work positing that social connections and support at school can compensate for other
areas of social deprivation (H. Foster & Brooks-Gunn, 2009) and it extends that work by
showing that those connections seem to enhance adolescent self-reports of perseverance,
optimism, connectedness, and happiness.
Our results are consistent with the literature highlighting the protective effects of school
connectedness (Brookmeyer et al., 2006; Hardaway et al., 2012; Kalu et al., 2020; Markowitz,
2017), but expand on it in four key ways. First, we utilized two multi-context measures of
adversity that prospectively indexed a child’s exposure to both violence and social deprivation at

93
varying levels of proximity to the child (i.e., self, home, neighborhood) and at multiple time
points (ages 3, 5, 9 years). Second, we included measures of school connectedness and outcomes
at two time points (age 9 and 15 years). This allowed us to gain insight into the longitudinal
effects of school connectedness because we were able to assess how school connectedness can be
correlated with better outcomes at the same timepoint, but also in the future, while still
controlling for the effects of contemporaneous school connectedness. Third, we examined the
protective effects of school connectedness at an earlier age (9 years) than previous research
studies. Last, we operationalized resilience in terms of enhanced positive function in addition to
reduced negative function (i.e., internalizing and externalizing symptoms) which supports
examining protective processes in terms of multiple domains of function (National Research
Council (US) & Institute of Medicine (US) Board on Children, Youth, and Families, 2001).
Results from the present study underscore the important role that the school environment
can play for youth who have been exposed to adversity in other areas of their lives. They also
underscore the enduring effect of positive social connections. School-aged children and
adolescents spend a majority of their day at school (Roeser et al., 2000), and thus, it is critical to
help them develop strong social connections at school, especially those who are exposed to
violence and social deprivation in their homes and neighborhoods. Previous research has shown
that school connectedness is improved through social support and encouragement in school
involvement from teachers, school counselors, peers, and parents, as well as through
involvement in school-sponsored extracurricular activities (Daly et al., 2010). However, more
research is needed to determine effective interventions to promote school connectedness because
there are systematic disparities in school connectedness and climate based on race-ethnicity,
gender, and socioeconomic status (Liu et al., 2020; Voight et al., 2015). Promoting school

94
connectedness may be particularly salient for African American boys who experience disparate
treatment at school, including disproportionately high levels of suspensions and expulsions
(Thomas & Stevenson, 2009) and systematically lower expectations for academic attainment
(Wood et al., 2007). Additionally, Latinx youth are the largest ethnic minority in the U.S.;
however, the rate of degree attainment in Latinx high school students is systematically lower and
has been linked to academic discrimination (Alfaro et al., 2009). These troubling trends highlight
the importance of identifying processes that promote factors, such as school connectedness, that
improve academic and socio-emotional outcomes in at-risk youth (Liu et al., 2020).
Results from the present study support modeling adversity in terms of their core
underlying dimensions which relate to development in both distinct and overlapping ways
(McLaughlin & Sheridan, 2016). We found that both violence exposure and social deprivation
predicted childhood symptoms of psychopathology. However, violence exposure distinctly
predicted adolescent externalizing symptoms and social deprivation, more strongly predicted
reduced adolescent positive function. These findings are largely consistent with previous
research modeling the effects of adversity using the DMAP framework, including work done
with the FFCWS sample, which found that threat (similar to our violence exposure) was
associated with both internalizing and externalizing symptoms (Miller et al., 2018, 2020). We are
unaware of any prior research examining links between dimensions of adversity and positive
function. The predictive effect of social deprivation suggests that there may be a specific
mechanism linking the lack of expected social input in the home and neighborhood environment
with teen self-reports of low perseverance, optimism, connectedness, and happiness.
Findings related to social deprivation in the present study are complementary but not
identical to those found in previous research using the DMAP framework. This may be due to

95
varying definitions of deprivation. Deprivation constructs have largely encompassed two areas:
cognitive, which indexes information about a lack of cognitive enrichment of the child’s
environment (e.g., age-appropriate toys, books, measures of SES - Lambert et al., 2017; Miller et
al., 2018); and social, which indexes information about a lack of expected social input in the
child’s environment as was done in the present study. Previous work has explicitly or implicitly
operationalized deprivation as either cognitive deprivation, social deprivation, or both.
Behavioral correlates of these differing definitions suggest that deprivation may be two
dimensions rather than one. Deprivation, when indexed by both cognitive and social deprivation,
has been linked to increased internalizing and externalizing symptoms (Miller et al., 2020).
However, when deprivation is indexed strictly as cognitive deprivation, it is associated
selectively with increased externalizing symptoms (Miller et al., 2018), suggesting that perhaps
cognitive deprivation is related to a higher risk for externalizing psychopathology and, consistent
with our findings, social deprivation may be a greater risk factor for internalizing
psychopathology. Future work using dimensional models of adversity should more directly test
whether social and cognitive deprivation form two separate dimensions in addition to violence
exposure/threat. Additionally, future work comparing the neural correlates of differing
definitions of deprivation may provide insight into if there are diverging neural mechanisms
underlying cognitive and social deprivation.
We found that social connections at school can promote resilience broadly, but that
protective effects also manifest in more specific ways through interaction with social deprivation.
This highlights the importance of studying protective factors within a dimensional model of
adversity and suggests that school connectedness may work through multiple mechanisms to
influence function. A benefit of employing dimensional models of adversity is that it is possible

96
to test specific hypotheses regarding how variation in core aspects of childhood adversity relate
to outcomes with the idea that particular dimensions are likely to impact development through
specific neurobiological mechanisms (McLaughlin et al., 2014). By examining protective
processes within a dimensional model of adversity, we were able to identify that social
connections at school protected against, and may make up for, a lack of expected social input
elsewhere (H. Foster & Brooks-Gunn, 2009), while also promoting outcomes overall. Future
research should test whether the compensatory effects of school connectedness operate through
distinct neurobiological mechanisms compared to the general promotive effects. Additionally,
future research should examine if school connectedness is protective against other dimensions of
adversity, such as cognitive deprivation or environmental instability (Ellis et al., 2009; Miller et
al., 2018), which would provide additional insight into the mechanisms through which school
connectedness promotes resilience.
The present study had limitations. First, there was a six-year gap between FFCWS data
collection waves at ages 9 and 15. We would be able to better understand these protective
associations and how the strength of school connectedness at age 9 changes over time if we had
information about the children and their families during this gap. Second, we did not have a
comparable index of positive function at age 9 to test whether school connectedness at age 9 is
also correlated with positive function. Third, the violence exposure and social deprivation
composites were derived from maternal reports. Data regarding childhood adversity from sources
outside the home, such as social workers and teachers, would make our composites more
comprehensive. Last, the environment of adversity is complex; thus, there are likely unmeasured
variables that may influence these associations or contribute to cascades of risk.
Conclusion

97
The present findings suggest that school connectedness is a robust protective factor
against exposure to early adversity in youth from the FFCWS in terms of both positive and
negative metrics of child and adolescent function. Social connections at school may compensate
for a lack of expected social support and input in the home and neighborhood to help reduce
externalizing symptoms and promote positive adaptive function. Consistent with previous
research, our results highlight the important role that the school environment can play for youth
who have been exposed to adversity in other areas of their lives. Additionally, the interactive
effect of school connectedness with social deprivation, but not violence exposure, supports
modeling risk and resilience processes using dimensional frameworks to better identify specific
groups of youth that may benefit from interventions that boost social connectedness at school.

98
Table 4.1: Demographic characteristics
Demographic characteristics of the sample.
Overall
(N=3246)
Child’s Sex at Birth
Female 1585 (48.8%)
Male 1661 (51.2%)
Adolescent Race-Ethnicity – Self-report at Age 15
African American 1592 (49.0%)
Caucasian 587 (18.1%)
Latinx 808 (24.9%)
Other 259 (8.0%)
Average Income-to-Needs Ratio1 Across All Study Waves
Mean (SD) 2.11 (2.10)
Median [Min, Max] 1.46 [0.120, 21.2]
Maternal Marital Status at Child's Birth
Married 785 (24.2%)
Not Married 2443 (75.3%)
Missing 18 (0.6%)
Maternal Education at Child's Birth
Less than high school 1025 (31.6%)
High school or equivalent 1030 (31.7%)
Some college or technical school 821 (25.3%)
College or graduate school 365 (11.2%)
Missing 5 (0.2%)
1 Income-to-needs ratio variable is referred to as the poverty ratio in the FFCWS dataset.

99
Table 4.2: Descriptive statistics and zero-order correlations
Means, standard deviations, and zero-order correlations with confidence intervals of the variables of the interest.
Note. M and SD are used to represent mean and standard deviation, respectively. Values in square brackets indicate the 95%
confidence interval for each correlation. The confidence interval is a plausible range of population correlations that could have caused
the sample correlation (Cumming, 2014). ** indicates p < .01.
Variable M SD 1 2 3 4 5 6 7 8
1. Violence Exposure 0.01 0.53
2. Social Deprivation 0.00 0.53 .40**
[.37, .43]
3. School Connectedness
(Age 9) -0.05 0.77 -.05** -.06**
[-.09, -.02] [-.09, -.02]
4. School Connectedness
(Age 15) -0.04 0.78 -.14** -.13** .16**
[-.17, -.10] [-.16, -.10] [.12, .19]
5. Internalizing Symptoms
(Age 9) 0.08 0.82 .20** .26** -.12** -.07**
[.16, .23] [.22, .29] [-.15, -.08] [-.11, -.04]
6. Externalizing Symptoms
(Age 9) 0.05 0.88 .34** .24** -.15** -.12** .60**
[.30, .37] [.21, .28] [-.19, -.11] [-.16, -.08] [.58, .62]
7. Internalizing Symptoms
(Age 15) 0.03 0.87 .08** .12** -.09** -.31** .14** .13**
[.05, .12] [.08, .15] [-.13, -.05] [-.34, -.28] [.11, .18] [.09, .16]
8. Externalizing Symptoms
(Age 15) 0.04 0.91 .19** .11** -.08** -.26** .08** .24** .42**
[.16, .23] [.08, .15] [-.12, -.05] [-.29, -.23] [.05, .12] [.21, .28] [.39, .45]
9. Positive Function
(Age 15) -0.02 0.89 -.04* -.11** .13** .42** -.12** -.09** -.50** -.27**
[-.08, -.01] [-.14, -.08] [.09, .16] [.39, .45] [-.16, -.08] [-.12, -.05] [-.53, -.48] [-.30, -.24]

100
Table 4.3: Measurement model factor loadings
Standard factor loading values for the latent variable measurement model. All factor loadings were
significant at p<0.001. Items were excluded if loading <0.4 or if very low endorsement (less than 20
responses per category). Model was clustered by city at birth.
Latent Variable Item Standard YX
Factor Loading School Connectedness K5E1A: Felt part of school 0.684
Age 9 K5E1B: Felt close to people at school 0.586
K5E1C: Happy to be at school 0.753
K5E1D: Felt safe at school 0.766
School Connectedness K6B1A1: Feel close to people at school 0.663
Age 15 K6B1B1: Feel part of school 0.772
K6B1C1: Happy to be at school 0.772
K6B1D1: Feel safe at school 0.637
Internalizing Symptoms P5Q3M: Cries a lot 0.644
Age 9 P5Q3AB: Fears certain animals/situations/places 0.463
P5Q3AD: Fears might do something bad 0.628
P5Q3AF: Feels/complains no one loves him/her 0.745
P5Q3AH: Feels worthless/inferior 0.820
P5Q3AR: Nervous movements or twitches 0.643
P5Q3AV: Too fearful or anxious 0.689
P5Q3AX: Feels too guilty 0.753
P5Q3BQ: Self-conscious or easily embarrassed 0.570
P5Q3CK: Talks about killing self 0.845
P5Q3DB: Worries 0.533
P5Q3E: Enjoys verry little 0.475
P5Q3AO: Would rather be alone than with others 0.593
P5Q3BK: Refuses to talk 0.641
P5Q3BO: Secretive, keeps things to self 0.639
P5Q3CU: Underactive, slow moving, lacks energy 0.651
P5Q3DA: Withdrawn, doesn’t get involved with others 0.713
P5Q3AS: Has nightmares 0.576
P5Q3AU: Constipated, doesn’t have bowel movements 0.524
P5Q3AZ: Overtired without good reason 0.754
P5Q3BB1: Aches or pains without medical cause 0.649
P5Q3BB2: Headaches without medical cause 0.506
P5Q3BB5: Rashes/skin problems without medical cause 0.436
P5Q3BB6: Stomachaches without medical cause 0.610
P5Q3BB7: Vomiting without medical cause 0.618
Externalizing Symptoms P5Q3X: Doesn’t feel guilty after misbehaving 0.618
Age 9 P5Q3AA: Breaks rules 0.744
P5Q3AL: Hangs around with others who get in trouble 0.642
P5Q3AP: Lies or cheats 0.712
P5Q3BI: Prefers being with older kids 0.421
P5Q3BZ: Steals at home 0.749
P5Q3CJ: Swears or uses obscene language 0.768
P5Q3C: Argues a lot 0.611
P5Q3O: Cruel, bullies, shows meanness to others 0.774
P5Q3R: Demands a lot of attention 0.644
P5Q3S: Destroys own things 0.774
P5Q3T: Destroys things belonging to others 0.781
P5Q3U: Disobedient at home 0.726
P5Q3V: Disobedient at school 0.710
P5Q3AJ: Gets in many fights 0.765

101
P5Q3BC: Physically attacks people 0.832
P5Q3BN: Screams a lot 0.730
P5Q3CF: Stubborn, sullen, irritable 0.745
P5Q3CG: Sudden changes in mood/feelings 0.762
P5Q3CH: Sulks a lot 0.718
P5Q3CI: Is suspicious 0.692
P5Q3CN: Teases a lot 0.678
P5Q3CO: Temper tantrums or hot temper 0.772
P5Q3CQ: Threatens people 0.860
P5Q3CW: Unusually loud 0.655
Internalizing Symptoms K6D2AG1: Nervous or shaky inside 0.773
Age 15 K6D2AI1: Feel fearful 0.587
K6D2D1: Spells of terror or panic 0.643
K6D2J1: Feel tense or keyed up 0.563
K6D2T1: Suddenly scared for no reason 0.685
K6D2AC1: Feel depressed 0.878
K6D2AK1: Feel so restless I can’t sit still 0.543
K6D2C1: Cannot shake off the blues even with help 0.616
K6D2N1: Feel sad 0.820
K6D2X1: Feel life is not worth living 0.768
Externalizing Symptoms K6D2A1: Don’t spend enough time thinking before act 0.508
Age 15 K6D2P1: Say/do things without considering consequences 0.675
K6D2R1: Plans don’t work because haven’t gone over 0.550
K6D2Z1: Make up mind without taking time to consider 0.551
K6D2AB1: Say whatever comes into mind 0.572
K6D2AJ1: Get into trouble because don’t think before act 0.753
K6D61C: Taken something from store without paying 0.902
K6D61D: Gotten into a serious physical fight 0.644
K6D61E: Hurt someone badly enough for medical care 0.628
K6D61K: Stolen something worth less than $50 0.861
K6D61L: Taken part in group fight 0.583
K6D61M: Were loud/rowdy/unruly in public place 0.472
K6D401: Smoked entire cigarette 0.656
K6D481: Drank alcohol more than twice without parents 0.554
K6F631: Ever tried marijuana 0.597
K6F681: Ever tried illegal drugs other than marijuana 0.625
K6F741: Ever used prescription drugs (not prescribed) 0.681
Positive Function K6D2B1: Love life 0.755
Age 15 K6D2F1: Am a cheerful person 0.672
K6D2G1: Have friends that I really care about 0.444
K6D2I1: Keep at my schoolwork until I am done 0.497
K6D2K1: Make plans and stick to them 0.556
K6D2L1: People in my life who really care about me 0.724
K6D2M1: Finish whatever I begin 0.564
K6D2O1: Think good things are going to happen to me 0.568
K6D2S1: Feel happy 0.866
K6D2V1: Am a hard worker 0.592
K6D2W1: Believe that things will work out 0.643
K6D2Y1: Have someone who will be there if I have problem 0.659
K6D2AA1: Have a lot of fun 0.721
K6D2AE1: In uncertain times I expect the best 0.467
K6D2AF1: Have person to share good news with 0.615
K6D2AH1: Optimistic about my future 0.484
1 Item was reverse coded

102
Figure 4.1: Diagram of the main effects model including school connectedness
Model controlled for average income-to-needs ratio, race-ethnicity, and sex and was clustered by
city at birth.
Path estimates shown are StandardYX estimates. To make this figure more readable, only paths
significant at p<0.05 are shown, but all were modeled. P-values of all paths are p<0.01 except
where reported otherwise. Correlations between all outcome latent variables are not shown to
simplify the figure but are modeled and are all significant at p<0.01.
Violence
Exposure
Composite
(Ages 3, 5, 9)
Social
Deprivation
Composite
(Ages 3, 5, 9)
Internalizing
(Age 15)
Positive
Function
(Age 15)
Externalizing
(Age 15)
Internalizing
(Age 9)
Externalizing
(Age 9)
School
Connectedness
(Age 9)
School
Connectedness
(Age 15)
-0.141
-0.157
0.154
0.212
0.256
0.125
-0.371
0.061
0.079
-0.289
0.148
0.567 -0.061, p=0.029
-0.127
0.268

103
Figure 4.2: Diagram of latent moderation model predicting psychopathology
Diagram of the latent variable moderation model showing that school connectedness at age 9
moderates the association between social deprivation (ages 3, 5, 9) and externalizing symptoms
(ages 9). Model controlled for average income-to-needs ratio, race-ethnicity, and sex.
Note: Path estimates shown are StandardYX estimates. To make this figure more readable, only
paths significant at p<0.05 are shown. All paths, including all 4 interaction paths, are retained in
the model even though they are not shown. Including age 15 school connectedness and
symptoms of psychopathology does not change the results of this model.
Violence
Exposure
Composite
(Ages 3, 5, 9)
Social
Deprivation
Composite
(Ages 3, 5, 9)
School
Connectedness
(Age 9) Internalizing
(Age 9)
Externalizing
(Age 9)
0.105
-0.153
0.446
0.339
-0.165
0.574
0.750
0.269

104
Figure 4.3: Simple slopes plot for SCxSD interaction predicting externalizing symptoms
Plot illustrating the interaction between childhood social deprivation (ages 3, 5, 9) and school
connectedness at age 9 in predicting childhood externalizing symptoms (age 9). For ease of
interpretation, all variables have been centered and z-scored so that the mean is 0 and the
standard deviation (SD) is 1. The dashed line represents mean levels of social deprivation.
School connectedness has been plotted at mean and +/- 1 SD. An evaluation of Johnson-Neyman
intervals shows that, in this sample, the interaction was significant until social deprivation was
very high (+3.22 SD) and when school connectedness was greater than -1.55 SD. This suggests
that school connectedness at age 9 also had a protective but reactive association with social
deprivation when predicting externalizing symptoms at age 9, meaning that school
connectedness was protective against social deprivation but that the protective effects diminished
when social deprivation was extreme. Additionally, when school connectedness at age 9 was low
(-1.55 SD), it was not protective against social deprivation. The range of school connectedness at
age 9 in this sample was [-3.31, 1.59] and the range of social deprivation values was [-2.77,
7.54].

105
Figure 4.4: Diagram of latent moderation model predicting positive function
Diagram of the latent variable moderation model showing that school connectedness at age 9
moderates the association between social deprivation (ages 3, 5, 9) and positive adolescent
function (age 15). Model controlled for average income-to-needs ratio, race-ethnicity, and sex.
Note: Path estimates shown are StandardYX estimates. To make this figure more readable, only
paths significant at p<0.05 are shown. All paths, including all both interaction paths, are retained
in the model even though they are not shown. Including age 15 school connectedness does not
change the results of this model.
Violence Exposure
Composite
(Ages 3, 5, 9)
Social
Deprivation
Composite
(Ages 3, 5, 9)
Positive
Function
(Age 15)
School
Connectedness
(Age 9)
-0.128
-0.235

106
Figure 4.5: Simple slopes plot for SCxSD interaction predicting positive function
Plot illustrating the interaction between childhood social deprivation (ages 3, 5, 9) and school
connectedness at age 9 in predicting adolescent positive function (age 15). For ease of
interpretation, all variables have been centered and z-scored so that the mean is 0 and the
standard deviation (SD) is 1. The dashed line represents mean levels of social deprivation.
School connectedness has been plotted at mean and +/- 1 SD. An evaluation of Johnson-Neyman
intervals shows that, in this sample, the interaction was significant until social deprivation was
very high (+2.77) and when school connectedness was greater than -1.27. This suggests that
school connectedness at age 9 had a protective but reactive association with social deprivation
when predicting positive adolescent function, meaning that school connectedness was protective
against social deprivation but that the protective effects diminished when social deprivation was
extreme. Additionally, when school connectedness at age 9 was low (-1.27 SD), it was not
protective against social deprivation. The range of school connectedness at age 9 in this sample
was [-3.26, 1.46] and the range of social deprivation values was [-2.77, 7.54].

107
Chapter 5: General Discussion
Early adversity is a potent and unfortunately common public health concern that
increases the risk of negative physical and mental health outcomes during childhood, and this
risk persists throughout the lifespan (Green et al., 2010). Research has shown that experiences of
adversity can be distilled down to core underlying dimensions that have at least partially distinct
effects on neural and behavioral development (McLaughlin et al., 2014; Miller et al., 2018). This
dissertation examined how two such dimensions, violence exposure and social deprivation,
related to alterations in neural architecture and function, as well as behavioral outcomes.
Importantly, many children exposed to early adversity do not experience negative outcomes
(Masten, 2001). However, there is a lack of work empirically testing protective processes within
this dimensional framework. Thus, a second objective of this dissertation was to examine how
protective factors buffered against adversity and whether this differed across dimensions of
adversity or by the outcome examined. This research has implications for understanding how
dimensions of adversity affect the brain and behavior during development and what factors can
be protective, which can inform future neuroscience-informed policy interventions.
Summary
Study 1. Dimensions of adversity may differentially shape emotion-based neural
circuitry, such as the white matter linking the amygdala with regions of the PFC (Etkin et al.,
2015; McLaughlin et al., 2014; Swartz et al., 2014). Using a preregistered analysis plan, this
chapter showed that childhood violence exposure and social deprivation interacted to predict the
probability of adolescent right hemisphere amygdala–OFC white matter connectivity. High

108
violence exposure with high social deprivation related to less amygdala–OFC white matter
connectivity. Violence exposure was not associated with white matter connectivity when social
deprivation was at mean or low levels (i.e., relatively socially supportive contexts). Therefore,
social deprivation may exacerbate the effects of childhood violence exposure on the development
of white matter connections involved in emotion processing and regulation. Conversely, social
support may buffer against them.
Study 2. Dimensional exposure to early adversity may also differentially shape
functional networks in the brain, such as the salience and default mode networks (Marusak,
Etkin, et al., 2015; McLaughlin et al., 2019). Observed effects of adversity on functional
networks are likely to be person specific because there is considerable variability in neural
responses to environmental stress (Marder & Goaillard, 2006). Chapter 3 used a person-specific
approach to modeling resting-state functional networks (GIMME) and a pre-registered analysis
plan to show that childhood violence exposure, but not social deprivation, was associated with
reduced adolescent resting-state density of the salience and default mode networks in the SAND
sample. A data-driven algorithm, blinded to childhood adversity, identified youth with
heightened violence exposure based on resting-state connectivity patterns. Childhood violence
exposure appears to be associated with adolescent functional connectivity heterogeneity, which
may reflect person-specific neural plasticity and should be considered when attempting to
understand the impacts of early adversity on the brain.
Study 3. School connectedness, a construct indexing supportive school relationships, has
been posited to promote resilience (Barber & Olsen, 1997; Hardaway et al., 2012). Consistent
with prominent calls in the field (Masten & Cicchetti, 2016), this study was precise in its
measure of two dimensions of adversity which index multiple levels of environmental exposure

109
and it examines resilience in terms of both the absence of negative outcomes and the presence of
positive function. Results from this chapter showed that child and adolescent school
connectedness were promotive of concurrent outcomes, even when accounting for the
detrimental effects of violence exposure and social deprivation. Additionally, child school
connectedness had a protective but reactive association (Luthar et al., 2000) with social
deprivation, but not violence exposure, when predicting child externalizing symptoms and
adolescent positive function. These findings highlight the important role that the school
environment can play for youth who have been exposed to adversity in other areas of their lives.
Additionally, the interactive effect of school connectedness with social deprivation, but not
violence exposure, supports modeling risk and resilience processes using dimensional
frameworks to better identify specific groups of youth that may benefit from interventions that
boost social connectedness at school in future research.
Considerations
The research discussed in this dissertation provides evidence of dimensional effects of
risk and resilience on neural and behavioral indices of socio-emotional function, but also
highlights considerations for future research.
Timing Effects. All three studies in this dissertation examined the cumulative effects of
childhood exposure to violence and social deprivation on developmental outcomes. However,
future work should determine how the timing of exposure impacts its effect on development.
Evidence for experience-driven plasticity suggests that plasticity driven by environmental
experience is influenced by the timing, quality, and intensity of those experiences (Gottlieb,
2007; Kolb & Gibb, 2014; McLaughlin et al., in press). Indeed, previous work has found
evidence for differential effects of neighborhood adversity on adolescent and early adult

110
corticolimbic function (Gard et al., 2021). This research found specific effects of neighborhood
disadvantage in early childhood and adolescence on amygdala reactivity and PFC reactivity,
respectively, suggesting that there may be sensitive periods or periods of heightened
neuroplasticity that differ across the brain and lead to more specific effects (Hyde et al., 2020).
More work is needed to determine whether there are specific developing timing effects of
violence exposure and social deprivation on the neural and behavioral correlates of
socioemotional function measured in this discussion. Progress towards that end can be made with
the existing SAND data. However, given that the first timepoint of neuroimaging data collected
in this sample was in adolescence (discussed in more detail below) and that there is a gap in
information about the child’s environmental exposures from approximately ages 9 to 15 years,
conclusions about timing effects may still be limited. Data from the longitudinal Adolescent
Behavioral and Cognitive Development® (ABCD) study (Casey et al., 2018), may be able to
address how exposure to adversity shapes neural development in adolescence since there would
baseline information about neural structure and function from childhood (Age 9-10). ABCD data
would still be limited; however, in drawing conclusions about neural and behavioral correlates of
early childhood adversity since the first study wave does not occur until preadolescence and thus
all reports of early adversity would be retrospective. Additionally, there are qualitative
differences between the samples in the SAND/FFCWS and ABCD studies that may hinder direct
comparisons (sample considerations discussed in more detail below). Future studies should be
designed to prospectively assess how developmental timing impacts the effects of adversity
using dimensional frameworks in samples with adequate representation of marginalized
populations (i.e., low-income families or families of color) who likely experience more adversity
(Falk et al., 2013; Hyde et al., 2020).

111
Causal Effects. Studies 1 and 2 found evidence of longitudinal associations between
dimensions of adversity and neural connectivity; however, given that there is only a single
timepoint of imaging data in the SAND study, it is not possible to determine causal effects of the
environment on the brain or vice versa. Additionally, the brain is plastic, and measures of neural
structure and function are not static, particularly during childhood, adolescence, and early
adulthood when there are times of explosive neural development (Giedd et al., 1999; Richmond
et al., 2016). Therefore, we do not know how the patterns of associations observed in studies 1
and 2 differed earlier in development or how they will continue to change as the teens transition
to early adulthood and beyond. Of further interest would be change over time in these patterns of
association and how longitudinal trajectories of neural structure and function are shaped by
adversity and how that corresponds to socioemotional function (Hyde, 2015; Wiggins & Monk,
2013).
Links between Brain and Behavior. Surprisingly absent from studies 1 and 2 were links
between neural correlates of adversity and behavioral outcomes, specifically psychopathology.
This could be for a number of reasons which should be the focus of additional research. First, the
adversity-related differences in white matter and resting-state function connectivity could be
reflective of adaptation and could promote resilience (Lipina & Evers, 2017; Varnum &
Kitayama, 2017). Evidence for this potential explanation comes from study 1 where the effects
of violence exposure were conditional upon social deprivation. Only in teens with high violence
exposure and high social deprivation, a relatively small portion of the sample, was there an
association with white matter connectivity suggesting that low social deprivation, or relative
social support, could be protective. Results from study 2 showing that violence exposure was
related to more individual heterogeneity in resting-state functional connectivity also provide

112
evidence of potential neural adaptation to adversity. This individual heterogeneity may reflect a
tuning of neural circuits to the environment that promote stability of network function in the
context of violence and threat in the environment (Marder & Goaillard, 2006; Varnum &
Kitayama, 2017). Additionally, although we did not examine neural correlates in study 3, the
theory that the adversity-related differences in brain structure and function may be adaptive
could be tested in future research by determining whether they relate to the measure of positive
function and wellbeing used in study 3 (EPOCH - Kern et al., 2016) An important consideration
related to resilience and adaptation as an explanation; however, is that protective processes can
differ by risk process and by domain of function (National Research Council (US) & Institute of
Medicine (US) Board on Children, Youth, and Families, 2001). Therefore, it is also tenable that,
although the adversity-related neural correlates we observed did not relate to internalizing
psychopathology, they may relate to differences in other domains of function.
A second possible explanation for the lack of association between the observed neural
correlates of adversity and psychopathology is the way in which psychopathology was measured
in this dissertation. Similar to adversity, psychopathology can be considered to be dimensional,
rather than categorical, with two dimensions being internalizing and externalizing
psychopathology (Hyde, 2015). Hypotheses for studies 1 and 2 focused only on how neural
correlates of adversity were associated with internalizing psychopathology (i.e., depression and
anxiety). However, given the high comorbidity of internalizing and externalizing
psychopathology in youth (Caron & Rutter, 1991; G. T. Smith et al., 2020; Wiggins et al., 2015),
perhaps study 1 and study 2 should have tested for associations with both dimensions of
psychopathology simultaneously as was done in Study 3. Alternatively, perhaps a better way to
measure broad maladaptive function associated with psychopathology would be to use “p-

113
factor,” which is hypothesized to be an overall latent risk for distress and overall
symptomatology across both internalizing and externalizing psychopathology (Hyde, 2015; G. T.
Smith et al., 2020). It is tenable that the adversity-related neural correlates would be related to
higher order associations indexed by a transdiagnostic “p-factor” (Hyde, 2015). An important
direction for future research using dimensional models of adversity would be to test whether
dimensions of adversity better predict specific dimensions of psychopathology or if exposure to
adversity more generally increases risk for psychopathology using “p-factor.”
Similarly, a third potential explanation for why we did not observe strong links between
the brain and behavior in this dissertation may be that the dimensional framework generally, or
the dimensions that we used specifically, do not correspond to neural correlates that relate to
behavior. Critics of dimensional models of adversity posit that the distinctions made between
dimensions are social in nature and thus are not likely to have distinct, meaningful effects on the
brain and subsequent psychopathology (K. E. Smith & Pollak, 2020). Although this is a
possibility, evidence does exist linking neural correlates within dimensional models of adversity
to behavior (e.g., Sheridan et al., 2017). Additionally, systematic reviews and meta-analyses have
found evidence for the specific effects of dimensional exposure to threat or deprivation on
biological metrics (e.g., brain structure and function, cellular aging) which have corresponded to
differences in behavior, including indices of psychopathology (Colich et al., 2020; McLaughlin
et al., 2019). With that in mind, it is tenable that either the dimensions or neural correlates we
studied were not meaningfully linked with behavior, but that other dimensions or other indices of
neural structure or function would be.
A last and less optimistic alternative would be that the associations between neural
correlates of adversity and psychopathology will develop later as this sample transitions to early

114
adulthood. Life course theory suggests that key transitions, such as the transition to adulthood,
are times of stress and individual life trajectories can be shaped by supportive relationships and
by social capital that provides resources in the transition to post-secondary education or the labor
force (Elder & Shanahan, 2006; McLoyd et al., 2015). Social resources are especially important
for socioeconomically disadvantaged or marginalized youth for whom they may be limited by
systematic mechanisms of inequality (McLoyd et al., 2015). Interestingly, rates of
psychopathology in the SAND teens were approximately equal to or below national averages
(Table 5.1); however, the rates for the SAND parents/guardians (92% biological mothers) were
generally higher than the national average, particularly for depressive disorders and PTSD
(Kessler et al., 2005; Merikangas et al., 2010). With the transition to adulthood, we may see
heterotypic continuity in the link between adversity-related neural correlates and
psychopathology outcomes where the same process, or neural correlate, may relate to different
outcomes at different developmental stages (Angold et al., 1999; Hyde, 2015). The neural
correlates observed in study 1 and study 2 may be adaptive in the short term, or in the teen’s
current context (Hyde et al., 2020; Varnum & Kitayama, 2017), but it will important to continue
to follow these teens to determine if that remains the case as they transition to adulthood.
Generalizability. A strength of the SAND subsample and the larger FFCWS sample is
that it includes substantial representation of marginalized populations, specifically African
American youth and their families. For example, the SAND subsample is approximately 70%
African American, which makes it largely different from other large neuroimaging samples
(though see Brody et al., 2017; Shaw et al., 2012 for other examples). However, this may impact
how the results compare to the extant literature and highlights the limits of generalizability of
results based on sample composition. Previous work in the SAND sample has found adversity-

115
related neural correlates that do not entirely match existing trends in the literature (e.g., threat
relates to attenuated rather than heightened amygdala reactivity (Hein et al., 2020; Hein & Monk,
2017). Similarly, study 2 in this dissertation found that violence exposure was related to reduced
salience network density, which is not directly in line with results of resting-state functional
connectivity studies showing adversity-related increases in salience network connectivity (e.g.,
Marusak, Etkin, et al., 2015). This may be due to meaningful differences in sample
demographics or systematic differences in the experience of adversity (e.g., chronic vs. acute).
For example, research in other high-risk samples found similar blunting of amygdala reactivity
(Gard et al., 2017; Holz et al., 2017) and work examining the HPA-axis response to stress has
found that experiences of chronic stress, or adversity, relate to blunting of the stress response
(McCarty, 2016). Additionally, the representation of different racial, ethnic, and gender identities
as well as the systematic differences in their experiences contribute to the complex associations
between context, biology, and behavior and it is important to consider how these factors may
impact how research findings are interpreted and may generalize (Hyde et al., 2020). Last,
discussions regarding generalizability of results are not complete without considering the
importance of thoughtful, representative sampling in the first place. In order to be able to more
fully understand complex associations between adversity, the brain, and behavior, the research
questions must be asked in well-powered studies where there is substantial representation of the
communities to which we want the results to generalize (Davis‐Kean & Jager, 2017; Falk et al.,
2013; Hyde et al., 2020).
Integrative Themes
There are three integrative themes that guided the research reported in this dissertation
which merit discussion that center around how to model risk, resilience, and their neural

116
correlates. A fourth integrative theme that guided this dissertation is the importance of open
science to support the transparency and reproducibility of psychological research.
Dimensional Models of Adversity and Resilience. All three data chapters in this
dissertation provide evidence and support for breaking adversity down into core, underlying
dimensions that have at least partially distinct effects on brain and behavioral development
(McLaughlin et al., in press, 2014). Findings from studies 1 and 2 isolate white matter and
functional neural correlates of violence exposure. In contrast, although social deprivation
moderated the association between violence exposure and the brain in study 1, it did not seem to
be related to the neural indices we examined in distinct ways. Additionally, study 3 provided
initial support for extending dimensional models to include protective processes that may have
both global and more specific buffering effects. In each of these three studies, modeling risk and
resilience within a dimensional framework yielded specific results which help to identify
mechanisms explaining how risk factors influence developmental outcomes with the goal of
ultimately improving both theory and evidence-based interventions (Hyde, 2015; McLaughlin et
al., in press).
Importance of Neural Connectivity. A central tenet of this dissertation was modeling the
brain using methods that index connectivity because the brain is a complex system of interacting
regions (Pessoa, 2018; Rubinov & Sporns, 2010). The use of connectivity or network models,
such as those in studies 1 and 2, help to provide a more comprehensive picture of how adversity
gets under the skin which may not be picked up when examining individual ROIs, including how
the brain may compensate or adapt to environmental adversity (Blair & Raver, 2012; Varnum &
Kitayama, 2017). Additionally, this dissertation took a multimodal neuroimaging approach to
modeling neural connectivity by measuring both white matter and resting-state functional

117
connectivity; two methods which provide complementary but distinct insights into the brain
(Honey et al., 2007; Rubinov & Sporns, 2010). White matter connectivity (study 1) is posited to
index longer-term exposures since axonal myelination is a process that occurs gradually across
development (de Prado Bert et al., 2018; Mackey et al., 2012). In contrast, resting-state
functional connectivity (study 2), may be more sensitive to short-term, concurrent exposures in
addition to picking up on patterns of experience-dependent plasticity that reflect a history of co-
activation (Gabard-Durnam et al., 2016; Guerra-Carrillo et al., 2014). Of note, research has not
systemically tested if there are differential links between the timing of environmental exposures
and diffusion and resting-state functional MRI. However, this is an interesting avenue for future
longitudinal neuroimaging research. The understanding of associations between dimensional
exposure to adversity and the structure and function of neural circuits gained from this research
will hopefully help build and improve existing theoretical models and ultimately help create
neuroscience-informed policies and interventions (Farah, 2018).
Heterogeneous Individual Response to the Environment. Results from this
dissertation, as well as the discussion of the first two integrative themes, provide evidence
suggesting that individuals are unique and their interaction with the environment results in
nuanced and probabilistic associations between adversity, the brain, and behavior (Cicchetti &
Blender, 2004; Hyde et al., 2020; Wiggins & Monk, 2013). In study 2, we see increased
heterogeneity of functional connectivity in teens with more childhood exposure to violence. This
may be because individuals do not respond to environmental stressors in uniform ways, likely
because people do not compensate for stress in uniform ways (Marder & Goaillard, 2006). This
concept is thoroughly discussed in theoretical models of developmental psychopathology which
emphasize that risk and protective factors operate within complex, multi-level systems

118
(Bronfenbrenner & Morris, 2007; Cicchetti & Toth, 2009; Hyde, 2015; Sameroff, 2010). There
are multiple, interacting, mechanistic pathways that connect environmental adversity with
individual brain and behavioral outcomes (Hankin, 2012; Hyde et al., 2020). This is most clearly
evident in studies of resilience where individuals with similar risk factors end up with different
outcomes (multifinality - Cicchetti & Rogosch, 1996). In these studies, such as study 1 and study
3, we see conditional and indirect effects which are more likely than large main effects to explain
how exposure to adversity gets under the skin and affects the individual (Hyde, 2015). Consistent
with that idea is that the extant literature has not identified strong, main effects of environmental
adversity in either brain or behavioral outcomes, but rather effects that are much more
heterogeneous and variable (Hughes et al., 2017; McLaughlin et al., 2019). Dimensional models
of adversity and resilience attempt to account for the heterogeneity of the environment and
models of neural connectivity work to better characterize the heterogeneous, dynamic system
that is the brain. However, a final, and critically important, set of factors that contribute to these
nuanced associations is the systematic differences in unmeasured influences resulting from
systems of oppression that marginalized communities experience (Chetty et al., 2020; Lipina &
Evers, 2017; Rivas‐Drake et al., 2014).
The presence of nuanced and probabilistic associations between adversity, the brain, and
behavior highlights the need to incorporate statistical methods that are capable of picking up the
dynamic interactions between context, biology, and behavior within an individual (Beltz et al.,
2016; Howard & Hoffman, 2018; Molenaar, 2004). Moving forward, research in this domain
must balance the parsimony provided by variable-centered models with the specificity provided
by person-centered and person-specific approaches to build theoretical models that are
representative of the individual but have the potential to be generalized. Methods that bridge

119
nomothetic and idiographic inferences, such as GIMME (used in study 2), can help identify
associations that are more generalizable (e.g., to the full sample or to subgroups) in addition to
those that are largely unique to the individual (Beltz & Gates, 2017; Gates et al., 2014; Gates &
Molenaar, 2012). Person-centered analysis approaches, such as latent profile analysis and data-
driven cluster analysis, can also help identify subgroups within a sample and give insight into
how associations differ within and between groups (Howard & Hoffman, 2018). It is likely a
combination of variable-centered, person-centered, and person-specific analyses is necessary to
develop and test models that explain how environmental adversity and individual neural and
behavioral outcomes are associated across development.
Importance of Open Science. One last integrative theme that has guided the work
reported in this dissertation has been the importance of open science in psychological research.
Studies 1 and 2 in this dissertation has preregistered aims, hypotheses, variables, and analytic
plans (Study 1: https://osf.io/spguw; Study 2: https://osf.io/mrwhn). While the final analyses did
end up being slightly different from the preregistered plan, especially for Study 1, preregistering
these studies helped to increase transparency about what was specifically hypothesized and what
was exploratory (Nosek et al., 2018; Simmons et al., in press). Preregistration is not always the
best fit for some research questions or methods. For example, it is difficult, though admittedly
not impossible, to preregister all of the iterative potential pathways in structural equation models
that may arise depending on how models fit the data (e.g., study 3). However, in those and all
cases, open science practices can and still should be incorporated which promote transparent,
reproducible research practices. For example, the code for the statistical analyses done for all
three studies reported in this dissertation are publicly available (https://github.com/lgoetschius)
as are the neuroimaging analysis pipelines used to process the white matter

120
(https://github.com/lgoetschius/ProbabilisticTractography_On_Flux) and resting-state functional
(Beltz et al., 2019) connectivity data. Future work should incorporate open-science practices
through publicly available code as well as pre-registration or registered reports where
appropriate.
Future Directions & Conclusions
The research in this dissertation presents evidence for how two dimensions of childhood
adversity, violence exposure and social deprivation, predict differences in adolescent neural
structure and function, as well as how protective factors, such as school connectedness, buffers
against these dimensions. However, it also points to a few avenues of future research that have
not already been discussed. One necessary direction for future research is to strengthen the
measurement of dimensions of adversity. Similar to dimensional models of psychopathology
(Caron & Rutter, 1991; Hyde, 2015), dimensional models of adversity are only as strong as the
measures used to operationalize and quantify them (McLaughlin et al., in press). Currently, much
of the research using dimensional models of adversity, this dissertation included, have used
measures of environmental adversity that are not designed to isolate specific dimensions, but
rather are pieced together from separate measures in existing datasets that measure specific
exposures (e.g., child abuse, child neglect, community violence, etc.) (McLaughlin et al., in
press). Future work should utilize principles from psychometric theory to build questionnaires
that are designed to measure dimensions of adversity and should also work to include more
objective measures in addition to data from multiple sources within and outside of the families
we are working with (e.g., social workers, teachers). A second, related direction for future
research is the consideration of additional dimensions. Results from study 3 and a discussion of
how they fit into the larger literature suggest that social and cognitive deprivation may be two

121
separate dimensions. Future work should directly test this hypothesis using both behavioral and
neuroimaging data to determine if they have distinct effects. Additionally, recent theoretical work
has posited that unpredictability or instability of the environment may be another dimension of
adversity (Ellis et al., 2009; McLaughlin et al., in press). Future work should directly test this as
well and determine its unique effect in models that contain the other dimensions.
A third important direction for future research will be to account for the influence of
genetic and epigenetic factors. Previous work suggests that genetic and epigenetic factors
contribute to the nuanced and probabilistic associations between adversity, the brain, and
behavior through conditional and indirect effects (Dunn et al., 2019; Gard et al., 2017; Holz et
al., 2016; Hyde, 2015). Additionally, a recent meta-analysis robustly linked the dimension of
threat, but not deprivation, to accelerated cellular aging using data about telomere length and
epigenetic clocks designed to quantify aging using markers of DNA methylation (Colich et al.,
2020). This meta-analysis had limitations, including that it used post-hoc estimates of threat and
deprivation for the included studies and that it collapsed across all indices of cellular aging rather
than examining distinct effects of adversity on epigenetic clock estimates and telomere length.
This second limitation is particularly problematic due to research that has found low correlations
between telomere length and metrics from different epigenetic clocks, suggesting that they may
work through distinct biological processes (Belsky et al., 2018). However, the results of this
meta-analysis, as well as other work linking genomics with environmental adversity and the
brain, provide strong evidence for the need to consider and account for links between
environmental adversity and measures of genomics within dimensional models of adversity.
Overall, the goal of this dissertation has been to help understand how early adversity may
shape neural and behavioral development and what may help buffer against it. Throughout this

122
work, my goal has been to keep the families who participated in the SAND and FFCWS studies
in mind, especially when framing research questions and interpreting results. It has been
important to always remember that I am analyzing data about exposure to adversity and stress
from real people and to be sensitive to that when working on this important topic. Further, I hope
I have communicated that, although we should do everything we can to prevent people from
living in high-risk environments and experiencing adversity, exposure to it does not lead to a
“broken brain” that condemns people to poor outcomes (Hyde et al., 2020; Varnum & Kitayama,
2017). Rather, I hope it brings attention to the societal inequalities that perpetuate the cycle of
poverty and keep families living in high-risk environments (Hyde et al., 2020; Lipina & Evers,
2017; Oliver et al., 2006; Roberts & Rizzo, 2020; Rothstein, 2017). Additionally, I hope that the
work on the promotive and protective effects of school connectedness underscores the
importance of providing schools with the resources and support necessary to create environments
where all students feel connected. It is my ultimate goal that the research reported in this
dissertation can eventually help the people from the statistics I reported at the very beginning of
this dissertation. The approximately 58% percent of adolescents who experience at least one
ACE, the 1 in 4 children who experience some form of child maltreatment, and the
approximately 40% are exposed to violence in the home or neighborhood (Finkelhor et al., 2015;
McLaughlin, Greif Green, et al., 2012; Sacks & Murphy, 2018). We still have a long way to go.

123
Table 5.1: Rates of teen and parental psychopathology in SAND
In this table, rates from the SAND teens and their mothers are reported alongside national rates.
Adolescent Psychopathology1
Diagnosis* SAND Rate (Count) National Rate2
ADHD 16% (39) 12.8%
Conduct Disorder 8% (19) 6.8%
Generalized Anxiety Disorder 3% (6) 2.3%
Major Depressive Disorder or Dysthymia 16% (39) 11.9%
Oppositional Defiant Disorder 8% (20) 12.6%
Post-Traumatic Stress Disorder 3% (7) 5.2%
Social Phobia 8% (18) 9.1%
Specific Phobia 5% (11) 19.5%
Substance Use Disorder 1% (3) 6.4%
Maternal3 Psychopathology4
Diagnosis* SAND Rate (Count) National Rate5
Generalized Anxiety Disorder 4% (9) 7.1%
Major Depressive Disorder 38% (91) 20.2%
Obsessive Compulsive Disorder 3% (7) 3.1%
Panic Disorder 8% (19) 6.2%
Persistent Depressive Disorder 13% (30) 3.1%
Post-Traumatic Stress Disorder 14% (33) 9.7%
Social Phobia 10% (23) 13.0%
Specific Phobia 15% (35) 15.8%
Substance Use Disorder <1% (2) 7.5%
Notes: 1 Diagnosed using K-SADS-PL (Kaufman et al., 1997) 2 National rates for teens come from the lifetime rates reported by 13-18-years-olds on the NCS-
A (Merikangas et al., 2010) 3 92% of parents or guardians at SAND visit were mothers, so we called this maternal
psychopathology for parsimony 4 Diagnosed using SCID for DSM5 (First, 2015) 5 National rates for moms come from estimates of lifetime prevalence in women reported in the
NCS-R (Kessler et al., 2005)
* Includes past and current diagnoses and “not otherwise specific” diagnoses

124
Appendices
Appendix 1: Chapter 2 Supplemental Methods
Violence Exposure and Social Deprivation Composites
Childhood Exposure to Violence. Included in this composite was the primary
caregiver’s report of child physical and emotional abuse based on items from the Parent-Child
Conflict Tactics Scale (Straus et al., 1998) that have been used in previous research (Font &
Berger, 2015; Hunt et al., 2017). Five items were used to assess physical abuse including, “hit
him/her on the bottom with a hard object” and “shook him/her” and five items were used to
assess emotional abuse including whether the parent/caregiver has “sworn or cursed at,” or
“called him/her dumb or lazy or some other name like that.” Each item was rated on a 7-point
Likert scale ranging from “never happened” to “more than 20 times.” The primary caregiver’s
report of the child’s exposure to or victimization of violence in the neighborhood (Zhang &
Anderson, 2010) was also included in the composite. This was measured using the primary
caregiver’s report of the child witnessing or being the victim of beating, attacks with a weapon,
shootings, and killings (witness only) on a 5-point Likert scale ranging from “never” to “more
than 10 times.” At age 9, the primary caregiver was not asked about whether the child had
witnessed killings or it they had been the victim of a shooting, so these items were only included
for ages 3 and 5 years. Lastly, the child’s mother reported on intimate partner violence (IPV)
(physical-2 items, emotional-3 items, or sexual-1 item) in the home at each wave (Hunt et al.,
2017). Each item was rated on a 3-point Likert scale ranging from “never” to “often.” Physical
IPV items included “he slapped or kicked you” and “he hit you with his fist or a dangerous
object.” Emotional IPV items included “he tried to isolate you from family and friends,” and “he

125
tried to prevent you from going to work and/or school.” The sexual IPV was “he tried to make
you have sex or do sexual things you didn’t want to do.” The child’s exposure to IPV against the
mother was coded as missing for a given wave if the child did not live with their mother at least
50% of the time.
Childhood Exposure to Social Deprivation. Included in this composite was the primary
caregiver’s report of child physical and emotional neglect based on items from the CTS-PC
(Straus et al., 1998) that have been used in previous research (Font & Berger, 2015; Hunt et al.,
2017). Four items from the CTS-PC were used to assed physical neglect including whether the
parent was ever “so drunk or high that you had a problem taking care of your child.” One item,
whether the parent was “ever so caught up in your own problems that you were not able to show
or tell your child that you loved him/her,” was used to assess emotional neglect. These items
from the CTS-PC were reported on the same 7-point Likert scale as the items in the violence
exposure composite. The primary caregiver’s report of social cohesion in the neighborhood was
also included in this composite (reverse coded such that higher scores corresponded to lower
cohesion) (Donnelly et al., 2016; Morenoff et al., 2001). This included 4 items, such as “this is a
close-knit neighborhood,” rated on a 5-point Likert scale ranging from “strongly agree” to
“strongly disagree.” Lastly, the child’s mother reported on the level of intimate partner support
for each wave using six items, such as “how frequently (the current romantic partner) expresses
love and affection (for the mother),” that were rated on a 3-point Likert scale ranging from
“never” to “often” (Manuel et al., 2012). This was also reverse coded such that higher scores
corresponded to less support. Child exposure to the mother’s intimate partner support was coded
as missing for a given wave if the child did not live with their mother at least 50% of the time.
Covariates

126
Adolescent/Current Internalizing Disorders. To ensure that any observed effects were
not driven by internalizing symptoms, a multi-method, multi-informant latent factor that indexed
internalizing symptoms was used a covariate. It was constructed from the following measures:
(1) K-SADS (Kaufman et al., 1997) clinician report of past and current symptoms of dysthymia,
social phobia, generalized anxiety disorder, major depression, and phobia and (2) parent and
child report on the Mood and Feelings Questionnaire (Angold et al., 1987), Child Depression
Inventory (Helsel & Matson, 1984), and the Screen for Child Anxiety Related Disorders
(Birmaher et al., 1997). A CFA of this model in the data had acceptable fit (Hein, 2019), with a 𝜒
2 of 38.558 (p = 0.011), a CFI of 0.936, a TLI of 0.862, and a RMSEA of 0.059 (Hu & Bentler,
1999).
To determine if amygdala–PFC white matter connectivity was a mediator between
dimensions of childhood adversity and internalizing psychopathology, we calculated the
correlations between white matter connectivity and internalizing psychopathology for each
amygdala-PFC target pair. There were no significant associations (Supplemental Table 2.1);
therefore, we determined that an analysis of indirect effects would not be appropriate – it was
then that internalizing psychopathology was added as a covariate in all analyses.
Supplemental Table 2.5.1: Internalizing psychopathology & white matter correlation
Supplemental Table 2.1
Correlation between internalizing psychopathology and the probability of amygdala
white matter connectivity with four Brodmann’s Areas (BAs)(bilaterally) in the PFC.
Region r t p
Left BA10 0.117 1.584 0.115
Left BA11 0.022 0.298 0.766
Left BA25 0.070 0.937 0.350
Left BA47 0.044 0.589 0.557
Right BA10 0.022 0.299 0.765
Right BA11 0.000 0.005 0.996
Right BA25 0.083 1.115 0.267
Right BA47 0.050 0.670 0.504

127
Adolescent/Current Life Stress. Current life stress was used as a covariate in the
present analyses and was measured using the Adolescent Life Events Scale (adapted for Shaw et
al., 2003 from Farrell et al., 1998 and Masten et al., 1994). This scale assesses the experience of
common adolescent stressful life events in the past year.
Race. Race was used a covariate in all analyses and was a set of two dummy-coded
variables based on three race categories reported by the teen on the Multigroup Ethnic Identity
Measure (MEIM - (Roberts et al., 1999)): African American (Hispanic and Non-Hispanic),
White/Caucasian, and Other. Other included Hispanic, Asian, multi-racial participants, Native
American, and Unknown/Not Reported (see Table 2.1). If teen report was not available (n = 12),
then parent report was used.
Pubertal Development. Self-report of pubertal status was used as a covariate in the
present analyses and was collected using the child report of the pubertal development scale
(Petersen et al., 1988) which asks both boys and girls about growth spurt in height, pubic hair,
and skin change; facial hair growth and voice change in boys only; and breast development and
menarche in girls only (see Table 2.1). When adolescent report pubertal data was not available
(N=6), parent report was used. Pubertal development scores reported by parents were not
significantly different from those reported by the adolescent (t (5.76) =-0.93, p=0.39).
Maternal Covariates at Birth. We used two maternal covariates at birth– self-report of
maternal marital status at birth (yes/no) and of maternal education at birth (1 - less than high
school, 2 - high school or equivalent, 3 - some college/technical school, 4 - college or graduate
school).
Functional MRI Task – Gender Identification (Faces Task)

128
During fMRI data collection, participants completed an implicit emotion task in which
they were instructed to attend to the gender of emotional faces from the NimStim set (Tottenham
et al., 2009) and respond to the gender of the face (Swartz et al., 2014). A trial consisted of a
500 ms fixation cross followed by a face presented for 250 ms. A black screen then appeared for
1500 ms, during which participants indicated the gender of the face by pressing a button (thumb
for male, index finger for female). Total trial duration was 2250 ms with an inter-trial interval
that was jittered and ranged from 2000 to 6000 ms at intervals of 2000 ms. There were 100 total
trials with 20 trials of each of the following emotions: happy, sad, angry, fearful, neutral. There
were equal numbers of males and female faces and an equal number of faces from individuals
identified as White/Caucasian-American and Black/African American.
Diffusion MRI Processing
Raw diffusion MRI data were denoised using MRtrix. Denoised data were then corrected
for motion, eddy-current, and signal dropout using dwipreproc in MRtrix, which utilizes eddy
from FSL (v.5.0.11)(Andersson & Sotiropoulos, 2016). Intra-volume motion was corrected using
slice-to-volume correction. Mean and standard deviation of the movement parameters as well as
their correlations with violence exposure and social deprivation can be found in Supplemental
Table 2.2. All correlations between environmental variables and movement parameters were not
statistically significant. Slices with an average intensity four or more standard deviations lower
than predicted by eddy's Gaussian process model were marked as outlier slices and replaced with
model predictions (Andersson et al., 2016). Participants with more than 5% of slices replaced
were excluded (N=1). Across included participants, 0.00% to 4.35% of slices were replaced
(median 0.43%). Mean and standard deviation of the percentage of outlier slices as well as the
correlation between percentage of outlier slices and our environmental variables can be found in

129
Supplemental Table 2.2. The ten images with the most slices replaced were visually inspected to
ensure that no abnormal artifacts were introduced during preprocessing. As an additional quality
check, we calculated the percentage of non-zero voxels for each seed and target mask (using
fslstats) and excluded participants (N=1) who did not have data for at least 70% of the voxels.
Supplemental Table 2.5.2: Correlation of environmental measures with movement
Supplemental Table 2.2
Means, standard deviations, and correlations with confidence intervals between the environmental
measures (Violence Exposure and Social Deprivation) and the movement metrics from the diffusion
MRI data.
Variable M SD Violence Exposure Social Deprivation
Violence Exposure 0.04 0.53
Social Deprivation 0.03 0.50 .50**
[.38, .60]
Outliers Percentage 0.61% 0.65% .13 .07
[-.02, .27] [-.07, .22]
X Rotation (degrees) 0.00 0.37 -.02 -.05
[-.16, .13] [-.20, .09]
Y Rotation (degrees) 0.00 0.14 .05 -.01
[-.10, .19] [-.16, .13]
Z Rotation (degrees) -0.11 0.17 -.00 .10
[-.15, .14] [-.05, .24]
X Translation (mm) -0.02 0.16 -.06 .05
[-.20, .09] [-.10, .19]
Y Translation (mm) -0.01 0.13 -.02 -.04
[-.16, .13] [-.18, .11]
Z Translation (mm) -0.01 0.30 .02 .09
[-.12, .17] [-.06, .23]
Note. M and SD are used to represent mean and standard deviation, respectively. Values in square brackets
indicate the 95% confidence interval for each correlation. The confidence interval is a plausible range of

130
population correlations that could have caused the sample correlation (Cumming, 2014). * indicates p < .05.
** indicates p < .01.
Following preprocessing, bedpostx (bedpostx_gpu: (Hernández et al., 2013) was
performed using the standard settings (number of fibers modeled per voxel = 2, multiplicative
factor weight = 1, burn in = 1000) to build up a distribution of diffusion parameters using
Markov Chain Monte Carlo sampling at each voxel (Behrens et al., 2007). The diffusion data
were then registered using FLIRT (Jenkinson et al., 2002; Jenkinson & Smith, 2001) to allow for
the linear transformation between diffusion, standard, and structural space.
FSL's probtrackx2 (nsamples per voxel = 5000; nsteps per sample = 2000; step length =
0.5mm; curvature threshold = 0.2; fibthresh = 0.01; distthresh = 0.1) (probtrackX2_gpu:
(Hernandez-Fernandez et al., 2016) was used to estimate the probability of white matter
connectivity between the prefrontal cortex and the amygdala (Behrens et al., 2007; Behrens,
Johansen-Berg, et al., 2003; Behrens, Woolrich, et al., 2003; Eickhoff et al., 2010; Johansen-Berg
et al., 2004). In this analysis, the amygdala, defined using masks created using WFU Pick Atlas
(v 3.0.5b) (Maldjian et al., 2003), was the seed region and eight Brodmann's Areas (BA) were
specified as the target regions. Those ROIs were BA10, BA11, BA25, and BA47 and they were
selected due to a previous stronger likelihood of amygdala white matter connectivity in our
previous work (Goetschius et al., 2019). Individual masks were made for the included regions for
each hemisphere using WFU Pick Atlas. Eight separate probabilistic tractography analyses were
run in each participant’s native diffusion space for the anatomical regions in each hemisphere.
Only ipsilateral connections between the amygdala and PFC regions were targeted in this
analysis because neural tracer studies in non-human primates suggest that first order amygdala
connections are primarily ipsilateral (Ghashghaei et al., 2007).

131
Following the individual probabilistic tractography analyses, the resulting amygdala
images representing the probability of white matter connectivity with the specified PFC targets
were transformed to MNI space for further analysis. Prior to the group-level analysis, each of the
individual amygdala images were divided by the total number of samples per voxel (5000) which
scaled the probability value at each voxel to a range between 0 and 1. Based on the group-level
analysis outlined in Greening and Mitchell (Greening & Mitchell, 2015), an average amygdala
image was created for each amygdala-PFC target pair using fslmaths (FMRIB, Oxford, UK) and
the peak voxel in that image was identified. This peak voxel represents the maximum probability
of white matter connectivity between the amygdala and the specified PFC region. This peak,
selected at the group level, was used for all participants. The MNI coordinates (x,y,z) for the
peak for each target are as follows: BA10 (left: -30, -4, -14; right: 32, -2, -12), BA11 (left: -30, -
4, -14; right: 32, -2, -14), BA25 (left: -16, 0, -14, right: 18, 0, -14), BA47: (left: -30, -4, -14;
right: 34, 0, -20). A 6mm sphere mask was then created centered around the peak voxel. Once
each of the amygdala-target peak voxel masks were created, the average probability of
connectivity for each mask was extracted at the individual participant level. This extracted value
represents the maximum likelihood estimate of probability for each of the 8 amygdala-target
pairs (Goetschius et al., 2019).
Identifying Statistical Outliers
Statistical outliers were excluded from multiple regression analyses based on the
standardized residuals with a cutoff based on Cook’s Distance. This was done separately for each
hemisphere in order to retain data from more participants (N=6 in the right hemisphere and N=6
in the left hemisphere) using diagnostic plots, including a Q-Q Norm plot, created using the stats
132
package (https://www.rdocumentation.org/packages/stats/versions/3.5.1) in R (v.3.5.1). Only one
of the six outliers was present in both hemispheres.
The final sample was slightly different in the right vs. left hemisphere. See Table 2.1 for a
comparison of sample demographics in the included versus full samples. The included sample
for both the left and right hemispheres did not differ statistically from the full sample on age
(Left Hemisphere: t(396.31) = 0.30, p=0.765; Right Hemisphere: t(398.04) = 0.32, p=0.750),
puberty (Left Hemisphere: t(392.68) = -0.33, p=0.739; Right Hemisphere: t(394.16) = -0.15,
p=0.882), gender (Left Hemisphere: : 2(1) = 0.020, p = 0.887; Right Hemisphere: 2(1) =
0.000, p = 0.987), race (Left Hemisphere: 2(2) = 0.044, p = 0.978; Right Hemisphere: 2(2) =
0.000, p = 0.999), or annual income (Left Hemisphere: 2(5) = 0.155, p = 0.999; Right
Hemisphere: 2(5) = 0.002, p = 0.999).
Checks for Statistical Assumptions
To confirm that our data conforms to the assumptions required for linear regression, we
performed multiple checks of the model residuals. Only the checks for the regression model
predicting right amygdala–BA47 white matter connectivity from violence exposure, social
deprivation, and violence exposure x social deprivation (including covariates) are reported here
since those were the main results from the present study; however, checks were done for all
regression models. First, we confirmed that the mean of the model residuals was approximately
equivalent to zero (Mresiduauls = 0.00000000000000005935, t(182) = 0.0000), p = 1). Next, we ran
a Durbin-Watson test to confirm that our residuals were not autocorrelated (DW = 1.917, p =
0.265). Then, we confirmed that our X variable of interest (violence exposure x social
deprivation) was not correlated with the model residuals, t(181) = 0.000, p =1. Additionally, we
tested for multicollinearity in our X variables by calculating the variance inflation factor (VIF).

133
The maximum VIF for all X variables (including covariates) was 2.03 (one of the two dummy-
coded variable for race/ethnicity) with the VIF for a majority of variables being below 2, a
relatively conservative cutoff (Sheather, 2009). Based on these checks, we concluded that our
data conformed to the assumptions of linear regression.

134
Supplemental Figure 5.1: Individual White Matter Streamlines
Supplemental Figure 2.1: Individual streamlines of participants with the highest and lowest composite scores. Images are taken from
the peak voxel per participant. Images thresholded at 1000 streamlines.
Lowest Violence Highest Violence

135
Appendix 2: Chapter 2 Supplemental Results
Supplemental Table 2.5.3: Regression results predicting right amygdala-BA10 white matter
Supplemental Table 2.3
Stepwise regression results showing that violence exposure, social deprivation, and their interaction do not predict right amygdala–
BA10 white matter connectivity when accounting for covariates.
Predictor b
b
95% CI
[LL, UL]
beta
beta
95% CI
[LL, UL]
Fit Difference
(Intercept) 0.06 [-0.00, 0.12]
Race_12 -0.00 [-0.03, 0.02] -0.04 [-0.25, 0.16]
Race_22 0.02* [0.00, 0.04] 0.21 [0.00, 0.41]
Gender 0.00 [-0.02, 0.02] 0.00 [-0.20, 0.20]
Internalizing
Psychopathology 0.00 [-0.01, 0.02] 0.05 [-0.11, 0.21]
Pubertal Status -0.00 [-0.01, 0.01] -0.00 [-0.19, 0.18]
Current Life Stress -0.00 [-0.00, 0.00] -0.06 [-0.21, 0.10]
Maternal Education -0.01 [-0.01, 0.00] -0.14 [-0.30, 0.03]
Maternal Marital Status -0.00 [-0.02, 0.01] -0.04 [-0.20, 0.12]
R2 = .073
95% CI[.00,.12]
(Intercept) 0.06 [-0.00, 0.12]
Violence Exposure -0.00 [-0.02, 0.01] -0.02 [-0.20, 0.16]
Social Deprivation -0.00 [-0.02, 0.01] -0.04 [-0.22, 0.14]
Race_12 -0.00 [-0.03, 0.02] -0.03 [-0.24, 0.17]
Race_22 0.02* [0.00, 0.04] 0.22 [0.01, 0.43]

136
Gender -0.00 [-0.02, 0.02] -0.00 [-0.20, 0.19]
Internalizing
Psychopathology 0.01 [-0.01, 0.02] 0.05 [-0.11, 0.22]
Pubertal Status -0.00 [-0.01, 0.01] -0.01 [-0.20, 0.18]
Current Life Stress -0.00 [-0.00, 0.00] -0.06 [-0.22, 0.10]
Maternal Education -0.01 [-0.01, 0.00] -0.15 [-0.31, 0.02]
Maternal Marital Status -0.00 [-0.02, 0.01] -0.04 [-0.20, 0.13]
R2 = .076 ΔR2 = .002
95% CI[.00,.11] 95% CI[-.01, .02]
(Intercept) 0.06 [0.00, 0.12]
Violence Exposure 0.00 [-0.01, 0.02] 0.02 [-0.16, 0.21]
Social Deprivation 0.00 [-0.01, 0.02] 0.02 [-0.17, 0.20]
Interaction1 -0.01 [-0.03, 0.00] -0.15 [-0.33, 0.02]
Race_12 -0.00 [-0.03, 0.02] -0.00 [-0.21, 0.21]
Race_22 0.02* [0.00, 0.04] 0.21 [0.00, 0.42]
Gender -0.00 [-0.02, 0.02] -0.00 [-0.20, 0.19]
Internalizing
Psychopathology 0.01 [-0.01, 0.02] 0.05 [-0.11, 0.22]
Pubertal Status -0.00 [-0.01, 0.01] -0.02 [-0.21, 0.17]
Current Life Stress -0.00 [-0.00, 0.00] -0.06 [-0.22, 0.10]
Maternal Education -0.01 [-0.01, 0.00] -0.14 [-0.30, 0.03]
Maternal Marital Status -0.00 [-0.02, 0.01] -0.04 [-0.21, 0.12]
R2 = .092 ΔR2 = .016
95% CI[.00,.12] 95% CI[-.02, .05]
Note. A significant b-weight indicates the beta-weight and semi-partial correlation are also significant. b represents unstandardized regression
weights. beta indicates the standardized regression weights. LL and UL indicate the lower and upper limits of a confidence interval, respectively.
* indicates p < .05. ** indicates p < .01. 1Interaction between Violence Exposure/Victimization and Social Deprivation 2Dummy coded variables represented 3 category race variable (African American, Caucasian, Other)

137
Supplemental Table 2.5.4: Regression results predicting left amygdala-BA10 white matter
Supplemental Table 2.4
Stepwise regression results showing that violence exposure, social deprivation, and their interaction do not predict left amygdala—
BA10 white matter connectivity.
Predictor b
b
95% CI
[LL, UL]
beta
beta
95% CI
[LL, UL]
Fit Difference
(Intercept) 0.01** [0.01, 0.01]
Violence Exposure -0.00 [-0.01, 0.00] -0.02 [-0.20, 0.15]
Social Deprivation -0.00 [-0.01, 0.01] -0.01 [-0.18, 0.16]
R2 = .001
95% CI[.00,.01]
(Intercept) 0.01** [0.01, 0.01]
Violence Exposure 0.00 [-0.01, 0.01] 0.00 [-0.17, 0.18]
Social Deprivation 0.00 [-0.00, 0.01] 0.03 [-0.15, 0.21]
Interaction1 -0.00 [-0.01, 0.00] -0.12 [-0.29, 0.05]
R2 = .012 ΔR2 = .011
95% CI[.00,.05] 95% CI[-.02, .04]
Note. A significant b-weight indicates the beta-weight and semi-partial correlation are also significant. b represents unstandardized
regression weights. beta indicates the standardized regression weights. LL and UL indicate the lower and upper limits of a confidence
interval, respectively.
* indicates p < .05. ** indicates p < .01. 1Interaction between Violence Exposure/Victimization and Social Deprivation

138
Supplemental Table 2.5.5: Regression results predicting left amygdala-BA11 white matter
Supplemental Table 2.5
Stepwise regression results showing that violence exposure, social deprivation, and their interaction do not predict left amygdala—
BA11 white matter connectivity.
Predictor b
b
95% CI
[LL, UL]
beta
beta
95% CI
[LL, UL]
Fit Difference
(Intercept) 0.02** [0.02, 0.02]
Violence Exposure -0.00 [-0.01, 0.01] -0.06 [-0.23, 0.11]
Social Deprivation -0.00 [-0.01, 0.01] -0.00 [-0.17, 0.17]
R2 = .004
95% CI[.00,.03]
(Intercept) 0.02** [0.02, 0.02]
Violence Exposure -0.00 [-0.01, 0.01] -0.04 [-0.22, 0.14]
Social Deprivation 0.00 [-0.01, 0.01] 0.03 [-0.15, 0.21]
Interaction1 -0.01 [-0.01, 0.00] -0.09 [-0.26, 0.08]
R2 = .010 ΔR2 = .006
95% CI[.00,.04] 95% CI[-.02, .03]
Note. A significant b-weight indicates the beta-weight and semi-partial correlation are also significant. b represents unstandardized
regression weights. beta indicates the standardized regression weights. LL and UL indicate the lower and upper limits of a confidence
interval, respectively.
* indicates p < .05. ** indicates p < .01. 1Interaction between Violence Exposure/Victimization and Social Deprivation

139
Supplemental Table 2.5.6: Regression results predicting left amygdala-BA25 white matter
Supplemental Table 2.6
Stepwise regression results showing that violence exposure, social deprivation, and their interaction do not predict left amygdala—
BA25 white matter connectivity.
Predictor b
b
95% CI
[LL, UL]
beta
beta
95% CI
[LL, UL]
Fit Difference
(Intercept) 0.08** [0.08, 0.09]
Violence Exposure 0.00 [-0.02, 0.02] 0.01 [-0.16, 0.19]
Social Deprivation 0.00 [-0.02, 0.02] 0.00 [-0.17, 0.17]
R2 = .000
95% CI[.00,1.00]
(Intercept) 0.08** [0.08, 0.09]
Violence Exposure 0.00 [-0.02, 0.02] 0.02 [-0.16, 0.20]
Social Deprivation 0.00 [-0.02, 0.03] 0.01 [-0.18, 0.19]
Interaction1 -0.00 [-0.03, 0.02] -0.02 [-0.19, 0.15]
R2 = .001 ΔR2 = .000
95% CI[.00,1.00] 95% CI[-.01, .01]
Note. A significant b-weight indicates the beta-weight and semi-partial correlation are also significant. b represents unstandardized
regression weights. beta indicates the standardized regression weights. LL and UL indicate the lower and upper limits of a confidence
interval, respectively.
* indicates p < .05. ** indicates p < .01. 1Interaction between Violence Exposure/Victimization and Social Deprivation

140
Supplemental Table 2.5.7: Regression results predicting left amygdala-BA47 white matter
Supplemental Table 2.7
Stepwise regression results showing that violence exposure, social deprivation, and their interaction do not predict left amygdala—
BA47 white matter connectivity.
Predictor b
b
95% CI
[LL, UL]
beta
beta
95% CI
[LL, UL]
Fit Difference
(Intercept) 0.02** [0.02, 0.03]
Violence Exposure -0.00 [-0.01, 0.00] -0.09 [-0.26, 0.08]
Social Deprivation 0.00 [-0.00, 0.01] 0.09 [-0.09, 0.26]
R2 = .008
95% CI[.00,.04]
(Intercept) 0.02** [0.02, 0.03]
Violence Exposure -0.00 [-0.01, 0.00] -0.09 [-0.26, 0.09]
Social Deprivation 0.01 [-0.00, 0.01] 0.10 [-0.09, 0.28]
Interaction1 -0.00 [-0.01, 0.01] -0.03 [-0.19, 0.14]
R2 = .008 ΔR2 = .001
95% CI[.00,.04] 95% CI[-.01, .01]
Note. A significant b-weight indicates the beta-weight and semi-partial correlation are also significant. b represents unstandardized
regression weights. beta indicates the standardized regression weights. LL and UL indicate the lower and upper limits of a confidence
interval, respectively.
* indicates p < .05. ** indicates p < .01. 1Interaction between Violence Exposure/Victimization and Social Deprivation
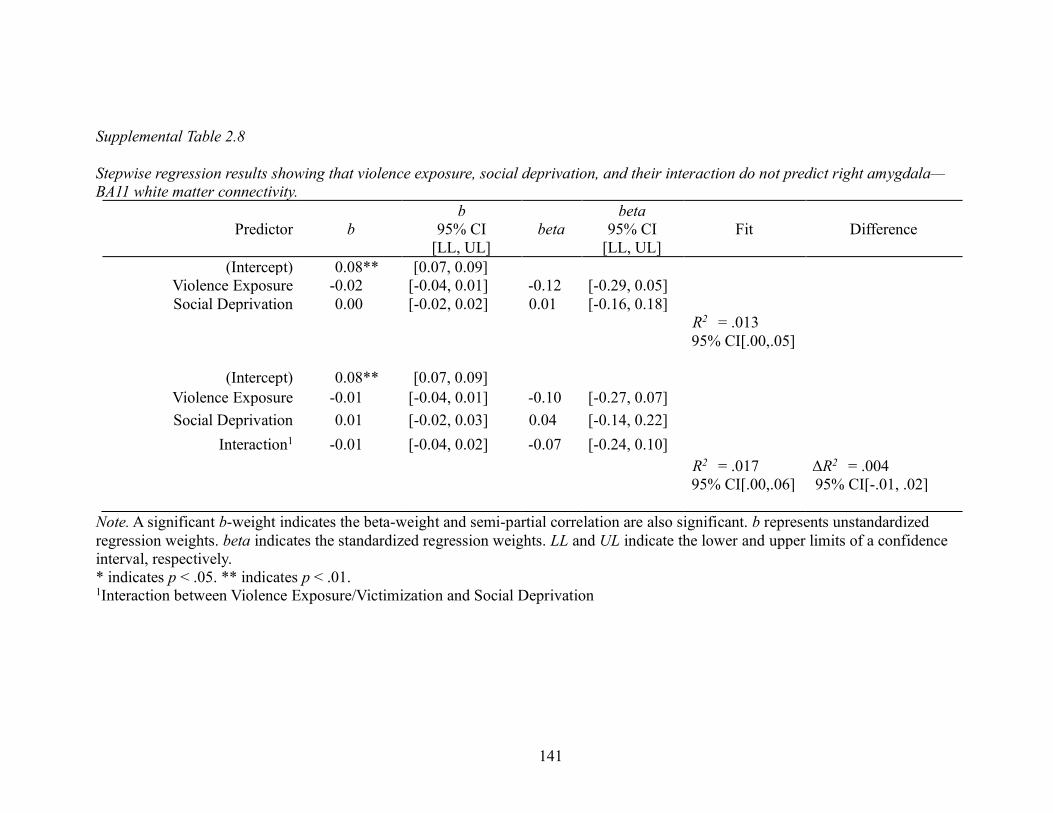
141
Supplemental Table 2.5.8: Regression results predicting right amygdala-BA11 white matter
Supplemental Table 2.8
Stepwise regression results showing that violence exposure, social deprivation, and their interaction do not predict right amygdala—
BA11 white matter connectivity.
Predictor b
b
95% CI
[LL, UL]
beta
beta
95% CI
[LL, UL]
Fit Difference
(Intercept) 0.08** [0.07, 0.09]
Violence Exposure -0.02 [-0.04, 0.01] -0.12 [-0.29, 0.05]
Social Deprivation 0.00 [-0.02, 0.02] 0.01 [-0.16, 0.18]
R2 = .013
95% CI[.00,.05]
(Intercept) 0.08** [0.07, 0.09]
Violence Exposure -0.01 [-0.04, 0.01] -0.10 [-0.27, 0.07]
Social Deprivation 0.01 [-0.02, 0.03] 0.04 [-0.14, 0.22]
Interaction1 -0.01 [-0.04, 0.02] -0.07 [-0.24, 0.10]
R2 = .017 ΔR2 = .004
95% CI[.00,.06] 95% CI[-.01, .02]
Note. A significant b-weight indicates the beta-weight and semi-partial correlation are also significant. b represents unstandardized
regression weights. beta indicates the standardized regression weights. LL and UL indicate the lower and upper limits of a confidence
interval, respectively.
* indicates p < .05. ** indicates p < .01. 1Interaction between Violence Exposure/Victimization and Social Deprivation

142
Supplemental Table 2.5.9: Regression results predicting right amygdala-BA25 white matter
Supplemental Table 2.9
Stepwise regression results showing that violence exposure, social deprivation, and their interaction do not predict right amygdala—
BA25 white matter connectivity.
Predictor b
b
95% CI
[LL, UL]
beta
beta
95% CI
[LL, UL]
Fit Difference
(Intercept) 0.09** [0.08, 0.10]
Violence Exposure -0.01 [-0.03, 0.01] -0.08 [-0.25, 0.09]
Social Deprivation -0.00 [-0.03, 0.02] -0.01 [-0.18, 0.16]
R2 = .007
95% CI[.00,.04]
(Intercept) 0.09** [0.07, 0.10]
Violence Exposure -0.01 [-0.04, 0.01] -0.09 [-0.26, 0.08]
Social Deprivation -0.00 [-0.03, 0.02] -0.03 [-0.21, 0.15]
Interaction1 0.01 [-0.02, 0.04] 0.04 [-0.13, 0.22]
R2 = .009 ΔR2 = .001
95% CI[.00,.04] 95% CI[-.01, .01]
Note. A significant b-weight indicates the beta-weight and semi-partial correlation are also significant. b represents unstandardized
regression weights. beta indicates the standardized regression weights. LL and UL indicate the lower and upper limits of a confidence
interval, respectively.
* indicates p < .05. ** indicates p < .01. 1Interaction between Violence Exposure/Victimization and Social Deprivation

143
Supplemental Table 2.5.10: Amygdala-PFC white matter & amygdala activation
Supplemental Table 2.10
Amygdala-prefrontal cortex white matter connectivity does NOT predict ipsilateral amygdala activation to threat faces
B SEB t p
Model: L. Amygdala Activation (Threat) ~ L. Amygdala-BA25 White Matter Connectivity
L. Amygdala – BA25 -0.210 0.750 -0.023 -0.280 0.780
F(1, 150) = 0.079 p = 0.780, R2 = 0.000
Model: L. Amygdala Activation (Threat) ~ L. Amygdala-BA47 White Matter Connectivity
L. Amygdala – BA47 -3.935 1.820 -0.174 -2.162 0.032
F(1, 150) = 4.674, p = 0.032, R2 = 0.030
Model: R. Amygdala Activation (Threat) ~ R. Amygdala-BA11 White Matter Connectivity
R. Amygdala – BA11 -1.027 0.765 -0.109 -1.342 0.182
F(1, 150) = 1.802, p = 0.182, R2 = 0.012
Model: R. Amygdala Activation (Threat) ~ R. Amygdala-BA25 White Matter Connectivity
R. Amygdala – BA25 -1.012 0.766 -0.107 -1.321 0.188
F(1, 150) = 1.746, p = 0.188, R2 = 0.012
Note: No models were significant at p<0.0063 (Bonferroni-corrected significance level for 8 tests)

144
Appendix 3: Chapter 3 Supplemental Methods
Supplemental Participant Information
Five hundred and six families from Detroit, Toledo, and Chicago area who had
participated in the FFCWS were contacted. Of the 506 FFCWS families contacted, 237 families
participated in SAND data collection, and 183 of those families had teens who were eligible and
completed the neuroimaging tasks. 54 teens either were not eligible (i.e., braces, etc.) to
complete the neuroimaging portion of the study (N=28) or did not complete the full protocol
(N=26).
Families that agreed to participate in SAND data collection did not differ from families
that refused or were unreachable on annual household income at the six waves of the FFCWS (ps
= .11 - .84). However, nonparticipation was associated with mother reports of community
violence exposure when adolescents were ages 3, 5, and 9 (χ2 = 6.72, df = 1, p < .05, V = .12).
Sixty-three percent of all mothers from families that participated in SAND endorsed at least one
form of community violence when adolescents were ages 3, 5, or 9 compared to 51.10% of
families that did not participate. Within the Detroit, Toledo, and Chicago subsamples, mothers’
self-report of race/ethnicity at the time of the child’s birth did not differ between mothers who
did and did not participate in SAND (ps = .13-.49). However, mothers’ self-report of
race/ethnicity at the time of the child’s birth differed between the SAND sample and the larger
FFCWS (χ2 = 86.32, df = 3, p < .01, V = .13). The majority of mothers who participated in
SAND data collection identified as Black/African American (75%), and also included mothers
identifying as White/Caucasian (16%), Hispanic (6%), and other (3%). In the FFCWS, 46% of

145
mothers identified as Black/African, 21% identified as White/Caucasian, 29% identified as
Hispanic, and 4% as other.
Of the 183 SAND teens with resting-state MRI data, three participants were excluded due
to artifacts in the functional or structural MRI data, four participants had excessive motion (as
defined by average relative framewise displacement greater than 0.5mm), and one person had
signal dropout in the areas of the brain included in the present analysis. The sample included for
the neuroimaging analyses did not differ from the full SAND sample (ps 0.670 - 0.997)
(Supplemental Table 3.1). This information has also been reported in other work from our group
(Hein, 2019; Peckins et al., 2019).
MRI Acquisition
Structural MRI Acquisition. T1-weighted gradient echo images were taken before the
functional scans using the same field of view (FOV) and slices as the functional scans (TR =
12ms, TE = 5ms, TI = 500ms, flip angle = 15°, FOV = 26cm; slice thickness = 1.4mm; 256 x
192 matrix; 110 slices, voxel size = 1mm x 1mm x 1mm). These methods are described in
previous research using this sample (Goetschius et al., 2019).
Resting State MRI Acquisition. Slices were prescribed parallel to the AC-PC line (same
locations as structural scans). Images were reconstructed into a 64x64 matrix (TR=2000 ms,
TE=30 ms, flip angle=90, FOV=22 cm, voxel size=3.44mm x 3.44mm x 3mm, bottom-up
interleaved). Slices were acquired contiguously, which optimized the effectiveness of the
movement post-processing algorithms. Images were reconstructed off-line using processing steps
to remove distortions caused by magnetic field inhomogeneity and other sources of misalignment
to the structural data, which yields excellent coverage of subcortical areas of interest. These

146
methods are identical to those described in previous task-based fMRI research using this sample
(Goetschius et al., 2019).
Imaging Data Analysis
MRI Preprocessing. Anatomical images were homogeneity-corrected using SPM2, then
skull-stripped (f=0.25) using the Brain Extraction Tool (BET) in FSL (version 5.0.7) (Jenkinson
et al., 2012; S. M. Smith, 2002). The functional imaging data then had the following
preprocessing steps applied: removal of large temporal spikes in k-space data (> 2 std dev), field
map correction and image reconstruction using custom code in MATLAB; noise from cardiac
and respiratory motion were removed using RETROICOR, and slice-timing correction using
SPM8 (Wellcome Department of Cognitive Neurology, London, UK;
http://www.fil.ion.ucl.ac.uk). Additionally, the first 10 volumes of functional data were removed
to ensure the stability of signal intensity. Lastly, the structural images were segmented into gray
matter, white matter, and CSF using FSL’s FAST(Y. Zhang et al., 2001).
Following these initial preprocessing steps, the resting state functional data underwent
further preprocessing using FEAT (FMRI Expert Analysis Tool) Version 6.00, part of FSL
(FMRIB's Software Library, www.fmrib.ox.ac.uk/fsl). Registration to high resolution structural
and/or standard space images was carried out using FLIRT(Jenkinson et al., 2002; Jenkinson &
Smith, 2001). The following pre-statistics processing was applied: motion correction using
MCFLIRT(Jenkinson et al., 2002); non-brain removal for the functional images using BET(S. M.
Smith, 2002); spatial smoothing using a Gaussian kernel of FWHM 6.0mm; grand-mean
intensity normalization of the entire 4D dataset by a single multiplicative factor. ICA-
AROMA(Pruim et al., 2015) was used to remove motion-related artifacts in the data. Nuisance

147
signal derived from the white matter and cerebrospinal fluid (CSF) were regressed out of the data
and then the data was high-pass filtered to remove signal below 0.01Hz.
Violence Exposure and Social Deprivation Composite Scores
The procedure creating these composite scores were first utilized in previous work from
our lab (Hein, 2019) and has been used previously in research on cortisol reactivity in this
sample(Peckins et al., 2019). Data for these composite scores come from primary caregiver
report on survey measures at 3, 5, 9 years.
Childhood Exposure to Violence. Included in this composite was the primary
caregiver’s report of child physical and emotional abuse based on items from the Parent-Child
Conflict Tactics Scale(Straus et al., 1998) that have been used in previous research (Font &
Berger, 2015; Hunt et al., 2017). Five items were used to assess physical abuse including, “hit
him/her on the bottom with a hard object” and “shook him/her” and five items were used to
assess emotional abuse including whether the parent/caregiver has “sworn or cursed at,” or
“called him/her dumb or lazy or some other name like that.” Each item was rated on a 7-point
Likert scale ranging from “never happened” to “more than 20 times.” The primary caregiver’s
report of the child’s exposure to or victimization of violence in the neighborhood(S. Zhang &
Anderson, 2010) was also included in the composite. This was measured using the primary
caregiver’s report of the child witnessing or being the victim of beating, attacks with a weapon,
shootings, and killings (witness only) on a 5-point Likert scale ranging from “never” to “more
than 10 times.” At age 9, the primary caregiver was not asked about whether the child had
witnessed killings or it they had been the victim of a shooting, so these items were only included
for ages 3 and 5 years. Lastly, the child’s mother reported on intimate partner violence (IPV)
(physical-2 items, emotional-3 items, or sexual-1 item) in the home at each wave (Hunt et al.,

148
2017). Each item was rated on a 3-point Likert scale ranging from “never” to “often.” Physical
IPV items included “he slapped or kicked you” and “he hit you with his fist or a dangerous
object.” Emotional IPV items included “he tried to isolate you from family and friends,” and “he
tried to prevent you from going to work and/or school.” The sexual IPV was “he tried to make
you have sex or do sexual things you didn’t want to do.” The child’s exposure to IPV against the
mother was coded as missing for a given wave if the child did not live with their mother at least
50% of the time. We considered violence exposure to exist on a continuum in which high scores
represent violence exposure and low scores represent safety.
Childhood Exposure to Social Deprivation. Included in this composite was the primary
caregiver’s report of child physical and emotional neglect based on items from the CTS-
PC(Straus et al., 1998) that have been used in previous research (Font & Berger, 2015; Hunt et
al., 2017). Four items from the CTS-PC were used to assed physical neglect including whether
the parent was ever “so drunk or high that you had a problem taking care of your child.” One
item, whether the parent was “ever so caught up in your own problems that you were not able to
show or tell your child that you loved him/her,” was used to assess emotional neglect. These
items from the CTS-PC were reported on the same 7-point Likert scale as the items in the
violence exposure composite. The primary caregiver’s report of social cohesion in the
neighborhood was also included in this composite (reverse coded such that higher scores
corresponded to lower cohesion). The items were selected based on previous research in the
FFCWS linking neighborhood cohesion and adolescent mental health (Donnelly et al., 2016) and
were adapted from previous neighborhood research (Morenoff et al., 2001). This included 4
items, such as “this is a close-knit neighborhood,” rated on a 5-point Likert scale ranging from
“strongly agree” to “strongly disagree.” Lastly, the child’s mother reported on the level of

149
intimate partner support for each wave using six items, such as “how frequently (the current
romantic partner) expresses love and affection (for the mother),” that were rated on a 3-point
Likert scale ranging from “never” to “often” (Manuel et al., 2012). This was also reverse coded
such that high scores represent low support. Child exposure to the mother’s intimate partner
support was coded as missing for a given wave if the child did not live with their mother at least
50% of the time. We considered social deprivation to exist on a continuum in which high scores
(e.g., the child experienced either high neglect or witnessed low social support for their mother
or low neighborhood social cohesion) represent deprivation and low scores (e.g., the child
experienced little neglect or witnessed high social support for their mother or high neighborhood
social cohesion) represent social support.
Composite Score Calculation. To calculate composite scores, the Z scores for each of
the childhood experiences (i.e., child abuse, exposure to intimate partner violence, community
violence, child neglect, lack of romantic partner support, lack of neighborhood social cohesion)
were summed for each of the childhood experiences within a dimension (i.e., violence exposure
and social deprivation) (Song et al., 2013) and then divided by the number of childhood
experiences within a dimension for each participant, thus maximizing the number of participants
and the diversity of the sample by minimizing drop out due to missing data at any given wave.
This procedure has been previously described (Hein, 2019).
In an exploratory attempt to characterize the sample, we examined the abuse and neglect
subscales of the Conflict Tactics Scale (CTS). We found that averaged across ages 3, 5, and 9
years, the focal children experienced greater than 3 of the 10 abuse categories (M=3.67,
SD=1.61, range: 0-10) and less than 1 of the 5 neglect categories (M=0.19, SD=0.37, range: 0-4)
in the CTS scale.

150
Covariates
With the exception of mean framewise displacement, all covariates have been previously
described (Goetschius et al., 2019; Hein, 2019; Peckins et al., 2019).
Current Life Stress. Current life stress was measured using the Adolescent Life Events
Scale (adapted(Shaw et al., 2003) from (Farrell et al., 1998; Masten et al., 1994)). This scale
assesses the experience of common adolescent stressful life events in the past year.
Race. Race was operationalized as a set of two dummy-coded variables based on three
race categories reported by the teen: African American (Hispanic and Non-Hispanic),
White/Caucasian, and Other. Other included Hispanic, Asian, multi-racial participants, Native
American, and Unknown/Not Reported (Supplemental Table 3.1). If teen report was not
available (N = 12), then parent report was used.
Pubertal Development. Self-report of pubertal status was assessed using child report of
the Pubertal Development Scale (Petersen et al., 1988) that measures growth spurt in height,
public hair, and skin change in boys and girls; facial hair growth and voice change in boys only;
and breast development and menarche in girls only (Supplemental Table 3.1). When adolescent
report was not available (N=8), parent report was used. Pubertal development scores reported by
parents were not significantly different from those reported by the adolescent (t(9.04)=-0.74,
p=0.48).
Maternal Covariates at Birth. Maternal self-report of marital status at birth (yes/no)
and education at birth (1 - less than high school, 2 - high school or equivalent, 3 - some
college/technical school, 4 - college or graduate school) was assessed.

151
Framewise Displacement. Framewise displacement (FD) is a metric that evaluates
motion in the scanner and is the average of rotation and translation parameter differences(Power
et al., 2012). FD was quantified using fsl_motion_outliers (FSL v.5.0.7).
Sensitivity Analyses
Extreme Outliers. Predictor variables (i.e., violence exposure and social deprivation)
were checked for extreme outliers, which were considered to be individuals with a value less
than Q1 - 2.2*Interquartile Range (IQR) or greater than Q3 + 2.2*IQR (Hoaglin & Iglewicz,
1987). Four individuals were considered to be extreme outliers. Analyses were run with and
without these participants, and inferences did not change. Thus, the participants were not
excluded in order to retain as much data as possible.
Protecting Against Model Overfitting. To protect against model overfitting, the psi
matrices for each individual were examined – these matrices summarize the variance that was
not explained for each network node for each participant. Participants were flagged (N=26 or
14.8%) if they had a psi value greater than 1. To ensure that these participants were not driving
effects, all analyses were run with and without participants with high psi values, and inferences
did not change. Thus, the participants were not excluded in order to retain as much data as
possible.

152
Supplemental Table 5.11: Participant demographics
Supplemental Table 3.1
Participant Demographics
Included vs. Full Sample Comparison
Included Sample (N=175) Full Sample (N=237)
Statistically
Different?
Age M = 15.88 yrs | SD = 0.53 M = 15.88 yrs | SD = 0.54 No. t(379.27) = 0.10,
p=0.918
Puberty M = 3.25 | SD = 0.58 M = 3.24 | SD = 0.59 No. t(377.67) = 0.30,
p=0.770
Gender F = 98 | M = 77 F = 125 | M = 112 No. 2(1) = 0.18,
p = 0.670
Race
African American: 127
Caucasian: 26
Other: 22
African American: 170
Caucasian: 34
Other: 33
No. 2(2) = 0.40,
p = 0.820
Annual
Income
$4,999 or less: 22
$5,000 to $19,999: 29
$20,000 to $39,999: 50
$40,000 to $69,999: 33
$70,000 or more: 28
Not Report/Missing: 13
$4,999 or less: 28
$5,000 to $19,999: 41
$20,000 to $39,999: 66
$40,000 to $69,999: 46
$70,000 or more: 35
Not Report/Missing: 21
No. 2(5) = 0.34,
p = 0.997

153
Supplemental Table 5.12: MNI Coordinates for ROIs
Supplemental Table 3.2
MNI coordinates for ROIs.
Region MNI Coordinates Network
Left Hemisphere
Insula -34 20 -4 Salience
Amygdala -24 -6 -16 Salience
Dorsal Anterior Cingulate Cortex 0 46 6 Salience
Dorsolateral Prefrontal Cortex -46 12 34 Salience
Inferior Parietal Lobule -42 -52 48 Default Mode
Posterior Cingulate Cortex -4 52 48 Default Mode
Medial Temporal Gyrus -62 -26 -18 Default Mode
Right Hemisphere
Insula 36 20 -4 Salience
Amygdala 24 -2 -16 Salience
Dorsal Anterior Cingulate Cortex 4 26 28 Salience
Dorsolateral Prefrontal Cortex 52 12 34 Salience
Inferior Parietal Lobule 46 -52 48 Default Mode
Posterior Cingulate Cortex 8 -52 28 Default Mode
Medial Temporal Gyrus 58 -16 20 Default Mode
Note: ROIs were selected based on their inclusion in either the Salience or Default Mode
networks according to the NeuroSynth database (search terms were “Salience Network” and
“Default Mode,” respectively). Additionally, the MNI coordinates for all ROIs were
preregistered with the Open Science Framework.

154
Supplemental Figure 5.2: S-GIMME analytical steps
Supplemental Figure 3.1: Flowchart of the S-GIMME analytical steps

155
Appendix 4: Chapter 3 Supplemental Results
Supplemental Table 5.13: Regression results for network density
Supplemental Table 3.3
Regression results for network density.
Predictor b
b
95% CI
[LL, UL]
beta
beta
95% CI
[LL, UL]
r Fit
Total Density
(Intercept) 47.20 [38.30, 56.11]
Violence Exposure* -2.81 [-5.01, -0.60] -0.23 [-0.41, -0.05] -.13
Social Deprivation 1.51 [-0.63, 3.65] 0.12 [-0.05, 0.30] .06
Motion 1* 13.24 [3.52, 22.96] 0.21 [0.06, 0.37] .17
Gender -2.22 [-4.65, 0.21] -0.18 [-0.37, 0.02] -.08
Race_12 0.90 [-2.17, 3.98] 0.06 [-0.15, 0.28] -.08
Race_22 3.16 [-0.61, 6.94] 0.18 [-0.03, 0.39] .16
Pubertal
Development -1.37 [-3.44, 0.69] -0.13 [-0.32, 0.06] -.03
Current Life Stress3 -0.08 [-0.24, 0.09] -0.07 [-0.22, 0.08] -.07
Maternal Education4 -0.08 [-1.10, 0.93] -0.01 [-0.18, 0.15] .03
Maternal Marital
Status4 -0.29 [-2.80, 2.23] -0.02 [-0.18, 0.15] -.08
R2 = .122
95% CI[.00,.17]
Salience Network Density
(Intercept) 17.37 [14.22, 20.52]
Violence Exposure* -1.01 [-1.79, -0.23] -0.24 [-0.42, -0.05] -.12
Social Deprivation 0.59 [-0.17, 1.34] 0.14 [-0.04, 0.32] .06
Motion 1* 4.97 [1.54, 8.41] 0.23 [0.07, 0.39] .20
Gender -0.33 [-1.19, 0.53] -0.07 [-0.27, 0.12] -.01
Race_12 0.24 [-0.85, 1.33] 0.05 [-0.17, 0.26] -.06
Race_22 0.78 [-0.56, 2.11] 0.12 [-0.09, 0.34] .12
Pubertal
Development -0.37 [-1.10, 0.36] -0.10 [-0.29, 0.09] -.07
Current Life Stress3 -0.00 [-0.06, 0.06] -0.01 [-0.16, 0.14] -.03
Maternal Education4 -0.05 [-0.40, 0.31] -0.02 [-0.18, 0.14] .02
Maternal Marital
Status4 -0.31 [-1.19, 0.58] -0.06 [-0.22, 0.11] -.09
R2 = .106

156
95% CI[.00,.15]
Density Between Salience & Default Mode Networks
(Intercept) 18.74 [13.95, 23.53]
Violence Exposure* -1.33 [-2.51, -0.14] -0.20 [-0.39, -0.02] -.09
Social Deprivation 0.65 [-0.50, 1.80] 0.10 [-0.08, 0.28] .06
Motion 1* 8.55 [3.33, 13.78] 0.26 [0.10, 0.41] .22
Gender -1.07 [-2.37, 0.24] -0.16 [-0.35, 0.04] -.04
Race_12 0.28 [-1.37, 1.94] 0.04 [-0.18, 0.25] -.07
Race_22 1.47 [-0.56, 3.51] 0.15 [-0.06, 0.37] .14
Pubertal
Development -0.79 [-1.90, 0.33] -0.13 [-0.32, 0.06] -.07
Current Life Stress3 -0.05 [-0.14, 0.04] -0.08 [-0.23, 0.07] -.09
Maternal Education4 -0.01 [-0.56, 0.54] -0.00 [-0.17, 0.16] .01
Maternal Marital
Status4 0.40 [-0.95, 1.75] 0.05 [-0.12, 0.21] -.01
R2 = .122
95% CI[.00,.17]
Default Mode Network Density
(Intercept) 11.09 [8.18, 14.01]
Violence Exposure -0.47 [-1.19, 0.25] -0.12 [-0.31, 0.06] -.12
Social Deprivation 0.27 [-0.43, 0.97] 0.07 [-0.11, 0.25] .01
Motion 1 -0.29 [-3.46, 2.89] -0.01 [-0.17, 0.15] -.06
Gender* -0.82 [-1.62, -0.03] -0.20 [-0.40, -0.01] -.19
Race_12 0.38 [-0.62, 1.39] 0.08 [-0.14, 0.30] -.07
Race_22 0.91 [-0.32, 2.15] 0.16 [-0.06, 0.38] .15
Pubertal
Development -0.22 [-0.89, 0.46] -0.06 [-0.26, 0.13] .09
Current Life Stress3 -0.02 [-0.08, 0.03] -0.06 [-0.22, 0.09] -.05
Maternal Education4 -0.03 [-0.36, 0.31] -0.01 [-0.18, 0.15] .05
Maternal Marital
Status4 -0.38 [-1.20, 0.44] -0.08 [-0.25, 0.09] -.13
R2 = .079
95% CI[.00,.11] Note. A significant b-weight indicates the beta-weight and semi-partial correlation are also significant.
b represents unstandardized regression weights. beta indicates the standardized regression weights. r
represents the zero-order correlation. LL and UL indicate the lower and upper limits of a confidence
interval, respectively.
* indicates significant predictor of network density
1Motion is measured using mean relative framewise displacement 2Dummy coded variables represented 3 category race variable (African American, Caucasian, Other) 3Current life stress is measured using the Adolescent Life Events Scale 4Maternal variable at the child’s birth

157
Supplemental Table 5.14: Non-significant node degree regression results
Supplemental Table 3.4
Node degree for ROIs that were not significantly associated with violence exposure or social
deprivation using the Bonferroni-corrected significance threshold.
Predictor b
b
95% CI
[LL, UL]
beta
beta
95% CI
[LL, UL]
r Fit
Left Amygdala Degree
(Intercept) 2.87 [2.55, 3.20]
Violence Exposure -0.60 [-1.13, -0.07] -0.19 [-0.36, -0.02] -.04
Social Deprivation 0.30 [-0.23, 0.82] 0.09 [-0.07, 0.26] .07
Motion 1 6.04 [3.69, 8.40] 0.37 [0.23, 0.52] .34
R2 = .143
95% CI[.05,.23]
Left Dorsal Anterior Cingulate Cortex Degree
(Intercept) 6.47 [6.15, 6.79]
Violence Exposure -0.35 [-0.87, 0.17] -0.12 [-0.30, 0.06] -.08
Social Deprivation 0.18 [-0.34, 0.69] 0.06 [-0.12, 0.24] .01
Motion 1 0.61 [-1.70, 2.92] 0.04 [-0.11, 0.20] .02
R2 = .011
95% CI[.00,.04]
Left Dorsolateral Prefrontal Cortex Degree
(Intercept) 6.96 [6.53, 7.40]
Violence Exposure -0.62 [-1.33, 0.08] -0.16 [-0.34, 0.02] -.12
Social Deprivation 0.34 [-0.36, 1.04] 0.09 [-0.09, 0.26] -.00
Motion 1 -0.57 [-3.71, 2.56] -0.03 [-0.18, 0.13] -.05
R2 = .020
95% CI[.00,.06]
Left Anterior Insula Degree
(Intercept) 6.02 [5.76, 6.28]
Violence Exposure -0.50 [-0.93, -0.08] -0.21 [-0.39, -0.03] -.12
Social Deprivation 0.26 [-0.17, 0.68] 0.11 [-0.07, 0.28] .02
Motion 1 1.38 [-0.52, 3.27] 0.11 [-0.04, 0.27] .08
R2 = .037
95% CI[.00,.09]
Left Medial Temporal Gyrus Degree
(Intercept) 6.03 [5.62, 6.45]
Violence Exposure -0.55 [-1.21, 0.12] -0.15 [-0.32, 0.03] -.06
Social Deprivation 0.65 [-0.01, 1.31] 0.17 [-0.00, 0.35] .09
Motion 1 -0.68 [-3.65, 2.29] -0.04 [-0.19, 0.12] -.04
R2 = .026
95% CI[.00,.07]
Left Posterior Cingulate Cortex Degree
(Intercept) 8.40 [8.03, 8.76]
Violence Exposure -0.61 [-1.21, -0.01] -0.18 [-0.36, -0.00] -.11
Social Deprivation 0.35 [-0.24, 0.94] 0.11 [-0.07, 0.28] .02
Motion 1 0.78 [-1.87, 3.44] 0.05 [-0.11, 0.20] .02
R2 = .024

158
95% CI[.00,.07]
Right Amygdala Degree
(Intercept) 4.05 [3.80, 4.29]
Violence Exposure 0.00 [-0.40, 0.40] 0.00 [-0.16, 0.16] .13
Social Deprivation 0.05 [-0.34, 0.45] 0.02 [-0.14, 0.18] .11
Motion 1 5.38 [3.60, 7.16] 0.43 [0.29, 0.57] .43
R2 = .188
95% CI[.08,.28]
Right Dorsal Anterior Cingulate Cortex Degree
(Intercept) 7.39 [7.13, 7.64]
Violence Exposure -0.40 [-0.81, 0.01] -0.17 [-0.35, 0.00] -.08
Social Deprivation 0.12 [-0.28, 0.53] 0.05 [-0.12, 0.23] .02
Motion 1 3.01 [1.19, 4.83] 0.25 [0.10, 0.40] .22
R2 = .069
95% CI[.00,.14]
Right Dorsolateral Prefrontal Cortex Degree
(Intercept) 6.38 [6.08, 6.68]
Violence Exposure -0.39 [-0.87, 0.09] -0.14 [-0.32, 0.03] -.03
Social Deprivation 0.40 [-0.08, 0.88] 0.15 [-0.03, 0.32] .10
Motion 1 1.71 [-0.45, 3.86] 0.12 [-0.03, 0.28] .12
R2 = .033
95% CI[.00,.09]
Right Inferior Parietal Lobule Degree
(Intercept) 5.45 [5.15, 5.75]
Violence Exposure -0.49 [-0.97, 0.00] -0.18 [-0.36, 0.00] -.16
Social Deprivation 0.06 [-0.42, 0.54] 0.02 [-0.15, 0.20] -.07
Motion 1 0.43 [-1.74, 2.59] 0.03 [-0.12, 0.19] -.01
R2 = .026
95% CI[.00,.08]
Right Medial Temporal Gyrus Degree
(Intercept) 4.69 [4.42, 4.96]
Violence Exposure 0.14 [-0.30, 0.57] 0.05 [-0.12, 0.22] .18
Social Deprivation 0.26 [-0.17, 0.69] 0.10 [-0.07, 0.27] .19
Motion 1 3.46 [1.53, 5.39] 0.27 [0.12, 0.41] .30
R2 = .11
95% CI[.03,.19]
Right Posterior Cingulate Cortex Degree
(Intercept) 3.99 [3.67, 4.30]
Violence Exposure -0.29 [-0.80, 0.22] -0.10 [-0.28, 0.08] -.12
Social Deprivation -0.25 [-0.76, 0.25] -0.09 [-0.26, 0.09] -.11
Motion 1 1.88 [-0.39, 4.15] 0.13 [-0.03, 0.28] .08
R2 = .032
95% CI[.00,.09]
Note. A significant b-weight indicates the beta-weight and semi-partial correlation are also significant. b
represents unstandardized regression weights. beta indicates the standardized regression weights. r
represents the zero-order correlation. LL and UL indicate the lower and upper limits of a confidence
interval, respectively.
*Significant at a Bonferroni-corrected threshold of p = 0.004 (p=0.05/14 tests) 1Motion is measured using mean relative framewise displacement

159
Supplemental Table 5.15: Node density adjusted for covariates
Supplemental Table 3.5
Node density adjusted for covariates Predictor b b
95% CI
[LL, UL]
beta beta
95% CI
[LL, UL]
r Fit
Left Inferior Parietal Lobule
(Intercept) 9.14 [6.79, 11.49]
Violence Exposure* -0.75 [-1.33, -0.17] -0.23 [-0.42, -0.05] -.17
Social Deprivation 0.36 [-0.20, 0.93] 0.11 [-0.06, 0.29] .03
Motion 1 1.27 [-1.29, 3.84] 0.08 [-0.08, 0.24] .03
Gender -0.04 [-0.09, 0.00] -0.15 [-0.30, 0.01] -.13
Race_12 -0.37 [-0.91, 0.18] -0.13 [-0.32, 0.06] -.09
Race_22 -0.71 [-1.36, -0.07] -0.21 [-0.41, -0.02] .17
Pubertal Development 0.30 [-0.51, 1.11] 0.08 [-0.14, 0.29] .03
Current Life Stress3 0.85 [-0.15, 1.84] 0.18 [-0.03, 0.39] -.14
Maternal Education4 -0.09 [-0.35, 0.18] -0.05 [-0.22, 0.11] .00
Maternal Marital Status4 -0.09 [-0.75, 0.57] -0.02 [-0.19, 0.14] -.07
R2 = .117
95% CI[.00,.16]
Right Insula
(Intercept) 8.44 [6.83, 10.06]
Violence Exposure* -0.64 [-1.04, -0.24] -0.28 [-0.46, -0.11] -.17
Social Deprivation 0.4 [0.06, 0.84] 0.20 [0.03, 0.37] .06
Motion 1 1.28 [-0.48, 3.04] 0.11 [-0.04, 0.27] .08
Gender -0.00 [-0.03, 0.03] -0.02 [-0.17, 0.13] -.05
Race_12 -0.36 [-0.73, 0.02] -0.18 [-0.36, 0.01] -.10
Race_22 -0.26 [-0.70, 0.19] -0.11 [-0.30, 0.08] -.01
Pubertal Development 0.01 [-0.54, 0.57] 0.01 [-0.21, 0.22] -.14
Current Life Stress3 0.58 [-0.11, 1.27] 0.18 [-0.03, 0.39] .21
Maternal Education4 0.17 [-0.01, 0.36] 0.15 [-0.01, 0.31] .17
Maternal Marital Status4 0.15 [-0.30, 0.61] 0.05 [-0.11, 0.22] -.07
R2 = .149
95% CI[.02,.20]
Note. A significant b-weight indicates the beta-weight and semi-partial correlation are also significant. b
represents unstandardized regression weights. beta indicates the standardized regression weights. r
represents the zero-order correlation. LL and UL indicate the lower and upper limits of a confidence
interval, respectively.
*Significant predictor of node degree adjusting for covariates. 1Motion is measured using mean relative framewise displacement 2Dummy coded variables represented 3 category race variable (African American, Caucasian, Other) 3Current life stress is measured using the Adolescent Life Events Scale 4Maternal variable at the child’s birth

160
Supplemental Table 5.16: Logistic regression results adjusted for covariates
Supplemental Table 3.6
Logistic regression results adjusted for covariates
Predictor b SE Odds Ratio
Odds Ratio
95% CI
[LL, UL]
(Intercept) -0.20 1.82 0.82 [0.02, 32.70]
Violence Exposure 0.93 0.54 2.54 [0.92, 7.87]
Social Deprivation -0.38 0.47 0.68 [0.27, 1.77]
Motion 1 7.32 3.54 1516.93 [3.58, 4284250.00]
Gender 0.57 0.50 1.77 [0.67, 4.77]
Race_12 -0.58 0.71 0.56 [0.11, 2.02]
Race_22 -1.13 0.80 0.32 [0.06, 1.46]
Pubertal Development 0.14 0.41 1.16 [0.50, 2.59]
Current Life Stress3 0.05 0.04 1.06 [0.98, 1.14]
Maternal Education4 0.07 0.20 1.07 [0.72, 1.61]
Maternal Marital Status4 0.05 0.49 1.05 [0.39, 2.72] 1Motion is measured using mean relative framewise displacement 2Dummy coded variables represented 3 category race variable (African American,
Caucasian, Other) 3Current life stress is measured using the Adolescent Life Events Scale 4Maternal variable at the child’s birth

161
Appendix 5: Chapter 3 Supplemental Data
Supplemental Table 5.17: Chapter 3 supplemental data
Table 3.7
Supplemental Data
Model fit for each individual participant. Connections were not added to individual models when 2 out of the 4 fit
indices met the following thresholds: RMSEA ≤0.05; SRMR ≤0.05; CFI ≥0.95; NNFI ≥0.95.
χ2 df npar RMSEA SRMR NNFI CFI
1 337.464 215 219 0.0493 0.0498 0.9468 0.9698
2 460.4917 232 202 0.0649 0.0434 0.919 0.9503
3 442.6814 227 207 0.0637 0.0493 0.9176 0.9505
4 369.3483 230 204 0.0509 0.0497 0.9395 0.9632
5 356.2464 224 210 0.0502 0.0499 0.9424 0.9658
6 422.89 230 204 0.0599 0.0472 0.9367 0.9615
7 400.1407 228 206 0.0568 0.0469 0.9183 0.9507
8 395.4893 229 205 0.0557 0.0493 0.9342 0.9602
9 472.9349 228 206 0.0678 0.0485 0.9261 0.9554
10 349.8288 222 212 0.0496 0.0511 0.9436 0.9668
11 446.6057 229 205 0.0637 0.0492 0.9183 0.9505
12 505.731 218 216 0.0751 0.0491 0.9157 0.9514
13 417.9443 221 213 0.0617 0.0485 0.9263 0.9569
14 451.117 227 207 0.065 0.049 0.9287 0.9572
15 405.1967 229 205 0.0573 0.0486 0.9292 0.9571
16 377.3698 228 206 0.0529 0.0486 0.952 0.971

162
17 375.7425 200 234 0.0613 0.0485 0.9211 0.9583
18 418.1664 219 215 0.0623 0.0482 0.9139 0.9501
19 362.0274 218 216 0.0531 0.0485 0.9154 0.9512
20 489.3867 233 201 0.0686 0.0484 0.9203 0.9509
21 355.5109 230 204 0.0483 0.0547 0.9471 0.9678
22 381.252 231 203 0.0527 0.0492 0.9311 0.9579
23 359.1018 209 225 0.0554 0.0499 0.9229 0.9574
24 366.8721 232 202 0.0498 0.0526 0.9266 0.9549
25 422.4284 226 208 0.0609 0.0466 0.9175 0.9507
26 482.5072 234 200 0.0674 0.0461 0.9201 0.9505
27 357.8082 220 214 0.0517 0.0498 0.935 0.9621
28 441.1115 227 207 0.0635 0.0455 0.9184 0.951
29 415.5675 213 221 0.0638 0.0496 0.9249 0.9577
30 435.3762 225 209 0.0632 0.0469 0.9164 0.9502
31 459.8657 216 218 0.0695 0.049 0.9279 0.9588
32 404.2475 215 219 0.0613 0.0476 0.9241 0.9569
33 363.5178 222 212 0.0522 0.0446 0.9168 0.9511
34 394.4465 217 217 0.0591 0.0498 0.9381 0.9645
35 512.738 221 213 0.0751 0.0461 0.9164 0.9511
36 419.0826 227 207 0.0601 0.0496 0.9189 0.9513
37 391.933 225 209 0.0563 0.0438 0.9204 0.9526
38 355.2865 226 208 0.0494 0.053 0.9259 0.9557
39 431.6301 221 213 0.0638 0.0487 0.9246 0.9559
40 363.5577 232 202 0.0492 0.0502 0.9342 0.9596
41 418.9789 216 218 0.0634 0.0494 0.9146 0.9512
42 370.4016 221 213 0.0537 0.0496 0.9307 0.9595
43 357.6225 219 215 0.052 0.0497 0.9424 0.9666
44 364.269 218 216 0.0535 0.05 0.9169 0.9521
45 404.6379 213 221 0.062 0.048 0.9374 0.9647
46 481.5645 215 219 0.0728 0.0443 0.9148 0.9515
47 360.3157 225 209 0.0507 0.0493 0.9179 0.9511
48 435.7415 217 217 0.0656 0.045 0.9164 0.952
49 387.1817 225 209 0.0555 0.0459 0.9177 0.951

163
50 428.6833 229 205 0.061 0.0489 0.9352 0.9608
51 414.8962 233 201 0.0578 0.0424 0.9191 0.9501
52 395.9013 212 222 0.0609 0.0447 0.9125 0.9509
53 532.6246 221 213 0.0776 0.047 0.9148 0.9502
54 416.5936 221 213 0.0615 0.0434 0.9152 0.9504
55 434.5957 208 226 0.0682 0.0497 0.9131 0.9522
56 418.6393 236 198 0.0575 0.0485 0.9256 0.9535
57 351.4741 222 212 0.0499 0.0499 0.9385 0.9639
58 398.2812 236 198 0.0542 0.0476 0.9511 0.9695
59 355.4745 228 206 0.0489 0.0483 0.922 0.953
60 471.3257 231 203 0.0667 0.0487 0.9262 0.9549
61 343.2778 206 228 0.0534 0.0495 0.9509 0.9732
62 431.6664 210 224 0.0672 0.0408 0.915 0.9528
63 432.934 225 209 0.0628 0.0465 0.9186 0.9516
64 341.8362 219 215 0.049 0.0512 0.9526 0.9726
65 395.5717 226 208 0.0566 0.0472 0.9167 0.9502
66 445.6803 225 209 0.0647 0.05 0.9164 0.9502
67 481.0292 219 215 0.0715 0.0441 0.9148 0.9506
68 388.5093 217 217 0.0581 0.0445 0.9165 0.9521
69 385.9336 210 224 0.0598 0.0411 0.9142 0.9524
70 422.1714 227 207 0.0606 0.0487 0.9353 0.9612
71 372.7023 236 198 0.0498 0.0488 0.9441 0.9651
72 435.3817 223 211 0.0638 0.0498 0.9187 0.952
73 368.3488 216 218 0.0549 0.0491 0.9404 0.9659
74 379.8688 207 227 0.0597 0.0478 0.9274 0.9602
75 460.2895 214 220 0.0701 0.0496 0.9288 0.9597
76 524.4858 217 217 0.0778 0.0436 0.9139 0.9506
77 356.5818 230 204 0.0485 0.057 0.9345 0.9602
78 428.9118 232 202 0.0602 0.0498 0.9278 0.9557
79 424.6102 226 208 0.0613 0.0497 0.9229 0.9539
80 404.0907 216 218 0.061 0.0439 0.9171 0.9526
81 408.21 214 220 0.0623 0.0496 0.9218 0.9557
82 337.0235 216 218 0.0489 0.052 0.9491 0.9709

164
83 416.4031 218 216 0.0624 0.0437 0.9179 0.9527
84 473.7268 228 206 0.0679 0.0442 0.919 0.9511
85 388.1109 233 201 0.0533 0.0494 0.9487 0.9684
86 378.0401 221 213 0.0551 0.0492 0.9245 0.9559
87 472.1856 218 216 0.0706 0.0499 0.9155 0.9512
88 417.637 233 201 0.0582 0.0498 0.9384 0.962
89 383.6733 230 204 0.0534 0.0481 0.9293 0.957
90 397.4964 222 212 0.0581 0.0476 0.9174 0.9515
91 358.8544 229 205 0.0492 0.0538 0.9407 0.9641
92 515.0297 237 197 0.0708 0.0479 0.9228 0.9516
93 339.9077 222 212 0.0476 0.0624 0.9418 0.9658
94 408.5504 209 225 0.0639 0.041 0.9114 0.951
95 549.3469 226 208 0.0782 0.0464 0.9165 0.9501
96 376.8911 225 209 0.0537 0.0492 0.9351 0.9614
97 440.472 221 213 0.0651 0.0471 0.9172 0.9516
98 347.1012 222 212 0.0491 0.0489 0.948 0.9695
99 381.2555 224 210 0.0548 0.048 0.9167 0.9506
100 441.3668 230 204 0.0627 0.0499 0.925 0.9543
101 407.0288 221 213 0.06 0.0495 0.9222 0.9545
102 376.2155 216 218 0.0563 0.0464 0.9131 0.9503
103 366.2102 223 211 0.0524 0.0497 0.9416 0.9656
104 381.601 233 201 0.0522 0.0478 0.9242 0.9533
105 457.7367 235 199 0.0636 0.048 0.9206 0.9506
106 423.4817 214 220 0.0647 0.0492 0.9321 0.9616
107 433.4452 227 207 0.0623 0.0468 0.92 0.952
108 449.1592 228 206 0.0644 0.0496 0.9176 0.9503
109 477.1445 227 207 0.0686 0.0496 0.9192 0.9515
110 412.928 223 211 0.0603 0.0486 0.9183 0.9518
111 395.8876 234 200 0.0544 0.0491 0.9222 0.9519
112 509.8378 202 232 0.0807 0.0494 0.9094 0.9516
113 379.6696 224 210 0.0545 0.0485 0.9436 0.9666
114 393.9832 229 205 0.0555 0.0488 0.9277 0.9562
115 420.1125 231 203 0.0591 0.0487 0.9283 0.9562

165
116 461.147 216 218 0.0696 0.0436 0.9167 0.9524
117 435.54 218 216 0.0653 0.047 0.9172 0.9522
118 400.423 221 213 0.0589 0.0478 0.9294 0.9587
119 405.4778 214 220 0.0618 0.0485 0.9135 0.951
120 435.3515 229 205 0.0621 0.0492 0.9258 0.9551
121 467.4572 219 215 0.0696 0.0495 0.9162 0.9515
122 451.823 226 208 0.0653 0.0457 0.9193 0.9517
123 444.5608 213 221 0.0682 0.0471 0.9164 0.9529
124 360.8171 216 218 0.0535 0.0495 0.9209 0.9548
125 428.2471 220 214 0.0636 0.044 0.9173 0.9519
126 371.5123 213 221 0.0564 0.0456 0.928 0.9594
127 374.1864 232 202 0.0512 0.0453 0.9215 0.9518
128 410.7942 212 222 0.0633 0.0487 0.9291 0.9602
129 480.7249 220 214 0.0712 0.048 0.9154 0.9507
130 408.7257 224 210 0.0594 0.0437 0.9166 0.9506
131 473.8235 209 225 0.0736 0.0416 0.9114 0.951
132 344.6724 219 215 0.0495 0.0532 0.9407 0.9656
133 430.6263 230 204 0.0611 0.0464 0.9211 0.952
134 432.7567 231 203 0.0611 0.0487 0.9241 0.9536
135 511.666 240 194 0.0696 0.0456 0.9231 0.9512
136 435.3927 222 212 0.0641 0.0482 0.9176 0.9516
137 360.0409 216 218 0.0534 0.0489 0.9322 0.9613
138 390.6012 230 204 0.0546 0.0444 0.9307 0.9578
139 411.2425 233 201 0.0572 0.0482 0.9352 0.9601
140 441.3396 221 213 0.0653 0.049 0.9171 0.9515
141 423.1329 221 213 0.0625 0.0455 0.9182 0.9522
142 484.8995 218 216 0.0723 0.0422 0.9205 0.9542
143 424.9599 220 214 0.0631 0.0485 0.9283 0.9583
144 437.5468 233 201 0.0613 0.0492 0.9285 0.9559
145 395.4005 228 206 0.056 0.0491 0.9282 0.9567
146 430.6302 229 205 0.0613 0.0475 0.9205 0.9518
147 505.7797 230 204 0.0716 0.0463 0.9206 0.9517
148 380.6049 215 219 0.0574 0.0444 0.9155 0.9519

166
149 481.3911 226 208 0.0695 0.0499 0.9295 0.9579
150 361.4001 220 214 0.0524 0.0465 0.9516 0.9718
151 356.5355 227 207 0.0494 0.0513 0.9247 0.9548
152 395.1945 227 207 0.0563 0.0483 0.9302 0.9581
153 420.3603 223 211 0.0615 0.0499 0.9183 0.9518
154 395.4 226 208 0.0566 0.0472 0.9178 0.9508
155 422.053 233 201 0.0589 0.05 0.9216 0.9517
156 361.1325 224 210 0.0511 0.0497 0.9329 0.9602
157 443.7209 233 201 0.0622 0.0493 0.9204 0.9509
158 419.7464 215 219 0.0638 0.0496 0.9331 0.962
159 422.6659 226 208 0.061 0.0489 0.917 0.9504
160 431.8286 228 206 0.0618 0.047 0.9181 0.9506
161 456.3976 235 199 0.0635 0.0475 0.921 0.9509
162 348.7459 222 212 0.0494 0.0498 0.9431 0.9666
163 384.086 226 208 0.0547 0.0487 0.9244 0.9548
164 450.2674 222 212 0.0663 0.0499 0.928 0.9577
165 333.3395 216 218 0.0482 0.0516 0.932 0.9612
166 418.5673 229 205 0.0595 0.0492 0.9204 0.9518
167 398.5382 218 216 0.0595 0.0486 0.9348 0.9624
168 353.7505 225 209 0.0495 0.0509 0.9235 0.9545
169 415.5257 230 204 0.0587 0.0484 0.9317 0.9584
170 402.5641 223 211 0.0587 0.0462 0.9209 0.9534
171 384.9787 229 205 0.054 0.0478 0.939 0.963
172 403.9139 215 219 0.0613 0.0494 0.9161 0.9523
173 374.1356 226 208 0.0529 0.0491 0.9294 0.9578
174 390.1415 216 218 0.0587 0.0488 0.935 0.9628
175 434.5492 215 219 0.0661 0.048 0.9153 0.9518

167
Appendix 6: Data Processing and Analysis Code
Study 1
Information about and the scripts for the processing of the diffusion MRI data for this
study are publicly available on GitHub
(https://github.com/lgoetschius/ProbabilisticTractography_On_Flux). The data cleaning and
statistical analysis code, including the graph visualizations, for this study are also publicly
available on GitHub (https://github.com/lgoetschius/VE_SD_AmygdalaProbtrack).
Visualizations of the white matter data were created using FSL (v.5.0.9), ITK-SNAP
(v.3.6.0), and ParaView (v.5.8.0) based on a tutorial in Madan (2015). Figure 2.2 was created by
overlaying 3D masks of the target regions (bilateral Brodmann’s Areas (BA) 10, 11, 25, 47) and
a binarized and thresholded (threshold=1000 streamlines) mask of the averaged FDT_path image
for all participants representing the probabilistic tractography streamlines for the left and right
amygdala seed regions. Visualizations of the individual white mater streamlines (Supplemental
Figure 2.1) was created using FSLeyes (0.31.2) (McCarthy, 2019) from the thresholded
(threshold = 1000 streamlines) fdt_paths image with the right amygdala as the seed region for the
individual participants with the highest and lowest violence exposure composite scores.
Study 2
Information about and the scripts for the processing of the resting state fMRI data for this
study are publicly available on GitHub (https://github.com/lgoetschius/GIMME_Preprocessing)
(Beltz et al., 2019). The data cleaning and statistical analysis code, including the graph

168
visualizations, for this study are also publicly available on GitHub
(https://github.com/lgoetschius/VE_SD_GIMME_Analysis).
Visualizations of the group, subgroup, and example individual connectivity maps (Figure
3.1) were created using FSL (v.6.0.3), ITK-SNAP (v.3.6.0), and ParaView (v.5.8.0) based on a
tutorial in Madan (2015). Figure 3.1 was created by overlaying 3D masks of the sphere masks for
each node central coordinate (Supplemental Table 3.2). Arrows representing the group, subgroup,
and example individual level paths were then added manually in Microsoft PowerPoint based on
the output from the S-GIMME algorithm.
Study 3
The data cleaning, statistical analysis, and graph visualization code done using Mplus and
R for this study are publicly available on GitHub
(https://github.com/lgoetschius/VE_SD_SchoolConnectedness). Diagrams of the structural
equation models (Figures 4.1, 4.2, 4.4) were created using the online Cacoo software (Nulab
Inc.) based on the statistical output from Mplus.

169
References
Achenbach, T. M., & Edelbrock, C. S. (1983). Manual for the Child Behavior Checklist and
Revised Child Behavior Profile. Department of Psychiatry, University of Vermont.
Alfaro, E. C., Umaña-Taylor, A. J., Gonzales-Backen, M. A., Bámaca, M. Y., & Zeiders, K. H.
(2009). Latino adolescents’ academic success: The role of discrimination, academic
motivation, and gender. Journal of Adolescence, 32(4), 941–962.
https://doi.org/10.1016/j.adolescence.2008.08.007
Amso, D., & Lynn, A. (2017). Distinctive Mechanisms of Adversity and Socioeconomic
Inequality in Child Development: A Review and Recommendations for Evidence-Based
Policy. Policy Insights from the Behavioral and Brain Sciences, 4(2), 139–146.
https://doi.org/10.1177/2372732217721933
Andersson, J. L. R., Graham, M. S., Drobnjak, I., Zhang, H., Filippini, N., & Bastiani, M.
(2017). Towards a comprehensive framework for movement and distortion correction of
diffusion MR images: Within volume movement. Neuroimage, 152, 450–466.
https://doi.org/10.1016/j.neuroimage.2017.02.085
Andersson, J. L. R., & Sotiropoulos, S. N. (2016). An integrated approach to correction for off-
resonance effects and subject movement in diffusion MR imaging. Neuroimage, 125,
1063–1078. https://doi.org/10.1016/j.neuroimage.2015.10.019
Angold, A., Costello, E. J., & Erkanli, A. (1999). Comorbidity. Journal of Child Psychology and
Psychiatry, 40(1), 57–87. https://doi.org/10.1111/1469-7610.00424

170
Angold, A., Costello, E. J., Pickles, A., & Winder, F. (1987). The development of a
questionnaire for use in epidemiological studies of depression in children and
adolescents. London: Medical Research Council Child Psychiatry Unit.
Barbas, H. (2015). General Cortical and Special Prefrontal Connections: Principles from
Structure to Function. Annual Review of Neuroscience, 38(1), 269–289.
https://doi.org/10.1146/annurev-neuro-071714-033936
Barber, B. K., & Olsen, J. A. (1997). Socialization in Context: Connection, Regulation, and
Autonomy in the Family, School, and Neighborhood, and with Peers. Journal of
Adolescent Research, 12(2), 287–315. https://doi.org/10.1177/0743554897122008
Behrens, T. E. J., Berg, H. J., Jbabdi, S., Rushworth, M. F. S., & Woolrich, M. W. (2007).
Probabilistic diffusion tractography with multiple fibre orientations: What can we gain?
NeuroImage, 34(1), 144–155. https://doi.org/10.1016/j.neuroimage.2006.09.018
Belsky, D. W., Moffitt, T. E., Cohen, A. A., Corcoran, D. L., Levine, M. E., Prinz, J. A.,
Schaefer, J., Sugden, K., Williams, B., Poulton, R., & Caspi, A. (2018). Eleven
Telomere, Epigenetic Clock, and Biomarker-Composite Quantifications of Biological
Aging: Do They Measure the Same Thing? American Journal of Epidemiology, 187(6),
1220–1230. https://doi.org/10.1093/aje/kwx346
Beltz, A. M., Dotterer, H. L., & Goetschius, L. G. (2019). GIMME Preprocessing: Initial
Release (1.0) [Computer software]. http://doi.org/10.5281/zenodo.2692522
Beltz, A. M., & Gates, K. M. (2017). Network Mapping with GIMME. Multivariate Behavioral
Research, 52(6), 789–804. https://doi.org/10.1080/00273171.2017.1373014

171
Beltz, A. M., Wright, A. G. C., Sprague, B. N., & Molenaar, P. C. M. (2016). Bridging the
Nomothetic and Idiographic Approaches to the Analysis of Clinical Data. Assessment,
23(4), 447–458. https://doi.org/10.1177/1073191116648209
Bick, J., Zhu, T., Stamoulis, C., Fox, N. A., Zeanah, C., & Nelson, C. A. (2015). A Randomized
Clinical Trial of Foster Care as an Intervention for Early Institutionalization: Long Term
Improvements in White Matter Microstructure. JAMA Pediatrics, 169(3), 211–219.
https://doi.org/10.1001/jamapediatrics.2014.3212
Birmaher, B., Khetarpal, S., Brent, D., Cully, M., Balach, L., Kaufman, J., & Neer, S. M. (1997).
The Screen for Child Anxiety Related Emotional Disorders (SCARED): Scale
construction and psychometric characteristics. Journal of the American Academy of Child
and Adolescent Psychiatry, 36(4), 545–553. https://doi.org/10.1097/00004583-
199704000-00018
Biswal, B. B., Mennes, M., Zuo, X.-N., Gohel, S., Kelly, C., Smith, S. M., Beckmann, C. F.,
Adelstein, J. S., Buckner, R. L., Colcombe, S., Dogonowski, A.-M., Ernst, M., Fair, D.,
Hampson, M., Hoptman, M. J., Hyde, J. S., Kiviniemi, V. J., Kötter, R., Li, S.-J., …
Milham, M. P. (2010). Toward discovery science of human brain function. Proceedings
of the National Academy of Sciences, 107(10), 4734–4739.
https://doi.org/10.1073/pnas.0911855107
Blair, C., & Raver, C. C. (2012). Child Development in the Context of Adversity. The American
Psychologist, 67(4), 309–318. https://doi.org/10.1037/a0027493
Bond, L., Butler, H., Thomas, L., Carlin, J., Glover, S., Bowes, G., & Patton, G. (2007). Social
and School Connectedness in Early Secondary School as Predictors of Late Teenage

172
Substance Use, Mental Health, and Academic Outcomes. Journal of Adolescent Health,
40(4), 357.e9-357.e18. https://doi.org/10.1016/j.jadohealth.2006.10.013
Brett, M., Anton, J.-L., Valabregue, R., & Poline, J.-B. (2002). Region of interest analysis using
the MarsBar toolbox for SPM 99. Neuroimage, 16(2), S497.
Brody, G. H., Gray, J. C., Yu, T., Barton, A. W., Beach, S. R. H., Galván, A., MacKillop, J.,
Windle, M., Chen, E., Miller, G. E., & Sweet, L. H. (2017). Protective Prevention Effects
on the Association of Poverty With Brain Development. JAMA Pediatrics, 171(1), 46–
52. https://doi.org/10.1001/jamapediatrics.2016.2988
Bronfenbrenner, U., & Morris, P. A. (2007). The Bioecological Model of Human Development,
The Bioecological Model of Human Development. In Handbook of Child Psychology,
Handbook of Child Psychology. John Wiley & Sons, Inc.
https://doi.org/10.1002/9780470147658.chpsy0114, 10.1002/9780470147658.chpsy0114
Brookmeyer, K. A., Fanti, K. A., & Henrich, C. C. (2006). Schools, parents, and youth violence:
A multilevel, ecological analysis. Journal of Clinical Child and Adolescent Psychology:
The Official Journal for the Society of Clinical Child and Adolescent Psychology,
American Psychological Association, Division 53, 35(4), 504–514.
https://doi.org/10.1207/s15374424jccp3504_2
Brown, T. A. (2006). Confirmatory factor analysis for applied research. Guilford Press.
Bullmore, E., & Sporns, O. (2012). The economy of brain network organization. Nature Reviews
Neuroscience, 13(5), 336–349. https://doi.org/10.1038/nrn3214
Caron, C., & Rutter, M. (1991). Comorbidity in Child Psychopathology: Concepts, Issues and
Research Strategies. Journal of Child Psychology and Psychiatry, 32(7), 1063–1080.
https://doi.org/10.1111/j.1469-7610.1991.tb00350.x

173
Carskadon, M. A., & Acebo, C. (1993). A self-administered rating scale for pubertal
development. Journal of Adolescent Health, 14(3), 190–195.
https://doi.org/10.1016/1054-139X(93)90004-9
Casey, B. J., Cannonier, T., Conley, M. I., Cohen, A. O., Barch, D. M., Heitzeg, M. M., Soules,
M. E., Teslovich, T., Dellarco, D. V., Garavan, H., Orr, C. A., Wager, T. D., Banich, M.
T., Speer, N. K., Sutherland, M. T., Riedel, M. C., Dick, A. S., Bjork, J. M., Thomas, K.
M., … Dale, A. M. (2018). The Adolescent Brain Cognitive Development (ABCD)
study: Imaging acquisition across 21 sites. Developmental Cognitive Neuroscience, 32,
43–54. https://doi.org/10.1016/j.dcn.2018.03.001
Ceballo, R., & McLoyd, V. C. (2002). Social Support and Parenting in Poor, Dangerous
Neighborhoods. Child Development, 73(4), 1310–1321. https://doi.org/10.1111/1467-
8624.00473
Chen, E., & Miller, G. E. (2012). “Shift-and-Persist” Strategies: Why Low Socioeconomic Status
Isn’t Always Bad for Health. Perspectives on Psychological Science, 7(2), 135–158.
https://doi.org/10.1177/1745691612436694
Chetty, R., Hendren, N., Jones, M. R., & Porter, S. R. (2020). Race and Economic Opportunity
in the United States: An Intergenerational Perspective*. The Quarterly Journal of
Economics, 135(2), 711–783. https://doi.org/10.1093/qje/qjz042
Choi, J., Jeong, B., Polcari, A., Rohan, M. L., & Teicher, M. H. (2012). Reduced Fractional
Anisotropy in the Visual Limbic Pathway of Young Adults Witnessing Domestic
Violence in Childhood. NeuroImage, 59(2), 1071–1079.
https://doi.org/10.1016/j.neuroimage.2011.09.033

174
Chugani, H. T., Behen, M. E., Muzik, O., Juhász, C., Nagy, F., & Chugani, D. C. (2001). Local
Brain Functional Activity Following Early Deprivation: A Study of Postinstitutionalized
Romanian Orphans. NeuroImage, 14(6), 1290–1301.
https://doi.org/10.1006/nimg.2001.0917
Cicchetti, D. (2010). Resilience under conditions of extreme stress: A multilevel perspective.
World Psychiatry, 9(3), 145–154.
Cicchetti, D., & Blender, J. A. (2004). A multiple-levels-of-analysis approach to the study of
developmental processes in maltreated children. Proceedings of the National Academy of
Sciences of the United States of America, 101(50), 17325–17326.
https://doi.org/10.1073/pnas.0408033101
Cicchetti, D., & Lynch, M. (1993). Toward an ecological/transactional model of community
violence and child maltreatment: Consequences for children’s development. Psychiatry,
56(1), 96–118. https://doi.org/10.1080/00332747.1993.11024624
Cicchetti, D., & Rogosch, F. A. (1996). Equifinality and multifinality in developmental
psychopathology. Development and Psychopathology, 8(4), 597–600.
https://doi.org/10.1017/S0954579400007318
Cicchetti, D., & Toth, S. L. (2009). The Past Achievements and Future Promises of
Developmental Psychopathology: The Coming of Age of a Discipline. Journal of Child
Psychology and Psychiatry, and Allied Disciplines, 50(1–2), 16–25.
https://doi.org/10.1111/j.1469-7610.2008.01979.x
Cisler, J. M., James, G. A., Tripathi, S., Mletzko, T., Heim, C., Hu, X. P., Mayberg, H. S.,
Nemeroff, C. B., & Kilts, C. D. (2013). Differential functional connectivity within an
emotion regulation neural network among individuals resilient and susceptible to the

175
depressogenic effects of early life stress. Psychological Medicine, 43(3), 507–518.
https://doi.org/10.1017/S0033291712001390
Colich, N. L., Rosen, M. L., Williams, E. S., & McLaughlin, K. A. (2020). Biological Aging in
Childhood and Adolescence Following Experiences of Threat and Deprivation: A
Systematic Review and Meta-Analysis. Psychological Bulletin, 146(9), 721–764.
https://doi.org/10.1037/bul0000270
Craney, T. A., & Surles, J. G. (2002). Model-Dependent Variance Inflation Factor Cutoff
Values. Quality Engineering, 14(3), 391–403. https://doi.org/10.1081/QEN-120001878
Daly, B., Buchanan, C., Dasch, K., Eichen, D., & Lenhart, C. (2010). Promoting School
Connectedness Among Urban Youth of Color: Reducing Risk Factors While Promoting
Protective Factors. Prevention Researcher, 17(3), 18–20.
Davis‐Kean, P. E., & Jager, J. (2017). Iii. from Small to Big: Methods for Incorporating Large
Scale Data into Developmental Science. Monographs of the Society for Research in Child
Development, 82(2), 31–45. https://doi.org/10.1111/mono.12297
de Prado Bert, P., Mercader, E. M. H., Pujol, J., Sunyer, J., & Mortamais, M. (2018). The Effects
of Air Pollution on the Brain: A Review of Studies Interfacing Environmental
Epidemiology and Neuroimaging. Current Environmental Health Reports, 5(3), 351–364.
https://doi.org/10.1007/s40572-018-0209-9
Dennison, M. J., Sheridan, M. A., Busso, D. S., Jenness, J. L., Peverill, M., Rosen, M. L., &
McLaughlin, K. A. (2016). Neurobehavioral markers of resilience to depression amongst
adolescents exposed to child abuse. Journal of Abnormal Psychology, 125(8), 1201–
1212. https://doi.org/10.1037/abn0000215

176
Derogatis, L. R., & Savitz, K. L. (2000). The SCL-90 and Brief Symptom Invetory (BSI) in
primary care. In M. E. Maruish (Ed.), Handbook of psychological assessment in primary
care settings (pp. 297–334). Lawrence Erlbaum Associates Publishers.
Dickman, S. J. (1990). Functional and dysfunctional impulsivity: Personality and cognitive
correlates. Journal of Personality and Social Psychology, 58(1), 95–102.
https://doi.org/10.1037/0022-3514.58.1.95
Donnelly, L., McLanahan, S., Brooks-Gunn, J., Garfinkel, I., Wagner, B. G., Jacobsen, W. C.,
Gold, S., & Gaydosh, L. (2016). Cohesive Neighborhoods Where Social Expectations
Are Shared May Have Positive Impact On Adolescent Mental Health. Health Affairs,
35(11), 2083–2091. https://doi.org/10.1377/hlthaff.2016.0721
Dufford, A. J., Kim, P., & Evans, G. W. (2019). The impact of childhood poverty on brain
health: Emerging evidence from neuroimaging across the lifespan. In International
Review of Neurobiology. Academic Press. https://doi.org/10.1016/bs.irn.2019.12.001
Dunn, E. C., McLaughlin, K. A., Slopen, N., Rosand, J., & Smoller, J. W. (2013).
Developmental timing of child maltreatment and symptoms of depression and suicidal
ideation in young adulthood: Results from the National Longitudinal Study on
Adolescent Health. Depression and Anxiety, 30(10). https://doi.org/10.1002/da.22102
Dunn, E. C., Soare, T. W., Zhu, Y., Simpkin, A. J., Suderman, M. J., Klengel, T., Smith, A. D.
A. C., Ressler, K., & Relton, C. L. (2019). Sensitive periods for the effect of childhood
adversity on DNA methylation: Results from a prospective, longitudinal study. Biological
Psychiatry, 85(10), 838–849. https://doi.org/10.1016/j.biopsych.2018.12.023

177
Eavani, H., Satterthwaite, T. D., Filipovych, R., Gur, R. E., Gur, R. C., & Davatzikos, C. (2015).
Identifying Sparse Connectivity Patterns in the brain using resting-state fMRI.
NeuroImage, 105, 286–299. https://doi.org/10.1016/j.neuroimage.2014.09.058
Elder, G. H., & Shanahan, M. J. (2006). The Life Course and Human Development. In
Handbook of child psychology: Theoretical models of human development, Vol. 1, 6th ed
(pp. 665–715). John Wiley & Sons Inc.
Ellis, B. J., Figueredo, A. J., Brumbach, B. H., & Schlomer, G. L. (2009). Fundamental
Dimensions of Environmental Risk: The Impact of Harsh versus Unpredictable
Environments on the Evolution and Development of Life History Strategies. Human
Nature (Hawthorne, N.Y.), 20(2), 204–268. https://doi.org/10.1007/s12110-009-9063-7
Eluvathingal, T. J., Chugani, H. T., Behen, M. E., Juhász, C., Muzik, O., Maqbool, M., Chugani,
D. C., & Makki, M. (2006). Abnormal brain connectivity in children after early severe
socioemotional deprivation: A diffusion tensor imaging study. Pediatrics, 117(6), 2093–
2100. https://doi.org/10.1542/peds.2005-1727
Etkin, A., Büchel, C., & Gross, J. J. (2015). The neural bases of emotion regulation. Nature
Reviews. Neuroscience, 16(11), 693–700. https://doi.org/10.1038/nrn4044
Etkin, A., Egner, T., & Kalisch, R. (2011). Emotional processing in anterior cingulate and medial
prefrontal cortex. Trends in Cognitive Sciences, 15(2), 85–93.
https://doi.org/10.1016/j.tics.2010.11.004
Evans, G. W., & Kim, P. (2007). Childhood Poverty and Health: Cumulative Risk Exposure and
Stress Dysregulation. Psychological Science, 18(11), 953–957.
https://doi.org/10.1111/j.1467-9280.2007.02008.x

178
Evans, G. W., Li, D., & Whipple, S. S. (2013). Cumulative risk and child development.
Psychological Bulletin, 139(6), 1342–1396. https://doi.org/10.1037/a0031808
Fair, D. A., Cohen, A. L., Power, J. D., Dosenbach, N. U. F., Church, J. A., Miezin, F. M.,
Schlaggar, B. L., & Petersen, S. E. (2009). Functional Brain Networks Develop from a
“Local to Distributed” Organization. PLoS Computational Biology, 5(5).
https://doi.org/10.1371/journal.pcbi.1000381
Falk, E. B., Hyde, L. W., Mitchell, C., Faul, J., Gonzalez, R., Heitzeg, M. M., Keating, D. P.,
Langa, K. M., Martz, M. E., Maslowsky, J., Morrison, F. J., Noll, D. C., Patrick, M. E.,
Pfeffer, F. T., Reuter-Lorenz, P. A., Thomason, M. E., Davis-Kean, P., Monk, C. S., &
Schulenberg, J. (2013). What is a representative brain? Neuroscience meets population
science. Proceedings of the National Academy of Sciences, 110(44), 17615–17622.
https://doi.org/10.1073/pnas.1310134110
Farah, M. J. (2018). Socioeconomic status and the brain: Prospects for neuroscience-informed
policy. Nature Reviews Neuroscience, 19(7), 428–438. https://doi.org/10.1038/s41583-
018-0023-2
Farrell, A. D., Ampy, L. A., & Meyer, A. L. (1998). Identification and assessment of problematic
interpersonal situations for urban adolescents. Journal of Clinical Child Psychology,
27(3), 293–305. https://doi.org/10.1207/s15374424jccp2703_6
Felitti, V. J., Anda, R. F., Nordenberg, D., Williamson, D. F., Spitz, A. M., Edwards, V., Koss,
M. P., & Marks, J. S. (1998). Relationship of Childhood Abuse and Household
Dysfunction to Many of the Leading Causes of Death in Adults: The Adverse Childhood
Experiences (ACE) Study. American Journal of Preventive Medicine, 14(4), 245–258.
https://doi.org/10.1016/S0749-3797(98)00017-8

179
Finkelhor, D., Turner, H. A., Shattuck, A., & Hamby, S. L. (2015). Prevalence of Childhood
Exposure to Violence, Crime, and Abuse: Results From the National Survey of
Children’s Exposure to Violence. JAMA Pediatrics, 169(8), 746–754.
https://doi.org/10.1001/jamapediatrics.2015.0676
Finn, E. S., Shen, X., Scheinost, D., Rosenberg, M. D., Huang, J., Chun, M. M., Papademetris,
X., & Constable, R. T. (2015). Functional connectome fingerprinting: Identifying
individuals using patterns of brain connectivity. Nature Neuroscience, 18(11), 1664–
1671. https://doi.org/10.1038/nn.4135
First, M. B. (2015). Structured Clinical Interview for the DSM (SCID). In The Encyclopedia of
Clinical Psychology (pp. 1–6). American Cancer Society.
https://doi.org/10.1002/9781118625392.wbecp351
Font, S. A., & Berger, L. M. (2015). Child Maltreatment and Children’s Developmental
Trajectories in Early- to Middle-Childhood. Child Development, 86(2), 536–556.
https://doi.org/10.1111/cdev.12322
Foster, C. E., Horwitz, A., Thomas, A., Opperman, K., Gipson, P., Burnside, A., Stone, D. M., &
King, C. A. (2017). Connectedness to family, school, peers, and community in socially
vulnerable adolescents. Children and Youth Services Review, 81, 321–331.
https://doi.org/10.1016/j.childyouth.2017.08.011
Foster, H., & Brooks-Gunn, J. (2009). Toward a Stress Process Model of Children’s Exposure to
Physical Family and Community Violence. Clinical Child and Family Psychology
Review, 12(2), 71–94. https://doi.org/10.1007/s10567-009-0049-0
Fox, M. D., & Greicius, M. (2010). Clinical applications of resting state functional connectivity.
Frontiers in Systems Neuroscience, 4. https://doi.org/10.3389/fnsys.2010.00019

180
Gabard-Durnam, L. J., Gee, D. G., Goff, B., Flannery, J., Telzer, E., Humphreys, K. L., Lumian,
D. S., Fareri, D. S., Caldera, C., & Tottenham, N. (2016). Stimulus-Elicited Connectivity
Influences Resting-State Connectivity Years Later in Human Development: A
Prospective Study. The Journal of Neuroscience, 36(17), 4771–4784.
https://doi.org/10.1523/JNEUROSCI.0598-16.2016
Gard, A. M., Maxwell, A. M., Shaw, D. S., Mitchell, C., Brooks‐Gunn, J., McLanahan, S. S.,
Forbes, E. E., Monk, C. S., & Hyde, L. W. (2021). Beyond family-level adversities:
Exploring the developmental timing of neighborhood disadvantage effects on the brain.
Developmental Science, 24(1), e12985. https://doi.org/10.1111/desc.12985
Gard, A. M., Waller, R., Shaw, D. S., Forbes, E. E., Hariri, A. R., & Hyde, L. W. (2017). The
Long Reach of Early Adversity: Parenting, Stress, and Neural Pathways to Antisocial
Behavior in Adulthood. Biological Psychiatry: Cognitive Neuroscience and
Neuroimaging, 2(7), 582–590. https://doi.org/10.1016/j.bpsc.2017.06.005
Gates, K. M., Lane, S. T., Varangis, E., Giovanello, K., & Guiskewicz, K. (2017). Unsupervised
Classification During Time-Series Model Building. Multivariate Behavioral Research,
52(2), 129–148. https://doi.org/10.1080/00273171.2016.1256187
Gates, K. M., & Molenaar, P. C. M. (2012). Group search algorithm recovers effective
connectivity maps for individuals in homogeneous and heterogeneous samples.
NeuroImage, 63(1), 310–319. https://doi.org/10.1016/j.neuroimage.2012.06.026
Gates, K. M., Molenaar, P. C. M., Hillary, F. G., Ram, N., & Rovine, M. J. (2010). Automatic
search for fMRI connectivity mapping: An alternative to Granger causality testing using
formal equivalences among SEM path modeling, VAR, and unified SEM. NeuroImage,
50(3), 1118–1125. https://doi.org/10.1016/j.neuroimage.2009.12.117

181
Gates, K. M., Molenaar, P. C. M., Iyer, S. P., Nigg, J. T., & Fair, D. A. (2014). Organizing
Heterogeneous Samples Using Community Detection of GIMME-Derived Resting State
Functional Networks. PLOS ONE, 9(3), e91322.
https://doi.org/10.1371/journal.pone.0091322
Gee, D. G., Gabard-Durnam, L. J., Flannery, J., Goff, B., Humphreys, K. L., Telzer, E. H., Hare,
T. A., Bookheimer, S. Y., & Tottenham, N. (2013). Early developmental emergence of
human amygdala–prefrontal connectivity after maternal deprivation. Proceedings of the
National Academy of Sciences, 110(39), 15638–15643.
https://doi.org/10.1073/pnas.1307893110
Giedd, J. N., Blumenthal, J., Jeffries, N. O., Castellanos, F. X., Liu, H., Zijdenbos, A., Paus, T.,
Evans, A. C., & Rapoport, J. L. (1999). Brain development during childhood and
adolescence: A longitudinal MRI study. Nature Neuroscience, 2(10), 861–863.
Glover, G. H., & Law, C. S. (2001). Spiral-in/out BOLD fMRI for increased SNR and reduced
susceptibility artifacts. Magnetic Resonance in Medicine, 46(3), 515–522.
Goetschius, L. G., Hein, T. C., Mattson, W. I., Lopez-Duran, N., Dotterer, H. . L., Welsh, R. C.,
Mitchell, C., Hyde, L. W., & Monk, C. S. (2019). Amygdala-prefrontal cortex white
matter tracts are widespread, variable and implicated in amygdala modulation in
adolescents. NeuroImage, 191, 278–291.
https://doi.org/10.1016/j.neuroimage.2019.02.009
Goetschius, L. G., Hein, T. C., McLanahan, S. S., Brooks-Gunn, J., McLoyd, V. C., Dotterer, H.
L., Lopez-Duran, N., Mitchell, C., Hyde, L. W., Monk, C. S., & Beltz, A. M. (2020).
Association of Childhood Violence Exposure With Adolescent Neural Network Density.

182
JAMA Network Open, 3(9), e2017850–e2017850.
https://doi.org/10.1001/jamanetworkopen.2020.17850
Goetschius, L. G., Hein, T. C., Mitchell, C., Lopez-Duran, N. L., McLoyd, V. C., Brooks-Gunn,
J., McLanahan, S. S., Hyde, L. W., & Monk, C. S. (2020a). Childhood violence exposure
and social deprivation predict adolescent amygdala-orbitofrontal cortex white matter
connectivity. Developmental Cognitive Neuroscience, 100822.
https://doi.org/10.1016/j.dcn.2020.100822
Goetschius, L. G., Hein, T. C., Mitchell, C., Lopez-Duran, N. L., McLoyd, V. C., Brooks-Gunn,
J., McLanahan, S. S., Hyde, L. W., & Monk, C. S. (2020b). Childhood violence exposure
and social deprivation predict adolescent amygdala-orbitofrontal cortex white matter
connectivity. Developmental Cognitive Neuroscience, 45, 100849.
https://doi.org/10.1016/j.dcn.2020.100849
Gold, A. L., Morey, R. A., & McCarthy, G. (2015). Amygdala–Prefrontal Cortex Functional
Connectivity During Threat-Induced Anxiety and Goal Distraction. Biological
Psychiatry, 77(4), 394–403. https://doi.org/10.1016/j.biopsych.2014.03.030
Gordon, E. M., Laumann, T. O., Gilmore, A. W., Newbold, D. J., Greene, D. J., Berg, J. J.,
Ortega, M., Hoyt-Drazen, C., Gratton, C., Sun, H., Hampton, J. M., Coalson, R. S.,
Nguyen, A. L., McDermott, K. B., Shimony, J. S., Snyder, A. Z., Schlaggar, B. L.,
Petersen, S. E., Nelson, S. M., & Dosenbach, N. U. F. (2017). Precision Functional
Mapping of Individual Human Brains. Neuron, 95(4), 791-807.e7.
https://doi.org/10.1016/j.neuron.2017.07.011

183
Gottfried, J. A., & Dolan, R. J. (2004). Human orbitofrontal cortex mediates extinction learning
while accessing conditioned representations of value. Nature Neuroscience, 7(10), 1144.
https://doi.org/10.1038/nn1314
Gottlieb, G. (2007). Probabilistic epigenesis. Developmental Science, 10(1), 1–11.
https://doi.org/10.1111/j.1467-7687.2007.00556.x
Govindan, R. M., Behen, M. E., Helder, E., Makki, M. I., & Chugani, H. T. (2010). Altered
Water Diffusivity in Cortical Association Tracts in Children with Early Deprivation
Identified with Tract-Based Spatial Statistics (TBSS). Cerebral Cortex (New York, NY),
20(3), 561–569. https://doi.org/10.1093/cercor/bhp122
Green, J. G., McLaughlin, K. A., Berglund, P. A., Gruber, M. J., Sampson, N. A., Zaslavsky, A.
M., & Kessler, R. C. (2010). Childhood Adversities and Adult Psychiatric Disorders in
the National Comorbidity Survey Replication I: Associations With First Onset of DSM-
IV Disorders. Archives of General Psychiatry, 67(2), 113–123.
https://doi.org/10.1001/archgenpsychiatry.2009.186
Greening, S. G., & Mitchell, D. G. V. (2015). A network of amygdala connections predict
individual differences in trait anxiety. Human Brain Mapping, 36(12), 4819–4830.
https://doi.org/10.1002/hbm.22952
Greicius, M. D., Flores, B. H., Menon, V., Glover, G. H., Solvason, H. B., Kenna, H., Reiss, A.
L., & Schatzberg, A. F. (2007). Resting-State Functional Connectivity in Major
Depression: Abnormally Increased Contributions from Subgenual Cingulate Cortex and
Thalamus. Biological Psychiatry, 62(5), 429–437.
https://doi.org/10.1016/j.biopsych.2006.09.020

184
Guerra-Carrillo, B., Mackey, A. P., & Bunge, S. A. (2014). Resting-State fMRI: A Window into
Human Brain Plasticity. The Neuroscientist, 20(5), 522–533.
https://doi.org/10.1177/1073858414524442
Gur, R. E., Moore, T. M., Rosen, A. F. G., Barzilay, R., Roalf, D. R., Calkins, M. E., Ruparel,
K., Scott, J. C., Almasy, L., Satterthwaite, T. D., Shinohara, R. T., & Gur, R. C. (2019).
Burden of Environmental Adversity Associated With Psychopathology, Maturation, and
Brain Behavior Parameters in Youths. JAMA Psychiatry, 76(9), 966–975.
https://doi.org/10.1001/jamapsychiatry.2019.0943
Hallquist, M. N., & Wiley, J. F. (2018). MplusAutomation: An R Package for Facilitating Large-
Scale Latent Variable Analyses in Mplus. Structural Equation Modeling: A
Multidisciplinary Journal, 25(4), 621–638.
https://doi.org/10.1080/10705511.2017.1402334
Hankin, B. L. (2012). Future Directions in Vulnerability to Depression among Youth: Integrating
Risk Factors and Processes across Multiple Levels of Analysis. Journal of Clinical Child
and Adolescent Psychology : The Official Journal for the Society of Clinical Child and
Adolescent Psychology, American Psychological Association, Division 53, 41(5), 695–
718. https://doi.org/10.1080/15374416.2012.711708
Hanson, J. L., Hariri, A. R., & Williamson, D. E. (2015). Blunted Ventral Striatum Development
in Adolescence Reflects Emotional Neglect and Predicts Depressive Symptoms.
Biological Psychiatry, 78(9), 598–605. https://doi.org/10.1016/j.biopsych.2015.05.010
Hanson, J. L., Knodt, A. R., Brigidi, B. D., & Hariri, A. R. (2015). Lower structural integrity of
the uncinate fasciculus is associated with a history of child maltreatment and future

185
psychological vulnerability to stress. Development and Psychopathology, 27(4 Pt 2),
1611–1619. https://doi.org/10.1017/S0954579415000978
Hanson, J. L., Nacewicz, B. M., Sutterer, M. J., Cayo, A. A., Schaefer, S. M., Rudolph, K. D.,
Shirtcliff, E. A., Pollak, S. D., & Davidson, R. J. (2015). Behavior Problems After Early
Life Stress: Contributions of the Hippocampus and Amygdala. Biological Psychiatry,
77(4), 314–323. https://doi.org/10.1016/j.biopsych.2014.04.020
Hardaway, C. R., McLoyd, V. C., & Wood, D. (2012). Exposure to Violence and
Socioemotional Adjustment in Low-Income Youth: An Examination of Protective
Factors. American Journal of Community Psychology, 49(1–2), 112–126.
https://doi.org/10.1007/s10464-011-9440-3
Harris, K. M. (2013). The Add Health Study: Design and Accomplishments.
https://doi.org/10.17615/C6TW87
Hedge, C., Powell, G., & Sumner, P. (2018). The reliability paradox: Why robust cognitive tasks
do not produce reliable individual differences. Behavior Research Methods, 50(3), 1166–
1186. https://doi.org/10.3758/s13428-017-0935-1
Hein, T. C. (2019). Dimensions of Early Adversity as Distinct Predictors of Adolescent Brain
Development [Doctoral Dissertation, University of Michigan].
https://deepblue.lib.umich.edu/bitstream/handle/2027.42/149945/heint_1.pdf?sequence=1
&isAllowed=y
Hein, T. C., Goetschius, L. G., McLoyd, V. C., Brooks-Gunn, J., McLanahan, S. S., Mitchell, C.,
Lopez-Duran, N., Hyde, L. W., & Monk, C. S. (2020). Childhood Violence Exposure and
Social Deprivation are Linked to Adolescent Threat and Reward Neural Function. Social
Cognitive and Affective Neuroscience. https://doi.org/10.1093/scan/nsaa144

186
Hein, T. C., Mattson, W. I., Dotterer, H. L., Mitchell, C., Lopez-Duran, N., Thomason, M. E.,
Peltier, S. J., Welsh, R. C., Hyde, L. W., & Monk, C. S. (2018). Amygdala habituation
and uncinate fasciculus connectivity in adolescence: A multi-modal approach.
NeuroImage, 183, 617–626. https://doi.org/10.1016/j.neuroimage.2018.08.058
Hein, T. C., & Monk, C. S. (2017). Research Review: Neural response to threat in children,
adolescents, and adults after child maltreatment - a quantitative meta-analysis. Journal of
Child Psychology and Psychiatry, and Allied Disciplines.
https://doi.org/10.1111/jcpp.12651
Helsel, W. J., & Matson, J. L. (1984). The assessment of depression in children: The internal
structure of the child depression inventory (CDI). Behaviour Research and Therapy,
22(3), 289–298. https://doi.org/10.1016/0005-7967(84)90009-3
Hernández, M., Guerrero, G. D., Cecilia, J. M., García, J. M., Inuggi, A., Jbabdi, S., Behrens, T.
E. J., & Sotiropoulos, S. N. (2013). Accelerating Fibre Orientation Estimation from
Diffusion Weighted Magnetic Resonance Imaging Using GPUs. PLOS ONE, 8(4),
e61892. https://doi.org/10.1371/journal.pone.0061892
Hernandez-Fernandez, M., Reguly, I., Giles, M., Jbabdi, S., Smith, S. M., & Sotiropoulos, S. N.
(2016, June). A fast and flexible toolbox for tracking brain connections in diffusion MRI
datasets using GPUs. 22nd Annual Meeting of the Organization for Human Brain
Mapping (OHBM), Geneva, Switzerland.
Herringa, R. J., Birn, R. M., Ruttle, P. L., Burghy, C. A., Stodola, D. E., Davidson, R. J., &
Essex, M. J. (2013). Childhood maltreatment is associated with altered fear circuitry and
increased internalizing symptoms by late adolescence. Proceedings of the National
Academy of Sciences, 110(47), 19119–19124. https://doi.org/10.1073/pnas.1310766110

187
Ho, T. C., King, L. S., Leong, J. K., Colich, N. L., Humphreys, K. L., Ordaz, S. J., & Gotlib, I.
H. (2017). Effects of sensitivity to life stress on uncinate fasciculus segments in early
adolescence. Social Cognitive and Affective Neuroscience, 12(9), 1460–1469.
https://doi.org/10.1093/scan/nsx065
Hoaglin, D. C., & Iglewicz, B. (1987). Fine-Tuning Some Resistant Rules for Outlier Labeling.
Journal of the American Statistical Association, 82(400), 1147–1149. JSTOR.
https://doi.org/10.2307/2289392
Holz, N. E., Boecker, R., Buchmann, A. F., Blomeyer, D., Baumeister, S., Hohmann, S., Jennen-
Steinmetz, C., Wolf, I., Rietschel, M., Witt, S. H., Plichta, M. M., Meyer-Lindenberg, A.,
Schmidt, M. H., Esser, G., Banaschewski, T., Brandeis, D., & Laucht, M. (2016).
Evidence for a Sex-Dependent MAOA× Childhood Stress Interaction in the Neural
Circuitry of Aggression. Cerebral Cortex, 26(3), 904–914.
https://doi.org/10.1093/cercor/bhu249
Holz, N. E., Boecker-Schlier, R., Buchmann, A. F., Blomeyer, D., Jennen-Steinmetz, C.,
Baumeister, S., Plichta, M. M., Cattrell, A., Schumann, G., Esser, G., Schmidt, M.,
Buitelaar, J., Meyer-Lindenberg, A., Banaschewski, T., Brandeis, D., & Laucht, M.
(2017). Ventral striatum and amygdala activity as convergence sites for early adversity
and conduct disorder. Social Cognitive and Affective Neuroscience, 12(2), 261–272.
https://doi.org/10.1093/scan/nsw120
Honey, C. J., Kötter, R., Breakspear, M., & Sporns, O. (2007). Network structure of cerebral
cortex shapes functional connectivity on multiple time scales. Proceedings of the
National Academy of Sciences, 104(24), 10240–10245.
https://doi.org/10.1073/pnas.0701519104

188
Howard, M. C., & Hoffman, M. E. (2018). Variable-Centered, Person-Centered, and Person-
Specific Approaches: Where Theory Meets the Method.
https://doi.org/10.1177/1094428117744021
Hu, L., & Bentler, P. M. (1999). Cutoff criteria for fit indexes in covariance structure analysis:
Conventional criteria versus new alternatives. Structural Equation Modeling: A
Multidisciplinary Journal, 6(1), 1–55. https://doi.org/10.1080/10705519909540118
Huang, H., Gundapuneedi, T., & Rao, U. (2012). White Matter Disruptions in Adolescents
Exposed to Childhood Maltreatment and Vulnerability to Psychopathology.
Neuropsychopharmacology, 37(12), 2693–2701. https://doi.org/10.1038/npp.2012.133
Huettel, S. A., Song, A. W., & McCarthy, G. (2009). Functional magnetic resonance imaging
(2nd ed.). Sinauer Associates Sunderland.
https://pdfs.semanticscholar.org/b917/f1d5f55a44446d45a14f2f0192375108aa0e.pdf
Hughes, K., Bellis, M. A., Hardcastle, K. A., Sethi, D., Butchart, A., Mikton, C., Jones, L., &
Dunne, M. P. (2017). The effect of multiple adverse childhood experiences on health: A
systematic review and meta-analysis. The Lancet Public Health, 2(8), e356–e366.
https://doi.org/10.1016/S2468-2667(17)30118-4
Hunt, T. K. A., Slack, K. S., & Berger, L. M. (2017). Adverse childhood experiences and
behavioral problems in middle childhood. Child Abuse & Neglect, 67, 391–402.
https://doi.org/10.1016/j.chiabu.2016.11.005
Hyde, L. W. (2015). Developmental psychopathology in an era of molecular genetics and
neuroimaging: A developmental neurogenetics approach. Development and
Psychopathology, 27(2), 587–613. https://doi.org/10.1017/S0954579415000188

189
Hyde, L. W., Gard, A. M., Tomlinson, R. C., Burt, S. A., Mitchell, C., & Monk, C. S. (2020). An
ecological approach to understanding the developing brain: Examples linking poverty,
parenting, neighborhoods, and the brain. American Psychologist, 75(9), 1245–1259.
https://doi.org/10.1037/amp0000741
Hyman, S. E. (2009). How adversity gets under the skin. Nature Neuroscience, 12(3), 241–243.
https://doi.org/10.1038/nn0309-241
Jackowski, A. P., Douglas-Palumberi, H., Jackowski, M., Win, L., Schultz, R. T., Staib, L. W.,
Krystal, J. H., & Kaufman, J. (2008). Corpus callosum in maltreated children with
posttraumatic stress disorder: A diffusion tensor imaging study. Psychiatry Research,
162(3), 256–261. https://doi.org/10.1016/j.pscychresns.2007.08.006
Jenkinson, M., Bannister, P., Brady, M., & Smith, S. (2002). Improved optimization for the
robust and accurate linear registration and motion correction of brain images.
NeuroImage, 17(2), 825–841.
Jenkinson, M., Beckmann, C. F., Behrens, T. E. J., Woolrich, M. W., & Smith, S. M. (2012).
FSL. NeuroImage, 62(2), 782–790. https://doi.org/10.1016/j.neuroimage.2011.09.015
Jenkinson, M., & Smith, S. (2001). A global optimisation method for robust affine registration of
brain images. Medical Image Analysis, 5(2), 143–156.
Kaiser, R. H., Clegg, R., Goer, F., Pechtel, P., Beltzer, M., Vitaliano, G., Olson, D. P., Teicher,
M. H., & Pizzagalli, D. A. (2018). Childhood stress, grown-up brain networks:
Corticolimbic correlates of threat-related early life stress and adult stress response.
Psychological Medicine, 48(7), 1157–1166. https://doi.org/10.1017/S0033291717002628
Kalu, S. R., Menon, S. E., & Quinn, C. R. (2020). The relationship between externalizing
behavior and school and familial attachments among girls from diverse backgrounds.

190
Children and Youth Services Review, 116, 105170.
https://doi.org/10.1016/j.childyouth.2020.105170
Kaufman, J., Birmaher, B., Brent, D., Rao, U., Flynn, C., Moreci, P., Williamson, D., & Ryan,
N. (1997). Schedule for Affective Disorders and Schizophrenia for School-Age Children-
Present and Lifetime Version (K-SADS-PL): Initial Reliability and Validity Data.
Journal of the American Academy of Child & Adolescent Psychiatry, 36(7), 980–988.
https://doi.org/10.1097/00004583-199707000-00021
Kaufman, J., Plotsky, P. M., Nemeroff, C. B., & Charney, D. S. (2000). Effects of early adverse
experiences on brain structure and function: Clinical implications. Biological Psychiatry,
48(8), 778–790. https://doi.org/10.1016/S0006-3223(00)00998-7
Kern, M. L., Benson, L., Steinberg, E. A., & Steinberg, L. (2016). The EPOCH Measure of
Adolescent Well-Being. Psychological Assessment, 28(5), 586–597.
https://doi.org/10.1037/pas0000201
Kessler, R. C., Berglund, P., Demler, O., Jin, R., Merikangas, K. R., & Walters, E. E. (2005).
Lifetime prevalence and age-of-onset distributions of DSM-IV disorders in the National
Comorbidity Survey Replication. Archives of General Psychiatry, 62(6), 593–602.
https://doi.org/10.1001/archpsyc.62.6.593
Kim, D.-J., Davis, E. P., Sandman, C. A., Glynn, L., Sporns, O., O’Donnell, B. F., & Hetrick, W.
P. (2019). Childhood poverty and the organization of structural brain connectome.
NeuroImage, 184, 409–416. https://doi.org/10.1016/j.neuroimage.2018.09.041
Kim, M. J., Farber, M. J., Knodt, A. R., & Hariri, A. R. (2019). Corticolimbic circuit structure
moderates an association between early life stress and later trait anxiety. NeuroImage.
Clinical, 24, 102050. https://doi.org/10.1016/j.nicl.2019.102050

191
Klika, J. B., Herrenkohl, T. I., & Lee, J. O. (2013). School Factors as Moderators of the
Relationship Between Physical Child Abuse and Pathways of Antisocial Behavior.
Journal of Interpersonal Violence, 28(4), 852–867.
https://doi.org/10.1177/0886260512455865
Kline, R. B. (2015). Principles and Practice of Structural Equation Modeling. Guilford
Publications.
Kolb, B., & Gibb, R. (2014). Searching for the principles of brain plasticity and behavior.
Cortex, 58, 251–260. https://doi.org/10.1016/j.cortex.2013.11.012
Koss, K. J., & Gunnar, M. R. (2018). Annual Research Review: Early adversity, the
hypothalamic–pituitary–adrenocortical axis, and child psychopathology. Journal of Child
Psychology and Psychiatry, 59(4), 327–346. https://doi.org/10.1111/jcpp.12784
Lambert, H. K., King, K. M., Monahan, K. C., & Mclaughlin, K. A. (2017). Differential
associations of threat and deprivation with emotion regulation and cognitive control in
adolescence. Development and Psychopathology, 29(3), 929–940.
https://doi.org/10.1017/S0954579416000584
Lane, S. T., Gates, K. M., & Molenaar, P. C. M. (2019). gimme: Group Iterative Multiple Model
Estimation (0.5-1) [Computer software]. https://CRAN.R-project.org/package=gimme
Le Bihan, D., Mangin, J. F., Poupon, C., Clark, C. A., Pappata, S., Molko, N., & Chabriat, H.
(2001). Diffusion tensor imaging: Concepts and applications. Journal of Magnetic
Resonance Imaging: JMRI, 13(4), 534–546.
Lensch, T., Clements-Nolle, K., Oman, R. F., Evans, W. P., Lu, M., & Yang, W. (2020).
Adverse Childhood Experiences and Suicidal Behaviors Among Youth: The Buffering

192
Influence of Family Communication and School Connectedness. Journal of Adolescent
Health. https://doi.org/10.1016/j.jadohealth.2020.08.024
Lipina, S. J., & Evers, K. (2017). Neuroscience of Childhood Poverty: Evidence of Impacts and
Mechanisms as Vehicles of Dialog With Ethics. Frontiers in Psychology, 8.
https://doi.org/10.3389/fpsyg.2017.00061
Liu, Y., Kim, H., Carney, J. V., Chung, K. S., & Hazler, R. J. (2020). Individual and Contextual
Factors Associated With School Connectedness in the Context of Counseling in Schools.
Journal of Counseling & Development, 98(4), 391–401.
https://doi.org/10.1002/jcad.12341
Long, J. A. (2019). interactions: Comprehensive, User-Friendly Toolkit for Probing Interactions
(1.1.1) [R]. https://CRAN.R-project.org/package=interactions
Loukas, A., Roalson, L. A., & Herrera, D. E. (2010). School Connectedness Buffers the Effects
of Negative Family Relations and Poor Effortful Control on Early Adolescent Conduct
Problems. Journal of Research on Adolescence, 20(1), 13–22.
https://doi.org/10.1111/j.1532-7795.2009.00632.x
Loukas, A., Suzuki, R., & Horton, K. D. (2006). Examining School Connectedness as a Mediator
of School Climate Effects. Journal of Research on Adolescence, 16(3), 491–502.
https://doi.org/10.1111/j.1532-7795.2006.00504.x
Luthar, S. S., Cicchetti, D., & Becker, B. (2000). The Construct of Resilience: A Critical
Evaluation and Guidelines for Future Work. Child Development, 71(3), 543–562.
Luthar, S. S., Crossman, E. J., & Small, P. J. (2015). Resilience and Adversity. In Handbook of
Child Psychology and Developmental Science (pp. 1–40). Wiley.
https://doi.org/10.1002/9781118963418.childpsy307

193
Mackey, A. P., Whitaker, K. J., & Bunge, S. A. (2012). Experience-dependent plasticity in white
matter microstructure: Reasoning training alters structural connectivity. Frontiers in
Neuroanatomy, 6. https://doi.org/10.3389/fnana.2012.00032
Madan, C. R. (2015). Creating 3D visualizations of MRI data: A brief guide. F1000Research, 4.
https://doi.org/10.12688/f1000research.6838.1
Maldjian, J. A., Laurienti, P. J., Kraft, R. A., & Burdette, J. H. (2003). An automated method for
neuroanatomic and cytoarchitectonic atlas-based interrogation of fMRI data sets.
NeuroImage, 19(3), 1233–1239.
Manuel, J. I., Martinson, M. L., Bledsoe-Mansori, S. E., & Bellamy, J. L. (2012). The influence
of stress and social support on depressive symptoms in mothers with young children.
Social Science & Medicine, 75(11), 2013–2020.
https://doi.org/10.1016/j.socscimed.2012.07.034
Marder, E., & Goaillard, J.-M. (2006). Variability, compensation and homeostasis in neuron and
network function. Nature Reviews Neuroscience, 7(7), 563–574.
https://doi.org/10.1038/nrn1949
Markowitz, A. J. (2017). Associations Between School Connection and Depressive Symptoms
From Adolescence Through Early Adulthood: Moderation by Early Adversity. Journal of
Research on Adolescence, 27(2), 298–311. https://doi.org/10.1111/jora.12275
Marusak, H. A., Etkin, A., & Thomason, M. E. (2015). Disrupted insula-based neural circuit
organization and conflict interference in trauma-exposed youth. NeuroImage: Clinical, 8,
516–525. https://doi.org/10.1016/j.nicl.2015.04.007
Marusak, H. A., Martin, K. R., Etkin, A., & Thomason, M. E. (2015). Childhood trauma
exposure disrupts the automatic regulation of emotional processing.

194
Neuropsychopharmacology: Official Publication of the American College of
Neuropsychopharmacology, 40(5), 1250–1258. https://doi.org/10.1038/npp.2014.311
Maslowsky, J., Jager, J., & Hemken, D. (2015). Estimating and interpreting latent variable
interactions: A tutorial for applying the latent moderated structural equations method.
International Journal of Behavioral Development, 39(1), 87–96.
https://doi.org/10.1177/0165025414552301
Masten, A. S. (2001). Ordinary magic. Resilience processes in development. The American
Psychologist, 56(3), 227–238.
Masten, A. S., Burt, K. B., Roisman, G. I., Obradović, J., Long, J. D., & Tellegen, A. (2004).
Resources and resilience in the transition to adulthood: Continuity and change.
Development and Psychopathology, 16(4), 1071–1094.
Masten, A. S., & Cicchetti, D. (2010). Developmental cascades. Development and
Psychopathology, 22(3), 491–495. https://doi.org/10.1017/S0954579410000222
Masten, A. S., & Cicchetti, D. (2016). Resilience in Development: Progress and Transformation.
In Developmental Psychopathology (pp. 1–63). American Cancer Society.
https://doi.org/10.1002/9781119125556.devpsy406
Masten, A. S., Neemann, J., & Andenas, S. (1994). Life events and adjustment in adolescents:
The significance of event independence, desirability, and chronicity. Journal of Research
on Adolescence, 4(1), 71–97. https://doi.org/10.1207/s15327795jra0401_5
McCarthy, P. (2019). FSLeyes. Zenodo. https://doi.org/10.5281/zenodo.3530921
McCarty, R. (2016). Learning about stress: Neural, endocrine and behavioral adaptations. Stress,
19(5), 449–475. https://doi.org/10.1080/10253890.2016.1192120
195
McCrory, E. J., Brito, S. A. D., Sebastian, C. L., Mechelli, A., Bird, G., Kelly, P. A., & Viding,
E. (2011). Heightened neural reactivity to threat in child victims of family violence.
Current Biology, 21(23), R947–R948. https://doi.org/10.1016/j.cub.2011.10.015
McCrory, E. J., Gerin, M. I., & Viding, E. (2017). Annual Research Review: Childhood
maltreatment, latent vulnerability and the shift to preventative psychiatry – the
contribution of functional brain imaging. Journal of Child Psychology and Psychiatry,
n/a-n/a. https://doi.org/10.1111/jcpp.12713
McEwen, B. S. (1998). Stress, Adaptation, and Disease: Allostasis and Allostatic Load. Annals
of the New York Academy of Sciences, 840(1), 33–44. https://doi.org/10.1111/j.1749-
6632.1998.tb09546.x
McEwen, B. S. (2012). Brain on stress: How the social environment gets under the skin.
Proceedings of the National Academy of Sciences of the United States of America, 109
Suppl 2, 17180–17185. https://doi.org/10.1073/pnas.1121254109
McEwen, B. S. (2016). In pursuit of resilience: Stress, epigenetics, and brain plasticity. Annals of
the New York Academy of Sciences, 1373(1), 56–64. https://doi.org/10.1111/nyas.13020
McLaughlin, K. A., Costello, E. J., Leblanc, W., Sampson, N. A., & Kessler, R. C. (2012).
Socioeconomic status and adolescent mental disorders. American Journal of Public
Health, 102(9), 1742–1750. https://doi.org/10.2105/AJPH.2011.300477
McLaughlin, K. A., Greif Green, J., Gruber, M. J., Sampson, N. A., Zaslavsky, A. M., & Kessler,
R. C. (2012). Childhood adversities and first onset of psychiatric disorders in a national
sample of US adolescents. Archives of General Psychiatry, 69(11), 1151–1160.
https://doi.org/10.1001/archgenpsychiatry.2011.2277

196
McLaughlin, K. A., & Sheridan, M. A. (2016). Beyond Cumulative Risk: A Dimensional
Approach to Childhood Adversity. Current Directions in Psychological Science, 25(4),
239–245. https://doi.org/10.1177/0963721416655883
McLaughlin, K. A., Sheridan, M. A., & Lambert, H. K. (2014). Childhood adversity and neural
development: Deprivation and threat as distinct dimensions of early experience.
Neuroscience & Biobehavioral Reviews, 47, 578–591.
https://doi.org/10.1016/j.neubiorev.2014.10.012
McLaughlin, K. A., Sheridan, M., Humphreys, K., Belsky, J., & Ellis, B. J. (in press). The Value
of Dimensional Models of Early Experience: Thinking Clearly about Concepts and
Categories. Perspectives on Psychological Science. https://doi.org/10.31234/osf.io/29fmt
McLaughlin, K. A., Weissman, D., & Bitrán, D. (2019). Childhood Adversity and Neural
Development: A Systematic Review. Annual Review of Developmental Psychology, 1(1),
277–312. https://doi.org/10.1146/annurev-devpsych-121318-084950
McLoyd, V. C. (1998). Socioeconomic disadvantage and child development. American
Psychologist, 53(2), 185–204. https://doi.org/10.1037/0003-066X.53.2.185
McLoyd, V. C., Purtell, K. M., & Hardaway, C. R. (2015). Race, Class, and Ethnicity in Young
Adulthood. In Handbook of Child Psychology and Developmental Science (pp. 1–53).
American Cancer Society. https://doi.org/10.1002/9781118963418.childpsy310
McNeely, C. A., Nonnemaker, J. M., & Blum, R. W. (2002). Promoting School Connectedness:
Evidence from the National Longitudinal Study of Adolescent Health. Journal of School
Health, 72(4), 138–146. https://doi.org/10.1111/j.1746-1561.2002.tb06533.x
Meadows, D. H. (2008). Thinking in systems: A primer. chelsea green publishing.

197
Menon, V. (2011). Large-scale brain networks and psychopathology: A unifying triple network
model. Trends in Cognitive Sciences, 15(10), 483–506.
https://doi.org/10.1016/j.tics.2011.08.003
Merikangas, K. R., He, J.-P., Burstein, M., Swanson, S. A., Avenevoli, S., Cui, L., Benjet, C.,
Georgiades, K., & Swendsen, J. (2010). Lifetime prevalence of mental disorders in U.S.
adolescents: Results from the National Comorbidity Survey Replication--Adolescent
Supplement (NCS-A). Journal of the American Academy of Child and Adolescent
Psychiatry, 49(10), 980–989. https://doi.org/10.1016/j.jaac.2010.05.017
Merrick, M. T., Ford, D. C., Ports, K. A., & Guinn, A. S. (2018). Prevalence of Adverse
Childhood Experiences From the 2011-2014 Behavioral Risk Factor Surveillance System
in 23 States. JAMA Pediatrics, 172(11), 1038–1044.
https://doi.org/10.1001/jamapediatrics.2018.2537
Miller, A. B., Machlin, L., McLaughlin, K. A., & Sheridan, M. A. (2020). Deprivation and
psychopathology in the Fragile Families Study: A 15-year longitudinal investigation.
Journal of Child Psychology and Psychiatry, n/a(n/a). https://doi.org/10.1111/jcpp.13260
Miller, A. B., Sheridan, M. A., Hanson, J. L., McLaughlin, K. A., Bates, J. E., Lansford, J. E.,
Pettit, G. S., & Dodge, K. A. (2018). Dimensions of deprivation and threat,
psychopathology, and potential mediators: A multi-year longitudinal analysis. Journal of
Abnormal Psychology, 127(2), 160–170. https://doi.org/10.1037/abn0000331
Molenaar, P. C. M. (2004). A Manifesto on Psychology as Idiographic Science: Bringing the
Person Back Into Scientific Psychology, This Time Forever. Measurement:
Interdisciplinary Research and Perspectives, 2(4), 201–218.
https://doi.org/10.1207/s15366359mea0204_1

198
Morenoff, J., Sampson, R., & Raudenbush, S. (2001). Neighborhood Inequality, Collective
Efficacy, and the Spatial Dynamics of Urban Violence. Criminology, 39, 517–560.
Muthén, L. K., & Muthén, B. O. (1998). Mplus User’s Guide (8th ed.). Muthén & Muthén.
National Research Council (US) & Institute of Medicine (US) Board on Children, Youth, and
Families. (2001). Vulnerability, Risk, and Protection. In B. Fischhoff, E. O. Nightingale,
& J. G. Iannotta (Eds.), Adolescent Risk and Vulnerability: Concepts and Measurement.
National Academies Press (US). https://www.ncbi.nlm.nih.gov/books/NBK223737/
Nave, K.-A., & Werner, H. B. (2014). Myelination of the Nervous System: Mechanisms and
Functions. Annual Review of Cell and Developmental Biology, 30(1), 503–533.
https://doi.org/10.1146/annurev-cellbio-100913-013101
Nelson, C. A., & Gabard-Durnam, L. J. (2020). Early Adversity and Critical Periods:
Neurodevelopmental Consequences of Violating the Expectable Environment. Trends in
Neurosciences, 43(3), 133–143. https://doi.org/10.1016/j.tins.2020.01.002
Nosek, B. A., Ebersole, C. R., DeHaven, A. C., & Mellor, D. T. (2018). The preregistration
revolution. Proceedings of the National Academy of Sciences, 201708274.
https://doi.org/10.1073/pnas.1708274114
Nusslock, R., & Miller, G. E. (2016). Early-Life Adversity and Physical and Emotional Health
across the Lifespan: A Neuro-Immune Network Hypothesis. Biological Psychiatry, 80(1),
23–32. https://doi.org/10.1016/j.biopsych.2015.05.017
Oliver, M. L., Shapiro, T. M., & Shapiro, T. (2006). Black Wealth, White Wealth: A New
Perspective on Racial Inequality. Taylor & Francis.

199
Olson, I. R., Heide, R. J. V. D., Alm, K. H., & Vyas, G. (2015). Development of the uncinate
fasciculus: Implications for theory and developmental disorders. Developmental
Cognitive Neuroscience, 14, 50–61. https://doi.org/10.1016/j.dcn.2015.06.003
Ozbay, F., Johnson, D. C., Dimoulas, E., Morgan, C. A., Charney, D., & Southwick, S. (2007).
Social Support and Resilience to Stress. Psychiatry (Edgmont), 4(5), 35–40.
Ozer, E. J. (2005). The Impact of Violence on Urban Adolescents: Longitudinal Effects of
Perceived School Connection and Family Support. Journal of Adolescent Research,
20(2), 167–192. https://doi.org/10.1177/0743558404273072
Park, S., Lee, J.-M., Kim, J.-W., Kwon, H., Cho, S.-C., Han, D. H., Cheong, J. H., & Kim, B.-N.
(2016). Increased white matter connectivity in traumatized children with attention deficit
hyperactivity disorder. Psychiatry Research: Neuroimaging, 247, 57–63.
https://doi.org/10.1016/j.pscychresns.2015.09.012
Pavlakis, A. E., Noble, K., Pavlakis, S. G., Ali, N., & Frank, Y. (2015). Brain imaging and
electrophysiology biomarkers: Is there a role in poverty and education outcome research?
Pediatric Neurology, 52(4), 383–388. https://doi.org/10.1016/j.pediatrneurol.2014.11.005
Peckins, M. K., Roberts, A. G., Hein, T. C., Hyde, L. W., Mitchell, C., Brooks-Gunn, J.,
McLanahan, S. S., Monk, C. S., & Lopez-Duran, N. L. (2019). Violence exposure and
social deprivation is associated with cortisol reactivity in urban adolescents.
Psychoneuroendocrinology, 104426. https://doi.org/10.1016/j.psyneuen.2019.104426
Pessoa, L. (2018). Understanding emotion with brain networks. Current Opinion in Behavioral
Sciences, 19, 19–25. https://doi.org/10.1016/j.cobeha.2017.09.005

200
Petersen, A. C., Crockett, L., Richards, M., & Boxer, A. (1988). A self-report measure of
pubertal status: Reliability, validity, and initial norms. Journal of Youth and Adolescence,
17(2), 117–133. https://doi.org/10.1007/BF01537962
Petrides, M., & Pandya, D. N. (2002). Comparative cytoarchitectonic analysis of the human and
the macaque ventrolateral prefrontal cortex and corticocortical connection patterns in the
monkey. European Journal of Neuroscience, 16(2), 291–310.
https://doi.org/10.1046/j.1460-9568.2001.02090.x
Phelps, E. A., & LeDoux, J. E. (2005). Contributions of the amygdala to emotion processing:
From animal models to human behavior. Neuron, 48(2), 175–187.
Philip, N. S., Sweet, L. H., Tyrka, A. R., Carpenter, S. L., Albright, S. E., Price, L. H., &
Carpenter, L. L. (2016). Exposure to childhood trauma is associated with altered n-back
activation and performance in healthy adults: Implications for a commonly used working
memory task. Brain Imaging and Behavior, 10(1), 124–135.
https://doi.org/10.1007/s11682-015-9373-9
Philip, N. S., Sweet, L. H., Tyrka, A. R., Price, L. H., Bloom, R. F., & Carpenter, L. L. (2013).
Decreased Default Network Connectivity is Associated with Early Life Stress in
Medication-Free Healthy Adults. European Neuropsychopharmacology : The Journal of
the European College of Neuropsychopharmacology, 23(1), 24–32.
https://doi.org/10.1016/j.euroneuro.2012.10.008
Philip, N. S., Sweet, L. H., Tyrka, A. R., Price, L. H., Carpenter, L. L., Kuras, Y. I., Clark, U. S.,
& Niaura, R. S. (2013). Early Life Stress is Associated with Greater Default Network
Deactivation During Working Memory in Healthy Controls: A Preliminary Report. Brain
Imaging and Behavior, 7(2), 204–212. https://doi.org/10.1007/s11682-012-9216-x

201
Phillips, M., Ladouceur, C., & Drevets, W. (2008). A neural model of voluntary and automatic
emotion regulation: Implications for understanding the pathophysiology and
neurodevelopment of bipolar disorder. Molecular Psychiatry, 13(9), 829–857.
https://doi.org/10.1038/mp.2008.65
Power, J. D., Barnes, K. A., Snyder, A. Z., Schlaggar, B. L., & Petersen, S. E. (2012). Spurious
but systematic correlations in functional connectivity MRI networks arise from subject
motion. NeuroImage, 59(3), 2142–2154.
https://doi.org/10.1016/j.neuroimage.2011.10.018
Power, J. D., Fair, D. A., Schlaggar, B. L., & Petersen, S. E. (2010). The development of Human
Functional Brain Networks. Neuron, 67(5), 735–748.
https://doi.org/10.1016/j.neuron.2010.08.017
Preacher, K. J., Curran, P. J., & Bauer, D. J. (2006). Computational Tools for Probing
Interactions in Multiple Linear Regression, Multilevel Modeling, and Latent Curve
Analysis. Journal of Educational and Behavioral Statistics, 31(4), 437–448.
https://doi.org/10.3102/10769986031004437
Preacher, K. J., Rucker, D. D., & Hayes, A. F. (2007). Addressing Moderated Mediation
Hypotheses: Theory, Methods, and Prescriptions. Multivariate Behavioral Research,
42(1), 185–227. https://doi.org/10.1080/00273170701341316
Price, R. B., Lane, S., Gates, K., Kraynak, T. E., Horner, M. S., Thase, M. E., & Siegle, G. J.
(2017). Parsing Heterogeneity in the Brain Connectivity of Depressed and Healthy Adults
During Positive Mood. Biological Psychiatry, 81(4), 347–357.
https://doi.org/10.1016/j.biopsych.2016.06.023

202
Proctor, L. J. (2006). Children growing up in a violent community: The role of the family.
Aggression and Violent Behavior, 11(6), 558–576.
https://doi.org/10.1016/j.avb.2005.12.004
Pruim, R. H. R., Mennes, M., van Rooij, D., Llera, A., Buitelaar, J. K., & Beckmann, C. F.
(2015). ICA-AROMA: A robust ICA-based strategy for removing motion artifacts from
fMRI data. NeuroImage, 112(Supplement C), 267–277.
https://doi.org/10.1016/j.neuroimage.2015.02.064
Public Data Documentation | Fragile Families and Child Wellbeing Study. (2019).
https://fragilefamilies.princeton.edu/data-and-documentation/public-data-documentation
Puetz, V. B., Parker, D., Kohn, N., Dahmen, B., Verma, R., & Konrad, K. (2017). Altered brain
network integrity after childhood maltreatment: A structural connectomic DTI-study.
Human Brain Mapping, 38(2), 855–868. https://doi.org/10.1002/hbm.23423
Radloff, L. S. (1977). The CES-D Scale: A self-report depression scale for research in the
general population. https://doi.org/10.1177/014662167700100306
Raichle, M. E., & Mintun, M. A. (2006). Brain Work and Brain Imaging. Annual Review of
Neuroscience, 29(1), 449–476. https://doi.org/10.1146/annurev.neuro.29.051605.112819
Rangel, A., Camerer, C., & Montague, P. R. (2008). A framework for studying the neurobiology
of value-based decision making. Nature Reviews Neuroscience, 9(7), 545–556.
https://doi.org/10.1038/nrn2357
Ray, R., & Zald, D. H. (2012). Anatomical insights into the interaction of emotion and cognition
in the prefrontal cortex. Neuroscience and Biobehavioral Reviews, 36(1), 479–501.
https://doi.org/10.1016/j.neubiorev.2011.08.005

203
Reichman, N. E., Teitler, J. O., Garfinkel, I., & McLanahan, S. S. (2001). Fragile Families:
Sample and design. Children and Youth Services Review, 23(4), 303–326.
https://doi.org/10.1016/S0190-7409(01)00141-4
Resnick, M. D., Bearman, P. S., Blum, R. W., Bauman, K. E., Harris, K. M., Jones, J., Tabor, J.,
Beuhring, T., Sieving, R. E., Shew, M., Ireland, M., Bearinger, L. H., & Udry, J. R.
(1997). Protecting Adolescents From Harm: Findings From the National Longitudinal
Study on Adolescent Health. JAMA, 278(10), 823–832.
https://doi.org/10.1001/jama.1997.03550100049038
Richmond, S., Johnson, K. A., Seal, M. L., Allen, N. B., & Whittle, S. (2016). Development of
brain networks and relevance of environmental and genetic factors: A systematic review.
Neuroscience & Biobehavioral Reviews, 71, 215–239.
https://doi.org/10.1016/j.neubiorev.2016.08.024
Rivas‐Drake, D., Seaton, E. K., Markstrom, C., Quintana, S., Syed, M., Lee, R. M., Schwartz, S.
J., Umaña‐Taylor, A. J., French, S., & Yip, T. (2014). Ethnic and Racial Identity in
Adolescence: Implications for Psychosocial, Academic, and Health Outcomes. Child
Development, 85(1), 40–57. https://doi.org/10.1111/cdev.12200
Roberts, S. O., & Rizzo, M. T. (2020). The psychology of American racism. American
Psychologist, No Pagination Specified-No Pagination Specified.
https://doi.org/10.1037/amp0000642
Roeser, R. W., Eccles, J. S., & Sameroff, A. J. (2000). School as a Context of Early Adolescents’
Academic and Social-Emotional Development: A Summary of Research Findings. The
Elementary School Journal, 100(5), 443–471.

204
Rothstein, R. (2017). The color of law: A forgotten history of how our government segregated
America. Liveright.
Rubinov, M., & Sporns, O. (2010). Complex network measures of brain connectivity: Uses and
interpretations. NeuroImage, 52(3), 1059–1069.
https://doi.org/10.1016/j.neuroimage.2009.10.003
Sacks, V., & Murphy, D. (2018). The prevalence of adverse childhood experiences, nationally,
by state, and by race or ethnicity. https://www.childtrends.org/publications/prevalence-
adverse-childhood-experiences-nationally-state-race-ethnicity
Sameroff, A. J. (1999). Ecological perspectives on developmental risk. In J. D. Osofsky & H. E.
Fitzgerald (Eds.), WAIMH Handbook of infant mental health: Vol 4. Infant mental health
groups at risk (pp. 223–248). Wiley.
Sameroff, A. J. (2010). A Unified Theory of Development: A Dialectic Integration of Nature and
Nurture. Child Development, 81(1), 6–22. https://doi.org/10.1111/j.1467-
8624.2009.01378.x
Sameroff, A. J., Seifer, R., Zax, M., & Barocas, R. (1987). Early Indicators of Developmental
Risk: Rochester Longitudinal Study. Schizophrenia Bulletin, 13(3), 383–394.
https://doi.org/10.1093/schbul/13.3.383
Satorra, A., & Bentler, P. M. (2010). Ensuring Positiveness of the Scaled Difference Chi-square
Test Statistic. Psychometrika, 75(2), 243–248. https://doi.org/10.1007/s11336-009-9135-
y
Schermelleh-engel, K., Moosbrugger, H., & Müller, H. (2003). Evaluating the fit of structural
equation models: Tests of significance and descriptive goodness-offit measures. Methods
of Psychological Research, 23–74.

205
Schilling, E. A., Aseltine, R. H., & Gore, S. (2008). The impact of cumulative childhood
adversity on young adult mental health: Measures, models, and interpretations. Social
Science & Medicine (1982), 66(5), 1140–1151.
https://doi.org/10.1016/j.socscimed.2007.11.023
Seeley, W. W., Menon, V., Schatzberg, A. F., Keller, J., Glover, G. H., Kenna, H., Reiss, A. L.,
& Greicius, M. D. (2007). Dissociable Intrinsic Connectivity Networks for Salience
Processing and Executive Control. The Journal of Neuroscience: The Official Journal of
the Society for Neuroscience, 27(9), 2349–2356.
https://doi.org/10.1523/JNEUROSCI.5587-06.2007
Shaw, D. S., Gilliom, M., Ingoldsby, E. M., & Nagin, D. S. (2003). Trajectories leading to
school-age conduct problems. Developmental Psychology, 39(2), 189–200.
https://doi.org/10.1037/0012-1649.39.2.189
Shaw, D. S., Hyde, L. W., & Brennan, L. M. (2012). Early predictors of boys’ antisocial
trajectories. Development and Psychopathology, 24(3), 871–888.
https://doi.org/10.1017/S0954579412000429
Sheather, S. (2009). A modern approach to regression with R. Springer Science & Business
Media.
Sherbondy, A. J., Dougherty, R. F., Ben-Shachar, M., Napel, S., & Wandell, B. A. (2008).
ConTrack: Finding the most likely pathways between brain regions using diffusion
tractography. Journal of Vision, 8(9), 15–15. https://doi.org/10.1167/8.9.15
Sheridan, M. A., & McLaughlin, K. A. (2014). Dimensions of early experience and neural
development: Deprivation and threat. Trends in Cognitive Sciences, 18(11), 580–585.
https://doi.org/10.1016/j.tics.2014.09.001

206
Sheridan, M. A., McLaughlin, K. A., Winter, W., Fox, N., Zeanah, C., & Nelson, C. A. (2018).
Early deprivation disruption of associative learning is a developmental pathway to
depression and social problems. Nature Communications, 9(1), 1–8.
https://doi.org/10.1038/s41467-018-04381-8
Sheridan, M. A., Peverill, M., Finn, A. S., & McLaughlin, K. A. (2017). Dimensions of
childhood adversity have distinct associations with neural systems underlying executive
functioning. Development and Psychopathology, 29(5), 1777–1794.
https://doi.org/10.1017/S0954579417001390
Simmons, J., Nelson, L., & Simonsohn, U. (in press). Pre-registration: Why and How. Journal of
Consumer Psychology, n/a(n/a). https://doi.org/10.1002/jcpy.1208
Smith, G. T., Atkinson, E. A., Davis, H. A., Riley, E. N., & Oltmanns, J. R. (2020). The General
Factor of Psychopathology. Annual Review of Clinical Psychology, 16(1), 75–98.
https://doi.org/10.1146/annurev-clinpsy-071119-115848
Smith, K. E., & Pollak, S. D. (2020). Rethinking Concepts and Categories for Understanding the
Neurodevelopmental Effects of Childhood Adversity: Perspectives on Psychological
Science. https://doi.org/10.1177/1745691620920725
Smith, S. M. (2002). Fast robust automated brain extraction. Human Brain Mapping, 17(3), 143–
155.
Smith, S. M. (2012). The future of FMRI connectivity. NeuroImage, 62(2), 1257–1266.
https://doi.org/10.1016/j.neuroimage.2012.01.022
Smith, S. M., Jenkinson, M., Johansen-Berg, H., Rueckert, D., Nichols, T. E., Mackay, C. E.,
Watkins, K. E., Ciccarelli, O., Cader, M. Z., Matthews, P. M., & Behrens, T. E. J. (2006).

207
Tract-based spatial statistics: Voxelwise analysis of multi-subject diffusion data.
NeuroImage, 31(4), 1487–1505. https://doi.org/10.1016/j.neuroimage.2006.02.024
Song, M.-K., Lin, F.-C., Ward, S. E., & Fine, J. P. (2013). Composite variables: When and how.
Nursing Research, 62(1), 45–49. https://doi.org/10.1097/NNR.0b013e3182741948
Sonuga‐Barke, E. J., Schlotz, W., & Kreppner, J. (2010). V. Differentiating Developmental
Trajectories for Conduct, Emotion, and Peer Problems Following Early Deprivation.
Monographs of the Society for Research in Child Development, 75(1), 102–124.
https://doi.org/10.1111/j.1540-5834.2010.00552.x
Sörbom, D. (1989). Model modification. Psychometrika, 54(3), 371–384.
https://doi.org/10.1007/BF02294623
Sporns, O. (2010). Networks of the Brain. MIT Press.
Sridharan, D., Levitin, D. J., & Menon, V. (2008). A critical role for the right fronto-insular
cortex in switching between central-executive and default-mode networks. Proceedings
of the National Academy of Sciences of the United States of America, 105(34), 12569–
12574. https://doi.org/10.1073/pnas.0800005105
Sroufe, L. A. (2009). The Concept of Development in Developmental Psychopathology. Child
Development Perspectives, 3(3), 178–183. https://doi.org/10.1111/j.1750-
8606.2009.00103.x
Stevens, M. C. (2009). The developmental cognitive neuroscience of functional connectivity.
Brain and Cognition, 70(1), 1–12. https://doi.org/10.1016/j.bandc.2008.12.009
Straus, M. A., Hamby, S. L., Finkelhor, D., Moore, D. W., & Runyan, D. (1998). Identification
of Child Maltreatment With the Parent-Child Conflict Tactics Scales: Development and

208
Psychometric Data for a National Sample of American Parents. Child Abuse & Neglect,
22(4), 249–270. https://doi.org/10.1016/S0145-2134(97)00174-9
Supekar, K., Musen, M., & Menon, V. (2009). Development of Large-Scale Functional Brain
Networks in Children. PLOS Biology, 7(7), e1000157.
https://doi.org/10.1371/journal.pbio.1000157
Swanson, L. W., & Lichtman, J. W. (2016). From Cajal to Connectome and Beyond. Annual
Review of Neuroscience, 39(1), 197–216. https://doi.org/10.1146/annurev-neuro-071714-
033954
Swartz, J. R., Carrasco, M., Wiggins, J. L., Thomason, M. E., & Monk, C. S. (2014). Age-related
changes in the structure and function of prefrontal cortex-amygdala circuitry in children
and adolescents: A multi-modal imaging approach. NeuroImage, 86, 212–220.
https://doi.org/10.1016/j.neuroimage.2013.08.018
Swartz, J. R., Wiggins, J. L., Carrasco, M., Lord, C., & Monk, C. S. (2013). Amygdala
Habituation and Prefrontal Functional Connectivity in Youth With Autism Spectrum
Disorders. Journal of the American Academy of Child & Adolescent Psychiatry, 52(1),
84–93. https://doi.org/10.1016/j.jaac.2012.10.012
Teicher, M. H., Anderson, C. M., Ohashi, K., & Polcari, A. (2014). Childhood maltreatment:
Altered network centrality of cingulate, precuneus, temporal pole and insula. Biological
Psychiatry, 76(4), 297–305. https://doi.org/10.1016/j.biopsych.2013.09.016
Teicher, M. H., & Samson, J. A. (2016). Annual Research Review: Enduring neurobiological
effects of childhood abuse and neglect. Journal of Child Psychology and Psychiatry, and
Allied Disciplines, 57(3), 241–266. https://doi.org/10.1111/jcpp.12507

209
Teicher, M. H., Samson, J. A., Anderson, C. M., & Ohashi, K. (2016). The effects of childhood
maltreatment on brain structure, function and connectivity. Nature Reviews
Neuroscience, 17(10), 652–666. https://doi.org/10.1038/nrn.2016.111
Thapar, A., & Rutter, M. (2019). Do natural experiments have an important future in the study of
mental disorders? Psychological Medicine, 49(7), 1079–1088.
https://doi.org/10.1017/S0033291718003896
The Panel Study of Income Dynamics Child Development Supplement: User Guide for CDS-III.
(2010). http://psidonline.isr.umich.edu/CDS/questionnaires/cds-iii/child.pdf
Thomas, D. E., & Stevenson, H. (2009). Gender Risks and Education: The Particular Classroom
Challenges for Urban Low-Income African American Boys. Review of Research in
Education, 33(1), 160–180. https://doi.org/10.3102/0091732X08327164
Thomason, M. E., Dennis, E. L., Joshi, A. A., Joshi, S. H., Dinov, I. D., Chang, C., Henry, M. L.,
Johnson, R. F., Thompson, P. M., Toga, A. W., Glover, G. H., Van Horn, J. D., & Gotlib,
I. H. (2011). Resting-state fMRI can reliably map neural networks in children.
NeuroImage, 55(1), 165–175. https://doi.org/10.1016/j.neuroimage.2010.11.080
Thomason, M. E., & Marusak, H. A. (2017). Toward understanding the impact of trauma on the
early developing human brain. Neuroscience, 342, 55–67.
https://doi.org/10.1016/j.neuroscience.2016.02.022
Tolwinski, K. (2019). Fraught claims at the intersection of biology and sociality: Managing
controversy in the neuroscience of poverty and adversity. Social Studies of Science,
49(2), 141–161. https://doi.org/10.1177/0306312719839149
Trentacosta, C. J., Hyde, L. W., Goodlett, B. D., & Shaw, D. S. (2013). Longitudinal Prediction
of Disruptive Behavior Disorders in Adolescent Males from Multiple Risk Domains.

210
Child Psychiatry & Human Development, 44(4), 561–572.
https://doi.org/10.1007/s10578-012-0349-3
Uddin, L. Q. (2017a). Chapter 3—Functions of the Salience Network. In Salience Network of the
Human Brain (pp. 11–16). Academic Press. https://doi.org/10.1016/B978-0-12-804593-
0.00003-5
Uddin, L. Q. (2017b). Chapter 5—Salience Network Dysfunction. In Salience Network of the
Human Brain (pp. 23–28). Academic Press. https://doi.org/10.1016/B978-0-12-804593-
0.00005-9
Uddin, L. Q., & Menon, V. (2010). Introduction to Special Topic – Resting-State Brain Activity:
Implications for Systems Neuroscience. Frontiers in Systems Neuroscience, 4.
https://doi.org/10.3389/fnsys.2010.00037
U.S. Census Bureau. (2020). How the Census Bureau Measures Poverty. The United States
Census Bureau. https://www.census.gov/topics/income-
poverty/poverty/guidance/poverty-measures.html
van der Werff, S. J. A., Pannekoek, J. N., Veer, I. M., van Tol, M.-J., Aleman, A., Veltman, D.
J., Zitman, F. G., Rombouts, S. a. R. B., Elzinga, B. M., & van der Wee, N. J. A. (2013).
Resting-state functional connectivity in adults with childhood emotional maltreatment.
Psychological Medicine, 43(9), 1825–1836. https://doi.org/10.1017/S0033291712002942
Varnum, M. E., & Kitayama, S. (2017). The neuroscience of social class. Current Opinion in
Psychology, 18, 147–151. https://doi.org/10.1016/j.copsyc.2017.07.032
Veraart, J., Novikov, D. S., Christiaens, D., Ades-aron, B., Sijbers, J., & Fieremans, E. (2016).
Denoising of diffusion MRI using random matrix theory. NeuroImage, 142, 394–406.
https://doi.org/10.1016/j.neuroimage.2016.08.016

211
Voight, A., Hanson, T., O’Malley, M., & Adekanye, L. (2015). The Racial School Climate Gap:
Within-School Disparities in Students’ Experiences of Safety, Support, and
Connectedness. American Journal of Community Psychology, 56(3–4), 252–267.
https://doi.org/10.1007/s10464-015-9751-x
Wiggins, J. L., Mitchell, C., Hyde, L. W., & Monk, C. S. (2015). Identifying early pathways of
risk and resilience: The codevelopment of internalizing and externalizing symptoms and
the role of harsh parenting. Development and Psychopathology, 27(4pt1), 1295–1312.
https://doi.org/10.1017/S0954579414001412
Wiggins, J. L., & Monk, C. S. (2013). A translational neuroscience framework for the
development of socioemotional functioning in health and psychopathology. Development
and Psychopathology, 25(4pt2), 1293–1309.
https://doi.org/10.1017/S095457941300062X
Wolf, S., & Suntheimer, N. M. (2019). A dimensional risk approach to assessing early adversity
in a national sample. Journal of Applied Developmental Psychology, 62, 270–281.
https://doi.org/10.1016/j.appdev.2019.03.004
Wood, D., Kaplan, R., & McLoyd, V. C. (2007). Gender Differences in the Educational
Expectations of Urban, Low-Income African American Youth: The Role of Parents and
the School. Journal of Youth and Adolescence, 36(4), 417–427.
https://doi.org/10.1007/s10964-007-9186-2
Wright, M. O., Masten, A. S., & Narayan, A. J. (2013). Resilience processes in development:
Four waves of research on positive adaptation in the context of adversity. In Handbook of
resilience in children, 2nd ed (pp. 15–37). Springer Science + Business Media.
https://doi.org/10.1007/978-1-4614-3661-4_2

212
Yarkoni, T., Poldrack, R. A., Nichols, T. E., Essen, D. C. V., & Wager, T. D. (2011). Large-scale
automated synthesis of human functional neuroimaging data. Nature Methods, 8(8), 665–
670. https://doi.org/10.1038/nmeth.1635
Zhang, S., & Anderson, S. G. (2010). Low-income single mothers’ community violence
exposure and aggressive parenting practices. Children and Youth Services Review, 32(6),
889–895. https://doi.org/10.1016/j.childyouth.2010.02.010
Zhang, Y., Brady, M., & Smith, S. (2001). Segmentation of brain MR images through a hidden
Markov random field model and the expectation-maximization algorithm. IEEE
Transactions on Medical Imaging, 20(1), 45–57. https://doi.org/10.1109/42.906424
Zikopoulos, B., Höistad, M., John, Y., & Barbas, H. (2017). Posterior Orbitofrontal and Anterior
Cingulate Pathways to the Amygdala Target Inhibitory and Excitatory Systems with
Opposite Functions. Journal of Neuroscience, 37(20), 5051–5064.
https://doi.org/10.1523/JNEUROSCI.3940-16.2017
Copyright © 2022 FDOKUMEN