Briefing Note – Scottish Index of Multiple Deprivation, 2020
28
1 Briefing Note – Scottish Index of Multiple Deprivation, 2020 Strategy and Insight City of Edinburgh Council 9 March 2020 Background The Scottish Index of Multiple Deprivation (SIMD) is one of the key tools for identifying concentrations of deprivation in Scotland. The 2020 SIMD is the latest iteration of the dataset, which is updated approximately every three to four years. Since its creation, SIMD has been widely used by Scottish Government and public sector bodies to allocate resources to areas of particular need. Within a council context, the data is an important resource and toolkit to support the development of strategies and service plans. While the dataset has some clear limitations, as explained below, it is well-respected and referenced by community organisations and the media. In 2011, the UK Statistics Authority designated SIMD as National Statistics. This briefing gives an overview of the SIMD 2020 data at a citywide, locality and ward level. 1. Further information can be found on the Scottish Government website. 2. A breakdown of Locality by Ward and areas can be found in Appendix A Use of SIMD SIMD provides information for small areas across Scotland, breaking every local authority down into a number of data zones – a data zone is a geographic area that usually has a population of between 500 and 1,000. Weighted indicators, which represent the different sides of deprivation such as pupil performance, travel times to the GP, crime, and unemployment, are grouped into seven domain areas: income, employment, health, education, housing, access to services, and crime. The full list of indicators will be available when the technical note for the SIMD 2020 dataset is released. However the indicators making up SIMD 2020 have remained broadly unchanged since SIMD 2016. The main changes are: 1. the education domain now includes the Skills Development Scotland participation measure instead of the proportion of 16-19 year olds not in education, employment or training indicator based on DWP data. 2. the access to services domain now includes a digital connectivity indicator 3. the income and employment domains have been updated to reflect on-going changes to the welfare system and remain broadly comparable with earlier indices.
-
Upload
khangminh22 -
Category
Documents
-
view
3 -
download
0
Transcript of Briefing Note – Scottish Index of Multiple Deprivation, 2020
1
Briefing Note – Scottish Index of Multiple
Deprivation, 2020
Strategy and Insight
City of Edinburgh Council
9 March 2020
Background
The Scottish Index of Multiple Deprivation (SIMD) is one of the key tools for identifying
concentrations of deprivation in Scotland. The 2020 SIMD is the latest iteration of the dataset,
which is updated approximately every three to four years.
Since its creation, SIMD has been widely used by Scottish Government and public sector
bodies to allocate resources to areas of particular need. Within a council context, the data is
an important resource and toolkit to support the development of strategies and service plans.
While the dataset has some clear limitations, as explained below, it is well-respected and
referenced by community organisations and the media. In 2011, the UK Statistics Authority
designated SIMD as National Statistics.
This briefing gives an overview of the SIMD 2020 data at a citywide, locality and ward level.
1. Further information can be found on the Scottish Government website.
2. A breakdown of Locality by Ward and areas can be found in Appendix A
Use of SIMD
SIMD provides information for small areas across Scotland, breaking every local authority
down into a number of data zones – a data zone is a geographic area that usually has a
population of between 500 and 1,000.
Weighted indicators, which represent the different sides of deprivation such as pupil
performance, travel times to the GP, crime, and unemployment, are grouped into seven
domain areas: income, employment, health, education, housing, access to services, and
crime. The full list of indicators will be available when the technical note for the SIMD 2020
dataset is released. However the indicators making up SIMD 2020 have remained broadly
unchanged since SIMD 2016. The main changes are:
1. the education domain now includes the Skills Development Scotland participation
measure instead of the proportion of 16-19 year olds not in education, employment or
training indicator based on DWP data.
2. the access to services domain now includes a digital connectivity indicator
3. the income and employment domains have been updated to reflect on-going changes
to the welfare system and remain broadly comparable with earlier indices.
2
Of the seven domains, the most important are income and employment – together they have
more weight than the other domains combine. Appendix B provides the weightings assigned
to each of the seven domains.
SIMD provides a relative ranking of deprivation. It is possible to use SIMD to determine
whether an area is, for example, ranked among the 5%, 10% or 20% most deprived nationally
or locally; it is also possible to compare two or more areas and say which is more deprived.
Limitations
SIMD identifies deprived areas - not people. Not everyone who is deprived lives in a deprived
area. Equally, people who are not deprived may live in a deprived area.
SIMD does not provide absolute ratings for deprivation, and because of this it is not possible
to say how much more deprived one area is compared to another, or to provide average
scores of deprivation for multiple data zones. Because a combination of domains are used to
determine relative ranking, this also means that two data zones with similar ranks can have
very different issues.
Direct comparison of individual data zones between 2020 and previous iterations of SIMD is
not possible because changes are relative and may not reflect actual changes in the
neighbourhood.
Due to ward boundary changes, introduced by the Electoral Commission in April 2016, ward
level comparisons are not possible between this SIMD dataset and previous ones. All maps
shown in this document are aligned to the ward boundaries as set in April 2016.
This change in ward boundaries in Edinburgh led to 20% of the data zones in Edinburgh lying
across the ward boundaries. For this analysis, each of the data zones which lie across
multiple ward boundaries has been looked at and assigned to the ward where most of the
housing within that data zone falls.
3
SIMD 2020 – Edinburgh’s Results
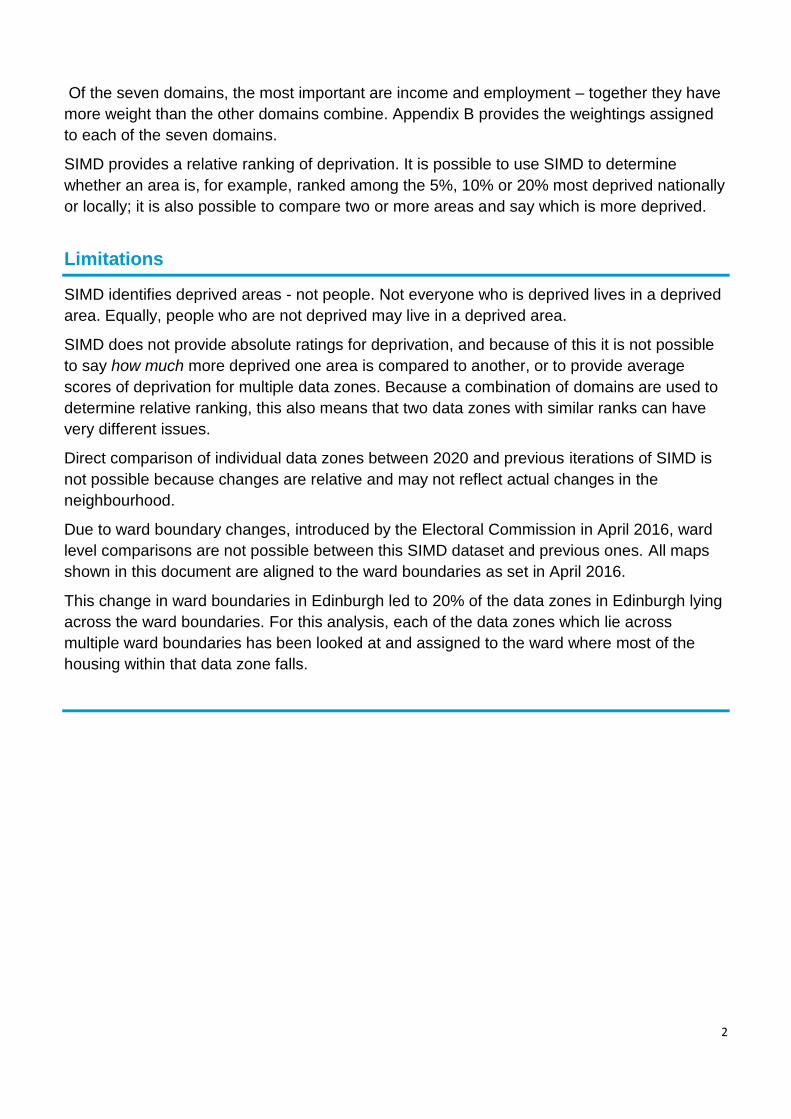
1. The map below shows the distribution of deprived areas within Edinburgh using
the new SIMD 2020 data. Darker colours represent the more deprived areas, with
concentrations of deprived areas notable in all four Localities across the City.
Map 1 - SIMD 2020 Rank by Edinburgh Locality
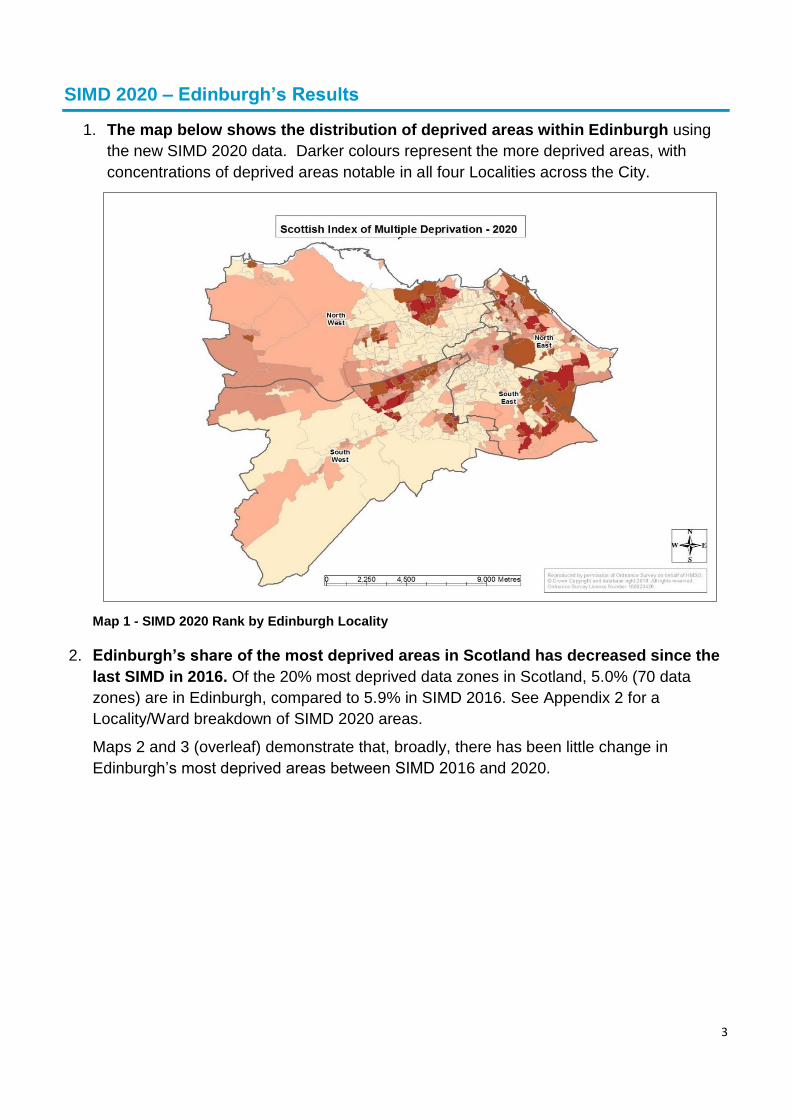
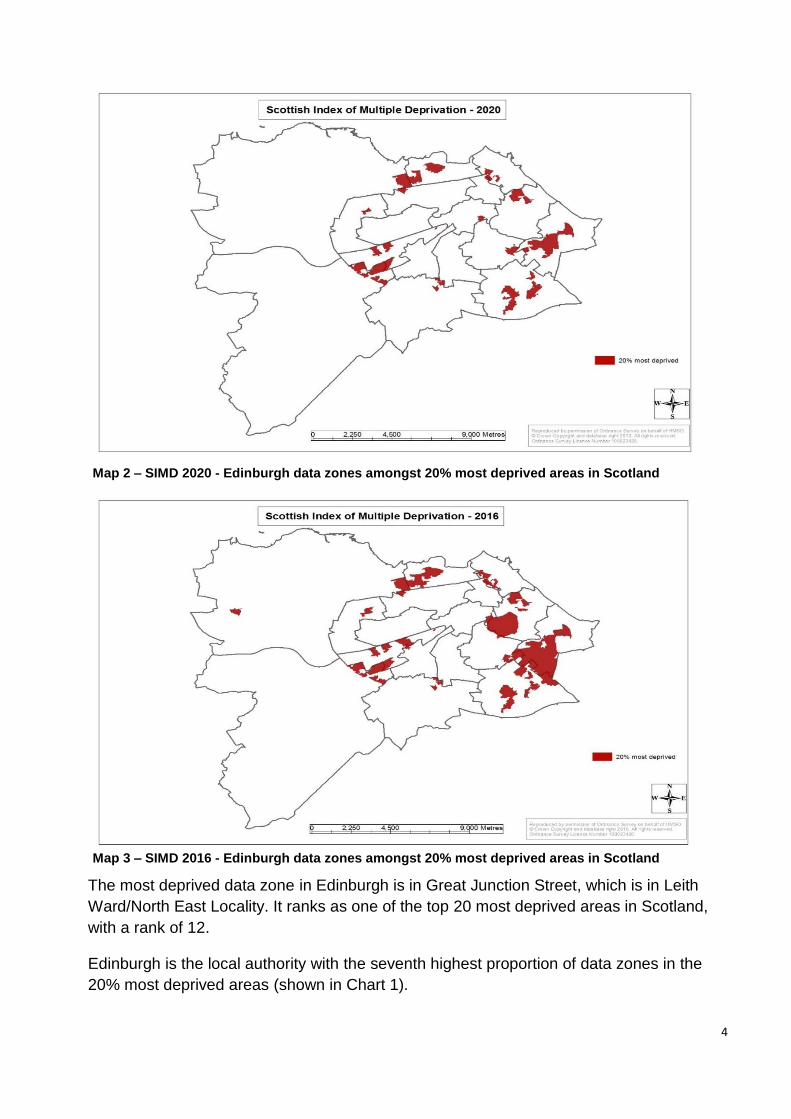
2. Edinburgh’s share of the most deprived areas in Scotland has decreased since the
last SIMD in 2016. Of the 20% most deprived data zones in Scotland, 5.0% (70 data
zones) are in Edinburgh, compared to 5.9% in SIMD 2016. See Appendix 2 for a
Locality/Ward breakdown of SIMD 2020 areas.
Maps 2 and 3 (overleaf) demonstrate that, broadly, there has been little change in
Edinburgh’s most deprived areas between SIMD 2016 and 2020.
4
Map 2 – SIMD 2020 - Edinburgh data zones amongst 20% most deprived areas in Scotland
Map 3 – SIMD 2016 - Edinburgh data zones amongst 20% most deprived areas in Scotland
The most deprived data zone in Edinburgh is in Great Junction Street, which is in Leith
Ward/North East Locality. It ranks as one of the top 20 most deprived areas in Scotland,
with a rank of 12.
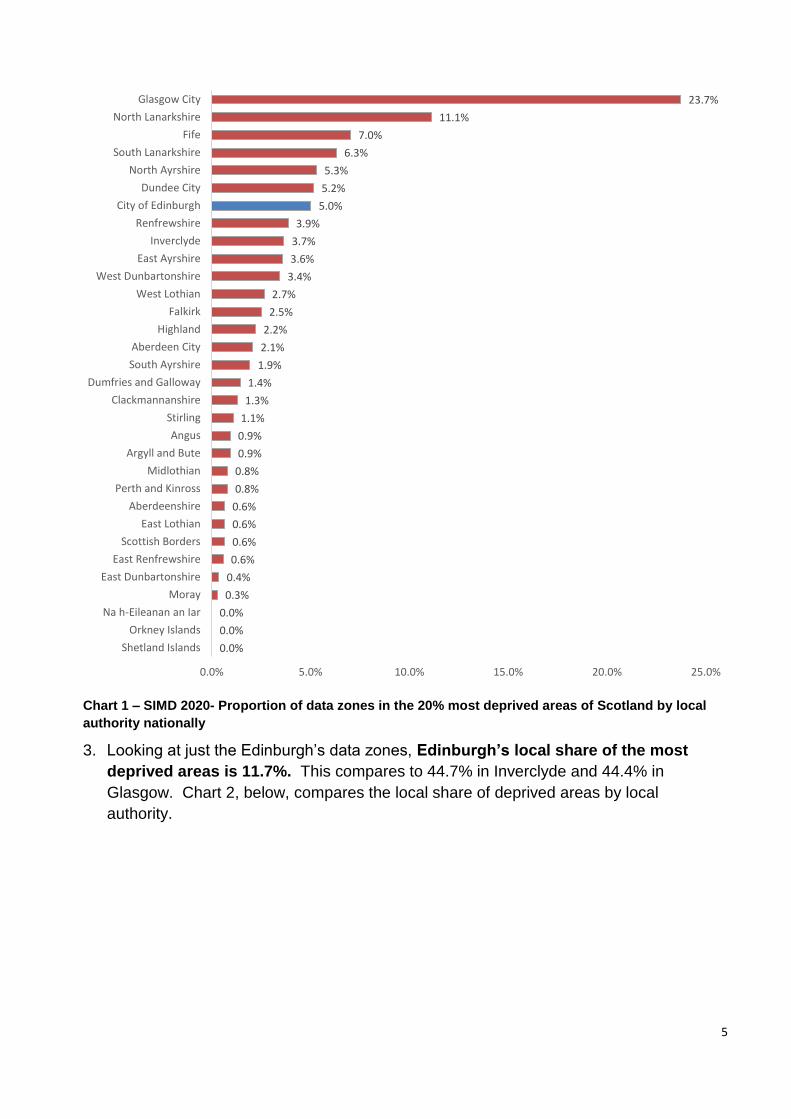
Edinburgh is the local authority with the seventh highest proportion of data zones in the
20% most deprived areas (shown in Chart 1).
5
Chart 1 – SIMD 2020- Proportion of data zones in the 20% most deprived areas of Scotland by local
authority nationally
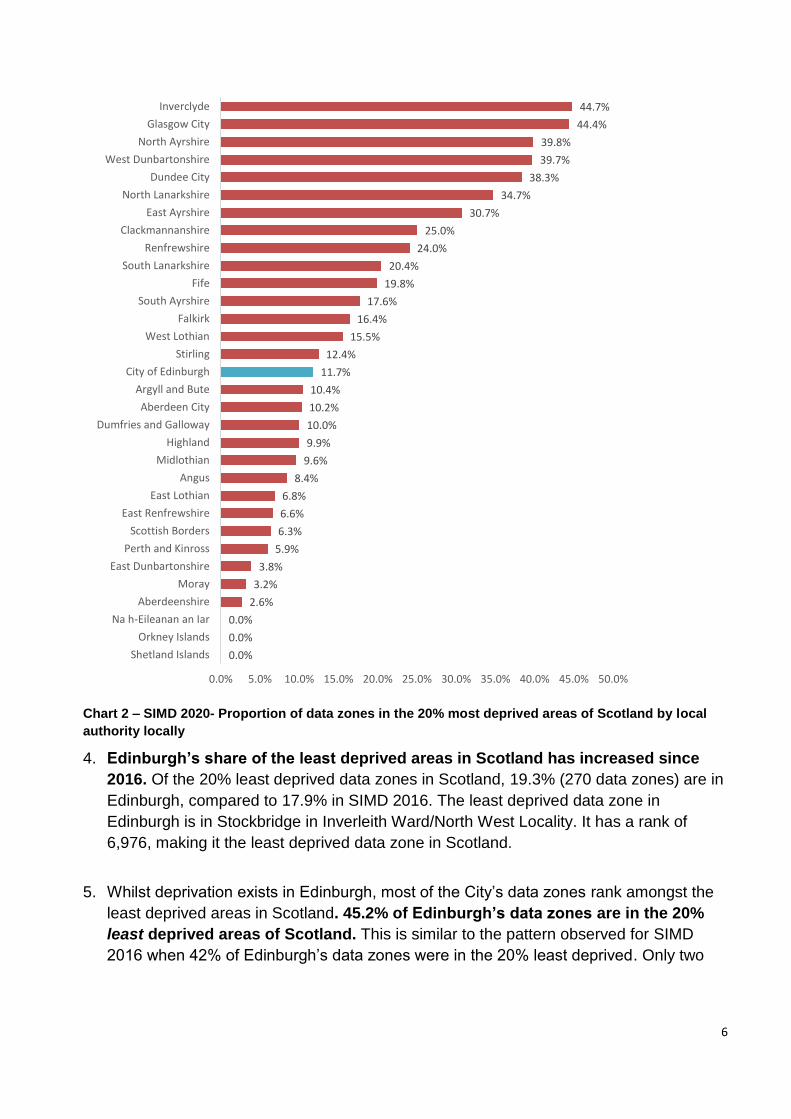
3. Looking at just the Edinburgh’s data zones, Edinburgh’s local share of the most
deprived areas is 11.7%. This compares to 44.7% in Inverclyde and 44.4% in
Glasgow. Chart 2, below, compares the local share of deprived areas by local
authority.
0.0%
0.0%
0.0%
0.3%
0.4%
0.6%
0.6%
0.6%
0.6%
0.8%
0.8%
0.9%
0.9%
1.1%
1.3%
1.4%
1.9%
2.1%
2.2%
2.5%
2.7%
3.4%
3.6%
3.7%
3.9%
5.0%
5.2%
5.3%
6.3%
7.0%
11.1%
23.7%
0.0% 5.0% 10.0% 15.0% 20.0% 25.0%
Shetland Islands
Orkney Islands
Na h-Eileanan an Iar
Moray
East Dunbartonshire
East Renfrewshire
Scottish Borders
East Lothian
Aberdeenshire
Perth and Kinross
Midlothian
Argyll and Bute
Angus
Stirling
Clackmannanshire
Dumfries and Galloway
South Ayrshire
Aberdeen City
Highland
Falkirk
West Lothian
West Dunbartonshire
East Ayrshire
Inverclyde
Renfrewshire
City of Edinburgh
Dundee City
North Ayrshire
South Lanarkshire
Fife
North Lanarkshire
Glasgow City
6
Chart 2 – SIMD 2020- Proportion of data zones in the 20% most deprived areas of Scotland by local
authority locally
4. Edinburgh’s share of the least deprived areas in Scotland has increased since
2016. Of the 20% least deprived data zones in Scotland, 19.3% (270 data zones) are in
Edinburgh, compared to 17.9% in SIMD 2016. The least deprived data zone in
Edinburgh is in Stockbridge in Inverleith Ward/North West Locality. It has a rank of
6,976, making it the least deprived data zone in Scotland.
5. Whilst deprivation exists in Edinburgh, most of the City’s data zones rank amongst the
least deprived areas in Scotland. 45.2% of Edinburgh’s data zones are in the 20%
least deprived areas of Scotland. This is similar to the pattern observed for SIMD
2016 when 42% of Edinburgh’s data zones were in the 20% least deprived. Only two
0.0%
0.0%
0.0%
2.6%
3.2%
3.8%
5.9%
6.3%
6.6%
6.8%
8.4%
9.6%
9.9%
10.0%
10.2%
10.4%
11.7%
12.4%
15.5%
16.4%
17.6%
19.8%
20.4%
24.0%
25.0%
30.7%
34.7%
38.3%
39.7%
39.8%
44.4%
44.7%
0.0% 5.0% 10.0% 15.0% 20.0% 25.0% 30.0% 35.0% 40.0% 45.0% 50.0%
Shetland Islands
Orkney Islands
Na h-Eileanan an Iar
Aberdeenshire
Moray
East Dunbartonshire
Perth and Kinross
Scottish Borders
East Renfrewshire
East Lothian
Angus
Midlothian
Highland
Dumfries and Galloway
Aberdeen City
Argyll and Bute
City of Edinburgh
Stirling
West Lothian
Falkirk
South Ayrshire
Fife
South Lanarkshire
Renfrewshire
Clackmannanshire
East Ayrshire
North Lanarkshire
Dundee City
West Dunbartonshire
North Ayrshire
Glasgow City
Inverclyde
7
other local authorities have a higher proportion of data zones in the 20% least deprived
areas of Scotland (East Dunbartonshire, 51.5%, and East Renfrewshire, 57.4%).
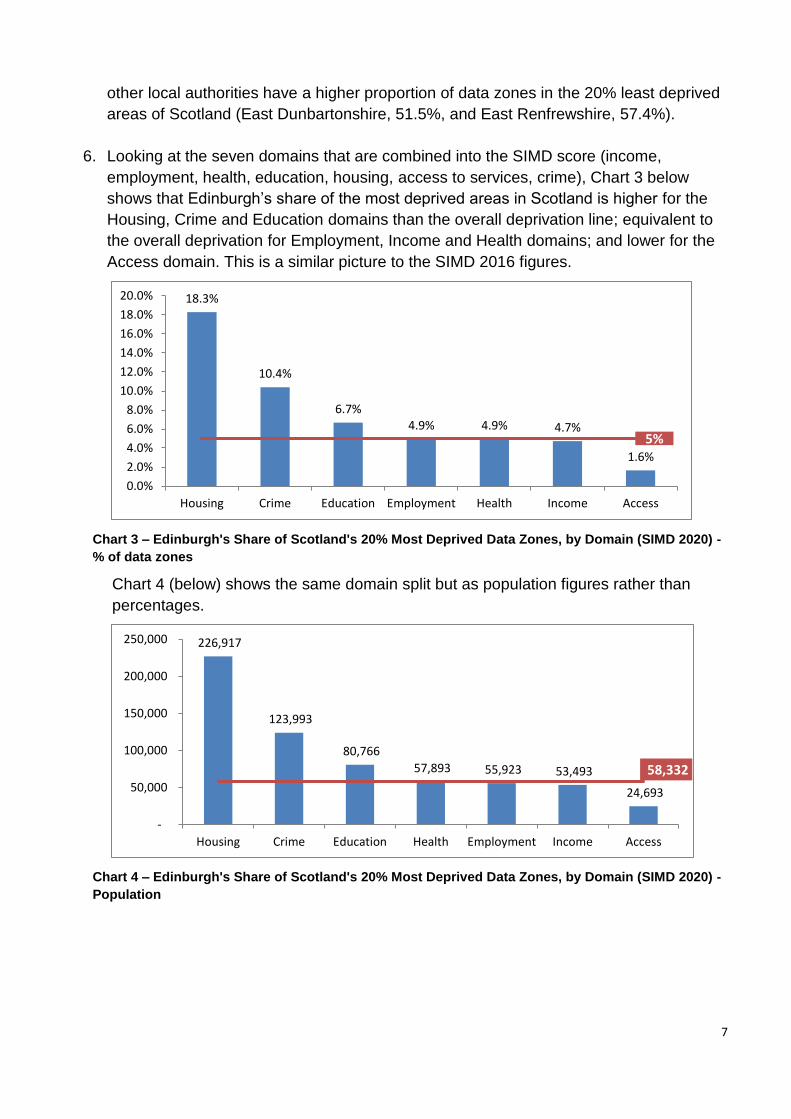
6. Looking at the seven domains that are combined into the SIMD score (income,
employment, health, education, housing, access to services, crime), Chart 3 below
shows that Edinburgh’s share of the most deprived areas in Scotland is higher for the
Housing, Crime and Education domains than the overall deprivation line; equivalent to
the overall deprivation for Employment, Income and Health domains; and lower for the
Access domain. This is a similar picture to the SIMD 2016 figures.
Chart 3 – Edinburgh's Share of Scotland's 20% Most Deprived Data Zones, by Domain (SIMD 2020) -
% of data zones
Chart 4 (below) shows the same domain split but as population figures rather than
percentages.
Chart 4 – Edinburgh's Share of Scotland's 20% Most Deprived Data Zones, by Domain (SIMD 2020) -
Population
18.3%
10.4%
6.7%4.9% 4.9% 4.7%
1.6%
5%
0.0%
2.0%
4.0%
6.0%
8.0%
10.0%
12.0%
14.0%
16.0%
18.0%
20.0%
Housing Crime Education Employment Health Income Access
226,917
123,993
80,766
57,893 55,923 53,493
24,693
58,332
-
50,000
100,000
150,000
200,000
250,000
Housing Crime Education Health Employment Income Access
8
SIMD 2020 – Locality Results
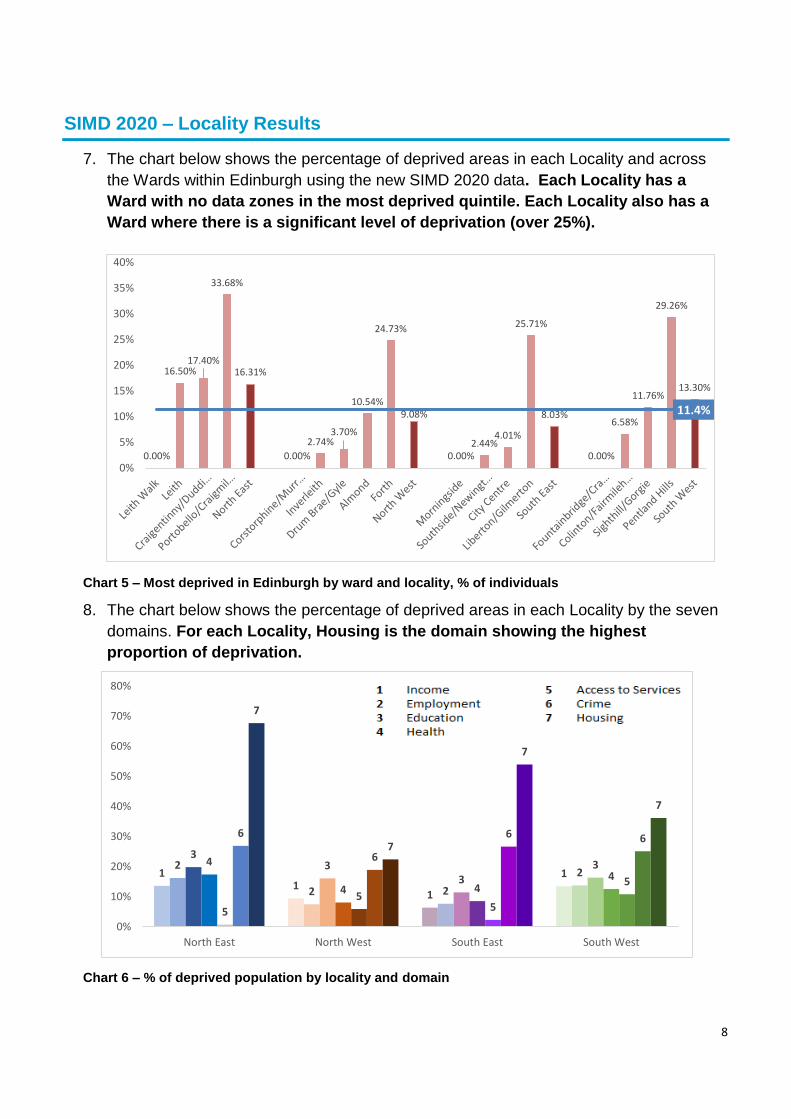
7. The chart below shows the percentage of deprived areas in each Locality and across
the Wards within Edinburgh using the new SIMD 2020 data. Each Locality has a
Ward with no data zones in the most deprived quintile. Each Locality also has a
Ward where there is a significant level of deprivation (over 25%).
Chart 5 – Most deprived in Edinburgh by ward and locality, % of individuals
8. The chart below shows the percentage of deprived areas in each Locality by the seven
domains. For each Locality, Housing is the domain showing the highest
proportion of deprivation.
Chart 6 – % of deprived population by locality and domain
0.00%
16.50%17.40%
33.68%
16.31%
0.00%
2.74%3.70%
10.54%
24.73%
9.08%
0.00%2.44%
4.01%
25.71%
8.03%
0.00%
6.58%
11.76%
29.26%
13.30%
11.4%
0%
5%
10%
15%
20%
25%
30%
35%
40%
11
1
12
2 2
2
33
334
4 44
5
55
5
6
6
6 6
7
7
7
7
0%
10%
20%
30%
40%
50%
60%
70%
80%
North East North West South East South West

9
SIMD 2020 – Ward Results
9. A single page summary of SIMD 2020 data for each Ward has been produced and can
be found in the following pages of this report.
10. Each Ward summary shows:
a. a chart showing the proportion of the data zones within the Ward by SIMD
deprivation quintiles.
b. a chart showing deprivation for the seven domains that make up the overall
SIMD figure for the Ward
c. and a map showing the deprivation quintiles for each data zone within the Ward.
Datazones that fall over ward boundaries are only shown in the map of the Ward
they have been allocated to for this briefing.
Next Steps
11. SIMD 2020 was officially published by the Scottish Government on 28 January 2020.
Additional information can be found on the Scottish Government website.
12. Further analysis of SIMD 2020 will be carried out by Strategy & Communications to
support the development of strategic plans. If you have any questions or would like any
specific analysis, please contact us.
13. This analysis of deprivation data comes in the context of ongoing wider analysis of
poverty and income inequality in Edinburgh, currently being undertaken by Strategy &
Communications.
Contact details
Laurence Rockey
Head of Strategy and Communications,
0131 469 3493,
Emma Morgan
Senior Change & Delivery officer,
0131 529 7598,
10
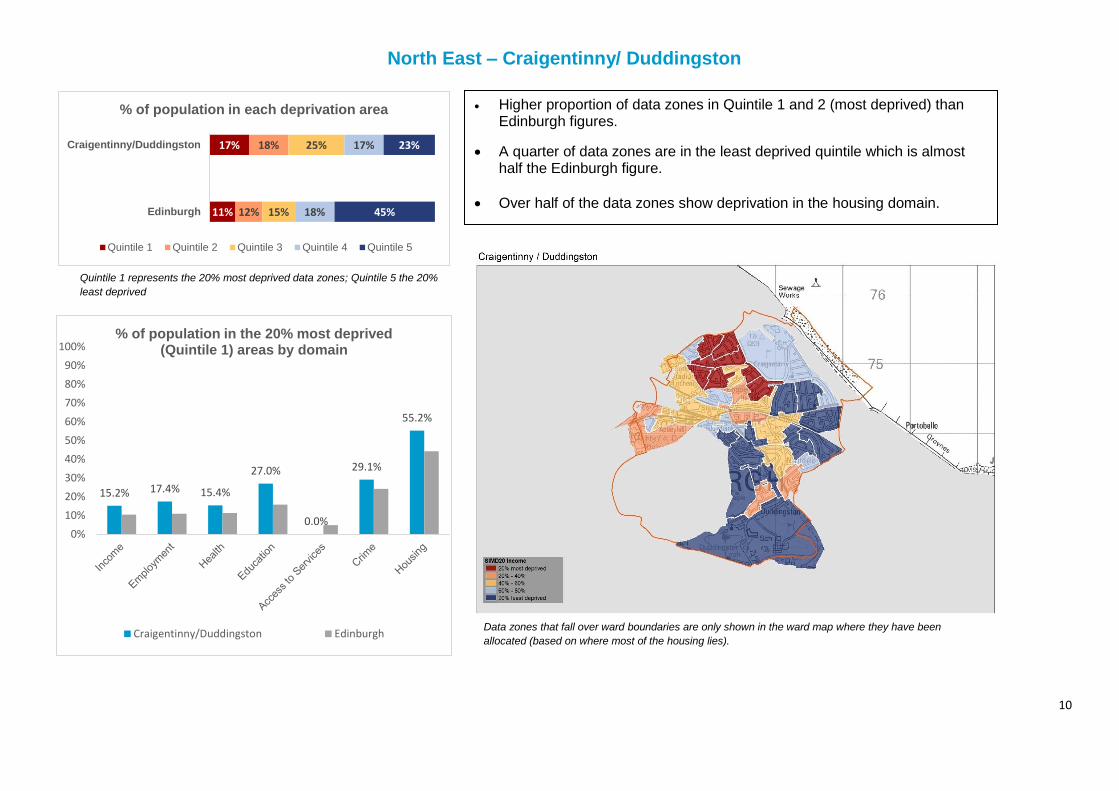
North East – Craigentinny/ Duddingston
15.2% 17.4% 15.4%
27.0%
0.0%
29.1%
55.2%
0%
10%
20%
30%
40%
50%
60%
70%
80%
90%
100%% of population in the 20% most deprived
(Quintile 1) areas by domain
Craigentinny/Duddingston Edinburgh
Quintile 1 represents the 20% most deprived data zones; Quintile 5 the 20%
least deprived
• Higher proportion of data zones in Quintile 1 and 2 (most deprived) than Edinburgh figures.
• A quarter of data zones are in the least deprived quintile which is almost half the Edinburgh figure.
• Over half of the data zones show deprivation in the housing domain.
Data zones that fall over ward boundaries are only shown in the ward map where they have been
allocated (based on where most of the housing lies).
17%
11%
18%
12%
25%
15%
17%
18%
23%
45%
Craigentinny/Duddingston
Edinburgh
% of population in each deprivation area
Quintile 1 Quintile 2 Quintile 3 Quintile 4 Quintile 5
11
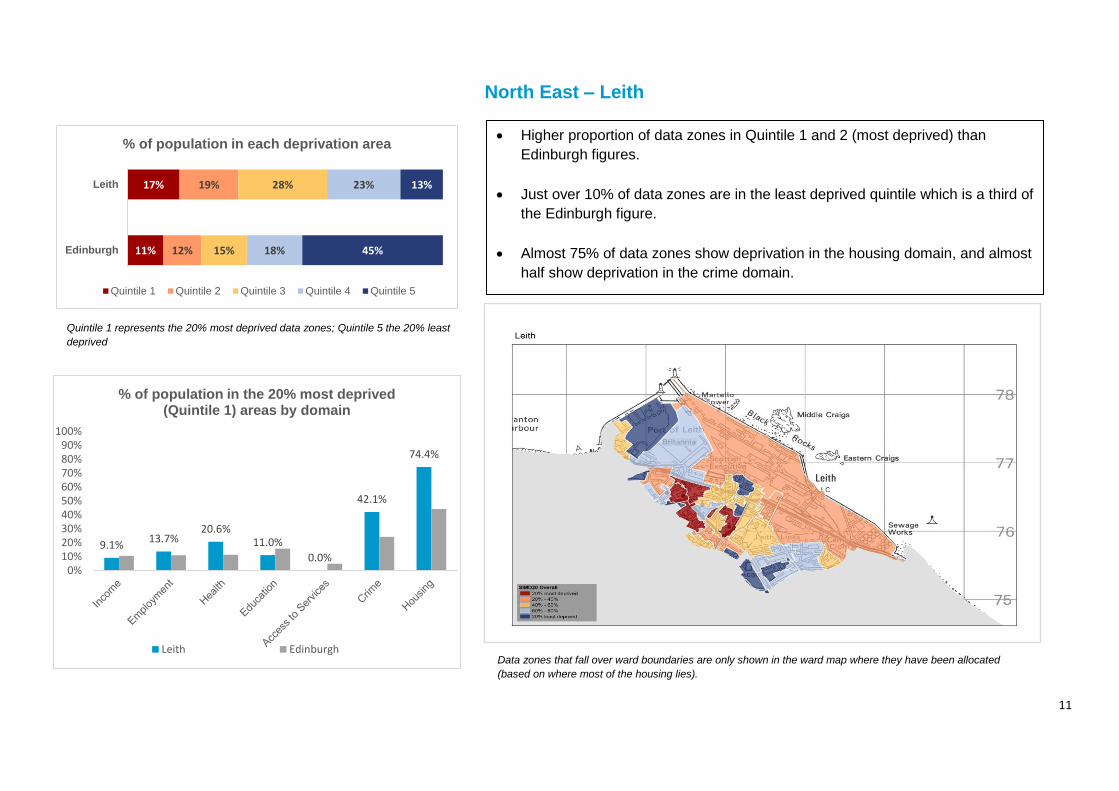
North East – Leith
Quintile 1 represents the 20% most deprived data zones; Quintile 5 the 20% least
deprived
• Higher proportion of data zones in Quintile 1 and 2 (most deprived) than
Edinburgh figures.
• Just over 10% of data zones are in the least deprived quintile which is a third of
the Edinburgh figure.
• Almost 75% of data zones show deprivation in the housing domain, and almost
half show deprivation in the crime domain.
17%
11%
19%
12%
28%
15%
23%
18%
13%
45%
Leith
Edinburgh
% of population in each deprivation area
Quintile 1 Quintile 2 Quintile 3 Quintile 4 Quintile 5
Data zones that fall over ward boundaries are only shown in the ward map where they have been allocated
(based on where most of the housing lies).
9.1%13.7%
20.6%11.0%
0.0%
42.1%
74.4%
0%10%20%30%40%50%60%70%80%90%
100%
% of population in the 20% most deprived (Quintile 1) areas by domain
Leith Edinburgh
12
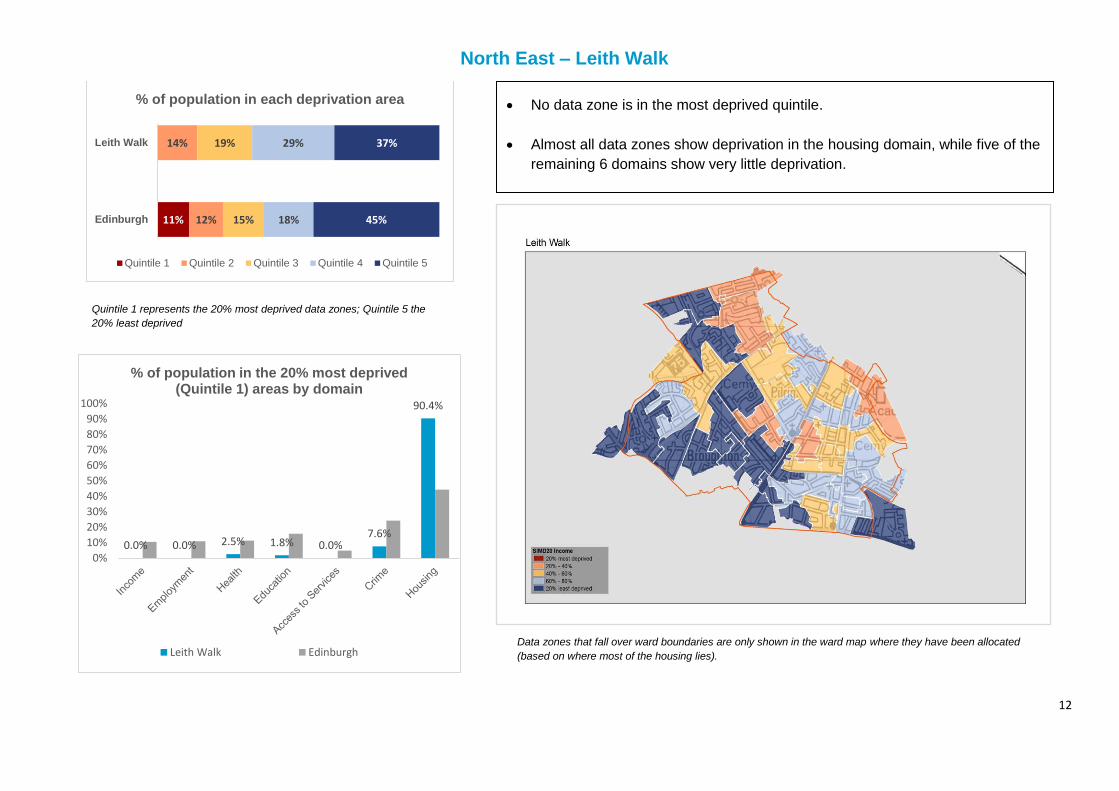
North East – Leith Walk
11%
14%
12%
19%
15%
29%
18%
37%
45%
Leith Walk
Edinburgh
% of population in each deprivation area
Quintile 1 Quintile 2 Quintile 3 Quintile 4 Quintile 5
Quintile 1 represents the 20% most deprived data zones; Quintile 5 the
20% least deprived
• No data zone is in the most deprived quintile.
• Almost all data zones show deprivation in the housing domain, while five of the
remaining 6 domains show very little deprivation.
Data zones that fall over ward boundaries are only shown in the ward map where they have been allocated
(based on where most of the housing lies).
0.0% 0.0% 2.5% 1.8% 0.0%7.6%
90.4%
0%
10%
20%
30%
40%
50%
60%
70%
80%
90%
100%
% of population in the 20% most deprived (Quintile 1) areas by domain
Leith Walk Edinburgh
13
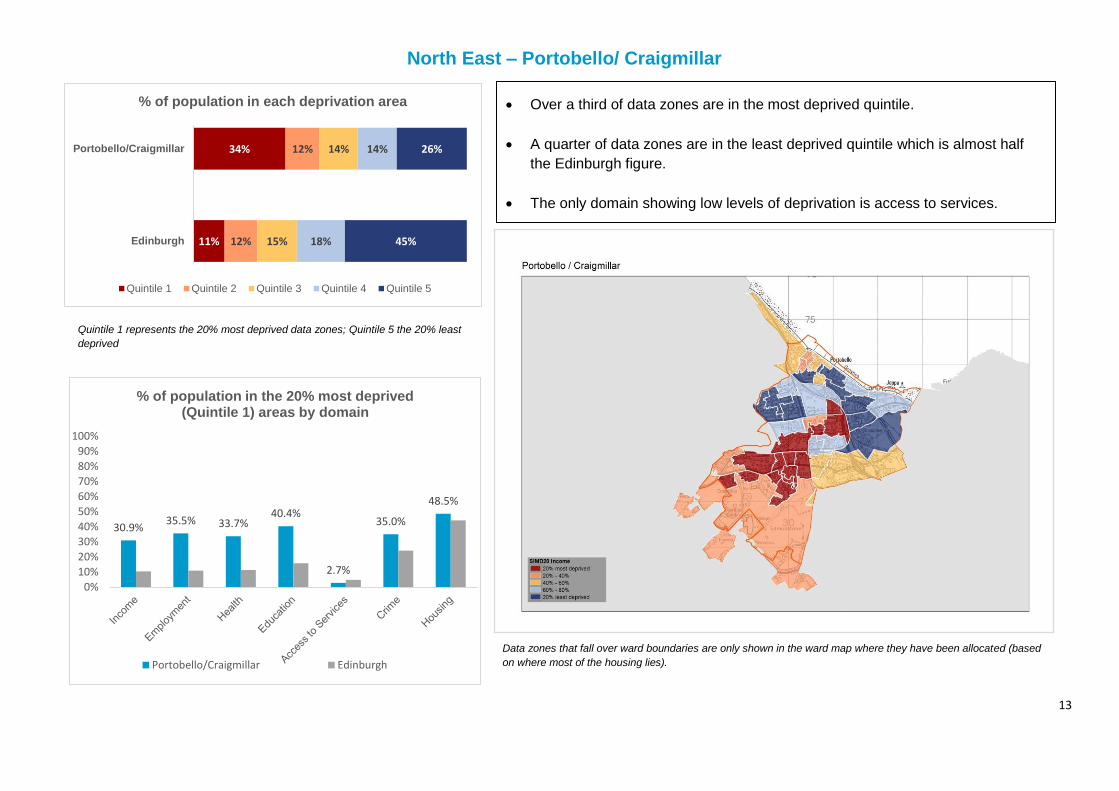
North East – Portobello/ Craigmillar
• Over a third of data zones are in the most deprived quintile.
• A quarter of data zones are in the least deprived quintile which is almost half
the Edinburgh figure.
• The only domain showing low levels of deprivation is access to services.
34%
11%
12%
12%
14%
15%
14%
18%
26%
45%
Portobello/Craigmillar
Edinburgh
% of population in each deprivation area
Quintile 1 Quintile 2 Quintile 3 Quintile 4 Quintile 5
30.9%35.5% 33.7%
40.4%
2.7%
35.0%
48.5%
0%
10%
20%
30%
40%
50%
60%
70%
80%
90%
100%
% of population in the 20% most deprived (Quintile 1) areas by domain
Portobello/Craigmillar Edinburgh
Quintile 1 represents the 20% most deprived data zones; Quintile 5 the 20% least
deprived
Data zones that fall over ward boundaries are only shown in the ward map where they have been allocated (based
on where most of the housing lies).
14
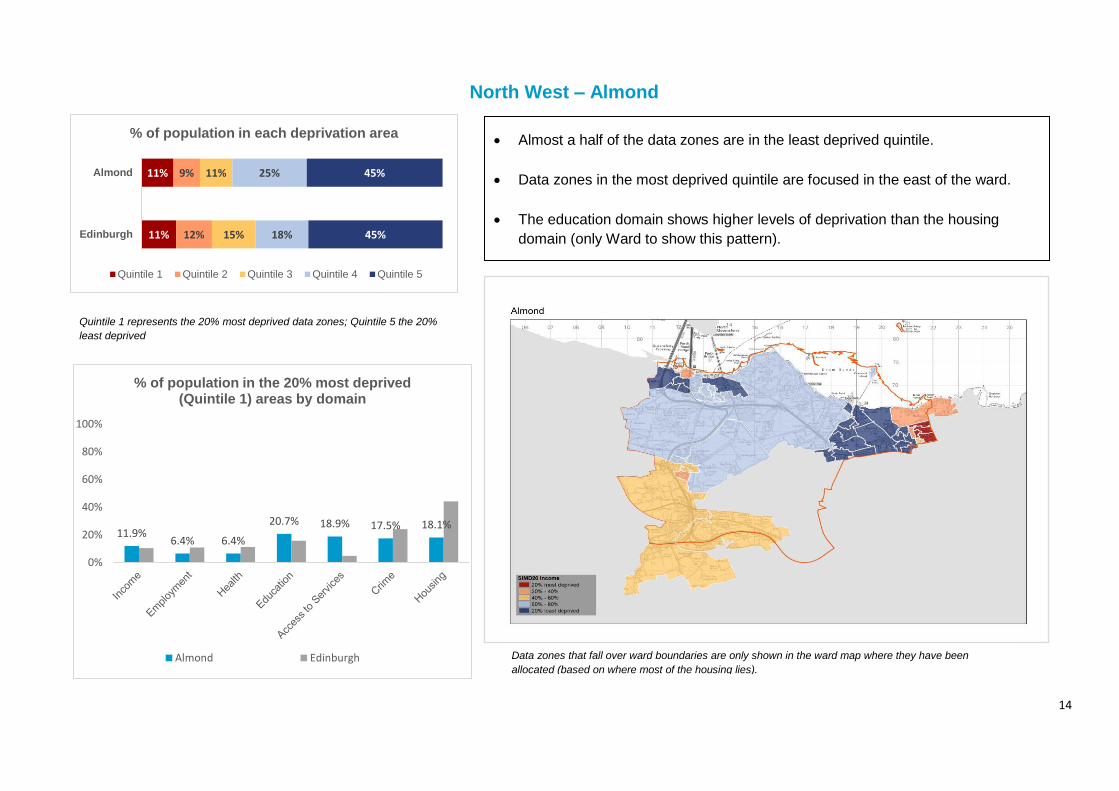
North West – Almond
11%
11%
9%
12%
11%
15%
25%
18%
45%
45%
Almond
Edinburgh
% of population in each deprivation area
Quintile 1 Quintile 2 Quintile 3 Quintile 4 Quintile 5
Quintile 1 represents the 20% most deprived data zones; Quintile 5 the 20%
least deprived
• Almost a half of the data zones are in the least deprived quintile.
• Data zones in the most deprived quintile are focused in the east of the ward.
• The education domain shows higher levels of deprivation than the housing
domain (only Ward to show this pattern).
Data zones that fall over ward boundaries are only shown in the ward map where they have been
allocated (based on where most of the housing lies).
11.9%6.4% 6.4%
20.7% 18.9% 17.5% 18.1%
0%
20%
40%
60%
80%
100%
% of population in the 20% most deprived (Quintile 1) areas by domain
Almond Edinburgh
15
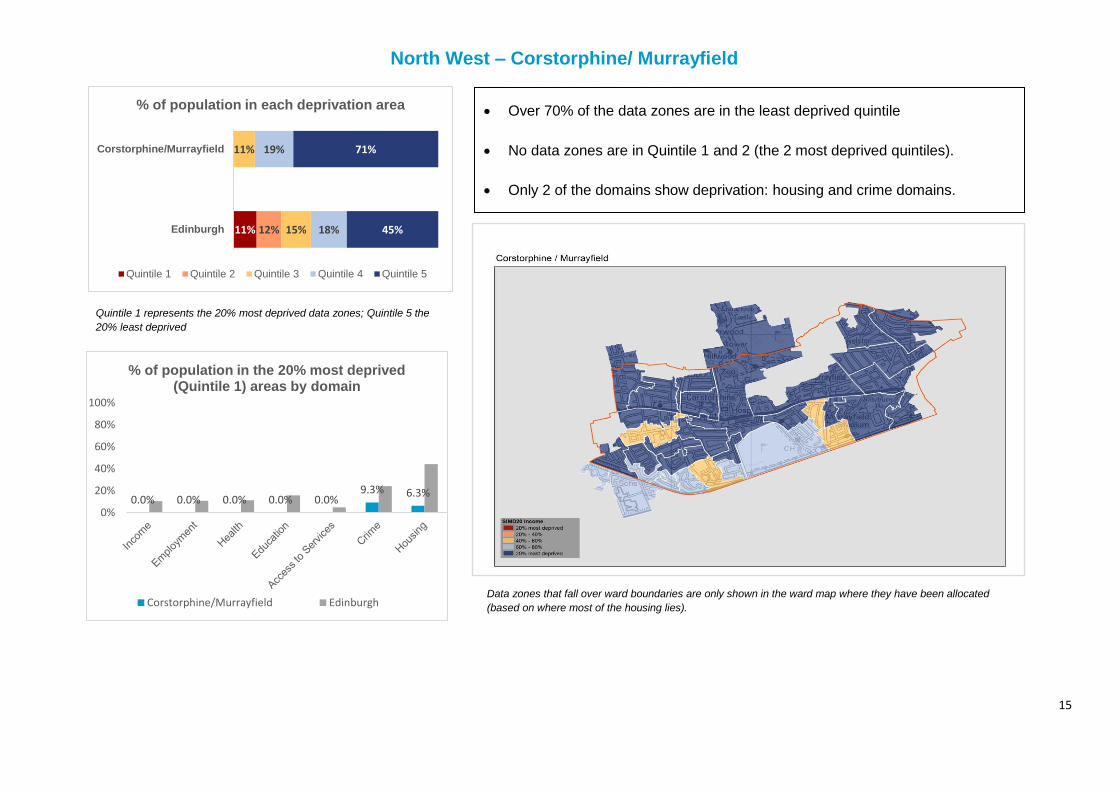
North West – Corstorphine/ Murrayfield
Quintile 1 represents the 20% most deprived data zones; Quintile 5 the
20% least deprived
• Over 70% of the data zones are in the least deprived quintile
• No data zones are in Quintile 1 and 2 (the 2 most deprived quintiles).
• Only 2 of the domains show deprivation: housing and crime domains.
11% 12%
11%
15%
19%
18%
71%
45%
Corstorphine/Murrayfield
Edinburgh
% of population in each deprivation area
Quintile 1 Quintile 2 Quintile 3 Quintile 4 Quintile 5
0.0% 0.0% 0.0% 0.0% 0.0%9.3% 6.3%
0%
20%
40%
60%
80%
100%
% of population in the 20% most deprived (Quintile 1) areas by domain
Corstorphine/Murrayfield EdinburghData zones that fall over ward boundaries are only shown in the ward map where they have been allocated
(based on where most of the housing lies).
16
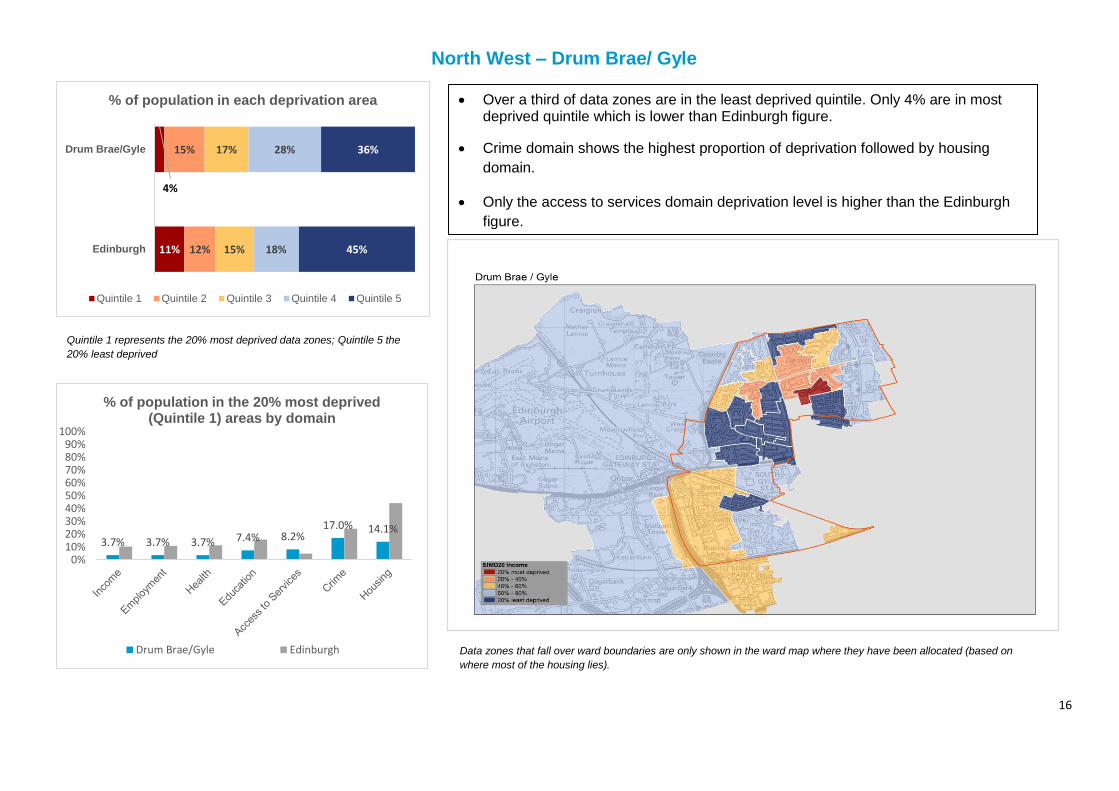
North West – Drum Brae/ Gyle
Quintile 1 represents the 20% most deprived data zones; Quintile 5 the
20% least deprived
4%
11%
15%
12%
17%
15%
28%
18%
36%
45%
Drum Brae/Gyle
Edinburgh
% of population in each deprivation area
Quintile 1 Quintile 2 Quintile 3 Quintile 4 Quintile 5
3.7% 3.7% 3.7% 7.4% 8.2%17.0% 14.1%
0%10%20%30%40%50%60%70%80%90%
100%
% of population in the 20% most deprived (Quintile 1) areas by domain
Drum Brae/Gyle Edinburgh
• Over a third of data zones are in the least deprived quintile. Only 4% are in most deprived quintile which is lower than Edinburgh figure.
• Crime domain shows the highest proportion of deprivation followed by housing
domain.
• Only the access to services domain deprivation level is higher than the Edinburgh
figure.
Data zones that fall over ward boundaries are only shown in the ward map where they have been allocated (based on
where most of the housing lies).
17
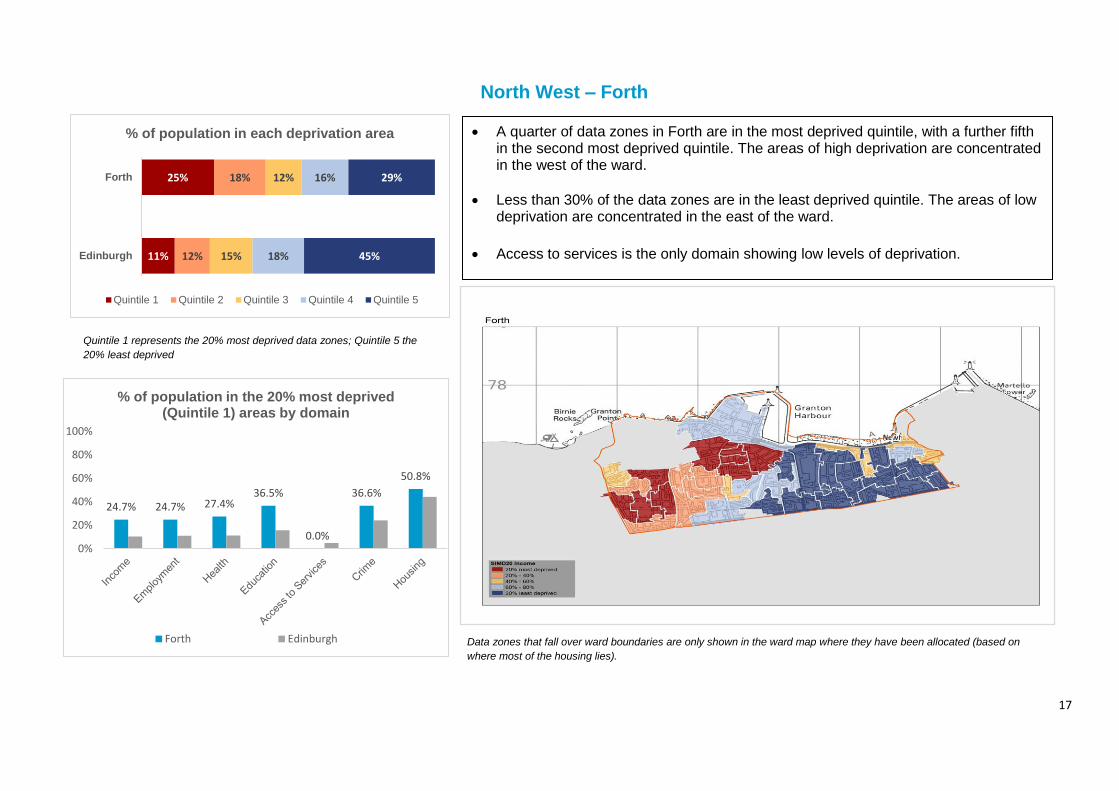
North West – Forth
Quintile 1 represents the 20% most deprived data zones; Quintile 5 the
20% least deprived
• A quarter of data zones in Forth are in the most deprived quintile, with a further fifth in the second most deprived quintile. The areas of high deprivation are concentrated in the west of the ward.
• Less than 30% of the data zones are in the least deprived quintile. The areas of low deprivation are concentrated in the east of the ward.
• Access to services is the only domain showing low levels of deprivation.
25%
11%
18%
12%
12%
15%
16%
18%
29%
45%
Forth
Edinburgh
% of population in each deprivation area
Quintile 1 Quintile 2 Quintile 3 Quintile 4 Quintile 5
24.7% 24.7% 27.4%36.5%
0.0%
36.6%
50.8%
0%
20%
40%
60%
80%
100%
% of population in the 20% most deprived (Quintile 1) areas by domain
Forth Edinburgh Data zones that fall over ward boundaries are only shown in the ward map where they have been allocated (based on
where most of the housing lies).
18
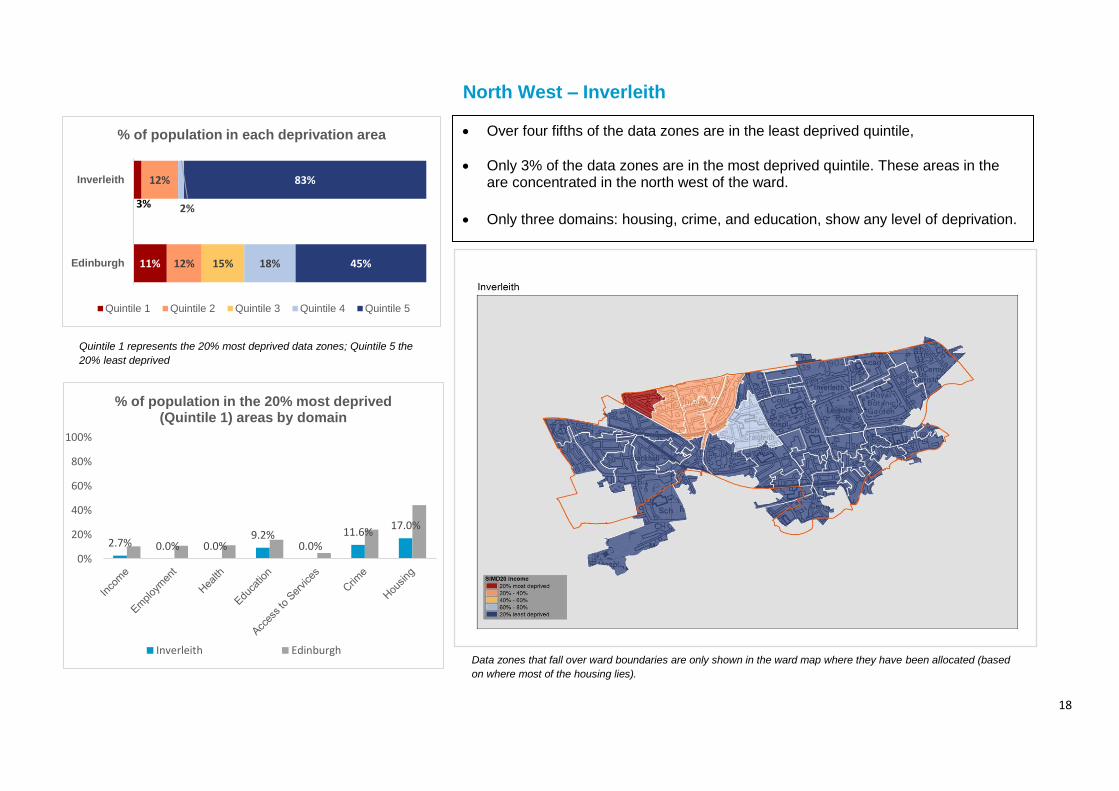
North West – Inverleith
Quintile 1 represents the 20% most deprived data zones; Quintile 5 the
20% least deprived
3%
11%
12%
12% 15%
2%
18%
83%
45%
Inverleith
Edinburgh
% of population in each deprivation area
Quintile 1 Quintile 2 Quintile 3 Quintile 4 Quintile 5
2.7% 0.0% 0.0%9.2%
0.0%11.6%
17.0%
0%
20%
40%
60%
80%
100%
% of population in the 20% most deprived (Quintile 1) areas by domain
Inverleith Edinburgh
• Over four fifths of the data zones are in the least deprived quintile,
• Only 3% of the data zones are in the most deprived quintile. These areas in the are concentrated in the north west of the ward.
• Only three domains: housing, crime, and education, show any level of deprivation.
Data zones that fall over ward boundaries are only shown in the ward map where they have been allocated (based
on where most of the housing lies).
19
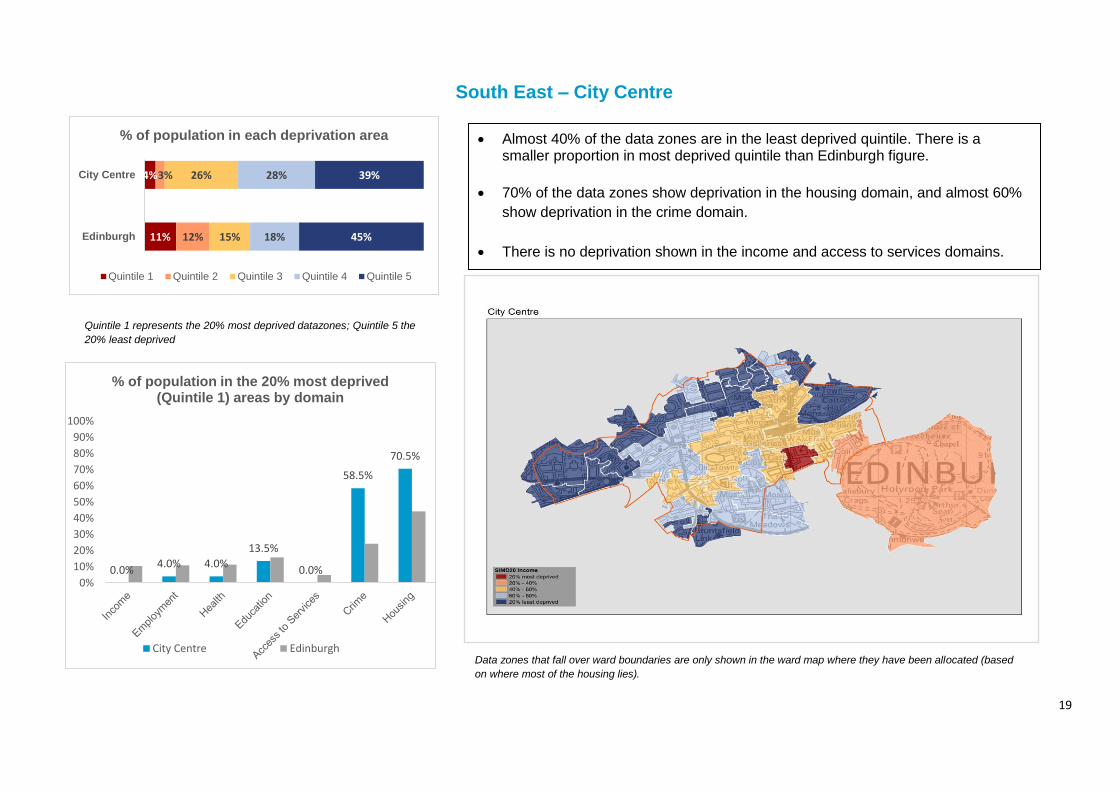
South East – City Centre
Quintile 1 represents the 20% most deprived datazones; Quintile 5 the
20% least deprived
• Almost 40% of the data zones are in the least deprived quintile. There is a smaller proportion in most deprived quintile than Edinburgh figure.
• 70% of the data zones show deprivation in the housing domain, and almost 60%
show deprivation in the crime domain.
• There is no deprivation shown in the income and access to services domains.
deprivation level is higher than the Edinburgh figure.
4%
11%
3%
12%
26%
15%
28%
18%
39%
45%
City Centre
Edinburgh
% of population in each deprivation area
Quintile 1 Quintile 2 Quintile 3 Quintile 4 Quintile 5
0.0%4.0% 4.0%
13.5%
0.0%
58.5%
70.5%
0%
10%
20%
30%
40%
50%
60%
70%
80%
90%
100%
% of population in the 20% most deprived (Quintile 1) areas by domain
City Centre EdinburghData zones that fall over ward boundaries are only shown in the ward map where they have been allocated (based
on where most of the housing lies).
20
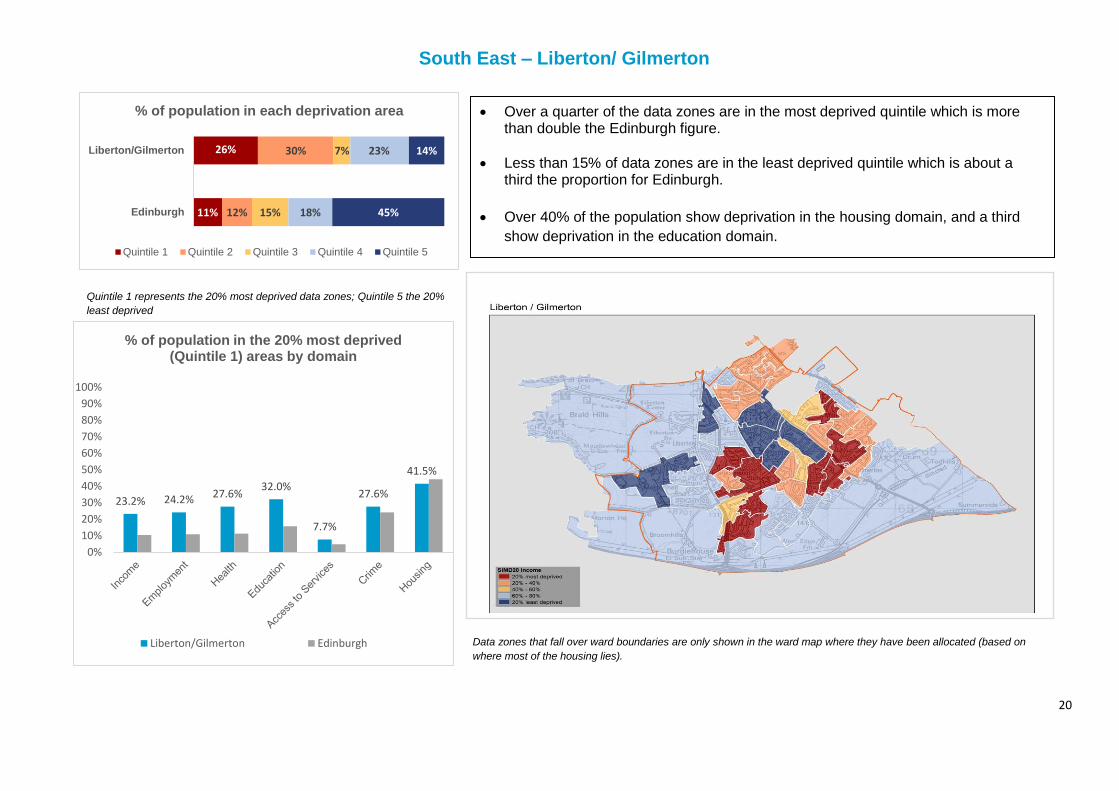
South East – Liberton/ Gilmerton
Quintile 1 represents the 20% most deprived data zones; Quintile 5 the 20%
least deprived
Data zones that fall over ward boundaries are only shown in the ward map where they have been allocated (based on
where most of the housing lies).
• Over a quarter of the data zones are in the most deprived quintile which is more than double the Edinburgh figure.
• Less than 15% of data zones are in the least deprived quintile which is about a third the proportion for Edinburgh.
• Over 40% of the population show deprivation in the housing domain, and a third
show deprivation in the education domain.
• Only the access to services domain deprivation level is higher than the Edinburgh
figure.
26%
11%
30%
12%
7%
15%
23%
18%
14%
45%
Liberton/Gilmerton
Edinburgh
% of population in each deprivation area
Quintile 1 Quintile 2 Quintile 3 Quintile 4 Quintile 5
23.2% 24.2% 27.6%32.0%
7.7%
27.6%
41.5%
0%
10%
20%
30%
40%
50%
60%
70%
80%
90%
100%
% of population in the 20% most deprived (Quintile 1) areas by domain
Liberton/Gilmerton Edinburgh
21
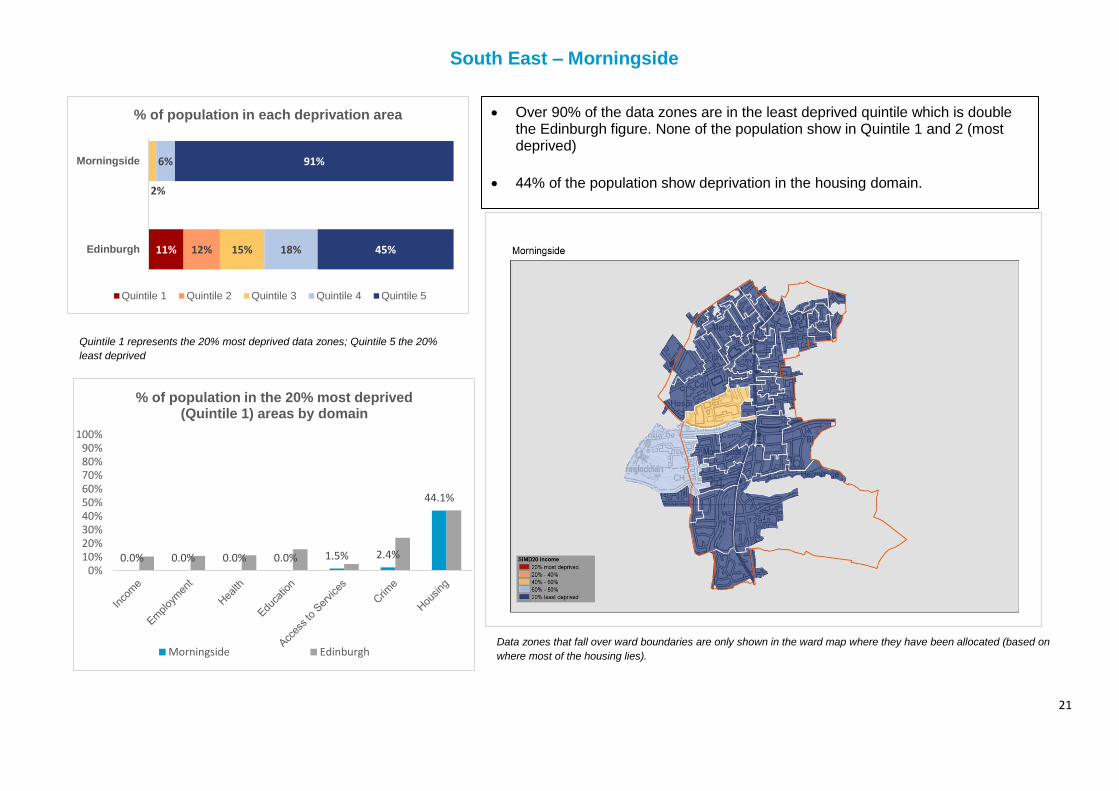
South East – Morningside
Quintile 1 represents the 20% most deprived data zones; Quintile 5 the 20%
least deprived
• Over 90% of the data zones are in the least deprived quintile which is double the Edinburgh figure. None of the population show in Quintile 1 and 2 (most deprived)
• 44% of the population show deprivation in the housing domain.
11% 12%
2%
15%
6%
18%
91%
45%
Morningside
Edinburgh
% of population in each deprivation area
Quintile 1 Quintile 2 Quintile 3 Quintile 4 Quintile 5
0.0% 0.0% 0.0% 0.0% 1.5% 2.4%
44.1%
0%10%20%30%40%50%60%70%80%90%
100%
% of population in the 20% most deprived (Quintile 1) areas by domain
Morningside EdinburghData zones that fall over ward boundaries are only shown in the ward map where they have been allocated (based on
where most of the housing lies).

22
South East – Southside/ Newington
Quintile 1 represents the 20% most deprived data zones; Quintile 5 the 20%
least deprived
• Almost 75% of the data zones are in the least deprived quintile which is double the Edinburgh figure.
• Almost 60% of the population show deprivation in the housing domain, followed by 16% in the crime domain.
2%
11%
3%
12%
12%
15%
9%
18%
74%
45%
Southside/Newington
Edinburgh
% of population in each deprivation area
Quintile 1 Quintile 2 Quintile 3 Quintile 4 Quintile 5
2.4% 2.4% 2.4% 0.0% 0.0%
16.4%
58.7%
0%
10%
20%
30%
40%
50%
60%
70%
80%
90%
100%
% of population in the 20% most deprived (Quintile 1) areas by domain
Southside/Newington Edinburgh Data zones that fall over ward boundaries are only shown in the ward map where they have been allocated
(based on where most of the housing lies).

23
South West – Colinton/ Fairmilehead
Quintile 1 represents the 20% most deprived data zones; Quintile 5 the 20%
least deprived
• Almost 70% of the data zones are in the least deprived quintile which is higher than the Edinburgh figure.
• Access to services domain shows the highest proportion of deprivation
closely followed by the crime domain.
7%
11%
8%
12%
8%
15%
11%
18%
67%
45%
Colinton/Fairmilehead
Edinburgh
% of population in each deprivation area
Quintile 1 Quintile 2 Quintile 3 Quintile 4 Quintile 5
Data zones that fall over ward boundaries are only shown in the ward map where they have been allocated
(based on where most of the housing lies).
6.4% 6.6% 3.7% 0.0%
12.4% 11.0% 6.6%
0%
20%
40%
60%
80%
100%
% of population in the 20% most deprived (Quintile 1) areas by domain
Colinton/Fairmilehead Edinburgh
24
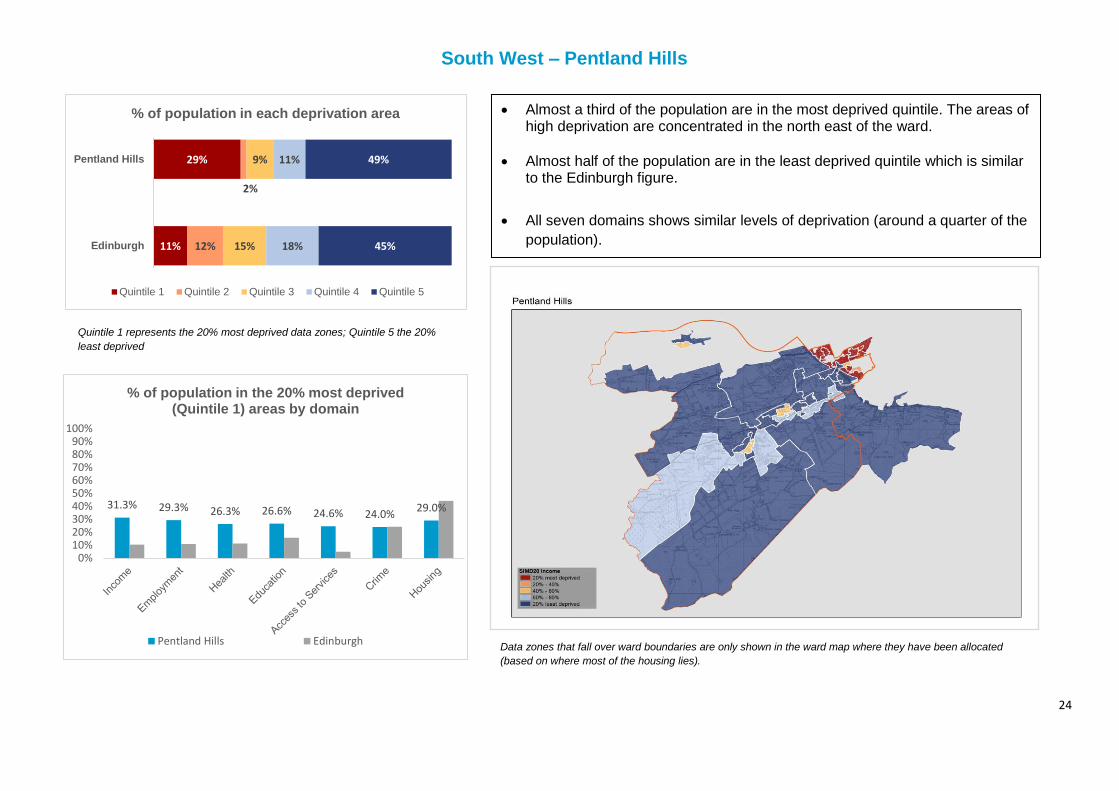
South West – Pentland Hills
Quintile 1 represents the 20% most deprived data zones; Quintile 5 the 20%
least deprived
• Almost a third of the population are in the most deprived quintile. The areas of high deprivation are concentrated in the north east of the ward.
• Almost half of the population are in the least deprived quintile which is similar to the Edinburgh figure.
• All seven domains shows similar levels of deprivation (around a quarter of the
population).
Data zones that fall over ward boundaries are only shown in the ward map where they have been allocated
(based on where most of the housing lies).
31.3% 29.3% 26.3% 26.6% 24.6% 24.0%29.0%
0%10%20%30%40%50%60%70%80%90%
100%
% of population in the 20% most deprived (Quintile 1) areas by domain
Pentland Hills Edinburgh
29%
11%
2%
12%
9%
15%
11%
18%
49%
45%
Pentland Hills
Edinburgh
% of population in each deprivation area
Quintile 1 Quintile 2 Quintile 3 Quintile 4 Quintile 5
25
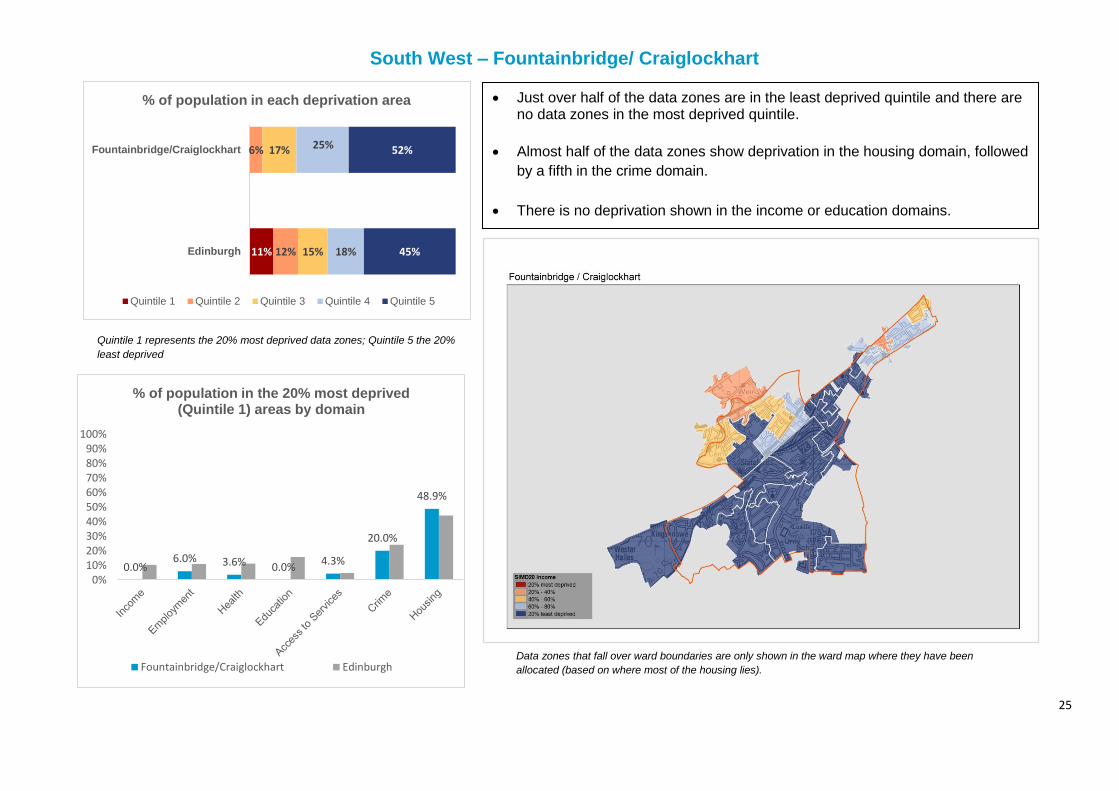
South West – Fountainbridge/ Craiglockhart
Quintile 1 represents the 20% most deprived data zones; Quintile 5 the 20%
least deprived
11%
6%
12%
17%
15%
25%
18%
52%
45%
Fountainbridge/Craiglockhart
Edinburgh
% of population in each deprivation area
Quintile 1 Quintile 2 Quintile 3 Quintile 4 Quintile 5
• Just over half of the data zones are in the least deprived quintile and there are no data zones in the most deprived quintile.
• Almost half of the data zones show deprivation in the housing domain, followed
by a fifth in the crime domain.
• There is no deprivation shown in the income or education domains.
0.0%6.0% 3.6% 0.0%
4.3%
20.0%
48.9%
0%10%20%30%40%50%60%70%80%90%
100%
% of population in the 20% most deprived (Quintile 1) areas by domain
Fountainbridge/Craiglockhart EdinburghData zones that fall over ward boundaries are only shown in the ward map where they have been
allocated (based on where most of the housing lies).
26
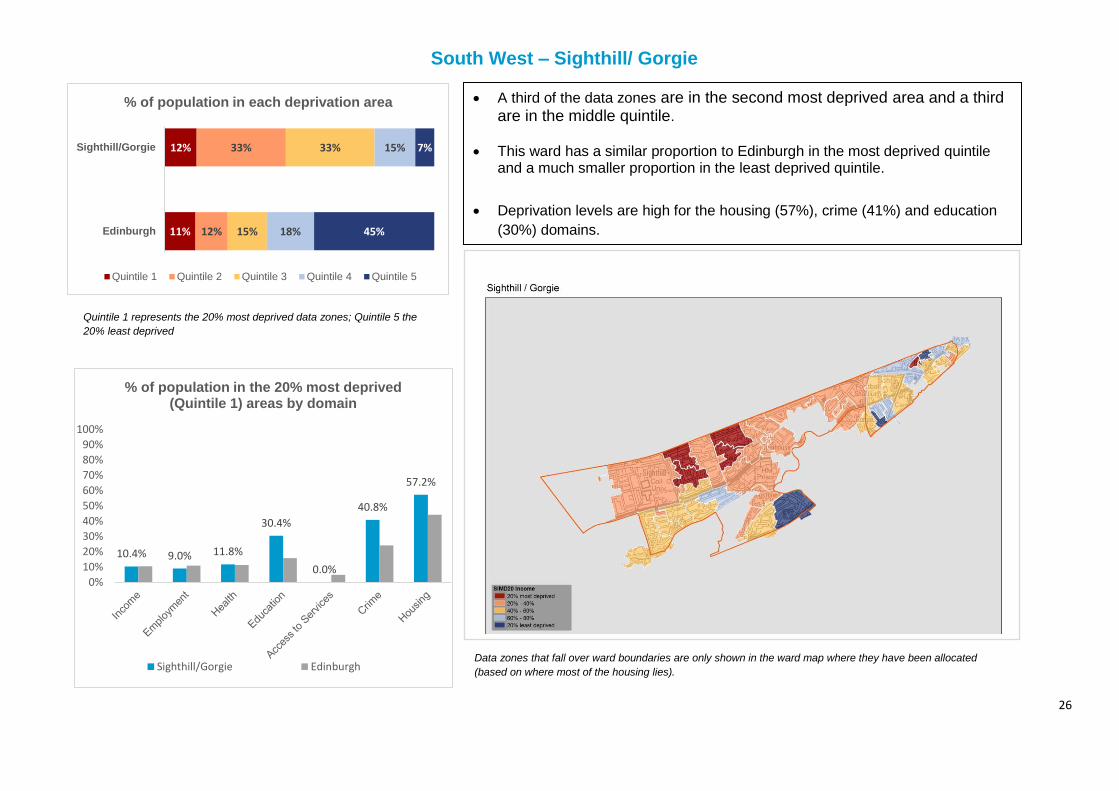
South West – Sighthill/ Gorgie
Quintile 1 represents the 20% most deprived data zones; Quintile 5 the
20% least deprived
Data zones that fall over ward boundaries are only shown in the ward map where they have been allocated
(based on where most of the housing lies).
• A third of the data zones are in the second most deprived area and a third are in the middle quintile.
• This ward has a similar proportion to Edinburgh in the most deprived quintile and a much smaller proportion in the least deprived quintile.
• Deprivation levels are high for the housing (57%), crime (41%) and education
(30%) domains.
• Only the access to services domain deprivation level is higher than the
Edinburgh figure.
12%
11%
33%
12%
33%
15%
15%
18%
7%
45%
Sighthill/Gorgie
Edinburgh
% of population in each deprivation area
Quintile 1 Quintile 2 Quintile 3 Quintile 4 Quintile 5
10.4% 9.0% 11.8%
30.4%
0.0%
40.8%
57.2%
0%
10%
20%
30%
40%
50%
60%
70%
80%
90%
100%
% of population in the 20% most deprived (Quintile 1) areas by domain
Sighthill/Gorgie Edinburgh
27
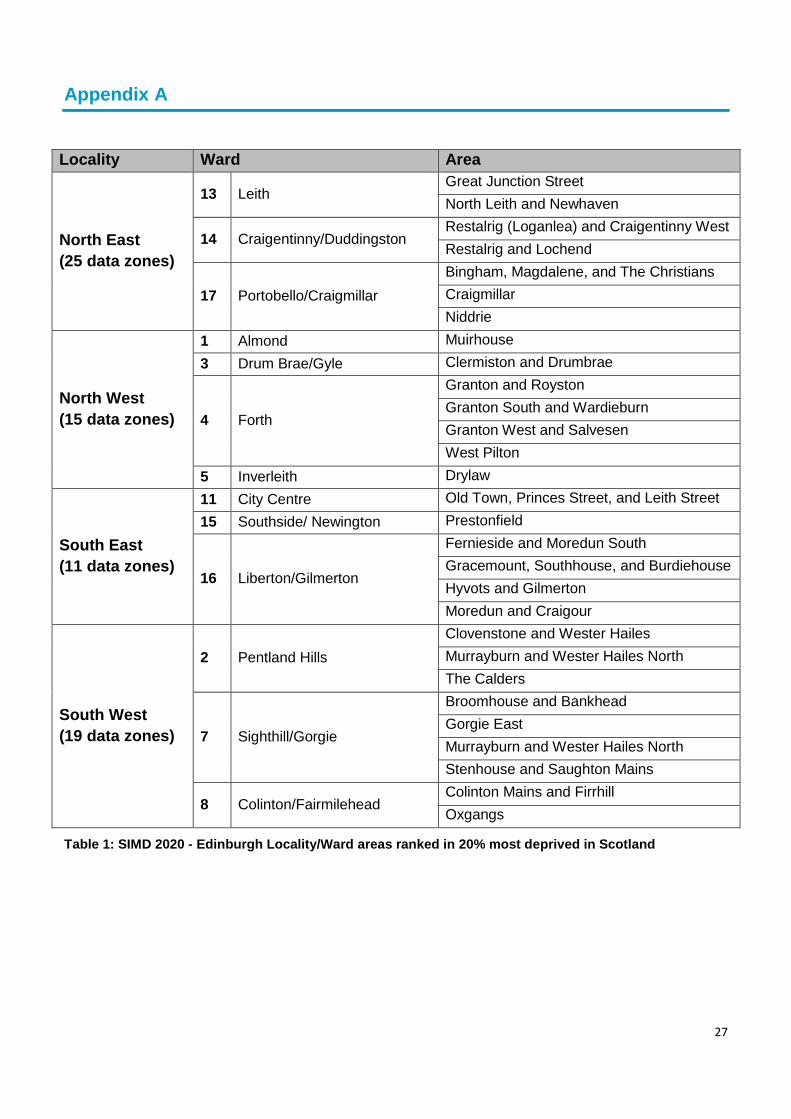
Appendix A
Locality Ward Area
North East
(25 data zones)
13 Leith Great Junction Street
North Leith and Newhaven
14 Craigentinny/Duddingston Restalrig (Loganlea) and Craigentinny West
Restalrig and Lochend
17 Portobello/Craigmillar
Bingham, Magdalene, and The Christians
Craigmillar
Niddrie
North West
(15 data zones)
1 Almond Muirhouse
3 Drum Brae/Gyle Clermiston and Drumbrae
4 Forth
Granton and Royston
Granton South and Wardieburn
Granton West and Salvesen
West Pilton
5 Inverleith Drylaw
South East
(11 data zones)
11 City Centre Old Town, Princes Street, and Leith Street
15 Southside/ Newington Prestonfield
16 Liberton/Gilmerton
Fernieside and Moredun South
Gracemount, Southhouse, and Burdiehouse
Hyvots and Gilmerton
Moredun and Craigour
South West
(19 data zones)
2 Pentland Hills
Clovenstone and Wester Hailes
Murrayburn and Wester Hailes North
The Calders
7 Sighthill/Gorgie
Broomhouse and Bankhead
Gorgie East
Murrayburn and Wester Hailes North
Stenhouse and Saughton Mains
8 Colinton/Fairmilehead Colinton Mains and Firrhill
Oxgangs
Table 1: SIMD 2020 - Edinburgh Locality/Ward areas ranked in 20% most deprived in Scotland
28
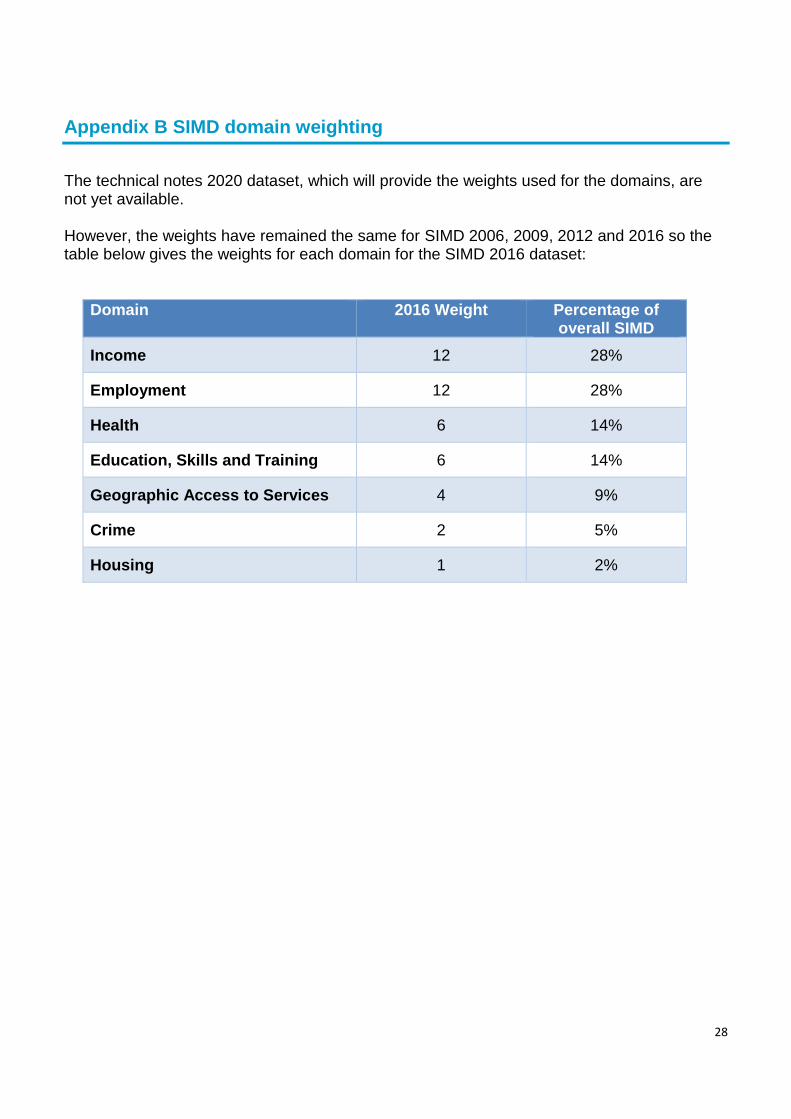
Appendix B SIMD domain weighting
The technical notes 2020 dataset, which will provide the weights used for the domains, are not yet available. However, the weights have remained the same for SIMD 2006, 2009, 2012 and 2016 so the table below gives the weights for each domain for the SIMD 2016 dataset:
Domain 2016 Weight Percentage of overall SIMD
Income 12 28%
Employment 12 28%
Health 6 14%
Education, Skills and Training 6 14%
Geographic Access to Services 4 9%
Crime 2 5%
Housing 1 2%