Sleep deprivation increases dorsal nexus connectivity to the dorsolateral prefrontal cortex in...
6
Sleep deprivation increases dorsal nexus connectivity to the dorsolateral prefrontal cortex in humans Oliver G. Bosch a,1 , Julia S. Rihm b , Milan Scheidegger a,c , Hans-Peter Landolt d , Philipp Stämpfli e , Janis Brakowski a , Fabrizio Esposito f , Björn Rasch g , and Erich Seifritz a a Department of Psychiatry, Psychotherapy and Psychosomatics, Hospital of Psychiatry, University of Zurich, 8032 Zurich, Switzerland; b Division of Biopsychology, Department of Psychology, University of Zurich, 8050 Zurich, Switzerland; c Institute for Biomedical Engineering, University of Zurich and ETH Zurich, 8092 Zurich, Switzerland; d Institute of Pharmacology and Toxicology, University of Zurich, 8057 Zurich, Switzerland; e MR-Center of the Hospital of Psychiatry and the Department of Child and Adolescent Psychiatry, University of Zurich, 8032 Zurich, Switzerland; f Department of Medicine and Surgery, University of Salerno, 84081 Baronissi, Italy; and g Division of Cognitive Biopsychology and Methods, Department of Psychology, University of Fribourg, 1701 Fribourg, Switzerland Edited by Marcus E. Raichle, Washington University in St. Louis, St. Louis, MO, and approved October 21, 2013 (received for review September 18, 2013) In many patients with major depressive disorder, sleep depriva- tion, or wake therapy, induces an immediate but often transient antidepressant response. It is known from brain imaging studies that changes in anterior cingulate and dorsolateral prefrontal cortex activity correlate with a relief of depression symptoms. Recently, resting-state functional magnetic resonance imaging re- vealed that brain network connectivity via the dorsal nexus (DN), a cortical area in the dorsomedial prefrontal cortex, is dramatically increased in depressed patients. To investigate whether an alter- ation in DN connectivity could provide a biomarker of therapy response and to determine brain mechanisms of action underly- ing sleep deprivations antidepressant effects, we examined its influence on resting state default mode network and DN connec- tivity in healthy humans. Our findings show that sleep deprivation reduced functional connectivity between posterior cingulate cortex and bilateral anterior cingulate cortex (Brodmann area 32), and enhanced connectivity between DN and distinct areas in right dorsolateral prefrontal cortex (Brodmann area 10). These find- ings are consistent with resolution of dysfunctional brain net- work connectivity changes observed in depression and suggest changes in prefrontal connectivity with the DN as a brain mech- anism of antidepressant therapy action. S leep deprivation has been used for decades as a rapid-acting and effective treatment in patients with major depressive disorder (MDD) (1, 2). Although clinically well established, the mechanisms of action are largely unknown. Brain imaging studies have shown that sleep deprivation in depressed patients is associated with renormalized metabolic activity, mainly in limbic structures including anterior cingu- late (ACC) as well as dorsolateral prefrontal cortex (DLPFC) (3–6), and that changes in limbic and DLPFC activity correlated with a relief of depression symptoms (7–9). Recent studies in patients with depression point to a critical importance of al- tered large-scale brain network connectivity during the resting state (10, 11). Among these networks, the default mode network (DMN), which mainly comprises cortical midline structures in- cluding precuneus and medial frontal cortex as well as the in- ferior parietal lobule (12–15), is most consistently characterized. In functional magnetic resonance imaging (fMRI) studies, the DMN shows the strongest blood oxygenation level–dependent (BOLD) activity during rest and decreased BOLD reactivity during goal-directed task performance. The DMN is anticorrelated with the cognitive control network (CCN), a corresponding task- positive network, which encompasses bilateral fronto-cingulo- parietal structures including lateral prefrontal and superior parietal areas (16). A third system with high relevance for depression—the affective network (AN)—is based in the subgenual and pregenual parts of the ACC [Brodman area (BA) 32] (17). The AN is active during both resting and task-related emotional processing, and forms strong functional and structural connections to other limbic areas such as hypothalamus, amygdala, entorhinal cortex, and nucleus accumbens (18, 19). Increased connectivity of DMN, CCN, and AN with a distinct area in the bilateral dorsomedial prefrontal cortex (DMPFC) was recently found in patients with depression compared with healthy controls (20). This area within the DMPFC was termed dorsal nexus (DN) and was postulated to constitute a converging node of depressive “hot wiring,” which manifests itself in symptoms of emotional, cognitive, and vegetative dysregulation. This led to the hypothesis that a modification in connectivity via the DN would be a potential target for antidepressant treatments (20). Recent studies in healthy subjects reported reduced functional connectivity within DMN and between DMN and CCN in the morning after total (21) and in the evening after partial sleep deprivation (22). However, brain network connectivity via the DN was not examined in these studies. Given the recently pro- posed role of the DN in mood regulation, here we specifically tested whether sleep deprivation as a well-known antidepressant treatment modality affects connectivity via the DN. Based on our previous findings on network changes by ketamine (23), we hy- pothesized that sleep deprivation leads to a reduction in con- nectivity via the DN. Results Both after normal sleep and sleep deprivation, posterior cingu- late cortex (PCC) seed-based analysis revealed a clear depiction of the DMN, with positively correlated clusters in orbital cortex and DMPFC, inferior parietal lobule, and precuneus (all bi- lateral) and negatively correlated clusters in medial frontal and lateral prefrontal cortex (Fig. 1). The DMN was determined Significance Major depressive disorder is a significant contributor to the global burden of disease, affecting 350 million people accord- ing to an estimation of the World Health Organization. Today, no valid biomarkers of depression, which could predict the efficacy of a certain treatment in a certain group of patients, exist. Sleep deprivation is an effective and rapid-acting anti- depressive treatment. However, the biomechanism of this ef- fect is largely unknown. This study shows the effects of sleep deprivation on human brain functional connectivity alterations via the dorsal nexus, an area which is crucial in major de- pressive disorder. Here, we offer a neurobiological explanation for the known antidepressive action of sleep deprivation. Author contributions: O.G.B., P.S., F.E., B.R., and E.S. designed research; O.G.B., J.S.R., P.S., J.B., and B.R. performed research; J.S.R., M.S., H.-P.L., F.E., and B.R. analyzed data; O.G.B., H.-P.L., J.B., F.E., B.R., and E.S. wrote the paper; and E.S. provided funding. The authors declare no conflict of interest. This article is a PNAS Direct Submission. 1 To whom correspondence should be addressed. E-mail: [email protected]. www.pnas.org/cgi/doi/10.1073/pnas.1317010110 PNAS | November 26, 2013 | vol. 110 | no. 48 | 19597–19602 NEUROSCIENCE
-
Upload
independent -
Category
Documents
-
view
3 -
download
0
Transcript of Sleep deprivation increases dorsal nexus connectivity to the dorsolateral prefrontal cortex in...
Sleep deprivation increases dorsal nexus connectivityto the dorsolateral prefrontal cortex in humansOliver G. Boscha,1, Julia S. Rihmb, Milan Scheideggera,c, Hans-Peter Landoltd, Philipp Stämpflie, Janis Brakowskia,Fabrizio Espositof, Björn Raschg, and Erich Seifritza
aDepartment of Psychiatry, Psychotherapy and Psychosomatics, Hospital of Psychiatry, University of Zurich, 8032 Zurich, Switzerland; bDivision ofBiopsychology, Department of Psychology, University of Zurich, 8050 Zurich, Switzerland; cInstitute for Biomedical Engineering, University of Zurich and ETHZurich, 8092 Zurich, Switzerland; dInstitute of Pharmacology and Toxicology, University of Zurich, 8057 Zurich, Switzerland; eMR-Center of the Hospital ofPsychiatry and the Department of Child and Adolescent Psychiatry, University of Zurich, 8032 Zurich, Switzerland; fDepartment of Medicine andSurgery, University of Salerno, 84081 Baronissi, Italy; and gDivision of Cognitive Biopsychology and Methods, Department of Psychology, University ofFribourg, 1701 Fribourg, Switzerland
Edited by Marcus E. Raichle, Washington University in St. Louis, St. Louis, MO, and approved October 21, 2013 (received for review September 18, 2013)
In many patients with major depressive disorder, sleep depriva-tion, or wake therapy, induces an immediate but often transientantidepressant response. It is known from brain imaging studiesthat changes in anterior cingulate and dorsolateral prefrontalcortex activity correlate with a relief of depression symptoms.Recently, resting-state functional magnetic resonance imaging re-vealed that brain network connectivity via the dorsal nexus (DN),a cortical area in the dorsomedial prefrontal cortex, is dramaticallyincreased in depressed patients. To investigate whether an alter-ation in DN connectivity could provide a biomarker of therapyresponse and to determine brain mechanisms of action underly-ing sleep deprivations antidepressant effects, we examined itsinfluence on resting state default mode network and DN connec-tivity in healthy humans. Our findings show that sleep deprivationreduced functional connectivity between posterior cingulate cortexand bilateral anterior cingulate cortex (Brodmann area 32), andenhanced connectivity between DN and distinct areas in rightdorsolateral prefrontal cortex (Brodmann area 10). These find-ings are consistent with resolution of dysfunctional brain net-work connectivity changes observed in depression and suggestchanges in prefrontal connectivity with the DN as a brain mech-anism of antidepressant therapy action.
Sleep deprivation has been used for decades as a rapid-actingand effective treatment in patients with major depressive
disorder (MDD) (1, 2). Although clinically well established, themechanisms of action are largely unknown.Brain imaging studies have shown that sleep deprivation in
depressed patients is associated with renormalized metabolicactivity, mainly in limbic structures including anterior cingu-late (ACC) as well as dorsolateral prefrontal cortex (DLPFC)(3–6), and that changes in limbic and DLPFC activity correlatedwith a relief of depression symptoms (7–9). Recent studies inpatients with depression point to a critical importance of al-tered large-scale brain network connectivity during the restingstate (10, 11). Among these networks, the default mode network(DMN), which mainly comprises cortical midline structures in-cluding precuneus and medial frontal cortex as well as the in-ferior parietal lobule (12–15), is most consistently characterized.In functional magnetic resonance imaging (fMRI) studies, theDMN shows the strongest blood oxygenation level–dependent(BOLD) activity during rest and decreased BOLD reactivityduring goal-directed task performance. The DMN is anticorrelatedwith the cognitive control network (CCN), a corresponding task-positive network, which encompasses bilateral fronto-cingulo-parietal structures including lateral prefrontal and superior parietalareas (16). A third system with high relevance for depression—theaffective network (AN)—is based in the subgenual and pregenualparts of the ACC [Brodman area (BA) 32] (17). The AN is activeduring both resting and task-related emotional processing, andforms strong functional and structural connections to other limbic
areas such as hypothalamus, amygdala, entorhinal cortex, andnucleus accumbens (18, 19).Increased connectivity of DMN, CCN, and AN with a distinct
area in the bilateral dorsomedial prefrontal cortex (DMPFC) wasrecently found in patients with depression compared with healthycontrols (20). This area within the DMPFC was termed dorsalnexus (DN) and was postulated to constitute a converging nodeof depressive “hot wiring,” which manifests itself in symptoms ofemotional, cognitive, and vegetative dysregulation. This led to thehypothesis that a modification in connectivity via the DN wouldbe a potential target for antidepressant treatments (20).Recent studies in healthy subjects reported reduced functional
connectivity within DMN and between DMN and CCN in themorning after total (21) and in the evening after partial sleepdeprivation (22). However, brain network connectivity via theDN was not examined in these studies. Given the recently pro-posed role of the DN in mood regulation, here we specificallytested whether sleep deprivation as a well-known antidepressanttreatment modality affects connectivity via the DN. Based on ourprevious findings on network changes by ketamine (23), we hy-pothesized that sleep deprivation leads to a reduction in con-nectivity via the DN.
ResultsBoth after normal sleep and sleep deprivation, posterior cingu-late cortex (PCC) seed-based analysis revealed a clear depictionof the DMN, with positively correlated clusters in orbital cortexand DMPFC, inferior parietal lobule, and precuneus (all bi-lateral) and negatively correlated clusters in medial frontal andlateral prefrontal cortex (Fig. 1). The DMN was determined
Significance
Major depressive disorder is a significant contributor to theglobal burden of disease, affecting 350 million people accord-ing to an estimation of the World Health Organization. Today,no valid biomarkers of depression, which could predict theefficacy of a certain treatment in a certain group of patients,exist. Sleep deprivation is an effective and rapid-acting anti-depressive treatment. However, the biomechanism of this ef-fect is largely unknown. This study shows the effects of sleepdeprivation on human brain functional connectivity alterationsvia the dorsal nexus, an area which is crucial in major de-pressive disorder. Here, we offer a neurobiological explanationfor the known antidepressive action of sleep deprivation.
Author contributions: O.G.B., P.S., F.E., B.R., and E.S. designed research; O.G.B., J.S.R., P.S.,J.B., and B.R. performed research; J.S.R., M.S., H.-P.L., F.E., and B.R. analyzed data; O.G.B.,H.-P.L., J.B., F.E., B.R., and E.S. wrote the paper; and E.S. provided funding.
The authors declare no conflict of interest.
This article is a PNAS Direct Submission.1To whom correspondence should be addressed. E-mail: [email protected].
www.pnas.org/cgi/doi/10.1073/pnas.1317010110 PNAS | November 26, 2013 | vol. 110 | no. 48 | 19597–19602
NEU
ROSC
IENCE

using a seed region identical to a previous work (center of thisregion: x = −8, y = −49, z = 28) (23). It is important to note that,consistent with previous studies (22, 24), sleep deprivation re-duced functional connectivity of the PCC with the ACC (BA 32;coordinates: +5, +43, +3; z score = 3.7173, P = 0.000201; clustersize = 359 mm3) (Fig. 2). On the other hand, when we selecteda seed region in the precuneus, the resulting functional con-nectivity analysis yielded no differential effects between sleepdeprivation and normal conditions over the entire brain at theused statistical threshold.The DN seed-based analysis also allowed a delineation of the
main DMN nodes. The overlap with the DMN, however, wasonly partial. The contribution of positively connected regionswas more prominent in the anterior part of the brain, includingputative regions of other networks such as CCN and AN, and lessprominent in the posterior part of the brain (Fig. 3).It is interesting that, in contrast to the known effects of sleep
deprivation on DMN connectivity, DN connectivity was alteredin unexpected manner. More specifically, compared with thenormal sleep condition, DN connectivity after sleep deprivationwas significantly increased in right anterior middle (coordinates:
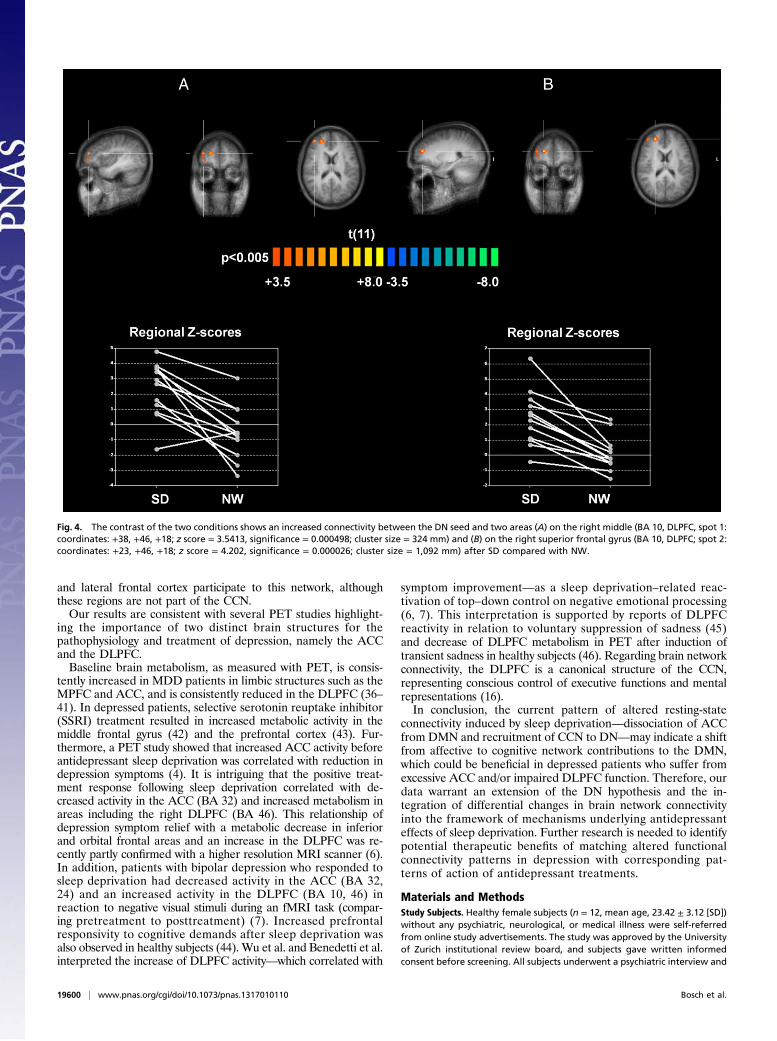
+38, +46, +18; z score = 3.5413, significance = 0.000498; clustersize = 324 mm3) and superior frontal gyri (coordinates: +23,+46, +18; z score = 4.202, significance = 0.000026; cluster size =1,092 mm3), both located in DLPFC and pertaining to the dor-solateral part of BA 10 (border to BA 46; Fig. 4). These frontalregions appear consistently and positively correlated with DNonly in the sleep deprivation condition, whereas in the normalwakefulness condition, half or more of the subjects exhibitednegative scores.A comparison of the DMN connectivity changes and the DN
connectivity changes due to sleep deprivation (Fig. 5) showsa reduction of the DMN–CCN anticorrelations from the normalwakefulness (Fig. 5 A and B) to the sleep deprivation (Fig. 5 Cand D) condition. Although it does not reach statistical signifi-cance, which might be due to the small sample size, this tendencyis in line with previous studies (21, 22). More important, thiscomparison clarifies that the main effect of sleep deprivation onthe functional connectivity of the DN is not to reduce DMNanticorrelations in these regions, but rather to promote theirpositive correlation to the DN.To control vigilance during fMRI, the EEG was recorded. In
both conditions, subjects were awake for more than 95% ofimaging time, and no differences in vigilance states were foundbetween the conditions (P > 0.6). As expected, spectral power indelta and theta frequencies (<8 Hz) was slightly enhanced afterprolonged wakefulness, yet did not differ significantly from thenormal wakefulness condition (pall > 0.3; Table 1).
DiscussionHere we delineate a differential pattern of resting-state con-nectivity after sleep deprivation, which is a potent, rapidly actingantidepressant intervention with a largely unknown mode ofaction. More specifically, using resting-state fMRI in healthysubjects, we found that sleep deprivation reduced functionalconnectivity between the PCC and the bilateral ACC (BA 32),yet increased connectivity between the DN and two areas withinthe right DLPFC (BA 10). Although the previous observationwas consistent with our a priori hypothesis, the latter observationwas not expected. Visual inspection and quantification of theEEG during scanning confirmed that the changes in connec-tivity were not caused by the occurrence of spontaneous sleepafter prolonged waking.There is growing evidence that brain connectivity within the
DMN and between the DMN and other brain networks is altered
Fig. 1. Functional connectivity maps (n = 12) of the brain using the PCCas seed region and comparing two conditions, normal wakefulness (A) andsleep deprived (B) (main effects, P < 0.05 cluster corrected).
Fig. 2. The contrast of the two conditions shows a reducedconnectivity between the PCC seed and the bilateral ACC (BA 32;coordinates: +5, +43, +3; z score = 3.7173, significance = 0.000201;cluster size = 359 mm) after sleep deprivation (SD) compared withnormal wakefulness (NW).
19598 | www.pnas.org/cgi/doi/10.1073/pnas.1317010110 Bosch et al.

in patients with MDD compared with healthy volunteers, pri-marily reflecting dysfunctional self-referential processing such asrumination, negative anticipation, and excessive feelings of guiltand shame (11). We explored the functional connectivity of thePCC as a core seed of the DMN, after normal wakefulness andsleep deprivation in healthy subjects. In both conditions, wefound a clear depiction of the DMN (13), including the PCC,orbital and dorsal parts of the medial prefrontal cortex (MPFC),inferior parietal lobule, and precuneus (all bilateral; Fig. 1). Thecomparison between normal sleep and sleep deprivation revealeda significantly reduced connectivity of the PCC to the bilateralACC (BA 32) after sleep deprivation (Fig. 2).The ACC is seen as a key structure for emotional processing
and depressive psychopathology and is part of the AN (25).Numerous studies using event-related and resting-state fMRIdesigns point to alterations in ACC activity in depressed patients(26–29). The first resting-state fMRI study with MDD patientsrevealed a hyperconnectivity between the subgenual ACC andthe DMN, confirming previous PET studies, which found rest-ing state overactivity in ACC in these patients (30). Hyper-connectivity in the MPFC and ventral ACC was correlated withrumination in another fMRI study (31). Here, we found thatsleep deprivation reduced connectivity on the ACC–PCC axis.This is of particular interest because resting-state DMN domi-nance is associated with increased maladaptive, depressive ru-mination, and reduced adaptive, reflective rumination (32).Depressed patients typically fail to down-regulate DMN activityduring emotional stimulation (33, 34). Our finding of reducedintrinsic DMN connectivity after sleep deprivation resemblesa pattern of normalization with regard to the depressive state.Keeping in mind the multiple functional connections of theACC, a connectivity reduction to the DMN might be viewed asa potential therapeutic effect in patients who suffer from ex-cessive ACC network contribution during rest, as it is observedduring rumination.Our study focused on the DN as a specific seed region, which
plays a crucial role in the pathophysiology of depression, and wasrecently discovered as a node mediating dramatic functionalhyperconnectivity between DMN, CCN, and AN in patients withMDD (20). This hot wiring via the DN was proposed to underliecore depressive symptoms such as rumination and hyperarousal,as well as affective and vegetative dysregulation. A reduction of
DN connectivity may, thus, represent a neurobiological targetfor antidepressant treatment strategies and a potential biomarkerof antidepressant response. Two recent studies tested this so-calledDN hypothesis using psychopharmacological challenges in healthysubjects. The first revealed reduced functional connectivity betweenDN and hippocampus after 7 d of citalopram administration (35).The second showed reduced DN connectivity with the PCC andthe pregenual ACC 24 h after ketamine infusions (23). Thesestudies support the hypothesis that reducing DN connectivityto subcortical structures and the DMN network may representa biomechanism of antidepressant action.In the present study, we observed similar DN connectivity to
the key structures of the DMN and the AN after normal sleepand sleep deprivation. We found in both conditions significantDN connectivity to the bilateral PCC, bilateral precuneus, andbilateral parietal lobules (Fig. 3), indicating that the DN is highlycorrelated with intrinsic DMN connectivity in healthy subjects.Compared with normal sleep, sleep deprivation induced an ex-pansion of the DN connectivity pattern with the DMPFC towardmore dorsolateral regions in the deprivation condition. This ef-fect led to the delineation of two sleep deprivation–related areasof significant hyperconnectivity in the right anterior middle andsuperior frontal gyrus, both of which are located in DLPFC (BA10/BA 46; Fig. 4). These areas showed negative scores in thenormal wakefulness condition in half or more of the subjects,suggesting the possibility that these regions could be anticorrelatedwith the DN in their initial status. From a metabolic perspectivethis means that sleep deprivation may actually weaken the anti-correlation, rather than increasing the correlation of these regionsto the DN. However, as a differential effect, we observe a changein the functional connectivity distribution where these regions areinitially not part of a positive or negative DN network, which inturn seems to recruit them specifically in the sleep deprivation–altered condition.The comparison of the functional connectivity changes of the
DMN and DN networks after normal wakefulness and sleepdeprivation (Fig. 5) shows that the negative correlations support-ing the DMN–CCN anticorrelation result weakened in the sleepdeprivation condition in line with previous studies. Furthermore,the DN region functionally connects to a frontally emphasizedDMN due to its overlap with the DMPFC node of the PCC-basedDMN pattern. After sleep deprivation, new regions in the superior
Fig. 3. Functional connectivity maps (n = 12) of thebrain using the DN as seed region and comparingthe two conditions, normal wakefulness (A) andsleep deprived (B) (main effects, P < 0.05 clustercorrected).
Bosch et al. PNAS | November 26, 2013 | vol. 110 | no. 48 | 19599
NEU
ROSC
IENCE
and lateral frontal cortex participate to this network, althoughthese regions are not part of the CCN.Our results are consistent with several PET studies highlight-
ing the importance of two distinct brain structures for thepathophysiology and treatment of depression, namely the ACCand the DLPFC.Baseline brain metabolism, as measured with PET, is consis-
tently increased in MDD patients in limbic structures such as theMPFC and ACC, and is consistently reduced in the DLPFC (36–41). In depressed patients, selective serotonin reuptake inhibitor(SSRI) treatment resulted in increased metabolic activity in themiddle frontal gyrus (42) and the prefrontal cortex (43). Fur-thermore, a PET study showed that increased ACC activity beforeantidepressant sleep deprivation was correlated with reduction indepression symptoms (4). It is intriguing that the positive treat-ment response following sleep deprivation correlated with de-creased activity in the ACC (BA 32) and increased metabolism inareas including the right DLPFC (BA 46). This relationship ofdepression symptom relief with a metabolic decrease in inferiorand orbital frontal areas and an increase in the DLPFC was re-cently partly confirmed with a higher resolution MRI scanner (6).In addition, patients with bipolar depression who responded tosleep deprivation had decreased activity in the ACC (BA 32,24) and an increased activity in the DLPFC (BA 10, 46) inreaction to negative visual stimuli during an fMRI task (compar-ing pretreatment to posttreatment) (7). Increased prefrontalresponsivity to cognitive demands after sleep deprivation wasalso observed in healthy subjects (44). Wu et al. and Benedetti et al.interpreted the increase of DLPFC activity—which correlated with
symptom improvement—as a sleep deprivation–related reac-tivation of top–down control on negative emotional processing(6, 7). This interpretation is supported by reports of DLPFCreactivity in relation to voluntary suppression of sadness (45)and decrease of DLPFC metabolism in PET after induction oftransient sadness in healthy subjects (46). Regarding brain networkconnectivity, the DLPFC is a canonical structure of the CCN,representing conscious control of executive functions and mentalrepresentations (16).In conclusion, the current pattern of altered resting-state
connectivity induced by sleep deprivation—dissociation of ACCfrom DMN and recruitment of CCN to DN—may indicate a shiftfrom affective to cognitive network contributions to the DMN,which could be beneficial in depressed patients who suffer fromexcessive ACC and/or impaired DLPFC function. Therefore, ourdata warrant an extension of the DN hypothesis and the in-tegration of differential changes in brain network connectivityinto the framework of mechanisms underlying antidepressanteffects of sleep deprivation. Further research is needed to identifypotential therapeutic benefits of matching altered functionalconnectivity patterns in depression with corresponding pat-terns of action of antidepressant treatments.
Materials and MethodsStudy Subjects. Healthy female subjects (n = 12, mean age, 23.42 ± 3.12 [SD])without any psychiatric, neurological, or medical illness were self-referredfrom online study advertisements. The study was approved by the Universityof Zurich institutional review board, and subjects gave written informedconsent before screening. All subjects underwent a psychiatric interview and
Fig. 4. The contrast of the two conditions shows an increased connectivity between the DN seed and two areas (A) on the right middle (BA 10, DLPFC, spot 1:coordinates: +38, +46, +18; z score = 3.5413, significance = 0.000498; cluster size = 324 mm) and (B) on the right superior frontal gyrus (BA 10, DLPFC; spot 2:coordinates: +23, +46, +18; z score = 4.202, significance = 0.000026; cluster size = 1,092 mm) after SD compared with NW.
19600 | www.pnas.org/cgi/doi/10.1073/pnas.1317010110 Bosch et al.

medical examination. Exclusion criteria were a history of psychiatric/neuro-logical diseases, sleep–wake cycle abnormalities, drug abuse, concurrentmedication, cardiovascular disease, anemia, or thyroid disease, MR exclusioncriteria, and pregnancy. The week before the experiments, subjects wereobliged to follow a regular sleep–wake pattern with bedtimes between10:00 PM and 8:00 AM. Wrist actigraphy was assessed for the sleep depri-vation night and the following day.
Sleep Deprivation and Experimental Protocol. Subjects underwent two fMRImeasurements—once well-rested after normal sleep and once after sleepdeprivation—at 6:00 PM or 8:30 PM (randomized, two subjects scanned aftereach other, scanning time kept constant). During sleep deprivation, partic-ipants slept from 3:06 AM (± 1:36 h [SD]) until 6:48 AM (± 2:48 h [SD]), witha sleep duration of 3 h 42 min (± 1:40 h [SD]), and then stayed awake untilthe measurement the next evening. Such an early sleep deprivation protocol
may elicit an antidepressant response in distinct cases, particularly in youn-ger women (47). The experiments were performed with an interval of twodays. Participants had to abstain from caffeine and alcohol on the ex-perimental days. Assessments were performed at the neuroimaging centerof the Psychiatric Hospital of the University of Zurich and the Child andAdolescence Psychiatry, sleep deprivation was conducted at home.
EEG Recording During fMRI Scanning. Presence of wakefulness and sleepduring scanning was confirmed by standard polysomnographic recordingsusing a 32-channel MR-compatible EEG montage (Brain Products). Impe-dances were kept below 20 kΩ. In addition to online control for sleep, thepolysomnographic records were visually scored offline by two independentraters according to standard criteria (48).
To quantify the EEG during the 8-min resting-state intervals, records weresubjected to power spectral analysis. Data of all channels were filtered be-tween 0.3 and 35 Hz with a slope of 48 dB/oct and rereferenced to averagedmastoids. Artifacts were excluded. Power spectra between 0 and 25 Hz (fastFourier transform routine; 10% Hanning window; 0.2-s overlap) of artifact-free, 4-s EEG epochs sampled with 1,024 Hz were calculated with Brain VisionAnalyzer. Individual mean power across all channels was determined forthe following EEG bands: 0.5–4.5 Hz (delta), 4.5–8.0 Hz (theta), 8.0–11.0 Hz(alpha), 11.0–15 Hz (beta 1), and 15.0–25.0 Hz (beta 2).
Functional MRI Data Acquisition. Measurements were performed on a PhilipsAchieva 3.0T TX 3-tesla whole-body magnetic resonance unit equipped withan eight-channel head coil array. The subjects were told to lie still in thescanner with their eyes closed during the acquisition of resting-state data.The functional images were collected in 8-min runs (196 volumes) usinga sensitivity-encoded single-shot echo-planar sequence (TE = 20 ms; fieldof view = 22 cm; acquisition matrix = 88 × 85, interpolated to 96 × 96,voxel size = 2.50 × 2.50 × 2.50 mm3, reconstructed to 2.29 × 2.29 × 2.5 mm3,and sensitivity-encoded acceleration factor R = 2.5) sensitive to BOLD contrast(T2* weighting). Using a midsagittal scout image, 42 contiguous axial sliceswere placed along the anterior–posterior commissure plane covering theentire brain with a repetition time of 2,500 ms. A 3D T1-weighted anatomicalscan was obtained for structural reference.
Postprocessing and fMRI Data Analysis. Standard image data preparation andpreprocessing, as well as statistical analysis and visualization were performedwith the software BrainVoyager QX (Brain Innovation BV). Functional datapreprocessing included a correction for slice scan timing acquisition, a 3D rigidbody motion correction, a spatial smoothing (Gaussian kernel of 4 mm fullwidth half maximum), a temporal high-pass filter with cutoff set to two cyclesper time course, and a temporal low-pass filter (Gaussian kernel of 3 s).Structural and functional data were coregistered and spatially normalized tothe Talairach standard space using a 12-parameter affine transformation. Inthe course of this procedure, the functional images were resampled to anisometric 3-mm grid covering the entire Talairach box. Nuisance signals(global signal, white matter, and cerebrospinal fluid signals) were regressedout from each data set together with motion translation and rotation esti-mates after segmenting the entire brain, the white matter, and ventriclesfrom the normalized T1 volume.
A seed-based analysis (49, 50) was performed to study the functionalconnectivity from the PCC and DN to the entire brain similar to previousstudies (20, 23). A control seed region was defined by tracing a 6-mmradius sphere centered at (x = −8, y = −60, z = 21). This region was ana-tomically located in the precuneus (51), and fell slightly more posteriorly andmore inferiorly, albeit not overlapping, to the PCC seed. To compute func-tional connectivity maps corresponding to a selected seed region of interest(ROI), the mean regional time course was extracted from all ROI voxels andcorrelated against all voxels of the brain. Two ROIs were studied, the
Fig. 5. Comparison of the locations of the DMN-CCN spots of Fig. 1 after (A)normal wakefulness and (C) SD with the DN spots of Fig. 4 after (B) normalwakefulness and (D) SD. An axial cut was generated at the location of theDN spots, keeping the positive and negative correlations of the PCC seedoverlaid on the same average anatomy to show in detail the location ofthese spots with respect to the CCN spots.
Table 1. Results of EEG spectral analysis during fMRI scanning
Frequency range (Hz) Normal wakefulness (μV2) Sleep deprivation (μV2) Difference ± SEM t value P value
0.5–4.5 4.64 ± 0.57 5.28 ± 0.65 0.65 ± 0.64 1.01 0.334.5–8.0 4.29 ± 0.82 4.59 ± 0.78 0.30 ± 0.60 0.49 0.648.0–11.0 2.01 ± 0.42 2.06 ± 0.40 0.05 ± 0.21 0.23 0.8211.0–15.0 1.17 ± 0.21 1.26 ± 0.33 0.09 ± 0.24 0.38 0.7115.0–25.0 0.96 ± 0.81 0.87 ± 0.56 −0.09 ± 0.25 −0.35 0.74
Means ± SEM (n = 12) represent EEG spectral power values in consecutive frequency bands (delta, theta, alpha, and beta) averagedover all recording electrodes during fMRI scanning in normal wakefulness and sleep deprivation conditions.
Bosch et al. PNAS | November 26, 2013 | vol. 110 | no. 48 | 19601
NEU
ROSC
IENCE
definition of which was based on our previous work (23), and separatecorrelation maps were produced for each subject, condition, and ROI. Thecorrelation maps were applied the Fisher’s r-to-z transform z = 0.5 Ln[(1 + r)/(1 − r)] before entering a second-level random-effects statisticalanalysis where the main and differential effects of the two studiedconditions were summarized as t-statistic maps. This analysis was carriedout by treating the individual subject map values as random observa-tions at each voxel, thereby one- and two-sample t tests were performedat each voxel to map the whole-brain distribution of the seed-basedfunctional connectivity for the single condition and the difference be-tween the two conditions. The statistical maps were thresholded at P =0.05 (corrected for multiple comparisons) and overlaid on the averagenormalized T1 volume of all subjects. To correct for multiple comparisons in
the voxel-based analysis, regional effects resulting from the voxel-basedcomparative tests were only accepted for compact cluster surviving the jointapplication of a voxel- and cluster-level statistical threshold chosen witha nonparametric randomization approach. Namely, an initial voxel-levelthreshold was set to P = 0.005 (uncorrected) and a minimum cluster size wasestimated after 1,000 Monte Carlo simulations that protected against falsepositive clusters up to 5% (52).
ACKNOWLEDGMENTS. We acknowledge the support of the Clinical Re-search Priority Programs Sleep and Health and Molecular Imaging grantedby University of Zurich, as well as Dr. B. B. Quednow for his criticalcomments. The work was supported by Swiss National Science FoundationGrants 320030-135414 and PP00P1_133685.
1. Dallaspezia S, Benedetti F (2011) Chronobiological therapy for mood disorders. ExpertRev Neurother 11(7):961–970.
2. Pflug B, Tölle R (1971) Disturbance of the 24-hour rhythm in endogenous depressionand the treatment of endogenous depression by sleep deprivation. Int Pharmacop-sychiatry 6(3):187–196.
3. Gillin JC, Buchsbaum M, Wu J, Clark C, Bunney W, Jr. (2001) Sleep deprivation as amodel experimental antidepressant treatment: Findings from functional brain im-aging. Depress Anxiety 14(1):37–49.
4. Wu J, et al. (1999) Prediction of antidepressant effects of sleep deprivation by met-abolic rates in the ventral anterior cingulate and medial prefrontal cortex. Am JPsychiatry 156(8):1149–1158.
5. Wu JC, et al. (1992) Effect of sleep deprivation on brain metabolism of depressedpatients. Am J Psychiatry 149(4):538–543.
6. Wu JC, et al. (2008) Sleep deprivation PET correlations of Hamilton symptom im-provement ratings with changes in relative glucose metabolism in patients with de-pression. J Affect Disord 107(1-3):181–186.
7. Benedetti F, et al. (2007) Neural and genetic correlates of antidepressant response tosleep deprivation: A functional magnetic resonance imaging study of moral valencedecision in bipolar depression. Arch Gen Psychiatry 64(2):179–187.
8. Clark CP, et al. (2006) Improved anatomic delineation of the antidepressant responseto partial sleep deprivation in medial frontal cortex using perfusion-weighted func-tional MRI. Psychiatry Res 146(3):213–222.
9. Clark CP, Frank LR, Brown GG (2001) Sleep deprivation, EEG, and functional MRI indepression: Preliminary results. Neuropsychopharmacology 25(5, Suppl):S79–S84.
10. Raichle ME, Snyder AZ (2007) A default mode of brain function: A brief history of anevolving idea. Neuroimage 37(4):1083–1090, discussion 1097–1099.
11. Wang L, Hermens DF, Hickie IB, Lagopoulos J (2012) A systematic review of resting-state functional-MRI studies in major depression. J Affect Disord 142(1-3):6–12.
12. Broyd SJ, et al. (2009) Default-mode brain dysfunction in mental disorders: A sys-tematic review. Neurosci Biobehav Rev 33(3):279–296.
13. Buckner RL, Andrews-Hanna JR, Schacter DL (2008) The brain’s default network:Anatomy, function, and relevance to disease. Ann N Y Acad Sci 1124:1–38.
14. Fox MD, Raichle ME (2007) Spontaneous fluctuations in brain activity observed withfunctional magnetic resonance imaging. Nat Rev Neurosci 8(9):700–711.
15. Raichle ME, et al. (2001) A default mode of brain function. Proc Natl Acad Sci USA98(2):676–682.
16. Niendam TA, et al. (2012) Meta-analytic evidence for a superordinate cognitivecontrol network subserving diverse executive functions. Cogn Affect Behav Neurosci12(2):241–268.
17. Yu C, et al. (2011) Functional segregation of the human cingulate cortex is confirmedby functional connectivity based neuroanatomical parcellation. Neuroimage 54(4):2571–2581.
18. Bush G, Luu P, Posner MI (2000) Cognitive and emotional influences in anterior cin-gulate cortex. Trends Cogn Sci 4(6):215–222.
19. Ongür D, Ferry AT, Price JL (2003) Architectonic subdivision of the human orbital andmedial prefrontal cortex. J Comp Neurol 460(3):425–449.
20. Sheline YI, Price JL, Yan Z, Mintun MA (2010) Resting-state functional MRI in de-pression unmasks increased connectivity between networks via the dorsal nexus. ProcNatl Acad Sci USA 107(24):11020–110.
21. De Havas JA, Parimal S, Soon CS, Chee MW (2012) Sleep deprivation reduces defaultmode network connectivity and anti-correlation during rest and task performance.Neuroimage 59(2):1745–1751.
22. Sämann PG, et al. (2010) Increased sleep pressure reduces resting state functionalconnectivity. MAGMA 23(5-6):375–389.
23. Scheidegger M, et al. (2012) Ketamine decreases resting state functional networkconnectivity in healthy subjects: Implications for antidepressant drug action. PLoSONE 7(9):e44799.
24. Gujar N, Yoo SS, Hu P, Walker MP (2010) The unrested resting brain: Sleep deprivationalters activity within the default-mode network. J Cogn Neurosci 22(8):1637–1648.
25. Price JL, Drevets WC (2010) Neurocircuitry of mood disorders. Neuropsychopharmacology35(1):192–216.
26. Drevets WC, Price JL, Furey ML (2008) Brain structural and functional abnormalities inmood disorders: Implications for neurocircuitry models of depression. Brain StructFunct 213(1-2):93–118.
27. Drevets WC, Savitz J, Trimble M (2008) The subgenual anterior cingulate cortex in
mood disorders. CNS Spectr 13(8):663–681.28. Kühn S, Vanderhasselt MA, De Raedt R, Gallinat J (2012) Why ruminators won’t stop:
The structural and resting state correlates of rumination and its relation to de-
pression. J Affect Disord 141(2-3):352–360.29. Sheline YI, et al. (2009) The default mode network and self-referential processes in
depression. Proc Natl Acad Sci USA 106(6):1942–1947.30. Greicius MD, et al. (2007) Resting-state functional connectivity in major depression:
Abnormally increased contributions from subgenual cingulate cortex and thalamus.
Biol Psychiatry 62(5):429–437.31. Zhu X, et al. (2012) Evidence of a dissociation pattern in resting-state default mode
network connectivity in first-episode, treatment-naive major depression patients. Biol
Psychiatry 71(7):611–617.32. Hamilton JP, et al. (2011) Default-mode and task-positive network activity in major
depressive disorder: Implications for adaptive and maladaptive rumination. Biol
Psychiatry 70(4):327–333.33. Grimm S, et al. (2009) Altered negative BOLD responses in the default-mode network
during emotion processing in depressed subjects. Neuropsychopharmacology 34(4):
932–943.34. Grimm S, et al. (2011) Reduced negative BOLD responses in the default-mode net-
work and increased self-focus in depression. World J Biol Psychiatry 12(8):627–637.35. McCabe C, et al. (2011) SSRI administration reduces resting state functional connec-
tivity in dorso-medial prefrontal cortex. Mol Psychiatry 16(6):592–594.36. Baxter LR, Jr., et al. (1989) Reduction of prefrontal cortex glucose metabolism com-
mon to three types of depression. Arch Gen Psychiatry 46(3):243–250.37. Bench CJ, et al. (1992) The anatomy of melancholia—Focal abnormalities of cerebral
blood flow in major depression. Psychol Med 22(3):607–615.38. Cohen RM, et al. (1989) Evidence for common alterations in cerebral glucose me-
tabolism in major affective disorders and schizophrenia. Neuropsychopharmacology
2(4):241–254.39. Mayberg HS (1994) Frontal lobe dysfunction in secondary depression. J Neuropsychiatry
Clin Neurosci 6(4):428–442.40. Mayberg HS (1997) Limbic-cortical dysregulation: A proposed model of depression.
J Neuropsychiatry Clin Neurosci 9(3):471–481.41. Mayberg HS, Lewis PJ, Regenold W, Wagner HN, Jr. (1994) Paralimbic hypoperfusion
in unipolar depression. J Nucl Med 35(6):929–934.42. BuchsbaumMS, et al. (1997) Effect of sertraline on regional metabolic rate in patients
with affective disorder. Biol Psychiatry 41(1):15–22.43. Kennedy SH, et al. (2001) Changes in regional brain glucose metabolism measured
with positron emission tomography after paroxetine treatment of major depression.
Am J Psychiatry 158(6):899–905.44. Drummond SP, et al. (2000) Altered brain response to verbal learning following sleep
deprivation. Nature 403(6770):655–657.45. Lévesque J, et al. (2003) Neural circuitry underlying voluntary suppression of sadness.
Biol Psychiatry 53(6):502–510.46. Liotti M, et al. (2000) Differential limbic–cortical correlates of sadness and anxiety in
healthy subjects: Implications for affective disorders. Biol Psychiatry 48(1):30–42.47. Parry BL, et al. (2000) Can critically timed sleep deprivation be useful in pregnancy
and postpartum depressions? J Affect Disord 60(3):201–212.48. Iber C, Ancoli-Israel S, Chessonn A, Quan S (2007) The AASM Manual for the Scoring
of Sleep and Associated Events: Rules, Terminology and Technical Specifications
(AASM, Westchester, IL), 1st Ed.49. Joel SE, Caffo BS, van Zijl PC, Pekar JJ (2011) On the relationship between seed-based
and ICA-based measures of functional connectivity. Magn Reson Med 66(3):644–657.50. Fox MD, et al. (2005) The human brain is intrinsically organized into dynamic, anti-
correlated functional networks. Proc Natl Acad Sci USA 102(27):9673–9678.51. Cavanna AE, Trimble MR (2006) The precuneus: A review of its functional anatomy
and behavioural correlates. Brain 129(Pt 3):564–583.52. Forman SD, et al. (1995) Improved assessment of significant activation in functional
magnetic resonance imaging (fMRI): Use of a cluster-size threshold.Magn Reson Med
33(5):636–647.
19602 | www.pnas.org/cgi/doi/10.1073/pnas.1317010110 Bosch et al.