March 2019 Roecliffe and Westwick neighbourhood plan pre ...
Health & Place 17 (2011) 633–640
Contents lists available at ScienceDirect
Health & Place
1353-82
doi:10.1
n Corr
E-m
journal homepage: www.elsevier.com/locate/healthplace
Neighbourhood deprivation and physical activity in UK older adults
Fox K.R.a,n, Hillsdon M.b, Sharp D.c, Cooper A.R.a, Coulson J.C.a, Davis M.a, Harris R.d, McKenna J.e,Narici M.f, Stathi A.g, Thompson J.L.a
a Centre for Exercise, Nutrition and Health Sciences, University of Bristol, Tyndall Avenue, Bristol BS8 1TN, UKb School for Sport and Health Sciences, University of Exeter, UKc Department of Primary Health Care, University of Bristol, UKd School of Geographical Sciences, University of Bristol, UKe Carnegie Faculty of Sport & Education, Leeds Metropolitan University, Leeds, UKf Institute for Biomedical Research into Human Movement and Health, Manchester Metropolitan University, UKg Department of Sport and Exercise Science, University of Bath, Bath, UK
a r t i c l e i n f o
Article history:
Received 14 April 2010
Received in revised form
24 December 2010
Accepted 6 January 2011Available online 13 January 2011
Keywords:
Older adults
Physical activity
Multiple deprivation
Physical function
Accelerometry
92/$ - see front matter & 2011 Elsevier Ltd. A
016/j.healthplace.2011.01.002
esponding author. Tel.: +44 117 331 1153; fa
ail address: [email protected] (Fox).
a b s t r a c t
The benefits of regular physical activity for older adults are now well-established but this group remain
the least active sector of the population. In this paper, the association between levels of neighbourhood
deprivation and physical activity was assessed. A sample of 125 males with a mean age of 77.5 (75.6)
years, and 115 females with a mean age of age 78.6 (78.6) underwent 7-day accelerometry, a physical
performance battery, and completed a daily journeys log. Univariate associations between physical
activity parameters and level of deprivation of neighbourhood were extinguished in regression models
controlling for age, gender, and level of educational attainment. Age, gender, educational attainment,
body mass index, physical function, and frequency of journeys from the home explained between 50%
and 54% of variance in activity parameters. These results suggest the importance of strategies to help
older adults maintain physical function, healthy weight, and remain active in their communities.
& 2011 Elsevier Ltd. All rights reserved.
1. Introduction
The burden of long term health care for the elderly is creatingdemand for strategies that can extend health, improve functionalcapacity, and maintain independence deeper into older age.Prevention of disease and disability would decrease health carecosts and provide a higher quality of life for a larger proportion ofelders, regardless of effect on longevity. However, recent evidencefrom the United States indicates that disability mobility, indicatedby difficulty with walking half a mile, is increasing in the 60–80year old age range (Seeman et al., 2010).
The benefits of physical activity for the prevention of cardio-vascular disease, stroke, type 2 diabetes, and some cancers arenow well-established and these benefits are experienced in olderage where incidence of many diseases and disabilities increases(Department of Health, 2004; US Department of Health andHuman Services, 2008; World Health Organisation, 2007).Furthermore, the evidence base is now indicating that physicalactivity reduces risk of mental disorders common in older ageincluding depression, cognitive decline, and dementia (Hamer &
ll rights reserved.
x: +44 117 331 1148.
Chida, 2009). Recent evidence also suggests that long periods ofuninterrupted sitting, which are more common in the elderly,may have a detrimental effect on health independent of low levelsof physical activity (Hamilton et al., 2007). Physical activityimproves physical mobility or delays its loss (The Life StudyInvestigators, 2006) and can also improve executive elements ofcognitive function (Angevaren et al., 2008). The public health casefor engaging older people in physical activity is therefore convin-cing and becoming widely accepted.
Unfortunately, older people are the least active sector ofsociety with less than 30% of 65–74-year-old and less than 15%of adults aged 75 and over reporting any sport and exerciselasting at least 10 min in the previous four weeks (Craig et al.,2009). Inactivity is not inevitable as a small percentage of olderpeople maintain high levels of activity, fitness, and athleticperformance. Furthermore, in some cultures such as in South-East Asia, the older population, through daily activities such as TaiChi, remain as active in their leisure time as younger generations(Ku et al., 2006). Activity patterns are therefore in part a functionof societal expectations and circumstances and are amenable tochange.
Reviews of a substantial body of research indicate that enga-ging older adults in formal programmes of structured exercise canimprove physical and cognitive function, reverse or slow muscle

K.R. Fox et al. / Health & Place 17 (2011) 633–640634
wastage and disability, and reduce falls in those at risk of falling(Department of Health and Human Services, 2008; Salem et al.,2009). There is sufficient evidence to show that engaging olderadults in exercise classes, for three or more times a week isbeneficial for building cardiovascular fitness, strength, walkingcapacity, mobility, and neuromuscular coordination (Departmentof Health and Human Services, 2008). However, less is knownabout daily physical activity in older adults involving walking orcycling in and around their local community. ‘Getting out andabout’ may be an important source of health-enhancing activity,may assist with maintenance of physical function and preventionof disease, and also may be critical for independence, social well-being, and quality of life of older people as it is associated withaccessibility to communities and social networks (Addy, Wilsonet al., 2004; Leyden, 2003; Richard, Gauvin et al., 2009). Given lowlevels of daily activity and its health burden, it is surprising thatonly recently has research focussed on older people’s ‘free living’patterns, levels, and modes of physical activity and theirdeterminants.
Socio-ecological models (Sallis & Owen, 2002) have beenadopted to provide a better understanding of the environmental(characteristics of built or rural residential areas), socio-demo-graphic and psycho-social factors influencing physical activity.Within these models, indicators of locality ‘walkability’, access toa range of amenities, and safety have been related to physicalactivity across the adult population (Ball, Timperio, & Crawford,2006) and in older adults (Berke et al., 2007). Additionally,relationships between perceptions of characteristics of the neigh-bourhood and physical activity have been investigated (Duncan,Spence, & Mummery, 2005).
Social, educational, and health inequalities associated withneighbourhood and community deprivation in England haverecently been brought back into focus through the Marmotreport—Fair Society, Healthy Lives (2010). The need for healthyand sustainable places and communities that support activetravel, use of green spaces, social capital, and community parti-cipation was emphasised. One way of capturing ‘quality of place’is through the Index of Multiple Deprivation (IMD) in England butthis has rarely been studied specifically with regard to itsinfluence on the physical activity of older adults. Higher affluencemay lead to greater reliance on cars. On the other hand, higherlevels of crime or limited availability of good quality green spacemay limit activity in highly deprived areas.
One of the few studies investigating the impact of deprivationon older people’s activity was recently conducted by Annear et al.(2009). They demonstrated that self-reported leisure-time physi-cal activity was lower in a neighbourhood of higher deprivation inNew Zealand when compared to a low deprivation area. However,self-reported activity, particularly incidental daily movementderived from shopping and other errands, is difficult to measurewith precision, especially in older people because of poorermemory (Harris et al., 2009a,b; Sims et al., 1999). In contrast,objective measures such as accelerometry provide a more accu-rate record of daily physical activity volume (movement countsper minute, steps walked per day, sedentary time) and intensityof activity (amount of moderate to vigorous activity), which ishighly time resolved. There are few studies where accelerometryhas been used to assess the physical activity of large representa-tive groups of older adults. In the US, the National Health andNutritional Examination Survey (NHANES) recently collectedaccelerometer data from 704 adults aged 70 years or over(Troiano et al., 2008) and accelerometer-derived steps countsfrom 363 adults aged 70–79 years and 264 adults of 80 years ormore (Tudor-Locke, Johnson, and Katzmarzyk , 2009). In the UK,the Health Survey for England (2008) reported accelerometer datafrom 336 adults aged 65–74 years and 242 adults aged 75 years or
over (The Health and Social Care Information Centre, 2009).To our knowledge only one published paper has provided linkswith neighbourhood characteristics. Cheng et al. (2007) collectedaccelerometry data from a sub-sample of 136 older adults inHong Kong but their reporting was restricted to age groupdifferences.
Project Older People and Active Living (OPAL) was designed toprovide a comprehensive assessment of patterns and levels ofphysical activity, functionality, well-being, and perceptions ofneighbourhood in a cohort of older adults (70 years and above)recruited from neighbourhoods of high, medium and low depri-vation. The aim of this paper was to investigate the associationbetween neighbourhood deprivation and physical activity and totake account of potential confounding variables.
2. Method
2.1. Recruitment framework
Twelve general medical practices, distributed within the cityboundaries of Bristol, were selected to reflect localities of low,medium, and high level of deprivation high or low proximity toamenities (defined as the nearest store). The Index of MultipleDeprivation (IMD) is an indicator used to characterise the depri-vation of Lower Level Super Output Areas (LSOAs) in the UK basedon several factors including: income, employment, health, educa-tion, housing, environment, and crime (Social DisadvantageResearch Centre, 2004). IMD for each practice was calculated asthe mean of the IMD scores of the output areas that patients camefrom weighted by the number of patients from each output area.One component of IMD is distance to the nearest store (from theLSOA centroid). Practices with high volumes of patients from‘‘near’’ or ‘‘far’’ (‘‘near’’ o0.39 k, ‘‘far’’ 41.49 k) were deemedeligible for recruitment. This produced a six-cell sampling frame-work (low, medium, and high IMD x low or high proximity to ashop) with two practices per cell.
2.2. Participants
Patients (Z70 years) were randomly selected on a rolling basisfrom patient lists. Those meeting inclusion criteria, as verified bytheir General Practitioners (GPs), were mailed an invitation letter,information pamphlet, and consent form by the practice adminis-trator. Emphasis was placed on inclusivity in order to attract a fullrange of levels of health, physical function, and physical activity.Exclusion criteria were minimal and included: (1) bereavementwithin the last two months; (2) terminally ill; (3) suffering frommoderate to advanced dementia or other debilitating mental illness;(4) unable to complete a questionnaire with assistance; (5) sufferingfrom an illness that would put the patient at risk by participating;and (6) other reasons seen by the GP as relevant. The study wasapproved by the Bristol Southmead National Health ServiceResearch Ethics Committee (06/Q2002/127).
2.3. Measures
Participant characteristics. Age, gender, type of housing, andeducation level attained, were recorded through questionnaire.
Physical activity. Physical activity was measured for one week ofwaking time using an accelerometer (Actigraph GT1M) programmedto record activity in 10 s epochs recording both movement countsand steps taken. Participants were asked to wear the Actigraph forseven days and also keep a log of days and times when the Actigraphwas worn or removed. Actigraph data were downloaded usingActilife Lifestyle Monitoring System v. 3.1.3 software. Files failing
K.R. Fox et al. / Health & Place 17 (2011) 633–640 635
to meet the inclusion criteria – at least 10 h of monitoring on at leastfive days – were excluded from analysis. Data were reduced usingMAH/UFFE Analyser v. 1.9.0.3(MRC Epidemiology Unit ) set to ignoreruns of 100 or more zeros. Variables used for these analysesincluded mean daily activity counts per minute (CPM), mean dailysteps, and mean daily minutes of moderate or vigorous activity(Z1952 CPM) (MVPA). Although there is controversy over theprecise level of counts which indicate the lower level of moderateintensity physical activity in older adults, it was felt that thisparameter at least provides some indicator of when a higher levelof intensity activity is being performed.
In addition, participants completed a daily journeys log forseven days recording the time, purpose (options were: shopping,personal business (e.g., banking or posting letters), visiting friendsor family, sport or exercise, day trip or excursion, going for a walkor walking the dog, escorting a friend or relative, work orvolunteer activity, entertainment or going out to eat or drink, orother) and mode of transport (e.g., walking, cycling, driving, carpassenger, bus, train, or ‘‘other’’) for each journey from theirresidence. Data were tabulated and reduced to provide a meannumber of daily journeys.
Physical function. This was assessed using the Short PhysicalPerformance Battery (SPPB) (Guralnik et al., 1994) which includeshome-based tests of leg strength, gait speed, and balance. Addi-tionally, height and body mass were measured.
A bank of other variables was also collected through question-naires. These included standard measures of perceptions of theneighbourhood including walkability, distance to a range of localamenities, quality of life, subjective well-being, and life satisfaction.
2.4. Procedures
Data were collected over a 15-month period in 2007/2008.Consenting participants were telephoned and two home visits, aweek apart and between 60 and 90 min in duration werescheduled. During visit 1, two researchers provided instructionson the accelerometer and daily journey log, conducted thephysical function tests, measured height and weight, and withthe support of prompt cards, administered the first part of thequestionnaire battery. During visit 2, one researcher collected theaccelerometer and log, and completed administration of thequestionnaire.
2.5. Analyses
For the purposes of univariate and multivariate models, agegroups (70–74, 75–79, 80–84, 85+ years), highest level of educa-tion groups (less than secondary, secondary, higher), BMI groups(underweight and normal weight¼ o25, overweight¼25–29.9,and obese¼30+) were formed. Additionally, the three physicalfunction scores were totalled and grouped according to Guralniket al. (1994) (low¼2–6, medium¼7–9, high¼10–12). Quartiles ofIMD of participants’ residence were used for analyses. Frequencyof trips from the house per week (0–6, 7–8, 9–13, 147) and
Table 1Sample numbers by age and practice IMD categories.
Practice deprivationlevel (IMD)
Male age groups
70–74 75–79 80–84 85+
High 13 6 5 4
Medium 17 14 12 7
Low 23 12 8 4
Total 53 32 25 15
distance to the nearest shop from the centroid of the lowersuper output area for each participant’s home (0.27–0.63 km,0.64–1.07 km, 1.08–6.52 km) were also categorised. Both totalCPM and MVPA were positively skewed and were log transformed(ln) to improve the normality of their distribution.
The unadjusted association between respondent characteris-tics and neighbourhood deprivation was examined using chisquared analyses. The unadjusted associations between indepen-dent and dependent variables were examined using one-wayANOVA. Each independent variable with a p-value o0.05 in theANOVA was entered into a series of ordinary least squaresregression models to examine the association between the inde-pendent variables and three measures of physical activity.
3. Results
Of the 1324 older adults who were randomly sampled, 1175met inclusion criteria and were invited by letter to participate. Ofthese, 240 entered the study representing 20.4% of those invited.All participants completed the study. The final sample comprised125 males (52%) with a mean age of 77.5 (75.6) years, and 115females with a mean age of age 78.6 (78.6) years. However,incomplete or faulty accelerometer data were provided by tenparticipants reducing the sample size to 230 for most analyses.Table 1 shows the recruitment matrix by practice level of IMD(high, medium, low), age group (young 70–79, old 80+), andgender. The age and gender of the sample differed minimally fromthe patient lists from which they were selected (differences inproportions between pooled practice lists and recruits in each ageand gender group: 70–74y �6.5% M �4.4% F, 75–84y +4.4% M,�7.0% F, 85–89y +0.9% M +7.8% F, 90+y +1.2% M +3.6% F). Thepercentages who were either overweight or obese were similar tothose from national samples (Craig et al., 2009). Also, the IMDs ofparticipants’ residence provided a fair representation of thequartiles for the IMD distribution in England http://www.communities.gov.uk/communities/neighbourhoodrenewal/deprivation/deprivation07) with 22.1%, 27.9%, 31.3%, and 18.7% of the OPALsample falling in the lowest to highest national quartiles, respec-tively. While data collection was not evenly distributed across theseasons (37% in summer), there were no significant differences(Pearson w2
¼16.4, p4 .05) in the proportions of participants fromeach IMD quartile for individual seasons and only weak seasonaleffects (r¼0.15 for hours sunshine/month and r¼0.13 for meanmonthly temperature) for light levels of physical activity and norelationship for steps per day, CPM or MVPA.
3.1. Characteristics of IMD groups
Table 2 indicates no significant difference in age group or genderdistribution among the quartiles of the IMDs of participants’residence. However, there was a strong contrast between the twolow and high IMD groups for highest level of education reached. Thehigher two IMD groups had 40% of participants not reachingsecondary level and only 16% experiencing higher education.
Female age groups
70–74 75–79 80–84 85+ Total
7 6 12 4 5712 15 10 5 9214 12 14 4 9133 33 36 13 240
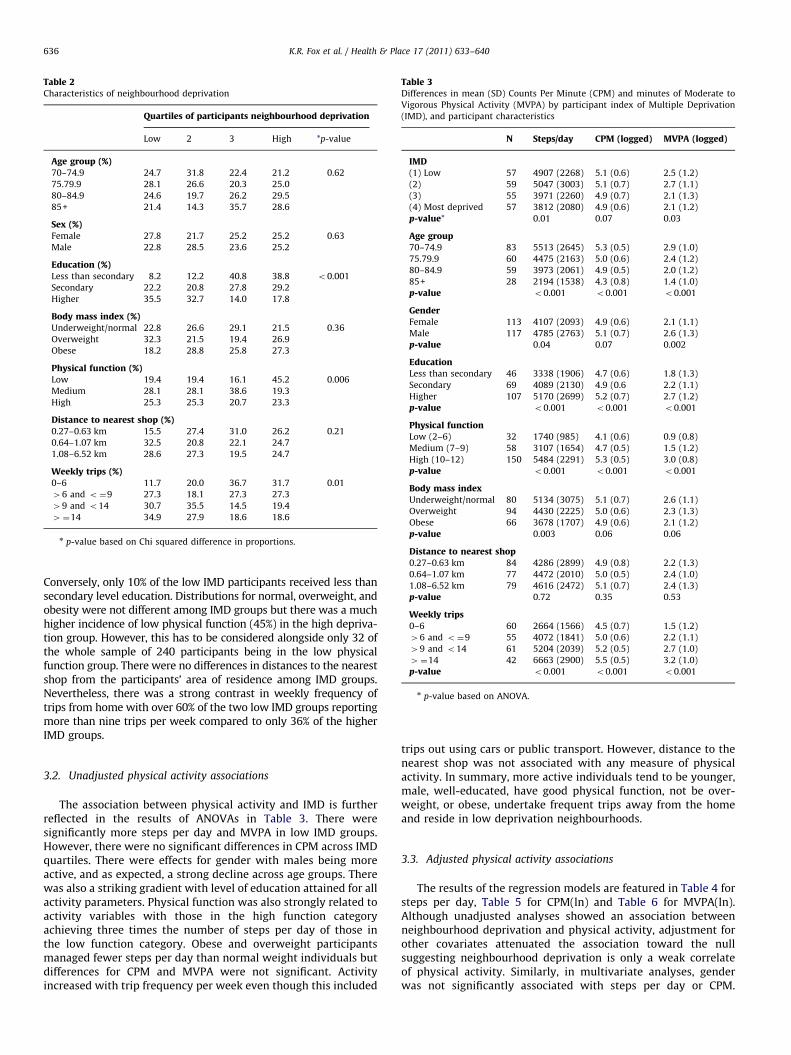
Table 2Characteristics of neighbourhood deprivation
Quartiles of participants neighbourhood deprivation
Low 2 3 High *p-value
Age group (%)70–74.9 24.7 31.8 22.4 21.2 0.62
75.79.9 28.1 26.6 20.3 25.0
80–84.9 24.6 19.7 26.2 29.5
85+ 21.4 14.3 35.7 28.6
Sex (%)Female 27.8 21.7 25.2 25.2 0.63
Male 22.8 28.5 23.6 25.2
Education (%)Less than secondary 8.2 12.2 40.8 38.8 o0.001
Secondary 22.2 20.8 27.8 29.2
Higher 35.5 32.7 14.0 17.8
Body mass index (%)Underweight/normal 22.8 26.6 29.1 21.5 0.36
Overweight 32.3 21.5 19.4 26.9
Obese 18.2 28.8 25.8 27.3
Physical function (%)Low 19.4 19.4 16.1 45.2 0.006
Medium 28.1 28.1 38.6 19.3
High 25.3 25.3 20.7 23.3
Distance to nearest shop (%)0.27–0.63 km 15.5 27.4 31.0 26.2 0.21
0.64–1.07 km 32.5 20.8 22.1 24.7
1.08–6.52 km 28.6 27.3 19.5 24.7
Weekly trips (%)0–6 11.7 20.0 36.7 31.7 0.01
46 and o¼9 27.3 18.1 27.3 27.3
49 and o14 30.7 35.5 14.5 19.4
4¼14 34.9 27.9 18.6 18.6
n p-value based on Chi squared difference in proportions.
Table 3Differences in mean (SD) Counts Per Minute (CPM) and minutes of Moderate to
Vigorous Physical Activity (MVPA) by participant index of Multiple Deprivation
(IMD), and participant characteristics
N Steps/day CPM (logged) MVPA (logged)
IMD(1) Low 57 4907 (2268) 5.1 (0.6) 2.5 (1.2)
(2) 59 5047 (3003) 5.1 (0.7) 2.7 (1.1)
(3) 55 3971 (2260) 4.9 (0.7) 2.1 (1.3)
(4) Most deprived 57 3812 (2080) 4.9 (0.6) 2.1 (1.2)
p-value* 0.01 0.07 0.03
Age group70–74.9 83 5513 (2645) 5.3 (0.5) 2.9 (1.0)
75.79.9 60 4475 (2163) 5.0 (0.6) 2.4 (1.2)
80–84.9 59 3973 (2061) 4.9 (0.5) 2.0 (1.2)
85+ 28 2194 (1538) 4.3 (0.8) 1.4 (1.0)
p-value o0.001 o0.001 o0.001
GenderFemale 113 4107 (2093) 4.9 (0.6) 2.1 (1.1)
Male 117 4785 (2763) 5.1 (0.7) 2.6 (1.3)
p-value 0.04 0.07 0.002
EducationLess than secondary 46 3338 (1906) 4.7 (0.6) 1.8 (1.3)
Secondary 69 4089 (2130) 4.9 (0.6 2.2 (1.1)
Higher 107 5170 (2699) 5.2 (0.7) 2.7 (1.2)
p-value o0.001 o0.001 o0.001
Physical functionLow (2–6) 32 1740 (985) 4.1 (0.6) 0.9 (0.8)
Medium (7–9) 58 3107 (1654) 4.7 (0.5) 1.5 (1.2)
High (10–12) 150 5484 (2291) 5.3 (0.5) 3.0 (0.8)
p-value o0.001 o0.001 o0.001
Body mass indexUnderweight/normal 80 5134 (3075) 5.1 (0.7) 2.6 (1.1)
Overweight 94 4430 (2225) 5.0 (0.6) 2.3 (1.3)
Obese 66 3678 (1707) 4.9 (0.6) 2.1 (1.2)
p-value 0.003 0.06 0.06
Distance to nearest shop0.27–0.63 km 84 4286 (2899) 4.9 (0.8) 2.2 (1.3)
0.64–1.07 km 77 4472 (2010) 5.0 (0.5) 2.4 (1.0)
1.08–6.52 km 79 4616 (2472) 5.1 (0.7) 2.4 (1.3)
p-value 0.72 0.35 0.53
Weekly trips0–6 60 2664 (1566) 4.5 (0.7) 1.5 (1.2)
46 and o¼9 55 4072 (1841) 5.0 (0.6) 2.2 (1.1)
49 and o14 61 5204 (2039) 5.2 (0.5) 2.7 (1.0)
4¼14 42 6663 (2900) 5.5 (0.5) 3.2 (1.0)
p-value o0.001 o0.001 o0.001
n p-value based on ANOVA.
K.R. Fox et al. / Health & Place 17 (2011) 633–640636
Conversely, only 10% of the low IMD participants received less thansecondary level education. Distributions for normal, overweight, andobesity were not different among IMD groups but there was a muchhigher incidence of low physical function (45%) in the high depriva-tion group. However, this has to be considered alongside only 32 ofthe whole sample of 240 participants being in the low physicalfunction group. There were no differences in distances to the nearestshop from the participants’ area of residence among IMD groups.Nevertheless, there was a strong contrast in weekly frequency oftrips from home with over 60% of the two low IMD groups reportingmore than nine trips per week compared to only 36% of the higherIMD groups.
3.2. Unadjusted physical activity associations
The association between physical activity and IMD is furtherreflected in the results of ANOVAs in Table 3. There weresignificantly more steps per day and MVPA in low IMD groups.However, there were no significant differences in CPM across IMDquartiles. There were effects for gender with males being moreactive, and as expected, a strong decline across age groups. Therewas also a striking gradient with level of education attained for allactivity parameters. Physical function was also strongly related toactivity variables with those in the high function categoryachieving three times the number of steps per day of those inthe low function category. Obese and overweight participantsmanaged fewer steps per day than normal weight individuals butdifferences for CPM and MVPA were not significant. Activityincreased with trip frequency per week even though this included
trips out using cars or public transport. However, distance to thenearest shop was not associated with any measure of physicalactivity. In summary, more active individuals tend to be younger,male, well-educated, have good physical function, not be over-weight, or obese, undertake frequent trips away from the homeand reside in low deprivation neighbourhoods.
3.3. Adjusted physical activity associations
The results of the regression models are featured in Table 4 forsteps per day, Table 5 for CPM(ln) and Table 6 for MVPA(ln).Although unadjusted analyses showed an association betweenneighbourhood deprivation and physical activity, adjustment forother covariates attenuated the association toward the nullsuggesting neighbourhood deprivation is only a weak correlateof physical activity. Similarly, in multivariate analyses, genderwas not significantly associated with steps per day or CPM.
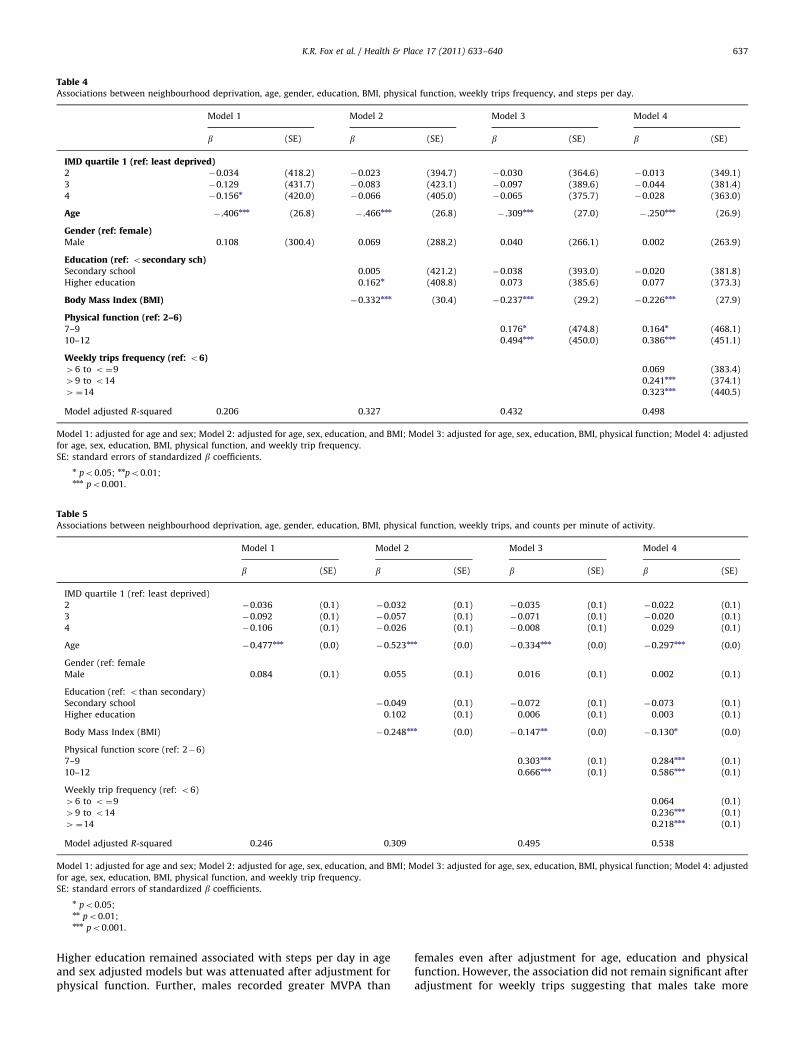
Table 4Associations between neighbourhood deprivation, age, gender, education, BMI, physical function, weekly trips frequency, and steps per day.
Model 1 Model 2 Model 3 Model 4
b (SE) b (SE) b (SE) b (SE)
IMD quartile 1 (ref: least deprived)2 �0.034 (418.2) �0.023 (394.7) �0.030 (364.6) �0.013 (349.1)
3 �0.129 (431.7) �0.083 (423.1) �0.097 (389.6) �0.044 (381.4)
4 �0.156n (420.0) �0.066 (405.0) �0.065 (375.7) �0.028 (363.0)
Age � .406nnn (26.8) � .466nnn (26.8) � .309nnn (27.0) � .250nnn (26.9)
Gender (ref: female)Male 0.108 (300.4) 0.069 (288.2) 0.040 (266.1) 0.002 (263.9)
Education (ref: osecondary sch)Secondary school 0.005 (421.2) �0.038 (393.0) �0.020 (381.8)
Higher education 0.162n (408.8) 0.073 (385.6) 0.077 (373.3)
Body Mass Index (BMI) �0.332nnn (30.4) �0.237nnn (29.2) �0.226nnn (27.9)
Physical function (ref: 2–6)7–9 0.176n (474.8) 0.164n (468.1)
10–12 0.494nnn (450.0) 0.386nnn (451.1)
Weekly trips frequency (ref: o6)46 to o¼9 0.069 (383.4)
49 to o14 0.241nnn (374.1)
4¼14 0.323nnn (440.5)
Model adjusted R-squared 0.206 0.327 0.432 0.498
Model 1: adjusted for age and sex; Model 2: adjusted for age, sex, education, and BMI; Model 3: adjusted for age, sex, education, BMI, physical function; Model 4: adjusted
for age, sex, education, BMI, physical function, and weekly trip frequency.
SE: standard errors of standardized b coefficients.
n po0.05; nnpo0.01;nnn po0.001.
Table 5Associations between neighbourhood deprivation, age, gender, education, BMI, physical function, weekly trips, and counts per minute of activity.
Model 1 Model 2 Model 3 Model 4
b (SE) b (SE) b (SE) b (SE)
IMD quartile 1 (ref: least deprived)
2 �0.036 (0.1) �0.032 (0.1) �0.035 (0.1) �0.022 (0.1)
3 �0.092 (0.1) �0.057 (0.1) �0.071 (0.1) �0.020 (0.1)
4 �0.106 (0.1) �0.026 (0.1) �0.008 (0.1) 0.029 (0.1)
Age �0.477nnn (0.0) �0.523nnn (0.0) �0.334nnn (0.0) �0.297nnn (0.0)
Gender (ref: female
Male 0.084 (0.1) 0.055 (0.1) 0.016 (0.1) 0.002 (0.1)
Education (ref: othan secondary)
Secondary school �0.049 (0.1) �0.072 (0.1) �0.073 (0.1)
Higher education 0.102 (0.1) 0.006 (0.1) 0.003 (0.1)
Body Mass Index (BMI) �0.248nnn (0.0) �0.147nn (0.0) �0.130n (0.0)
Physical function score (ref: 2�6)
7–9 0.303nnn (0.1) 0.284nnn (0.1)
10–12 0.666nnn (0.1) 0.586nnn (0.1)
Weekly trip frequency (ref: o6)
46 to o¼9 0.064 (0.1)
49 to o14 0.236nnn (0.1)
4¼14 0.218nnn (0.1)
Model adjusted R-squared 0.246 0.309 0.495 0.538
Model 1: adjusted for age and sex; Model 2: adjusted for age, sex, education, and BMI; Model 3: adjusted for age, sex, education, BMI, physical function; Model 4: adjusted
for age, sex, education, BMI, physical function, and weekly trip frequency.
SE: standard errors of standardized b coefficients.
n po0.05;nn po0.01;nnn po0.001.
K.R. Fox et al. / Health & Place 17 (2011) 633–640 637
Higher education remained associated with steps per day in ageand sex adjusted models but was attenuated after adjustment forphysical function. Further, males recorded greater MVPA than
females even after adjustment for age, education and physicalfunction. However, the association did not remain significant afteradjustment for weekly trips suggesting that males take more

Table 6Associations between neighbourhood deprivation, age, gender, education, BMI, physical function, weekly trips, and moderate-to-vigorous physical activity.
Model 1 Model 2 Model 3 Model 4
b (SE) b (SE) b (SE) b (SE)
IMD quartile 1 (ref: least deprived)
2 0.006 (0.2) 0.008 (0.2) �0.006 (0.2) �0.004 (0.2)
3 �0.101 (0.2) �0.046 (0.2) �0.060 (0.2) �0.034 (0.2)
4 �0.109 (0.2) �0.038 (0.2) �0.038 (0.2) �0.015 (0.2)
Age �0.412nnn (0.0) �0.451nnn (0.0) �0.251nnn (0.0) �0.214nn (0.0)
Gender (ref: female)
Male 0.166nn (0.1) 0.125nn (0.1) 0.077 (0.1) 0.061 (0.1)
Education (ref: othan secondary school)
Secondary school 0.025 (0.2) �0.022 (0.2) �0.016 (0.2)
Higher education 0.159 (0.2) 0.036 (0.2) 0.036 (0.2)
Body Mass Index (BMI) �0.246 (0.0) �0.128n (0.0) �0.114n (0.0)
Physical function score (ref: 2–6)
7–9 0.201nn (0.2) 0.192n (0.2)
10–12 0.660nnn (0.2) 0.593nnn (0.2)
Weekly trips frequency (ref: o6)
46 to o¼9 0.059 (0.2)
49 to o14 0.191nn (0.2)
4¼14 0.191nn (0.2)
Adjusted R-squared 0.224 0.290 0.503 0.524
Model 1: adjusted for age and sex; Model 2: adjusted for age, sex, education, and BMI; Model 3: adjusted for age, sex, education, and BMI, physical function; Model 4:
adjusted for age, sex, education, BMI, physical function, and weekly trip frequency.
SE: standard errors of standardized b coefficients.
n po0.05;nn po0.01;nnn po0.001.
K.R. Fox et al. / Health & Place 17 (2011) 633–640638
weekly trips outside and it is this that leads to greater MVPA. Bothphysical function and weekly trips outside are both indepen-dently and significantly associated with all three measures ofphysical activity.
Older adults, regardless of age, level of education, or level ofphysical function, who make a trip outside at least daily, aresignificantly more active than those who make fewer trips out-side. Physical function is also associated with physical activity sothat older adults who maintain a medium to high level of physicalfunction have higher physical activity levels. Tests for an interac-tion at the 5% level indicated that the effect of physical functionon physical activity did not differ by frequency of weekly tripsand the reverse was also true, indicating their independenteffects. The amount of variance accounted for in steps per day,CPM, and MVPA was 50%, 54%, and 52%, respectively, indicatinghow important age, BMI, physical function, and weekly trips areas correlates of physical activity in this sample of older adults.
4. Discussion
This paper provides insight into the influence of level ofdeprivation of residential neighbourhood on the physical activitylevels of a diverse sample of 240 older adults aged 70–95 yearsliving in a city in SW England. Recruiting a representative sampleof older adults into physical activity studies has proved challen-ging (Harris et al., 2008; Hildebrand, 2009; Stathi et al., 2010) asthe well-educated, healthy, more motivated, and functionallycapable are more likely to be attracted. Participants in this studywere representative by age and gender of the practices fromwhich they were drawn and these were located in 12 differentneighbourhoods of the city. The IMD of the postcode of residenceof participants indicated a fair representation of national IMDdistribution and also levels of overweight and obesity were
similar to national levels. Descriptive results showed that resi-dents in more deprived neighbourhoods tended to be less well-educated, have lower levels of physical function, make fewer tripsoutside and be less physically active than residents in moreaffluent neighbourhoods.
A novel contribution of this study is the use of accelerometryas a measure of physical activity to study its variance as afunction of neighbourhood deprivation. This allowed more preciseestimation of daily movement at different levels of intensity andalso provided a count of walking steps per day. Most activityundertaken by older adults is incidental movement around thehome or purposeful walking involved in shopping, other errandsand social visits. Incidental and routine movement such as this ismuch more difficult to accurately register through self-report.We have previously reported the diversity of steps taken per dayand frequency of weekly trips from the home in this cohort(Davis et al., 2010) both within and across age groups. From theseanalyses it became clear that older adults who leave their home,regardless of their usual mode of transport, and ‘get out andabout’ frequently are more physically active than those whodo not.
In this study, people living in high deprivation neighbourhoodstook over 1000 fewer steps per day and achieved less MVPA (thatis particularly associated with better health outcomes) whencompared to those in low deprivation areas. Total physicalactivity, which also takes into account light movement that mayhave occurred in the home, did not differ significantly by level ofneighbourhood deprivation. However, our regression modelsindicated that living in a deprived neighbourhood in itself is notassociated with low physical activity but low physical activity isassociated with being older, having a high BMI, low physicalfunction, and taking fewer journeys away from the home eachweek, characteristics that are more common among residents ofmore deprived neighbourhoods. The relationship between
K.R. Fox et al. / Health & Place 17 (2011) 633–640 639
physical function and deprivation has also been reported in acohort of over 4000 adults aged 60 and over from the EnglishLongitudinal Study of Ageing where the incidence of mobilitydisability was 1.75 times higher in areas of high deprivation (Langet al., 2008). Our findings contrast with those of Annear et al.(2009) where the association between deprivation and self-reported leisure time physical activity among 63 older adultsfrom two neighbourhoods in New Zealand, starkly contrasting inlevel of deprivation, remained strong with the addition of age andgender in a regression model.
An interesting finding is the significant independent contribu-tion of frequency of journeys from the home. Beyond age, BMI,and physical function, higher frequency of trips was associatedwith higher levels of physical activity. Even among our samplewith low physical function, the frequency of trips outside wasassociated with higher levels of physical activity at all ages. Withno evidence of an interaction between weekly trips and physicalfunction, older adults who make frequent trips outdoors appear toenhance their chances of achieving a physically active lifestyleirrespective of their level of physical function. The reverse wasalso true suggesting that if it were possible to increase physicalfunction and encourage older adults to take a trip outdoors eachday, higher levels of physical activity might be achieved. Othershave shown that weekly trips are associated with physicalfunction even in Japanese community dwelling, frail, older adults,and that trips are at least in part a matter of confidence (Shimadaet al., 2010).
Overall, the amount of variance accounted for in steps per day,CPM, and MVPA was 50%, 54%, and 52%, respectively, andindicates how important age, BMI, physical function, and weeklytrips (and gender in the case of MVPA) are as correlates ofphysical activity in this sample of older adults. Little can be doneabout age as a factor in physical activity, although this studywould suggest that its impact is not entirely a result of decline inphysical function or overweight. Results indicate the importanceof maintaining physical function into older age. This has beenachieved in the pilot LIFE project (The Life Study Investigators,2006) through structured exercise involvement and a supportpackage to assist independent activity. Participants were able tomaintain or improve their 400 m walk times, level of physicalfunction, and avoid disability mobility. Campaigns to influencehealthy weight in older adults are rare as children and middle ageadults are more frequently targeted. However, as weight itselfadds further limitations to physical function and carries diseaserisk, it would appear to be an important issue.
The independent association of frequency of trips with physi-cal activity is not easily explained as these involved journeys incars, and buses as well as on foot. The process of ‘getting outand about’ seems to have importance in its own right and weare further investigating why this might be the case. Mostjourneys on foot are made for shopping and business errands(Transport Statistics: Department for Transport. 2008) and itwould seem that local availability of amenities may be important.Unfortunately, in this study, distance to the nearest shop did notconfirm this, although we suspect the measure we used was tooimprecise.
There are limitations to this study. Although the sample wasdiverse in age, educational attainment, body mass index, physicalfunction, and physical activity levels, and was drawn from areasof different level of multiple deprivation, it was probably heal-thier, better educated, and had better physical function than theUK population. Participants were also drawn from one UK city.Different factors may be operating in other countries and culturesthat impact on the association between area deprivation andphysical activity in older adults. It was assumed that seven daysof accelerometry data provides a reasonable representation of
participants’ activity levels and patterns and our interpretationof the meaning of counts and steps per day is limited by thecurrent knowledge base for accelerometry with older adults. Ourmeasure of distance to the nearest retail outlet may have been toocrude to provide an adequate test of the impact of nearness toshops on physical activity. Finally, the data are cross-sectional.Although our regression models have indicated independentassociations, the causal directions cannot be determined. Inparticular, the close relationship between physical function andphysical activity and the likely reciprocal effects of each on theother cannot be ignored. However, the findings do make itclear that loss of functional capacity that might occur throughinsufficient physical activity in old age, may be too important toignore.
5. Conclusion
Although area deprivation has emerged as a contributor tohealth inequalities, neighbourhood deprivation was not indepen-dently associated with the physical activity levels in this sampleof elderly UK adults. It appears that characteristics of thepopulation from different levels of residential IMD especiallyphysical function, weight status, and trips away from the home,are more important. This study reinforces the critical importanceof maintaining physical function and a healthy weight into olderage. Currently, activity levels of older adults are very low andimproving the capacity of neighbourhoods to support walkingand cycling and increasing access to close-by amenities and socialattractions, especially, where these are lacking may facilitategreater levels of physical activity. Because activity and functionare lower in high deprivation neighbourhoods, these locationsmay still be useful for the targeting of activity ‘needy’ individuals.Strategies that influence older adults in poorer neighbourhoods tomaintain a high level of physical function, a healthy weight and toget ‘out and about’ more seem particularly important.
Conflict of interest statement
The authors declare that there are no conflicts of interest.
Sponsors
The UK National Prevention Research Initiative funded thisproject. The funders were not involved in study design, collection,analysis, and interpretation of the data or in writing the report.
Acknowledgements
The OPAL project was funded by the Phase 1 National Preven-tion Research Initiative (http://www.npri.org.uk) that is sup-ported by the British Heart Foundation, Cancer Research UK,Department of Health, Diabetes UK, Economic and Social ResearchCouncil, Medical Research Council, Research and DevelopmentOffice for the Northern Ireland Health and Social Services, ChiefScientist Office, Scottish Executive Health Department, WelshAssembly Government, and World Cancer Research Fund. Wewould like to thank all the participants for their time andgenerosity, Bristol Primary Care Trust and the South West GeneralPractitioners Trust for their additional financial support. Finally,we would like to thank Tanya Trayers, Georgina Bentley andCarina Thorstensson for their sensitive and skillful assistance.
K.R. Fox et al. / Health & Place 17 (2011) 633–640640
References
Addy, C.L., Wilson, D.K., Kirtland, K.A., Ainsworth, B.E., Sharpe, P., Kimsey, D., 2004.Associations of perceived social and physical environmental supports withphysical activity and walking behavior. American Journal of Public Health. 94,440–443.
Angevaren, M., Aufdemkampe, G., Verhaar, H.J.J, Aleman, A., Vanhees, L., 2008.Physical activity and enhanced fitness to improve cognitive impairment. TheCochrane Collaboration.
Annear, M.J., Cushman, G., Gidlow, B., 2009. Leisure time physical activitydifferences among older adults from diverse socioeconomic neighborhoods.Health and Place. 15, 482–490.
Ball, K., Timperio, A., Crawford, D., 2006. Understanding environmental influenceson nutrition and physical activity behaviors: Where should we look and whatshould we count? International Journal of Behavioral Nutrition and PhysicalActivity 3, 33.
Berke, E.M., Koepsell, T.D., Moudon, A.V., Hoskins, R.E., Larson, E.B., 2007. Associa-tion of the built environment with physical activity and obesity in olderpersons. American Journal of Public Health. 97, 486–492.
Cheng, Y.H., Chou, K.L., MacFarlane, D.J., Vhi, I., 2007. Patterns of physical exerciseand contributing factors among Hong Kong older adults. Hong Kong MedicalJournal 13 (Suppl 4), S7–12.
Craig, R., Mindell, J., Hirani, V., 2009. Health Survey for England 2008: Physicalactivity and fitness. Leeds: The NHS Information Centre.
Davis, M., Fox, K.R., Hillsdon, M., Sharp, D., Coulson, J., Thompson, J., 2010.Objectively measured physical activity in a diverse sample of older urban-living UK adults. Medicine and Science in Sport and Exercise. doi:10.1249/MSS.0b013e3181f36196.
Department of Health and Human Services, 2008. Physical Activity Guidelines forAmericans. Department of Health and Human Services, Washington: USPhy-sical Activity Guidelines for Americans. Department of Health and HumanServices, Washington: US.
Department of Health, 2004. At Least Five a Week: Evidence on the Impact ofPhysical Activity and its Relationship to Health, a report from the ChiefMedical Officer. Department of Health, London.
Duncan, M.J., Spence, J.C., Mummery, W.K, 2005. Perceived environment andphysical activity: A meta-analysis of selected environmental characteristics.International Journal of Behavioral Nutrition and Physical Activity 2, 11.
Guralnik, J.M., Simonsick, E.M., Ferrucci, L., Glynn, R.J., Berkman, L.F., Blazer, D.G.,Scherr, P.A., Wallace, R.B, 1994. A short physical performance battery assessinglower extremity function: Association with self-reported disability and pre-diction of mortality and nursing home admission. Journal of Gerontology 49,M85–M94.
Hamer, M., Chida, Y., 2009. Physical activity and risk of neurodegenerative disease:A systematic review of prospective evidence. Psychological Medicine 39, 3–11.
Hamilton, M.T., Hamilton, D.G., Zderic, T.W., 2007. Role of low energy expenditureand sitting in obesity, metabolic syndrome, type 2 diabetes, and cardiovas-cular disease. Diabetes 56, 2655–2667.
Harris, T.J., Owen, C.G., Victor, C.R., Adams, R., Ekelund, U., Cook, D.G., 2009a.A Comparison of questionnaire, accelerometer, and pedometer: Measures inOlder People. Medicine and Science in Sport and Exercise 41, 1392.
Harris, T.J., Owen, C.G., Victor, C.R., Adams, R., Cook, D.G., 2009b. What factors areassociated with physical activity in older people, assessed objectively byaccelerometry? British Journal of Sports Medicine 43, 442–450.
Harris, T.J., Victor, C.R., Carey, I.M., Adams, R., Cook, D.G., 2008. Less healthy, butmore active: Opposing selection biases when recruiting older people to aphysical activity study through primary care. BMC Public Health 8, 182.
Hildebrand, M., Neufeld, P., 2009. Recruiting older adults into a physical activitypromotion program: Active Living Every Day offered in a naturally occurringretirement community. The Gerontologist 49, 702–710.
Ku, P.-W., Fox, K.R., McKenna, J., Peng, T.-L., 2006. Prevalence of leisure-time physical activity in Taiwanese adults: Results of four national surveys,2000–2004. Preventive Medicine. 43, 454–457.
Lang, L., Llewellyn, D., Langa, K., Wallace, R., Melzer, D., 2008. Neighbourhooddeprivation and incident mobility disability in older adults Age and Ageing 37,403–410.
Leyden, K.M, 2003. Social capital and the built environment: The importance ofwalkable neighborhoods. American Journal of Public Health 93, 1546–1551.
Richard, L., Gauvin, L., Gosselin, C., Laforest, S., 2009. Staying connected: Neigh-bourhood correlates of social participation among older adults living in anurban environment in Montreal Quebec. Health Promotion International 24,46–57.
Salem, G.J., Skinner, J.S., Chodzko-Zajko, W.J., Proctor, D.N., Fiatarone Singh, M.A.,Minson, C.T., Nigg, C.R., 2009. Exercise and physical activity for older adults:Position statement. Medicine and Science in Sports and Exercise 41,1510–1530.
Sallis, J.F., Owen, N., 2002. Ecological models of health behaviour. In: Glanz, K.,Rimer, B., Lewis, F. (Eds.), Health Behavior and Health Education: Theory,Research and Practice 3rd edition Jossey-Bass, San Francisco, pp. 462–485.
Seeman, T.E., Merkin, S.S., Crimmins, E.M., Karlamangla, A.S., 2010. Disabilitytrends among older Americans: National Health and Nutrition ExaminationSurveys, 1988–1994 and 1999–2004. American Journal of Public Health 100,100–107.
Sims, J., Smith, F., Duffy, A., Hilton, S., 1999. The vagaries of self-reports of physicalactivity: A problem revisited and addressed in a study of exercise promotion inthe over 65 s in general practice. Family Practice 16, 152–157.
Shimada, H., Ishizaki, T., Kato, M., Morimoto, A., Tamate, A., Uchiyama, Y.,Yasumura, S., 2010. How often and how far do frail elderly people need togo outdoors to maintain functional capacity? Archives of Gerontology andGeriatrics 50, 140–146.
Social Disadvantage Research Centre, 2004. The English Indices of Deprivation.University of Oxford, OxfordUniversity of Oxford, Oxford.
Stathi, A., Fox, K.R., McKenna, J., 2010. Processes associated with participation andadherence to a 12-month exercise programme for adults aged 70 and older.Journal of Health Psychology 15, 838–847.
The Health and Social Care Information Centre, 2009. Survey for England 2008:Physical activity and fitness. Health and Social Care, London.
The Life Study Investigators, 2006. Effects of a physical activity intervention onmeasures of physical performance: Results of the Lifestyle Interventions andIndependence for Elders Pilot (LIFE-P) Study. Journal of Gerontology ABiological Science Medical Science 61, 1157–1165.
Transport Statistics: Department for Transport, 2008. Transport Statistics BulletinNational Travel Survey: 2008. National Statistics, London.
Troiano, R.P., Berrigan, D., Dodd, K.W., Masse, L.C., Tilert, T., McDowell, M., 2008.Physical activity in the United States measured by accelerometer. Medicineand Science in Sports 40, 181–188.
Tudor-Locke, C., Johnson, W.D., Katzmarzyk, P.T., 2009. Accelerometer-determinedsteps per day in US adults. Medicine and Science in Sports and Exercise. 41,1384–1391.
World Health Organisation, 2007. Global Age Friendly Cities: A guide. WorldHealth Organisation, Geneva.
Web reference
http://www.communities.gov.uk/communities/neighbourhoodrenewal/deprivation/deprivation07
Copyright © 2022 FDOKUMEN