SLAC-J-ICFA-15 - Stanford University
66
SLAC-J-ICFA-15
-
Upload
khangminh22 -
Category
Documents
-
view
2 -
download
0
Transcript of SLAC-J-ICFA-15 - Stanford University

SLAC-J-ICFA-15


1
Streamers in MSGC's and other gaseous detectors
P. Fonte1, V. Peskov2,3, B.D. Ramsey2
1 LIP/Coimbra University and ISEC, Portugal,2 NASA Marshall Space Flight Center,3 National Research Council.
ABSTRACT
In this paper we describe the formation and propagation of streamers under different conditionsand in different gas mixtures. We discuss how streamers may limit the operational capabilities ofvarious gaseous detectors.
1 . IntroductionWire chambers, proposed by G. Charpak et al. [1], revolutionized detector development. They
are widely used now in many experiments and have made possible many important discoveries inHigh Energy Physics. A further significant step was made by A. Oed et al. [2], who suggestedreplacing the wires by strips on a dielectric substrate.
This detector, the MSGC, has many technological advantages. However, it suffers from onemain disadvantage: at gains of about 104 sparking appears and this is a serious limitation in manyapplications. Recent studies have shown that the gain is limited by the appearance of streamers [3]and that these streamers have a very narrow self-quenched region (in voltage) and then transitrapidly to sparks.
Do streamers affect the rate characteristics of MSGC's and other gaseous detectors and canbreakdown in MSGC's be prevented? In this paper we will try to answer these questions.
2 . What is known about streamers
2 . 1 PPAC
Historically, the first observations and systematic studies of streamers were done in Parallel-PlateAvalanche Chambers (PPAC's) [4] and we will summarize here the main conclusions.At high gains in gaseous detectors two changes occur in the avalanche dynamics:
1) photons start to contribute to the avalanche development and cause a spread of theavalanches.
2) the space charge in the avalanche becomes sufficient to disturb the external electric field.As a result, photoelectrons created outside the avalanche start to move towards it - Fig. 1. Thismay cause a growth of the avalanche in all directions and finally a streamer (a thin plasma filament)is formed. This occurs at some total charge in the avalanche (usually 108 electrons) correspondingroughly to the charge density at which the space-charge field becomes comparable to the appliedfield. This value seems to be an universal one in parallel-plate geometry at pressures close to orlarger than 1 atm and is known as the Raether limit [4,5].
In any given gas mixture and pressure, streamers seem to propagate only in regions with appliedfields larger than some critical value.

2
e
e
e
hh
E
_ _ _ __
ν ν
Figure 1 - Schematic drawing of streamer development.
Experimental studies [6] show that a streamer in its final stage has a structure very similar to aglow discharge. Note that in glow discharges an essential mechanism for sustaining the plasma iselectron emission from the cathode spot and multi-step ionization in a positive column, i.e.ionization from excited states of atoms and molecules by electron impacts. Some authors [7]suggested that multi-step ionization also plays an important role in streamer formation. This helpsto explain the propagation of streamers in gases with high concentrations of quencher when thephoton mean free path is too small for photoelectrons to get sufficient multiplication.
Figure 2 - Typical current pulse during breakdown in a PPAC [5].
When streamers reach the opposite electrode they may cause a powerful spark. In this case oneobserves precursors corresponding to the primary avalanche and then, with some delay, a currentpulse corresponding to the propagation of the streamer and finally to the spark (see Fig. 2).
Many authors attempted to calculate the dynamics of avalanche to spark transition. Althoughmodels of streamer formation and development seem to reproduce well the experimental data [8],there is no comprehensive theory describing a streamer's transition to a spark when it touches theelectrode [9]. It may be strongly dependent on electrode conductivity and surface conditions.
The main advantage of the PPAC is the ability to reach high gains (as was mentioned above thetotal charge in the avalanche before breakdown appears is usually about 108), and high ratecapabilities (>105 counts/mm2 sec). However, this total charge in the avalanche before breakdownis achievable only at rather low rates. At higher rates, the breakdown gain is usually inverselyproportional to the counting rate. One possible reason for this is that avalanches overlapping intime and space effectively add their respective ion charges [5].

3
Figure 3 - Current pulse at breakdown in a RPC [11].
2 . 2 Streamer chambers
Streamer development in PPAC's can be restricted if a very short duration high-voltage pulsed isapplied. This principle was realized in the so called "streamer chambers", which were actively usedin many experiments [10]. The streamer chamber works in a "waiting" mode. A passing chargedparticle produces ionization inside the chamber and also generates a signal in a trigger systemlocated outside the detector volume. This signal in turn triggers a short (~10 ns) high-voltagepulse, which initiates streamer development. Since the high-voltage pulse is very short, streamersare generated very close to the position of the initial ionization and do not produce any sparks.Such streamers emit enough light to be recorded optically which allows reconstruction of the track.If a longer duration high-voltage pulse is applied, streamers transit to sparks. This principle isrealized in the so called “spark chambers” [4].
2 . 3 RPC
In Resistive Plate Chambers (RPC's) one or both electrodes are made from materials with highresistivity (usually > 1010 Ω cm).
In principle there should be no significant difference in streamer formation and their initialdevelopment between the PPAC and the RPC. Indeed, the same current pulse features wereobserved in both the RPC and the PPAC-see Figs. 2 and 3 [5,11,12]. However, the final streamerstages and especially the power dissipated in the sparks is different. Roughly speaking, the powerdissipated in sparks depends on the effective discharge capacities. In the case of metallic electrodesa considerable part of the charge accumulated in the detector will be discharged through the spark.
In the case of the RPC local charging of the resistive electrode by the spark current renders theeffective capacitance very low. As a consequence, sparks created by streamers in the RPC will beweak. This is why in many papers these weak sparks were called "streamers " although they arenot actually real streamers.
Power dissipated in sparks also depends on the gas mixture. For example, in freon mixtures theelectron charge released by a spark could be very small, about 1 pC [13].
For RPC’s the maximum achievable gain is also inversely proportional to the counting rate, butthis dependence is much steeper than in the case of the PPAC. The primary reason for thisdependence is not the appearance of breakdown due to avalanche overlapping, but simply chargingof the dielectric electrodes of the RPC. The best rate characteristics, so far, were obtained withPestov (electronic) glass electrodes [14]. Spatial resolutions achieved with such detectors werebetter than 0.1 mm. Note that when metallic readout strips were placed inside the gas gap betweenthe electrodes the rate capability approached that of the PPAC [15].

4
2 . 4 Detectors with anode wires
2 .4 .a Single wire counter and multiwire chambers
As was described above, in uniform fields streamers are usually unquenched and once startedcontinue to develop until they touch the opposite electrode.
It was found that streamers also can be formed in detectors with non-uniform fields, for examplein single wire counters and multiwire chambers (MWPC) [16,17]. The main feature of thesestreamers is that they start to propagate perpendicularly to the anode wire, but usually they do notreach the cathode due to the fast field drop with distance from the anode (see Fig. 4). As aconsequence they do not trigger sparks and are somehow "self quenched". Note that thesestreamers appear only in detectors with rather thick anode wires (>50 µm). In the case of thinwires, the field drops so fast with distance that at high gains discharges start to propagate along thewire (the so-called Geiger or limited-Geiger mode) [18].
+
Self-quenched streamer
++++
++
+
Anode wire
Cathode
__
__
_
Figure 4 - Self-quenched streamer in detectors with thick anode wires.
How do these self-quenched streamers reveal themselves experimentally?When streamers appear one can observe a jump in amplification, as shown in Fig. 5. The other
typical characteristic of streamers is an intense (>10 µA) and short (<50 ns) current pulse. Insome cases streamers can be recorded optically.
3200310030002900280027002600250010 5
10 6
10 7
10 8
10 9
V(V)
Proportional region
Limitedstreamer mode
Number ofelectrons
Figure 5 - Total charge in avalanche vs. voltage in wire detectors operating inproportional and streamer mode [17]

5
The gas gains at which streamers appear depend not only on the detector geometry, but on thegas mixture and pressure - see Figs. 6a and 6b. From this figure one can see that there is anoptimum concentration of the quencher at which the gain reaches the highest values.
4,23,22,21,210 5
10 6
10 7
10 8
10 9
10 10
10 11
V(kV)
0%10%
20% 50% 70% 100%
90%
Proportional mode
Streamer mode
Number ofelectrons
Figure 6 a - Total charge in avalanche at which streamers develop in a single wirecounter for various methane concentrations in Ar/CH4 mixtures [19]
2,01,010 5
10 6
10 7
10 8
10 9
10 10
10 11
V(kV)
150Torr
300Torr
550Torr
770Torr
Proportional mode
Streamer mode
Number ofelectrons
Figure 6 b - Total charge in avalanche at which streamers develop in a singlewire counter for various total pressures in Ar + 25% iC4H10.
The maximum charge in avalanches at which streamers appear also depends on noble gas: it ismaximum in He and Ne-based mixtures and minimum in Xe-based mixtures (see Fig.7)

6
In [19] it was claimed that in some pure quenching gases at 1 atm, CH4 for example, nostreamers develop at all (see Fig. 6a). The same is also true at low pressures (p<0.3 atm) for mostof the mixtures tested in [19] (see Fig. 6b).
.2,51,5
10 6
10 7
10 8
10 9
10 10
V(kV)
Number ofelectrons
1 2
34
5
Streamer mode
Proportional mode
Figure 7 - Total charge in avalanche at which streamers appear in various noble gases [19].1 - He + 25% iC4H10 2 - Ne + 25% iC4H103 - Ar + 25% iC4H10 4 - Kr + 25% iC4H105 - Xe + 25% iC4H10
2 . 4 . b Streamers in asymmetric wire chambers
Asymmetric wire chambers are the next generation of detectors and were invented to improve therate capability of the MWPC [20]. In fact, they have a geometry similar to the MSGC, but thestrips are replaced by wires and there is no substrate. A short distance and strong field betweenanodes and cathodes allows fast removal of positive ions.
In asymmetric wire chambers streamers may also occur at total a charge in avalanche larger thanabout 2-5×10⁶ electrons [3,21].
3 . Streamers in gaseous detectors with substrate
3 . 1 Streamers in asymmetric wire chamber with substrates
What will happen when we place the wires of the asymmetric wire chamber in direct contact witha dielectric surface? In this case streamers also occur (at a total charge in avalanche slightly lessthan without substrate), but they are unquenched. So the presence of the surface changes thestreamer's development.
Self-quenched streamers are only observed occasionally, at low gains. Note that wires should bein firm contact with the surface otherwise charging will occur and the gain will drop with time[22].

7
3 . 2 Streamers in uncoated MSGC's
It was discovered recently [3] that in the case of MSGC's the maximum achievable gain is alsolimited by streamers, as in asymmetric wire chambers with substrates. A typical waveform of thecurrent pulse of a streamer in a MSGC is presented in Fig. 8. Usually the streamer current pulsesare shorter than 50 ns and have amplitudes up to a few mV on 50 Ω.
In some gases, for example with TMAE vapor, the streamers were clearly observed visually in adark room (note that in this case the gas chamber with MSGC and all gas system was heated to40 Cº to increase the partial pressure of TMAE). As in the case of the asymmetric wire chamberwith substrates, streamers in MSGC's have a very narrow (in voltage) self-quenched region andthen transit rapidly to sparks. These sparks were very bright and could be seen easily even in anilluminated room.
-100
-50
0
50
100
0 5 10 15 20
Time (µsec)
A
Figure 8 - Streamer current pulse in a MSGC (on 50 Ω).
Figure 9 a - The field strength around the tip of a streamer. The inset details amap of equipotential lines for a streamer near an anode wire.

8
Figure 9 b - The same for a streamer in the presence of a surface.
Why are the streamers unquenched in the presence of a substrate?This can be understood from calculations of the field near the streamer head. In these calculations
the streamer was considered as a conductive medium (plasma actually), kept at the anode potential.Figs. 9a and 9b show calculations of the field near the streamer (diameter 100 µm, length250 µm) for an asymmetric wire chamber without and with substrate. One can clearly see thatwhen the substrate is present there is a high local electric field between the head of the streamer andthe substrate, due to dielectric polarization. This is therefore the region of the most intenseionization during the streamer propagation. Thus, the streamer, when it is close to the dielectricsurface, creates the high field necessary for its own propagation.
These streamers are very similar to the well known "gliding" discharges [23]. Gliding dischargesare two dimensional and, due to the extreme "sharpness" of the edges of the surface space-chargelayer, the transition from surface avalanche to the spark type of breakdown occurs at much lowerelectric fields than in the usual "three dimensional" case [23].
Calculations also show that points where the metal electrode structures touch the dielectricsubstrate have a very high electric field. These points are favorable for the initiation of avalanchesclose to the surface and the formation of surface streamers.
Are there any ways to limit streamer formation? This could be done by optimization of theMSGC and by developing substrate-free detector designs.
3 . 3 Optimization of uncoated MSGC's
As was described above, in the case of detectors with thin anode wires (< 20 µm) streamerscannot touch the cathode due to the fast drop of radial electric field. By analogy one can think thatin order to suppress the streamers and therefore increase the maximum gain before breakdown inthe MSGC, the multiplication region should be concentrated to a narrow region around the anodestrips and that the gas gain elsewhere should be maximally suppressed.
Of course, the real situation is more complicated because streamers create their own field. Sincethe calculations of streamer dynamics is rather complicated the easiest way to check the validity ofour assumption is experimentally. One can try to concentrate the multiplication near the anodestrips in several ways: by reducing the anode width, by increasing the anode-cathode gap and byusing mixtures having a sharp dependence of gain vs. voltage. A systematic experimental studyperformed recently fully confirms that optimizing these parameters allows higher gains to be
9
reached in MSGC's (see [24] for more details). As an example, Fig. 10 presents results obtainedwith different pitches and anode widths.
1800160014001200100080060040010 2
10 3
10 4
10 5
10 6
V(V)
Gain
1
2
3
4
Figure 10 - Maximum achievable gains in MSGC's with different anode widths andpitches:
1 - 1 mm pitch, 10 µm anode width 2 - 2 mm pitch, 10 µm anode width3 - 1 mm pitch, 25 µm anode width 4 - strips and wires on substrate at 2 mm
pitch (see Fig.12).
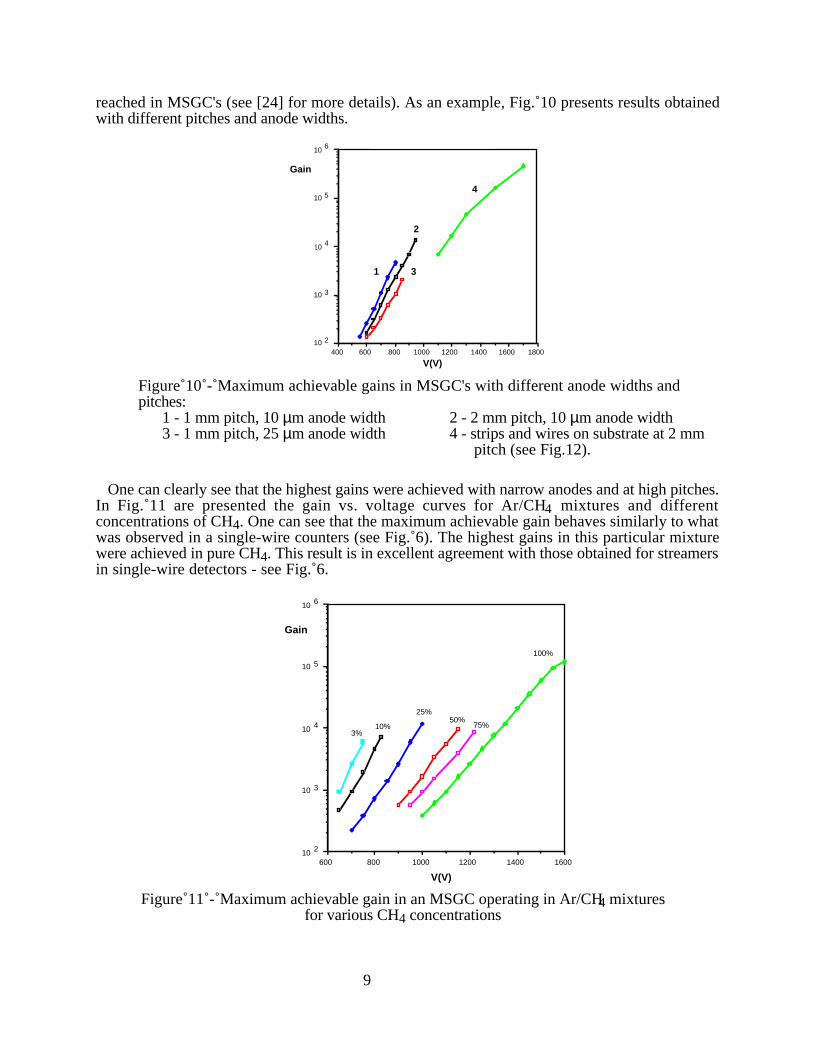
One can clearly see that the highest gains were achieved with narrow anodes and at high pitches.In Fig. 11 are presented the gain vs. voltage curves for Ar/CH4 mixtures and differentconcentrations of CH4. One can see that the maximum achievable gain behaves similarly to whatwas observed in a single-wire counters (see Fig. 6). The highest gains in this particular mixturewere achieved in pure CH4. This result is in excellent agreement with those obtained for streamersin single-wire detectors - see Fig. 6.
1600140012001000800600
10 2
10 3
10 4
10 5
10 6
V(V)
Gain
3%10%
25%50%
75%
100%
Figure 11 - Maximum achievable gain in an MSGC operating in Ar/CH4 mixturesfor various CH4 concentrations

10
It was found also that the maximum achievable gain depends on the noble gas [25]. The highestgains were achieved in He and Ne-based mixtures and lowest in Xe-based mixtures. These resultsare in a good qualitative agreement with those obtained with single wire counters (see Fig. 7).
Despite the good qualitative agreement between streamer onset properties in MSGC’s and singlewire detectors the charge needed for streamer development is two orders of magnitude lower in theformer case. This may be attributed to the two dimensional nature of the streamer discharge inMSGCs, which will be more concentrated than the three dimensional streamer formed in singlewire detectors.
New geometries of microstrip detectors were also tested. In one of these, cathodes were madefrom thick wires of diameter 0.75 and 1 mm touching the surface or suspended just above it (seeFig. 12). In such designs, we tried to minimize the contribution of the substrate and reduce thefield near the cathode. The gain achieved with such devices was 105 or higher (see Fig. 10 -curve 4). All these results confirm the assumption that the gain should be concentrated near theanodes.
As a result of this work on MSGC's optimization, the authors of ref. [26] were able to get auniform gain of 104 over a MSGC of surface area 30×30 cm2 with 2 mm pitch, 10 µm anodesstrips and a Penning mixture (Xe+2% isobutylene at 2 atm) having a sharp dependence of gain vs.voltage. The probability of breakdown is proportional to the detector's surface area. However, nota single breakdown was observed over a week of continuous operation of the detector at this gain.
Cathode wires
Anode strips
Figure 12 - Example of a MSGC design which permits the highest gains.
3 . 4 Streamers in coated MSGC's
At high counting rates the dielectric substrate of the MSGC's is charged by positive ions fromavalanches causing gain variations with time. One solution to this problem is coating the substratewith a thin, higher conductivity layer (e.g. diamond). In MSGC's with conductive coatedsubstrates the mean field along the surface between anodes and cathodes increases and, what iseven more important, becomes more uniform [22]. This is favorable for streamer propagation andas a result the maximum achievable gain is lower compared to bare MSGC's.
Another feature of coated MSGC's is high amplitude spurious pulses which can also triggerbreakdown. The nature of these pulses is discussed in [22,27].
3 . 5 Microgap Gas chambers
The Microgap Gas Chamber (MGC) was developed by F. Angelini et al . [28] in an attempt tosolve the charging problem of MSGC. The main feature of this type of detector is a very short gapbetween anodes and cathodes allowing fast removal of ions produced by avalanches. As a result nocharging effect was observed even at rates up to 107 counts/mm2 sec. However the maximumachievable gain is also limited to 104.
Our recent results with MGC's [29] reveal many similarities with MSGC pre-discharge features.We concluded that breakdown in these detectors occurs through a streamer mechanism as inMSGC's. It is not surprising since part of the avalanche touches the dielectric surface and mayform a surface streamer.

11
It is interesting to note that the maximum achievable gain in the MGC depends on the gas mixturein a way similar to high pitch MSGC's. There is also one optimum concentration of quencher atwhich the gain reaches a maximum, and the highest gains were achieved in He and Ne-basedmixtures, the lowest in Xe-based mixtures [30].
4 . New types of high-rate gaseous detectors.The low achievable gains in ordinary MSGC's stimulated different groups to develop another
designs of high-rate gaseous detectors. A relevant example could be the Microdot Gas AvalancheChamber [31,32]. The main feature of this design is that the anodes are metalized dots on asubstrate and the cathodes are coaxial rings. This geometry insures fast drop of electric field withdistance from the anode dots and as a consequence allows higher gains (> 104) to be achieved[32]. However, even in this design streamers may develop at high gains as was clearly shown in[31].
Another example of a new high-rate detector could be the recent MICROMEGAS [33].MICROMEGAS is just a PPAC with a small (~0.1 mm) gap between electrodes. There are at leasttwo advantages of this design:
1) the small size of the gap and hence the avalanche reduces the effective area of the inducedcharge on the anode strips. Thus by using small pitch strips a better position resolution inprinciple could be achieved,
2) a small gap also guaranties a fast removal of positive ions and hence less space charge effectat high rates.
MICROMEGAS permits gains of 104-105 [34]. At higher gains breakdown appears, presumablythrough the streamer mechanism. However in a new design with narrow anode strips it waspossible to explore additional multiplication in non-uniform field near the anode strips, permittingan additional factor of 5 or more in gain [34].
Other examples of new high rate gaseous detectors in which the role of substrate was minimizedcould be CAT [35] and GEM [36]. In these detectors amplifications occur in "holes" in substrate.There were no reports on breakdown studies in these devices, but since part of the avalanchetouches the dielectric surface one can assume that it may occurs through the surface type ofdischarge.
5 . Potential limitations of high-rate gaseous detectorsIn general one can assume that in any high-rate detector, fast removal of ions requires a short
distance between anodes and cathodes, as well as an high and uniform field. But these are alsofavorable conditions for streamer development. Additionally, at high counting rate, avalanches startoverlapping in space and time [5] and this lowers the maximum achievable gain at which streamersappear. This effect is also proportional to the detector surface area, so streamers always appearsoon or later just due to statistics. So, large-surface high-rate detectors are specially prone to sufferfrom streamers.
Another effect in some types of high-rate detectors is cathode "excitation". It was observed thatunder ion bombardment the work function of the cathode may be reduced [37] and additionally itmay emit electrons [22, 38]. This emission may continue for several minutes. Due to these effects,after one breakdown another breakdown or a series of breakdowns may appear at the same place[38]. One can stop these continuous breakdowns by lowering the working voltage for a fewminutes, which is obviously not a practical solution for a high-rate device.It looks that all high rate gaseous detectors may suffer from streamers or continuous breakdown.As a result, for reliable operation one should lower the gain at high rates.
12
6 . ConclusionExperience shows that all detectors are rate limited for one or another reason. We described in
this paper how streamers could play an important role.In uniform fields, or when the attached to a dielectric surface, streamers are unquenched and
once started continue to develop until they reach the cathodes. As follows from this paper, insubstrate-free detectors and especially in geometries providing non-uniform fields one can reachthe highest gains. An example could be recent modification of MICROMEGAS whereamplification in non-uniform fields near anode strips was observed [34]
References[1] G. Charpak et al., Nucl. Instr. and Meth. 62 (1968) 262[2] A. Oed, Nucl. Instr. and Meth. A263 (1988) 351[3] V. Peskov et al., "Surface streamer breakdown mechanisms in MSGC", to appear in Nucl.
Instr and Meth.[4] H. Raether, "Electron avalanches and breakdown in gases", Butterworths, Washington, 1964[5] P. Fonte et al., Nucl. Instr. and Meth. A310 (1991) 128[6] E. Marode, Journal of Applied Phys. 46, (1975) 2005,
E. Marode, Journal of Applied Phys. 46, (1975) 2016[7] L. S. Zhang, Nucl. Instr. and Meth. 247 (1986) 343
V. Peskov, Sov. Phys. Tech. Phys. 20 (1976) 1584[8] P. Fonte, IEEE Trans. Nucl. Science, vol. 43, 3 June 1996, pp. 2135.[9] Yu. P. Raizer, "Gas discharge Physics" Springer-Verlag, 1991[10] L. S. Schroeder, Nucl. Instr. and Meth. 162 (1979) 395[11] D. F. Anderson et al., Nucl. Instr. and Meth. A348 (1994) 324[12] I. R. Cardarelli, Nucl. Instr. and Meth. A382 (1996) 470[13] A. D. Ciaccio et al., Proceedings of the 3d International Workshop on Resistive Plate
Chambers and Related Detectors", Edd. S. P. Ratti, M. Merlo, INFN Pavia, Italy 1996, 263[14] V. Peskov, " High rate RPC" report at the US/CMS Meeting at the Univ. of Wisconsin,
Madison, 1994[15] I. Crotti et al., "RPC with secondary electron emitters and microstrip readout" report at the
IEEE Nucl. Science Symposium, Anaheim 1996[16] G. Alekseev et al., Nucl. Instr. and Meth. 177 (1980) 385[17] M. Atac et al., Nuclear Instr. and Meth. 200 (1982) 345[18] E. Funfer, H. Neuert, "Radiation counters", Gosatomisdat,1961 (in russian)
G. D. Bogomolov et al., Prib. Techn. Exp, 21 (1978) 639[19] A. Nohtomi, "Study on operation mechanism of gas counters in self-quenched streamer
mode" Doctoral Thesis, Kyushu Univ. Fukuoka, Japan, 1995[20] G. Charpak et al., Preprint CERN/AT/94-07 (ET),1994[21] I. Giomataris, private communication[22] V. Peskov et al., "Feedback and Breakdown in MSGC" accepted for publication in Nucl.
Instr. and Meth.[23] K. Uhlig, "Surface discharges in high magnetic fields", Hartung-Gorre Verlag, 1991[24] B. D. Ramsey et al., "A study of factors limiting maximum gain in MSGC" to appear in IEEE
Trans. Nucl. Science, 1997[25] R. Bellazzini, private communication[26] B. D. Ramsey et al., Nucl. Instr. and Meth. A383 (1996) 424

13
[27] V. Peskov et al., "Breakdown features of various MSGC designs and their improvements"submitted to IEEE-97 Symposium
[28] F. Angelini et al., Nucl. Instr. and Meth. A 335 (1993) 69.[29] V. Peskov, B. Ramsey, "Energy resolution of MGC's at high pressure", unpublished data.[30] J. Van der Marel, "Microstrip and Microgap Chambers", PhD. Thesis, Delft University,
1997.[31] D. Mattern et al., Nucl. Instr. and Meth. A300 (1991) 275.[32] S. F. Biagi, "Microdot Chambers" report at the Manchester Conf. on Position Sensitive
Detectors, Manchester, UK, 1996[33] I.Giomataris et al., Preprint DAPNIA/SED 95-04,1995[34] I. Giomataris, Private communication[35] F. Bartol et al., J. Phys III 6 (1996) 337[36] F. Sauli, Nucl. Instr. and Meth. A386 (1997) 531[37] G. F. Karabadjak et al., Nucl. Instr. and Meth. 217 (1983) 56[38] Y. Ivaniouchenkov et al., "The high-rate behavior of Parallel Mesh Chambers", report
submitted to the IEEE-97 Nuclear Science Symposium.

1
October 12, 1997
SOFT X-RAY PRODUCTION IN SPARK DISCHARGES IN HYDROGEN, NITROGEN, AIR, ARGON, AND XENON GASES
J. Va'vra Stanford Linear Accelerator Center, Stanford University,
Stanford, CA 94309, U.S.A.
J. A. Maly Applied Science Consultants 5819 Ettersberg Dr., San Jose, CA 95123, U.S.A.
P. M. Va'vra67 Pine Lane, Los Altos, CA 94022, U.S.A.
ABSTRACT
We describe a generator of soft X-rays of energy between 2 and 10 keV by sparking in
hydrogen, air, nitrogen, argon, and xenon gases at low pressure with a sparking voltage as low as
~0.8 kV, which can be used as a simple monitor of the gaseous detectors. The X-ray production
mechanism is also discussed, including the possibility of a new process.
(Submitted to Nuclear Instruments and Methods)
1. INTRODUCTION
We present a simple X-ray generator which can be used to monitor drift chambers. The generator
uses a spark gap operating at low pressure, with a thin window and very low voltages between 0.8
and 2.5 kV to create X-rays between 2 and 10 keV.
To create the X-rays by sparking in low pressure is not new. Less known is the fact that one can
create the X-ray energies, which are larger than the sparking voltage. This seemingly surprising
effect is semi-qualitatively explained in the literature by the so called "pinch" effect [1-4], which is
known to occur during very large low inductance sparks, operating typically with initial charging
voltages of 10-60kV, charging capacitance of 10-20µ F, low inductance of ~100 nH, stored
energies of 1-3 kJ/pulse, and peak spark currents of 100-200kA [1]. The pinch effect has been
demonstrated experimentally using pin hole photography, which indicates a formation of point-like
(plasma points) regions within the plasma [2]. A generally accepted explanation of the pinch effect
is based on the radiation collapse model [1]. During the pinch effect, one observes a formation of
dips in spark current, which in turn creates large local voltages [1]. The voltage across the sparking
gap can exceed the supply voltage by a factor of 2-3 [3], and thus, the X-ray energies can exceed
the sparking voltage. The current dips are correlated with the appearance of plasma points, which
principally emit X-ray lines of the anode material; radiation from the cathode material is weak [1].
The X-ray production shows a strong angular anisotropy [4]. The sparks in the above tests are so

2
large that the electrodes wear out quickly. Indeed, the spectral investigations reveal emission from
heavily ionized atoms, which are present in the electrode material [2].
In our tests, we tried to set the smallest possible sparks that are still consistent with the X-ray
production, i.e., we tried to operate at the opposite end of the spark's stored energies, as
mentioned above. The sparking voltage varied between 0.8 and 2.1kV, the charging capacitance
was 75nF, inductance was ~1000nH, stored energy was 0.024-0.17J/pulse, the peak spark
currents were 0.2-0.5kA, and the total spark charge was between 4x10¹⁴ and 1015 electrons/spark.
The observed X-ray energies were between 2 and 10 keV, even at the lowest sparking voltage of
~0.8kV (depending on the gas), and followed an exponential distribution falling towards larger X-
ray energies. The maximum observed X-ray energy (~10keV), generated at the lowest voltage
(~0.8kV), is above K-shell energy of typical gases we used in our tests, and materials used in our
spark electrodes (see Table 1 and Chapter 4). The X-ray production persists even for the carbon
electrodes which have the smallest K-shell energy (0.284keV); this would appear to eliminate a
theory that the electrode atoms are responsible for the X-ray production. Furthermore, we have
evidence that the production threshold and the X-ray rate are dependent on the gas choice in the
sparking vessel. We have measured the I(t), V(t), and dI/dt(t) curves and have confirmed that the
X-rays are produced during the largest swing in the dI/dt(t) curve corresponding to a dip in the
current I(t). This would appear to be consistent with the earlier mentioned pinch effect mechanism.
The sparks in our tests are relatively large by a typical standard, however, compared to the spark
energies used in Refs.1-4, they are considerably smaller, by at least a factor of ~4x10⁴ (at
~0.8kV). If our results are due to the pinch effect, we are then observing the pinch effect
phenomenon at the smallest spark energy reported so far in the literature, i.e., we are investigating
its threshold behavior.
However, we have some doubts that the pinch effect is really understood quantitatively. The
sparking phenomenon is an extremely complex process if we insist on a real quantitative evaluation
of its dynamics. Its understanding is not yet at a level of that of the electron transport at low drift
electric fields or small avalanches, which can be solved reasonably accurately using the three-
dimensional Monte Carlo simulation [5] [the computer program follows the electrons and ions in
small steps (fraction of a ps) and evaluates electrostatic forces, position and velocities of each
electron and ion, and probability of various physics processes using the electron-molecule
scattering cross-sections]. It is not possible to do this for sparks having large number of electrons
involved in the pinch effect at this time, not only because of the computational difficulties but also
because one does not necessarily know details of all physics processes involved. For example, in
Chapter 4 we mention one additional possible mechanism which may have been neglected in the
theory of the pinch effect, and may contribute to the X-ray production in our tests.

3
One practical benefit of running small spark energy is that the sparking electrodes do not wear
out quickly and the device is suited for long-term investigations. The spark electromagnetic noise
requires careful shielding for fast detectors. For drift chambers with a long drift, one can be easily
protected by a drift time delay of about 1-2 µ s. The X-rays were monitored at 90o in respect to the
spark axis during all tests in this paper. An initial approximate observation indicates that they may
be isotropic, although this is yet to be confirmed by a larger test detecting X-rays over a larger
solid angle.
2. EXPERIMENTAL SETUP
2.1. Description of X-ray producing apparatus
Figure 1 shows schematically the spark producing apparatus. It uses a spark gap with a 1 mm
gap between the points, which is placed in a small brass vessel equipped with a thin window to
allow low energy X-rays to penetrate (in final tests we also used carbon electrodes in a specially
prepared spark gap). The window opening is ~1.27 cm diameter and its material is either 12.7 µ m
stainless steel (sealed by a conducting epoxy), or 50 µ m Mylar foil. The sparking vessel is
connected to a vacuum pump from one side, and to a gas bottle from another side. The gas
pressure is controlled by a small needle valve throttling the gas flow while pumping. The pressure
is monitored by a thermocouple gauge with an accuracy of a few microns (1 µ = 10-3 Torr). The
pump was capable of reaching a pressure (p) of 10-20 µ .
X-ray
1/16" Pb
Wire Tube Detector
Copper mesh
Mylar absorbers
Pump
Gauge
Valve
Meteringvalve
Gasbottle
Sparkplug
Air
+2.5kV, 40mA
10k
300M
100K
C = 75nF
R = 80k
1nf
Scope trigger
WindowThin
Scope
Fig. 1. Our experimental setup for sparking in gases at low pressure. It uses a spark plug with a 1 mm gap,
operating as a relaxation oscillator.
The operating parameters of the spark gap were tuned to maximize the X-ray production; this
occurs in a relatively narrow window of the parameter space. The spark gap operates at low

4
pressure between 0.2 and 1Torr, depending on the gas choice. It operates as a relaxation oscillator
with a charging resistor R = 80kΩ and a charging capacitor C = 75nF. Because of excessive
heating, the charging resistor R is made with an equivalent circuit involving six pairs of ~27k Ω ,
10W resistors; it is necessary to cool them with a small fan. The high voltage power supply,
capable of delivering up to 40 mA DC current, operates at +2.5kVDC voltage. The sparkingvoltage (Vspark) varies between 0.8 and 2.1kV, which corresponds to a spark energy (
1
2CVspark2)
between 0.024 and 0.17J/pulse, and a spark charge (CVspark) between 4x10¹⁴ and 1015
electrons/spark. The spark repetition period (T) is set typically between 5 and 20ms by the choice
of gas pressure, which corresponds to sparking rates between 50 and 200Hz.
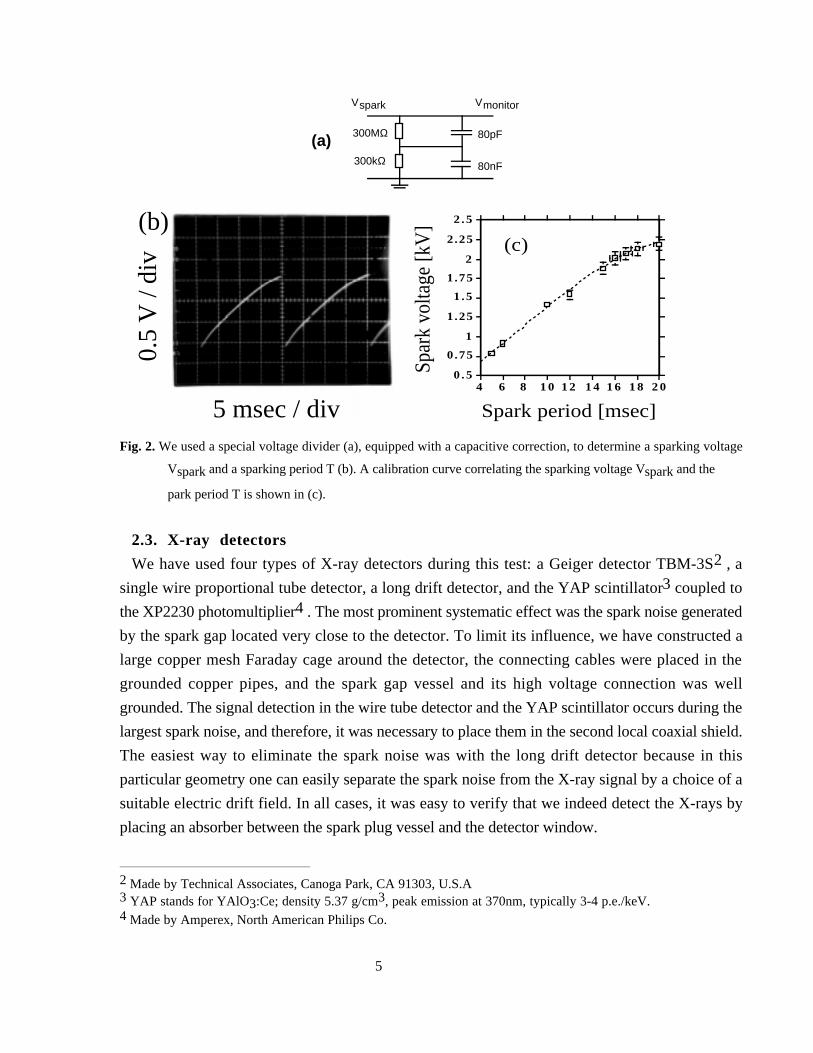
2.2. Spark voltage monitoring
First, we calibrated the DC power supply output with a precision voltage divider and a digital
voltmeter. This resulted in a small ~0.6% correction. Second, we calibrated a spark voltage Vspark
relative to a spark period T using a special voltage divider, as shown in Fig.2a. To monitor the
varying voltage with a voltage divider, it is necessary to compensate the resistors for their parasitic
capacitance. This was done by measuring a parasitic capacitance of the 300M Ωresistor in Fig.2a,
and then empirically tuning the 80nF capacitor to minimize an undershoot in the monitored voltage
of Fig.2b. The monitored voltage of Fig.2b was used to determine a correlation between the
sparking voltage Vspark and a sparking period T of the oscillator. By measuring the sparking period
T, one can uniquely determine the sparking voltage Vspark, which is shown in Fig.2c. Finally, we
have also used a spark gap1 CG3-1.5 to calibrate Vspark. Its sparking voltage was selected to be
1.4kV. For Vspark < 1.4kV, the spark gap did not fire. This was a simple way to confirm that our
calibration is correct, and that there is no fast transient exceeding Vspark.
The relaxation oscillator has the following feature: for a given spark gap distance d, gas pressure
p and gas choice, the sparking voltage Vspark is determined according to Paschen's law, which
says that Vspark is a function of pd. We operated in a region of the law where increasing the
pressure reduces the sparking voltage, which in turn reduces the sparking period T.
During the experiment, we would typically monitor the sparking period, which is easy to
measure, and use the calibration curve of Fig.2c to obtain the corresponding sparking voltage.
Depending on the choice of the gas pressure in a given gas, we would typically select the sparking
voltage Vspark between 0.8 and 2.1kV during this experiment, while running the high voltage
power supply always at a constant value of +2.5kV. We used the scope triggering circuit,
described in Fig.1, to determine the sparking frequency T.
1 Made by General Instrument Co., Chicago, Il 60645, U.S.A.
5
Vspark Vmonitor
80pF
80nF
300MΩ
300kΩ
(a)
(b)
5 msec / div
0.5
V /
div
0 .5
0.75
1
1.25
1 .5
1.75
2
2.25
2 .5
Spar
k vo
ltage
[kV
]
4 6 8 1 0 1 2 1 4 1 6 1 8 2 0
Spark period [msec]
Data
(c)
Fig. 2. We used a special voltage divider (a), equipped with a capacitive correction, to determine a sparking voltage
Vspark and a sparking period T (b). A calibration curve correlating the sparking voltage Vspark and the
park period T is shown in (c).
2.3. X-ray detectors
We have used four types of X-ray detectors during this test: a Geiger detector TBM-3S2 , a
single wire proportional tube detector, a long drift detector, and the YAP scintillator3 coupled to
the XP2230 photomultiplier4 . The most prominent systematic effect was the spark noise generated
by the spark gap located very close to the detector. To limit its influence, we have constructed a
large copper mesh Faraday cage around the detector, the connecting cables were placed in the
grounded copper pipes, and the spark gap vessel and its high voltage connection was well
grounded. The signal detection in the wire tube detector and the YAP scintillator occurs during the
largest spark noise, and therefore, it was necessary to place them in the second local coaxial shield.
The easiest way to eliminate the spark noise was with the long drift detector because in this
particular geometry one can easily separate the spark noise from the X-ray signal by a choice of a
suitable electric drift field. In all cases, it was easy to verify that we indeed detect the X-rays by
placing an absorber between the spark plug vessel and the detector window.
2 Made by Technical Associates, Canoga Park, CA 91303, U.S.A3 YAP stands for YAlO3:Ce; density 5.37 g/cm3, peak emission at 370nm, typically 3-4 p.e./keV.4 Made by Amperex, North American Philips Co.

6
The Geiger detector TBM-3S is a commercially made battery operated detector equipped with a
thin Mylar window of a 1.5 mg/cm2 thickness and 5 cm diameter. It is filled with halogen gas.
WindowThin
Shield
AluminumTube
AnodeWire
Conducting
epoxy
Pin to holdthe wire
Shield
Decouplingcapacitor
Resistor
Coaxialcables
Insulator
Fig. 3. Geometry of the single wire proportional tube detector including its spark noise shield.
Figure 3 shows the geometry of the wire tube detector. The gold plated tungsten anode wire
diameter is 38 µ m. The aluminum tube has 10 mm i.d. with a 1 mm wall thickness. The tube has a
10 mm x 10 mm opening in the center, which is covered with a 30 µ m thick aluminized Mylar foil.
The foil is connected electrically to the tube wall with conducting epoxy and sealed with a DP-190
epoxy. The detector is operating with a 95% Ar+5% CH4 gas mixture at 1 atm pressure. This
choice was primarily motivated by its nonflammability.
Figure 4 shows the geometry of the long drift wire detector. The drift cell is made of two
sections: a drift region made of equally spaced stainless steel rings and a gain region containing
20 µ m gold plated anode wires surrounded by a nickel plated cathode. The drift field is defined by
the potentials V1 and V2. The resistor chain provides voltages to the individual stainless steel rings.
The value of each resistor is 10MΩ. The drift region has a cylindrical shape with 2.5 cm i.d. and
12 cm long active volume. The entrance window into the long drift detector is made of ~13 µ m
thick aluminized Mylar foil. The gas gain is controlled by the cathode voltage Vc. All anode wires
are connected together to a single amplifier. The detector also operates with a 95% Ar+5% CH4
gas mixture at 1 atm pressure. To be insensitive to a spark noise, we would typically choose a drift
field of only ~8-10V/cm corresponding to a very low electron drift velocity of ~5mm/ µ s .
Typically, with this detector, the spark noise would appear only in the first 1-2 µ s after the scope
trigger, followed by a perfect noise-free period. We would then observe events of interest between
3 and 25 µ s after the scope trigger.

7
X-rays
12 cm
2.5 cm dia.
ResistorsThin window
Anode wire Cathode
V2
V1
Vc
Fig. 4. Geometry of the long drift detector.
The YAP scintillator was a cube (1cm x 1cm x 1cm) coupled to a XP2230 PM tube with a UV
coupling grease. A good light collection was ensured by covering the sides of the scintillator with
Teflon tape; the light leak was stopped with two layers of black paper tape. Because we used an
amplifier with a large gain (~15mV/pC), the photomultiplier tube (PM) operated at a very low
voltage of -1.4kV. The main reason to use this detector was to investigate the high energy end
(tens of keV) of the pulse height spectrum, where the gaseous detectors start loosing efficiency.
2.4. Electronics used in the test
The long drift detector was used to measure the multiplicity of the X-ray bursts. Its amplifier was
a battery operated charge sensitive amplifier with a gain of ~15mV/pC, a shaping time of ~65ns,
and σnoise~2000 e-. This sensitivity is enough to be able to detect even single electrons arriving
on the wire, assuming that the gas gain is in the range of 105. A conversion of a 3-10keV X-ray
generates a much larger signal, equivalent to several hundred electrons.
The wire tube detector measured the X-ray pulse height spectra using two methods: (a) peak
sensing method using a LeCroy TRA100 amplifier with a gain of ~50mV/pC and a shaping time of
~20 µ s, together with a digital oscilloscope (reading individual pulses manually), (b) charge
sensing method using the battery operated amplifier (see above) with the pulse height analyzer
LeCroy QVT 3001 in q-mode operating with an external 400ns long gate (the YAP scintillator
detector was also using this method).

8
2.5. Expected X-ray attenuation factors and detection efficiency
Figures 5a and 5b show calculated attenuation curves for various materials and an expected
detection efficiency for the tube and long drift wire detectors.
0
0.2
0.4
0.6
0.8
1
0 2 4 6 8 10 12 14 16 18 20
Tube wire chamber
(a)
0.0
0.2
0.4
0.6
0.8
1.0
0 2 4 6 8 10 12 14 16 18 20
Long driftwire chamber
(b)
Photon energy [keV]
Atte
nuat
ion
or R
elat
ive
Det
ectio
n E
ffic
ienc
y
Fig. 5. Calculated attenuation N/No curves for various materials in the X-ray path, and expected X-ray detection
efficiency for (a) the tube wire chamber and (b) the long drift detector. The attenuation was calculated for
51 µ m thick Mylar sparking vessel window (open circles), 3 cm of air (squares), 33 µ m (tube) or 12.5 µ m
(long drift) wire chamber window (triangles), the combined attenuation factor (x) and the final detection
efficiency (star).
The attenuation factor is defined as η(E) = N/No = exp(L/Lo), where L is the X-ray path length
and Lo is the attenuation length calculated from the absorption coefficient in a given material [6].
The X-ray detection efficiency, ε(E), defined as a ratio of detected and produced number of X-
rays, was calculated as follows:ε(E) = ηmylar (E) ηair (E) ηwindow(E) (1 − ηgas(E)) (1)
where ηgas is the attenuation in 95% Ar+5% CH4 gas mixture, and other factors are the attenuation
factors in the materials in the X-ray path. We assume that the wire chamber detection efficiency is
9
close to 100% for a charge generated by the X-rays. From Fig.5b, one can see that the long drift
detector has a good X-ray detection efficiency between 3 and 20keV.
3. EXPERIMENTAL RESULTS
We have observed X-ray production with all four types of detectors described in Section 2.3.
There are three arguments for this statement: (a) the radiation was not affected by a strong magnet
placed between the sparking vessel and the detector, indicating that we are indeed dealing with the
X-rays or neutral particles; (b) the range measurements are very consistent with the X-ray
production; (c) the response from the gaseous detectors strongly indicates soft X-ray production
(pulses are comparable in size and shape to pulses from an Fe55 X-ray source). The X-rays were
monitored at 90o in respect to the spark axis during all tests in this paper.
3.1. Observation of X-ray showers
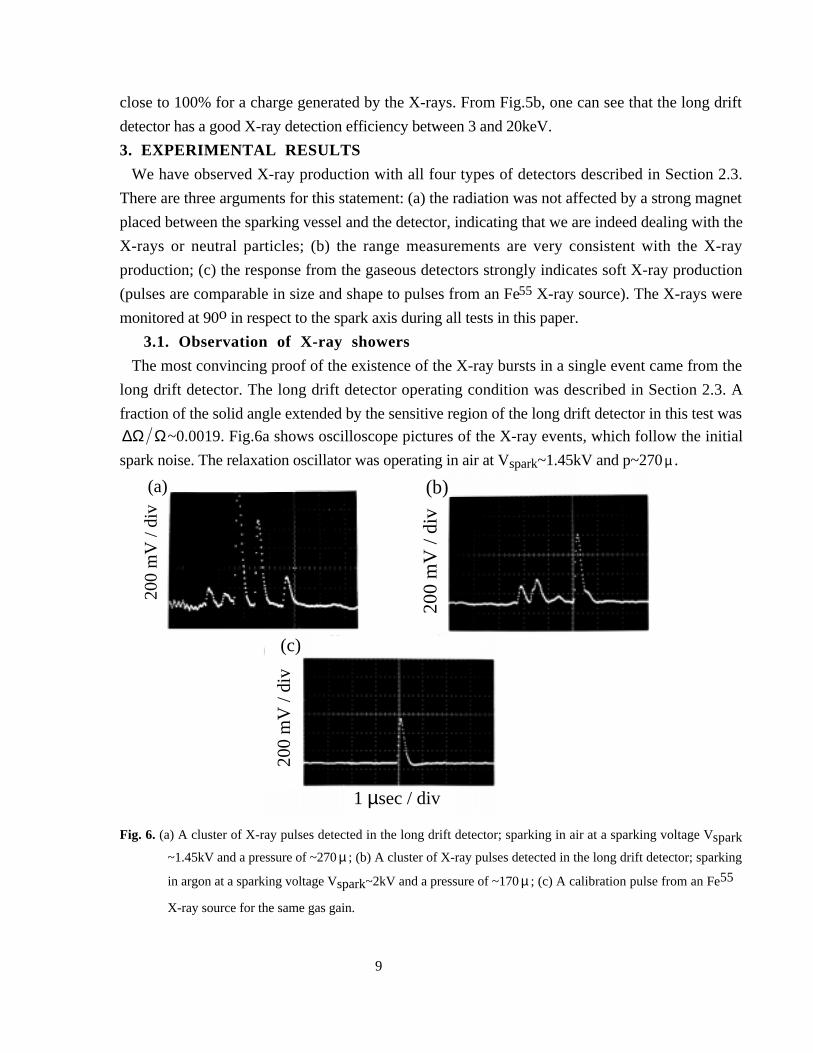
The most convincing proof of the existence of the X-ray bursts in a single event came from the
long drift detector. The long drift detector operating condition was described in Section 2.3. A
fraction of the solid angle extended by the sensitive region of the long drift detector in this test was
∆Ω Ω~0.0019. Fig.6a shows oscilloscope pictures of the X-ray events, which follow the initial
spark noise. The relaxation oscillator was operating in air at Vspark~1.45kV and p~270 µ .
200
mV
/ di
v
(a) (b)
200
mV
/ di
v
1 µsec / div
200
mV
/ di
v
(c)
Fig. 6. (a) A cluster of X-ray pulses detected in the long drift detector; sparking in air at a sparking voltage Vspark
~1.45kV and a pressure of ~270 µ ; (b) A cluster of X-ray pulses detected in the long drift detector; sparking
in argon at a sparking voltage Vspark~2kV and a pressure of ~170 µ ; (c) A calibration pulse from an Fe55
X-ray source for the same gas gain.

10
Figure 6b shows similar X-ray production with argon at Vspark~2kV and p~170 µ . For
comparison, Fig. 6c shows a typical calibration pulse from the Fe55 X-ray source. Notice that the
X-ray events appear in clusters (Figs. 6a and b). To study the single X-ray events, it is necessary
to adjust their flux so that the probability to observe the X-ray pulse per spark was only ~5%, thus
ensuring only a small probability of a pile-up from different events. This is achieved by placing an
additional 178 µ m Mylar absorber in the X-ray path, creating a total Mylar thickness of 261µ m
between the spark and the sensitive volume of the long drift detector. The sparking vessel is filled
with argon, and operates at Vspark~2kV and p~170 µ . The counting of X-ray pulses is done
visually using a digital scope. Fig.7 shows a multiplicity distribution of the X-ray pulses per
spark, indicating a mean of three. Extrapolating this result to a 4 π -solid angle and assuming an
isotropic distribution, one would expect more than 3*( Ω ∆Ω)~1500 X-ray pulses.
From a visual observation of scope traces, it appears that the average energy of the X-rays is
below ~10keV. The signal disappears when placing either a 1.6mm thick lead sheet or even a
762 µ m thick Mylar sheet in front of the long drift detector (see the next chapter for a quantitative
evaluation of average energy).
0
25
50
75
100
Cou
nts
0 1 2 3 4 5 6 7 8 9 10
Number of X-ray pulses / spark
659659
Fig. 7 An average X-ray multiplicity per spark in argon, sparking voltage Vspark~2kV and pressure of ~170 µ .
The X-ray energy was between 3 and 10keV on average, and probability to observe an X-ray pulse per given
spark was kept at only ~10% to ensure a proper X-ray counting.
3.2. Average effective X-ray energy using a range measurement
An advantage of the range measurement is that it is simple and insensitive to any spark noise.
We have used Mylar, Kapton, aluminum, and stainless steel absorbers mounted into slide frames.
The slides were carefully placed into an X-ray path between the sparking vessel and the detector.
Fig. 8a shows a comparison of calculated and measured attenuation curves for the setup using the
Geiger counter TBM-3S. The X-rays passed through a 12.7 µ m thick stainless steel sparking
vessel window, 3 cm of air and 38 µ m of Mylar foil on the counter. The sparking vessel was
operating with air at Vspark~2.1kV and p~240 µ . One can see that an average measured effective

11
energy of X-rays is slightly above 4keV. Fig.8a also shows the measured calibration data using the
Fe55 source producing 5.9keV X-rays; it agrees fairly well with the calculation.
Fig.8b shows a comparison of the calculated and measured attenuation curves for the setup
using the tube wire detector. In this case, the X-rays passed through a 12.7µ m thick stainless steel
sparking vessel window, 3 cm of air, and a 30 µ m thick aluminized Mylar foil of the tube window.
The sparking vessel was operating with air at Vspark~2.1kV and p~240 µ . Again, one can see that
an average effective energy of X-rays is slightly above 4keV. Fig.8b also shows the calibration
data using the Fe55 source producing 5.9keV X-rays. Both methods, one using the Geiger counter
and one using the tube wire detector, agree with each other.
Geiger detector
0
20
40
60
80
100
120
0 200 400 600 800 1000 1200
(a)
Wire tube chamber
0
20
40
60
80
100
120
0 200 400 600 800 1000 1200
Absorber thickness [microns]
(b)
Atte
nuat
ion
N/N
o
Fig. 8 (a) A comparison of a range measurement and calculated attenuation curves using the Geiger counter TBM-
3S. The sparking data (open triangles) were obtained with air at sparking voltage Vspark ~2.1kV and
pressure of 240 µ , calibration was done using the Fe55 X-ray source (open diamonds), the calculation was
done at 6keV (open squares), 5keV (open circles), 4keV (filled squares), and 3keV (filled circles). (b) The
same for the tube wire detector; the sparking vessel was operating with air at sparking voltage
Vspark~2.1kV and pressure of 240 µ .

12
The spark charge contains approximately ~1015 electrons. The question is, what is the
probability that one such electron creates an event, containing any number of X-ray pulses.
Combining the results from the long drift detector of Sections 3.1, and the tube detector of Section
3.2, we calculate this probability as follows: ~0.1*5*10-15 = 5x10-16, where 0.1 is the probability
to observe an X-ray even per spark containing 1015 electrons, a factor of 5 comes from the
absorption correction caused by the 262 µ m Mylar absorber in the X-ray path (see the multiplicity
measurement in chapter 3.1), assuming an average X-ray energy ~4keV - see Fig.8b. To be able to
see this phenomenon one needs a very large instantaneous spark current (>400A). For example,
one would not see it using electrons from an ordinary β-source.
3.3. X-ray energy distribution
The difficulty to correctly measure the pulse height distribution in this experiment is mainly
related to a short duty cycle of the X-ray production, and to a spark noise. The X-rays are
produced within ~150-200ns time interval (see Section 3.5), and they seem to occur in multiple
events (see Section 3.1). To assure that we are dealing predominantly with the single X-ray pulses
when measuring the pulse height spectra, we need to limit the probability of a single X-ray pulse
per spark to less than 5%. This is achieved by (a) restricting the X-ray flux with a ~1mm diameter
hole in the 1.5mm thick lead sheet, and (b) by running at the lowest possible sparking voltage.
Despite these precautions, there is still a nonzero chance of having two X-ray pulses within the
integration gate, and therefore, one should not over-interpret a maximum X-ray energy measured
in the test. The maximum observed energy is also affected by a resolution of the detector, which
has to be determined by a separate calibration run. The spark noise was reduced by using careful
shielding precautions (see Section 2.3), and by running relatively long shaping time of the
amplifier, which, however, made it more difficult to resolve doubles.
3.3.1. Wire tube detector with a long integration time constant.We use a charge integrating amplifier with a gain of ~50mV/pC and a shaping time of ~20 µ s ,
and a digital oscilloscope to measure the pulse height spectrum by determining a peak of each
pulse. In this way, every pulse contributing to the pulse height spectrum is visually checked. The
X-rays pass through a 51 µ m thick Mylar window of the sparking vessel, 3 cm of air and a 30 µ m
thick aluminized Mylar foil of the wire tube window before there is a detection in the wire tube
chamber operating with 95% Ar+5% CH4 gas.
Figure 9a shows the uncorrected X-ray pulse height spectra in air, hydrogen, argon, and xenon
gases. The spark gap operates at Vspark~0.9kV and p~310 µ for air, at Vspark~1.55kV and p~950 µ
for hydrogen, at Vspark~0.8kV and p~240 µ for argon, and at Vspark~1.81kV and p~135 µ for
xenon.

13
1
10
100
1000
0 1 2 3 4 5 6 7 8 9 10
Cou
nts
AirHydrogenArgonXenon
(a)
X-ray energy [keV]
1
10
100
1000
10000
100000
1 10 100
X-ray energy [keV]
Cor
rect
ed c
ount
s AirHydrogenArgonXenon
(b)
Fig. 9. (a) A measured X-ray pulse height spectrum using the wire tube detector while sparking in air at ~0.9kV;
hydrogen at ~1.55kV; argon at ~0.8kV; xenon at ~1.81kV. The X-rays pass through the 51 µ m Mylar
window in the sparking vessel, 3 cm of air, and a 30 µ m thick aluminized Mylar foil in the wire tube
chamber. The energy scale is calibrated using the Fe55 source; the resolution σ /Peak of the wire tube
detector is ~14% at 5.9 keV. (b) The same pulse height spectra as shown in Fig. 9a, but corrected for the
attenuation factors in various materials and the wire tube X-ray detection efficiency - see Fig.5a.

14
Using the calculated attenuation factors for each absorber in the X-ray path, and using the
calculated wire tube detection efficiency based on the energy dependent attenuation factors in each
component of the chamber gas (see Eq.1, Ref.6, and Fig.5a), one can correct the measured spectra
of Fig.9a and obtain a shape of the primary X-ray spectra at the source. Fig.9b shows the final
results for air, hydrogen, argon, and xenon in the sparking vessel. The spectra have the same
shape within the experimental errors and they follow a power law distribution.
The scale is calibrated with the Fe55 radioactive source. The resolution σ /Peak of the wire tube
detector is ~14% at 5.9 keV.
3.3.2. Wire tube detector with a short integration time constant
In this test, the wire tube detector is coupled to the charge integrating amplifier with a gain of
~15mV/pC and shaping time of ~65ns. The pulse height spectrum is measured using the QVT
pulse height analyzer operating in the charge integrating mode (q-mode) with an external gate of
400ns long. The shape of the X-ray distribution and the maximum energy observed in argon and
xenon are consistent with the results presented in Fig.9a.
3.3.3. YAP scintillation detector with a short integration time constant
In this test, the YAP scintillation detector is coupled to a PM operating at -1.4kV. The PM anode
output is amplified by the charge integrating amplifier with a gain of ~15mV/pC and the shaping
time of ~65ns. As indicated above, the pulse height spectrum is measured using the QVT pulse
height analyzer operating in q-mode with a 400ns long external gate.
In this case, we are interested to see if there are some X-rays with much larger energies than
~10keV. Fig.10a shows the uncorrected X-ray pulse height spectrum in xenon on the logarithmic
scale. The spark gap was operating at Vspark~1.81kV and p~135 µ . Fig.10b shows the same
spectrum, but in this case the X-rays are blocked with 1.5mm thick lead sheet. As expected, no
events are observed above the pedestal peak. Fig.10c shows the calibration spectrum using the
Cd109 radioactive source. The resolution σ /Peak of the YAP detector is only ~26% at 22 keV,
which is expected due to the finite photoelectron statistics for this type of scintillator. This
resolution is considerably worse compared to the gaseous wire tube detector. Taking into account
the relatively poor resolution of the YAP detector, we conclude that the result of this measurement
is consistent with the corresponding result from the wire tube detector in Fig. 9a. However,
Fig.10a shows few events with energy up to 20-25keV, which would indicate a presence of larger
energies compared to what we measured with the gaseous wire tube detector in Fig.9 (at X-ray
energy of ~20keV the gaseous detector has practically zero detection efficiency - see Fig.5a).

15
(a) (b)
Cou
nts
010
1000
010
1000
(c)
50
co
un
ts/d
iv
X-ray energy [3 keV/div]
Fig. 10. (a) A measured X-ray pulse height spectrum using the YAP scintillation detector while sparking in xenon
at ~1.81kV. The X-rays passing through the 51 µ m Mylar window in the sparking vessel, 3 cm of air, and a
30 µ m thick aluminized Mylar foil in the wire tube chamber (log vertical scale). (b) The same but the X-rays
blocked with 1.5mm thick lead sheet (log vertical scale). (c) The calibration with a Cd109 radioactive source
producing 22keV X-rays; the measured resolution σ /Peak is ~26% at 22 keV (linear vertical scale). Every 50-
th count is bright.
3.4. X-ray production rate as a function of E/p, sparking voltage and gasIn this test, the X-rays pass through a 51 µ m thick Mylar window of the sparking vessel, ~3cm
of air, and the Geiger detector window (38 µ m thick Mylar), i.e., the X-rays below 2-3keV were
absorbed. We placed additional Mylar absorbers in front of the detector to evaluate the hardness of
the X-ray radiation. The gases in the sparking vessel were hydrogen, air, nitrogen, argon, and
xenon. We used the following gas pressure ranges: 195-230 µ for argon, 120-140 µ for xenon,
280-320 µ for air, 275-330 µ for nitrogen, and 850-1020 µ for hydrogen. Outside these pressure
ranges the X-ray production stopped, although the spark gap continued to glow. Fig.11 shows the
measured X-ray rate in the Geiger detector as a function of the sparking voltage for several gases in

16
the sparking vessel. Notice that the argon X-ray spectrum appears to be hardest in this group of
gases.
1
10
100
1000
0.8 1 1.2 1.4 1.6 1.8 2
Hydrogen
(a)
1
10
100
1000
10000
0.8 1 1.2 1.4 1.6 1.8 2
Air(b)
1
10100
1000
10000
0.8 1 1.2 1.4 1.6 1.8 2
Nitrogen(c)
1
10
100
1000
10000
0.8 1 1.2 1.4 1.6 1.8 2
Argon(d)
Spark voltage [kV]
Cou
nt r
ate
[c/m
in]
Fig. 11. The rate of the X-rays in the Geiger detector as a function of the sparking voltage Vspark, gas and a Mylar
absorber thickness: for (a) hydrogen, (b) air, (c) nitrogen and (d) argon; no absorber (diamond) and Mylar
absorbers of the following thickness: 127 µ m (square), 254 µ m (triangle), 356 µ m (filled circle), 483 µ m
(x), 610 µ m (filled circles), and 711 µ m (cross).
Many gaseous phenomena depend on the E/N variable, where E is the electric field and N is the
number of molecules per cm3. E/N is often approximated by an E/p variable, where p is the gas
pressure. For example, the electron drift velocity is often expressed as a function of E/p.
Unfortunately, it is difficult to know E precisely due to a dynamic behavior of the spark; the space
charge effects must also be very important for charges of ~1015 electrons per spark; for E/p higher
than 10kV/cm/Torr, the electron energy is higher than ~50eV, causing ionization. Similarly, a

17
spark pressure may not be known since it depends on the spark temperature, which is not directly
measured during the test (a surface temperature of the sparking vessel is increased rapidly; within
30 minutes it climbed to 70-80oC). Therefore, only approximations can be made. We assume that
E = Vspark/d, where Vspark is determined from Fig.2c, d is ~1 mm, and p is the gas pressure
monitored ~20cm away from the sparking vessel.
0
2000
4000
6000
Rat
e [c
ount
s/m
in]
0 20 40 60 80 100 120 140
E/p [kV/cm/Torr]
Xenon
Hydrogen
Air
Nitrogen
Argon
0
50
100
150
X-r
ay t
her
sho
ld [
kV
/cm
/To
rr]
0 10 20 30 40 50 60
Z of the sparking gas
(b)
Fig. 12. (a) The production threshold and the rate dependence of the X-rays in the Geiger detector on the E/p value
of the gas in the sparking vessel. (b) The dependence of the X-ray production threshold on the atomic
number Z of the gas in the sparking vessel.
0
1000
2000
3000
4000
0 20 40 60 80 100
Elapsed time [min]
Rat
e [c
ount
s/m
in]
Fig. 13. The measured X-ray production rate as a function of elapsed time (sparking in air at Vspark~0.9kV). The
increase is due to the gas heating, which changes E/p.
Figure 12a shows the measured the X-ray rate in the Geiger detector as a function of the E/p
value for several gases in the sparking vessel. In this measurement, no additional absorber was

18
placed between the sparking vessel and the detector. One can see that hydrogen starts producing
the X-rays at the lowest E/p, xenon at highest. From Fig.12b it appears that the X-ray production
threshold correlates with the atomic number Z of the gas.
Figure 13 shows the result in air at sparking voltage Vspark~0.9kV. We see an increase in the
rate as a function of elapsed time since the beginning of the sparking. This may be related to an
increase in the sparking temperature which changes E/p.
-600
-400
-200
0
200
400
600
800
1000
1200
1400
1600
0 200 400 600 800 1000
Time [ns]
dI/d
t [M
A/s
ec]
or I
[A
] or
V [
V]
dI/dt(t)
I(t)
V(t)
X-ray burst occurs only here and lasts ~150ns
Fig. 14. Measured time development of the current I(t), voltage V(t), and current derivative dI/dt(t) relative to the
X-ray production during our sparking tests. The X-ray burst duration is ~150-200ns, and is observed at
~200ns after the spark starts. The spark gap is operating, in this case, in air at Vspark~1.4kV and p ~290 µ ;
similar shapes were measured at Vspark~0.9kV.
3.5. The X-ray production and the I, V, and dI/dt dependence of the spark
We have added several components to the setup of Fig.1 in order to measure the I(t), V(t), and
dI/dt(t) spark parameters. The current I(t) is measured with a 1.2Ω shunt resistor placed in the
ground return of the spark gap, the voltage V(t) is measured with a simple 1000:1 divider, and the
current derivative dI/dt(t) is measured using the toroid coil (so called Rogovski coil [7]). The coil is

19
placed around a conductor delivering the current into the spark gap; it has 30 turns, a minor radius
of 4.2mm, and a major radius of ~17.8mm. To check the Rogovski coil measurement, we also
performed a numerical derivative of the I(t) curve. Fig.14 shows time development of the current,
voltage, and dI/dt during the spark and the relative timing of the X-ray production. The X-rays
were measured in the wire tube or the YAP detectors.
We observe the first X-rays at ~200ns after the spark starts and are all contained within a time
interval lasting 150-200ns, which corresponds to an observation of a slight dip in the current I(t).
The current dip also corresponds to the largest swing of the dI/dt(t). The voltage measurement
shows a small ripple effect at this time; however, we do not measure larger values than the
expected spark voltage Vspark. The observation of the X-ray production during the dip in the
current appears to be consistent with what has been observed during the pinch effect studies [1-4].
4. DISCUSSION OF THE PRODUCTION MECHANISM OF THE X-RAYS
We clearly see the production of soft X-rays with energies between 2 and 10keV, which are
above the expected value given the known sparking voltage. The effect occurs during a slight dip
in the current I(t). This observation appears to be consistent with the earlier pinch effect studies [1-
4], which are explained in the plasma field literature using the theory of radiation collapse [1].
However, one should stress that our spark energies at our smallest sparking voltage (~0.8kV)
are at least a factor of ~4x10⁴ smaller compared to the spark energies used in Refs.1-4. If our
results are due to the pinch effect, we are then observing the pinch effect phenomenon at the
smallest spark energy reported so far in the literature, i.e., we are investigating its threshold
behavior. The maximum observed X-ray energy (~10keV), generated at the lowest voltage
(~0.8kV), is ten times more than expected; it is above the K-shell energy for gases used in our
tests, or the materials used in our spark electrodes (see Table 1 and Chapter 4). The X-ray
production persists even for the carbon electrodes, which have the smallest K-shell energy
(0.284keV); this would appear to eliminate the theory that the electrode atoms are responsible for
the X-ray production. Furthermore, we have evidence that the production threshold and the X-ray
rate is dependent on the gas choice in the sparking vessel. Because of the doubts that the pinch
effect is the only explanation for the observed phenomenon, we were interested in searching for
other possible explanations:
(a) The first obvious question is, if our spark voltages could produce the characteristic K-shell X-
rays in the materials or gases which are present in our system, assuming a multi-electron
participation on a liberation of a K-shell electron of some heavy atom such as iron, nickel, or
molybdenum (see Table 1). The phenomenon would be similar to the multi-photon ionization of
the gas impurities observed when a UV laser is shining into a gaseous drift chamber. However, it
appears that such a production is very unlikely. It is difficult for a charged electron, having an
20
energy of only 50-100eV, to deeply penetrate inside the atom (compared to a neutral photon during
the multi-photon excitation).
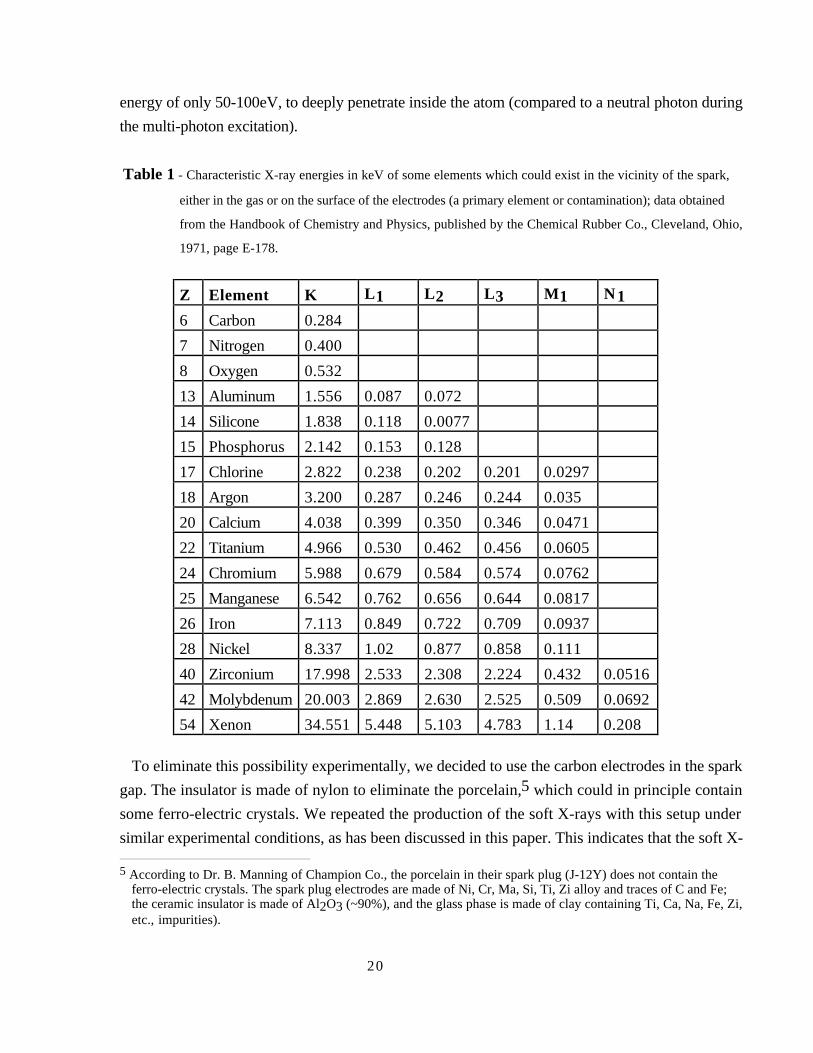
Table 1 - Characteristic X-ray energies in keV of some elements which could exist in the vicinity of the spark,
either in the gas or on the surface of the electrodes (a primary element or contamination); data obtained
from the Handbook of Chemistry and Physics, published by the Chemical Rubber Co., Cleveland, Ohio,
1971, page E-178.
Z Element K L1 L2 L3 M1 N1
6 Carbon 0.284
7 Nitrogen 0.400
8 Oxygen 0.532
13 Aluminum 1.556 0.087 0.072
14 Silicone 1.838 0.118 0.0077
15 Phosphorus 2.142 0.153 0.128
17 Chlorine 2.822 0.238 0.202 0.201 0.0297
18 Argon 3.200 0.287 0.246 0.244 0.035
20 Calcium 4.038 0.399 0.350 0.346 0.0471
22 Titanium 4.966 0.530 0.462 0.456 0.0605
24 Chromium 5.988 0.679 0.584 0.574 0.0762
25 Manganese 6.542 0.762 0.656 0.644 0.0817
26 Iron 7.113 0.849 0.722 0.709 0.0937
28 Nickel 8.337 1.02 0.877 0.858 0.111
40 Zirconium 17.998 2.533 2.308 2.224 0.432 0.0516
42 Molybdenum 20.003 2.869 2.630 2.525 0.509 0.0692
54 Xenon 34.551 5.448 5.103 4.783 1.14 0.208
To eliminate this possibility experimentally, we decided to use the carbon electrodes in the spark
gap. The insulator is made of nylon to eliminate the porcelain,5 which could in principle contain
some ferro-electric crystals. We repeated the production of the soft X-rays with this setup under
similar experimental conditions, as has been discussed in this paper. This indicates that the soft X-
5 According to Dr. B. Manning of Champion Co., the porcelain in their spark plug (J-12Y) does not contain theferro-electric crystals. The spark plug electrodes are made of Ni, Cr, Ma, Si, Ti, Zi alloy and traces of C and Fe; the ceramic insulator is made of Al2O3 (~90%), and the glass phase is made of clay containing Ti, Ca, Na, Fe, Zi,etc., impurities).

21
ray production is very likely related to the gaseous phenomenon and not to the spark gap material,
or to the insulator properties.
(b) In principle, the hot plasma can excite the X-rays through the "thermal Bremsstrahlung"
phenomenon, which is caused by the electron-ion collisions at extremely high temperatures. It is
necessary to heat the plasma to temperatures between 107 and 108 oK to excite the X-ray spectra
seen in Fig. 9b. We exclude this possibility in our experiment because the predominant radiation
from the spark is in the visible spectrum, and therefore, the average temperatures are very likely
below 104 oK.
(c) One also cannot exclude that there is new physics, which goes either in parallel to the theory of
the pinch effect, is driven by it, or even drives it. Refs. 8-12 suggest that both relativistic
Schroedinger and Dirac wave equations allow atoms to have additional energy levels (so called
Deep Dirac levels or DDL levels, which correspond to electron orbits close to the nucleus). Indeed,
if such atomic levels exist then the plasma environment of the spark may be an ideal place to excite
such transitions, because of a large number of ions and energetic electrons involved. A free
energetic electron, perhaps even driven by the pinch effect, may enter an ion with such a velocity
that it is captured by the new DDL atomic energy level. During such entry to the DDL level, the
electron will radiate the Bremsstrahlung spectrum involving many photons, some of them would
be X-rays (for example, the total energy released for hydrogen is close to ~509keV). One should
mention that we have not observed any peaks in the X-ray energy distributions.
So far, we have not established proof that the DDL atoms exist. However, we continue this
search and have finished building a larger detector capable of detecting soft X-rays over a larger
solid angle. The aim of this search is two-fold: (a) to verify that the X-ray production is indeed
isotropic, which must be an essential characteristic of the DDL atomic transitions (as opposed to
the pinch effect), (b) to make a better estimate of the total energy sum per single event.
One may apply the results of this work to explain the soft X-ray spectra from various stars. For
example, Fig. 15a shows a recent astronomical data of the X-ray flux originating from an object
called PKS2155-304 as measured by the BeppoSAX satellite, equipped with the soft X-ray
detectors [13]. Fig.15b shows the background spectrum from the Crab Nebula, which is used for
normalization. Ref.13 speculates that the origin of these spectra is the Synchrotron emission.
However, it is possible to explain, at least in principle, that the shape of the spectrum showed in
Fig.15a is made of a composition of spectra similar to those shown in Fig. 9b from many
contributing elements, i.e., using the plasma processes similar to those investigated by this work,
as the origin of the soft X-rays from these objects.

22
(a)
(b)
Cou
nts
Cou
nts
X-ray energy [keV]
PKS2155-304/CRAB
CRAB Nebula
Fig. 15. (a) The recent astronomical data of the X-ray flux originating from an object called PKS2155-304 as
measured by the BeppoSAX satellite, equipped with the soft X-ray detectors [8]; (b) the same for the CRAB
Nebula, which is used for the normalization purpose in (a).
CONCLUSIONS
1. We observe the production of soft X-rays of energy 2-10keV by sparking in hydrogen, air,
nitrogen, argon, and xenon gases at low pressure with a sparking voltage as low as 0.8-1.6kV.
2. The X-ray events appear to come in clusters, with an average mean multiplicity of 3 per event
into the solid angle of our long drift detector. The extrapolated production into a 4 π -solid angle
is more than ~1500 pulses, assuming the isotropic distribution.
3. The X-ray pulse height spectra in all tested gases have similar shapes resembling a power law
distribution between 2 and 10 keV. Using the range method, the average measured X-ray
energy is about 4keV.
4. The X-ray production threshold depends on E/p of the spark chamber gas. The threshold value
increases as the gas Z increases.
5. The X-ray production persists even for the carbon electrodes; this would appear to eliminate the
theory that electrode atoms are responsible for X-ray production.
6. We calculate that the probability to produce an X-ray event per one electron in a given spark is
less than ~5x10-16. To observe this phenomenon, one needs very large currents. One would
not see it with electrons from an ordinary β-source.
7. The paper also suggest that the observed X-rays could originate, at least partially, from a new

23
process, where energetic free electrons enter ions, and are captured on the DDL levels [8-12],
radiating the Bremsstrahlung spectrum involving many photons.
8. If our results are due to the pinch effect, we are then observing the pinch effect phenomenon at
the smallest spark energy reported so far in the literature, i.e., we are investigating its threshold
behavior.
ACKNOWLEDGMENTS
We are grateful to Catherine Maly for editing this paper. We would like to thank Dr. S. Majewski
for providing the YAP scintillator for this test.
REFERENCES
[1] K.N. Koshelev and N.R. Pereira, J. Appl. Phys., 69(1991)R21.
[2] L. Cohen et al., J. of the Optical Soc. of America, 58(1968)843.
[3] E.D. Korop et al., Sov. Phys. Usp. 22(1979)727, page 729.
[4] G. Herziger et al., Phys. Lett., A64(1978)390.
[5] H. Pruchova and B. Franek, Nucl. Instr & Meth., A366(1995)385; Issue of ICFA
Instrumentation Bulletin, SLAC-PUB-7376, 1997; and H. Pruchova's Ph.D. thesis, Prague
Tech. Univ.
[6] E. Storm and H.I. Israel, "Photon cross-section from 1keV to 100MeV for Elements Z=1 to
Z=100," Atomic Data and Nucl. Data Tables 7(1970)565.
[7] For description of the Rogovski coil see for example S. Glasstone and R.H. Lovberg,
"Controlled Thermonuclear Reactions," 1960, D. Van Nostrand Co., Inc., page 164.
[8] J. A. Maly, J. Va'vra, "Electron Transitions on Deep Dirac Levels I," Fusion Technology 24,
307, (1993).
[9] J. A. Maly, J. Va'vra, "Electron Transitions on Deep Dirac Levels II," Fusion Technology
27, 59, (1995).
[10] J. A. Maly, J. Va'vra, "Electron Transitions on Deep Dirac Levels III. Electron densities in
hydrogen-like atoms using the relativistic Schroedinger equation," Submitted to Fusion
Technology, November 2, 1994.
[11] J. A. Maly, J. Va'vra, "Electron Transitions on Deep Dirac Levels IV. Electron densities in
the DDL atoms," Submitted to Fusion Technology, September 11, 1995.
[12] J. A. Maly, J. Va'vra, "Electron Transitions on Deep Dirac Levels V. Negative energies in
Dirac equation solutions give double deep Dirac levels (DDDL)," Submitted to Fusion
Technology, February 8, 1996.
[13] F. Frontera et al., Proceedings of Compton GRO Symposium, Williamsburg, 1993;
P. Giommi et al., Astronomy and Astrophysics, May 28, 1997.

ICFA Instrumentation Bulletin
BEAM TESTS OF THE CLEO III LIF-TEA RINGIMAGING CHERENKOV DETECTOR
M. Artuso, F. Azfar, A. Emov, S. Kopp, R. Mountain, S. Schuh, T. Skwarnicki,
S. Stone, and G. Viehhauser
Syracuse University, Syracuse, NY 13244-1130
and
T. Coan, V. Fadeyev, I. Volobouev, and J. Yey
Southern Methodist University, Dallas, TX 75275-0175
and
S. Anderson, Y. Kubota, and A. Smithy
University of Minnesota, Minneapolis, MN 55455-0112
and
E. Lipelesy
California Institute of Technology, Pasadena, CA 91125-0001
ABSTRACT
We present preliminary results from a test beam run of CLEO III RICH modules. The system
consists of LiF radiators and multiwire proportional chambers containing a mixture of CH4 and
TEA gases. The radiators were both at and \sawtooth." The data were taken in a beam dump at
Fermilab. We will discuss the chamber stability, electronics, the number of photons observed for
both radiators, the angular resolution per photon and the angular resolution per track.
Supported by National Science Foundation.ySupported by Dept. of Energy
1

ICFA Instrumentation Bulletin
1 Description of the CLEO III RICH System
The CLEO III RICH is based on the `proximity focusing' approach, in which the Cherenkov cone
is simply let to expand in a volume lled with gas transparent to ultraviolet (UV) light before
intersecting the detector surface where the coordinates of the Cherenkov photons are reconstructed.
The components of our system are illustrated in Fig. 1. They consist of a LiF radiator, providing
UV photons, an expansion region, and a photosensitive detector. The angle p is the polar angle of
the incident particle with respect to the radiator normal, is the Cherenkov angle and species
the azimuthal angle of the Cherenkov photons. Our system is based on the one developed by the
College de France-Strasbourg group [1].
@@AAABBCCCÀÀÁÁÁÂÂÃÃÃ@@AAABBCCCÀÀÁÁÁÂÂÃÃÃ@@AAABBCCCÀÀÁÁÁÂÂÃÃÃ@@AAABBCCCÀÀÁÁÁÂÂÃÃÃ@@AAABBCCCÀÀÁÁÁÂÂÃÃÃ@@AAABBCCCÀÀÁÁÁÂÂÃÃÃ@@AAABBCCCÀÀÁÁÁÂÂÃÃÃ@@AAABBCCCÀÀÁÁÁÂÂÃÃÃ@@AAABBCCCÀÀÁÁÁÂÂÃÃÃ@@AAABBCCCÀÀÁÁÁÂÂÃÃÃ@@AAABBCCCÀÀÁÁÁÂÂÃÃÃ@@AAABBCCCÀÀÁÁÁÂÂÃÃÃ@@AAABBCCCÀÀÁÁÁÂÂÃÃÃ@@AAABBCCCÀÀÁÁÁÂÂÃÃÃ@@AAABBCCCÀÀÁÁÁÂÂÃÃÃ@@AAABBCCCÀÀÁÁÁÂÂÃÃÃ@@AAABBCCCÀÀÁÁÁÂÂÃÃÃ@@AAABBCCCÀÀÁÁÁÂÂÃÃÃ@@AAABBCCCÀÀÁÁÁÂÂÃÃÃ@@AAABBCCCÀÀÁÁÁÂÂÃÃÃ@@AAABBCCCÀÀÁÁÁÂÂÃÃÃ@@AAABBCCCÀÀÁÁÁÂÂÃÃÃ@@AAABBCCCÀÀÁÁÁÂÂÃÃÃ@@AAABBCCCÀÀÁÁÁÂÂÃÃÃ@@AAABBCCCÀÀÁÁÁÂÂÃÃÃ@@AAABBCCCÀÀÁÁÁÂÂÃÃÃ@@AAABBCCCÀÀÁÁÁÂÂÃÃÃ@@AAABBCCCÀÀÁÁÁÂÂÃÃÃ@@AAABBCCCÀÀÁÁÁÂÂÃÃÃ@@AAABBCCCÀÀÁÁÁÂÂÃÃÃ@@AAABBCCCÀÀÁÁÁÂÂÃÃÃ@@AAABBCCCÀÀÁÁÁÂÂÃÃÃ@@AAABBCCCÀÀÁÁÁÂÂÃÃÃ@@AAABBCCCÀÀÁÁÁÂÂÃÃÃ@@AAABBCCCÀÀÁÁÁÂÂÃÃÃ@@AAABBCCCÀÀÁÁÁÂÂÃÃÃ@@AAABBCCCÀÀÁÁÁÂÂÃÃÃ@@AAABBCCCÀÀÁÁÁÂÂÃÃÃ@@AAABBCCCÀÀÁÁÁÂÂÃÃÃ@@AAABBCCCÀÀÁÁÁÂÂÃÃÃ@@AAABBCCCÀÀÁÁÁÂÂÃÃÃ@@AAABBCCCÀÀÁÁÁÂÂÃÃÃ@@AAABBCCCÀÀÁÁÁÂÂÃÃÃ@@AAABBCCCÀÀÁÁÁÂÂÃÃÃ@@AAABBCCCÀÀÁÁÁÂÂÃÃÃ@@AAABBCCCÀÀÁÁÁÂÂÃÃÃ@@AAABBCCCÀÀÁÁÁÂÂÃÃÃ@@AAABBCCCÀÀÁÁÁÂÂÃÃÃ@@AAABBCCCÀÀÁÁÁÂÂÃÃÃ@@AAABBCCCÀÀÁÁÁÂÂÃÃÃ@@AAABBCCCÀÀÁÁÁÂÂÃÃÃ@@AAABBCCCÀÀÁÁÁÂÂÃÃÃ@@AAABBCCCÀÀÁÁÁÂÂÃÃÃ@@AAABBCCCÀÀÁÁÁÂÂÃÃÃ@@AAABBCCCÀÀÁÁÁÂÂÃÃÃ@@AAABBCCCÀÀÁÁÁÂÂÃÃÃ@@AAABBCCCÀÀÁÁÁÂÂÃÃÃ@@AAABBCCCÀÀÁÁÁÂÂÃÃÃ@@AAABBCCCÀÀÁÁÁÂÂÃÃÃ@@AAABBCCCÀÀÁÁÁÂÂÃÃÃ@@AAABBCCCÀÀÁÁÁÂÂÃÃÃ@@AAABBCCCÀÀÁÁÁÂÂÃÃÃ@@AAABBCCCÀÀÁÁÁÂÂÃÃÃ@@AAABBCCCÀÀÁÁÁÂÂÃÃÃ@@AAABBCCCÀÀÁÁÁÂÂÃÃÃ@@AAABBCCCÀÀÁÁÁÂÂÃÃÃ@@AAABBCCCÀÀÁÁÁÂÂÃÃÃ@@AAABBCCCÀÀÁÁÁÂÂÃÃÃ@@AAABBCCCÀÀÁÁÁÂÂÃÃÃ@@AAABBCCCÀÀÁÁÁÂÂÃÃÃ@@AAABBCCCÀÀÁÁÁÂÂÃÃÃ@@AAABBCCCÀÀÁÁÁÂÂÃÃÃ@@AAABBCCCÀÀÁÁÁÂÂÃÃÃ@@AAABBCCCÀÀÁÁÁÂÂÃÃÃ@@AAABBCCCÀÀÁÁÁÂÂÃÃÃ@@AAABBCCCÀÀÁÁÁÂÂÃÃÃ@@AAABBCCCÀÀÁÁÁÂÂÃÃÃ@@AAABBCCCÀÀÁÁÁÂÂÃÃÃ@@AAABBCCCÀÀÁÁÁÂÂÃÃÃ@@AAABBCCCÀÀÁÁÁÂÂÃÃÃ@@AAABBCCCÀÀÁÁÁÂÂÃÃÃ@@AAABBCCCÀÀÁÁÁÂÂÃÃÃ@@AAABBCCCÀÀÁÁÁÂÂÃÃÃ@@AAABBCCCÀÀÁÁÁÂÂÃÃÃ@@AAABBCCCÀÀÁÁÁÂÂÃÃÃ@@AAABBCCCÀÀÁÁÁÂÂÃÃÃ@@AAABBCCCÀÀÁÁÁÂÂÃÃÃ@@AAABBCCCÀÀÁÁÁÂÂÃÃÃ@@AAABBCCCÀÀÁÁÁÂÂÃÃÃ@@AAABBCCCÀÀÁÁÁÂÂÃÃÃ@@AAABBCCCÀÀÁÁÁÂÂÃÃÃ@@AAABBCCCÀÀÁÁÁÂÂÃÃÃ@@AAABBCCCÀÀÁÁÁÂÂÃÃÃQQRRRSSTTT¢¢£££¤¤¥¥¥
yDx
( , )y
xD
Incident Hadron
qP
x
y
z
f
LiF Radiator
Cathode Pads
....................................
g
q
TEA + Methane
CaF window2
Figure 1: Schematic diagram of LiF-TEA RICH system.
The photosensitive detector is really the starting point for the system design. We chose a
multiwire proportional chamber lled with a mixture of Triethylamine (TEA) gas and Methane
because it has good quantum eciency (up to 35%) in a narrow wavelength interval between 135-
165 nm, and an absorption length of only 1/2 mm. Other choices such as TMAE gas or phototubes
would have taken most of our allotted 16 cm of radial space, and thus not allowed a full size detector
to be constructed. Other solutions such as DIRC [2] were not feasible due to the existing detector
iron and the desire to limit the detector thickness to less than 12% of a radiation length.
The position of Cherenkov photons is measured by sensing the induced charge on array of 7.6
mm x 8.0 mm pads. Since the pulse height distribution from single photons is exponential, this
requires the use of low noise electronics. A dedicated VLSI chip, called VA RICH, based on a
very successful chip developed for solid state applications, has been designed and produced for our
application at IDE AS, Norway. We have fully characterized hundreds of 64 channel chips, mounted
on hybrid circuits. For moderate values of the input capacitance Cin the equivalent noise charge
2

ICFA Instrumentation Bulletin
measured ENC is found to be about:
ENC = 130e + (9e=pF ) Cin : (1)
Its dynamic range is between 450,000 and 900,000 electrons, depending upon whether we choose a
bias point for the output buer suitable for signals of positive or negative polarity or we shift this
bias point to have the maximum dynamic range for signals of a single polarity.
Two VA RICH chips are mounted on a hybrid circuit. These are attached via miniature con-
nectors to the back of the cathode board of the photon detectors. We group 5 hybrids (10 chips)
into a single readout cell cabled to data boards located in VME crates just outside the detector
cylinder. Chips in the same readout cell share the same control signals and bias lines from the data
boards and output lines from the hybrid to the detector.
The analog output of the VA RICH is transmitted to the data boards as a dierential current,
transformed into a voltage by transimpedance ampliers and digitized by a 12 bit dierential
ADC. These receivers are part of complex data boards which perform several important analog
and digital functions. Each board contains 15 digitization circuits and three analog power supply
sections providing the voltages and currents to bias the chips, and calibration circuitry. The digital
component of these boards contains a sparsication circuit, an event buer, memory to store the
pedestal values, and the interface to the VME cpu.
If a track is incident normal to a LiF radiator no light is emitted in the wavelength range that
can be detected by TEA, due to total internal re ection. A full system for CLEO, therefore, would
require that the radiators be tilted until the track angles are about 15. This causes several serious
problems. One is the diculty in accurate radiator mounting. More importantly, some of the light
from one radiator must traverse through another radiator resulting in lost light and reconstruction
problems. To eliminate these problems a novel radiator geometry has been proposed [3]. It involves
cutting the outer surface of the radiator with a prole resembling the teeth of a saw, and therefore
it is referred to as a \sawtooth radiator" [3]. The major advantage of this conguration is that it
reduces the losses of photons due to total internal re ection at the interface between the radiator
and the expansion region. It also turns out that the angular resolution per photoelectron is greatly
decreased [4].
A crystal prole with teeth about 4 mm deep in a plate of 12 mm thickness is a good compromise
between uniformity in light output, and cost. A detailed simulation has shown that a tooth angle
of 42 is close to optimal and technically feasible. Fig. 2 summarizes the results of this study, which
focuses on particles with p = 2:8 GeV/c. The mean number of reconstructed photoelectrons, Npe,
Cherenkov angle resolution per photon, Cherenkov angle resolution per track, and the probability
for a to fake a K are plotted as a function of the angle between the charged particle and the
normal to the radiator inner surface.
3

ICFA Instrumentation Bulletin
Figure 2: Performance of the sawtooth radiator as a function of the incident track angle. (Normal
incidence is described by cos() of 0.) The curves are parametrized by the sawtooth angle: (a) The
average number of detected photoelectrons, (b) The angular resolution per photon, (c) the angular
resolution per track as a function of incident track angle, (d) the probability for a 2.8 GeV/c to
fake a K for 95% detection eciency.
The fake rates shown in Fig. 2(d) can be estimated accurately for the plane radiator by using the
12.8 mr Cherenkov angle separation coupled with the estimated resolution per track. However, such
a procedure is far too optimistic in the case of the sawtooth radiator. The cause of the worsening
of the fake rate is the that the image pattern of the photons is not described by a single curve
as in the case of the plane radiator. In fact the image has two main branches and two secondary
branches which contain <10% of the photons. The predicted image pattern for tracks normally
incident on a sawtooth is shown in Fig. 3. The possibility for multiple interpretations of a photon
path is responsible for the worsening of the fake rate. In the data analyzed here only the two main
branches are considered.
There are several problems inherent in producing such radiators, including the ability to pre-
cisely cut the LiF without cleaving the material and the ability to polish the surface to yield good
4

ICFA Instrumentation Bulletin
Figure 3: Cherenkov photon pattern on the detector plane for a track at normal incidence to a
sawtooth radiator. The lense densely populated paths result from a combination of one refraction
and one re ection.
ultraviolet light transmission. Furthermore, the production time and cost need to be reasonable.
We worked with OPTOVAC in North Brookeld Mass. to produce two full sized radiators. A close
up of two sawtooth radiators separated by a plane radiator is shown in Fig. 4.
Figure 4: Two sawtooth radiators separated by a plane radiator. The teeth are aligned perpendic-
ular to one other in this test beam setup.
Transparency measurements for the two sawtooth radiators have been made relative to a plane
polished sample of LiF. The transmissions for both pieces are very good. One exceeded the normally
polished sample by 10% while the other was equal to it. The measurements for the better sample
are shown in Fig. 5.
5
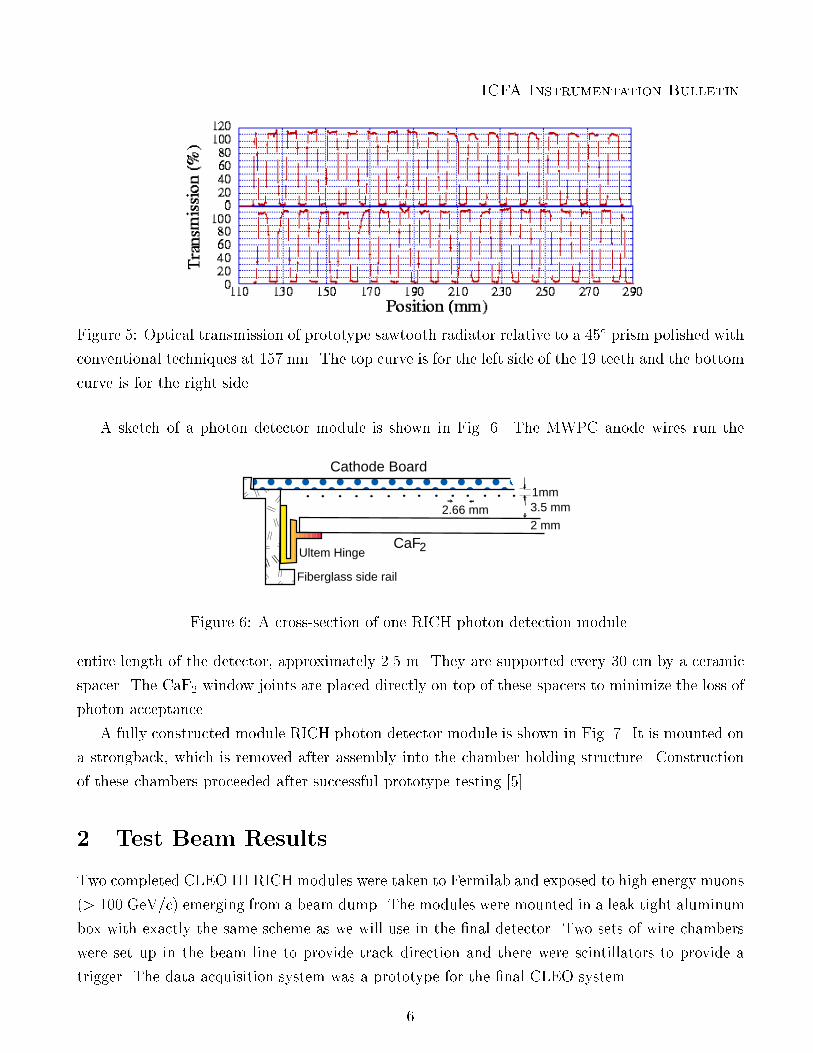
ICFA Instrumentation Bulletin
Figure 5: Optical transmission of prototype sawtooth radiator relative to a 45 prism polished with
conventional techniques at 157 nm. The top curve is for the left side of the 19 teeth and the bottom
curve is for the right side.
A sketch of a photon detector module is shown in Fig. 6. The MWPC anode wires run the
. . . . . . . . . . . . . .
Cathode Board
CaF2Ultem Hinge
Fiberglass side rail
1mm2.66 mm 3.5 mm
2 mm
Figure 6: A cross-section of one RICH photon detection module.
entire length of the detector, approximately 2.5 m. They are supported every 30 cm by a ceramic
spacer. The CaF2 window joints are placed directly on top of these spacers to minimize the loss of
photon acceptance.
A fully constructed module RICH photon detector module is shown in Fig. 7. It is mounted on
a strongback, which is removed after assembly into the chamber holding structure. Construction
of these chambers proceeded after successful prototype testing [5].
2 Test Beam Results
Two completed CLEO III RICH modules were taken to Fermilab and exposed to high energy muons
(> 100 GeV/c) emerging from a beam dump. The modules were mounted in a leak tight aluminum
box with exactly the same scheme as we will use in the nal detector. Two sets of wire chambers
were set up in the beam line to provide track direction and there were scintillators to provide a
trigger. The data acquisition system was a prototype for the nal CLEO system.
6
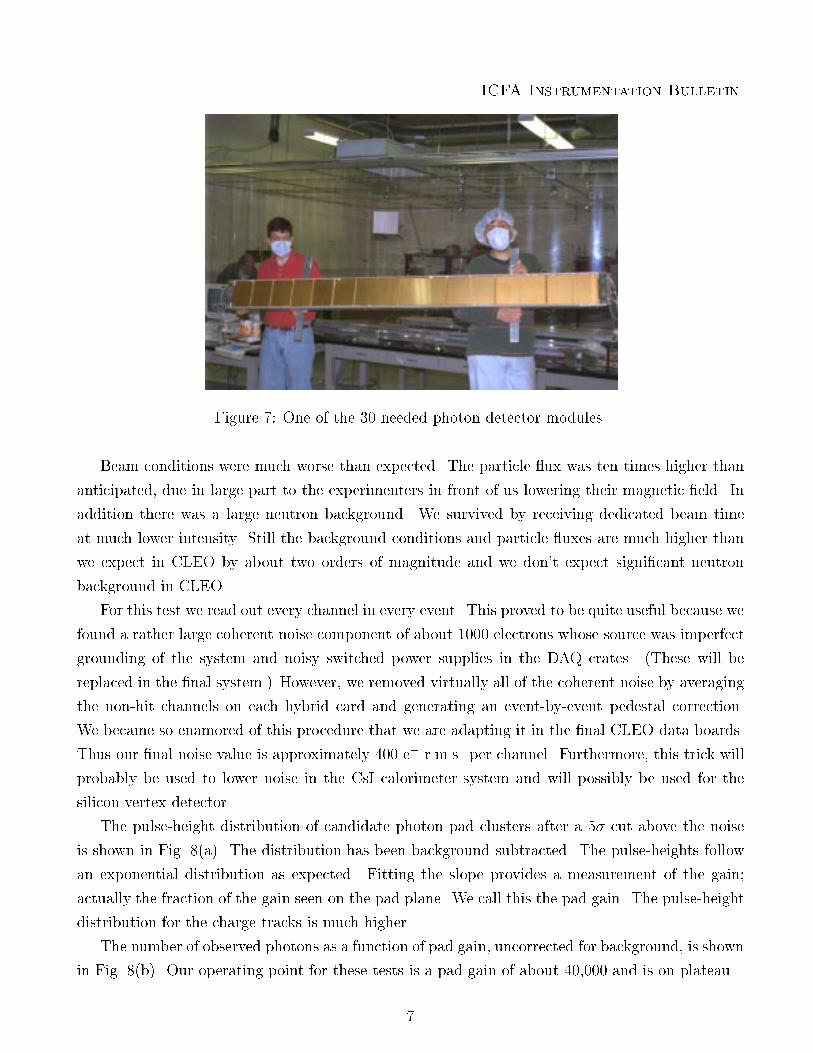
ICFA Instrumentation Bulletin
Figure 7: One of the 30 needed photon detector modules.
Beam conditions were much worse than expected. The particle ux was ten times higher than
anticipated, due in large part to the experimenters in front of us lowering their magnetic eld. In
addition there was a large neutron background. We survived by receiving dedicated beam time
at much lower intensity. Still the background conditions and particle uxes are much higher than
we expect in CLEO by about two orders of magnitude and we don't expect signicant neutron
background in CLEO.
For this test we read out every channel in every event. This proved to be quite useful because we
found a rather large coherent noise component of about 1000 electrons whose source was imperfect
grounding of the system and noisy switched power supplies in the DAQ crates. (These will be
replaced in the nal system.) However, we removed virtually all of the coherent noise by averaging
the non-hit channels on each hybrid card and generating an event-by-event pedestal correction.
We became so enamored of this procedure that we are adapting it in the nal CLEO data boards.
Thus our nal noise value is approximately 400 e r.m.s. per channel. Furthermore, this trick will
probably be used to lower noise in the CsI calorimeter system and will possibly be used for the
silicon vertex detector.
The pulse-height distribution of candidate photon pad clusters after a 5 cut above the noise
is shown in Fig. 8(a). The distribution has been background subtracted. The pulse-heights follow
an exponential distribution as expected. Fitting the slope provides a measurement of the gain;
actually the fraction of the gain seen on the pad plane. We call this the pad gain. The pulse-height
distribution for the charge tracks is much higher.
The number of observed photons as a function of pad gain, uncorrected for background, is shown
in Fig. 8(b). Our operating point for these tests is a pad gain of about 40,000 and is on plateau.
7

ICFA Instrumentation Bulletin
Figure 8: (a)The pulse height distribution for hits 5 above noise from photon candidate clusters.
(b) The number of observed photons, including background, as a function of pad gain.
For the plane radiator, we were able to congure the detector so that the photon pattern would
appear only in one chamber. For the sawtooth radiator we would have needed three chambers to
fully contain the image. Sample images from the plane and sawtooth radiators are shown in Fig. 9.
Here the track was incident at 30 to the plane radiator and zero degrees for the sawtooth.
The best way to ascertain the expected performance is to rst view the number of photons and
the angular resolution per photon. In Fig. 10(left) we show the Cherenkov angle for all photons
from many tracks. Fitting to a Gaussian with an asymmetric tail and quadratic background gives
an angular resolution per photon of about 13.50.2 mr and a background of 8.8%. The asymmetric
tail is due to the chromatic error [7].
Our Monte Carlo simulation includes information on CH4-TEA quantum eciency as a function
of wavelength, crystal transmissions, etc... The background under the single photon peak has been
modeled and included in our simulation. We think the background is mostly due to out of time
tracks and that the background level in CLEO will be much smaller. The Monte Carlo simulation is
in good agreement with the angular resolution per photon, and, after being adjusted to yield more
photons, is also in good agreement with the photon distribution. From these data we can estimate
the expected resolution per track, and compare to what we measure. The results presented here
are preliminary; we have more data to analyze and the reconstruction algorithms are undergoing
improvement.
Fig. 10(right) shows the number of detected photons per track, before background subtraction.
The average number, after background subtraction, is approximately 14. Including some smearing
from the background, we estimate the nal average resolution per track to be 3.9 mr. However,
8

ICFA Instrumentation Bulletin
Figure 9: Single event images from the plane (top) and sawtooth (bottom) radiators. The light
yellow points are where photons are expected to hit the detector plane. The green and blue points
are photon hits and the crosses mark the reconstructed photon positions. The red point between
the two arcs of the lower images shows the charged track impact point.
we have not included any error from the tracking system. Monte Carlo simulation of our tracking
system shows that it contributes a 2.3 mr r.m.s. error [6]. Thus we expect a resolution of 4.5 mr
on the Cherenkov angle per track, which is what we observe in Fig. 11. Most of the tracking error
contribution comes from inaccurate prediction of the impact point of the track on the radiator,
rather than a poorly determined track angle. We expect this to be substantially better in CLEO
III, and thus expect to achieve our goal of 4.2 mr resolution. The pion momentum distribution
from Bo ! + is a box shaped spectrum from 2.5 to 2.8 GeV/c, spread by the Doppler shift
due to the B momentum. The angular separation between K and at 2.8 GeV/c is 12.8 mr. Thus
4.2 mr resolution will provide better than 3 K= separation for all B decays [8].
In Fig. 12 and Fig. 13 we show similar plots for the sawtooth radiator. We see the expected
improvement in angular resolution per photon of 11.80.2 mr. Here the Monte Carlo predicts a
slightly better resolution. The number of observed photons is approximately 13.5. The measured
Cherenkov angular resolution per track is 4.80.05 mr. The Monte Carlo prediction is 4.1 mr. We
are not sure of the sources of this disagreement but it is possible that the crystal alignment is not
adequate or that we do not know the sawtooth angle precisely enough. The number of photons
needs to be corrected upwards by a factor of 1.7 since we do not have complete acceptance for
9

ICFA Instrumentation Bulletin
Figure 10: Results from test beam studies compared with Monte Carlo simulation for a plane
radiator with tracks at 30 incidence. (left) The Cherenkov angle of each photon for a sum over
many tracks. (right) The number of photons for each track.
both branches of the sawtooth image. For full acceptance we calculate 20 photons on average, after
removing the 9% background. The sawtooth radiators work and we will use them for 3/7 of the
detector, which covers 5/8 of the available solid angle.
3 Conclusions
Fig. 14 shows the measured resolution per track for the plane and sawtooth radiators as a function of
the background subtracted number of photons detected. The curves are ts to the parameterization
(a=pn)
2+ b2. Unfortunately, the parameters a and b have no relevant meaning since their errors
are completely anti-correlated.
Table 1 summaries the achieved and predicted track resolutions.
Table 1: Track resolutions (mr)
Radiator Data Monte Carloy MC no background CLEO
& no tracking errors expectations
plane (30) 4.50.07 4.5 3.9 4.0
sawtooth (0) 4.80.05 4.1 3.8 2.9-3.8
y Statistical errors on the Monte Carlo samples are 0.04 mr.
These data though preliminary show that we have a good understanding of the system and
10

ICFA Instrumentation Bulletin
Figure 11: The Cherenkov angular resolution per track for a plane radiator with tracks at 30
incidence.
we can expect the predicted levels of eciency versus rejection in CLEO III. Furthermore, the
chambers held voltage, the electronics functioned, and the gas system worked, in much more dicult
environment than will be present in CLEO. We have data for several additional incident angles
for both plane and sawtooth radiators. After we have analyzed these data and understood the
systematic errors in more detail, we will present more complete results in a later publication.
4 Acknowledgments
We thank Fermilab for their cooperation in providing a high energy particle beam and computing.
Especially noteworthy for their help were Chuck Brown and Joel Butler. Franz Muheim and Stephen
Playfer played major roles in the early stages of this work. Jacques Seguinot and Tom Ypsilantis
provided initial insights and encouragement. We appreciate the help of our CLEO colleagues,
especially Chris Bebek, Je Cherwinka, Charlie Strohman and Frank Wurthwein. Support was
provided by the National Science Foundation and the Department of Energy.
11

ICFA Instrumentation Bulletin
Figure 12: Results from test beam studies compared with Monte Carlo simulation for a sawtooth
radiator with tracks at normal incidence. (left) The Cherenkov angle of each photon for a sum over
many tracks. (right) The number of photons for each track.
Figure 13: The Cherenkov angular resolution per track for a sawtooth radiator with tracks at
normal incidence.
12

ICFA Instrumentation Bulletin
Figure 14: The Cherenkov angular resolution per track as a function of the number of detected
photons (background subtracted) for a plane radiator with tracks at 30 incidence (left) and for a
sawtooth radiator with tracks at normal incidence (right).
13

ICFA Instrumentation Bulletin
References
[1] R. Arnold el al., Nucl. Inst. and Meth. A314 (1992) 465.
[2] B. Ratcli, Nucl. Instr. and Meth. A343 292 (1994).
[3] A. Emov et al., Nucl. Instr. and Meth. A365 285 (1995).
[4] The improvement in angular resolution per photon is due to the reduced refraction at the
LiF-N2 interface. Thus the angular spread due to chromatic dispersion is not magnied as
much for the sawtooth radiator as it is for the plane radiator.
[5] S. Playfer et al, Nucl. Instr. and Meth. A371 321 (1996).
[6] We used 30 cm2 wire chambers borrowed from Fermilab which had 5 mm wide cells. We
equipped the wire readout with TDC's, also borrowed from Fermilab, but have not imple-
mented the TDC readout. If time permits we can, in principle, improve the tracking errors.
[7] We have not quoted systematic errors on the various measured resolutions in this paper. The
systematic errors are likely to be as large if not larger than the statistical errors, and thus we
emphasize the preliminary nature of these results.
[8] We also expect to have 2 =K separation at 2.8 GeV/c from the dE/dx system in the drift
chamber.
14

ELECTRON MULTIPLICATION AND SECONDARYSCINTILLATION IN LIQUID XENON: NEW PROSPECTS
A.J.P.L.Policarpo, V.Chepel, M.I.Lopes and R.Ferreira Marques
LIP-Coimbra and Physics Department of the University of Coimbra
University of Coimbra, 3000 Coimbra, Portugal
ABSTRACT
The history, present situation and prospects on electron multiplication and secondary
scintillation in liquid xenon and their application to radiation detectors are shortly
discussed.
1 IntroductionProportional charge multiplication and secondary scintillation are two effects of
great importance for radiation detection. Intrinsic amplification in a detector, which
becomes possible thanks to these mechanisms, notably improves the detector performance.
Apart from reducing requirements to the front end electronics, the intrinsic amplification
results in significant increase of signal-to-noise ratio and, as a consequence, allows the
detection of particles that deposit in the detector very low energy with good energy
resolution. Moreover, the influence of positive ions, produced by an ionizing particle along
its track, on the signal amplitude can be neglected. The essence of proportional
multiplication is that electrons, drifting in a strong electric field, gain enough energy to
ionize the atoms and/or molecules of the medium. Overall, every primary electron can
produce thousands of secondary electrons. Thus, yielding a total collected charge at the
detector output proportional to the ionization charge (energy deposit) produced by the
incoming particle.
Typically, the practical electric field threshold for achieving charge multiplication in
gas is E/pª~5 to 10 V/cm/Torr (E/N >1.4x10⁻¹⁶ Vcm2), where E is the electric field
strength, N the number of atoms/molecules of the gas per cubic centimeter and p the
pressure.
Secondary scintillation does not require such a high field as charge multiplication of
the charge as the drifting electrons do not ionize the gas but just excite its atoms. The
threshold field for secondary scintillation in noble gases is about E/p~1 V/cm/Torr
(E/N~3x10-17 Vcm2). The scintillation light, mostly UV or VUV, emitted is commonly
detected by photomultiplier tubes. One drifting electron can produce up to hundreds of

photons reaching the photomultiplier, resulting in tens to hundreds of photoelectrons
emitted from the photocathode. Employing the secondary scintillation allows very good
energy resolution to be achieved as the statistics of charge multiplication is avoided.
In general, excitation of the gas by drifting electrons always precedes charge
multiplication. In proportional counters, however, the light emission plays a negative role.
It may give rise to electric discharges due to possible photoelectric emission of electrons at
the cathode thus resulting in positive feedback in the chamber. Therefore, quenching
admixtures are usually added to the main detecting gas, in order to suppress the light
emission or shorten its mean free path, thus allowing to achieve higher charge gains. For
example, in gaseous xenon, which is the most efficient g-ray absorber, an order of
magnitude higher gain can be achieved with Xe/CH4 mixture than with pure xenon [1].
Conversely, employing secondary scintillation requires the gas to be pure. It is very
important to keep in mind this point when one considers the possibility of electron
multiplication or secondary scintillation in liquid xenon as the purity requirements in the
liquid are much more severe than in the gas. Concentration of electronegative impurities of
~10 ppb (oxygen equivalent) limits the electron life time to a few ms and is not acceptable
for many applications.
Liquid xenon detectors were recently proposed for various applications: as
electromagnetic calorimeters for high energy physics [2,3], for gamma ray detection in
astronomy [4], as a time projection chamber for particle physics experiments [5], imaging
detectors for nuclear medicine [6,7]. These detectors work either in ionization or in primary
scintillation mode or combine both of them, i.e. with no intrinsic amplification in the
chamber. However, even a moderate charge amplification is highly desirable. This justifies
the efforts that were and are being made in order to study the possibility of achieving both
multiplication and secondary scintillation in liquid xenon detectors, which is the subject we
shall discuss below.
2 Historical surveyThe first observations of the electron multiplication in condensed noble gases were
reported 50 years ago by Hutchinson [8]. Twenty years later, in the beginning of the 70s, a
detail investigation of multiplication in liquid xenon in view of possible applications for
radiation detection was initiated by L.W.Alvarez and carried out independently in several
laboratories [9-12]. The ultimate goal of replacing the gas in the proportional chamber with
a liquefied noble gas was to improve the position resolution. Indeed, increasing the density
of the detecting medium would result in an increase of the number of ion pairs produced by
a minimum ionizing particle within the detector, thus allowing a more accurate definition of

the center of gravity of the electron distribution and, therefore, better localization. In
addition, this is accompanied by the suppression of electron diffusion and delta-ray range.
Furthermore, the decrease of the detector thickness decreases the localization uncertainty
due to parallax. Alternatively, sacrificing spatial resolution, a thick chamber can be
produced providing high detection efficiency of g-rays.
A maximum gain of about 200 has been obtained in a liquid xenon single wire
cylindrical proportional chamber with very thin anode wires using as a radioactive source
either an internal 207Bi, which emits conversion electrons and g-rays of energy of about
0.5 MeV and 1 MeV, or an external g-ray source 137Cs (662 keV) or 207Hg (85 keV and
279 keV). It was found that multiplication in the liquid occurs at E/N significantly lower
than one could expect from a simple extrapolation of the data obtained in gaseous xenon to
the liquid densities. Nevertheless, wires of 3 to 5 mm diameter are required to obtain
electric field strengths of ~1 MV/cm near the anode surface at the applied voltage of several
kV. An energy resolution of about 22%, fwhm, was measured for 279 keV g-rays with
the 3.5 mm wire at gain of 10 [10]. The resolution becomes worse at higher gains. A poor
energy resolution roots, apparently, in the non-uniformity of the wire diameter and
probable irregularities on its surface (one can roughly estimate that variations of the
diameter of 1% can cause differences in the gain of ~30%).
Chambers of 6 to 10 mm cathode diameter were experimented by different authors
[9-12]. A saturation of the charge pulse amplitude after reaching a gain of ~200 due to
accumulation of positive space charge near the wire was observed. For example, a
reduction of the count rate from 2000 to 200 s-1 resulted in an increase of the saturation
amplitude by a factor of 3 [10] (for the cathode diameter of 8 mm), showing that the low
mobility of positive ions in liquid xenon constitutes a real problem for the practical use of
the electron multiplication.
The first Townsend coefficient, a, was computed by fitting the experimental data
with 9 adjusting parameters [10]. It was found to be 27 times larger than it would be in
gaseous xenon with the same density showing that liquid xenon is not just a compressed
gas. The maximum reported value of a=(4.47±0.26)x104 cm-1 was obtained at
E=2 MV/cm. The results were, however, questioned by T.Doke, since the fit does not
converge to the right W-value and recombination constant [13]. The coefficient a was also
derived by Prunier et al. [11] from independent measurements. The values reported were
close to those obtained by Derenzo et al. at fields above ~0.8 MV/cm, but the W-value
suffers from the same inconsistency with other data.

An attempt to build a multiwire proportional chamber has been undertaken [14].
However, much higher voltages were required to reach the same gain as in a single wire
counter and, practically, it was difficult to operate the chamber at a gain higher than 10.
Such thin wires are very difficult to handle; they can be easily damaged by electrical
discharges. In addition, the electrostatic repulsion between the wires in a multiwire
chamber is so strong that frequently leads to breaking the wires, just due to application of a
high voltage, and special means (wires interlaced with quartz fibers) were necessary to
keep the wires in a plane. Thus, although the first results were very promising and
significant and reproducible multiplication of electrons in liquid xenon has been obtained,
the technical difficulties associated to practical applications are such that this line of research
was practically abandoned.
Secondary scintillation of liquid xenon has been first observed by Dolgoshein et al.
[15] in a uniform electric field. The threshold field was found to be ~100 kV/cm. Later, it
was studied by a Japanese group [16, 17] in a cylindrical geometry with wires of 4 to
20 mm diameter. Although, the authors do not present the absolute number of photons
emitted, one can roughly estimate it to be ~10 to ~100 photons per primary electron,
depending on the applied voltage, for the 4 mm anode wire. The lowest value corresponds
to a voltage at which there is essentially no charge multiplication while the highest one was
obtained for a charge gain of ~50 was observed.
Assuming the same linear relationship between the number of photons per electron
and the electric field strength, found for gas, the authors made a fit to the measured data
and found the threshold field for secondary scintillation in liquid xenon to be surprisingly
high. A value ranging from 400 kV/cm to 700 kV/cm was derived, which is much larger
than the one previously obtained [15] and very close to the field at which the electron
multiplication occurs. However, these figures are consistent with the value calculated
considering liquid xenon as compressed gas at 520 bar.
Proportional scintillation could also be observed with thicker wires. With the wire
of 20 mm diameter, ~5 photons per electron are emitted at an anode voltage of 5 kV, as
estimated by T.Doke [18] (our estimate, using the same method as above and taking into
account the scintillation light yield for liquid xenon measured in [19], gives the value of
~20 photons per primary electron). For a 50 mm wire, the figure of ª30 photons per
electron was estimated to be achievable at the anode voltage of 12 kV [20].
However, the energy resolution as good as expected has not been obtained. It was
measured to be about 16-20% for 1 MeV electrons, almost independently of the wire
diameter [16]. The same 16% resolution was also obtained when the chamber was operated
in ionization mode. The authors attribute this fact to imperfect charge collection onto the

wire in that particular chamber geometry. In a better geometry, the resolution of 15% was
measured for alpha-particles [17]. In order to compare this value to that obtained with
electrons, one should take into account that due to high ionization density along the
alpha-particle track in liquid xenon, only a few percent of the electrons escape the
recombination in the field of ~10 kV/cm. Thus, the number of electrons collected onto the
anode wire in this experiment corresponds to an energy deposition of ~250 keV by a
minimum ionizing particle. To our knowledge, there are no other experimental results
published in the literature showing that a better energy resolution has be achieved.
Secondary scintillation was used in a liquid xenon drift chamber built for precise
localization of charged particles (20 mm, r.m.s.) [17] or annihilation g-rays (0.9 mm,
fwhm) [21]. Recently, a liquid xenon detector was developed for detection of WIMP’s
(Weak Interacting Massive Particles) [22]. Detection of the xenon primary and secondary
scintillation from the same event allows to discriminate the background, mainly due to
minimum ionizing particles, and to detect the recoil nuclei with high signal-to-noise ratio.
Secondary scintillation, with an increase in the photon yield relatively to the primary
scintillation by a factor of 10 (for 122 keV g-rays; 4.5 mm wire), was measured and the
information obtained allowed the design of a prototype of a 700 cm3 chamber. To our
knowledge, this is the first reasonably sized device designed with the specific aim of using
intrinsic gains with liquid xenon, towards a well defined physics experiment.
3 Charge multiplication with new microstructuresThe development of new microstructures, such as microstrip and microgap
chambers, refreshed the interest for electron multiplication in liquid xenon. Indeed, not
only such devices can be made with anode strips of several micrometers width and thus
substitute thin fragile wires, but also the short anode to cathode distance allows the fast
collection of positive ions. It is interesting to note that the advantage of such a kind of
device was recognized more than 20 years ago: the “development of a practical
high-resolution chamber of large size requires replacement of the stretched fine wires by
conductive strips laid down on an insulating substrate” [9].

Fig.1 Schematic drawing of the liquid xenon chamber with a microstrip plate
The electron multiplication in a microstrip plate (MS) has been observed in liquid
xenon by us and is reported in the literature [23]. A plate of ILL-6C type was used for the
measurements. It has anode strips of 8 mm width, cathodes of 400 mm width and
1000 mm anode pitch. The strips, made of nickel, are deposited on Desag D236 glass
(Fig.1). An 241Am alpha-source of 4 mm diameter was deposited on the drift electrode
1.9 mm away from the MS plate surface and parallel to it. All the anode strips were
connected together, as well as all the cathodes. The negative voltage was applied to the drift
electrode; cathodes were kept at the ground potential and a positive voltage applied to the
anodes. Three signals were read from the chamber with low-noise charge-sensitive
preamplifiers: at the anode strips, at the cathodes and at the drift electrode. The latter
allowed to account for the recombination along the alpha-particle track which is a function
of the drift field strength.
The chamber was filled with carefully purified liquid xenon and cooled down to the
temperature of about -60ºC being immersed into an ethanol bath cooled with liquid
nitrogen.
With an increase of the anode voltage above 600 V (at constant drift voltage), the
amplitude of the anode signals, normalized to those taken at the drift electrode (i.e.,
corrected for the charge yield from the particle track), started to rise while the signals at the
cathode strips changes the polarity (Fig.2). The amplitude of the signals was determined as
the position of the corresponding peak on the amplitude spectrum.

Fig.2 Anode and cathode signal amplitudes as a function of anode voltage [23].
Published with permission
The interpretation of this plot is as follows. As the alpha-particle range in liquid
xenon is of the order of tens of microns and the drifting electron cloud is broadened due to
diffusion by ~100 mm, i.e. comparable with the distance between the cathode edge and the
anode, and the source diameter is larger than the MS plate pitch, two possibilities may arise
at low fields. First, the electrons extracted from each track can be collected almost totally
either to the cathodes or to the anode strips, thus inducing negative charge signals with the
amplitude equal to 1 (inverted in Fig.2) on the corresponding electrode. Second, the
drifting charge can be split between the electrodes and this is the case for the anode
potential <200 V at which the amplitude of the anode signal varies with the applied
voltage. An increase of the anode potential to 500 V results in complete charge collection to
the anodes; the count rate at the anodes also increases at the cost of that observed at the
cathodes; when the drifting charge is split, most of it is collected onto the anode strips, also
yielding a decrease of the amplitude of the cathode signals. Up to this voltage, the results
are fully explainable on the basis of collection conditions of the drifting electrons.
As one increases the anode voltage above 600 V, the electron multiplication starts.
We observe both an exponential rise of the anode amplitude and the appearance of inverted
pulses on the cathodes, induced by positive ions created near the anode surface and drifting
towards the cathodes. The inequality of the amplitudes of the signals observed at the
anodes and cathodes is, apparently, due to the long ion drift time estimated to be ~100 ms
for the distance of 300 mm. Such long signals could not be measured correctly with our
electronics. At the intermediate anode voltages, between 500 and 800 V, the signals of
both polarities at the cathode strips could be observed with an oscilloscope, some of them

related with the collection of the electrons from the particle track to the cathodes while
others being induced by those collected to the anode where the multiplication occurred.
At higher drift voltage, higher maximum multiplication gain could be achieved. At
-2600 V applied to the drift electrode, we measured the gain of about 10 at the anode
voltage of 1700 V. It was the highest voltage that we could apply to the anode. Further
voltage increase resulted in unstable behavior and discharges.
The collection time of the positive ions in the MS chamber filled with liquid xenon
is still long. It can be eventually reduced several times by using a plate with smaller
distance between the anode and cathode strips. A more radical solution is to use a microgap
chamber (MGC) instead. In this chamber, the anode strips are separated from the cathode
plane by a thin insulating layer so that the drift path of the ions can be made of a few
microns. In addition, a higher field strength at the anode surface is expected to be achieved
at lower anode voltage. Therefore, we also experimented an MGC chamber produced in
Delft Technical University [24] in liquid xenon. The experimental set-up and working
conditions were essentially the same as for the MS chamber. However, discharges at anode
voltage as low as 450 V did not allow to achieve the field strength at which the electron
multiplication might possibly occur.
The MS plates and MGC chambers, in general advantageous when compared to
wire chambers, have however one drawback: the existence of a dielectric surface
supporting the electrodes significantly limits the operating voltage as it favors the
occurrence of surface discharges. One could think about producing a substrate with a
special profile in order to reduce the tangential component of the electric field at the
dielectric surface (the leak microstructure [25] is an example) but it complicates the design
and such a device can become too “bulky” for some applications (this is the case of the
liquid xenon detector for PET, for instance [7], where the dead volume in the chamber has
to be minimized).

Fig.3 Virtual cathode chamber configuration considered in calculations. Selected central
area corresponds to that shown in Fig.4.
A new microstructure, the so called “virtual cathode chamber”, which has recently
been suggested for gas filled proportional detectors [26], may be an interesting option for a
liquid xenon detector, as well. It attracts by the simplicity of the design and by having a
bulk insulator (substrate) between the anode strips and the cathode layer deposited on the
opposite side of the substrate (Fig.3) thus avoiding discharges.
In order to assess the possibility of charge multiplication with this device, we
performed calculations of the electric field and the multiplication gain for the chamber
shown in fig.3 and for various sets of potentials at the drift electrode and the cathode plane,
assuming the anode strips to be kept at the ground potential. The field configurationobtained for Vd= -2000 V and Vc= -1800 V is shown in Fig.4. The calculations show
that the field strength of >1 MV/cm, necessary for multiplication in liquid xenon, can be
achieved along a few mm close to the surface of the anode strip. Moreover, near the anode,
the field varies with the distance much slower than ~1/r, typical of cylindrical geometry,
thus being more favorable for the multiplication. We have found that the multiplication
region of several micrometers is expected to result into a total gain of ~100 or higher.
However, one should remember that since the multiplication is an exponential process, a
small uncertainty in the first Townsend coefficient, which we took from [10], may lead to a
significant error in the calculated gain. Nevertheless, even being pessimistic we believe that
the considered microstructure has good prospects in what concerns both charge
multiplication and secondary scintillation.

.
Fig.4 Field configuration in the drift region of the virtual cathode chamber shown in fig.3with Vd= -1800 V and - Vd= -2000 V. Dimensions shown in the figure are in mm.
4 ConclusionThe possibility of taking profit from electron multiplication and secondary
scintillation in liquid xenon radiation detectors, that were observed over 20 years ago and,
at that time, did not find any practical applications due to technical difficulties, should be
reconsidered, in view of the recent development of new reliable and easy to handle
microstructures. The existing data, however, are contradictory and, therefore, additional
studies of the multiplication and secondary scintillation processes are required.
References[1] H.Sakurai and B.D.Ramsey. Dependence of Energy Resolution on Anode Diameter in
Xenon Proportional Counters, Nucl.Instr. and Meth. in Phys. Res., vol.A313,
pp.155-160, 1992.
[2] J.Séguinot, G.Passardi, J.Tischhauser and T.Ypsilantis, Liquid Xenon Ionization and
Scintillation. Studies for a Totally Active-Vector Electromagnetic Calorimeter, Nucl.
Instr. and Meth. in Phys. Res., vol.A323, pp.583-600, 1992.

[3] M.Chen, M.Mullins, D.Pelly et al. Homogeneous Scintillating LKr/LXe Calorimeters,
Nucl. Instr. and Meth. in Phys. Res., vol.A327, pp.187-192, 1993.
[4] E.Aprile and M.Suzuki, Development of Liquid Xenon Detectors for Gamma Ray
Astronomy, IEEE Trans. on Nucl. Sci., vol.NS-36, pp.311-315, 1989.
[5] G. Carugno, G.Pete, S.Cerdonio et al. Test of a Self Triggered Liquid Xenon TPC,
Proc. Int. Conf. on Liquid Radiation Detectors, Waseda University, Tokyo, 1992, Ed.
T.Doke, pp.104-108.
[6]V.V.Egorov,V.P.Miroshnichenko, B.U.Rodionov, A.I.Bolozdynya, S.D.Kalashnikov
and V.L.Krivoshein. Electroluminescence Emission Gamma-Camera, Nucl. Instr. and
Meth., vol.205, pp.373-374, 1983.
[7] V.Yu.Chepel, M.I.Lopes, H.M.Araújo, M.A.Alves, R.Ferreira Marques and
A.J.P.L.Policarpo. Liquid Xenon Multiwire Chamber for Positron Tomography,
Nucl. Instr. and Meth. in Phys. Res., vol.A367, pp.58-61, 1995.
[8] G.W.Hutchinson. Ionization in Liquid and Solid Argon, Nature, vol.162, pp.610-611,
1948.
[9] R.A.Muller, S.E.Derenzo, G.Smadja, D.B.Smith, R.G.Smits, H.Zaklad and
L.W.Alvarez. Liquid-Filled Proportional Counter, Phys. Rev. Lett., vol.27, pp.532-
535, 1971.
[10] S.E.Derenzo, T.S.Mast, H.Zaklad and R.A.Muller. Electron Avalanche in Liquid
Xenon, Phys. Rev., vol.A9, pp.2582-2591, 1974.
[11] J.Prunier, R.Allemand, M.Laval and G.Thomas. Some Properties of Xenon
Liquid-Filled Nuclear Detectors, Nucl. Instr. and Meth., vol.109, pp.257-264, 1973.
[12] M.Miyajima, K.Masuda, A.Hitachi, T.Doke, T.Takahashi, S.Konno, T.Hamada,
S.Kubota, A.Nakamoto and E.Shibamura. Proportional Counter Filled With Highly
Purified Liquid Xenon, Nucl.Instr. and Meth., vol.134, pp.403-405, 1976.
[13] T.Doke. Fundamental Properties of Liquid Argon, Krypton and Xenon as Radiation
Detector Media, Portug. Phys., vol.12, pp.9-48, 1981.
[14] H.Zaklad, S.E.Derenzo, R.A.Muller and R.G.Smits. Initial Images From a 24-Wire
Liquid Xenon g-Camera, IEEE Trans. Nucl. Sci., vol.NS-20, pp.429-431, 1973
[15] B.A.Dolgoshein, V.N.Lebedenko and B.U.Rodionov. Luminescence Induced by
Alpha Particles in Liquid Xenon in an Electric Field, JETP Lett., vol.6, p.224, 1967.
[16] K.Masuda, S.Takasu, T.Doke, T.Takahashi, A.Nakamoto, S.Kubota and
E.Shibamura. A Liquid Xenon Proportional Scintillation Counter, Nucl.Instr. and
Meth., vol.160, pp.247-253, 1979.
[17] M.Miyajima, K.Masuda, Y.Hoshi, T.Doke, T.Takahashi, T.Hamada, S.Kubota,
A.Nakamoto and E.Shibamura. A Self-Triggered Liquid Xenon Drift Chamber by the

Use of Proportional Ionisation or Proportional Scintillation, Nucl.Instr. and Meth.,
vol.160, pp.239-246, 1979.
[18] T.Doke. Recent Developments of Liquid Xenon Detectors, Nucl.Instr. and Meth.,
vol.196, pp.87-96, 1982
[19] M.Miyajima, S.Sasaki and E.Shibamura. Absolute Number of Photons Produced by
Alpha-particles in Liquid and Gaseous Xenon, , Nucl. Instr. and Meth. in Phys. Res.,
vol.B63, pp.297-308, 1992.
[20] A.J.P.L.Policarpo. Ionization Scintillation Detectors, Nucl. Instr. and Meth.,
vol.196, pp.53-62, 1982.
[21] K.Masuda, T.Doke and T.Takahashi. A Liquid Xenon Position Sensitive Gamma-
Ray Detector for Positron Annihilation Experiments, Nucl.Instr. and Meth., vol.188,
pp.629-638, 1981.
[22] P.Benetti, E.Calligarich, R.Dolfini et al., Detection of Energy Deposition down to the
keV Region Using Liquid Xenon Scintillation, Nucl. Instr. and Meth. in Phys. Res.,
vol.A327, pp.203-206, 1993.
[23] A.J.P.L.Policarpo, V.Chepel, M.I.Lopes et al. Observation of Electron Multiplication
in Liquid Xenon with a Microstrip Plate, Nucl. Instr. and Meth. in Phys. Res.,
vol.A365, pp.568-571, 1995.
[24] J. van der Marel, A. van den Bogaard, C.W.E. van Eijk, R.W.Hollander and
P.M.Sarro. Two-Dimensional Microgap Gas Chambers on Silicon, Nucl. Instr. and
Meth. in Phys. Res., vol.A367, pp.181-184, 1995.
[25] M.Lombardi and F.S.Lombardi. The Leak Microstructure, Preliminary Results, Nucl.
Instr. and Meth. in Phys. Res., vol.A367, pp.23-27, 1995.
[26] M.Capeáns, W.Dominik, M.Hoch, L.Ropelewski, F.Sauli, L.Shekhtman,
A.Sharma. The Virtual Cathode Camber, Preprint CERN-PPE/97-61.