
Papers from U.S. Department of Energy Science ... - SLAC
401
SLAC-R-998 August 2012 Papers from U.S. Department of Energy Science Undergraduate Laboratory Internship Program (SULI 2011) SLAC National Accelerator Laboratory, Stanford University, Menlo Park, CA 94025 Work supported by Department of Energy contract DE-AC02-76SF00515.
-
Upload
khangminh22 -
Category
Documents
-
view
3 -
download
0
Transcript of Papers from U.S. Department of Energy Science ... - SLAC

SLAC-R-998 August 2012
Papers from U.S. Department of Energy
Science Undergraduate Laboratory Internship Program (SULI 2011)
SLAC National Accelerator Laboratory, Stanford University, Menlo Park, CA 94025
Work supported by Department of Energy contract DE-AC02-76SF00515.

Table of Contents
Author Project Title Page
Cole Adams INSPIRE and SPIRES Log File Analysis 3
Peter J. Bolgert A Comparison of Image Quality Evaluation Techniques for Transmission X-Ray Microscopy 16
Keaton J. Burns Investigating the Magnetorotational Instability with Dedalus, an Open-Source Hydrodynamics Code 37
Julie Cass Simulations and Analysis of an Infrared Prism Spectrometer for Ultra-short Bunch Length Diagnostics at the Linac Coherent Light Source 55
Gilles Dongmo-Momo Infrared Spectroscope for Electron Bunch-length Measurement: Heat Sensor parameters Analysis 73
Jennifer Felder Design & Fabrication of a High-Voltage Photovoltaic Cell 92
Ross Greenwood Dark Photon Search at BABAR 112
Allison Hume Using Dynamic Quantum Clustering to Analyze Hierarchically Heterogeneous Samples on the Nanoscale 129
Forrest Iandola Representing Range Compensators with Computational Geometry in TOPAS 145
Stephanie Mack Channeling through Bent Crystals 155
Daniel Marley Magnet Lattice Design for the Transmission of Power Using Particle Beams 174
Mitch Miller Bunch Profiling Using a Rotating Mask 193
Blythe Moreland Measuring Cluster Relaxedness 211
Ashley Parker An Improved Technique for Increasing the Accuracy of Photometrically Determined Redshifts for ‘Blended’ Galaxies 231
Chris Payne Characterizing the Nanoscale Layers of Tomorrow’s Electronics An Application of Fourier Analysis 248
Veronica Policht Research and Design of a Sample Heater for Beam Line 6-2c Transmission X-ray Microscope 269
W. Clarke Smith Extracting bb Higgs Decay Signals Using Multivariate Techniques 297
Katherine Spoth X-Ray Emission Spectrometer Design with Single-Shot Pump-Probe and Resonant Excitation Capabilities 318
Colleen Treado Space Charge Correction on Emittance Measurement of Low Energy Electron Beams 340
Jack Wang Longitudinal Bunch Pattern Measurements through Single Photon Counting at SPEAR3 366
Kiel Williams Optical Design of a Broadband Infrared Spectrometer for Bunch Length Measurement at the Linac Coherent Light Source 383

INSPIRE and SPIRES Log File Analysis
Cole AdamsScience Undergraduate Laboratory Internship Program
Wheaton College
SLAC National Accelerator Laboratory
August 5, 2011
Prepared in partial fulfillment of the requirement of the Office of Science, Department of Energy's Science Undergraduate Laboratory Internship under the direction of Travis Brooks in the Scientific Computing division at SLAC National Accelerator Laboratory
Participant Signature: ___________________________________
Research Adviser Signature:______________________________
Work supported by US Department of Energy contract DE-AC02-76SF00515.
SLAC-TN-12-017

ABSTRACT
SPIRES, an aging high-energy physics publication data base, is in the process of being replaced by INSPIRE. In order to ease the transition from SPIRES to INSPIRE it is important to understand user behavior and the drivers for adoption. The goal of this project was to address some questions in regards to the presumed two-thirds of the users still using SPIRES. These questions are answered through analysis of the log files from both websites. A series of scripts were developed to collect and interpret the data contained in the log files. The common search patterns and usage comparisons are made between INSPIRE and SPIRES, and a method for detecting user frustration is presented. The analysis reveals a more even split than originally thought as well as the expected trend of user transition to INSPIRE
INTRODUCTION
SPIRES is the high-energy physics publication database that has been used for
collaboration and communication between physicists since the late 1960s. However, forty years
is a long time in terms of technology, and SPIRES is in the process of being replaced by a new,
similar service called INSPIRE. INSPIRE builds off of the usefulness of SPIRES and hopes to
provide the high-energy physics community with better tools for successful research. INSPIRE
provides a much faster alternative to SPIRES with a greater depth of features. INSPIRE
functions as the quality SPIRES content built on the modern Invenio digital document repository
platform developed at CERN
While INSPIRE is an incredibly high-quality tool, it is not yet a finished product.
Currently INSPIRE is in a public beta phase and it will become a full production service in the
Fall of 2011. Any service can use improvement and the best way to ensure that this improvement
is most beneficial is to get feedback from the users themselves. Having a user base that provides
constant feedback about the website will give the developers a clear focus of what will help the
users most.
At the moment, the user base is split between SPIRES and INSPIRE, and originally it
was thought that roughly two-thirds of the users still were using SPIRES, based on a simple

metric of total searches. There were two questions to be answered about these two groups:
1. What are the distinctions between the two groups?
2. Is the two-thirds division the correct one?
In order to answer these questions we analyzed the log files for user behavior to find a better
usage metric and to describe the differences between user behavior in INSPIRE and SPIRES.
The methods used in this project revealed the presence of a large number of robots that
artificially increased the search counts on SPIRES, making the original usage metric a poor one.
Using a new metric based on user session results in a division of almost 50-50. The original
question about the distinction between these two groups is still important because the SPIRES
users will need to switch to INSPIRE soon. There is an effort to try and get the remaining
SPIRES to switch over to INSPIRE before SPIRES is shutdown so that these users can make the
change without feeling forced, a situation that can create unnecessary work and pain for both
users and developers alike.
METHODS
My part in the INSPIRE project is to build statistical tools that can assist developers in
deciding how to encourage SPIRES users to make the switch to INSPIRE now, as well as
determining functionality that INSPIRE lacks which can then be added. By looking at the usage
patterns of both SPIRES and INSPIRE the developers can see what features users most want to
retain from SPIRES and what features they use the most in INSPIRE. From that information the
developers can guide the SPIRES users to those features in INSPIRE. It is also important to find
what barriers prevent the switch to INSPIRE. There are a variety of possible reasons, such as a
lack of knowledge about INSPIRE or possible missing features in INSPIRE. We can learn what

the barriers might be through analysis of the usage patterns.
In order to learn about the usage patterns of SPIRES and INSPIRE, there are two ways to
learn about the users. One way is to have the users continually submit feedback. This system is
already in place and allows for the developers to communicate with their users. The second is to
look through the log files and examine the search queries and site hits that the users have
generated through using the website. This alternative method had only been implemented at a
basic level, and it was the aim of this project to improve the depth and functionality of this
technique.
Some of the data that exists in these log files that can be analyzed are session lengths,
common search terms, search results, and geographical or institutional location of users. This
information is useful to the developers in the transitional period between SPIRES and INSPIRE,
and will continue to be important as they try to keep improving user experience on the website. It
can directly help identify the barriers mentioned above; common search terms can show the
differences between search patterns in SPIRES and INSPIRE, location can tell us if some
regions are possibly unaware of the impending switch, and search results can let us know if
people are finding what they are looking for, and the session information can tell us if people are
either getting frustrated with INSPIRE or if they are pleased with the performance of the site.
The data extracted from the logs can also be used to build more complex data such as
reconstructing complete user sessions. The user session information can be used to track things
such as user frustration, when a user is struggling to use a part of the website effectively. The
administrative staff of INSPIRE could then see where this occurs and send a message to the user
to assist them. Analysis of the logfiles may reveal additional uses of the logfile data.
There is a large amount of data associated with the log files resulting from over 15,000

searches performed by users every day. Since the log files contain every HTTP request to the
website, there is a lot more data than just searches in the logs, and over time the data that needs
to be processed can become fairly large. It would be extremely inefficient to process the data
from scratch every time a different analysis needs to be done, so the data is cached at various
stages to improve performance. This caching allows months worth of data to be processed in
minutes.
The log file analysis was performed using Python, a free scripting language. The analysis
contained in this paper was all done with a set of log files from May 1, 2011 through July 31,
2011; however, the analysis tools were designed with the intention of long term usage that will
be able to repeat the analysis later. The most useful methods can potentially be added to some of
the existing basic log file statistics that are already in place. This will make the analysis
techniques more easily maintainable.
While analyzing some of the data early on it became apparent that there were a number of
IP addresses from China that had an enormous number of searches. Upon further investigation,
the searches they were performing appeared very scripted. These were considered to be robots
and were not considered in further analysis.
RESULTS
Search Keyword Occurrence
The search keyword occurrence was extracted by examining each search query for any
keywords or their aliases. For instance, 'au', and 'author' both map to the search keyword 'author'.
The top ten search keywords for both INSPIRE and SPIRES are shown below in Table 1.

INSPIRE (June 2011) SPIRES (June 2011)
Search Keyword Occurrences Search Keyword Occurrences
'author' 259243 'author' 278062
'field' 58225 'date' 251327
'title' 39090 'date-added' 237226
'date' 25316 'reportnumber' 89219
'reportnumber' 13824 'irn' 67713
'journal' 13512 'exactauthor' 65081
'exactauthor' 9801 'reference' 64565
'keyword' 4367 'title' 38420
'collaboration' 4300 'journal 25183
'reference' 4165 'keyword' 19672Table 1: SPIRES Search Keyword Occurrences in INSPIRE and SPIRES
User Sessions
The user session data contains the searches that a user performed during a visit to either
INSPIRE or SPIRES. The session data is constructed by looking at searches performed by a
given IP (which is assumed to identify a unique user) and uses the time in between successive
searches to decide whether or not the search reflects the start of a new session or a continuation
of the current session. Both the time of the search and the search query are recorded for each
search in a session. Figure 1 shows a histogram of the session searches for both INSPIRE and
SPIRES. The data from both follows the same shape when the data is scaled to match the second
points of both logs, with the exception of the first data point (which represents the single search
session counts). For this reason, the multi-search session counts were considered distinctly from
total session counts. A multi-search session represents a countable use of the website, so the
multi-search session counts is taken as a superior metric to the total search counts.

Figure 1. Histograms of the number of searches in a session.
Usage Statistics
Based on the session data shown in Figure 1, the two best measures of
usage for INSPIRE and SPIRES are the number of unique users and the number of

multiple search sessions. Figure 2 shows a plot of usage metrics over this time
span.
Figure 2. Plot of usage metrics (Multiple Session and Unique IP counts) over time
The usage can be broken down by country to show where the use of INSPIRE and
SPIRES is most prominent as well as to give a good idea about where INSPIRE has been
adopted in place of SPIRES. Figure 3 shows a bar plot of of the multiple search sessions in
INSPIRE and SPIRES as well as the users who used both INSPIRE and SPIRES, broken down
by their session count in each website. The segment labeled “Others” refers to any country that

made up less than 5% of the whole in all of the categories.
Figure 3. Bar plot of usage broken down into countries.
User Frustration Analysis
During a user's session it is possible that the user can experience a “frustration event”,
where the user cannot seem to find the correct way to execute a given search query. Both
SPIRES and INSPIRE use fielded metadata searches, which means that they have syntaxes that
allow the users to specify the type of information they are searching on. This is useful in physics
for searches such as “Higgs”, which is both an author and a frequent word in a title. When the

search syntax doesn't work as expected it can lead to user frustration. This shows up in the logs
as several consecutive searches by a user that are similar in structure and content. These
frustrated sessions are recorded and divided into two categories based on the severity of the
frustration events present in the session. Users in the extremely frustrated category have twice as
many repeated similar searches as those in the frustrated category. Table 2 shows the frustration
event counts for INSPIRE and SPIRES as well as the total number of sessions that are long
enough to potentially contain a frustration event. The frustration events are usually centered on a
search keyword, so the breakdown of the most common search keywords that appear in
frustration events is shown in Table 3.
INSPIRE SPIRES
Frustrated Sessions Total Sessions Frustrated Sessions Total Sessions
Frustrated 289 14613 197 13830
Extremely Frustrated
255 5967 220 5656
Table 2. “Frustration Event” counts for INSPIRE and SPIRES
INSPIRE SPIRES
'author' 37% 'reportnumber' 29%
'journal' 22% 'author' 26%
'field' 11% 'exactauthor' 15%
'title' 7% 'title' 9%
'reportnumber' 5% 'journal' 9%Table 3. Common search keywords in “frustration events”
DISCUSSION AND CONCLUSION
The search keyword data shown in Table 1 can give a good estimate as to what INSPIRE
is being used for. The high number of author searches demonstrates that the preferred search
method is to search by author. It also gives an idea of what search keywords are most used in

SPIRES which can help to direct focus towards ensuring that the search engine in INSPIRE
handles them properly. In this case, focus should be directed towards ensuring that the author
search works properly.
The session data is highly interesting as a usage metric, particularly when the large
variation in the SPIRES single search session is discounted(Figure 1). The two most general
explanations are external links and automated systems. In the case of external links, a user is
simply clicking a link that returns a SPIRES search page, and no actual search is performed user.
In the logs, this would show up as a session with one search, and is not particularly interesting to
look at. In the case of automated systems, there is perhaps some script that runs a search once
every hour to refresh a list of articles that fits some search query. Both of these would artificially
increase the number of single search sessions and would be sufficient reason to discount the
point. The reason the same variation is not present in INSPIRE is perhaps due to how new it is
relative to SPIRES. In future work it might be possible to identify robots and remove their
searches entirely and correct the anomalous single search session count.
The usage data gives some useful results in terms of comparisons between INSPIRE and
SPIRES. The usage time line in Figure 2 indicates that SPIRES usage is decreasing, while
INSPIRE usage is increasing only slightly. There could be other trends that would occur in a
system with constant usage that might mask an increasing trend in INSPIRE which would
correlate to the decreasing trend of SPIRES. A seasonal effect that takes place from May 1 to
July 31, such as summer vacations, could explain this.
The bar chart in Figure 3 helps break down the usage by the origin of the user. The plot
shows that the United States makes up the plurality of both INSPIRE and SPIRES usage, but
also that both services are clearly used internationally. The relative sizes of countries in

INSPIRE and SPIRES can identify where people have begun transitioning to INSPIRE from
SPIRES. For instance, most of the European countries have a higher usage fraction in INSPIRE,
which means means they have generally switched from SPIRES more than the United States,
which has more of a half and half distribution. China has a large SPIRES usage metric, which
could be due to the Chinese robots mentioned earlier that perhaps were not detected. In the
future more of these can be identified and possibly removed. The “Both” columns can give an
estimate of proportion is still in the transitional phase, as well as where the usage of those in this
transitional phase is concentrated. This does not tell us about the users in the transitional stage,
but it does ask questions about how the transitional process works. Do users gradually change,
preferring INSPIRE for some tasks and SPIRES for others? Do they have a comparison phase,
where they do similar searches on both to see the differences? These kind of questions could
potentially be answered by examining in detail the sessions of the users that fall into the “Both”
category.
The frustration event data in Table 2 indicates that INSPIRE has a higher occurrence of
frustration events than SPIRES. This is because INSPIRE, as a newer service, is still being
learned by its users. The data in Table 3 is more interesting, because it shows the kind of
problems that cause the frustration events. The high occurrence of frustration events caused by
author search keywords is due to misspellings in author names, something that is common in
both SPIRES and INSPIRE. It can also show situations where a particular author is expected to
appear in the search results but does not. The high occurrence of the journal search keyword in
INSPIRE as opposed to SPIRES is due to a flaw in the code of search engine parsing that was
present over the time period the data was taken from. This shows the usefulness of the
frustration detection analysis in highlighting important issues for the developers. The frustration

detection has already identified an important feature that is broken in INSPIRE, and will
continue to prove a valuable tool. In the near future, the algorithm for frustration detection will
be made a part of the INSPIRE web statistics module to continually watch for frustration events.
ACKNOWLEDGEMENTS
This work was supported by the Science Undergraduate Laboratory Internship program
at SLAC National Accelerator Laboratory and the Department of Energy. I would like to thank
my mentor, Travis Brooks, for his leadership in this project. I would also like to thank Joseph
Blaylock, Valkyrie Savage, and Mike Sullivan for their assistance.

A Comparison of Image Quality Evaluation Techniques for
Transmission X-Ray Microscopy
Peter J. Bolgert
Office of Science, Science Undergraduate Laboratory Internship Program
Marquette University
SLAC National Accelerator Laboratory
Menlo Park, California
August 17, 2011
Prepared in partial fulfillment of the requirement of the Office of Science, Department of
Energy’s Science Undergraduate Laboratory Internship under the direction of Yijin Liu at
Stanford Synchrotron Radiation Lightsource, SLAC National Accelerator Laboratory.
Participant: __________________________________
Signature
Research Advisor: __________________________________
Signature
Work supported by US Department of Energy contract DE-AC02-76SF00515.
SLAC-TN-12-018

1
TABLE OF CONTENTS
Page
Abstract . . . . . . . . . . . . . . . . . . . . . . . . . . . . . . . . . . . . . . . . . . . . . . . . . . . . . . . . . . . . . . . . . . . 2
Introduction . . . . . . . . . . . . . . . . . . . . . . . . . . . . . . . . . . . . . . . . . . . . . . . . . . . . . . . . . . . . . . . . 3
Materials and Methods . . . . . . . . . . . . . . . . . . . . . . . . . . . . . . . . . . . . . . . . . . . . . . . . . . . . . . . 6
Results . . . . . . . . . . . . . . . . . . . . . . . . . . . . . . . . . . . . . . . . . . . . . . . . . . . . . . . . . . . . . . . . . . . . 10
Discussion . . . . . . . . . . . . . . . . . . . . . . . . . . . . . . . . . . . . . . . . . . . . . . . . . . . . . . . . . . . . . . . . . 11
Acknowledgments . . . . . . . . . . . . . . . . . . . . . . . . . . . . . . . . . . . . . . . . . . . . . . . . . . . . . . . . . . . 13
References . . . . . . . . . . . . . . . . . . . . . . . . . . . . . . . . . . . . . . . . . . . . . . . . . . . . . . . . . . . . . . . . . 13
Figures . . . . . . . . . . . . . . . . . . . . . . . . . . . . . . . . . . . . . . . . . . . . . . . . . . . . . . . . . . . . . . . . . . . . 14

2
ABSTRACT
A Comparison of Image Quality Evaluation Techniques for Transmission X-Ray Microscopy.
PETER J. BOLGERT (Marquette University, Milwaukee, WI, 53233), YIJIN LIU (Stanford
Synchrotron Radiation Lightsource, SLAC National Accelerator Laboratory, Menlo Park, CA
94025).
Beamline 6-2c at Stanford Synchrotron Radiation Lightsource (SSRL) is capable of
Transmission X-ray Microscopy (TXM) at 30 nm resolution. Raw images from the microscope
must undergo extensive image processing before publication. Since typical data sets normally
contain thousands of images, it is necessary to automate the image processing workflow as much
as possible, particularly for the aligning and averaging of similar images. Currently we align
images using the “phase correlation” algorithm, which calculates the relative offset of two
images by multiplying them in the frequency domain. For images containing high frequency
noise, this algorithm will align noise with noise, resulting in a blurry average. To remedy this we
multiply the images by a Gaussian function in the frequency domain, so that the algorithm
ignores the high frequency noise while properly aligning the features of interest (FOI). The
shape of the Gaussian is manually tuned by the user until the resulting average image is sharpest.
To automatically optimize this process, it is necessary for the computer to evaluate the quality of
the average image by quantifying its sharpness. In our research we explored two image
sharpness metrics, the variance method and the frequency threshold method. The variance
method uses the variance of the image as an indicator of sharpness while the frequency threshold
method sums up the power in a specific frequency band. These metrics were tested on a variety
of test images, containing both real and artificial noise. To apply these sharpness metrics, we
designed and built a MATLAB graphical user interface (GUI) called “Blur Master.” We found
that it is possible for blurry images to have a large variance if they contain high amounts of
noise. On the other hand, we found the frequency method to be quite reliable, although it is
necessary to manually choose suitable limits for the frequency band. Further research must be
performed to design an algorithm which automatically selects these parameters.

3
INTRODUCTION
Beamline 6-2c at the Stanford Synchrotron Radiation Lightsource (SSRL) is capable of
Transmission X-ray Microscopy (TXM) at 30 nm spatial resolution [1]. A transmission X-ray
microscope is conceptually identical to a familiar optical microscope, consisting of a light
source, a condenser to focus light on the sample, a sample stage, and an objective to focus the
transmitted light onto a digital sensor (Figure 1). In this context though, the word “light” refers
to synchrotron X-ray radiation, ranging from about 5 to 14 keV per photon. Since X-ray
wavelengths are shorter than those of visible light, the X-ray microscope is capable of much
higher resolution.
Users from around the world have come to Beamline 6-2c to image a variety of
biological and inorganic samples. While it depends on the specific TXM technique being used,
the user will typically take thousands of images of a single sample. For example, the user might
take images at 180 different angles, taking 20 identical pictures per angle, resulting in 3600
images. If the sample is larger than the field of view (FOV) of the microscope, it becomes
necessary to construct a mosaic of sub-images at each angle. If it takes five exposures to cover
the sample, the total increases to images. Additionally, the user will
periodically move the sample off to the side and take some reference images (perhaps several
hundred). All of these images must be extensively processed before presentation-quality images
and 3D models can be obtained. While the details of the image processing depend on the
specific TXM technique used, a typical processing workflow is shown in Figure 2.
With such massive amounts of data, it is necessary to automate the image processing
workflow as much as possible, especially for the alignment of similar images with each other.
Image alignment is a recurring part of our workflow, as it appears in steps two (Aligning and

4
Averaging of Multiple Images), three (Mosaic Stitching), and five (Tomographic
Reconstruction). As mentioned, the user will typically take 20 to 30 repeated images of the
sample at each angle. In between every exposure, the sample stage will jitter slightly, causing
these repeated exposures to be identical except for a small translation. Step two of our workflow
consists of aligning these repeated images and then taking the average, which increases the
signal-to-noise ratio (SNR), a step known as the “advanced average.” Not only is it tedious to
align images by eye, but a computer should be able to align images much more accurately than a
human can. By automating tasks like this, users can focus more on their experiment and less on
repetitive image processing.
One commonly used algorithm for aligning two images is known as phase correlation,
which manipulates the two images in the frequency domain. First, we calculate the phase
correlation function (PC) for images a and b, given by
(1)
where is the Fourier transform of image a and the overbar denotes complex conjugation
[2]. For two images which are identical except for a pure translational shift, the phase
correlation function will be given by
(2)
where u is a vector whose components are the horizontal and vertical shifts (in pixels) from
image a to b, and f is the position vector in the PC matrix. Figure 3 shows the real part of the PC
function for two images with . This cosine wave
points in the direction of u and the spacing is inversely proportional to the magnitude of u.
Since the Fourier transform of a complex exponential is a Dirac delta function [3], we find that
contains a single spike whose coordinates correspond to the offset, u. In other words,

5
(3)
By calculating the offset between the first image and every other image in the stack, we can
accurately align all the images to the first image, resulting in a sharp average.
For images containing noise, the situation described above is not completely accurate.
In particular, for two images containing high frequency noise, sometimes the algorithm will
attempt to align noise with noise, yielding an unsatisfactory result. For example, consider a stack
of 30 images of the same sample, which differ by a small translation. However, each image
contains a sharp scratch in the exact same location (see Figure 4 for an example). In the case of
this data set (which we call the “scratched data set”), there was a scratch on the digital sensor of
the microscope. In the FFT, the scratch corresponds to high frequency power, and the phase
correlation will align the scratches together, resulting in an offset of u = (0, 0). Since the
alignment failed, the resulting average will be blurry (Fig. 4), tainting the rest of the workflow.
To remedy this problem, it is helpful to slightly blur the images during the phase
correlation process. We start by multiplying the PC function by a two-dimensional Gaussian
function of the form
(4)
where g is a blurring parameter. The greater g is, the narrower the Gaussian peak. Multiplying
PC by a Gaussian masks the outer region of the PC function, which corresponds to high
frequency noise in the original images. Once the parameter g passes a critical value, the
maximum of shifts to the desired offset. Figure 5 shows the evolution of the PC
function for two scratched images as g is increased. As g increases, the center spot begins to
look more and more like the ideal sinusoid of Figure 3. Figure 5 also shows the evolution of
with increasing g. You can see that there are two blobs competing for attention. The

6
off-center blob corresponds to the features of interest (FOI). As g increases, both blobs fade, but
the off-center blob fades more slowly. By g = 8, the maximum of occurs in the off-
center blob, resulting in a correct alignment. Finally, Figure 5 also shows the evolution of the
resulting averages when phase correlation is performed for the entire stack of the twenty
“scratched” images. As you can see, when g crosses a critical value, the resulting average is as
sharp as any of the starting images, but with much less noise (high SNR).
The process of blurring during phase correlation works well, but it requires manual user
input for choosing g, slowing down the workflow. In order to make this process fully automatic
we need an algorithm to evaluate image quality, particularly sharpness. If the averaged image is
not sharp enough, the algorithm should adjust the blurring so that the alignment is optimized.
All of this should occur without any input from the user. There are many examples of sharpness
algorithms in the literature, many of which are surveyed in Ferzli and Karam [4]. In this paper,
we will explore a variance-based algorithm and an FFT-based algorithm in an attempt to further
automate our image processing workflow.
MATERIALS AND METHODS
All of the work for this project was performed using MATLAB R2010b, equipped with
the Image Processing Toolbox. Every step in the TXM image processing workflow (Fig. 2) can
be performed with TXM Wizard, a suite of Matlab software developed by Yijin Liu, Florian
Meirer, and Phillip Williams. TXM Wizard can be downloaded for free at
http://sourceforge.net/projects/txm-wizard. The program used to align and average images (step
two in Fig. 2) is known as Advanced Average.

7
In order to test different sharpness algorithms, I used two test data sets. The first data set
is the “scratched data set” described above. It consists of thirty 1024 x 1024 pixel TIFF images
taken of an industrial catalyst. The second data set, consisting of fifty 1024 x 1024 pixel TIFF
images, is known as the “root data set” since the images are of tiny plant roots (Figure 6). This
data set has been doctored to contain both high and low frequency noise. The high frequency
noise consists of small artificial scratches, which have the same position for each image. The
low frequency noise consists of broad bright and dark patches which shift randomly from image
to image. Figure 6 also shows the evolution of alignment for this data set. In the computer,
these images are stored as 1024 x 1024 matrices with integer values ranging from 0 (black) to
255 (white).
Next I will describe the two sharpness algorithms which were used. The first is called the
variance method. The variance of a data set (such as matrix of integers) is the square of the
standard deviation and is equal to
(5)
where xi represents a data point and is the mean of the data set. Now, it seems intuitively
obvious that a sharp “advanced average” should have a larger variance than a misaligned, blurry
“advanced average.” In a sharp image, there will be very light pixels and very dark pixels, both
deviating far from the mean. In a blurry image, the features are averaged out. The light pixels
are not as light, and the dark are not as dark, resulting in a lower variance. This is demonstrated
in Figure 7 for a random 20x20 matrix.
The second sharpness algorithm used is related to the Fast Fourier Transform (FFT) and
is called the frequency threshold method. A 2D FFT is a pictorial depiction of the frequency
distribution in a signal (Figure 8). Low frequencies appear in the center, and high frequencies

8
away from the center. In the case of a digital image, we are concerned with the spatial
frequency, that is, how quickly pixels values change as we move across the image. The highest
frequency occurs when a black pixel (value 0) is adjacent to a white pixel (value 255), and this
would show up at the fringes of the FFT. A quality image will contain sharp edges, with pixel
values changing quickly from light to dark. This corresponds to high frequency power in the
FFT. Thus we expect sharp images to contain more high frequency power than a blurry image.
To quantify the sharpness, we choose a suitable radius and then sum up all the absolute
values of the FFT matrix which lie outside this value (technically, the term “power” refers to the
absolute square of the FFT values, but we will use “power” to refer to the absolute value in this
paper). However, we do not want to sum all the way to the outer boundary. While the features
of interest in an image are sharp, it will generally take at least a few pixels to transition from
light to dark. Any FFT power more than a certain distance from the origin corresponds to
undesirable high frequency noise. Thus to quantify the sharpness of an image, it suffices to sum
up the FFT power in between suitably sized concentric circles (Figure 8). The radii of the
threshold circles (Rin and Rout) must be experimentally determined.
One way to determine suitable values of Rin and Rout is to simply compare FFT’s of blurry
and sharp images. Figure 8 shows FFT’s of two “advanced averages” for the root set. In the
blurry average (g = 0), you can see that while most power is concentrated in the center, there is
power scattered all the way out to the edges, corresponding to the scratches. The sharp average
(g = 5) has more power in the mid-range region of the FFT. Choosing Rin= w/32 and Rout=w/16
would be an appropriate choice for this data set, where w is the width of the cropped “advanced
average.”

9
Another way to choose Rin and Rout is to plot the power in the FFT’s as a function of the
distance from the center. Figure 9 shows such a plot for the root data “advanced averages” in
Figure 8. For each pixel in the image, its distance from the origin was calculated and rounded to
the nearest integer (say r = r0). By adding together all elements at this rounded distance, we
obtain . From Fig. 9 we can see that most of the power corresponding to the features
of interest lies between Rin= w/30 and Rout = w/10, generally consistent with the values
mentioned previously. In reality, choosing radii is somewhat arbitrary and it pays to look at the
problem in more than one way.
In order to carry out my research I designed and built a Matlab graphical user interface
(GUI) called Blur Master. A screenshot is shown in Figure 10. Blur Master is used to create
“advanced averages” for a customizable range of g (blurring) values. After writing all the
“advanced averages” to file, Blur Master automatically quantifies the sharpness of the averages
using both the variance and frequency threshold methods. All images are cropped by 20% on
each side before evaluating the sharpness. I also designed a sub-GUI, called Power Plotter to
plot FFT power as a function of the distance from the center, which can be used to choose
appropriate values for Rin and Rout. A screenshot of Power Plotter is shown in Figure 11.

10
RESULTS OF SHARPNESS TESTING
Table 1: Scratched Data Set
(Rin= w/32 and Rout = w/16 for freq. method)
g (blurring) variance
method
frequency
method
0 270.7 1.012
1 270.7 1.015
2 270.9 1.019
3 270.9 1.021
4 261.0 1.028
5 263.3 1.190
6 282.0 1.580
7 286.5 1.667
8 313.9 1.987
9 313.9 1.987
10 313.9 1.985
11 314.0 1.984
12 314.0 1.989
13 314.0 1.989
14 314.0 1.988
15 314.0 1.988
16 314.0 1.988
17 314.1 1.990
18 314.1 1.991
19 314.1 1.990
20 314.1 1.990
30 314.1 1.991
40 314.1 1.990
50 314.0 1.986
60 314.0 1.985
70 313.9 1.983
80 313.8 1.977
90 313.8 1.975
99 313.7 1.966
Table 2: Root Data Set
(Rin= w/32 and Rout = w/16 for freq. method)
g (blurring) variance
method
frequency
method
0 118.2 2.867
1 118.2 2.867
2 118.2 2.867
3 118.2 2.867
4 104.5 6.736
5 104.8 6.752
6 104.9 6.755
7 105.0 6.760
8 105.1 6.760
9 105.2 6.763
10 105.3 6.766
11 105.3 6.766
12 105.3 6.766
13 105.3 6.766
14 105.3 6.766
15 105.3 6.766
16 105.3 6.766
17 105.3 6.766
18 105.3 6.766
19 105.3 6.766
20 105.3 6.766
30 105.1 6.764
40 104.0 6.737
50 102.1 6.687
60 99.2 6.596
70 96.6 6.482
80 91.7 6.226
90 87.0 5.896
99 83.2 5.552

11
DISCUSSION
The tables above show the sharpness results for both the scratched and root data sets. For
each value of g, we created an “advanced average” and quantified its sharpness. For the
scratched data set, we see that both the variance and frequency threshold values start low,
increase dramatically from g = 5 to 8, and then level off. These results are consistent with our
visual sense of sharpness. The “advanced averages” start out blurry, start aligning between g = 5
to 8, and then look the same from that point on.
For the root data set, the results are mixed. While the frequency threshold algorithm
performed well, the variance algorithm finds the misaligned averages to be the “sharpest”! In
this case the variance contributed by the noise was greater than the variance contributed by the
sharp features of interest. The variance method is not expected to perform consistently from one
data set to another because it treats sharp features and high frequency noise on equal footing.
Note that the same frequency parameters were the same for both data sets (Rin= w/32 and Rout =
w/16). These values were found experimentally through trial and error. We conclude that these
parameters should work for “typical” TXM images, although certainly more tests are needed.
Now that we have gained some insight into image quality evaluation, there are several
directions for continued research. The literature is rich with various sharpness algorithms,
including several which claim to be immune to noise [4], [5]. There also exist “no-reference”
sharpness metrics which can align images without any prior knowledge of the images (i.e. it is
not necessary to manually adjust parameters) [4], [5]. By implementing more sophisticated and
robust algorithms, we can improve the ease and reliability of our GUI’s.
In addition to adding more sophisticated algorithms, we would like to completely
automate the advanced average process. In the ideal scenario, when images are loaded into the

12
Advanced Average GUI, the computer would automatically find the ideal g value, and then
return only the sharp average. One way to achieve this would be to 1) calculate the “advanced
average” at a default g (say g = 8), 2) evaluate the sharpness, 3) calculate the “advanced
average” at adjacent g’s (g = 8 and g = 9), 4) evaluate these sharpnesses, and 5) continue
outward until reaching a local maximum or a plateau. A plateau is reached when adjacent
sharpnesses differ less than a specified amount (say 0.1%).
The main problem with this scheme is that is it is difficult to choose Rin and Rout ahead of
time. Values that work for one data set may not work for another data set. It seems foolish to
rely on “typical values” such as Rin = w/32 and Rout = w/16. We would like to choose these
parameters automatically for each data set. We can potentially solve this problem by looking at
the FFT vs. radius plot for one of the original images (see Figure 12). Since the features of
interest are obviously sharp in the original image, this plot should display a local maximum at
these frequencies. By evaluating the properties of this maxima (e.g. the full-width-at-half-max),
suitable values of Rin and Rout could be chosen automatically.
While the “advanced average” blurring process is not yet automatic, the Blur Master GUI
could still be useful for users in its current form. For example, if the user has multiple sets of
similar data (e.g. 20 images for one angle, then 20 images for the next angle, etc.), he/she could
run Blur Master on the first 20 images to find the best g value, and then apply the same blurring
factor to all subsequent data sets.
In conclusion, two sharpness algorithms were used to evaluate the quality of alignment in
TXM images. The frequency threshold method was found to be more reliable; however, it
requires manual input from the user. Further research must be performed in order to

13
automatically select these frequency parameters. In addition, “noise immune” metrics and “no-
reference” metrics should be investigated.
ACKNOWLEDGMENTS
This work was supported by SLAC National Accelerator Center, the U.S. Department of
Energy, and the Office of Science. I would like to give special thanks to Yijin Liu, who guided
me, and to Allison Hume, who provided a stimulating working environment. Finally, I would
like to thank anybody who took the time to read this research paper.
REFERENCES
[1] J.C. Andrews et al., “Nanoscale X-Ray Microscopic Imaging of Mammalian Mineralized
Tissue,” Microscopy and Microanalysis, vol. 16, pp. 327 – 336, 2010.
[2] R. Szeliski, “Image Alignment and Stitching: A Tutorial,” Foundations and Trends in
Computer Graphics and Vision, vol. 2, pp. 1 – 104, 2006.
[3] R.N. Bracewell, The Fourier Transform and its Applications, 3rd
ed., New York: McGraw-
Hill, 1999.
[4] R. Ferzli and L.J. Karam, “No-Reference Objective Wavelet Based Noise Immune Image
Sharpness Metric,” IEEE International Conference on Image Processing, vol. 1, pp. 405 – 408,
2005.
[5] X. Zhu and P. Milanfar, “A No-Reference Sharpness Metric Sensitive to Blur and Noise,”
International Workshop on Quality of Multimedia Experience, pp. 64 – 69, 2009.

14
FIGURES
Figure 1: Schematic of the Transmission X-Ray Microscope at SSRL Beamline 6-2c. Synchrotron radiation, which contains a wide range of frequencies, is passed through the monochromator to select a single frequency. The condenser (C) focuses the X-rays on the sample, and the micro-zone plate (MZP) focuses the transmitted X-rays onto the Charge Coupled Device (CCD). The microscope also contains various slits and mirrors (M0, M1) to collimate and direct the beam.
Figure 2: Image Processing Work Flow. Starting with raw images, the first step is to subtract references images, which are images taken with the sample moved outside the Field of View. Subtracting the references should eliminate the background and other types of noise (due to the digital sensor for instance). In step two, we align nearly identical images (see text for explanation) and then averaging them. Automating this process is the subject of the present paper. In step three, we stitch images together to create a larger mosaic. This is necessary when the sample is larger than the Field of View of the microscope. Step four, magnification correction, is needed when we image the sample at multiple X-ray energies. Magnification is a function of energy, and so we need to scale all images to a common size. Step five is used for tomographic techniques, in which we take images at multiple angles. The reconstruction algorithm converts these angled views to a series of cross-sectional slices, much like an MRI. Finally, further analysis may be necessary for more advanced techniques. In order to completely automate this workflow we need automatic image quality control, as discussed in the text.

15
Figure 3: The real part of the phase correlation function for two images differing by a pure translational offset. The offset u is given by u = (10 pixels to the right, 10 pixels down). In the ideal situation, the real part of this function is a cosine pointing in the direction of the offset. The spacing, or wavelength, is inversely proportional to |u|.
Figure 4: (LEFT) Two of the 30 images in the scratched data set. Both images have a faint scratch in the same location, while the catalyst is offset to the right in the second picture. Since the scratch is quite faint, its position is indicated by the dotted white line. (RIGHT) The “advanced average” of the entire image stack using phase correlation. The scratches all align, resulting in a sharp scratch and a blurry catalyst.

16
Figure 5: (LEFT) The evolution of the PC function (real part) between two scratched images as g increases. As g increases, the
PC function begins to look like a cosine, reminiscent of Figure3. (MIDDLE) The evolution of the corresponding functions. By g = 8, the maximum is located in the off-center blob. (RIGHT) The evolution of the “advanced average” of the entire image stack with increasing g.

17
Figure 6: (TOP) One image from the root data set, with a blown up inset to show the high frequency artificial scratches. (BOTTOM) The evolution of alignment with increasing g for the root data set. For g = 0, the artificial scratches are aligned, resulting in blurry features. By g = 5, the features of interest are aligning properly. By g = 99, the “advanced average” is starting to get slightly blurred, which can be seen in the inset.

18
Figure 7: (LEFT) A random 20x20 matrix to represent a “sharp” image; (RIGHT) The same matrix after a 3x3 pixel averaging filter has been applied. This matrix represents a blurred image, and its variance has decreased.
Figure 8: A comparison of the FFT’s of a blurry “advanced average” (g = 0) and a sharp average (g = 5). Most of the frequency power corresponding to the features of interest lies between r=w/32 and r=w/16, where w is the width of the cropped “advanced average.”

19
Figure 9: Plots of abs(FFT) vs. distance radius for “advanced averages,” a blurry average (g = 0) and a sharp average (g = 5). These plots are for the root data set. In the sharp image (g = 5), there is a peak between r=w/30 and r=w/10, where w is the width of the cropped “advanced average.” This peak corresponds to the sharp features of interest in the sharp average. The power drops off after about 300 pixels because we are starting to sum up the power in the corners of the FFT’s, where the area is less.
Figure 10: Screen shot of Blur Master. This GUI is used to produce “advanced averages” for a range of g (blurring) values, and also to quantify their sharpness using the two algorithms described in the text.

20
Figure 11: Screenshot of Power Plotter. This sub-GUI allows the user to simultaneously see each “advanced average” alongside a plot showing its FFT power vs. the distance from the FFT center, similar to Figure 9. This sub-GUI could be used to pick appropriate frequency bands to quantify the sharpness of subsequent data sets.
Figure 12: Plot of abs(FFT) vs. radius for a single root image. While this image contains high frequency noise, you can see that there is a small local max between r=w/25 and r=w/9, where w is the width of the cropped image. This local maximum corresponds to the sharp features of interest in the original image. We expect any sufficiently sharp “advanced average” to show a similar hump.

Investigating the Magnetorotational Instability with Dedalus, an
Open-Source Hydrodynamics Code
Keaton J. Burns
Office of Science, Science Undergraduate Laboratory Internship (SULI)
University of California Berkeley
SLAC National Accelerator Laboratory
Menlo Park, CA 94025
August 17, 2011
Prepared in partial fulfillment of the requirements of the Office of Science, Department of
Energy’s Science Undergraduate Laboratory Internship under the direction of Jeffrey S. Oishi
with the Kavli Institute for Particle Astrophysics and Cosmology.
Participant:
Signature
Research Advisor:
Signature
SLAC-TN-12-019
Work supported by US Department of Energy contract DE-AC02-76SF00515.

TABLE OF CONTENTS
Abstract ii
Introduction 1
Methodology: Dedalus Development 1
MHD Equations . . . . . . . . . . . . . . . . . . . . . . . . . . . . . . . . . . . . . 2
Spectral Implementation . . . . . . . . . . . . . . . . . . . . . . . . . . . . . . . . 3
Temporal Integration . . . . . . . . . . . . . . . . . . . . . . . . . . . . . . . . . . 4
Shearing Box . . . . . . . . . . . . . . . . . . . . . . . . . . . . . . . . . . . . . . 5
FFTs and Parallelization . . . . . . . . . . . . . . . . . . . . . . . . . . . . . . . . 7
Results 8
Code Verification and Testing . . . . . . . . . . . . . . . . . . . . . . . . . . . . . 8
Science Results . . . . . . . . . . . . . . . . . . . . . . . . . . . . . . . . . . . . . 9
Discussion and Conclusions 9
Acknowledgments 10
References 10
i

ABSTRACT
Investigating the Magnetorotational Instability with Dedalus, an Open-Source Hydrody-
namics Code. KEATON J. BURNS (University of California Berkeley, Berkeley, CA 94720)
JEFFREY S. OISHI (Kavli Institute for Particle Astrophysics and Cosmology, Menlo Park,
CA 94025)
The magnetorotational instability is a fluid instability that causes the onset of turbulence
in discs with poloidal magnetic fields. It is believed to be an important mechanism in the
physics of accretion discs, namely in its ability to transport angular momentum outward. A
similar instability arising in systems with a helical magnetic field may be easier to produce
in laboratory experiments using liquid sodium, but the applicability of this phenomenon
to astrophysical discs is unclear. To explore and compare the properties of these standard
and helical magnetorotational instabilities (MRI and HRMI, respectively), magnetohydrody-
namic (MHD) capabilities were added to Dedalus, an open-source hydrodynamics simulator.
Dedalus is a Python-based pseudospectral code that uses external libraries and paralleliza-
tion with the goal of achieving speeds competitive with codes implemented in lower-level
languages. This paper will outline the MHD equations as implemented in Dedalus, the steps
taken to improve the performance of the code, and the status of MRI investigations using
Dedalus.
ii

INTRODUCTION
Astrophysical accretion discs are discs of material orbiting around a star or black hole.
For decades, an outstanding theoretical problem in the physics of accretion discs was the
identification of an efficient mechanism for transporting angular momentum outward, since
viscous transport was unable to account for the observed rates of infalling material [1]. In
1991, Balbus and Hawley discovered a linear instability that occurs in discs with a poloidal
magnetic field [2]. This magnetorotational instability (MRI) is generally accepted as the
mechanism responsible for angular momentum transport and turbulence in accretion discs.
Laboratory experiments seeking to produce and study the MRI face a key difficulty: the
toroidal field perturbations required by the MRI must be produced by induction if an entirely
poloidal external magnetic field is applied. However, liquid metal flows with sufficiently high
magnetic Reynolds numbers (Rm) to produce these induction effects tend to have extremely
high hydrodynamic Reynolds numbers (Re) (RmRe≈ 10−5 for these materials), and hence
tend to be turbulent even without contributions from the MRI [3]. One solution to this issue
is to apply a helical magnetic field in the laboratory, exciting a helical magnetorotational
instability (HMRI). Simulations of the MRI and HMRI into their non-linear phases may
provide information pertaining to the applicability of experimental HRMI results to the
processes occurring in astrophysical discs.
METHODOLOGY: DEDALUS DEVELOPMENT
Dedalus is an open-source hydrodynamics code, written in Python 2.7. It is a pseudospectral
code, meaning it uses fast Fourier transforms (FFTs) to compute spatial derivatives. It
was designed to be flexible and easy to use, with the FFTs handled by external libraries
and/or parallelization to abate the performance penalties of using a high-level language.
The code makes extensive use of object-oriented programming, facilitating the modular
1

implementation of different domain representations and physics. Dedalus is currently hosted
on a public Bitbucket repository1.
MHD Equations
Incompressible MHD is primarily governed by four equations2 3: the Navier-Stokes equation
with the Lorentz force and viscosity, the induction equation with magnetic diffusivity, the
mass continuity equation, and Gauss’s law for magnetism:
∂tu + u · ∇u = −∇pρ0
+FL
ρ0
+ ν∇2u, (1)
∂tB = ∇× (u×B) + η∇2B, (2)
∂tρ+∇ · (ρu) = 0incomp.−−−−→ ∇ · u = 0, (3)
∇ ·B = 0. (4)
Expanding the Lorentz force as
FL =(∇×B)×B
4π=
B · ∇B
4π− ∇B
2
8π, (5)
Eq. (1) becomes
∂tu + u · ∇u = −∇Ptotρ0
+B · ∇B
4πρ0
+ ν∇2u, (6)
Ptot = p+B2
8π. (7)
1http://bitbucket.org/jsoishi/dedalus2All presented here in Gaussian units, and with ∂t indicating ∂
∂t .3With u the velocity field, B the magnetic field, p the pressure, ρ the density, ν the kinematic viscosity,
and η the magnetic diffusivity.
2

Using the identity ∇× (A×B) = A(∇ ·B)−B(∇ ·A) + (B · ∇)A− (A · ∇)B along with
the constraining equations (Eqs. (3) and (4)), Eq. (2) becomes
∂tB = B · ∇u− u · ∇B + η∇2B. (8)
Spectral Implementation
In a periodic domain, any sufficiently smooth field variable can be represented by its discrete
Fourier decomposition on the grid. That is, for some function f ,
f(x, t) =1√N
∑k
f(k, t)eixiki , (9)
f(k, t) =1√N
∑x
f(x, t)e−ixiki . (10)
Pseudospectral codes, such as Dedalus, use FFTs to evolve partial differential equations in
Fourier space, where they become systems of ordinary differential equations. This is because
the spatial derivatives in the governing equations become inexpensive multiplications under
the Fourier transform: ∇ FT−→ ik. The spectral implementation follows Maron and Goldreich
[4].
Taking the Fourier transforms of Eqs. (6), (8), (3), and (4) yields
∂tu = −u · ∇u− ikPtotρ0
+B · ∇B
4πρ0
− νk2u, (11)
∂tB = B · ∇u− u · ∇B− ηk2B, (12)
ik · u = 0, (13)
ik · B = 0, (14)
3

the Fourier space evolution and constraining equation pairs, respectively. Taking the scalar
product of ik with Eq. (11) leads to an expression for the total pressure:
Ptotρ0
=ik · u · ∇u
k2− ik · B · ∇B
4πρ0k2. (15)
The nonlinear terms (u · ∇u, u · ∇B, B · ∇u, and B · ∇B) in Eqs. (11), (12), and (15)
are computed in real space. To eliminate aliasing effects, the 2/3 rule is utilized, zeroing any
mode with a k component greater than or equal to 2/3 of the Nyquist wavenumber in that
direction. This zeroing is done prior to every reverse Fourier transform, after every forward
Fourier transform, and at each temporal evolution.
Temporal Integration
The Fourier space ODEs, along with the initial conditions specified at the start of the simu-
lation, form an initial value problem that is integrated using explicit Runge-Kutta methods,
specifically the second-order midpoint method. For simulations with viscosity and/or mag-
netic diffusivity, an integrating factor is used to evaluate the normally linear steps used
to construct the Runge-Kutta stages. Consider Eq. (11) for a specified mode k, with the
non-viscous terms considered to be constant during an integration step:
∂tu(t) + νk2u(t) = RHS. (16)
This is an equation of the form y′(x) + P (x)y = Q(x), which has the exact solution
y(x) =
∫Q(x)M(x)dx
M(x), (17)
4

where M(x) = e∫P (x)dx is called the integrating factor. Hence the solution of Eq. (16) at
time t+ dt is found to be
u(t+ dt) =[u(t) +
RHS
νk2(eνk
2dt − 1)]e−νk
2dt. (18)
Shearing Box
To study the effects of the MRI, local simulations are performed in which the computational
domain represents a small part of an astrophysical disc. The domain is taken to be a co-
rotating box, whose left edge is a distance r0 from the axis of rotation, and whose length
in each dimension is much less than this fiducial radius. In the co-rotating frame, the unit
vector ex is in the outward radial direction, and the unit vector ez is along the axis of
rotation. The box is rotating with an angular velocity Ω0 = Ω0ez = Ω(r0)ez.
The radial dependence of angular velocity in a Keplerian disc, Ω(r) =√GMr−3/2, gives
rise to a linear shear flow in this domain: with the domain moving at the angular velocity
of the left (inner) edge, the fluid in the box will shear in the x direction with a velocity of
−32Ω0xey, as shown in Fig. 1. This shear motivates the construction of a domain representa-
tion and a corresponding physics implementation to handle MHD in a box with an arbitrary
local linear shear.
Consider an arbitrary power-law shearing profile, Ω(r) = CrS (which arises from an at-
tractive force of magnitude ρ0C2r2S+1 and gives rise to a linear background shear in the
local frame with velocity SΩ0xey. Hence C =√GM and S = −3/2 for Keplerian rota-
tion). In this case, the centrifugal (−Ω0× (Ω0× r) = Ω02rex) and attractive (−C2r2S+1ex)
accelerations partially cancel (via approximations utilizing x, y, z r0):
arad = (Ω02 − C2r2S)rex ≈ −2SΩ0
2xex. (19)
5

With this radial acceleration and the Coriolis acceleration (−2Ω0×v), Eq. (1) for the velocity
field in the rotating frame, v, becomes
∂tv + v · ∇v = −∇pρ0
+FL
ρ0
+ ν∇2v − 2SΩ02xex − 2Ω0 × v. (20)
Decomposing v into the background shear flow and velocity perturbations (v = SΩ0xey+u),
Eq. (20) becomes
∂tu + u · ∇u = −∇pρ0
+FL
ρ0
+ ν∇2u + 2Ω0uyex − (2 + S)Ω0uxey − SΩ0x∂yu. (21)
To account for the background shear in the evolution of the perturbations, the remesh-
free approach of Brucker et al [5] was implemented. Due to the shear in the local frame, the
forward and reverse Fourier transforms must be modified to maintain periodicity along the
shearing direction:
f(k, t) =∑x
f(x, t)e−i(xiki−SΩ0xtky), (22)
f(x, t) =∑k
f(k, t)ei(xiki−SΩ0xtky). (23)
Hence, the fixed-grid wavevector K becomes a function of the Lagrangian (shearing) wavevec-
tor k and time, K(k, t) = (kx−SΩ0tky, ky, kz), and when transforming to Fourier space, the
derivative operators become
∂x → i(kx − SΩ0tky) = iKx, (24)
∂y → iky = iKy, (25)
∂z → ikz = iKz, (26)
∂t → ∂t − iSΩ0xky. (27)
6

The shearing box implementations of Eqs. (11) and (15) are then
∂tu = −u · ∇u− iKPtotρ0
+B · ∇B
4πρ0
− νK2u + 2Ω0uyex − (2 + S)Ω0uxey, (28)
Ptotρ0
=iK · MK2
− iK · L4πρ0K2
− 2iΩ0uyKx
K2+
(1 + S)2iΩ0uxKy
K2. (29)
Eq. (8) becomes, in velocity perturbations,
∂tB = B · ∇u− u · ∇B + η∇2B + SΩ0Bxey − SΩ0x∂yB, (30)
and the shearing box implementation of Eq. (12) becomes
∂tB = B · ∇u− u · ∇B− ηK2B + SΩ0Bxey. (31)
FFTs and Parallelization
Although Dedalus is written in Python, the FFTs dominate the computational cost of a
simulation. Optimizing the FFTs largely negates the performance penalties of using a high-
level language, while maintaining the ease of use and speed of development of Python.
Outsourcing the FFTs from Python to FFTW, a C-based library that optimizes FFT
routines based on local hardware, results in a substantial speed improvement over Python’s
(i.e. NumPy’s) built-in FFT algorithms. Much greater gains can be made on a graphics
processing unit (GPU) using Nvidia’s CUDA architecture to compute the FFTs and other
calculations.
Finally, MPI-based parallelization has been implemented, allowing a single simulation
to simultaneously run as N separate tasks. To achieve this, the computational domain is
evenly divided among the N tasks along the kz direction in Fourier space. The reverse
Fourier transform is then accomplished in a series of steps, as depicted in Fig. 2. First, each
7

task performs a 1D IFFT in the kx direction on its dataset, and the shearing phase shift is
applied as in Eq. (23), if necessary. Second, an MPI All-To-All call is issued, in which each
task evenly divides its data N times in the x direction, and sends the Nth slab to the Nth
task. Each task then stacks the N slabs it has received, and performs a 2D IFFT in the ky
and kz directions. The resulting datasets have gone through a full 3D IFFT, and the data is
evenly divided among the tasks along the x direction in real space. The parallelized forward
transform is the reverse of this process.
RESULTS
Code Verification and Testing
Multiple tests were performed to verify the MHD implementation in Dedalus. First, the
motion of a shear-Alfven wave, an eigenmode of the linearized MHD equations which travels
along magnetic field lines, was tested. A constant background magnetic field B0 was setup
across the domain, along with the velocity and magnetic field perturbations corresponding
to a shear-Alfven eigenmode. Shear-Alfven waves were found to propagate with the correct
phase velocities based on their direction of travel and the magnetic field strength: vA ∝
B0 cos θ, where vA is the speed of a shear-Alfven wave and θ is the angle between the
magnetic field and the wavevector.
This test was repeated with nonzero viscosity and magnetic diffusion. Fig. 3 shows
the resulting amplitude and phase velocity plots for several seeded modes, which behave
as expected. The velocity and magnetic field amplitudes decay exponentially, with rates
proportional to wavevector magnitude, as expected from Eq. (18), and the phase velocities
are constant in time and of the expected magnitude (here B0 is directed along (1, 0, 0)).
The advection of a low amplitude magnetic field was also tested. A small (|B| ≈ 10−3),
random magnetic field was imposed on a constant fluid velocity of order unity. The magnetic
8

field forced velocity perturbations of the same order, and both fields were advected with
the background fluid velocity. This behavior was expected, since the non-linear terms are
negligible with such small field perturbations.
The shearing box implementation was tested using the swinging wave test of Lithwick
[6]. The wavefronts of the vorticity waves are seen to turn with the local domain’s shear, as
expected. Snapshots of the wave at several times are shown in Fig. 4.
Science Results
At the time of this report, the parallelization techniques described above are being finalized
and tested. While they are critical for high-resolution simulations quantitatively studying
the MRI, linear and early non-linear behavior can be investigated at lower resolution. These
MRI simulations begin with a vertical magnetic field and small (≈ 10−6) random velocity
perturbations. Channel modes, precursors to turbulence in the MRI, are seen to form and
grow exponentially. The mode formation is seen in Fig. 5, which depicts ux in one xz plane
at several times. The modes lie primarily in xy planes and are nearly axisymmetric, as
expected. Higher resolution simulations following these modes further into the non-linear
domain will be performed utilizing the parallel architecture of Dedalus.
DISCUSSION AND CONCLUSIONS
Dedalus is among the first entirely open-source spectral MHD codes. The Python develop-
ment environment facilitates ease of use and code development, and the project’s emphasis
on object-oriented techniques have helped make Dedalus a very modular code which can
be easily adapted to study a variety of problems. The parallelized FFT algorithms, the
use of external libraries, and the incorporation of GPU-based calculations using CUDA all
contribute substantially to the performance of the code. With shearing-box simulations
9

underway, the MHD capabilities of Dedalus may help identify points of comparison and de-
parture between current lab-based HMRI experiments and the standard MRI operating in
astrophysical accretion discs.
ACKNOWLEDGMENTS
Dedalus is currently being developed by Jeffrey S. Oishi, Oliver Hahn, Keaton J. Burns,
and Greg Peairs. This project was made possibly by the U.S. Department of Energy’s SULI
program, and the KIPAC group at SLAC National Accelerator Laboratory and Stanford
University.
REFERENCES
[1] G. Lesur and P.-Y. Longaretti, “Impact of dimensionless numbers on the efficiency
of magnetorotational instability induced turbulent transport,” Monthly Notices of the
Royal Astronomical Society, vol. 378, no. 4, pp. 1471–1480, Jul. 2007. [Online].
Available: http://doi.wiley.com/10.1111/j.1365-2966.2007.11888.x
[2] S. A. Balbus and J. F. Hawley, “A powerful local shear instability in weakly magnetized
disks. I - Linear analysis. II - Nonlinear evolution,” The Astrophysical Journal, vol. 376,
pp. 214–233, 1991. [Online]. Available: http://adsabs.harvard.edu/abs/1991ApJ...376.
.214B
[3] O. N. Kirillov and F. Stefani, “ON THE RELATION OF STANDARD AND HELICAL
MAGNETOROTATIONAL INSTABILITY,” The Astrophysical Journal, vol. 712, no. 1,
pp. 52–68, Mar. 2010. [Online]. Available: http://arxiv.org/abs/0911.0067
[4] J. Maron and P. Goldreich, “Simulations of Incompressible Magnetohydrodynamic
Turbulence,” The Astrophysical Journal, vol. 554, no. 2, pp. 1175–1196, Jun. 2001.
10

[Online]. Available: http://arxiv.org/abs/astro-ph/0012491http://adsabs.harvard.edu/
abs/2001ApJ...554.1175M
[5] K. A. Brucker, J. C. Isaza, T. Vaithianathan, and L. R. Collins, “Efficient algorithm
for simulating homogeneous turbulent shear flow without remeshing,” Journal of
Computational Physics, vol. 225, no. 1, pp. 20–32, Jul. 2007. [Online]. Available:
http://linkinghub.elsevier.com/retrieve/pii/S0021999106004827
[6] Y. Lithwick, “Nonlinear evolution of hydrodynamical shear flows in two dimensions,”
The Astrophysical Journal, vol. 670, pp. 789–804, 2007.
11

FIGURES
Figure 1: The motion of fluid tracers initially aligned with the edges of the co-rotating localdomain, as viewed from an inertial frame. Lower angular velocity at larger radii results in alocal linear shear across the x direction of the local domain. The size of the box relative tor0 is exaggerated for clarity.
Figure 2: Data distribution using MPI parallelization: task cuts along kz in Fourier space,data passing during MPI All-To-All call, and task cuts along x in real space.
12

Figure 3: Amplitude and phase velocity evolution of several shear-Alfven waves, with vis-cosity and magnetic diffusivity.
13

Figure 4: Swinging wave demonstrating local linear shear (ux depicted).
14

Figure 5: Formation of channel modes (ux depicted in an xz plane).
15

Simulations and Analysis of an Infrared Prism Spectrometer for
Ultra-short Bunch Length Diagnostics at the Linac Coherent Light Source
Julie Cass
Office of Science, Science Undergraduate Laboratory Internship Program
University of Notre Dame
SLAC National Accelerator Laboratory
Menlo Park, California
August 19, 2011
Prepared in partial fulfillment of the requirement of the Office of Science, Department of
Energy’s Science Undergraduate Laboratory Internship under the direction of Josef Frisch in the
ICD Accelerator Physics & Engineering Department at SLAC National Accelerator Laboratory.
Participant: __________________________________
Signature
Research Advisor: __________________________________
Signature
SLAC-TN-12-020
Work supported by US Department of Energy contract DE-AC02-76SF00515.

1
ABSTRACT
Simulations and Analysis of an Infrared Prism Spectrometer for Ultra-short Bunch Length
Diagnostics at the Linac Coherent Light Source.
Julie Cass (University of Notre Dame, Notre Dame, IN 46556), Josef Frisch (ICD Accelerator
Physics & Engineering, SLAC National Accelerator Laboratory, Stanford, CA 94025).
We require a means of determining the minimum achievable bunch length at the Linac
Coherent Light Source (LCLS) at SLAC National Accelerator Laboratory. Current methods of
measurement in the time domain do not have the resolution to measure ultra-short bunch lengths
below 10 fs. An alternative method has been designed, using a single-shot near- to mid-infrared
prism spectrometer for bunch length diagnosis in the frequency domain. This design requires the
precision alignment of sensitive optical equipment and complete understanding of the spectrum
reaching the spectrometer’s detector surface. This paper provides information on preliminary
simulations designed to model beam behavior in the optical set-up and at the detector surface for
comparison to measured values as an indication of the current achievable optical alignment and
the study of optimal detector orientation. The results of these simulations indicate the necessity
for a method of greater precision in optical alignment and further study of achievable
spectrometer range.

2
INTRODUCTION
The Linac Coherent Light Source (LCLS) at SLAC National Accelerator Laboratory is a
groundbreaking free electron laser (FEL), using magnetic fields to oscillate high-energy
electrons and generate ultrafast X-ray pulses [1]. This FEL is capable of producing pulses with
ultra-short bunch lengths, enabling scientists to image molecules and atoms in motion, pushing
the limits of technology in pursuit of a deeper understanding of fundamental chemical,
biological, and physical properties of materials [2]. The interpretation and understanding of the
data collected in these experiments relies on a complete understanding of the parameters used in
driving the FEL. While the minimum achievable bunch length at LCLS is known to have a value
below 10 fs, the precise value remains unknown. Measurement of this parameter requires a
mechanism capable of probing pulses shorter than 10 fs, a scale too small to be resolved by
existing time domain detectors. Scientists at the LCLS have developed an alternative design
implementing a broadband infrared prism spectrometer to probe for this parameter in the
frequency domain.
This new approach is centered on the concept that information about the bunch length can
be extracted from the spectrum of optical transition radiation generated by the electron beam.
This radiation can be characterized as a relativistic effect, resulting in the emission of
electromagnetic radiation as a charge particle approaches a conducting foil. The implementation
of an inverse Fourier transform of the transition radiation spectrum allows for the inversion of
spectral information for analysis in the time domain. This provides an absolute means for
calculation of the FEL bunch length from the information contained in the transition radiation

3
spectrum. The wavelength range of interest for the transition radiation from the LCLS beam is
within the near- to mid-infrared range.
Transition radiation from FEL electrons is expanded and collimated using precision
optics [3] and steered to the spectrometer prism. The index of refraction of the prism material is
wavelength dependent, creating a dispersion relation between the wavelengths comprising the
radiation beam and the angle of refraction as the light emerges from the prism. The dispersed
light is focused onto the detecting surface of a pyroelectric detector array [4]. The resulting
spectrum will then be used in the inverse Fourier analysis to determine the FEL bunch length. It
is crucial for the success of this approach that the spectrometer is designed with precisely aligned
optics for propagation of transition radiation from the foil to the detector. For this purpose, a
method for analyzing the behavior of the beam in the optical system of the spectrometer has been
determined. We require a calculation of both how the beam would behave for an ideal system
and for a system containing aberrations with the introduction of alignment errors.
METHODS AND MATERIALS
Spectrometer Design
The infrared spectrometer design is comprised of an electronic system to drive and
collect data from the pyroelectric line detector and an optical set-up employing lenses and
mirrors to expand, collimate and steer the beam towards this detector. A diagram of the optical
system as it would be implemented in the LCLS is provided in Figure 1.

4
Figure 1. Preliminary optical layout for the prism spectrometer
The mirrors used in this optical design are gold-coated, 90-degree, off-axis parabolic mirrors
(OAPs). Preliminary calculations for this project showed that the optical transition radiation form
the LCLS is likely to fall in the infrared wavelength range. These mirrors were chosen for their
reflectivity in the wavelength range of interest. They are particularly difficult to align, due to the
challenge in locating the off-axis central point. A Helium-Neon (HeNe) laser emitting light in
the visible range at 632.816 nm was initially used for positioning of the system elements and a
Thallium Bromo-Idodide (KRS-5) crystal was selected to act as the spectrometer prism,
dispersing the transition radiation over the detector. This material was chosen for its dispersive
and transmission properties in the range of wavelengths of interest.
MATLAB Simulation for Idealized Modeling
As proper alignment is essential to our project, we required a calculation of the tolerances
for beam behavior while navigating the optical system. A mathematical interpretation of the

5
optical system was programmed in MATLAB [6] to graphically simulate the size of the beam as
it is passed through various optical elements using “ray transfer matrix analysis” [7]. The
programming software MATLAB was selected for this simulation due to its capabilities in
matrix-based calculation. In the ray transfer matrix approach to optical analysis, light rays are
represented as vectors in terms of height r, and angle of inclination relative to the optical axis.
Each optical element or length of free space propagated by the beam is represented by 2 x 2
matrix; when the initial light ray is multiplied by the ray transfer matrix, the result is a new
vector, containing information about the outgoing beam height and angle of inclination.
Examples of ray transfer matrices for light refraction through a lens with focal length f and the
propagation of a ray through free space of length d are provided in Equations 1 and 2
respectively.
rf
f
1 0
1f
1
ri
i
(1)
rf
f
1 d
0 1
ri
i
(2)
If we represent each successive optical element or length of free space (at 100 m intervals) in
the system as ray transfer matrix Mi, we can represent the compounded effects of the entire
optical system with a single ray transfer matrix M:
M M i
i1
n
(3)
where n is the total number of optical elements and 100 m intervals of free space in the system.
While basic ray transfer matrix analysis is designed for modeling ideal behavior of light rays
with negligible waist size, our system required ray transfer analysis of Gaussian beam

6
propagation, as the HeNe laser used to align the system produces a Gaussian beam. In order to
incorporate the effects of diffraction into our design, we generated a vector to represent the initial
Gaussian beam in terms of a complex beam parameter q, calculated by the following equation:
(4)
where q is the complex beam parameter, R is the radius of curvature of the beam,
is the
wavelength of the beam and w is the beam waist size or beam diameter [8]. With this notation,
the equation modeling the transformation of the initial beam to a final beam through ray transfer
analysis takes on the modified form:
q f
1
k M
qi
1
(5)
where the beam is now represented by a vector containing the complex beam parameter and k is
a constant chosen to maintain the normalization of the bottom component of the beam vector.
Carrying out this multiplication and solving for the inverse q value leaves us with:
1
q fM(2,1) M(2,2)
qi
M(1,1) M(1,2)qi
(6)
giving us a way to find the new waist size from the definition of the beam parameter q and the
elements contained in the ray transfer matrices and initial beam parameter. From this
information, the MATLAB code calculates the beam waist at each element and free space
interval and outputs a graph of these waist sizes.
This simulation was designed with matrices representing ideal versions of each optical
element; off-axis parabolic mirrors and lenses are treated according to the thin lens
approximation. The errors in alignment are not accounted for; the program offers an outline for

7
behavior in a system with infinite precision as a guideline for proper alignment and a means of
comparison between ideal beam behavior and the behavior, or beam sizes, seen in the actual set-
up.
ZEMAX Simulation
Disagreements between the measured beam sizes and those calculated in the MATLAB
simulation were anticipated due to limitations in the precision aligning of optics. We wished to
determine the spectrometer tolerances achievable considering these limitations. For a more
accurate representation of the design and calculation of this resolution, the optical simulation
software ZEMAX was used [9]. This software provides the ability to trace rays of light as they
are reflected, refracted, and dispersed in an optical system.
The spot size was analyzed at two crucial points in the optical system: the focal points of
the first and third OAPs, with the latter corresponding to the proposed location of the line array
detector. As these are the two tightest focuses in the optical design, they are excellent test points
for the design tolerances in angular misalignments. The beam sizes measured and simulated in
this project are the 1/e2 beam diameters. For analysis of the beam size at the focal point of the
first OAP, a ZEMAX simulation of a single 90-degree OAP with a 50.8 mm focal length and
mirror diameter perpendicular to the optical axis of 50.8 mm was generated. The 3D plot of this
mirror produced by ZEMAX is provided in Figure 2.

8
Figure 2. ZEMAX ray tracing of reflection off of a 90-degree off-axis parabolic mirror. Light rays are
incident from the left side of the image and are focused by the OAP.
As the HeNe laser used has a beam output diameter 2w0 of 2 mm and is expanded in a pair of
lenses, or a telescope, to approximately 17 times its initial size, the entrance beam size for the
simulation was set to 33 mm. The beam size at the OAP focus was first calculated for the case of
a perfectly aligned mirror. Mirror tilts on the order of a tenth of a degree about the horizontal,
vertical and optical axes were added in keeping with the estimated tolerances for physical
alignment of the optics. These angles were adjusted until a beam size similar to the beam size
measured on the optical table was reached. The tilts needed to cause these beam sizes were
recorded for comparison with estimated order of misalignment error.
The design for testing beam sizes due to aberrations at the final detector location was
more complex. While the functionality of the spectrometer depends on the dispersion of
wavelengths through the prism, this dispersion also introduces chromatic aberrations in the focal
plane of the spectrum. Previous simulations of the beam path indicate that, due to these
chromatic aberrations, the wavelength-dependent focal plane is not perpendicular to the optical
axis; a 44 degree tilt of the detector plane was required to minimize these effects [10]. We

9
wished to create a new simulation of this portion of the spectrometer design to account for
differences in mirror diameters and beam sizes, as well as refocusing the system to the best focus
for all wavelengths of dispersed light. From this model we could then test the angular tolerances
and determine the new optimal detector tilt.
The simulation was first designed to focus several wavelengths of light at the detector to
simulate actual conditions for application in LCLS. While chromatic aberrations make perfect
foci impossible to produce, we could optimize the optical system in ZEMAX to achieve
minimum beam diameters and sharpest possible foci. A simple example of the process is shown
for a basic plano-concave lens in Figure 3a-b. When the ZEMAX function 3D-plot is
implemented for a simple lens design (Figure 3a) we can see the unclear focus produced as
different rays of light focus at different points.
Figure 3a and 3b. ZEMAX tracing of light rays intiated at the far left of the image, are
refracted through plano-concave lens with spherical aberrations onto an image plane
(line at far right), shown before and after focusing optimization
Owing to the chromatic aberrations, the "focal length" specified for the lens is no longer the
point of smallest beam radius. Instead, we defined a new adjusted focal length as the point where
the tightest beam waist is located. Through use of the Merit Function Editor in ZEMAX, system

10
parameters specified by the user in the Lens Data Editor as variables may be adjusted, allowing
for system optimization. The Geometric Encircle Energy (GENC) merit function was used for
the focusing of elements in this simulation. GENC places the image plane closest to the point at
which a user-specified fraction of the beam energy falls within a user-specified beam radius,
constraining beam size at the image plane. Using the Optimization feature of ZEMAX allows the
software to adjust any “variable” parameters in the lens data editor, such as distance from the
object to the image plane, in order to meet the target encircled energy values as closely as
possible. Figure 3b displays the resulting 3D plot when the GENC merit function was used to
constrain the greatest possible amount of beam energy to the smallest possible radius at the
image plane. This technique for image focus, once understood for simple cases as the lens shown
above, was then applied to our optical design for precision focusing of OAPs about the prism and
detector for a measurement of the new detector tilt needed and angular tolerances in beam
alignment. The GENC target fraction of beam energy set in order to simulate the 1/e2 beam
diameter for comparison with the measured beam sizes.
With a design completed for the spectrometer dispersion of several wavelengths of light,
the model was adjusted to simulate only the beam path of the HeNe laser and the system was re-
optimized for this single wavelength. A ZEMAX plot of this model is given in Figure 4.

11
Figure 4. ZEMAX plot of OAP focusing of HeNe light onto the detector plane (line on the
far left) after traveling through the final two OAPs and prism
To determine the angular adjustments needed to cause a beam size similar to the measured beam
size, coordinate breaks with angular tilts were added to the design. Angular tilts about the
optical, vertical, and horizontal axes were added and the system was optimized for each new
design angle. The tilts were adjusted until the simulated beam size was similar to the measured
beam size and the resulting tilts were compared to the expected magnitude of tilt misalignments.
We could then consider whether the aberrations in measured beam sizes were in fact due to
misalignments and whether they were close enough to the values predicted by MATLAB and
ZEMAX to be negligible in spectrometer functionality.
RESULTS
Figure 5 below displays a plot of the beam waist results produced through the
implementation of the MATLAB optical simulation code.

12
Figure 5. Log-scaled plot of beam size at various points in the spectrometer optics
predicted by MATLAB simulation
The Optical Element Numbers given in the x-axis represent which step through the optical
system each element falls at. The step size for this system was 0.1 mm. Each Optical Element is
either a distance step of this size or an optical element itself.
At the first focal point of interest, following light reflection from the first parabolic
mirror, we measured a beam diameter of approximately 172 m. Our simulations in MATLAB
predict a beam diameter of approximately 65m. To determine whether the magnification of the
measured beam size by three times the predicted size could be the result of misalignments, we
compared these numbers to those generated by the ZEMAX simulation. The Spot Diagram
display in ZEMAX providing the beam diameter at this focal point through general ray tracing
predicted a beam size of 0 m without any mirror tilts or aberrations. Tilts of approximately 0.4
degrees both along the optical axis and perpendicular to the optical table were needed in order to
produce a beam with diameter equal to the measured beam diameter.

13
At the focal point of the third parabolic mirror, with no detector tilt implemented, we
measured the beam diameter of approximately 280 m. MATLAB simulations predict a beam
size of approximately 37.5 m at this location. It was determined that the disagreements between
these two values were also likely the result of limits in precision alignment of the system, though
these effects seemed much greater at the detector location than at the focal point of the first
parabolic mirror. This hypothesis was tested with the study of beam sizes predicted by the
ZEMAX model. Without aberrations added, this simulation predicted a beam diameter of 14 m.
Tilts of approximately 1 degree both about the vertical, horizontal, and optical axes were needed
to cause beam sizes comparable to the measured beam size. A table containing all relevant
measured and simulated beam sizes is provided in Table 1.
Measured MATLAB ZEMAX ZEMAX Tilts
Required
50.8 mm OAP
Focal Point 172 m 65 m 0 m 0.4
Detector
Surface 280 m 37.5 m 14 m 1
Table 1. Table of measured and simulated beam diameters (m) at two points of interest
in the optical system, and simulation tilts needed to produce the measured beam sizes
With a new simulation designed to match the design parameters of our spectrometer,
multiple wavelengths of light were added to the simulation and the detector tilt and distance were
optimized for focusing of all wavelengths. A new detector tilt of 45 degrees was determined to
minimize chromatic aberrations at the detector plane. While this tilt provided a decent focus for
all wavelengths of light, this design created a dispersion of approximately 16 mm. The detector,
however, has a length of 14 mm and not all wavelengths of light transmitted by the KRS-5 prism
would fit on the detector for analysis. Ray tracing images of this portion of the system and light

14
focusing at the detector are given in Figure 6. A spot diagram of all wavelengths falling on the
detector surface is given in Figure 7 and a table listing the wavelengths plotted in these
simulations is given in Table 2.
Figure 6. Ray tracing for focusing of several wavelengths onto the detector plane. Left: The simulated beam
initiates at the far right, is reflected by the 105.6 mm OAP, disperses through the prism, reflects off of the
177.8 mm OAP and falls on the detector surface. Right: Close-up of all wavelengths focusing onto the
detector plane.
Figure 7. Spot diagram for the detector surface. The vertical axis represents the length of the detector array.
Each wavelength is confined to a thin strip along the vertical or detector axis

15
Wavelengths (m)
Blue 0.632
Green 3.39
Red 10.6
Gold 20.0
Magenta 30.0
Turquoise 39.0
Table 2. List of wavelengths (m) plotted in the ZEMAX simulation shown in Figure 7.
DISCUSSION AND CONCLUSION
Comparisons of the measured beam size and MATLAB simulated beam sizes at both the
focal point of the 50.8mm OAP and the detector plane yielded measured results larger than those
simulated by MATLAB. This result was consistent with our hypothesis that discrepancies in
these beam sizes could be the result of minor errors in alignment. When the system was modeled
in ZEMAX and tilts were added to simulate mirror misalignment, we found that the tilts
necessary to match the measured beam sizes were less than or equal to one degree. We believe
that precision in mirror alignment is limited to tolerances greater than one degree. However, the
aberrations found in our system are great enough, that we believe a superior method for precision
alignment is needed for the spectrometer to function properly. We will require further research
and testing to develop a method for fine-tuning this alignment for a closer match between the
predicted and measured beam sizes.
Spectrometer design considerations originally predicted the transmission range of KRS-5
prism to be the limiting factor in the range of wavelengths detected in the spectrometer. Through
our ZEMAX simulations, we found that no detector tilt can be implemented in our current design
to allow all wavelengths transmitted by this prism. This result implies that either our

16
spectrometer detection range will be bounded for larger wavelengths at 38 m rather than 40 m
or the design will need to be changed. We believe that this decrease in detector range is small
enough that the current spectrometer design will be sufficient. The spectrometer contains
aberrations large enough that a new method for alignment is needed but has a detection range
sufficient to produce the spectrum needed for FEL bunch length diagnosis.
ACKNOWLEDGEMENTS
This research was carried out at the SLAC National Accelerator Laboratory between May
23 and August 19, 2011 under the direction of Josef Frisch. The author would like to thank the
United States Department of Energy and the SLAC National Accelerator Laboratory for
supporting this research through the creation, organization, and funding of the Summer
Undergraduate Laboratory Internship (SULI) program. She would also like to thank her mentor
Joe Frisch and research partners Gilles Dongmo-Momo and Kiel Williams. Thanks also go to
Alan Fisher for his guidance in optical simulation design.

17
REFERENCES
[1] Y. Ding et al., “Measurements and Simulations of Ultralow Emittance and Ultrashort
Electron Beams in the Linas Coherent Light Source”, PRL 102, 254801, 2009
[2] Linear Coherent Light Source http://lcls.slac.stanford.edu/
[3] K. Williams, “Optical Design of a Broadband Infrared Spectrometer for Bunch Length
Measurement at the Linac Coherent Light Source,” SLAC National Accelerator
Laboratory SULI Program 2011, Palo Alto, CA
[4] Pyreos Ltd, http://www.pyreos.com/
[5] G. Dongmo-Momo, “Infrared Spectroscope for Electron Bunch-length Measurement:
Heat Sensor Parameters Analysis,” SLAC National Accelerator Laboratory SULI
Program, Palo Alto, CA 2011
[6] MATLAB 7.0.4, The MathWorks Inc.
[7] Bahaa E. A. Saleh and Malvin Carl Teich (1991). Fundamentals of Photonics. New
York: John Wiley & Sons. Section 1.4, pp. 26-36 [8] Gaussian Beams http://www.rp-photonics.com/
[9] Radiant ZEMAX LLC, http://www.zemax.com
[10] C. Behrens et al., “Design of a Single-Shot Prism Spectrometer in the Near- and Mid-
Infrared Wavelength Range for Ultra-Short Bunch Length Diagnostics”, DIPAC'11,
Hamburg, Germany, 201

Infrared Spectroscope for Electron Bunch-length Measurement:
Heat Sensor Parameters Analysis.
Gilles Dongmo - Momo
Office of Science, Science Undergraduate Laboratory Internship (SULI) Program
Towson University Baltimore, Maryland
SLAC National Laboratory Menlo Park, California
08/20/2011
Prepared in partial fulfillment of the requirements of the Office of Science, U.S. Department of Energy’s SULI under the direction of Dr. Josef Frisch at the Linac Coherent Light Source
(LCLS).
Participant: ___________________________
Signature
Research Advisor: ____________________________
Signature
SLAC-TN-12-022
Work supported by US Department of Energy contract DE-AC02-76SF00515.

Gilles Dongmo – Momo
2 | P a g e
Table of Contents
Abstract 3
Introduction 4
Methods 5
Results 9
Discussion and Conclusion 17
Acknowledgements 19
References 19

Gilles Dongmo – Momo
3 | P a g e
ABSTRACT:
Infrared Spectroscope for Electron Bunch-length Measurement: Heat Sensor Parameters Analysis. Gilles Dongmo - Momo (Towson University, Baltimore, MD 21252) Josef Frisch (ICD Accelerator Physics & Engineering department, SLAC National Laboratory, Menlo Park CA 94025)
The Linac Coherent Light Source (LCLS) is used for many experiments. Taking advantage of the free electron laser (FEL) process, scientists of various fields perform experiments of all kind. Some for example study protein folding; other experiments are more interested in the way electrons interact with the molecules before they are destroyed. These experiments among many others have very little information about the electrons’ x-ray produced by the FEL, except that the FEL is using bunches less than 10 femtoseconds long. To be able to interpret the data collected from those experiments, more accurate information is needed about the electron’s bunch-length. Existing bunch length measurement techniques are not suitable for the measurement of such small time scales. Hence the need to design a device that will provide more precise information about the electron bunch length. This paper investigates the use of a pyreoelectric heat sensor that has a sensitivity of about 1.34 micro amps per watt for the single cell detector. Such sensitivity, added to the fact that the detector is an array sensor, makes the detector studied the primary candidate to be integrated to an infrared spectrometer designed to better measure the LCLS’ electron bunch length.

Gilles Dongmo – Momo
4 | P a g e
INTRODUCTION:
The X-rays produced by the LCLS have the same profile in the time domain as the electrons
producing them. More information about the electrons can be translated to more information
about the x-rays. Many techniques were developed to characterize electrons. To give accurate
information about the LCLS’ electron bunch, those techniques were able to approximate the
electron bunch length to be shorter than 10 femto-seconds. [1] But the need to get better image
resolution out of the LCLS’s Free Electron Laser becomes a necessity added to the fact that
current experimental efforts require a more precise measurement for LCLS electron pulse
duration, new bunch-length measurement techniques are being developed[2]. An infrared
spectrometer was designed as a means of indirectly measuring the pulse duration. [3]. Due to the
difficulty of directly measuring the electron bunch length, measurement efforts must focus on
indirectly extracting the pulse duration from other properties of the beam.
For this characterization purpose, an innovative spectrometer designed to measure the optical
transition radiation spectrum of the electrons as they pass through a foil can provide such an
indirect measurement. Getting the wavelength distribution of this radiation and then calculating
its inverse Fourier transform will provide a space-time profile of the electron bunch. The optical
transition radiation is mostly in the infrared range which makes it hard to work with, especially
in the optics alignment and setup. In the final setup to be used at LCLS, the radiation produced
from the electrons will go through a set of optical elements [3] including gold-coated mirrors,
irises, gold-coated off-axis parabolic mirrors, and a prism to stop at a detector. [4]

Gilles Dongmo – Momo
5 | P a g e
METHODS:
The project aim is to use infrared spectroscopy to get information on the electrons from the
optical transition radiation (OTR) that are produced when electrons approach and pass through a
thin metal foil. [5] The ultimate spectrometer design is expected to direct the OTR beam to a
prism that will disperse infrared light from about 0.6 to 40 micro meters. This covers the infrared
range most relevant to the OTR emitted by the LCLS pulses. The primary setup was done on an
optical bench using lasers of different wavelengths to simulate the OTR. The IR sensor is a heat
detector that will be connected to a computer.
Most available spectrometers are designed to detect a particular wavelength of light or a very
narrow range of wavelengths. The Spectrometer that is being designed is intended to be sensitive
to a wide range of infrared light for wavelengths varying from 0.6 nanometers to 40 nanometers.
The infrared spectrometer includes an optical set up that ends with an infrared detector. For this
setup, a piezoelectric heat sensor was utilized. The PY-LA-S-128 from PYREOS is a line sensor
array made of 128 two and a half-millimeter long sensor elements, each lined up over 14.3
millimeters. Each element of the detector constitutes a pixel and is made of a thin film of
pyroelectric PZT (Lead zirconate titanate) material. PZT is a material that develops a voltage
difference when experiencing a temperature, mostly infrared light change; these characteristics
make this innovative sensor the perfect candidate for the project. [6] Most detectors of this type
are made of a single cell element. The detector used in this experiment is sensitive a wide band
in the IR spectrum. [7]

Gilles Dongmo – Momo
6 | P a g e
Figure 1: Line sensor.
The detector is mounted on a board on which all the electronics necessary to the data acquisition
are setup. The detector was purchased with the board and the necessary software allowing us to
upload collected data during the experiment. [8]
Figure 2: Sensor PCD board.
In an attempt to improve the understanding of the data collected by the detector, some
preliminary data were collected only from the room temperature variations. Several
modifications were then made to reduce temperature fluctuations due to room lighting. A black
box was made to shield as much of the room’s light as possible. On the inside of the box, an
LED was inserted so most of the change in light recorded by the sensor came from the LED
flashes.
Pixel array
Power connector
Synchronization connector (Pin 3- connector4)
USB port
Array detector connector

Gilles Dongmo – Momo
7 | P a g e
The sensor board is equipped with a set of pins each outputting specific data. Pin 3 of connector
4 shown on Figure 2 out puts the pulse necessary to drive the LED. This pulse is synchronized
with the sampling frequency of the detector which can be digitally modified through the
software. In the initial setup, an LED was connected and driven by the board. Sets of data were
recorded for different sampling frequencies values. The raw data were collected and saved in an
EXCEL file. Each column represented a pixel, and each alternating row was the voltage reading
of the detector during a period of the data collection time. The data reading happened during two
periods; when the LED was on and when it was off
To calculate the actual change in brightness of the LED, an algorithm was created in EXCEL to
take the difference between consecutive rows of the EXCEL sheet with each row representing
the LED on and LED off recorded values at each pixel. The result of this calculation yielded an
array of signal intensities. Later, the average signal for each pixel was taken so a graph of signal
intensity vs. pixel could be plotted.
To compare how much noise the room light and other electronics was creating relative to the
signal, the average root mean square (RMS) voltage of the signal was calculated from the most
lit pixels. From the array of data calculated earlier, the standard deviation of the signal was
calculated. The average RMS voltage and the actual signal values were calculated for each
frequency and plotted to compare the sensitivity of the detector across a range of frequencies.
This RMS signal was then compared to the average signal for each pixel on the same plot.
After interpreting the data collected from the initial setup, other experiments were performed.
They consisted in covering parts of the detector with regular tape and observing the detectors
behavior in different conditions. Figure 3 represents the latest setup used.

Gilles Dongmo – Momo
8 | P a g e
Figure 3: electronics setup to test the detector.
Later in the experiment, a single cell pyroelectric detector (Figure 4) was calibrated for potential
use in the alignment of the invisible lasers that will be used in the final design of the
spectrometer. The single cell detector was connected to a lock-in amplifier so the current output
can be read at a specific frequency. The single cell detector was placed on the optical table after
the chopping wheel, a mirror and two lenses used to focus the beam [2] Later, the single cell
sensor was replaced by a diode detector that gave information about the power of the beam.
Figure 4: Pyroelectric single cell detector mounted on a holder.

Gilles Dongmo – Momo
9 | P a g e
RESULTS:
To calibrate the detector, its sensitivity had to be probed by a strong light source, the LED light
source was run using the pulse generated from the third pin of the fourth connector of the
detector. (Figure 2) It was convenient to use a regular LED light source for this purpose. When
using the detector, several anomalies in the data were noticed, indicating some deficiencies in the
data collection process. These deficiencies were not easily assigned to the hardware or the
software of the detector. To determine the origin of the problems, several tests were performed.
These tests yielding data sets that were also challenging to interpret. Figure 5 shows one signal
recorded during these tests.
Figure 5: Data collected when running the LED at a frequency of 240Hz, the LED is placed at the center of the array detector, around pixel 60.
The data shown in Figure 5 represents the output power the sensor recorded when an LED was
placed at the center of the array, directly above it. The data yielded an inverted bell-curve. This
contrasted with the expectation of a Gaussian distribution. The most intensely-illuminated pixels
-100
-50
0
50
100
150
0 10 20 30 40 50 60 70 80 90 100 110 120 130 140
max
imum
inte
nsity
(mv)
pixel
Signal and noise recorded with a LED rate of 240Hz
software data
rms

Gilles Dongmo – Momo
10 | P a g e
yielded negative intensities, while the least intensely-illuminated pixels yielded positive ones.
Also, the whole spectrum represented had an average intensity of -9.22 mv which is too small to
represent the average intensity of the LED. These effects suggest that the detector may be AC-
Coupled rather than DC-Coupled as described in the company-provided user manual.
These observations were made for each available frequency up to 240 Hz. The data were
recorded for frequencies at 10Hz intervals.
The manufacturer of the detector was initially contacted in an effort to determine how the
detector used raw data. The received information did not fully characterize the observed data,
some of which was in direct contradiction to the supplied user manual. The EXCEL algorithm
described in the previous section was developed to get a better understanding of the software
functioning. Data as the ones produced by the software from the raw data collected from the
board were calculated. Then, the noise and the signal were compared for the whole range of
frequencies of interest. From that data, the observation that the noise was very small compared to
the signal was made. When averaging the signal and noise of the 30 most lit pixels and averaging
those for each frequency, we determined that the signal was 43.3 times higher than the noise.
Figure 6 shows the plot of the signal compared to the noise. One can notice that the noise is very
small relative to the signal.

Gilles Dongmo – Momo
11 | P a g e
Figure 6: Signal compare to the noise for frequencies from 10Hz to 240Hz.
The software calculations appeared reasonable since the results could be reproduced using a
program written in the lab. The only concern now was to know what type of information were
the raw data yielding. During this part of the experiment, a dark tape was placed at the center of
the array detector. The plot in Figure 7 shows that the detector presented characteristics similar
to the initial data collected. These results suggested that the program may have inverted the raw
data it received. However, this was inconsistent with the observed behavior of dead pixels on the
detector across different tested frequencies.
0 100 200 300 400 500 600 700 800 900
0 50 100 150 200 250
brig
htne
ss (u
V)
frequencies (Hz)
RMS and average brightness data for the frequency range
rms
brightness

Gilles Dongmo – Momo
12 | P a g e
Figure 7: Data collected from the PYREOS sensor with a centered tape, the graph suggests that the software averages the overall signal to zero.
Another issue with the data was observed when the experiment was run at a sampling rate of
220Hz. (Figure 8) instead of a Gaussian curve, the expected inverse bell shaped curve was
observed with the minimum brightness at the center of the detector, where the tape was placed.
This completely contradicted the according to which the data were just inversed.
-1500
-1000
-500
0
500
1000
1500
0 20 40 60 80 100 120 140
max
imum
inte
nsity
(mv)
pixel number
RMS and Brightness data at 20Hz with centered tape
maximum brightness rms

Gilles Dongmo – Momo
13 | P a g e
Figure 8: Data collected from the PYREOS sensor at 220 Hz sampling frequency with a centered tape,
the graph suggests that the software averages the overall signal to zero.
In Figure 8, the tape is centered so the observed plot is the shape we expected while the previous
data presented the opposite characteristics even though the parameters were the same throughout
the experiment. This observation further suggested AC-Coupling in the detector. In this
configuration, the slightest change in lightning can result in the change in the whole spectrum. It
was suggested that an additional experiment be performed to determine the parameters needed to
optimize the detector system. But changing the software parameters and observing the behavior
of the detector in real time.
The detector allows for sample rate and data collection interval to both be adjusted. The times
that are modifiable are: the ‘VVR closed time’ (VVR = Voltage VGainStage Reset) and the
‘VDR closed time’ (VDR = Voltage DGainStage Reset) those two times determine the duration
of the detector not recording data: Dead time. Modifying the dead time affected the integration
time which is the time during which the detector collects data.
-1000
-800
-600
-400
-200
0
200
400
600
800
0 20 40 60 80 100 120 140
max
imum
inte
nsity
(mv)
pixel
220Hz with centered tape data comparison
software data rms

Gilles Dongmo – Momo
14 | P a g e
According to the detector’s manufacturer, the integration time is related to the other parameters
as follow:
𝑖𝑛𝑡𝑒𝑔𝑟𝑎𝑡𝑖𝑜𝑛 𝑡𝑖𝑚𝑒 (𝑢𝑠) = 1𝑠𝑎𝑚𝑝𝑙𝑒 𝑓𝑟𝑒𝑞𝑢𝑒𝑛𝑐𝑦
(𝑢𝑠) − 𝑉𝐷𝑅 𝑡𝑖𝑚𝑒(𝑢𝑠) − 3(𝑢𝑠) (1)
Data were collected for a range of sampling frequencies and dead time. Figure 11 shows the
table of the data collected, the integration time predicted by the user’s manual.
Sampling frequencies
(Hz) VDR time
(us) integration time (us) 240 375 3788.666667 240 400 3763.666667 240 646 3517.666667 230 800 3544.826087 220 1000 3542.454545 210 1200 3558.904762 201 1400 3572.124378 197 1500 3573.142132 129 4000 3748.937984
Figure 8: Calculated Integration time for several frequencies to be compared With the delay time measured.
This calculated integration time seemed very high compared to what was observed
simultaneously on an oscilloscope (Figure 9). The realization that the time during which the
software takes data does not change while the dead time and “the integrating time” decrease was
quickly made.

Gilles Dongmo – Momo
15 | P a g e
Figure 9: Generated signal and integration time. On this graph from the detector’s user’s manual, the integration time covers most of the signal period both the on and off phase.
While performing this experiment, it appeared that the integration time was different from the
expected time. Using the previously described setup, modifications to the phase difference
between the LED pulse and the sampling rate were made. A very small change in this delay time
induced using the pulse generator completely nullified the signal when the calculated integration
time suggested otherwise. Figure 10 shows how delaying the pulse may cancel the signal,
represented by the blue areas under the red curve. This plot shows that the sampling frequency
will have to be shifted by a considerable amount for the signal to disappear but continuing the
delay will make the signal reappear with a potential change in sign.
Figure 10: a delay time will result in the cancelation of the signal.

Gilles Dongmo – Momo
16 | P a g e
For the same parameters and dead times as the ones described above, the pulse was delayed in
time, and the amount of time it took the detector to lose the signal was recorded. The delay times
for several VDR values were recorded in Figure 11 for several frequencies.
Sampling frequencies (Hz)
VDR time (us) delay (us)
240 375 0 240 400 74 240 646 258 230 800 350 220 1000 494 210 1200 634 201 1400 1270 197 1500 over 129 4000 over
Figure 11: the delay time measured for several frequencies to be compared to the calculated integration time.
Figure 12 shows a plot of both the integration time calculated and the delay time needed for the
signal to disappear on the oscilloscope. One can see that the delay time is much too short
compared to the integration time to cause the signal to disappear.
Figure 12: Comparison of the delay time and integration time. One would expect the delay time to be much larger for the signal to disappear.
0
500
1000
1500
2000
2500
3000
3500
4000
0 50 100 150 200 250 300
time
(us)
frequencies (Hz)
Comparison of the integration time and delay time
integration time delay time

Gilles Dongmo – Momo
17 | P a g e
Simultaneously, the sensitivity of a single cell, one-pixel pyroelectric detector was measured. A
chopper wheel was driven at a frequency of 100 Hz immediately after the origin of a test laser.
The power sensor, placed after the chopping wheel, a mirror, and two lenses to focus the beam,
recorded a power output by the laser of 0.531 mW. The same set up was used to determine the
current output by the pyroelectric detector; the locking amplifier displayed a current reading of
0.71 nA. From this we can infer that the single cell detector has sensitivity of about 1.34uA/w. at
100Hz for the Helium- Neon laser of wave length 633nm.
Discussion and Conclusion:
The fact that the data is flipped for some frequencies is believed to result from the fact that the
program used by the software does not distinguish between subtracting the minimum intensity by
the maximum and vice-versa. So one can simply multiply the whole set of data by a -1 and will
only have to deal with the AC-Coupling.
The performed test indicated that the detector used provided us with hard to analyze data. We
were able to confirm that the issue was not a software deficiency since the program used to get
the reading from the raw data was written and gave results identical to the original detector
software. This observation, coupled with variation in the data, suggests a hardware deficiency.
The detector is thought to be an AC coupled device since the program appears to average the
data it receives to 0 when the parameters are changed. Taken together, this evidence suggests a
problematic user manual description of the detector integration time. Further experiment with the
timing will allow the determination of the integration time for the whole range of frequencies
studied.

Gilles Dongmo – Momo
18 | P a g e
Even though a full understanding of the data collected was not achieved, an understanding of its
functions and data treatment methods was engaged. With no other candidate for its replacement,
understanding the detector’s operating scheme is a big step toward the completion of the Infrared
spectrometer.
The integration time determination is crucial for the data acquisition phase of the project, and
will be a major focus of future work with the detector. The calibration of the sensors depends
greatly on the amount of signal collected by the detector, and the right timing must be
determined to optimize the reliability of the data.

Gilles Dongmo – Momo
19 | P a g e
Acknowledgement:
I would like to thank Josef Frisch for being an outstanding mentor; Alan Fisher for his
tremendous help and support throughout the project; Mark Petree and Georges Burgess for their
assistance in the laboratory work; Stephen Rock for directing the program, all SULI students for
the social environment with which they surrounded program. I would also like to thank the
department of energy for funding the Science undergraduate Laboratory Internship. Finally,
thanks to the SLAC national laboratory and Stanford University for hosting the program.
References:
[1]Josef Frisch, Tonee Smith, et al, Accelerator physics and engineering update, (Jan 6, 2011) Department updates [2] C. Behrens, A. F. Design of a single-shet prismspectroeter in the near infrared and mid infrared wavelength range for ultra-short Bunch Length diagnostics. DIPAC'11, Hamburg, Germany, 201 [3] Williams, K.(2011). Optical Design of a Broadband Infrared Spectrometer for Bunch Length Measurement at the Linac Coherent Light Source [4] Cass, J. (2011). Simulations and Analysis of an Infrared Prism Spectrometer for Ultra-short Bunch Length Diagnostics at the Linac Coherent Light Source. [5]Alan Fisher, From LCLS to LHC: Light from Electrons, Protons, even Lead ions, (jan 6, 2011) LHC Synchrotron Light monitor, THz studies, Alan Fisher. [6] Lead Zirconate Titanate http://en.wikipedia.org/wiki/PZT [7]Tim Chamberlain, (. (2009, december). Thin Film Pyroelectric. Retrieved july 2011, from Pyreos.com: http://www.pyreos.com/images/docs/PYDK_LAS_Demo_Kit_User_Guide__JWrelease_Jan2010.pdf [8]Tim Chamberlain, (n.d.). www.pyreos.com. Retrieved july 1, 2011, from Pyreos Ltd: http://pyreos.com/products/line-sensors.html

Design & Fabrication of a High-Voltage Photovoltaic Cell
Jennifer Felder
Office of Science, Science Undergraduate Laboratory Internship (SULI)
North Carolina State University
SLAC National Accelerator Laboratory
Menlo Park, CA
12 August 2011
Prepared in partial fulfillment of the requirements of the Office of Science, Department of
Energy’s Science Undergraduate Laboratory Internship under the direction of Chris Kenney
at the Particle Physics and Astrophysics (PPA) Division of SLAC National Accelerator
Laboratory.
Participant:
Signature
Research Advisor:
Signature
SLAC-TN-12-021
Work supported by US Department of Energy contract DE-AC02-76SF00515.

TABLE OF CONTENTS
Abstract ii
Introduction 1
Methods 3
Results 7
Discussion 8
Conclusion 10
Acknowledgments 10
References 11
i

ABSTRACT
Design & Fabrication of a High-Voltage Photovoltaic Cell. JENNIFER FELDER (North
Carolina State University, Raleigh, NC 27615) CHRIS KENNEY (Particle Physics and As-
trophysics (PPA) Division of SLAC National Accelerator Laboratory, Menlo Park, CA 94025)
Silicon photovoltaic (PV) cells are alternative energy sources that are important in sus-tainable power generation. Currently, applications of PV cells are limited by the low outputvoltage and somewhat low efficiency of such devices. In light of this fact, this project inves-tigates the possibility of fabricating high-voltage PV cells on float-zone silicon wafers havingoutput voltages ranging from 50 V to 2000 V. Three designs with different geometries ofdiffusion layers were simulated and compared in terms of metal coverage, recombination,built-in potential, and conduction current density. One design was then chosen and opti-mized to be implemented in the final device design. The results of the simulation serve as afeasibility test for the design concept and provide supportive evidence of the effectiveness ofsilicon PV cells as high-voltage power supplies.
ii

INTRODUCTION
Background Information
Solar photovoltaic (PV) energy is produced by converting light energy to electrical en-
ergy. The energy of light, composed of photons, is determined by the color and therefore
frequency of that light. As explained by the photoelectric effect, when the energy of that
light is high enough, it excites the electrons on the surface of a material, causing them to
move to a higher energy level. While in normal materials these excited electrons return
to their original state relatively quickly, in photovoltaic devices these excited electrons are
driven to create a current; this is known as the photovoltaic effect. The electrons do not
return to their lower energy state because of an asymmetry that is inherent to this type of
materials, and a potential difference is created. PV cells are developed to take advantage of
this effect, and thus have a unique functionality: they conduct as diodes in a dark environ-
ment and in light they gain a charge, producing a photovoltage. [1]
One distinguishing feature of the PV device designed in this project is that it is fabri-
cated on float-zone silicon wafers. There are two processes typically used to fabricate silicon
wafers, namely the float-zone and Czochralski methods. Both processes extract a single
crystal as the final product; however, the Czochralski does so using a melt from which the
crystal is extracted directly, while the float-zone technique passes a liquid phase through a
polycrystalline rod. Using the float-zone method provides several advantages, in particular
the fact that the wafers have fewer impurities, which improves the performance of the final
device. However, there also exists a tradeoff in using this method: the wafers are much more
expensive than those prepared using other methods. [1]
This PV device also has a comparative advantage in terms of efficiency, as a result
of the application for which it was developed. The device was designed to act as a power
source for the Enriched Xenon Observatory (EXO) experiment. The thickness of the ma-
1

terial, surrounding temperature, and wavelength of the incident light all contribute to the
efficiency of a PV device. Because the environment of the experiment is known and rela-
tively constant, the surrounding temperature and wavelength of the light to be converted to
electrical energy is known. The PV cell can therefore be designed to absorb light near the
peak in its absorption spectrum, increasing the efficiency of the device.
Prior Work: Silicon Solar Cells in the Past Decade
In the past decade in particular, efforts have been made to significantly increase the
efficiency, and therefore utility, of PV devices. A twenty-four percent efficient silicon solar
cell was achieved by altering the design of such cells in several ways. First, the silicon cell
was covered in a layer of SiO2; this reduced the recombination losses at the surface of the
cell covered in oxide. Second, the surface was textured with an inverted pyramid pattern,
reducing external light reflection of the top cell surface and increasing the internal light
reflection of the rear cell surface. This increased the ability of the cell to absorb infrared
light. Finally, the addition of a double layer antireflection coat composed of a MgF2/ZnS
compound decreased the reflective losses of the cell. [2]
Another promising advance in this area of research was made by using an alternate
texturing pattern on the cell surface. Instead of the previously described inverted pyramid
scheme, cells have also been fabricated with a honeycomb pattern, which consists of wells in
the shape of hemispheres aligned adjacently on the cell surface. This, when combined with
the previously described technique of covering the cell in oxide, increased the efficiency of
monocrystalline cells from 24.0% to 24.4% and of multicrystalline cells from 18.6% to 19.8%.
The symmetric pattern, while reducing the angle and height of surface features, allowed
for more internal reflection; more light was absorbed by the cell, increasing its efficiency at
wavelengths that are more difficult for PV devices to absorb. [3]
2

Motivation & Purpose
While solar cells have been fabricated with success for some time, their applications are
still limited. These limiting factors include the low output voltage and somewhat low effi-
ciency typical PV devices yield. This project aims to explore producing a single PV device
having an output voltage up to 2000 V. Such a high-voltage DC power supply could sub-
stantially improve the utility of renewable energy sources such as silicon solar cells.
This high-voltage PV device was designed to be a power source for the EXO experi-
ment. The goal of this experiment is to use the 136 isotope of Xenon to observe neutrinoless
double beta decay. While it has not yet been observed, being able to observe this process
would lead to two major discoveries: discerning whether the neutrino is its own antiparticle
and measuring the half-life of the neutrinoless double-beta decay process, which would help
in estimating the mass of the neutrino. The experiment also has importance in improving
the current limit on the neutrino mass estimate. [4]
METHODS
Design Process
In beginning the mask design process, a list of features necessary for the PV cell was first
developed. These features included both fabrication test features and device features. The
purpose of the fabrication tests included in the design was to verify the functionality of the
following aspects of the device: the conductivity of the metal, the conductivity of the N and
P diffusion layers, the contact between both the metal and N diffusion layer and the metal
and P diffusion layer, diode functionality, trench hopping and the field oxide etch and glass
etch patterns. Each of these aspects required a separate fabrication feature, as this allows
the various properties of the device to be tested independently of one another. In this way,
if the final PV cell does not work properly after fabrication, it will be relatively easier to
3

determine the failing feature and to diagnose and fix the problem.
Once the fabrication test features were designed, the design of the actual PV device
was developed. High voltage PV cells were designed having dimensions of both 50 µm
and 100 µm per side. Three main cell designs were developed for the mask, each having
a different geometry of the diffusion layers; these designs for the 100 µm square cell are
included in Figure 1. In this figure, the bright green layer is the field oxide (trench) etch
pattern, the orange is the diffusion-to-metal contact, the light green is the N-type diffusion,
and the pink is the P-type diffusion layer. Different devices were designed to produce various
output voltages ranging from 50 V to 2000 V. To determine how many cells were needed in
each module for a desired output voltage, several parameters of the silicon PV cells had to
be calculated.
The intrinsic doping concentration, ni, of the substrate, silicon, is known to be ap-
proximately 1010 cm−3, which was included as the theoretical value in Table 3. Next, the
built in potential, φj, of the individual PV cell was calculated using Equations 1 and 2, in
which NA and ND are the active acceptor and donor dopant concentrations respectively, and
VT is the thermal voltage of a material at a specific temperature, in this case of silicon at
300 K.
φj =kT
qln(NAND
n2i
)(1)
VT =kT
q= 0.0259V (2)
Finally, the depletion width, ωdo, of the cell was calculated using Equation 3 and
Equation 4; here εs represents the permittivity of a material, which in this case is silicon,
and q is the charge of an electron.
4

ωdo =
√2εsq
( 1
NA
+1
ND
)φj (3)
εs = εoεr (4)
Table 1 shows the actual variable values used to calculate the parameters of the PV
device. The resulting calculated parameters of the PV device, defined in the formulae above,
were then calculated to produce theoretical results for those cell parameters.
The calculated built-in voltage of the PV cell was used to calculate how many cells
connected in series were needed to produce various output voltages. Each module has a
square geometry; therefore, the next largest perfect square to the number of cells needed
was chosen to determine the size of each module. The number of cells in each PV cell is
summarized in Table 2.
Different layouts of the cells were also considered, including linear, circular, and hexag-
onal designs. Several features were added to the PV device, including the ability to bypass
a particular cell, connections for external switches, and side-entrance photo switches. By-
pass diodes were necessary because of the series connections between individual cells: if one
failed, the entire device may not function. Therefore, adding bypass diodes prevents the
entire device from failing in the event of an individual cell failing. [1]
Simulation Process
The PV device was designed in software first to test the various parameters of the designs
being considered. Three basic designs for the individual PV cells were first simulated; each
had a different geometry of the diffusion layer, matching those in the mask design, with
all other parameters being equal. These simulated cell designs are shown in Figure 2. In
5

this figure, dark green layer is the support wafer, light green is the Silicon-On-Insulator
(SOI) layer, red is the N-type diffusion, and blue is the P-type diffusion. The main purpose
of the simulation process was to assess the performance of each design with respect to
a few parameters. The first parameter that was examined was the Shockley-Read Hall
(SRH) recombination. As recombination limits the current generation capability of the cell,
having low recombination is desirable. Another factor of each cell design that was modeled
was the built-in potential. The doping geometry that maximizes the built-in potential is
more advantageous, as it would require fewer individual cells to produce a given voltage,
reducing the size of the overall device. Finally, the conduction current of each design was
also studied, especially in the region between the N-type and P-type diffusion areas. Using
these parameters, the three main designs were compared, to determine which geometry of
the dopants provided optimal performance.
After examining the simulated performance, the design shown in Figure 2(c) was
chosen to be implemented in the actual PV device, and so some parameters were then
adjusted to optimize the performance of that particular design, leading to a fourth cell design.
All of the wafers on which the PV devices were to be fabricated had N-type substrates. For
this reason, any N-type doped layers would simply function as ohmic contacts. Therefore,
the area of P-type dopant was maximized. The minimum area of the N-type dopant and
of the distance between the two dopant types was mainly determined by the limitation in
precision of the alignment equipment used to align the mask to the wafer.
Fabrication Process
This high-voltage PV cell is being fabricated at the Stanford Nanofabrication Facility.
The first step was to remove impurities from and oxidize the wafers on which the PV cells
were to be fabricated. To do so, the wafers went through the following wet-etch procedure.
• 20 minutes in 9:1 H2SO4 : H2O2 mixture; rinsed with deionized water; dried with a
6

spin dryer
• 10 minutes in a 4:1 H2SO4 : H2O2 bath to remove organic particles; deionized water
rinse
• 30 seconds in a 50:1 HF mixture for oxide etching; rinsed with deionized water
• 10 minutes in 5:1:1 H2O:H2O2:HCl bath to remove metal ions; rinsed with deionized
water; cycle through spin dryer
• Oxidation process: WET 850 Tylan process [5]; variable time set to 20 minutes
With the oxidation process complete, there are still several steps that need to be
completed to finish fabricating the device. Thus far, only the first step of the fabrication
process has been completed; device fabrication and testing will be continued in future work.
RESULTS
Three parameters of the individual PV cell were calculated, as previously described;
these calculated values comprise the theoretical results of those cell parameters. These
same properties were measured using the simulation software, to assess the validity of the
calculated values and provide a more extensive theoretical basis on which to judge the final
device. These results are summarized in Table 3. As shown in the table, the calculated and
simulated values agree fairly closely, within a margin of error. This adds credibility both
to the calculations and simulation results. As measuring ωdo directly in the simulation was
only possible by estimating a value off of a plot, Equation 3 was used with the value of φj
measured from the simulation to get a more precise value for comparison.
In addition to the three basic parameters of each cell that were calculated, other
factors of a PV cell are critical to the device performance, yet cannot be easily or directly
7

calculated by hand. For this type of properties, simulation is imperative to comparing
different designs. One such factor is the SRH recombination of the simulated cells. An ideal
PV cell would have minimal recombination, which limits the output current of the cell. The
SRH recombination plots for the various designs are included in Figure 3.
Another property of PV cells that was simulated was the conduction current density.
A functional cell needs conduction between contacts on the N and P diffusion layers; there-
fore the conduction current density is expected to be higher between contacts and minimal
elsewhere. It is also desirable to have higher conduction current on the surface of the cell, as
it is that portion of the device that is designed to be conductive. The plots of the conduction
current density for each design are shown in Figure 5.
To simulate the operation of the cell as a photovoltaic device, several parameters had
to be specified. To effectively simulate the environment in which this device could potentially
operate, the optical generation of the device was set to 1018 cm−3s−1. The diffusion implants
in the actual PV cell are approximately 2 µm deep; assuming a Gaussian distribution with a
peak value of 1019 cm−3 of the diffusion layer, the standard deviation was adjusted to achieve
this in the simulation. Finally, to bias the cell to 0 V, a resistive contact with a value of 105
Ω was connected to the diffusion contacts.
DISCUSSION
Some properties of the individual cells are easier to compare in the mask designs, while
others are more evident in simulation. When designing the mask for the PV cells, enough
metal has to be placed on the cell to provide adequate contact to the diffusion layers, to
create a strong electrical contact. However, the area of the cell covered by metal should be
minimal, as metal prevents light from being absorbed by the cell. Comparing the layout
designs in Figure 1, it is clear that the design in Figure 1(c) has the best performance in
8

minimizing the area of metal coverage.
Several trends emerge from examining the simulation results of the four designs. In
all of the designs the SRH recombination is higher in the area between the two diffusions.
As recombination limits the output of a PV cell, the area with high recombination should
be minimized. The optimized design has the least area between diffusions, and therefore
the most desirable recombination profile, as shown in Figure 3(c). In contrast, the design in
Figure 3(a) shows the greatest amount of recombination in its profile.
The designs were also compared in terms of built-in potential. Comparing the built-in
potential simulation plots for each device in Figure 4, the potential does not vary more than
0.01 V between designs. This is an important factor when comparing cells, as the built-in
potential determines how many cells are needed to produce a given output voltage, which
determines the size of the overall device. However, in this case, the built-in potential for all
designs compared is the nearly same, as expected because the built-in potential is only de-
pendent upon the doping concentrations and intrinsic concentration of the substrate, which
is constant for all devices. This is therefore not a determining factor in choosing a cell design.
Finally, the conduction current density was compared among designs. A higher con-
duction current is expected between diffusion contacts: the current generated in the cell must
flow between the contacts to be an effective power source. As the area of the designs being
compared is constant, the design with the best conduction current density profile can be
assumed to have the most ideal conduction current profile as well. The design in Figure 5(c)
has the most favorable profile; in contrast, Figure 5(a) has the least ideal conduction current
properties.
9

CONCLUSION
Based on the comparisons drawn among the different cell designs, a design was chosen
to be implemented in the PV device. Because it had minimal metal coverage, an acceptable
conduction current density profile, and the lowest recombination rate among the designs,
the design shown in Figure 2(d) was chosen to be implemented in the mask design.
There are several important implications that arise from this project. The design and
particularly the simulation portion of this project serve as a feasibility test for the concept
of high-voltage PV cells. While the final fabrication of the high-voltage PV device has not
yet been completed, the preliminary results of the simulations support the theory of such
a device having practical functionality. Once the device is fabricated and tested, further
conclusions as to the possibility of implementing PV devices in a wider range of applications
will be assessed.
There are many applications of this technology and future work to be done on this
specific project. The first step in continuing this research is to finish fabricating the PV
device. After fabrication, the device will be tested to assess its functionality. Its effectiveness
at producing the desired output voltage will be determined, to conclude the feasibility of
such a device to be used as a high-voltage DC power supply. In addition to having an impact
on scientific experiments such as EXO and other work at SLAC, society could also benefit if
such devices were implemented on a large scale.
ACKNOWLEDGMENTS
This work was funded by the United States Department of Energy and the SLAC National
Accelerator Laboratory Science Undergraduate Laboratory Internship (SULI) program. In
addition, I would like to thank Chris Kenney, Astrid Tomada, Jasmine Hasi, and Julie Segal
for the opportunity to conduct this research, for training me in the nanofabrication facility,
10

and for helping in many ways throughout the project. Finally, I would like to acknowledge
the contribution of Sentaurus Synopsis simulation software to this project.
REFERENCES
[1] J. Nelson, The Physics of Solar Cells. London: Imperial College Press, 2003. 7 July
2011.
[2] J. Zhao, A. Wang, P. Altermatt, and M. A. Green, “Twenty-four percent efficient
silicon solar cells with double layer reflection coatings and reduced resistance loss,” Applied
Physics Letters, vol. 66, pp. 3636-3638, 26 June 1995.
[3] J. Zhao, A. Wang, M. A. Green, and F. Ferrazza, “19.8% efficient “honeycomb”
textured multicrystalline and 24.4% monocrystalline silicon colar cells,” Applied Physics
Letters, vol. 73, num. 14, pp. 1991-1993, 5 October 1998.
[4] Enriched Xenon Observatory, “EXO: About the Experiment,” 20 August 2010, http:
//www-project.slac.stanford.edu/exo/ .
[5] Stanford Nanofabrication Facility, “WET850 Tylan Recipe,” http://snf.stanford.edu/
Equipment/tylanrecipes/wet/WET850 .
11

FIGURES
(a) (b)
(c)
Figure 1: Mask Design of Individual PV Cells for (a) Design 1, (b) Design 2, and (c) Design3
12

(a) (b)
(c) (d)
Figure 2: Doping Profile Simulation Plots for (a) Design 1, (b) Design 2, and (c) Design 3
13

(a) (b)
(c) (d)
Figure 3: SRH Recombination Simulation Plots for (a) Design 1, (b) Design 2, and (c)Design 3
14

Figure 4: Electrostatic Potential Plots of Design 4, Optimized Design 3
15

(a) (b)
(c) (d)
Figure 5: Conduction Current Density Simulation Plots for (a) Design 1, (b) Design 2, and(c) Design 3
16

TABLES
Parameter Value UnitsNA 2 · 1015 (1019) cm−2 (cm−3)ND 2 · 1015 (1019) cm−2 (cm−3)µn 1300 cm2/V·cmµp 440 cm2/V·cmρ 10 kΩ · cmεr 11.7εo 8.85 · 10−14 F
cm
q 1.609 · 10−19 C
Table 1: Values of Various Parameters Used in the Calculations In Equations 1-6
Output Voltage (V) Cells Needed Sq. Matrix Actual Number Cells50 52 8 x 8 64100 104 11 x 11 121200 207 15 x 15 225500 516 23 x 23 5291000 1,031 33 x 33 1,0892000 2,062 46 x 46 2,116
Table 2: Summary of Cells Needed in PV Cell Modules to Produce Given Output Voltages
Parameter Theoretical Value Simulated Value Unitsni 1.01 · 1010 1.5 · 1010 cm−3
ωdo 0.0166 0.01580 µmφj 1.07 0.970 V
Table 3: Values of Calculated & Simulated Parameters of PV Cell
17

Dark Photon Search at BABAR
Ross N. Greenwood
Office of Science, Science Undergraduate Laboratory Internship (SULI)
Massachusetts Institute of Technology
Stanford National Accelerator Laboratory
Stanford, CA
August 12, 2011
Prepared in partial fulfillment of the requirements of the Office of Science, Department
of Energy’s Science Undergraduate Laboratory Internship under the direction of Arafat
Gabareen Mokhtar at the Stanford National Accelerator Laboratory.
Participant:
Signature
Research Advisor:
Signature
SLAC-TN-12-023
Work supported by US Department of Energy contract DE-AC02-76SF00515.

TABLE OF CONTENTS
Abstract ii
Introduction 1
Materials and Methods 2
Discussion and Outlook 6
Acknowledgments 6
i

ABSTRACT
Dark Photon Search at BABAR. ROSS N. GREENWOOD (Massachusetts Institute of Tech-
nology, Cambridge, MA 02139) ARAFAT GABAREEN MOKHTAR (Stanford National Ac-
celerator Laboratory, Stanford, CA 94025)
Presented is the current progress of a search for the signature of a dark photon or new
particle using the BaBar data set. We search for the processes e+e− → γISRA′, A′ → e+e−
and e+e− → γISRγ, γ → A′, A′ → e+e−, where γISR is an initial state radiated photon of
energy Eγ >= 1 GeV. Twenty-five sets of Monte Carlo, simulating e+e− collisions at an
energy of 10.58 GeV, were produced with different values of the A’ mass ranging from 100
MeV to 9.5 GeV. The mass resolution is calculated based on Monte Carlo simulations. We
implement ROOT’s Toolkit for Multivariate Analysis (TMVA), a machine learning tool that
allows us to evaluate the signal character of events based on many of discriminating variables.
TMVA training is conducted with samples of Monte Carlo as signal and a small portion of
Run 6 as background. The multivariate analysis produces additional cuts to separate signal
and background. The signal efficiency and sensitivity are calculated. The analysis will move
forward to fit the background and scan the residuals for the narrow resonance peak of a new
particle.
ii

INTRODUCTION
Based on observational evidence from astronomical surveys of the internal motions of distant
galaxy clusters, it is believed that electromagnetically interacting matter contributes to only
about 4% of the mass-energy of the universe. Current theory suggests that the remainder is
made up of two additional components in a ratio of approximately three to one, respectively:
dark energy, which is responsible for accelerating the metric expansion of space, and dark
matter - nonbaryonic matter particles with nonzero mass (inferred from its gravitational
effects on nearby visible matter) that may experience the weak or strong nuclear forces, or
yet undiscovered interactions.
One candidate constituent of dark matter is a theoretical dark photon (symbol: A′).
The dark photon is a massive, weakly interacting boson whose existence is postulated in
models of supersymmetry [2]. It may serve as the force-carrying gauge boson for particle
interactions unique to the dark sector, or even provide a means for interaction between
dark matter and Standard Model particles. Theory suggests the possibility of dark photon
production in electron-positron annihilation events. By the process e+e− → A′ → f+f−,
the electron-positron pair may annihilate directly to a dark photon, which would decay to a
fermion pair. Alternatively, the e+e− pair annihilates to a virtual Standard Model photon,
which produces a dark photon via an intermediate virtual fermion loop [2].
The BaBar experiment (1999 - 2008) recorded asymmetric collisions of electrons and
positrons supplied by the linear accelerator at the SLAC National Accelerator Laboratory.
BaBar focused on the study of CP violation by production of B mesons, hadrons containing
a quark and an anti-quark of which one has bottom quark flavor (b or b). B mesons can be
produced during the decay of the Υ (4S) (bb) meson. During Runs 1-6, collisions took place
at center-of-mass energies corresponding to the masses of Υ (4S). The collision energy was
tuned to the masses of the Υ (2S) and Υ (3S).
1

We searched the BABAR data set for evidence of a dark photon or a new particle, probing
a mass range from 100 MeV to 9.5 GeV. Events featuring e+e− annihilation preceded by
emission of an energetic photon (Eγ >= 1 GeV) from either particle were selected. By
requiring initial state radiation (ISR), we access a range of values for the relativistic mass
mee of the e+e− system at the collision event. The main background process (those with
the same final state as the sample) are radiative Bhabha scattering (e+e− → γISRe+e−) and
two-photon production (e+e− → γISRe+e−γγ, γγ → e+e−) where one of the e+e− pairs goes
undetected.
If a dark photon exists and we implement the appropriate selection criteria, the particle
will manifest in the data as a narrow resonance peak in the candidate event count plotted
against the e+e− invariant mass. In this analysis, the significance is optimized as
S√B + 3
2
, where S is the number of signal events and B is the number of background events. We begin
with a blind analysis using a small portion of the available data, composed of events with a
dielectron mass corresponding to the Υ (4S) resonance (10.58 MeV/c2). After perfecting our
optimization techniques, we will unblind the analysis to include all compatible data from
Runs 1-7.
MATERIALS AND METHODS
Twenty-five Monte Carlo simulation production (SP) modes with discrete dark photon gen-
erated mass values ranging from 100 MeV to 9.5 GeV were produced. Bhabha scattering
and two-photon production were also simulated. Two terms are used to describe the mass
with respect to Monte Carlo simulations: the generated mass is a parameter submitted to
the event generator as the true mass of the simulated dark photon with a resonance of zero
2

width; the reconstructed mass is the invariant mass of the e+e− system calculated from the
kinematics of the generated event and simulated to account for detector resolution.
We began with a data set containing approximately 2.3% of Run 6, which contains events
with pre-ISR mee tuned to the Υ (4S) mass of 10.58 GeV. We require at least two e tracks
and one photon with energy greater than 1 GeV in the final state. Up to ten additional
photons are allowed with energies less than 100 MeV. If multiple candidate pairs of e tracks
are available, the pair with the best vertex fit (best χ2) is selected, such that there is only one
candidate e+e− pair per event. Our analysis is focused on dark photon events with an e+e−
final state, though µ+µ−, π+π−, and e±µ∓ final states are also considered for the purpose of
understanding the background.
The analysis thus far can be summarized in the following steps:
1. Resolution σ(m)
Quantify the spread of the reconstructed dark photon mass produced by a Monte Carlo
simulation.
2. Multivariate Analysis (MVA)
ROOT’s Toolkit for Multivariate Analysis (TMVA) package is a machine learning tool
that allows us to evaluate the most likely character of events (signal vs. background)
based on many discriminating variables [1]. Train a TMVA program to recognize signal
events by comparing sample signal events generated in Monte Carlo simulations to the
sample background, a small portion of Run 6.
3. Signal efficiency ǫ(m)
Determine the rate of successful reconstruction of events generated in Monte Carlo.
4. Sensitivity
Predict the potential discovery.
3

Resolution
The reconstructed mass histogram for each Monte Carlo mode was fit to the sum of two
Crystal Ball functions. The widths and means of the two functions are set equal, but the
exponential tails are on opposite sides and otherwise free to vary. The histograms and fits
are found in Figure 1. The width is considered as the resolution at the mean value of the
mass. The twenty-five resolution values were plotted with the generated mass of each Monte
Carlo mode and fit to a third order polynomial.
Multivariate Analysis
We used TMVA to characterize events based on nine variables:
[Unless otherwise stated, kinematic calculations were performed in the center-of-momentum
frame of the e+e− system after initial state radiation.]
• EXUnc : Unconstrained total energy of γISRe+e− calculated in the laboratory frame
• PTX : Transverse momentum of γISRe+e−
• XvtxProb : Vertex probability
• e2cms : Energy of the 2nd highest energy photon
• apl : Positive cosine angle between γISR and the plane defined by the lepton tracks
• mmiss2 : Squared missing mass
• costhmiss : Cosine polar angle of the missing momentum vector
• thglfCM : Angle between γISR and the fastest e track
• thfCM : Polar angle of the e− track
4

The TMVA classification methods employed in this analysis are Boosted Decision Tree
(BDT), Likelihood, and Fisher. An assessment of each method’s performance based on
signal efficiency and background reduction, sampled in Figure 3, identified BDT as the
most successful classifier. We ran a separate TMVA analysis for each Monte Carlo mode,
and interpolated the results to produce a continous function of the BDT output parameter
mvaBDT for the full range of mee.
To determine the most appropriate cut on mvaBDT , we used the well understood J/ψ
resonance peak as a reference. We varied the mimimum mvaBDT value in a cut of the Run
6 background and fit the region of the J/ψ to the stum of a Gaussian and a linear function
using the RooFit package in ROOT. We then calculated the signal-to-background ratio of
the J/ψ peak. The data and fits are shown in Figure 4 and the results summarized in
Figure 5. We found the cut mvaBDT > 0.2 to produce the best signal-to-background ratio
while maintaining an acceptable level of signal retention.
Signal Efficiency
The efficiency was calculated for each Monte Carlo simulation as the ratio of the number of
reconstructed events to the number of generated events. The results are plotted in Figure 7.
ǫ(mee) =Nrec
Ngen
. (1)
Sensitivity
The sensitivity was calculated as the expected error on the branching ratio σBR, the fraction
of the total e+e− annihilation cross section that includes dark photon production, corre-
sponding to a 5σ discovery.
σBR =5√
α ·Nbkg(m)
ǫ(m) ·Nee
(2)
5

α is the ratio of the number of events in Runs 1-7 to the number of events in Run 6. Nbkg
is the number of background events with reconstructed masses close tomee, within 1.5σ(mee),
where σ(mee) is the resolution. Nee is the total number of electron-positron collision events
in Runs 1-7.
DISCUSSION AND OUTLOOK
In summary, we have made significant progress in a search for a dark photon signature using
the BABAR data set, calculating the simulated resolution, establishing cuts based on multi-
variate analysis, determining our signal efficiency, and predicting the sensitivity. However,
the analysis is still underway, and has yet to produce conclusive results. The next step is to
fit the reconstructed mee distribution. We will first fit the background, including recognized
features (i.e. J/ψ) and assuming that no other signal is present. We will then iterate through
the range of possible reconstructed A’ masses, attempting to fit to a double sided Crystal
Ball function at each mass value on top of the background. We aim to produce a measure of
the likelihood that a discovery resonance peak sits atop the background at that mass value.
Finally, we will unblind the analysis to include all available BABAR data from Runs 1-7.
ACKNOWLEDGMENTS
I would like to thank my project mentor Arafat Gabareen Mokhtar for his genuine effort
and guidance during my two months at SLAC. I would also like to thank the SULI staff
for their hard work in making the program an unforgettable success: Stephen Rock, Maria
Mastrokyriakos, and Anita Piercey. Finally, my fellow SULI students have greatly enriched
the other aspects of my summer life, and I greatly value their friendship.
6

REFERENCES
[1] M. Backes, et al. Toolkit for Multivariate Analysis in ROOT, User’s Guide. European
Organization for Nuclear Research (CERN). (2009).
[2] R. Essig, et al. ”Probing dark forces and hidden light sectors at low-energy e+e− collid-
ers.” SLAC National Accelerator Laboratory. (2009).
7

FIGURES
)2 (GeV/cGenee-mRec
eem-0.02 0 0.02
Even
ts /
( 0.0
01 )
0
2000
4000
6000
8000
10000
)2 (GeV/cGenee-mRec
eem-0.02 0 0.02
Even
ts /
( 0.0
01 )
0
2000
4000
6000
8000
10000
)2 (GeV/cGenee-mRec
eem-0.02 0 0.02
Even
ts /
( 0.0
01 )
0
2000
4000
6000
8000
10000
12000
14000
16000
)2 (GeV/cGenee-mRec
eem-0.02 0 0.02
Even
ts /
( 0.0
01 )
0
2000
4000
6000
8000
10000
12000
14000
16000
)2 (GeV/cGenee-mRec
eem-0.02 0 0.02
Even
ts /
( 0.0
01 )
0
2000
4000
6000
8000
10000
12000
)2 (GeV/cGenee-mRec
eem-0.02 0 0.02
Even
ts /
( 0.0
01 )
0
2000
4000
6000
8000
10000
12000
)2 (GeV/cGenee-mRec
eem-0.02 0 0.02
Even
ts /
( 0.0
01 )
0
2000
4000
6000
8000
10000
12000
14000
16000
)2 (GeV/cGenee-mRec
eem-0.02 0 0.02
Even
ts /
( 0.0
01 )
0
2000
4000
6000
8000
10000
12000
14000
16000
)2 (GeV/cGenee-mRec
eem-0.02 0 0.02
Even
ts /
( 0.0
01 )
0
1000
2000
3000
4000
5000
6000
7000
8000
)2 (GeV/cGenee-mRec
eem-0.02 0 0.02
Even
ts /
( 0.0
01 )
0
1000
2000
3000
4000
5000
6000
7000
8000
)2 (GeV/cGenee-mRec
eem-0.02 0 0.02
Even
ts /
( 0.0
01 )
0
1000
2000
3000
4000
5000
6000
7000
8000
9000
)2 (GeV/cGenee-mRec
eem-0.02 0 0.02
Even
ts /
( 0.0
01 )
0
1000
2000
3000
4000
5000
6000
7000
8000
9000
)2 (GeV/cGenee-mRec
eem-0.02 0 0.02
Even
ts /
( 0.0
01 )
0
1000
2000
3000
4000
5000
6000
7000
8000
)2 (GeV/cGenee-mRec
eem-0.02 0 0.02
Even
ts /
( 0.0
01 )
0
1000
2000
3000
4000
5000
6000
7000
8000
)2 (GeV/cGenee-mRec
eem-0.02 0 0.02
Even
ts /
( 0.0
01 )
0
2000
4000
6000
8000
10000
12000
)2 (GeV/cGenee-mRec
eem-0.02 0 0.02
Even
ts /
( 0.0
01 )
0
2000
4000
6000
8000
10000
12000
)2 (GeV/cGenee-mRec
eem-0.02 0 0.02
Even
ts /
( 0.0
01 )
0
1000
2000
3000
4000
5000
6000
7000
)2 (GeV/cGenee-mRec
eem-0.02 0 0.02
Even
ts /
( 0.0
01 )
0
1000
2000
3000
4000
5000
6000
7000
)2 (GeV/cGenee-mRec
eem-0.02 0 0.02
Even
ts /
( 0.0
01 )
0
2000
4000
6000
8000
10000
)2 (GeV/cGenee-mRec
eem-0.02 0 0.02
Even
ts /
( 0.0
01 )
0
2000
4000
6000
8000
10000
)2 (GeV/cGenee-mRec
eem-0.02 0 0.02
Even
ts /
( 0.0
01 )
0
2000
4000
6000
8000
10000
)2 (GeV/cGenee-mRec
eem-0.02 0 0.02
Even
ts /
( 0.0
01 )
0
2000
4000
6000
8000
10000
)2 (GeV/cGenee-mRec
eem-0.02 0 0.02
Even
ts /
( 0.0
01 )
0
2000
4000
6000
8000
10000
)2 (GeV/cGenee-mRec
eem-0.02 0 0.02
Even
ts /
( 0.0
01 )
0
2000
4000
6000
8000
10000
)2 (GeV/cGenee-mRec
eem-0.02 0 0.02
Even
ts /
( 0.0
01 )
0
1000
2000
3000
4000
5000
6000
)2 (GeV/cGenee-mRec
eem-0.02 0 0.02
Even
ts /
( 0.0
01 )
0
1000
2000
3000
4000
5000
6000
)2 (GeV/cGenee-mRec
eem-0.02 0 0.02
Even
ts /
( 0.0
01 )
0
1000
2000
3000
4000
5000
6000
7000
8000
9000
)2 (GeV/cGenee-mRec
eem-0.02 0 0.02
Even
ts /
( 0.0
01 )
0
1000
2000
3000
4000
5000
6000
7000
8000
9000
)2 (GeV/cGenee-mRec
eem-0.02 0 0.02
Even
ts /
( 0.0
01 )
0
1000
2000
3000
4000
5000
6000
7000
8000
9000
)2 (GeV/cGenee-mRec
eem-0.02 0 0.02
Even
ts /
( 0.0
01 )
0
1000
2000
3000
4000
5000
6000
7000
8000
9000
)2 (GeV/cGenee-mRec
eem-0.02 0 0.02
Even
ts /
( 0.0
01 )
0
1000
2000
3000
4000
5000
6000
7000
8000
)2 (GeV/cGenee-mRec
eem-0.02 0 0.02
Even
ts /
( 0.0
01 )
0
1000
2000
3000
4000
5000
6000
7000
8000
)2 (GeV/cGenee-mRec
eem-0.02 0 0.02
Even
ts /
( 0.0
01 )
0
500
1000
1500
2000
2500
3000
3500
4000
4500
)2 (GeV/cGenee-mRec
eem-0.02 0 0.02
Even
ts /
( 0.0
01 )
0
500
1000
1500
2000
2500
3000
3500
4000
4500
)2 (GeV/cGenee-mRec
eem-0.02 0 0.02
Even
ts /
( 0.0
01 )
0
1000
2000
3000
4000
5000
6000
7000
8000
)2 (GeV/cGenee-mRec
eem-0.02 0 0.02
Even
ts /
( 0.0
01 )
0
1000
2000
3000
4000
5000
6000
7000
8000
)2 (GeV/cGenee-mRec
eem-0.02 0 0.02
Even
ts /
( 0.0
01 )
0
1000
2000
3000
4000
5000
6000
7000
8000
)2 (GeV/cGenee-mRec
eem-0.02 0 0.02
Even
ts /
( 0.0
01 )
0
1000
2000
3000
4000
5000
6000
7000
8000
)2 (GeV/cGenee-mRec
eem-0.02 0 0.02
Even
ts /
( 0.0
01 )
0
1000
2000
3000
4000
5000
6000
7000
8000
)2 (GeV/cGenee-mRec
eem-0.02 0 0.02
Even
ts /
( 0.0
01 )
0
1000
2000
3000
4000
5000
6000
7000
8000
)2 (GeV/cGenee-mRec
eem-0.02 0 0.02
Even
ts /
( 0.0
01 )
0
1000
2000
3000
4000
5000
)2 (GeV/cGenee-mRec
eem-0.02 0 0.02
Even
ts /
( 0.0
01 )
0
1000
2000
3000
4000
5000
)2 (GeV/cGenee-mRec
eem-0.02 0 0.02
Even
ts /
( 0.0
01 )
0
1000
2000
3000
4000
5000
6000
7000
8000
)2 (GeV/cGenee-mRec
eem-0.02 0 0.02
Even
ts /
( 0.0
01 )
0
1000
2000
3000
4000
5000
6000
7000
8000
)2 (GeV/cGenee-mRec
eem-0.02 0 0.02
Even
ts /
( 0.0
01 )
0
1000
2000
3000
4000
5000
6000
7000
8000
)2 (GeV/cGenee-mRec
eem-0.02 0 0.02
Even
ts /
( 0.0
01 )
0
1000
2000
3000
4000
5000
6000
7000
8000
)2 (GeV/cGenee-mRec
eem-0.02 0 0.02
Even
ts /
( 0.0
01 )
0
1000
2000
3000
4000
5000
)2 (GeV/cGenee-mRec
eem-0.02 0 0.02
Even
ts /
( 0.0
01 )
0
1000
2000
3000
4000
5000
Figure 1: The reconstructed mass histograms and double Crystal Ball fits for 24 Monte Carlomodes.
8

0 2 4 6 8 10
)2R
esol
utio
n (M
eV/c
0
2
4
6
8
10
)2 (GeV/ceeM0 2 4 6 8 10
)2B
ias (
MeV
/c
-1
0
1
Figure 2: The resolution (top) and bias (displacement of the mean of the fit function)(bottom), plotted against mee.
9

Signal efficiency0.1 0.2 0.3 0.4 0.5 0.6 0.7 0.8 0.9 1
Bac
kgro
und
reje
ctio
n
0.8
0.85
0.9
0.95
1
Signal efficiency0.1 0.2 0.3 0.4 0.5 0.6 0.7 0.8 0.9 1
Bac
kgro
und
reje
ctio
n
0.8
0.85
0.9
0.95
1
MVA Method:BDTLikelihoodFisherCuts
Background rejection versus Signal efficiency
Figure 3: Background rejection plotted against signal efficiency for various MVA-based cuts.
10

)2 (GeV/ceem3 3.1 3.2
2E
vts/
2 M
eV/c
0
1000
2000
BDT > -0.44
)2 (GeV/ceem3 3.1 3.2
2E
vts/
2 M
eV/c
0
1000
2000
BDT > -0.42
)2 (GeV/ceem3 3.1 3.2
2E
vts/
2 M
eV/c
0
500
1000
1500
2000
BDT > -0.40
)2 (GeV/ceem3 3.1 3.2
2E
vts/
2 M
eV/c
0
500
1000
1500
2000
BDT > -0.38
)2 (GeV/ceem3 3.1 3.2
2E
vts/
2 M
eV/c
0
500
1000
1500
BDT > -0.36
)2 (GeV/ceem3 3.1 3.2
2E
vts/
2 M
eV/c
0
500
1000
BDT > -0.34
)2 (GeV/ceem3 3.1 3.2
2E
vts/
2 M
eV/c
0
500
1000
BDT > -0.32
)2 (GeV/ceem3 3.1 3.2
2E
vts/
2 M
eV/c
0
500
1000
BDT > -0.30
)2 (GeV/ceem3 3.1 3.2
2E
vts/
2 M
eV/c
0
500
1000
BDT > -0.28
)2 (GeV/ceem3 3.1 3.2
2E
vts/
2 M
eV/c
0
200
400
600
800
BDT > -0.26
)2 (GeV/ceem3 3.1 3.2
2E
vts/
2 M
eV/c
0
200
400
600
800
BDT > -0.24
)2 (GeV/ceem3 3.1 3.2
2E
vts/
2 M
eV/c
0
200
400
600
800
BDT > -0.22
)2 (GeV/ceem3 3.1 3.2
2E
vts/
2 M
eV/c
0
200
400
600
BDT > -0.20
)2 (GeV/ceem3 3.1 3.2
2E
vts/
2 M
eV/c
0
200
400
600
BDT > -0.18
)2 (GeV/ceem3 3.1 3.2
2E
vts/
2 M
eV/c
0
200
400
600
BDT > -0.16
)2 (GeV/ceem3 3.1 3.2
2E
vts/
2 M
eV/c
0
200
400
600
BDT > -0.14
)2 (GeV/ceem3 3.1 3.2
2E
vts/
2 M
eV/c
0
200
400
600
BDT > -0.12
)2 (GeV/ceem3 3.1 3.2
2E
vts/
2 M
eV/c
0
200
400
600
BDT > -0.10
)2 (GeV/ceem3 3.1 3.2
2E
vts/
2 M
eV/c
0
200
400
600
BDT > -0.08
)2 (GeV/ceem3 3.1 3.2
2E
vts/
2 M
eV/c
0
200
400
600
BDT > -0.06
)2 (GeV/ceem3 3.1 3.2
2E
vts/
2 M
eV/c
0
200
400
600
BDT > -0.04
)2 (GeV/ceem3 3.1 3.2
2E
vts/
2 M
eV/c
0
200
400
BDT > -0.02
)2 (GeV/ceem3 3.1 3.2
2E
vts/
2 M
eV/c
0
200
400
BDT > 0.00
)2 (GeV/ceem3 3.1 3.2
2E
vts/
2 M
eV/c
0
200
400
BDT > 0.02
)2 (GeV/ceem3 3.1 3.2
2E
vts/
2 M
eV/c
0
200
400
BDT > 0.04
)2 (GeV/ceem3 3.1 3.2
2E
vts/
2 M
eV/c
0
200
400
BDT > 0.06
)2 (GeV/ceem3 3.1 3.2
2E
vts/
2 M
eV/c
0
100
200
300
400
BDT > 0.08
)2 (GeV/ceem3 3.1 3.2
2E
vts/
2 M
eV/c
0
100
200
300
400
BDT > 0.10
)2 (GeV/ceem3 3.1 3.2
2E
vts/
2 M
eV/c
0
100
200
300
BDT > 0.12
)2 (GeV/ceem3 3.1 3.2
2E
vts/
2 M
eV/c
0
100
200
300
BDT > 0.14
)2 (GeV/ceem3 3.1 3.2
2E
vts/
2 M
eV/c
0
100
200
BDT > 0.16
)2 (GeV/ceem3 3.1 3.2
2E
vts/
2 M
eV/c
0
50
100
150
BDT > 0.18
)2 (GeV/ceem3 3.1 3.2
2E
vts/
2 M
eV/c
0
50
100
150
BDT > 0.20
)2 (GeV/ceem3 3.1 3.2
2E
vts/
2 M
eV/c
0
50
100
BDT > 0.22
)2 (GeV/ceem3 3.1 3.2
2E
vts/
2 M
eV/c
0
20
40
60
BDT > 0.24
)2 (GeV/ceem3 3.1 3.2
2E
vts/
2 M
eV/c
0
10
20
30
40
BDT > 0.26
)2 (GeV/ceem3 3.1 3.2
2E
vts/
2 M
eV/c
0
10
20
BDT > 0.28
)2 (GeV/ceem3 3.1 3.2
2E
vts/
2 M
eV/c
0
5
10
BDT > 0.30
)2 (GeV/ceem3 3.1 3.2
2E
vts/
2 M
eV/c
0
2
4
6
BDT > 0.32
)2 (GeV/ceem3 3.1 3.2
2E
vts/
2 M
eV/c
0
2
4
BDT > 0.34
)2 (GeV/ceem3 3.1 3.2
2E
vts/
2 M
eV/c
0
1
2
3
BDT > 0.36
)2 (GeV/ceem3 3.1 3.2
2E
vts/
2 M
eV/c
0
0.5
1
1.5
2
BDT > 0.38
Figure 4: Fits to the J/ψ resonance for different values of minimum mvaBDT
11

-0.4 -0.2 0 0.2 0.4
Sig
nal
ψJ/
0
500
1000a)
-0.4 -0.2 0 0.2 0.4
Bac
kgro
und
3.2
3.0∫
0
100000
200000
b)
Min BDT Req.-0.4 -0.2 0 0.2 0.4
Rat
io
0
0.05
0.1
0.15c)
Figure 5: The normalizations of the J/ψ resonance (top) and background (middle), and thesignal-to-background ratio (bootm) plotted against minimum required value of mvaBDT . At0.2 on the x-axis, corresponding to a cut of mvaBDT < 0.2, there is a local maximum in thesignal efficiency.
12

Fri Aug 12 16:34:54 2011)2 (GeV/ceem
0 2 4 6 8 10
Effic
ienc
y
0
0.1
0.2
No Classifier Req.LH > 0.80BDT > 0.11Fisher > -0.25
Figure 6: The signal efficiency ǫ(mee) calculated from 25 Monte Carlo modes with fits tohigh order polynomials. Also plotted are the efficiencies calculated after applying the cutsfrom several different MVA methods.
13

)2 (GeV/ceem0 1 2 3 4 5 6 7 8 9
Sens
itivi
ty
-710
-610
-510
Figure 7: Sensitivity plotted against mee. Discontinuities are caused by the evaluation of thesensitivity based on parameters specific to each separate Monte Carlo mode. The sensitivitycalculation at mee uses parameters from the Monte Carlo with generated mass closest tomee.
14

Using Dynamic Quantum Clustering to Analyze Hierarchically Heterogeneous
Samples on the Nanoscale
Allison Hume
Office of Science, Science Undergraduate Laboratory Internship (SULI)
Princeton University
SLAC National Accelerator Laboratory
Menlo Park, California
August 19, 2011
Prepared in partial fulfillment of the requirements of the Office of Science, Department of Energy’s
Science Undergraduate Laboratory Internship under the direction of Marvin Weinstein at the SLAC
National Accelerator Laboratory.
Participant:
Signature
Research Advisor:
Signature
SLAC-TN-12-024
Work supported by US Department of Energy contract DE-AC02-76SF00515.

Table of Contents
Abstract ii
Introduction 1
Methods 2
Results 4
Discussion and Conclusion 6
References 8
i

Abstract
Using Dynamic Quantum Clustering to Analyze Hierarchically Heterogeneous Samples on the
Nanoscale. ALLISON HUME (Princeton University, Princeton, NJ 08544) MARVIN WEINSTEIN
(SLAC National Accelerator Laboratory, Menlo Park, CA 90425)
Dynamic Quantum Clustering (DQC) is an unsupervised, high visual data mining technique.
DQC was tested as an analysis method for X-ray Absorption Near Edge Structure (XANES) data
from the Transmission X-ray Microscopy (TXM) group. The TXM group images hierarchically
heterogeneous materials with nanoscale resolution and large field of view. XANES data consists
of energy spectra for each pixel of an image. It was determined that DQC successfully identifies
structure in data of this type without prior knowledge of the components in the sample. Clusters and
sub-clusters clearly reflected features of the spectra that identified chemical component, chemical
environment, and density in the image. DQC can also be used in conjunction with the established
data analysis technique, which does require knowledge of components present.
ii

Introduction
The ability to study hierarchically heterogeneous materials on the nanoscale can lend insight to
problems ranging from the chemistry of batteries to techniques of ancient artists. A hierarchically
heterogeneous sample is a sample that contains multiple chemical components that appear homoge-
nous on the nanoscale, but heterogeneous on a micron or millimeter scale. The Transmission X-ray
Microscopy (TXM) group at beam line 6-2c in the Stanford Synchrotron Radiation Light-source
(SSRL) has the ability to image such samples with a 30 nanometer resolution and field of view
large enough to see the hierarchical structure.
The data collected for a sample is a set of images taken over a range of energies from which
the TXM group can determine a full X-ray Absorption Near Edge Structure (XANES) spectrum
for each pixel. XANES goes beyond identifying the elements present in a sample, determined by
the edge-jump in the spectrum, and provides information about the surrounding chemistry, such as
the oxidation state of the element. This information is present in the fine structure in the energy
range higher than the edge-jump. [1] The TXM group, however, is not able to analyze this data
without knowing what chemical components are present in the sample. The current data analysis
procedure compares the absorption spectrum for each pixel to spectra for compounds known to be
in the sample using R2 fitting. A colored map of the sample is created by assigning the known
spectra to colors such as red and blue and coloring each pixel according to how similar it is to the
“red” or “blue” spectra. Any pixels with extremely poor R2 values are examined to find unknown
components. This method is effective for samples in which the composition is known and the only
information needed is the distribution, but a new method is necessary for samples of unknown
composition.
Dynamic Quantum Clustering (DQC) is a method of data mining that does not require any
previous information about the composition of the sample. It performs unsupervised clustering
to identify energy spectra that have similar characteristics. To test the applicability of DQC to
TXM-XANES data, a sample was used that had been analyzed by the original method as well.
The sample came from a piece of ancient Roman pottery made from hematite (iron(III) oxide) and
1

hercynite (iron(II) aluminate). The images are taken as a cross-section of the interface between
the two oxides with hematite on the surface and hercynite underneath. This data set consists of a
series of 146 images, each with close to one million pixels, which determines the spectra for each
pixel. The spectra are noisy and the combination of this noise and the large data size creates a
significant data mining challenge to find groups of pixels with similar spectra.
Methods
DQC is an algorithm that maps a problem of unsupervised clustering to a problem in quantum
mechanics and provides a visual animation of the cluster formation. An outline of the algorithm
appears below and a full description of the theory and methods of computation can be found
in Dynamic quantum clustering: a method for visual exploration of structures in data by Marvin
Weinstein and David Horn. [2]
In DQC each data point is described as a Gaussian wave function in an n-dimensional parameter
space. The full data set is then associated with the sum of these individual Gaussians:
Ψ(~x) =∑
i
e−(~x− ~xi)
2
2σ2 =∑
i
ψi(~xi) (1)
Choosing a larger value for σ causes the individual wave functions to have more overlap while a
smaller value decreases overlap. This in turn affects the level of definition of the extrema of the
full wave function.
The wave function is then taken to be the ground state of the Hamiltonian:
(−σ2
2∇2 + V (~x))Ψ(~x) = EΨ(~x), E = 0 (2)
The full wave function therefore determines some potential V (~x) that will have minima determined
by the maxima of the wave function, which correspond to the most most dense regions of the data
in parameter space:
V (~x) =σ2
2Ψ(~x)∇2Ψ(~x) (3)
2

The potential, is less sensitive to the value of σ than the full wave function so the choice of value for
that variable is less important than it is for other data mining methods that use a sum of Gaussians.
The individual data points are them evolved in time according to the time-dependent Schrodringer
equation:
i∂ψi(~xi, t)
∂t= (−∇2
2m+ V (~x))ψi(~xi, t) (4)
The value chosen for the mass of the “particle” has an effect on the amount of tunneling that occurs
as the data evolve, as well as the speed at which the evolution occurs.
The data is a matrix: each row corresponds to the 146 point energy spectrum of a single pixel.
After removal of the pixels for which there was no data, slightly over half a million pixels were
left. Singular value decomposition (SVD) was then performed. SVD is a method of factorizing a
matrix that allows the original matrix to be approximated as a sum of a series of terms that show
increasing detail. In this case, since each row of the matrix is a spectrum, recreating the matrix
from a subset of the 146 singular components reduced the noise in the spectra. The more singular
components used to recreate the original matrix, the closer the spectra will be to their original
shape. The first five components were used for the rest of the initial analysis. Five features were
enough to retain the important features in the shape of the spectra, while reducing the noise of
the spectra greatly. This can be seen in Figure 1 which shows an example spectrum taken from
the original matrix in green and the same spectrum reconstructed from the first give components
in black.
DQC is able to operate in high dimension; however, the speed of computation scales linearly with
the number of dimensions. So reduction from 146 to five dimensions in the data matrix increased
the speed of computation. The most important step taken to reduce the time of computation,
however, was the selection of template states. Template states are essentially an approximate
basis: a subset of data points, linear combinations of which can reproduce all of the other states up
to a given accuracy. By choosing about 1500 states that spanned the full data and only evolving
these states, the computation became possible on a desktop workstation. A description of the DQC
Maple library, including further detail on the process of selecting template states can be found on
Weinstein’s website. [3] In this analysis, all of the states were used to construct the potential, the
3

template states were evolved through 75 time-steps using the potential, and the remaining states
were expressed as approximate linear combinations of the template states to fully evolve the data.
After the 75 frame animation of the evolution was completed, the result was examined, and
clusters and sub-clusters were visually identified. In this analysis, a cluster is considered as a group
of data points which is separate from all others in any dimension and a sub-cluster is any visible
structure within a cluster such as connected strands. The data were then colored based on the
visible structure, the original image was reconstructed from those colors, and the clusters were
used to understand the structure and distribution of the data. A selection of reconstructed spectra,
as well as the average spectra, was examined from each cluster and sub-cluster to determine the
aspects of the spectra that affected the clustering of the data. Four clusters and the sub-structure
of two of the clusters were examined in depth. The colors used are shades of red, shades of blue,
and shades of green. The three shades of red (dark red, red, and pink) and the shades of blue (blue
and cyan) each correspond to the sub-structure of a cluster while the shades of green (green and
dark green) correspond to two clusters.
Results
As DQC had never been used for this type of data, the first important result was that the data
clustered. Figure 2 shows the final frame of the evolution and illustrates how both the clustering
and sub-clustering appear. It is important to note that the size of the cluster in the final frame
does not necessarily correspond to the number of points it contains. In theory, each isolated point
in the final frame must be considered as an individual cluster. Watching the animation is useful to
estimate the size of clusters. Figure 3 shows the final frame again but illustrates how the clusters
and sub-clusters were colored. In practice, most of the isolated points were grouped with other
clusters.
The picture that was recreated based on the clustering of the data appears in Figure 4(a) colored
according to how each pixel was colored in the final frame of the animation. It is important to note
that no information about the location of the pixels in the image was used during the clustering
4

process. Figure 4(b) shows the picture that was created from the original data analysis method for
comparison. Information about pixel location was used by the TXM group to create this picture.
Again, the different shades of color in the DQC picture come from the structure of the data. The
different shades of red and green in the original, however, were added by examining the amplitude
of the curves after the fitting was performed and adding white to the lower amplitude curves to
represent lower intensity pixels. The blue piece of the picture was identified in the original analysis
through the poor fit those pixels had with both the hematite and hercynite spectra. In the DQC
analysis those pixels clustered to a point within four frames and remained separated for the rest of
the animation.
Examining the spectra in each cluster provided information about what aspects of the curves
were important in the clustering process. Several groups of clusters and sub-clusters were seen to
have spectra of similar shape, but different intensities. Figure 5 shows the averages of these groups,
as well as a selection of curves from each group to illustrate how the intensity of spectra comes out
in the clustering.
Most of the large clusters corresponded to groups of spectra with different shapes. Figure 6
shows 100 random spectra from each of the three clusters whose spectra had the most distinct
shapes. Upon examining the spectra in the green and red clusters, it was confirmed that the green
spectra correspond to the spectra of hematite, and the spectra in the main red band correspond
to the spectra of hercynite. The locations of hematite and hercynite in the image (locations of
green and red pixels in Figure 4(a)) matched what was expected based on the original analysis.
The information about the location of hematite and hercynite, although confirmed by the other
analysis method, were therefore determined purely from similarities in spectra in the DQC analysis.
It is clear (both in Figure 6 and Figure 5) that the green spectra are tightly grouped while the
red and blue spectra contain a much larger spread of curve shapes. This information is reflected
in the sub-clustering of the three clusters. The green cluster shows no sub-structure while the red
cluster shows three large strands, among other features, and the blue shows a tight node and two
diffuse strands. The sub-structure of the red and blue clusters were examined in depth. One strand
of the red cluster was determined to correspond to a different chemical environment, as seen in
5

Figure 7. Figure 7(a) shows only the red cluster in a two dimensional projection of the last frame
of the animation with one strand colored yellow. Figure 7(b) shows 20 random spectra from both
the red strand and the yellow strand. It shows that the yellow strand corresponds to an apparently
different chemical environment from the hercynite from the rest of the red. This is visible in the
image in Figure 4(a) as the yellow pixels mostly appear on the interface between the hematite
and the hercynite. The blue cluster has a band that resembles the spectrum of mostly pure iron
but also contains curves that resemble hercynite. Although the blue cluster appeared as a point
on the animation by the fourth or fifth frame, the sub-structure of this cluster is visible with the
other clusters removed. Figure 8(a) contains a view of the sub-structure of this cluster from the
fifth frame of the animation. Figure 8(b) contains sample spectra from the different components
of the structure and Figure 8(c) contains the average spectra from the two components. Both of
these plots show that the curves more closely resembling hercynite or pure iron separate in the
sub-clustering. It is interesting to note in the image in Figure 4(a) that the light blue or pure iron
appears as a coherent band.
Discussion and Conclusion
The DQC algorithm successfully identified structure in the XANES data. The animation of the
evolution shows detailed clustering and sub-clustering which correspond to physically important
information in the curves. Upon examination of the spectra present in the various clusters it appears
that the most important information in forming the clusters comes from the shape of the pre-edge
and edge jump. Thus, different components are the first groups to cluster out. Clusters containing
spectra for hematite, hercynite, and relatively pure iron contained pixels from areas where those
components were expected to appear based on the original analysis, which confirms that DQC is
able to correctly identify different chemical components in the data. Some sub-structure of clusters
identified the chemical environment of a compound that is present. This was seen in the mapping
of apparent differences in the hercynite spectra to the visible strands of the red cluster.
The other information that is important in the cluster formation is the intensity of the spectra.
6

This was seen in how well some separate clusters and large sub-features corresponded to the intensity
information that had been added in the original picture. Although learning that clustering occurs
partially based on intensity was informative for understanding how DQC responds to XANES data,
in the future clustering will most likely be performed on normalized data. This is because intensity
is not physically interesting, and it can be added to the image afterwards, in the same way it was
added to the TXM image. Clustering on normalized data will most likely simplify the structure
that needs to be examined which will make it easier to find physically interesting information.
The blue cluster (pixels containing mostly iron) represented an example of a “strong” cluster,
or a cluster that forms almost immediately and does not join other clusters later. It was important
to see that DQC was sensitive to this cluster because iron and hercynite have similar spectra and
the pixels in the iron cluster represented less than 1% of the data set. This was a confirmation
of how well DQC works with this type of data. The characteristic differences in the spectra is
barely visible to the eye when examining the spectra reconstructed from five SVD components but
the algorithm is sensitive enough to small changes in the spectra that this tiny subset of the data
clustered immediately and remained separate from the data.
It is also important to note that the two data analysis methods can be used well in tandem -
DQC provides information about what parts of the image might be interesting to study in depth but,
by using the traditional method to create a second picture, the user can also identify areas of the
image that should be examined further in the DQC animation. Any area of the image identified by
the user can be examined in the animation and so the user can request specific information such as
how a smaller group of pixels clusters. The differences between the two pictures are also important
and will generally reflect areas that should be examined in depth. This provides another motive
for using the two data analysis techniques together. The traditional method is currently faster but
DQC is capable of providing more detail and work is continuing to speed up the algorithm. DQC
holds great potential for use in the analysis of XANES data in the TXM group.
7

Acknowledgements
I would like to thank my mentor Marvin Weinstein for all of his help and support as well as
Apurva Mehta, Florian Meirer, and Yijin Liu for their time and assistance. I would also like to
thank the Department of Energy for funding this program and for everyone at the SLAC National
Laboratory for being welcoming and helpful. Thank you to Stephen Rock, Maria Mastrokyriakos
and Anita Piercy for all of the work they put into making the summer go smoothly.
REFERENCES
[1] F. Meirer, Y. Liu, A. Mehta. Mineralogy and morphology at nanoscale in hierarchically hetero-
geneous materials. June 24, 2011.
[2] M. Weinstein, D. Horn. Dynamic quantum clustering: a method for visual exploration of struc-
tures in data. SLAC-PUB-13759.
[3] M. Weinstein. DQCOverview1. http://www.slac.stanford.edu/~niv/index_files/
DQCOverview1.html
8

FIGURES
Figure 1: In this illustration of SVD reconstruction the black curve is a sample spectrum takenfrom the data and the green curve is the same spectrum reconstructed from the first five singularcomponents.
(a) Dimensions 1, 2, 3 (b) Dimensions 3, 4, 5
Figure 2: Two views of the last frame of the DQC animation that show all five dimensions of thedata and illustrate how the data separated into clusters, as well as how many of the clusters containvisible sub-structure.
9

(a) Dimensions 1, 2, 3 (b) Dimensions 3, 4, 5
Figure 3: Two views of the last frame of the DQC animation that show all five dimensions of thedata and illustrate how clusters and sub-clusters were colored.
(a) Image Created by DQC Analysis (b) Image Created by Fitting Analysis
Figure 4: Two images of the data with the left image colored based on the unsupervised clusteringof the data using DQC analysis and the right image colored based on R2 fitting to previously knowncomponents.
10

(a) Average Spectra for two Groups (b) Average Spectra for three Groups
(c) 100 Random Spectra for two Groups (d) 100 Random Spectra for three Groups
Figure 5: The amplitude differences seen between spectra of several clusters and sub-clusters thathave spectra of similar shape. There were two major intensities seen in the shape in green andat least three seen in the shape in red. The different intensities are illustrated using the averagereconstructed spectra for a group and 100 random reconstructed spectra for each group.
11

(a) Hematite (b) Hercynite (c) Mostly Iron
Figure 6: 100 random reconstructed spectra from three clusters that illustrate the three mainspectra shapes, and therefore the three main chemical components seen in the data.
(a) Sub-structure of Red Cluster (b) Sub-groups of Red Spectra
Figure 7: The sub-structure of the red cluster is visible in the last frame of the animation. Thissub-structure reflects differences in the shape of the spectra, corresponding to different phases ofhercynite.
12

(a) Sub-structure of Blue Cluster (b) Sub-groups of Blue Spectra
(c) Averages of Sub-groups of Blue Spectra
Figure 8: The sub-structure of the blue cluster is visible in the fifth frame of the animation whenthe rest of the data is removed. This sub-structure reflects differences in the shape of the spectra,corresponding to how much iron is present. Curves more closely resembling hercynite or pure ironseparate in the sub-clustering. The lighter blue curves show the flattening of the spectra after theedge-jump that is characteristic of iron.
13

Representing Range Compensators with Computational
Geometry in TOPAS
Forrest N. Iandola
University of Illinois at Urbana-Champaign
August 19, 2011
Prepared in partial fulfillment of the requirements of the Department of Energy’s Science
Undergraduate Laboratory Internship under the direction of Joseph Perl.
Participant:
Signature
Research Advisor:
Signature
SLAC-TN-12-025
Work supported by US Department of Energy contract DE-AC02-76SF00515.
and SLAC National Accelerator Laboratory, Menlo Park, CA 94025

TABLE OF CONTENTS
Abstract ii
Introduction 1
Background 1
Range Compensator Model with Subtraction Solids 3
“3D Hexagon”-based Range Compensator Approximation 3
Conclusions and Future Work 4
Acknowledgments 4
References 4
i

ABSTRACT
In a proton therapy beamline, the range compensator modulates the beam energy, which
subsequently controls the depth at which protons deposit energy. In this paper, we intro-
duce two computational representations of range compensator. One of our compensator
representations, which we refer to as a subtraction solid -based range compensator, precisely
represents the compensator. Our other representation, the 3D hexagon-based range com-
pensator, closely approximates the compensator geometry. We have implemented both of
these compensator models in a proton therapy Monte Carlo simulation called TOPAS (Tool
for Particle Simulation). In the future, we will present a detailed study of the accuracy and
runtime performance trade-offs between our two range compensator representations.
ii

INTRODUCTION
Proton therapy is one of the best methods available for treating cancer [1]. The number
of proton facilities is steadily increasing, and proton therapy is entering the mainstream
of radiation therapy. TOPAS (Tool for Particle Simulation) is a four year NIH-funded
project of SLAC, University of California, San Francisco (UCSF) and Massachusetts General
Hospital to make Monte Carlo particle transport simulation faster and easier to use for
proton therapy [2] [3] [4]. TOPAS enables researchers and clinicians to refine proton therapy
delivery system designs and individual patient treatment plans to improve proton therapy’s
therapeutic ratio (improved tumor control, reduced side effects). TOPAS offers a collection
of ready-made geometries for modeling proton therapy beamlines, and TOPAS uses Geant4
for fundamental physics processes.
In most proton therapy facilities, an extensive beamline lies between the proton source
and the patient. This beamline includes components such as collimators, magnets, a range
modulator, scatterers, and a range compensator. The range compensator (or simply com-
pensator) sits close to the patient. The fundamental purpose of a range compensator is to
modify the proton beam energy so that the protons deliver energy to the correct location in
a patient. This study seeks to represent compensators with computational geometry. While
a wide variety of computational geometry methods could be applied to compensator rep-
resentation, we focus on fast and accurate methods. This paper presents two compensator
representations, which the authors have recently implemented in TOPAS.
BACKGROUND
The Range Compensator
In proton treatment facilities, medical staff typically prescribe a radiation dose (in Greys)
to a patient’s tumor. To ensure that the correct dose is delivered to the correct location, the
1

protons must have a specific energy. The necessary energy may vary within the treatment
region. A range compensator allows a beamline to deliver protons with the correct energy
(and corresponding depth of deposition).
In many proton therapy facilities, a non-Monte Carlo treatment planning software such
as XiO [5] designs a unique range compensator for each patient. In some facilities, medical
physicists use a Monte Carlo simulation such as TOPAS to validate the compensator design.
Therapy facilities typically construct compensators by using a milling machine to drill a
number of holes out of a cylinder of Lucite or other clear plastic. Each drill hole may have
a unique depth, such as in Figure 1. The thickness of the Lucite proportionally reduces the
protons’ energy. Lower-energy protons deposit most of their energy at a shorter depth in the
patient than higher-energy protons. In short, the range compensator modulates the beam
energy, which subsequently controls the depth at which protons deposit energy.
Subtraction Solids in Geant4
Geant4 supports boolean solid combinatorial geometry [6]. Subtraction solids are a type of
Geant4 boolean solid. Subtraction solids enable a small solid to be cut out, or subtracted,
from a larger solid [7]. The pseudo code in Figure 2 serves as a simple example of sub-
traction solid geometry. As shown in Figure 3, Geant4 also allows nested subtraction of
solids. In addition, subtracted solids are allowed to overlap. Therefore, for the example
in Figure 3, Geant4’s ability to track particles is not impaired if the subtracted cylinders,
smallCylinder1 and smallCylinder2, overlap. In contrast, geometrical components that
are not comprised of boolean solids are not allowed to overlap in Geant4.
2

RANGE COMPENSATOR MODEL WITH SUBTRACTION
SOLIDS
Given the compensator milling machine instructions in .Decimal format [8], we subtract
each drill hole from the solid Lucite cylinder. We subtract the cylinders in the same order
that the milling machine would drill the cylinders. Thus, we produce an exact model of
the real compensator. The pseudo code in Figure 3 constructs a compensator comprised of
a bigCylinder with n drill holes subtracted. Figure 4 offers a Geant4 visualization [9] of a
subtraction solid compensator with twelve holes subtracted.
Our (unpublished) preliminary results show that, especially for compensators with fifty
or more drill holes, tracking particles through a subtraction solid-based compensator is quite
slow. To remedy this, we present a hexagon-based compensator approximation in the next
section.
“3D HEXAGON”-BASED RANGE COMPENSATOR
APPROXIMATION
In this section, we present an approximate compensator representation. We approximate
the drill holes with a collection of “3D hexagons,” as shown in Figure 5. Each 3D hexagon
has the depth of the drill hole that it represents.
We choose 3D hexagons, because they can be clustered without overlap or gaps. (Re-
call that, while boolean solids allow overlap, other forms of Geant4 geometry do not allow
overlap.) The lack of overlap among the hexagons allows us to insert a volume of air in the
shape of each 3D hexagon into the Lucite cylinder. However, unlike the precise compensator
model produced with subtraction solids, the 3D hexagon model does not correctly represent
the drill hole depth in regions where drill holes overlap.
3

Our preliminary results show that particle tracking through a hexagon-based compensator
is as up to twenty times faster than through a subtraction solid-based compensator. We will
present the finalized version of these results in a future study.
CONCLUSIONS AND FUTURE WORK
In this paper, we introduced two range compensator representations, which we have imple-
mented in TOPAS. In the near future, we will present a detailed study of the accuracy and
runtime performance trade-offs between our two compensator representations.
ACKNOWLEDGMENTS
The authors thank Jan Schuemann, Harald Paganetti, Jungwook Shin, and Bruce Faddegon
for their helpful suggestions. Thanks to the U.S. Department of Energy and the National
Institutes of Health for their generous support.
REFERENCES
[1] H. Suit, S. Goldberg, A. Niemierko, A. Trofimov, J. Adams, H. Paganetti, G. Chen,
T. Bortfeld, S. Rosenthal, J. Loeffler, and T. Delaney, “Proton beams to replace photon
beams in radical dose treatments.” Acta Oncologica, vol. 42, no. 8, pp. 800–808, 2003.
[2] J. Perl, J. Shin, J. Schuemann, B. Faddegon, and H. Paganetti, “Topas: A fast and
easy to use tool for particle simulation,” in Joint American Association of Physicists in
Medicine (AAPM) and Canadian Organization of Medical Physicists (COMP) Meeting,
August 2011.
4

[3] J. Perl, J. Schuemann, J. Shin, B. Faddegon, and H. Paganetti, “Topas: A fast and easy
to use monte carlo system for proton therapy,” in Presented at the 50th Meeting of the
Particle Therapy Co-Operative Group (PTCOG), May 2011.
[4] T. Akagi, T. Aso, B. Faddegon, A. Kimura, N. Matsufuji, T. Nishi, C. Omachi, H. Pa-
ganetti, J. Perl, T. Sasaki, D. Sawkey, J. Scheumann, J. Shin, T. Toshito, T. Yamashita,
and Y. Yoshida, “The ptsim and topas projects, bringing geant4 to the particle therapy
clinic,” in Joint International Conference on Supercomputing in Nuclear Applications and
Monte Carlo 2010 (SNA + MC 2010), October 2010.
[5] M. Lee, “Xio treatment planning system from elekta cms software optimizes clinical
treatment at rinecker proton therapy center,” Elekta, Inc. Press Release, October 2009,
http://www.elekta.com/healthcare international press release 20070632.php.
[6] G. Cosmo, “Modeling detector geometries in geant4,” in IEEE Nuclear Science Sympo-
sium (IEEE-NSS), vol. 1, October 2003, pp. 479–481.
[7] ——, “The geant4 geometry modeler,” in IEEE Nuclear Science Symposium (IEEE-
NSS), vol. 4, October 2004, pp. 2196–2198.
[8] B. E. Willis, “Commissioning of adac pinnacle for imrt utilizing solid compensators,”
Master’s thesis, Oregon State University, 2008.
[9] J. Allison, M. Asai, G. Barrand, M. Donszelmann, K. Minamimoto, J. Perl, S. Tanaka,
E. Tcherniaev, and J. Tinslay, “The geant4 visualisation system,” Computer Physics
Communications, vol. 178, no. 5, pp. 331–365, 2008.
5

FIGURES
Figure 1: Example range compensator
newSolid = bigCylinder - smallCylinder
Figure 2: Pseudo-code for simple subtraction solid example
newSolid1 = bigCylinder - smallCylinder1
newSolid2 = newSolid1 - smallCylinder2
...
Compensator = newSolid(n-1) - smallCylinder(n)
Figure 3: Pseudo-code for repeated subtraction solid example
6

Figure 4: Compensator modeled with subtraction solids
Figure 5: Compensator modeled with 3D hexagons
7

Channeling through Bent Crystals
Stephanie Mack
Office of Science, Science Undergraduate Laboratory Internship (SULI)
University of Ottawa
SLAC National Accelerator Laboratory
Menlo Park, CA
August 19, 2011
Prepared in partial fulfillment of the requirements of the Office of Science, Department of
Energy’s Science Undergraduate Laboratory Internship under the direction of H.-Ulrich (Uli)
Wienands at the Stanford University, SLAC National Accelerator Laboratory.
Participant:
Signature
Research Advisor:
Signature
SLAC-TN-12-026
Work supported by US Department of Energy contract DE-AC02-76SF00515.

TABLE OF CONTENTS
Abstract ii
Introduction 1
Materials and Methods 2
Results 3
Discussion and Conclusions 5
Acknowledgments 7
i

ABSTRACT
Channeling through Bent Crystals. STEPHANIE MACK (University of Ottawa, Ottawa,
ON K1N 6N5), H.-ULRICH (ULI) WIENANDS (Stanford University, SLAC National Ac-
celerator Laboratory, Menlo Park, CA 94025).
Bent crystals have demonstrated potential for use in beam collimation. A process
called channeling is when accelerated particle beams are trapped by the nuclear potentials
in the atomic planes within a crystal lattice. If the crystal is bent then the particles can
follow the bending angle of the crystal. There are several different effects that are observed
when particles travel through a bent crystal including dechanneling, volume capture, volume
reflection and channeling. With a crystal placed at the edge of a particle beam, part of the
fringe of the beam can be deflected away towards a detector or beam dump, thus helping
collimate the beam. There is currently FORTRAN code by Igor Yazynin that has been
used to model the passage of particles through a bent crystal. Using this code, the effects
mentioned were explored for beam energy that would be seen at the Facility for Advanced
Accelerator Experimental Tests (FACET) at a range of crystal orientations with respect
to the incoming beam. After propagating 5 meters in vacuum space past the crystal the
channeled particles were observed to separate from most of the beam with some noise due
to dechanneled particles. Progressively smaller bending radii, with corresponding shorter
crystal lengths, were compared and it was seen that multiple scattering decreases with the
length of the crystal therefore allowing for cleaner detection of the channeled particles. The
input beam was then modified and only a portion of the beam sent through the crystal.
With the majority of the beam not affected by the crystal, most particles were not deflected
and after propagation the channeled particles were seen to be deflected approximately 5mm.
After a portion of the beam travels through the crystal, the entire beam was then sent
through a quadrupole magnet, which increased the separation of the channeled particles
ii

from the remainder of the beam to a distance of around 20mm. A different code, which was
developed at SLAC, was used to create an angular profile plot which was compared to what
was produced by Yazynin’s code for a beam with no multiple scattering. The results were
comparable, with volume reflection and channeling effects observed and the range of crystal
orientations at which volume reflection is seen was about 1 mrad in both simulations.
iii

INTRODUCTION
Crystals contain atoms arranged in a lattice which forms planes. When accelerated par-
ticles enter a crystal parallel to a plane they can be trapped by the nuclear potentials, a
process called channeling [1]. If the crystal is bent elastically then particles may follow the
curvature of the planes. This concept can then be applied to beam collimation: if a crystal
is placed to intercept the halo particles of a beam these can be deflected away from the
beam to a detector or beam dump. This may improve the collimation of the beam which
is important for preventing damage to equipment and improving the noise to signal ratio of
experiments using the beam. Previous channeling experiments have examined this effect at
circular accelerators including the RD22 experiment at the H8 beamline at the European
Organization for Nuclear Research (CERN) [2] and the Tevatron at Fermilab [3].
An experiment to be proposed for the Facility for Advanced Accelerator Experimental
Tests (FACET) at SLAC National Accelerator Laboratory (SLAC) will study the effective-
ness of a bent crystal for collimation of the 23 GeV positron/electron beam using planar
channeling with a silicon (110) crystal. The CRY AP code written in Fortran by Igor
Yazynin and modified by Robert J. Noble [4] provides the baseline for the study of the
bent crystal. The effects of volume reflection, volume capture, channeling and dechanneling
were investigated with a beam of positively charged particles passing through the crystal.
Volume capture happens when a particle is not initially channeled, but as it passes through
successive planes it eventually makes a critical angle with a plane and becomes channeled.
A dechanneled particle is one that is initially channeled between the planes but then exits.
These processes are largely caused by multiple scattering of the particle. Volume reflection
occurs when the particles hit the planes of the crystal at a shallow angle. They are thus
reflected off the plane and do not get trapped between the planes and are only slightly de-
viated from a straight path.
The crystal parameters were optimized for FACET beam energy. A more realistic input
1

beam was then prepared and the crystal placed to intercept the edge of the beam. The effec-
tiveness of channeling after passing through the crystal and propagating a certain distance
to a detector was investigated. Beyond the crystal a quadrupole magnet was then added to
the code to improve separation of channeled particles from the remainder of the beam to
improve the experimental setup. Another code written at SLAC [5], which employs a dif-
ferent method of computation for determining the particles’ positions and angles, was then
compared to the results of Yazynin’s code. This work focuses on channeling of positrons as
the process is less efficient with electrons due to their being attracted by the nuclei.
MATERIALS AND METHODS
The main tool used for analysis of positively charged particles passing through a bent
crystal was the FORTRAN code CRY AP written by Igor Yazynin and modified by Robert
J. Noble [4]. The code uses a truncated Monte Carlo method for determining the position
and angle of the particle as it exits the crystal. It includes the volume reflection, volume
capture, dechanneling and channeling effects. Nuclear and multiple scattering are also taken
into account.
This code was modified to make a more realistic comparison to experimental conditions
in FACET. The divergence of the beam was added in to the initialization of the position
of the particles. A drift space was added so that after passing through the crystal, the
particles propagated five meters and their angle and position were calculated at that point to
determine what a detector would measure. Furthermore, instead of initializing the particles
with a random number generator, a datafile was constructed with an initial position and
angle assigned to each particle with a phase space ellipse similar to what would be expected
in the accelerator. This input beam was then implemented into the code and positioned
so only the edge of the beam was intercepted by the crystal. These particles were also
propagated in vacuum space.
2

In FACET it would be possible to propagate the particles further from the crystal in order
to allow more separation between the main beam and the channeled portion, but they would
pass through a quadrupole magnet. Therefore the code was adjusted to take into account
the manipulation of the beam due to the magnet. The transform matrix was obtained from
a magnet-lattice model of FACET.
The relevant FACET parameters were calculated for positrons and are included in Table
1. As well, the critical angle for channeling in silicon (110) crystals was calculated using the
formula
Θc =
√2 ∗ Umax
pv(1 − RT
Rm
)
where Umax is the maximum potential energy, p is the momentum, v is the velocity, RT is
the Tsyganov radius and Rm is the bending radius. The critical angle was found to be 42.6
µrad.
The second code performs detailed tracking to decide the particle’s angle and position.
It uses many steps through the crystal and averages the atomic potential along the planes
according to the Lindhard Potential [1].This code does not calculate multiple scattering
effects on the particles.
RESULTS
The angular profile plot for the crystal was used primarily for the analysis. The deflection
of the particles as a function of the crystal orientation, the angle the crystal planes make
with the incoming beam, is plotted. For a 10mm long crystal with a 10m bending radius
with multiple scattering effects turned off in the code, a basic view of the amorphous region,
volume reflection, and channeled particles is outlined in green in Fig. 1. When multiple
scattering is included, the beam width increases significantly as seen by the red data points,
and the volume capture and dechanneled particles are clearly observed.
Upon implementing the propagation of the particles to a detector, a histogram was
3

created in order to see the distribution of the particles. For the amorphous region, in Fig. 2
the histogram shows a peak of particles centered around the middle, with no displacement,
with a certain width of the distribution of the beam due to scattering. Fig. 3 illustrates
a slice of the crystal orientation which includes volume reflection and volume capture, seen
as two clearly defined peaks of intensity. In the channeling orientation of the crystal, the
channeled particles have the highest intensity relative to the rest of the beam (Fig. 4).
In order to optimize the crystal parameters, the same analysis was done for three different
bending radii and crystal lengths but the same overall bending angle. In Fig. 5 is shown
the angular plots overlaid for a 10m/10mm, 5m/5mm, 2.5m/2.5mm bending radius/crystal
length. These particles were also propagated 5m after passing through the crystal and their
distribution is plotted in Fig. 6.
A phase space plot of the new input beam is shown in Fig. 7. This beam was offset so
that only a portion would pass through the crystal, which was placed at the zero position,
and the rest of the beam would not be affected by it. The portion traveling through the
crystal is highlighted in green. Fig. 8 shows the same phase space plot of the particles
at the exit face of the crystal, for a crystal of a 5m bending radius and a length of 5mm.
The distribution of particles is plotted in Fig. 9 upon propagating 5m. Then in place of
just propagating 5m in vacuum space, after the crystal the entire beam was sent through a
quadrupole magnet (analogous to the what is in place in the beamline at FACET) and the
distribution of the particles after the magnet is plotted in Fig. 10.
Using the code developed at SLAC [5], the result of the angular profile was compared to
what was observed with Yazynin’s code. The angular profile plot in Fig. 11 demonstrates
that there are strong similarities; it should be noted that the vertical line parallel to the
main beam in the figure is an artifact of the code dependent on the number of steps taken.
4

DISCUSSION AND CONCLUSIONS
The angular profile plots match the overall form expected from previous research [2] with
the volume reflection, capture, dechanneling and channeling effects taken into account in the
code. Comparing the angular profiles in Fig. 1, the effect of multiple scattering is easily
seen. The beam width increases significantly from a narrow beam without the multiple
scattering. As well, the volume capture effect and dechanneling are dependent on scattering.
The scattered particles far from the main part of the beam (i.e. when the absolute value of
the deflection is greater than approximately 0.5mrad) are largely due to nuclear scattering
and large angle multiple scattering.
Using this angular profile to determine the orientation of the crystal to observe different
channeling effects, the distribution of particles upon propagating 5m past the crystal was
investigated using a crystal with a bending radius of 10m and a length of 10mm. In the
amorphous region, where the beam interacts minimally, the distribution in Fig. 2 shows a
single peak with a certain width which can be attributed to the scattering effects. Upon
changing the orientation of the crystal to observe volume capture and volume reflection in
Fig. 3, the distribution changes significantly. The wider peak on the left representing the
volume reflected portion of the beam illustrates that it would be difficult to use a detector to
observe this effect since the displacement of these particles from zero is minimal compared
to the width of the peak. There is some noise between the two peaks which reduces the
clarity of the peaks. The volume captured particles have a higher intensity with a narrower
displacement distribution than the volume reflected particles.
At channeling orientation of the crystal, channeling of the particles is easily detected in
Fig. 4. There is a small peak in the distribution where the beam is minimally deflected.
The intensity of the channeled particles is observed around a deflection of 5mm. However,
there is significant noise between these two peaks due to the dechanneled particles. In order
to minimize this effect and optimize channeling, different bending radii and crystal lengths
5

were compared. As observed in Fig. 5 the beam width (the amount of multiple scattering)
decreases with crystal length. As well, the density of dechanneled particles can be seen to
be less with the 2.5m bending radius than the 5m or 10m bending radius since the particles
are less dense in that area on the plot. When using Fig. 5 and Fig. 6 to compare the
different bending radii, one can observe the decreased multiple scattering with a decrease
in the bending radius. The intensity of channeled particles almost doubles as the bending
radius goes down by a factor of four and the angle of deflection for these particles remains
constant. The noise due to dechanneled particles between the two peaks does decrease with
the shorter bending radius. This would improve the ability to cleanly detect the channeled
particles in an experimental setup. However, mechanical constraints will hinder the feasibility
of attaining a crystal with a very small bending radius. Therefore, the remaining simulations
used a 5mm long crystal with a 5m bending radius.
The code originally initializes the particles with a fixed position and angle then adds a
randomized element using a random number generator. To better simulate the beam that
would be in FACET, a data file with particles assigned positions and angles that make a
phase space ellipse as seen in Fig. 7 was created. Instead of passing the entire beam through
the crystal, since the crystal would be used for collimation, the beam was offset from the
crystal so only a portion of the beam actually passes through as illustrated with the green
portion of the beam. At the exit face of the crystal the main part of the beam remains
unchanged but the portion going through the crystal is subject to dechanneling, channeling,
volume capture/reflection as is illustrated in Fig. 8. One can see that of the part of the beam
going through the crystal, the particles are mostly either not deflected, volume reflected or
channeled with some dechanneling occurring. Since the majority of the beam is not passed
through the crystal there is a high intensity of particles that are not deflected in Fig. 9. The
channeled particles represent less than 5% of the beam but are still detectable at a deflection
of approximately 5mm.
Beyond where the crystal would be placed in FACET is a quadrupole magnet. This would
6

affect the beam and so using the input beam in Fig. 7, again with the portion highlighted
in green actually going to the crystal, the entire beam was then passed through the magnet
and the particle distribution plotted in Fig. 10. Similar to Fig. 9, the majority of the
beam is unaffected causing a large peak close to zero. The channeled particles are deflected
approximately 20mm with less than 5% channeled.
A comparison was made between the angular profile of a beam with no multiple scattering,
with the entire beam going through the crystal, and the deflection as a function of crystal
orientation between the code developed at SLAC (Fig. 11) and Yazynin’s code. The volume
reflection and channeling can be easily observed. The range of orientations of the crystal
for which volume reflection occurs is approximately 1mrad, comparable to the range seen in
Fig. 1. Further modifications need to be made to the code, including removing the artifact
vertical band parallel to the beam and possibly including multiple scattering effects.
Bent crystals have applications for beam collimation. A particle beam can be passed
through a crystal and depending on the orientation of the crystal, various effects can be
observed. A shorter bending radius along with a shorter length of crystal improved the
detection of channeled particles after they have propagated 5m past the crystal. Propagating
the particles through the quadrupole magnet increases the distance the channeled particles
are deflected. The placement of a detector could also be investigated further to improve
the experimental setup. As well, the code could be modified to include negatively charged
particles. It appears that a bent crystal could be used to channel a portion of the positron
beam in FACET.
ACKNOWLEDGMENTS
This research was made possible by the United States Department of Energy Summer
Undergraduate Laboratory Internship (SULI). I would like to thank SLAC National Accel-
erator Laboratory and Stanford University for hosting me this summer. Lastly I would like
7

to thank Uli Wienands for providing me with this interesting project and mentoring me
throughout my time at SLAC.
REFERENCES
[1] S. Møller “High-energy channeling – applications in beam bending and extraction”.
Nucl. Instrum. Meth. A, vol. 361, no. 3, 403-420, July 1995
[2] W. Scandale, “High-Efficiency Volume Reflection of an Ultrarelativistic Proton Beam
with a Bent Silicon Crystal,” Phys. Rev.Lett., vol. 98, no. 15, 154801, Apr. 2007
[3] R.A. Carrigan, “Beam extraction studies at 900 GeV using a channeling crystal”.
Phys. Rev. ST Accel. Beams, vol. 5, no. 4, 043501, Apr. 2002
[4] R.J. Noble, “Proton-Nucleus Scattering Approximation and Implications for LHC Crystal
Collimation,” Nucl. Instrum. Meth. A, vol. 623, no. 3, 872-882, Nov. 2010
[5] U. Wienands, SLAC National Accelerator Laboratory, private communication
8

FIGURES
Figure 1: Angular profile of the crystal representing the angular deflection of the particlesas a function of the crystal orientation. The red points represent when multiple scatteringis included and the green points are when it is not included in the calculations. The crystalin 10mm in length and has a 10m bending radius. The labels indicate the effects that occurat various crystal orientations. The crystal is aligned with the beam at an orientation angleof 0.
Figure 2: Histogram of the displacement of particles after propagating five meters beyondthe crystal in vacuum space. The orientation angle of the crystal is from 0.2mrad to 0.3mradrepresenting the amorphous region.
9

Figure 3: Histogram of the displacement of particles after propagating five meters beyond thecrystal in vacuum space. The orientation angle of the crystal is from -0.3mrad to -0.2mradrepresenting a region with volume reflection (peak on the left) and volume capture (peak onthe right).
Figure 4: Histogram of the displacement of particles after propagating five meters beyondthe crystal in vacuum space. The orientation angle of the crystal is from -0.051mrad to0.049mrad. The peak on the right is channeled particles and the unaffected particles arecentered around 0.
10

Figure 5: Angular profile with 10m/10mm, 5m/5mm, 2.5m/2.5mm bending radius/crystallength. Demonstrates the decrease in multiple scattering as the bending radius decreases.
Figure 6: Histogram of the displacement of particles after propagating five meters beyondthe crystal in vacuum space. The orientation angle of the crystal is from -0.051mrad to0.049mrad corresponding to the channeling region. Shown for three different bending radiiand crystal lengths.
11

Figure 7: Phase space of angle vs position for the input positron beam. The crystal is placedat position=0mm. The beam is offset and only the portion highlighted in green passesthrough the crystal. The remainder of the beam propagates unaffected.
Figure 8: Phase space of angle vs position of positron beam at exit face of the crystal. Notethe scale difference from Figure 7.
12

Figure 9: Histogram of the displacement of particles after propagating five meters beyondthe crystal in vacuum space with only a portion of the beam passing through the crystal asillustrated in Fig. 7. The majority of the beam is not displaced, the left peak is cut off dueto the scale of the graph but reaches its maximum at approximately 80 000 particles. Thepeak on the right represents the channeled particles.
Figure 10: Histogram of the displacement of particles after propagating through a quadrupolemagnet after a small portion of the beam passes through the crystal as illustrated in Fig. 7.Note the scale. The peak on the right represents the particles that were channeled and theremainder of the beam remains unchanged as represented in the peak on the left.
13

Figure 11: Angular profile of the crystal representing the angular deflection of the particles asa function of the crystal orientation. The crystal is aligned with the beam at an orientationangle of 0. This plot is the result of the code developed at SLAC. The vertical line parallelto the beam at the change in angle = 1000microrad is an artifact of the code dependent onthe number of steps. This plot was made using 64000 steps.
14

TABLES
Table 1: FACET ParametersEnergy 23 GeVEmittance 3 µm·radLorentz Factor 45 010Beam Width 81.6 µmDivergence 0.82 µrad
15

Magnet Lattice Design for the Transmission of Power Using
Particle Beams
Daniel Marley
Office of Science, Science Undergraduate Laboratory Internship (SULI)
North Carolina State University
SLAC National Accelerator Laboratory
Menlo Park, CA
12 August 2011
Prepared in partial fulfillment of the requirements of the Office of Science, Department of
Energy’s Science Undergraduate Laboratory Internship under the direction of James Welch
at the SLAC Accelerator Directorate.
Participant:
Signature
Research Advisor:
Signature
Work supported by US Department of Energy contract DE-AC02-76SF00515.
SLAC-TN-12-010

TABLE OF CONTENTS
Abstract ii
Introduction 1
Methods 3
Results 8
Discussion and Conclusions 9
Acknowledgments 10
References 11
i

ABSTRACT
Magnet Lattice Design for the Transmission of Power Using Particle Beams. DANIEL MAR-LEY (North Carolina State University, Raleigh, NC 27695) JAMES WELCH (SLAC Accel-erator Directorate, Menlo Park, CA 94025)
As the amount of electricity generated by renewable energy sources continues to increase,the current method of power transmission will not serve as an adequate method for trans-mitting power over very long distances. A new method for transmitting power is proposedusing particle beams in a storage ring. Particle beams offer an incredibly energy efficientalternative to transmission lines in transmitting power over very long distances. A thoroughinvestigation of the magnet lattice design for this storage ring is presented. The designdemonstrates the ability to design a ring with stable orbits over a 381.733 km circumference.Double bend achromats and FODO cells are implemented to achieve appropriate β functionsand dispersion functions for 9-11 GeV electron beams.
ii

INTRODUCTION
Although the manner for transmitting power in the United States is well established,
there still exist some shortcomings of using transmission lines to efficiently transmit power
over very long distances. This paper evaluates the current state of the electrical power
system (the grid) and explores the idea of using particle beams for power transmission with
a discussion of the magnet lattice that has been designed for such an endeavor.
Background Information
Electrical power is transmitted from power plants to consumers through various changes
in voltage over multiple power lines. Transmission lines transfer most of this power over
very long distances, at a few hundred kilovolts, from the power plants to substations. From
the substations, lower-voltage (a few kV) lines carry power to primary consumers and then
pass through another step-down transformer (120 and 240V) before entering housing devel-
opments. The transmission line is a critical piece of the electrical grid in that it first receives
the raw power from the generators and is responsible for distributing the power at a high ef-
ficiency to substations. The voltages at which these lines operate include 138, 230, 345, 500,
and 765 kV. These transmission lines currently retain an average of about 93% efficiency and
increasing the voltage is one way of improving the efficiency by minimizing resistive losses
[1]. However, they still grow approximately linearly with distance and eventually become an
unfavorable form of power transmission [2]. This property of transmission lines hinders the
ability to share excess power with distant areas experiencing a power deficit. Transmission
lines are also becoming less capable of providing enough power to serve the increased demand
from consumers [3].
1

Motivation & Purpose
In recent years there has been an ongoing shift from fossil fuels to renewable energy
sources. The two main types of renewable energy sources of interest are nuclear and solar
power because they provide the most promise for widespread distribution. Nuclear power
is already a popular energy source with 32 states in the continental United States (US)
hosting at least one nuclear reactor [4]. While most of these reactors are located in the
eastern half of the US, there is a surge of solar power production in the western half of
the US, with California producing the most of any state [5]. Nuclear reactors, however, are
being relocated to different areas of the country that contain a less dense population. As
the efficiency and power production of these forms of renewable energy sources continue to
grow, and investment in transmission lines continues to decline, there is an ever-increasing
need to transmit the power over very long distances. Solar power is generated largely in the
desert of the southwestern US where the population density is very low. Because nuclear
and solar power plants are being placed in locations were very few people live, there is a need
to transmit the power they produce over very long distances. Transmitting this power over
very long distances (from the power plants where no one lives to areas of high population
density) motivates us to propose a new method for transporting power across the country,
and possibly between continents. Fig. 1 depicts a schematic of this process and shows
possible locations for generators and loads.
Particle accelerators are routinely used in high-energy physics experiments around the
world. The particle beams that make these accelerators useful are tremendously energetic
(up to 7 TeV at the Large Hadron Collider) and typically run from a few MeV to a few GeV,
or five orders of magnitude greater than that of current transmission lines. Along with the
tremendous voltages at which particle accelerators operate, they are also incredibly energy
efficient. The primary source of energy loss is synchrotron radiation, which occurs when the
2

particles undergo centripetal acceleration in a storage ring, described by (for electrons):
Plost = 88.5E4I
2πρ∆θ (1)
with the energy, E, measured in GeV, the current, I, in amperes, and the radius of curvature,
ρ, in meters. Incorporating particle beams into the grid will allow for cost-effective power
distribution over incredibly long distances (e.g., around the United States or from North
to South America). To adequately determine the feasibility and viability of using particle
beams for power transmission, multiple factors need to be researched: the current condition
of the grid, the energy efficiency of particle beams, the cost for materials and operation,
the status of other proposed technologies compared to that of particle beams, and the de-
sign of the arrangements of magnets, or lattice, to focus and steer the beams. The work
presented explores the magnet lattice design for the future electron storage ring for particle
transmission.
METHODS
To design the magnet lattice for an electron storage ring, the transfer matrix method
was applied to generate ring designs and analyze the electron stability. The following section
describes the mathematical formalism of the transfer matrix method applied to design the
magnet lattice and the software used to calculate beam stability and the lattice design.
The lattice design was created for an example ring that nearly encloses the United States,
joining the Eastern, Western, and Texas interconnects. The size of this ring represents the
magnitude and scope of this project to efficiently transmit power over very long distances.
3

Transfer Matrix Method
In an electron storage ring, electrons remain in orbit due to magnetic forces from dipole,
quadrupole and even sextupole magnets. These magnets steer and focus the electrons around
the ring with an approximately Gaussian distribution about the ideal orbit. To quantify the
behavior and properties of the electrons, a unique coordinate system has been defined with
respect to the ideal orbit: s along the beam line, x in the radial direction, and y in the
transverse direction, as noted in (Fig. 2) [6].
The lattice, or series of magnets and drift spaces (areas free of magnetic forces) that
define an accelerator, design in this ring currently contains only quadrupoles and dipoles,
although sextupoles can be added later if deemed necessary. The effect that these magnets
have on electrons can be calculated using K, the focusing function:
Kx ≡ 1
ρ2− ec
EB1(s) & Ky ≡
ec
EB1(s) (2)
with B1(s) = ∂By/∂x, e the electron charge, c the speed of light, and E the energy of the
particle of interest [7]. The focal length for the quadrupole magnets is f = 1/(Kl), with
l the length of the quadrupole. The focus/defocus character of quadrupole is a result of
∇ × B = 0 so dBx/dy = −dBy/dx. That is a positive gradient in one direction implies
a negative gradient in the other. In the limit of small oscillations, the linear equations of
motion for an electron in an accelerator can be formed and then solved to reveal the position
and phase functions based on the focusing function and structure of the lattice. The linear
equation of motion is x+Kx(s)x = 0 (can substitute x with y and the derivatives are taken
4

with respect to s) and the corresponding position solutions are [7]
x(s) =
a cos√
Ks+ b
K > 0
as+ b K = 0
a cosh
|K|s+ b
K < 0
(3)
The solutions produced will combine into a pseudo-periodic function that does not repeat
itself exactly, but does follow an approximate sine/cosine shape.
For a given set of initial conditions, x(s0) and x(s0), a matrix equation can be written that
describes the current position, x(s), and phase, x(s), functions due to the beam elements
(quadrupole, dipole, or drift space)
x(s) ≡
x(s)
x(s)
x(s) =←→M(s, s0)x(s0) (4)
The form of this equation provides the necessary information for determining the transfer
matrix,←→M for each beam element.
K > 0 :←→M(s, s0) =
cos(
√Kl)
1√K
sin(√Kl)
−√K sin(
√Kl) cos(
√Kl)
(5)
K = 0 :←→M(s, s0) =
1 l
0 1
(6)
K < 0 :←→M(s, s0) =
cosh(
|K|l) 1
|K|sinh(
|K|l)
|K| sinh(
|K|l) cosh(
|K|l)
(7)
5

For the sector dipole magnet of length l, K > 0 (= 1/ρ2) and the matrix simplifies to
←→M(s, s0) =
cos(l/ρ) ρ sin(l/ρ)
−1
ρsin(l/ρ) cos(l/ρ)
. (8)
For n beam elements, Eq. (4) can be rewritten as
x(s) =←→M1(s1, s0) ·
←→M2(s2, s1) ·
←→M3(s3, s2) · · ·
←→Mn(s, sn−1)
x(s0). (9)
This matrix product results in a unit matrix [7]. Not only does this help calculate final
position and phase functions, but also the beam stability is contained within this matrix.
If the Trace of the final matrix is less than or equal to 2 (|Trace(←→M)| ≤ 2) there exists a
stable orbit. This result is derived from the requirement that the eigenvalues of the matrix
satisfy the equations: λ1 = 1/λ2, λ1 + λ2 = Trace(←→M), and λ2 − Trace(
←→M)λ + 1 = 0 for
either eigenvalue [9]. This has to be calculated for both x and y to determine stability in
both directions.
Simulation Process & Beam Parameters
With this theoretical formalism in place, Mathematica 8 was used to compute the final
matrix produced from the beam elements. Because the trace of a matrix is easily determined,
the stability of the beams can be calculated in a quick and efficient manner. This allows for
the calculation and frequent manipulation of beam parameters to fully optimize the design
and explore many options in very little time. To calculate the final matrix, the parameters
of the beam need to be defined. These parameters are collected in (Table 1).
After determining the beam stability in Mathematica, the Methodical Accelerator Design
(MAD) software (v 8.52), developed by CERN, was used to input the lattice design and
determine the β functions in x and y, along with the dispersion relation and an output of the
6

coordinates of each beam element. The β functions are very important in accelerator physics
and are derived from the general solution to the linear equation of motion x +Kx(s)x = 0:
x(s) =
εβ cos(φ− θ) (10)
where ε is the emittance of the beam (area in phase space) and β describe the lateral
focusing properties of the lattice. From this equation one can see the maximum amplitude
of the beam is√εβ (≡ σ, the standard deviation). For this lattice, the amplitude should
remain below 1 mm to ensure the beam does not become too wide and begin to be lost
to the enclosure and other nonlinear effects. MAD can determine more complex features
of the beam (nonlinear terms, beam position monitors, horizontal and vertical kickers, RF
cavities, etc.) than Mathematica, and allows the user to input constraints on the system.
MAD is also capable of determining stability, but the location of the instability is unknown
and difficult to find. Being able to input constraints allows the user to have some freedom in
writing a lattice because MAD can calculate the optimal values. However, in some instances
the determined values are not ideal, and it is best to re-compute them using Mathematica.
It was pre-determined that there would be two main lattice elements for the beam: Double
bend achromat (DBA) and a FODO cell. The best mechanism for controlling the dispersion
of the beam was to implement a DBA. Two dipole magnets with a focusing quadrupole
magnet, in x, placed between them comprise a DBA. The usefulness of a DBA is that it
prevents electrons of different energies that travel through the dipole magnet from taking
a different path by eliminating dispersion outside of the DBA. As electrons come through
the first dipole, they are refocused by the quadrupole to pass through the second dipole and
emerge back in the electron bunch as if there had been no bend at all (Fig. 3). Outside
of a DBA it is optimal to include either a doublet or a triplet of quadrupoles to ensure the
beam is not lost and that it remains stable while entering and exiting a DBA [9]. Multiple
7

drift cells are needed to cover the large distances planned by this ring. A cell that consists
of only drift sections and quadrupoles is known as a FODO cell (a segment of a storage
ring that is symmetric about its center), outlined in Fig. 4. These two design elements
were implemented into Mathematica and MAD to yield a stable orbit of electrons around a
storage ring.
RESULTS
After applying the transfer-matrix formalism in Mathematica and then inputing the re-
sults into MAD, three separate cell designs were combined to create a single lattice design.
Two stable cells were created that incorporated a smaller bend radius (≡ Cell 1) and a larger
bend radius (≡ Cell 2) through two different DBAs, and a third FODO cell (≡ Cell 3) was
created. The plots of the β functions can be seen in Fig. 5,6 & 7.
Fig. 5 (Cell 1) represents the DBA with a smaller radius, Fig. 6 (Cell 2) the DBA
with a bigger radius, and Fig. 7 (Cell 3) an example drift section. Table 2 displays the
maximum β functions in x and y, the total length, and maximum dispersion for each Cell.
The β functions, dispersion, and total length vary between the different cells because they
have different quadrupoles, drift spaces, and dipoles. Both Cell 1 and 2 have multiple
quadrupoles implemented into the design. They have different dipoles form one another to
achieve different bend angles as well. Because Cell 3 is just a FODO cell, the quadrupoles
all consist of the same strength and the same separation between them. From the values
used to create these cells, it is possible to see the wide variety in values necessary to gain
stability in the electron orbit simply based on the type of DBA needed.
After the files were created and the stability was verified in Mathematica, MAD was used
to combine these cells into one final ring design (Fig. 8). The ability to vary quantities
and set constraints in MAD made it possible to match β functions across the various cells.
8

Constraints were also applied to ensure the dispersion remained zero outside of the DBAs
and to attempt to keep the β functions below 2000 m. A stable beam was created that is
2355.38 m long, a maximum dispersion of 0.099596 m and a maximum βx and βy of 2188.89
m and 2254.96 m, respectively. These values are not below the desired maximum, but exceed
that value by less than 15% each.
DISCUSSION AND CONCLUSIONS
From the results it was possible to find an electron storage ring that would yield stable
electron motion and cover approximately 381.733 km. This length is short of the desired
10,000 km, but with further work on the MAD program 10,000 km should be easily achievable
by implementing more FODO cells and multiple DBAs. The power of MAD to iterate
through the beam elements and vary them such that the constraints could be met allowed
for the design to be created.
The desired parameters for this lattice made it particularly difficult in finding a large
enough ring that produced a stable orbit. As the lattice became longer and longer, the β
functions became larger and larger. The size of the FODO cells were restricted by the size
of the β functions. The DBAs also became affected by the β function size as well. Meeting
the dispersion requirement was completed by varying the strength of the quadrupole in the
DBA; the β function would grow too large if the quadrupole was too far or too close to
the surrounding dipoles. For future designs, allowing the β functions to increase may make
it possible to more quickly find a stable orbit for the ring. Also, as a result of the given
parameters, the electron beam will contain greater than 300 MJ worth of energy. This is a
tremendous amount of energy traversing the beam and how this energy should be dissipated
needs to be addressed in future beam designs. Regardless of the difficulties in meeting the
pre-determined parameters, MAD made it much easier than expected to find a stable orbit
9

because of its ability to vary parameters and constrain variables.
This lattice design is not the only possible design. If more constraints are revealed, or
if some can be removed, the values that were formed for the quadrupoles, dipoles, and drift
sections may be changed to yield different lattice designs. Some of these possible constraints
may include the strength of permanent magnets that can be manufactured, the width of the
pipe and tunnel, and the cost of tunneling, among others. From here there are multiple steps
that should be taken to turn this example lattice into the final design including nonlinear
terms, RF cavities, vertical bends to match the curvature of the earth, and creating more
complex DBA cells. It is also important that the terrain be more thoroughly analyzed and
a ring be designed that can more efficiently navigate the landscape.
With this design, a first step in demonstrating the possibility of this project has been
taken and it proves the feasibility in at least achieving stability in a ring of this magnitude.
Transmitting power over very large distances has gained plausibility from this design and
encourages the exploration of other factors in developing this technology, such as the cost
of construction, manufacturing, cost of operation, and economic advantage over current
transmission lines and other competing technologies.
ACKNOWLEDGMENTS
This work was supported by the U.S. Department of Energy Office of Science through
the Summer Undergraduate Laboratory Internship (SULI) Program. I am very appreciative
of my mentor Jim Welch for not only the opportunity to work on this interesting and very
challenging project, but for also helping me continuously throughout the summer and better
exposing me to accelerator physics. I would like to thank the director, Steve Rock, for
providing a positive learning environment, and for exposing me to many new areas of physics.
10

REFERENCES
[1] U.S. Energy Information Administration. (2009, November 19). Data on electricity transmission and
distribution losses. Retrieved from http://www.eia.gov/tools/faqs/faq.cfm?id=105&t=3
[2] L. Paris, G. Zini, M. Valtorta, G. Manzoni, and N. De Franco (1984). Proceedings from International
Conference on Large High Voltage Electric Systems, 1984 Session: Present Limits of Very Long Distance
Transmission Systems. Paris, France: Global Energy Network Institute.
[3] Schewe, P.F. (2007). The Grid: A Journey Through the Heart of Our Electrical World. Washington, DC:
Joseph Henry Press
[4] U.S. Nuclear Regulatory Commission. (2011, May 19). Operating Nuclear Power Reactors. Retrieved
from http://www.nrc.gov/info-finder/reactor/
[5] Gelman, R., Hummon, M., McLaren, J., and Doris, E. (2010, October). 2009 US State Clean Energy
Data Book. U.S. Department of Energy: Washington, DC.
[6] Sands, M. (1970). The Physics of Electron Storage Rings: an introduction. Prepared for the US Atomic
Energy Commission under contract no. AT(04-3)-515.
[7] Lee, S.Y. (1999). Accelerator Physics. River Edge, NJ: World Scientific Publishing Co.
11

FIGURES
Figure 1: Outline of final storage ring with possible generator and load locations. Overlaidon a map of the US with the 3 interconnects colored: East (Pink), West (Green), Texas and(Orange).
Figure 2: Schematic depicting the coordinate system for electrons in a storage ring.
12

Figure 3: Schematic of a double bend achromat (DBA).
Figure 4: Diagram of a FODO lattice using optical lenses to represent quadrupoles. Thespaces between each lens represent the drift spaces in a lattice.
13

Figure 5: β function for stronger DBA, smaller radius.
Figure 6: β function for weaker DBA, larger radius.
14

Figure 7: β function for FODO cell.
Figure 8: β function for combined cell.
15

TABLES
Parameter Value Parameter ValueCircumference 10,000 km Dispersion (max) 0.1 mBeam Energy 10 GeV Dipole Radius (min) 100 mBeam Current 1 A Dipole Field 0.1 TEmittance (ε) 5×10⁻¹⁰ m Quadrupole Gradient (max) 10 T/mβx,y max 2000m σ ∼1 mm
Table 1: Parameters for the storage ring.
Cell βx max. (m) βy max. (m) Dispersion max. (m) Total Length (m)1 1884.85 1960.75 0.099424 584.242 1551.37 1271.54 0.099595 936.503 1954.72 1954.72 0.00 2914.0
Table 2: Maximum β and dispersion values and the total length for the Cells in the magnetlattice.
16

Bunch Profiling Using a Rotating Mask
Mitchell Miller
SLAC National Accelerator Laboratory
Summer Undergraduate Laboratory Internship (SULI) Program
08/19/2011
Illinois Institute of Technology Physics 2012
Mentor: Alan Fisher
-------------------------------------------------------
--------------------------------------------------------
Work supported by US Department of Energy contract DE-AC02-76SF00515.
SLAC National Accelerator Laboratory, Menlo Park, CA 94025
SLAC-TN-12-009

1
Abstract
The current method for measuring profiles of proton bunches in accelerators is severely lacking. One must dedicate a great deal of time and expensive equipment to achieve meaningful results. A new method to complete this task uses a rotating mask with slots of three different orientations to collect this data. By scanning over the beam in three different directions, a complete profile for each bunch is built in just seconds, compared to the hours necessary for the previous method. This design was successfully tested using synchrotron radiation emitted by SPEAR3. The profile of the beam was measured in each of the three desired directions. Due to scheduled beam maintenance, only one set of data was completed and more are necessary to solve any remaining issues. The data collected was processed and all of the RMS sizes along the major and minor axes, as well as the tilt of the beam ellipse were measured.

2
INTRODUCTION
The Large Hadron Collider (LHC) is the premier high energy physics experiment, using
some of the most advanced technology on the planet. This colossal machine, 27 kilometers
around, now collides 3.5 TeV protons (7 TeV center of mass) and will collide at twice this energy
in 2014, the highest collision energy ever achieved. At the opposite end of the scale spectrum,
the proton beam is only a few microns across at an interaction point (IP, where the beams
collide in the four detectors around the ring), requiring extremely precise control and
measurements. It is, therefore, very useful to directly measure the beam cross-section. One
would imagine that this task could prove very difficult, but with the clever application of a few
pieces of basic hardware, one can easily achieve this goal at a low cost.
Outside the detectors, the transverse size of the beams is much larger. At the injection
energy, 450 GeV, the beam size is approximately 1 mm RMS (root mean square, the standard
deviation) and at full energy this size drops to 0.3 mm. As the protons fly around the enormous
ring, they, like all charged particles, emit synchrotron radiation. When low energy charged
particles are bent by an outside influence, such as a magnetic field, they emit radiation with an
intensity that varies with the cosine of the angle to the direction of travel. However, when the
particle is accelerated to near the speed of light, this wide spread is focused into a narrow,
forward beam. The spectrum is also shifted to higher energies. For electrons the midpoint of
the emission spectrum for a bending magnet is called the “critical frequency” follows:
Where is the critical frequency, γ is the relativistic factor, c is the speed of light, and ρ
is the radius of the bending magnet. The x-ray beam is commonly used for experiments in a
wide range of disciplines, from condensed matter to biological studies, but synchrotron
radiation, particularly the visible emission, is often used to understand the profile of the beam
of particles that created it. Optics can image the synchrotron light onto an ordinary CCD to
provide video of the transverse profile of the beam, but this requires electron beams or very
high energy proton beams, and these still often need image intensifiers. Measurement of these
profiles usually requires a camera with a gate faster than the spacing between bunches. The

3
camera is placed in the beam of synchrotron light, at an image point of the particle beam, and
records the profile generated by each proton bunch. These bunches traveling around the ring
are separated only by a few nanoseconds, requiring an incredibly fast shutter. In this very brief
period of time, very little light is gathered by the camera. To compensate for this, many
exposures are taken over many separate passes of the same bunch. This means that several
seconds are necessary to obtain meaningful statistics. Since there are hundreds or even
thousands of bunches in most accelerator rings, measuring a complete profile of every bunch
can take several hours. The LHC is a particularly difficult case, with 2808 bunches spread over
89 microseconds with 25 nanoseconds between each bunch. With a typical integration time of
two seconds per bunch, a full measurement of every bunch would take nearly two hours. This
is obviously not ideal, since the bunch size can change drastically in that time.
One alternative to this method significantly cuts down on the time necessary to take
data, but only provides a mathematical description of the bunch cross-sections, not a tangible
image. By passing a rotating mask consisting of three slots of different orientation, one
horizontal, vertical, and one at a 45° angle, in front of the beam, one can build an intensity
profile in the three different dimensions. From the light that passes through the slot, one can
find the Gaussian shape of the bunch that created it. With this information in three
dimensions, the shape and tilt of the overall Gaussian ellipse can be calculated.
Each bunch returns to the optical system every 89 microseconds. During this time, the
wheel has only moved a small amount. This provides a very large number of data points to
reconstruct the shape of the bunch. Using simple computer software, one can index each point
to a specific bunch and then reconstruct all of the bunches separately from a single set of three
slots. This entire process can be conducted in less than a second, improving performance time
by orders of magnitude.
MATERIALS AND METHODS
The main materials necessary for this project are a photomultiplier tube, rotating mask,
and a driving motor. To test this method, visible light from the SPEAR3 storage ring at SSRL was

4
used in place of LHC synchrotron radiation. More details regarding these components are
found below.
PHOTOMULTIPLIER TUBE
This project requires a small, fast photomultiplier tube to collect intensity data from
bunches. One other necessary feature of this device is resistance to radiation damage. The
entire apparatus being developed in this project will eventually sit in the tunnel at the LHC. This
is a very extreme environment, with very high levels of ambient radiation from the accelerator.
The current choice for PMT is the Hamamatsu R7400U. The “U” specifies a fused-silica window
rather than glass to avoid radiation damage, since glass is easily darkened by the ambient
radiation that is present in the LHC tunnel. This PMT is small, less than 20 mm. in any
dimension, and also has a very fast response time, just below 2 ns[1]. Since the radiation being
measured is entirely in the visible spectrum, no additional equipment, such as scintillators, is
necessary.
ROTATING MASK
Another very important component of this project is the rotating mask. An earlier
version of this component was designed and tested by another student working under Dr.
Fisher in a previous SULI summer program[1]. The wheel has a radius of 100 mm with slots
centered at 80 mm. There are four sets of three slots, each cut so that they will be at precisely
the right orientation as they pass over the image of the beam, which intercepts the wheel at a
45° angle from its X or Y axis. The slots are laser cut to be approximately 15 microns in a very
thin foil which is then sandwiched between two plates of aluminum to protect it. The design
schematics for this component are shown in Fig. 1.
OSCILLOSCOPE
To record the data taken from a scan of the mask, an oscilloscope with a very long
memory and high sample rate was used. The Tektronix DPO4104 was chosen on account of its
wide range of features. This oscilloscope is able to scan five gigasamples per second and record
ten million points in its memory. The high resolution, resulting from the sampling rate, allows
for signals from individual bunches to be resolved it high detail. Since the signal resolution is so
high, however, a large amount of memory is needed to record all the data from one slot.

5
MOTOR
The final mechanical component of this project is the motor that turns the mask. The
motor chosen is the Maxon Sensor DC Motor 118748. This motor is then attached to a gear-
head with a 53:1 reduction factor. This provides the motor with a huge range of speeds,
allowing for a great deal of versatility in the number of data points taken. Additionally, a
resolver head is attached to the rear of the motor which outputs angular position in the form of
a cosine and sine signal. These two signals can be converted to an angular position using simple
software to track which slot is providing a signal at a given time. An example of this output is
shown in Fig. 2.
SSRL
Due to the high levels of ambient radiation in the LHC tunnel which this apparatus will
eventually be used in, it is convenient to test the setup in a safer and more accessible
environment. The Stanford Synchrotron Radiation Lightsource (SSRL) provides an excellent
opportunity to test the behavior and diagnostic abilities of the rotating wheel system. At SSRL,
electrons orbit a storage ring at 3 GeV, creating extremely intense beams of radiation. This
radiation ranges from infrared to hard x-rays. For this experiment, the range of radiation was
restricted to visible light, since that is the only type available for detection at the LHC.
Although the energy range is vastly different, most other beam properties are similar between
the LHC and SSRL. Both have bunches of particles that emit radiation, which is the central focus
of this project. However, one major drawback is that SSRL has no signal digitizer that can
record data from each bunch as it passes in real time. Therefore, at SSRL, the data must be
recorded and processed at a later time. This results in a very large data file that is difficult to
work with.
One should note that there are significant differences between the light measured at
SSRL compared to the ultimate goal of diagnostics at LHC. The intensity and energy of the
radiation produced at SSRL is orders of magnitude higher than that of the LHC. Since this light
was so intense, several filters were necessary to prevent the PMT used in this project from
being overwhelmed. The saturation of the PMT caused a major distortion in the output signal.
This was caused by insufficient time between an successive signals for the capacitors within the

6
PMT to recharge. To remedy this issue, the rotational speed of the wheel was increased,
causing the PMT to be exposed to light for a shorter time, the driving voltage of the PMT was
decreased, reducing the output gain, and a filter was placed in the beam path, decreasing the
amount of light being measured. All of these changes, although resolving the PMT discharge
issue, significantly reduced the signal intensity. Therefore, an amplifier was used to magnify
the output signal. Additionally, the time necessary for a bunch to travel around the storage ring
at SSRL is approximately 100 times faster than at the LHC. This makes the signal analysis much
more difficult because the peaks generated by each bunch are compressed very closely
together.
METHODS
The test of this apparatus was conducted on the diagnostic beam line at SSRL. This is a
beam line that is limited to only visible radiation. A large optical table was shared with two
other experiments to provide a stable, organized test area. A light tight box was constructed
around the mask and PMT housing to reduce ambient light. This setup is shown in Fig. 3. The
light coming from the beam line was first focused with a large lens to a point approximately two
meters away. This lens results in a demagnification of the image by a factor of 8. Along this
axis, several mirrors were inserted at different points so each experiment could acquire the
light as well as a neutral density filter to reduce the amount of light reaching the PMT,
preventing overload. The light for this project was then passed through another lens to
magnify the image by a factor of 3.25, resulting in a net magnification of 0.4063.
In order to obtain a precise focus and magnification measurement, an electronic camera
was placed at the exact point where the mask would be located. A glass slide with a USAF
resolution test pattern, consisting of a series of lines with different sizes, was placed in the path
of the beam. Using software written in MatLab by Jeff Corbett, both the beam and this image
were accurately focused. The test pattern also provided a very precise measurement of the
magnification power of the optical set up.
After the focus and magnification were successfully measured, a light-tight enclosure
was built to ensure that only photons from the synchrotron source were being recorded. The
PMT was isolated in a specially designed box and mounted to an optical breadboard. The

7
motor and wheel were then carefully aligned so that the PMT would focus at 45° from the
horizontal axis of the wheel. This ensured that the angles of the slots were exactly 0°, 90° and
45° when they passed in front of the PMT. Another layer of light reduction was then put in
place using black cardboard and tape to further seal the PMT from ambient light. In addition to
all of these measures, the room in which the experiment was conducted was also dark during
data collection.
Finally, to collect data, a high voltage power supply applied -600 volts to the PMT. A DS
345 signal generator provided a 10 kHz sine wave signal to the motor resolver, allowing for
position measurements. Four signals were then recorded using the oscilloscope: the resolver
drive signal, the cosine output, the sine output, and the PMT signal. A slight modification to the
wheel was made in the form of dark tape placed over all but one slot. The record stored by the
oscilloscope was then limited to the time interval around the passage of just one slot. To
resolve the fast PMT signals, the data was digitized at two gigsamples per second. A full wheel
rotation would create a record of billions of points. By examining one slot at a time, the
resolution was maintained while being limited by the oscilloscope’s ten megasample memory.
This insured that position of the slot was known very accurately, since the data was not being
processed in real time. Under normal working conditions, the sampling rate at the LHC will be
such that only the relevant data is accessed. However, at SSRL, this is not the case, so a large
amount of extraneous data is recorded, making precise position measurements difficult.
The final step of this project was the development of a Python script to process these
signals. The latest version of the script reads all of the data, and then finds the average angular
velocity of the wheel using the cosine, sine, and resolver input signals. Since the cosine and
sine signals are simply amplitude modulations of the drive signal, finding the peak of the drive
signal and checking the value of the cosine and sine signals will give an accurate angular
position.
The script then scans the PMT data for the peak generated by the timing bunch, which is
a large, isolated bunch of electrons used for diagnostic purposes. By isolating each of the
timing bunch peaks, a Gaussian profile is built that corresponds to that bunch only, allowing for
the imaging of single bunches. This can be repeated with any of the bunches, but the timing

8
bunch is the simplest for testing purposes. The profile from each scan were then fit to find the
size of the beam in real space.
RESULTS AND DISCUSSION
This project has successfully shown that this technique is a viable method for
measurement of individual bunch profiles. A scan in each of the three axes was successfully
obtained. From that data, the Gaussian profiles were fit and their sizes were obtained. Figure
4, 5, and 6 each display the scans after being converted into real space with position on the x-
axis and intensity on the y-axis. The Y profile scan is particularly interesting due to the non-
gaussian shape. This abnormality is most likely the result of improper focusing of the beam or
aberrations caused by the optics used to focus the beam.
After fitting a Gaussian peak to each of these profiles, several beam parameters were
extracted for each including height and σ. These values for each axis are shown in Table 1.
The two sets of values for σ result from two different calculation methods. The first, labeled as
‘automated’, uses the motor resolver head signal to calculate angular velocity. Due to the
sampling method used in this project discussed above, this has a large amount of error. One
can see in Fig. 2 that the exact angular position is not well defined, so this measurement,
especially when automated with computer software, is not particularly accurate. The second
value uses a hard coded value for angular velocity. This value was measured using an
oscilloscope to find the time necessary for a complete revolution of the wheel.
One should note the relatively large discrepancy between the expected values and
those which were measured. This error results from diffraction effects of the beam as it passes
through the numerous optical devices before being imaged as well as the incredibly high
amount of precision necessary to properly focus the beam. A lens out of place by less than a
millimeter can change the image size by an enormous magnitude. This is a result, however, of
the current setup and not a defect with the apparatus.

9
ACKNOWLEDGEMENTS
I would like to thank my mentor, Alan Fisher, for allowing me to work on this project. It
was a very valuable experience. I would also like to thank Jeff Corbett for assisting me in optical
alignment when Alan was not available. Finally, I would like to thank the US Department of
Energy for providing funding for this project.
REFERENCES
[1] Lee, Christopher J. Bunch by Bunch Profiling with a Rotating X-Ray Mask. Science Undergraduate
Laboratory Internship (SULI), 22 Aug. 2007. Web. 15 Aug. 2011.

10
APPENDIX A: Figures and Tables
Figure 1: Design schematics for the rotating light mask. One can see four sets of slots at different angles, generating each of
the three profiles.
Figure 2: The cosine output from motor resolver for the X Profile scan. Note the envelope in which the 10 kHz resolver sits
within.

11
Figure 3: Light tight box setup. One can see the PMT box (large yellow cable) to the left of the motor and resolver outputs
(thin, multi-colored wires) in the lower section of the image.
Figure 4: The X profile scan taken on the SSRL Diagnostic Beamline showing the Gaussian fit.

12
Figure 5: The Y profile scan taken on the SSRL Diagnostic Beamline showing the Gaussian fit.
Figure 6: The U profile scan taken on the SSRL Diagnostic Beamline showing the Gaussian fit.

13
Table 1: Profile σ values
Profile Expected σ Measured σ (automated)
Measured σ (measured ω)
X 60.94 321.98 234.76
Y 20.31 282.22 169.98
U Unknown 262.86 189.13

14
APPENDIX B: Code # Read data from scope containing 5 signals # Converts time to distance using angle resolver # # Data is read using numpy.genfromtxt which requires a file open in # 'binary read' mode. The cosine signal is then scanned for maxima # to build a carrier frequency profile. This is used to calculate # an average angular frequency for use in time to position conversion # Next, the time and intensity data are read and maxima are found. # These points correspond to the 'mondo' bunches that were observed # during data collection. The time scale is then converted to # position using the previously calculated angular frequency. This # data is all saved to a text file for further use. # # Mitch Miller # 7/22/11 import sys import numpy as np import math as m ##pathList = ["E:\TestProfile.csv"] ##pathList = [r"E:\XProfile_600V_1ND_721.csv",r"E:\YProfile_600V_1ND_721.csv",r"E:\UProfile_600V_1ND_721.csv"] pathList = ["/media/2423-A37F/XProfile_600V_1ND_721.csv","/media/2423-A37F/YProfile_600V_1ND_721.csv","/media/2423-A37F/UProfile_600V_1ND_721.csv"] for path in pathList: ## Define Variables numberOfPeaks = 256 ## 256 for full scan inFile = open(path,'rb') outPath = path.replace('.csv','.peaks.csv') anglePath = path.replace('.csv','.anglepeaks.csv') outFile = open(outPath,'wb') angleOutFile = open(anglePath,'wb') max = 0 sinMax = 0 cosMax = 0 counter = 1 peakCounter = 0 omegaCounter = 0 omegaPeaks = 20 ## 20 for full scan gearRatio = (64. / 3375.) maxCounter = 0 pointCounter = 0 maxArray = np.array([[0,0,0,0,0,0]]) angleArray = np.array([[0,0,0]]) radius = 80000. ## In microns omega = 0 avgOmega = 0

15
## Read data from file sys.stdout.write('Begin Reading Data \n') sys.stdout.write('This will take up to 30 minutes \n') ##data = np.genfromtxt(inFile, dtype=None, delimiter=",")#, skip_header=16, names=['time','cos','sin','res','inten']) ##WINDOWS data = np.genfromtxt(inFile, dtype=None, delimiter=",", skiprows=16, names=['time','cos','sin','res','inten']) ## LINUX numberOfPoints = np.size(data,axis=0) ## Find peaks for Cos and Sin ## NOTE: Only cos peaks are measured directly, ## sin peaks may have some error. Use cos for ## calculations if possible. sys.stdout.write('Begin Angle Peak Search\n') pointsPerSection = numberOfPoints/omegaPeaks while omegaCounter < omegaPeaks: counter = omegaCounter * pointsPerSection cosMax = 0 sinMax = 0 while counter < ((omegaCounter + 1) * pointsPerSection): if data[counter][1] > cosMax: cosMax = data[counter][1] sinMax = data[counter][2] time = data[counter][0] counter = counter + 1 dummyArray = np.array([[time,(cosMax),sinMax]]) angleArray = np.concatenate((angleArray,dummyArray)) omegaCounter = omegaCounter + 1 ## Calculate average omega for time to distance conversion sys.stdout.write('Begin Omega Calculation\n') counter = 1 angleArray = np.delete(angleArray, [0], axis = 0) # Find the maximum of the array and normalize to ensure [-1 < data < 1] absoluteValueArray = np.absolute(angleArray) arrayMax = absoluteValueArray.max(axis=0) if arrayMax[1] < 1:

16
arrayMax[1] = 1 if arrayMax[2] < 1: arrayMax[2] = 1 while counter < omegaPeaks: deltaT = angleArray[counter][0] - angleArray[counter-1][0] deltaTheta = m.tan((angleArray[counter][2] / arrayMax[2])/(angleArray[counter][1] / arrayMax[1])) - ((angleArray[counter-1][2] / arrayMax[2])/(angleArray[counter-1][1] / arrayMax[1])) ##deltaTheta = m.acos(angleArray[counter][1]) - m.acos(angleArray[counter-1][1]) if deltaTheta != 0 and m.sqrt(deltaTheta**2) < 0.25: omega = deltaTheta / deltaT avgOmega = avgOmega + omega pointCounter = pointCounter + 1 counter = counter + 1 avgOmega = avgOmega / pointCounter avgOmega = avgOmega * gearRatio avgOmega = avgOmega * avgOmega avgOmega = m.sqrt(avgOmega) sys.stdout.write('Avg Omega = ') sys.stdout.write(str(avgOmega)) sys.stdout.write('\n') ## Save angle peaks np.savetxt(angleOutFile, angleArray, delimiter = ',') ## Scan each section for largest value and save inensity ## and position. sys.stdout.write('Begin Main Function\n') counter = 0 pointsPerSection = numberOfPoints/numberOfPeaks while peakCounter < numberOfPeaks: counter = peakCounter * pointsPerSection max = 0 while counter < ((peakCounter + 1) * pointsPerSection): ## Record point if it is larger than the previous if data[counter][4] > max: max = data[counter][4] time = data[counter][0] maxCounter = counter counter = counter + 1 ## Convert time to position and record all relevant data in maxArray ## [Time, Position, Cos, Sin, Drive, Intensity]

17
position = radius * avgOmega * time dummyArray = np.array([[time,position,data[maxCounter][1],data[maxCounter][2],data[maxCounter][3],max]]) maxArray = np.concatenate((maxArray,dummyArray)) ## Print current peak number and omega for debug ##sys.stdout.write('Counter = ') ##sys.stdout.write(str(peakCounter)) ##sys.stdout.write('\n') peakCounter = peakCounter + 1 ## Delete first row [0,0,0,0,0,0] from array maxArray = np.delete(maxArray, [0], axis = 0) ## Save array of maximums to a text file ##output = ''.join('Average Omega = ',str(avgOmega),'\n') ##outFile.write(output) sys.stdout.write('Saving Data\n') np.savetxt(outFile, maxArray, delimiter = ',') sys.stdout.write('File Complete\n') inFile.close() outFile.close()

Measuring Cluster Relaxedness
Blythe Moreland
University of Michigan
Office of Science, Science Undergraduate Laboratory Internship Program (SULI)
SLAC National Accelerator Laboratory
Menlo Park, California
August 18, 2011
Prepared in partial fulfillment of the requirements of the Office of Science, Department of
Energy’s Science Undergraduate Laboratory Internship, under the direction of Risa Wechsler at
the Kavli Institute for Particle Astrophysics and Cosmology at SLAC.
Participant: Blythe Moreland __________________________________
Research Advisor: Risa Wechsler __________________________________
Work supported in part by US Department of Energy contract DE-AC02-76SF00515.
SLAC-TN-12-011

Contents
1 Introduction 2
2 Methods 3
2.1 The simulation . . . . . . . . . . . . . . . . . . . . . . . . . . . . . . . . . . 3
2.2 The measurements . . . . . . . . . . . . . . . . . . . . . . . . . . . . . . . . 4
3 Results and discussion 6
3.1 Relaxedness measures and halo properties . . . . . . . . . . . . . . . . . . . 7
3.2 Relaxedness and major mergers . . . . . . . . . . . . . . . . . . . . . . . . . 11
4 Conclusion and future work 18
5 Acknowledgements 18
1

1 Introduction
When is a dark matter halo “relaxed”? In our efforts to understand the structure of the
universe, dark matter simulations have provided essential grounds for theoretical predictions.
These simulations provide a wealth of ways of parameterizing and measuring the features of
astronomical objects. It is these measurements on which we base comparisons of our world
and our attempts to re-create it. One of the essential questions dark matter simulations help
address is how dark matter halos evolve. How does one characterize different states of that
evolution? The focus of this project is identifying cluster relaxedness and how it relates to
the internal structure of the halo.
A dark matter simulation consists of an N -body simulation which takes an initial set of
positions and velocities of the dark matter particles and evolves them under the influence of
gravity [6]. Though scientists have so far not been able to detect dark matter particles, the
information from these simulations is still valuable especially given the relationship between
dark matter halos and galaxy clusters. Galaxies sit within dark matter halos and recent
evidence points to filaments of dark matter forming the framework on which galaxy clusters
grow [7]. A dark matter halo is a collapsed group of gravitationally bound dark matter
particles. Subsets of bound particles form subhalos or substructures. The dark matter
simulation is carried out over time - with decreasing redshift (z ) or increasing scale factor
(a = 11+z
). (Thus, z = 0 or a = 1.0 is present-day.) The merger history of a halo can
be represented pictorally by a merger tree. A major merger event occurs when a structure
joins the main halo with the mass ratio between it and the main halo being above a certain
threshold. These events mark important points in the halo’s evolution. And it is at these
events that one hopes, and perhaps is more likely, to relate measures of relaxedness to this
mass accretion.
Cluster relaxedness is not a well-defined concept. Rather a set of qualities are defined
that one expects a “relaxed” cluster to have. One expects a relaxed halo to have a roughly
2

isotropic density distribution. Most of the particles should be part of the main halo rather
than bound in substructures. Taking into account kinematic information of the halo, one
does not expect a proportion of the particles’ energy in kinetic energy that goes far beyond
virial equilibrium.
With our measures of cluster relaxedness, we want to investigate its relationship to these
major merger events. We’ll first look at how measurements of different aspects of relaxedness
relate to each other and to other aspects of a halo’s internal structure. We’ll then look at
how these measurements behave in response to major mergers.
2 Methods
2.1 The simulation
Our dark matter halos are from the Rhapsody (Re-simulated Halo Sample for Statistical
Observable-mass Distribution Study) catalog [9]. The sample includes 110 halos with virial
mass log10Mvir = 14.8 ± 0.05 M/h and this puts the halos in the regime of “massive”
halos. The parent simulation is called Carmen of the LasDamas suite of simulations that
originally ran with a 1000 Mpc/h size box and 11203 collisionless particles and a softening
scale of 25 kpc/h. Wu’s process of curating these massive halos was to select halos in a high
but narrow mass bin, zoom-in on them and re-simulate them at higher resolution. Such a
bin omits enough particles to be able to run for high resolution but admits a statisticially
appreciable number of halos. The resulting smoothing scale is 6.7 kpc/h. This resolution
gives us significant substructures and a rich, unique probe into halo evolution. The data cited
in the ensuing sections is the output of the halo-finder and merger tree at 100 “snapshots”
of the simulation. These snapshots are spaced equally in log a, thus the time in gigayears
(Gyr) between each snapshot is not constant.
3

2.2 The measurements
The relaxedness measurements (which will be shortened to RMs) considered here are taken
from the literature and in particular from Neto’s paper on CDM halo structure [4]. They
are described below:
(i) Concentration:
Navarro, Frenk & White [3] proposed a simple model to approximate the density profile of
a dark matter with two free parameters:
ρ(r)
ρcrit=
δc(r/rs)(1 + r/rs)2
(1)
ρcrit is the critical density of the universe - the density required for a closed universe. δc
is called the characteristic density and rs, the scale radius. This profile has done well at
parameterizing dark matter halos close to virial equilibrium. The NFW profile indicates two
major regimes where different power laws dominate. This rs tells us something about the
shape of the density profile as it corresponds to the transition between the two power laws.
The concentration measurement is defined as cvir = rvir/rs where rvir is the virial radius of
the halo. This value relates to how much of the halo is in this denser region.
(ii) NFW fit error :
Since the NFW profile best describes large, relaxed halos. The χ2 value [4] used to evaluate
the goodness of fit when fitting the profile may be an indicator of relaxedness:
χ2 =1
Nbins − 1
Nbins∑i=1
1
wi[log10 ρi − log10 ρNFW (δc; rs)]
2 (2)
Where wi is the number of particles in bin i.
For (i) and (ii) the fitting process plays a role in determining the values. The IDL function
MPFIT.pro was used to minimize the χ2 value. The halo is binned initially in 32 bins
spaced equally in log10(r/rvir), with the innermost bin beginning when log1 0(r/rvir) = −2.5
4

and the outermost bin ending at rvir. Then bin edges were removed until the bin was at
least .02Mpc in width, which is around 3× the softening length. The density is spherically
averaged by counting the particles within each bin and dividing by the volume of the bin. In
the calculation of χ2, the bin is weighted by the number of particles it contains. When the
fitting was particularly difficult, MPFIT would sometimes return a value of 0.0 or 1.0 for 2
at low snapshot number. This seemed to be a feature of how the value was stored within the
program so we ignore these values in our analysis. Lastly, the minimum number of particles
to consider an NFW fit was 50 and this was the threshold used for all other RMs as well.
(iii) Substructure mass fraction [4]:
fsub is the total mass inside substructures whose centers are within the virial radius of the
center of the main halo divided by the mass of the main halo. This value should reasonably
be between 0 and 1 but may rise above 1 if there is complex subhalo structure contained
within the halo as well as a large subhalo whose center lies at the outskirts of rvir.
(iv) Center of mass displacement [4]:
Take the difference between the average position of particles in the halo (the center of mass)
with the position of the particle at the bottom of the potential well. A low s value describes
a radially symmetric mass distribution.
s =|rc − rcm|
rvir(3)
(v) Virial fraction [4]:
Compute 2T/|U | where T is the total kinetic energy of the halo particles within rvir (with
respect to the halo center) and U the gravitational potential. This value addresses the
dynamic state of the halo and how close it is to dynamic equilibrium.
5

3 Results and discussion
This section is organized as follows: Section 3.1 deals with measurements taken to establish
a connection between properties of the halo at low redshift and characterizations of the
full trajectory of the halo’s growth. Section 3.2 focuses on behavior of RMs around major
mergers. Note also that while the Rhapsody catalog officially contains 110 halos, 106 were
put through the following analyses.
Definition of Major Merger: In this project, a major merger is said to occur at
timestep ti when Mi−1/Mi < 0.70 where Mi is the mass within the virial radius of the center
of the halo at time i. This gives a distribution of most-recent MM as seen in Figure 3:
Figure 1: Fraction of all major mergers occuring within a scale factor bin (solid). Thefraction of halos’ most recent MM occurring within the bin is overplotted in the dotted line.
6

3.1 Relaxedness measures and halo properties
Figure 3.1 gives an array of plots with the RMs plotted against one another with information
taken at a = 1.0 and Table 3 gives Spearman ranked-correlations. The clearest relations
appear between fsub and s, fsub and c, and fsub and s. The more mass is in substructures,
which orbit the center, the less likely it is for the distribution to be isotropic. Thus in cases
of higher fsub and s values, the mass has a wider spatial distribution, skewing the spherically
averaged concentration calculation higher.
Concentration has been shown to correlate with formation time [8]. Defining when a halo
has “formed” can be a bit arbitrary, though it is clear some sort of time marking when halo
gained some proportion of its mass would differentiate halos. While the final mass of all 106
halos lie within a narrow mass range, their rates of accumulating mass can be quite diverse.
a1/2 is defined as 11+z1/2
where z1/2 is the redshift at which the halo first exceeds half of its
final mass (.5M0). Figure 3.1 shows the distribution of a1/2 values for the halos.
Another way of characterizing the formation history is by fitting the full trajectory of
the mass accretion history (MAH). In [8], this can be fitted by a simple power law with one
parameter α and this model is adapted here (S is an arbitrary threshold):
M(a)
M0
= e−αz (4)
Where M0 is the mass of the halo at z = 0. And the characteristic epoch of formation,
denoted ac, can be derived from:
ac =a0α
S=α
2(5)
Since a0, our intial scale factor, is 1, and the same value of S as [8] is taken. While a1/2
has less scatter in its calculation, it also does not incorporate as much information of the
7

Figure 2: Off-diagonal plots are scatter plots of the relaxedness measurements at a = 1.0.On the diagonal are histograms of the values.
MAH as ac does. These characterizations of the MAH are plotted against the RMs taken at
a = 1.0 in Figure 3.1 with correlation statistics in Table 7. It happens that the correlation
between ac and last MM time is higher than that for a1/2 but for both measurements we get
strong anti-correlations with concentration. This agrees with the strong correlation between
8

Figure 3: Table of correlation and significance values for the relationships examined in 3.1.The values are given as they appear left to right and top to bottom in 3.1
Measure vs. Measure R - correlation p-valueCvir vs. χ2 -0.367836 9.70663e-05Cvir vs. fsub -0.587884 2.78713e-11χ2 vs. fsub 0.579312 6.26867e-11cvir vs. s -0.579909 5.92881e-11χ2 vs. s 0.447961 1.31010e-06fsub vs. s 0.607516 3.97083e-12cvir vs. virial ratio -0.117528 0.227964χ2 vs. virial ratio -0.000186086 1.00000fsub vs. virial ratio 0.189561 0.0505157s vs. virial ratio 0.0116872 0.904910
Figure 4: Table of correlation and significance values of relaxedness values and concentrationwith the time of the last major merger.
Measure vs. Last MM R - correlation p-valueCvir -0.435212 2.80388e-06fsub 0.437618 2.43454e-06s 0.278723 0.00364790χ2 0.291659 0.00230319virial ratio 0.0778430 0.425470
9

Figure 5: At left, a histogram of the ac (top) and a1/2 (bottom) values calculated for the106 halos considered in the sample. At right, the a1/2 distribution is reproduced but withsmaller bin size to show detail
z1/2 and c200 in [2]. Though in that paper, the correlation between z1/2 and c200 is stronger
than that between c200 and fsub. But they find both correlations to be strong. In general,
among the common measurements, all of our |Rs| values are higher than those found in [2]
but the relative values between relations are indeed similar.
Among relaxedness measures, χ2 has the weakest correlation. Furthermore, one can still
see a strong distinction in the MAHs when halos are taken from the ends of the distribution
of the RMs at a = 1.0. For the measurements of cvir, fsub, s, χ2, and 2T/U , the halos with
the top and bottom 20% values (21 halos) are taken and at each timestep the median value of
their mass history is plotted. The results are seen in Figure 8. How well the measure does in
distinguishing the two regimes could be taken as the maximum separation between the two
averages for each measurement. Incidentally, the measurement with the largest separation
is concentration. At this point it is noted that the virial ratio correlates poorly to the other
RMs and as seen in Figure 8 does little to separate out halos’ histories. This may be due to
10

the omission of a surface pressure term [5] but the measurement will be dropped from most
of following discussion.
Figure 6: Different definitions of formation time are plotted against RMs at a = 1.0 andconcentration. See Table 7 for correlation values
3.2 Relaxedness and major mergers
How recent states of relaxed measures correlate with the full trajectory of the MAH is
affected by how such measures behave around major merger events. A major merger implies
an unrelaxedness but the response seen in the RMs may not be seen directly, nor solely, at
the reported time of the major merger since a merger may be ongoing for several snapshots.
There is also a question of where do we want to look for MMs in most of our analysis. At
11

Figure 7: Table of correlation and significance values for the relationships examined in 3.1.The values are given as they appear left to right and top to bottom in 3.1
Formation time vs. Measure R - correlation p-valueac vs. Cvir -0.746015 2.98065e-20a1/2 vs. Cvir -0.743025 5.05537e-20ac vs. χ2 0.583755 4.13028e-11a1/2 vs. χ2 0.541274 1.74920e-09ac vs. fsub 0.810633 3.74928e-26a1/2 vs. fsub 0.737966 1.21578e-19ac vs. s 0.651351 3.04152e-14a1/2 vs. s 0.621948 8.68429e-13ac vs. MM time 0.592732 1.74371e-11a1/2 vs. MM time 0.509901 2.0259e-08
Figure 8: Solid lines show the averaged MAH for top 21 halos (black) and bottom 21 halos(blue) for 5 measures. Dashed lines show 25% and 75% values. (a) Cvir, (b) fsub, (c) s, (d)χ2, (e) virial ratio.
12

early times, the mass may jump considerly with the addition of only 1000 particles. In Figure
3.2 is plotted the distribution of relaxed measures across all recorded snapshots on the left,
and at all major mergers on the right with values of the 183 major mergers occurring after
a = .4 overplotted. Looking at the MM at all times introduces too much noise from the
measurements of relatively few particles whereas the distribution for a > .4 shows a larger
in mean value.
Figure 9: At left are the distributions of the RMs across all recorded snapshots and at leftthe distributions of values that occur at MM. In particular, the values for MMs occurringafter a = .4 are shown in the dotted line.
Very simply, one can look at the initial response of the RMs to the major merger. Figure
10 shows the values of fsub, and s normalized to the value taken on at the MM and for
halos whose last MM occurred after a = .4 for 3 snapshots before and 4 snapshots after
13

the major merger (this resulted in 68 halos). fsub and s where chosen since they have the
strongest correlations to formation time and unlike concentration have little systematic error
in their measurements. The lines are colored to reflect the jump in mass from the previous
snapshot to this one, thus bluer lines indicate smaller jumps in mass and green/yellow lines
more so. Since the lines are converge to 1 at time 0.0, the radial distribution of colors on
both sides of the vertical through that point give some indication of how fsub immediately
changes around the MM for different mass jumps. Particularly for fsub the green lines are
concentrated within 26o of the vertical, and the most dramatic drops from before the MM to
the MM are by lower mass jumps, for which the merger may have already mostly happened.
Little besides an intuititon for the varied responses in the structure to the major merger
can be deduced from Figure 3.2, so Figure 3.2 gives boxplot information for bins .5 Gyr in
width. fsub values depart from the MM value in a much narrower range than does s though
there is a 60% spread in values between the upper and lower quartiles. Given that s often
exhibits a periodic nature when looked at across snapshots - presumably as structures cross
and re-cross the halo - this seems reasonable. In this mass range it is noted that younger
halos are less able to disrupt their substructures [1] so the extended presence of mass in
substructures is also unsurprising. Furthermore, our definition of MM time helps enable this
since it is set when these particles first enter the virial radius.
It is logical to then ask how long a halo stays “unrelaxed”. Again fsub and s are considered.
To determine when a halo first becomes unrelaxed after a MM, the thresholds set by [4] were
first used. These were fsub < .1 and s < 0.07. For s, this threshold still allowed us to see a
significant number of halos to settle. For fsub, only 3 out of 68 settled within the time from
their MM to a = 1.0. It took those three halos, 11,18, and 17 snapshots to get below .1. The
average fsub value at the time of major merger was .509 among these 68 halos. So to look
at more points, a threshold of .20 was selected. In this case, only 8 were not able to relax
and these halos were given a “time to relax” of ∞. Interestingly, there seemed no evident
14

Figure 10: A stacked view of all the MMs occurring after a = 0.04 and within 4 snapshotsof a = 1.0 where the RM value normalized to RM(amm) is plotted against the time in Gyrfrom the major merger. A negative value implies such a time before the MM. The value atleft is for fsub and on the bottoms. The top right isolates the halos with log10(Mf/Mi) > .5.The line color attaches lower values of the mass jump (log10(Mf/Mi)) to the bluer end ofthe spectrum and higher values to the redder.
15

Figure 11: These plots describe the information in Figure 10. Time is binned by 0.50 Gyr.The solid line connects the medians, the dotted lines the upper and lower quartiles and theplus signs the maximums and minimums.
Figure 12: The scale factor of a halo’s last MM and the period afterwards that it remainedin an “unrelaxed” according to different RM measures. The colors correspond to the massgained at that snapshot, lower - bluer, higher-redder.
correlation between the period of unrelaxedness and time of last MM (and again, we are
considering only the most recent MM for a given halo) and to the mass ratio occurring at
the MM (see Figure 12. Possible effects may come from the fsub curves being un-smoothed.
16

Halos that we would not expect to relax as quickly maybe only dip below the threshold for
a single snapshot. Something may emerge if the halos were separated by formation time or
similarly by the fraction of their final mass gained at this step. This may also be a sampling
issue since this analysis considered MMs in a wide time range and yet there stills seems to be
evidence that by a = 1.0, traces ostensibly left by MMs provided enough information with
which correlate formation time with RMs.
Figure 13: Relating the period of time it look for the RM to go below the relaxednessthresholds - chosen here as 0.20 for fsub and 0.07 for s - and the change concentrationunderwent during this time period. The change we observe is the ratio cf/ci where cf is theconcentration when the RM becomes relaxed and ci the the concentration when the MMoccurred.
An interesting relationship we do observe was with respect to how this period of unre-
laxedness related to how the concentration changed over that time period. In Figure 13 we see
the ratio of final to initial concentrations taken with respect to this period of unrelaxedness
after a MM. The fsub plot at left (Rs value of 0.687901) suggests that the shorter this period
of unrelaxedness, the smaller gain in concentration. Yet Figure 12 would motivate that this
happens in a way that is not completely dependent on the amount of mass gained at the
time of the MM. The absence of correlation with respect to the time s is unrelaxed may be
17

because of the smaller timescales in comparison to fsub. Though even when we looked at the
ratio for the fsub time period with the time spent unrelaxed in s, there was little correlation.
4 Conclusion and future work
With sample of 106 massive halos we were able to examine relationships among relaxednessmeasures and see how much relaxedness measurements relate to the evolution of the halo(by way of chosen formation times). These correlations in the end, however, are directlyinfluenced by how these relaxedness measures respond to the most evident drivers of unre-laxedness - major mergers. When we focused on fsub and s we saw what we expected interms of the halo remaining unrelaxed for longer periods of time with respect to fsub. Whatwill certainly be interesting to look further into is how the initial concentration of the halo,the mass jump at the major merger, and scale factor of the major merger perhaps influencetogether the time the halo remains unrelaxed. Future work may involve looking at othermajor mergers besides the most recent ones and incorporate other systems of analysis asidefrom correlation. A technique of time sequence analysis may be particularly exciting.
5 Acknowledgements
This research was made possible by the United States Department of Energy Summer Under-graduate Laboratory Internship (SULI). I would like to change SLAC National AcceleratorLaboratory and Stanford University for hosting me this summer. I would also like to thankmy project advisor Risa Wechsler and her graduate student Hao-Yi Wu for their time,guidance, and support in this project.
References
[1] Gao, L. et al, 2011, The statistics of the subhalo abundance of dark matter haloes,Monthly Notices of the Royal Astronomical Society, vol. 410, Issue 4, 2309-2314p.
[2] Jeeson-Daniel, A., Dalla Vecchia, C., Haas, Marcel R., and Schaye, J., 2011, TheCorrelation Structure of Dark Matter Halo Properties, Monthly Notices of the RoyalAstronomical Society
[3] Navarro, J. F., Frenk, C. S., and White, S. D. M., 1996, The Structure of Cold DarkMatter Halos, Astrophysical Journal, v.462, 563p.
18

[4] Neto, A. F., Gao, L., et al., 2007, The Statistics of Λ CDM halo concentrations, MonthlyNotices of the Royal Astronomical Society, vol. 381, Issue 4, 1450-1462p.
[5] Shaw, L., Weller, J., and Ostriker, J. and Bode, P., 2006, Statistics of Physical Propertiesof Dark Matter Clusters, The Astrophysical Journal, vol. 646, 815-833p.
[6] Steves, Bonnie A. and Maciejewski, A.J., 2001, The restless universe: applications ofgravitational n-body dynamics to planetary, stellar and galactic systems, J W ArrowsmithLtd, Bristol, 133p.
[7] Scoville, N., Aussel H. et al., 2006, Large Structure and Galaxy Evolution in COSMOSat z < 1.1, Bulletin of the American Astronomical Society, vol. 38, 1211p.
[8] Wechsler, R., Bullock, J., Primack, J., Kravtsov, A., and Dekel, A., 2002, Concentrationsof Dark Halos from their Assembly Histories,The Astrophysical Journal, vol. 568, 52-70p.
[9] Wu, H. et al, In preparation
19

An Improved Technique for Increasing the Accuracy of
Photometrically Determined Redshifts for “Blended”
Galaxies
Ashley Marie Parker
Marietta College, Marietta, Ohio
Office of Science, Science Undergraduate Laboratory Internship Program
SLAC National Accelerator Laboratory
Menlo Park, California
August 13, 2011
Prepared in partial fulfillment of the requirements of the Office of Science, Department of
Energy’s Science Undergraduate Laboratory Internship, under the direction of Dr. Deborah Bard,
Kavli Institute for Particle Astrophysics and Cosmology at SLAC.
Participant: __________________________________
Research Advisor: __________________________________
Work supported in part by US Department of Energy contract DE-AC02-76SF00515.
SLAC-TN-12-012

2
TABLE OF CONTENTS
Abstract ……………………………………………………………… 3
Introduction …………………………………………………………. 4
Methods ……………………………………………………………... 6
Results ………………………………………………………………. 8
Discussion and Conclusion .………..……………………………...… 9
Acknowledgments ………………………………………………….. 11
References …………………………………………………………… 12
Figures ……………………………………………………………….. 13

3
Abstract
An improved technique for increasing the accuracy of photometrically determined redshifts for “blended”
galaxies. ASHLEY M. PARKER ( Marietta College, Marietta, OH 45750) DEBORAH J. BARD ( Kavli
Institute for Particle and Astrophysics, Menlo Park, CA 94025)
The redshift of a galaxy can be determined by one of two methods; photometric or spectroscopic.
Photometric is a term for any redshift determination made using the magnitudes of light in different
filters. Spectroscopic redshifts are determined by measuring the absorption spectra of the object then
determining the difference in wavelength between the “standard” absorption lines and the measured ones,
making it the most accurate of the two methods.
The data for this research was collected from SDSS DR8 and then separated into blended and
non-blended galaxy sets; the definition of “blended” is discussed in the Introduction section. The current
SDSS photometric redshift determination method does not discriminate between blended and non-
blended data when it determines the photometric redshift of a given galaxy. The focus of this research was
to utilize machine learning techniques to determine if a considerably more accurate photometric redshift
determination method could be found, for the case of the blended and non-blended data being treated
separately. The results show a reduction of 0.00496 in the RMS error of photometric redshift
determinations for blended galaxies and a more significant reduction of 0.00827 for non-blended galaxies,
illustrated in Table 2.

4
Introduction
The goal of this project is to utilize Sloan Digital Sky Survey’s (SDSS) data along with
machine learning techniques to ultimately increase the reliability of photometric redshift analysis
for blended and non-blended galaxies. Currently in SDSS database, self adjusting algorithms are
used to determine photometric redshifts for all objects as a set, although none of these algorithms
are optimized for galaxies [₁]. This summer research aims determine if more accurate
photometric redshift measurements will result from looking at only galaxy data and separating
blended from non-blended.
A “blended” object is defined by the SDSS database as a light source (e.g. galaxy, star,
etc.) for which intensity analysis shows multiple intensity peaks in the single light source,
meaning there are multiple objects present [₁]. Figure 1 shows a simple illustration of the
deblending process, taken from a paper on the SDSS deblending algorithm [₂]. Within the
database the “frames pipeline” analyzes the data to determine if a light-emitting object is
blended. If so, a de-blending algorithm is used to separate the multiple objects into “child”
objects whose spectra add to become the “parent” image [₁]. After de-blending these “child” light
sources are all treated as separate objects, and are categorized as blended data. Objects that are
flagged as blended are given a unique parentID number greater than zero, otherwise parentID is
set to zero for the non-blended [₁].
This parentID numbering is used in SDSS's newest data release, DR8, which covers
approximately one third of the sky and includes all spectroscopic measurements that will be
taken with this imaging camera [₁]. This research project will use data acquired from SDSS
which includes approximately 900,000 galaxies for which both photometric and spectroscopic

5
data has been recorded. The reason both photometric and spectroscopic methods will be analyzed
is that an accurate redshift measurement, assuming that the spectroscopic is the “true” redshift,
must exist to test results from the new machine learning techniques.
A photometric redshift is measured using photometry, a method of looking at the light
from an object through 5 standard filters (u, g, r, i, z) and using the overall magnitudes per filter
to determine the redshift. The average wavelengths for the SDSS filters are shown in Table 1 [₁].
Photometry is much less time consuming than the alternate method of spectroscopic redshift
determination. In order to spectroscopically measure redshift there must be significantly more
light collected for the object, so the full spectrum can be seen rather than just the intensities per
filter. This makes spectroscopic far more accurate, however due to the large amount of telescope
time it requires, the photometric is the most commonly used method. Telescope time is even more
precious when it is used for a large scale sky survey, this is the reasoning behind efforts to increase the
accuracy of the photometric method.
This is, to my knowledge, an original research project which will yield a photometric
redshift determination method, specifically for blended or non-blended galaxies, which could be
implemented in the next generation of sky survey databases, namely LSST, Large Synaptic
Survey Telescope. This increase in accuracy of photometric redshift measurements will impact
many scientific measurements, which rely on redshift, such as the study of large scale structure
of the universe and gravitational lensing.
The goal was to find a method which yielded results for blended galaxies which were
more accurate than SDSS's photometric redshift values. The goal for the non-blended galaxies
was to determine a method equivalent to SDSS's method, although we did not expect to be
capable of doing a significantly more accurate determination on this data set.

6
In the future I will investigate the scientific application of the, more accurate, photometric
redshifts. Ultimately this work is hoped to be useful for the future LSST database which will not
contain spectroscopic redshift measurements for all objects, and will therefore need to make use
of the photometric method.
Methods
The initial step of the project was to learn SQL, Structured Query Language, which is
used to write queries that acquire data from SDSS. The multitude of data available on SDSS's
database makes it ideal for “training” a machine learning program such that the example data
should show nearly every variation in galaxy type. The data used for the “training” consisted of
approximately 100,000 non-blended galaxies and 800,000 that were blended. The difference in
sample size was unintentional; it is a product of the fact that most of SDSS’s galaxy data is
blended.
This project made use of CasJobs DR8, a program which utilizes SQL queries to acquire
large amounts of data, from the most recent data release. The queries allowed for request of
specific useful quantities such as: spectroscopic redshift measurement, two separate photometric
redshift measurements using “random forest” and “robust fit” methods, magnitudes in the bands
u, g, r, i, z, parentID and uncertainty measurements for all relevant quantities. An example of one
SQL query for non-blended galaxy data, which was used for this research, is shown in Figure 3.
Data was requested for all objects which are of the type “galaxy” and downloaded for use
in the ROOT data analysis framework. Data was requested for both blended and non-blended
objects separately, so that a determination could be made if the photometric redshift

7
measurements for blended galaxies are less accurate than measurements of non-blended objects.
There was an investigation into which of the predetermined photometric redshift determination
methods is most accurate, which was determined to be the “robust fit” technique.
For this research a machine learning technique, specifically TMVA, was used in order to
find a more accurate method for determination of photometric redshift for blended galaxies. The
Toolkit for Multivariate Analysis (TMVA) is a 'ROOT-integrated environment' which allows
multivariate regression techniques to be used to analyze large data sets [₃]. A TMVA regression
script template was edited to include all necessary information about the studied galaxies. The
goal of the script is to start with only the galaxy magnitudes in the 5 different bandwidth filters
(u, g, r, i, z) and from that determine a redshift which is in good agreement with the
spectroscopic value, which is considered the “correct” redshift. Within the script various methods
attempt to determine redshifts, afterwards a given method's results were compared with the
spectroscopic redshift determined by SDSS to see which method gave the best approximation.
The TMVA regression script was “trained” separately for blended and non-blended
galaxies. All available TMVA methods were tested on the data, which include: PDERS,
PDERSkNN, KNN, LD, FDA_GA, FDA_MC, FDA_MT, FDA_GAMT, MLP, SVM, BDT, and
BDTG. All method titles are acronyms which describe the underlying mathematics of the
method, there are far too many methods to describe them all in sufficient detail in this paper, for
specific information regarding the individual methods see reference [3], the TMVA users guide.
The data analysis began by determining the accuracy of the current SDSS photometric method by
comparing it to the spectroscopic data, which was needed to show the improvement of the machine
learning methods used. In this study the accuracy of a given method was determined by an RMS error,
given by:

8
Equation 1.
Where , with z being the determined redshift and the overhead bars in the
equation representing when the average is taken [₄].
Results
On the far right of Figures 4 and 5 the graph shows the difference in redshifts as determined by
spectroscopic and SDSS photometric methods, for non-blended and blended data respectively. From these
figures, 4 and 5, it is clear that for both data sets there are large discrepancies between the photometric
and spectroscopic redshift determinations. It is also clear from the shapes of the curves that the blended
and non-blended data are distinctly different in their shape and reaction to the SDSS photometric method,
thus showing the need for this research. The RMS errors for non-blended and blended data for the SDSS
photometric method are shown in Table 2, 0.0724 and 0.04587, respectively.
In order to determine the most accurate of the TMVA methods, many histograms were produced
showing the photometrically determined redshifts to be compared with the spectroscopic. These are
depicted in Figures 7 and 8, which show the redshifts for the 7 most accurate TMVA methods and the
SDSS photometric method. The best method should have a 2 peak profile similar to the graphs on the far
left of figures 4 and 5, which show the spectroscopic or “true” redshift. Notice that the values end
promptly at zero and do not go negative. Since the current “standard” cosmological theory infers that the
universe is expanding, all galaxies should be moving away from the Milky-Way, making all redshift
values of galaxies positive, therefore a negative value is considered non-physical.
Figures 9 and 10 show the “best” (lowest RMS error) TMVA method redshift values as a function
of the spectroscopic redshift and compare those to the SDSS photometric data as a function of
spectroscopic redshift, for blended and non-blended data respectively. When comparing figures 9 and 10,

9
it becomes obvious that the non-blended data seems very tight where the blended data shows a large
spread, which can partially be contributed to the blended data set being much larger but is also believed to
be attributed to shortcomings of the SDSS deblending algorithm.
Discussion and Conclusion
Table 2 shows that for blended galaxy data the KNN method gave the most accurate results which
are slightly more accurate than the SDSS determination. Table 2 also shows that for non-blended galaxies
the MLP method yields the most accurate results for redshift, significantly more accurate than the SDSS
determination. This was not an expected result; this research began with the hypothesis that a better
photometric method could be determined for blended galaxy data and a similar, but not significantly more
accurate, method would be found for non-blended data. This hypothesis was exactly the opposite of what
was determined by the research: a significantly more accurate photometric redshift determination method
was found for non-blended galaxy data while only a slight improvement was made on the blended galaxy
data.
It is clear, from figures 7 and 8, that the BDT, LD and FDA_GAMT methods, first row right,
second row left and third row right, respectively in both figures 7 and 8, are not the best methods due to
the fact that they clearly include many non-physical redshift values. The BDTG method, shown on first
row right in both figures 7 and 8, is also clearly not the best method due to the large amount of noise in
the data which leads to the strange shape of the curve. The PDERSkNN method, shown in figures 7 and 8,
third row left, yielded an unusual pile-up of redshift determinations at 0 which is not representative of the
actual data. The data from these figures was input into Equation 1, along with the spectroscopic data from
figures 4 and 5, in order to determine the RMS errors for all methods, which are displayed in Table 2.
In conclusion, a significant improvement over the SDSS photometric redshift determination
method was made for non-blended galaxies. This will have far reaching effects on how photometric

10
redshifts are determined for future large-scale sky-surveys, such as LSST. This work should be taken into
account when the de-blending algorithms for the LSST database are being developed since the blended
data clearly behaves differently from the non-blended due to the effects of the de-blending process. These
improved photometric redshift determination methods should also be applied to existing data so that a
more accurate representation of the universe can be seen.

11
Acknowledgments
I would like to express my gratitude to my mentor, Dr. Deborah Bard, for her assistance with this
project. Dr. Bard was invaluable in my research effort; providing her guidance as well as many useful
references along with assistance in troubleshooting and de-bugging my many ROOT macros. I would also
like to thank Dr. Steven Rock, director of the SULI program at SLAC, for his efforts in making this year’s
SULI program a success. This research was funded by the U.S. Department of Energy, and the Kavli
Institute for Particle Astrophysics and Cosmology.

12
References
[1] http://sdss.org, July 2011.
[2] http://www.astro.princeton.edu/~rhl/photomisc/deblender.ps.gz, August 2011.
[3] “TMVA Users Guide”, http://tmva.sourceforge.net/, August 2011.
[4] http://arxiv.org/PS_cache/astro-ph/pdf/0605/0605303v2.pdf, August 2011.

13
Figures
Figure 1: a) here is a “blended” parent object, solid black line, consisting of 3 child objects shown as
colored dotted lines. b and c) shows the corresponding deblended children d) shows the difference
between the sum of the children and the original parent, illustrating the imperfection of the method.
Table 1: The average wavelength, in angstrom, of the 5 model magnitude filters for SDSS DR8 data ₁.

14
Figure 3: This SQL query is requesting data on non-blended galaxies where both spectroscopic and
photometric data is available.
Figure 4: Shows non-blended data: on the far left is the spectroscopic redshift determination, middle
shows the SDSS photometric method and on far right is the difference between the two.

15
Figure 5: Shows blended data: on the far left is the spectroscopic redshift determination, middle shows the
SDSS photometric method and on far right is the difference between the two.
Table 2: Above are the RMS errors, in accending order, computed using Equation 1, of the various TMVA
machine learning techniques as compared to the SDSS photometric method. The * next to some methods
is to indicate the fact that although the RMS may be low, because it was calculated on the redshift interval
of 0 to 1, it is not the best method due to the large number of non-physical redshift determinations.

16
Figure 7: The above figure shows the redshift results of various methods for blended data. Method titles
from left to right beginning with top; BDT, BDTG, LD, KNN, PDERSkNN, FDA_GAMT, SDSS
photometric, MLP.
Figure 8: The above figure shows the redshift results of various methods for non-blended data. The
method titles from left to right beginning with top; BDT, BDTG, LD, KNN, PDERSkNN, FDA_GAMT,
SDSS photometric, MLP.

17
Figure 9: (Left) The “best” redshift determining TMVA method for blended data, KNN, as a function of
the spectroscopic redshift.(Right) The SDSS photometric data as a function of spectroscopic redshift.
Figure 10: (Left) The “best” redshift determining TMVA method for non-blended data, MLP, as a function
of the spectroscopic redshift.(Right) The SDSS photometric data as a function of spectroscopic redshift.

Characterizing the Nanoscale Layers of Tomorrow‟s Electronics
An Application of Fourier Analysis
Christopher Bishop Payne Princeton University
United States Department of Energy
Office of Science, Science Undergraduate Laboratory Internship Program
SLAC National Accelerator Laboratory
Menlo Park, California
August 20th
, 2011
Prepared in partial fulfillment of the requirement of the Office of Science, Department of
Energy‟s Science Undergraduate Laboratory Internship under the direction of Apurva Mehta of
the SSRL division of SLAC National Accelerator Laboratory.
Participant: __________________________________
Signature
Research Advisors: __________________________________
Signature
SLAC-TN-12-013
Work supported by US Department of Energy contract DE-AC02-76SF00515.

2
Abstract
Characterizing the Nanoscale Layers of Tomorrow‟s Electronics: An Application of Fourier
Analysis. CHRISTOPHER PAYNE (Princeton University, Princeton, NJ 08544) APURVA
MEHTA (Stanford Synchrotron Radiation Lightsource (SSRL) Division of SLAC National
Accelerator Laboratory, Menlo Park, CA 94025) MATTHEW BIBEE (Stanford University,
Stanford, California, 94305)
Thin film applications are of great interest to the semiconductor industry due to the important
role they play in cutting edge technology such as thin film solar cells. X-Ray Reflectivity (XRR)
characterizes thin films in a non-destructive and efficient manner yet complications exist in
extracting these characteristics from raw XRR data. This study developed and tested two
different algorithms to extract quantity of layers and thickness information on the nanometer
scale from XRR data. It was concluded that an algorithm involving a local averaging technique
revealed this information clearly in Fourier space.

3
I. Introduction
The next generation of electronic devices will power an increasingly technology
dependent world, requiring industry to be able to manufacture semiconductor chips that are both
smaller and composed of new materials. The semiconductor industry has rapidly grown over the
past three decades as they have pushed the limits of fabrication technology into the nanometer
resolution range. This exponential decrease in device size was hypothesized by Gordon Moore in
1965i and has led to increasingly cheaper devices with more processing power per area than their
more expensive predecessors. Additionally, nearly all semiconductors are now made of silicon,
however the use of new semiconductor materials could yield electronics that are more efficient
and can operate under greater extremes.
To unlock these favorable attributes of these next generation semiconductors, we need to
be able to characterize and analyze materials with a resolution of a few nanometers. Many
different techniques have been developed to perform this analysis, yet the one we will focus on is
called X-Ray Reflectivity (XRR). This technique quantifies parameters of materials by revealing
the number of layers of which the material is composed of and each layer‟s corresponding
thickness, density, and roughness value.ii These parameters are discussed in more detail in the
theory section, but for now, it is sufficient to understand that XRR allows the user to know the
physical structure of a material on the nanometer scale. It should also be noted that unlike other
techniques, XRR does not destroy the sample nor does it require specially prepared samples such
as Transmission Electron Microscopyiii
demands.
The specific focus of this project was to characterize the layers present on silicon carbide
(SiC) wafers that GE is in the process of developing for future use in a wide range of
applications that include wind turbines and hybrid-electric vehicles. iv
It is important to keep in

4
mind though that the XRR analysis techniques discussed in this paper can be applied to a vast
range of cutting edge semiconductor applications that involve nanometer scale layers such as
thin film solar cells and power transistors. Having the capability to characterize these nanometer
layers in the non-destructive manner XRR allows, is a crucial step on the path to developing the
electronics of the future that the world urgently seeks.
II. Materials and Methods
i. Reflectivity Theory
When a multilayer system is illuminated by an x-ray beam of wavelength (λ), the
reflected beam profile measured as a function of the incidence angle, theta (ϴ), contains
information about the layer stratigraphy, density and roughness. Figure 1 shows a simple case of
one thin layer on an infinitely thick substrate. The reflected beam in this case is a coherent
summation of the beam reflected from the top surface and the beam reflected from the buried
interface. The intensity of the reflected beam is then a function of the path length difference
between the beams reflected from these two interfaces. This path length difference is shown in
red in Figure 1.
Figure 1 XRR Experimental Setup
Note the path length difference highlighted in red. This path length difference is a function of ϴ and Z as shown in
Equation 1.
z

5
The path length difference that modifies the phase of the reflected wave can be approximated as
(1)
This extra distance corresponds to a phase difference at the point that the reflected beams
interfere at the detector, dependent on the of the incident beam:
(2)
The beams reflected from the two interfaces interfere constructively if this phase difference is a
multiple of 2π and destructively if the phase difference is an odd multiple of π. This simple
illustration, therefore, suggests that the intensity of the reflected beam is a function of the
incidence angle (ϴ) and is modulated to contain information about the layer thickness.
Under a more rigorous derivation, but still under the kinematic approximation, the
reflected beam intensity is:
(3)v
with being the electronic density a distance z (see Figure 1) into the sample and S defined
as:
(4)
vi
Equation 3 can be rewritten in the following manner:
(5)
As the reflected beam intensity is a function of the electron density gradient into the
sample, it contains information about not only the thickness of the individual layers, but also the
interfacial roughness and density difference between adjacent layersvii
. Figure 2 represents an
ideal situation in which of a particular layer is uniform and instantaneously changes at
a layer interface.

6
As Figure 2 depicts, the non-zero values of dρ(z)/dz correspond to layer boundaries expressed in
terms of z, thus we must arrange Equation 5 to get dρ(z)/dz in terms of intensity. The 1/S4 term
in Equation 5 is a fall-off term which attenuates the intensity value over even a small S domain
and is valid if the interfaces have no roughness. Experimentally we found this fall-off term
ranges from 1/S4 to approximately 1/S
6 for real multilayer samples, thus we developed an
algorithm to calculate this fall-off term on a case by case basis so that it could be removed from
the data. The algorithms that were tested are referred to as dN and 2N in the Results and
Discussion section. With this fall-off term removed by using this algorithm, Equation 5 now has
the form:
(6)
The final step is to take the inverse Fourier Transform which will yield the self-convolution of
dρ(z)/dz:
(7)
Shortly, using some simulations, we will explore how the layer characteristics are encoded in
Equation 7.
The main challenge in converting the original equation, Equation 3, into Equation 7, is to
accurately calculate the fall-off term so that it can be removed. The following sections describe
two algorithms for calculating the fall-off term. Subsequently, we will test the range of validity
Figure 2 Relating density gradients to the sample’s layers.
Substrate
Layer
2
Layer
1
Z Z
Z
𝑑
𝑑

7
of Equation 7, and explore how the various characteristics of the layers and layer stratigraphy are
encoded in the formulation suggested by Equation 7.
ii. Fall-Off and Conversion Algorithm Development Outline
In order to find a solution to the problem outlined previously, I used MATLAB to create
two algorithms that applied two different methods to remove the fall-off term from the intensity
data. Independent of which method was used, the result was then transformed into Fourier space
where sample characteristics such as number of layers present and layer thicknesses were
compared with the information available in Fourier space. As will be discussed later, additional
characteristics such as roughness or density of the layers are thought to be contained within the
Fourier space, but were not fully explored in my study.
To optimize the fall-off subtraction algorithm and to test the range of validity of Equation
7, I used a MATLAB program called Multig, developed by Anneli Munkholm and Sean M.
Brennan. I inputted sample characteristics such as the number of layers present and their
corresponding thicknesses into the program and it outputted a simulated intensity versus ϴ curve.
I then applied my algorithm to the simulated data to test whether the algorithm could return the
sample characteristics I had simulated. I used this simple process to develop and tune my
algorithm until the algorithm yielded the correct characteristics.
Below, the entire process of simulating raw intensity versus ϴ data and then transforming
it into the accessible form of Equation 7 is outlined in five steps. Note that the two different fall-
off removal methods, dN and 2N, are introduced in Step 3, Fall-off Removal.

8
Step 1, Simulate intensity versus ϴ data using Multig
In this example, a 2 nm layer of aluminum (Al) between a 20 nm layer of silicon oxide (SiO2)
is simulated on a SiC substrate (Figure 4). The Multig program then outputs a simulated intensity
versus ϴ profile (Figure 3).
Step 2, Restrict the ϴ Domain
X-rays do not penetrate the sample until ϴ exceeds a critical angle. The kinematic
approximation is known to be inaccurate near the critical angle, therefore, data points below a
certain ϴ threshold are removed from the intensity versus ϴ data set to be operated on.
Additionally, the reflectivity curve for higher ϴ values becomes progressively noisy,
accordingly, data points above a certain threshold are removed as well. Techniques for selecting
favorable threshold values, referred to as theta_low_clip and theta_high_clip, respectively, are
discussed later. Additionally, the log10 of the intensity data is taken to make it easier to operate
on the data over approximately eight orders of magnitude.
Step 3, Fall-off Removal
Apply the dN Method
The main idea behind this method is to take an averaged derivative of the intensity versus
ϴ signal as described by Poust and Goorsky in Enhanced Fourier Transforms for X-Ray
Figure 4 Simulated sample inputted into Multig, no roughness
in either layer.
Al
SiC
SiO2
∞
2 𝑚
20 𝑚
Figure 3 Resulting log(Intensity) versus ϴ simulated curve at 12keV
0 1 2 3 4 5 6 7 8 9-9
-8
-7
-6
-5
-4
-3
-2
-1
0
theta
log(inte
nsity)

9
Scattering Applications, which will minimize the original fall-off component present in the
resulting datasetviii
. The discrete version of this, as we are dealing with a finite dataset is
described as:
(8) ix
Expressed in words, the algorithm takes the jth
intensity & ϴ data point and replaces it with the
„local‟ average derivative of the intensity. The „local‟ area is defined by the dataset ranging from
through and is centered on the jth
data point. By applying this process, the fall-off term
is removed leaving a dataset in the form of Equation 6. As recommended by Poust and Goorsky,
N is selected so that it is high enough to average out noise fluctuations but kept substantially less
than the period of any possible thickness signals. As a result of taking the derivative, the dataset
now trails the original dataset by a quarter of a period of the high frequency oscillations present
in the original dataset.
Or, alternatively apply the 2N Method
The central idea behind this method is to construct a smooth and monotonic curve that
removes the fall-off term from the original dataset while keeping all of its original frequency
content. This is done by taking the local average of the intensity versus ϴ data and recording it as
the fall-off value at that point. As alluded to in Enhanced Fourier Transforms for X-Ray
Scattering Applicationx:
(9)
The method is called „2N‟ as the local average includes the jth
point plus the N data points
between and plus the N points between and . Effective selection of N will be
discussed in detail later.

10
After quantifying the fall-off value at each point, we now subtract it from the
corresponding original intensity values to remove the fall-off.
(10)
The last step in the 2N method is to take the anti-log of all the intensity values that have had the
fall-off removed from them, .
Regardless of whether the dN or 2N method is used, the fall-off has now been subtracted
from the data, resulting in a dataset in the form of Equation 6, shown graphically in Figure 5.
Step 4, Convert ϴ into S
The ϴ values are converted to S according to Equation 11:
(11)
Figure 5 Graphical view of dataset after fall-off has been removed using dN (Top green graph) and 2N(Bottom blue graph)
Note, the dN result includes negative values, as it is the derivative of the log of the intensity. On the other hand, the 2N result is entirely
positive because it is the antilog of the log of intensity minus the fall-off term:
with defined in Equation 10

11
Note that this has an extra coefficient of 2π compared to Equation 4 and that is
subtracted off because there is no interference for ϴ below as there is no x-ray
penetration of the sample. This equation favorably converts the ϴ axis [degrees] into S [m-1
]. For
the more advanced reader, this transforms ϴ into a value related to momentum space.
Step 5, Fourier Space Analysis
Lastly, we take the inverse Fourier transform of the extracted oscillation shown in Figure 5 in
order to quantitatively know the number of layers and their corresponding thicknesses. In
MATLAB, this is done using the built in fft() command and then discarding the results that
correspond to negative frequencies – a mathematical byproduct of any application of fft(). The
final result, expressed graphically, is the approximation of the convolution of the density
gradient of the sample with itself as outlined in Equation 7. Figure 6 is the result from the
simulation we started with:
Figure 6 Fourier transform result
Note peak 4 corresponding to the 2nm layer and peak 3 corresponding to the 20 nm layer. Peak 2 is simply the sum of these two layers, equaling about 22nm.
Also, we see the usefulness of transforming theta[degrees] into S[m-1], which results in an axis expressed in units of meters after the Fourier transform.
0 1 2 3 4 5 6 7 8 9-10
-8
-6
-4
-2
0
theta
log(inte
nsity)
0 1 2 3 4 5 6 7 8 90
0.5
1
1.5
2
2.5
3
theta
inte
nsity -
2N
0 10 20 30 40 50 60 700
100
200
300
400
500
600
nm
am
plitu
de o
f sig
nal
1
2
3
4
5
Al
SiC
SiO2
∞
𝑚
𝑚

12
III. Results
I will now discuss the results from testing the above algorithm against Multig simulations
that included no roughness and roughness. This testing was designed to determine which of the
dN or 2N method for Step 3, Fall-off Removal yielded structures closer to ones used for the
simulation. Also, the parameters theta_low_clip, theta_high_clip, and N were varied to see how
to select them to achieve a consistently accurate algorithm.
i. dN Results With No Roughness Introduced
Using a simulation with no roughness present, such as the simulation of the 2nm of Al
and 20 nm of SiO2 discussed earlier, dN successfully extracted the number of layers present in
the model and their corresponding thickness. It should be noted that although the oscillations
resulting from applying the dN method in Step 3, Fall-off Removal are
out of phase with the
original high frequency oscillations, it does not alter the frequency of the oscillations and thus
does not alter the result of Step 5, Fourier Space Analysis.
One evident shortcoming of the dN method is the existence of a low frequency residue
evident in Figure 7:
Figure 7 Fourier transform result using the dN method on simulated data equivalent to that in Figure 4. Test run at 12keV, with a
theta_low_clip of .2 and an N value of 3. The original data spans 9 degrees of ϴ.

13
This gradual low frequency curve spans from approximately 0 to 10 nm and „drowns out‟ a peak
that should be visible at 2nm in Figure 7. The existence of this 2nm layer is then only revealed
through the difference in peaks at about 22 and 20 nm.
Another observation of the dN results in Fourier space is the relatively strong second
harmonics signals present around approximately 45 nm in Figure 7. The presence of pronounced
harmonics such as these indicates the dataset that is being Fourier transformed is not very
sinusoidal in nature.
Lastly, the characteristics of a multilayer stack that are most readily evident from this
method are the number and thickness of layers present. This capability has only been tested on
one and two layer samples that are situated on a substrate.
ii. dN Results on simulated roughness
Under actual experimental conditions, roughness is present on the layers of any real
sample being tested since no semiconductor sample can be perfectly smooth. To simulate this,
the same simulation above is analyzed, yet with 1.5 Å of roughness added to the SiO2 layer.
Figure 8 show how the roughness affects the intensity versus ϴ signal and the corresponding
application of the dN method, while Figure 9 specifically shows the Fourier transform result.
Figure 8 The top graph is the intensity versus theta dataset for a simulated sample defined in Figure 4 – with 1.5 Å of roughness
added to the SiO2 layer. The second graph is the result of applying the dN method in Step 3, Fall-off Removal.
Note how the high frequency component is greatly attenuated, especially after 7 degrees of theta. In turn, this affects the derivative in this
region too, introducing a pulse like signal.

14
As can be seen in Figure 8, the roughness greatly attenuates the high frequency oscillation for
larger ϴ. Although the Fourier transform result in Figure 9 is very noisy, a sizable peak is now
centered over approximately 2nm. Additionally, the peak with the largest amplitude is now over
20nm, rather than the largest amplitude peak representing the summation of both layers (22nm).
The Fourier transform also contains many large “ringing” oscillations, which do not correspond
to any real layer spacing.
iii. 2N Results With No Roughness Introduced
Using a simulation with no roughness, such as the 2nm of Al and 20 nm of SiO2
discussed earlier, the 2N method extracted the number of layers present in the model and their
corresponding thickness. This success is illustrated in the Figure 10 Fourier transform:
Observing Figure 10, we see three distinct peaks. The first, peak four, corresponds to a thickness
of 2.01 nm while the third corresponds to 20.1 nm. Peak two is approximately the sum of these
Figure 9 The Step 5, Fourier Space Analysis result of the data shown in Figure 8.
Note the many different peaks that have been introduced by the addition of roughness, as compared to Figure 7 when no roughness was present
Figure 10 The Fourier transform result from Step 5, Fourier Space Analysis using the 2N method on the dataset defined in Figure 4
with N set to 18 and theta_low_clip equal to 0.18 .
Note the existence of peak 4, indicating the 2nm layer. This peak is not visible in Figure 7, when the dN method is used.

15
two layers. We notice that the second harmonics are extremely small as indicated by peak 5,
suggesting that dN method enhances the higher harmonic contents. One anomaly is noted for a
peak that appears to correspond to 0 nm. The reason for its existence and its physical meaning is
not understood. We have only used the Fourier method so far to extract information about the
number and thicknesses of layers. It is likely that the height, width and the shape of the peaks in
the Fourier space contain information about roughness and density of the layers, but we haven‟t
explored those characteristics yet.
iv. 2N Results on simulated roughness
Figure 11 shows the result of running the 2N algorithm on the same roughness simulation
described previously in Figure 8 and 9 in the dN section
Figure 11 The top graph is the intensity versus theta dataset for a simulated sample defined in Figure 4 – with 1.5 Å of roughness added to the
SiO2 layer. The second graph is the result of applying the 2N method in Step 3, Fall-off Removal. The bottom graph is the Fourier transform
result from Step 5, Fourier Space Analysis using the 2N method. N is set to 18 and theta_low_clip equal to 0.3 .
Note the introduction of noise from the roughness, especially in the low frequency regions.

16
Just as with the dN simulation, there is the introduction of additional oscillations that do not
correspond to any real layer thickness, especially in the low frequency region, though they are
not as pronounced as in the case of dN method. These roughness-driven additional oscillations
are rounded peaks, while the thickness of the 2 nm layer is denoted by a pointy peak of greater
amplitude, as shown in peak 4 in Figure 11. Also, the peak with the largest amplitude (peak 2)
now corresponds to 20nm, rather than the largest amplitude peak representing the summation of
both layers (peak 4). The same effect occurred using the dN method.
v. Results of altering the theta_low_clip and theta_high_clip bounds on both algorithms
The most sensitive input parameter for both algorithms appears to be the lower ϴ bound
used in Step 2, Restrict the ϴ Domain, a parameter defined as theta_low_clip. To highlight this
fact, Table 1 illustrates the effect of altering the theta_low_clip used in applying the 2N method.
For additional context, the location of the theta_low_clip is plotted in Figure 12.
.
Table 1 Results of changing the lower bounds of theta, theta_low_clip , when the 2N method is applied to the simulation
detailed in Figure 4 but with 1.5 Å of roughness added to the SiO2 layer. N is held constant at 20 throughout. The colored
dots correspond to the points on the Step 3, Fall-off Removal graph in Figure 12 below.
Total deviation is the percent that the 2nm result differs from the actual value plus the percent that the 20nm result differs from
the actual value.
theta_low_clip
Used [ ]
2 nm Layer
Result [nm]
20 nm Layer
Result [nm]
Total Deviation
[%]
0 1.97 20.03 1.78
0.22 2.02 19.86 1.78
0.33 2.38 20.46 23.58
0.38 2.05 19.89 3.72
0.45 2.42 20.40 25.13
0.75 2.50 20.42 27.50

17
To further analyze these findings, Figure 13 displays the Fourier transform of the three
theta_low_clips that have the smallest deviations.
Figure 13 Fourier transform graphs, the results of Step 5, Fourier Space Analysis on the dataset described in Table 1. All
elements are held constant between the graphs, except for theta_low_clip values chosen because they deviated the least in
Table 1. Note that although the theta_low_clip value of 0.38 thicknesses deviates the most, the false peaks in the transform
are rounded, leaving the true peak at approximately 2nm pointed. The peaks in the other transforms are prominently
pointed in nature, which could lead to multiple false readings of small layers
Figure 12 A graph of the first part of the extracted oscillations resulting from the Step 3, Fall-off Removal with colored dots
corresponding to Table 1.
Note the large spike below theta equal to 0.2 and how the oscillations then settle into a regular pattern after a theta equal to about 0.8.
Theta_low_clip = 0
Total Deviation = 1.78%
Theta_low_clip = 0.38
Total Deviation = 3.72%
Theta_low_clip = 0.22
Total Deviation = 1.78%

18
Looking at the results of Table 1, Figure 12, and Figure 13 it is observed that choosing the
theta_low_clip to be the second minima in the high frequency oscillation, 0.38 in the example
case, yields the best combination of layer thickness and true layer detection accuracy. Choosing
alternative theta_low_clips that are more accurate in terms of layer thickness appear to falsely
detect other thin layers.
Additional tests found that using a theta_high_clip always lowered the accuracy of the
algorithm when used against various simulations. Tests were not tried on actual data.
v. Results of altering N value used for the 2N method
It was determined that the most sensible way to choose an appropriate N value was to
observe the visual output of Step 3, Fall-off Removal, both the fall-off line created by the 2N
method and the corresponding graphic with this fall-off line removed. As noted in Figure 14 and
Figure 14 An N value of 4 is used on the dataset defined in Figure 4. The green line in the top picture
indicates the fall-off the 2N method is calculating.
In this case, N is too small, thus the green fall-off calculation too closely matches the original function resulting
in the „clipping‟ seen in the lower blue oscillation graph.

19
Figure 15, an appropriate N value allows the full oscillation to be extracted, rather than an
oscillation with its peak clipped – such as Figure 14.
It is concluded that an N value equivalent to half the points in one period of the high
frequency oscillation accurately maps the fall-off function present in the original data.
Mathematically, this is intuitive because the 2N method will span a full period of an oscillation
when it takes a local average.
IV. Discussion & Conclusion
Separating the reflected beam intensity into a smooth, monotonic falloff term and an
oscillatory terms, and then Fourier transforming the oscillatory terms is a quick and powerful
way of extracting key characteristics of the layers from a sample containing multiple layers.
Based on the simulation test results described in the Results section, it appears that 2N
fall-off subtraction distorts the Fourier space data less than the dN method. Therefore, it is
recommended that the 2N algorithm be employed to assist in extracting information from the
Figure 15 An N value of 6 is used on the dataset defined in Figure 4. The green line in the top picture
indicates the fall-off the 2N method is calculating.
In this case, the green line accurately captures the fall-off with N chosen to be half the number of points in a
period of the high frequency oscillation.

20
XRR data, particularly the number of layers present and their thicknesses. The key distinction
that sets the 2N algorithm apart from the dN algorithm is its low frequency sensitivity, a
characteristic that is critical to the mission of detecting thin layers on samples. The low
frequency artifact that exists in the dN method, as manifested in Figure 7, is simply
unacceptable.
As noted in the Results section, it is recommended a theta_low_clip corresponding to the
second minima of the high frequency oscillation be used with the 2N method. This
recommendation is done with caution, due to the sensitivity of this parameter and it‟s
recommended that this parameter‟s affect on the output of the algorithm be studied additionally.
No theta_high_clip should be used, however, it may be useful to remove a high theta region of
experimental data that traditionally contains a high noise to signal ratio – this needs to be further
explored. Experience has determined that using an N value equal to at least half the number of
points in the high frequency period yields the cleanest extraction of the fall-off function.
It is concluded that using the 2N fall-off removal method combined with the Fourier
analysis is a powerful technique that can reveal the presence of nanoscale layers and their
corresponding thicknesses. This study did not focus on the intensity and the shape of the peaks in
the Fourier space, but there is some preliminary evidence that they may hold information about
layer densities and order. It is recommended that this be explored in more detail.
Even if no connection is established, the current capabilities of this technique are very
useful in analyzing new semiconductor structures that often contain multiple layers of varying
thicknesses. Just knowing the number of layers present and their thicknesses eliminates many
important unknown variables, making modeling of additional characteristics such as layer order
and density less labor intensive. This partial information is often sufficient enough to guide the

21
generation of appropriate stratigraphic models which can then be refined against the raw XRR
data using conventional goodness-of-fit metrics, ultimately resulting in a reliable characterization
of complex multilayer samples.
V. Acknowledgments
This work was supported by the SULI Program, U.S. Department of Energy, Office of Science. I
would like to thank my mentor Apurva Mehta and Matthew Bibee, a graduate student at Stanford
and a former SULI intern, for their assistance in addition to all the administrators of the SULI
program for this wonderful and enriching experience. Finally, I would like to thank Yan Gao, of
GE, for providing interesting samples for testing the effectiveness of the analysis approach taken
here.
VI. References
i Moore, Gordon E. (1965). "Cramming more components onto integrated circuits" . Electronics
Magazine. pp. 4. ii Toney, Michael and Brennan, Sean. “Measurements of carbon thin films using x-ray reflectivity”.
Journal of Applied Physics 66 (4). 15 August 1989. iii Discussion with Apurva Mehta. August 4th, 2011. iv Fronheiser, Jody and Tilak, Vinayak. “Motivation for SiC Device Development and Relevance to
NIST/GE Contract on SiC/SiO2 Interface Measurement Technologies”. March 27th, 2011. v O. Durand. “Characterization of multilayered materials for optoelectronic components by high-
resolution X-ray diffractometry and reflectometry: contribution of numerical treatments”. Thin Solid
Films Volume 450, Issue 1, Proceedings of Symposium M on Optical and X-Ray Metrology for
Advanced Device Materials Characterization, of the E-MRS 2003 Spring Conference. 22 February 2004.
Pg. 51-59 vi O. Durand. vii Toney, Michael and Brennan, Sean viii Poust, Benjamin and Goorsky, Mark. “Enhanced Fourier Transforms for X-Ray Scattering
Applications”. Fourier Transforms – Approach to Scientific Principles. InTech. 2011 ix Poust, Goorsky x Poust, Goorsky

Research and Design of a Sample Heater for Beam Line 6-2c
Transmission X-ray Microscope
Veronica Policht
Office of Science, Science Undergraduate Laboratory Internship (SULI)
Loyola University, Chicago
SLAC National Accelerator Laboratory
Stanford, CA
August 12, 2011
Prepared in partial fulfillment of the requirements of the Office of Science, Department of En-
ergy’s Science Undergraduate Laboratory Internship under the direction of Johanna Nelson
at the Stanford Synchrotron Radiation Lightsource, SLAC National Accelerator Laboratory.
Participant:
Signature
Research Advisor:
Signature
SLAC-TN-12-014
Work supported by US Department of Energy contract DE-AC02-76SF00515.

i
TABLE OF CONTENTS
Abstract ii
Introduction 1
Methods 5
Results 6
Conclusion 13
Acknowledgement 13
Reference 14

ABSTRACT
Research and Design of a Sample Heater for Beam Line 6-2c Transmission X-ray Microscope.
VERONICA POLICHT (Loyola University, Chicago, Chicago, IL 60660) JOHANNA NEL-
SON (Stanford Synchrotron Radiation Lightsource, SLAC National Accelerator Laboratory,
Stanford, CA 94025)
There exists a need for environmental control of samples to be imaged by the Transmission
X-Ray Microscope (TXM) at the SSRLs Beam Line 6-2c. In order to observe heat-driven
chemical or morphological changes that normally occur in situ, microscopes require an addi-
tional component that effectively heats a given sample without heating any of the microscope
elements. The confinement of the heat and other concerns about the heaters integrity limit
which type of heater is appropriate for the TXM. The bulk of this research project entails
researching different heating methods used previously in microscopes, but also in other in-
dustrial applications, with the goal of determining the best-fitting method, and finally in
designing a preliminary sample heater.
ii

INTRODUCTION
Facilities
SLAC National Accelerator Laboratory is one of 13 facilities in the United States equipped
with a permanent source of synchrotron x-rays. Synchrotron radiation is produced at SLAC
in the Stanford Synchrotron Radiation Lightsource (SSRL) by an electron beam subject
to magnetic manipulation along a curved path. The bending of the electron beam’s path
results in a change in the beam’s momentum and the emission of synchrotron x-rays which
can be used to probe structures on the molecular level. The SSRL is equipped with facilities
for several types of characterization techniques including x-ray diffraction, x-ray absorp-
tion spectroscopy, and macromolecular crystallography. Another type of technique which
utilizes synchrotron x-rays is Transmission X-ray Microscopy (TXM). Transmission X-ray
Microscopy is used to produce images of the sample in a way similar to Transmission Electron
Microscopy (TEM), but with several marked advantages.
Beam Line 6-2c at the SSRL consists of a TXM, which utilized intensified synchrotron
x-rays from an electron beam fed through a 54 pole wiggler. A beam of synchrotron x-rays
builds as the electron beam travels sinusoidally through the wiggler’s magnets of alternating
polarity. Transmission X-ray Microscopy is a full field microscope, similar to a visible light
microscope or TEM, that functions by training a focused, monochromatic beam of x-rays
onto a sample where the rays are either absorbed or transmitted. Data is collected from the
transmitted rays by a detector placed downstream of an objective lens. The TXM at Beam
Line 6-2c can be characterized by the high image resolution of 30 nm, large depth of field
(20 - 60 µm), and a variety of imaging techniques. Unlike TEM, the high penetration depth
of the synchrotron x-rays allows thick samples to remain largely intact and make it possible
to image a complete structure. The x-rays range in energy from 5 - 14 keV and by changing
1

the energy of the x-ray beam incident on the sample, information can be gathered about
the chemical structure of a sample. An advantage of using TXM for imaging is the ability
to easily construct 3D tomography of a sample by collecting 2D images at many angles.
The TXM uses hard x-rays to image a wide variety of samples including geological samples,
lithium-ion batteries, and biological samples [1].
There is very limited available space around the sample stage of the TXM on Beam Line
6-2c. Between the pinhole, where the x-ray beam exits, and the zone plates downstream
of the sample is roughly 1 inch of space for the sample and any additional components, as
depicted in Fig. 1.
Introduction of Problem
To gain a better understanding of a sample’s morphology and behavior, some samples
require in situ conditions be maintained during imaging. Certain molecular and chemical
reactions only occur at pressures and temperatures outside of those present in the open air of
the TXM hutch and therefore need to be placed in an artificial reaction environment with an
additional microscope component. The focus of this project has been to develop a heating
device to be used at Beam Line 6-2c for the samples previously alluded to as well as other
potential sample types.
The important characteristics of a heating device are as follows: it delivers well controlled,
confined and measurable heat within a given temperature range and is capable of main-
taining a given temperature for several hours as data is gathered. The heater will ideally
perform between 50-500 C. Because the Beam Line equipment is also used by other users,
the design of this heater must be easily installed and removed. Additionally, the heater
device must physically be able to fit in the sample space of the TXM. A final consideration
is the adaptability of the heater for different sample types; the two most general sample
2

formats used in the TXM are either flat samples or samples contained within a capillary.
An example of a heaters applicability is the real-time imaging of thermally driven reactions
or the observation of a samples behavior and character across a temperature spectrum. For
example, a recently proposed project for use of SSRL facilities would require their samples
be kept at a temperature between 65 and 80 C. The proposers wish to conduct TXM and
X-ray Absorption Near Edge Structure (XANES) imaging in order to study the nucleation
and growth of a ZnO crystal film [2]. XANES is used to better understand chemical com-
position by examining the absorption of x-rays below, throught, and aboce the x-ray energy
necessary to excite a core electron of a specific element.
There are many uses for heating devices in lightsource science and the ability to heat a
sample adds another dimension to our understanding of elemental behavior over a spectrum
of temperatures. Previously, the use of sample heaters in visible light and electron beam
microscopes has successfully imaged the performance of materials at elevated temperatures.
Therefore, by examining these heating devices, I plan to gather information for the design
of a similar heating device to be used for x-ray light based equipment. The heating methods
under consideration in this paper are three types of microelectromechanical resistive heating
and two types of infrared heating: silicon wafer-based resistive, Kapton-based resistive,
ceramic-based resistive, laser-based and infrared-based.
Introduction to Sample Heaters
A heater system is composed of the heating apparatus and a measurement apparatus.
The two general methods of heating we have considered for use in our sample heater are
infrared radiation (IR) and resistive heating methods. Infrared heat sources can be either
coherent like lasers or incoherent like heat lamps. Infrared radiation trained onto the sample
face is partially reflected and partially absorbed, resulting in sample heating. Heat lamps
3

are radiative heaters, which consist of a heating element such as a metal filament that upon
application of a large current radiates infrared light. Resistive heaters function by running
a current through a metal wire with some internal resistance such that internal collisions
of the moving electrons generate heat. This heat dissipates over the surface of the metal
electrode and through the air. These general methods for heating function based upon Joule
heating that running a current through a resistor will result in heat: Q ∝ I2R, where Q is
heat, I is current, and R is resistance. Resistance is a characteristic quality of a material
and depends upon cross sectional area. Note that heat is only proportional to the right side
of the equation.
There are several methods by which the temperature of a heater can be determined. Those
considered in this project are direct measurement with a thermocouple, calibration of the
heater before use, and calculating the local electrical resistance. All three of these methods
are based upon electronic principles and take material properties into account. Calculating
the temperature of a resistive heater requires information about the metal’s resistance and the
current as Q is proportional to power, P: Q ∝ P . A thermocouple functions by measuring
the current gradient across a junction of two different types of metal. By knowing the
resistance of the respective metals you can calculate the temperature at the junction with
the information about the current. There are few methods of heater calibration including
using a heater on a test sample which has very well understood transitional properties. By
comparing the well known materials transition states, such as melting, with the associated
voltage and current applied to the heater you can calibrate the heater’s resulting temperature.
4

For the heating methods which require radiation to travel through the air, the Planck
radiation function effectively describes emitted power per unit area of the emitting element:
I =2hc2
(ehcλkT − 1)λ5
, (1)
where I is the energy per unit time per unit surface area, λ is the wavelength of the emitted
light, T is the temperature of a black body, h is the Planck constant, c is the speed of light,
and k is the Boltzmann constant.
METHODS
My portion of this project consisted of investigating and working on a preliminary design
for a heating device that would ideally adhere to all the previously stated parameters of
removability and the constraints of its heating profile. After researching different methods
of heating, I constructed a decision matrix. From this decision matrix I have deduced
the best heat source options for Beam Line 6-2c. At this point I designed a preliminary
heating apparatus, but due to time constraints did not see through to the beginning stages
of fabrication.
The method by which research was conducted began with searching for any academic
papers that used a given heating method. The papers that contained pertinent information
were collected and used for reference material for constructing the decision matrix. Papers
were either found by conducting Internet searches using Google Scholar, ArXiv, or the Stan-
ford academic journal search engine [3, 4, 5]. In some instances a certain paper was found
in another paper. Where there were no academic papers available relating to a certain heat-
ing method, information was gathered on the heating device from textbooks, manufacturer
websites, and speaking with manufacturers’ engineers. Textbook resources were discovered
5

through Google Books and the manufacturer websites were found through Google search [6].
Based upon the gathered information, I then constructed a decision matrix; the decision
matrix compares and ranks each heating method based upon how well it meets the previously
determined desirable characteristics. Each of these characteristics has been given a weight
1 through 3, where a weight of 3 denotes more importance than a weight of 1. Finally, the
ranks given to the heaters are multiplied by the characteristic’s weight, all of which are then
summed. The heating method that has the lowest weighted rank is determined to be the
best fit for our needs [Tables 3 & 4].
RESULTS
Infrared Heaters
Infrared Heat Lamp Heaters
Infrared heat lamp heaters are on the whole very effective at heating large areas with
high intensity. The heat emitted by these lamps depends upon their color temperature, the
temperature at which a black body would radiate with the same color. There exists com-
mercially available infrared heating filaments, which operate within the desired temperature
range decided upon for our sample heater. The main challenge of designing an infrared heat
lamp heater for use in the TXM is managing to confine the heat to the sample face. As
Fig. 1 shows, the components of the TXM near the sample stage are very close to where
the desired heat would be. In order to preserve the integrity of these TXM elements we
must ensure the elimination of all stray heat from the sample. To combat this problem we
could use a small IR heat filament and create an apparatus such that the beam of infrared
radiation would be focused and manipulated onto the sample. A preliminary design for such
a heating apparatus is pictured in Fig. 2, and features the use of a reflecting mirror to direct
6

the beam and a Cassegrain reflector to focus the beam to a small spot size. The use of a
Cassegrain reflector is based upon the design for a Fourier Transform Infrared Spectrome-
ter [7]. Another way to confine the IR heat would be implementing radiation-containment
chamber made of ceramic.
Overall using an infrared heat lamp would be relatively costly in terms of purchasing
components and the labor that would be required to build a viable heater. An infrared
heat lamp would be difficult to use especially when the sample stage must be moved during
imaging. A typical heat lamp alone costs around $200. A recommendation I would suggest
for making such a system easier to use would be placing the reflecting mirror and Cassegrain
reflector on a mechanical stage, which could be controlled by computer. In this way, the two
moveable components of the heater could be configured to move in sync with the sample
stage. A final aspect to consider is the trade-off between filament size and the emissivity
of the filament. Emissivity a is dimensionless quantity that relates a material’s radiation of
energy to the energy emitted by a black body at the same temperature. Emissivity depends
on several factors including the thickness of a material; thinner materials will have a reduced
emissivity.
Laser Heaters
Lasers are reliable, coherent heat sources; due to their coherence they can be manipulated
in terms of intensity, beam size, polarization, and direction fairly easily. The use of an
infrared laser to heat samples has been previously used in an x-ray setting in laser-heated
diamond anvil cells [8, 9]. These cells simultaneously pressurize and heat a sample and are
able to reach temperatures above 1200 C. In these instances, a double-sided laser technique
is implemented using Nd:YLF lasers. The use of two different lasers allows for minimal
axial temperature gradient on the sample face. This is done by choosing to have the lasers
7

function in complementary modes, one in Gaussian and the other doughnut-shaped modes.
As a result, the axial temperature gradient is approximately 30 C, whereas a similar single-
laser system has an axial temperature gradient of hundreds of degrees. Another positive
aspect of double-sided heating is its level of precision; this system implements several optical
devices to obtain a heating area of 10 - 25 µm [9].
The drawback of having the double-laser system is that the apparatus, pictured in Fig.
3, requires a lot of space and the entire set-up would be very expensive. A laser similar
to those recommended, Diode Pumped Infrared 1030 nm CrystaLaser, is $7,600, including
its power supply [10]. A third reason this method is a poor fit is that the fabrication is
too complicated for the scope of this project. This is a very precise and controlled heating
method though, so I would recommend it in the case where someone could be dedicated to
the design and fabrication of this specific apparatus.
Resistive Heaters
Resistive heaters include a broad range of heaters which most generally are composed
of a base substrate with a metal electrode either embedded in or deposited on top of the
base. Some resistive heaters have additional layers of insulation and electrodes placed on
top of the two previously mentioned most basic layers. The heat character, dimensions, and
physical character depend mostly upon the materials used for the base substrate and the
metal electrode. For this reason, I have addressed three common types of resistive heaters;
silicon-based, Kapton-based, and ceramic-based; separately. Figure 4 shows 3 examples of
each of the three previously mentioned kinds of resistive heaters. Between the three types of
resistive heaters the main areas of disagreement are the 1) operational temperature range,
2) cost, 3) manufacturing process difficulty, and 4) sample applicability.
8

Micro-Hotplate/Microelectromechanical System (MEMS) Heaters
Micro-hotplates and MEMS are fabricated using a silicon wafer as their base substrate
forming a frame and acting as a heat sink. Upon a silicon frame there is a membrane, which
forms a window for radiation to penetrate. These heaters have been used as sample heaters
in TEM systems because of their relative strength and thermal properties. Silicon has a
high heat capacity and is strong at thicknesses above 50 nm, but is brittle at thicknesses
less than 50 nm. Because of silicon’s high heat capacity there is a large heat-drop off
between the metal electrodes and the heater stand. The fabrication method of these silicon-
based heaters has been performed and re-worked by many different research groups and as
such these heaters have been developed to function in a broad temperature range. MEMS
and micro-hotplates are able to operate at a wide range of temperatures with a highest
mentioned operating temperature of 800 C and the average operating temperature of 500
C [11, 12, 13, 14, 15, 16].
The silicon-based heaters perform well and offer a homogeneous heat distribution on the
sample. Beckel, et al. specifically mentioned that the use of an integrated heater to anneal
a crystallized film sample caused it to crack, but also that the annealing of said film took
15% of the time it took using other techniques [14]. Another paper tracked the drift of
nanoparticles in their FOV and concluded that the heat from a spiraled Pt heater was well
distributed. The findings are made based upon how consistent the drift rate of said particles
was as it moved along a given path, giving a good measure of local heat gradient [17]. The
use of resistive heating could effectively heat the sample at a steady, tunable, and readable
temperature. Several previously used systems that require the use of a micro-hotplate have
used either a heating element with multiple connections such that it can simultaneously be
controlled and read, or a system with dedicated components for heating and for temperature
measurement.
9

Several of the papers that I have read have stated in various levels of detail the exact
fabrication methods which indicate that this would be a difficult apparatus to pursue without
outside help. These apparatuses are produced using several nanofabrication and chemical
processes and would only be able to be performed in the cleanroom environment of an outside
nanofabrication lab. Generally, fabrication employs several machining and microfabrication
techniques. A few examples of the type of processes are lift-off technique for the deposition
of the Pt heating element and low-pressure chemical vapor deposition for the placement of a
SiN membrane layer on top of the heating element [11, 12, 13, 14, 15, 16]. Additionally, E.A.
Olson, et al. details specific instructions on how to best choose your conducting material
[16].
There are also many manufacturers and distributors of silicon-based resistive heaters.
Many of the companies that produce these also offer customization services to ensure that the
heater meets the customers specifications. The trade off between fabricating the apparatus
ourselves and buying one from an outside source is cost. One silicon-based micro-heater
(10 mm x 5 mm x 0.2 mm, gold electrode, 350 nm thick) is $82.00 without any customization;
requesting custom dimensions increases the price [18]. Though one heater is not on it’s own
expensive, most companies have minimum order sizes and the outcome is a large, expensive
order of heaters. Another drawback of using the silicon-based heaters is that it, because
silicon is not very flexible, it would only apply homogeneous heat to flat samples. A final
thing to consider is that, as already mentioned, the devices were designed for and used for
TEM and SEM measurements. The use of the TEM and SEM places the micro-hotplate in a
vacuum and as such we cannot assume that our observed heat drop-off will not be the same
as what had been observed in their papers. That said, the spacing between the electrode
patterns would be larger than the x-ray beam diameter and so, expecting that the heat will
be homogeneous in that region is not a terrible assumption.
10

Kapton Heaters
Kapton heaters use Kapton film as their base substrate. Kapton film is characterized
by its excellent thermal and physical properties, which make it a good component for a
prospective sample heater. Kapton film’s limits have been well tested and so many of its
thermal properties are known. Kapton has a thermal conductivity on the order of 10−1 WmK
,
which correlates to high insulative properties. For comparison, Table 1 lists several materials
and their thermal conductivities [19].
There are several companies which specialize in the production of Kapton heaters. The
majority of these companies advertise customizability in terms of dimensions of the heater
and of the metal foil materials used for the metal electrode. The dimensions of the heater,
such as thickness and distance between the electrodes, depend upon the metal material
chosen.
The problem met with using a Kapton-based heater is the maximum operational tem-
perature. Table 2 shows three Kapton-heater companies and the associated maximum tem-
peratures attainable. These listed temperatures are well below what we had hoped for in
a maximum heating temperature (500 C). Kapton film itself maintains its structural in-
tegrity up to temperatures as high as 400 C [19]. This would indicate that the temperature
limitations stem from the metal used for the electrode or the adhesive used in fabrication.
Overall I think that Kaptons physical properties would make it a good material for a
heater. Kaptons flexibilty means it could homogeneously heat both planar surfaces and
surfaces which are gently curved. However, as far as prefabricated heaters go those available
will not operate in the temperature range we require.
11

Ceramic Heaters
Ceramic materials are used as heater substrates because of their favorable physical and
electrical properties including good strength, high temperature stability, low dielectric con-
stant, and high electrical insulation. Ceramic infrared heaters are often used in industrial
manufacturing as well as domestic and pet care applications. More so than silicon- and
Kapton-based heaters, ceramic-based heaters are limited in terms of the dimensions at which
they can be produced to function. Ceramic heaters can be manufactured in many shapes
including squares, circles, and cylinders with the metal wires being embedded on the face
for the square and circle and within the inner portion for the cylinder. This offers some flex-
ibility in applicable samples as you could potentially use a square or circle for flat samples
and a cylindrical for a capillary-bound sample. Unfortunately, the heat is not easily confined
in the case of the square or circular heater with there being too much risk of the TXM
elements surrounding the sample being affected by stray heat. This leaves the cylindrical
heater, which is an excellent option for samples contained within a capillary.
There are several cylindrical ceramic based heaters available commercially and offer some
level of customizability. A ceramic heater generally consists of a ceramic shell with a metal
coil embedded in the wall of the shell. The wires are seldom left uncovered as they reach very
high temperatures; clamshell furnace elements reaching temperatures greater than 1100 C
[20]. The metal wires are usually either covered completely with a thin layer of ceramic or
are partially covered by ceramic bars.
Another option is fabricating a ceramic-based heater by threading a hollow cylinder of
Macor machinable ceramic with a metal wire. Macor retains structural integrity up to
1000 C and has similar chemical and thermal properties to ceramics used in the fabrication of
commercial furnaces. A 1/2” diameter 3 long cylinder of Macor costs $32.00 [21]. Fabrication
12

of this type of heater would be relatively easy with the most difficult portion being threading
the wire in the Macor. A preliminary design of a ceramic-based heater produced in-house at
SLAC is pictured in Fig. 7.
CONCLUSIONS
Based upon the decision matrix in Tables 3 and 4, the best option for our sample heater
is the Kapton-based resistive heater. While the Kapton heaters are not able to function
through the entirety of our desired temperature range, the benefits in terms of size, cost,
and ease of production make Kapton a good option for the current needs of Beam Line 6-2c.
Because the Kapton heater only is applicable to flat or gently-curved surfaces and because it
can only operate up to 200 C, we have chosen a second heating type to cover a wider sample
range. The second heater type is the cylindrical ceramic-based heater. Ceramic heaters are
relatively easy to produce, have several methods of measuring the temperature, and operate
very well within the desired temperature range. The combination of these two heating
methods covers most sample types for imaging in the TXM and covers the characteristics we
desired in a sample heater. Figures 5 and 6 show SketchUp images of the proposed Kapton-
based sample heater to be used on flat and gently-curved sample types [22]. The heater is
based upon a Kapton heater distributed by OMEGA Industries [23].
ACKNOWLEDGMENTS
I would like to thank the Department of Energy and the faculty at SLAC who have made
this internship possible for myself and many other undergraduate students. I would like to
thank Johanna Nelson for mentoring me throughout this project and for ensuring that I had
a meaningful experience at SLAC. Finally, I’d like to thank the other SULI student interns
who helped make this summer wonderful.
13

REFERENCES
[1] J. Andrews, S. Brennan, C. Patty, K. Luening, P. Pianetta, E. Almeida, M. C. H.
van der Meulen, M. Feser, J. Gelb, J. Rudati, A. Tkachuk, and W. B. Yun, “A high
resolution, hard x-ray bio-imaging facility at ssrl,” Synchrotron Radiation News, vol. 21,
no. 3, p. 26, 2008.
[2] A. Cruickshank, “In-situ txm of the nucleation and growth of electrodeposited zno
nanocrystals,” June 2011, proposed Usage.
[3] Google Scholar Database. [Online]. Available: http://scholar.google.com/
[4] ArXiv: Open access Scholarly Database. [Online]. Available: http://arxiv.org/
[5] Stanford Research E-Library. [Online]. Available: http://www-group.slac.stanford.
edu/library/
[6] Google Books Internet Database. [Online]. Available: http://books.google.com/
[7] S. Slobodan and Y. Ozaki, Eds., FT-IR Imaging Hardware. John Wiley and Sons,
2011, sections 3.1-3.2.
[8] Y. Meng, G. Shen, and H. K. Mao, “Double-sided laser heating system at hpcat
for in situ x-ray diffraction at high pressures and high temperatures,” Journal of
Physics: Condensed Matter, vol. 18, no. 25, p. S1097, 2006. [Online]. Available:
http://stacks.iop.org/0953-8984/18/i=25/a=S17
[9] G. Shen, M. L. Rivers, Y. Wang, and S. R. Sutton, “Laser heated diamond cell system
at the advanced photon source for in situ x-ray measurements at high pressure and
temperature,” AIP, vol. 72, no. 2, pp. 1273–1282, 2001.
14

[10] T. Zaki, August 2011, person correspondance with CrystaLaser technical engineer.
[Online]. Available: www.crystalaser.com
[11] D. Briand, A. K. B. van der Schoot, U. Wiemar, N. Barsan, W. Gpel, and N. de Rooij,
“Design and fabrication of high-temperature micro-hotplates for drop-coated gas
sensors,” Sensors Actuators B, vol. 68, pp. 223–233, 2000. [Online]. Available:
www.elseview.com/locate/snb
[12] E. de Smit, I. S. J. F. Creemer, G. H. Hoveling, M. K. Gilles, T. Tyliszczak, P. J.
Kooyman, H. W. Zandbergen, C. Morin, B. M. Weckhuuysen, and F. M. F. de Groot,
“Nanoscale chemical imaging of a working catalyst by scanning transmission x-ray mi-
croscopy,” Nature, vol. 456, pp. 222–226, 2008.
[13] M. Z. nd E.A. Olson, R. Twesten, J. Wen, L. Allen, I. Robertson, and I. Petrov, “In
situ transmission electron microscopy studies enabled by microelectromechanical system
technology,” J. Mater. Res., vol. 20, no. 7, pp. 1802–1807, 2005.
[14] D. Beckel, D. Birand, A. Bieberle-Hutter, J. Courbat, N. F. de Rooij, and L. J. Gauckler,
“Electrical conductivitiy of lscf thin films for sofc on micro hotplates,” work performed
by members of ETH Zurich and the University of Neuchatel.
[15] M. Jeule and L. Gauckler, “Miniaturised arrays of tin oxide gas sensors
on single microhotplate substrates fabricated by micromolding in capillaries,”
Sensors and Actuators B, vol. 93, pp. 100–106, 2003. [Online]. Available:
www.elseview.com/locate/snb
[16] E. A. Olsen, M. Y. Efremov, M. Zhang, Z. Zhang, and L. H. Allen, “The deisgn and
operation of a mems differential scanning nanoncalorimeter for high-speed heat capacity
measurements of ultrathin films,” Journal of Microelectromechanical Systems, vol. 12,
no. 3, pp. 355–364, June 2003.
15

[17] J. F. Creemer, S. Helveg, G. H. Hoveling, S. Ullmann, A. M. Molenbroek, P. M. Sarro,
and H. W. Zandbergen, “Atomic-scale electron microscopy at ambient pressure,” Ultra-
microscopy, vol. 108, pp. 993–998, April 2008.
[18] M. Cox and P. Anastasi, July 2011, person correspondance with Silson Ltd regarding
the purchasing of a micro-hotplate. [Online]. Available: http://www.silson.com/
[19] Summary of Properties for Kapton Polyimide Films, DuPont. [Online]. Available:
http://www2.dupont.com/Kapton/en US/assets/downloads/pdf/summaryofprop.pdf
[20] The Mellen Company; produce ceramic cylindrical furnaces and heaters. [Online].
Available: http://www.mellencompany.com/
[21] Astro Met, Inc.; distributor of Macor glass ceramic produced by Corning Incorporated.
[Online]. Available: http://www.astromet.com/macor.htm
[22] Free 3D Modeling Software by Google. [Online]. Available: http://sketchup.google.com/
[23] OMEGA; produce Kapton Flexible Heaters. [Online]. Available: http://www.omega.
com/
[24] G. J. Nelson, W. M. Harris, J. J. R. Izzo, K. N. Grew, W. K. S. Chiu, Y. S. Chu,
J. Yi, J. C. Andrews, Y. Liu, and P. Pianetta, “Three-dimensional mapping of nickel
oxidation states using full field x-ray absorption near edge structure nanotomography,”
AIP, vol. 98, no. 17, p. 173109, 2011.
[25] Newport Corporation; produce IR Heating Elements. [Online]. Available: http:
//newport.com/
16

FIGURES
Figure 1: TXM schematic of the optics involved in full field nanotomography. The x-rays arefocused by the capillary condenser and unfocused rays are obstructed by the pin hole andbeam stop. The x-rays are focused onto the sample and the transmitted rays are transformedby the objective zone plate and are finally detected by an optically-coupled CCD. The sampleis able to rotate about an axis in cases where tomography is desired. [24]
17

Figure 2: Schematic depicting possible IR Heat Lamp Apparatus. The Heat Emitter (HE)is backed by a primary reflecting mirror (M1) which directs the radiation towards a secondreflecting mirror (M2) which is also acts as a directing mirror. The radiation is then reflectedinto a Cassegrain Reflector (CR) where it is focused onto the sample (S) face. Both M2 andCR are placed on mechanical tracks such that they are able to move as adjustments areneeded.
18

Figure 3: Schematic of the optics involved in manipulating and focusing the laser beams.In this diagram WP represent wave plate, BS represent beam splitter, BD represents beamdump, BE represents beam expander, DM represents dichroic mirror, ccd represents a CCDcamera. WP1, BS1, and BD regulate the power of the laser beam. The beam is thencombines and redistributed by WP2 and BS2. [8].
Figure 4: Depicted are various resistive heaters. 4a A silicon-based MEMS with spiraledPt electrode pattern. [17] 4b A Kapton-based flexible heater with metal-foil meanderingelectrode pattern and two leads. [23]. 4c A ceramic-based heater where the ceramic half-cylinder is embedded with metal wire, which is partially obscured with additional ceramicbars to keep wire from contacting sample. [20].
19

Figure 5: SketchUp image of the proposed Kapton Flexible Heater with two 12” FEP insu-lated 24 gauge wire leads. OMEGA Flexible Heater, 0.5” x 2” ; spacing between etched foilelectrodes 1/32”; from heater edge to electrode edge 1/8”; maximum heater thickness 0.01”[23].
20

Figure 6: SketchUp image of the expanded sample holder. The proposed Kapton heaterfrom Figure 5 is positioned between the front and back sample holderplates. Holderplatesare made of aluminum and were designed by Johanna Nelson. A projection of the spatialrange available for x-rays to be transmitted shown in blue; note that the actual beam is onthe order of 15-30 µm. The openings in the holderplates are 1/4” x 1/16”.
21

Figure 7: SketchUp image of a 3D model of a ceramic-based resistive heater that would befabricated in-house using machinable Macor ceramic. The ideal design for such a ceramicheater would have the wire partially embedded within the ceramic. This design would featurea solid ceramic body with a vertical slit, which enables the user to slide the heater arounda capillary. The ceramic cylinder would feature a circular, horizontal gap to allow x-raytransmittance through the sample. This design could be mounted externally to the tableadjacent to the sample stage, allowing the sample to rotate for tomography while keepingthe heater still. [21]
22

TABLES
Material Air Wood Kapton Water Glass Macor Ceramic Aluminum Copperk [W/mK] 0.025 0.04 0.37 0.6 1.1 1.46 237 401
Table 1: Materials and their thermal conductivities [W/(mK)]. Kapton polyimide filmsthermal conductivity than glass and ceramic but is larger than air and wood; its thermalconductivity is one thousandth of copper.
Company Operating Heater Thickness Spacing Minimum Cost perTemp. Extrema (nm) Between Dimensions Heatingof the Kapton Electrodes (mm x Unit†
Heating (C) (mm) mmDurex Low -195, 0.1524-0.3048; 25.4 x 25.4 /Industries High: 200 Standard: 0.178OMEGA -200, 200 0.203 0.79 6.35 x 6.35 / $31Birk Designand N/A, 120/260‡ 0.07-0.254 12.7 x 12.7 /Manufacturing
Table 2: Companies which produce customizable Kapton-based resistive heaters and theirrespective characteristics and dimensions. †5 W/in2, 0.5” x 2”; ‡Acrylic bonded Kapton has max.capability of 120
23

Infr
are
dH
eat
Infr
are
dL
ase
rS
ilso
nS
ilic
on
-base
dO
ME
GA
Kap
ton
R ©-b
ase
dM
ell
en
Cyli
nd
rica
lL
am
pM
EM
SR
esi
stiv
eC
era
mic
-base
dFu
rnace
(a)
Contr
oll
ed
Po w
erSupply
Po w
erSupply
Po w
erSupply
Po w
erSupply
Po w
erSupply
(b)
Con
fin
ed
Must
use
opti
csto
confine
Use
opti
csto
man
ipula
tela
ser
Hea
ter
regi
onis
0.5
mm
xH
eat
isco
nfined
toel
ectr
ode
Con
fined
wit
hin
the
cylinder
;hea
tsm
all
spot
size
bea
m;
alre
ady
smal
lsp
otsi
ze0.
5m
m;
hig
hdro
poff
from
regi
on;
hea
ting
area
beg
ins
hol
esnec
essa
ryfo
rx-r
ayel
ectr
ode
pat
tern
toou
ter
3.17
mm
(1/8
”)fr
omou
ter
tran
smis
sion
thro
ugh
sam
ple
silico
ned
geof
hea
ter
may
be
conce
rnfo
rst
ray
hea
t
(c)
Measu
rab
leC
anca
lcula
tete
mp
erat
ure
Cal
cula
tete
mp
erat
ure
atC
anca
lcula
teth
elo
cal
Can
calc
ula
teth
elo
cal
Can
calibra
te;
use
ain
ciden
ton
sam
ple
face
and
the
sam
ple
inte
rfac
eusi
ng
resi
stan
ce;
calibra
teth
ere
sist
ance
;ca
libra
teth
eth
erm
oco
uple
use
ath
erm
oco
uple
onIR
the
Pla
nc k
radia
tion
funct
ion
(1);
hea
ter;
use
ath
erm
oco
uple
onhea
ter;
use
ath
erm
oco
uple
onso
urc
euse
anim
agin
gsp
ectr
ogra
ph
the
hea
ter
face
the
hea
ter
face
(d)
Tem
pera
ture
Som
eIR
hea
ters
can
hea
tC
anhea
tab
ove
1200 C
Bel
ow40
0 C
;cu
rren
tly
use
aB
elow
200 C
Bel
ow11
00
Ran
ge
(50-5
00
sam
ple
sto
700
Au
elec
trode,
inth
epro
cess
C)
ofR
&D
for
aP
tel
ectr
ode
whic
hw
ould
oper
ate
athig
her
tem
per
ature
s
(e)
Rem
ovab
leW
ould
be
inst
alle
doff
-sta
geIn
stal
led
offT
XM
;w
ould
be
Pla
ced
wit
hsa
mple
onP
lace
don
sam
ple
,si
de
Pla
ced
arou
nd
sam
ple
;or
onth
esi
de
ofth
eT
XM
diffi
cult
tore
mov
ean
din
stal
l.el
ectr
ode
side;
rem
ovab
ledoes
n’t
mat
ter;
rem
ovea
ble
dep
endin
gup
onth
em
odel
Ifp
ossi
ble
,in
stal
lab
ove
wou
ldb
ecl
amp
edar
ound
orT
XM
(out
ofth
ew
ay).
slid
o ver
the
sam
ple
(f)
Siz
eR
an
ge
Siz
eof
IRhea
ters
vari
esR
equir
esa
rath
erla
rge
opti
cal
Min
imum
dim
ensi
ons
are
10M
inim
um
size
12.7
mm
xM
inim
um
dia
met
er19
.05
mm
grea
tly;
esti
mat
esi
zew
ould
stag
eas
wel
las
seve
ral
mm
x5
mm
x0.
5m
m(h
eigh
t12
.7m
m(0
.5”
x0.
5”)
(0.7
5”),
any
lengt
hb
ea
10”
cub
esa
tellit
edat
a-ga
ther
ing
xw
idth
xth
icknes
s)co
mp
onen
ts;
very
larg
ean
dbulk
y
(g)
Poss
ible
Sam
ple
All;
diffi
cult
yfo
rth
ose
tob
eA
ll;
diffi
cult
yfo
rth
ose
tob
eF
lat
sam
ple
son
lyF
lat
orge
ntl
ycu
rved
sam
ple
sC
ylindri
cal
sam
ple
son
ly;
Typ
es
rota
ted
for
tom
ogra
phy
rota
ted
for
tom
ogra
phy
only
thos
ein
capilla
rytu
bes
(h)
Cost
>$2
39.0
0a
>$1
5,00
0b
$81.
40c
$31.
00d
N/A
(i)
Level
of
InH
ou
seH
igh;
opti
csan
dfa
bri
cati
onH
igh;
opti
csan
dm
ounti
ng
Hig
h;
nan
ofab
rica
tion
Med
ium
;re
quir
eM
ediu
m;
requir
em
achin
ing
Manu
fact
uri
ng
ofC
asse
grai
nre
flec
tor
larg
eco
mp
onen
tsre
quir
ednan
ofab
rica
tion
but
less
Mac
orce
ram
ican
dth
read
ing
Diffi
cult
ydiffi
cult
than
silico
n-b
ased
wir
eth
rough
Tab
le3:
Sum
mar
yof
each
hea
ting
elem
ents
applica
bilit
yto
the
det
erm
ined
crit
eria
for
our
des
ired
hea
ter.
The
crit
eria
are
lab
eled
ath
rough
i.aIR
Emitter,Model
6363
[25];bIR
Laser
(105
4nm),model
CL10
30-200
[10];c1”
x1”
Micro-hotplate,Auelectrode
pattern
[18];d0.5”x2”
KHLV-050
2,5W
/in
2[23]
24

a b c d e f g h iWeight 1 2 2 3 1 3 1 3 3
Rank (1-best, 5-worst) Weighted RankHeat Lamp 1 5 3 5 4 4 3 3 4 72Laser 1 1 1 1 5 5 1 5 5 59Silicon 1 2 4 2 1 1 5 2 3 43Kapton 1 3 5 2 1 2 2 1 2 41Ceramic 1 4 1 4 3 3 5 1 43
Table 4: Each of the criteria a through i were weighted, as shown. Then the heating methodswere ranked for each of the criteria, 1 being the best and 5 the worst. The total indicatesthe sum of the heaters rank for a respective criteria multiplied by that criterias weight. Thebest scores are the lowest.
25

Extracting bb Higgs decay signals using multivariate techniques
W Clarke Smith
Office of Science, Science Undergraduate Laboratory Internship (SULI)
George Washington University
SLAC National Accelerator Laboratory
Menlo Park, CA
August 17, 2011
Prepared in partial fulfillment of the requirements of the Office of Science, Department
of Energy’s Science Undergraduate Laboratory Internship under the direction of Timothy
Barklow with the ATLAS group at SLAC National Accelerator Laboratory.
Participant:
Signature
Research Advisor:
Signature
SLAC-TN-12-015
Work supported by US Department of Energy contract DE-AC02-76SF00515.

TABLE OF CONTENTS
Abstract ii
Introduction 1
Materials and Methods 4
Results 12
Discussion and Conclusions 14
Acknowledgments 17
References 17
i

ABSTRACT
Extracting bb Higgs decay signals using multivariate techniques. W CLARKE SMITH(George Washington University, Washington, DC 20052) TIMOTHY BARKLOW (ATLASgroup at SLAC National Accelerator Laboratory, Menlo Park, CA 94025)
For low-mass Higgs boson production at ATLAS at√s = 7 TeV, the hard subprocess
gg → h0 → bb dominates but is in turn drowned out by background. We seek to exploitthe intrinsic few-MeV mass width of the Higgs boson to observe it above the backgroundin bb-dijet mass plots. The mass resolution of existing mass-reconstruction algorithms isinsufficient for this purpose due to jet combinatorics, that is, the algorithms cannot identifyevery jet that results from bb Higgs decay. We combine these algorithms using the neural net(NN) and boosted regression tree (BDT) multivariate methods in attempt to improve themass resolution. Events involving gg → h0 → bb are generated using Monte Carlo methodswith Pythia and then the Toolkit for Multivariate Analysis (TMVA) is used to train andtest NNs and BDTs. For a 120 GeV Standard Model Higgs boson, the mh0-reconstructionwidth is reduced from 8.6 to 6.5 GeV. Most importantly, however, the methods used hereallow for more advanced mh0-reconstructions to be created in the future using multivariatemethods.
ii

INTRODUCTION
When formulating the Standard Model of particle physics (SM), theorists initially had
trouble explaining the origin of mass for bosons and fermions. In general, they reasoned
that a symmetric system could not evolve into an asymmetric state. As a consequence,
though, neither W± nor Z0 bosons would be massive. Since W± and Z0 are massive,
they hypothesized the existence of a so-called Higgs mechanism that allows for spontaneous
symmetry breaking, thereby giving such force-carrying bosons mass.
A Toroidal LHC ApparatuS (ATLAS), one of the six experiments at the Large Hadron
Collider (LHC), is currently attempting to confirm the empirical existence of the Higgs
mechanism by observing its scalar remnant: h0, the Higgs boson1. Teams within ATLAS
are attempting to do this by detecting the particles that characteristically result when these
bosons decay. Higgs bosons can be created in proton-proton collisions, or ‘events,’ at ∼ 7
TeV in the center-of-mass frame. The most promising Higgs decay modes to detect are
WW (∗)2, ZZ(∗), τ+τ−, and γγ [1]. However, for the low Higgs masses (115 / mh / 140
GeV) that this project is interested in, the Higgs boson decays into bb approximately 66%
of the time3 via the hard subprocess gg → h→ bb. We call signal events those that include
this process (Figure 1) and background events those that include a different bb-producing
hard subprocess, such as gg → bb (Figure 2). Unfortunately, almost every bb-dijet detected
results from a background event.
In order to successfully detect the Higgs boson, we seek to exploit its intrinsic narrow
mass width of several MeV [2]. Theoretically, this will manifest itself as a sharp, narrow spike
at mh in the bb-dijet mass (mbb) plot, allowing for the Higgs boson to be easily observed.
However, reconstructing mbb from event information proves difficult due to the so-called ‘jet
1There may be multiple Higgs bosons; we reduce to the singular case. Also, hereafter we denote the Higgsboson h instead of the more accurate h0 (the symbol for a scalar, light Higgs boson).
2The superscript (∗) denotes a virtual particle.3Calculated for a 120 GeV SM Higgs boson using Pythia Monte Carlo generated events.
1

g
g
b
t
t
t
b
h
Figure 1: Feynman diagram of gg → h → bb (Higgs boson production from gluonfusion via a virtual t-quark loop followed by bb Higgs decay), the hard subprocess insignal events.
g
g
b
b
b
Figure 2: Feynman diagram of gg → bb (production of bb from t-channel gluon fusionvia the exchange of a virtual b-quark), an example of a hard subprocess in backgroundevents.
combinatorics problem,’ that is, our inability to identify jets accurately. Although the bb-
dijets can be efficiently distinguished (b-tagged) [3], the b- and b-quarks constantly radiate
and reabsorb gluons before hadronizing and some gluons will be radiated but not reabsorbed.
Those gluons are called final state radiation (FSR) and they are precisely those whose jets
are difficult to identify. To solve this problem, there have been many mass-reconstruction
2

algorithms developed to isolate such FSR-jets, but their inability leads to a reconstructed mbb
plot with a dull, essentially nonexistent bump at mh. Realizing that the plot of background
events vs. bb-dijet masses experiences gradual decay over tens of GeV and so should the
analogous reconstructed background mbb plots, we restrict ourselves to the case of signal
events, where mbb = mh. In other words, reconstructing mbb from signal events alone is
sufficient to extract the mh spike from the background mbb plot. Hence, the goal of this
project is to specifically construct an improved mh-reconstruction algorithm4.
Motivated by the quantity and unknown degree of interdependency of the observables
measured by ATLAS, we use several types of multivariate analysis5 (MVA) to search for
patterns in Monte Carlo (MC) generated pp collisions in attempt to reconstruct mbb more
effectively. One MVA method that we use is the neural network (NN), a composition of
many linear and nonlinear functions which maps sets of input values into models of the
target values [4]. For our purposes, the target is mh,true.
This approach is not altogether new; others have used various MVA techniques to enhance
Higgs decay signals in many of the modes. For example, Hakl et al. [5] used NNs6 and
Takahashi [1] used another type of MVA, boosted decision trees, to improve the signal-to-
background ratio for bb and WW (∗) Higgs decays, respectively. In fact, boosted decision trees
have shown impressive results in comparison to NNs — in a b-tagging performance evaluation,
boosted decision trees demonstrated an efficiency improvement of 35% [6]. Instead of using
a classification NN or boosted decision trees to distinguish signal events from background
events like Hakl et al. and Takahashi, we use a variety of regression NNs and boosted
regression trees to reconstruct mh.
4Note that “mass-reconstruction algorithm” is taken to mean “mbb-reconstruction algorithm.”5Multivariate analysis is merely drawing inferences from data sets with multiple statistical variables.6Hakl et al. used NNs with switching units optimized via a genetic algorithm.
3

MATERIALS AND METHODS
All regression MVA methods search for patterns in statistical variables in an attempt to
better model the target, in this case, the true Higgs mass. If the method is not supplied any
information aside from the variables, it will be entirely unable to model the target and it
will not be able to produce an output; it needs to be “taught.” We systematically feed the
method variables as well as targets. It then develops a mechanism for predicting the target
(computing outputs). This is called training.
Event generation with Pythia
For the data from which to select the variables and targets, we generate signal pp collisions
using MC methods with Pythia. The Pythia program is a powerful particle physics event
generator that includes a collection of methods for modeling the evolution of few-body hard
processes to complex multihadronic final states. In Pythia event generation, the user is
allowed to select the physical models used, the hard subprocesses involved, and, if applicable,
the Higgs mass [7]. We use SM physics, the process gg → h → bb, and mh = 90, 100, 110,
120, 130, 140, and 150 GeV to generate 105 (signal) events at each mh. Pythia’s main
weakness is that it does not include next-to-leading-order perturbative calculations and thus
is insensitive to events with a low total transverse momenta pT , that is, the momentum
perpendicular to the beam axis. The high total pT of gg → h→ bb makes Pythia ideal for
our low mass Higgs decays [7]. We do not use data taken by ATLAS. The reasons for this are
twofold: we avoid complications caused by experimental uncertainties and we have absolute
control over the type of event that is generated. For instance, we can choose whether to
generate a bb or ZZ(∗) Higgs decay, an event with mh = 90 GeV or mh = 150 GeV, or
an event with one FSR-jet or five. Moreover, the only detector simulation is an angular
cut is applied to remove all hadrons that escape the detector geometry; even neutrinos are
4

generated.
Event processing with ROOT
For each hadron detected by ATLAS, the azimuthal angle φ, the pseudorapidity η =
− ln tan ( θ2), and pT are measured, providing us with its geometric and energetic image7.
Additionally, we form the observable∑i
pT,i for particles i in a given event to gauge the total
transverse momentum.
Using a given mass-reconstruction algorithm, first the detected hadrons are partitioned
into their respective jets. This partitioning is somewhat trivial — there is not much varia-
tion between algorithms. For each jet, η, φ, and pT are computed from the ηi, φi, and pT,i
measured for each hadron i within that jet. Second, the bb-dijets and FSR-jets all resulting
from bb production are isolated. This is done with cuts in the ηφ plane, where the metric
∆R =√
(∆η)2 + (∆φ)2 can be constructed, providing a notion of distance between compo-
nents of the event. Each mass-reconstruction algorithm uses a value of ∆R to classify all
jets within a certain vicinity of the tagged bb-dijets as FSR-jets from the b- and b-quarks.
From this jet selection, mbb, pT,bb, and ηbb are calculated. Finally, the algorithms compute
∆Rbb, the “distance” between b- and b-jets, from the algorithmically determined bb-dijet
information.
It then seems reasonable that some algorithms would be better for certain types of events
than others, depending primarily on their method of selecting those jets that result from
bb production. For example, some mass-reconstruction algorithms may be very good at
determining mbb in events with a large fraction of jets being emitted due to initial state
radiation8 (ISR), while others may be better suited for events with little ISR activity.
We use ROOT, the leading data analysis framework for particle physics, to process the
raw output of the Pythia signal event generation. For every Pythia MC generated event,
7Here, θ is the angle with respect to the beam axis.8Initial state radiation is those gluons that radiate but do not get reabsorbed prior to the pp collision.
5

mh, pT,h, and ηh are reconstructed using 25 of the most effective mass-reconstruction al-
gorithms. Furthermore, these 25 algorithms are divided into five families. The algorithm
families have slightly different methods for partitioning hadrons into jets while algorithms
within a family have distinct ∆R values for identifying those FSR-jets that result from bb
production. So, for the same events, ηb, ηb, pT,b, pT,b, and ∆Rbb are reconstructed using the
five algorithm families. Note that no φ information is reconstructed; this is due to the fact
that the pp collisions are azimuthally symmetric. Together, these collections of outputted
event information are the input values for the MVA methods. We call these input types
variables ; they are listed in Table 1. Obviously, not all 101 variables will be used for every
MVA technique.
Input Variables Quantity per Event Description∑i
pT,i 1 Total event transverse momentum
ηb, ηb 5 each Reconstructed b, b-jet pseudorapiditiespT,b, pT,b 5 each Reconstructed b, b-jet transverse momenta
ηh 25 Reconstructed Higgs pseudorapiditypT,h 25 Reconstructed Higgs transverse momentum
mh,reconstruction 25 Reconstructed Higgs mass∆Rbb 5 Reconstructed “distance” between b, b-jets
Table 1: A comprehensive list of MVA input variables.
Finally, in ROOT we declare one further characteristic of the generated events: the true
Higgs mass as specified in Pythia. This mh,true is not a variable but the target of the MVA
regression; it is only used in training and for performance evaluation.
MVA training and testing
At this point, we have ∼ 7 × 10⁵ Pythia generated signal events each with one of
seven Higgs masses as well as values for 101 different variables. The goal is then to construct
mappings from the 101 variables onto the set of seven Higgs masses by invoking multiple MVA
6

methods, which have been shown to be superior to uni- and bivariate techniques for most
purposes [1]. While each mass-reconstruction algorithm is insufficient on its own, feeding the
outputs of 25 different algorithms into an advanced MVA technique vastly improves the mh
regression. Due to the ease of implementation and the customizability of its MVA methods,
we use the Toolkit for Multivariate Analysis (TMVA) to construct such mappings. TMVA is
included in the ROOT package and offers thirteen MVA techniques for classification (directly
separating signal from background events), eight of which can also be used for regression
(creating a regression function that models the target). We restrict ourselves to the two most
promising of the eight methods suitable for our regression task: neural nets and boosted
regression trees.
Previous NN analyses of this kind used the ROOT class TMultiLayerPerceptron which
allows for any number of intermediate functions as well as one of six different learning
methods to be used [2]. The advantages of using TMVA are the facility of using boosted
regression trees, an increased number of adjustable method-specific parameters, and most
importantly, the ability to repeat analyses quickly using different parameters, variables, MVA
methods, and data sets [8].
In a feedforward NN9, there is an input layer, a hidden layer(s), and an output layer
(Figure 3). The nodes are called inputs in the input layer, neurons in the hidden layers,
and outputs in the output layer. Each variable corresponds to an input and the targets
correspond to the outputs. Each neuron in the first hidden layer maps a linear combination
of the inputs through a specified nonlinear function σ. Neurons in subsequent hidden layers
repeat this process using neurons in the previous hidden layer. Additionally, there can be
“empty” neurons and inputs called biases which are merely weights independent of prior
layers added to increase the ability of the NN.
9Other types of NNs (those with feedback loops, etc.) are neglected because they are overkill for ourrelatively standard regression task.
7

Figure 3: Feedforward NN with three hidden layers with 6, 4, and 2 neurons, respec-tively, as well as biases.
It may seem that having more neurons and hidden layers allows for a more complicated
and therefore capable NN to be formed. This is true up to a point — while additional neurons
and hidden layers enable the neural net to find more subtle relationships, it eventually reaches
a peak beyond which the neural net is being overtrained. In that region, neural nets find
patterns that are not necessarily representative of legitimate relationships, but are merely due
to the finite size of the event sample. Moreover, there is not good reason to use excess hidden
layers or neurons, for the Weierstrass approximation theorem dictates that any continuous
function can be approximated by a sufficient number of neurons in one hidden layer [9].
MVA for particle physics has been dominated by the use of NNs over the past decade. In
past several years, though, boosted decision and regression trees have emerged as a powerful
tool for MVA. First of all, a regression tree is an MVA method grown by splitting the
training sample of events into two parts for each value of each variable, depending on that
8

value. Then, the variable and value that produces the optimal split (“best” division of the
training sample into high and low target value mh,true parts) is chosen as the first branching
of the regression tree. This process is repeated until the user-specified maximum number
of leaves is reached. Boosted regression trees (BDTs10), then, are merely an advanced form
of regression trees. Boosting is achieved by allowing the tree to predict the target mh,true
for each of the training events; those events which have their targets incorrectly predicted
are given additional weight depending on how poor the prediction was. The regression tree
is then regrown; this boosting process goes through a user-specified number of iterations,
eventually arriving at a final boosted regression tree (Figure 4). Typically a larger number
of maximum leaves and boosting iterations allows for a more robust network, but BDTs are
very susceptible to overtraining so these parameters need to be chosen carefully. In attempt
to minimize the effects of overtraining, once the BDT is grown and boosted, it is pruned by
removing statistically insignificant leaves.
Figure 4: The 99th iteration of a boosted regression tree used for mh regression.
10The acronym “BDT” is adopted for both boosted regression trees as well as boosted decision trees outof convention.
9

As mentioned before, event processing yields 101 variables with which to train the MVA
methods. In order to increase efficiency and reduce computing time, redundant and ineffec-
tive variables are removed. Redundant variables are those which are very highly correlated
with other variables used, meaning the underlying event information that they hold is very
similar. Ineffective variables are those which do not show a significant correlation with the
target. Clearly, redundant variables are useless while ineffective variables slow down and
hinder the training process.
Figure 5: Plots of ηb vs. pT,b, ηb vs. ηb, and ηb vs. pT,b showing redundancy in thecenter plot.
A simple correlation-to-target ranking performed by TMVA allows us to reduce the num-
ber of variables from 101 to 40 relatively easily. The 25 reconstructed Higgs masses are the
most highly correlated with mh,true and so they are not removed. Then, the correlations
are similar from variable to variable, so∑i
pT,i as well as two of each ∆Rbb, ηb, ηb, pT,b,
pT,b, ηh, and pT,h are used for the initial training. Then, scatter plots of the variables vs.
one another (Figure 5) as well as two-dimensional histograms of regression output deviation
dreg := mh,reco −mh,true vs. the variables (Figure 6) are used to determine redundancy and
effectiveness, respectively. Clearly the efficacy of a variable depends on the MVA method
for which it is training. As such, we construct two sets of variables, a NN set and a BDT
10

set, which are slightly different but contain ∼30 variables.
(a) The high efficacy of pT,b. (b) The low efficacy of ηb.
Figure 6: Regression output deviation dreg vs. variable plots used to determine variablecontribution to the MVA method.
Once the variables have been selected to maximize efficiency, the various parameters of the
NN and the BDT need to be optimized. There are three types of NN implemented in TMVA:
the Clermont-Ferrand NN, the ROOT NN (TMultiLayerPerceptron), and the multilayer
perceptron (MLP) NN. We use the MLP NN due to its improved speed and flexibility over
the other two types of neural net [8]. Five of the most important parameters for the MLP are
NCycles, HiddenLayers, NeuronType, NeuronInputType, and TrainingMethod. NCycles
is merely the number of training cycles the NN undergoes and HiddenLayers specifies the
number of hidden layers and how many neurons are in each of them. In general, we want
to have as many cycles, hidden layers, and neurons as possible in order to have a robust
and sensitive network while not overtraining it. The NeuronType is the NN’s nonlinear
function σ. The options include the sigmoid function 1/(1 + e−rv), the hyperbolic tangent
function (ev−e−v)/(ev +e−v), and the radial function e−v2/2. We have found the best results
using the hyperbolic tangent function11. The option NeuronInputType specifies how the
linear combinations are taken within each neuron. They can be sums, sums of squares,
11“Best” is ambiguous; here, we refer to the MLP with the lowest dreg root mean square (RMS).
11

or sums of absolutes; we use regular sums. Finally, the TrainingMethod can be either the
back-propagation (BP) method or the Broyden-Fletcher-Goldfarb-Shannon (BFGS) method.
BFGS requires less iterations to receive the same result as BP, but it costs a large amount of
computing power when the NN is complicated [8]. As such, we use BP with complex hidden
structures and BFGS with simple hidden structures.
For the BDT, some of the adjusted parameters are NTrees, BoostType, SeparationType,
nEventsMin, and PruneMethod. NTrees is merely the number of times the regression tree
is boosted and regrown while nEventsMin is the minimum number of events in any given
leaf node. Increasing the former and decreasing the latter heightens the BDT’s sensitivity
and capability so long as overtraining is avoided. For regression, the BoostType options
are narrowed to adaptive boost (AdaBoost.R2) and gradient boost (GradientBoost). The
difference between the two algorithms is the function they use to determine how poor the
BDT’s estimation of the target value is. Because neither AdaBoost.R2 nor GradientBoost is
particularly advantageous, we use two BDT implementations: one for each type of boosting.
Another important parameter is SeparationType, which determines how the training sample
is split at each node. There are five settings available, but we find the default Gini-Index to
produce the best results. Finally, for regression tasks, the PruneMethod can either be cost
complexity or nothing. We use the cost complexity method to recover from overtraining.
With selected variables and optimized parameters for MLP, BDT (AdaBoost.R2), and
BDT (GradientBoost) MVA methods, we feed the ∼7× 10⁵ Pythia MC generated events
into TMVA. Half of these events are used for training and half for testing.
RESULTS
For each MVA method, we build a complicated nonlinear function from the set of se-
lected variables into the set of possible mh values through training. Then, that function’s
12

performance is evaluated through testing, in which the remaining half of the events have
their variables mapped to reconstructed Higgs masses (mh,reco). From TMVA we ultimately
receive ∼ 3 × 10⁵ pairs of mh,reco and mh,true data. These results can be depicted in three
ways.
First, the total MVA method RMS can be calculated by RMS =√〈dreg2〉. This RMS
can then be compared for multiple methods to determine which method has the overall
least difference between reconstructed and true Higgs mass. The RMS values for the MLP,
the BDT with AdaBoost.R2, and the BDT with GradientBoost methods are presented in
Table 2 along with some extra information. Note that half of the values in Table 2 are
“truncated,” meaning they were calculated from only those events whose dreg values lie
within two standard deviations of the mean, i.e., in the middle 95%. On the other hand,
the truncated RMS roughly represents the difference between mh,reco peak values and mh,true
values. Finally, while 〈dreg〉 is sensitive to sign, comparing the truncated and non-truncated
entries for a given method provides shape and location information about the dreg plot.
For instance, the magnitude and sign of the difference indicates the degree and sign of the
skewness of dreg. Additionally, the size of 〈dreg〉T reflects how centered about mh,true the
mh,reco plot is.
MVA Method RMS (MeV) 〈dreg〉 (MeV) RMST (MeV) 〈dreg〉T (MeV)MLP 1.25× 10⁴ 47 9.73× 10³ 1.21× 10³
BDT with AdaBoost.R2 1.38× 10⁴ 631 1.25× 10⁴ 1.29× 10³
BDT with GradientBoost 1.24× 10⁴ −1.49× 10³ 8.99× 10³ −281
Table 2: A performance summary for all MVA methods utilized.
Second, we can plot dreg on its own and against mh,true (Figure 7). These plots tell us
whether the MVA method is under- or over-estimating the Higgs mass and for which mh,true.
Third and finally, for any one of 90, 100, 110, 120, 130, 140, or 150 GeV, we can plot both
the reconstructed Higgs mass (Figure 8).
13

Figure 7: Plot of dreg vs. mh,true for a BDT with GradientBoost.
DISCUSSION AND CONCLUSIONS
In order to visualize the actual performance of our trained MVA methods, we compare
the reconstructed Higgs mass plot (Figure 8) to the Pythia MC generated mh,true plot,
the mh,reco resulting from a single mass-reconstruction algorithm, and the current best NN-
reconstructed Higgs mass plot all for events generated with an inputted mh,true of 120 GeV
(Figure 9). We take this state-of-the-art in mh reconstruction to be Barklow’s [2], which uses
the TMultiLayerPerceptron class in ROOT with multiple algorithmically reconstructed
Higgs masses as inputs. This allows us to witness the development of mh reconstruction
methods from single algorithms to coarse, ROOT-based neural nets to powerful BDTs.
First, we notice that the Pythia generated mh,true plot has a width of 12.3 MeV, re-
flecting the narrow intrinsic Higgs mass width. Second, the mh reconstruction using a single
14

Figure 8: Plot of mh,reco for a BDT with AdaBoost.R2 using Pythia MC generatedsignal events with a 120 GeV SM Higgs boson.
algorithm shows a peak at ∼120 GeV, but a mean of 113.7 GeV and a width of 23.4 GeV.
Third, the NN mh reconstruction plot has its peak and mean at 120 GeV but a width of
8.6 GeV. Finally, our mh reconstruction using a BDT with AdaBoost.R2 peaks around 120
GeV, has a mean of 120.7 GeV, and has a width of 6.5 GeV. We can therefore say that our
MVA methods yield competitive mh resolutions when compared to all previous approaches.
Although the bb Higgs decay signal was by no means extracted and observed, this re-
construction attempt was a success. Not only were gains made in Higgs mass resolution,
but they were made as a proof-of-principle. Many elements of the development of the mh-
reconstruction method were crude and abbreviated — there is much room to improve our
method. We have merely shown that it may be possible to construct a very effective mh-
reconstruction algorithm using MVA methods.
15

(a) Pythia generated mh,true plot with an in-putted Higgs mass of 120 GeV.
(b) Single algorithm reconstructed mh fromPythia generated signal events with a 120 GeVHiggs boson.
(c) Previous state-of-the-art NN-reconstructed mh fromsignal events with a 120 GeV SM Higgs boson generatedby ALPGEN (an MC particle physics generator best forlow-pT events).
Some of the improvements that can, and should, be made are in event generation, event
processing, and the training and testing of MVA methods. Immediately, we should generate
gg → h→ bb events with more than seven distinct values for mh,true to reduce discretization
in the final mbb plots. As more results from the LHC are released, we could also generate
events for additional Higgs decay modes as well as with beyond-the-SM physics. Another
relatively easy improvement would be to optimize the MVA-method-specific parameters as
well as select variables more gracefully. In both cases, the methods we use are crude and
insensitive — algorithms may be used, for example, for both of these purposes. Additionally,
16

Hoecker et al. [8] are continually working to improve TMVA and include more advanced
MVA methods as well as combined MVA methods; these should be trained and tested as
soon as they are released.
Finally, the largest potential improvement will be made from upgrading our event process-
ing. Specifically, we will initially process events with a broader method of defining variables,
allowing them to be selected from a pool of ∼700. With this added information, the MVA
methods may be able to find even subtler patterns in the events, increasing their ability to
resolve the true Higgs mass. In conclusion, we are encouraged by our MLP and BDT results
— they show that MVA methods can be very useful for mh discrimination in ATLAS.
ACKNOWLEDGMENTS
This work was carried out at SLAC National Accelerator Laboratory from June–August
2011 as part of the Summer Undergraduate Laboratory Internship (SULI) program created,
organized, and funded by the U.S. Department of Energy, Office of Science. I would like
to thank my mentor Tim Barklow as well as Steve Rock, the director of the SULI pro-
gram. Lastly, I would like to thank the ATLAS collaboration at the LHC for access to their
resources.
REFERENCES
[1] M. Takahashi, “Standard Model Higgs Searches at the LHC,” 2008, arXiv:hep-ex/0809.3224.
[2] T. Barklow, “Higgs→ bb.” http://indico.cern.ch/getFile.py/access?contribId=
40&sessionId=5&resId=0&materialId=slides&confId=116471, Jan. 2011.
[3] B. Martin and G. Shaw, Particle Physics. Manchester Physics Series, Wiley, 2008.
[4] T. Hastie, R. Tibshirani, and J. Friedman, The Elements of Statistical Learning: DataMining, Inference, and Prediction. Springer Series in Statistics, New York: Springer,2001.
17

[5] F. Hakl, M. Hlavacek, and R. Kalous, “Application of neural networks to Higgs bosonsearch,” Nuclear Instruments and Methods in Physics Research Section A: Accelerators,Spectrometers, Detectors and Associated Equipment, vol. 502, no. 2-3, pp. 489 – 491,2003.
[6] J. Bastos, “Tagging heavy flavours with boosted decision trees,” 2007, arXiv:physics.data-an/0702041.
[7] T. Sjostrand, S. Mrenna, and P. Skands, “Pythia 6.4 Physics and Manual,” JHEP,vol. 05, p. 026, 2006.
[8] A. Hoecker, P. Speckmayer, J. Stelzer, J. Therhaag, E. von Toerne, and H. Voss, “TMVA:Toolkit for Multivariate Data Analysis,” PoS, vol. ACAT, p. 040, 2007.
[9] M. H. Hassoun, Fundamentals of Artificial Neural Networks. The MIT Press, 1995.
18

X-Ray Emission Spectrometer Design with Single-Shot
Pump-Probe and Resonant Excitation Capabilities
Katherine Spoth
Office of Science, Science Undergraduate Laboratory Internship (SULI)
State University of New York at Buffalo
SLAC National Accelerator Laboratory
Menlo Park, CA
August 12, 2011
Prepared in partial fulfillment of the requirements of the Office of Science, Department
of Energy’s Science Undergraduate Laboratory Internship under the direction of Dennis
Nordlund at the Stanford Synchrotron Radiation Lightsource, SLAC.
Participant:
Signature
Research Advisor:
Signature
SLAC-TN-12-016
Work supported by US Department of Energy contract DE-AC02-76SF00515.

TABLE OF CONTENTS
Abstract ii
Introduction 1
Materials and Methods 2
Results 5
Discussion and Conclusions 10
Acknowledgments 11
References 11
i

ABSTRACT
X-Ray Emission Spectrometer Design with Single-Shot Pump-Probe and Resonant Excita-
tion Capabilities. KATHERINE SPOTH (State University of New York at Buffalo, Buffalo,
NY 14260) DENNIS NORDLUND (Stanford Synchrotron Radiation Lightsource, SLAC,
Menlo Park, CA 94025)
Core-level spectroscopy in the soft X-ray regime is a powerful tool for the study of chem-
ical bonding processes. The ultrafast, ultrabright X-ray pulses generated by the Linac Co-
herent Light Source (LCLS) allow these reactions to be studied in greater detail than ever
before. In this study, we investigated a conceptual design of a spectrometer for the LCLS
with imaging in the non-dispersive direction. This would allow single-shot collection of X-ray
emission spectroscopy (XES) measurements with varying laser pump X-ray probe delay or
a variation of incoming X-ray energy over the illuminated area of the sample. Ray-tracing
simulations were used to demonstrate how the components of the spectrometer affect its per-
formance, allowing a determination of the optimal final design. These simulations showed
that the spectrometer’s non-dispersive focusing is extremely sensitive to the size of the sample
footprint; the spectrometer is not able to image a footprint width larger than one millime-
ter with the required resolution. This is compatible with a single shot scheme that maps
out the laser pump X-ray probe delay in the non-dispersive direction as well as resonant
XES applications at normal incidence. However, the current capabilities of the Soft X-Ray
(SXR) beamline at the LCLS do not produce the required energy range in a small enough
sample footprint, hindering the single shot resonant XES application at SXR for chemical
dynamics studies at surfaces. If an upgraded or future beamline at LCLS is developed with
lower monochromator energy dispersion the width can be made small enough at the required
energy range to be imaged by this spectrometer design.
ii

INTRODUCTION
Understanding the bonding processes that take place during the formation of chemical com-
pounds can give us a greater ability to predict their chemical properties and reactivity. Some
knowledge of these processes can be gained by studying changes in molecular orbitals. Many
of these interesting reactions involve C, N, and O atoms. Core level soft X-ray spectroscopy
techniques allow us to study these systems in an atom-specific way, meaning we can probe a
specific energy transition by creating a core hole that can only be filled by a nearby valence
electron [1]. The transfer of electrons during bonding processes occurs on a femtosecond
time scale. Measurements on this scale are made possible using ultrafast X-ray pulses gener-
ated by the Linac Coherent Light Source (LCLS). A spectrometer that allows for Resonant
Inelastic X-Ray Scattering (RIXS) or time-resolved X-Ray Emission Spectroscopy (XES)
measurements to be taken in a single shot at the LCLS will allow us to study changes in the
electronic structure of complex systems in greater detail than has ever been possible.
One of the many systems that would be interesting to study using this instrument is
the dissociation of N2 as occurs during the Haber-Bosch process through which ammonia is
produced from nitrogen and hydrogen on a substrate of ruthenium or iron [2]. This process
is widely used in the production of nitrogen-based fertilizers responsible for growing crops
that feed much of the world’s population and therefore is estimated to account for as much
as one percent of the world’s total energy consumption [3]. For this reason, it would be very
beneficial if we could make improve this process to reduce its energy consumption.
The processes that take place during this and other surface reactions are difficult to ob-
serve experimentally. Between adsorption and desorption steps, charge and energy transfer
takes place between the adsorbates and catalyst determining the intermediate steps in the
reaction. These short-lived elementary steps can be observed using the time-resolved mea-
surements made possible in ultrafast laser pump X-ray probe experiments using XES at the
1

LCLS.
Our goal is to determine the best design of a new XES spectrometer for the LCLS. We
modify the design of a typical XES spectrometer to allow for single-shot measurements with a
time delay or energy gradient along the sample footprint. Ray-tracing simulations of possible
configurations are used to determine the best design, which has maximum throughput at
the energy and imaging resolutions required to perform the desired experiments.
MATERIALS AND METHODS
Figure 1 shows an illustration of the X-ray emission process. In non-resonant X-ray emission,
incoming X-ray photons excite an electron from the core of an atom in a sample, ejecting the
electron into the vacuum. In the resonant case, this electron is not ejected but promoted to
an unoccupied atomic or molecular orbital [4]. This is achieved by using a resonant incoming
X-ray energy, which is equal to the difference between the core level energy and that of the
excited state. In both cases, an electron from the valence level falls to fill the vacancy in
the core, radiating an X-ray photon with energy equal to the difference between its initial
and final states. The XES spectrum shows the intensity vs. energy of these emitted X-rays.
From this spectrum, the energy and symmetry of the atom’s orbitals can be determined,
providing information about its valence band electronic structure.
Because each element has a unique core level energy, XES is element-specific. When
bonds are formed with another element, the energies of an atom’s orbitals transform. These
changes in energy can be easily observed using XES, making this method chemical bonding-
specific as well. Additionally, because the core holes created in this method can only be
filled by valence electrons in the vicinity of the atom, XES is a useful tool in probing the
local electronic structure of an atom.
In a typical XES spectrometer, which is shown in Figure 2, incoming X-rays excite core
2

electrons in the sample causing outer electrons to decay and emit X-rays. The emitted rays
are incident on a concave grating, which disperses the photons according to energy and
focuses the light in this dispersive direction. At the detector, the focused rays’ positions are
related to their energy due to the their interaction with the diffraction grating.
Figure 3 illustrates how the sample footprint can be used to image laser-X-ray time
delay. The sample footprint is defined as the area which is illuminated by incoming X-rays.
In regular pump-probe experiments, the sample is excited by a laser pulse then probed using
X-rays at a time delay. It is possible to create a varying time delay along the width x of this
sample footprint by placing the X-ray probe at an angle to the laser pump such that the
pump arrives first, followed by the probe at a time delay that increases across the sample
footprint via the speed of light. If the laser pump incidence is normal to the sample, the
time delay can be described by the equation TD= xc. We can shorten this time delay by
decreasing the incidence angle of the laser pump.
In a similar way we can also vary the energy of incoming X-rays along the sample footprint
for RIXS measurements, shown in Figure 4. At the Soft X-Ray (SXR) beamline at LCLS,
a monochromator tunes incoming X-ray energy by dispersing the photons with a grating
and selecting the desired energy using an entrance slit. By increasing the size of this slit, a
range of energies (5 eV, for example) can be used to illuminate the sample with incoming
energy related to position x on the footprint. The footprint width is dictated by the energy
dispersion of the monochromator and the angle of the sample to the incoming beam. To
achieve an energy difference of 2 eV at the SXR beamline a footprint with width of about 2
mm must be used.
The conceptual design of the proposed spectrometer is shown in Figure 5. Imaging over
the sample footprint is in the non-dispersive direction of the grating; light in the dispersive
direction, which corresponds to vertical on the sample, is dispersed by the grating according
to its energy and focused. In the typical spectrometer design, rays are not focused in the
3

non-dispersive direction. In order to have a meaningful picture on the detector that gives
some information about the sample at increasing time delay or energy, the light in this
non-dispersive direction must be focused. This is achieved by adding a concave mirror
perpendicular to the grating. The result is an image on the detector in which many XES
spectra can be observed as a function of incoming energy or pump-probe delay.
Due to the low cross-section of the X-ray emission technique, one of the most important
aspects in the design of the spectrometer is to maximize throughput while maintaining an
energy resolution small enough to study the systems of interest. Figure 5 includes a summary
of the desired resolution. In the case of surface reactions involving adsorbates on catalysts
studied here, 0.25 eV is the best resolution required. It is also useful in some cases to allow
high throughput measurements at up to 1 eV resolution. For time-resolved experiments,
we define a resolution of 10 µm on the source in the non-dispersive direction corresponding
to a 30 fs time-delay (Figure 3). For the RIXS case with varying energy along the sample
footprint we wish to have a 0.25 eV incoming energy resolution. Using the SXR beamline
design and an incidence angle of 12, we define this as 200 µm. For the sake of clarity, we
refer to resolution in the dispersive direction as the energy resolution of the spectrometer
and to resolution in the non-dispersive direction as imaging resolution, which for the RIXS
case is in units of energy. Additionally, the spectrometer will be optimized for use at 520
eV, the oxygen K-line.
To analyze the possible designs of the spectrometer, we performed ray-tracing simulations
using the SHADOWVUI extension of X-Ray Oriented Programs (XOP) [5]. We tested several
illumination distances for the grating and for the non-dispersive focusing mirror. We also
looked at the effect of changing the mirror’s position, causing changes in the magnification
at the detector, and investigated several possible mirror shapes.
4

RESULTS
The final design of the spectrometer has three main components: the imaging mirror, disper-
sive grating, and detector. The detector to be used has already been specified—a 4 x 4 cm
multichannel plate used with a CCD camera to produce a picture of intensity vs. position
in two dimensions. Therefore, our main focus has been analyzing the performance of the
dispersive grating and the imaging mirror.
Dispersive Grating
The most basic spectrometer design consists of a dispersive grating and detector; this is a
useful starting point for the new design. We choose three parameters of the grating that will
dictate the geometry of the entire spectrometer: the radius of curvature R at the center, the
ruling spacing d, and the incidence angle α. From these parameters one can mathematically
determine the total length of the spectrometer and the energy dispersion at the detector.
The energy dispersion describes the way that the vertical detector position changes with
photon energy. For soft X-ray applications the incoming angle must be small because many
of the X-rays will be absorbed by the grating material. This is limited by using grazing
incidence near or below the material’s critical angle. For a nickel coated mirror at 520 eV
this angle is on the order of 4; above this angle the reflectivity decreases sharply. This
design uses an incidence angle of 5, or α = 85 (α is defined relative to normal incidence).
We define the radius of curvature R and the ruling spacing d based on the spectrometer’s
desired length and dispersion. We wish to have a total length close to 1 meter and an energy
dispersion of about 0.4 µm/meV. A reasonably small source size (about 10 µm) should have
an energy resolution close to 0.25 eV, the high-resolution design goal. This fact dictates
the energy dispersion required of the grating. The proper spectrometer length and energy
dispersion are achieved with R = 7.5 m and a grating spacing of 800 rulings per mm.
5

From α, R, and d we can determine the correct position of the sample, grating, and
detector such that the light coming off of the grating is focused at the detector. These
positions are determined using the Rowland Circle geometry shown in Figure 6. For a
grating with radius of curvature R there exists a circle of diameter R such that if the source
of light is on this circle, then the diffracted image in all orders will be in focus at points on
the circle. From these conditions, we can calculate the correct positions of the grating and
detector relative to the sample (summarized in Figure 6). The spectrometer is operated in
negative order to increase the distance between the sample and grating, which is necessary
for the inclusion of the non-dispersive focusing mirror.
The grating’s shape is that of a symmetric ellipse. This shape produces lower spherical
aberrations than a spherical reflector would, allowing a longer section of the grating to be
illuminated before similar errors to a sphere are produced. A longer illumination distance
allows more rays to strike the grating, resulting in a higher overall throughput. The best
shape of this ellipse is determined through calculations that show the energy dispersion at
different offsets from the center of the grating. The relationship between the major and
minor axes’ lengths is constrained by the requirement that the curvature at the center of
the grating be equal to 7.5 m. This allows us to manipulate the length of the major axis of
the ellipse and see the effect on the energy dispersion. The best shape is that for which the
dispersion is symmetric about the center of the grating. In this case, we use a major axis of
about 55 cm for which the corresponding minor axis length is 4 cm.
Imaging Mirror
To allow for imaging in the non-dispersive direction, we consider a mirror reflecting this
direction, focusing at the same spot as that defined by the grating. The position, shape,
and grazing are chosen such that light from the source will be focused at the position of the
detector. The mirror’s position also determines the magnification at the detector.
6

The “perfect” shape of the mirror is dictated by the source distance, the detector (image)
distance, and the incidence angle. For the same reasons as in the case of the grating, a very
grazing incidence angle must be used; here we choose 4 again based on the reflectivity of a
nickel coated mirror. SHADOW calculates the ideal shape of the mirror given its geometry
(elliptical or spherical), the object and image focus distances, and the incidence angle. We
analyzed the performance of three possible mirror shapes: a sphere, a symmetric ellipse, and
an ideal ellipse. Figure 7 illustrates the distinction between the ideal and symmetric ellipses.
What we call an ideal ellipse is the small section of the ellipse with foci at the sample and the
detector for which light from the sample is incident at the specified angle. The symmetric
ellipse is a section of the ellipse centered at one of the ellipse’s axes, thus its curvature is
symmetric about its center.
The first case simulated in SHADOW was 1:10 imaging for an ideal elliptical mirror at 4
incidence. In addition to viewing the image spot at the detector we used a SHADOW post
processor called FOCNEW to determine if the mirror was focusing as required. FOCNEW
computes the waist size of the X-ray beam as a function of its position from an optical
element and returns the position in which this size is smallest. Based on the parameters of
the mirror, the best focus should be at the same location as the detector.
The result of analysis in FOCNEW was unexpected: the mirror’s focusing ability was
extremely sensitive to source’s size and angular divergence. Specifically, if a source divergence
of 0.015 rad is used the position of best focus deviates from the detector position for any
source size larger than 10 µm. This sensitivity is related to the departure of an ideal point
source towards a source that is closer to a plane wave. This issue is limited to the width
of the source as this is the direction in which this mirror is focusing; changing the source
height or divergence in the vertical direction has no effect on the focus. Further simulations
in SHADOW showed that for larger source sizes up to 1 mm the use of a larger divergence
(around 0.15 rad) corrected the focusing issue, however here the detector image was very
7

distorted and asymmetrical.
To better understand how the imaging distortion affects the performance of the spectrom-
eter we carried out a series of simulations in which for different magnifications we determined
the maximum divergence that could resolve 200 µm on the source, conforming to the design
goal. For example, in the 1:10 case, a spot 200 µm on the source corresponds to a 2 mm
spot on the detector, thus we determined which source divergence produced a 2 mm spot.
For these simulations, we used a point source 500 µm offset from the center, i.e. the edge
of a 1 mm sample footprint. Our goal was to determine if a smaller magnification would
decrease the effects of this focusing problem. The results can be seen in Table 1. The max-
imum divergence remained steady around 0.01 rad for magnifications between 1:10 and 1:2
but decreased in the demagnification cases. Based on these results there is no reason to use
a smaller magnification than 10, since it would decrease the achievable resolution without
improving the instrument’s acceptance. A magnification higher than 10 is impractical, as
the mirror would need to be placed too near the sample.
We also investigated the effect of the mirror’s shape on focusing, with the goal of de-
termining whether a spherical or symmetric elliptical mirror would perform better than the
ideal ellipse. For the spherical mirror, SHADOW calculates the proper radius based again
on the image and object focal distances and the incoming angle. The proper shape of the
symmetric elliptical mirror can be determined using the radius that SHADOW calculates
for the spherical mirror as the radius of curvature of the center of the ellipse. From this we
know the Rowland circle radius and can find the major and minor axis lengths. In the 1:10
case using a 5 µm source, neither the spherical nor symmetric elliptical mirror was able to
produce a source resolution of 200 µm for any divergence greater than 0.001 rad. Based on
this observation, alternative shapes to the ideal ellipse were discarded.
From these results we can conclude that of the configurations that were investigated, the
1:10 ideal ellipse at 4 is the best choice for the non-dispersive focusing in this design.
8

Resolution Determination
The proper length of both the mirror and the grating now must be determined. Here,
the balance between resolution and flux has a large impact—longer illumination distances
on the optics will create high throughput but also cause imaging error through spherical
aberrations present when concave optics are illuminated far from their centers. We optimized
this balance by finding the longest illumination of the mirror and grating conforming to
the previously listed energy and imaging resolutions required for the different applications
(Figure 5). This is achieved by simulating the resolution at different illumination lengths
on both the mirror and the grating. The results are shown in Table 2. We examine the
case of a point source, a small source (50 µm offset point source) as in the time-resolved
case, and a large source (RIXS case, 500 µm offset). The resolution is measured by finding
the full width at half maximum (FWHM) of the spot on the detector in each axis (vertical
corresponds to imaging, and horizontal to energy). These lengths can then be converted to
time or energy resolutions using the relationships between sample position and energy in
the non-dispersive direction, or the calculated energy dispersion in the dispersive direction.
Usable combinations of illumination lengths are those for which the resolution is lower then
the specified requirements.
According to this data, it appears as though the grating can be illuminated up to 16
cm and still have the appropriate resolution. However, at illuminations above 10 cm an
asymmetry appears in the detector image due to spherical aberrations. This asymmetry is
not easily identifiable in the numerical data because the FWHM was used to find the spot
size, and the intensity of the asymmetry is low enough that it does not significantly alter the
value of the FWHM. Figure 8 shows the detector footprint for a 10 cm grating illumination
and for a 12 cm illumination. Here, it is easy to see the asymmetry that appears. One can
determine whether it is beneficial to illuminate more than 10 cm of the grating by looking
only at the contribution of the outer regions. If the main contribution of these regions is to
9

the asymmetry in the image rather than to the peak then it is not useful to include them.
The results of a simulation in which only the outer 1 cm of the grating was illuminated are
shown in the graph in Figure 9. Around an illumination of 12 cm, once can see that the
position of the image begins to deviate significantly from the center. Therefore, it is wise
to exclude any length greater than 12 cm on the grating for measurements requiring high
energy resolution. For applications in which a high resolution is less important, illuminating
up to 18 cm of the grating allows greater throughput at resolutions up to 1 eV.
From these simulations, we determine that a grating illumination of 10 cm is acceptable
for both of the spectrometer’s applications. In the case of time-resolved XES, a time reso-
lution around 30 fs on the sample is achieved for a mirror illumination of 1.8 cm. For the
RIXS case, a resolution of 0.25 eV is achievable with 3 cm illumination of the mirror.
DISCUSSION AND CONCLUSIONS
Figure 10 depicts the final schematic of the design, along with a summary of the parameters
determined from ray-tracing simulations that optimize its performance. With these param-
eters, the instrument is able to image sample footprints smaller than 1 mm. Under these
conditions, time-resolved XES measurements can be performed as well as RIXS measure-
ments in which a small spot size is possible. Figure 4 shows how this spot size is limited
by the setup of the beamline at which these measurements are performed, providing a com-
parison between the SXR beamline of LCLS and beamline 13 at the Stanford Synchrotron
Radiation Lightsource (SSRL). Currently, the energy spread per mm on the sample at SXR
is such that to image an energy difference of 2 eV a sample footprint of width 2 mm or
more would be required. This width can be minimized by placing the sample at normal
incidence to the X-ray beam, however this would prevent the study of surface catalysis for
which grazing incidence on the sample is needed. The setup at SSRL beamline 13 allows an
10

acceptably small footprint size for these measurements, which allows steady state RIXS as
well as picosecond time resolved measurements using the low-alpha operational mode of the
Stanford Positron-Electron Accelerating Ring (SPEAR). However, LCLS’s peak power and
femtosecond resolution are ultimately needed for many of the prospective chemical dynamics
studies considered here. At the SXR beamline, applications to surface reactions would be
possible with an upgraded monochromator having lower energy dispersion (i.e. more eV per
mm). A beamline at the future LCLS-II could also be designed with dispersion low enough
to allow these measurements. The realization of one of these possibilities will make this
spectrometer a powerful tool for the study of chemical systems.
ACKNOWLEDGMENTS
This research was completed at SLAC National Accelerator Laboratory between June and
August 2011. Many thanks to my mentor, Dennis Nordlund, for his enthusiasm and guid-
ance. I’d also like to acknowledge the funding provided to the SULI program by the U.S.
Department of Energy, and thank the staff at SLAC who make this program such a success.
Finally, thanks to my fellow SULI students for making this summer so memorable.
REFERENCES
[1] A. Nilsson, “Applications of core level spectroscopy to adsorbates,” Journal of Electron
Spectroscopy and Related Phenomena, vol. 126, no. 1-3, pp. 3 – 42, 2002. [Online].
Available: http://www.sciencedirect.com/science/article/pii/S036820480200141X
[2] S. Dahl, A. Logadottir, R. C. Egeberg, J. H. Larsen, I. Chorkendorff, E. Tornqvist, and
J. K. Nørskov, “Role of steps in N2 activation on Ru(0001),” Phys. Rev. Lett., vol. 83,
no. 9, pp. 1814–1817, Aug 1999.
11

[3] R. Schrock, “Nitrogen fix,” Technology Review, May 2006. [Online]. Available:
http://www.technologyreview.com/article/16822/
[4] A. Nilsson and L. G. M. Pettersson, “Chemical bonding on surfaces probed
by X-ray emission spectroscopy and density functional theory,” Surface Science
Reports, vol. 55, no. 2-5, pp. 49 – 167, 2004. [Online]. Available: http:
//www.sciencedirect.com/science/article/pii/S0167572904000573
[5] M. Sanchez de Rio and R. J. Dejus, “Status of XOP: an X-ray optics
software toolkit,” in Proc. SPIE, vol. 5536, 2004, p. 171. [Online]. Available:
http://dx.doi.org/10.1117/12.560903
12

FIGURES
hν hν
Figure 1: Illustration of the non-resonant (left) and resonant (right) cases of XES. IncomingX-ray radiation excites an electron from the atom’s core level, ejecting it in the non-resonantcase or promoting it to an unoccupied orbital level in the resonant case. A valence electronof the atom then falls to fill the core level vacancy, emitting a photon with energy equal tothe energy difference between its initial and final states.
Entrance Slit
Rowland GratingDispersive Grating, Spherical Focusing 2-D Detector
Figure 2: The basic schematic of a typical X-ray emission spectrometer, consisting of adispersive grating and detector.
13

α
hv
LCLS x-ray beam Sample Footprint (FP)
grazing incidence
beam size: h x vx = h / sin αTD = x / c
Laser beam
x
Figure 3: Illustration of imaging in the non-dispersive direction with variable time delay.For time-resolved imaging place the X-ray probe at an angle to the laser pump at normalincidence, causing the probe to arrive at a time delay linearly related to position x on thefootprint.
Δx
θ
X X’
Sample
EnergyDispersion
dE
Entrance SlitDispersive gratingSample
For sample at θ=12°: dE (slit) X:X’ dE (sample)LCLS SXR 0.82 mm/eV 4:1 1 eV/mmSSRL BL 13 0.15 mm/eV 7:1 10 eV/mm
Mirror
Figure 4: Illustration of the SXR beamline monochromator. Widening the entrance slitallows a range of wavelengths to illuminate the sample footprint. The footprint width isdictated by the monochromator’s energy dispersion at the sample and the angle at whichthe sample is placed relative to the X-ray beam. The current setup at SXR allows 1 eV tobe imaged per mm on the sample; we also provide a comparison to the monochromator atSSRL beamline 13 for which the dispersion at the sample is ten times smaller. An improvedsetup would have the ability to produce a higher energy difference at more grazing incidenceon the sample.
14

α
LCLS X-ray Probe
Low Energy High Energy
Imaging Optics
Dispersive Grating
2-D DetectorMCP + CCD
X-ray Emission Energy
Inco
min
g X
-ray
Ene
rgy
Optimized for 520 eV (O)Minimum Energy Resolution: 0.25 eVMinimum Imaging Resolution: 10 μm
Figure 5: A schematic of the proposed spectrometer. The incoming X-rays vary in energyalong the sample footprint x. X-rays emitted from the sample are focused in the non-dispersive direction by a concave mirror. An elliptical grating disperses the rays accordingto energy and focuses them in this dispersive direction, producing the detector image shownin the figure. The time-resolved case is very similar: a laser pump is added at an angle tothe X-ray probe such that time delay varies across x. The 2D detector displays X-ray probedelay in the vertical rather than incoming X-ray energy.
m = -1α
β
r
r
d = 1/800 mm R = 7.5 mE = 520 eV = h c / λ 90° - α = 5.0°λ = 2.34 nm 90° - β = 3.53°d (sin α + sin β) = m λr = R cos α r = 65.37 cm r’ = R cos β r' = 46.19 cmRowland Circle
Figure 6: Illustration of the sample-grating-detector setup, showing the Rowland circle ge-ometry and the details of calculations of the correct grating and detector positions. TheRowland Circle is a circle with radius one-half the radius of curvature of the center of thegrating. If the source is located on this circle, the diffracted image in all orders will be infocus on the circle.
15

Ideal Ellipse Symmetric Ellipse
Source Detector
Mirror
Source Detector
Mirror
Figure 7: Distinction between symmetric and ideal elliptical geometries. In the proposedspectrometer design, the non-dispersive focusing mirror has an ideal elliptical shape, whilethe grating is a symmetric ellipse with focusing dictated by the Rowland condition
.
Figure 8: Detector footprints in SHADOW for a grating illumination of 10 cm (left) and 12cm (right). These show the picture of the X-ray spot on the detector, with the dispersivedirection being in the horizontal and the non-dispersive in the vertical. One can easily seethe asymmetry that begins to appear in the 12 cm case due to aberrations resulting fromthe illumination of the grating far from its center.
16

Figure 9: The contribution of only the outer 1 cm of the grating illumination to the detectorspot size. If the position of the spot’s center deviates significantly from its position whenthe center of the grating is illuminated, this section of the grating contributes mainly to theasymmetry in the image at the detector. The position is given in eV for ease of comparisonto the design requirements. We see that for a resolution of 0.25 eV, we can illuminate 12 cmof the grating; for 1 eV resolution up to 18 cm can be illuminated.
MCP + CCD
Grating
1:10 imaging
Low EnergyHigh Energy
LCLS beam
sample
Probe EarlyProbe Late
Time-resolved XES
RIXS
LCLS beam
rm r’mr’grg
Positionsrm: 10.1 cmr’m: 101.4 cmrg: 65.4 cmr’g: 46.2 cm
GratingRadius (R): 7.5 mMajor Axis: 55.0 cmMinor Axis: 4.0 cmLine density: 800 mm-1
Incoming angle: 5°Outgoing angle: 3.5° (520 eV)Illumination distance: 12 cm(high resolution)
Illumination distance: 18 cm(high throughput)
MirrorMajor Axis: 55.8 cmMinor Axis: 2.2 cmIncoming angle: 4°Illumination Distance: 3 cm(RIXS)
Illumination Distance: 1.8 cm(Time-resolved XES)
Sam
ple
Focusing mirror
Grating Detector
Top view:
Figure 10: Schematic of the proposed design, including summary of the component param-eters.
17

TABLES
Table 1: The maximum source angular divergence that allows 200 µm source resolution fora 5 µm source offset 500µm at different magnifications of the source. From this data wedetermine the best position of the non-dispersive focusing mirror to be that which allows1:10 imaging.
Magnification Sample Resolution Source Divergence (rad)1:10 2 mm 0.0111:7 1.4 mm 0.0111:5 1 mm 0.0111:3 600 µm 0.0111:2 400 µm 0.0091:1 200 µm 0.0072:1 100 µm 0.0053:1 66 µm 0.00355:1 40 µm 0.00237:1 29 µm 0.001710:1 20 µm 0.0013
18

Table 2: The results of simulations in which different grating and mirror illumination lengthswere tested to determine which combinations produce the necessary resolution for the instru-ment. In the time-resolved XES case, we used a point source offset 50 µm from the center tosimulate a 100 µm source; for the RIXS the offset was 500 µm for a 1 mm source. Blue cellsrepresent those combinations which yield an acceptable resolution. Yellow cells appear tohave acceptable resolution but have grating illuminations at which there is significant imageerror.
Time Resolution (fs)
Mirror length (cm)3.0 2.4 1.8 1.2 0.6
Gra
ting
lengt
h(c
m)
16.0 48.416 41.619 31.249 20.373 9.47812.8 48.345 41.796 29.511 19.476 9.7759.6 47.315 41.397 31.101 19.890 9.7876.4 47.042 40.950 31.216 19.916 9.6473.2 46.995 39.051 30.744 20.471 9.325
Energy Resolution (eV)
Mirror length (cm)3.0 2.4 1.8 1.2 0.6
Gra
ting
lengt
h(c
m)
16.0 0.1230 0.1041 0.0859 0.0678 0.033512.8 0.1230 0.1038 0.0857 0.0674 0.03339.6 0.1231 0.1032 0.0860 0.0680 0.03406.4 0.1227 0.1034 0.0860 0.0673 0.03333.2 0.1215 0.1034 0.0839 0.0667 0.0333
19

Space Charge Correction on Emittance Measurement of Low
Energy Electron Beams
Colleen J. Treado
Office of Science, Science Undergraduate Laboratory Internship (SULI)
University of Massachusetts Amherst
SLAC National Accelerator Laboratory
Stanford, CA 94025
August 12, 2011
Prepared in partial fulfillment of the requirements of the Office of Science, Department of En-
ergy’s Science Undergraduate Laboratory Internship under the direction of Cecile Limborg-
Deprey at the Accelerator Division, SLAC National Accelerator Laboratory.
Participant:
Signature
Research Advisor:
Signature
SLAC-TN-12-027
Work supported by US Department of Energy contract DE-AC02-76SF00515.

TABLE OF CONTENTS
Abstract ii
Introduction 1
Materials and Methods 5
Results 11
Discussion and Conclusions 13
Acknowledgements 15
References 15
i

ABSTRACT
Space Charge Correction on Emittance Measurement of Low Energy Electron Beams. COLLEEN
J. TREADO (University of Massachusetts Amherst, Amherst, MA 01003) CECILE LIMBORG-
DEPREY (Accelerator Division, SLAC National Accelerator Laboratory, Stanford, CA 94025)
The goal of any particle accelerator is to optimize the transport of a charged particle
beam along a set path by confining the beam to a small region close to the design trajectory
and directing it accurately along the beamline. To do so in the simplest fashion, accelera-
tors use a system of magnets that exert approximately linear electromagnetic forces on the
charged beam. These electromagnets bend the beam along the desired path, in the case of
bending magnets, and constrain the beam to the desired area through alternating focusing
and defocusing effects, in the case of quadrupole magnets. We can model the transport
of such a beam through transfer matrices representing the actions of the various beamline
elements. However, space charge effects, produced from self electric fields within the beam,
defocus the beam and must be accounted for in the calculation of beam emittance. We
present below the preliminary results of a MATLAB code built to model the transport of a
charged particle beam through an accelerator and measure the emittance under the influence
of space charge effects. We demonstrate the method of correctly calculating the emittance of
a beam under space charge effects using a least square fit to determine the initial properties
of the beam given the beam size measured at a specific point after transport.
ii

INTRODUCTION
Accelerator physics studies the optimization of the acceleration and transport of charged
particle beams. We define a beam through its distribution in phase space using the par-
ticles spatial coordinates and conjugate coordinates, or normalized momenta. The spatial
coordinates, (x, y, z), correspond to the displacements of the particles from a synchronous
particle, corresponding to the centroid of the beam and having a specified design velocity
and trajectory. The z-coordinate, aligned with the design trajectory, represents the longi-
tudinal position of the beam along the accelerator, thus leaving the xy-plane to represent
the transverse plane. The normalized momenta, (x′, y′, z′), are taken with respect to the
longitudinal position of the synchronous particle, s, rather than time [1].
In a particle accelerator, the beam is guided along a desired path by electromagnetic
forces produced by components of the accelerator. These forces, known as Lorentz forces
and defined as
F = qE +q
c(v×B), (1)
where q is the charge of a single particle, E is the electric field, v is the velocity of the
synchronous particle, and B is the magnetic field, also confine the beam to a narrow region.
To good approximation, all of the fields contributing to the Lorentz forces can be assumed
as linear, and the evolution of the trajectory of the charged particle beam due to such
linear Lorentz forces is known as linear beam dynamics. Such forces are produced by beam
transport magnets, specifically quadrupoles and bending magnets, the two of which alone
completely achieve the basic principles of linear beam dynamics, enabling beam transport
systems to consist solely of linear components [2]. Thus, we can approximate the equations
of motion governing the transport of the charged particle beam through the accelerator to
1

first order as harmonic oscillators, as follows:
x′′ +κx
γmc2β2x = 0, (2)
y′′ +κy
γmc2β2y = 0, (3)
z′′ +κz
γmc2β2z = 0, (4)
where β =v
c, with c being the speed of light, γ =
1√1− β2
, m is the mass of a parti-
cle, κα represents the action of the transport element on the beam, and primes represent
differentiation with respect to s [1].
An important concept in accelerator physics is that of the rms envelope. The rms en-
velopes represent the size of the beam and are described by
x =√< x2 >, (5)
y =√< y2 >, (6)
z =√< z2 >, (7)
for a centered beam [1]. More important yet is the beam emittance, which represents the
volume in phase space occupied by the rms particle beam envelopes and is defined as
εx =√< x2 >< x′2 > − < xx′ >2, (8)
with similar definitions in the y and z planes. Under the influence of only linear forces,
the emittance is unchanged by the motion of the beam, and a changing emittance indicates
undesired nonlinear forces acting on the beam. Therefore, producing and maintaining a
small transverse beam emittance is among the fundamental objectives in the design and
2

operation of a high quality accelerator.
While it is possible to describe the transformation of the particle beam through trans-
portation of individual particles, this method is often cumbersome and time-consuming. We
demonstrate that it is possible and effective to instead directly transport only the second
order moments of the beam. We surround the two-dimensional projection of the particle
beam distribution with an ellipse, defined by:
γxx2 + 2αxxx
′ + βxx′2 = εx, (9)
for the x projection, where αx, βx, and γx are the Courant-Snyder, or Twiss, parameters,
defined below:
αx =< xx′ >
εx, (10)
βx =< x2 >
εx, (11)
γx =< x′2 >
εx, (12)
[1]. The ellipse has an area of A = πεx, where εx is the emittance in x [2]. Similar ellipses
and parameters exist in the y and z planes. Liouville’s Theorem, which states that the
density of particles remains constant along the beam transport, or
d
dsf(x(s), x′(s), y(s), y′(s), z(s), z′(s)) = 0, (13)
where f is the density function of the phase space coordinates [1], ensures that the particles
contained within the ellipse remain within the ellipse and that the ellipse’s area, and thus the
emittance of the beam, remains constant throughout the entire transport along the beam.
Therefore, it is possible to describe the transformation of the beam through the transforma-
tion of its Twiss parameters alone [2]. As the emittance remains unchanged, measuring the
3

transformation of the Twiss parameters is equivalent to measuring the transformation of the
beam’s second order moments; therefore, we can model the transport of the charged particle
beam through the transport of its second order moments.
A charged particle beam is subject to defocusing electrostatic forces between the charged
particles and to focusing magnetic forces, due to the motion of the charged particles and
dependent on the velocity of the beam. However, at low beam energies, the electric forces
are greater than the magnetic forces; therefore, the self-fields generated from the electric
forces non-negligibly defocus, and thus destabilize, the beam. The equations of motion are
no longer homogeneous, instead described by
x′′ +κx
γmc2β2x = K
2πε0qN
Ex, (14)
y′′ +κy
γmc2β2y = K
2πε0qN
Ey, (15)
z′′ +κz
γmc2β2z = γ2K
2πε0qN
Ez, (16)
where K =qN
2πε0
1
γ3β2
q
mc2[1] is the beam perveance, N is the total number of particles in
the beam, and ε0 is the permittivity of free space. These space charge effects, represented
by the inhomogenous term, must therefore be accounted for in modeling the transport of
the beam through the accelerator. The purpose of the project is to model the transport of
a low energy, specifically between 8 and 100 MeV, electron beam through an accelerator,
accounting for space charge effects when necessary, to accurately measure the emittance of
the beam.
4

MATERIALS AND METHODS
One can analytically transport the beam through solving the differential equations of motion
above. However, it is more convenient, and often as effective, to transport the beam through
a matrix formalism similar to that of linear optics used in the transport of optical beams. A
transfer, or transformation, matrix represents the linear component of the force of a beam
transport element, whether it be a quadrupole, bending magnet, or drift space, which is a
region between magnets in which no external electromagnetic forces act on the beam. The
transport of particle coordinates through that element of the accelerator is given by the
product of the coordinate vector, (x, x′, y, y′, z, z′), and the corresponding transfer matrix of
the accelerator element, as below:
x
x′
y
y′
z
z′
=
Cx(s) Sx(s) 0 0 0 0
C ′x(s) S ′x(s) 0 0 0 0
0 0 Cy(s) Sy(s) 0 0
0 0 C ′y(s) S ′y(s) 0 0
0 0 0 0 Cz(s) Sz(s)
0 0 0 0 C ′z(s) S ′z(s)
x0
x′0
y0
y′0
z0
z′0
, (17)
where (x0, x′0, y0, y
′0, z0, z
′0), is the initial coordinate vector, (x, x′, y, y′, z, z′), is the coordinate
vector after transport, Cα and Sα are the solutions of the differential equations of motion
for a given transport element, and C ′α and S ′α are their derivatives with respect to s [2]. It
is also possible to calculate the transport of the second order moments of the beam through
the same transfer matrices; however, instead of directly transporting the moments as we do
the coordinates above, we create a correlation matrix with indices consisting of the second
5

order moments of the coordinate vector. We define the correlation matrix as:
σ =
< x2 > < xx′ > < xy > < xy′ > < xz > < xz′ >
< xx′ > < x′2 > < x′y > < x′y′ > < x′z > < x′z′ >
< xy > < x′y > < y2 > < yy′ > < yz > < yz′ >
< xy′ > < x′y′ > < yy′ > < y′2 > < y′z > < y′z′ >
< xz > < x′z > < yz > < y′z > < z2 > < zz′ >
< xz′ > < x′z′ > < yz′ > < y′z′ > < zz′ > < z′2 >
(18)
[3], and we transport the second order moments through multiplying the transfer matrix by
the product of the correlation matrix with the transpose of the transfer matrix, as below:
σ = MσMT , (19)
[1], where M is the transfer matrix.
In our case, we focus primarily on the use of quadrupoles, rather than bending magnets,
as transfer components. Quadrupole electromagnets, which are focusing in one plane and
defocusing in the other, can be placed in an alternating focusing and defocusing pattern along
the beam line to provide the appropriate restoring forces necessary to confine the charged
particle beams in the transverse plane. We therefore model the beam line as a system of
quadrupoles and drift spaces, applying the action of each element to the beam as it travels
through the accelerator.
We develop a MATLAB code to model the transport and measure the emittance of low
energy electron beams, specifically less than 100 MeV, in the accelerator. We do so through
the use of transfer matrices and the performance of quadrupole scans to transport both
the particles of the beam individually and the beams statistics as a whole, from which we
calculate the emittance. We discretize the beamline into separate elements, including the
6

quadrupole magnets and drift spaces, the actions of which we represent with different transfer
matrices. In the case of a quadrupole that is focusing in the x-plane and defocusing in the
y-plane, the element is represented by the following 6× 6 matrix:
Mquad =
cos(kl) 1k
cos(kl) 0 0 0 0
−k sin(kl) cos(kl) 0 0 0 0
0 0 cosh(kl) 1k
sinh(kl) 0 0
0 0 k sinh(kl) cosh(kl) 0 0
0 0 0 0 1 l
0 0 0 0 0 1
(20)
where k =√|K|, with K being the focusing strength of the quadrupole magnet, and l is
the length of the quadrupole [1]. We represent a drift space through the following transfer
matrix:
Mdrift =
1 L 0 0 0 0
0 1 0 0 0 0
0 0 1 L 0 0
0 0 0 1 0 0
0 0 0 0 1 L
0 0 0 0 0 1
(21)
where L is the length of the drift space [1]. We systematically move along the beamline,
separately multiplying the particle coordinate vector by the corresponding transfer matrix
that the beam is currently moving through in order to computationally transport the coor-
dinates of the beam. Simultaneously, we transport the statistics of the beam through the
same approach, comparing the transported moments with the second order moments of the
transported coordinates to confirm their consistency. We model the action of the entire
accelerator on the beam through the matrix product of each successive beamline element’s
7

transfer matrix. However, in cases of low energy or high charge, space charge effects on the
beam become non-negligible and must be accounted for in the beam transport in order to
accurately calculate the beam emittance. We account for space charge effects by applying
a kick to the beam at regular, short intervals and represent these effects through a matrix
similar to the transfer matrices above:
MSC =
1 0 0 0 0 0
∆sfsc,x
1 0 0 0 0
0 0 1 0 0 0
0 0 ∆sfsc,y
1 0 0
0 0 0 0 1 0
0 0 0 0 ∆sfsc,z
1
(22)
where ∆s is the short interval over which the space charge effects are applied, and fsc is the
thin lens focal length due to space charge, defined as:
1
fsc,x=K
2[1
5
1
< x2 >]3/2RD[
< y2 >
< x2,< z2 >
< x2 >, 1] (23)
1
fsc,y=K
2[1
5
1
< y2 >]3/2RD[
< z2 >
< y2,< x2 >
< y2 >, 1] (24)
1
fsc,z=K
2[1
5
1
< z2 >]3/2RD[
< x2 >
< z2,< y2 >
< z2 >, 1] (25)
where K is the beam perveance, defined above, and RD is the Carlton elliptic integral of the
second kind, defined as
RD(x, y, z) =3
2
∫ ∞0
dt
(t+ x)1/2(t+ y)1/2(t+ z)3/2, (26)
[1]. We thus account for space charge effects by transporting the beam over small subsections
8

of the beamline through the transfer matrix approach presented above and then applying
the space charge effect matrix after each subsection. In other words, we perform the matrix
multiplication described above to yield the transported second order moments, which we
use, along with the small longitudinal displacement over which we calculated the transport,
in the calculation of the space charge matrix. We then transport the beam, either the
coordinates or the second order moments directly, through the space charge matrix using
the same formalism as without space charge. We mathematically express this method below:
U = M × U0, (27)
USC = SC × U = SC ×M × U0, (28)
where U0 is the initial coordinate vector, M is the transfer matrix, U is the coordinate vector
after transport through the transfer element, SC is the space charge effect matrix, and USC
is the coordinate vector after application of space charge effects, and
σ = M × σ0 ×MT , (29)
σSC = SC × σ × SCT = SC ×M × σ0 ×MT × SCT , (30)
where σ is the correlation matrix. This process of repeatedly transporting the beam is
equivalent to representing the action of the entire beam as a single transfer matrix, formed
from the product of each successive transfer matrix, as expressed below:
M = Msc,nMnMsc,n−1Mn−1 · · ·Msc,2M2Msc,1M1. (31)
From this application of space charge effects, we obtain the true transport of coordinates
and moments and thus the correct emmitance of the beam under space charge effects.
9

The hope of this project is to develop a code that enables us to reconstitute the initial
properties of an actual beam, from which we can then calculate the emittance. Because the
divergence of the beam is not easily accessible, we measure the xrms value at a desired point
on the beamline. From the method used in individual particle transport, we know that
x
x′
= M
x0
x′0
(32)
where
M =
m11 m12
m21 m22
(33)
is the x-related portion of the matrix formed from the product of consecutive beam transport
matrices. From the above equation, we see that
x = m11x0 +m12x′0, (34)
x2 = m112x0
2 + 2m11m12x0x′0 +m12
2x0′2, (35)
which we can express as
< x2 >= a < x02 > +b < x0x
′0 > +c < x0
′2 > . (36)
We know the coefficients, a, b, and c, from the indices of M , and we strive to determine
the initial second order moments of the beam. Thus, we have three unknowns but only one
equation. In order to solve for the unknowns, we introduce more equations by varying the
beam elements and measuring the corresponding beam sizes. In our case, we varied only the
focusing strength of one quadrupole of the system to calculate the xrms values as a function
of varying focusing strength. Using MATLAB’s lsqcurvefit function, we least square fitted
10

the coefficients of the above equation to the squares of the measured xrms values, from
which we determined the initial properties and calculated the emittance of the beam. If we
exclude the space charge effects matrices from the calculation of M, we should expect to
see a difference between the corresponding emittance and the emittance calculated from an
M that includes space charge, with the emittance including space charge being the correct
value. We also benchmark our code through comparison with simulations in ASTRA [4], a
macroparticle based space charge code.
RESULTS
Through running our code over drift spaces and quadrupoles, we obtained the same results
from individual particle transport as from second order moment transport, thus confirming
the consistency between the two methods. Both methods yielded the same second order
moments through transport along the beam, and therefore the same emittances, enabling
us to continue with the faster method of direct second order moment transport. We ran
our code over a system of four quadrupoles with length 0.2062 m and various focusing
strengths placed at 2.003, 2.410, 3.216, and 3.6122 meters along a 5.5 meter beamline,
comparing our results with those from ASTRA simulations. In the case of a quadrupole
system with focusing strengths of -3.416, 2.3, 5,801, and -7 respectively, we found small
differences between our distributions transported without regard to space charge and those
created in ASTRA simulations (Fig. 1), confirming the necessity of including space charge
effects in the transport of a charged particle beam.
Then, using a separate quadrupole system, with quadrupoles of strength -9.059, -7.865,
and -1.342 for the first, third, and fourth quadrupoles, respectively, we varied the focusing
strength of the second quadrupole. We transported the beam at various charges through
the system, using seven different focusing strengths, between 9.5 and 11.5, of the second
11

quadrupole and calculated the beam envelopes at 4.3 meters for each focusing strength.
ASTRA simulations of the xrms values as a function of focusing strength for the system
described above are shown in Fig. 2. We fit the curves of this ASTRA simulation using the
transfer matrix, M , of the beam that excludes space charge effects, thus calculating different
normalized emittances for beams of different charges, as we expected (Fig. 3). We then
compared this simulated data with the results from our transport code, run over the same
setup [Fig. 4]. Using the beam sizes calculated from our transport, we performed the least
square fit using both the transfer matrix produced from the product of all beam transfer
matrices, including space charge, and the transfer matrix produced without space charge.
Similar to the ASTRA data and expected results, we saw a constant emittance from charge
to charge when including space charge effects in the matrix, and we saw a changing emittance
from charge to charge when excluding space charge effects, which we show in Fig. 5.
We also transported the beam over a single drift space of one meter to better compare
our results with ASTRA, slicing the beam along the z-coordinate and transporting each
slice individually for various beam energies and charges. We introduced a form factor to the
charge of the beam, which we also later introduced in our quadrupole scans, in order to fit
the xrms values of the beam to the ASTRA data. In the case of the 100 MeV beam, we
were able to closely fit the xrms values to the ASTRA data by applying a factor of .045 to
the charge of each slice of the beam. We sliced the beam because in lower energy beams,
the spread of the energy is large, meaning the linear approximation applied in calculating
the space charge may no longer be valid. We expected the slices to be consistent, in that
we would need to apply the same factor to each slice, which was true in the case of the 100
MeV beam. While each slice and each charge did not exactly fit the ASTRA data for the
100 MeV beam, our data came very close using the .045 form factor, as seen in Fig. 6. We
then modeled this drift in a single slice, the results of which are shown in Fig. 7, finding that
the necessary form factor was the previously mentioned factor multiplied by the number of
12

slices, which in our case was ten. Thus, in modeling the beam without slicing, such as in
our quadrupole scans, we used a form factor of .0045.
We also studied an 8 MeV beam, for which our results were much farther off from the
ASTRA simulations. The necessary factor used to fit the data was much greater, at 0.45,
and the data still did not fit the expected results well, as seen in Fig. 8.
DISCUSSION AND CONCLUSIONS
Our initial results indicate a problem in our transport code that is as of yet unclear. Our
transported data for the second quadrupole variation does not completely correspond to the
ASTRA data for beam charges of 0, 250, and 500 pC. Although we were able to demonstrate
the necessity of the inclusion of space charge effects in the calculation of the transfer matrix
and thus in the reconstitution of the beam emittance by obtaining a constant emittance
with respect to changing charge, our calculated emittance differs slightly from that found
in the no space charge case of the ASTRA simulation. This is most likely due to that
our transported beam does not correspond exactly to the ASTRA simulated data. As is
clear from Fig. 2 and Fig. 4, the beam sizes calculated in our transport code are somewhat
different from those calculated in ASTRA, even including the form factor derived from the
results of our slicing and drift runs. The form factor was introduced because the distribution
of the beam after acceleration is not exactly Gaussian, instead having projections closer to
parabolic distributions. Thus, we apply the form factor to the charge in order to account for
the different beam volume in the calculation of the chare density of the beam, which we use
in calculating the space charge effects. It is also important to note that our our calculation
of the space charge includes an approximation of the RD elliptic integral, as follows:
RD(Z2, Y 2, X2) =3
XZ
1
X + Y(1− ξ( γZ√
XY)), (37)
13

RD(Z2, X2, Y 2) =3
Y Z
1
X + Y(1− ξ( γZ√
XY)), (38)
RD(X2, Y 2, Z2) =3
XY Zξ(
γZ√XY
), (39)
where X2 = 5 < x2 >, Y 2 = 5 < y2 >, Z2 = 5 < z2 >, and ξ(s) is defined below:
ξ(s) =1
1− s2(1− s√
1− s2cos−1(s), s < 1 (40)
ξ(s) =1
1− s2(1− s√
s2 − 1cosh−1(s), s > 1 (41)
The gamma factor in the ξ(s) approximation was added in an attempt to better fit our data
to ASTRA. This gamma factor corresponds to the Lorentz boost, which appears throughout
our equations. We should not have had to introduce this factor here, however, which suggests
we may be missing a gamma factor somewhere else in our equations. Once this missing factor
is found, our data should fit more correctly. We also encountered problems in our results
when running over a simple drift space. We focused on applying a factor to fit the xrms
data, but in doing so, our x’rms and zrms data does not match the ASTRA simulated results.
Because space charge effects depend on the entire volume of the beam, applying a factor to
fit the beam size in x should have affected all of the rms values in a similar way. That the
form factor does not fit the x’rms and zrms values to the ASTRA data suggests another
aspect of our code is negatively affecting our data. Similarly, our results from the 8 MeV
beam are significantly different from ASTRA data. As of yet, more benchmarking with the
8 MeV code is required to understand the problem. We plan to continue with our code,
benchmarking it with ASTRA to determine where the problem lies. We can also perform
a convergence study to determine the best number of steps to use in calculating our space
charge, which may also affect our results. Upon fixing our code to correctly transport the
beam, we will be able to calculate the correct emittances under space charge effects.
14

ACKNOWLEDGEMENTS
I would like to thank my mentor, Cecile Limborg-Deprey, for volunteering her time and effort
this summer. I am extremely grateful for her kindness and help throughout the past weeks
and for providing me with such an interesting and exciting project to work on. I also thank
the Department of Energy and SLAC for sponsoring my research through the SULI program.
I especially thank my fellow SULI students, who made this summer unforgettable.
REFERENCES
[1] C. K. Allen and N. D. Pattengale, “Theory and technique of beam envelope simulation:
Simulation of bunched particle beams with ellipsoidal symmetry and linear space charge
forces,” Los Alamos National Laboratory, Los Alamos, New Mexico, Tech. Rep., August
2001.
[2] H. Wiedemann, Particle Accelerator Physics: Basic Principles and Linear Beam Dynam-
ics, 1st ed. Berlin, Heidelberg: Springer-Verlag, 1993, ch. 4-5, pp. 75–158.
[3] C. K. Allen, “Bunched-beam rms envelope simulation with space charge,” January 2005,
los Alamos National Laboratory Seminar Presentation.
[4] ASTRA A Space Charge Tracking Algorithm User’s Manual, July 2008.
15

FIGURES
0.4 0.2 0 0.2 0.4
0.4
0.2
0
0.2
0.4
x[mm]
x’[m
rad]
0.4 0.2 0 0.2 0.40.4
0.2
0
0.2
0.4
y[mm]
y’[m
rad]
0.8 0.6 0.4 0.2 098
98.5
99
99.5
z[mm]
Ener
gy [M
eV]
0.8 0.6 0.4 0.2 00.5
0
0.5
z[mm]
x’[m
rad]
Figure 1: Overlay of transported distributions on ASTRA simulations at z = 1.9 m (blue),z = 2.1062 m (green, cyan), or immediately following the first quadrupole, and z = 5.5 m(red, magenta), or the end of the beamline, for 100 MeV beam. Transported distributiondoes not take space charge into account. Slight differences between ASTRA and modeleddistributions confirm effects of space charge on transport of beam.
16

Figure 2: Beam envelope in x (xrms) of 0, 250, and 500 pC charged beam from ASTRAsimulations as function of focusing strength of second quadrupole. Space charge effectsclearly influence beam size.
17

Figure 3: Least square fit of ASTRA simulations of beam envelops in x (xrms) as functionof focusing strength of second quadrupole. Matrix used to least square fit does not includespace charge, resulting in changing emittance with increasing beam charge.
18

Figure 4: Beam envelope in x (xrms) of 0, 250, and 500 pC charged beam from MATLABtransport code as function of focusing strength of second quadrupole. Form factor of .0045introduced to charge to better fit results to ASTRA simulations, although beam sizes stilldiffer from expected values. Regardless, fitting with matrix including space charge stillresults in constant emittance from charge to charge, although calculated emittance differsslightly from expected value.
19

0 100 200 300 400 5003.35
3.4
3.45
3.5
3.55
3.6
3.65
3.7
3.75x 10 9
Absolute Value of Beam Charge [pC]
Xem
ittan
ce [m
mm
rad]
Emittance Measurement With and Without Space Charge
including space chargeexcluding space charge
Figure 5: Beam emittance, calculated from least square fit to beam size, as a function ofcharge. Excluding space charge effects from calculation of transfer matrix, indices of whichused as coefficients in least square fit, results in changing emittance with increasing charge.
20

Figure 6: Beam size of 10 z-slices of 100 MeV beam with 250, 500, 750, and 1000 pC charge,respectively, along 1 meter drift. Points represent ASTRA simulated beam sizes at start andend of drift space. Lines represent beam sizes calculated in transport code. Form factor of0.045 applied to charge for each slice. With increasing charge, difference between transportedbeam size and ASTRA simulated beam size at end of drift increases.
21

Figure 7: Beam size of 100 MeV beam without slicing and with 250, 500, 750, and 1000 pCcharge, respectively, along 1 meter drift. Using 0.0045 form factor on each charge, calculatedbeam sizes correspond well with ASTRA simulated curves.
22

Figure 8: Beam size of 8 MeV beam without slicing and with 250, 500, 750, and 1000 pCcharge, respectively, along 1 meter drift. Form factor of 0.45 applied to charge of beam.Clear and significant differences between ASTRA simulated data and data calculated fromtransport code, with differences in beam size increasing with increasing charge. ASTRAsimulates curved growth of beam size along drift, while calculated data models growth ofbeam size linearly.
23

Longitudinal Bunch Pattern Measurements through Single
Photon Counting at SPEAR3
Hongyi (Jack) Wang
Office of Science, Science Undergraduate Laboratory Internship (SULI) Program
UCSD Electrical Engineering Class of 2013
SLAC National Accelerator Laboratory
Stanford, CA
08/03/2011
Prepared in partial fulfillment of the requirements of the Office of Science, Department of Energy’s
Science undergraduate Laboratory Internship under the direction of Jeff Corbett at SSRL, SLAC National
Accelerator Laboratory.
Participant: ------------------------------------------------------- Signature
Research Advisor: -------------------------------------------------------- Signature
Work supported by US Department of Energy contract DE-AC02-76SF00515.
SLAC-TN-12-028

1
Table of Contents:
Abstract 2
Introduction 3
Materials and Methods 7
Results 11
Conclusion 14
Acknowledgement 15
Reference 16

2
Longitudinal Bunch Pattern Measurements through Single Photon Counting at SPEAR3. HONGYI WANG
(University of California, San Diego, La Jolla, CA 92093). Jeff Corbett (SSRL Operations, SLAC National
Laboratory, Menlo Park, CA 94025)
Abstract
The SSRL is a synchrotron light source that provides x-rays for experimental use. As electrons are
bent in the storage ring, they emit electromagnetic radiation. There are 372 different buckets which
electrons can be loaded into. Different filling patterns produce different types of x-rays. What is the
bunch pattern at a given time? Which filling pattern is better? Are there any flaws to the current
injection system? These questions can be answered with this single photon counting experiment.

3
Introduction
The Stanford Synchrotron Radiation Lightsource (SSRL) is a division of SLAC National Accelerator
Laboratory. SSRL provides to users electromagnetic radiation in x-ray, ultraviolet, visible, and infrared
spectrums for a variety of experiments ranging from basic materials science to advanced protein
crystallography and biological research. The various portions of the electromagnetic spectrum are
delivered to 14 different beam-lines by means of mirrors, collimators, and aggressively-cooled grating
and crystal monochromaters. The electromagnetic radiation is given off as synchrotron radiation by
electron bunches stored in the SPEAR3 ring. The electron bunches can be loaded into 372 different
buckets, which are radio-frequency power potential wells in the storage ring. Each electron bunch
produces synchrotron radiation as they are radially accelerated in bend magnets or more advanced
wiggler and undulator magnets.
The circumference of the SPEAR3 storage ring is 234.12 m. The electron bunches therefore
revolve with a turn time of 780 ns, corresponding to a 1.28 MHz repetition rate. When all 372 buckets
contain electrons, experimenters at the photon beam lines see a photon-beam pulse repetition rate up
to 476 MHz. With a maximum of 500 mA total of circulating electron beam current in SPEAR3, the total
synchrotron radiation (SR) power ranges up to 450 kW; however, after filtering and collimation, a typical
beam line only receives a few mW of photon beam power. For most applications, SR Users are
interested in average beam power and not the pulse-by-pulse time structure generated by the individual
bunches separated by 2.1 ns. Nevertheless, the 372 different buckets can be filled with different
electron ‘bunch’ patterns.
Dark-space or ‘gaps’ are normally left between trains of electron bunches, to prevent the
trapping and accumulation of positively-charged ions in the SPEAR3 vacuum chamber. As electrons
travel through the storage ring, there are some positively charged particles flowing around the tube,

4
despite vacuuming efforts. If the buckets are filled without gaps, the continuous electron beam will
attract positively charge particles inside the vacuum chamber towards the beam. As a result, the
positively charged particle will be attracted towards the electrons and continuously deflect the electron
beam. The trapped ions can lead to electron beam instability and particle loss, due to elastic and
inelastic collisions. For this reason, some buckets are left unfilled, to give positively charged particles
time to escape the electric field from the beam and thus reduce deflection. A second reason for leaving
‘gaps’ in the electron bunch pattern is to produce different types of time-dependent radiation for
various experimental needs. Certain measurements prefer single isolated photon pulses to image time-
dependent sample dynamics. Often a laser is used to ‘pump’ the sample while the x-ray beam is used to
‘probe’ the response. Since the fast-gating of the detectors requires up to several hundred nanoseconds,
the probe pulse must be isolated from the rest of the bunch pattern. Of significance to this study is the
fact that the probe pulse must be very well isolated with charge in adjacent buckets down by a factor of
10-5 or less. Some fill patterns are better than others, due to reasons that will be discussed later.
The fill pattern in the SPEAR3 ring is established by a graphical-interface control system that
communicates with a complex timing system from the SSRL control room. From the control room,
operators inject beam into the individual SPEAR3 buckets, and can monitor the electron bunch pattern
as detected from a capacitive pick-up electrode with relative ease; however, this does not have the
dynamic range required for isolated-bunch timing experiments. Often it is difficult to detect timing flaws
with the current injection system, which can be attributed to frequency drift, electronic jitter or
temperature-dependent phase-errors that accumulate in the long-haul timing cables extending between
the SPEAR3 control room and the injector. All of these effects can lead to inadvertent injection of charge
in buckets adjacent to the intended target bucket. These are the causes of some of the questions
investigated with single photon counting experiments carried out in the SSRL synchrotron light monitor
diagnostic room, called the light-shack.

5
By utilizing a single photon counting technique, the electron bunch pattern in the SPEAR3
storage ring was able to be mapped out. From the user side, it was determined which buckets were
filled, which were left empty, and in relative terms how many electrons were in each bucket. This
information can be used to confirm with the control room to ensure good beam delivery to each beam-
line. Although there are other ways to measure the bunch pattern, as previously mentioned, single-
photon yields the highest dynamic range. For other applications, such as laser-SR beam cross-correlation
to measure individual bunch length, photon production from the cross-correlation experiment is so slow
that single-photon counting is the only way to measure the result. Many other single-photon counting
applications occur on the SSRL beam lines and throughout both applied physics and low-light intensity
measurements, such as those found in astronomy.
Single-Photon Counting Technique:
The technique of mapping the location and relative radiation power of each electron bunch is
known as Single Photon Counting. Basically, this requires counting the number of photons hitting the
detector from each electron bunch; as the name of the technique suggests, the number of photons
hitting are in the single photon range. Therefore, the synchrotron radiation light must be of such low
intensity that only one photon strikes the detector in a single counting interval. To do this, a
photomultiplier tube (PMT) is used as the detector. A photomultiplier tube consists of a photocathode,
electron multipliers, and an anode. When a photon hits the photocathode, electrons are emitted under
the photoelectric effect. The number of electrons is then multiplied through cascade electron emissions
from the dynodes, or electron multipliers. These electrons are collected by the anode as a voltage pulse
output. The output of the PMT is an analog TTL signal for each photon detected, and a fast digitizer is
needed to translate and store the output signal in the desired data format. With single photon counting,
each pulse in the output signal represents one photon hitting the detector. Since each photon is

6
generated by an orbiting electron bunch in the ring, the timing of the pulses can be tracked, to
extrapolate the position of each electron bunch in the storage ring relative to each other.
At nominal electron beam currents of several hundred milliamps in SPEAR3, the photon entering
the diagnostic room spans a range of approximately 420-1000 nm, and has a beam power of about 100
uW, which contains way too many photons than we need. Band-pass filters and wide-band neutral-
density filters, or “sunglasses”, are therefore used to control the amount of power incident on the
single-photon counter. Filtering the synchrotron radiation to the single photon range is important,
because at high light levels, multiple photons will hit the detector at once. This runs the risk of
overloading the detector, as too many electrons may be emitted at one time. Also, if photons hit the
detector too frequently, the output pulses will overlap with each other (Figure 1). As a result, there will
be a waveform of the train of photons, but no information about each individual photon arrival. As we
are interested in studying the individual buckets in the storage ring, as well as the overall distribution,
photon counting will give us more accurate information at low light level.
1 Figure: Output Pulses from Photomultiplier Tube at Different Light Levels At high light level, signal output pulses overlap, and single photon arrivals cannot be resolved. At low light levels, signal outputs are discrete pulses, and single photon arrival can be resolved.

7
With single photon counting, the beam is filtered down to the ‘single photon’ range to avoid
pulse overlaps. This also means that only a few photons hit the detector in one turn, and only limited
information about the electron bunches can be gathered in one rotation in the ring. For typical single-
photon counting applications, one wants to detect only about 1 photon in every 10 counting intervals, to
avoid overload. To solve this problem, a time-correlated integration technique was used. Since only the
relative position of electron bunches was of interest, the signal could be integrated from the detector,
as electron bunches revolve for multiple turns. Although only a few photons are let through each pass
over many turns in the ring, each photon has an equal probability of hitting the detector. While only
several pulses are collected in one turn, over millions of turns the full electron bunch profile can be
mapped out. Each turn takes 780 ns, so integrating over millions of turns would still allow a reasonable
short sampling time.
Materials and Methods
The single-photon counting experiments were conducted in the SSRL Light-Shack. The Light-
Shack is a special diagnostic beam-line that only collects radiation in the visible, near IR spectrum
(420nm-1000nm). For this experiment, harmful radiation in the x-ray range is not needed, since visible
spectrum photons convey the same message about the electron bunch pattern. Although x-ray radiation
is filtered out, other properties of the radiation from this diagnostic beam-line is the same as other
experimental beam-lines. Therefore, the light-shack is an ideal location in which to conduct this
experiment.

8
When the light comes out of the beam-line, it is guided onto an optical bench. Through a series
of focusing mirrors and focusing lenses, the beam is then directed into a light-tight box where the
detector sits. In order to filter the incident photon beam down to single-photon counting regime, a
combination of neutral density filters and a 10 nm band-pass filter centered at 550 nm were used.
Through measurements with a Newport Power Meter, the average power of the beam was measured
(Table 1). An estimate of number of photons per turn was calculated using the equation below:
Beam Power =
(N represents the number of photons, and is the only unknown variable)
Neutral Density
Filter Level
Measured Beam
Power(μW) Number Of Photons in Beam Per Turn (780 ns)
0 206 993123456.8
1 20.4 98348148.15
2 2.58 12438148.15
3 0.458 2208012.346
4 0.0712 343254.321
5 0.01 48209.87654
Table 1: Measured beam power from power-meter and corresponding number of photons at each filter level. No band-pass filter used.
SSRL Running at 350 mA.
Extrapolating from the data in Table 1, a level 8 neutral density filter in series with a 10 nm
band-pass filter only lets through 1 photon out of every 10 turns. Ideally, the neutral-density filters
should correspond to beam power reduction in powers of 10. Our results roughly follow the pattern,

9
some deviate may be caused by noise and sensitivity of detector. ND8 therefore reduces beam power by
a factor of 107. This filtering achieves the desired single-photon range, but slight adjustments are made
in accordance with sampling time: fewer photons hitting means a longer sampling time is necessary to
produce the same result. The detector was sealed light-tight to block out ambient room light noise, and
experiments were run with room lights turned off.
Figure 2: (Left) Hamamatsu Photonics H-7360 Photomultiplier Tube.
(Right) National Instruments 5154 2Gs/s Digitizer
The detector chosen was a Hamamatsu Photonics H-7360 Counting Head. This detector contains
a photomultiplier tube that is sensitive to single photons. The detector can be biased with a DC voltage
between 3.4 V and 5 V. When a photon hit the detector, a TTL pulse was generated from the anode. This
TTL pulse was then sent to a National Instrument 5154 2GSample/s Digitizer for analysis. The digitizer
was triggered from the constant 1.28 MHz SSRL ring-clock, a TTL pulse provided from the control room
synchronous with the revolution time of the individual bunches. For each ring-clock trigger, the TTL
pulses were saved as a ‘time-of-flight’ record for the single-photon arrival times. A Ortec Counting Card
was intended to be used originally. It is also a digitizer and produces very high resolution histograms.
The Ortec Card was tested with DG535 generators, which generated simulated TTL pulses, and the setup
was ready to take actual data. However, the counting card was taken to a different beam-line due to a
conflict in experiments, and the National Instruments Digitizer was used instead.

10
After preparing the detector, software was developed to communicate with the detector output
and extract the desired data from the analog TTL signals. Using a Lab-View Module that makes time
histograms, we modified the program to work for our specific experiment. With the help with a
experienced LabView programmer, we connected all terminals of the block diagram and correct input to
parameters were given. Our final program keeps track of all TTL pulses from the detector and makes a
time histogram evaluated over the rotating period of the ring, which is 780 ns. Output is stored in a text
file. Since each TTL pulse indicates the presence of an electron bunch in the storage ring, a histogram
that keeps track of all TTL pulse generates a full longitudinal electron bunch pattern over the course of
time. Figure 3 is a screen shot of the user interface of the program.
Figure 3: User Interface of Lab View Program The software contains a Scope function (top right display) that keeps track of TTL
pulses after a single trigger. The time-correlated Integration is done in the histogram (bottom right display) that integrates the data from Scope.

11
Program Parameters:
Parameter Name: Description: What was used in experiment:
Histogram Size number of bins contained in the histogram, histogram resolution.
781(2 bins = 1 bucket)
High Voltage Limit/Low Voltage Limit
This defines the range which the program samples data and includes in
the histogram.
2.4V-3.0V (signal from detector falls within this range)
High Time Limit/Low Time Limit This defines the x-axis of the histogram 0ns-781ns(represents the turn time of SSRL)
Trigger Reference Position defines the position of the trigger relative to data. At 0, all data collected
are after the trigger. At 100, all data collected are prior to trigger.
0 (all data collected after trigger)
Min Sample Rate This is the actual sample rate. (1 Ghz maximum)
1 Ghz (produces the highest resolution)
Min Record Length This defines the time length which the detector looks for data after a trigger. It specifies the number of sample points
the scope looks for. It interacts with sample rate to define the time length
which the detector looks for data after a trigger (Example. At 1Ghz, 700 for
record length = samples for 700ns after trigger).
781 (samples 781 data points at 1 Ghz after trigger, which is 781 ns)
Table 2: Lab View Program Parameters This table contains an description of all parameters associated with our software,
as well as the values we used for our experiment.
Results
Using our experimental setup, we were able to get very good data. A few different bunch
patterns were detected and analyzed.
The Following results were taken during normal SSRL operations, when the pattern was run for
user experiments.

12
Figure 5: 6 Electron Bunch Train with 1 Mondo Bunch
45 bunches per train with 17 bunch gap 5min Sampling Time
Taken at 4:09pm 07/22/2011 This pattern is what the users see from their beam-line for their experiments. The bunch trains are used
as a continuous radiation source. The Mundo bunch is an isolated bunch with high current used for pump-probe experiments.
Figure 6: 6 Electron Bunch Train with 1 Mondo Bunch
45 bunches per train with 17 bunch gap 5 sec Sampling Time
Taken at 5:40pm 7/20/2011 Results are fairly noisy due to short sampling time.
0
1000
2000
3000
4000
5000
6000
7000
1
33
65
97
12
9
16
1
19
3
22
5
25
7
28
9
32
1
35
3
38
5
41
7
44
9
48
1
51
3
54
5
57
7
60
9
64
1
67
3
70
5
73
7
76
9
nu
mb
er
of
ph
oto
n h
its
Time (ns) relative to ring clock
0
5
10
15
20
25
30
1
30
5
9
88
1
17
1
46
1
75
2
04
2
33
2
62
2
91
3
20
3
49
3
78
4
07
4
36
4
65
4
94
5
23
5
52
5
81
6
10
6
39
6
68
6
97
7
26
7
55
Nu
mb
er
of
Ph
oto
n H
its
Time (ns) Relative to Ring Clock

13
The following results were taken during accelerator physics beam time. These bunch patterns are used for SSRL facility diagnostics.
Figure 7: 3 Electron Bunch Train Taken 8:20pm 07/25/2011
Figure 8: Single electron bunch at 5mA. Roughly 5% of charge is spilled into adjacent bunches. There is a small peak 6 buckets away, but we suspect that is the ringing effect from the PMT signal.
Taken: 5:52am 07/26/2011
0
50
100
150
200
250
300
350
400
450
500
1
34
67
10
0
13
3
16
6
19
9
23
2
26
5
29
8
33
1
36
4
39
7
43
0
46
3
49
6
52
9
56
2
59
5
62
8
66
1
69
4
72
7
76
0
Nu
mb
er
of
Ph
oto
n H
its
Time Relative to Ring Clock
0
200
400
600
800
1000
1200
1
35
69
10
3
13
7
17
1
20
5
23
9
27
3
30
7
34
1
37
5
40
9
44
3
47
7
51
1
54
5
57
9
61
3
64
7
68
1
71
5
74
9
Nu
mb
er
of
Ph
oto
n H
its
Time (ns) Relative to Ring Clock

14
Discussion/Conclusions
The results of the single-photon counting measurements revealed much about the electron
bunch distribution in SPEAR3. As seen in Figure 5, a short sampling time produces a roughly accurate
electron distribution in the ring. However, when compared to Figure 6, the electron bunch pattern is
much more accurate as the sampling time increases, as signal to noise ratio increases linearly to the
square-root of N (N being the number of samples).
Figure 9: Ideal current distribution inside SSRL Storage ring.
Figure 9 represents the idea electron bunch distribution in the SSRL Storage at the time Figure 5
data is taken. While both distributions have roughly the same shape and timing, there are still many
minor, yet important, differences.
The first noticeable difference is the unevenness of the bunch train in the experimental data.
Noise, which in this case is ambient light and dark current from the PMT, contributes partially to the
oscillation. However, the big spike at the beginning of each bunch train is more than just noise. The
0
2
4
6
8
10
12
1
16
31
46
61
76
91
10
6
12
1
13
6
15
1
16
6
18
1
19
6
21
1
22
6
24
1
25
6
27
1
28
6
30
1
31
6
33
1
34
6
36
1
37
6
Cu
rre
nt
(mA
)
Bcket Number

15
current injection system at SPEAR3 injects electron bunches into the assigned bucket without first
measuring the current in that bucket. In other words, the system assumes what is left in the bucket and
adds a predetermined amount of electrons into the bucket. If the remaining energy inside the bucket
differs from assumption, then the total energy inside the bucket will differ from the target current after
an injection. As seen in Figure 5, this “blind” injection resulted in more electrons at the beginning
buckets of each train, as compared to the rest of the train. This result reveals a flaw in the top-off
injection system at SSRL. The remaining current inside each bucket should be measured first, before
injecting additional electrons. Such a feedback mechanism can help eliminate this problem.
Another important difference between the ideal and measured bunch patterns is evident in the
“spilling” of electrons into adjacent buckets. Although electrons are injected into a bucket, oscillation
and collision with other particles may knock an electron into an adjacent bucket. This result can be seen
in the experimental results, as unfilled buckets near filled buckets have a small amount of current. This
effect can be seen in Figure 8. For this specific bunch pattern, only one bucket is filled. However, in the
results, observed electrons in the adjacent 8 buckets. Most of the charge was spilled into the 2 adjacent
buckets, with roughly 5% of the Mundo bunch spilled in each bucket. This “spilling” effect is a known
phenomenon, but the percentage of spilling must be monitored to ensure good beam quality.
Acknowledgements
Thanks to Jeff Corbett for being a wonderful mentor. He designed the experiment, supervised
each step, and was of tremendous help to me. I worked in the same lab as Mitch Miller, and Jonathan
Kamp. We collaborated on our projects and they helped me through many parts of my project. Dennis

16
provided the counting card, which was essential to our experiment. Doug helped me with modifying the
Lab View program. He is an experienced programmer and my program would not have worked if it
wasn’t for him. And thanks to the SULI program and DOE for this wonderful opportunity here at SLAC
National Laboratory.
References
[1]Advanced Measurement Technology, Inc. “Ortec Model 9353 100 Picosecond Time Digitizer,
Hardware and Software User’s Manual”
[2]Hamamatsu Inc. “Photon Counting Using Photomultiplier Tubes”.
[3] Michael Wahl, PicoQuant GmbH. “Time-Correlated Single Photon Counting”.
[4] A. Jeff* (CERN, Geneva, Switzerland & University of Liverpool, UK), M. Andersen, S. Bozyigit,
E. Bravin, A. Boccardi, T. Lefevre, A. Rabiller, F. Roncarolo (CERN, Geneva, Switzerland);
C.P. Welsch (Cockcroft Institute, Daresbury, UK); A.S. Fisher (SLAC, Menlo Park, USA). “DESIGN FOR A
LONGITUDINAL DENSITY MONITOR FOR THE LHC”.
[5] M. D. Eisaman, J. Fan, A. Migdall, and S. V. Polyakov. “Single-photon sources and detectors”

Optical Design of a Broadband Infrared Spectrometer for
Bunch Length Measurement at the Linac Coherent Light
Source
Kiel Williams
Office of Science, Science Undergraduate Laboratory Internship (SULI) Program
Guilford College, Greensboro, North Carolina
SLAC National Accelerator Laboratory
Menlo Park, California
20 August, 2011
Prepared in partial fulfillment of the requirements of the Office of Science, U.S.
Department of Energy’s SULI Program under the direction of Dr. Josef Frisch at the Linac
Coherent Light Source (LCLS).
Participant: ____________________________
Signature
Research Advisor: ____________________________
Signature
SLAC-TN-12-029
Work supported by US Department of Energy contract DE-AC02-76SF00515.

2
Table of Contents
Introduction 4
Materials and Methods 6
Results 9
Discussion 11
Acknowledgements 12
References 13
Tables and Figures 14

3
ABSTRACT
The electron pulses generated by the Linac Coherent Light Source at the SLAC National
Accelerator Laboratory occur on the order of tens of femtoseconds and cannot be directly
measured by conventional means. The length of the pulses can instead be reconstructed by
measuring the spectrum of optical transition radiation emitted by the electrons as they move
toward a conducting foil. Because the emitted radiation occurs in the mid-infrared from 0.6 to 30
microns a novel optical layout is required. Using a helium-neon laser with wavelength 633 nm, a
series of gold-coated off-axis parabolic mirrors were positioned to direct a beam through a zinc
selenide prism and to a focus at a CCD camera for imaging. Constructing this layout revealed a
number of novel techniques for reducing the aberrations introduced into the system by the off—
axis parabolic mirrors. The beam had a recorded radius of less than a millimeter at its final focus
on the CCD imager. This preliminary setup serves as a model for the spectrometer that will
ultimately measure the LCLS electron pulse duration.

4
INTRODUCTION
The Linac Coherent Light Source (LCLS) at the SLAC National Accelerator Laboratory
is a free-electron laser (FEL) capable of producing some of the shortest x-ray pulses ever
observed. The LCLS produces electron pulses less than ten femtoseconds in duration. These
pulses then emit soft and hard x-rays as magnetic fields force the electron bunches to oscillate
back and forth [1].
Due to the short duration of the LCLS electron pulses, a precise measurement of their
length has proven difficult to obtain [2]. Improved information on the pulse length would enable
researchers to better understand the time scales over which the processes they observe are
happening. The dissolution of chemical bonds and the folding of different types of protein are
known to happen over scales similar to the length of LCLS electron pulses, and more knowledge
of the pulse length could be translated into more a knowledge of these fundamental reactions.
An indirect measurement of the electron pulse length can be obtained by observing the
optical transition radiation (OTR)1 given off by the electron pulses as they strike a conducting
material [3]. The OTR can then be directed through an optical layout and toward a thermal
detector that records the constituent spectrum.
Due to the broadband nature of the spectrum of OTR emitted by the electrons, the
internal configuration of this spectrometer differs significantly from that of most modern
spectrometers. Most modern spectrometers focus on too narrow a spectral band to appropriately
analyze the electrons’ full OTR band. Conventional glass optical materials also fail to transmit
1 The induced mirror charge on the conductor and the approaching electron together behave like
a collapsing electric dipole as the electron approaches, with the emitted OTR falling in a wide
spectral band primarily within the infrared [4].

5
over wavelengths comparable to that of the electron bunch OTR (0.5-30 microns). Additionally,
typical diffraction gratings fail to examine a wide enough spectral band to sufficiently analyze
the OTR. Triangular prisms can decompose light across a wide range of frequencies into its
constituent wavelengths, permitting such prisms to act as appropriate substitutes. Figure 1
illustrates the relevant geometry of this type of prism. The total deviation angle of a light ray
through such prisms is given by
2
sin2
sin 0
nn
(1)
where n and 0n are the indices of refraction for the outside medium and the inside of the prism
respectively, and ε is the apex angle of the prism (aberrational effects through the prism are
minimized for this configuration). Furthermore, when the prism is in this aberration2 minimizing
configuration it can be shown that the relation
2sincos 1
n , (2)
where α is angle formed by the incident light ray and the surface of the prism, also holds.
Expanding beam optics can be used as a means of bringing a beam parallel to a chosen
axis. One concave and one convex lens can accomplish this in a simple case. A diagram of this
setup is illustrated in Figure 2. The magnitude of magnification M obtained by such a setup is
given by the relation
1
2
f
fM , (3)
where 2f is the focal length of the convex lens, and 1f is the focal length of the concave lens.
2 In this paper an aberration is taken to be any optical effect that degrades the circularly-symmetric Gaussian
profile of the beam.

6
For a Gaussian mode TEM00 beam, analysis of the analytic expression for the beam
profile admits numerical formulae for the half-width and 1/e2 width of the beam in terms of one
another. Frequently the half-width can be measured with greater ease and converted to the 1/e2
width based on the formula
, (4)
where is the 1/e2 radius of the beam and is the full-width of the beam at half of its
maximum power.
MATERIALS AND METHODS
Preliminary construction of the optical layout utilized a 632.8 nanometer wavelength
helium-neon mode TEM00 laser of minimum peak power 0.8 mW and a 1/e2 diameter of 0.48
millimeters. A series of reflecting mirrors and lenses were inserted to expand and direct the
beam. A plano-concave and plano-convex lens were placed the difference of their focal lengths
apart to enable their operation as a Galilean beam expander. The projected final beam diameter
was calculated according to Equation 3, and the final diameter of the beam was measured by
ruler as it emerged from the convex lens onto a portable screen. Gold-coated plane mirrors then
directed the beam towards a collection of gold-coated off-axis parabolic (OAP) mirrors, with
irises aligning the beam along each portion of its path. The first two OAP mirrors were separated
by the sum of their focal lengths, allowing the beam to further expand as it passed from the first
to the second. A zinc selenide (ZnSe) triangular prism of apex angle 10 degrees was placed
approximately 50 mm in front of the second OAP mirror. A prism made of thallium-
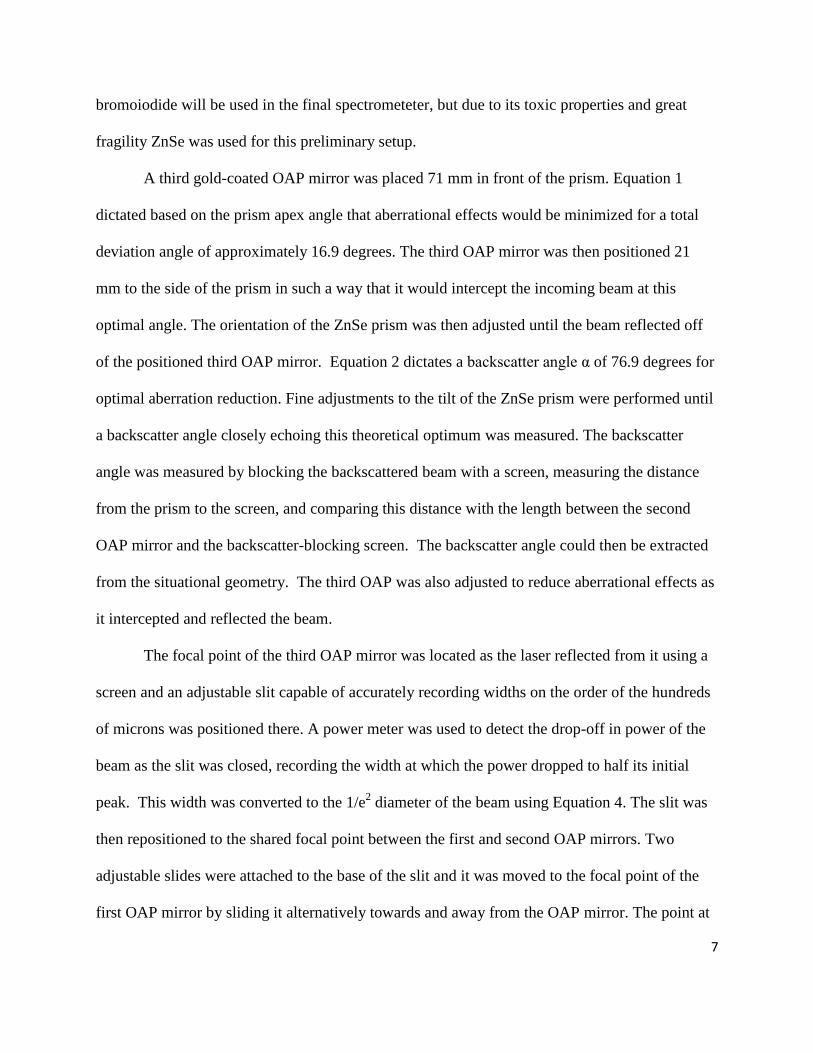
7
bromoiodide will be used in the final spectrometeter, but due to its toxic properties and great
fragility ZnSe was used for this preliminary setup.
A third gold-coated OAP mirror was placed 71 mm in front of the prism. Equation 1
dictated based on the prism apex angle that aberrational effects would be minimized for a total
deviation angle of approximately 16.9 degrees. The third OAP mirror was then positioned 21
mm to the side of the prism in such a way that it would intercept the incoming beam at this
optimal angle. The orientation of the ZnSe prism was then adjusted until the beam reflected off
of the positioned third OAP mirror. Equation 2 dictates a backscatter angle α of 76.9 degrees for
optimal aberration reduction. Fine adjustments to the tilt of the ZnSe prism were performed until
a backscatter angle closely echoing this theoretical optimum was measured. The backscatter
angle was measured by blocking the backscattered beam with a screen, measuring the distance
from the prism to the screen, and comparing this distance with the length between the second
OAP mirror and the backscatter-blocking screen. The backscatter angle could then be extracted
from the situational geometry. The third OAP was also adjusted to reduce aberrational effects as
it intercepted and reflected the beam.
The focal point of the third OAP mirror was located as the laser reflected from it using a
screen and an adjustable slit capable of accurately recording widths on the order of the hundreds
of microns was positioned there. A power meter was used to detect the drop-off in power of the
beam as the slit was closed, recording the width at which the power dropped to half its initial
peak. This width was converted to the 1/e2 diameter of the beam using Equation 4. The slit was
then repositioned to the shared focal point between the first and second OAP mirrors. Two
adjustable slides were attached to the base of the slit and it was moved to the focal point of the
first OAP mirror by sliding it alternatively towards and away from the OAP mirror. The point at

8
which sliding the slit perpendicular to the beam reversed the direction the image moved on a
mounted screen was scanned for as a means of precisely locating the focal point of the first OAP
mirror. Each time the beam image switched the direction it moved relative to the horizontal slide
of the stage it was revealed that the focal point had been passed. This process could then be
iterated to bring the slit closer to the focal point. Following these first-order positioning
corrections the slit size was adjusted and it was moved in a way that maximized the amount of
passing light. The horizontal and vertical knobs on the first OAP mirror before the slit were also
adjusted as a means of eliminating beam aberrations introduced by this mirror into the optical
system. A measurement of the beam waist using the same power-based method as for the prior
focal point after the third OAP mirror was taken and compared with simulated data [6]. A
measurement of the beam waist at its origin from the laser was also performed in this manner.
A CCD camera fitted with a 30 dB circular attenuator was then placed at the final focal
point to profile the beam at the end of the optical layout and connected to a nearby computer
terminal. Placing the CCD camera so that its surface formed an angle of approximately 44
degrees with the incoming beam allowed for further beam aberration minimization based on the
results of previous optical simulations. Figure 3 illustrates this configuration of optical
components. Table 1 records the focal length of each lens and OAP mirror.
Precision alignments of the OAP mirrors following their initial placement were
performed by first rotating them 180 degrees and observing that the beam profile fell on the
center bolt on the rear of each mirror. It was verified that each OAP was at an appropriate height
by doing this in turn to each of the three OAP mirrors in the system. The horizontal and vertical
fine adjustment knobs on the OAP mirrors then enabled the beam to be gradually directed
through the last half of the system and to the center of the CCD camera.

9
Positioning a small screen immediately after each of the three OAP mirrors then allowed
an assessment of the extent to which they introduced damaging aberrations into the beam profile.
The methods used to reduce the observed aberrations in the OAP mirrors included small
rotations along the optical axis of the mirrors and minor height adjustments to better center the
incoming beam, and turning the OAP mirrors while they rested in their holders to alter the angle
at which they deflected the incoming beam. Adjustment of this tilt enabled the beam to maintain
its six-inch height in addition to the correction of aberrational effects. Adjusting the micrometer
on the slit after the first OAP mirror and observing the laser profile on a screen also guided
aberrational corrections. Figure 4 illustrates the final layout of the aligned optical components.
A set of images of the beam was collected immediately after concave lens at the
beginning of the optical layout with the CCD camera to ensure its linearity. Images of the beam
at different widths as it grew larger through the beam expander were collected by shifting the
position of the camera. These images were then loaded into MatlabTM
and the intensities across a
center cut of the beam were summed together. By comparing this summation for the beam at
different widths, the degree to which nonlinear digital effects applied by the CCD camera
impacted images of the beam and its accompanying intensity at points throughout the optical
system was determined.
RESULTS
At its origin the beam 1/e2 diameter was measured as .28±.02 mm using the slit
micrometer. Following the passage of the beam through the Galilean expander it attained a
diameter of 6±1 mm based on an approximate ruler measurement (the size of the beam at this
point in the system made a micrometer measurement impractical). This measurement is in line

10
with that predicted by Equation 3. Additionally, CCD camera images taken at the conclusion of
the optical layout reveal the beam to have an approximately Gaussian structure when the slit was
left fully open. Summing the MatlabTM
intensity indices of different cross-sections of the beam
taken with the CCD camera revealed an image-to-image variation of less than five percent.
Figure 5 shows an image of the beam at this focal point of the third OAP mirror under 50 dB of
total attenuation (the additional 20 dB of attenuation resulted from a second attenuator placed
immediately in front of the CCD camera).
In the final optical configuration a total deviation angle of 15±1 degrees through the
prism was measured. Measure of the backscatter angle after adjustment revealed a backscatter
angle of 73 degrees to within an error of less than five degrees. This falls within five degrees of
the theoretical optimum angle given by Equation 2 to reduce aberrational effects. Small
variations in this angle were not observed to have a major impact on the reduction of aberrational
effects.
A beam profile diameter of 173±5 microns was recorded at the focal point of the first
OAP mirror using the slit micrometer. Using the slit to measure the beam profile at its focus after
the third OAP mirror yielded a measurement of approximately 237±5 microns for the 1/e2 beam
diameter at this point in the optical layout. Performing fine adjustments to the orientation of each
OAP mirror and positioning the slit carefully between the first and second OAP mirror
eliminated many aberrations throughout the system. Initially, the beam appeared to diminish
from the vertical direction as it passed through the horizontal slit following the first OAP mirror.
By empirically adjusting the horizontal and vertical tilt of the first OAP mirror this aberration
has been mitigated. The beam continues to focus in two different planes as it approaches the
focal point of the third OAP mirror.

11
DISCUSSION
Significant reductions in the severity of optical aberrations throughout the final system
proved attainable through hand adjustment of the constituent optics. Following the initial
placement of the optical equipment the beam focused horizontally and vertically in different
planes in the space following the third OAP mirror. Rotating the third OAP mirror in a way such
that the beam fell precisely at its center helped to reduce the problem somewhat. Rotating the tilt
of the angle at which the second OAP mirror intercepted the incoming beam proved helpful as
well. Errors in the angle of the tilt of OAP mirrors about their optical axes of less than one
degree can greatly distort the final image by bending it into an arc-like pattern. Adjustment of
this tilt itself proved one of the more effective means of determining the correct tilt angle for the
OAP mirrors due to the observable aberrations introduced by even small initial errors.
Simulations predict a beam diameter of 65 microns at the focal point of the first OAP
mirror, and a required tilt of 0.4 degrees of the first OAP mirror to attain the measured 1/e2
diameter of 173±5 microns. Similar simulations project a spot size of 38 microns at the focal
point of the third OAP mirror, with a required tilt of approximately 1 degree to attain the
measured 1/e2 diameter of 237±5 microns. This is less consistent with expected human alignment
errors, and suggests deeper aberrational effects occurring in the second and third OAP mirror,
and potentially within the prism as well.
One aberration of particular note is that which occurs immediately after the closure of the
slit in which the beam would appear horizontally oriented despite the vertical orientation of the
slit. Noting that this aberration coupled the horizontal and vertical propagation of the beam, the
horizontal and vertical tilt of the first OAP mirror were gradually changed until the beam was
oriented vertically as it exited the slit. Because altering the vertical and horizontal mirror tilt

12
iteratively proved effective in eliminating the problem, it is suggested that the way the OAP
mirror couples the propagation of the beam in the horizontal and vertical direction causes the
beam to twist in some manner as it passes through the slit. Noting patterns like these will become
a progressively more important means of correcting aberrations in later versions of the
spectrometer as lasers in the near- and mid-infrared are incorporated into the design.
Future modifications to this preliminary layout will incorporate a pyroelectric thermal
line detector that will ultimately be used to capture the spectrum of the LCLS beam [7]. The
orientation of the beam as it reflects from the third OAP mirror will require a greater level of
attention due to the sensitivity of the detector. In conjunction with this, additional lasers emitting
in the near- and mid-IR spectrum will be added to enable calibration of the sensor and test how
the optical layout transmits signals through portions of the IR spectrum.
ACKNOWLEDGEMENTS
This work received support from the SLAC National Accelerator Laboratory and
Department of Energy, Office of Science. I would like to thank my mentor Josef Frisch for the
assistance he provided throughout this project. I also wish to thank Alan Fisher, Mark Petree,
George Burgueno, and my research partners Julie Cass and Gilles Dongmo-Momo for their
invaluable assistance.

13
REFERENCES
[1] Z. Huang, A. Baker, C. Behrens, M. Boyes, J. Craft, F.-J. Decker, Y. Ding, P. Emma, J.
Frisch, R. Iverson, J. Lipari, H. Loos, D. Walz, “Measurement of Femtosecond LCLS Bunches
Using the SLAC A-Line Spectrometer.” Paper presented at the 2011 Particle Accelerator
Conference, New York, New York, March 28-April 1, 2011.
[2] M. Zelazny, S. Allison, S. Chevtsov, P. Emma, K.D. Kotturi, H. Loos, S. Peng, D. Rogind,
and T. Straumann, “Electron Bunch Length Measurement For LCLS at SLAC.” Paper presented
at the 2007 International Conference on Accelerator and Large Experimental Physics Control
Systems, Knoxville, Tennessee, October 15-19, 2007.
[3] J. Frisch, R. Akre, F.-J. Decker, Y. Ding, D. Dowell, P. Emma, S. Gilevich, G. Hays, P.
Hering, Z. Huang, R. Iverson, R. Johnson, C. Limborg-Deprey, H. Loos, E. Medvedko, A.
Miahnahri, H.-D. Nuhn, D. Ratner, S. Smith, J. Turner, J. Welch, W. White, J. Wu, “Beam
Measurements at LCLS.” Paper presented at the Beam Instrumentation Workshop, Lake Tahoe,
California, May 4-8, 2008.
[4] C. Behrens, A. Fisher, J. Frisch, S. Gilevich, H. Loos, J. Loos, “Design of a Single-Shot
Prism Spectrometer in the Near- and Mid-Infrared Wavelength Range for Ultra-Short Bunch
Length Diagnostics.” Paper presented at the 10th
European Workshop on Beam Diagnostics and
Instrumentation for Particle Accelerators, Hamburg, Germany, May 16-18, 2011.
[5] C. Behrens, “Design of an Infrared Prism Spectrometer for Ultra-Short Bunch Length
Diagnostics.” Presentation at a meeting of the SLAC National Accelerator Laboratory
Accelerator Physics and Engineering Department, Menlo Park, California, November 30, 2010.
[6] J. Cass, “Simulations and Analysis of an Infrared Prism Spectrometer for Ultra-Short Bunch
Length Diagnostics at the Linac Coherent Light Source.” Produced for the Department of Energy
Student Undergraduate Laboratory Internship program at the SLAC National Accelerator
Laboratory, Menlo Park, California, 2011.
[7] G. Dongmo-Momo, “Infrared Spectroscope for Electron Bunch-length Measurement:
Heat Sensor Parameters Analysis.” Produced for the Department of Energy Student
Undergraduate Laboratory Internship program at the SLAC National Accelerator Laboratory,
Menlo Park, California, 2011.

14
TABLES AND FIGURES
Figure 1: Illustration of a prism in an aberration-minimizing symmetric configuration. Note that
all incoming and outgoing angles are equal to their symmetric partners. Courtesy C. Behrens.

15
Figure 2: Illustration of the lens configuration that expanded the beam in this optical layout. Note
that the lenses are separated by the difference of their focal lengths.

16
Figure 3: Illustration of the optical layout directing the helium-neon beam to a final focus. Note
that this is one of several placements used for the measuring slit. The lens were placed before the
first OAP mirror and are not shown.

17
Figure 4: Final layout of aligned optical components. The ZnSe prism and gold-coated OAP
mirrors are all visible.

18
Figure 5: CCD camera image of the beam under 50 ODs of attenuation taken at the focal point of
the third OAP mirror. Note its approximately Gaussian composition and the absence of severe
aberrational effects.

19
Table 1: Focal Lengths of Relevant Optical Equipment
Focal Lengths
Optical Equipment Focal Length
mm
Plano-Concave Lens -30
Plano-Convex Lens 500
OAP 1 50.8
OAP 2 151.6
OAP 3 177.8