Size-related changes in cranial morphology affect diet in the catfish Clariallabes longicauda
12
Size-related changes in cranial morphology affect diet in the catfish Clariallabes longicauda MARISA WYCKMANS 1 *, SAM VAN WASSENBERGH 1 , DOMINIQUE ADRIAENS 2 , RAOUL VAN DAMME 1 and ANTHONY HERREL 1 1 Department of Biology, University of Antwerp, Universiteitsplein 1, B-2610 Antwerpen, Belgium 2 Department of Biology, Ghent University, K.L. Ledeganckstraat 35, B-9000 Gent, Belgium Received 20 June 2006; accepted for publication 6 December 2006 Within the catfish family Clariidae, species exist with different degrees of jaw adductor hypertrophy. This jaw adductor hypertrophy has been related to bite performance, in turn suggesting a link to dietary specialization. Thus, an increase in the degree of hypertrophy will likely be reflected in an increase in the amount of hard prey in the diet. In the present study, we examine the ontogenetic scaling of cranial structure and diet in a species of catfish with a moderate degree of jaw adductor hypertrophy, Clariallabes longicauda. Additionally, we investigate whether the observed changes in the morphology of the feeding system during growth are linked to changes in diet. The fish examined demonstrate a strong positively allometric growth of the jaw adductors, of head height and of maximal head width, suggesting that larger fish can feed on larger and harder prey. Dietary data confirm these hypotheses and reveal an increase in maximal prey size consumed, the proportion of large prey in the diet, and average prey hardness during ontogeny. Moreover, the observed changes in the proportion of large prey consumed and prey hardness are correlated with an increase in lower jaw width and maximal head width, respectively. An increase in the amount of evasive prey in the diet with fish size is correlated with an increase in hyoid length. In summary, not only size dependent, but also size-independent variation of the feeding system was associated with ontogenetic changes in diet in C. longicauda. © 2007 The Linnean Society of London, Biological Journal of the Linnean Society, 2007, 92, 323–334. ADDITIONAL KEYWORDS: feeding capacity – head shape – scaling – variation. INTRODUCTION Animals must live within the boundaries set by physi- cal laws. The size of an organism is of crucial impor- tance and has profound effects on its structure and function (Schmidt-Nielsen, 1984). Theoretical scaling models have been developed to understand the func- tioning of musculo-skeletal systems during growth, and to predict the effects of size on the functioning of musculo-skeletal systems in general (Hill, 1950; McMahon, 1973; Richard & Wainwright, 1995; West et al., 2003). In many of these models (Hill, 1950; Richard & Wainwright, 1995), geometric similarity, or maintenance of shape, is assumed. Although linear dimensions (e.g. jaw length) are expected to increase directly proportional to linear dimensions (e.g. body length, L), force generating capacity (being directly proportional to muscle cross sectional area) and seg- mental masses are expected to increase to the second and third power of linear dimensions, respectively. There can, however, be important functional conse- quences of maintaining shape with increasing size. As a consequence of geometric similarity (maintenance of shape during growth), discrepancies between the available muscle force (proportional to L 2 ) and the force needed to accelerate a given segmental mass (proportional to L 3 ) arise, thus causing the accelera- tions to decrease as size increases. Although shape is being maintained with increases in size, function is not. Therefore, geometrically similar animals are not necessarily functionally equivalent. Functional equivalence in different-sized organisms only occurs when performance capability is maintained with *Corresponding author. E-mail: [email protected] Biological Journal of the Linnean Society, 2007, 92, 323–334. With 7 figures © 2007 The Linnean Society of London, Biological Journal of the Linnean Society, 2007, 92, 323–334 323
Transcript of Size-related changes in cranial morphology affect diet in the catfish Clariallabes longicauda

Size-related changes in cranial morphology affect dietin the catfish Clariallabes longicauda
MARISA WYCKMANS1*, SAM VAN WASSENBERGH1, DOMINIQUE ADRIAENS2,RAOUL VAN DAMME1 and ANTHONY HERREL1
1Department of Biology, University of Antwerp, Universiteitsplein 1, B-2610 Antwerpen, Belgium2Department of Biology, Ghent University, K.L. Ledeganckstraat 35, B-9000 Gent, Belgium
Received 20 June 2006; accepted for publication 6 December 2006
Within the catfish family Clariidae, species exist with different degrees of jaw adductor hypertrophy. This jawadductor hypertrophy has been related to bite performance, in turn suggesting a link to dietary specialization.Thus, an increase in the degree of hypertrophy will likely be reflected in an increase in the amount of hard preyin the diet. In the present study, we examine the ontogenetic scaling of cranial structure and diet in a species ofcatfish with a moderate degree of jaw adductor hypertrophy, Clariallabes longicauda. Additionally, we investigatewhether the observed changes in the morphology of the feeding system during growth are linked to changes in diet.The fish examined demonstrate a strong positively allometric growth of the jaw adductors, of head height and ofmaximal head width, suggesting that larger fish can feed on larger and harder prey. Dietary data confirm thesehypotheses and reveal an increase in maximal prey size consumed, the proportion of large prey in the diet, andaverage prey hardness during ontogeny. Moreover, the observed changes in the proportion of large prey consumedand prey hardness are correlated with an increase in lower jaw width and maximal head width, respectively. Anincrease in the amount of evasive prey in the diet with fish size is correlated with an increase in hyoid length. Insummary, not only size dependent, but also size-independent variation of the feeding system was associated withontogenetic changes in diet in C. longicauda. © 2007 The Linnean Society of London, Biological Journal of theLinnean Society, 2007, 92, 323–334.
ADDITIONAL KEYWORDS: feeding capacity – head shape – scaling – variation.
INTRODUCTION
Animals must live within the boundaries set by physi-cal laws. The size of an organism is of crucial impor-tance and has profound effects on its structure andfunction (Schmidt-Nielsen, 1984). Theoretical scalingmodels have been developed to understand the func-tioning of musculo-skeletal systems during growth,and to predict the effects of size on the functioning ofmusculo-skeletal systems in general (Hill, 1950;McMahon, 1973; Richard & Wainwright, 1995; Westet al., 2003). In many of these models (Hill, 1950;Richard & Wainwright, 1995), geometric similarity, ormaintenance of shape, is assumed. Although lineardimensions (e.g. jaw length) are expected to increase
directly proportional to linear dimensions (e.g. bodylength, L), force generating capacity (being directlyproportional to muscle cross sectional area) and seg-mental masses are expected to increase to the secondand third power of linear dimensions, respectively.
There can, however, be important functional conse-quences of maintaining shape with increasing size. Asa consequence of geometric similarity (maintenanceof shape during growth), discrepancies between theavailable muscle force (proportional to L2) and theforce needed to accelerate a given segmental mass(proportional to L3) arise, thus causing the accelera-tions to decrease as size increases. Although shape isbeing maintained with increases in size, function isnot. Therefore, geometrically similar animals arenot necessarily functionally equivalent. Functionalequivalence in different-sized organisms only occurswhen performance capability is maintained with
*Corresponding author. E-mail:[email protected]
Biological Journal of the Linnean Society, 2007, 92, 323–334. With 7 figures
© 2007 The Linnean Society of London, Biological Journal of the Linnean Society, 2007, 92, 323–334 323

changes in size (Emerson, Greene & Charnov, 1994).Because ectotherms such as fish, amphibians andreptiles typically display indeterminate growth, theyhave been proposed as good systems in which to testthe predictions of geometric scaling models (Meyers,Herrel & Birch, 2002; Deban & O’Reilly, 2005).Among ectotherms, fish have been the subject of moststudies because they appear to maintain the shape ofthe cranial system during growth (Richard & Wain-wright, 1995; Hernandez & Motta, 1997). However, arecent study by Herrel et al. (2005) demonstratedthat, for the catfish Clarias gariepinus Burchell,1882, neither the head, nor the cranial structuresthemselves scale according to geometric similaritymodels. Relative to head size, distinct changes in themass and configuration of the feeding structures takeplace that appear to affect the functioning of thecranial system (Van Wassenbergh, Aerts & Herrel,2005). A comparison of the functional consequences ofchanges in morphology during growth with publisheddietary data for this species suggested that the onto-genetic changes in morphology might be tightlylinked to changes in diet (Herrel et al., 2005).
Besides the nonhypertrophied C. gariepinus,species with extremely well-developed jaw adductors,as well as intermediate forms, exist within the familyClariidae (air-breathing catfishes). Jaw adductorhypertrophy is assumed to have originated severaltimes independently in clariids (Teugels & Adriaens,2003) and has been related to an increased bite per-formance (Herrel et al., 2002). An obvious hypothesisis that this increase in bite performance is linked todietary specialization, and such a relationship hasbeen shown in other teleost families (Wainwright,1996; Clifton & Motta, 1998; for Clariids, see alsoHuysentruyt et al., 2004). Within the Clariidae,however, most of our knowledge, both morphologicaland ecological, results from the nonhypertrophied(Bruton, 1979; Herrel et al., 2005) or extremely hyper-trophied species (Cabuy et al., 1999; Devaere et al.,2001; Huysentruyt et al., 2004). Species with a mod-erate degree of jaw adductor hypertrophy remainlargely unstudied, but kinematic studies suggest thatprey are captured by a combination of suction feedingand biting. Prey items are sucked towards the mouth,during the expansion of the skull, after which thejaws are placed firmly onto the prey. Next, the head isswung to one side, thereby tearing loose attachedpieces of prey (Van Wassenbergh et al., 2004). Thus,any change in the degree of hypertrophy of thejaw muscles can be expected to be reflected inthe absolute and/or relative amount of large andhard prey into the diet. Changes in the size and shapeof the elements related to buccal expansion shouldbe related to the proportion of evasive prey into thediet.
Not only when comparing across species, but alsoduring ontogeny, changes in the degree of jaw adduc-tor hypertrophy can be observed in some species ofcatfish (Herrel et al., 2005). If this is a more generalfeature of cranial growth in catfish, then ontogeneticchanges in diet are also expected in the more hyper-trophied species such as Clariallabes longicaudaBoulenger, 1902.
In the present study, we investigated the scaling ofcranial structures and ontogenetic changes in the dietof a catfish species with a moderate degree of jawadductor hypertrophy, C. longicauda. Additionally, wedetermined whether the observed changes in size andhead morphology are correlated with changes in diet.Specifically, we expected an increase in the proportionof hard prey in the diet in fish with larger (bothabsolutely and relatively) heads and jaw muscles.Moreover, the proportion of evasive prey in the dietwas expected to be related to changes in morphologythat affect the expansion of the oral cavity duringsuction feeding (i.e. associated with the dimensionsand shape of the hyoid and pectoral girdle). Finally,we tested whether the observed ontogenetic changesin diet are a consequence of changes in overall bodysize or rather are associated with specific shapechanges in the cranial system of C. longicauda.
MATERIAL AND METHODSMORPHOMETRICS
The 63 C. longicauda used in the study were obtainedfrom the Royal Museum for Central Africa (RMCA–KMMA), Tervuren, Belgium. Specimens were pre-dominantly collected in one of two localities innorth-western Gabon and Cameroon (see Appendix).No geographical bias in morphology was detectedupon inspection of the data.
Body size (both total length and standard length)and head dimensions were measured using digitalcalipers (Mitutoyo CD-30C and CD-15B; ±0.01 mm).Head length was measured as the distance betweenthe tip of the snout and the caudal edge of theoccipital process. Head width and head height weremeasured just posterior of the jaw adductors.
To estimate the size of the jaw adductors, the areataken up by the jaw adductors in dorsal view wasdetermined from digital photographs of each specimen(Fig. 1), taken using a Nikon Coolpix 885 digitalcamera. The outline of the jaw adductors was indicatedboth on the left and the right side, and the enclosedsurface area was calculated. As a measure of the jawadductor size, the average of the left and right side wascalculated. To validate these measurements, we dis-sected a small sample of fish (N = 10) of which the jawadductors were removed. Muscles were blotted dryand weighed on an electronic microbalance (Mettler
324 M. WYCKMANS ET AL.
© 2007 The Linnean Society of London, Biological Journal of the Linnean Society, 2007, 92, 323–334

Toledo MT5; ±0.001 mg). Regressions of surface areaagainst muscle mass were highly significant (r = 0.81;P < 0.01). To test whether this correlation is the resultof the covariance of these traits with size (fish withbigger heads will have larger muscles and largersurface areas), we regressed the traits against fishcranial length and calculated the residuals. Theregression of the residual surface area against residualmuscle mass was also highly significant (r = 0.78;P < 0.01), demonstrating that the surface area takenup by the jaw adductors in dorsal view is a goodpredictor of muscle mass in these fish.
Additionally, the maximal width of the head andthe width of the neurocranium were both determinedon these pictures. Neurocranium width was measuredas the minimal width of the neurocranium, whereasmaximal head width was measured as the maximalwidth across the jaw adductors. Measurements werecarried out using tpsDIG32 (version 1.40; Rohlf,
2004). A scale bar (±1 mm) was included in eachphotograph, allowing the data to be converted to realunits.
To determine the dimensions of a number of inter-nal skeletal elements, X-ray photographs (dorsoven-tral view) were made using a Philips Optimus X-rayunit with image intensifier, coupled to a RedlakeImaging MotionPro high resolution digital videocamera. On each photograph, eight landmarks weredigitized using Didge (version 2.2.0.; Cullum A)(Fig. 2) and the x- and y-coordinates for each pointwere exported to a spreadsheet. Based on the x- andy-coordinates, the length and width of the lower jawand the hyoid, the angle between the two hyoid barsand the width of the pectoral girdle were calculated.
DIET
Stomach contents were removed in situ through aventral incision, and preserved in a 70% aqueousethanol solution. All prey items were sorted andidentified using a binocular scope (type WILD M3Z).Because the majority of organisms found in the stom-achs were crushed and/or digested, they were identi-fied to the level of the order or higher taxonomic levelwhere appropriate.
Figure 1. Dorsal view on the head of a Clariallabes lon-gicauda specimen. The outlines of the jaw adductors areindicated in white.
Figure 2. Dorsoventral X-ray photograph with the eightlandmarks (white dots) that were digitized to determinethe dimensions of the lower jaw, the hyoid and the pectoralgirdle. White lines indicate the angle between the left andright hyoid bars. Numbers indicate the landmarks digi-tized: (1) lower jaw symphysis; (2, 3) caudal tips of thelower jaw; (4) hyoid symphysis; (5, 6) caudal tips of thehyoid; (7, 8) left and right pectoral fin articulation.
MORPHOLOGY AND DIET IN C. LONGICAUDA 325
© 2007 The Linnean Society of London, Biological Journal of the Linnean Society, 2007, 92, 323–334

The number of prey items found in every stomachwas counted and for every prey item prey size wasestimated. Intact prey were measured using digitalcalipers (Mitutoyo CD-15B; ±0.01 mm). Non-intactprey were grouped in size classes, from 0–45 mm, at5-mm intervals. Average prey size, maximal preysize and the proportion of large prey (i.e. > 20 mm)consumed was calculated for each individual fish.In addition, every prey group was weighed usingan electronic microbalance (Mettler Toledo MT5;±0.001 mg).
For each prey group, a relative importance index(IRI) was calculated as an indicator of the significanceof that particular prey group in the diet of C. longi-cauda (Huysentruyt et al., 2004):
IRI % % %= +( ) ×N V Oc
where %N and %Oc are, respectively, the numericabundance and the frequency of occurrence of a par-ticular prey group. %V is the mass that particularprey group contributes to total prey mass. In addition,%IRI was calculated, being the proportion of IRI ofeach prey group in relation to the total IRI value.
Not only the taxonomic diversity, but also theecological and functional diversity of the diet wasassessed. To do so, prey items were divided into anumber of ecological/functional classes: (1) Hard(H) - Intermediate (I) - Soft (S); (2) Terrestrial(T) - Aquatic (A); and (3) Evasive (E) - Non-evasive(NE). These classifications were only made for preythat could be identified to the level of the order.
Based on previous measurements of prey hardness(Herrel et al., 1999, 2001; Verwaijen, Van Damme &Herrel, 2002; Aguirre et al., 2003), every prey itemwas classified as being either hard (i.e. adult Cole-optera, Hymenoptera, larval Trichoptera, Isopoda,Gastropoda and Vertebrata), of intermediate hard-ness (i.e. Ephemeroptera, Hemiptera, Odonata,Orthoptera and Diplopoda) or soft (all other prey).Prey hardness was estimated for each prey item usingthe following regressions (Verwaijen et al., 2002):
Hard prey hardnessprey size mm
: log. log .
10
101 582 1 36N( )[ ]
= × ( )[ ] − 55
Intermediate prey hardnessprey size mm
: log. log
10
101 780N( )[ ]
= × ( ))[ ] − 1 942.
Soft prey hardnessprey size mm
: log. log .
10
100 997 1 37N( )[ ]
= × ( )[ ] − 99
For all intact prey, the actual prey length was usedto calculate prey hardness; for non-intact prey, themiddle of the size class to which the prey item wasassigned was used as an indicator of prey length. Inaddition, an average prey hardness value was calcu-lated for each individual.
To classify organisms as being evasive or non-evasive, the assumption was made that terrestrialprey had fallen into the water where they could easilybe captured by the fish. Consequently, all terrestrialprey groups were classified as being non-evasive. Anoverview of the classification of the different prey intofunctional categories is provided in Table 1.
Finally, the proportion of prey belonging to eachecological/functional class was calculated in threedifferent ways: numeric (number of prey), volumetric(mass), and based upon the frequency of occurrence(i.e. number of stomachs containing prey of a par-ticular ecological/functional class in relation to thetotal number of full stomachs). This was carried outboth for each individual and for the species as awhole.
STATISTICAL ANALYSIS
To investigate ontogenetic changes in morphology,log10-transformed morphological measures were re-gressed against the log10-transformed standard length.A two-tailed Student’s t-test was used to test fordifferences between the observed slopes obtained fromthe regression analyses and the slopes expected in thecase of isometric growth (Sokal & Rohlf, 1995).
Next, the log10-transformed average and maximalprey size, proportion of large prey consumed,average prey hardness, prey number (absolute), andprey mass (proportional) in each ecological/functionalclass were regressed against the log10-transformedstandard length to investigate ontogenetic changesin diet.
Finally, we investigated which morphological vari-able(s) could account for dietary variation usingmultiple regression analyses. The log10-transformedaverage and maximal prey size, the proportion oflarge prey consumed, average prey hardness, preynumber (absolute), and prey mass (proportional)in each ecological/functional class were regressedagainst the morphological variables. The morpho-logical variables used were the log10-transformedstandard length and the residual values of allother log10-transformed measures relative to the log10-transformed standard length. In the case of ontoge-netic changes in diet, the residuals of the dietaryvariables (relative to standard length) were regressedagainst the morphological variables.
RESULTSONTOGENETIC CHANGES IN HEAD SIZE AND SHAPE
All morphological traits examined (Table 2) werehighly correlated with fish body size (all R2 > 0.614and P < 0.0001), except for the angle between the twohyoid bars (R2 = 0.04 and P = 0.155). The observed
326 M. WYCKMANS ET AL.
© 2007 The Linnean Society of London, Biological Journal of the Linnean Society, 2007, 92, 323–334

Table 1. Diet composition of C. longicauda. The taxonomic classification is based on stomach analyses for 47 individuals.The ecological/functional classification is based on a subgroup of 39 individuals
TAXONOMIC CLASSIFICATIONPrey type No. of stomachs No. of prey Mass (mg) % IRI Functional category
Plant/unidentifiable** 37InvertebrataNematoda** 1Annelida 2 2 8.714 0.08 S-NE-AGastropoda 3 217 7.929 7.76 H-NE-AArthropoda* 6 12 0.807 0.86Araneae 2 4 59.522 0.29 S-NE-TDecapoda 3 4 135.984 0.80 S-E-AIsopoda 3 4 5.350 0.17 H-NE-TChilopoda 2 2 2.644 0.06 S-NE-TDiplopoda 1 1 0.187 0.01 I-NE-TInsecta* 19 29 17.503 7.07Coleoptera (ad) 10 22 540.255 11.34 H-NE/E-T/AColeoptera (la) 6 12 548.139 6.17 S-NE-TDictyoptera 3 3 0.563 0.11 I-NE-TDiptera (ad) 7 7 2.731 0.61 S-NE-TDiptera (la) 6 74 59.675 5.84 S-NE-AHemiptera 3 8 8.314 0.32 I-NE-THymenoptera 14 19 73.804 4.82 H-NE-TIsoptera 4 28 6.324 1.37 S-NE-TIsoptera** 2Lepidoptera (ad) 1 1 15.529 0.04 S-NE-TLepidoptera (la) 5 6 465.487 4.12 S-NE-TMecoptera 1 1 0.383 0.01 S-NE-TOdonata (ad) 1 1 21.210 0.05 I-NE-TOdonata (la) 16 26 162.594 9.14 I-E-AOrthoptera 7 8 113.635 1.95 I-NE-TSiphonoptera 1 1 1.145 0.01 S-NE-TTrichoptera 2 3 2.185 0.08 S-NE-TEggs (insect) 1 10 5.268 0.13 S-NE-A
VertebrataTeleostei 10 10 1507.895 25.57 H-E-AEggs (fish) 4 152 96.042 7.83 S-NE-AAnura 2 2 1034.751 3.39 H-E-A
Total 47 669 4904.569
ECOLOGICAL/FUNCTIONAL CLASSIFICATIONNumber of stomachs with prey size in this class (number of stomachs with average prey size in this class)
0–5 mm 5–10 mm 10–15 mm 15–20 mm > 20 mm15 (6) 29 (12) 21 (10) 8 (3) 18 (8)
Hard - Intermediate - Soft
No. of stomachs No. of prey Mass (mg) % IRI
Hard 29 275 3171.863 58.15Intermediate 24 45 305.967 5.94Soft 25 308 1408.429 35.91
Evasive - Non-evasive
No. of stomachs No. of prey Mass (mg) % IRI
Evasive 27 52 3376.291 35.47Non-evasive 31 576 1509.968 64.53
Terrestrial - Aquatic
No. of stomachs No. of prey Mass (mg) % IRI
Terrestrial 30 120 1330.461 23.17Aquatic 30 508 3555.798 76.83
*prey group not accounted for in ecological/functional part of the table.**prey group for which only frequency of occurence was calculated. IRI, relative importance index.S, soft; I, intermediate; H, hard; E, evasive; NE, non-evasive; A, aquatic; T, terrestrial.
MORPHOLOGY AND DIET IN C. LONGICAUDA 327
© 2007 The Linnean Society of London, Biological Journal of the Linnean Society, 2007, 92, 323–334

ontogenetic changes in morphology, however, were notalways consistent with those expected for a model ofisometric growth (Table 3). Notably, jaw adductor size(Student’s t-test, d.f. = 61, t = 4.98, P < 0.01; Fig. 3),maximal head width (Student’s t-test, d.f. = 61,t = 3.14, P < 0.01) and head height (Student’s t-test,d.f. = 61, t = 3.06, P < 0.01) increased faster than pre-dicted by geometric scaling models. Thus, distinctchanges in head shape occur during growth in Clari-allabes longicauda.
DIET: GENERAL
Sixteen (25.4%) of the 63 stomachs examined wereempty and six (9.5%) contained only unidentifiable orplant matter. The content of the remaining 41 stom-achs could be identified, although these too regularlycontained some unidentifiable or plant matter.Table 1 summarizes the results of the stomachcontent analysis. In the taxonomic part of Table 1, anoverview of all prey groups (based on the 47 stomachs
Table 2. Overview of the minimum and maximum values, averages and standarddeviations (SD) for all morphological traits examined
Variable Minimum Maximum Mean SD
Total length (mm) 119.10 276.16 162.28 36.57Standard length (mm) 105.52 245.33 145.39 32.72Head length (mm) 19.89 51.97 28.26 6.74Head width (mm) 14.82 38.66 20.94 5.30Head height (mm) 8.43 28.46 13.13 4.11Neurocranium width (mm) 5.66 20.50 10.22 2.63Maximum head width (mm)* 16.05 53.32 25.28 7.60Jaw adductor size (mm2) 22.36 336.80 77.07 63.02Lower jaw length (mm) 5.06 14.53 7.91 2.10Lower jaw width (mm) 8.57 24.12 12.59 3.07Hyoid length (mm) 3.93 13.32 7.50 1.79Hyoid width(mm) 11.78 29.03 15.81 3.88Hyoid angle (°) 81.27 138.51 92.94 10.50Pectoral girdle width (mm) 12.47 32.25 17.81 4.22
*measured across jaw adductors.
Table 3. Results of Student’s t-test used to test for differences between observedslope and expected slope (geometric scaling)
Variable Expected slope Observed slope SE
Total length (mm) 1 0.994 0.007Head length (mm) 1 1.000 0.037Head width (mm) 1 1.051 0.041Head height (mm) 1 1.208 0.068Neurocranium width (mm) 1 0.876 0.088Max. head width (mm)* 1 1.185 0.059Jaw adductor size (mm2) 2 2.712 0.143Lower jaw length (mm) 1 0.964 0.088Lower jaw width (mm) 1 0.946 0.059Hyoid length (mm) 1 0.831 0.087Hyoid width(mm) 1 0.935 0.056Hyoid angle (°) 0 0.067 0.047Pectoral girdle width (mm) 1 0.938 0.059
*measured across jaw adductors.SE, standard error.Bold variables are significantly different from predictions of geometric similarity.
328 M. WYCKMANS ET AL.
© 2007 The Linnean Society of London, Biological Journal of the Linnean Society, 2007, 92, 323–334
with content) is given. It shows that the three mostimportant prey groups for C. longicauda were fish(% IRI = 25.6), adult Coleoptera (% IRI = 11.3) andlarval Odonata (% IRI = 9.1). The ecological/functional part of Table 1 is based on 39 stomachswith identifiable content and shows how the prey aredivided over the different ecological/functional andsize classes. An important part of the diet consisted ofhard prey (% IRI = 58.2). Although prey of intermedi-ate hardness were found in a similar number ofstomachs compared to soft prey, there was a largedifference in importance (% IRI = 5.9 for intermediateversus 35.9 for soft prey). Furthermore, both non-evasive (% IRI = 64.5) and aquatic prey (% IRI = 76.8)were important components of the diet of C. longi-cauda. In 80% of the stomachs, the average prey sizewas smaller than 20 mm.
SIZE-RELATED CHANGES IN DIET
Size-related changes in diet were detected for anumber of prey characteristics. Notably, the propor-tion of large prey (> 20 mm) (R2 = 0.14, P = 0.021), themaximal prey size consumed (R2 = 0.10, P = 0.047),the average prey hardness (R2 = 0.10, P = 0.045), theproportion of hard and soft prey (R2 = 0.10, P = 0.047and R2 = 0.19, P = 0.006, respectively), the proportionof evasive and non-evasive prey (both R2 = 0.16;P = 0.012), and the proportion of terrestrial andaquatic prey (both R2 = 0.16; P = 0.012) changed withincreasing fish size. Whereas the average prey hard-ness and the proportion of hard, evasive and aquaticprey in the diet increased with fish body size, the
proportion of soft, non-evasive and terrestrial preyconsumed decreased with increasing fish body size.
RELATIONSHIPS BETWEEN MORPHOLOGY AND DIET
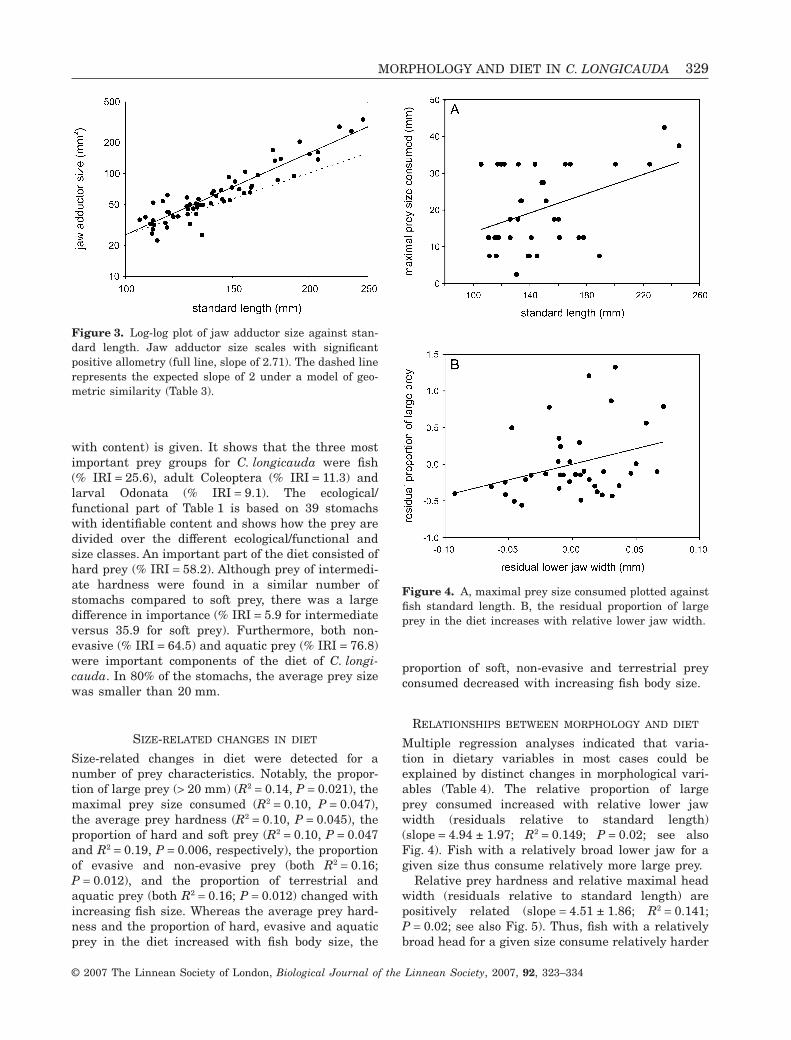
Multiple regression analyses indicated that varia-tion in dietary variables in most cases could beexplained by distinct changes in morphological vari-ables (Table 4). The relative proportion of largeprey consumed increased with relative lower jawwidth (residuals relative to standard length)(slope = 4.94 ± 1.97; R2 = 0.149; P = 0.02; see alsoFig. 4). Fish with a relatively broad lower jaw for agiven size thus consume relatively more large prey.
Relative prey hardness and relative maximal headwidth (residuals relative to standard length) arepositively related (slope = 4.51 ± 1.86; R2 = 0.141;P = 0.02; see also Fig. 5). Thus, fish with a relativelybroad head for a given size consume relatively harder
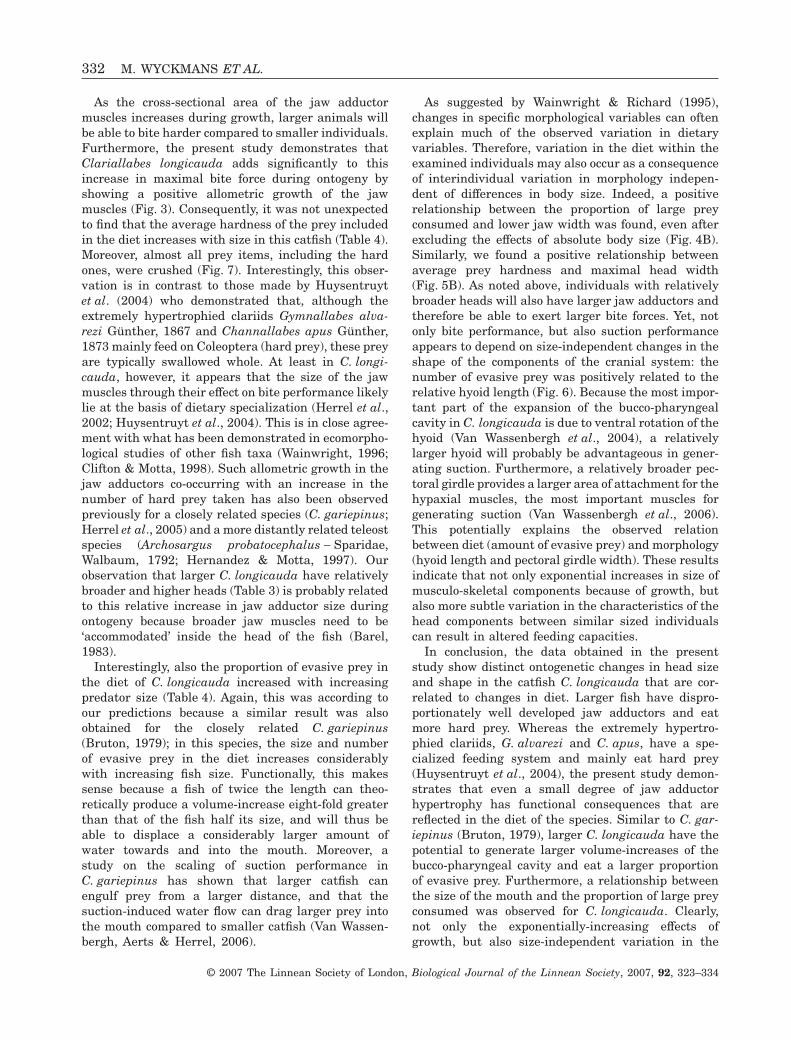
Figure 4. A, maximal prey size consumed plotted againstfish standard length. B, the residual proportion of largeprey in the diet increases with relative lower jaw width.
Figure 3. Log-log plot of jaw adductor size against stan-dard length. Jaw adductor size scales with significantpositive allometry (full line, slope of 2.71). The dashed linerepresents the expected slope of 2 under a model of geo-metric similarity (Table 3).
MORPHOLOGY AND DIET IN C. LONGICAUDA 329
© 2007 The Linnean Society of London, Biological Journal of the Linnean Society, 2007, 92, 323–334

prey. The relative proportion of hard prey in the dietwas positively related to relative lower jaw width(slope = 8.21 ± 2.45; R2 = 0.24; P = 0.002). Conse-quently, for the proportion of soft prey in the diet, anegative relationship with head width was observed(slope = -8.29 ± 2.84; R2 = 0.19; P = 0.006).
The relative proportion of evasive prey was relatedto relative pectoral girdle width (slope = 5.01 ± 1.92;both R2 = 0.16 and P = 0.01). The absolute number ofevasive prey in the diet, on the other hand, waspositively related to relative hyoid length (slope =6.13 ± 2.45; R2 = 0.15; P = 0.017; Fig. 6). The presenceof evasive prey in the diet thus appears to be associatedwith shape differences in the pectoral girdle and hyoid.
Finally, the relative proportion of aquatic prey inthe diet was positively related to relative lower jawlength and pectoral girdle width (both R2 = 0.26; lowerjaw length: slope = 4.49 ± 1.83; P = 0.019 and pectoralgirdle width: slope = 3.89 ± 1.88; P = 0.046).
DISCUSSION
Ontogenetic diet switches in fishes and other ecto-therms appear to be a universal phenomenon. Why dofish switch diet as they grow? The most commonexplanation is that ontogenetic diet switches reflectthe changing feeding abilities or energetic demands offish as they grow. Most, but not all diet switches ofcarnivorous species involve increases in the averagesize of prey with increasing predator size (Keast,1985; Osenberg & Mittelbach, 1989). As fish grow,they are able to eat larger prey, and bigger preybecome more profitable. Increasing prey size willusually lead to taxonomic changes and these changesare manifested as ontogenetic diet switches (Wain-wright & Richard, 1995). An example of a shift in dietduring ontogeny in a clariid catfish (the taxono-mic group of our study species Clariallabeslongicauda) has been reported for C. gariepinus
Table 4. Results of multiple regression analyses of dietary variables against morphological variables. Note that onlysignificant regressions are listed here. Note also that results of non-evasive and terrestrial prey are not shown as thesemirror those for evasive and aquatic prey, respectively. It should be mentioned, however, that for the number ofnon-evasive prey no significant correlations with morphology were detected
Dietary variable Morphological variable R2 Slope SE
% large prey consumed* Lower jaw width (res) 0.255 4.954 1.993Standard length 1.823 0.777
% large prey consumed (res)* Lower jaw width (res) 0.149 4.943 1.965Average prey hardness Maximum head width** (res) 0.222 4.507 1.881
Standard length 1.731 0.840Average prey hardness (res) Maximum head width** (res) 0.141 4.507 1.855Hard
% mass Lower jaw width (res) 0.326 8.208 2.494Standard length 2.286 0.969
% mass (res) Lower jaw width (res) 0.238 8.212 2.448Soft
% mass Standard length 0.378 -2.974 0.839Head width (res) -8.273 2.875
% mass (res) Head width (res) 0.192 -8.285 2.837Evasive
Number of prey Hyoid length (res) 0.149 6.133 2.447% mass Standard length 0.309 2.940 0.980
Pectoral girdle width (res) 5.007 1.949% mass (res) Pectoral girdle width (res) 0.159 5.007 1.923
Aquatic% mass Standard length 0.395 2.976 0.944
Lower jaw length (res) 4.490 1.850Pectoral girdle width (res) 3.885 1.909
% mass (res) Lower jaw length (res) 0.263 4.492 1.825Pectoral girdle width (res) 3.886 1.882
*prey size > 20 mm.**measured across jaw adductors.SE, standard error; res, residual values, relative to standard length.
330 M. WYCKMANS ET AL.
© 2007 The Linnean Society of London, Biological Journal of the Linnean Society, 2007, 92, 323–334

(Bruton, 1979). The study showed that crustaceans,insects and larval fishes make up the bulk of the dietfor small C. gariepinus, whereas the diet of largerconspecifics is primarily composed of adult fish.
Moreover, mouth size is usually positively related toprey size (Wainwright & Richard, 1995; Hugueny &Pouilly, 1999; Sibbing & Nagelkerke, 2001; Bouton, DeVisser & Barel, 2002). The dimensions of the lower jawaffect the volume of the buccal cavity (Bouton et al.,2002). Therefore, larger fish (with larger mouths) areexpected to feed on larger prey. Indeed, in C. longi-cauda, maximal prey size and the proportion of largeprey consumed both increase with predator size.However, in the largest C. longicauda specimens, anamount of relatively small prey (< 20 mm) is alsofound. Because large individuals apparently consumeboth small and large prey items, the expected increasein average prey size with predator size is not present.
Figure 7. A coleopteran elythrum showing clear bitemarks as an example of a crushed prey item (onesquare = 1 mm2).
Figure 5. Log-log plot of the average prey hardnessagainst maximal head width (i.e. measured across jawadductors), represented as absolute and (A) relative (B)values. Average prey hardness significantly increases withincreasing maximal head width (Table 4).
Figure 6. A, plot of the number of evasive prey againsthyoid length. The number of evasive prey increases sig-nificantly with increasing hyoid length (Table 4). B, notehow also relative hyoid length is significantly correlatedwith the number of evasive prey in the diet (Table 4).
MORPHOLOGY AND DIET IN C. LONGICAUDA 331
© 2007 The Linnean Society of London, Biological Journal of the Linnean Society, 2007, 92, 323–334
As the cross-sectional area of the jaw adductormuscles increases during growth, larger animals willbe able to bite harder compared to smaller individuals.Furthermore, the present study demonstrates thatClariallabes longicauda adds significantly to thisincrease in maximal bite force during ontogeny byshowing a positive allometric growth of the jawmuscles (Fig. 3). Consequently, it was not unexpectedto find that the average hardness of the prey includedin the diet increases with size in this catfish (Table 4).Moreover, almost all prey items, including the hardones, were crushed (Fig. 7). Interestingly, this obser-vation is in contrast to those made by Huysentruytet al. (2004) who demonstrated that, although theextremely hypertrophied clariids Gymnallabes alva-rezi Günther, 1867 and Channallabes apus Günther,1873 mainly feed on Coleoptera (hard prey), these preyare typically swallowed whole. At least in C. longi-cauda, however, it appears that the size of the jawmuscles through their effect on bite performance likelylie at the basis of dietary specialization (Herrel et al.,2002; Huysentruyt et al., 2004). This is in close agree-ment with what has been demonstrated in ecomorpho-logical studies of other fish taxa (Wainwright, 1996;Clifton & Motta, 1998). Such allometric growth in thejaw adductors co-occurring with an increase in thenumber of hard prey taken has also been observedpreviously for a closely related species (C. gariepinus;Herrel et al., 2005) and a more distantly related teleostspecies (Archosargus probatocephalus - Sparidae,Walbaum, 1792; Hernandez & Motta, 1997). Ourobservation that larger C. longicauda have relativelybroader and higher heads (Table 3) is probably relatedto this relative increase in jaw adductor size duringontogeny because broader jaw muscles need to be‘accommodated’ inside the head of the fish (Barel,1983).
Interestingly, also the proportion of evasive prey inthe diet of C. longicauda increased with increasingpredator size (Table 4). Again, this was according toour predictions because a similar result was alsoobtained for the closely related C. gariepinus(Bruton, 1979); in this species, the size and numberof evasive prey in the diet increases considerablywith increasing fish size. Functionally, this makessense because a fish of twice the length can theo-retically produce a volume-increase eight-fold greaterthan that of the fish half its size, and will thus beable to displace a considerably larger amount ofwater towards and into the mouth. Moreover, astudy on the scaling of suction performance inC. gariepinus has shown that larger catfish canengulf prey from a larger distance, and that thesuction-induced water flow can drag larger prey intothe mouth compared to smaller catfish (Van Wassen-bergh, Aerts & Herrel, 2006).
As suggested by Wainwright & Richard (1995),changes in specific morphological variables can oftenexplain much of the observed variation in dietaryvariables. Therefore, variation in the diet within theexamined individuals may also occur as a consequenceof interindividual variation in morphology indepen-dent of differences in body size. Indeed, a positiverelationship between the proportion of large preyconsumed and lower jaw width was found, even afterexcluding the effects of absolute body size (Fig. 4B).Similarly, we found a positive relationship betweenaverage prey hardness and maximal head width(Fig. 5B). As noted above, individuals with relativelybroader heads will also have larger jaw adductors andtherefore be able to exert larger bite forces. Yet, notonly bite performance, but also suction performanceappears to depend on size-independent changes in theshape of the components of the cranial system: thenumber of evasive prey was positively related to therelative hyoid length (Fig. 6). Because the most impor-tant part of the expansion of the bucco-pharyngealcavity in C. longicauda is due to ventral rotation of thehyoid (Van Wassenbergh et al., 2004), a relativelylarger hyoid will probably be advantageous in gener-ating suction. Furthermore, a relatively broader pec-toral girdle provides a larger area of attachment for thehypaxial muscles, the most important muscles forgenerating suction (Van Wassenbergh et al., 2006).This potentially explains the observed relationbetween diet (amount of evasive prey) and morphology(hyoid length and pectoral girdle width). These resultsindicate that not only exponential increases in size ofmusculo-skeletal components because of growth, butalso more subtle variation in the characteristics of thehead components between similar sized individualscan result in altered feeding capacities.
In conclusion, the data obtained in the presentstudy show distinct ontogenetic changes in head sizeand shape in the catfish C. longicauda that are cor-related to changes in diet. Larger fish have dispro-portionately well developed jaw adductors and eatmore hard prey. Whereas the extremely hypertro-phied clariids, G. alvarezi and C. apus, have a spe-cialized feeding system and mainly eat hard prey(Huysentruyt et al., 2004), the present study demon-strates that even a small degree of jaw adductorhypertrophy has functional consequences that arereflected in the diet of the species. Similar to C. gar-iepinus (Bruton, 1979), larger C. longicauda have thepotential to generate larger volume-increases of thebucco-pharyngeal cavity and eat a larger proportionof evasive prey. Furthermore, a relationship betweenthe size of the mouth and the proportion of large preyconsumed was observed for C. longicauda. Clearly,not only the exponentially-increasing effects ofgrowth, but also size-independent variation in the
332 M. WYCKMANS ET AL.
© 2007 The Linnean Society of London, Biological Journal of the Linnean Society, 2007, 92, 323–334

characteristics of the head components between indi-viduals results in altered feeding capacities, indicat-ing the importance of cranial shape to diet in thesefish.
ACKNOWLEDGEMENTS
We would like to thank M. Parrent and J. Snoeksfrom the RMCA, Tervuren, Belgium for the loan of thefish used in this study. A.H. is a postdoctoral fellow ofthe Fund for Scientific Research - Flanders, Belgium(FWO-Vl). This study was supported by grants fromthe special research fund from the University ofAntwerp and a Research Programme of the Fund forScientific Research - Flanders, Belgium (FWO-Vl).
REFERENCES
Aguirre LF, Herrel A, Van Damme R, Matthysen E. 2003.The implications of food hardness for diet in bats. Func-tional Ecology 17: 201–212.
Barel CDN. 1983. Towards a constructional morphology ofcichlid fishes (Teleostei, Perciformes). Netherlands Journalof Zoology 33: 357–424.
Bouton N, De Visser J, Barel CDN. 2002. Correlating headshape with ecological variables in rock-dwelling haplo-chromines (Teleostei: Cichlidae) from Lake Victoria. Biologi-cal Journal of the Linnean Society 76: 39–48.
Bruton MN. 1979. The food and feeding behaviour of Clariasgariepinus (Pisces: Clariidae) in Lake Sibaya, South Africa,with emphasis on its role as a predator of cichlids. Tran-scripts of the Zoological Society of London 35: 47–114.
Cabuy E, Adriaens D, Verraes W, Teugels GG. 1999.Comparative study on the cranial morphology of Gymnall-abes typus (Siluriformes: Clariidae) and their less anguilli-form relatives, Clariallabes melas and Clarias gariepinus.Journal of Morphology 240: 169–194.
Clifton KB, Motta PJ. 1998. Feeding morphology, diet andecomorphology relationships among five Caribean labrids(Teleostei, Labridae). Copeia 4: 953–966.
Deban SM, O’Reilly JC. 2005. The ontogeny of feedingkinematics in a giant salamander Cryptobranchus alle-ganiensis: Does current function or phylogenetic relatednesspredict the scaling patterns of movement? Zoology 108:155–167.
Devaere S, Adriaens D, Verraes W, Teugels GG. 2001.Cranial morphology of the anguilliform clariid Channall-abes apus (Günther, 1873) (Teleostei: Siliruformes): areadaptations related to powerful biting? Journal of ZoologyLondon 255: 235–250.
Emerson SB, Greene HW, Charnov EL. 1994. Allometricaspects of predator–prey interactions. In: Wainwright PC,Reilly SM, eds. Ecological morphology: integrative organis-mal biology. Chicago, IL: University of Chicago Press, 123–139.
Hernandez LP, Motta PJ. 1997. Trophic consequences ofdifferential performance in the sheepshead, Archosargus
probatocephalus (Teleostei, Sparidae). Journal of ZoologyLondon 243: 737–756.
Herrel A, Adriaens D, Verraes W, Aerts P. 2002. Biteperformance in clariid fishes with hypertrophied jaw adduc-tors as deduced by bite modeling. Journal of Morphology235: 196–205.
Herrel A, Spithoven L, Van Damme R, De Vree F. 1999.Sexual dimorphism of head size in Gallotia galloti: testingthe niche divergence hypothesis by functional analyses.Functional Ecology 13: 289–297.
Herrel A, Van Damme R, Vanhooydonck B, De Vree F.2001. The implications of bite performance for diet in twospecies of lacertid lizards. Canadian Journal of Zoology 79:662–670.
Herrel A, Van Wassenbergh S, Wouters S, Adriaens D,Aerts P. 2005. A functional morphological approach to thescaling of the feeding system in the African catfish, Clariasgariepinus. Journal of Experimental Biology 208: 2091–2102.
Hill AV. 1950. The dimensions of animals and their musculardynamics. Science Progress 150: 209–230.
Hugueny B, Pouilly M. 1999. Morphological correlates ofdiet in an assemblage of West African freshwater fishes.Journal of Fish Biology 54: 1310–1325.
Huysentruyt F, Adriaens D, Teugels GG, Devaere S,Herrel A, Verraes W, Aerts P. 2004. Diet composition inrelation to morphology in some African anguilliform clariidcatfishes. Belgian Journal of Zoology 134: 41–46.
Keast A. 1985. The piscivore feeding guild of fishes in smallfreshwater ecosystems. Environmental Biology of Fishes 12:119–129.
McMahon TA. 1973. Size and shape in biology. Science 179:1201–1204.
Meyers JJ, Herrel A, Birch J. 2002. Scaling of morphol-ogy, bite force and feeding kinematics in an iguanian anda scleroglossan lizard. In: Aerts P, D’Aout K, Herrel A,Van Damme R, eds. Topics in functional and ecologicalvertebrate morphology. Maastricht: Shaker Publishing,47–62.
Osenberg CW, Mittelbach GG. 1989. Effects of body sizeon the predator–prey interaction between pumpkinseedsunfish and gastropods. Ecological Monographs 59: 405–432.
Richard BA, Wainwright PC. 1995. Scaling the feedingmechanism of largemouth bass (Micropterus salmoides):kinematics of prey capture. Journal of Experimental Biology198: 419–433.
Rohlf FJ. 2004. tpsDIG32 version 1.40. Available at http://life.bio.sunysb.edu/morph/index.html
Schmidt-Nielsen K. 1984. Scaling: why is animal size soimportant? Cambridge: Cambridge University Press.
Sibbing FA, Nagelkerke LAJ. 2001. Resource partitioningby Lake Tana barbs predicted from fish morphometrics andprey characteristics. Reviews in Fish Biology and Fisheries10: 393–437.
Sokal RF, Rohlf FJ. 1995. Biometry. New York, NY: WHFreeman.
Teugels GG, Adriaens D. 2003. Taxonomy and phylogenyof Clariidae: an overview. In: Arratia G, Kapoor BG,
MORPHOLOGY AND DIET IN C. LONGICAUDA 333
© 2007 The Linnean Society of London, Biological Journal of the Linnean Society, 2007, 92, 323–334

Chardon M, Diogo R, eds. Catfishes, Vol. 1. Enfield, CT:Science Publishers Inc., 465–487.
Van Wassenbergh S, Aerts P, Herrel A. 2005. Scaling ofsuction-feeding kinematics and dynamics in the Africancatfish, Clarias gariepinus. Journal of Experimental Biology208: 2103–2114.
Van Wassenbergh S, Aerts P, Herrel A. 2006. Scalingof suction feeding performance in the catfish Clarias gar-iepinus. Physiological and Biochemical Zoology 79: 43–56.
Van Wassenbergh S, Herrel A, Adriaens D, Aerts P. 2004.Effects of jaw adductor hypertrophy on buccal expansionsduring feeding of air breeding catfishes (Teleostei, Clari-idae). Zoomorphology 123: 81–93.
Verwaijen D, Van Damme R, Herrel A. 2002. Relationshipsbetween head size, bite force, prey handling efficiency anddiet in two sympatric lacertid lizards. Functional Ecology16: 842–850.
Wainwright PC. 1996. Ecological explanation through func-tional morphology: the feeding biology of sunfishes. Ecology77: 1336–1343.
Wainwright PC, Richard BA. 1995. Predicting patterns ofprey use from morphology of fishes. Environmental Biologyof Fishes 44: 97–113.
West GB, Savage VM, Gillooly JF, Enquist BJ, WoodruffWH, Brown JH. 2003. Why does metabolic rate scale withbody size? Nature 421: 713.
APPENDIX
Overview of the localities where Clariallabes longicauda specimens were collected.
Collection number(Royal Museum forCentral Africa)
Number ofspecimens Locality
73-16-P-6375-380 4 Olounou, Cameroon73-16-P-6408-412 4 Olounou, Cameroon73-16-P-6469-472 1 Olounou, Cameroon73-16-P-6518-555 6 Olounou, Cameroon73-16-P-6556-587 9 Olounou, Cameroon73-16-P-6659-660 1 Olounou, Cameroon73-16-P-6664-665 1 Olounou, Cameroon73-02-P-2255 1 Elang, river Sanaga, Cameroon73-18-P-3311-313 3 Elogo, river Nyong, Cameroon76-14-P-687 1 Mieri, river Doume, Cameroon76-14-P-839 1 Kombetiko, river Nguesse, Cameroon77-32-P-17-32 3 Méséa, river Bom, Cameroon77-32-P-124-143 3 Bassin Doumé, Cameroon95-042-P-0811-0813 3 Bassin Dja, Cameroon179114-115 2 Tchibanga, river Nyanga, Gabon98-029-P-0944 1 Nyame Pende creek, Gabon99-056-P-0001-0004 3 Ebeigne, river Otubitang, Oyem, GabonA0-049-P-0123-0140 13 Ebeigne, river Woleu, Oyem, GabonA0-049-P-0141-0142 2 Ebeigne, river Woleu, Oyem, GabonA0-049-P-0144 1 Mifoumou (Nefarge), Oyem, Gabon
334 M. WYCKMANS ET AL.
© 2007 The Linnean Society of London, Biological Journal of the Linnean Society, 2007, 92, 323–334