Variation of functional cranial components in six Anthropoidea species
13
ZOOLOGY Zoology 109 (2006) 231–243 Variation of functional cranial components in six Anthropoidea species He´ctor M. Pucciarelli a,c, , Fernando V. Ramirez Rozzi d , Marı´a C. Mun˜e a,c , Marina L. Sardi b,c a Centro de Investigaciones en Gene´tica Ba´sica y Aplicada (CIGEBA, FCV, UNLP), 1900 La Plata, Argentina b Departamento Cientı´fico de Antropologı´a, Museo de La Plata, Paseo del Bosque S/N, 1900 La Plata, Argentina c Consejo Nacional de Investigaciones Cientı´ficas y Te´cnicas (CONICET), Buenos Aires, Argentina d UPR 2147 Centre National de la Recherche Scientifique (CNRS), Paris, France Received 18 April 2005; received in revised form 17 February 2006; accepted 27 February 2006 Abstract Sixty male crania from three Platyrrhini and three Catarrhini genera were measured by means of the craniofunctional method. The aim was to analyze functional components of the skull and relate their function and the degree of encephalization to life history variables. We recognized two major and eight minor functional components. The objectives were to test (1) if within-taxa (Platyrrhini or Catarrhini) and/or between-taxa (Platyrrhini and Catarrhini) comparisons showed minor-component differentiation; and (2) if encephalization affects both primate groups differently. After standardization by size and scaling, 15 possible within-taxa and between-taxa comparisons were made. We found a strong phylogenetic signal, i.e., cranial differences were not randomly distributed, with the between-taxa variation being greater than within-taxa. Both hypotheses tested were accepted since: (1) There was no random variation between functional cranial components. They followed definite patterns for ancestral and derived traits. (2) Encephalization was present in all scaled comparisons, with Platyrrhini showing a higher degree of encephalization than Catarrhini. We conclude that major and minor craniofunctional components should be considered as correlated traits related to life history, because we found different patterns between platyrrhines and catarrhines, and within species of both taxa. r 2006 Elsevier GmbH. All rights reserved. Keywords: Life history; Encephalization; Apes; Monkeys; Heterochrony Introduction Life history has been defined as the ‘‘allocation of an organism’s energy toward growth, maintenance, repro- duction, raising offspring to independence, and avoiding death’’ (Smith and Tompkins, 1995). Life history is particularly interesting with regard to primates, because new findings about the relationships between apparently diverse characters like body size and condition, food behavior, maternal care, growth and nutrition, survival strategies, and many other characters that formerly had to be isolately studied, can now be integrated in a common theory. Modern taxonomy of primates includes the New World monkeys (Platyrrhini), and the apes and cercopithecids from the Old World (Catarrhini) in ARTICLE IN PRESS www.elsevier.de/zool 0944-2006/$ - see front matter r 2006 Elsevier GmbH. All rights reserved. doi:10.1016/j.zool.2006.02.002 Corresponding author. Centro de Investigaciones en Gene´tica Ba´ sica y Aplicada (CIGEBA, FCV, UNLP), 1900 La Plata, Argentina. E-mail address: [email protected] (H.M. Pucciarelli).
Transcript of Variation of functional cranial components in six Anthropoidea species

ARTICLE IN PRESS
ZOOLOGY
0944-2006/$ - se
doi:10.1016/j.zo
�CorrespondBasica y Aplica
E-mail addr
Zoology 109 (2006) 231–243www.elsevier.de/zool
Variation of functional cranial components in six Anthropoidea species
Hector M. Pucciarellia,c,�, Fernando V. Ramirez Rozzid,Marıa C. Munea,c, Marina L. Sardib,c
aCentro de Investigaciones en Genetica Basica y Aplicada (CIGEBA, FCV, UNLP), 1900 La Plata, ArgentinabDepartamento Cientıfico de Antropologıa, Museo de La Plata, Paseo del Bosque S/N, 1900 La Plata, ArgentinacConsejo Nacional de Investigaciones Cientıficas y Tecnicas (CONICET), Buenos Aires, ArgentinadUPR 2147 Centre National de la Recherche Scientifique (CNRS), Paris, France
Received 18 April 2005; received in revised form 17 February 2006; accepted 27 February 2006
Abstract
Sixty male crania from three Platyrrhini and three Catarrhini genera were measured by means of thecraniofunctional method. The aim was to analyze functional components of the skull and relate their function andthe degree of encephalization to life history variables. We recognized two major and eight minor functionalcomponents. The objectives were to test (1) if within-taxa (Platyrrhini or Catarrhini) and/or between-taxa (Platyrrhiniand Catarrhini) comparisons showed minor-component differentiation; and (2) if encephalization affects both primategroups differently. After standardization by size and scaling, 15 possible within-taxa and between-taxa comparisonswere made. We found a strong phylogenetic signal, i.e., cranial differences were not randomly distributed, with thebetween-taxa variation being greater than within-taxa. Both hypotheses tested were accepted since: (1) There was norandom variation between functional cranial components. They followed definite patterns for ancestral and derivedtraits. (2) Encephalization was present in all scaled comparisons, with Platyrrhini showing a higher degree ofencephalization than Catarrhini. We conclude that major and minor craniofunctional components should beconsidered as correlated traits related to life history, because we found different patterns between platyrrhines andcatarrhines, and within species of both taxa.r 2006 Elsevier GmbH. All rights reserved.
Keywords: Life history; Encephalization; Apes; Monkeys; Heterochrony
Introduction
Life history has been defined as the ‘‘allocation of anorganism’s energy toward growth, maintenance, repro-duction, raising offspring to independence, and avoidingdeath’’ (Smith and Tompkins, 1995). Life history is
e front matter r 2006 Elsevier GmbH. All rights reserved.
ol.2006.02.002
ing author. Centro de Investigaciones en Genetica
da (CIGEBA, FCV, UNLP), 1900 La Plata, Argentina.
ess: [email protected] (H.M. Pucciarelli).
particularly interesting with regard to primates, becausenew findings about the relationships between apparentlydiverse characters like body size and condition, foodbehavior, maternal care, growth and nutrition, survivalstrategies, and many other characters that formerly hadto be isolately studied, can now be integrated in acommon theory.
Modern taxonomy of primates includes the NewWorld monkeys (Platyrrhini), and the apes andcercopithecids from the Old World (Catarrhini) in

ARTICLE IN PRESSH.M. Pucciarelli et al. / Zoology 109 (2006) 231–243232
Anthropoidea (Lewin, 1998). Because a phylogeneticclassification should reflect main evolutionary events, wethink that a comparison of Catarrhini and Platyrrhini isrelevant not only for primatology but also for physicalanthropology.
Traits like newborn and adult brain size, age atweaning, adult body size, tooth development, time offirst female breeding, adult mortality and the sequencesof physical, morphological and behavioral changes, areassociated with many other life history variables(Harvey and Clutton-Brock, 1985; Smith et al., 1994).The traits studied depend upon the specific questions.Recently, the role of mineralized tissue biology for lifehistory studies was emphasized, as ‘‘paleoanthropolo-gists have looked more intently at the developmentaland functional biology of early hominid skeletal anddental tissues’’ (Bromage, 1990).
Recent studies on higher primates showed that apesare not a monophyletic group because chimpanzees andgorillas share a more recent ancestor with humans thanthey do with the orangutans. This is important for lifehistory studies, because the human-like behavior ofthese animals may be more exhaustively interpreted.According to Gould (1977), the ‘‘r–K’’ theory ofselection may be an interesting framework to under-stand the life history variations in ecological terms. Thistheory tries to establish which environmental group offactors (named ‘‘r’’) would favor the maximization ofthe intrinsic rate of natural increase, and which group offactors (named ‘‘K’’) would lead to the maximization ofthe carrying capacity of the environment. The basicprecondition is that r and K cannot be maximized at thesame time (Pianka, 1970, 1972). In essence, the K-selected species are altricial, while the r-selected speciesare mainly precocial. According to Derrickson (1992),primates are considered as intermediate between altricialand precocial. Many relevant characters distinguish theanthropoids from other mammals. One of them is therelative brain increment, i.e., encephalization (e.g., Bolk,1926a, b; Noback and Moskowitz, 1962). According toTrinkaus and Tompkins (1990), this is a dominantaspect of the hominoid evolution. Although Marino(1998) found that some cetacean species arrived at anencephalization stage that was intermediate betweenhumans and the more encephalized anthropoids, Ben-nett (1979) regarded this character as distinctive of theprimate order, because cerebral cortex, cerebellum, andother parts of the brain become progressively differ-entiated, elaborated, and reorganized, especially inAnthropoidea. This trait was frequently used as abaseline in different mammalian life-cycle comparisons(Sacher and Staffeldt, 1974; Gould, 1977; Sacher, 1982).According to McKinney (2002), encephalization inanthropoids is a product of prolonged brain growthand maturation without a proportional body growth.The most encephalized brain portion is the prefrontal
cortex, and its expansion is governed by large initial cellsize and a prolonged period of neuron mitosis, which isnot accompanied by a reduction of mitotic rates. Thisleads to a great increase in the neuron number, and isthe product of increasingly complex activities demandedby both terrestrial and arboreal ways of primateadaptation. Moreover, encephalization is associatedwith the progressive acquisition of all functionalstructures in the brain of humans, monkeys, and apesduring ontogenetic and phylogenetic evolution.
Functional cranial theory is intimately linked toprimate life history traits evolution, specifically forstudying cranial and facial characters. The mainadvantage of this method is that several functionalcranial components (FCCs) (anteroneural, otic, masti-catory, etc.) may be studied separately. This is im-portant because the dynamics among different FCCsacross different primate taxa are unknown. The generalaim of the present study was to study the skull of someNew World and Old World primate species according tofunctional components and to relate those to a lifehistory framework. In particular, we tested the followinghypotheses: (1) Are there within-taxa (Platyrrhini orCatarrhini) and/or between-taxa (Platyrrhini and Catar-rhini) trends of differentiation of major and minorFCCs? (2) Does encephalization affects both taxadifferently, with Platyrrhini being more encephalizedthan Catarrhini?
Material and methods
Sixty male crania belonging to the species Papio
papio, Gorilla gorilla, Pan troglodytes, Alouatta senicu-
lus, Saimiri sciureus, and Ateles paniscus (10 skulls each)were used. All crania—except Saimiri, which belongedto CIGEBA (La Plata, Argentina)—were part of thecollections of the Musee National d’Histoire Naturellede Paris (France), and the Division Zoologıa Vertebra-dos from the Museo de La Plata (Argentina). Compar-isons were made as follows: (a) within Platyrrhini: 1.Saimiri–Alouatta, 2. Saimiri–Ateles, 3. Alouatta–Ateles,(b) within Catarrhini: 4. Papio–Pan, 5. Papio–Gorilla, 6.Pan–Gorilla, (c) between Platyrrhini and Catarrhini: 7.Saimiri–Papio, 8. Saimiri–Pan, 9. Saimiri–Gorilla, 10.Alouatta–Papio, 11. Alouatta–Pan, 12. Alouatta–Gorilla,13. Ateles–Papio, 14. Ateles–Pan, and 15. Ateles–Gorilla.
Most studies in physical anthropology follow thesame methodological criteria, i.e. sophisticated statisti-cal techniques (hierarchical clusters, discriminant andprincipal component analyses, etc.) applied to datacoming from conventionally chosen variable sets, suchas that of the Monaco convention held in 1906 (Comas,1966). This mode of measuring is useful when the sameset of variables is necessary to give uniformity.

ARTICLE IN PRESSH.M. Pucciarelli et al. / Zoology 109 (2006) 231–243 233
Uniformity—defined here as the minimal intra- andinter-observer error made in any given variable mea-surement—is necessary in order to assure comparabilityin the results. This requisite is even more importantwhen crania as different-sized as those of Saimiri andGorilla are compared. According to O’Higgins (1989),the choice of data and its uniformity influence thepattern obtained from between-group comparisons.
Other assumptions are also necessary to perform acraniofacial study that is not solely descriptive but moreanalytical. The skull is a complex structure that can bedecomposed in subunits with high internal integrationand relative independence from other such subunits(modularity; for analysis of mammalian skulls, see e.g.,Klingenberg et al., 2004). Traits within a module arestructural elements that are probably integrated by themodular genetic control of their development (Stock,2001) and show coordinate responses to epigeneticfactors (Wolf et al., 2001). Its theoretical framework isvan der Klaauw’s (1948–1952) functional theory of theindependent function of the cranial components inmammals, as well as the studies of Washburn andDetwiler (1943), Moss and Young (1960), and Moss(1961, 1973, 1979). The craniofunctional method hasalready been successfully applied in several human andnon-human primate studies (Pucciarelli et al., 1990,2000; Dressino and Pucciarelli, 1997; Sardi et al., 2004;Gonzalez-Jose et al., 2005).
Functional craniology assumes that a skull is com-posed of relatively independent skeletal units (SKUs)(modules). This means that cranial growth and differ-entiation are not uniform, because SKUs and relatedsoft tissues are integrated into independent FCCs. EachFCC was measured in length, width, and height. Scalingand size effects were avoided by simple and double z-standardization (Wilkinson and Engelman, 2002). Nor-mality of frequency distributions was tested by the one-sample KS test. Given the lack of significance obtainedin all comparisons, we assumed normality distributionfor all variables.
In all functional cranial studies, a certain discretiza-tion level of the skull needs to be chosen, dependingupon the aims of the study; the higher the discretizationlevel, the smaller the component size, and the greater thecomponent number. The masticatory component, forexample, was considered in toto for the purposes of thepresent study, but in a different study of higherdiscretization level, the temporal–mandibular joint andtheir osseous and dental environment were compared(Dubreuil and Buyle-Bodin, 1977). For the present, wechose two major components (neurocranium and face)enclosing four minor components each. In the neuro-cranium, the minor components are 1-anteroneural, 2-midneural, 3-posteroneural, and 4-otic. In the face, theminor components are 5-optic, 6-respiratory, 7-masti-catory, and 8-alveolar. We consider this model appro-
priate to perform a craniofunctional analysis on theentire cranium (except jaws) with the least number ofvariables (three orthogonals per component). The modelis suitable for obtaining specific information fromdefinite components, without incurring excessivelycomplex information. In all crania, 30 functionalvariables were measured. Three major-component in-dices were employed to evaluate size and shape variationin both the neurocranium and the face. The neurocra-nial (NVI) and the facial (FVI) volumetric indices(VIx) measured size plus shape, and the neurofacialindex (NFI) one, facialization or encephalization(Tables 1and 2).
Most of the encephalization measurements are basedon quotients. The most commonly used quotient is therate between brain volume and body weight. This mayalso be achieved by several neurocranial measurementsrelated to body weight as taken for prosimians (Bauchotand Stephan, 1966), and anthropoids (Bauchot andStephan, 1969; McHenry, 1976, 1988; Hartwig-Scherer,1993; Ruff et al., 1997; McHenry and Coffing, 2000).
For this study, the NFI was chosen for two reasons.First, this is usually employed in craniofunctionalstudies, allowing us to compare results from differentinvestigations. Second, it was the most accuratepossibility, because information about extra-cranialvariables of our samples was lacking. The NFI is infact a morphometric index, because it expresses shapevariation in terms of neurocranial content per unit offace. A skull of NFI ¼ 2.0 means that the neurocraniumis two times greater than the face. We chose thestandardized neurofacial index (SNFI), i.e., with theeffects of size and scaling removed, for measuringencephalization.
The general formula for calculating VIx is
VIx ¼ffiffiffiffiffiffiffiffiffiffiffiffiffiffiffiffiffiffiffiffiffiffiffiffiffi
LxnWxnHx3p
with Lx being the length, Wx the width, and Hx theheight of each major or minor component. A measure ofthe overall cranial size (TVI) is obtained by the sum ofboth major components:
TVI ¼ NVIþ FVI
The general formula for calculating the NFI is
NFI ¼ NVI=FVI
The major and minor component VIx measure sizeplus shape before standardization, and only shape afterstandardization.
According to Harvey and Read (1988), ‘‘cross-taxonomic comparisons not only reveal the diversity,but help us to understand it. But, how can they help usand what have they told us so far?’’ These authorsenumerate three steps of the cross-taxon interpretation.The most relevant for our subject is to remove theinfluence of confounding variables as, e.g., body size.
ARTICLE IN PRESS
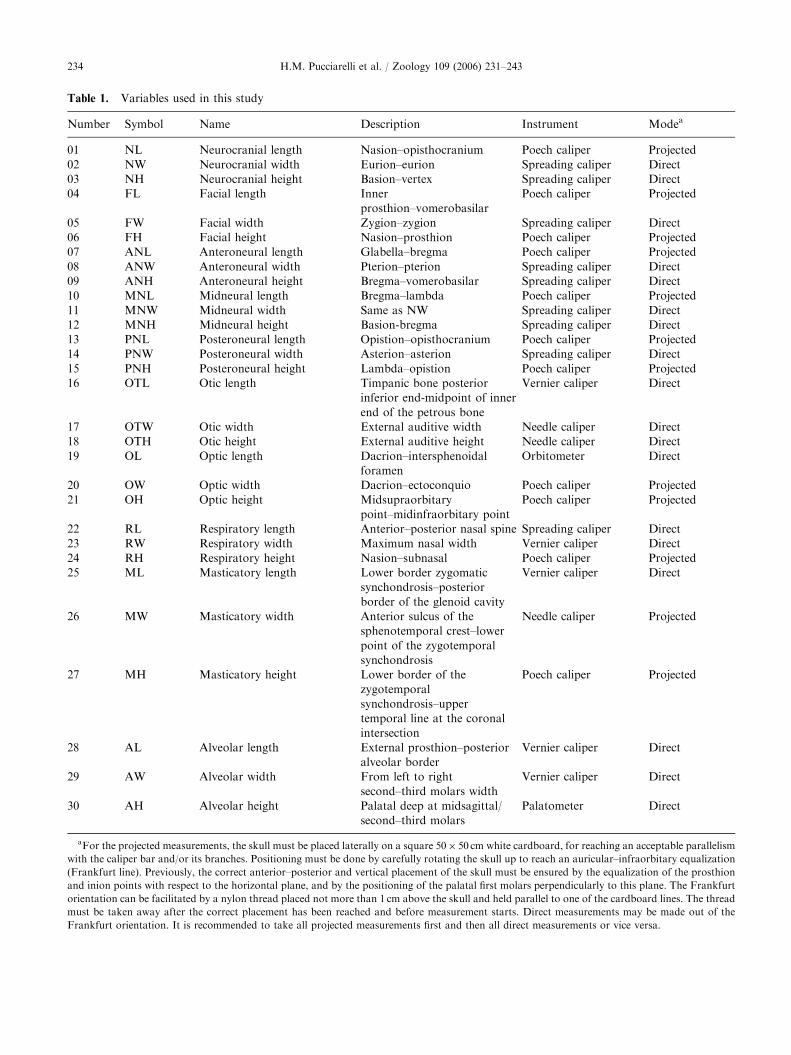
Table 1. Variables used in this study
Number Symbol Name Description Instrument Modea
01 NL Neurocranial length Nasion–opisthocranium Poech caliper Projected
02 NW Neurocranial width Eurion–eurion Spreading caliper Direct
03 NH Neurocranial height Basion–vertex Spreading caliper Direct
04 FL Facial length Inner
prosthion–vomerobasilar
Poech caliper Projected
05 FW Facial width Zygion–zygion Spreading caliper Direct
06 FH Facial height Nasion–prosthion Poech caliper Projected
07 ANL Anteroneural length Glabella–bregma Poech caliper Projected
08 ANW Anteroneural width Pterion–pterion Spreading caliper Direct
09 ANH Anteroneural height Bregma–vomerobasilar Spreading caliper Direct
10 MNL Midneural length Bregma–lambda Poech caliper Projected
11 MNW Midneural width Same as NW Spreading caliper Direct
12 MNH Midneural height Basion-bregma Spreading caliper Direct
13 PNL Posteroneural length Opistion–opisthocranium Poech caliper Projected
14 PNW Posteroneural width Asterion–asterion Spreading caliper Direct
15 PNH Posteroneural height Lambda–opistion Poech caliper Projected
16 OTL Otic length Timpanic bone posterior
inferior end-midpoint of inner
end of the petrous bone
Vernier caliper Direct
17 OTW Otic width External auditive width Needle caliper Direct
18 OTH Otic height External auditive height Needle caliper Direct
19 OL Optic length Dacrion–intersphenoidal
foramen
Orbitometer Direct
20 OW Optic width Dacrion–ectoconquio Poech caliper Projected
21 OH Optic height Midsupraorbitary
point–midinfraorbitary point
Poech caliper Projected
22 RL Respiratory length Anterior–posterior nasal spine Spreading caliper Direct
23 RW Respiratory width Maximum nasal width Vernier caliper Direct
24 RH Respiratory height Nasion–subnasal Poech caliper Projected
25 ML Masticatory length Lower border zygomatic
synchondrosis–posterior
border of the glenoid cavity
Vernier caliper Direct
26 MW Masticatory width Anterior sulcus of the
sphenotemporal crest–lower
point of the zygotemporal
synchondrosis
Needle caliper Projected
27 MH Masticatory height Lower border of the
zygotemporal
synchondrosis–upper
temporal line at the coronal
intersection
Poech caliper Projected
28 AL Alveolar length External prosthion–posterior
alveolar border
Vernier caliper Direct
29 AW Alveolar width From left to right
second–third molars width
Vernier caliper Direct
30 AH Alveolar height Palatal deep at midsagittal/
second–third molars
Palatometer Direct
aFor the projected measurements, the skull must be placed laterally on a square 50� 50 cm white cardboard, for reaching an acceptable parallelism
with the caliper bar and/or its branches. Positioning must be done by carefully rotating the skull up to reach an auricular–infraorbitary equalization
(Frankfurt line). Previously, the correct anterior–posterior and vertical placement of the skull must be ensured by the equalization of the prosthion
and inion points with respect to the horizontal plane, and by the positioning of the palatal first molars perpendicularly to this plane. The Frankfurt
orientation can be facilitated by a nylon thread placed not more than 1 cm above the skull and held parallel to one of the cardboard lines. The thread
must be taken away after the correct placement has been reached and before measurement starts. Direct measurements may be made out of the
Frankfurt orientation. It is recommended to take all projected measurements first and then all direct measurements or vice versa.
H.M. Pucciarelli et al. / Zoology 109 (2006) 231–243234

ARTICLE IN PRESS
Table 2. Indices used in this study
Symbol Formula Description
Major components
NVI NVI ¼ffiffiffiffiffiffiffiffiffiffiffiffiffiffiffiffiffiffiffiffiffiffiffiffiffiffiffiffiffi
NLnNWnNH3p
Neurocranial volumetric index
FVI FVI ¼ffiffiffiffiffiffiffiffiffiffiffiffiffiffiffiffiffiffiffiffiffiffiffiffiffiffiffi
FLnFWnFH3p
Facial volumetric index
NFI NFI ¼ NVI/FVI Neurofacial index (morphometric)
Minor components
ANVI ANVI ¼ffiffiffiffiffiffiffiffiffiffiffiffiffiffiffiffiffiffiffiffiffiffiffiffiffiffiffiffiffiffiffiffiffiffiffiffiffiffiffiffiffi
ANLnANWnANH3p
Anteroneural volumetric index
MNVI MNVI ¼ffiffiffiffiffiffiffiffiffiffiffiffiffiffiffiffiffiffiffiffiffiffiffiffiffiffiffiffiffiffiffiffiffiffiffiffiffiffiffiffiffiffiffiffi
MNLnMNWnMNH3p
Midneural volumetric index
PNVI PNVI ¼ffiffiffiffiffiffiffiffiffiffiffiffiffiffiffiffiffiffiffiffiffiffiffiffiffiffiffiffiffiffiffiffiffiffiffiffiffiffi
PNLnPNWnPNH3p
Posteroneural volumetric index
OTVI OTVI ¼ffiffiffiffiffiffiffiffiffiffiffiffiffiffiffiffiffiffiffiffiffiffiffiffiffiffiffiffiffiffiffiffiffiffiffiffiffiffi
OTLnOTWnOTH3p
Otic volumetric index
OVI OVI ¼ffiffiffiffiffiffiffiffiffiffiffiffiffiffiffiffiffiffiffiffiffiffiffiffiffiffiffiffiffi
OLnOWnOH3p
Optic volumetric index
RVI RVI ¼ffiffiffiffiffiffiffiffiffiffiffiffiffiffiffiffiffiffiffiffiffiffiffiffiffiffiffiffiffi
RLnRWnRH3p
Respiratory volumetric index
MVI MVI ¼ffiffiffiffiffiffiffiffiffiffiffiffiffiffiffiffiffiffiffiffiffiffiffiffiffiffiffiffiffiffiffiffi
MLnMWnMH3p
Masticatory volumetric index
AVI AVI ¼ffiffiffiffiffiffiffiffiffiffiffiffiffiffiffiffiffiffiffiffiffiffiffiffiffiffiffiffiffi
ALnAWnAH3p
Alveolar volumetric index
1.0
1.5
2.0
2.5
3.0
neur
ofac
ial r
atio
s
H.M. Pucciarelli et al. / Zoology 109 (2006) 231–243 235
Body size variation may affect between-taxa compar-isons, because many biological features vary because of
body size changes. This also applied to our platyrrhine-catarrhine comparisons, because body weight may be upto eighty times greater in Gorilla than in Saimiri. Is thelarge Gorilla cranium the product of selection or ofscaling? Since size and scaling can mask the effect ofinterest in our study, all indices were standardized. Inpractice, standardization was obtained by: (1) z-stan-dardization by rows, (2) transposing the data matrix, (3)z-standardization by columns, and (4) second datamatrix transposition and merge.
All between-group Mahalanobis D2 distances for allVI and NFI samples were calculated. These values wereused in the NVI and FVI graphics of bars and in allminor component comparisons, with their respectivemeaning (positive or negative) and significance(**pp0.01). Linear regressions were also done, withNFI or SNFI in the ordinate axis, and TVI or STVI inthe abscissa. The Kruskall–Wallis non-parametric testwas employed to check if SNFI and SVI datastill remained significant after standardization. Thestatistical analyses were done with Systat 10.2 andStatistica 6.0.
0 100 200 300
TVI
0.0
0.5
Fig. 1. Linear regressions between overall cranial size (TVI) on
the abscissa and both the raw (o—upper line) and standardized
(x—lower line) neurofacial index ratios. While the upper line is
significantly decreasing, the lower line is slightly and non-
significantly increasing.
Results
Size and scaling effects
The simple regression between the non-SNFI and thenon-standardized total volumetric index (TVI) indicateda strong allometric relationship between size andencephalization (b ¼ 2184:1 � �). The fraction ex-plained by the adjusted squared multiple r was not so
strong (r2 ¼ 0:52). This indicated that little more than50% of the SNFI variation was explained by scaling.The relatively low r2 was not striking, given the highdata dispersion resulting from the comparison of sixdifferent primate species in one data set. After NFIstandardization (SNFI), the relationship between bothindices was non-significant (Fig. 1).
After both, NFI and TVI standardization, the simpleregression indicated a moderate but significant relation-ship between shape and encephalization (b ¼ 26:5 � �).
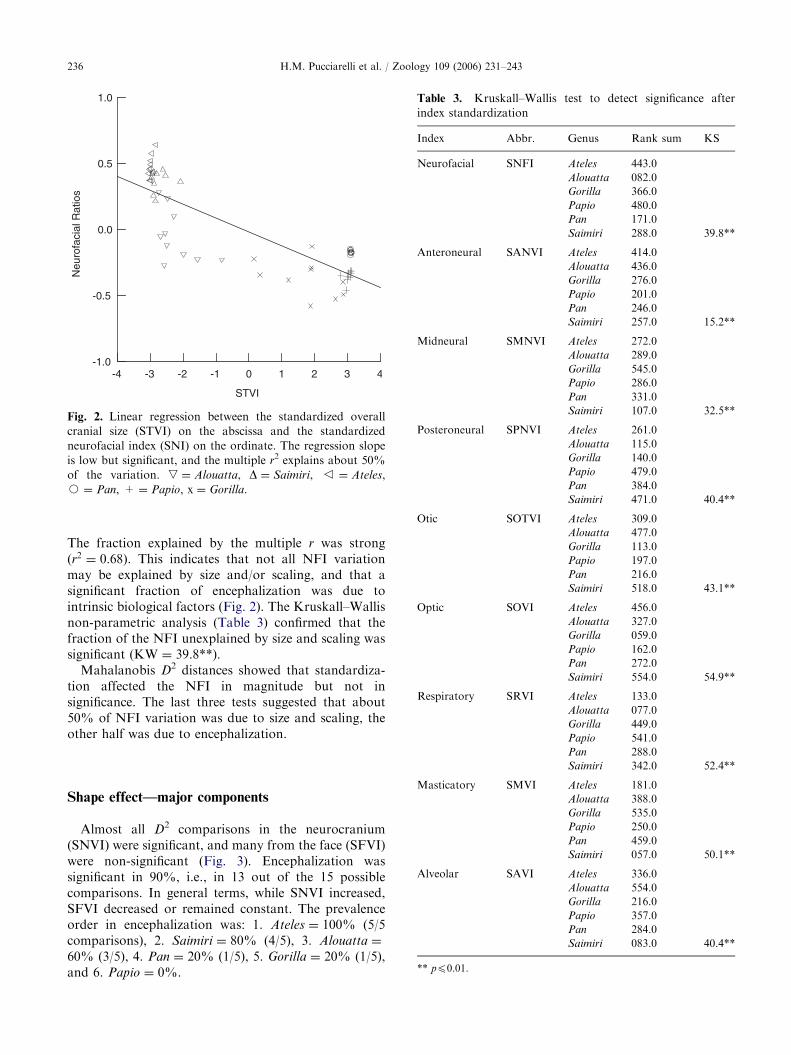
ARTICLE IN PRESS
-4 -3 -2 -1 0 1 2 3 4
STVI
-1.0
-0.5
0.0
0.5
1.0
Neu
rofa
cial
Rat
ios
Fig. 2. Linear regression between the standardized overall
cranial size (STVI) on the abscissa and the standardized
neurofacial index (SNI) on the ordinate. The regression slope
is low but significant, and the multiple r2 explains about 50%
of the variation. , ¼ Alouatta, D ¼ Saimiri, v ¼ Ateles,
J ¼ Pan, + ¼ Papio, x ¼ Gorilla.
Table 3. Kruskall–Wallis test to detect significance after
index standardization
Index Abbr. Genus Rank sum KS
Neurofacial SNFI Ateles 443.0
Alouatta 082.0
Gorilla 366.0
Papio 480.0
Pan 171.0
Saimiri 288.0 39.8**
Anteroneural SANVI Ateles 414.0
Alouatta 436.0
Gorilla 276.0
Papio 201.0
Pan 246.0
Saimiri 257.0 15.2**
Midneural SMNVI Ateles 272.0
Alouatta 289.0
Gorilla 545.0
Papio 286.0
Pan 331.0
Saimiri 107.0 32.5**
Posteroneural SPNVI Ateles 261.0
Alouatta 115.0
Gorilla 140.0
Papio 479.0
Pan 384.0
Saimiri 471.0 40.4**
Otic SOTVI Ateles 309.0
Alouatta 477.0
Gorilla 113.0
Papio 197.0
Pan 216.0
Saimiri 518.0 43.1**
Optic SOVI Ateles 456.0
Alouatta 327.0
Gorilla 059.0
Papio 162.0
Pan 272.0
Saimiri 554.0 54.9**
Respiratory SRVI Ateles 133.0
Alouatta 077.0
Gorilla 449.0
Papio 541.0
H.M. Pucciarelli et al. / Zoology 109 (2006) 231–243236
The fraction explained by the multiple r was strong(r2 ¼ 0:68). This indicates that not all NFI variationmay be explained by size and/or scaling, and that asignificant fraction of encephalization was due tointrinsic biological factors (Fig. 2). The Kruskall–Wallisnon-parametric analysis (Table 3) confirmed that thefraction of the NFI unexplained by size and scaling wassignificant (KW ¼ 39.8**).
Mahalanobis D2 distances showed that standardiza-tion affected the NFI in magnitude but not insignificance. The last three tests suggested that about50% of NFI variation was due to size and scaling, theother half was due to encephalization.
Pan 288.0
Saimiri 342.0 52.4**
Masticatory SMVI Ateles 181.0
Alouatta 388.0
Gorilla 535.0
Papio 250.0
Pan 459.0
Saimiri 057.0 50.1**
Alveolar SAVI Ateles 336.0
Alouatta 554.0
Gorilla 216.0
Papio 357.0
Pan 284.0
Saimiri 083.0 40.4**
** pp0.01.
Shape effect—major components
Almost all D2 comparisons in the neurocranium(SNVI) were significant, and many from the face (SFVI)were non-significant (Fig. 3). Encephalization wassignificant in 90%, i.e., in 13 out of the 15 possiblecomparisons. In general terms, while SNVI increased,SFVI decreased or remained constant. The prevalenceorder in encephalization was: 1. Ateles ¼ 100% (5/5comparisons), 2. Saimiri ¼ 80% (4/5), 3. Alouatta ¼
60% (3/5), 4. Pan ¼ 20% (1/5), 5. Gorilla ¼ 20% (1/5),and 6. Papio ¼ 0%.

ARTICLE IN PRESS
0
10
20
30
40
50
60
01)Ss-As
02)Ss-Ap
03)As-Ap
04)Pp-Pt
05)Pp-Gg
06)Pt-Gg
07)Ss-Pp
08)Ss-Pt
09)Ss-Gg
10)As-Pp
11)As-Pt
12)As-Gg
13)Ap-Pp
14)Ap-Pt
15)Ap-Gg
(a) Standardized NVI
10
20
30
40
50
60
0
10
20
30
40
50
60
dist
ance
dist
ance
dist
ance
01)Ss-As
02)Ss-Ap
03)As-Ap
04)Pp-Pt
05)Pp-Gg
06)Pt-Gg
07)Ss-Pp
08)Ss-Pt
09)Ss-Gg
10)As-Pp
11)As-Pt
12)As-Gg
13)Ap-Pp
14)Ap-Pt
15)Ap-Gg
(b) Standardized FVI
10
20
30
40
50
60
dist
ance
Fig. 3. Standardized neurocranial (NVI) and facial (FVI)
volumetric index bars. Gray bars ¼ pp0.01. White
bars ¼ non-significant differences (p40.01). Ss ¼ Saimiri
sciureus, As ¼ Alouatta seniculus, Ap ¼ Ateles paniscus,
Pp ¼ Papio papio, Pt ¼ Pan troglodytes, Gg ¼ Gorilla gorilla.
H.M. Pucciarelli et al. / Zoology 109 (2006) 231–243 237
Shape effect—minor components
Platyrrhine comparisons
When Saimiri were compared to Alouatta, a greaterSNFI of Saimiri associated with increased posteroneuraland optic components, and with two strongly decreasedfacial (masticatory and alveolar) components (Fig. 4a,bars 1, 4, 6, 8, 9). The lower SNFI of Saimiri as comparedto Ateles was also associated with an increased respiratorycomponent in Saimiri (Fig. 4b, bars 1, 7). In theAlouatta–Ateles comparison, the greater SNFI of Ateles
was due to its enlarged posteroneural and midneuralcomponents. In the same comparison, Alouatta showed adecrement in the anteroneural component, and anincrement in the masticatory and the alveolar component(Fig. 4c, bars 1–4, 8, 9).
Catarrhine comparisons
In the Papio–Pan comparison, there were significantdifferences of SNFI and the posteroneural componentwas larger in Pan, while the other components weregreater in Papio, except for the non-significant mastica-tory and alveolar components (Fig. 4d, bars 1–7). In thePapio–Gorilla comparison, there were significant differ-ences of SNFI and the midneural component was largerin Gorilla, while the otic component was greater in Papio
(Fig. 4e, bars 1, 3, 5). There were no significant SNFIdifferences between Pan and Gorilla. The posteroneuraland optic components were greater in Pan, while therespiratory and masticatory components were greater inGorilla (Fig. 4f, bars 1, 4, 6–8).
Platyrrhine–catarrhine comparisons
The between-group comparisons showed larger SNFIin platyrrhines (Figs. 4g–o) and a higher differentiationof components in general. Saimiri showed a greaterSNFI and optic component than Papio, which in turnhad larger respiratory and alveolar components (Fig. 4g,bars 1, 6, 7, 9). Saimiri showed greater SNFI,anteroneural, otic and optic components than Pan,which, in turn, had its midneural component morestrongly developed (Fig. 4h, bars 1–3, 5, 6). In theSaimiri–Gorilla comparison, SNFI, anteroneural andoptic components were greater in Saimiri whereasGorilla showed greater midneural, masticatory andalveolar components (Fig. 4i, bars 1–3, 6, 8, 9). Alouatta
showed greater SNFI, anteroneural, midneural, otic,masticatory and alveolar increments, while Papio hadgreater posteroneural and respiratory components (Fig.4j, bars 1–5, 7–9). Alouatta had greater SNFI, ante-roneural, midneural, otic, and optic increments, whilePan showed greater posteroneural and masticatorycomponents (Fig. 4k, bars 1–6, 8). Alouatta had greaterSNFI, anteroneural, otic, and alveolar components,while Gorilla showed greater midneural and poster-oneural ones (Fig. 4l, bars 1–5, 9). Ateles showed greaterSNFI and otic components than Papio, while the latterhad larger respiratory, masticatory and alveolar com-ponents (Fig. 4m, bars 1, 5, 7–9). Ateles had greaterSNFI and anteroneural, posteroneural, otic and opticcomponents than Pan (Fig. 4n, bars 1, 2, 4–6). Ateles
had greater SNFI and otic component than Gorilla,while the latter had greater midneural and respiratorycomponents (Fig. 4o, bars 1, 3, 5, 7).
Discussion
A clear difference in variability patterns betweentaxonomic categories emerged from our study. Accord-ing to Preuschoft (1989), this may be due to the influenceof specific demands, such as locomotion, food acquisi-

ARTICLE IN PRESS
0
10
20
30
dist
ance
1-SNFI
2-SANVI
3-SMNVI
4-SPNVI
5-SOTVI
6-SOVI
7-SRVI
8-SMVI
9-SAVI
(a) Saimiri - Alouatta
10
20
30
dist
ance
dist
ance
dist
ance
dist
ance
dist
ance
dist
ance
dist
ance
dist
ance
dist
ance
dist
ance
dist
ance
dist
ance
dist
ance
dist
ance
dist
ance
0
10
20
30
1-SNFI
2-SANVI
3-SMNVI
4-SPNVI
5-SOTVI
6-SOVI
7-SRVI
8-SMVI
9-SAVI
(b) Saimiri - Ateles
10
20
30
0
10
20
30
1-SNFI
2-SANVI
3-SMNVI
4-SPNVI
5-SOTVI
6-SOVI
7-SRVI
8-SMVI
9-SAVI
(c) Alouatta - Ateles
0
10
20
30
0
10
20
30
1-SNFI
2-SANVI
3-SMNVI
4-SPNVI
5-SOTVI
6-SOVI
7-SRVI
8-SMVI
9-SAVI
(d) Papio - Pan
0
10
20
30
0
10
20
30
1-SNFI
2-SANVI
3-SMNVI
4-SPNVI
5-SOTVI
6-SOVI
7-SRVI
8-SMVI
9-SAVI
(e) Papio - Gorilla
0
10
20
30
0
10
20
30
1-SNFI
2-SANVI
3-SMNVI
4-SPNVI
5-SOTVI
6-SOVI
7-SRVI
8-SMVI
9-SAVI
(f) Pan - Gorilla
0
10
20
30
0
10
20
30
1-SNFI
2-SANVI
3-SMNVI
4-SPNVI
5-SOTVI
6-SOVI
7-SRVI
8-SMVI
9-SAVI
(g) Saimiri - Papio
0
10
20
30
0
10
20
30
1-SNFI
2-SANVI
3-SMNVI
4-SPNVI
5-SOTVI
6-SOVI
7-SRVI
8-SMVI
9-SAVI
(h) Saimiri - Pan
10
20
30
Fig. 4. Craniograms based on the SVNI and SVFI D2 distances between each minor functional component, through all possible
comparisons (a–o). Gray bars ¼ pp0.01. White bars ¼ non-significant differences (p40.01). Abbreviations as listed in Table 2.
H.M. Pucciarelli et al. / Zoology 109 (2006) 231–243238
tion and processing, and intraspecific fighting. Theinfluence of food on cranial differentiation was demon-strated by Beecher et al. (1983). They showed thatdietary consistency affected palatal arching, teethcrowding, and the cranial growth and mineralizationof Saimiri. Also, Anapol and Lee (1994) studied severalmorphological changes in dental and palatal structuresin platyrrhines, related either to frugivory, folivory, oromnivory. According to Shea (1983), most of thevariation seen in the ape skull relates to the extensionof a common growth trend. Consequently, we infer thatthe more general categories of differentiation, e.g., thosethat appear in the Simiiformes (Groves, 2001), are olderthan the specific differentiations that characterize thePlatyrrhini or Catarrhini.
The main reasons for including life history in ourstudies are: first, we add several relevant traits to thewell-known life history ontogenetic variables: the minorcraniofunctional components. Their function is to givegreater detail to the study of the cephalic and facialfunction as a group of related traits, closely linked,
according to Calder (1984), to brain size and encepha-lization. Second, it is possible, according to the earlystudies by Napier and Napier (1967), Schultz (1969) andLe Gross Clark (1971), to include all living primate taxa,like prosimians, New and Old World monkeys, apes andhumans, in the context of life history studies (Watts,1990). Third, traits as those employed here support thenew concept of life history mode (Leigh and Bernstein,2004). This would allow biologists and anthropologiststo reconstruct trends based on given sets of ontogeneticvariables, many of them linked to the minor FCCs.
The within- and between-group comparisons suggestdifferent functional features of size-corrected minorcomponents (SVIx), as well as that of the SNFI.Encephalization showed a defined trend, since theSNFI sequence was in the following order: Ateles4Saimiri4Alouatta4Pan ¼ Gorilla4Papio. The highposition found for Saimiri coincides with Hartwig’sobservation (1995) who found that Saimiri was the mostencephalized (brain weight/body weight) from a list of13 New World monkeys. In other words, platyrrhines

ARTICLE IN PRESS
0
10
20
30
1-SNFI
2-SANVI
3-SMNVI
4-SPNVI
5-SOTVI
6-SOVI
7-SRVI
8-SMVI
9-SAVI
(i) Saimiri - Gorilla
10
20
30
dist
ance
dist
ance
dist
ance
dist
ance
dist
ance
dist
ance
dist
ance
dist
ance
dist
ance
dist
ance
dist
ance
dist
ance
dist
ance
dist
ance
0
10
20
30
1-SNFI
2-SANVI
3-SMNVI
4-SPNVI
5-SOTVI
6-SOVI
7-SRVI
8-SMVI
9-SAVI
(j) Alouatta - Papio
0
10
20
30
0
10
20
30
1-SNFI
2-SANVI
3-SMNVI
4-SPNVI
5-SOTVI
6-SOVI
7-SRVI
8-SMVI
9-SAVI
(k) Alouatta - Pan
10
20
30
0
10
20
30
1-SNFI
2-SANVI
3-SMNVI
4-SPNVI
5-SOTVI
6-SOVI
7-SRVI
8-SMVI
9-SAVI
(l) Alouatta - Gorilla
10
20
30
0
10
20
30
1-SNFI
2-SANVI
3-SMNVI
4-SPNVI
5-SOTVI
6-SOVI
7-SRVI
8-SMVI
9-SAVI
(m) Ateles - Papio
10
20
30
0
10
20
30
1-SNFI
2-SANVI
3-SMNVI
4-SPNVI
5-SOTVI
6-SOVI
7-SRVI
8-SMVI
9-SAVI
(n) Ateles - Pan
10
20
30
0
10
20
30
1-SNFI
2-SANVI
3-SMNVI
4-SPNVI
5-SOTVI
6-SOVI
7-SRVI
8-SMVI
9-SAVI
(o) Ateles - Gorilla
10
20
30
Fig. 4. (Continued)
H.M. Pucciarelli et al. / Zoology 109 (2006) 231–243 239
are more encephalized than pongyds, and the lattermore than cercopithecids. Why are platyrrhines, whichare smaller in body size, more encephalized afterstandardization than the great non-human anthropoidsstudied here? Why do platyrrhines closely approach theencephalization values reached by humans rather thanpongyds?
The answer to the first question is heterochrony(Bogin, 2001). Here, the specific heterochronic effect isneoteny as defined by Gould (1977), i.e., the retardationof somatic development and perduration of somejuvenile characters (like the great head of platyrrhinesand men) into adulthood. These findings are inaccordance with Hartwig (1995) who found that Saimiri
ontogeny is longer compared to most New Worldmonkeys (except Ateles), and comparable to many OldWorld monkeys, such as Macaca, Cercocebus, andPapio.
Heterochrony in Saimiri was experimentally demon-strated by Ramirez Rozzi et al. (2005) in conditions oflow protein nutrition. Similar results were obtained byCole (1992) for Cebus apella in relation to earlymasticatory specializations. If heterochrony is true for
Saimiri and Cebus, we may suppose that this processwas shared by most platyrrhines. The answer to thesecond question is that neoteny also causes the greathead of humans at birth (Godfrey and Sutherland,1995). This fact led us to conclude that platyrrhines andmen have high encephalization coefficients because bothshared the same heterochronic effect, perhaps byevolutive convergence.
According to Anapol and Lee (1994) and Lewin(1998) there are two main nutritional strategies inprimates. One is mainly frugivorory and complementa-rily insectivory (practiced by Saimiri) or seed eating(practiced by Ateles). These animals are characterized bya short alveolar–masticatory complex and great braindevelopment. The other strategy is mainly frugivory andcomplementarily folivory. It is practiced by monkeys oflarge body size and a well-developed alveolar–mastica-tory apparatus (Harvey et al., 1987). We found it inAlouatta, Papio, and pongyds. Body size and braindevelopment are not necessarily associated with phylo-geny, e.g., Platyrrhines and men differ in body size butare similar in the degree of encephalization. Nutritionaldifferences do not relate to primate phylogeny either,

ARTICLE IN PRESSH.M. Pucciarelli et al. / Zoology 109 (2006) 231–243240
e.g., platyrrhines, like Alouatta and Cebus, belong to thesame dietary category as pongyds and cercopithecids. Itappears that insectivory and seed-eating are derivedcharacters, because they are shared by several large-brained and small-sized platyrrhine species.
According to several authors, chimpanzees (Good-man et al., 1994; Ruvolo, 1994) or chimpanzees andgorillas (McKenna and Bell, 1997) have to be includedinto Hominidae, while orangutans remain as pongyds.The main reason for this change is some genecharacteristics that place the former nearer to hominidsthan to pongyds. This, however, was disputed byMitteroecker et al. (2004) since they found, by meansof geometric morphometry techniques, that, whilepongyds share many apomorphies, humans remainclearly separated from the great apes by size and shapedifferences. We found, however, an argument in favor ofMcKenna and Bell (1997) criterion. Chimpanzees andgorillas were (a) largely more encephalized than Papio
but less than platyrrhines, and (b) there were no SNFIdifferences between chimpanzees and gorillas. Unfortu-nately, we could not study orangutans in order to arriveat a definitive conclusion. We also cannot explain whyhumans are about 20% more encephalized than theother hominids (chimpanzees and gorillas), and whyhumans are more- and chimpanzees and gorillas less-encephalized than platyrrhines.
Even though SNFI is a continuous character, we candetermine different levels of encephalization. There is ageneral level in which the Simiiformes (Groves, 2001) arehigher in SNFI than the prosimians. The second levelcharacterizes the section Platyrrhini, since the threespecies studied here were the most strongly encephalizednon-human anthropoids. The third level refers toHominoidea. Gorilla and Pan did not differ and theyare more encephalized than the cercopithecids, as Papio.
Another important trait in life history studies is thedevelopment of the alveolar–masticatory complex, sinceit is related to food acquisition and processing. Saimiri
and Ateles are less developed in masticatory andalveolar components than cercopithecids, which, inturn, are larger in body size than Alouatta. In thesecases, the masticatory configuration is related tonutrition and it may not depend upon phylogeneticrelationships. In platyrrhines, both feeding models arepresent while all catarrhines belong to the frugivor-ous–folivorous feeding style, although, according toMontagu (1960), some macaques occasionally includeinsects in their diets.
According to several authors (Harvey et al., 1987;Harvey, 1990; Lewin, 1998), there is a strong relationshipbetween body size, face size, nutrition, and encephaliza-tion. Small-sized monkeys have a high energetic demandper unit of body weight, therefore their food has to be lessin quantity and high in protein content (Montagu, 1960).The others, in contrast, process greater masses of low-
protein food, such as leaves and fruit, which they chewalmost continuously. The large body of Alouatta, forexample, corresponds to the ‘‘folivory model’’ of nutri-tion. Alouatta developed an appropriately large andstrong alveolar–masticatory complex, which is greaterthan those of Saimiri and Ateles, and still greater thanthose of the large-bodied Papio and Gorilla.
Leigh (1994) found a clear association between bodyweight, growth, and diet. Folivory animals grew fasterand in a shorter period of time than insectivores.Furthermore, Leigh and Shea (1996) showed thatinter-generic variation in size is a consequence ofdifferences in the rate of body weight growth. Thischaracteristic may also be functionally associated to alonger digestive tract (necessary for leaf digestion), withthe consequently greater body size in folivories.
Encephalization was not associated to body sizebecause the most encephalized non-human anthropoidwas the smallest in size. Even Alouatta, which has one ofthe largest bodies, was not more encephalized(SNFI ¼ 1.25) than the smaller Saimiri (SNFI ¼ 1.53)and Ateles (SNFI ¼ 1.65). This indicates that encepha-lization responds to other factors than body size and/ornutrition. It is worth to note that the strong encepha-lization in platyrrhines is accompanied by the develop-ment of the anteroneural, otic, and optic components. Itis tempting to suggest that encephalization in platyr-rhines results from the strong development of these threeminor components, which would indicate a derivedplatyrrhine character not shared by catarrhines. Ininsectivores as Saimiri, the development of the visualorgan can be related to finding prey. We consider thiswell-developed trait as a property of the New and allOld World monkeys. The well-developed auditory senseof Alouatta may be correlated with phonation andconsidered a derived character shared by most New andOld World monkeys. The strong alveolar–masticatorycomplex may be related to chewing hard food and,consequently, it is a character of large-sized anthro-poids, not shared by insectivores and humans.
Ackermann (2002) postulated that all hominoidsshare a general pattern of facial variation, althoughsome specific patterns may diverge according to thephylogenetic relationships among the species. The highvariability of the respiratory component was describedby Eckhardt (1987). He found extensive polymorphismin the nasal region of several hominoid taxa. This agreedwith the different nasal growth patterns found byLosken et al. (1994), who described different shapes inhumans and catarrhines. We found that the respiratorycomponent was more developed in Papio than inSaimiri, Ateles, Alouatta, and Pan, differing in almost60% of the comparisons. A large respiratory componentcan be defined as a general character of catarrhines,since it seems not to be shared by any New Worldspecies.

ARTICLE IN PRESSH.M. Pucciarelli et al. / Zoology 109 (2006) 231–243 241
The facial variability found here may be related tohigh strain areas located along the mandible, zygomaticarch, and postorbital, orbital, and interorbital regions(Hylander and Johnson, 1992). Similarly, Losken et al.(1992) showed high variability for the masticatorycomponent. They found that mandibular growth wasdifferently modeled in mammals: at least three clusterscould be discerned, the first for Homo, Pan, and Rhesus,the second for baboons, and the third for non-primatemammalians. We found two alveolar–masticatoryshapes associated with the two main kinds of primatefeeding. The first was associated with the insectivory andseed-eating model (Saimiri, Ateles), where the alveo-lar–masticatory complex is relatively small. The secondwas associated with the folivory model, by which someplatyrrhines and all catarrhines developed a largealveolar–masticatory apparatus, due to the continuousleaf and fruit chewing. Therefore, the alveolar–mastica-tory complex may be associated with different dietarymodels as well as with systematic differences.
Several authors (Relethford, 2002; Roseman, 2004;Roseman and Weaver, 2004) proposed that in modernhumans, genetic neutralism explains most of theneurocranial variation, while face variation may begoverned by evolutionary forces. This criterion is basedon genetical studies made on neutral loci, in which thewithin-group diversity was greater than the between-group diversity. The face, in contrast, may vary becauseof selection and other factors, e.g., gene flow and drift.From the point of view of life history, we think that thedifferential cranial–facial behavior is an interestingsubject. If the neutral neurocranial variation is restrictedto humans, then it is a species-dependent model of anadaptive trend, because it would not affect the remain-ing anthropoids. If, however, it involves other primates,then it may be considered a family-dependent variationfactor, and the neurocranial stochastic variation will berelevant for all anthropoid life histories. If we accept thelatter point of view, then different variation patterns areexpected in both major components. This was not thecase in the present study, since non-significant differ-ences (w2 ¼ 0.64, p40.05) were found when comparingthe neurocranial proportion of variation (50%) withthat of the face (57%). We conclude that the neutralistvariability model for the neurocranium encompass aderived character of humans, not shared by the otheranthropoids.
Conclusions
Both hypotheses were accepted because (1) we foundno random variation between FCCs in the speciesstudied. Skull-component diversification followed defi-nite patterns for general and derived traits. They were
seen in both within-taxa (Platyrrhini or Catarrhini) andbetween-taxa (Platyrrhini and Catarrhini) comparisons.(2) Encephalization being a continuous trait, it waspossible to discontinue it in a binomial character,around to a SNFIx ¼ 1.2070.02. On the one hand,there were the least encephalized, as cercopithecids andpongyds (SNFIx ¼ 1.03). On the other hand were themost encephalized, as platyrrhines (SNFIx ¼ 1.48) andhumans (SNFIx ¼ 1.89). Low encephalized anthropoidsare large-bodied quadrupedal or brachiators, linkedmostly to a folivory nutrition and an arboreal life. Highencephalized anthropoids demand a more complexexplanation. The small-bodied insectivores and thelarge-bodied frugivores are linked mostly to arboreallife (platyrrhines). Humans, in contrast, are large-bodiedterrestrial omnivores, who share a high encephalizationdegree with the New World monkeys. This fact may beexplained by heterochrony, because both groups showan early prenatal growth of the head and, consequently,a great encephalon in relation to body size at birth.
Acknowledgements
The authors are grateful to Ing. Ernesto A. Calderon(CICPBA) for his highly valuable assistance, and toMrs. Damiana C. Pucciarelli for the language correctionof the manuscript. We are also indebted to theauthorities and curators from the Museo de La Plata(Argentina), and the Musee National d’Histoire Natur-elle (Paris, France) for allowing us access to thecollections. This study was made possible by GrantsPID 30322000/85 (CONICET, Argentina); PID 3125/92(CONICET, Argentina) and Proyecto Binacional deCooperacion Internacional Argentino-Frances (CON-ICET-CNRS) Res.1069/27-06-01, and 1438/27-08-01.
References
Ackermann, R.A., 2002. Patterns of covariation in the
hominoid craniofacial skeleton: implications for paleoan-
thropological models. J. Hum. Evol. 42, 167–187.
Anapol, F., Lee, S., 1994. Morphological adaptation to diet in
Platyrrhine primates. Am. J. Phys. Anthropol. 94, 239–261.
Bauchot, R., Stephan, H., 1966. Donnees nouvelles sur
l’encephalisation des insectivores et des prosimiens. Mam-
malia 30, 160–196.
Bauchot, R., Stephan, H., 1969. Encephalisation et niveau
evolutif chez les simiens. Mammalia 33, 225–275.
Beecher, R.M., Corruccini, R.S., Freeman, M., 1983. Cranio-
facial correlates of dietary consistency in a nonhuman
primate. J. Craniofac. Genet. Dev. Biol. 3, 193–202.
Bennett, K.A., 1979. Fundamentals of Biological Anthropol-
ogy. Wm. C. Brown Company Publishers, Dubuque.
Bogin, B., 2001. The Growth of Humanity. Wiley–Liss, New
York.

ARTICLE IN PRESSH.M. Pucciarelli et al. / Zoology 109 (2006) 231–243242
Bolk, L., 1926a. On the problem of anthropogenesis. Proc.
Sect. Sci. Kon. Akad. Wetens. Amsterdam 29, 465–475.
Bolk, L., 1926b. La recapitulation ontogenetique comme
phenomene harmonique. Arch. Anat. Hist. Embryol. 5,
85–98.
Bromage, T.G., 1990. Early hominid development and life
history. In: De Rousseau, J.C. (Ed.), Primate Life History
and Evolution. Wiley–Liss Inc., New York, pp. 105–113.
Calder, W.A., 1984. Size, Function, and Life-History. Harvard
University Press, Cambridge.
Cole, T.M., 1992. Postnatal heterochrony of the masticatory
apparatus in Cebus apella and Cebus albifrons. J. Hum.
Evol. 23, 253–282.
Comas, J., 1966. Manual de Antropologıa Fısica. Universidad
Nacional Autonoma de Mexico, Mexico.
Derrickson, E.M., 1992. Comparative reproductive strategies
of altricial and precocial eutherian mammals. Funct. Ecol.
6, 57–65.
Dressino, V., Pucciarelli, H.M., 1997. Cranial growth in
Saimiri sciureus (Cebidae) and its alteration by nutritional
factors: a longitudinal study. Am. J. Phys. Anthropol. 102,
545–554.
Dubreuil, D., Buyle-Bodin, Y., 1977. Groupe de recherches sur
les bases de l’occlusion et de la mastication. J. Biol. Buccale
5, 291–310.
Eckhardt, R.B., 1987. Hominoid nasal region polymorphism
and its phylogenetic significance. Nature 328, 333–337.
Godfrey, L.R., Sutherland, M.R., 1995. What’s growth got to
do with it? Process and product in the evolution of
ontogeny. J. Hum. Evol. 29, 405–431.
Gonzalez-Jose, R., Ramirez Rozzi, F., Sardi, M., Martınez-
Abadıas, N., Hernandez, M., Pucciarelli, H.M., 2005. A
functional–cranial approach to the influence of economic
strategy on skull morphology. Am. J. Phys. Anthropol. 128,
757–771.
Goodman, M., Bailey, W.J., Haysaka, K., Stanhope, M.J.,
Slington, J., Czelusniak, J., 1994. Molecular evidence on
primate phylogeny from DNA sequences. Am. J. Phys.
Anthropol. 94, 3–24.
Gould, S.J., 1977. Ontogeny and Phylogeny. Harvard Uni-
versity Press, Cambridge.
Groves, C.P., 2001. Primate Taxonomy. Smithsonian Institute
Press, Washington.
Hartwig, W.C., 1995. Effect of life history on the squirrel
monkey (Platyrrhini, Saimiri) cranium. Am. J. Phys.
Anthropol. 97, 435–449.
Hartwig-Scherer, S., 1993. Body weight prediction in early
fossil hominids: towards a taxon-‘‘independent’’ approach.
Am. J. Phys. Anthropol. 92, 17–36.
Harvey, P.H., 1990. Life-history variation: size and mortality
patterns. In: De Rousseau, C.J. (Ed.), Primate Life History
and Evolution. Wiley–Liss, New York, pp. 181–188.
Harvey, P.H., Clutton-Brock, T.H., 1985. Life history varia-
tion in primates. Evolution 39, 559–581.
Harvey, P.H., Read, A.F., 1988. How and why do mammalian
life histories vary? In: Boyce, M.S. (Ed.), Evolution of Life
Histories of Mammals: Theory and Pattern. Yale Uni-
versity Press, New Haven, pp. 213–232.
Harvey, P.H., Martin, R.D., Clutton-Brock, T.H., 1987. Life
histories in comparative perspective. In: Smuts, B.B.,
Cheney, D.L., Seyfarth, R.M., Wrangham, R.W., Struhsa-
ker, T.T. (Eds.), Primate Societies. University of Chicago
Press, Chicago, pp. 181–196.
Hylander, W.L., Johnson, K.R., 1992. Strain gradients in the
craniofacial region of primates. In: Davidovitch, Z. (Ed.),
The Biological Mechanisms of Tooth Movement and
Craniofacial Adaptation. College of Dentistry of Ohio
State University, Ohio, pp. 559–569.
Klingenberg, C.P., Leamy, L.J., Cheverud, J.M., 2004.
Integration and modularity of quantitative trait locus
effects on geometric shape in the mouse mandible. Genetics
166, 1909–1921.
Le Gross Clark, W.E., 1971. The Antecedents of Man.
Edinburg University Press, Edinburg.
Leigh, S.R., 1994. Ontogenetic correlates of diet in anthropoid
primates. Am. J. Phys. Anthropol. 94, 499–592.
Leigh, S.R., Bernstein, R.M., 2004. Evolution of primate life
histories. Am. J. Phys. Anthropol. Suppl. 38, 134.
Leigh, S.R., Shea, B.T., 1996. Ontogeny of body size variation
in African apes. Am. J. Phys. Anthropol. 99, 43–65.
Lewin, R., 1998. Principles of Human Evolution. Blackwell
Science Ltd., Oxford.
Losken, A., Mooney, M.P., Siegel, M.I., 1992. A comparative
study of mandibular growth patterns in seven animal
models. J. Oral Maxillofac. Surg. 50, 409–495.
Losken, A., Mooney, M.P., Siegel, M.I., 1994. Comparative
cephalometric study of nasal cavity growth patterns in
seven animal models. Cleft Palate Craniofac. J. 31, 17–23.
Marino, L., 1998. A comparison of encephalization between
odontocete cetaceans and anthropoid primates. Brain,
Behavior and Evolution 51, 230–238.
McHenry, H.M., 1976. Early hominid body weight and
encephalization. Am. J. Phys. Anthropol. 45, 77–84.
McHenry, H.M., 1988. New estimates of body weight in early
hominids and their significance to encephalization and
megadontia in ‘‘robust’’ Australopithecines. In: Grine,
F.E., de Gruyter, A. (Eds.), Evolutionary History of the
‘‘Robust’’ Australopithecines. Gruyter, New York, pp.
133–148.
McHenry, H.M., Coffing, K., 2000. Australopithecus to
Homo: transformations in body and mind. Annu. Rev.
Anthropol. 29, 125–146.
McKenna, M.C., Bell, S.K., 1997. Classification of Mammals
Above the Species Level. Columbia University Press, New
York.
McKinney, M.L., 2002. Brain evolution by stretching the
global mitotic clock. In: Minugh-Purvis, N., McNamara,
K.J. (Eds.), Human Evolution Through Development
Change. John Hopkins University Press, Baltimore, pp.
1–508.
Mitteroecker, P., Gunz, P., Bernhard, M., Schaeffer, K.,
Bookstein, F.L., 2004. Comparison of cranial ontogenetic
trajectories among great apes and humans. J. Hum. Evol.
46, 679–698.
Montagu, M.F.A., 1960. An Introduction to Physical Anthro-
pology. Charles Thomas, Springfield.
Moss, M.L., 1961. Rotation of the otic capsule in bipedal rats.
Am. J. Phys. Anthropol. 19, 301–307.

ARTICLE IN PRESSH.M. Pucciarelli et al. / Zoology 109 (2006) 231–243 243
Moss, M.L., 1973. A functional cranial analysis of primate
craniofacial growth. In: The Symposium of the IVth
International Congress of Primatology, vol. 3, pp. 191–208.
Moss, M.L., 1979. Functional cranial analysis and the
functional matrix. Int. J. Orthodont. 17, 21–31.
Moss, M.L., Young, R.W., 1960. A functional approach to
craniology. Am. J. Phys. Anthropol. 18, 281–292.
Napier, J.R., Napier, P.H., 1967. A Handbook of Living
Primates: Morphology, Ecology and Behaviour in Nonhu-
man Primates. Academic Press, New York.
Noback, C.R., Moskowitz, N., 1962. Structural and functional
correlates of ‘‘encephalization’’ in the primate brain. Ann.
NY Acad. Sci. 102, 210–218.
O’Higgins, P., 1989. Developments in cranial morphometrics.
Folia Primatol. 53, 101–124.
Pianka, E.R., 1970. On r and K selection. Am. Nat. 104,
592–597.
Pianka, E.R., 1972. r and K selection or b and d selection. Am.
Nat. 106, 581–588.
Preuschoft, H., 1989. Quantitative approaches to primate
morphology. Folia Primatol. 53, 82–100.
Pucciarelli, H.M., Dressino, V., Niveiro, M.H., 1990. Changes
in skull components of the squirrel monkey evoked by
growth and nutrition: an experimental study. Am. J. Phys.
Anthropol. 81, 535–543.
Pucciarelli, H.M., Mune, M.C., Oyhenart, E.E., Orden, A.B.,
Villanueva, M.E., Rodriguez, R.R., Pons, E.R., 2000.
Growth of skeletal components of the young squirrel
monkey (Saimiri sciureus boliviensis): a longitudinal experi-
ment. Am. J. Phys. Anthropol. 112, 57–68.
Ramirez Rozzi, F.V., Gonzalez-Jose, R., Pucciarelli, H.M.,
2005. Cranial growth in normal and low-protein-fed
Saimiri. An environmental heterochrony. J. Hum. Evol.
49, 515–535.
Relethford, J.H., 2002. Apportionment of global human
genetic diversity based on craniometrics and skin color.
Am. J. Phys. Anthropol. 118, 393–398.
Roseman, C.C., 2004. Detecting interregionally diversifying
natural selection on modern human cranial form by using
matched molecular and morphometric data. Proc. Natl.
Acad. Sci. USA 101, 12824–12829.
Roseman, C.C., Weaver, T.D., 2004. Multivariate apportion-
ment of global human craniometric diversity. Am. J. Phys.
Anthropol. 125, 257–263.
Ruff, C.B., Trinkaus, E., Holliday, W., 1997. Body mass and
encephalization in Pleistocene Homo. Nature 387, 173–176.
Ruvolo, M., 1994. Molecular evolutionary processes and
conflicting gene trees: the hominoid case. Am. J. Phys.
Anthropol. 94, 89–113.
Sacher, G.A., 1982. The role of brain maturation in the
evolution of the primates. In: Armstrong, E., Falks, D.
(Eds.), Primate Brain Evolution. Plenum Press, New York,
pp. 97–112.
Sacher, G.A., Staffeldt, E.F., 1974. Relation of gestation time
to brain weight for placental mammals: implications for the
theory of vertebrate growth. Am. Anat. 108, 593–615.
Sardi, M.L., Ramirez Rozzi, F., Pucciarelli, H.M., 2004. The
Neolithic transition in Europe and North Africa. The
functional craniology contribution. Anthrop. Anz. 62,
129–145.
Schultz, A.H., 1969. The Life of Primates. Universe Books,
New York.
Shea, B.T., 1983. Size and diet in the evolution of African ape
craniodental form. Folia Primatol. 40, 32–68.
Smith, B.H., Tompkins, R.L., 1995. Toward a life-history of
the hominidae. Annu. Rev. Anthropol. 24, 257–279.
Smith, B.H., Crummett, T.L., Brandt, K.L., 1994. Ages of
eruption of primate teeth: a compendium for aging
individuals or comparing life histories. Yrb. Phys. Anthro-
pol. 37, 177–231.
Stock, D.W., 2001. The genetic basis of modularity in the
development and evolution of vertebrate dentition. Phil.
Trans. R. Soc. Lond. B 356, 1633–1653.
Trinkaus, E., Tompkins, R., 1990. The Neanderthal life-cycle:
the possibility, probability, and perceptibility of contrasts
with recent humans. In: De Rousseau, J.C. (Ed.), Primate
Life History and Evolution. Wiley–Liss Inc., New York,
pp. 153–158.
van der Klaauw, C.J., 1948–1952. Size and position of the
functional components of the skull. Arch. Neerl. Zool. 9,
1–559.
Washburn, S.L., Detwiler, S.R., 1943. An experimental
bearing on the problems of physical anthropology. Am. J.
Phys. Anthropol. 1, 171–190.
Watts, E.A., 1990. Evolutionary trends in primate growth and
development. In: De Rousseau, J.C. (Ed.), Primate Life
History and Evolution. Wiley–Liss Inc., New York, pp.
89–104.
Wilkinson, L., Engelman, L., 2002. Data Transformations.
Systat Software Inc., California, pp. 57–103.
Wolf, J.B., Frankino, W.A., Agrawal, A.F., Brodie, E.D.,
Moore, A.J., 2001. Developmental interactions and the
constituents of quantitative variation. Evolution 55,
232–245.