Developmental connections between cranial components and the emergence of the first permanent molar...
12
J. Anat. (2007) 210, pp406– 417 doi: 10.1111/j.1469-7580.2007.00701.x © 2007 The Authors Journal compilation © 2007 Anatomical Society of Great Britain and Ireland Blackwell Publishing Ltd Developmental connections between cranial components and the emergence of the first permanent molar in humans Marina L. Sardi and Fernando Ramírez Rozzi UPR 2147 Dynamique de l’Evolution Humaine, CNRS, Paris, France Abstract The age of emergence of the first molar (M1) is a developmental event correlated with many variables of primate life history, such as adult brain size. The evolution of human life history is characterized by the inclusion of child- hood, which takes place between weaning and M1 emergence. Children still depend on adults for nutrition due to their small digestive system and their immature brains. By contrast, juveniles are not dependent because of M1 emergence, which enables shifting to adult type diet, and attainment of nearly adult brain size. In this study, develop- mental connections between M1 emergence and growth of cranial components were explored in two ways in order to understand the developmental basis of their evolutionary connections: (1) differences in growth tra- jectories of cranial components with respect to M1 emergence and (2) differences between individuals with and without fully emerged M1. Growth of anteroneural, midneural, posteroneural, otic, optic, respiratory, masticatory and alveolar cranial components was analysed in human skulls of individuals aged 0–20 years and in an adult reference skull. Volumetric indices were calculated to estimate size. Two subsamples were selected in order to focus on the transition between deciduous and permanent dentition: those with full deciduous dentition and before M1 reaches the occlusal plane; and those who present M1 in full emergence and no other cheek-tooth at the occlusal plane. The principal results were as follows. (1) Trajectories fitted using the whole sample are characterized by an inflection point that takes place before M1 emergence for neural components and around M1 emergence for facial components. (2) Associations between growth and age tend to be strong in those with full deciduous dentition, and weak in those who present M1 in full emergence. (3) Individuals who present M1 in full emergence are larger than those with full deciduous dentition. (4) Growth of components linked to the central nervous system is not linear until M1 emergence. Individuals who present M1 in full emergence are only larger than individuals with full deciduous dentition by 4–5% of adult size. (5) The alveolar component does not show increments between full deciduous dentition and M1 emergence. (6) When volumetric indices were standardized by age, the growth trajectories of individuals with full deciduous dentition and of those with M1 were not decoupled. In general terms, M1 emergence does not show a strong association with growth of the components that may explain differ- ences in life histories. However, the main changes in neural and alveolar components occur in the first 3 years of life, which may be developmentally connected with M1 crown formation. Key words cranial components; developmental connections; M1. Introduction Craniofacial growth Craniofacial morphology is the result of several epi- genetic factors, such as inductions among cells and tissues, hormones, mechanical loads, and bioelectrical and biophysical events, acting at different structural levels (e.g. cells, tissues, organs) (Atchley & Hall, 1991; Correspondence Dr Marina L. Sardi. Present address: División Antropología, Museo de La Plata, Universidad Nacional de La Plata, Paseo del Bosque S/N 1900 La Plata, Argentina. T: +54 2214259161; E: [email protected]. Accepted for publication 12 January 2007
Transcript of Developmental connections between cranial components and the emergence of the first permanent molar...
J. Anat.
(2007)
210
, pp406–417 doi: 10.1111/j.1469-7580.2007.00701.x
© 2007 The AuthorsJournal compilation © 2007 Anatomical Society of Great Britain and Ireland
Blackwell Publishing Ltd
Developmental connections between cranial components and the emergence of the first permanent molar in humans
Marina L. Sardi and Fernando Ramírez Rozzi
UPR 2147 Dynamique de l’Evolution Humaine, CNRS, Paris, France
Abstract
The age of emergence of the first molar (M1) is a developmental event correlated with many variables of primate
life history, such as adult brain size. The evolution of human life history is characterized by the inclusion of child-
hood, which takes place between weaning and M1 emergence. Children still depend on adults for nutrition due
to their small digestive system and their immature brains. By contrast, juveniles are not dependent because of M1
emergence, which enables shifting to adult type diet, and attainment of nearly adult brain size. In this study, develop-
mental connections between M1 emergence and growth of cranial components were explored in two ways
in order to understand the developmental basis of their evolutionary connections: (1) differences in growth tra-
jectories of cranial components with respect to M1 emergence and (2) differences between individuals with and
without fully emerged M1. Growth of anteroneural, midneural, posteroneural, otic, optic, respiratory, masticatory
and alveolar cranial components was analysed in human skulls of individuals aged 0–20 years and in an adult
reference skull. Volumetric indices were calculated to estimate size. Two subsamples were selected in order to focus
on the transition between deciduous and permanent dentition: those with full deciduous dentition and before M1
reaches the occlusal plane; and those who present M1 in full emergence and no other cheek-tooth at the occlusal
plane. The principal results were as follows. (1) Trajectories fitted using the whole sample are characterized by an
inflection point that takes place before M1 emergence for neural components and around M1 emergence for facial
components. (2) Associations between growth and age tend to be strong in those with full deciduous dentition,
and weak in those who present M1 in full emergence. (3) Individuals who present M1 in full emergence are larger
than those with full deciduous dentition. (4) Growth of components linked to the central nervous system is not
linear until M1 emergence. Individuals who present M1 in full emergence are only larger than individuals with
full deciduous dentition by 4–5% of adult size. (5) The alveolar component does not show increments between
full deciduous dentition and M1 emergence. (6) When volumetric indices were standardized by age, the growth
trajectories of individuals with full deciduous dentition and of those with M1 were not decoupled. In general terms,
M1 emergence does not show a strong association with growth of the components that may explain differ-
ences in life histories. However, the main changes in neural and alveolar components occur in the first 3 years of
life, which may be developmentally connected with M1 crown formation.
Key words
cranial components; developmental connections; M1.
Introduction
Craniofacial growth
Craniofacial morphology is the result of several epi-
genetic factors, such as inductions among cells and
tissues, hormones, mechanical loads, and bioelectrical
and biophysical events, acting at different structural
levels (e.g. cells, tissues, organs) (Atchley & Hall, 1991;
Correspondence
Dr Marina L. Sardi. Present address: División Antropología, Museo de La Plata, Universidad Nacional de La Plata, Paseo del Bosque S/N 1900 La Plata, Argentina. T: +54 2214259161; E: [email protected].
Accepted for publication
12 January 2007
Craniofacial growth and M1 emergence, M. L. Sardi and F. Ramírez Rozzi
© 2007 The Authors Journal compilation © 2007 Anatomical Society of Great Britain and Ireland
407
Herring, 1993; Vogl et al. 1993; Moss, 1997a,b,c; Lieber-
man et al. 2004; Buschang & Hinton, 2005), for instance
by interactions between immediately adjacent tissues
during growth and interactions of cells within a unit
with the rest of the organism and with the environment.
The functional matrix hypothesis (Moss & Young, 1960;
Moss, 1973, 1997a,b,c) was one of the most important
theories to explain craniofacial growth on the basis of
interactions between adjacent tissues (Enlow & Hans,
1996; Lieberman et al. 2004). This hypothesis states
that cranial shape reflects its primary functions, namely
support and protection of the related functional tissues
and spaces (Moss & Young, 1960). It proposes that the
rate and direction of bone and cartilage growth are
not regulated by means of their own genetic controls.
Instead, bone is epigenetically modified by the growth
of the functional matrix associated with it (Moss, 1973,
1997c). Each function of the head, such as digestion or
vision, is performed by a functional cranial component
consisting of both a functional matrix and a skeletal
unit (Moss, 1973). All soft tissues, organs and cavities
necessary for carrying out a function comprise the
func-
tional matrix.
The assemblage of hard tissues (bone and
cartilage) and other associated soft tissues (tendons
and ligaments) that give biomechanical support to the
functional matrix constitutes the
skeletal unit
. At least
two major semi-independent modules or components
can be recognized in the skull: neurocranium and face.
These two components, and even different minor com-
ponents within them, differ in their growth patterns
and in the age of attainment of adult size (e.g. Enlow
& Hans, 1996; Smith, 1996; Humphrey, 1998; Miller &
German, 1999; VandeBerg et al. 2004a; Sardi & Ramírez
Rozzi, 2005). Growth of the neurocranium is affected
by brain growth (Delattre, 1951; Moss & Young, 1960;
Moss, 1973; Michejda, 1975; Sirianni, 1985; Hartwig,
1995), whereas the face is affected by the development
of airways, teeth and the associated muscular loadings
(Enlow & Hans, 1996; Herring, 1993). Cranial growth
occurs mainly at sutures and synchondroses (Enlow &
Hans, 1996; Opperman et al. 2005); bone remodelling
also accounts for part of the changes in size and shape.
Neural structures are more advanced with respect to
adult size than the facial structures (Buschang et al.
1983; Enlow & Hans, 1996; VandeBerg et al. 2004a).
Buschang et al. (1983) observed that the craniofacial
maturity intergrades between the neural and the
general patterns of growth; the neural pattern is char-
acterized by a steep increase of relative growth that
occurs prenatally, followed by a rapid deceleration,
whereas the general pattern is represented by a sig-
moid curve with greater relative growth during infancy
and adolescence (Buschang & Hinton, 2005). Sardi &
Ramírez Rozzi (2005) described growth trajectories of
eight functional cranial components and found that
neural and optic components show changes in growth
rates around 3 years of age whereas the respiratory,
masticatory and otic components show changes in
growth rates around 5 years of age, and the alveolar
component shows a decrease of growth rate around
age 3 years and a reacceleration after 14 years of age.
Dental development and its associations with
life-history variables
Dental development can be characterized by two vari-
ables: chronology and sequence of tooth formation
and emergence. In humans, the sequence of emerg-
ence of some teeth, such as P3 and P4, shows very
small variation among individuals (Smith & Garn, 1987)
and because this feature is under greater genetic con-
trol than other skeletal variables, it is the most accurate
estimator of chronological age (Meindl & Russel, 1998;
Hoppa & Fitzgerald, 1999; Konigsberg & Holman, 1999).
By contrast, important variability has been reported
in the chronology of tooth emergence, mainly in M3
(i.e. Garn & Moorrees, 1951; Garn et al. 1973; Lavelle,
1975), and in the relative calcification of teeth (Fanning
& Moorrees, 1969; Tompkins, 1996). Dental emergence,
in particular the emergence of permanent molars, offers
an excellent way to gauge the growth of individuals
because it is linked to the attainment of distinct somatic
and reproductive growth stages (Liversidge et al. 1993).
It has been used to delimit age classes in studies of
unknown-age individuals (Corner & Richtsmeier, 1991,
1992, 1993) and to establish reference stages in inter-
specific comparisons (Schultz, 1960; Swindler, 1985;
Smith, 1989; Smith et al. 1994; Bastir & Rosas, 2004).
The age of M1 emergence has been proposed to be
strongly correlated with life-history variables in inter-
specific comparisons. Life history has been defined as
the strategy of organisms for energy allocation during
their lifespan (Bogin, 1999), and it includes variables
referred to sequences of physiological, morphological
and behavioural change, such as lifespan, age at wean-
ing and fertility.
Human life history is divided into infancy, childhood,
juvenility, adolescence and adulthood (Bogin, 1997,

Craniofacial growth and M1 emergence, M. L. Sardi and F. Ramírez Rozzi
© 2007 The AuthorsJournal compilation © 2007 Anatomical Society of Great Britain and Ireland
408
1999). Ontogenetically, emergence of the deciduous
dentition occurs during infancy; weaning indicates the
end of this period and the onset of childhood. Accord-
ing to Bogin (1997, 1999), childhood is an ontogenetic
period that evolved in humans. During childhood,
humans are not capable of eating an adult type diet
because both the deciduous teeth and their digestive
system are small, while the brain grows rapidly to
attain most of its adult size; for these reasons, children
are still dependent on older people for feeding and
protection (Bogin, 1997). Humans progress into juvenil-
ity due to M1 emergence and to the completion of
brain growth (Bogin, 1997). In this sense, emergence of
the permanent dentition represents a milestone with
ecological implications, as it allows independence from
parents for nutrition (Smith, 1991; Bogin, 1999), associ-
ated with enhanced performance of neurological and
motor skills. In primates, Smith (1989, 1992) has com-
pared the age of M1 emergence with many reproduc-
tive variables and found strong positive correlations.
Similar results were found with respect to the age of
eruption of other permanent teeth and brain weight in
adult primates (Smith et al. 1994; Godfrey et al. 2001).
These close associations among life-history variables
led to the suggestion that M1 emergence is an impor-
tant developmental milestone in primate life history
(Bogin, 1999).
The purpose of this study was to explore structural
changes of cranial components with respect to M1
emergence throughout the postnatal ontogeny of
humans. The null hypothesis to be tested indicates that
there are connections between cranial growth and M1
emergence at the individual level, as can be observed
at the evolutionary level. According to Cheverud (1996),
developmental integration or connection occurs when
morphological elements interact during their forma-
tion or are directed by a common external source, such
as epigenetic interactions.
Developmental connections between cranial com-
ponents and M1 emergence were explored in two
ways. On the one hand, growth trajectories of differ-
ent cranial components with respect to M1 emergence
were observed. If M1 emergence is delayed in
humans and if it is associated with brain growth, then
a concomitant delay in the growth of those cranial
components linked to the central nervous system
would be expected; significant growth of the cranial
components associated with digestion, which would
prepare individuals for processing and consuming an
adult type diet, would also be expected. On the other
hand, size differences were observed between indi-
viduals with and without M1 in full emergence. If M1
emergence is connected with cranial growth, then
individuals showing M1 emergence would be expected
to differ in size from those individuals that do not
show M1.
Materials and methods
We measured a sample of 228 human skulls of known
age at death, with ages ranging from 0 to 20 years
(Table 1). The sample comprised 165 individuals of
Portuguese origin, housed at the University of Coimbra
(Portugal) and 63 individuals of French origin housed
at the Musée de l’Homme, Paris (France). Another 121
human skulls (63 males and 58 females) from the
Portuguese collection, with ages at death between
21 and 39 years, and showing closure of the spheno-
occipital synchondrosis and complete permanent
dentition, were added as adult references. Sex was
known for the adult sample and for most of the sub-
adults; those of unknown sex were mostly among
individuals of 0–5 years of age (Table 1).
Components were delimited in the skull according
to previous studies (Pucciarelli et al. 1990; Dressino &
Table 1 Frequencies of skulls by sex and age
Age (years) Unknown sex Females Males Total
0 30 0 0 301 2 0 0 22 5 2 1 83 0 1 1 24 4 1 1 65 3 0 0 36 0 0 1 17 2 6 3 118 3 5 5 139 1 2 2 510 2 6 3 1111 1 5 4 1012 0 9 3 1213 0 2 5 714 4 5 2 1115 2 8 10 2016 0 6 7 1317 1 14 8 2318 1 10 9 2019 0 6 5 1120 0 4 5 9Total 61 92 75 228

Craniofacial growth and M1 emergence, M. L. Sardi and F. Ramírez Rozzi
© 2007 The Authors Journal compilation © 2007 Anatomical Society of Great Britain and Ireland
409
Pucciarelli, 1999; González-José et al. 2005; Ramírez
Rozzi et al. 2005; Sardi & Ramírez Rozzi, 2005; Sardi
et al. 2006) (Fig. 1, Table 2), on the basis of the func-
tional matrix hypothesis (Moss & Young, 1960; Moss,
1973). The biological basis of components is related to
specific functional matrices (Table 2). The neurocranium
was divided into four components: anteroneural,
midneural, posteroneural and otic. Another four com-
ponents were established in the face: optic, respiratory,
masticatory and alveolar.
Fig. 1 Landmarks used for measurements recorded. Otic, optic and masticatory components were measured on the left side of the skull.
Table 2 Functional matrix of cranial components and measurements. Length (L), breadth (B) and height (H) are orthogonal with respect to each other and were measured in skulls orientated according to the Frankfort plane
Component Functional matrix Measurement
anteroneural neural structures related to the L: Glabella (1) – Bregma (2)anterior cranial fossa (mainly B: Pterion (3) – Pterion (3)anterior lobes) and frontal sinus H: Bregma (2) – Vomerobasilar (4)
midneural neural structures related to middle L: Bregma (2) – Lambda (5)and part of posterior cranial fossae and the most part of the brain hemispheres
B: Eurion (6) – Eurion (6)H: Basion (7) – Bregma (2)
posteroneural cerebellum L: Opisthion (8) – Opisthocranion (9)B: Asterion (10) – Asterion (10)H: Lambda (9) – Opisthion (8)
otic cavities and structures for hearing and equilibrium included in the petrosal and tympanic bones
L: inferior border of the tympanic bone (11) – inner extreme of petrosal bone (12)B: external auditory meatus breadth (13–14) H: external auditory meatus height (11–15)
optic ocular globe and orbital muscles L: Dacrion (16) – optic foramen (17)B: Dacrion (16) – Ectoconquium (18)H: Supraorbitary (19) – Infraorbitary (20)
respiratory cavity for respiration and olfaction L: Subspinale (21) – posterior nasal spine (22)B: Alare left (23) – Alare right (23)H: Nasion (24) – Subspinale (21)
masticatory temporal and part of masseter L: Zygomaxillare (25) – posterior border of the glenoid cavity (26)muscles B: anterior sulcus of the sphenotemporal crest (27) – lowest point of the
zygo temporal suture (28)H: lowest border of the zygo temporal suture (28) – inferior temporal lineat the coronal intersection (29)
alveolar teeth and tissues of the oral cavity L: Prosthion (31) – posterior limit of the maxillary alveolar arch (30)B: maximum breath of the exterior alveolar border (32–32)H: midsagital palatal depth (33) at point where alveolar breadth (32) was taken

Craniofacial growth and M1 emergence, M. L. Sardi and F. Ramírez Rozzi
© 2007 The AuthorsJournal compilation © 2007 Anatomical Society of Great Britain and Ireland
410
Landmarks were digitized with Microscribe (Fig. 1)
and inter-landmark distances were calculated: length,
breadth and height of each component (Table 2).
Volumetric indices (VI), representing the geometric
mean of the three dimensions, were constructed to
estimate size variation, expressed in dimensionless
units, as follows
The emergence of maxillary dentition was recorded
and individuals were assigned to dental classes accord-
ing to tooth emergence. Individuals with deciduous
dentition are those in which M1 has not yet reached
the occlusal plane (
n
=
52), with an age span between
0 and 8 years. Individuals with permanent dentition are
considered those who present at least the M1 in full
emergence (
n
=
176), with an age span between 5 and
20 years. Individuals who represent the upper limit of
the first class and the inferior limit of the second class
were differentiated. Within the deciduous dentition
class, individuals with complete deciduous dentition in
full emergence (FDD) and with M1 not reaching the
occlusal plane were selected (
n
=
16); their ages ranged
between 2 and 8 years. Among individuals with perma-
nent dentition, those with full emergence of M1 and
no other cheek-tooth at the occlusal plane (EM1) were
selected (
n
=
34), with ages between 5 and 11 years.
Growth trajectories of cranial components were
assessed by adjusting volumetric indices to chronologi-
cal age using the non-parametric smoothing spline.
Non-parametric methods are preferable for the descrip-
tion of growth because the curve is estimated without
the constraint of fitting a particular shape (Simonoff,
1996). The range of the
x
variable is divided into seg-
ments and then
y
values are adjusted using parametric
regression within each segment; thus, fittings of
y
in
any given segment are independent of fittings in
adjacent segments. The smoothing spline requires the
definition of the smoothing parameter
λ
, which estab-
lishes the trade-off between smoothness and variance
(Simonoff, 1996). A small
λ
produces low smoothness
and high variance; conversely, a high
λ
produces better
smoothness with lower variance; the linear regression
is the expression of an extremely high
λ
. In this study,
many different values of
λ
were explored. Finally,
λ
=
10 was chosen by visual inspection because curves
did not vary with smaller
λ
values. In order to deter-
mine the distribution of major dental classes in relation
to chronological age and volumetric indices, ellipses
with 95% confidence limits were calculated for each
major dental class. Analyses were performed pooling
individuals of both sexes, including those of unknown
sex that correspond to the most critical growth period
(Table 1). Sexual dimorphism in growth patterns may
exist, but it is not so pronounced at pre-adolescent
stages, even in the most dimorphic structures (Sperber,
2001). Moreover, Guihard-Costa & Ramírez Rozzi
(2004) have demonstrated that the inflection point of
brain and neurocranial growth occurs at the same age
in both males and females.
FDD and EM1 individuals were analysed in order to
examine growth trajectories across the transition
between deciduous and permanent dentition. Data
were log-transformed to enhance variance stability
and linearity of the distribution. Pearson’s correlation
coefficients and regression equations were calculated
from volumetric indices (
y
) against age (
x
), to test the
hypothesis that the slope is significantly different from 0.
The proportion of adult size of volumetric indices
was calculated in FDD and EM1 individuals, using the
adult sample as reference. This represents a means by
which to measure relative increments between the two
stages and the degree of advancement with respect to
adult size.
In order to test differences between FDD and EM1
individuals, percentage of differences between means
(PDM) of volumetric indices was calculated. Homo-
scedasticity was assessed using Levene’s test. The
hypothesis that differences between FDD and EM1
means equal 0 was tested by means of paired
t
and
Wilcoxon tests for homoscedastic and heteroscedastic
samples, respectively.
Size differences may be dependent on age differ-
ences between the two groups, i.e. EM1 individuals
may be larger than individuals without M1 just because
they are older, but the small sample size for the most
critical ages (around M1 emergence) does not allow
the comparison between individuals of different den-
tal stages at the same age. However, distributions of
log-transformed volumetric indices for FDD and EM1
individuals were standardized by age (log VI/age) for
comparison. Log VI/age values (
y
) were plotted against
age (
x
). If craniofacial growth is a function of age, it is
expected that EM1 and FDD individuals will show
similar distributions.
Statistical analyses were performed using the Jump
5.0.1 package.
VI length breadth height) ( .= × ×3

Craniofacial growth and M1 emergence, M. L. Sardi and F. Ramírez Rozzi
© 2007 The Authors Journal compilation © 2007 Anatomical Society of Great Britain and Ireland
411
Results
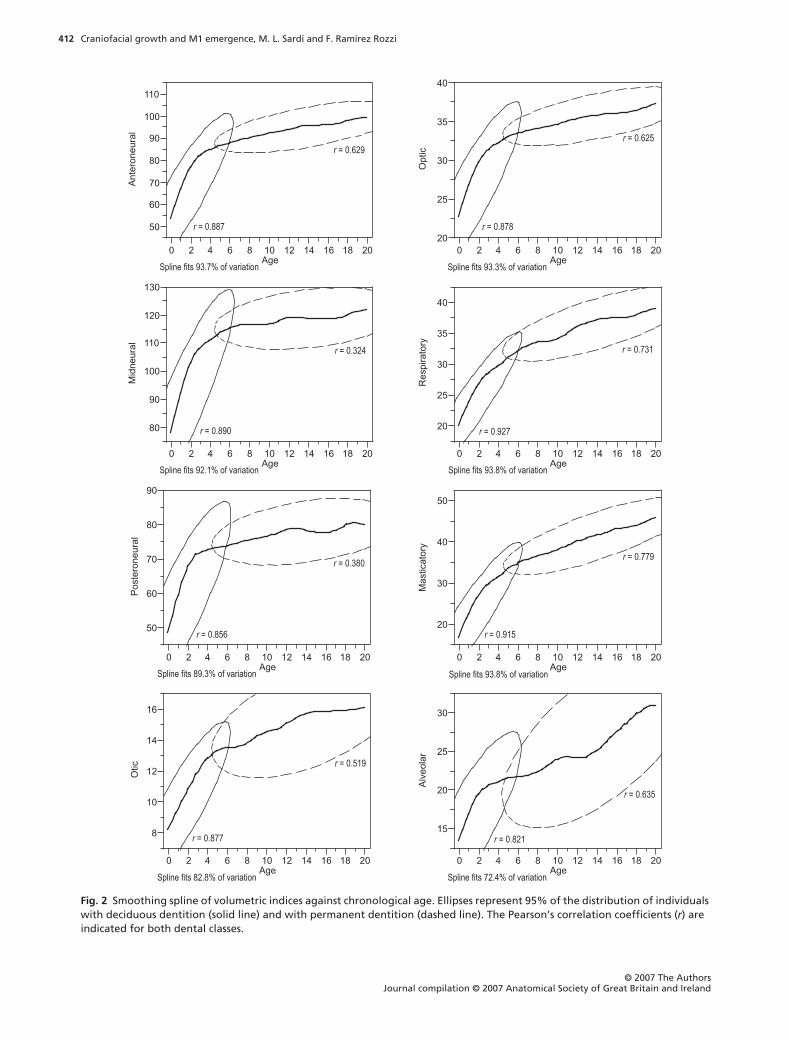
Figure 2 shows the growth trajectories of each com-
ponent obtained with the smoothing spline. Adjustments
explained a highly significant proportion of variation
(
r
2
). Growth trajectories revealed high growth rates
up to ages 3–5 years, followed by an inflection point,
which was in turn followed by lower growth rates. The
alveolar component showed a different trajectory,
with two moments of greater growth rate, during ages
0–4 and after age 14 years. Ellipses, representing the
distribution of individuals before and after the full
emergence of M1, overlapped near the inflection point
of component growth trajectories (Fig. 2). The trajecto-
ries indicated that individuals with deciduous dentition
have a higher growth rate whereas individuals with
permanent dentition have a lower growth rate.
Correlations and linear equations calculated from
log-transformed volumetric indices (Table 3) indicated
that FDD individuals show significant and highly signi-
ficant age-related changes for most of the components.
The posteroneural and alveolar components had
non-significant slopes; this may indicate that greatest
growth rates occur before the acquisition of the full
deciduous dentition for the posteroneural component
and after 14 years of age for the alveolar component
(Fig. 2). EM1 individuals showed significant and non-
significant age-related changes, with the exception of
the anteroneural component which continued to
present highly significant increments. Table 4 shows
the proportion of adult size in FDD and EM1 indi-
viduals. The anteroneural, midneural, posteroneural and
optic components were the most advanced, while the
masticatory and alveolar components were the most
retarded at both FDD and EM1 stages. Both the masti-
catory and the respiratory components showed the
greatest increments between these dental stages.
Table 5 shows descriptive statistics of volumetric
indices studied for FDD and EM1 individuals. Student’s
t
and Wilcoxon tests indicated that EM1 individuals are
larger than FDD individuals in all components, except
the alveolar component (Table 5). The PDM values
indicated that the masticatory, respiratory and otic
components have the greatest differences between
both dental stages. Figure 3 shows the distribution of age-
standardized log-volumetric indices. The trajectories
Table 3 Pearson’s correlation coefficients and linear regression equations for log VIs against age in FDD and EM1 individuals
Component
FDD EM1
r Slope Intercept r Slope Intercept
anteroneural 0.763** 0.015** 4.38 0.457** 0.013** 4.39midneural 0.668* 0.014* 4.65 0.150 0.003 4.73posteroneural 0.507 0.015 4.21 0.166 0.004 4.28otic 0.666** 0.027** 2.44 0.392* 0.027* 2.41optic 0.653** 0.018** 3.39 0.373* 0.010* 3.45respiratory 0.754** 0.034** 3.26 0.279 0.010 3.42masticatory 0.681** 0.041** 3.28 0.432* 0.016* 3.46alveolar 0.484 0.036 2.92 0.282 0.035 2.80
*P < 0.05, **P < 0.01.
Table 4 Proportion of adult size in volumetric indices
Component
FDD EM1
x ± SD Lower Upper x ± SD Lower Upper
anteroneural 0.85 ± 0.03 0.83 0.87 0.90 ± 0.04 0.89 0.91midneural 0.91 ± 0.03 0.89 0.93 0.95 ± 0.03 0.94 0.96posteroneural 0.88 ± 0.04 0.86 0.91 0.92 ± 0.04 0.91 0.94otic 0.77 ± 0.05 0.75 0.80 0.85 ± 0.09 0.82 0.88optic 0.86 ± 0.04 0.84 0.88 0.92 ± 0.03 0.91 0.93respiratory 0.75 ± 0.06 0.72 0.78 0.84 ± 0.04 0.83 0.86masticatory 0.69 ± 0.07 0.65 0.72 0.80 ± 0.04 0.79 0.82alveolar 0.69 ± 0.08 0.64 0.73 0.71 ± 0.12 0.67 0.75
Craniofacial growth and M1 emergence, M. L. Sardi and F. Ramírez Rozzi
© 2007 The AuthorsJournal compilation © 2007 Anatomical Society of Great Britain and Ireland
412
Fig. 2 Smoothing spline of volumetric indices against chronological age. Ellipses represent 95% of the distribution of individuals with deciduous dentition (solid line) and with permanent dentition (dashed line). The Pearson’s correlation coefficients (r) are indicated for both dental classes.

Craniofacial growth and M1 emergence, M. L. Sardi and F. Ramírez Rozzi
© 2007 The Authors Journal compilation © 2007 Anatomical Society of Great Britain and Ireland
413
Fig. 3 Biplot of the log-transformed volumetric indices scaled to age (log VI/age) and chronological age in FDD (triangles) and in EM1 (crosses) individuals.

Craniofacial growth and M1 emergence, M. L. Sardi and F. Ramírez Rozzi
© 2007 The AuthorsJournal compilation © 2007 Anatomical Society of Great Britain and Ireland
414
followed by FDD and EM1 individuals were identical;
thus, no shift between the distributions at both dental
stages was observed (Fig. 3).
Discussion and conclusions
Age-related changes in cranial components have been
previously described (Sardi & Ramírez Rozzi, 2005).
Growth trajectories were characterized by higher
growth rates in individuals under ages 3–5 years com-
pared with those of individuals after age 5 years (Sardi
& Ramírez Rozzi, 2005). Cranial components were
classified into three groups according to differences
among trajectories, mainly changes of growth rates
(inflection points) and proportion of adult size: (1)
anteroneural, midneural, posteroneural and optic;
(2) respiratory, masticatory, and otic; and (3) alveolar
trajectory. The coordinate variation among neural and
facial components may express the modular organiza-
tion of the craniofacial skeleton (Schilling & Thoro-
good, 2000), normally attributed to functional and
developmental constraints (Cheverud, 1996). The simi-
larity in growth patterns among components of groups
(1) and (2) can be explained mainly by common embryo-
logical origins of these components, rather than by
their participation in a common function or with their
localization in the neurocranium or the face (Sardi &
Ramírez Rozzi, 2005).
In this study, growth trajectories were described with
respect to a developmental event, namely M1 emerg-
ence. According to Fig. 2, ellipses overlap the inflection
point in growth trajectories, which would mean that
changes in trajectories are quite coincident with the
transition from deciduous to permanent dentition.
Associations between growth and age are strong
before the full emergence of M1, and they are weaker
for most components after M1 emergence (Table 3).
However, the anteroneural, posteroneural and alveo-
lar components continue to show similar slopes during
both dental stages, highly significant for the first com-
ponent and non-significant for the others (Table 3).
The respiratory component undergoes the most impor-
tant age-related changes, showing highly significant
correlations in FDD and non-significant correlations in
EM1 individuals (Table 3).
If age of M1 emergence is developmentally con-
nected with brain size, then size increments in neural
components would be expected up to M1 emergence.
Results of this study confirm that the neural components
of EM1 individuals present much of their adult size;
however, growth of the neural components is not
linear up to the emergence of M1. Components linked
to the central nervous system (anteroneural, mid-
neural, posteroneural) and the optic component show
an inflection point located earlier across ontogeny,
long before M1 emergence (Fig. 2). Moreover, estima-
tions of adult size indicate that FDD individuals have
attained around 88% of adult size for the antero-
neural, midneural and posteroneural components, and
at least 83% of adult size considering the minimum
value of the anteroneural component (Table 4). Little
growth occurs in neural components (4–5%) from FDD
to EM1 stages (Table 4). Guihard-Costa & Ramírez Rozzi
(2004) also found an inflection point for brain and skull
growth in living humans around 2–3 years of age. This
means that growth of the central nervous system is
more important during the first 3 years of life, which
are the period of emergence of deciduous dentition
and also the period of M1 crown calcification (Liver-
sidge et al. 1993; Reid et al. 1998). It is possible that, as
Table 5 Means (x), standard deviations (SD), and percentage differences between means (PDM) of volumetric indices. Levene (F ), Student’s (t) and Wilcoxon (approximate z) tests in log VI
Component FDD x ± SD EM1 x ± SD PDM† Levene’s F FDDx − EM1x
anteroneural 85.33 ± 3.20 90.25 ± 3.89 1.18 0.22 t = −3.90**midneural 111.02 ± 4.19 116.43 ± 3.82 0.69 1.11 t = −4.07**posteroneural 71.81 ± 3.71 75.14 ± 3.10 1.03 2.01 t = −3.20**otic 12.77 ± 0.87 14.06 ± 1.45 3.72 5.10* z = −2.81**optic 32.00 ± 1.56 34.23 ± 1.33 1.91 0.53 t = −5.02**respiratory 29.77 ± 2.39 33.51 ± 1.82 3.41 2.08 t = −5.80**masticatory 31.38 ± 3.31 36.63 ± 1.94 4.62 19.16** z = −4.41**alveolar 21.54 ± 2.72 22.29 ± 3.74 0.94 0.97 t = −0.54
†Calculated as (FDDx − EM1x)/FDDx. 100 in log-volumetric indices.*P < 0.05, **P < 0.01.

Craniofacial growth and M1 emergence, M. L. Sardi and F. Ramírez Rozzi
© 2007 The Authors Journal compilation © 2007 Anatomical Society of Great Britain and Ireland
415
stated by Bogin (1997, 1999), the brain gains most of its
adult size in weight up to the moment of M1 emerg-
ence, but according to the results of the present
study, delay in M1 emergence does not translate as
delayed growth of neural components or maintenance
of high growth rates. It is possible that neurological
performance up to M1 emergence is associated with
histological and maturational changes (Thompson
et al. 2000; Nagy et al. 2004).
After M1 emergence, only the anteroneural compo-
nent maintains a growth pattern associated with age
(Table 3) and shows a lesser proportion of adult size
than midneural and posteroneural components (Table 4).
The prolongation of growth of the anteroneural com-
ponent may result in expansion of the frontal sinus,
which presents a facial growth pattern rather than a
neural one (Moss & Young, 1960), and pulls the outer
table of the frontal bone forward (Lieberman et al.
2000b, 2004) also into old age (Sperber, 2001). By con-
trast, the growth pattern and proportion of adult size
of the optic component is similar to those of neural
components (Fig. 2, Table 4), even if some bones of the
optic cavity are part of the face.
The respiratory and masticatory components belong
to somatic systems. Expansion of most of their bones
depends on sutural growth, mainly due to extrinsic
forces (Opperman et al. 2005). Changes in growth
trajectories take place around 5 years of age (Fig. 2).
The respiratory component is the first portion of the
respiratory system; its size may be linked in part to body
size (Enlow & Hans, 1996) and its growth is to some
degree dependent on changes in the anterior cranial
base (Enlow & Hans, 1996; Lieberman et al. 2000a,b;
Sperber, 2001; Bastir et al. 2004; Bastir & Rosas, 2006).
By contrast, growth of the masticatory component is
associated with growth of the masticatory muscles and
is thus subject to hormonal influences (e.g. growth
hormone; Vogl et al. 1993; VandeBerg et al. 2004b).
Regarding M1 emergence, these components show the
greatest size changes between FDD and EM1 stages,
which would be associated with somatic growth
(Bogin, 1997, 1999), even though more than 10% of
their adult size is achieved during later ontogenetic
stages (Table 4).
The otic trajectory is similar to the respiratory and
masticatory trajectories. This is difficult to interpret
given that the otic component includes different struc-
tures: the petrosal bone, which contains structures
derived from the first and second pharyngeal arches,
and the tympanic bone, which is derived from the
pharyngeal arches (Sperber, 2001). The similarities with
the masticatory and respiratory components may be due
to associations of basicranial structures with the face
(Enlow & Hans, 1996; Kemaloglu et al. 2000; Lieberman
et al. 2000a,b; Bastir et al. 2004; Bastir & Rosas, 2006).
The alveolar component follows an S-shaped pat-
tern, different from the other components derived
from the pharyngeal arches, with highest growth rates
up to 3 years old and after 14 years old (Fig. 2). As the
alveolar component supports the teeth, and the mouth
forms the first part of the digestive system, it could be
expected to be the most affected by the emergence of
M1, in order to enable children to consume an adult
type diet (Smith, 1991; Bogin, 1999). However, in the
transition between both dental stages, this component
does not show either size changes associated with age
(Table 3) or differences between FDD and EM1 means
(Table 5). It is very probable that the space for M1
placement becomes available during crown formation,
which starts before birth and finishes around age 2.5–
3 years (Liversidge et al. 1993; Reid et al. 1998). The
remaining growth of the alveolar component in later
ontogeny (Fig. 2) may be linked to the formation of M2
and M3 (Sperber, 2001), as Boughner & Dean (2004)
observed for the mandibular length in Pan and Papio.
Significant size differences between FDD and EM1
individuals (Table 4) indicate that considerable cranio-
facial changes take place during the transition from
deciduous to permanent dentitions. Most components,
except the alveolar component, are significantly larger
in EM1 individuals (Table 4). However, when trajecto-
ries are standardized by age, EM1 individuals show the
same growth pattern as FDD individuals (Fig. 3), thus
indicating that there is no shift in growth that can be
attributed to M1 emergence during the ontogenetic
period spanned by both samples. This means that dif-
ferences between both dental stages are likely to be
due to the cumulative age-related increments rather
than to the actual emergence of M1.
Based on life-history studies, M1 emergence is often
considered to be a developmental event significantly
associated with many variables. However, M1 emerg-
ence does not seem to be strongly connected with
structural craniofacial changes across ontogeny at
the individual level. Moreover, if developmental inte-
gration exists between M1 emergence and growth of
neural and alveolar components, it is not mediated by
processes that involve temporal continuity. Thus, the

Craniofacial growth and M1 emergence, M. L. Sardi and F. Ramírez Rozzi
© 2007 The AuthorsJournal compilation © 2007 Anatomical Society of Great Britain and Ireland
416
null hypothesis is rejected. Nevertheless, it must be
taken into account that the M1 crown of humans
grows and accommodates within the alveolus around
age 2.5 years (Reid et al. 1998), much earlier than the
M1 full emergence. That is, M1 crown formation may
be developmentally associated to some extent with
craniofacial growth by some causal mechanism that
would produce this temporal association of events. By
contrast, M1 emergence is a developmentally quite
independent event.
Acknowledgements
We wish to thank the Editor and reviewers for correc-
tions and observations that helped us to rework some
of our arguments; Valeria Bernal, Paula González and
Ivan Pérez for commentaries made on early versions of
the manuscript; Fernando Ventrice, for technical assist-
ance; and Phillipe Mennecier, Eugenia Cunha and Sofia
Wasterlain for access to collections under their care.
This work was made possible by a Fondation Fyssen
Grant held by M.L.S.
References
Atchley WR, Hall BK (1991) A model for development and evo-lution of complex morphological structures. Biol Rev CambPhilos Soc 66, 101–157.
Bastir M, Rosas A (2004) Comparative ontogeny in humansand chimpanzees: similarities, differences and paradoxes inpostnatal growth and development of the skull. Ann Anat186, 503–509.
Bastir M, Rosas A, Kuroe K (2004) Petrosal orientation andmandibular ramus breadth: evidence for an integratedpetroso-mandibular developmental unit. Am J PhysAnthropol 123, 340–350.
Bastir M, Rosas A (2006) Correlated variation between thelateral basicranium and the face: a geometric morphometricstudy in different human groups. Arch Oral Biol in press.
Bogin B (1997) Evolutionary hypotheses for human childhood.Ybk Phys Anthropol 40, 63–89.
Bogin B (1999) Patterns of Human Growth. Cambridge:Cambridge University Press.
Boughner JC, Dean MC (2004) Does space in the jaw influencethe timing of molar crown initiation? A model using baboons(Papio anubis) and great apes (Pan troglodytes, Pan paniscus).J Hum Evol 46, 255–277.
Buschang PH, Baume RM, Nass G (1983) A craniofacial growthmaturity gradient for males and females between 4 and 16years of age. Am J Phys Anthropol 61, 373–381.
Buschang PH, Hinton RJ (2005) A gradient of potential formodifying craniofacial growth. Semin Orthod 11, 219–226.
Cheverud JM (1996) Developmental integration and theevolution of pleiotropy. Am Zool 36, 44–50.
Corner BD, Richtsmeier JT (1991) Morphometric analysis ofcraniofacial growth in Cebus apella. Am J Phys Anthropol84, 323–342.
Corner BD, Richtsmeier JT (1992) Cranial growth in the squirrelmonkey Saimiri sciureus: a quantitative analysis using threedimensional coordinate data. Am J Phys Anthropol 87, 67–82.
Corner BD, Richtsmeier JT (1993) Cranial growth and growthdimorphism in Ateles geoffroyi. Am J Phys Anthropol 92,371–394.
Delattre A (1951) Du Crâne Animal au Crâne Humain. Paris:Masson.
Dressino V, Pucciarelli HM (1999) Growth of functional cranialcomponents in Saimiri sciureus boliviensis (Cebidae): a lon-gitudinal study. Growth Dev Aging 63, 111–127.
Enlow DH, Hans MG (1996) Crecimiento Facial. Mexico DF:McGraw-Hill Interamericana.
Fanning E, Moorrees C (1969) A comparison of permanentmandibular molar formation in Australian Aborigines andCaucasoids. Arch Oral Biol 14, 999–1006.
Garn SM, Moorrees C (1951) Stature, body-build, and toothemergence in Aleutian Aleut children. Child Dev 22, 261–270.
Garn SM, Sandusky ST, Nagy JM, Trowbridge FL (1973)Negro-Caucasoid differences in permanent tooth emergenceat a constant income level. Arch Oral Biol 18, 609–615.
Godfrey LR, Samonds KE, Jungers WL, Sutherland MR (2001)Teeth, brains, and primate life history. Am J Phys Anthropol114, 192–214.
González-José R, Ramírez Rozzi F, Sardi M, Martínez-AbadíasN, Hernández M, Pucciarelli HM (2005) Functional-cranialapproach to the influence of economic strategy on skullmorphology. Am J Phys Anthropol 128, 757–771.
Guihard-Costa AM, Ramírez Rozzi F (2004) Growth of thehuman brain and skull slows down at about 2.5 years old.CR Palevol 3, 397–402.
Hartwig NC (1995) Effect of life history on the squirrel monkey(Platyrrhini, Saimiri) cranium. Am J Phys Anthropol 97, 435–449.
Herring SW (1993) Formation of the vertebrate face: epige-netic and functional influences. Am Zool 33, 472–483.
Hoppa RD, Fitzgerald CM (1999) From head to toe: integratingstudies from bones and teeth in biological anthropology.In Human Growth in the Past. Studies from Bones and Teeth(Hoppa R, Fitzgerald CM, eds), pp. 1–31. Cambridge:Cambridge University Press.
Humphrey LT (1998) Growth patterns in the modern humanskeleton. Am J Phys Anthropol 105, 57–72.
Kemaloglu YK, Kobayashi T, Nakajima T (2000) Associationsbetween the Eustachian tube and craniofacial skeleton.Int J Pediatr Otorhinolaryngol 53, 195–205.
Konigsberg L, Holman D (1999) Estimation of age at deathfrom dental emergence and implications for studies ofprehistoric somatic growth. In Human Growth in the Past.Studies from Bones and Teeth (Hoppa R, Fitzgerald CM,eds), pp. 264–289. Cambridge: Cambridge University Press.
Lavelle C (1975) A note on the variation in the timing ofdeciduous tooth eruption. J Dent 3, 267–270.
Lieberman DE, Pearson OM, Mowbray KM (2000a) Basicranialinfluence on overall cranial shape. J Hum Evol 38, 291–315.

Craniofacial growth and M1 emergence, M. L. Sardi and F. Ramírez Rozzi
© 2007 The Authors Journal compilation © 2007 Anatomical Society of Great Britain and Ireland
417
Lieberman DE, Ross CF, Ravosa MJ (2000b) The primate cranialbase: ontogeny, function, and integration. Ybk PhysAnthropol 43, 117–169.
Lieberman DE, Krovitz GE, McBratney-Owen B (2004) Testinghypotheses about tinkering in the fossil record: the case ofthe human skull. J Exper Zool 302, 284–301.
Liversidge HM, Dean MC, Molleson TI (1993) Increasinghuman tooth length between birth and 5.4 years. Am J PhysAnthropol 90, 307–313.
Meindl RS, Russel KF (1998) Recent advances in method andtheory in paleodemography. Ann Rev Anthropol 27, 375–399.
Michejda M (1975) Ontogenetic growth changes of the skullbase in four genera of nonhuman primates. Acta Anat 91,110–117.
Miller JP, German RZ (1999) Protein malnutrition affectsthe growth trajectories of the craniofacial skeleton in rats.J Nutr 129, 2061–2069.
Moss ML, Young RW (1960) A functional approach to cranio-logy. Am J Phys Anthropol 18, 281–291.
Moss ML (1973) A functional cranial analysis of primatecraniofacial growth. Symp IVth Int Congr Primat 3, 191–208.
Moss ML (1997a) The functional matrix hypothesis revisited. 2.The role of an osseous connected cellular network. Am JOrthod Dentof Orthop 112, 221–226.
Moss ML (1997b) The functional matrix hypothesis revisited. 3.The genomic thesis. Am J Orthod Dentof Orthop 112, 338–342.
Moss ML (1997c) The functional matrix hypothesis revisited. 4.The epigenetic antithesis and the resolving synthesis. Am JOrthod Dentofac Orthop 112, 410–417.
Nagy Z, Westerberg H, Klingberg T (2004) Maturation ofwhite matter is associated with the development of cog-nitive functions. J Cogn Neurosci 16, 1227–1233.
Opperman LA, Gakunga PT, Carlson DS (2005) Genetic factorsinfluencing morphogenesis and growth of sutures andsynchondroses in the craniofacial complex. Semin Orthod11, 199–208.
Pucciarelli HM, Dressino V, Niveiro MH (1990) Changes in skullcomponents of the squirrel monkey evoked by growth andnutrition: an experimental study. Am J Phys Anthropol 81,535–543.
Ramírez Rozzi FV, González-José R, Pucciarelli HM (2005)Cranial growth in normal and low-protein-fed Saimiri. Anenvironmental heterochrony. J Hum Evol 49, 515–535.
Reid DJ, Beynon AD, Ramírez Rozzi F (1998) Histologicalreconstruction of dental development in four individualsfrom a medieval site in Picardie, France. J Hum Evol 35, 463–477.
Sardi ML, Ramírez Rozzi FV (2005) A cross-sectional study ofhuman craniofacial growth. Ann Hum Biol 32, 390–396.
Sardi ML, Novellino PS, Pucciarelli HM (2006) Craniofacial
morphology in the Argentine center-west: consequences ofthe transition to food production. Am J Phys Anthropol 130,333–343.
Schilling TF, Thorogood PV (2000) Development and evolutionof the vertebrate skull. In Development, Growth and Evolu-tion. Implications for the Study of the Hominid Skeleton(O’Higgins P, Cohn M, eds), pp. 57–83. London: AcademicPress.
Schultz AH (1960) Age changes in primates and their modifi-cation in man. In Human Growth (Tanner JM, ed.), pp. 1–20.Oxford: Pergamon.
Simonoff JS (1996) Smoothing Methods in Statistics. NewYork: Springer.
Sirianni JE (1985) Nonhuman primates as models for humancraniofacial growth. In Nonhuman Primate Models forHuman Growth and Development (Watts ES, ed.), pp. 95–124. New York: Alan R. Liss, Inc.
Smith BH, Garn SM (1987) Polymorphisms in eruptionsequence of permanent teeth in American children. Am JPhys Anthropol 74, 289–303.
Smith BH (1989) Growth and development and its significancefor early hominid behaviour. Ossa 14, 63–96.
Smith BH (1991) Dental development and the evolution of lifehistory in Hominidæ. Am J Phys Anthropol 86, 157–174.
Smith BH (1992) Life history and the evolution of humanmaturation. Evol Anthropol 1, 134–142.
Smith BH, Crummet TL, Brandt KL (1994) Ages of eruption ofprimate teeth: a compendium for aging individuals andcomparing life histories. Ybk Phys Anthropol 37, 177–231.
Smith KK (1996) Integration of craniofacial structures duringdevelopment in Mammals. Am Zool 36, 70–79.
Sperber GH (2001) Craniofacial Development. Hamilton,Ontario: BC Decker Inc.
Swindler DR (1985) Nonhuman primate dental developmentand its relationship to human dental development. InNonhuman Primate Models for Human Growth and Develop-ment (Watts ES, ed.), pp. 67–94. New York: Alan R. Liss.
Thompson PM, Giedd JN, Woods RP, MacDonald D, Evans AC,Toga AW (2000) Growth patterns in the developing braindetected by using continuum mechanical tensor maps.Nature 404, 190–193.
Tompkins RL (1996) Human population variability in relativedental development. Am J Phys Anthropol 99, 79–102.
VandeBerg JR, Buschang PH, Hinton RJ (2004a) Absolute andrelative growth of the rat craniofacial skeleton. Arch OralBiol 49, 477–484.
VandeBerg JR, Buschang PH, Hinton RJ (2004b) Craniofacialgrowth in growth hormone-deficient rats. Anat Rec Part A278A, 561–570.
Vogl C, Atchley WC, Cowley DE, Crenshaw P, Murray JD, Pomp D(1993) The epigenetic influence of growth hormone onskeletal development. Growth Dev Aging 57, 163–182.