Cranial-Vertebral-Maxillary Morphological Integration in Down ...
13
Citation: García-García, M.T.; Diz-Dios, P.; Abeleira-Pazos, M.T.; Limeres-Posse, J.; García-Mato, E.; Varela-Aneiros, I.; Outumuro-Rial, M.; Diniz-Freitas, M. Cranial-Vertebral- Maxillary Morphological Integration in Down Syndrome. Biology 2022, 11, 496. https://doi.org/10.3390/ biology11040496 Academic Editors: De-Li Shi and Jennifer Fish Received: 20 January 2022 Accepted: 18 March 2022 Published: 24 March 2022 Publisher’s Note: MDPI stays neutral with regard to jurisdictional claims in published maps and institutional affil- iations. Copyright: © 2022 by the authors. Licensee MDPI, Basel, Switzerland. This article is an open access article distributed under the terms and conditions of the Creative Commons Attribution (CC BY) license (https:// creativecommons.org/licenses/by/ 4.0/). biology Article Cranial-Vertebral-Maxillary Morphological Integration in Down Syndrome Marta Teresa García-García, Pedro Diz-Dios , María Teresa Abeleira-Pazos, Jacobo Limeres-Posse * , Eliane García-Mato, Iván Varela-Aneiros, Mercedes Outumuro-Rial and Márcio Diniz-Freitas * Medical-Surgical Dentistry Research Group (OMEQUI), Health Research Institute of Santiago de Compostela (IDIS), University of Santiago de Compostela (USC), 15782 Santiago de Compostela, Spain; [email protected] (M.T.G.-G.); [email protected] (P.D.-D.); [email protected] (M.T.A.-P.); [email protected] (E.G.-M.); [email protected] (I.V.-A.); [email protected] (M.O.-R.) * Correspondence: [email protected] (J.L.-P.); [email protected] (M.D.-F.); Tel.: +34-881812344 (J.L.-P. & M.D.-F.) Simple Summary: Phenotypic variability can be structured according to three interrelated compo- nents: developmental stability, morphological integration, and canalization. The cranium presents modular organization, consistent with the principles of morphological integration. In Down syn- drome (DS), the most common genetic aneuploidy, the integration of the cranial-vertebral-maxillary complex, remains unknown. This study aimed to analyze whether there are significant relationships between the skull base, atlantoaxial joint, and maxillary-mandibular complex in a study group of 41 individuals with DS and nonsyndromic controls. Twenty-nine measurements were performed on each participant’s cone-beam computed tomography images, which were grouped into three blocks: atlantoaxial dimensions, craniovertebral dimensions, and cephalometric dimensions. With regard to the association between blocks, we found no significant relationship in the DS group. However, we confirmed a statistically significant correlation between all blocks of variables in the controls. In conclusion, these results confirm a very poor morphological integration of the cranial- cervical-maxillary complex in individuals with DS. This finding reinforces the proposal that gene overload enhances canalization, which could potentially affect the outcomes of certain orthopedic and surgical procedures. Abstract: Background: Morphological integration refers to the tendency of anatomical structures to show correlated variations because they develop in response to shared developmental processes or function in concert with other structures. The objective of this study was to determine the relationships between the dimensions of different cranial-cervical-facial structures in patients with Down syndrome (DS). Methodology: The study group consisted of 41 individuals with DS who had undergone cone-beam computed tomography (CBCT) at the Dental Radiology Unit of the University of Santiago de Compostela (Spain). In the historical archive of this same unit, 41 CBCTs belonging to individuals with no known systemic disorders or severe malformations of the maxillofacial region were selected, forming an age and sex-matched control group. Twenty-nine measurements were performed on each participant’s CBCT images, which were grouped into three blocks: atlantoaxial dimensions, craniovertebral dimensions and cephalometric dimensions. To determine whether there were significant differences between the dimensions obtained in the DS and control groups, we applied multiple analysis of variance and linear discriminant analysis tests. The analysis of the association between blocks (in pairs) was performed with the canonical correlation analysis test. Results: The dimensions evaluated in the three blocks of variables of individuals with DS differ significantly from those of nonsyndromic controls (p < 0.001). The highest discriminative capacity to identify controls and patients with DS was obtained with the cephalometric dimensions (87.5%). With regard to the association between blocks (two-by-two measurements), we found no significant relationship in the DS group. However, we confirmed a statistically significant correlation between all pairs of blocks of variables in the controls, especially between the atlantoaxial and cephalometric Biology 2022, 11, 496. https://doi.org/10.3390/biology11040496 https://www.mdpi.com/journal/biology
-
Upload
khangminh22 -
Category
Documents
-
view
0 -
download
0
Transcript of Cranial-Vertebral-Maxillary Morphological Integration in Down ...

�����������������
Citation: García-García, M.T.;
Diz-Dios, P.; Abeleira-Pazos, M.T.;
Limeres-Posse, J.; García-Mato, E.;
Varela-Aneiros, I.; Outumuro-Rial, M.;
Diniz-Freitas, M. Cranial-Vertebral-
Maxillary Morphological Integration
in Down Syndrome. Biology 2022, 11,
496. https://doi.org/10.3390/
biology11040496
Academic Editors: De-Li Shi and
Jennifer Fish
Received: 20 January 2022
Accepted: 18 March 2022
Published: 24 March 2022
Publisher’s Note: MDPI stays neutral
with regard to jurisdictional claims in
published maps and institutional affil-
iations.
Copyright: © 2022 by the authors.
Licensee MDPI, Basel, Switzerland.
This article is an open access article
distributed under the terms and
conditions of the Creative Commons
Attribution (CC BY) license (https://
creativecommons.org/licenses/by/
4.0/).
biology
Article
Cranial-Vertebral-Maxillary Morphological Integration inDown SyndromeMarta Teresa García-García, Pedro Diz-Dios , María Teresa Abeleira-Pazos, Jacobo Limeres-Posse * ,Eliane García-Mato, Iván Varela-Aneiros, Mercedes Outumuro-Rial and Márcio Diniz-Freitas *
Medical-Surgical Dentistry Research Group (OMEQUI), Health Research Institute of Santiago deCompostela (IDIS), University of Santiago de Compostela (USC), 15782 Santiago de Compostela, Spain;[email protected] (M.T.G.-G.); [email protected] (P.D.-D.); [email protected] (M.T.A.-P.);[email protected] (E.G.-M.); [email protected] (I.V.-A.);[email protected] (M.O.-R.)* Correspondence: [email protected] (J.L.-P.); [email protected] (M.D.-F.);
Tel.: +34-881812344 (J.L.-P. & M.D.-F.)
Simple Summary: Phenotypic variability can be structured according to three interrelated compo-nents: developmental stability, morphological integration, and canalization. The cranium presentsmodular organization, consistent with the principles of morphological integration. In Down syn-drome (DS), the most common genetic aneuploidy, the integration of the cranial-vertebral-maxillarycomplex, remains unknown. This study aimed to analyze whether there are significant relationshipsbetween the skull base, atlantoaxial joint, and maxillary-mandibular complex in a study group of41 individuals with DS and nonsyndromic controls. Twenty-nine measurements were performedon each participant’s cone-beam computed tomography images, which were grouped into threeblocks: atlantoaxial dimensions, craniovertebral dimensions, and cephalometric dimensions. Withregard to the association between blocks, we found no significant relationship in the DS group.However, we confirmed a statistically significant correlation between all blocks of variables in thecontrols. In conclusion, these results confirm a very poor morphological integration of the cranial-cervical-maxillary complex in individuals with DS. This finding reinforces the proposal that geneoverload enhances canalization, which could potentially affect the outcomes of certain orthopedicand surgical procedures.
Abstract: Background: Morphological integration refers to the tendency of anatomical structuresto show correlated variations because they develop in response to shared developmental processesor function in concert with other structures. The objective of this study was to determine therelationships between the dimensions of different cranial-cervical-facial structures in patients withDown syndrome (DS). Methodology: The study group consisted of 41 individuals with DS who hadundergone cone-beam computed tomography (CBCT) at the Dental Radiology Unit of the Universityof Santiago de Compostela (Spain). In the historical archive of this same unit, 41 CBCTs belonging toindividuals with no known systemic disorders or severe malformations of the maxillofacial regionwere selected, forming an age and sex-matched control group. Twenty-nine measurements wereperformed on each participant’s CBCT images, which were grouped into three blocks: atlantoaxialdimensions, craniovertebral dimensions and cephalometric dimensions. To determine whether therewere significant differences between the dimensions obtained in the DS and control groups, weapplied multiple analysis of variance and linear discriminant analysis tests. The analysis of theassociation between blocks (in pairs) was performed with the canonical correlation analysis test.Results: The dimensions evaluated in the three blocks of variables of individuals with DS differsignificantly from those of nonsyndromic controls (p < 0.001). The highest discriminative capacityto identify controls and patients with DS was obtained with the cephalometric dimensions (87.5%).With regard to the association between blocks (two-by-two measurements), we found no significantrelationship in the DS group. However, we confirmed a statistically significant correlation betweenall pairs of blocks of variables in the controls, especially between the atlantoaxial and cephalometric
Biology 2022, 11, 496. https://doi.org/10.3390/biology11040496 https://www.mdpi.com/journal/biology

Biology 2022, 11, 496 2 of 13
dimensions (p < 0.001) and between the craniovertebral and cephalometric dimensions (p < 0.001).Conclusions: Our results confirm a very poor morphological integration of the cranial-cervical-maxillary complex in individuals with DS. This finding reinforces the proposal that gene overloadenhances the channeling process.
Keywords: down syndrome; atlantoaxial joint; skull base; cephalometry; developmental instability;canalization
1. Introduction
Down syndrome (DS) is a disorder characterized by the presence of an additionalchromosome or a part of the same in position 21, which causes a characteristic phenotype,intellectual disability and several physical and medical peculiarities [1]. The orofacialmanifestations of DS are characteristic of the syndrome and can affect soft and hardtissues, jeopardizing eating, chewing, swallowing, and phonation [2]. One of the inherentcharacteristics of the aneuploid condition is the high phenotypic variability, which hasbeen described in relation to the cognitive capacity, hypotonia, dermatoglyphic findings,susceptibility to certain comorbidities and facial dysmorphology [3]. The phenotypicvariability can be structured according to three interrelated components: developmentalstability, morphological integration, and canalization [4].
Stability is a property of development that can limit phenotypic variation when facedwith random perturbations (“developmental noise”) that occur during the course of on-togeny, such that a certain phenotype is produced under specific genetic and environmentalconditions [5,6]. When the genetic or environmental stress increases the developmentalnoise, minor deviations occur in the ideal developmental program of perfect bilateralsymmetry, and developmental instability occurs [4]. Historically, developmental instabilityhas been evaluated using an analysis of fluctuating asymmetry, defined as a measure of themetric differences between the left and right sides of developing organisms [7,8].
Modularity is an important organizational component in biological systems thatdescribes the differences in the degree of trait integration between and within groups andsubgroups of structures and that is manifested at the morphological level [9]. Morphologicalintegration refers to the tendency of various traits to show correlated variations becausethey develop in response to shared development processes or work in concert with othershared structures [10,11]. This concept was introduced by Olson and Miller [10] whoargued that those traits that share developmental aspects (tissue precursors, developmentchronology, topological proximity in the embryo, etc.) or similar functional demands(chewing, vision, locomotion, etc.) will evolve as integrated units.
In the 1940s, Conrad H. Waddington [12] employed the term “canalization” to de-scribe a phenotype’s ability to resist perturbations. Canalization implies that a genotype’sphenotype remains relatively unchanged when the individuals of a particular genotype areexposed to various environments (environmental canalization) or when the individualsof the same genotype differ in their genetic origin (genetic canalization). Developmentalinstability and canalization perform a relevant role in micro- and macro-evolutionary pro-cesses [8]. Developmental instability is expressed phenotypically by the intraindividualvariation, while canalization is expressed by the interindividual variation. The combinedeffect of developmental instability and canalization has been called developmental home-ostasis [13]. It has been suggested that they share a common background but should beconsidered distinct processes until their origins and underlying mechanisms have beendefinitely clarified [13].
The deficient development that characterizes DS also affects the head, which is gen-erally small and has a tendency toward a brachycephalic pattern [14]. The cranial baseis flattened, and its length is shorter than that of the general population [15]. Between10% and 30% of individuals with DS have radiological findings suggestive of atlantoaxial
Biology 2022, 11, 496 3 of 13
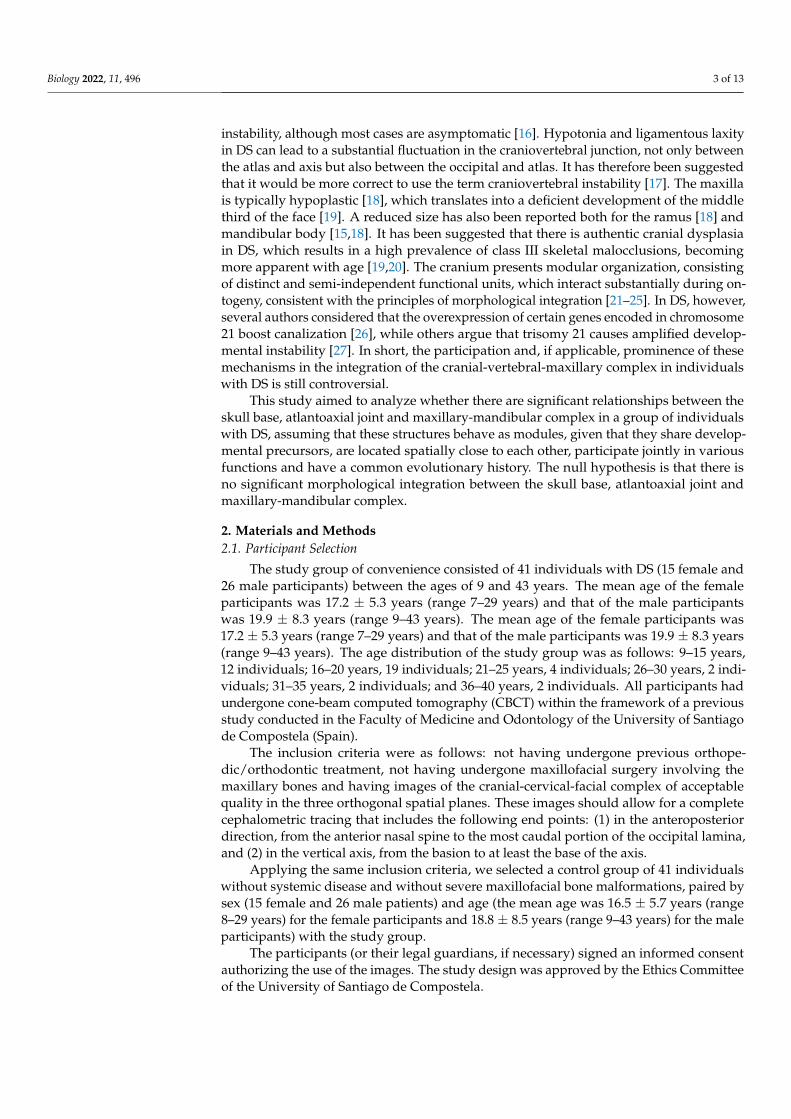
instability, although most cases are asymptomatic [16]. Hypotonia and ligamentous laxityin DS can lead to a substantial fluctuation in the craniovertebral junction, not only betweenthe atlas and axis but also between the occipital and atlas. It has therefore been suggestedthat it would be more correct to use the term craniovertebral instability [17]. The maxillais typically hypoplastic [18], which translates into a deficient development of the middlethird of the face [19]. A reduced size has also been reported both for the ramus [18] andmandibular body [15,18]. It has been suggested that there is authentic cranial dysplasiain DS, which results in a high prevalence of class III skeletal malocclusions, becomingmore apparent with age [19,20]. The cranium presents modular organization, consistingof distinct and semi-independent functional units, which interact substantially during on-togeny, consistent with the principles of morphological integration [21–25]. In DS, however,several authors considered that the overexpression of certain genes encoded in chromosome21 boost canalization [26], while others argue that trisomy 21 causes amplified develop-mental instability [27]. In short, the participation and, if applicable, prominence of thesemechanisms in the integration of the cranial-vertebral-maxillary complex in individualswith DS is still controversial.
This study aimed to analyze whether there are significant relationships between theskull base, atlantoaxial joint and maxillary-mandibular complex in a group of individualswith DS, assuming that these structures behave as modules, given that they share develop-mental precursors, are located spatially close to each other, participate jointly in variousfunctions and have a common evolutionary history. The null hypothesis is that there isno significant morphological integration between the skull base, atlantoaxial joint andmaxillary-mandibular complex.
2. Materials and Methods2.1. Participant Selection
The study group of convenience consisted of 41 individuals with DS (15 female and26 male participants) between the ages of 9 and 43 years. The mean age of the femaleparticipants was 17.2 ± 5.3 years (range 7–29 years) and that of the male participantswas 19.9 ± 8.3 years (range 9–43 years). The mean age of the female participants was17.2 ± 5.3 years (range 7–29 years) and that of the male participants was 19.9 ± 8.3 years(range 9–43 years). The age distribution of the study group was as follows: 9–15 years,12 individuals; 16–20 years, 19 individuals; 21–25 years, 4 individuals; 26–30 years, 2 indi-viduals; 31–35 years, 2 individuals; and 36–40 years, 2 individuals. All participants hadundergone cone-beam computed tomography (CBCT) within the framework of a previousstudy conducted in the Faculty of Medicine and Odontology of the University of Santiagode Compostela (Spain).
The inclusion criteria were as follows: not having undergone previous orthope-dic/orthodontic treatment, not having undergone maxillofacial surgery involving themaxillary bones and having images of the cranial-cervical-facial complex of acceptablequality in the three orthogonal spatial planes. These images should allow for a completecephalometric tracing that includes the following end points: (1) in the anteroposteriordirection, from the anterior nasal spine to the most caudal portion of the occipital lamina,and (2) in the vertical axis, from the basion to at least the base of the axis.
Applying the same inclusion criteria, we selected a control group of 41 individualswithout systemic disease and without severe maxillofacial bone malformations, paired bysex (15 female and 26 male patients) and age (the mean age was 16.5 ± 5.7 years (range8–29 years) for the female participants and 18.8 ± 8.5 years (range 9–43 years) for the maleparticipants) with the study group.
The participants (or their legal guardians, if necessary) signed an informed consentauthorizing the use of the images. The study design was approved by the Ethics Committeeof the University of Santiago de Compostela.

Biology 2022, 11, 496 4 of 13
2.2. Radiological Measurements
The images were obtained using an i-CAT® cone-beam computed tomography system(Imaging Sciences International, Hatfield, PA, USA). The imaging studies were performedby a single operator, following the manufacturer’s instructions, and standardizing thepatients’ position. To perform the scanning, the participants were placed in the standingposition, with the intermaxillary occlusion in maximum intercuspation and with the fol-lowing head position: in the sagittal plane, with the Frankfurt plane parallel to the floor(anterior and posterior nasal spine aligned and coinciding with the horizontal), and in thefrontal plane, with the vertebral body aligned with the vertical axis.
The images were obtained at 120 kVp and 5.0 mA; the voxel size was 0.3 mm, witha field of view of 10–20 cm and an exposure time of 8.9 s. All images were reconstructedusing i-CAT® Vision 17.1 software (Imaging Sciences International, Hatfield, PA, USA)and were exported in DICOM format (Digital Imaging Communication in Medicine) toa personal computer with MacBook 27 software (MacOS X 10.6, Apple Inc., Cupertino,CA, USA). All measurements were performed using the open-source, image-processingsoftware OsiriX (Pixmeo, Geneva, Switzerland).
The CBCT scans were oriented by aligning the palatal vault with the X axis (in thesagittal and coronal planes) and the midpalatal suture with the Y axis (in the axial andcoronal planes). The cursor was then moved within the plane that was the object of thestudy following the Z axis (the selected coronal plane was that which passed through themesial face of the first maxillary molars in the axial perspective). The images were analyzedin the sagittal and frontal planes: the sagittal plane was that which crossed the midpoint ofthe odontoid apophysis and the facial midline; the frontal plane was established based onthe highest point of the odontoid apophysis.
Twenty-nine measurements grouped into three blocks were performed on each patient(Table S1). The first block of atlantoaxial (A) dimensions (9 measurements) were as fol-lows: sagittal atlantodens interval, left mesial atlantoaxial interval, left medial atlantoaxialinterval, left lateral atlantoaxial interval, right mesial atlantoaxial interval, right medialatlantoaxial interval, right lateral atlantoaxial interval, left lateral atlantodens intervaland right lateral atlantodens interval. The second block of craniocervical dimensions(B) (7 measurements) were as follows: Wackenheim measurement, McRae measurement,Chamberlain measurement, McGregor measurement, Redlund-Johnell method, modifiedRanawat method and length of the odontoid apophysis. The third block of cephalometricdimensions (C) (13 measurements) were as follows: McRae–Wackenheim angle; length,anterosuperior and vertical position, and inclination of the maxilla; angle between theaxis of the maxillary central incisor and the palatal plane; size, anterosuperior and verticalposition, and inclination of the mandible; angle between the axis of the mandibular cen-tral incisor and the Downs mandibular plane; and the distance between points A and Bprojected on the McRae line.
To check the intraexaminer repeatability, a single observer repeated the measurementsof 10 randomly selected cases (5 patients with DS and 5 controls) one month after the firstmeasurements, obtaining an intraclass correlation coefficient of 0.94 (95% CI 0.84–0.96)for all evaluated variables. To analyze the interobserver reproducibility, two observersperformed all the measurements in 10 other randomly selected cases (5 patients with DSand 5 controls), obtaining an intraclass correlation coefficient of 0.92 (95% CI 0.72–0.99). Thelowest values corresponded to variables AA1-L and AA1-R (0.75 and 0.72, respectively).
2.3. Statistical Methodology
We conducted an analysis of the differences between the cases and controls to de-termine whether it was possible to discriminate between the two groups based on thevalues of the variables for each of the three examined blocks. Basically, we sought tofind a linear combination of response variables that maximized the differences betweenthe cases and controls. To this end, we performed a multivariate analysis of variance toassess the presence of intergroup differences in the means and then performed a linear

Biology 2022, 11, 496 5 of 13
discriminant analysis to obtain the linear combination of variables that maximizes theintergroup discrimination.
To analyze the association of the measurements between pairs of blocks of variables(A vs. B, A vs. C, B vs. C), we selected the canonical correlation analysis methodologybecause this method allows for the sequential extraction of linear combinations of variables(measured in the same set of individuals) searching for the maximum sample correlation.The objective of the analysis is to obtain the canonical dimensions (the number of dimen-sions equals the number of variables in the smaller block) and to test for their significance.We used the Pillai–Barlett Trace using the F-approximation to reach this goal. The estima-tion of the numerator and denominator degrees of freedom of the test takes into accountthe sample size and the dimension of the blocks (number of variables in each block). Thecanonical correlation between the sets of items of each dimension was also estimated.
3. Results
The measurements of centralization and dispersion of the atlantoaxial, craniovertebral andcephalometric dimensions in the DS and control groups are detailed in Tables 1–3 respectively.
Table 1. Atlantoaxial Measurements in the Study (Down Syndrome) and Control Group.
Measurement * Mean SD Median Minimum Maximum
Study Group (Down Syndrome)
ADI 0.189 0.097 0.149 0.056 0.409
AA1. L 0.165 0.077 0.164 0.034 0.346
AA2. L 0.203 0.088 0.208 0.035 0.371
AA3. L 0.151 0.065 0.143 0.054 0.318
AA1. R 0.186 0.074 0.180 0.074 0.361
AA2. R 0.224 0.073 0.225 0.113 0.469
AA3. R 0.153 0.070 0.143 0.059 0.345
ADL. L 0.431 0.135 0.417 0.153 0.719
ADL. R 0.439 0.176 0.435 0.140 1.020
Control Group
ADI 0.181 0.052 0.167 0.120 0.412
AA1.L 0.209 0.068 0.186 0.091 0.381
AA2.L 0.262 0.055 0.262 0.184 0.415
AA3.L 0.196 0.058 0.206 0.104 0.338
AA1.R 0.206 0.094 0.177 0.056 0.474
AA2.R 0.262 0.078 0.250 0.149 0.585
AA3.R 0.190 0.075 0.185 0.115 0.458
ADL.L 0.567 0.847 0.368 0.245 4.190
ADL.R 0.565 0.674 0.420 0.293 3.440* The linear measurements are expressed in centimeters. SD, standard deviation; ADI, atlantodens interval; AA1.L,left mesial atlantoaxial interval; AA2.L, left medial atlantoaxial interval; AA3.L, left distal atlantoaxial interval;AA1.R, right mesial atlantoaxial interval; AA2.R, right medial atlantoaxial interval; AA3.R, right distal atlantoaxialinterval; ADL.L, left lateral atlanto-dens interval; ADL.R, right lateral atlanto-dens interval.
Biology 2022, 11, 496 6 of 13
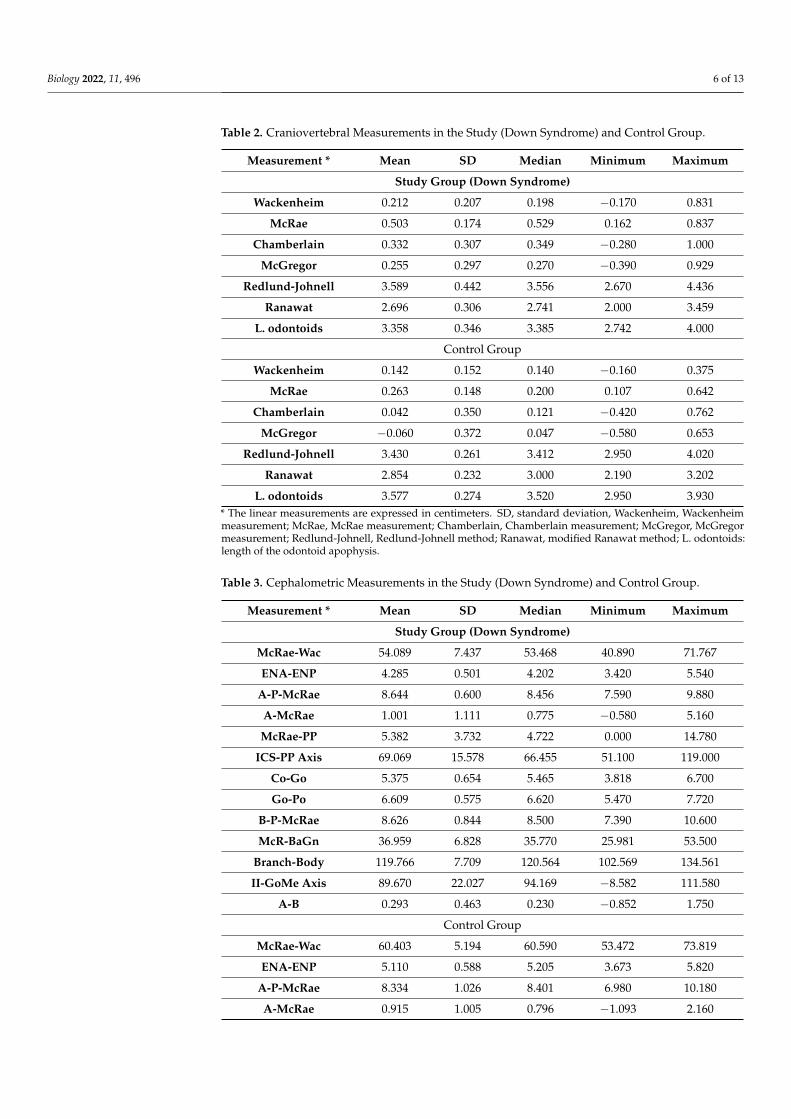
Table 2. Craniovertebral Measurements in the Study (Down Syndrome) and Control Group.
Measurement * Mean SD Median Minimum Maximum
Study Group (Down Syndrome)
Wackenheim 0.212 0.207 0.198 −0.170 0.831
McRae 0.503 0.174 0.529 0.162 0.837
Chamberlain 0.332 0.307 0.349 −0.280 1.000
McGregor 0.255 0.297 0.270 −0.390 0.929
Redlund-Johnell 3.589 0.442 3.556 2.670 4.436
Ranawat 2.696 0.306 2.741 2.000 3.459
L. odontoids 3.358 0.346 3.385 2.742 4.000
Control Group
Wackenheim 0.142 0.152 0.140 −0.160 0.375
McRae 0.263 0.148 0.200 0.107 0.642
Chamberlain 0.042 0.350 0.121 −0.420 0.762
McGregor −0.060 0.372 0.047 −0.580 0.653
Redlund-Johnell 3.430 0.261 3.412 2.950 4.020
Ranawat 2.854 0.232 3.000 2.190 3.202
L. odontoids 3.577 0.274 3.520 2.950 3.930* The linear measurements are expressed in centimeters. SD, standard deviation, Wackenheim, Wackenheimmeasurement; McRae, McRae measurement; Chamberlain, Chamberlain measurement; McGregor, McGregormeasurement; Redlund-Johnell, Redlund-Johnell method; Ranawat, modified Ranawat method; L. odontoids:length of the odontoid apophysis.
Table 3. Cephalometric Measurements in the Study (Down Syndrome) and Control Group.
Measurement * Mean SD Median Minimum Maximum
Study Group (Down Syndrome)
McRae-Wac 54.089 7.437 53.468 40.890 71.767
ENA-ENP 4.285 0.501 4.202 3.420 5.540
A-P-McRae 8.644 0.600 8.456 7.590 9.880
A-McRae 1.001 1.111 0.775 −0.580 5.160
McRae-PP 5.382 3.732 4.722 0.000 14.780
ICS-PP Axis 69.069 15.578 66.455 51.100 119.000
Co-Go 5.375 0.654 5.465 3.818 6.700
Go-Po 6.609 0.575 6.620 5.470 7.720
B-P-McRae 8.626 0.844 8.500 7.390 10.600
McR-BaGn 36.959 6.828 35.770 25.981 53.500
Branch-Body 119.766 7.709 120.564 102.569 134.561
II-GoMe Axis 89.670 22.027 94.169 −8.582 111.580
A-B 0.293 0.463 0.230 −0.852 1.750
Control Group
McRae-Wac 60.403 5.194 60.590 53.472 73.819
ENA-ENP 5.110 0.588 5.205 3.673 5.820
A-P-McRae 8.334 1.026 8.401 6.980 10.180
A-McRae 0.915 1.005 0.796 −1.093 2.160
Biology 2022, 11, 496 7 of 13
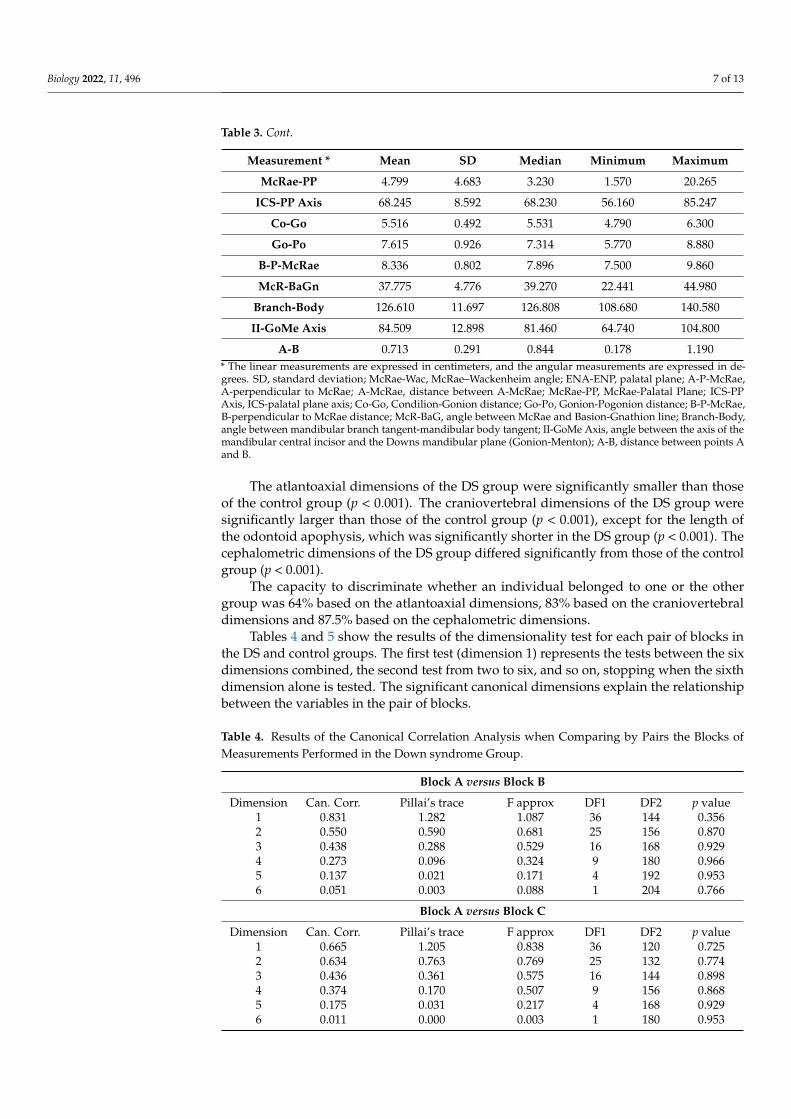
Table 3. Cont.
Measurement * Mean SD Median Minimum Maximum
McRae-PP 4.799 4.683 3.230 1.570 20.265
ICS-PP Axis 68.245 8.592 68.230 56.160 85.247
Co-Go 5.516 0.492 5.531 4.790 6.300
Go-Po 7.615 0.926 7.314 5.770 8.880
B-P-McRae 8.336 0.802 7.896 7.500 9.860
McR-BaGn 37.775 4.776 39.270 22.441 44.980
Branch-Body 126.610 11.697 126.808 108.680 140.580
II-GoMe Axis 84.509 12.898 81.460 64.740 104.800
A-B 0.713 0.291 0.844 0.178 1.190* The linear measurements are expressed in centimeters, and the angular measurements are expressed in de-grees. SD, standard deviation; McRae-Wac, McRae–Wackenheim angle; ENA-ENP, palatal plane; A-P-McRae,A-perpendicular to McRae; A-McRae, distance between A-McRae; McRae-PP, McRae-Palatal Plane; ICS-PPAxis, ICS-palatal plane axis; Co-Go, Condilion-Gonion distance; Go-Po, Gonion-Pogonion distance; B-P-McRae,B-perpendicular to McRae distance; McR-BaG, angle between McRae and Basion-Gnathion line; Branch-Body,angle between mandibular branch tangent-mandibular body tangent; II-GoMe Axis, angle between the axis of themandibular central incisor and the Downs mandibular plane (Gonion-Menton); A-B, distance between points Aand B.
The atlantoaxial dimensions of the DS group were significantly smaller than thoseof the control group (p < 0.001). The craniovertebral dimensions of the DS group weresignificantly larger than those of the control group (p < 0.001), except for the length ofthe odontoid apophysis, which was significantly shorter in the DS group (p < 0.001). Thecephalometric dimensions of the DS group differed significantly from those of the controlgroup (p < 0.001).
The capacity to discriminate whether an individual belonged to one or the othergroup was 64% based on the atlantoaxial dimensions, 83% based on the craniovertebraldimensions and 87.5% based on the cephalometric dimensions.
Tables 4 and 5 show the results of the dimensionality test for each pair of blocks inthe DS and control groups. The first test (dimension 1) represents the tests between the sixdimensions combined, the second test from two to six, and so on, stopping when the sixthdimension alone is tested. The significant canonical dimensions explain the relationshipbetween the variables in the pair of blocks.
Table 4. Results of the Canonical Correlation Analysis when Comparing by Pairs the Blocks ofMeasurements Performed in the Down syndrome Group.
Block A versus Block B
Dimension Can. Corr. Pillai’s trace F approx DF1 DF2 p value1 0.831 1.282 1.087 36 144 0.3562 0.550 0.590 0.681 25 156 0.8703 0.438 0.288 0.529 16 168 0.9294 0.273 0.096 0.324 9 180 0.9665 0.137 0.021 0.171 4 192 0.9536 0.051 0.003 0.088 1 204 0.766
Block A versus Block C
Dimension Can. Corr. Pillai’s trace F approx DF1 DF2 p value1 0.665 1.205 0.838 36 120 0.7252 0.634 0.763 0.769 25 132 0.7743 0.436 0.361 0.575 16 144 0.8984 0.374 0.170 0.507 9 156 0.8685 0.175 0.031 0.217 4 168 0.9296 0.011 0.000 0.003 1 180 0.953
Biology 2022, 11, 496 8 of 13
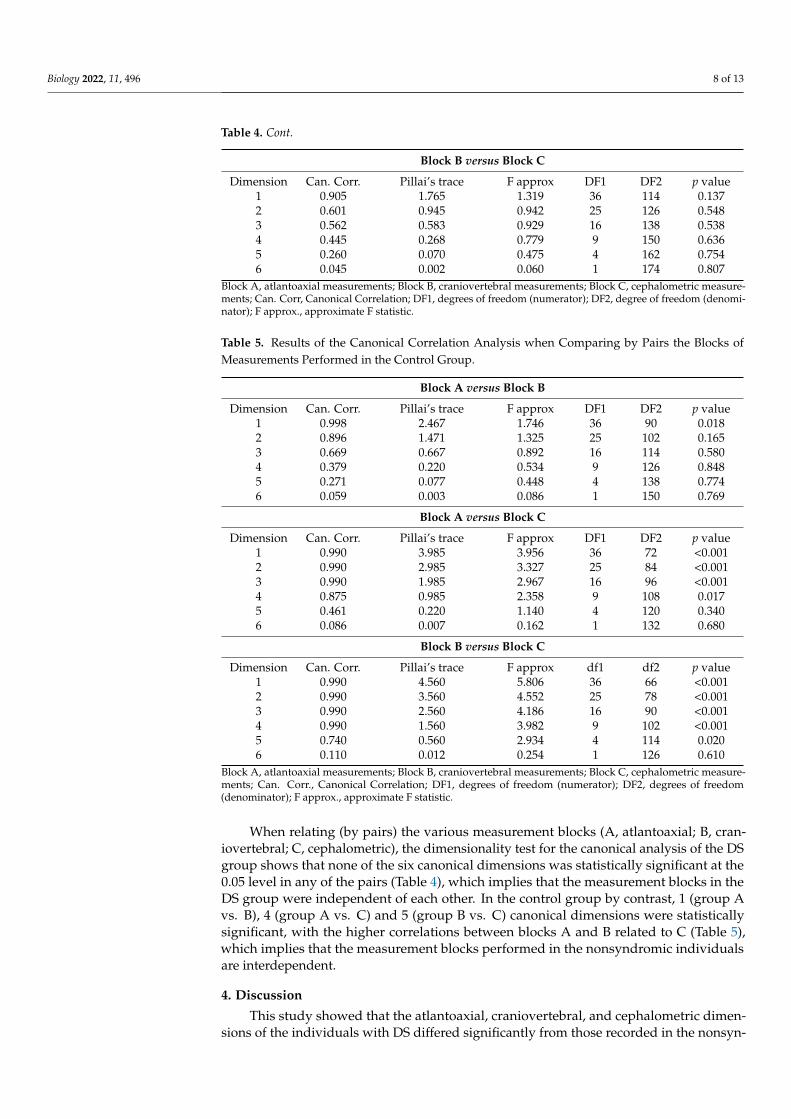
Table 4. Cont.
Block B versus Block C
Dimension Can. Corr. Pillai’s trace F approx DF1 DF2 p value1 0.905 1.765 1.319 36 114 0.1372 0.601 0.945 0.942 25 126 0.5483 0.562 0.583 0.929 16 138 0.5384 0.445 0.268 0.779 9 150 0.6365 0.260 0.070 0.475 4 162 0.7546 0.045 0.002 0.060 1 174 0.807
Block A, atlantoaxial measurements; Block B, craniovertebral measurements; Block C, cephalometric measure-ments; Can. Corr, Canonical Correlation; DF1, degrees of freedom (numerator); DF2, degree of freedom (denomi-nator); F approx., approximate F statistic.
Table 5. Results of the Canonical Correlation Analysis when Comparing by Pairs the Blocks ofMeasurements Performed in the Control Group.
Block A versus Block B
Dimension Can. Corr. Pillai’s trace F approx DF1 DF2 p value1 0.998 2.467 1.746 36 90 0.0182 0.896 1.471 1.325 25 102 0.1653 0.669 0.667 0.892 16 114 0.5804 0.379 0.220 0.534 9 126 0.8485 0.271 0.077 0.448 4 138 0.7746 0.059 0.003 0.086 1 150 0.769
Block A versus Block C
Dimension Can. Corr. Pillai’s trace F approx DF1 DF2 p value1 0.990 3.985 3.956 36 72 <0.0012 0.990 2.985 3.327 25 84 <0.0013 0.990 1.985 2.967 16 96 <0.0014 0.875 0.985 2.358 9 108 0.0175 0.461 0.220 1.140 4 120 0.3406 0.086 0.007 0.162 1 132 0.680
Block B versus Block C
Dimension Can. Corr. Pillai’s trace F approx df1 df2 p value1 0.990 4.560 5.806 36 66 <0.0012 0.990 3.560 4.552 25 78 <0.0013 0.990 2.560 4.186 16 90 <0.0014 0.990 1.560 3.982 9 102 <0.0015 0.740 0.560 2.934 4 114 0.0206 0.110 0.012 0.254 1 126 0.610
Block A, atlantoaxial measurements; Block B, craniovertebral measurements; Block C, cephalometric measure-ments; Can. Corr., Canonical Correlation; DF1, degrees of freedom (numerator); DF2, degrees of freedom(denominator); F approx., approximate F statistic.
When relating (by pairs) the various measurement blocks (A, atlantoaxial; B, cran-iovertebral; C, cephalometric), the dimensionality test for the canonical analysis of the DSgroup shows that none of the six canonical dimensions was statistically significant at the0.05 level in any of the pairs (Table 4), which implies that the measurement blocks in theDS group were independent of each other. In the control group by contrast, 1 (group Avs. B), 4 (group A vs. C) and 5 (group B vs. C) canonical dimensions were statisticallysignificant, with the higher correlations between blocks A and B related to C (Table 5),which implies that the measurement blocks performed in the nonsyndromic individualsare interdependent.
4. Discussion
This study showed that the atlantoaxial, craniovertebral, and cephalometric dimen-sions of the individuals with DS differed significantly from those recorded in the nonsyn-

Biology 2022, 11, 496 9 of 13
dromic individuals. In contrast to the control group, the three measurement blocks in theDS group were independent of each other.
The hypothesis has been suggested that trisomy 21 causes “amplified developmentalinstability”, which results in increased asymmetry and variability of the phenotypic charac-teristics [28,29]. In DS, an increase in fluctuating asymmetry has been reported in skeletalabnormalities [30], dermatoglyphic abnormalities [28], palatal dimensions [31] and facialdysmorphology [27].
Facial morphogenesis requires adequate spatiotemporal deployment of gene products,neural crest cells, and other cells to develop the facial prominences [32]. These prominenceshave to be established, grow and fuse in a coordinated manner to form the structuresthat will comprise a functional craniofacial complex [33]. Trisomy causes a generalizedgenetic imbalance that interrupts the evolutionarily preserved morphogenetic pathwaysof development [34]. This mechanism would explain the onset of orofacial abnormalities,by formation, growth, and/or fusion defects of the facial prominences during embryonalcraniofacial development [34]. Research conducted on Ts65Dn mice, which are trisomicfor the orthologs of approximately half of the genes found in the human chromosome21 and exhibit craniofacial abnormalities similar to DS, confirmed that trisomy 21 was aneurocristopathy that involves cells that give rise to facial prominences [35].
Starbuck et al. [16] reported that facial prominences in DS showed an increase in fluc-tuating asymmetry during facial morphogenesis, which provides arguments for an increasein facial developmental instability in patients with DS. According to these authors [16], theimbalance caused by trisomy variably affects the facial regions derived from the embryonicfacial prominences, therefore jeopardizing the development of these regions rather thancausing a generalized interruption in development, as has been previously suggested [36].
The proponents of the hypothesis of amplified developmental instability [28,37,38]hold that the abnormal phenotypes found in individuals with DS (such as smaller palatesand dental abnormalities) tend to be the same as those that are less damped (or canalized)during the developmental period in euploid individuals. Therefore, these especially labiletraits are more likely to exhibit increased phenotypic variation when they are subjected togenetic or environmental aggressions during development [28,39].
However, Starbuck et al. [40] demonstrated that the faces of children with DS werequantitatively more similar to those of their siblings than to those of unrelated euploidindividuals, and the majority showed variations in the normal variation range establishedamong euploid samples. One of this study’s conclusions, as well as revealing the geneticfoundations of the similarity between relatives, was to confirm the resistance of craniofa-cial development to genetic perturbations caused by trisomy 21 [40]. After performing arigorous biostatistical analysis of the dental dimensions in individuals with DS, a studypublished by Matabuena Rodríguez et al. [41] concluded not only that fluctuating dentalasymmetry was less in DS than in the general population but also that several dental mor-phometric variables could also be more stable in individuals with trisomy 21. These findingsallow us to speculate that canalization in DS could prevail over fluctuating asymmetry.
Another study published by Starbuck et al. [42], whose objective was to study theeffects of trisomy 21 on the covariance patterns of facial measures, compared the mor-phological integration patterns of immature faces of patients with DS and those of theirnonsyndromic siblings. The association patterns of linear distances in the upper and middleportions of the face do not seem to be affected by trisomy 21; however, the associationpatterns of linear distances in the lower part of the face were significantly different be-tween the two groups of individuals. Extrapolating these findings from soft tissues tohard tissues, one could explain why in the present study the values of the cephalometricmeasurements (which mainly affect the lower third of the face) are those with greatercapacity to discriminate whether an individual has DS or belongs to the control group.
Starbuck et al. [42] also found statistically significant differences in terms of morpho-logical integration between various facial regions in the patients with DS, unlike theirnonsyndromic siblings. This finding coincides to a degree with our results, given that
Biology 2022, 11, 496 10 of 13
we found no significant relationship between the cranial-cervical-maxillary measurementblocks in the DS group but did find them in the paired controls.
Pritchard and Kola [26] defended the “gene dosage effect” hypothesis to explain theDS phenotype, to the detriment of the “amplified developmental instability” hypothesis.According to these authors, the phenotypic traits of the aneuploid syndromes and of DS inparticular are the result of an overexpression of specific genes encrypted in chromosome21. Our results confirm that cranial-cervical-maxillary morphological integration is verypoor in the individuals with DS, which allows us to speculate that genetic overload booststhe canalization process, therefore granting certain autonomy to the functional units duringthe growth period.
This study is not exempt from several limitations that should be considered wheninterpreting the results. All of the participants underwent a CBCT examination, whichcould entail a selection bias based on their degree of cooperation [31], given that the patientswith more severe phenotypes, who presumably have an increased degree of intellectualdisability and consequently are less cooperative, could have been involuntarily excluded.CBCT is an indispensable tool for obtaining dental-maxillary-facial images [43]; however,very few studies have been published with this technique to compare with our results.Although CBCT is not justified in any case for exclusively research procedures [44], theimages in our series belonged to the historic file of the University of Santiago de Compostela.The participants likely had to wear a cervical collar while the radiological scan was beingperformed to standardize the neck position, as several authors have suggested [45].
5. Conclusions
The atlantoaxial, craniovertebral, and cephalometric dimensions of individuals withDS differ significantly from those of nonsyndromic controls. Unlike the general population,the individuals with DS had no statistically significant relationship between these threeblocks of dimensions. This confirms that in DS, the cranial-cervical-maxillary morphologicalintegration is very poor, reinforcing the hypothesis of genetic overload to explain the DSphenotype. Additionally, these findings could affect the decision making and the long-termresults of certain interventions in this anatomical region, such as maxillofacial orthopedicsand orthognathic surgery.
Supplementary Materials: The following supporting information can be downloaded at: https://www.mdpi.com/article/10.3390/biology11040496/s1, Table S1: Atlantoaxial, Craniocervical andCephalometric Measurements Performed on cone-beam computed tomography images [45–68].
Author Contributions: Conceptualization, M.T.G.-G., J.L.-P., P.D.-D. and M.D.-F.; Methodology,M.T.G.-G., E.G.-M., I.V.-A., M.T.A.-P. and M.O.-R.; Investigation, M.T.G.-G., E.G.-M., I.V.-A., M.T.A.-P.and M.O.-R.; Writing-original draft preparation, M.T.G.-G., M.T.A.-P. and M.O.-R.; Writing-reviewand editing, P.D.-D., J.L.-P. and M.D.-F.; Supervision, J.L.-P., M.D.-F. and P.D.-D. All authors haveread and agreed to the published version of the manuscript.
Funding: This research received no external funding.
Institutional Review Board Statement: The study design was approved by the Ethics Committee ofthe University of Santiago de Compostela (Spain). (reference number 2010-1724B).
Informed Consent Statement: The participants (or their legal guardians, if necessary) signed aninformed consent authorizing the use of the images.
Data Availability Statement: The data that support the findings of this study are available on requestfrom the corresponding authors.
Conflicts of Interest: The authors declare no conflict of interest.

Biology 2022, 11, 496 11 of 13
References1. Roizen, N.J.; Patterson, D. Down’s syndrome. Lancet 2003, 361, 1281–1289. [CrossRef]2. Al-Biltagi, M.; Kamal, A.; Meakkara, J.J.; Raj, V. Dental problems in Down syndrome children. In Down Syndrome Children—An
Update; Bentham Science Publishers: Sharjah, United Arab Emirates, 2015; Volume 1, pp. 419–466.3. Roper, R.J.; Reeves, R.H. Understanding the Basis for Down Syndrome Phenotypes. PLoS Genet. 2006, 2, e50. [CrossRef]4. Hallgrímsson, B.; Willmore, K.; Hall, B.K. Canalization, developmental stability, and morphological integration in primate limbs.
Am. J. Phys. Anthr. 2002, 119, 131–158. [CrossRef] [PubMed]5. Polak, M. Developmental Instability: Causes and Consequences; Oxford University Press: New York, NY, USA, 2003.6. Willmore, K.E.; Klingenberg, C.P.; Hallgrímsson, B. The relationship between fluctuating asymmetry and environmental variance
in Rhesus macaque skulls. Evolution 2005, 59, 898–909. [CrossRef] [PubMed]7. Palmer, A.; Strobeck, C. Fluctuating asymmetry: Measurement, analysis, patterns. Annu. Rev. Ecol. Evol. Syst. 1986, 17, 391–421.
[CrossRef]8. Van Dongen, S. Fluctuating asymmetry and developmental instability in evolutionary biology: Past, present and future. J. Evol.
Biol. 2006, 19, 1727–1743. [CrossRef] [PubMed]9. Klingenberg, C.P. Morphometric integration and modularity in configurations of landmarks: Tools for evaluating a priori
hypotheses. Evol. Dev. 2009, 11, 405–421. [CrossRef] [PubMed]10. Olson, E.C.; Miller, R.L. Morphological Integration; University of Chicago Press: Chicago, IL, USA, 1958.11. Willmore, K.E.; Young, N.M.; Richtsmeier, J.T. Phenotypic variability: Its components, measurements and underlying devel-
opmental processes. Evol. Biol. 2007, 34, 99–120. [CrossRef]12. Waddington, C.H. Canalization of development and the inheritance of acquired characters. Nature 1942, 150, 563–565. [CrossRef]13. Debat, V.; Alibert, P.; David, P. Independence between developmental stability and canalisation in the skull of the house mouse.
Proc. R. Soc. Lond. B 2000, 267, 423–430. [CrossRef]14. Kucera, J.; Dolezalova, V. Prenatal development of malformed fetuses at 28–42 weeks of gestational age (anencephalus, hy-
drocephalus, Down’s syndrome, cleft lip and palate and hypospadias). Biol. Neonate 1973, 22, 319–324. [CrossRef]15. Jesuino, F.A.S.; Valladares-Neto, J. Craniofacial morphological differences between Down syndrome and maxillary deficiency
children. Eur. J. Orthod. 2013, 35, 124–130. [CrossRef] [PubMed]16. Dedlow, E.R.; Siddiqi, S.; Fillipps, D.J.; Kelly, M.N.; Nackashi, J.A.; Tuli, S.Y. Symptomatic atlanto-axial instability in an ado-lescent
with trisomy 21 (Down’s syndrome). Clin. Pediatr. 2013, 52, 633–638. [CrossRef] [PubMed]17. Down Syndrome Medical Interest Group. Cervical Spine Disorders: Craniovertebral Instability. One of a Set Guidelines Drawn
up by the Down Syndrome Medical Interest Group (DSMIG UK). 2012. Available online: www.dsmig.org.uk (accessed on5 October 2021).
18. Suri, S.; Tompson, B.D.; Cornfoot, L. Cranial base, maxillary and mandibular morphology in Down syndrome. Angle Orthod.2010, 80, 861–869. [CrossRef] [PubMed]
19. Alió, J.; Lorenzo, J.; Iglesias, M.C.; Manso, F.J.; Ramírez, E.M. Longitudinal maxillary growth in Down syndrome patients. AngleOrthod. 2011, 81, 253–259. [CrossRef]
20. Allareddy, V.; Ching, N.; Macklin, E.A.; Voelz, L.; Weintraub, G.; Davidson, E.; Prock, L.A.; Rosen, D.; Brunn, R.; Skotko, B.G.Craniofacial features as assessed by lateral cephalometric measurements in children with Down syndrome. Prog. Orthod. 2016,17, 35. [CrossRef]
21. Moss, M.L.; Young, R.W. A functional approach to craniology. Am. J. Phys. Anthr. 1960, 18, 281–292. [CrossRef]22. Moss, M.L. The functional matrix hypothesis revisited. 1. The role of mechanotransduction. Am. J. Orthod. Dentofac. Orthop. 1997,
112, 8–11. [CrossRef]23. Moss, M.L. The functional matrix hypothesis revisited. 2. The role of an osseous connected cellular network. Am. J. Orthod.
Dentofac. Orthop. 1997, 112, 221–226. [CrossRef]24. Moss, M.L. The functional matrix hypothesis revisited. 3. The genomic thesis. Am. J. Orthod. Dentofac. Orthop. 1997, 112, 338–342.
[CrossRef]25. Moss, M.L. The functional matrix hypothesis revisited. 4. The epigenetic antithesis and the resolving synthesis. Am. J. Orthod.
Dentofac. Orthop. 1997, 112, 410–417. [CrossRef]26. Pritchard, M.A.; Kola, I. The “gene dosage effect” hypothesis versus the “amplified developmental instability” hypothesis in
Down syndrome. J. Neural. Transm. Suppl. 1999, 57, 293–303. [PubMed]27. Starbuck, J.M.; Cole, T.M., 3rd; Reeves, R.H.; Richtsmeier, J.T. Trisomy 21 and facial developmental instability. Am. J. Phys.
Anthropol. 2013, 151, 49–57. [CrossRef] [PubMed]28. Shapiro, B. Amplified developmental instability in Down’s syndrome. Ann. Hum. Genet. 1975, 38, 429–437. [CrossRef]29. Barden, H.S. Fluctuating dental asymmetry: A measure of developmental instability in Down syndrome. Am. J. Phys. Anthr. 1980,
52, 169–173. [CrossRef]30. Blum-Hoffmann, E.; Rehder, H.; Langenbeck, U.; Optiz, J.M.; Reynolds, J.F. Skeletal anomalies in trisomy 21 as an example of
amplified developmental instability in chromosome disorders: Histological study of the feet of 21 mid-trimester fetuses withtrisomy 21. Am. J. Med. Genet. 1988, 29, 155–160. [CrossRef]
31. Shapiro, B.; Gorlin, R.; Redman, R.; Bruhl, H. The palate and Down´s syndrome. N. Engl. J. Med. 1967, 276, 1460–1463. [CrossRef]
Biology 2022, 11, 496 12 of 13
32. Brugmann, S.; Kim, J.; Helms, J. Looking different: Understanding diversity in facial form. Am. J. Med. Genet. Part A 2006,140A, 2521–2529. [CrossRef]
33. Chai, Y.; Maxson, R.E., Jr. Recent advances in craniofacial morphogenesis. Dev. Dyn. 2006, 235, 2353–2375. [CrossRef]34. Young, N.M.; Hu, D.; Lainoff, A.J.; Smith, F.; Diaz, R.; Tucker, A.; Trainor, P.; Schneider, R.; Hallgrímsson, B.; Marcucio, R.
Embryonic bauplans and the developmental origins of facial diversity and constraint. Development 2014, 141, 1059–1063.[CrossRef]
35. Roper, R.J.; VanHorn, J.F.; Cain, C.C.; Reeves, R.H. A neural crest deficit in Down syndrome mice is associated with deficientmitotic response to Sonic hedgehog. Mech. Dev. 2009, 126, 212–219. [CrossRef] [PubMed]
36. Shapiro, B. Down syndrome—A disruption of homeostasis. Am. J. Med. Genet. 1983, 14, 241–269. [CrossRef] [PubMed]37. Cronk, C.E.; Reed, R.B. Canalization of growth in Down syndrome children three months to six years. Hum. Biol. 1981, 53, 383–398.
[PubMed]38. Dunlap, S.S.; Aziz, M.A.; Rosenbaum, K.N. Comparative anatomical analysis of human trisomies 13, 18, and 21: I. The forelimb.
Teratology 1986, 33, 159–186. [CrossRef] [PubMed]39. Shapiro, B.L. Development of human autosomal aneuploid phenotypes (with an emphasis on Down syndrome). Acta Zool. Fenn.
1992, 191, 97–105.40. Starbuck, J.M.; Cole, T.M., 3rd; Reeves, R.H.; Richtsmeier, J.T. The Influence of trisomy 21 on facial form and variability. Am. J.
Med. Genet. A 2017, 173, 2861–2872. [CrossRef] [PubMed]41. Matabuena, M.; Diz, P.; Cadarso-Suárez, C.; Diniz-Freitas, M.; Outumuro, M.; Abeleira, M.T.; Limeres, J. Reassessment of
fluctuating dental asymmetry in Down syndrome. Sci. Rep. 2017, 7, 16679. [CrossRef]42. Starbuck, J.; Reeves, R.H.; Richtsmeier, J. Morphological integration of soft-tissue facial morphology in down syndrome and
siblings. Am. J. Phys. Anthr. 2011, 146, 560–568. [CrossRef]43. Schulze, R.K. CBCT special issue. Dentomaxillofac. Radiol. 2015, 44, 20140380. [CrossRef]44. The American Dental Association Council on Scientific Affairs. The use of cone-beam computed tomography in dentistry: An
advisory statement from the American Dental Association Council on Scientific Affairs. J. Am. Dent. Assoc. 2012, 143, 899–902.45. Rojas, C.A.; Hayes, A.; Bertozzi, J.C.; Guidi, C.; Martinez, C.R. Evaluation of the C1–C2 Articulation on MDCT in Healthy
Children and Young Adults. Am. J. Roentgenol. 2009, 193, 1388–1392. [CrossRef] [PubMed]46. Radcliff, K.E.; Ben-Galim, P.; Dreiangel, N.; Martin, S.B.; Reitman, C.A.; Lin, J.N.; Hipp, J.A. Comprehensive computed
tomography assessment of the upper cervical anatomy: What is normal? Spine J. 2010, 10, 219–229.47. Hinck, V.C.; Hopkins, C.E. Measurement of the atlanto-dental interval in the adult. Am. J. Roentgenol. Radium. Ther. Nucl. Med.
1960, 84, 945–951.48. Wackenheim, A. Roentgen Diagnosis of the Craniovertebral Region; Springer: New York, NY, USA, 1974.49. McRae, D.L.; Barnum, A.S. Occipitalization of the atlas. Am. J. Roentgenol. Radium. Ther. Nucl. Med. 1953, 70, 23–46.50. Chamberlain, W.E. Basilar Impression (Platybasia): A Bizarre De¬velopmental Anomaly of the Occipital Bone and Upper Cervical
Spine with Striking and Misleading Neurologic Manifestations. Yale J. Biol. Med. 1939, 11, 487–496.51. McGregor, M. The significance of certain measurements of the skull in the diagnosis of basilar impression. Br. J. Radiol. 1948,
21, 171–181.52. Redlund-Johnell, I.; Pettersson, H. Radiographic measurements of the cranio-vertebral region, designed for evaluation of
abnormalities in rheumatoid arthritis. Acta Radiol. Diagn. 1984, 25, 23–28.53. Ranawat, C.S.; O’Leary, P.; Pellicci, P.; Tsairis, P.; Marchisello, P.; Dorr, L. Cervical spine fusion in rheumatoid arthritis. J. Bone Joint
Surg. Am. 1979, 61, 1003–1010.54. Kwong, Y.; Rao, N.; Latief, K. Craniometric measurements in the assessment of craniovertebral settling: Are they still relevant in
the age of cross-sectional imaging? AJR Am. J. Roentgenol. 2011, 196, W421–W425.55. Ohnmeiß, M.; Kinzinger, G.; Wesselbaum, J.; Korbmacher-Steiner, H.M. Therapeutic effects of functional orthodontic appliances
on cervical spine posture: A retrospective cephalometric study. Head Face Med. 2014, 10, 7–16.56. Riolo, M.L. An Atlas of Craniofacial Growth; University of Michigan Center for Human Growth and Development: Ann Arbor,
Michigan, 1974.57. Proffit, W.R.; White, R.P.; Sarver, D.M. Contemporary Treatment of Dentofacial Deformity; Mosby: St. Louis, MO, USA, 2003.58. Burstone, C.J.; James, R.B.; Legan, H.; Murphy, G.A.; Norton, L.A. Cephalometrics for orthognathic surgery. J. Oral Surg. 1978,
36, 269–277.59. McNamara, J.A., Jr. A method of cephalometric evaluation. Am. J. Orthod. 1984, 86, 449–469.60. Coben, S.E. Basion Horizontal coordinate tracing films. J. Clin. Orthod. 1979, 13, 598–605.61. Coben, S.E. Basion Horizontal: An Integrated Concept of Craniofacial Growth and Cephalometric Analysis; Computer Cephalometric
Associated: Jenkintown, PA, USA, 1986.62. Karlsen, A.T. Craniofacial morphology in children with Angle Class II-1 malocclusion with and without deepbite. Angle Orthod.
1994, 64, 437–446.63. Karlsen, A.T. Longitudinal changes in Class I subjects with moderate mandibular skeletal protrusion. Angle Orthod. 1998,
68, 431–438.64. Karlsen, A.T.; Krogstad, O. Morphology and growth in convex profile facial patterns: A longitudinal study. Angle Orthod. 1999,
69, 334–344.

Biology 2022, 11, 496 13 of 13
65. Ricketts, R.M. A foundation for cephalometric communication. Am. J. Orthod. 1960, 46, 330–357.66. Ricketts, R.M. An overview of computerized cephalometrics. Am. J. Orthod. 1972, 61, 1–28.67. Ricketts, R.M. Perspectives in the clinical application of cephalometrics: The first fifty years. Angle Orthod. 1981, 51, 115–150.68. Tweed, C.H. The diagnostic facial triangle in the control of treatment objectives. Am. J. Orthod. 1969, 55, 651–657.