Situation Assessment for Mobile Robots - DTU Orbit
187
General rights Copyright and moral rights for the publications made accessible in the public portal are retained by the authors and/or other copyright owners and it is a condition of accessing publications that users recognise and abide by the legal requirements associated with these rights. Users may download and print one copy of any publication from the public portal for the purpose of private study or research. You may not further distribute the material or use it for any profit-making activity or commercial gain You may freely distribute the URL identifying the publication in the public portal If you believe that this document breaches copyright please contact us providing details, and we will remove access to the work immediately and investigate your claim. Downloaded from orbit.dtu.dk on: Apr 13, 2022 Situation Assessment for Mobile Robots Beck, Anders Billesø Publication date: 2012 Document Version Publisher's PDF, also known as Version of record Link back to DTU Orbit Citation (APA): Beck, A. B. (2012). Situation Assessment for Mobile Robots. Technical University of Denmark.
-
Upload
khangminh22 -
Category
Documents
-
view
0 -
download
0
Transcript of Situation Assessment for Mobile Robots - DTU Orbit

General rights Copyright and moral rights for the publications made accessible in the public portal are retained by the authors and/or other copyright owners and it is a condition of accessing publications that users recognise and abide by the legal requirements associated with these rights.
Users may download and print one copy of any publication from the public portal for the purpose of private study or research.
You may not further distribute the material or use it for any profit-making activity or commercial gain
You may freely distribute the URL identifying the publication in the public portal If you believe that this document breaches copyright please contact us providing details, and we will remove access to the work immediately and investigate your claim.
Downloaded from orbit.dtu.dk on: Apr 13, 2022
Situation Assessment for Mobile Robots
Beck, Anders Billesø
Publication date:2012
Document VersionPublisher's PDF, also known as Version of record
Link back to DTU Orbit
Citation (APA):Beck, A. B. (2012). Situation Assessment for Mobile Robots. Technical University of Denmark.

Anders Billesø Beck
Situation Assessment for Mobile Robots PhD thesis, September 2012


This thesis is submitted to the Department of Electrical Engineering, atthe Technical University of Denmark in partial fulfillment of the require-ments for the degree of Doctor of Philosophy.
The work was performed within the IndustrialPhD program in col-laboration between the Danish Technological Institute (DTI), RobotTechnology and the department of Automation and Control, DTUElectrical Engineering in the period from July 2009 to September 2012.The project was partially funded by the Danish Agency for Science,Technology and Innovation.
Supervisors of the project have been Associate Professor Ole Ravn andAssociate Professor Nils Axel Andersen from Automation and Control,DTU Electical Engineering.
Industrial supervisor was Claus Risager, ph.d., head of Danish Techno-logical Institute, Robot Technology.


Abstract
Mobile robots have become a mature technology. The first cable guided logisticsrobots were introduced in the industry almost 60 years ago, but in this timethe market has only experienced a very modest growth. However, consideringthe achievements in research the last 15 years within perception and operationin natural environments together with the reductions of costs in modern sensorsystems, the growth potential for mobile robot applications are enormous.
Many new technological components are available to move the limits of com-mercial mobile robot applications, but a key hindrance is reliability. Naturalenvironments are complex and dynamic, and thus the risk of robots misinter-preting the environment or failing to detect critical circumstances is unavoidable.To deal with this challenge, the control of robot applications must be able tohandle imperfect observations and gracefully recover from unavoidable errors.The controller needs to know what is going on.
This thesis addresses exactly this problem from the hypothesis that an as-sessment of the situation for the robot, will be able to contribute with essentialknowledge to the robot control and enable the understanding of the currentsituation as well as predict the future status.
A novel framework for situation modeling are presented, which applies anExtensible Markov Model (EMM) to represent the spatio-temporal nature ofsituations. On-line data-streams from the robot sensors and algorithms are pro-cessed using stream-based clustering to build the spatio-temporal structure ormatch the situation of the robot to existing states. Situation prediction is pro-posed using an on-line graph-search of maximum likelihoods in the EMM.
The developed software modules are integrated in a new software architec-ture, which facilitates integration into any robotic control framework and useson-line visualization of the spatio-temporal graphs to optimize situation classi-fication.
The results are evaluated in three real-world scenarios, which successfullyevaluates capabilities of the proposed situation assessment framework within de-tection of known spatio-temporal relations, deviation from known spatio-temporalpatterns, and detection of known critical situations.
v


Resume
Mobile robotter er blevet en moden teknologi, hvor de første kabelførte logis-tikroboter blev introduceret i industrien for nœsten 60 ar siden. Igennem dennetid, har markedet for mobile robotter i industrien dog kun bevidnet en megetmoderat vœkst. Forskningen inden for mobile robotter har dermod bevidnet enmalrettet indsats de sidste 15 ar, som har resulteret i stœrke resultater inden foralgoritmer og styring. Disse resultater, samt, at nødvœndige advancerede sensorsystemer er faldet markant i pris, abner et enmormt vœkstpotientiale inden formobile robotter.
Mange nye teknologi-komponenter er allerede klar til at flytte grœnserne foranvendelsen af mobile robotter i naturlige omgivelser, men en nøgleudfordringfor at dette kan lykkes er deres palidelighed. Naturlige omgivelser er komplekseog dynamiske, hvilket medfører der er en uundgaelig risiko for at robotten mis-fortolker omgivelserne eller forfejler detektionen af kritiske omstœndigheder. Forat handtere disse udfordringer, ma styringen af robot-applikationen vœre i standtil at handtere fejlbehœftede observationer og komme videre efter uundgaeligefejl. Robottens styringssystem er nødt til at vide hvad der egentligt foregar.
Denne afhandling adresserer netop dette problem, ud fra den hypotese, atvurdering og forstaelse af robottens situation kan bidrage med essentiel viden tilrobotstyringen og gøre denne i stand til at forsta robottens nuvœrende situationsamt forudse hvad der vil ske i den nœre fremtid.
Et nyt system for situations modellering bliver prœsenteret, der anvenderen Extensible Markov Model til at representere den spatio-temporale natur afsituationer. On-line data-streams fra robottens sensorer og algorithmer bliverbehandlet ved brug af stream-baseret clustering til at bygge den spatio-temporalemodel og til at matche robottens situation til eksisterende tilstande. Forudsigelseaf situationer er realiseret ved brug af on-line grafsøgning af maximum likelihoodi den spatio-temporale model.
De udviklede software moduler er integreret i en software arkitektur, sommuliggør integration i et hvilkarligt robotstyrings system og anvender on-linevisualizering af den spatio-temporale graf for at optimere klassifikation af situa-tioner.
Resultaterne er evalueret i tre brugsscenarier der, med success, vurderer sit-uation assessment systemet i forhold til detektion af kendte spatio-temporalerelationer, afvigelser fra kendte spatio-temporale mønstre og detektion af kendtekritiske situationer.
vii


Acknowledgments
I would first of all like to thank my university supervisors Ole Ravn and NilsA. Andersen for the cooperation, advice and encouragement. We have had along journey together, and I appreciate the knowledge, the inspiration and thefriendship that I bring with me.
I secondly want to express my gratitude to my industry supervisor and man-ager Claus Risager, for taking me onboard for this project and for your endlessinspiration, motivation and energy in this project, and in many to come.
I would also like to thank the other members of the Automation group atDTU for inspiring discussions, in particular my office-mate Søren Hansen androbotics-codewizard Christian Andersen for good and inspirational times. Aspecial thanks to Dorthe Hansen for patient and thorough proofreading of thisthesis.
Thanks also to my colleagues at DTI for the daily support, discussions andchallenges. In particular my team leader Kurt Nielsen for sparring, encourage-ment and gentle pushes. Further thanks to Mikkel Viager for the collaborationand assistance in the experimental work and to Lars Dalgaard and Bridget Hal-lam providing valuable feedback to this thesis.
A thanks to the Robotics and Embedded Systems department of the Tech-nische Universitat Munchen for welcoming me at the department and giving mea pleasant and educational stay. Special thanks to Dr. Reinhard Lafrenz forinviting and supervising me, to Prof. Alois Knoll for facilitating my stay andfinally to Alexander Perzylo for enjoyable office companionship and the endlesshospitality of you and your family.
Thanks to my friends and family for always being there with support andmotivation, this journey would not have been the same without you. A gratefulthought is sent to my father Gunnar who is not with us to witness this day, butwhom without I would not have been the person that I am, and achieved whatI have today.
Finally, my greatest appreciation and gratitude is to my wife Tanja and mytwo sons Frederik and Mads, without your love, support and energy this wouldnot have been possible. Thank you for bearing with me throughout this journey,and in particular the past months.
Anders Billesø Beck
ix

Acknowledgments
September 2012
x

Contents
Abstract v
Resume vii
Acknowledgments ix
Contents xi
1 Introduction 11.1 Challenges for mobile Robots . . . . . . . . . . . . . . . . . . . . 21.2 Working hypothesis . . . . . . . . . . . . . . . . . . . . . . . . . . 31.3 Situation Assessment . . . . . . . . . . . . . . . . . . . . . . . . . 31.4 Contributions . . . . . . . . . . . . . . . . . . . . . . . . . . . . . 4
1. Situation Assessment . . . . . . . . . . . . . . . . . . . 42. Modeling framework . . . . . . . . . . . . . . . . . . . 53. Software architecture . . . . . . . . . . . . . . . . . . . 5
1.5 Thesis outline . . . . . . . . . . . . . . . . . . . . . . . . . . . . . 5
2 Mobile Robots 72.1 Mobile Robots in General . . . . . . . . . . . . . . . . . . . . . . 82.2 Commercial applications for mobile robots . . . . . . . . . . . . . 9
2.2.1 Industrial applications . . . . . . . . . . . . . . . . . . . . 9Examples of industrial mobile robot systems . . . . . . . 10
2.2.2 Non-industrial use of mobile robots . . . . . . . . . . . . . 132.3 State-of-the-art for mobile robot applications . . . . . . . . . . . 15
2.3.1 Autonomous Cars . . . . . . . . . . . . . . . . . . . . . . 152.3.2 Field Robots . . . . . . . . . . . . . . . . . . . . . . . . . 162.3.3 Service Robots . . . . . . . . . . . . . . . . . . . . . . . . 18
2.4 Robotic Software Frameworks . . . . . . . . . . . . . . . . . . . . 202.4.1 Architectures vs. Frameworks . . . . . . . . . . . . . . . . 212.4.2 Hierarchical architecture structures . . . . . . . . . . . . . 24
2.5 Modern Robotics Frameworks . . . . . . . . . . . . . . . . . . . . 262.5.1 Robot Operating System: ROS . . . . . . . . . . . . . . . 262.5.2 DTU Mobotware . . . . . . . . . . . . . . . . . . . . . . . 28
2.6 Task Execution and challenges . . . . . . . . . . . . . . . . . . . 35
xi
Contents
2.7 Summary . . . . . . . . . . . . . . . . . . . . . . . . . . . . . . . 36
3 Situations for Mobile Robots 393.1 The importance of situations in automation systems . . . . . . . 403.2 Situations . . . . . . . . . . . . . . . . . . . . . . . . . . . . . . . 40
3.2.1 Critical situations . . . . . . . . . . . . . . . . . . . . . . 423.2.2 Example of handling critical situations . . . . . . . . . . . 42
3.3 Strategies for Situation Assessment . . . . . . . . . . . . . . . . . 433.3.1 Type 1: Detection of known spatio-temporal relations . . 443.3.2 Type 2: Deviation from known spatio-temporal patterns . 463.3.3 Type 3: Detection of known critical situations . . . . . . 473.3.4 Type 4: Black Swan events . . . . . . . . . . . . . . . . . 48
3.4 Summary . . . . . . . . . . . . . . . . . . . . . . . . . . . . . . . 49
4 Situation Assessment 514.1 Information Fusion . . . . . . . . . . . . . . . . . . . . . . . . . . 52
4.1.1 The JDL Model . . . . . . . . . . . . . . . . . . . . . . . 544.1.2 Situation Assessment . . . . . . . . . . . . . . . . . . . . . 57
4.2 Situation Awareness . . . . . . . . . . . . . . . . . . . . . . . . . 584.2.1 The Endsley model of Situation Awareness . . . . . . . . 59
4.3 Modeling Spatial and Temporal Relations . . . . . . . . . . . . . 624.3.1 Methods and assumptions . . . . . . . . . . . . . . . . . . 644.3.2 The Extensible Markov Model . . . . . . . . . . . . . . . 644.3.3 Other frameworks for spatio-temporal modeling. . . . . . 66
4.4 Situation Assessment Modeling Framework . . . . . . . . . . . . 674.4.1 Model definition . . . . . . . . . . . . . . . . . . . . . . . 70
4.5 Situation prediction engine . . . . . . . . . . . . . . . . . . . . . 714.5.1 Maximum likelihood of graph sequences . . . . . . . . . . 724.5.2 Modification of Dijkstra’s algorithm . . . . . . . . . . . . 72
4.6 Summary . . . . . . . . . . . . . . . . . . . . . . . . . . . . . . . 74
5 Processing Information Streams 775.1 Model-based approaches . . . . . . . . . . . . . . . . . . . . . . . 785.2 Pattern recognition and cluster analysis . . . . . . . . . . . . . . 785.3 Definition of information streams . . . . . . . . . . . . . . . . . . 79
5.3.1 On-line clustering of data streams . . . . . . . . . . . . . 805.4 Clustering engine design . . . . . . . . . . . . . . . . . . . . . . . 81
5.4.1 Distance metric . . . . . . . . . . . . . . . . . . . . . . . . 825.5 Examining the effects of clustering . . . . . . . . . . . . . . . . . 83
5.5.1 Analysis using static clustering . . . . . . . . . . . . . . . 855.5.2 Analysis using EMM and on-line stream clustering . . . . 87
5.6 Summary . . . . . . . . . . . . . . . . . . . . . . . . . . . . . . . 905.7 Further improvements . . . . . . . . . . . . . . . . . . . . . . . . 90
6 Situation Assessment Platform 916.1 Platform architecture . . . . . . . . . . . . . . . . . . . . . . . . . 92
6.1.1 Design decisions . . . . . . . . . . . . . . . . . . . . . . . 936.2 Heterogeneous data sources . . . . . . . . . . . . . . . . . . . . . 96
xii

Contents
6.3 Situation modelling . . . . . . . . . . . . . . . . . . . . . . . . . . 976.3.1 Loading of Models . . . . . . . . . . . . . . . . . . . . . . 98
6.4 Pre-processing of data . . . . . . . . . . . . . . . . . . . . . . . . 996.5 Component structure . . . . . . . . . . . . . . . . . . . . . . . . . 101
6.5.1 Hierarchical structure . . . . . . . . . . . . . . . . . . . . 1026.6 On-line data visualization and inspection . . . . . . . . . . . . . 104
6.6.1 Graph visualization in the SA-Platform . . . . . . . . . . 1066.7 Summary . . . . . . . . . . . . . . . . . . . . . . . . . . . . . . . 107
7 Experimental Evaluation 1097.1 Narrow passage detection . . . . . . . . . . . . . . . . . . . . . . 110
7.1.1 Situation analysis . . . . . . . . . . . . . . . . . . . . . . . 1107.1.2 Door passage using simulated data . . . . . . . . . . . . . 1147.1.3 Door passage using real world data . . . . . . . . . . . . . 120
7.2 The AGV Logistics Robot . . . . . . . . . . . . . . . . . . . . . . 1237.2.1 Situations in the application . . . . . . . . . . . . . . . . 125
7.3 Detection of errors in AGV localization tracking . . . . . . . . . 1287.3.1 Situation model design . . . . . . . . . . . . . . . . . . . . 1307.3.2 Situation assessment results . . . . . . . . . . . . . . . . . 131
7.4 AGV Situation characterization and prediction . . . . . . . . . . 1327.4.1 Situation model design . . . . . . . . . . . . . . . . . . . . 1337.4.2 Situation assessment results . . . . . . . . . . . . . . . . . 135
7.5 Discussion . . . . . . . . . . . . . . . . . . . . . . . . . . . . . . . 1447.6 Performance considerations . . . . . . . . . . . . . . . . . . . . . 146
7.6.1 Algorithm analysis . . . . . . . . . . . . . . . . . . . . . . 1467.6.2 Memory management . . . . . . . . . . . . . . . . . . . . 1477.6.3 Measurement of performance . . . . . . . . . . . . . . . . 1487.6.4 GPU implementation . . . . . . . . . . . . . . . . . . . . 1497.6.5 Performance comparison and evaluation . . . . . . . . . . 1517.6.6 Summary . . . . . . . . . . . . . . . . . . . . . . . . . . . 153
8 Conclusions 1558.1 Summary of Achievements . . . . . . . . . . . . . . . . . . . . . . 156
8.1.1 Situation Assessment for mobile robots . . . . . . . . . . 1568.1.2 Situation Assessment modeling framework . . . . . . . . . 1578.1.3 Software architecture . . . . . . . . . . . . . . . . . . . . . 158
8.2 Experimental results . . . . . . . . . . . . . . . . . . . . . . . . . 1598.3 Future work . . . . . . . . . . . . . . . . . . . . . . . . . . . . . . 160
Bibliography 163
xiii


1
Introduction
Mobile robots are becoming a mature technology and applied in an increasingnumber of domains and applications. Mobile robots have existed in industry foralmost 60 years as Automated Guided Vehicles (AGVs), but their distributionhas only been increasing at a modest pace. Most new applications and productsthat emerge are merely evolutions of the original AGV principles using improvedsensor technologies and better integration into production IT infra structures. Inrecent years, where most obvious processes in industry have become automatedusing specialized production equipment and industrial manipulation robots, in-troduction of mobile robots for improving logistics performance are the nextlogical step. Nevertheless, the market for AGVs are still orders of magnitudesmaller, where IFRs World Robotics 2012 statistics note 2.100 sold systemsworldwide in 2011 compared to 181.000 sold units of industrial manipulationrobots (IFR Statistical Department, 2012).
There is currently a diffusion of mobile robot application away from industrialsettings towards service robot applications, both in professional and domesticdomains. New technologies and significant drops in sensor prices begin to enablemobile robots to enter new and more challenging applications. Unfortunately,these new robots have a difficult route to the commercial markets. The leadingapplications in relation to sales are military purposes for professional services(where Unmanned Aerial Vehicles account for 75 % of the sales) and the domesticservice area is mostly dominated by household robotics such as vacuum cleaners,lawn mowers and entertainment robots (IFR Statistical Department, 2012). Newapplications like professional cleaning, inspection, maintenance, and securityrobots only hold a neglect able part of the sales figures.
A major impact area for mobile robots in recent years are hospitals. Hos-pitals have enormous volumes of intra logistics of medical supplies, food, cleanand dirty linen, blood samples, and surgery equipment. The cost of this logisticscan amount to more than 30 % of the annual hospital budgets, which makes theintroduction of mobile robots for logistics obvious in this domain. A number ofcompanies have established them in this domain, and have developed platformswhich navigate on natural environment contours and are safe to operate amonghumans. In Denmark, experiments with mobile robots have already been con-ducted at Svendborg Sygehus in 2009 for transportation of blood samples. Led
1

1. Introduction
by the Danish Technological Institute, a larger scale integration of the Aethon1
robot platform will commence in the fall of 2012 in Sygehus Sønderjylland, ini-tially also for blood samples but later for several other applications such ascustom food delivery.
The growth potential for the mobile robot market is considered very large, asthe basic technologies are mature and many new applications and technologiesare investigated in this domain. The widespread market penetration of mobilerobots has now been predicted almost continuously for the last decade, e.g. byGates (2007), but nothing really seems to happen. Why is that?
1.1 Challenges for mobile Robots
Demonstrations in research laboratories demonstrate capabilities which signif-icantly exceed what we find applied in commercial products. Mobile roboticshave been subject to intensive research the last 15 years and a broad part of thekey scientific challenges, such as localization, mapping, navigation planning andenvironment perception, are now considered solved.
Sensor systems have dropped significantly in price recent years, and newtechnologies emerge, which present previously unseen price/performance rela-tionships, like the Microsoft Kinect cameras, which enable 3D perception forless than 80 euro. Together with cost effective mobile platforms, developmentsystems can be set-up for very reasonable cost and pave the way for competitivecommercial products.
One key obstacle of why so few commercially attractive products enter themarkets despite of the technical possibilities is reliability. Reliable perception ofnatural environments, navigation among natural obstacles of any size and in anyplace, and detection of objects with only partially known geometries are reallylarge challenges which yet have not seen any solutions that are fail safe. Whenintegrating these challenges into one application, it sets a very high demand tothe error handling capabilities of application control systems, which are an areawhere a limited amount of research results has been presented.
To make a reliable system for application control, it is essential to have aproper comprehension of the current situation to make informed decisions torecover from errors or, even better, to predict the likelihood of future errors inorder to avoid them instead of recovering from them. The comprehension ofsituations for mobile robots and the prediction of future events are the issuesstudied in this thesis.
1Aetheon, Automated Hospital Delivery and Asset Management Solutions,http://www.aethon.com, 2012
2

1.2. Working hypothesis
1.2 Working hypothesis
The work presented in this thesis has been conducted in the context of an In-dustrialPhD project at the Danish Technological Institute (DTI), Robot Tech-nology. The three year program is co-funded by the Danish Agency for Science,Technology and Innovation and has the purpose to connect Danish industry andacademia.
For DTI the goal of the project has been twofold as 1) to investigate intothe challenges and applications for the future of mobile robotics and as 2) tospecifically address the issue of reliability in robotics applications and intelligentinterpretation of both errors and normal situations. The context throughout thework has been confined to mobile robotics, but with a general outlook in mindto ensure the possibility of future transfer to other domains.
The challenges of this thesis have focused on comprehending the currentsituation of the robot, and assessing if that complies with state estimates withinthe robot control, in order to identify possible critical situations and enable therobot control to handle them gracefully.
The approach to this thesis has been formulated in the two hypotheses, as itis assumed:
• that scenarios of application for mobile robots can be adequately describedin a finite number of situations.
• that a generalized model for situation description and comprehension canbe developed, which will be able to cover the majority of situations thatwill occur for a mobile robot in any area of application.
As an approach to this challenge, this thesis presents an investigation intothe domain of situation assessment from a mobile robot application perspective.
1.3 Situation Assessment
Knowledge and comprehension of the current situation are defined in literatureas situation awareness (Endsley, 1995), where the process of achieving, acquiringand maintaining situation awareness is known as situation assessment. Researchand analysis into situation awareness for human operators dates back to WorldWar I, where it was used to describe crucial performance characteristics for crewsin military aircrafts. Later it has been used to generally describe the assessmentcapabilities of military performers and in the 1990s the term was adopted by thehuman factors area of research.
In the human factors domain, situation awareness (SA) has been investigatedin complex dynamic decision making environments, such as air traffic control,operation of large automation systems (e.g. nuclear power plants) (Endsley,2006), as well as ground fire commanders (Klein, 1989), in order to understandthe processes of (SA) and how to design systems which optimize operator SA inthe best possible way.
3

1. Introduction
Situation assessment is also addressed in the domain of information fusion, asa process of achieving higher level knowledge by fusion of a number of lover leveldata sources. Strategies in this domain are based on development of relationshipsbetween objects and events in the context of their environments. Applicationof research in this level of information fusion is found in the military domainfor battlefield overviews or intelligence gartering, or in the civilian domain forsystems for cyber security.
The presented approach to situation assessment considers the contributionsfrom both areas of research to form a model for situation assessment and inves-tigates as the first the use of situation assessment in the domain of mobile robotapplications.
1.4 Contributions
By the work of this thesis, a number of contributions was made, which can bedivided into three main categories:
1. Situation Assessment
The work presented is a novel approach towards a connection between situa-tion assessment from an information perspective and the challenges of mobilerobotics. The challenges of mobile robot applications are investigated and anumber of popular open source robotics frameworks have been investigated tomap their capabilities in higher level application control. Only very limited capa-bilities are found in this area, and those frameworks which have presented deci-sion architecture and included higher level tools are now abandoned from futuredevelopment. The frameworks that have caught popularity are the architectureneutral, which are easy to use, but leaves the entire application development tothe user.
Modeling and representation approaches to situations are investigated anddefine situations as spatio-temporal relations between objects. The analysislead to the proposal of three strategies to achieve situation assessment in themobile robot domain: detection of known spatio-temporal relations, deviationfrom known spatio-temporal patterns, and detection of known critical situations.These strategies are used to form the situation model and addressed specificallyin the experimental evaluation.
The DTU MobotWare framework is discussed and presented as roboticsframework for the work of this thesis. The architecture and approaches to high-level application control of DTU MobotWare have been published in:
• A. B. Beck, N. A. Andersen, J. C. Andersen, and O. Ravn. Mobotware- a plug-in based software framework for mobile robots. In 7th IFACSymposium on Intelligent Autonomous Vehicles, Lecce, Italy, 2010.
• A. B. Beck, N. A. Andersen, and O. Ravn. Mission management for Mo-bile Robots. In L. Akdahl, editor, The fourth Swedish Workshop on Au-tonomous Robots, volume I, Vesteras, September 2009. Robotdalen.
4

1.5. Thesis outline
2. Modeling framework
A novel situation modeling framework is presented, which can parameterize andrepresent situations in a general context and has been evaluated in a mobilerobot context with good results.
The model accepts heterogeneous data from a flexible data-source systemwhich creates a good infrastructure to any robotics framework. Situations arerepresented in the spatio-temporal Extensible Markov Model (EMM) frameworkby Dunham et al. (2004). The EMM enables a situation model to evolve on-lineand yet to maintain the spatio-temporal structure. The Markov Chain represen-tation of EMM is efficient for analyzing state relationships in both the spatialand temporal domain in order to comprehend the situations the relationshipsdescribe.
Real-time data are processed and matched to states in the EMM usingstream-based clustering, as a non model-based approach to dealing with sen-sor noise and doing data reduction. A prediction engine enables on-line predic-tion of future events based on graph-search in the likelihoods captured in thespatio-temporal model.
The situation modeling approach and parts of the experimental results ofthis thesis have been published in:
• A. B. Beck, C. Risager, N. A. Andersen, and O. Ravn. Spatio-TemporalSituation Assessment for Mobile Robots. In 14th International Conferenceon Information Fusion, Chicago, 2011.
3. Software architecture
A new software architecture is proposed to integrate the contributed softwaremodules in a flexible, expandable and modular framework. The architecture isimplemented in the Situation Assessment Platform (SA-Platform).
A flexible data source module enables seamless integration to any roboticsframework or other sensor data source. The evolution of the spatio-temporalEMM is visualized in real-time by adaptation and real-time interface of theGephi graph visualization software. The visualization proved very beneficial forhuman comprehension of situations represented by the EMM.
The use of the SA-Platform has enabled demonstration and evaluation of thesituation modeling framework using on-line and real-world examples.
1.5 Thesis outline
The structure of this thesis follows the classical scientific model: analysis, syn-thesis and evaluation, where chapter 2 and 3 analyses the challenges and assump-tions of the presented work, followed by chapters 4, 5 and 6 which synthesizeand discuss the proposed theoretical approaches of the thesis. Finally, chapter7 presents the experimental evaluation of the proposed approach.
5

1. Introduction
The structure and outline of each chapter are therefore as follows:
Chapter 2 entitled Mobile Robots addresses the domain of application for mo-bile robots. The chapter also presents an analysis of a number of roboticssoftware frameworks and reviews their capabilities of higher level mod-ules for application control. Furthermore, DTU MobotWare is presentedtogether with a discussion of the challenges in mobile robot task execution.
Chapter 3 entitled Situations for Mobile Robots first introduces the definitionof situations and critical situations for mobile robots. This leads to apresentation of the strategies for situation assessment.
Chapter 4 entitled Situation Assessment presents the fundamental of situationassessment from an Information Fusion perspective as well as from the Hu-man Factors perspective. The chapter furthermore presents the proposedspatio-temporal situation definition together with the situation modelingframework and prediction engine.
Chapter 5 entitled Processing Information Streams presents the challenge ofprocessing on-line streams of information with focus on a non model-basedapproach. This leads to the design of the stream based clustering engine.
Chapter 6 entitled Situation Assessment Platform presents the architectureand design of the Situation Assessment Platform software framework.
Chapter 7 entitled Experimental Evaluation presents the experiments conductedto evaluate the performance of the situation modeling framework. A totalof three experiments is conducted, where each experiment addresses oneof the strategies for situation assessment.
Chapter 8 entitled Conclusions presents the final conclusions of this disserta-tion and highlights the major contributions as well as a brief discussion offuture work.
6

2
Mobile Robots
In scientific and popular literature the emergence of second generation intelli-gent service robots outside laboratories has been predicted repeatedly for thelast 10 years (Gates, 2007). In this decade advanced algorithms for localizationand navigation have been maturing towards industrial strength implementationsand the capabilities of affordable computing and sensor hardware continuouslyincrease. Yet we still do not see intelligent service robots in our home, in ourworkplace or at the shopping centers. The reason is that reliable long term oper-ation in dynamic and indeterministic environments is a huge challenge, not onlyfor the navigation and localization systems but also for the system capabilitiesof handling unplanned and even unexpected events.
As of today, even simple service operations as grass cutting, floor cleaningand logistics such as retrieving and delivering items are carried out by humansbecause mobile service robots lack the reliability to deliver professional graderesults. In opposition to industrial robots, mobile service robots must operatein environments, which are designed with no regards to the robots that mustoperate in them. Daily operating conditions involve frequent changes in theenvironment and a high likelihood of the robot getting caught in situations thatstandard navigation methods are unable to resolve or could bring the robot inundesirable or even potentially harmful situations.
In the following chapter I will present the application where mobile robotsplay an important role. I investigate how they are used in industry, in domesticsettings and how they are demonstrated in state-of-the art research applications.The purpose of the investigation is to clarify which challenges mobile robotsare facing and how applications are designed to handle them. Furthermore, Iinvestigate how the efforts within community driven software frameworks formobile robots address design and execution of mobile robot applications andwhat capabilities they have for handling potential errors.
DTU MobotWare is the mobile robot control software framework used for thework of this thesis. In the last part of this chapter the architecture of MobotWareis presented. Finally, I discuss strategies for handling errors in mobile robotapplications and why situation assessment can be an important contribution toimproving this capability.
7
2. Mobile Robots
2.1 Mobile Robots in General
Mobile robots distinguish themselves from their counterparts, the industrial ma-nipulators, by being able to move about in their environment. When industrialmanipulation robots work in the same environmental setting, most parts of theenvironment and workspace can be considered static.
As definition of this thesis I consider mobile robots as all types of robots,which are capable of moving about in their environment without any fixed at-tachment (no linear axes or rails), where robots referred to as industrial robotsaccount for industrial manipulators who are mechanically fixed to the environ-ment.
Many simplified approaches to mobile robot control also assume a staticenvironment, but yet the robot has to move about in the environment. Justmoving about introduces a higher level of uncertainty than for industrial robots,as there is no direct way of getting feedback to whether the commanded motionsactually were executed as expected, wheels might be slipping. In most industrialrobot settings, the environment can actually kept adequately unchanged, sothat a simple control script with fixed coordinates will be enough to control aninstallation for years.
For mobile robots, the real challenge is that even in dedicated industrialsettings it is very difficult to enforce a static environment, as human workersalmost always will be present in the workspace of the mobile robots. Humanswill move things around and intercept the operation space of the robot, forcingthe robot to sense the environment in real-time and reconstruct plans, motionsand estimates dynamically.
Workspaces for mobile robots are almost always much larger than for mostindustrial robot installations. In these large workspaces it is often difficult todetermine accurate coordinates of objects in the workspace using a global co-ordinate system, often simply because of measurement inconvenience but alsoaccuracy of affordable measurement tools. Besides of often operating with lowaccuracy information on elements in the environment, the technologies com-monly applied to estimate the location of the robot location in the environmenthave an accuracy which is several orders of magnitude worse than what is knownin industrial robots.
Mobile robots are especially suited for tasks where there is a need for a largeworkspace. The tasks are not only on the sense of pure logistics and inspection,but a lot of effort in research and development projects is currently put intomobile manipulation robots. When reach of the industrial manipulators becomefairly large (> 2 m), the only available robots are often large scale heavy liftingmanipulators. So despite fairly low payloads, i.e. 10 kg for packing, a robot witha payload of several hundreds of kilos is often used, just because it has the reach.These huge robots in light packaging stations can be replaced by significantlysmaller robots on mobile bases.
8

2.2. Commercial applications for mobile robots
2.2 Commercial applications for mobile robots
2.2.1 Industrial applications
Mobile robots gain an increasing popularity in industrial settings. Commercialsystems are most commonly used in larger warehouse environments and pro-duction facilities that produce or consume large quantities of material. In thesesettings they transport material to and from storage to production machinesand they transport products to packaging, around warehouses and onto trucks.These logistic functions require complex handling of orders and storage loca-tions, which can be overwhelming for humans but fairly easily integrated intoorder and Warehouse Management Systems (WMS). The tight integration ofWMS and task control of the mobile robot fleet entails that most suppliers ofmobile robot systems deliver complete systems of warehouse, order and logisticsmanagement together with the mobile robot hardware.
Navigation and localization of the industrial platforms, known as AutomaticGuided Vehicles (AGVs), were previously done by traditional methods, suchas embedding magnetic/electromagnetic guide wire in factory floors or paintingultraviolet reflective tracks. Most recent installations use reflective laser guid-ance, where a rotating laser is mounted on AGVs well above human head leveland reflective markers are placed in exposed places, such as corners. Having ageometric map of reflectance markers allows the laser system to triangulate theposition of the AGV quite robustly. Newer systems, like the SICK NAV350 illus-trated in figure 2.1, use a combination of marker based localization and distancemeasurements of the natural environment, so that environment contours can beused for localization where no reflective markers are visible. This allows laserguidance systems to be used, even in situations such as truck loading/unloadingwhere no reflective markers can be used.
Figure 2.1: Loading and unloading of trucks using reflective markers and environment con-tours for localization can be accomplished by the new Sick NAV350 navigation system
Laser guidance has a fairly good accuracy, for example the SICK NAV3xxseries has a position accuracy of ±4 mm with a systematic and statistical er-ror of ±10 mm (SICK, 2012), which is on par or slightly better than mostresearch grade localization systems. To distinguish laser guided robots from the
9

2. Mobile Robots
traditional AGVs, they are often referred to as Laser Guided Vehicles (LGVs).Another popular system for laser guided navigation is produced by GuidanceNavigation2.
Examples of industrial mobile robot systems
The following shows examples of commercial mobile robot systems for industrialapplications, both illustrating the focus of industrial mobile robot products aswell as the technologies which are applied to in the robotic platforms:
Elettric 803 is a leading Italian supplier of logistics and warehouse manage-ment solutions, especially for end-of-line tasks. For logistics and intra warehouseoperation they exclusively use LGVs in many different forms to transport goodsto and from packaging systems. Positioning in the Elettric 80 LGV platformsis done by the SICK NAV platform. Quite a lot of suppliers similar to Elettric80 exist, such as Egemin, Frog, Atab, Savant, CoreCon, etc. who all supplytraditional system infrastructures to transport pallets and other bulk contain-ers around production and packaging facilities, as well as they supply completeWMS to manage the logistics processes and LGV fleets.
Figure 2.2: Commercial LGV platform from Elettric 80 for light warehouse automation. Allrights of this image are courtesy of Elettric 80 c©.
Aethon4 is an American based mobile robot developer, who provides inno-vative robotic hospital delivery systems and asset management solutions. Morethan 100 hospitals throughout USA employ customized Aethon solutions for in-tra logistics. Tasks like transporting blood samples, dirty laundry and warmmeals can be automated using Aethons TUG mobile robot platform, illustratedin figure 2.3. The platform uses sensing in the natural environment for navi-gation, based on ultrasonic, infra-red and laser-scanners measure distances tothe environment and navigate the robot. Maps for navigation are created from
2Guidance Navigation Limited, http://www.guidance.eu.com, 20123Elettric 80, Total Business Solutions, http://www.elettric80.com, 20124Aetheon, Automated Hospital Delivery and Asset Management Solutions,
http://www.aethon.com, 2012
10

2.2. Commercial applications for mobile robots
building CAD files or learned by the robot/operator if they are not available.Evaluation and integration projects of the TUG platform into Danish hospitalswill commence in fall 2012 with DTI as lead integrator.
Figure 2.3: The Aethon TUG delivery platform, which will be demonstrated in Denmark inthe fall of 2012.
Swisslog5 is a swiss based globally leading integrator of logistic solutions.The focus of Swisslog is to provide solutions for the industry segments of foodand beverage, retail, pharmaceuticals and healthcare. In the European researchcommunity, Swisslog is especially known for their TransCar mobile robot plat-form, which is employed at many European hospitals and illustrated in figure2.4. The platform is also laser guided, using SICK safety laserscanners to local-ize and guide it through the hospital environment. The laserscanner is placed atfloor level, which makes robust tracking of environment contours slightly chal-lenging, as it has to look through human feet and other non-stationary obstacles.A benefit of having the navigation system at floor level is that it eliminates theneed for an additional safety laserscanner to avoid collisions with humans andstatic objects.
5SWISSLOG, A leading global provider of integrated solutions, http://www.swisslog.com/,2012
11

2. Mobile Robots
Figure 2.4: Swisslog TansCar logistic robot platform is designed to lift and move materialcarts around hospitals.
Kiva Systems6 is a truly innovative player on the mobile robotics mar-ket. The Kiva Systems concept is a mobile robot system specifically designedfor fulfilling orders in the large volume mail-order industry. The small Kivamobile robot platforms transport racks in warehouses directly to the operators,who mix-pack cartons for shipment. In this way, the Kiva system automaticallybrings the right products directly to the operator, who can effectively pick theitems and fulfill orders much more efficient than manually picking with a trolleyaround a large warehouse, as shown in figure 2.5. Navigation of the Kiva mobilerobot platforms is done, using a rather simplistic approach by reading positionbar codes on the floor, which are placed in a grid in the entire warehouse floor.Ultrasonic sensors are used for obstacle avoidance. Where Kiva especially dis-tinguishes itself from competitors, is that their solution does not focus entirelyon mobile robot technology but has rather focused on optimal flow of materi-als and using mobile robots as just one of the means of achieving that. In May2012, Kiva Systems was acquired by Amazon for no less than $775 million, whichunderlined the impact the company gained in its short 9 year lifetime.
6Kiva Systems, A Different kind of Material Handling Company & Complete WarehouseAutomation Solution, http://www.kivasystems.com, 2012
12

2.2. Commercial applications for mobile robots
Figure 2.5: The Kiva Systems robotic platforms transport shelve units from warehouseinventory to packing stations in parallel, so operators always have the shelves and items athand.
This section of industrial mobile robot usage makes it quite obvious, thatmobile robots are used in many different domains in industrial settings. However,the largest majority of the robot systems are still designed with the sole purposeof transporting goods around in the respective facilities.
2.2.2 Non-industrial use of mobile robots
Domestic-like settings have been the primary target and playground for mobilerobotics research for quite some time. The reason why research has focused a loton domestic environments is that domestic settings cannot be customized for therobot systems in the same degree as in industrial settings, where the workspacesare significantly modified to suit the mobile robots. Mobile robots for domesticuse must operate in the natural environments of humans.
Two different usage scenarios exist for non-industrial mobile robots: profes-sional service and domestic service. Professional services range from healthcareand indoor cleaning and pool cleaning. Domestic services include vacuum clean-ing robots, lawn moving robots and robots for telepresence. Revenue is notproduced by professional or domestic services at the same level as industrial ser-vices, so earnings by employing mobile robots can often only be counted in thenumber of minutes which they liberate human service personnel, whereas indus-trial systems can improve earnings by much larger factors as they can improveproduction throughput.
Professional cleaning would seem like an obvious target for automation us-ing mobile robots. Large scale floor washing machines already exist and onlyan addition of a navigation system and navigation of large open spaces are aspecialty for mobile robots. Building commercial professional cleaning robotshave been attempted by many large industrial players, such as Hefter (usingSiemens control), Karcher, Subaru, Servus, Hako, Comac, Cybernetix, Robosoft
13

2. Mobile Robots
and many more. Examples of the robots can be seen in figure 2.6. Unfortu-nately, these robots had competed with very low salaries in the cleaning sectorand large cleaning capabilities for the existing manual solutions. None of pre-viously mentioned solutions had commercial success and can be bought today(Elkmann et al., 2009).
Figure 2.6: Professional floor cleaning solutions produced by Hako, Servus, Comac andHefter. None of the solutions had commercial success and are available for sale today.
In the personal segment, vacuum cleaning robots have had major successand represent what most non-roboticists consider a mobile robot. The segmentwas pioneered by the American company iRobot, who initially started buildingrobots for military purposes in 1990. In 2002 they introduced the Roomba,the first mobile robot vacuum cleaner to gain global popularity with a totalof more than 5 million sold units. The Roomba has been updated on severaloccasions through its life cycle, but the upgrades have mostly been mechanicaland on software, not on navigation system. In the following years, many vacuumrobots have followed using principles very similar to the Roomba. Recently newtechnologies are finding its way into the vacuum cleaning robots, such as theSamsung Navibot who uses an upwards facing camera to map and navigate inrooms and follow straight cleaning paths. The latest contribution to vacuumrobots is the Neato Robotics XV-15, who uses a proprietary low cost rotatinglaserscanner to map and navigate the cleaning area in similar manner to State-of-the-art research systems. The laserscanner allows the XV-15 to clean justwithout bumping into all obstacles, to clean in a very ordered fashion, structurethe sequence of rooms for cleaning and suspend cleaning for charging and resumeagain from the spot where it stopped.
14

2.3. State-of-the-art for mobile robot applications
Figure 2.7: Development in the cost-sensitive market of personal vacuum cleaning robotsis also beginning to introduce technologies previously only used in research. The NeatoRobotics XV-15 uses a cost effective rotating laserscanner for mapping and localization,making it capable of navigating entire houses, vacuum in straight lines, and is finishing oneroom at the time.
2.3 State-of-the-art for mobile robot applications
Research within mobile robotics is pushing the limits of mobile robot applicationseven further. Sensor technologies are not limited by commercially viable businesscases, and robustness does not necessarily need to meet industry standards ofthousands of hours between failures.
The following section will look into state-of-the-art of mobile robot applica-tions in order to further lay out the landscape of the challenges and situationswhich need to be tackled in these systems.
2.3.1 Autonomous Cars
A major research initiative from the American Defence Advanced ResearchProjects Agency (DARPA) has directed quite some attention towards devel-opment of autonomous cars. Starting with the 2004 Grand Challenge, DARPAposted a competition for autonomous cars. The 2004 and 2005 challenges wereto navigate 240 km and 212 km respectively in the Mojave Desert. The GrandChallenge was superseded in 2007 by the Urban Challenge, a 96 km urban raceat the closed George Air Force Base and including challenges such as obeyingtraffic regulations, negotiating traffic and obstacles as well as merging into traffic.Throughout the years of the Grand Challenge, the capabilities of the competingvehicles significantly improved performance, from 2004 where no vehicle passed11 km to 2007 where 6 vehicles completed the challenging course. The rivalry ofthe competition was especially between Stanford, the winning team in 2005 and
15

2. Mobile Robots
second place in 2007, headed by Sebastian Thrun and Carnegie Mellon, secondplace in 2005 and winner in 2007
In the slipstream of the Grand Challenges, autonomous driving slipped a bitin the background of the robotics community. Some initiatives kept working onthe challenge, such as the Urban Challenge 2007 competitor, VisLab departmentfrom the University of Pharma. Their recent prototype ”BRAiVE” (figure 2.8),is a completely customized x-by-wire, where the sensory system of 10 cameras, 4laserscanners, 16 single-point lasers, GPS and IMUs is completely integrated intothe car. The primary goal of BRAiVE is to be a research platform to developindustry-grade capabilities of driver assistance, such as lane assistance, adaptivecruise control and elements of autonomous driving.
Figure 2.8: The BRAiVE autonomous car research platform.
Head of the Stanford Racing Team, Sebastian Thrun, joined Google on asabbatical and co-invented Google Street View in this period. Inspired by theGrand Challenge and Street View, the cooperation between Google and Thruntook another level in 2010, when Google announced the Self-driving Car projectheaded by Thrun. Googles project brought renewed fuel to research in self-driving cars, and the achievements from their Toyota Prius, equipped with aVeloDyne LIDAR HDL-64E 64-beam laserscanner are impressive.
The accumulated distance travelled by the Google car has now surpassed300.000 miles with an ambition to pass 1 million miles soon. In 2011 the state ofNevada passed a law on public licensing of autonomous vehicles. The law wentinto effect in March 1, 2012 and the Google Prius was the first car to pass theautonomous driving test and be awarded a street license and a red set of licenseplates, marked with the infinity symbol and the text ”autonomous vehicle”(Paul,2012).
2.3.2 Field Robots
Robots for field operation are another area, where mobile robots are beginningto play an important role. Many manufactures of heavy agricultural equipmentare intensively developing auto-pilot systems for their vehicles.
16
2.3. State-of-the-art for mobile robot applications
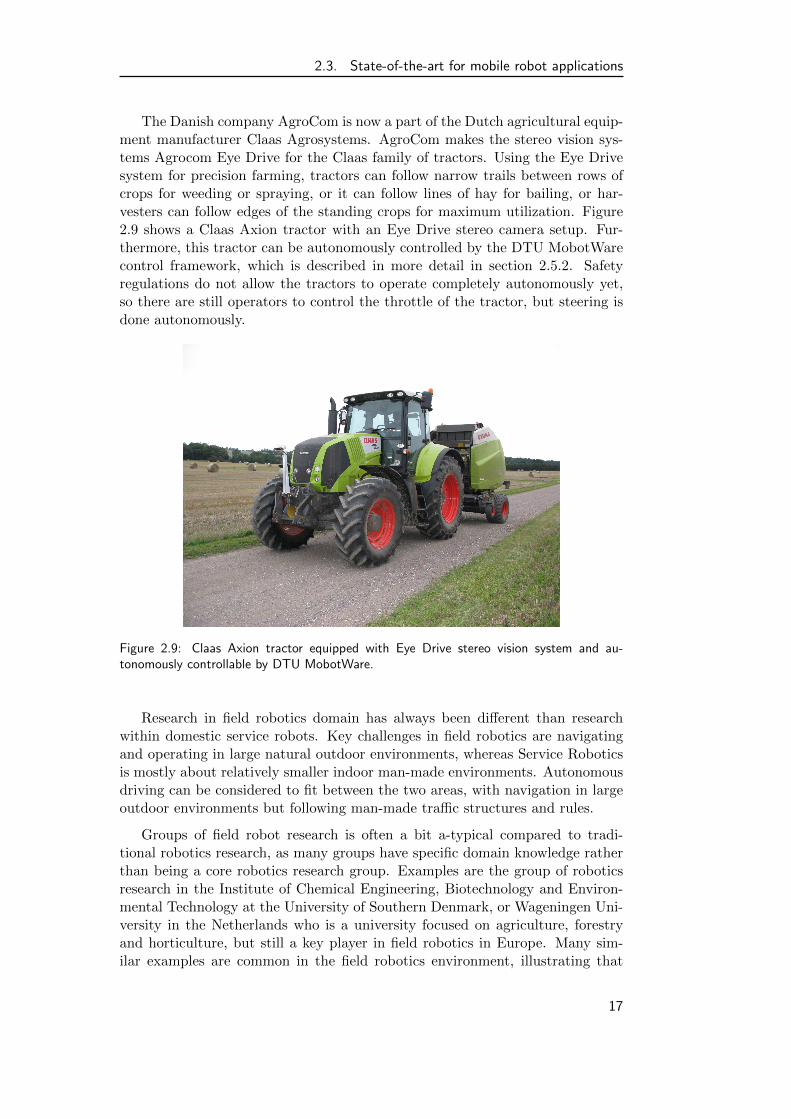
The Danish company AgroCom is now a part of the Dutch agricultural equip-ment manufacturer Claas Agrosystems. AgroCom makes the stereo vision sys-tems Agrocom Eye Drive for the Claas family of tractors. Using the Eye Drivesystem for precision farming, tractors can follow narrow trails between rows ofcrops for weeding or spraying, or it can follow lines of hay for bailing, or har-vesters can follow edges of the standing crops for maximum utilization. Figure2.9 shows a Claas Axion tractor with an Eye Drive stereo camera setup. Fur-thermore, this tractor can be autonomously controlled by the DTU MobotWarecontrol framework, which is described in more detail in section 2.5.2. Safetyregulations do not allow the tractors to operate completely autonomously yet,so there are still operators to control the throttle of the tractor, but steering isdone autonomously.
Figure 2.9: Claas Axion tractor equipped with Eye Drive stereo vision system and au-tonomously controllable by DTU MobotWare.
Research in field robotics domain has always been different than researchwithin domestic service robots. Key challenges in field robotics are navigatingand operating in large natural outdoor environments, whereas Service Roboticsis mostly about relatively smaller indoor man-made environments. Autonomousdriving can be considered to fit between the two areas, with navigation in largeoutdoor environments but following man-made traffic structures and rules.
Groups of field robot research is often a bit a-typical compared to tradi-tional robotics research, as many groups have specific domain knowledge ratherthan being a core robotics research group. Examples are the group of roboticsresearch in the Institute of Chemical Engineering, Biotechnology and Environ-mental Technology at the University of Southern Denmark, or Wageningen Uni-versity in the Netherlands who is a university focused on agriculture, forestryand horticulture, but still a key player in field robotics in Europe. Many sim-ilar examples are common in the field robotics environment, illustrating that
17

2. Mobile Robots
challenges in this environment are just as much in the field processes and heavyequipment as they are within robotics.
2.3.3 Service Robots
Robots for providing services are a less well defined area than e.g. industrialrobots. Since 2007 a working group of ISO has been reviewing the ISO8373,which will include an official definition of service robots. Until then, the IFR 7
has adopted a tentative definition of service robots as
“A service robot is a robot which operates semi- or fully autonomouslyto perform services useful to the well-being of humans and equipment,excluding manufacturing operations.” (International Frederation ofRobotics, 2012)
In research, service robots are most commonly addressed as mobile manipu-lation robots. These robot platforms are the closest real siblings of the householdservice robots, known from sci-fi movies. When combining manipulation armsand mobile platforms, the robots can move about to grasp and operate thingsin a normal domestic environment. But comparing the enormous global effortsput into this domain and the results achieved, there is yet a significant way togo, before we see the robots enter our everyday kitchens.
In 2006, Scott Hassan founded Willow Garage in Menlo Park, California,a company to accelerate research in non-military robotics and promote opensource software development within robotics. Through the Personal RoboticsProgram (PR Program), Willow Garage set off to push the limits of what canbe done with personal service robots. Building on the robot platform developedfrom professor Ken Salisbury’s lab at Stanford (PR1), Willow Garage developedthe PR2 (Personal Robot 2) platform. The PR2 is a research-centric design withcompletely controllable hardware architecture, massive computation and sensorsuite, omni-directional mobile base and safe dual manipulation arms. In 2010Willow Garage made a call for proposals to a PR2 beta program, where researchinstitutions could apply for borrowing one of 11 PR2s for two years againstcontributing their research results to the open source robotics community.
One of the groups who was awarded a PR2 in the beta program was the IASgroup of the Technische Universitat Munchen (TUM), led by Professor MichaelBeetz. The capabilities of the PR2 suited the research activities of the IAS group,who is striving towards making cognition enabled service robots. Examples oftheir research activities are the use of integration of semantic knowledge intocomputer vision for scene classification and object recognition and the integra-tion of knowledge processing and reasoning to automatically specify and createthe action sequences required to solve household tasks. Figure 2.10 illustratesthe PR2 making popcorn at an official demonstration at the IAS laboratory inMunchen.
7International Federation of Robotics
18

2.3. State-of-the-art for mobile robot applications
Figure 2.10: The PR2 making popcorn at an official demonstration at TUM IAS laboratory.
The Fraunhofer Institute for Manufacturing Engineering and Automation(IPA) has through more than 14 years developed another state-of-the-art ser-vice robot platform: the Care-O-Bot. The Care-O-Bot was initially designedas a tour guide robot in 1998, but the second generation in 2002 introduced amanipulator to enable the use of the platform for mobile manipulation research.The third generation Care-O-Bot 3 was designed as a mobile butler robot, ca-pable of performing manipulation tasks safely with a rear-mounted industrialmanipulator and serving humans with a touch-screen equipped tray in front.
In the research project WiMi-Care, the Care-O-Bot 3 was demonstrated inthe nursing home Parkheit Berg in Stuttgart, Germany (Fraunhofer IPA, 2011).In the demonstration the Care-O-Bot was used to assist the nursing staff byproviding glasses of water to the residents of the facility. By registration ofwater consumption in databases together with active follow up by interactionwith the residents, the Care-O-Bot could single out the residents which have nothad enough to drink and offer them additional drinks. In order to accomplishthe application, the Care-O-Bot was capable of grasping cups, filling them ata water dispenser and place them on the tray for serving. Figure 2.11 showsCare-O-Bot serving a cup of water to a nursing home resident.
19

2. Mobile Robots
Figure 2.11: The Care-O-Bot 3 serving water to the residents of the nursing home ParkheitBerg in Stuttgart, Germany.
All the presented novel applications of mobile robotics clearly illustrate, thatthere are significant challenges and massive research connected to any advancesin the possible applications within this area. Furthermore, when the large num-ber of advanced sensors and software components are integrated in an applica-tion, there is a fairly high likelihood of any of these modules failing at someunexpected point and thus causing an application error. This generally moti-vates the need of a general situation assessment tool in these applications tolearn the natural behavior of the application and to comprehend and possiblyeven predict application errors.
2.4 Robotic Software Frameworks
In research, a number of software systems have been developed and publishedto encapsulate research achievements and to form an infrastructure for runningmobile robot applications. Before the millennium it was commonplace for eachresearch group to develop and maintain their own software infrastructures tocontrol the mobile robots. It caused software to be rewritten again and again inresearch groups all over the world and countless hours was spent, especially ondeveloping software infrastructures to support development, configuration andexecution of the robot software modules.
The purpose of this section is to analyze the characteristics of the mostcommon robotics frameworks used as development platform for state-of-the-artrobot applications. The particular focus of the analysis is to investigate thestrategies used to execute the robot applications and which capabilities exist toensure that applications are correctly executed and the mission goals actually
20

2.4. Robotic Software Frameworks
are achieved.
Pioneered in the early 2000’s by Gerkey et al. (2001) with the Player projectand Montemerlo et al. (2003) with the CARMEN toolkit, a consensus started togrow in the robotics community that open source software and common frame-works were the way to join forces and reach new goals with research robotics.From this period, many research projects turned to the use of these frameworks,as they provided infrastructure, hardware abstraction and simulation capabil-ities. However, many established research groups already had much work in-vested in their own frameworks and the result was initially that most existingframeworks became open source. The popularity of open source robot-controlframeworks also opened a lot of discussion of how to develop reusable robot soft-ware components, i.e. by initiatives like the Best Practices in Robotics (BRICS)project (Bischoff et al., 2010) and how frameworks and functionality were diffi-cult to keep separated (Makarenko et al., 2007).
Initiated by the software requirements of the Personal Robotics Program andthe PR2 robot platform, Willow Garage presented a general open source roboticsframework to the global robotics research community. A clear part of the WillowGarage strategy was to unite the forces of the robotic research community, bydesigning a strong and feature rich framework for community driven open sourcedevelopment. So in 2008, the Robot Operating System: ROS (Quigley et al.,2009) was presented. The impact of introducing ROS in the robotics researchcommunity has been second to none.
2.4.1 Architectures vs. Frameworks
Despite the widespread adaptation of robotic software frameworks, the primarybenefit of using a framework was initially that researchers could avoid writinghardware device drivers. Some functionality exists in the cores of most frame-works but it is not until the last few years that robust modules e.g. for localiza-tion were considered a standard. The results were that there were not producedsignificantly better results on higher level tasks when frameworks were used thanfrom groups who used self-designed and monolithic control software.
This claim is supported by a larger survey by Kramer and Scheutz (2007),which analyses nine public domain frameworks in depth, not only on featuresbut also on the specific goals of the frameworks, the practical usability andthe scientific impact (by related publications). Many software platforms aredifficult to include in the comparison, such as Cyberbotics Webots (althoughthis is quite widely used) and Evolution Robotics’ ERSP, as they are closedsource commercial platforms. The interesting NASA platform CLARAty (Nes-nas et al., 2006) has not been included either, as the platform was not releasedto public domain at the time of the analysis. In June 2007 NASA choose togo open source with CLARAty, which caused some excitement in the roboticscommunity. But seemingly it has lost momentum again, and nothing has beenpublished on CLARAty since 2008. Other frameworks not considered in thesurvey was Lego Mindstorms, as it was too specific for one platform, as wellas Orocos (Bruyninckx, 2001) and YARP (Metta et al., 2006), as Kramer and
21

2. Mobile Robots
Scheutz (2007) set a minimum requirement that one cohesive application shouldhave been developed in the framework at the time of writing. Interestingly bothOrocos and YARP have survived and become somewhat popular frameworksthe following years. The frameworks included into the analysis were ultimatelynine: TeamBots8, ARIA 9, Player/Stage (Gerkey et al., 2001), Pyro, CARMEN(Montemerlo et al., 2003), MissionLab (MacKenzie and Arkin, 1998), ADE (An-dronache and Scheutz, 2004) and MARIE (Cote et al., 2008).
The analysis of Kramer and Scheutz (2007) evaluates frameworks based onthe following categories of criteria:
1. Specification Formalisms, methodologies, and design tools.2. Platform support Hardware, low-level interface and system support.3. Infrastructure Components and capabilities as part of the framework.4. Implementation Application control and components of the architecture.
The criteria forms a very in-depth analysis of the frameworks, as the qual-ity of each top-level criterion is evaluated on basis of 4-9 sub-criteria. In thespecification category only an around half of the frameworks have architecturalprimitives implemented to support organization of modules e.g. for control,behaviors and perception, but all of them are considered to be architecture neu-tral. Being architecture neutral can be considered a benefit for rapid applicationdevelopment, as there are no stringent doctrines which must be followed, butwhen applications grow, it is often the cause for anarchy. Furthermore, whenno distinct architectures are followed, it becomes much more difficult to developgeneral modules for higher level functionality when there are no clear definitionson which role the higher level modules play in the architecture. The evaluationresults for each top-level criteria are shown in table 2.1.
FrameworkFeature
Specification Platform Infrastructure Implementation Total
TeamBots 83 % 17 % 0 % 10 % 28 %
ARIA 67 % 33 % 38 % 47 % 45 %
Player/Stage 50 % 83 % 56 % 57 % 59 %
Pyro 83 % 83 % 31 % 73 % 64 %
CARMEN 67 % 83 % 50 % 33 % 47 %
MissionLab 100 % 67 % 63 % 50 % 60 %
ADE 100 % 50 % 100 % 60 % 74 %
Miro 83 % 50 % 56 % 47 % 53 %
MARIE 83 % 100 % 63 % 77 % 76 %
Table 2.1: Comparison of feature scores for the evaluated robotic frameworks by Kramerand Scheutz (2007).
8TeamBots R©, http://www.teambots.org/, c©Tucker Balch, 20009ARIA, Mobile Robotics Inc., http://robots.mobilerobots.com/wiki/ARIA, 2012
22

2.4. Robotic Software Frameworks
ADE and MARIE earn the highest score in total features in table 2.1 onthe preceding page with 74 % and 76 % respectively, closely followed by Pyrowith 64 %, all caused by superior results in one or two specific categories. Thisunderlines that most frameworks are created with one specific ideology where itperforms rather well, but overall good scores are difficult and some scores caneven be contradictory to the ideology of the framework.
Digging into the evaluation key-points, especially interesting criteria in thecontext of this thesis are the fault tolerance and higher level reasoning capabil-ities of the frameworks. The level of features supported in the frameworks willtell important details about well handling of errors and deviation from plannedactions are handled. Fault tolerance is evaluated mostly on basis of separationbetween components, on basis of whether the failure of one component will crashthe framework and does any mechanism aid to its recovery. Player/Stage, CAR-MEN, MissionLab, MARIE and Miro do support component isolation by the useof 3rd party middleware (IPC and ACE). These features will allow the frame-work to keep running despite of software failures, but there is no functionalityon application level to ensure that the mission gets correctly executed.
Another criteria evaluates the capabilities of predefined components of theframeworks. Besides the classical localization, route planners and vision com-ponents, some frameworks also contain higher level reasoning components, suchas rule-based interpreters in ADE, MARIE and MissionLab, generic task plan-ners in MARIE and MissionLab, and learning modules in TeamBots, Pyro andMissionLab. These components can all be beneficial for developing higher levelrobustness in application execution. Rules-based systems and task planners canbe used to handle deviations from plans and learning modules can be used to fur-ther adapt to changes in application assumptions. It is still up to the applicationdeveloper to implement these functionalities using the supplied modules.
Framework Total Usability Total Impact
TeamBots 35 % 10 %
ARIA 53 % 10 %
Player/Stage 82 % 80 %
Pyro 88 % 15 %
CARMEN 59 % 25 %
MissionLab 71 % 35 %
ADE 76 % 30 %
Miro 29 % 30 %
MARIE 50 % 35 %
Table 2.2: Comparison of usability and impact results for the evaluated robotic frameworksby Kramer and Scheutz (2007).
Player / Stage received a general high usability score, as illustrated in table2.2, and by far the highest score for impact with 80 %, more than double of
23

2. Mobile Robots
MARIE and MissionLab who shared the second place. The popularity of Play-er/Stage is highly interesting, as the framework did not score top results in eitherthe features or usability scores. What attracted users to the framework was thatit was designed directly to be a programming interface, rather than a develop-ment environment or enforcing any types of architecture. This caused Player /Stage to be a good choice for researchers who wanted to get into robot develop-ment and research quickly, without the hassle of writing hardware device driversand communication infrastructure. The popularity also produced a number ofready modules for sensor processing and simple differential motion control, butdue to the programming interface ideology and lack of system architecture, nohigher level modules were ever introduced into the Player / Stage distribution.The principles of Player / Stage were carried on by the key developer BrianGerkey, who was requited by Willow Garage and brought into the foundationsof ROS.
From the 9 frameworks reviewed in the paper by Kramer and Scheutz (2007),TeamBots stopped active development in 2000, Player / Stage in 2010, Pyro in2007, CARMEN in 2008, MissionLab in 2006, ADE in 2004, Miro in 2009 andMARIE in 2009, leaving only ARIA to remain under active development, as it iscommercially driven by Adept Mobile Robots to support their range of mobilerobot research platforms. So where short-term development in research projectsmight have benefited by using one of these frameworks, long term achievementssuffer when development stops.
A clear lesson learned from the pioneering efforts in robotic frameworks wasthat impact was not created alone by all research groups releasing their frame-work to open source. For example, the research in the community itself whichformed around Player / Stage was what made the impact of the framework, notonly the core team itself.
The halt in development for a large part of the pioneering frameworks hascaused as loss of the developed functionality that was too closely linked to theframework. This phenomenon has changed the approach towards open sourcedevelopment for robotics slightly. Recent initiatives like OpenSLAM (Stachnisset al., 2010) and the Point Cloud Library10 (PCL) were initiated to isolate anddrive the development of functional libraries without linking them too closely toany robotics framework.
2.4.2 Hierarchical architecture structures
Early architectures like the classical NASA NASREM architecture (Albus et al.,1989) introduced the Sense-Plan-Act (SPA) principles in multiple layers, whereeach layer performs a closed loop of sensing, planning and acting, as well asproducing refined information to a subsequent layer of higher level SPA control.The NASREM model is illustrated in figure 2.12.
10Point Cloud Library, http://pointclouds.org/, 2012
24

2.4. Robotic Software Frameworks
Global memory
G1 M1 H1
Sense Action
G1 M1 H1
G1 M1 H1
G1 M1 H1
G1 M1 H1
G1 M1 H1
Sensory processing
World modelingPlanning
Plan execution
Op
erator in
terface
Mission
Tactical
Task
Skills
Primitives
Servo
Figure 2.12: The NASA NASREM architecture model (Albus et al., 1989) introduced theSPA principle and has been a reference model for numerous robot architectures.
The SPA architectures were a predominate architecture for robotic systemsthroughout the 1990s, but like the original JDL Data Fusion model, the SPA suf-fered the disadvantage of being interpreted as a canonical implementation guiderather than a principle architecture. This problem became evident when opensource robotic frameworks changed the development from being in one groupwith a common understanding within one department to a larger community.This change proved, that adopting new frameworks might be manageable if thesoftware engineering approach is well crafted and enough impact is gained bythe adoption, but to adopt a complex principal software architecture is muchless appealing to new users.
The two unquestionably most popular robotic frameworks in history havebeen Player/Stage and ROS, which are interesting as these two frameworksexplicitly are designed towards not enforcing any architecture. CARMEN isdescribed by Montemerlo et al. (2003) to be an example of the 3T hybrid ar-chitecture but does not enforce it by any means. I will argue, that architectureneutrality is key success criteria for an open source robotic framework today, un-fortunately, I also consider it a severe limitation to the application level achieve-ments by the community of the framework. It quickly becomes anarchy betweenmodules when system complexity increases and decision making must be inte-grated at multiple levels without clear guidelines of the roles of modules andinterfaces between layers.
25

2. Mobile Robots
2.5 Modern Robotics Frameworks
In the following section I will look closer into two modern robotics frameworks:the Robot Operating System (ROS) and DTU MobotWare.
DTU MobotWare is the software framework developed at the departmentof Automation and Control at DTU Electrical Engineering and is the roboticsframeworks used as development and experimental framework in the work pre-sented in this thesis. To give a better understanding of the components andstructure of the framework, as relatively through introduction to the frameworkis given in the following section 2.5.2 on page 28. For further details about theframework, please refer to (Beck et al., 2010).
The structure of ROS is investigated due to the popularity of the framework,and thus forms a baseline to ensure that any assumptions made throughout thisthesis on communication architecture and component structure apply to thegeneral case and not MobotWare specific details.
2.5.1 Robot Operating System: ROS
Fueled by the ambitious and mysterious Willow Garage, ROS has rapidly becomethe de-facto standard of robotic frameworks. ROS was initially announced asconceptually being an operating system for robots (Quigley et al., 2009). Themotivation behind presenting ROS as an operating system was that traditionaloperating systems basically organized device drivers, software structures, processmanagement, communication and graphical interfaces - so does ROS.
The fundamental ideas and concepts of ROS were created from experienceand challenges in large service robot projects at both Stanford University andat Willow Garage. The fundamental goals of the framework were summarizedby Quigley et al. (2009) as
• Peer-to-peer
• Tools-based
• Multi-lingual
• Thin
• Free and Open-Source
The fundamentals of a system using ROS are of a number of processes con-nected in a peer-to-peer topology. Connection peers could either be processeson the same physical machine or on the other side of a cabled or wireless LAN.Lookup to establish new peer-to-peer connections is managed in a central “mas-ter” service. This topology ensures independence between peers, easy connec-tivity and access to all data and functions from anywhere in the architecture.However, for large volume data traffic to or from many peers, the topology isquite inefficient.
26

2.5. Modern Robotics Frameworks
As the only linkage between components or “nodes” in ROS is the peer-to-peer communications system, there is freedom to implement them in anyprogramming language, as long as the communications library exists in the givenlanguage.
Figure 2.13: Visualization of ROS computation graph. Connections between ROS-nodes arecreated by request from nodes themselves in a peer-to-peer manner.
Similar to the Linux architecture, functionality in the ROS system is builtinto a set of tools, which are used to configure the system, as well as visual-ize peer-to-peer connections, debug nodes, and graphically plot sensor readingsand other message data. Figure 2.13 shows an visualization of a ROS peer-to-peer topology instance for a mobile robot simulation using the Stage simulator(Vaughan, 2008).
As it is apparent in figure 2.13, the peer-to-peer topology can become fairlycomplex, but the tools in ROS make it possible to tap into any message streamto investigate the data to debug any module or combination of modules.
The mobile robot navigation in ROS is implemented in the navigation stack,who is a collection of nodes, which combined gives the basic navigation capabil-ities of a mobile robot base. The principles of the stack are fairly simple, as itconnects to information from the odometry of a mobile robot platform and sensorstreams, such as a laserscanner and outputs velocities to the motor controllersof the base platform. Using the navigation stack, the robot can be localized ina previously defined map and utilize path planning modules to avoid obstacleson the way to the goal. In general, this stack seamlessly combines a numberof state-of-the-art modules and algorithms into one package for easy navigation
27

2. Mobile Robots
using mobile platforms.
Looking into the navigation stack from an application development perspec-tive is, however, a bit disappointing. The control of the platform is performedby issuing a sequence of coordinates in C++ of where the robot should positionitself like illustrated in listing 2.1.
MoveBaseClient ac("move_base", true);
goal.target_pose.pose.position.x = 1.0;
goal.target_pose.pose.orientation.w = 1.0;
ac.sendGoal(goal);
ac.waitForResult ();
Listing 2.1: Assignment of the ROS navigation stack to move 1 m forward.
The use of the actionlib class ac in the example in listing 2.1 allows theuser to preempt the execution of assigned goals or to monitor the executionwhile it runs. But as this example also illustrates, execution of larger tasksor development of mobile robot applications are simply implemented in C++by sequencing raw move-pose commands. At the current state, ROS does notprovide any scripting language to define higher level missions or to monitor taskexecution for error recovery.
Like Player one of the design philosophies of ROS is to be open and archi-tecture neutral, which leaves the design of higher level architectures to each usergroup. As discussed earlier, this design decision has most likely played a partin the success of ROS as it seems much harder to share high-level architecturesacross communities than sharing low level signal processing modules. As a re-sult, low level modules are no longer rewritten all over the world, but high levelmission and application execution modules still are.
2.5.2 DTU Mobotware
DTU MobotWare is a mobile robot control framework developed at the TechnicalUniversity of Denmark (Beck et al., 2010). The first modules date back to 1999 asreusable components to control mobile robots in research projects. Throughoutmore than a decade of research projects, master and ph.d. projects have formedthe framework into a modular and plug-in driven software structure.
MobotWare has been born in a university research environment, which hasbeen a central part to form its design philosophy: Writing a software frameworkfor autonomous mobile robots requires an effort that goes beyond one project.This means that it is important to control development over a longer period.A university environment is a very dynamic environment, where students workon isolated short term projects and often face hard deadlines at the same timeas they are finalizing their testing. Furthermore, most university projects arecase or application driven, which often poses a need for making core systemadjustments to suit the needs of the specific cases.
In such an environment it is difficult to enforce strict software developmentmethods and rules. Often it means that the software written in a project is
28

2.5. Modern Robotics Frameworks
abandoned when the student leaves after finishing his or her project, leading torewriting the same functionality again and again, not only in different places inthe world but even at the same department.
The MobotWare framework has three core modules:
Robot Hardware Daemon (RHD) Flexible hardware abstraction layer forreal-time critical sensors
Mobile Robot Controller (MRC) Real-time Closed-loop controller of robotmotion and mission execution
Automation Robot Servers (AURS) Advanced framework for processingof complex sensors and non-real-time mission planning and management
Figure 2.14: Overview of the MobotWare mobile robot control framework.
Using these three core modules, MobotWare implements a control architec-ture into the framework as illustrated in figure 2.14, which was deliberatelyavoided in many other popular frameworks like ROS (Quigley et al., 2009),Player (Gerkey et al., 2001) and OROCOS (Bruyninckx, 2001). RHD and MRCform the hard real-time control section and AURS takes care of all heavy andnon-deterministic sensor processing and planning. The choice of having a layeredcontrol architecture has a number of benefits:
• There is a clear distinction between the hard real-time control section andthe non-deterministic soft real-time section.
• Modules are easier reusable, as they are developed to play a specific rolein a limited context.
29

2. Mobile Robots
• All data-reduction must be handled at the level where the data are locallyavailable, rather than where a developer finds it most convenient at a giventime.
• Developers tend to solve problems on the context where they currentlyare working. In an unstructured university development environment, thisoften causes modules to be a mixture of algorithms and decisions belongingon several levels. Architectures force developers to create general andreusable modules at the right levels to solve tasks.
• Stability is ensured by having the right code executed at the right level.
Core components are connected through low latency TCP/IP connections,that makes is possible to distribute the MobotWare components across multi-ple computer platforms, without the need of complex 3rd party communicationlibraries. This could be a low-power platform for real-time control and a high-performance platform for laser or vision processing, or it could be a developmentmodule conveniently running on the development machine, while all other mod-ules are performing on the actual robot platform.
All communication protocols, except the RHD real-time sensor interface,are implemented in human-readable XML, which is efficient for debugging andtesting, yet powerful for inter-process communications due to efficient and readilyavailable parsers. By design decision, sensor data must be processed at the sourceand only reduced data are distributed, in opposition to e.g. ROS and Player.It makes the development doctrine slightly strict, but improves stability in auniversity development environment.
Development and research of new functionality within the framework is donethrough a plug-in interface on all system levels. This ensures that studentsand researchers have a well-documented entry-point into the framework thatminimizes time spent on learning a complex system. Another strong advantageis that core stability of the MobotWare framework is always ensured, as failedor uncompleted projects can easily be removed - and successful projects can besaved!
The Robot Hardware Daemon (RHD), a real-time device server, has beendeveloped to cope with the increasing diversity of the supported mobile robotplatforms (Beck and Andersen, 2008). In opposition to related initiatives suchas Player (Gerkey et al., 2001) or CARMEN (Montemerlo et al., 2003), RHD islimited to be a lightweight hard real-time hardware interface. Signal processingat RHD level is limited to protocol interaction and simple security functions asemergency stops.
RHD is a real-time synchronized variable database. The variable databasestructure provides great flexibility, but it also helps to enforce a clean cut inter-face between the various hardware formats and a user-manageable API withoutenforcing specific device abstractions. RHD is also the primary real-time controlscheduler in the MobotWare framework, so much effort was used to analyze the
30

2.5. Modern Robotics Frameworks
behavior of scheduling mechanisms in Linux, and to create a robust, lightweightand flexible real-time safe implementation.
RHD consists of a set of core components, and a range of specific hardwaredriver plug-ins. The core components include the variable database, TCP/IPserver and the real-time scheduler. Plug-ins create the support of hardwaredevices, by managing hardware I/O, pre/post-processing and database interface.
Besides being a networked variable database, RHD is also the main real-timescheduler for low level robot control applications, such as MRC. The MobotWareframework is expanding to support new robots and as some of these hardwareplatforms are big, powerful, and heavy, fault tolerance and especially real-timeperformance are critical.
Hard real-time performance is not generically supported by the Linux kernel,as there is no support for kernel pre-emption. In projects, as RTAI (Mantegazzaet al., 2000) and RT-Linux (Bruyninckx, 2002), this is solved by patching thekernel with a second scheduler, which allows tasks to work in kernel prioritylevels and with full kernel pre-emption. Our RT-implementation of choice isthe Linux Real-Time Application Interface (RTAI). Linux itself provides somemeans of achieving soft real-time performance. RHD is capable of operatingsatisfactory on a standard Linux distribution and with enhanced stability andreal-time performance using the RTAI scheduler. For hard real-time performanceRHD uses the LXRT module and RT-FIFOs from RTAI to obtain real-timescheduling in user space.
The Mobile Robot Controller (MRC) is providing the basic low level real-time control of the mobile robot platform. It uses RHD (Robot Hardware De-mon) as an interface to the actual robot hardware. MRC has the followingfeatures
• Odometry
• Motion controller
• SMR-CL interpreter (Andersen and Ravn, 2004)
• Socket interface to high level controllers
• XML-based socket interface to sensor servers
• Socket interface to RHD
• XML-based configuration file
• Calibration support for odometry, line-sensors and distance sensors.
The odometry is based on wheel measurements and inertial sensors, e.g. gy-ros. It is configurable using an XML-based configuration file for several kinemat-ics: differential drive, Ackerman steering and vehicles described with linear andangular velocity (v, ω). The motion controller provides the basic path controlbased on odometry as well as sensor based movements for the following SMR-CLcommands:
31

2. Mobile Robots
fwd Point to point forward motion.turn Turn around center.drive Continuous linear motion.turnr Circular movement with given turning radius.stop Stop the robot and idle motor controllers.followline Follow a line on the floor (painted or buried wire).followwall Follow a wall using e.g. infrared distance sensors or laser scanner.
Small Mobile Robot Control Language, SMR-CL (Andersen and Ravn, 2004),(Jørgensen et al., 2008) is an interpreted language intended for control of mobilerobots. The language supports sequences of basic robot actions with multiplecriterions for seamless motion gluing as well as standard mathematical expres-sions. The system has two kinds of variables, system variables that reflect thestate of the vehicle and user variables that are created the first time they areused in an assignment clause. The language is intended to be used in the tacticallayer just over the control layer, i.e. it is fast enough to shift between controlstrategies and react to state changes in real time. SMR-CL provides the bridgebetween the hard real-time demands of the control layer and the soft real-timedemands of the planning (strategic) layer. The language may be used in twoways, either as scripts runs directly from text files or as a command languagethrough a socket interface.
Automation Robot Servers (AURS). Sensors with high data volume - likecameras and laser scanners - usually require time consuming data processing.This is not easily compatible with the real time requirements of the motion con-trol. Each sensor is often used for more than one purpose, e.g. the laser scannermay be used for detecting obstacles, for wall following, for human detectionand emergency stop. An architecture, which supports sharing of sensor data, istherefore essential.
More than one processor unit is often needed when processing data fromthese high volume sensors. A standardized communication interface is thereforebeneficial. In a university environment new functionality is often developedby students. It is therefore important, that the development can be done inindependent groups and within a limited time frame. The architecture andprogramming interface must therefore be reasonably simple, and it must be easyto add (and remove) the developed modules without influencing other parts ofthe software.
The MobotWare solution to these challenges is a set of servers called AURS.A typical AURS configuration consists of a camera server, a laser scanner serverand a mission management server. Each server consists of a server core thatprovides a number of general services to the functional plug-ins. These servicesinclude:
• Management for loading, unloading and configuring plug-ins dynamically
• Communication services (socket based)
32

2.5. Modern Robotics Frameworks
• Event handling (generation and implementation)
• Server wide shared plug-in variable tree
• Plug-in to plug-in communication
• Direct access to base plug-ins (like laser sensor plug-in and pose history)
• API for common tools (like linear algebra, coordinate conversion and imagealgorithms from openCV.
• Data logging and replay services
As an example the perception laser scanner server could be configured asshown in figure 2.15. There is a plug-in to maintain the recent robot pose in eachof the maintained coordinate systems (odometry and map coordinates), theseare capable of providing the robot pose at any given (sensor) time. The laserscanner plug-in provides (raw) laser scanner range data and the laser scannerpose - relative to the robot. The other plug-ins use the sensor data to createand maintain a specific perception model.
Figure 2.15: The AURS structure, with server core and functional plug-ins.
The communication to and from a plug-in (apart from the internal plug-in toplug-in function calls) is handled by the server core using XML based messages.Each plug-in handle commands formatted into one or more XML tag types, andthus can share the same server provided socket connection.
A plug-in can also trigger an event - an event could be that a new laserscanis available, the server may then be configured to react by sending an XMLcommand to other plug-ins, e.g. to update the wall and obstacle model. Updateof the obstacle model could trigger a further event, e.g. to start a new behaviorgeneration. As described here, both sensor processing and part of the perceptionmodel are handled in one server. This is intentional, as the high volume data flowfrom the sensor plug-in to the perception plug-in in this way is kept internallyin the server. The reduced data flow from the generated model is communicatedto other servers only.
The server structure allows both client-pull data flow - send a command andget a reply - and server-push data flow, where data are sent as a response to anevent. Timed events are supported directly by the server core. A large numberof plug-ins are available, these include:
• a laser scanner plug-in, supporting Sick and Hokuyo scanners
33

2. Mobile Robots
• a camera device plug-in
• a MRC interface plug-in for easy access to real time data and behaviorcommands
• a road detection plug-in using a slightly tilted laser scanner (Andersenet al., 2006b)
• an obstacle detection plug-in using laser scanner data
• an obstacle detection plug-in using stereo camera data
• a road detection plug-in using single camera data (Andersen et al., 2006a)
• a localization plug-in combining laser scanner and a-priori map (Tjell andHansen, 2008)
• a plug-in that implements a rule based mission scheduler
• a mission manager plug-in (Beck et al., 2009)
• obstacle avoidance plug-in based on visibility graph.
Data recorded from laser scanner, camera, GPS and robot pose11 can bereplayed based on log files from each of the relevant plug-ins and synchronizedby the server core. The replay ability eases development of especially perceptionplug-ins significantly.
An operator interface is available to interact with all servers and all plug-ins,and displays also some of the more complex data structures. An example fromthe operator display is shown in 2.16.
Figure 2.16: Operator interface example, illustrating traversable road (green) and obstacles(purple) after treatment of the perception plug-ins.
11Pose: position and orientation
34

2.6. Task Execution and challenges
2.6 Task Execution and challenges
The obvious challenges when considering mobile robotics are about planningmotions, perceiving the environment, navigating robots and avoiding obstacles.These challenges are hard, but have been tackled by research to a level wherea substantial number of algorithms and methods exist to present a solution toeach challenge.
So, what is left? The problem with operating in natural environments isthat a myriad of things can go wrong. Under these circumstances, even themost well proven methods can solve a challenge in 98 % of all cases, or maybe99.9 %, yet there is still the last fraction of situations where the methods proveto be inadequate. Most of these times, the robot system has the knowledgeof the error happening, but no mechanisms to handle what to do, except justcontinuing along a mission following a set of basic assumptions which no longerhold.
Having just one strategy to solve a problem is unnatural to us humans. Mostproblems are solved iteratively, by having a prototype strategy for solving theproblem, but if methods fail or new information is learned, we revise our strategyand switch method. This could also be the case for robot systems, but generallyis not.
Work not covered in this thesis, but presented in (Beck, 2009; Beck et al.,2009) investigates the use of mission management to employ multiple strategiesfor executing navigation missions. The proposed system is capable of switchingbetween strategies in hard real-time by constantly feeding forward navigationalternatives across the hard/soft real-time boundary in MobotWare. Herebythe real-time motion controller MRC was capable of switching to secondarynavigation options if the basic assumptions for the current navigation failed.Combination of this general framework for real-time behavior switching witha module for automatic mission planning / re-planning presented a reasonablesolution to the “no plan B” problem within MobotWare. The proposed missionmanagement architecture is illustrated in figure 2.17.
35

2. Mobile Robots
Figure 2.17: Architecture of the auManager mission management plug-in for AURS. Nav-igation behaviors are processed and pre-loaded into MRC, which allows switch of behaviorin real-time if errors in current navigation strategy are detected.
Alternative solutions can be selected in case of errors if the proper executionarchitecture is in place. But sometimes failures of navigation algorithms are notdetected within the robot systems at all. The environment might have changedso significantly that the localization system mistakes the current location withan entirely different in the map, or an event is missed, which causes the robotcontroller to be in an entirely state in the robot mission code than the robot isin reality.
This loss of synchronization between reality and the virtual representationwithin the robot controller is a significant problem as the robot can continueinto hazardous situations without having any knowledge of the problem.
Combining the internal belief of the robot control system with measurementsof the environment is one of the key challenges addressed in this work on situationassessment. I address the challenge of creating meaning from relations betweenobservations, both internal and external, without having any knowledge aboutthe system models, program or intentions. Observing these relations from aspatio-temporal perspective to form an understanding of the current situationand possibly even predict future situations is one proposed solution to improvingthe capabilities and reliability of mobile robot applications.
2.7 Summary
This chapter presented the current state-of-the-art within mobile robotic appli-cations. Mobile robots in commercial applications within industry and domesticsettings are employed in solving routine functions such as transporting large vol-umes of goods around warehouses or vacuuming the floors of our homes. Appli-cation innovation has created new epoch-making solutions using mobile robots,such as the Kiva solution, without any significant technical breakthroughs butsimply by using simple robot platforms in genius application settings.
36

2.7. Summary
The state-of-the-art research applications push the limits of sensor systemsand environment perception, like the Google Self-driving car, which employs3D environment reconstruction using a 64-beam 3D laserscanner or the ClaasAgrocom vision sensor who tracks rows and crop edges in real-time to controltractors autonomously. Confronting the limits of technology also increases thelikelihood for errors, either in algorithms or by the perception capabilities of thesensor systems.
An in-depth study of a number of common open-source robotic frameworksinvestigates their capabilities of handling these errors. Either by explicit modulesfor error recovery or by advanced mission control to adapt or re-plan missions topossible events of errors. Very little of this capability exists in the frameworksinvestigated.
Robot application might fail due to errors in critical algorithms or because thesynchronization between the vitual representation in the control system and thereal environment is lost, causing the robot to continue its mission in a completelywrong scenario. Solving the challenge of detecting these errors by assessing thesituation of the robot is the goal of the work presented.
37


3
Situations for Mobile Robots
Situation:The combination ofcircumstances at a given moment.
The great British dictionary
In the previous chapter I presented state-of-the-art within mobile robot ap-plications and showed how the current work of the mobile robotics researchcommunity has made significant contributions within the field of navigation,perception and control of the mobile robots. However, support for higher levelcontrol and especially for reliability enhancement has not found its way to playa significant role in the community efforts for mobile robotics frameworks.
In mobile robot applications, any number of things can fail as the robot op-erates in dynamic environments which could change critically or sensors couldmiss important measurements. Commonly known failures might be handledwithin motion skills themselves. However, many problems are not evident byonly considering the measurements, and some situations will only be consideredproblematic in certain critical contexts, but considered normal in other contexts.Assessing situations for the mobile robots will produce this knowledge and pro-vide crucial information for the robot controller to deal with errors and criticalsituations.
In this chapter I will introduce a formal definition of situations, and howsituations can be represented in terms of primitives. A number of circumstancescan form the basis for a situation. In order to accurately describe a situation, alsothe spatio-temporal properties of these circumstances are required to describe thesituation state, as well as the relationship between the circumstances is requiredto describe the situation dynamics.
The specific case of critical situations for automated systems is discussed. Anecessary criterion for successful planned behavior is that the basic assumptionsupon which the application have been designed, hold throughout the executionof the application. Situations where these assumptions are endangered or fail canbe identified as critical and are particularly interesting for situation assessment.
In the last part of the chapter, I introduce three types of strategies for situa-
39

3. Situations for Mobile Robots
tion assessment. The strategies are based on the assumption that situations forthe mobile robots can either be considered normal or anomalies when they arecompared to the goals which have been programmed for the robot application.
3.1 The importance of situations in automationsystems
Handling errors in automated systems is generally very difficult. In manuallyoperated systems, the operator has complete situation awareness of the systemstate, the process and how to control it. When systems become semi or fullyautomated, the operator changes role to being a passive observer instead of ac-tually being a part of the process as well as the type of feedback given to theoperator changes. There are numerous examples of operators who are report-edly unaware of automation system failures and does not detect critical systemchanges when acting as monitors for automated systems (Endsley, 2006).
For humans this problem is known as the“out-of-the-loop”problem. Humansare notoriously poor observers if little or no interaction is required. And whenerrors are detected, humans need additional time to investigate the state of asystem in order to sufficiently understand the problem situation. Time spent inthese steps can be critical for the system, with results ranging from decreasedperformance to catastrophic failures with major consequences.
For robot systems, human operators can be a crucial component to resolvecomplicated error situations, as the problem solving capability of humans stillsurpasses what can be accomplished using AI by several magnitudes. But inorder to increase the effectiveness of humans as error resolution agents, theyneed to have presented clear detections of errors and comprehensive descriptionsof the error situations in order to contribute efficiently to the error resolution.
Having detailed knowledge of the current situation can help more than thehuman operator, as automation systems can be designed to utilize the situationalknowledge in order to react to certain situations or anticipate future events.
3.2 Situations
A focal point throughout this thesis is the term situation. Before I connect fur-ther analysis to this term, it is necessary to address and identify what a situationis in a robot context. The discussion of situations has played an important rolewithin many branches of science.
Defined by the great British Dictionary, a situation is “the combination ofcircumstances at a given moment”. Wikipedia defines a situation as “an abstractobject relating to a position (location) or a set of circumstances 12”.
From these situation definitions two key elements can be extracted as thecore contents of a situation definition, thus I propose a situation to be describedat the abstract level by
12Wikipedia, URL: http://en.wikipedia.org/wiki/Situation, June 2012
40

3.2. Situations
• A combination of circumstances
• A relation between the circumstances.
In the early 1980s, Barwise and Perry (1983, 1981) made a large contributionon a framework for describing and reasoning about common sense and real-worldsituations, which they named Situation Semantics. Their focus was especiallywithin the domains of theoretical linguistics, philosophy and applied naturallanguage processing. In Situations and Attitudes they state:
Situations is basic and ubiquitous. We are always in some situationor other. Human cognitivity categorizes these situations in terms ofobjects having attributes and standing in relations to one anotherat locations - connected regions of space-time (Barwise and Perry,1981).
Formalizing this, they define situations to be formed by the primitives: ob-jects, relations and locations. From this set of primitives, Barwise and Perry(1981) identify a formal definition of situation components, which expand theearlier proposed definition of situations
• a set A of individuals a1, a2, ...an;
• a set L of space-time locations l, l1...ln
• a set R of relations R = R0 ∪ R1 ∪ ...Rn, where Rn consists of the n-aryrelations of individuals and locations.
Barwise and Perry (1983) advocate an ontology for situations, stating that asituation is roughly a set of n-tuples, where each n-tuple contains the situationalelements: objects, a relation, and a spatio-temporal location at which the objectshave this relation.
This formulation of a situational description has been the widely accepted,but the remaining work of Barwise and Perry (1981, 1983) has received a lot ofcritical review throughout the 1980’s and 1990’s, as the primary contribution oftheir work was focused on deriving the grammar and semantics where naturallanguage could be fitted. Natural language and philosophic analysis has a verywide scope and is traditionally not bound to formal rules and grammars, whichmakes it difficult to propose a universal and agreeable model.
The world of robotics can be observed as less open and slightly easier toformalize, based on two assumptions:
1. Robot systems are based on controls who only work on well-defined andknown parameters.
2. The theory will be beneficial in the world of robotics if it can contribute toproblem solving on real-world situations, even if the proposed theory doesnot cover and handle all context specific and hypothetical situations.
41

3. Situations for Mobile Robots
In summary, there is a general agreement in literature that a situation canbe described as a collection of a number of circumstances (objects) and theirrelation. But as proposed by Barwise and Perry (1981) the term circumstanceand the term relation implies that not only is a situation defined by a numberof object parameters, but the spatio-temporal location is just as important.
The aim for this thesis is to create a framework to recognize and react to sit-uations that can be generalized for robots. Butterfield (1986) criticizes Barwiseand Perry (1983), by stating that their situational semantics only act like partialmodels or parts of possible worlds (Butterfield, 1986). Being a strong criticalargument to Barwise and Perry (1983), it perfectly supports the hypothesis ofthis thesis. The goal is to have a model who acts and works as a partial modelof a possible world, as it will allow us to work with incomplete or generalizedsituations. Robots can only perceive a limited part of the world based on itssensors and internal world model, and thus the situations it can recognize areonly partial impressions of the world.
3.2.1 Critical situations
A particular interesting instance of a situation is the so called critical situationsor crisis. As stated by Barwise and Perry (1983) we are always in one situationor another, but for reasoning and decision making the particular interestingsituations are the critical situations. A critical situation has been defined inliterature as:
An unstable or crucial time or state of affairs in which a decisivechange is impending; especially: one with the distinct possibility of ahighly undesirable outcome 13.
A disruption that physically affects a system as a whole and threatensits basic assumptions, its subjective sense of self, its existential core.(Pauchant and Mitroff, 1992)
By definition, a critical situation is a situation, which has critical impact inthe world model it describes. Known from laboratory testing of research robotsystems, most errors happen because the robot operates on assumptions whichno longer holds. It could be that a localizer has lost the robot position, a sensormisreading or hardware malfunction. In all cases, the robot system will continueto operate on assumptions which are false and require some decision making toavoid malfunction.
3.2.2 Example of handling critical situations
When doing system integration of automation systems, it is common practice toanalyze the system process for critical situations. Figure 3.1 illustrates a time-line for an automation system process. Within such a process, there are non-critical phases where little can go wrong, such as process items being transported
13The Merriam-Webster dictionary
42

3.3. Strategies for Situation Assessment
on a conveyor or being moved by a robot. But in certain phases, often inconnection with transitions or complex handling, there are critical situations i.e.where the robot could miss a grip or items could get stuck. In figure 3.1 thecritical elements in the time line are marked with red circles.
Critical situations
Process timeline
Figure 3.1: Critical situations within a process in an automation system. Most of the timeprocesses are known to be reliable, but at certain moments, identified critical situations mustbe handled.
The traditional automation systems approach to handling critical situationsis illustrated in figure 3.2. When a critical situation is identified, the integrationengineer dives into the problem and writes a piece of exception handling code.After a lot of test iterations, the exception handling code has become quite elab-orate and handles the unique critical situation. If a number of critical elementswere found within the critical situation, it is handled through a similar iterativeprocess.
Critical situations
Process timeline
Handling code
Handling code
Embedded critical situations
Handling code
Figure 3.2: Handling critical situations in automation systems are traditionally done byidentifying the situations and creating customized handling code to robustify the situations.In an iterative testing process it is identified if the critical situations might contain additionalembedded critical situations and they are handled in similar manner.
Although the method for handling critical situations by analyzing themand optimizing/removing the critical elements is an intuitively sound methodof improving robustness of an automation system, the key drawback is thatthe method only solves the single unique critical situation in a completely un-reusable manner. If there is a change in products the system handles or mechan-ical wear on the system, the assumptions which formed the solutions in figure3.2 no longer hold. For mobile robots, even in semi structured environments, itcannot be assumed that very detailed assumptions hold, even in normal opera-tion.
3.3 Strategies for Situation Assessment
Situations exist as certain sequences of spatio-temporal relationships. The chainsof events are what defines a situation, just as much as the events themselves.
43

3. Situations for Mobile Robots
For any type of robots, behavior is programmed to follow certain behaviorsand often using various types of feedback to ensure that the system truly fol-lows the programmed behavior to the best of its ability. As a generalization ofsituations for robots they can fall into two categories. Situations can either beconsidered to be normal, which follows expected spatio-temporal patterns, or asanomaly where the situation deviates significantly from the expected patterns.
Anomalies can occur when any of the basic assumptions for an applicationfails, e.g. if motors fail, environment changes unexpectedly or if crucial algo-rithms fails. Anomalous situations can happen at any time when unexpectedevents force the robots to deviate from its planned behavior, but in the situ-ations defined as critical situations there is an increased likelihood of failureshappening. The critical situations can be identified as described earlier in sec-tion 3.2.2 on page 42 and monitored specifically.
In total, four strategies for assessing situations from spatio-temporal patternsare identified
Type 1: Detection of known spatio-temporal relations.
Type 2: Deviation from known spatio-temporal patterns.
Type 3: Detection of known critical situations.
Type 4: Unpredictable “Black Swan events”.
The following sections define the characteristics of the situation assessmentstrategies.
3.3.1 Type 1: Detection of known spatio-temporal relations
Although mobile robots often operate in environments which are fairly dynamic,much of its behavior is predictable and in long term operation it will becomerepetitive. Any number of parameters from within the robot controller and frommeasurements of its environment can be assembled and their relations can beinvestigated in time and space. A result of this will be patterns which describethe situations the robot passes through. Depending on the choice of parameters,some of these patterns will make sense, others not.
A natural example could be to investigate the pose (x, y, θ) of a mobile robotwhile it performs a repetitive sequence of motions. Spatio-temporal relationsbetween these parameters will describe the characteristics of the motions, e.g.at which position and orientation it had at a certain time, and what motionsthat followed. With such a model of the known robot behavior, it is possible torecognize situations for the robot, when it follows the sequence of motions againand it is also possible to predict what might happen in the near future for therobot.
A critical scenario for mobile robots is precision navigation operations. Thesesituations can be docking, positioning for manipulation, or other motion taskswhere close proximity to objects is required. It is particularly critical as there is
44

3.3. Strategies for Situation Assessment
an reasonable amount of absolute inaccuracy associated the mobile robot local-ization methods and localization often are performed in relation to a global orlocal coordinate frame, not in direct relation to the objects in close proximity.
An example of precision navigation is the CoffeeBot demonstration at Auto-matica 2010 at the DTI stand, illustrated in figure 3.3.
Figure 3.3: The Coffeebot mobile platform was used for fetching coffee to visitors at theAutomatica 2010 at the DTI stand. Precision positioning of the robot was essential toensure that the cup holder caught a cup and coffee was poured into the cup.
The CoffeeBot followed a detailed sequence of motions in order to positionitself to catch a cup from a cup dispenser and afterwards move to have coffeebrewed into the cup from the vending machine. In both situations, it was crit-ical to have an exact position as otherwise coffee would be spilled or the robotwould crash into the machine. The movement pattern of the demonstration isillustrated in figure 3.4.
Cup dispenser
Step 2: Move robot to beverage dispenser
Beverage dispenser
Cup dispenser
Step 1: Move robot to cup dispenser
Beverage dispenser
Cup dispenser
Step 3: Move robot to serve beverage
Beverage dispenser
Figure 3.4: The coffee fetching behavior follows three steps. In step 1, the robot movesto the cup dispensing unit to have a cup dropped into its cup holder. In step 2, the robotmoves backwards and then forward to position the cup holder underneath the coffee brewer.Finally in step 3, the robot moves (gently) to serve the coffee.
45

3. Situations for Mobile Robots
Precision was crucial for the application, so the robot control was designedto follow the exact same trajectory at each run. Using a spatio-temporal modelof this sequence it is always possible to derive the current situation of the robotbased on its current state in the model and its future behavior can be predictedfrom the model, without having any knowledge of how the mission control isdesigned.
A result of using this situation assessment strategy, models can be designedto capture the characteristics of certain elements within a mobile robot mission.From prior knowledge of the robot behavior, the current situation of the robotcan be assessed and its future status can possibly be predicted.
Situation assessment using this strategy is specifically investigated in theAGV Situation characterization experiment in section 7.4 on page 132.
3.3.2 Type 2: Deviation from known spatio-temporal patterns
When spatio-temporal patterns are known parts or complete sequences of mo-bile robot applications, they describe with some certainty how the applicationis designed to be executed. Any deviation from these expected spatio-temporalsequences represents a possible critical situation. Figure 3.5 illustrates a fewsituations using agricultural machinery, where the current situations in environ-ments clearly deviate from the predicted models.
Figure 3.5: Examples of using agricultural machinery, where operator situational assessmentwas inadequate to assess the change in environment and thus crashed.
Returning to the CoffeeBot scenario, the robot trajectory was defined in veryclear detail. A localization system was used to continuously update the robotpositions in relation to the wooden frame behind the coffee machine. This workedfairly well, but at certain instances, the localizer did not capture the lines of thewooden frame correctly at the first initialization, which caused a bad localizationof the robot. This critical situation was evident already from the beginning ofthe mission and could be detected by a poor localization quality estimate as
46

3.3. Strategies for Situation Assessment
well as unusual distance measurements to surroundings by the laserscanner. Ifthese signatures were captured in a spatio-temporal model, a prone failure of theCoffeeBot application could be detected in good time before any actual failureand spilled coffee.
Using this situation assessment strategy, deviations from type 1 models canbe used to predict the emergence of possible critical situation. These situationscould either represent the likelihood of future application failure, or they couldrepresent any predicted change in the application, which also could benefit frombeing handled from a situation assessment perspective.
Using this situation assessment strategy is investigated in the detection oferrors in AGV localization tracking experiment in section 7.3 on page 128.
3.3.3 Type 3: Detection of known critical situations
In some military situation assessment contexts, it has been claimed that thereare too many patterns of normal behavior to use these for general situationassessment solutions (Rogova, 2011). For mobile robot systems, a large part ofthe behavior of the systems is following static programs and even using feedbackcontrol algorithms to follow certain patterns. I argue that in a large part ofthese applications, commonly reoccurring patterns can be extracted and usedsuccessfully for situation assessment.
Rogova (2011) argues that in contrast to normal patterns, there are lessabnormal patterns, which lead to this third strategy for situation assessment.Instead of creating spatio-temporal models of normal behavior for the robot, amodel of known critical situations or abnormal behavior can be created. Byknowing the signatures of critical situations, they can be detected early whenthe robot changes into this behavior and thus the possible error can be avoidedinstead of being recovered from. Enabling robot controllers to do error avoidanceinstead of error recovery will be a significant step forward in development ofreliable mobile robot systems.
47
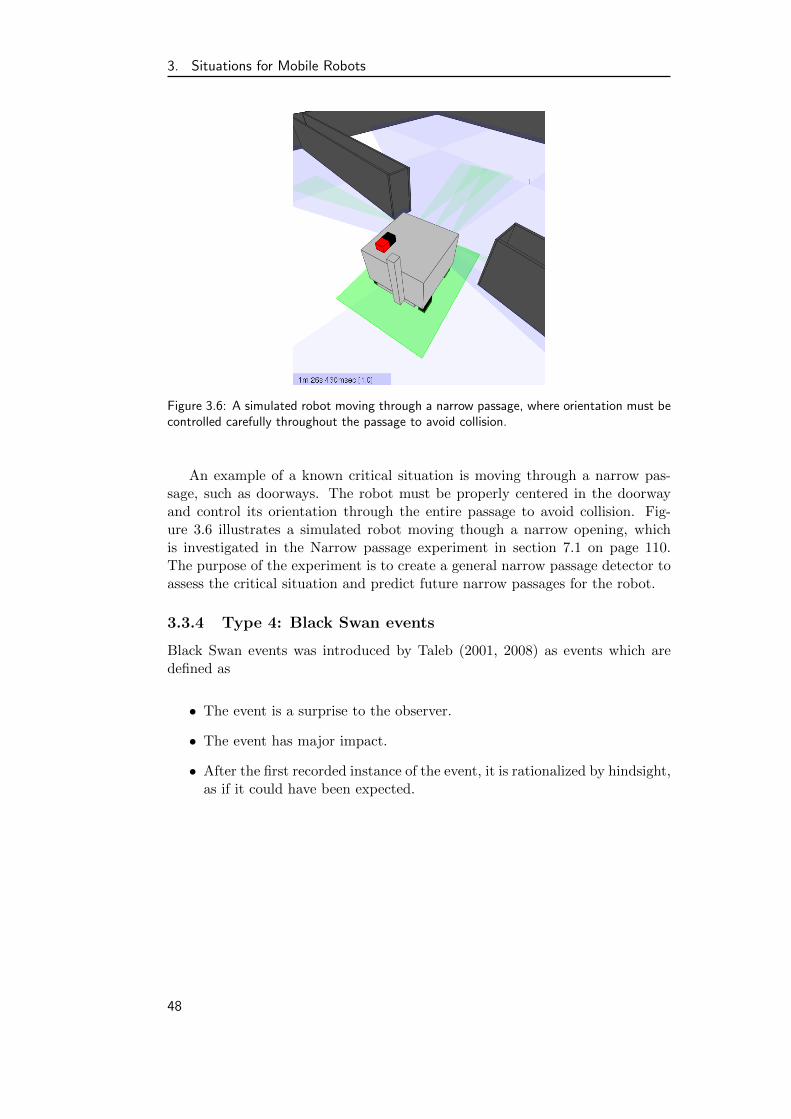
3. Situations for Mobile Robots
Figure 3.6: A simulated robot moving through a narrow passage, where orientation must becontrolled carefully throughout the passage to avoid collision.
An example of a known critical situation is moving through a narrow pas-sage, such as doorways. The robot must be properly centered in the doorwayand control its orientation through the entire passage to avoid collision. Fig-ure 3.6 illustrates a simulated robot moving though a narrow opening, whichis investigated in the Narrow passage experiment in section 7.1 on page 110.The purpose of the experiment is to create a general narrow passage detector toassess the critical situation and predict future narrow passages for the robot.
3.3.4 Type 4: Black Swan events
Black Swan events was introduced by Taleb (2001, 2008) as events which aredefined as
• The event is a surprise to the observer.
• The event has major impact.
• After the first recorded instance of the event, it is rationalized by hindsight,as if it could have been expected.
48

3.4. Summary
Figure 3.7: Black Swan events are surprising events with major impact.
This type of events are unavoidable in robotics and virtually all experimentalpractitioners within robotics have experienced their brilliantly crafted experi-ments fail due to unsuspected circumstances which they probably could haveanticipated, but did not.
Solution to this type of situations is not explicitly covered within the workof this thesis. The type 2 detection of deviation from known patterns strategycovers detection of unexpected behavior within well-known situational patterns.However, this strategy only considers deviations which are represented by theparameters selected to describe the situation. Many Black Swan events can beimagined which go completely undetected by the sensors of the robot until thesudden event of failure.
3.4 Summary
This chapter introduces the concept of situations as a combination of circum-stances and the relations among these circumstances. This definition is expandedby Barwise and Perry (1981) as a formation of three primitives: a set of objects(circumstances), a set of spatio-temporal locations and a set of relations.
From this definition the special case of critical situations are discussed. Crit-ical situations or crisis are situations where the likelihood of failure is unac-ceptably high, and thus must be handled. For mobile robots, critical situationsare most likely to occur when the basic assumptions for the robot applicationsfail. Such situations are likely to cause failure, despite of the application controlworking as intended, as failed assumption could be a hardware fault or a missedsensor reading.
Finally four strategies to situation assessment in a mobile robot context arepresented, where three are explicitly addressed in the context of this thesis:Detection of known spatio-temporal relations, detection of deviation from knownspatio-temporal patterns and detection of known critical situations. Dealing withunexpected “Black Swan” events are not addressed in this work, except when theevents fall into the strategy of detection of deviation from known patterns.
49


4
Situation Assessment
We are drowning in informationbut starved for knowledge. Thecurrent level of information isclearly impossible to be handledby present means. Uncontrolledand unorganized information isno longer a resource in aninformation society, instead itbecomes the enemy.
The International Society ofInformation Fusion.
Situations play an important role for us humans to interpret what is going on.And when we combine our assessment with experience, we find that resolving aproper solution is quick and efficient, even without us knowing all details.
For humans it is natural to use templates of situations to match our currentsituation and achieve situation awareness. This enables us to quickly compre-hend the current status and predict what will happen next. This chapter intro-duces situation assessment as the process used to achieve situation awareness.
In order to transfer this ability to the domain of mobile robots, I investigatehow situation assessment has been approached in science. Within the domainof information fusion, situation awareness has played a role since the late 80sand in particular from a military perspective. In information fusion, situationassessment is considered a higher level fusion process, which fuses results fromlower level fusion processes and other available knowledge to form an on-lineassessment of the current situation.
Another field which has addressed situation awareness and situation assess-ment is the research within human factors. The field of human factors researchhas the focus on the achieved situation awareness of human decision makersin complex dynamic scenarios, such as air traffic control and control of largescale automation systems. In this context the connection between human andcomputer systems is crucial and much work has been focused towards designingsystems to automate or aid situation assessment.
51

4. Situation Assessment
Analysis of the presented work leads to the final contribution of this chapter,which is a proposed modeling framework for situation assessment. The proposedmodel is using the spatio-temporal Extensible Markov Model framework by Dun-ham et al. (2004) to model the spatio-temporal characteristics of situations.Furthermore, a situation prediction engine is proposed to perform continuousmaximum likelihood calculations in the EMM to predict future events.
4.1 Information Fusion
Sensor fusion and state estimation are core elements within research and teachingin control theory and signal processing. Applications for sensor fusion are foundwithin state estimation, dynamic system modeling and system identification andoften are related to process control. However, there are a large number of otherpurposes where multiple and possibly heterogeneous information sources can bemerged into a higher level of knowledge. This field is known as InformationFusion.
Information fusion is the synergistic integration of information from differ-ent sources about the behavior of a particular system, to support decisions andactions relating to the system. So in contrast to traditional sensor fusion, in-formation fusion is targeted towards determining the behavior of systems, notonly to control the dynamics of the system but also to support decisions and ac-tions associated with the system. Information fusion includes theory, techniquesand tools for exploiting the synergy in the information acquired from multi-ple sources, for example sensors observing system behavior, databases storingknowledge about previous behavior, simulations predicting future behavior andinformation gathered by humans.
Interestingly, the field of information fusion has attracted much attentionfrom military research. The interest have been so explicit, that even textbooksdistinguish between Department of Defense (DoD) and non-DoD applications(Hall and Llinas, 1997). Naturally, a key challenge for military intelligence is tounderstand what is going on in a very complex scenario of information. Militaryinterests in information fusion range from robust real-time target tracking e.g.using moving radars, to multi target tracking and surveillance using sensors onships, aircrafts, submarines, as well as ground- and ocean-based sensors and toform ”battlefield overviews”. Extracting useful information of these enormouslydistributed sensor systems is a complex fusion of information of different levelof reliability and without specific dynamic system models. On top of the ob-ject identification and tracking tasks in battlefield overviews, DoD users seek toachieve higher levels of information about enemy situation (e.g. relationships be-tween enemy entities, their relationships with the environment and higher levelenemy organizations). Examples of sensor-based DoD applications are listed intable 4.1.
52

4.1. Information Fusion
Specificapplication
Inferencessought
Primaryobservabledata
Surveillancevolume
Sensorplatform
OceanSurveillance
Detection,tracking,identificationof targets/events
EM Signal,Acoustic signal,Derived observa-tions (wake)
Hundreds ofnautical miles
Ships, Aircraft,Submarines,Ground-based,Ocean-based
Air-to-air andSurface-to-airdefense
Detection, track-ing and identifi-cation of aircraft
EM Radiation Hundreds ofkilometers
Ground based,Aircraft, Ships
Battlefieldintelligence
Identification ofpotential groundtargets
EM Radiation Tens tohundredsof kilometers
Ground based,Aircraft
Strategicwarning anddefense
Detection of in-dications of im-pending strate-gic actions
EM Radiation,Nuclear related
Global Satellites,Aircraft,ground-based
Table 4.1: Examples of sensor-based DoD applications of information fusion, from (Hall andLlinas, 1997)
Besides the sensor-based approaches from table 4.1, military intelligence re-search contributes significantly to the information fusion community within thefield of soft information fusion and higher level fusion. Soft information fusionoften deals with elements such as natural language and other soft data types,which can involve a lot of ambiguity. Examples of soft fusion are Prentice et al.(2010) who presents a framework to apply a graph-based technique for fusionof natural language messages or Gross et al. (2010) who uses ”dirty graphs” todo template graph matching on uncertain soft information. Higher level fusioninvolves the complex and contextual information that is subjectively reasonedand analyzed to form higher level knowledge.
A second broad community which addresses data fusion problems is the aca-demic/industrial/commercial community, which has a much wider scope of ap-plications. The key issue is to extract enriched knowledge from a large bodyof information, either gathered from a distributed sensor system, or by process-ing information from high volume data sources, such as network traffic analy-ses, telephone statistics, web services or Twitter. Shroff et al. (2011) presentsa blackboard architecture with a locality sensitive hashing to prune and ana-lyze data from the assumption that the information sources are locally sensi-tive. The blackboard system was tested using Twitter feeds to ensure supplychain reliability. Twitter feeds were explored for topics like natural disasters ordisturbance nearby important production facilities in a company supply chain.Another important application area is cyber security. Schwoegler et al. (2011)from Raytheon Company applies Multi hypothesis tracking, normally knownfrom estimation in (kinematic)dynamic systems, to follow the dynamics of cyberintrusion sensors and automate the identification of individual attacks.
The pirate situation in the Gulf of Aden close to Somalia has attracted par-ticular interest in the Information Fusion community, as a large part of thecommunity is either defense affiliated, defense funded or defense subcontractors.Furthermore, maritime surveillance is an obvious application for higher level in-
53

4. Situation Assessment
formation fusion. Modern Automatic Identification Systems (AIS) makes it easyto get maritime vessel signatures and track their journey using existing radarinstallations. For example, a knowledge-based system, including a proposedrepresentation of knowledge, inference engine, and series of rules is presented byRoy (2009); Roy and Davenport (2009). Unsupervised learning techniques usingGaussian mixture models to learn patterns of motion behavior are presented in(Garagic et al., 2009). Adaptive kernel density estimation is used in (Ristic et al.,2008) to model normal ship tracks and where departures from this model areconsidered anomalous. Lane et al. (2010) outlines five anomalous ship behav-iors: deviation from standard routes, unexpected AIS activity, unexpected portarrival, close approach, and zone entry. For each behavior, a process is describedfor determining the probability that it is anomalous. Individual probabilities arecombined using a Bayesian network to calculate the overall probability that aspecific threat is present.
4.1.1 The JDL Model
A historic barrier to establish Information Fusion as an individual field of re-search and to facilitate technology transfer between application domains hasbeen the lack of a unifying terminology. Information Fusion spans an enormousfield of applications, and even within related military applications with similarapproaches, different definitions for fundamental terms have been used, such ascorrelation and data fusion. In order to improve collaboration and communi-cation between military researchers, civilian developers and system developersthe (US Army) Joint Directors of Laboratories (JDL) working group for DataFusion was established in 1986. The result of the effort was a process model fordata fusion, formally known as the JDL Data Fusion Model, illustrated in figure4.1, and a Data Fusion Lexicon (White, 1987).
In the Data Fusion Lexicon, the JDL working group defined data fusion as
a process dealing with the association, correlation, and combinationof data and information from single and multiple sources to achieverefined position and identity estimates, and complete and timely as-sessments of situations and threats, and their significance. The pro-cess is characterized by continuous refinements of its estimates andassessments, and the evaluation of the need for additional sources, ormodification of the process itself, to achieve improved results (White,1987).
Already from the definition of data fusion, it is clear that fusion needs to bedone in a number of abstraction layers. There is a significant difference betweenestimates of position and identity to assessment of situations and threats. Toclarify these roles and layers, the model in figure 4.1 was presented.
54

4.1. Information Fusion
Sources
DATA FUSION DOMAIN
SourcePre-processing
Level oneObject
Refinement
Level twoSituation
Refinement
Level threeThreat
Refinement
Level fourProcess
Refinement
Database management system
Human Computer Interaction
Support database
Fusion database
Figure 4.1: The JDL data fusion in its original form, published by the JDL working groupfor Data Fusion in 1987.
The model prescribes four levels of data fusion, which mature the perceptionof measurements on signal and cognitive levels to present to human decisionmakers. Although the JDL Fusion Model has been the most accepted and useddata fusion model, it also faced some criticism. Especially that the model is acanonical guide to a fusion architecture and the description suggests that eachlevel builds on the previous level, so that an architecture of complete assess-ment are necessary to deal with higher level fusion, and that each layer workedindependently from other layers. The model also had a focus towards mili-tary applications and used a lot of terminology, such as ”threat refinement”, whobrought a focus on for example tactical targeting applications and made transferof the concepts to other domains not so obvious.
Steinberg et al. (1999) presented a revision to the JDL model, which maturedthe initial model to be more appropriate for a research community, rather thanstrictly military driven research. The revision II model introduced a bettermethodology for interplay between layers, a level 0 fusion layer for sub-objectfusion and the notion of estimating perceptual states instead of just physicalobjects. Figure 4.2 illustrate the revised JDL fusion model by Steinberg et al.(1999)
55

4. Situation Assessment
Level 0Sub-Object Assessment
Level 1Object Assessment
Level 2Situation Assessment
Level 3Impact Assessment
Level 4Process refinement (Ressource management)
Measurements Signals / Features
Signals / Features Objects
SituationsObjects
Situations
Plans Situations / Plans
Plans Resources
Figure 4.2: Revision 2 of the JDL model by Steinberg et al. (1999), presents a betterinterplay between fusion layers and a more loose coupling of the architecture.
So far, I have omitted a more formal description of the layers in the JDLData Fusion Model. This was mainly to avoid the original and military centricdefinition and to focus the effort towards the modern and more suitable revisedmodel by Steinberg et al. (1999). The layers defined in the revised model aredescribed as following:
Level 0 fusion delivers assignments which include signal detection on thebasis of integration of a time-series of data (e.g. the output of an A/D converter)and feature extraction (e.g. from images in a machine vision system).
Level 1 fusion assignments involve associating metrics (or tracks from priorfusion nodes in a processing sequence) into association hypotheses.
Level 2 fusion involves a process of associating tracks (i.e. hypothesizedentities) into aggregations. The state of the aggregate is represented as a net-work of relations among its elements. The revised model admits any variety ofrelations to be considered - physical, organizational, informational, perceptual -as appropriate to the given system’s mission. As the class of relationships esti-mated and the numbers of interrelated entities broaden, the community tendsto use the term situation for such an aggregate object of estimation.
Level 3 fusion is usually implemented as a prediction, which can draw par-ticular kinds of inference from Level 2 associations. Level 3 fusion estimatesthe impact of an assessed situation; i.e. the outcome of various plans as theyinteract with one another and with the environment. The impact estimate caninclude likelihood and cost/utility measures associated with potential outcomesof planned actions.
56

4.1. Information Fusion
Level 4 processing involves planning and control, not estimation. Somediscussion points towards there being a formal duality between estimation andcontrol, as there is a similar duality between association and planning. Therefore,level 4 assignment involves assigning tasks to resources.
Although this revised definition of fusion levels also might seem a bit canon-ical, where each layer relies on estimates from the preceding layer, it is notedby Steinberg et al. (1999) that data types are not restricted to any layer, andthat one methodological approach can contain elements from several or even alllayers.
Acknowledging the revised JDL model, Llinas et al. (2004) presented a thought-ful revisit to the model. Along with a great deal of fine tuning of the semanticsin the revised JDL model, Llinas et al. (2004) also proposed to remove level 4processing from the data fusion model. A key argument is that level 4 is definedas a resource assignment and planning layer. I agree that planning and resourcemanagement is an essential part of any autonomous system, but I do not seeit as a part of the information fusion system. System goals and plans are animportant part of making a proper impact assessment, but the planning processis not an integral part of the perception hierarchy.
4.1.2 Situation Assessment
Level 2 Information Fusion was initially described by the JDL Data fusion work-ing group as Situation Refinement and was originally considered a process ofconverting information such as a ballistic missile track to a refined situationalpicture such as ”a missile is inbound” and thus creating situation awarenessamong human decision makers, whom should take countermeasures. Within hu-man factors research, the process of achieving situation awareness is defined assituation assessment and thus it was natural to rename level 2 fusion to situationassessment in the revised JDL Data Fusion model.
Several software modules and systems for situation assessment have beenpresented to the Information Fusion community with various approaches in re-gards of methodology and application. The research group around Prof. MosesSudit at the University of Buffalo New York and associated research centers hasdone numerous works in situation assessment, especially within the domain ofcyber security. Sudit et al. (2007) presents the software framework INFERD(INformation Fusion Engine for Real-time Decision-making), an adaptable in-formation fusion engine which performs fusion at levels zero, one, and two toprovide real-time situational assessment.
The INFERD framework is considered to be the most elaborate frameworkfor multi-level fusion and situation assessment publicly presented. INFERD usesa graph-based process to hierarchically organize level 0 (L0), level 1 (L1) andlevel 2 (L2) fusion processes. In the L0 fusion stage system inputs are trans-formed from heterogeneous data (values, text strings or file based information) toan abstracted data type and represented in a feature node, which are organizedin a feature node tree, as understood in basic graph theory. Nodes in the featuretree will become asserted to a binary 1, when a discrete input value matches an
57

4. Situation Assessment
assigned constraint such as equals, less than, larger than, string equality or regu-lar expression match. Once a feature node changes assertion state, the L1 fusiontakes over. The top level node of the feature trees is named a Template Node.Rather simplified, an Ordered Weighted Average (OWA) method is applied tocalculate the probabilistic ’credibility value’ of the template node, based on thenumber of asserted feature nodes among the children (feature nodes) of the tem-plate node. For L2 fusion Sudit et al. (2007) proposes two different methods,either based on concepts from statistical mechanics or entropy.
The INFERD approach to L0 and L1 fusion uses an interesting graph-basedmethod. It forms relationship graphs and uses it to fuse multiple evidence intoprobabilistic assessments of the reliability of a fact, represented in a templatenode. A weakness of this approach is, that the method evaluates reliabilitybased on how many indicators point towards that fact being true. In domainslike cyber security and airport security control, assessments can be formed onbasis of sums of discrete evidence. In robotics, there is often only one sensorassociated to a given measurement, but it has inherent uncertainty associatedto it. Fusion of multiple sensors very often requires a model driven approachto form L1 estimates and not just a sum of a number of L0 assertions. The L2fusion only relies on spatial relations between template nodes in the templategraph, but as derived in chapter 3, the temporal aspect is essential to assesssituations for mobile robots.
4.2 Situation Awareness
A terminology closely related to situation assessment is Situation Awareness(SA). The first adoption of the term was by the USAF (US Air Force) whenanalyzing the fighter crews returning from Korea and Vietnam, who identifiedhaving good SA as a key factor in air combat, or what they called the ”acefactor”. Performance in air combat was a matter of observing the moves ofthe opponent and being able to anticipate the next move, before the opponentanticipated your next move.
In the 1990s the term was adopted by the community of human factors re-search. Human factors science are the science of understanding of the propertiesof human capability, and defines the concept of human factors as the sets ofhuman-specific physical, cognitive, or social properties which may interact ina critical or dangerous manner with technological systems, the human naturalenvironment, or human organizations. In human factors engineering, these prop-erties can be taken under consideration in the design of ergonomic human-useroriented systems.
58

4.2. Situation Awareness
Many approaches and models for SA have been proposed within the hu-man factors community, but the definition by Endsley (1995) has been widelyaccepted and adopted:
The perception of elements in the environment within a volume oftime and space, the comprehension of their meaning, and the projec-tion of their status in the near future. (Endsley, 1995)
This definition has not only formed a reference within human factors science,but also in other communities who strive towards achieving this type of knowl-edge such as Information Fusion. A cornerstone in human factors science andengineering is to integrate optimal interaction between human decision makersand computer-based systems, such as military information systems, air trafficcontrol systems, or automation systems. Typically these systems have an enor-mous amount of information available and a similar amount coming in frominformation sources constantly. In order to make the human decision makers ca-pable of quickly comprehending complex dynamic situations from large amountsof data, SA systems extract important or critical elements and relations in orderto present them in the system interfaces and accelerate decision making.
The relation between situation awareness and situation assessment has beensubject to some confusion, as they are applied in many formal and informalfields of research and application. Endsley (1995) establishes the relationship byarguing that:
it is important to distinguish the term situation awareness, as a stateof knowledge, from the processes used to achieve that state. Theseprocesses, which may vary widely among individuals and contexts,will be referred to as situation assessment or the process of achieving,acquiring, or maintaining SA.
In short terms it defines situation awareness as a state of knowledge whereassituation assessment is the process used to achieve that knowledge.
4.2.1 The Endsley model of Situation Awareness
The need for SA is critical in a number of environments, such as Air traffic con-trol, large automation systems control, and tactical and strategic systems (alsofor civilian use). But also many every day activities need a dynamic update ofSA to ensure correct decision making and effectiveness, such as walking, drivingin heavy traffic or operating heavy machinery.
Acquiring and maintaining SA becomes increasingly difficult when complex-ities and dynamics of environments increase. In these environments, many de-cisions are required in a fairly narrow window of time and many tasks requirea continuous and up-to-date environment analysis. For human-in-the-loop sys-tems, the challenge of maintaining SA can range from trivial to require a majorpart of the operator’s time and attention.
59

4. Situation Assessment
Researchers who analyzed human decision processes in a wide range of appli-cation areas do agree, that expert decision makers begin their decision processby classifying and understanding a situation, before immediately selecting anaction strategy (Endsley, 1995). What is interesting in that conclusion is that ifsituations are classified to known situation models, actions can often be chosenimmediately without much deliberation involved in deriving the solution.
Evidence points towards, that a basic human process is forming the achievedSA picture of the current situation and matching it towards prototypical situ-ations in memory. Furthermore, these prototypical situations are considered tobe mentally mapped to corresponding appropriate actions, making it efficient toadopt a course of action when the situation is known (Klein, 1989). The strategyis also known from medical decision making, where some emergency proceduresare being formulated as Standard Operating Procedures (SOPs), where given sit-uational patterns can be mapped to a list of appropriate actions in times wheretime is too critical for elaborate deduction of courses of action. In his studiesof ground fire commanders, Klein (1989) found that conscious deliberation ofaction strategies was rare. In most of the cases, experts focused their attentionto classify the situation and hereafter immediately yield the solution strategyfrom memory.
On basis of these observations and the basis of situation awareness, Endsley(1995) formulated a model for SA and how it relates between the human mentalmodel, goals and the system/task environment where SA is derived from. Themodel is illustrated in figure 4.3.
Perception of elements in
current situationLevel 1
Comprehension of current situationLevel 2
Projection of future status
Level 3
State of the Environment
Situation Awareness
DesicionsPerformance
of actions
Feedback
Task / System Factors
· System capability· Interface design· Stress and Workload· Complexity· Automation
Individual Factors
· Goals and Objectives· Preconceptions· Expectations
Information Processing Mechanisms
Long term memory Automaticity· Abilities· Experience· Training
Figure 4.3: Endsley’s model for situation awareness in dynamic decision making. The corefeedback model is illustrated in the center and is augmented with the relations to humancognition factors for decision making.
In the model, Endsley defines three levels of SA. The levels are organized in
60
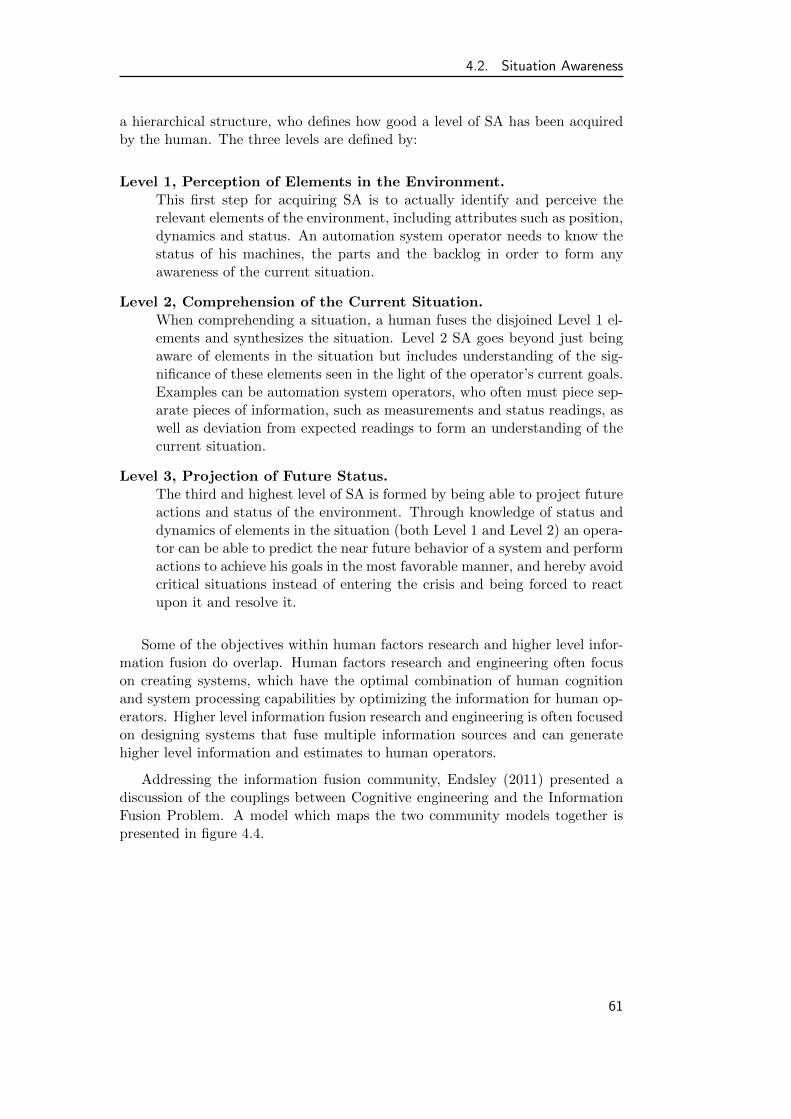
4.2. Situation Awareness
a hierarchical structure, who defines how good a level of SA has been acquiredby the human. The three levels are defined by:
Level 1, Perception of Elements in the Environment.This first step for acquiring SA is to actually identify and perceive therelevant elements of the environment, including attributes such as position,dynamics and status. An automation system operator needs to know thestatus of his machines, the parts and the backlog in order to form anyawareness of the current situation.
Level 2, Comprehension of the Current Situation.When comprehending a situation, a human fuses the disjoined Level 1 el-ements and synthesizes the situation. Level 2 SA goes beyond just beingaware of elements in the situation but includes understanding of the sig-nificance of these elements seen in the light of the operator’s current goals.Examples can be automation system operators, who often must piece sep-arate pieces of information, such as measurements and status readings, aswell as deviation from expected readings to form an understanding of thecurrent situation.
Level 3, Projection of Future Status.The third and highest level of SA is formed by being able to project futureactions and status of the environment. Through knowledge of status anddynamics of elements in the situation (both Level 1 and Level 2) an opera-tor can be able to predict the near future behavior of a system and performactions to achieve his goals in the most favorable manner, and hereby avoidcritical situations instead of entering the crisis and being forced to reactupon it and resolve it.
Some of the objectives within human factors research and higher level infor-mation fusion do overlap. Human factors research and engineering often focuson creating systems, which have the optimal combination of human cognitionand system processing capabilities by optimizing the information for human op-erators. Higher level information fusion research and engineering is often focusedon designing systems that fuse multiple information sources and can generatehigher level information and estimates to human operators.
Addressing the information fusion community, Endsley (2011) presented adiscussion of the couplings between Cognitive engineering and the InformationFusion Problem. A model which maps the two community models together ispresented in figure 4.4.
61

4. Situation Assessment
SA Theory
JDL model
Low Level Data Fusion High Level Data Fusion
Level 1Perception
Level 0Source
Preprocessing
Level 1Object
Assessment
Level 2Comprehension
Levels 2 & 3Comprehension and Prediction
Current State of the Art Human-Centered Fusion
Level 2Situation
Assessment
Level 3Impact
Assessment
Level 4Process
Refinement
Level 5Cognitive
Refinement
Figure 4.4: Mappings between the SA Theory model by Endsley (1995) and the revised JDLmodel for Data Fusion by Steinberg et al. (1999).
It is clearly seen in figure 4.4, that there is a match between theories fromthe two communities. The most significant difference is the focus and approachto the problem. Information Fusion is born from the fusion technologies in thedomain of fusing several sensors and real-time sources into better or more infor-mative estimates. Human factors cognitive engineering is born from making idealsystems for human operators and thus has been forced to focus on informationwhich must be presented to the operator.
4.3 Modeling Spatial and Temporal Relations
Already in the initial discussion about situations in chapter 3.2 on page 40,it was obvious that from a human descriptive point of view, a situation mustbe considered as an aggregation of elements from the environment, not only inmetric and spatial aspects but also in the temporal domain. Within his work onsituation calculus, Reiter (1991) models a dynamic world as progressing throughseries of situations as result of actions being performed within this world. In thisdefinition a situation is not a state, but rather the explicit sequence of states asunderlined by Reiter (1991) as follows:
A situation is a finite sequence of actions. Period. It’s not a state,it’s not a snapshot, it’s a history. (Reiter, 1991)
In domain of Information Fusion, it is not explicitly defined that there isany evaluation of temporal relations involved in situation assessment. The JDLmodel defines situation assessment in a domain as forming a ”network of relationsamong its elements”, which does not prescribe any temporal relations. In theINFERD situation assessment framework, described in section 4.1.2 on page 57,situation prototypes and models are matched without modeling the temporalrelations of the data structure.
A single observation can be used for a multitude of purposes in a roboticsystem. Distances can be measured, objects can be recognized, and motors can
62

4.3. Modeling Spatial and Temporal Relations
be controlled. However, neither of these observations describes a situation, butmaybe a significant state in a situation. Figure 4.5 illustrate a plot of data froma laserscanner mounted on a mobile robot platform, which captures the contoursof 5 pairs of human legs.
Figure 4.5: A number of human legs detected and recorded using a laserscanner at floor levelon a mobile robot platform. Using only this single instance of information, it is impossibleto have any comprehension of the situation and to do any prediction of future events.
Observing the leg contours in figure 4.5, it is impossible to grasp what thepersons on the scan are doing, in what direction they are going, or at whatvelocity they are moving. Using the temporal domain to connect sequencesof measurements, enables us to comprehend what is actually going on in thissequence and maybe even predict future status.
In their work on using an ontology driven approach to formalize reasoningaround situation assessment in disaster environments, Little and Rogova (2005)proposes to integrate the temporal aspect by the use of two separate ontologies.By their approach, situations are characterized by spatial items of interest inthe SNAP ontology in different levels of granularity. Temporal items of inter-est are defined in the SPAN ontology which also is used to define the relationsbetween SNAP entities. Although I very much agree, that it is a good idea toseparate description models to simplify modeling and motivate re-use, Little andRogova (2005) becomes challenged when defining the SPAN temporal ontology.Their disaster ontology example for SPAN becomes mixed between process ele-ments and purely temporal elements, where I will argue that elements such asAmbulance -> Pick-up and other process entities, is not an explicit temporalelement.
63

4. Situation Assessment
4.3.1 Methods and assumptions
In order to design a framework to organize data from a mobile robot in bothspatial and temporal domains, a suitable modeling framework must be selected.Many computational approaches have been proposed, such as rule-based meth-ods, graph-based methods, case-based reasoning, hidden Markov models, multi-agent systems, neural networks, situation calculus and many hybrid methodsespecially involving probabilistic additions.
In chapter 3 it was outlined, that important situational patterns can beconstructed from a number of sources, either learned from good or bad situations.These patterns could maybe be partially hand-crafted by experts to captureinteresting key-points. However, in dynamic environments, it is evident thatnot all situational patterns can be manually crafted. Critical characteristics canoften be found in un-modeled uncertainties or other elements which is not a corepart of the perception and control of a system, which concludes
• The model must be definable by experts but also be able to build or refineitself dynamically to comprehend real-world dynamics.
Not all models are capable of representing both spatial and temporal rela-tions. Graphical models are very popular for this purpose, as they are very wellsuited to structure and represent relations among elements and generally covertwo important components:
• The structural component, the graph (directed, undirected)
• The quantitative component (probability, possibility, belief)
Most variations of the graphical methods use a variation of a probabilisticframework to combine the atomic structure in the graph-based model with theaspects of uncertainty. Another general benefit for the graphical methods isthat they are easily visualized and there is a large body of efficient algorithmsand software packages available. As for all methodologies, graphical methodsalso have their drawbacks. In general, the methods are particularly good forsparse networks as in general methods of inference are NP-hard. In an open anddynamic world, it is often difficult to fix the variables and structure, as well ashandling dynamic situations adds complexity of the model (Rogova, 2011).
4.3.2 The Extensible Markov Model
The framework for modeling the spatio-temporal characteristics of situations hasbeen selected to be the Extensible Markov Model (EMM), originally presentedby Dunham et al. (2004) as a tool for on-line analysis of the spatio-temporalstructure of data sets. Markov models are a popular data modeling tool forspatio-temporal problems, as the graph-based structure fits intuitively too manynatural processes and is easily visualized. The traditional structure of a MarkovChain is a static representation of a number of states in a graph and a number of
64

4.3. Modeling Spatial and Temporal Relations
edges connecting elements of the graph with associated transition probabilitiesdescribing the probability of traversing the edge from one state to another.
The static properties of the Markov Chain only make it suitable for examina-tion and evaluation of static data sets, where on-line and dynamic datasets doesnot fit. With most real-world on-line data sources, such as robotic sensor sys-tems or perception algorithms, data values change over time, resulting in thesetypical problems using a static Markov Chain for real world data:
1. The required structure of the Markov Chain may not be certain at themodel construction time.
2. As the real world being modeled by the Markov Chain changes, so shouldthe structure of the Markov Chain.
To deal with this problem, Dunham et al. (2004) proposed the ExtensibleMarkov Model (EMM). The EMM is in essence a time varying Markov Chain,with the capability to learn new states dynamically and adjust its structure.Furthermore, the edges are used for modeling state transitions and the associ-ated probabilities based on the input data to the model. Dunham et al. (2004)experimentally verifies the model using examples from prediction of river flowand prediction of traffic volumes for both computer networks and roadways.
In work on a similar problem Goldberg and Mataric (1999) have presentedthe Augmented Markov Model (AMM). The AMM also learns new states whennew data are seen in the model and adjusts transition probabilities accordingto the number of transitions along each edge compared to the total number oftransitions from that state. Unlike the EMM, when the AMM is constructed afterthe learning phase, it is frozen and no longer being updated in the predictionphase.
The EMM model uses a similar approach to AMM, but offers a great dealmore flexibility with the following key differences (Dunham et al., 2004):
• EMM can continue to learn during the application (prediction, etc.) phase.
• The EMM is a generic incremental model whose nodes can have any kindof representation.
• State matching is determined using a clustering technique (as further dis-cussed in chapter 5).
• EMM not only allows the creation of new nodes, but deletion (or merging)of existing nodes. This allows the EMM model to ”forget” old informationwhich may not be relevant in the future. It also allows the EMM to adaptto any main memory constraints for large scale datasets.
• EMM performs only one scan of new data and therefore is suitable foronline processing of streaming data.
65
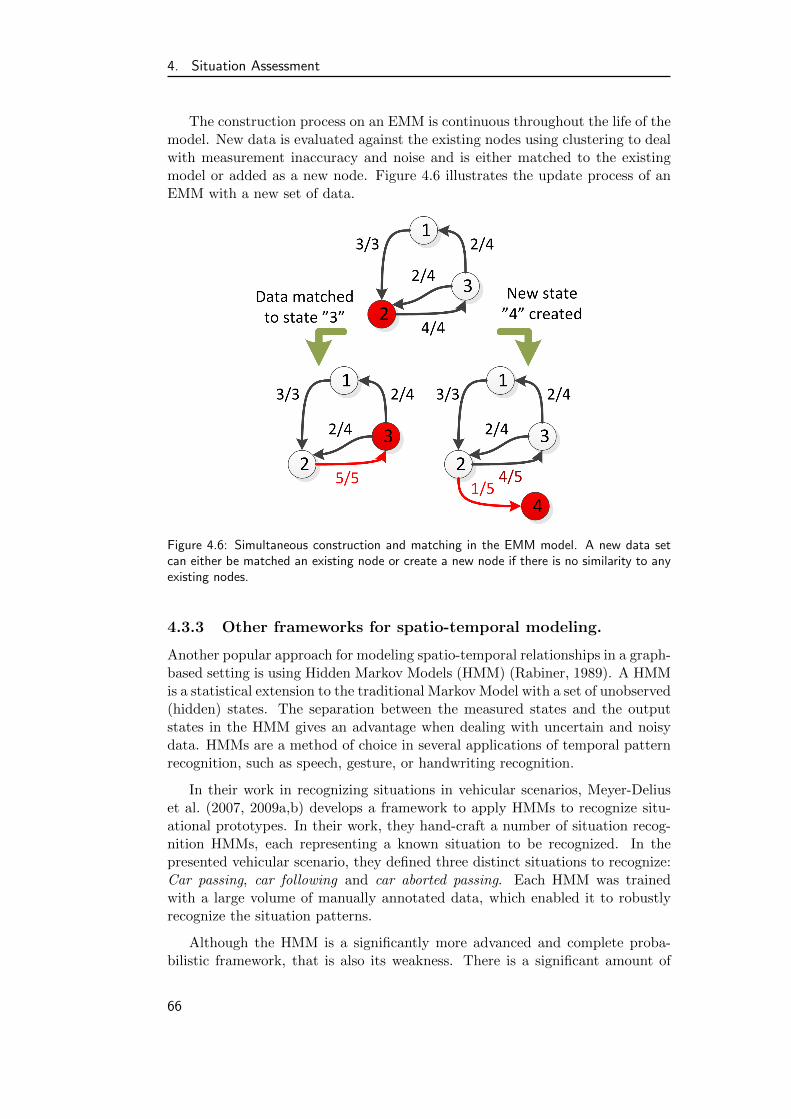
4. Situation Assessment
The construction process on an EMM is continuous throughout the life of themodel. New data is evaluated against the existing nodes using clustering to dealwith measurement inaccuracy and noise and is either matched to the existingmodel or added as a new node. Figure 4.6 illustrates the update process of anEMM with a new set of data.
Figure 4.6: Simultaneous construction and matching in the EMM model. A new data setcan either be matched an existing node or create a new node if there is no similarity to anyexisting nodes.
4.3.3 Other frameworks for spatio-temporal modeling.
Another popular approach for modeling spatio-temporal relationships in a graph-based setting is using Hidden Markov Models (HMM) (Rabiner, 1989). A HMMis a statistical extension to the traditional Markov Model with a set of unobserved(hidden) states. The separation between the measured states and the outputstates in the HMM gives an advantage when dealing with uncertain and noisydata. HMMs are a method of choice in several applications of temporal patternrecognition, such as speech, gesture, or handwriting recognition.
In their work in recognizing situations in vehicular scenarios, Meyer-Deliuset al. (2007, 2009a,b) develops a framework to apply HMMs to recognize situ-ational prototypes. In their work, they hand-craft a number of situation recog-nition HMMs, each representing a known situation to be recognized. In thepresented vehicular scenario, they defined three distinct situations to recognize:Car passing, car following and car aborted passing. Each HMM was trainedwith a large volume of manually annotated data, which enabled it to robustlyrecognize the situation patterns.
Although the HMM is a significantly more advanced and complete proba-bilistic framework, that is also its weakness. There is a significant amount of
66

4.4. Situation Assessment Modeling Framework
thoughtful modeling in designing the suitable models, as both the ”observation”state space and the hidden states and their relations must be hand crafted. Fur-thermore, all probabilistic matching between input data and the HMM is doneinternally in the trained model which makes it very difficult to debug, tune oroptimize parameters, especially for non-experts.
4.4 Situation Assessment Modeling Framework
As I have described so far in this thesis, there is a fair body of work related tosituations, their definition, their description, their recognition and how humansperceive them. Approaches for technical situation models span from complexprobabilistic models to specific predicate logic dedicated to situations. Althoughnone of them specifically addresses robotics from a situation assessment context.
In this section I will describe the choice of situation modeling framework usedto represent the situations for mobile robots. Robotics in general is a very crossdisciplinary field, building intensively on state-of-the-art from areas like controltheory, signal processing, artificial intelligence and mechanical engineering. Thebroad landscape of research disciplines, all contributing to solve the challenge ofmaking mechanical computerized systems solve real-world challenges, makes theinformation within a robotic system highly heterogeneous. Common data typeswhich need to be considered are:
• Raw sensor readings, e.g. from distance sensors, encoders or analogueinputs.
• Simple positions, e.g. from dead-reckoning or from position servos.
• Pose estimates of robot and objects, e.g. from localization algorithms andobject trackers.
• Status values, e.g. from hardware or software components.
• Logic values, e.g. from rules monitoring processes.
• Process details, e.g. details from the planning system about current mis-sion and task.
• Symbolic information, e.g. from an AI or inference layer.
Using the first order Markov chain nature of EMM, the spatio-temporal na-ture of situations can be represented together with transition probabilities, i.e.without the complexity of hidden states in a HMM. States in the Markov chainare a unique set of information or circumstances at one given time. We definea situation instance as the sequence of one or more of these states, who can betranslated to meaningful knowledge about the state of a dynamic environment.
67

4. Situation Assessment
Figure 4.7: Perception information for mobile robots is often organized in a hierarchy inthe robot control architectures. Situations combine these layers in the spatio-temporaldimension.
Situations add an additional level of abstraction to traditional spatio-temporalmodels, as both symbolic and sub symbolic information can be fused to formthe situation states and combine them in the temporal and spatial dimension.Figure 4.7 illustrates the common understanding of a mobile robot perceptionhierarchy where situation models are placed in the highest level, as an assess-ment can involve data from all preceding layers, as also emphasized by Steinberget al. (1999) in the JDL model.
To embrace this, a situation model must be parameterized by any combina-tion of data sources available in the heterogeneous perception hierarchy, whichexists in the frameworks of modern mobile robotics.
Following Endsley’s model for Situation Awareness (Endsley, 1995), the fullbenefit of achieving SA is the ability to both comprehend the current statusof the environment as well as being able to predict future status and events,as outlined in Endsley’s SA hierarchy in figure 4.8. A comprehensive situationmodel should be capable of covering the three levels of situation awareness.
68

4.4. Situation Assessment Modeling Framework
Figure 4.8: Endsley’s models of Situation Awareness define three levels of awareness.
Using the EMM for situation representation, it can be considered to havethree similar layers of abstraction, which are a natural part of the Markov chainapproach.
Level 1 SA concept of the modelIs the definition of what data that should be included in the model. Dataselection must be done carefully, as too many parameters can cloud theobserved structures and too little might give inconclusive observations.
Level 2 SA concept of the modelIs represented in specific state-sequences which form a situation. Thesemodels must be capable of being pre-imposed from expert descriptions orclassified from learned data during runtime.
Level 3 SA concept of the modelIs the evaluation of transition likelihoods from the current state to otherdefined states. These models are used for prediction of future error statesand inference i.e. for triggering counter measures.
Comparing the layers to the revised JDL model for Data Fusion, there is areasonable resemblance between this model definition and the comparison illus-trated earlier in figure 4.4 on page 62.
In the work presented in Beck et al. (2011), who introduced this modelingapproach, we focus primarily on designing a level 1 model and show throughexperiments that it can be used to learn meaningful level 2 situation models andlevel 3 prediction models. In the experimental work in chapter 7 on page 109 Iinvestigate further how all three levels of situation awareness can be achieved asa result of situation assessment using this model.
69
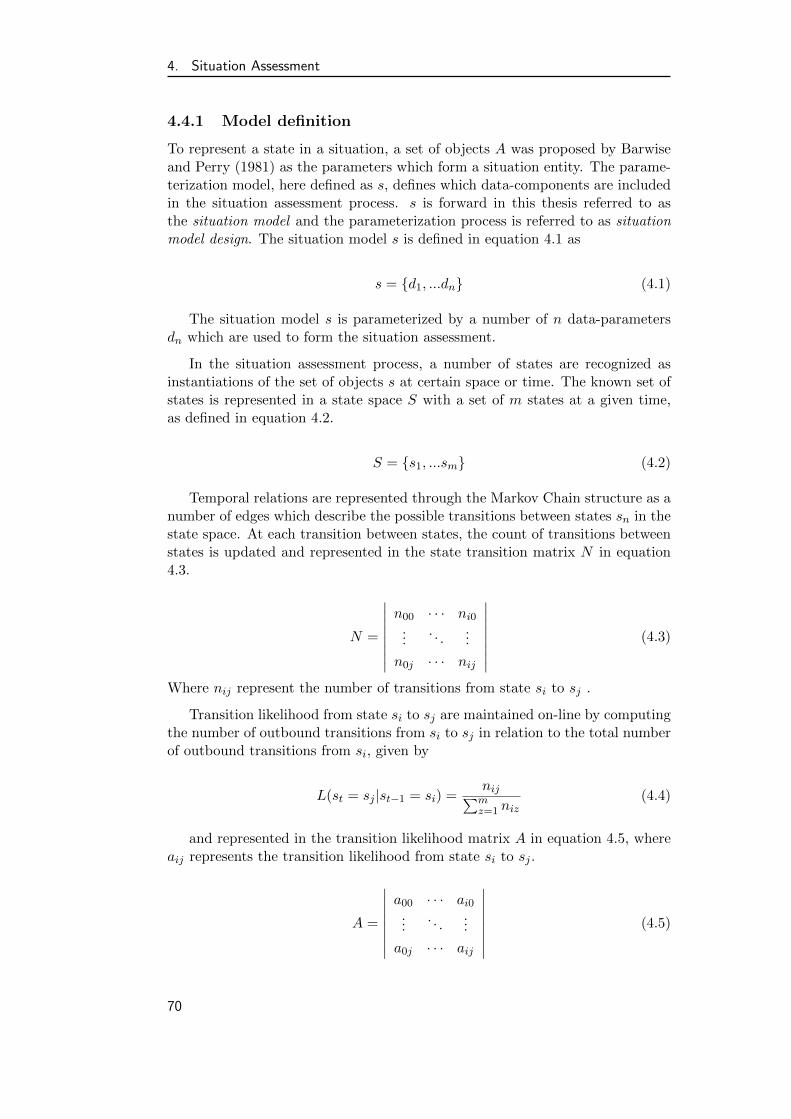
4. Situation Assessment
4.4.1 Model definition
To represent a state in a situation, a set of objects A was proposed by Barwiseand Perry (1981) as the parameters which form a situation entity. The parame-terization model, here defined as s, defines which data-components are includedin the situation assessment process. s is forward in this thesis referred to asthe situation model and the parameterization process is referred to as situationmodel design. The situation model s is defined in equation 4.1 as
s = {d1, ...dn} (4.1)
The situation model s is parameterized by a number of n data-parametersdn which are used to form the situation assessment.
In the situation assessment process, a number of states are recognized asinstantiations of the set of objects s at certain space or time. The known set ofstates is represented in a state space S with a set of m states at a given time,as defined in equation 4.2.
S = {s1, ...sm} (4.2)
Temporal relations are represented through the Markov Chain structure as anumber of edges which describe the possible transitions between states sn in thestate space. At each transition between states, the count of transitions betweenstates is updated and represented in the state transition matrix N in equation4.3.
N =
∣∣∣∣∣∣∣∣n00 · · · ni0
.... . .
...
n0j · · · nij
∣∣∣∣∣∣∣∣ (4.3)
Where nij represent the number of transitions from state si to sj .
Transition likelihood from state si to sj are maintained on-line by computingthe number of outbound transitions from si to sj in relation to the total numberof outbound transitions from si, given by
L(st = sj |st−1 = si) =nij∑mz=1 niz
(4.4)
and represented in the transition likelihood matrix A in equation 4.5, whereaij represents the transition likelihood from state si to sj .
A =
∣∣∣∣∣∣∣∣a00 · · · ai0...
. . ....
a0j · · · aij
∣∣∣∣∣∣∣∣ (4.5)
70

4.5. Situation prediction engine
Valid transition likelihoods are important for predicting occurrence of future,important states and hereby approach Level 3 Situation Awareness. The on-linecalculation of transition likelihoods is utilized for situation transition predictionby the proposed prediction engine in section 4.5.
State matching is based on a data clustering, where a model independentclustering algorithm determines the state relationship of measurements, insteadof learning data association into the models as with Hidden Markov Models.The clustering is further elaborated in chapter 5 on page 77.
4.5 Situation prediction engine
This section presents a proposed engine to perform on-line prediction calcula-tions from the current node of the EMM model to any other node in the model.By calculation of the maximum likelihood sequences through the EMM graph,the most likely transition sequence between two nodes can be calculated togetherwith the likelihood of this sequence occurring. Using this knowledge, robot con-trol systems can prepare for the most likely future events and possibly activatecountermeasures if likelihoods of entering critical situations become unaccept-ably high.
Thus, the goal of this section is to design a methodology to keep an updatedmaximum likelihood estimate of transitioning from the current node to any othernodes in the EMM graph, to enable monitoring of possible critical situations andimprove the avoidance of these situations instead of recovery from them.
In the EMM model, transition likelihoods are annotated in the descriptionof each edge connecting the states si and sj by equation 4.4 on the facing page.Considering the EMM as a traditional graph, the transition likelihoods can alsobe considered as (inverse) weight factors of traversing the edges.
Well known algorithms exist for processing and searching graphs with weightfactors assigned to the edges, where the most famous is Dijkstra’s algorithm.The algorithm was presented by the Dutch computer scientist Edsger Dijkstrain 1959 and is a graph search algorithm to solve the shortest-path problem in agraph from a single source node.
The Dijkstra algorithm iterates through and “visits” all nodes connected tothe start node and assigns the lowest cumulative cost to each node. This contin-ues to iterate through nodes connected to the “visited” nodes, until the end nodeis reached or until all nodes have been visited. As a result of the algorithm isa route-map of lowest possible cost sequence from the start node to any visitednode in the graph, as well as the cumulative cost of following this sequence.
In general, the characteristics of Dijkstra’s algorithm fit fairly well with thedesired prediction calculations, but instead of calculating the lowest cost, I aminterested in extracting the maximum likelihood of the sequences.
71

4. Situation Assessment
4.5.1 Maximum likelihood of graph sequences
Following the chain rule of probability, it is possible to calculate the joint distri-bution in terms of transition probabilities of the set Xseq using the conditionalprobabilities. Consider the sequence of nodes
Xseq = {s1, ..sn} (4.6)
To calculate the conditional probability of this sequence, the definition ofconditional probability can be applied (Russell and Norvig, 2010, p. 512)
P (sn, . . . , s1) = P (sn|sn−1, . . . , s1) · P (sn−1, . . . , s1) (4.7)
And repeating the deduction on the final product of equation 4.7 the condi-tional probability of the joint distribution of the set Xset is given by the product
P (sn, . . . , s1) =n∏
i=1
P (si | si−1, . . . , s1) (4.8)
4.5.2 Modification of Dijkstra’s algorithm
Replacing the cost minimization step in Dijkstra’s algorithm with a maximiza-tion of this joint distribution of conditional probability calculation makes Di-jkstra’s algorithm a maximum likelihood estimator, instead of shortest pathplanner.
It is implemented into the algorithm by modifying the original core loopwhich is illustrated for comparison in pseudo code in listing 4.1.
1 //Q is the set of non -visited nodes
2 while Q is not empty:
3 u = vertex in Q with smallest distance in dist[] ;
4 remove u from Q ;
5 if dist[u] = infinity:
6 break ;
7
8 for each neighbor v of u:
9 remove v from Q.
10 alt = dist[u] + dist_between(u, v) ;
11 if alt < dist[v]:
12 dist[v] = alt;
13 previous[v] = u;
14 return dist;
Listing 4.1: Pseudo code of the core loop in Dijkstra’s algorithm for solvingthe shortest path problem.
Listing 4.2 illustrates pseudo code of the modified core loop, where the mainchanges are
• Line 3: u is now the vertex with largest likelihood.
72

4.5. Situation prediction engine
• Line 10: Instead of calculating the sum of distances, the product of likeli-hoods is calculated.
• Line 11: Max likelihood is updated for each node instead of min distance.
1 //Q is the set of non -visited nodes
2 while Q is not empty:
3 u := vertex in Q with largest likelihood in
maxLikelihood [] ;
4 remove u from Q ;
5 if maxLikelihood[u] = 0:
6 break ;
7
8 for each neighbor v of u:
9 remove v from Q.
10 alt = maxLikelihood[u] * likelihood_between(u, v) ;
11 if alt > maxLikelihood[v]:
12 maxLikelihood[v] = alt ;
13 previous[v] = u ;
14 return maxLikelihood;
Listing 4.2: Pseudo code of the modified Dijkstra algorithm for solving themaximum likelihood estimation problem.
If the only purpose was to calculate the maximum likelihood between a startnode s1 and a specific end node sn, the algorithm could be terminated at line4 if u = sn. The resulting maximum likelihoods to any node sn in the EMMgraph can now be extracted from the maxLikelihood(sn). The sequence whichleads to this likelihood can be extracted by iterating backwards through theprevious[v] from sn until s1 is returned (and then reversing the sequence).
Figure 4.9 illustrates an example of the maximum likelihood calculationsbetween node N1 and N6. Transition likelihoods are noted on each edge and thecalculated maximum likelihood in each node is noted besides the node id in ().
73

4. Situation Assessment
N1(1.0)N2(0.2)
N3(0.48)N4(0.8)
N5(0.48)
N6(0.48)
0.2
0.81.0
1.0
0.6
0.20.1
1.0
Start
End
Figure 4.9: Example of maximum likelihood calculations using the modified Dijkstra algo-rithm. The green edges illustrate the route of maximum likelihood with transition probabil-ities noted on each edge. The maximum likelihood for each node is noted in () besides thenode id.
The algorithm is implemented in a prediction engine module which continu-ously updates the maximum likelihood map, when the EMM model is changed.Experiments in chapter 7, and in particular section 7.4 on page 132, investi-gate the usefulness of using this module for prediction of future status of thesituations described in the EMM model.
4.6 Summary
This chapter provides an overview of the areas of research which have dealtwith situation assessment and situation awareness. As it is clearly evident,these concepts have been addressed from many sides of research, where the mostdominant have been within information fusion and human factors research.
Already in 1987 situation assessment was defined as an essential part ofthe information fusion domain, as the US Army Joint Directors of Laboratories(JDL) working group within data fusion presented the model, known as the JDLData Fusion model, which clearly identified the level 2 information fusion processas situation assessment. The model and research of that age was clearly directedtowards military purposes, and the examples discussed were identification ofrelations in battlefield overviews and formation of higher level knowledge frommultiple instances of target tracking. Modern research within information fusionhas addressed situation assessment from other contexts than military, such ascyber security. Although a number of good approaches to situation assessmenthave been proposed, the techniques have not yet found their way into large scale
74

4.6. Summary
deployment in real-world systems. Situation assessment from an informationfusion perspective has yet to be addressed within the domain of robotics.
Again from a military background, the research within human factors sciencehas also targeted the concepts of situation awareness and situation assessment.Analysis of how humans form mental models of situations have successfully beenapplied in cognitive engineering for designing human-computer interfaces, whichoptimally utilizes strengths of both. Massive volumes of data can be interpretedand processed by computers but complicated reasoning and decision making onbehalf of the results are still optimally solved by humans. The 3-layered humansituation awareness model, presented by Endsley (1995) will form a baseline forthe conceptual situation modeling framework I present in this thesis. Comparedto the JDL Data fusion model, Endsley’s model describes an actual process ofcognitively building a model of situation awareness in multiple layers, which allare addressed in the presented work.
The final contribution in this chapter is the definition of the situation assess-ment modeling framework, which forms the basis for the approach to situationassessment in this thesis. Using the Extensible Markov Model by Dunham et al.(2004) as modeling basis, a framework for modeling situations as spatio-temporalsequences is presented. By the use of this approach, all three layers of situationawareness as described by Endsley (1995) can be achieved and yet be foundedin a mathematical model which is suitable for implementation and both humanand computerized interpretation.
In order to achieve prediction of future status, a novel prediction engine wasdesigned to process the situation model and continuously calculate the maximumlikelihood from current to other states in the situation model. Using this enginemakes it possible to monitor the likelihood of entering critical situations andthus prepare certain control algorithms for handling it, before any error occursto be recovered.
75


5
Processing Information Streams
The general nature of communication infrastructures in robotic systems are de-signed from the paradigm that most data sources are continuous, high volumesensors. Besides the high volume sensor information, the results of a level 0 orlevel 1 fusion process are often estimates, pose, and state values which are lowerin volume but often have the same high data rate as the raw sensor data. Thecontinuous streams of information set certain requirements to the performanceof the infrastructure, but also to the design of the algorithms which generatehigher level information from these sensor data streams.
Research targeted general data processing and computing have recently be-gun to see a similar challenge in the application they need to address. Manyapplications, such as web-technology and database systems, could tradition-ally consider data management and processing as dealing with data that mightchange over time, but being relatively constant in volume. Now, with dynamicand interactive websites and the possibility to gather information such as click-streams and user preferences from millions of users, the rate and overall volumemight be so great that all data cannot be stored for processing, which leads torequirements for efficiency and scalability. In other cases, information volumesmight be manageable, but the entire approach of data streams turns what hasbeen a static view of a problem and adds the temporal dimension to it.
The same challenge has appeared in many application areas, such as phonerecords analysis, financial transactions, data network security monitoring, andautomated surveillance. All these applications involve high volumes of data,which are collected through an on-line stream, and just as much information liesin the temporal domain, such as peaks in telephone activity in non-office hoursand anomalies in surveillance by detecting persons following unusual sequencesof behavior.
Detection of patterns of interest in datasets exists within a number of sci-entific areas, such as Machine Learning, Statistics, System identification. Thischapter focuses on analyzing approaches towards pattern and knowledge extrac-tion from information streams as well as selection of approach and design of thesituation assessment data processing module.
77

5. Processing Information Streams
5.1 Model-based approaches
A common approach to extracting information from data streams within thecontrol engineering and signal processing community is using a model-basedapproach. Using models has enormous benefits when using their results in directcomputations, as outputs are explicitly defined and internal structures oftenonly change little or to a certain degree. The drawback of most model-basedapproaches is that they require a complex analytical process, often by a skilledexpert to create and parameterize the models.
A wide range of filtering and estimation algorithms has been developed toperform on-line matching between various dynamic models and sensor informa-tion, such as the Kalman filter, the particle filter and countless derivations. Thegoal of these algorithms is to estimate unobservable states or to increase thequality of information in the system and they are generally considered to belongin the Level 0 and level 1 of the JDL Data Fusion Model.
Dynamic Bayesian network approaches, such as the Hidden Markov Model(HMM) is another popular model-based approach towards pattern recognition.Its application towards matching uncertain sensor stream data towards specificsituation models has been presented by Meyer-Delius et al. (2009a) as describedearlier. HMM is excellently suitable for adapting their parameters from trainingdata, but as their observation structure must be assigned to states of outputs,it becomes difficult to design a system which learns the model structure fromdata.
A key element in the motivation to use EMM as modeling framework wasthe fact that the structure of situation models cannot be fully known before op-eration, and thus requires an information processing framework, which supportson-line and dynamic creation of the model. This requirement criterion generallydisqualifies model-based information processing methods.
5.2 Pattern recognition and cluster analysis
Pattern recognition covers a rather large area of signal processing approaches,algorithms and applications. Duda et al. (2001) describes pattern recognition as
”the act of taking in raw data and taking an action based on thecategory of the pattern”
This is exactly what is intended to for mobile robotics. The aim of patternrecognition is to classify data based on either a priori knowledge or statisticalinformation extracted from patterns submerged in the data. Being an approachin the category of pattern analysis, cluster analysis is considered the most sig-nificant approach to unsupervised machine learning. Generally clustering is theproblem of finding structure in a volume of unlabeled data or in loose terms as”the process of organizing objects into groups whose members are similar in someway”.
78

5.3. Definition of information streams
To gain the benefit of the model-learning nature of clustering, an on-linecluster analysis driven approach has been chosen as data processing framework.Combining on-line clustering with the use of the first order Extensible MarkovModel framework covers the gap between the pure clustering methods which onlyconsider the spatial dimension of data, and the pure model-based approacheswhere most of the model structures can only be designed by hand.
5.3 Definition of information streams
Streams of information have been addressed in a number of different contexts.One definition has emerged in the research community around analysis of massivedata-sets. A data stream is considered as an ordered sequence of data-pointswhich can only be read once or a small number of times.
Guha et al. (2000) defines data streams formally as the sequence of pointsx1...xi...xn read in the increasing order of the indices i. They furthermore statethat data stream algorithms must access the input only via linear scans withoutrandom access and only require a few (hopefully one) scans over the data. Thesize of the data-set exceeds any available amount of main memory, so it is notpossible for an algorithm to store much of the data. The main novelty of algo-rithms for handling streaming data is that they can only store a summary modelof the data, which can be fitted in memory instead of the entire dataset. Thisdefinition of streaming data might apply, if the purpose was to design algorithmswhich can process large volumes of data, stored on tape-backup systems or otherlarge but finite sources.
Beringer and Hullermeier (2006) argues that the data stream model followsthe basic assumption that some or all data to be processed are not available forrandom access, but arrive as one or more continuous streams. This is supportedby Babcock et al. (2002), whose definition of data streams differs slightly fromthe models used in the database community:
• The elements of a stream arrive on-line (the stream is ”active” in the sensethat the incoming items trigger operations on the data, rather than beingsend on request).
• The order in which elements of a stream arrive is not under the control ofthe system.
• Data streams are potentially of unbounded size.
• Data stream elements that have been processed are either discarded orarchived. They cannot be retrieved easily unless being stored in memory,which is typically small relative to the size of the stream.
• Due to limited resources (memory) and strict time constraints, the pro-cessing of stream data will usually produce approximate results.
79

5. Processing Information Streams
5.3.1 On-line clustering of data streams
To effectively deal with the issues of minimization of I/O and memory cost whenextracting useful patterns in very large data-sets, Zhang et al. (1996) proposedthe well-recognized Balanced Iterative Reducing and Clustering using Hierar-chies (BIRCH) algorithm. BIRCH has been designed from a database context,and thus the design focus has been towards creating best possible clustering witha single pass through the data-set, but with the possibility for better results us-ing several passes. BIRCH was the first incremental clustering engine capableof handling outliers (sparse data points which are not a part of the underlyingpattern) which are very useful for processing of sensor data. A key strong pointabout BIRCH is that the algorithm is hierarchical, using a explicitly definedvolume of memory to store the cluster tree where the amount of details definedin the leafs of the tree only depends on allocated volume of memory. This hier-archical approach has a possible potential in a situation assessment context, butthe BIRCH algorithm is not developed towards the infinite data stream modeland would need quite some redesign.
The most common approach towards clustering of data streams is using avariant of the K-means or K-median clustering algorithm. The basic principleof the k-means algorithm is to partition n data points into K clusters, whereeach data point belongs to the cluster with the nearest mean value. In principle,the problem is NP-hard when applied to a static data-set, but a number ofapproaches to use heuristics to accelerate convergence.
Beringer and Hullermeier (2006) use a discrete furrier transform to smooth in-put data and to ensure real-time performance whilst still maintaining Euclideandistance. The STREAM system, proposed by O’Callaghan et al. (2002), keepsa memory restricted buffer where the data stream is stored. When the bufferis filled, the data-points are clustered into K clusters and only the K centroidsare stored. This process is iteratively repeated with new points. Because theK-means algorithm is one of the most simple and intuitive algorithms, its use isparticularly common in scenarios where a level of human understanding of theclustering process is required.
The principle K-means algorithm, however, results in data-set being parti-tioned into K clusters, which assumes the data-set should be partitioned intoexactly K clusters, as it is not the case for clustering into a non-finite and dy-namic model. In the domain of classification, the k-nearest neighbor algorithmis a commonly applied approach for assigning data-points to one of a number ofcategories on the basis of an existing and pre-categorized set of data-points. Thealgorithm is fairly simple, as the new data point gets assigned to a category bymajority vote among the k-nearest neighboring data points by means of a givendistance metric. The nature of the k-nearest neighbor algorithm is not suited foron-line streaming classification, as all points in the data-set must be analyzedto determine the nearest neighbor, but it does not impose any static limitationson the classification, besides main memory.
80

5.4. Clustering engine design
5.4 Clustering engine design
The signal input system for the situation assessment framework needs to be ca-pable of handling real-time information streams from robot system frameworks,not in hard real-time but at least keep up with the information flow. The pro-posed method is a hybrid between K-means clustering and nearest neighborclassification, combining the strengths of both approaches:
K-means clustering has the key benefit of reducing the state-space from theoriginal amount of data-points to a number of clusters, which suits therequirements for information streams.
Nearest neighbor classification is capable of assigning a data-point to thenearest cluster of points, working directly on the reduced clustered statespace.
To exemplify the design, consider a system that would monitor the relationbetween two physical objects, it could be the pose of a mobile robot and itstarget pose. The pose transformation between the poses is pre-processed withinthe robotic system and streamed to the situation assessment framework. At thetime t, the raw data vector is given by Dt with the dimension n.
Dt = {d1t, d2t, ..., dnt} (5.1)
The existing nodes in the EMM model is defined the list of vectors S = {s1...sm}, where m is the number of existing nodes in the model. The initial clusteringstep is to determine the cluster with the largest similarity Jmax as described inequation 5.2, using the similarity measure function J(), which is elaborated in afollowing section.
Jmax = maxx∈[1,m]
J(Dt, sx) (5.2)
To form the hybrid between clustering and classification, a similarity thresh-old defined by λ is used to determine if the new data point Dt should be classifiedas belonging to any existing node si in the EMM model or if a new cluster shouldbe created with the center in Dt.
Dt ∈
si where i = argmaxx∈[1,m]
J(Dt, sx) if Jmax > λ
sm+1 thus m = m+ 1 if Jmax < λ(5.3)
The EMM model will initially not hold any states s, unless some sections ofthe model have been hand-crafted by an expert or a previously learned model hasbeen loaded, so the very first data-set D1 will naturally be assigned as a node inthe EMM model. Through this on-line clustering process, the EMM continuouslymaintains the temporal transition relations of the model. An illustration of theclustering process is shown in figure 5.1 on the following page.
81

5. Processing Information Streams
Current state
Newest data point(matched to existing state) New point arrives
(not matched to any state)
Current state
New state created
Figure 5.1: The principle of the combined EMM structure and clustering framework. In theexample, two new data points are processed in the clustering engine, where the first pointis assigned to the current existing node and the second is below the similarity threshold andis assigned as a new node. Note that only cluster-centers are saved, so other points in theclusters are only included for illustrative purposes.
5.4.1 Distance metric
An important component of a clustering algorithm is the distance measure be-tween the data points. This distance metric is used to determine the level ofsimilarity between points in the data space and thus forms the background forassociating points to a given cluster. The choice of distance metric will also in-fluence the shape of the clusters, as some elements might be close to each otherin one metric and far away according to another metric. A large number ofdistance metrics exist, where some of the more popular are:
• Euclidian distance is the simple geometric distance between two points,given by the Pythagorean formula. The Euclidian distance is invariant torotation and translations of the data points.
• Mahalanobis distance uses a covariance matrix of the data points in thecluster to normalize the distances and thus making it scale invariant.
• Jaccard similarity is a measure for comparing the similarity and diversityif sample sets.
• Cosine similarity is a measure of similarity between two vectors by cal-culating the cosine of the angle between them. Cosine similarity is oftenused to compare documents in text mining applications.
Using the Mahalanobis distance would be a strong choice as metric, as ithas the benefit of compensating for scale differences by using the covariance ofthe cluster-set to normalize. Unfortunately, in order to calculate the covariancematrix of a given cluster, it is necessary to iterate through the actual data pointsof the cluster, making the metric unsuitable for the proposed clustering approachwhere only the center point is stored.
The choice of distance metric of the clustering engine has become the Jaccardsimilarity coefficient, which is defined as the size of the intersection divided by
82

5.5. Examining the effects of clustering
the size of the union of the sample sets
J(si, sj) =|si ∩ sj ||si ∪ sj |
(5.4)
Expressed over scalar vectors, the Jaccard index can be written as
f(A,B) =A ·B
|A|2 + |B|2 −A ·B(5.5)
The result of the similarity calculation will always be in the range of J = [0, 1]where a value of 1 denotes complete similarity and 0 means no commonality atall. The range of the index makes it significantly easier to assign a threshold λthan using a metric distance, such as the Euclidean, which differs significantlywith absolute scale.
5.5 Examining the effects of clustering
As a preliminary evaluation on the usefulness of clustering to extract informationfrom robot sensor data, a simple but relevant example is applied: recognitionof motion patterns from raw wheel encoder increments. The sensor input dataare chosen as hardware near as possible to illustrate that important higher levelinformation can be extracted, even from very low level data.
Figure 5.2: The Small Mobile Robot (SMR) platform used for the motion pattern tests.
The following example is based on encoder increments on a SMR (SmallMobile Robot) platform at the Automation and Control labs at DTU, which isan approx. 30x30x30 cm in size and differentially driven mobile robot platform,illustrated in figure 5.2. The robot was designed for teaching in mobile roboticsas well as doing tests without the risks and overhead of running medium sizedmobile robots. The SMR runs DTU MobotWare, which makes development
83

5. Processing Information Streams
and control completely transferable to other MobotWare operated robots, andthe current versions of the SMR include Hokuyo URG-04LX laserscanners andMicrosoft Kinect RGB-D cameras.
In the experiment, the SMR was instructed to perform a sequence of mo-tions, and the number of increments on the left and right wheel encoders (encland encr), as well as the speed reference for the left and right motors (speedland speedr) were logged at 100 Hz directly from the Robot Hardware Daemon(RHD). The motions were given in the following sequence:
Nr. Motion Note
1 Straight forward Motion starts and ends with accel/deccel to 0
2 Circular arc towards left Motion starts with accel from 0
3 Circular arc towards right No accel/decell other than motion change
4 Straight forward Motion ends with deccel to 0
5 Stationary turn towards left Motion is only accel/deccel as stationary speed is not reached
6 Straight forward Motion starts and ends with accel/deccel to 0
7 Stationary turn towards right Motion is only accel/deccel as stationary speed is not reached
8 Straight forward Motion starts and ends with accel/deccel to 0
Table 5.1: Motion sequence of the SMR in the experiment.
Inspection of the resulting encoder data allows manual annotation of themotion sequences, making the different motion patterns clearly visible includingacceleration ramps. An interesting observation was that a number of outliersappeared in the dataset. These outliers were caused by using Python to recordthe dataset, which proved incapable of keeping a sample rate of 100 Hz. Missinga sample in the data synchronizations caused the encoder increments to be thedouble of their expected real value.
84
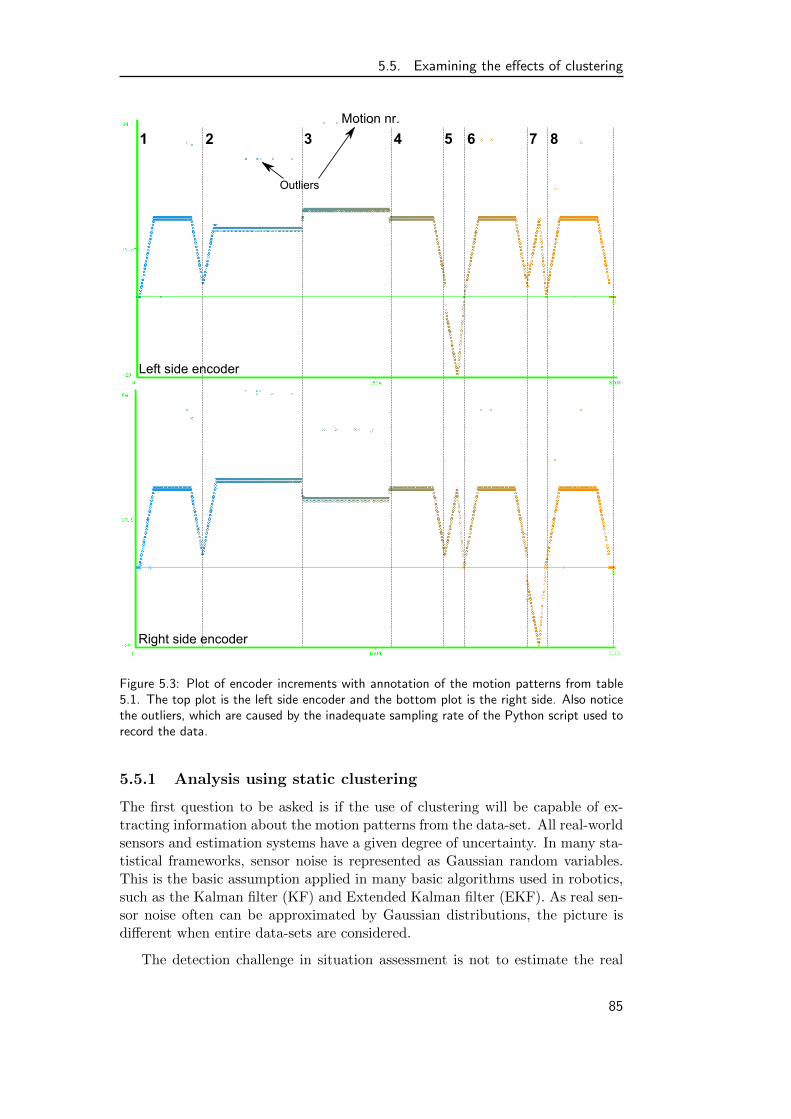
5.5. Examining the effects of clustering
0
0
1 2 3 4 5 6 7 8
Motion nr.
Outliers
Left side encoder
Right side encoder
Figure 5.3: Plot of encoder increments with annotation of the motion patterns from table5.1. The top plot is the left side encoder and the bottom plot is the right side. Also noticethe outliers, which are caused by the inadequate sampling rate of the Python script used torecord the data.
5.5.1 Analysis using static clustering
The first question to be asked is if the use of clustering will be capable of ex-tracting information about the motion patterns from the data-set. All real-worldsensors and estimation systems have a given degree of uncertainty. In many sta-tistical frameworks, sensor noise is represented as Gaussian random variables.This is the basic assumption applied in many basic algorithms used in robotics,such as the Kalman filter (KF) and Extended Kalman filter (EKF). As real sen-sor noise often can be approximated by Gaussian distributions, the picture isdifferent when entire data-sets are considered.
The detection challenge in situation assessment is not to estimate the real
85

5. Processing Information Streams
signal beneath a Gaussian noise distribution but rather to recognize changes andpatterns in sensor data over time. This data stream has the possibility of manystates that might or might not be related linearly. For this representation a pureGaussian distribution is inadequate to represent the belief state correctly, whichmakes it obvious to turn to the Gaussian Mixture Model (GMM) (Bishop, 2006).
Gaussian mixture distributions were defined by McLachlan and Basford (1988)as linear super positions of basic Gaussian distributions. By linear superpositionit is clear that such super positions can form even quite complex distributions.Using a sufficient number of Gaussian, almost any arbitrary distribution can beapproximated accurately. GMMs can efficiently be used for clustering by meansof the Expectation, Maximization (EM) algorithm, where the EM algorithm as-signs a probability distribution to each instance which indicates the probabilityof it belonging to each of the clusters. The EM algorithm would generally havebeen a very good choice as core clustering algorithm, but unfortunately it has ahighly iterative access on the data-set and thus unsuited for clustering stream-ing data. In this experiment EM is applied as reference and for validating theconcept of the chosen approach of data analysis.
For this purpose the data-set is analyzed using the Weka 3 Data Miningand Machine Learning software (Hall et al., 2009). Weka is developed in opensource by the University of Waikato and has become the de-facto standard ofopen source Data Mining tools, as it contains a large number of algorithmsimplemented (including EM), a very good suite to analyze data and a good APIfor researching in new algorithms. The result after a slight parameter-fitting andmore than 5 minutes of running the clustering process is shown in figure 5.4.
0
1 2 3 4 5 6 7 8
Motion nr.
Outliers
Cluster 1 Cluster 2 Cluster 3 Cluster 4 Cluster 5 Cluster 7 Cluster 8Cluster 6
Figure 5.4: Result clustering shown for the left encoder after running the data-set throughthe EM clustering algorithm in Weka, where each cluster are represented by a different colorin the graph.
86

5.5. Examining the effects of clustering
The clustering algorithm yielded a total of 8 clusters, which naturally did notfollow the motion primitives of the sequence as described in table 5.1 on page 84.The algorithm did, however, manage to capture each of the characteristic pat-terns of the motion sequence as shown in table 5.2. It is especially interestingthat the algorithm managed to assign all outliers to cluster 8, despite that theywere randomly scattered throughout the data-set.
Cluster Motion pattern
1 Stationary or values close to 0
2 Linear accelerations with both wheels
3 Straight forward movement as in motion nr. 1,4,6 and 8.
4 Circular arc motion towards right
5 Circular arc motion towards left
6 Stationary turn towards left.
7 Stationary turn towards right.
8 Outliers
Table 5.2: Motion patterns identified by the EM algorithm.
The results in table 5.2 clearly shows that higher level information can beextracted from even simple raw sensor measurements using clustering. However,this approach only managed to segment the spatial component of the data-set,where the situational information found in the temporal structure cannot bemodeled using this approach.
5.5.2 Analysis using EMM and on-line stream clustering
Using the EMM modeling framework and the on-line streaming clustering model,it is possible to model total spatio-temporal structure of the data set. Where theEM algorithm uses a mixture of Gaussian to model the cluster distributions, theproposed clustering algorithm uses a much simpler representation; the charac-teristics of the data-set cannot be encoded into the clusters in a similar degree.By organizing the clusters in the EMM, an even more detailed representationcan be achieved, as the cluster distributions are encoded into their relations,which also contains the temporal structure.
The data set was processed using the Jaccard similarity coefficient and witha threshold of λ = 0.985 which produces a fairly high number of states but alsoreveals a lot of details in the structure. The resulting EMM was streamed on-line to the graph visualization tool Gephi as described in chapter 6 on page 91.Figure 5.5 on the following page shows the Gephi visualization with a manualannotation of the motion pattern structure modeled in the graph.
87

5. Processing Information Streams
Start pose
turning right
Stationary
turning left
Stationary
Line
ar a
ccel
lera
tion
Straight forward
Outliers
Curve left
Curv
e r
ight
Figure 5.5: Graph visualization of the EMM model which have been learned from the data-setusing on-line streaming clustering.
It is clear that the EMM model also managed to capture the different motionpatterns, with stationary turns in the right part of the graph and linear togetherwith curve motions in the left side. It also managed to capture a number ofother details:
• Straight and curve motions follow the same acceleration patterns, whichwere also detected by the EM algorithm.
• The temporal locations of the outliers are identified. The outliers couldhave been deviations from normal operation caused by a wheel to be stuck,the robot touching an obstacle or a type of mechanical fault. On-line
88

5.5. Examining the effects of clustering
identification makes it possible to react to these critical situations andresolve them.
When analyzing the graph around zero speed, some interesting hardwarecharacteristics become visible. Figure 5.6 shows a close-up of the graph aroundthe zero state, with manual annotation to identify the different acceleration anddeceleration sequences. Here it is noticeable that none of the motions follow thesame patterns for the initial part of acceleration as for deceleration. When speedsbecome higher, the curves meet and the sequence becomes identical. This canbe caused by the differences in static and dynamic friction as well as electronicor software part of the motor control.
Start pose
Decel. from turn
Decel. from
turnA
ccel
. to
turn
Accel. to turn
Line
ar d
ecel
.
Line
ar a
ccel
.
Figure 5.6: Close up of the graph around initial acceleration and deceleration to zero. Noticethat acceleration and deceleration follow different patterns.
From this experiment it is possible to conclude that the use of clustering doeshave the capability of revealing relevant patterns of higher level information, even
89

5. Processing Information Streams
from low level sensor data. Clustering using EM showed itself capable of clearlyidentifying the correct patterns, but at the cost of high computation time anda large number of passes through the data-set. Using EMM and the simplernearest neighbor clustering proved capable of identifying the same patterns inthe data-set using only a single pass through the data-set. Furthermore, theEMM extracted the temporal structure of the data-set, which revealed moredetailed information about the outliers of the data-set and certain hardwarecharacteristics of acceleration and deceleration.
5.6 Summary
This chapter has presented a thorough analysis of the input signal processingsystem for situation assessment with a focus of clustering and classification ofinformation streams. Clustering of information streams are an efficient tool toperform on-line analysis of data where no explicit models exist and thus leavingthe problem unsuitable for model-based approaches such as Kalman filters andmany other statistical approached.
A clustering engine was designed to combine the strengths of both classifica-tion and clustering using the nearest neighbor principle to assign data points toexisting clusters on-line or to create new clusters if no clusters could be foundwith an adequate level of similarity. To evaluate similarity the Jaccard simi-larity index was chosen as it is suitable by its range of calculation output andsuitability to vectors with no explicit Euclidean relationship.
To evaluate the relevance and capabilities of using clustering and patternrecognition to identify higher level information, the effects of clustering wereevaluated on data-set containing incremental values from right and left wheelencoders from a differentially driven SMR mobile robot platform during a se-quence of different motions. Using the iterative EM clustering algorithm, it waspossible to identify and segment each individual part of the motion sequence.Using the on-line streaming clustering engine and EMM to model the spatio-temporal structure of the data-set, it was possible to identify and segment theindividual parts of motion sequence, as well as their temporal structure. Further-more, the temporal analysis showed that process characteristics, such as friction,can be learned and identified by the model.
5.7 Further improvements
Further improvements are, however, expected to be obtainable in the design ofthe clustering engine by further investigation into the use of some of the emergingon-line variants of hierarchical clustering. Using a hierarchical representationmay make it possible to choose the level of abstraction and detail representedin the model by selecting the appropriate hierarchical level in the model. Thus,it does require a hierarchical organization of the EMM structure as well, whichcould have some benefits, but also increase complexity significantly.
90

6
Situation Assessment Platform
The volume of software needed to run situation assessment is quite substantial,especially when the structure should perform at a level where technical detailsdo not cloud the focus of doing experiments with situation assessment, evenwhen working with a robot in on-line operation scenarios. In these scenariosgood user interfaces and visualization together with reliable software modulesare key issues. Furthermore, it is crucial that the framework architecture are asthin as possible to allow researchers to keep focus on algorithm development andtesting instead of struggling with complicated data interfaces and developmentparadigms.
This chapter is dedicated to put together the pieces from the analysis and de-sign of system components from the previous chapters. The synthesis will resultin a full framework, designed for situation assessment integration with mobilerobotic software frameworks. The presented framework, the Situation Assess-ment Platform (SA-Platform), provides a modular GUI-based and expandableinfrastructure to develop and experiment with situation assessment, with easyto use infrastructure and visualization.
Inspiration has been drawn in particular from the modern trends of develop-ment and research within open source robotic frameworks. Special attention isput into make sure that algorithmic functionality stays separated from frame-work infrastructure code and that data and functional services can be accessedtransparently and easily throughout the framework. Furthermore, it has beenan important design criterion that core functionality can be easily extracted andlater ported to a lightweight embedded version in a future on-robot version forcompletely autonomous situation assessment.
91
6. Situation Assessment Platform
Figure 6.1: The Situation Assessment Platform (SA-Platform) is the GUI based modularframework for on-line situation assessment with mobile robots.
6.1 Platform architecture
A Meta model for information fusion system architectures was presented in therevised JDL model by Steinberg et al. (1999). Although this model contains in-formation flow in both directions, there is no distinct definition on how informa-tion fusion results are connected to controllers and other information consumingmodules as they exist in robotic systems architectures. For the SA-Platformthe usefulness of the JDL model as practical implementation guideline is ratherlimited, as no JDL level 0+1 processes exist in the framework, leaving only level2 (Situation Assessment) to be implemented in the SA-Platform.
As discussed earlier, most modern robotic frameworks, including the popularPlayer/Stage (Gerkey et al., 2001), ROS Quigley et al. (2009) and CARMEN(Montemerlo et al., 2003), are all architecture neutral which does not provideany encouragement to adaptation of their architecture. DTU MobotWare isthe primary implementation target of the SA-Platform, which would make itobvious to implement situation assessment directly into the modular architectureof MobotWare. This will also be the solution in a future head-less and mobilerobot integration oriented version, but for ongoing research it is necessary witha graphical framework, where real-time evolution of the spatio-temporal modelscan be followed, visualized and efficiently interacted with.
The model of Situation Awareness (SA) by Endsley (1995) describes the pro-cess of human formation of SA and has been good inspiration through the workof this thesis. Although the model is not thought as a technically implementablemodel, it addresses the processes involved in situation assessment in better detailthan the JDL model and, furthermore, results in a principal architecture thatmakes particular sense for humans. From Endsley’s model the architecture musthierarchically support the three levels of SA, 1) Perception of elements in thesituation, 2) Comprehension of the situation and 3) Prediction of future status.
92

6.1. Platform architecture
In the SA-Platform, these levels of SA are implemented in the following models:
1. Perception of elements.Information for level 1 SA is received from the robotic frameworks, eitherfrom raw data, or from Level 0+1 information fusion processes (estimation,tracking, recognition, etc.). From MobotWare, raw low level sensor dataare received from the Robot Hardware Daemon (RHD) and AutomationRobot Servers (AURS), where AURS also hosts Level 0+1 InformationFusion processes which produce higher level data. The heterogeneous data-source module and situation modeling framework implement the level 1 SAcomponents.
2. Comprehension of situation.Comprehension is achieved by creating spatio-temporal relationships oflevel 1 SA information. This is implemented in the Clustering engine andin the EMM Spatio-temporal modeling framework.
3. Prediction of future status.Prediction of future status is achieved by calculating the maximum like-lihood of states traversing from the current node in the EMM model toother nodes, which are critical parts of given situations. Level 3 SA isimplemented in the prediction engine.
6.1.1 Design decisions
Besides the architectural structure, practical research development in a mobilerobot context leads to a number of requirements, which set good developmentpractice and the necessary supporting functionality for efficient research. Thefollowing list summarizes the key framework requirements.
Data sources must be heterogeneous.It should be possible to process multiple information sources from any partof a mobile robot system, at multiple levels of abstraction and at multipledata rates. Furthermore, the expansion towards new sources of data shouldbe simple and only require limited insight to the core system integrationdetails.
Multiple situation assessment instances must be able to run in parallel.Each assessment instance can contribute with minor clues to assist robotcontrol, major clues about the status of complete robot functionality oreven provide information to higher-level situation assessment instances.Hence, running several instances in parallel enables tracking of mulitiplesituations simultaneously.
Visual representation of the produced graphs in real-time.Manual and on-line inspection and debugging of temporal systems can bechallenging, as patterns can be cycled through many times and informationis encoded in the order of these sequences. Therefore, on-line visualizationis a key tool to follow the system behavior through execution.
93

6. Situation Assessment Platform
Separation of functionality and framework.The framework must support and encourage a clear separation betweenexclusive function modules and framework components, such that func-tion modules can be expanded and modified without modification of thestable framework core modules. Furthermore, the separation into functionmodules makes the exportation of modules e.g. to a simpler embeddedhead-less framework possible.
Combining the structure from the SA model by Endsley (1995) and the designrequirements leads to the architectural structure of the Situation AssessmentPlatform, illustrated in figure 6.2, which also illustrates the information flow ofthe architecture.
94

6.1. Platform architecture
Clustering engine
Situationmodel
Data SourceLaserscanner
features
Data SourceRaw signals
Data SourceObjects, states or knowledge
EMM Spacio/temporal model
Prediction engine
Heterogenous data sources
Figure 6.2: The basic elements of the proposed situation assessment architecture. Informa-tion from many data sources can be fused by the situation model. The clustering enginegroups and matches the data in clusters, which are structured in the spatio-temporal domainby the EMM model.
The situation model (described in section 4.4.1 on page 70) defines whichsources of data that should be part of the situation perception and fed into theclustering engine. The clustering engine matches and creates cluster states from
95

6. Situation Assessment Platform
the arriving data and feeds it into the EMM Spatio-temporal model. The EMMmodel builds a Markov Chain of states from the sequence of clusters, tracks thecurrent states and updates transition likelihoods between states in the graph.Finally, the prediction engine continuously calculates the maximum likelihoodof transition from the current state to other states in the Markov Chain in orderto predict the likelihood of transitioning through critical sequences.
This architecture contains many modules which receive and process informa-tion simultaneously. In order to monitor the many concurrent processes and atthe same time follow the temporal development of the EMM model, it is neces-sary to use a graphical user-interface where many functions can be illustrated,manipulated and monitored at the same time. For this purpose the SituationAssessment Platform is implemented building on the Java NetBeans Platform14,which contains an enormous volume of easily implementable features for build-ing a rich graphical user interface and yet the platform is built upon a clear-cutmodular system which helps to keep functionality in separate library moduleswith a limited number of dependencies. The modular system is very benefi-cial to ensure that UI and functionality do not get too intertwined and allowsa future port to a headless robot-system, which does not require direct on-linemonitoring.
6.2 Heterogeneous data sources
Being a higher level information fusion process, it is necessary to support datainput from a large range of information sources. To facilitate this the Situ-ation Assessment Platform has a plug-in based data-source back-end. Usingthe ServiceLoader architecture in Java, data sources are loaded as independentmodules, where data consumer modules can subscribe to their information atruntime without any source code coupling or compilation dependencies.
Data Source rhd://
Data consumer moduleJava ServiceLoader
Lookup and subscriberhd://enclSubscribe to data
Rhd://encl
Data Source aurs://
Sensor data (encl)
CallbacknewDataReady(encl)
Callback eventnewDataReady(encl)
Figure 6.3: Flow of the data source service architecture. A data consumer module subscribesto the RHD data source through the Java ServiceLoader API and receives a callback eachtime new sensor data are ready.
Figure 6.3 illustrates an example of a data consumer module, who wants
14The NetBeans Platform, http://netbeans.org/features/platform/, 2012, Oracle Co-operation
96

6.3. Situation modelling
to subscribe to the RHD data-source to receive the left encoder values: encl.The module initially makes a lookup in the Java ServiceProvider API to find therhd:// and subscribes to the encl variable. If the lookup is successful, the RHDdata-source module registers a callback to the data-consumer. When new valuesare received from RHD, a callback is invoked to the data consumer module (andother possible subscribers) which then can process the new data. Using thismethod, the data-source modules only need to retrieve the subscribed data fromtheir sources which greatly reduce bandwidth and resources.
All parts of the data source service interface are designed using interfaceclasses, which make it generic and efficient to create new data source modules.A new module is created by wrapping existing interface libraries or writing in-terfaces to new data sources and then just implement a few abstract functions toinsert the source module in the Situation Assessment Platform. At the currenttime of writing, the Situation Assessment Platform contains the following datasource modules.
• Native client interface to Robot Hardware Daemon supporting data ratesin excess of 100 Hz.
• XML-based interface to AURS with publish-subscribe of all data-variables.
• Socket interface to a dedicated ROS-node with a publish-subscribe con-nection to all topics in a ROS system.
6.3 Situation modelling
The situation model can be considered the recipe of elements to perceive inorder to comprehend a situation. It can be compared to the specific instrumentsa fighter pilot must monitor in order to predict if the aircraft is going to stallduring a steep climb or the indicators a power plant operator monitors in orderto comprehend situations such as leakages or pump errors.
The situation models are based on a XML configuration file, which defineseach situation instance with the following parameters:
• Clustering algorithm and threshold
• Data sources and associated variables and selected indices
• Predefined states (e.g. well-known critical states defined by an expert)
• Loading of previously learned EMM model in binary form
Situation models can be used to track and detect information at many levelsof abstraction, for example simple low level events as the correlation betweenwheel encoders and commanded wheel velocities as investigated in section 5.5on page 83 to discover anomalies like a wheel being stuck, mechanical faults orincreased vehicle loads (intentionally or unintentionally). Situations could also
97

6. Situation Assessment Platform
be of higher level, such as the correlation between states in a mission sequenceand the map pose of the robot.
An example situation model for tracking the relationship between EKF lo-calization covariance (diagonal elements 0, 4 and 8 in an array format) andthe (x, y) map coordinates of an AGV platform can be used to detect if thelocalization system is having abnormally high localization uncertainty at givenlocations (further investigated in section 7.3 on page 128). Using the localizationand mapping modules of AURS, the resulting situation model is shown in listing6.1.
<emm name="AGV State tracker" >
<model name="CovarTrack">
<clustering method="Jaccard" threshold="0.8"/>
<probability enable="true"/>
<data source="aurs" variable="localize.covar" index="0 4 8"/>
<data source="aurs" variable="mappose.pose" sync="true" index="0
1"/>
<load model="covar.bin"/>
<state name="Initial" data="0.5 0.5 0.5 0.0 0.0" />
</model>
</emm>
Listing 6.1: Example of XML configuration of a situation model to monitor the relationshipbetween localizer covariance and map pose for an AGV platform.
Data sources have many different rates of data, often with raw sensors run-ning up to hundreds of Hz and others only run at a few Hz. Often, there isno meaning in updating the relationship between the data at the change of allvariables, but synchronization should be tied to the updates of specific variables.In the example in listing 6.1, the model is updated on synchronization to themappose.pose variable, which is the last of the two variables to be updated.The probability parameter enables the prediction engine which calculates themaximum likelihood for transition from the current state to any state in thegraph at each update.
6.3.1 Loading of Models
The spatio-temporal EMM models can be learned from scratch from sensor data,but often previously learned models are necessary to perform situation assess-ment already at system start-up. Two methods are supported to pre-load EMMmodels, where the first method is hand-crafting the states in the situation modelXML file, using the <state/> identifier. This is especially useful for modelingby experts, who want to ensure that center-points of data-clusters are placedcorrectly e.g. known end-positions for position tracking through a motion se-quence. The second method is to load a binary EMM model, which has beensaved after earlier runs. Figure 6.4 on the facing page illustrates the loading andcreation process of the EMM.
98

6.4. Pre-processing of data
EMM Spacio/temporal model
States from XML situation model
Binary load from existing learned model
New data during runtime
Initial EMM model
Saved binary model
Figure 6.4: Pre-defined structure of EMMs can be loaded in several ways. States can bothbe loaded from XML situation models and from binary versions of models which have beenlearned through earlier sessions.
The EMM loading system also supports the combined loading of states inbinary form and from the situation model. In this case, the binary model isloaded first, then followed by states from the situation model. Before the statesare loaded from the situation model, the binary model is searched for matchingstates, which then are merged with situation model states if they are found.
6.4 Pre-processing of data
Sensor information is not always in good format for higher level fusion. Theoriginal JDL Data fusion model by White (1987) explicitly defined a stage ofsource pre-processing, as often it is necessary to do simple re-formatting of theoriginal data to suit higher level fusion processes. The INFERD Fusion Engine(Sudit et al., 2007) uses an Input Manager to transform raw input from cyber-attack sensors into a unified format suitable for situation assessment, but nocalculations or feature extraction are involved in the process. Duda et al. (2012)proposes the use of equi-width cubes for data-reduction in the pre-processingstage to limit noise and deal with too high data rates. In robotic systems pre-processing is often the process of extracting important features or compositionof measurement from bulk raw sensor measurements.
The Situation Assessment Platform does not explicitly have a pre-processingmodule built into the platform. Within DTU MobotWare lower level fusionprocesses are implemented in the AURS framework which is the most obviousdata source for situation assessment. Besides fusion and perception algorithmsAURS also contains an interpreter module for a rule-based scripting language(Andersen et al., 2010). The rule interpreter was specifically designed as the ex-ecutor of an easy and efficient scripting language to orchestrate the functionalityof AURS. Andersen et al. (2010) presents how the rule-bases scripting languagecan be used elegantly as mission management tool for autonomous tractor op-
99

6. Situation Assessment Platform
erations in an orchard and where the concurrent interpretation of rules provesefficient to coordinate auxiliary tasks, such as stopping insecticide sprayers atthe ends of tree-rows as a script which can operate independently without beingmixed into one main script.
Besides being useful for monitoring execution status and scripting missionsequences, the rule interpreter is also suitable as data pre-processor. The rule-based system supports basic algebraic operations (from math.h) as well as anumber of robotic-suitable tools such as pose (x, y, θ) coordinate system trans-formations. Using these operations sensor data streams and fusion results canbe processed e.g. to extract basic features from laser scans, transform relativeposes between objects or to calculate ∆-values from continuous measurements.Rules are executed at 4 Hz in AURS with default settings, which is sufficient formost situation monitoring. An example of pre-processing rule is illustrated inlisting 6.2.
100

6.5. Component structure
<rule name="dirDetector" run="true">
<init>
global.dir.run = true #Run the rule
<rule name="dirdetect" if="(global.dir.run)" >
mPose = mappose.pose #Extract the map pose
mAng = mPose [2] * 180 / Pi #Convert pose to degrees
#Calculate the closest direction
global.dir.dir = int(mPose / 22.5)
print "Direction detected: " global.dir.dir
</rule>
print("------------ Direction tracker initialized")
</init>
wait() : false
</rule>
Listing 6.2: Pre-processing rule used to reduce the robot orientation to a principal directionindication.
The preprocessor in listing 6.2 extracts the orientation from the robot map-pose and calculates a principal direction indication by dividing the orientationby 22.5◦. This direction indication can be applied to investigate if the robotfollows the same pattern of orientation in a given motion without having to dealwidth minor fluctuations in orientation.
For more complicated feature extraction and calculations which exceed therule-based scripting language, AURS has a well-established plug-in system wherefeature extraction algorithms can be implemented efficiently in C++. Withinthe plug-in system there is similar easy access to all resources of AURS, thuswith the overhead of preparing a source-code module with classes, headers andbuild-system adjustment.
6.5 Component structure
A modular software structure has been the de-facto development standard withinrobotics since the community driven frameworks became popular in the late1990s and early 2000s. The key goal of developing robotics software in modulesis to ensure that the software can be re-used for other purposes without beingintertwined, and thus leading to global re-use of software components writtenby experts in their fields. In modular software development, two layers of mod-ularity exist.
The first layer of modularity is to use a modular software framework (e.g.Player/Stage, ROS, MobotWare, etc.) as implementation platform. These plat-forms encapsulate functionality in modules which ensure well defined APIs anddependencies such that the modules easily can be transferred to the same frame-work in other systems or contexts.
The second level of modularity is within the source-code itself. A commoncaveat is to mix drivers and algorithms into framework specific code, whichties the functionality of modules to the frameworks and often makes it difficultfor others than the author to work on the modules to improve the core algo-rithms without being a framework expert. Makarenko et al. (2007) analyses the
101

6. Situation Assessment Platform
structure of framework specific code vs. drivers and algorithms in a numberof popular robotics frameworks. Only one (Orocos) out of six frameworks hasmanaged somewhat separation between drivers and algorithms and the roboticsystem framework. Others mix the code which severely limits the portability ofthe code. What is achieved in modern robotic frameworks are by Makarenkoet al. (2007) called the marketplace, which in many aspects has similarities tothe app-markets known from Smartphones. Modules for a specific frameworkcan be shared and applied quickly, but transfer to other platforms are at thesame complexity level as a complete rewrite.
The structural design goal of the SA-Platform is to ensure that even thoughit is developed using a graphical front-end and the sophisticated NetBeans plat-form, it must be possible to re-factor the core modules into a lightweight ver-sion, suitable for integration into embedded systems. This could either be intoa MobotWare AURS plug-in or as a stand-alone application. To enable this,the core of the architecture is based on five function libraries, which in princi-ple could be integrated into one tightly coupled application as illustrated in thearchitecture overview in figure 6.2 on page 95. The modules are:
• The DataSource library
• The XML Situation model loader library
• The Clustering engine
• The EMM Modeling engine
• The Prediction engine
In order to integrate the libraries into the Java framework without causingany source code dependencies, the Java ServiceLoader is used, not only for theDataSourceService as described in section 6.2 on page 96, but also to publishupdates of the EMMs to subscribed modules. The design choice of using a secondServiceLoader interface at the EMM model is based on a hierarchically layeredstructure of the software components in the SA-Platform.
6.5.1 Hierarchical structure
A hierarchical structure of software components is a natural and common way oforganizing information processing of increasing levels of abstraction. However,as discussed earlier, a hierarchical structure which enforces a certain organiza-tion of modules, interfaces and decision structure has a theoretical appeal andbenefits development in large and complex systems, but in practice it is hardto implement and adapt to the requirements of tackling real-world problems. Ibelieve such a structure can work well when it is used by the original inventorand maybe also by collaborators at the same department with a similar un-derstanding and mindset, but history has proven it is difficult to apply strictarchitectures in larger open source communities.
Similar problems led to the revision of the JDL Data Fusion model. The orig-inal model (illustrated in figure 4.1 on page 55) proved it difficult to implement,
102

6.5. Component structure
as it easily became interpreted as a canonical guideline for an entire softwareframework, where the model dictated which level of abstraction was processedat each level. The revised model has a lot of similarity with a traditional Sense-Plan-Act architecture, and like the NASA NASREM architecture (Albus et al.,1989) the model defines that all layers can process information from level of ab-straction, but the process types and resulting information abstraction level arefixed towards the architecture model. As a principal sketch for understandingthe roles of system components, I find the model beneficial, but when dealingwith practical implementation and real-world systems it can be too restricted tolimit the roles of system components to a certain type of processing and output.
The component structure of the SA-Platform has been inspired by the ar-chitecture implemented by Diankov and Kuffner (2008); Diankov (2010) in theOpenRAVE project. OpenRAVE is a software architecture designed for controland motion planning for humanoid robots. The versatile nature of humanoidrobots pushes the architecture away from the navigation-centric paradigm whichhas dominated traditional architectures for mobile robots. The principles of theOpenRAVE are an architectural breakdown by the functional services each mod-ule provides within the architecture and with API interfaces similar to ROS.Where a node-interface in ROS is based on the type of information which istransferred across the interface, the interface in OpenRAVE is based on moduleservices, such as Planners, Controllers, Sensors, Robots, etc.
In similar fashion Java ServiceLoader service interfaces in the SA-Platformare used to expose certain services within the framework, based on their func-tionality.
Another source of inspiration to the system architecture is the three levelsof situation awareness described by Endsley (1995) where the interfaces imple-mented represent one conceptual layer of situation awareness:
1. Perception of elements is exposed through the DataSourceService.
2. Comprehension of situation is exposed through the EMMService.
3. Prediction of future status is implemented in the prediction engine.
Both SA level 1 (perception) and level 2 (comprehension) are built around theJava ServiceLoader to make these interfaces available in the entire framework,and yet keep them free of tight independence couplings. The situation modelloader bridges these layers as it creates the DataSourceService connections be-tween data sources and clustering engine.
The clustering engine and the EMM model work in tight connection, clus-tering sets of perception data and organizing it in the EMM model. The EMMmodel is published through the EMMService interface, which issues callbacks toall subscribers when the EMM model is updated. This way, the GUI is updatedwith the changes in EMM structure, updates are streamed to the visualizationand the prediction engine updates transition probabilities.
103
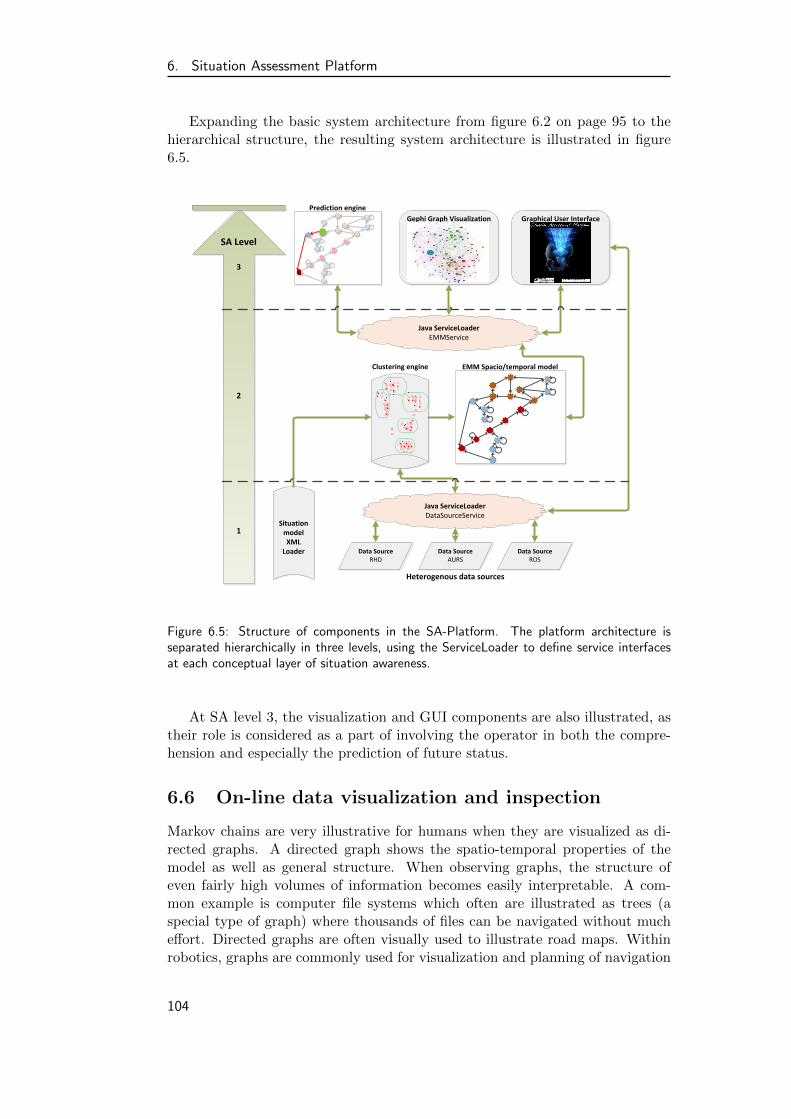
6. Situation Assessment Platform
Expanding the basic system architecture from figure 6.2 on page 95 to thehierarchical structure, the resulting system architecture is illustrated in figure6.5.
Clustering engine
Data SourceRHD
Data SourceAURS
Data SourceROS
EMM Spacio/temporal model
Prediction engine
Heterogenous data sources
Java ServiceLoaderDataSourceService
Situation model XML
Loader
Graphical User Interface
Java ServiceLoaderEMMService
Gephi Graph Visualization
SA Level
3
2
1
Figure 6.5: Structure of components in the SA-Platform. The platform architecture isseparated hierarchically in three levels, using the ServiceLoader to define service interfacesat each conceptual layer of situation awareness.
At SA level 3, the visualization and GUI components are also illustrated, astheir role is considered as a part of involving the operator in both the compre-hension and especially the prediction of future status.
6.6 On-line data visualization and inspection
Markov chains are very illustrative for humans when they are visualized as di-rected graphs. A directed graph shows the spatio-temporal properties of themodel as well as general structure. When observing graphs, the structure ofeven fairly high volumes of information becomes easily interpretable. A com-mon example is computer file systems which often are illustrated as trees (aspecial type of graph) where thousands of files can be navigated without mucheffort. Directed graphs are often visually used to illustrate road maps. Withinrobotics, graphs are commonly used for visualization and planning of navigation
104

6.6. On-line data visualization and inspection
routes.
When directed graphs become relatively large, they become fairly difficult tovisualize and interpret. In the case when graphs have sizes like common road-maps, it is possible for any human interpreter to investigate the structure toextract details of the graph. When they grow beyond a certain size, the indi-vidual elements of the graph become hard to distinguish and information fromthe graph must be identified using analysis tools and algorithms (Herman et al.,2000). Figure 6.6 shows an example by a graph rendering of my personal con-nections from the social network Facebook 15 and their individual connectionsusing the graph visualization and analysis tool Gephi (Bastian et al., 2009).When loading the raw graph it is a big mess, but applying a basic layout al-gorithm and a color-coding based on node modality (a clustering into clusterswith high degrees of mutual connections) yields a graph visualization in figure6.6 which is very useful for data analysis.
Figure 6.6: Graph visualization of a large network with many edges. This example is thefirst order connections and their individual connections of my personal social network onFacebook. A graph of this volume is impossible to analyze in raw form, but when layoutand partition algorithms are applied, higher level clusters become evident and lead to betterunderstanding of the complex graph structures. In this example the color coding actually doesrepresent different social groups of my connection, all automatically extracted by algorithmswith default settings using the Graph visualization and analysis tool Gephi.
In the simple example of post-processing of the graph, details emerge whichpreviously drowned in the vast volumes of nodes and edges. In the example
15Facebook, www.facebook.com, 2012
105

6. Situation Assessment Platform
in figure 6.6, groupings in my social network become evident, which even wasidentified correctly just using basic algorithm parameters. When the graphsare well-structured and visualized, even complex structures can be analyzed,first from the high-level structure which makes it possible to identify points ofinterest for closer analysis.
6.6.1 Graph visualization in the SA-Platform
Visualization of the graph-structures in the SA-Platform is done like the exampleby using the 3D graph visualization and analysis tool Gephi (Bastian et al.,2009) which is designed as a toolkit for visualizing and exploring large graphs.Gephi uses a fast OpenGL accelerated 3D rendering engine, which allows on-linerendering and analysis of the graph structure.
The module for graph streaming in Gephi enables on-line streaming of datato the graph workspace from external sources, either by letting Gephi pull froma source server or by pushing into Gephi in server mode. The EMMStream moduleof the SA-Platform pushes updates of the EMM graph structure to Gephi duringon-line clustering in JSON message format. The server interface provides fullcontrol of Gephi to add, remove and change the graph structure.
The Gephi is ideal to visualize the temporal behavior of the graph struc-ture during real-time operation, as the graph can be updated continuously andproperties of the graph can be visualized using color coding. This makes itsignificantly easier to overview complex structures and properties, compared toGUI printouts of numeric values. The on-line visualization is implemented usingthe following properties:
• Highlighting of current node in red color and large size
• Last visited nodes visualized with a fading color trail
• Likelihood of next nodes in green color code and thicker edges to predicttransitions
• Possibility to visualize maximum likelihood routes between current nodeand selected critical nodes
Figure 6.7 illustrates an example of the on-line visualization of a simple graphexample.
106

6.7. Summary
Node 1 Node 2 Node 4Node 3
Node 5
Node 6
Figure 6.7: Visualization example of an EMM streamed to Gephi. The current node 4 ishighlighted in red and larger in size. Previously visited nodes fade back to blue after 3transitions and states for subsequent transitions gets highlighted in shades of green basedon the transition likelihood together with the weight of the connecting edges.
Besides the on-line tracking of EMM development and clustering, all otherEMM structure information is also streamed to Gephi for examining the graphstructures using the graph analyze tools within Gephi. These tools are particu-larly suitable for analyzing an EMM model, which has been generated e.g. byperforming a number of docking operations. By off-line analysis critical situ-ations can be categorized, and the model can be examined to reveal possibleundesired behavior. With these annotations, the EMM can be stored and thenre-loaded as prediction model for later docking operations.
Like the SA-Platform, Gephi is built upon the NetBeans platform whichcreates a common look and feel. Furthermore, it also exists as a stand-alonetool-kit library for integration into other applications on the NetBeans platform,but unfortunately only back-end part of Gephi is included in this tool-kit and notthe real-time graph renderer, which is the most important part to use with theSA-Platform. The excellent UI and tools for graph analysis are another strongbenefit of using Gephi as stand-alone application, which in total leads to theconclusion that effort is best spent by keeping the two as separate applications.
6.7 Summary
A software platform is proposed for encapsulating the modules created for situ-ation assessment for mobile robots. Building upon the Java NetBeans platform,it features a rich GUI environment with a modular structure which eliminatesinter-module dependencies through the use of the Java ServiceLoader services.This way, modules can be removed and added with a click of a button andboth GUI components and internal functional modules accept the new serviceproviders, which only exist when module plug-ins are loaded into the platform.
The role of components within the SA-Platform has been designed to followthe model of human situation awareness by Endsley (1995). This ensures themindset of a situation assessment process and connects well to the mental modelof the human who will design the situation models required to form the situationperception layer.
The overall architecture emphasizes software modality, reuse of componentsand ensures that transfer to embedded applications is possible. Inspired frombest practices of modern open source robotic frameworks, there is no enforced
107
6. Situation Assessment Platform
architecture within the SA-Platform, but modules can interconnect freely be-tween each other using Java ServiceLoader services. Any type of data sourcecan be integrated using the DataSourceService interfaces, which enables quickadaptation to new robotic frameworks or direct connections to smart sensors.
Data pre-processing is not an integral part of the SA-Platform, but must beimplemented at the data source. MobotWare AURS provides an excellent infras-tructure for this, either by the rule-based scripting language for low dimensionaland low rate calculations, or through C++ based plug-ins for fast processing ofhigher data volumes and data rates.
On-line visualization is implemented using the Gephi graph visualization andanalysis tool. This significantly enhances the capacity of the observer to followsequences through fairly complex graphs. Furthermore, the analytical capabili-ties of Gephi are of great benefit for in-depth analysis of larger graph structures.
108

7
Experimental Evaluation
Situation assessment can be applied to a myriad of different purposes and appli-cations. The purpose of this experimental chapter is to use a number of exper-iments to investigate the performance and usability of the proposed frameworkfor situation assessment. In the chapter the design of situation models is specifi-cally addressed together with in-depth analysis of the achieved models and theircapabilities within perception of elements within the situation, comprehensionof current status and prediction of future events.
The first experiment investigates a situation assessment module to monitorthe environment of a mobile robot to detect if the robot is approaching narrowpassages which might require a change in navigation strategy in order to proceedsafely. The module is independent of the actual robot motion, but uses a featureextraction module to pre-process raw data from a laserscanner and hereby detectthe signature of an approaching narrow passage. From the assessment model,both the comprehension of the current status of the robot in relation to thenarrow passage and the prediction likelihood of future status can be extracted.
The second and third experiment investigate an AGV logistics robot applica-tion demonstration, which has been built in parallel at both DTI and DTU. Inthe experimental scenario, the mobile AGV platform transports a cart betweentwo locations in a continuous loop with a small route between the transports.The demonstration is prone to have localization errors, where the second exper-iment is specifically designed towards detect this error as deviations from knownbehavior. The third experiment investigates a large data-set of cart transport.A comprehensive situation model is designed to capture the behavioral signatureof the robot and its control while performing the application tasks in order toform situation awareness by comprehension and prediction in learned structuresof events.
Situation assessment faces the challenge of performing processing and clus-tering in a large volume of high rate data. In order to tackle this challengeusing hardware suitable for mobile robots, the last section of this chapter inves-tigates the use of acceleration in stream-based clustering using mobile graphicsprocessing units (GPUs).
109

7. Experimental Evaluation
7.1 Narrow passage detection
A classic critical situation for mobile robots is the move through narrow passagessuch as doorways or between obstacles. Especially for medium sized robots(50 cm to 80 cm wide) passage through doorways is often difficult and requireconstrained control strategies.
Mobile Robot navigation through open spaces is often done by route plan-ning between two points in the global map and using the same global positioncoordinates for control along the path. This global navigation scheme introducessome amount of uncertainty, as it can be difficult to map an entire building withadequate precision to position the mobile robot in e.g. a doorway with only 5-10cm of space at each side. Furthermore, the global navigation planners rarelyensure that the mobile robots have the correct orientation when they arrive atcertain points, such as a doorway. An example is found in the description of theROS navigation stack, where it is explicitly remarked: “it may have difficultywith large rectangular robots in narrow spaces like doorways”16.
To navigate safely through a doorway, specially crafted algorithms shouldbe used, which calculates path of the robot relatively to the actual local mea-surements of the doorway opening to make sure that the robot approaches thedoorway in a suitable angle and keeps at the center line of the doorway.
Such narrow passages could appear in well-known and predicable positions,such as doorways in mapped environments, but they could also appear unex-pectedly when obstacles are placed in the operating environment, such as pallets,boxes or tools, creating narrow passages in the previously open spaces. In suchscenarios, automatic detection and prediction of this critical situation are veryuseful for avoiding navigation errors and collisions.
7.1.1 Situation analysis
The situation assessment strategy addressed in this experiment is the Type 1:detection and prediction of events in known sequences. In this experiment,sequences are learned though a number of passages through doorways which areused for on-line classification of situation events and prediction of future events.
First step is to create a level 1 situation model which is capable of capturingthe characteristics of the mobile robot approaching a narrow passage and thepassage through it. The mobile robot can approach a passage in a number ofways as illustrated in figure 7.1. The approach could be perfect straight-on andcentered, but it could also be offset towards one of the sides or approaching at anangle. It is important to select parameters so that the variations of approach tothe narrow passage are all covered within the same temporal sequence to make acommon classification and prediction of when the robot approaches the passage,no matter if it is offset or rotated.
16ROS Navigation stack summary, Eitan Marder-Eppstein,http://www.ros.org/wiki/navigation, 2012
110

7.1. Narrow passage detection
Robot with laserscanner
Robot with laserscanner
Robot with laserscanner
A)
B) C)
Do
or
Do
or
Do
or
Figure 7.1: Movement through narrow passages can either be straight centered through thepassage as in scenario A) or either slightly offset towards one of the sides as in scenario B)or passing through at an rotated angle as in scenario C).
A key sensor for detection of the natural environment contours and obstaclesis the laserscanner. The laserscanner is used on almost all mobile robot plat-forms for research purposes for navigation (few newer platforms uses camerasexclusively). Also almost all commercial AGV systems use them for safety (colli-sion avoidance) and some for navigation as well. That makes the laserscanner anobvious choice as sensor source for narrow passage detection. The laserscannercollects a range of distance measurements of 180 to 270 degrees with an equalspacing between each measurement, often 1, 0.5 or 0.25 degrees. Within such ascan, the measurements from the laserscanner will capture a complete contourof the environment within range, as illustrated on figure 7.2.
111

7. Experimental Evaluation
Figure 7.2: Laserscan of environment contour, looking through the doorway at a commonoffice in DTU Building 326.
If the robot always would approach the same doorway centered and at thesame angle, all points of a complete laserscan could be fed directly into the situa-tion model. That would result in an EMM model being generated from a certainsequence of enormous data-sets of 180 to 1080 values. This approach would beextremely sensitive to any change in the environment, change in the robot ap-proach angle or offset or just by the noise generated when the same obstaclesare measured from slightly different positions (caused by the update frequencyof the scanner). So, besides being heavy load for the clustering engine, usingcomplete scans are unlikely to give robust detection of the desired signatures inthe environment.
To pre-process the high volume laserscanner data, a pre-processing plug-in forMobotWare AURS was designed and used to extract features from the laserscan.The hypothesis of the feature extractor is, that the robot, when approaching anarrow passage, the closest points on either side of the robot will represent theinner corners of the obstacles which form the narrow passage as illustrated infigure 7.3.
112

7.1. Narrow passage detection
Figure 7.3: The laserscan is separated into two halves, where the distance and angle to theclosest point in each side are extracted as features.
The laserscan L, containing nl points in polar coordinates, where each pointpscan is represented by a distance and the angle of measurement pscan = (r, θ)with relation to the center line of the robot. To characterize the closest point ateither side of the robot pl and pr, the laserscan is divided by two halves alongthe center line of the robot and the points are found by minimization.
pl = minx∈[0;
nl2 ]
L(x) Left feature point (7.1)
pr = minx∈[
nl2 ;nl]
L(x) Right feature point (7.2)
Two features are extracted from each feature point, where Dl and Dr aredistances to the closest point on left and right side of the robot center line. Al
and Ar are the angles between the Dl and Dr vectors and the center line.
Dl = |pl| Al = arg(pl) (7.3)
Dr = |pr| Al = arg(pr) (7.4)
(7.5)
These four features are able to isolate the signature of an approach towardsa narrow passage from the remaining points of a laserscan. But they are notsignificantly invariant to differences in angle of approach, as well as offset fromcenter of the passage. Differences in angle will change the relation between Al
and Ar and offsets will especially be visible in the relation between Dl and Dr.To compensate for this, the feature data-set sn was calculated containing thetwo variables d, which are the sum of the two distances, and a which is thedifference between the angles, as defined in equation 7.6.
113

7. Experimental Evaluation
sn =
{d = Dl +Dr Sum of distances
a = Al −Ar Difference of angles(7.6)
The d feature is resistant towards offset of the robot from the center, as anyoffset to one side will just transfer distance towards the other. The a featuredescribes the “opening” angle between the two points, which are invariant of anyrotation of the robot. Tests have shown this feature set to be sufficient to givea robust recognition of narrow space passage.
7.1.2 Door passage using simulated data
Using the Stage 3.2.2 simulator (Vaughan, 2008) and DTU MobotWare (Becket al., 2010) as controller, a quantitative evaluation was conducted to investi-gate the characteristics of the narrow passage detection model. The aim of theexperiment is to investigate how tolerant the detector was against variations inapproach angle and offset within the narrow passage. Furthermore, I want toinvestigate the possibilities of tracking and prediction of the situation.
A simple simulation environment was set up with two rooms, separated by along wall with a 60 cm wide doorway connecting the rooms. The robot used forthe simulation was a simulated version of the DTU SMR robot, which is 30 cmwide. The relatively narrow doorway of only 60 cm was chosen to represent adoor width which poses a challenge for the small robot. Figure 7.4 shows imagesfrom the simulation environment when the robot performs a doorway passage.
Figure 7.4: Simulation environment for examining situation modeling and recognition ofpassing through a narrow doorway. The simulated DTU SMR robot is 30 cm wide andmoves between two rooms through a 60 cm wide doorway.
A simulated test sequence was conducted where the robot passed throughthe doorway 20 times, starting at location offsets and approach angles whichwere randomly selected in the range x ∈ [−0.7;−1.0], being the distance fromthe doorway, y ∈ [−0.25; 0.25], being the offset from the center of the doorwayand θ ∈ [−40◦; 40◦] being the approach angle. If a set was chosen which wouldcollide with the doorway, a new random set was drawn. Figure 7.5 shows therobot trajectories throughout the simulated sequence.
114

7.1. Narrow passage detection
−1 −0.8 −0.6 −0.4 −0.2 0 0.2 0.4 0.6−0.5
−0.4
−0.3
−0.2
−0.1
0
0.1
0.2
0.3
0.4
0.5
X−Coord [m]
Y−C
oord
[m]
Door
Door
Figure 7.5: Trajectories of the robot during the simulated test sequence.
The simulated experiment was initialized without any predefined states inthe EMM, neither from the situation model or binary loaded. The first passthrough the passage generated the initial state sequence in the EMM model.This model was then subsequently used for matching the states of the remainingsimulated runs. The Jaccard similarity measure was used for cluster matching,using a similarity threshold of λ = 0.99.
New states in the EMM model are identified by consecutive IDs, starting at1. When the robot made the first pass through the door, a state sequence from1-11 was generated before the robot was inside the doorway. When the doorwayhas been passed by the front of the robot, the laserscanner no longer sees thedoorway, which causes various other features to be detected and a number of newstates created. Figure 7.6 illustrates the trajectory of the first passage throughthe doorway, including the points where the EMM transitions to a new state.
115

7. Experimental Evaluation
−1 −0.8 −0.6 −0.4 −0.2 0 0.2 0.4 0.6−0.5
−0.4
−0.3
−0.2
−0.1
0
0.1
0.2
0.3
0.4
0.5
X−Coord [m]
Y−C
oord
[m]
Door
Door
State ID
2 3
4 5 6 7 8 9 10 1112 13 14
1516Inside doorway
Figure 7.6: Trajectory of the first passage of the robot. The points where the EMM transi-tioned to a new state are annotated by stars and ID. State 11 accounts for the point insidethe doorway.
Following the first pass through the doorway, the last 19 passes through thedoorway were run using the same EMM model to evaluate the capabilities ofmatching states to recognize and predict the situation. Figure 7.7 shows thetotal set of robot trajectories together with the contours of EMM states thatwere matched through the passes. For plotting purposes, the state contourshave been interpolated between the discrete states which follow the trajectories,which cause some noisy edge effects around the top and bottom of the plot.
116
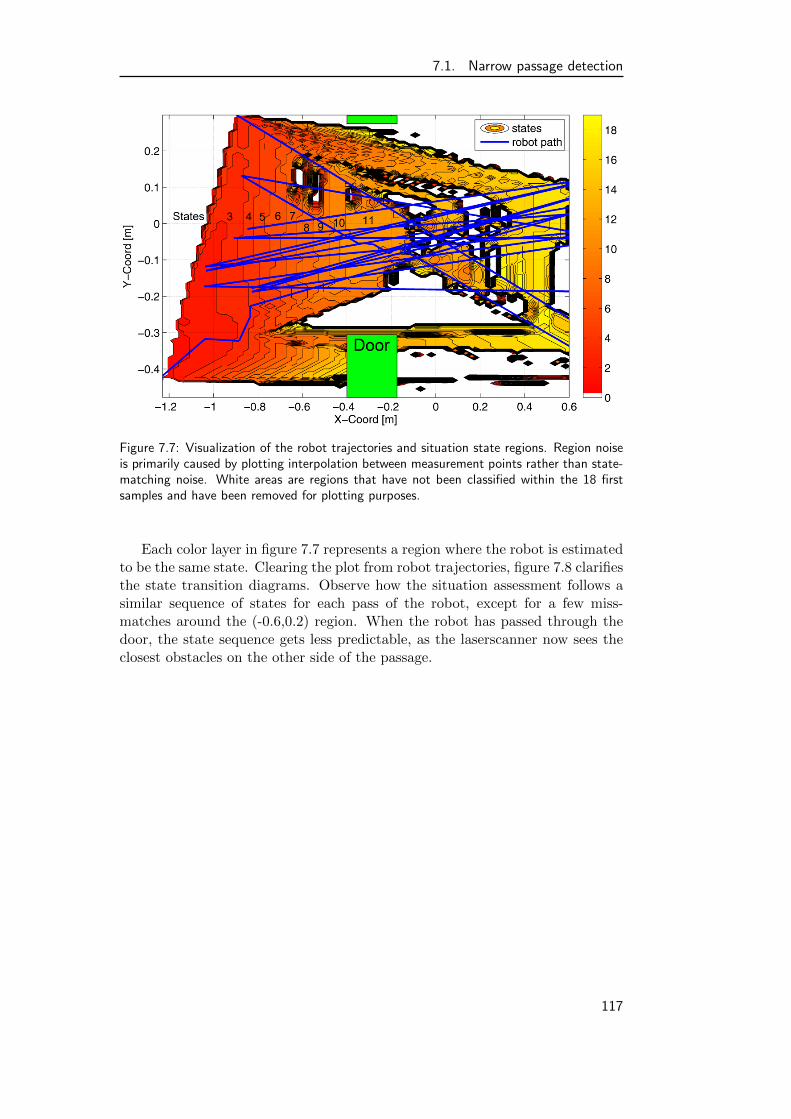
7.1. Narrow passage detection
Figure 7.7: Visualization of the robot trajectories and situation state regions. Region noiseis primarily caused by plotting interpolation between measurement points rather than state-matching noise. White areas are regions that have not been classified within the 18 firstsamples and have been removed for plotting purposes.
Each color layer in figure 7.7 represents a region where the robot is estimatedto be the same state. Clearing the plot from robot trajectories, figure 7.8 clarifiesthe state transition diagrams. Observe how the situation assessment follows asimilar sequence of states for each pass of the robot, except for a few miss-matches around the (-0.6,0.2) region. When the robot has passed through thedoor, the state sequence gets less predictable, as the laserscanner now sees theclosest obstacles on the other side of the passage.
117

7. Experimental Evaluation
Figure 7.8: Close-up on state regions without the robot trajectories. It is clearly evidentthat each robot pass has followed a similar sequence, except for a few spurious states around(-0.6,0.2) that have caused steep gradients in the interpolation.
Already from a significant distance, the state sequence predicts a high like-lihood of a narrow passage. For example, observe in figure 7.8 how the statesequence is almost linear from 60 cm before the door and until it has beenpassed. State 11 is observed to be the center of the door, with a state data-setof
s11 =
{d = 0.61 m
a = 3.09 rad(7.7)
Where the combined distance from the laserscanner equals the width of thedoor, and the angle difference between the closest points is approx. 180 ◦.Following the state transitions up to state 11 in the state transition likelihoodmatrix, reveals a clearly identifiable sequence back to state 4. To make a robustmodel, a slightly smaller situation sequence is chosen to represent the narrowpassage by the following state sequence Xs:
Xs = {7, 8, 9, 10, 11} (7.8)
The transition maximum likelihoods for the states of Xs, as calculated bythe prediction engine, are shown in table 7.1.
118

7.1. Narrow passage detection
State Transition to Likelihood
7 8 1.00
89 0.95
7 0.05
9 10 1.00
1011 0.91
12 0.09
11
12 0.55
14 0.05
34 0.30
Table 7.1: State transition likelihoods for the states of the level 2 situation model Xs
throughout the simulation.
The state transition table 7.1 can also be visualized in a directed graph,where the likelihood of predicting a passage through the narrow space is clearer.
Figure 7.9: Summary of the state transition likelihood for passing through the door. Throughthe 20 simulated runs, prediction through the chain is very high.
The typical sequence has been identified by inspection as of figure 7.9, so theprediction accuracy can be calculated from the Markov chain by its maximumlikelihood, given by
L(s11|s7) =∏i∈Xs
ai,i−1 = 0.86 (7.9)
This can be considered as a firm ground for changing to a different motionplanner, which is optimized for careful navigation through the passage. In oppo-sition to similar work for example by Meyer-Delius et al. (2009a), both situations
119

7. Experimental Evaluation
and state space are learned from actual operation in the environment. By theflexibility of the approach, situations and states can be classified during on-lineoperation, pre-imposed by hand-crafted models or trained from a data-set.
In this experiment, I have shown that a level 1 perception model can bedefined without too much complexity to produce meaningful situation states.By classification, a level 2 comprehension model Xs is extracted, that robustlydetects the planned situation. FinallyA¨, it was shown that a level 3 predictionmodel can be derived to allow the use of transition likelihoods for situationprediction.
7.1.3 Door passage using real world data
Using a small mobile SMR robot platform, the framework was also evaluated ina real world setup. The robot is similar to the simulated robot in figure 7.4 andis also running the DTU MobotWare mobile robot control software. For sensingthe narrow passage through the door, the robot was equipped with a HokuyoURG-04LX laserscanner mounted 5 cm above the ground and configured to cover180◦in front of the robot. The scanner samples the distance for every 0.35◦ata frequency of 10 Hz. Using this set-up, the robot was navigated through twolaboratory doors and one office door.
Figure 7.10: Small module robot passing through a doorway at a common office in DTUBuilding 326. A passage through 3 different doorways was investigated in this experiment.
Like in the simulated tests, the first passage through a laboratory door gen-erated the states that subsequently were used for matching. A Jaccard similaritythreshold of λ = 0.99 was used for cluster matching to keep results comparable tothe simulated experiment. Unfortunately, it is not possible to use the geographicposition of the robot as a comparison measure in this test, as the environmentswere different and only odometry was available. Figure 7.11 shows the statetransition time line for passing through the doors.
120

7.1. Narrow passage detection
Figure 7.11: State transition time-line for passing through two lab doors (A and B) and anoffice door (C) in a traditionally cluttered university environment.
Samples 10 to 18 in figure 7.11 (in red) are the actual passage through thedoorway, that is clearly identified in all three situations as state 12. Some statenoise is present, especially when the robot has passed through the doorway, aswe also saw on the simulated tests.
Very noteworthy is that state 12 is preceded by state 11 in all three cases.Examining the state transition matrix concludes that the likelihood for transitionfrom state 11 to state 12 is
P (s12|s11) = 0.56 (7.10)
Although the likelihood is not completely conclusive, it is still useful for pre-dicting possible narrow passages ahead and i.e. for selecting a slow maneuverspeed or a motion planner with focus on keeping the center between obstacles.The last part of the red sections is passage past the open door and objects clut-tering the doorway, creating noise but still some detections of state 11 and 12indicating a narrow passage ahead or at the current locating.
In this experiment I have shown that a robust detection of being within anarrow passage is also possible using real data and parameters identical to thesimulated experiment. Prediction is not possible through as many states as in
121

7. Experimental Evaluation
the simulated experiment, but performance might be improved by optimizingthe similarity threshold or selecting a more advanced clustering strategy thathandles sensor and environment noise better.
122

7.2. The AGV Logistics Robot
7.2 The AGV Logistics Robot
At DTI we have devoted quite some attention to the trends of AGV logisticsrobots and how they are becoming more and more common in modern industry.From being an isolated transportation system in closed warehouses, innovationefforts have now matured AGV application for operation in open areas amongfactory and warehouse workers. To demonstrate this, an AGV demonstrationwas set-up at the DTI robot laboratory to transport material carts betweenrobot installations as illustrated in figure 7.12.
Figure 7.12: Demonstration platform for the AGV demonstrations at the DTI Robot labo-ratory.
The mobile robot platform used for the coffeebot experiments was retrofittedwith an electromagnetic coupling (powerful door magnet) to connect the transfercarts, which proved to be a mechanically simple way of attaching loads in excessof 500 kg. Figure 7.13 illustrates the magnet device on the AGV platform.Detailed positioning in relation to the carts was done by placing a checker-boardbased guidemark at the front of the cart (as seen in figure 7.12). The guidemarkmodule was designed for MobotWare by Andersen (2005) and makes it possibleto estimate the relative position between camera and guidemark in 6 degreesof freedom. Position estimation accuracy was achieved down to an average of0.2 cm by Andersen (2005) with well calibrated camera geometry. Using theMicrosoft Kinect camera and an automatic tilt-calibration module by Viager(2012) an accuracy of below 2 cm is achieved only by measuring the cameraoffset from robot base in (x, y, z) coordinates. The electromagnetic couplingis quite sensitive to full surface contact before it develops proper holding forcebut the accuracy of the guidemark positioning approach using the automaticallycalibrated Kinect camera has proven adequate to robustly pick up the cart.Besides being useful for positioning, the guidemark also contains a 10-bit ID-
123
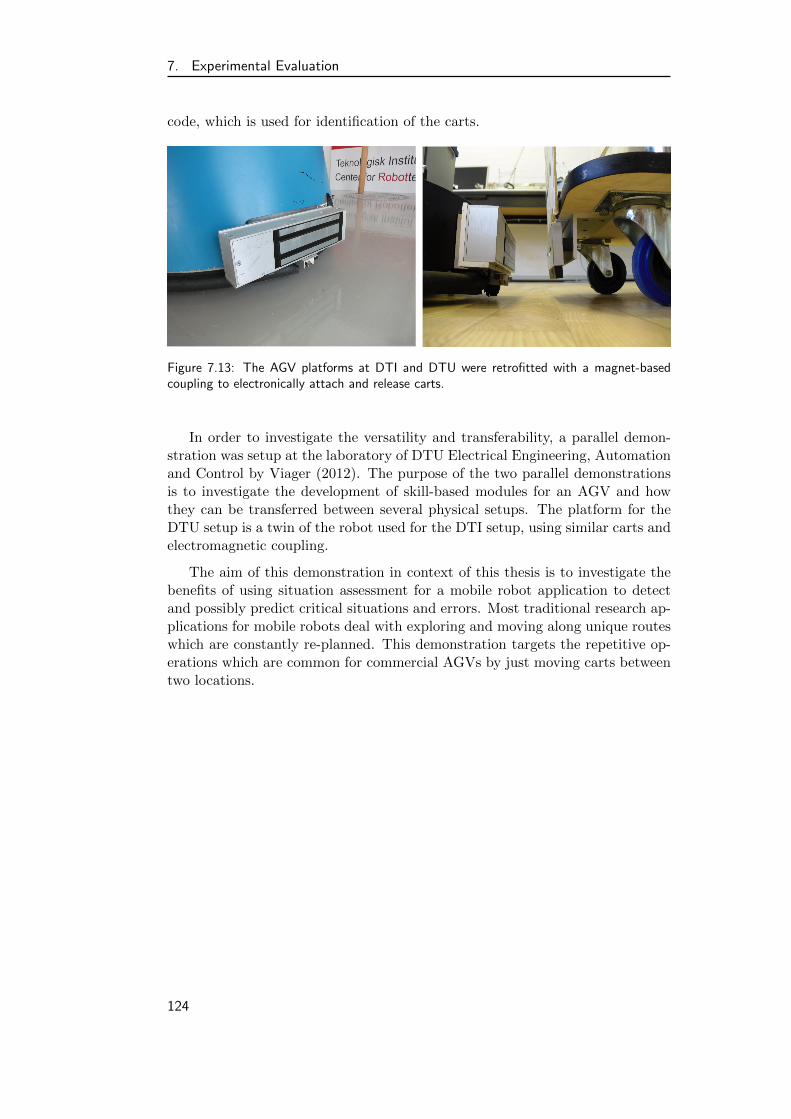
7. Experimental Evaluation
code, which is used for identification of the carts.
Figure 7.13: The AGV platforms at DTI and DTU were retrofitted with a magnet-basedcoupling to electronically attach and release carts.
In order to investigate the versatility and transferability, a parallel demon-stration was setup at the laboratory of DTU Electrical Engineering, Automationand Control by Viager (2012). The purpose of the two parallel demonstrationsis to investigate the development of skill-based modules for an AGV and howthey can be transferred between several physical setups. The platform for theDTU setup is a twin of the robot used for the DTI setup, using similar carts andelectromagnetic coupling.
The aim of this demonstration in context of this thesis is to investigate thebenefits of using situation assessment for a mobile robot application to detectand possibly predict critical situations and errors. Most traditional research ap-plications for mobile robots deal with exploring and moving along unique routeswhich are constantly re-planned. This demonstration targets the repetitive op-erations which are common for commercial AGVs by just moving carts betweentwo locations.
124

7.2. The AGV Logistics Robot
Figure 7.14: The twin AGV demonstration platform at DTU Electrical Engineering, Au-tomation and Control laboratories. The data-sets used for this experiment were collectedfrom this platform.
7.2.1 Situations in the application
The complete scenario for this demonstration follows a sequence, where theAGV is initialized at a start position. From there, it moves to cart location 1and picks the cart. The cart is moved and dropped at location 2, whereafter theAGV moves to a pause location. After a short pause, the AGV moves to pickthe cart at location 2 and returns it to location 1. Finally, the AGV moves tothe start position, where the mission loops.
Mission control is implemented through a state-machine in an AURS rulescript. The script coordinates script-based modules for initialization of the robotlocalizer, movement between start, cart 1, cart 2 and pause locations and invo-cation of rule-based cart pick-up script. The state-machine follows the sequenceof states mstate as shown in table 7.2
125

7. Experimental Evaluation
State mstate Action Cart attached
1 Initialize EKF localizer from guidemark No
2 Move from start to cart 1 position No
3 Execute cart pick-up rule No→Yes
4 Move to cart 2 position Yes
5 Execute cart drop-off rule Yes→No
6 Move to pause location No
7 Re-initialize localizer from guidemark No
8 Move to cart 2 location No
9 Execute cart pick-up rule No→Yes
10 Move to cart 1 position Yes
11 Execute cart drop-off rule Yes→No
12 Move to start location No
Table 7.2: State sequence of the AGV Application demonstration.
Initialization of the MobotWare EKF localizer is done by using the guidemarkpose estimation module, which also is used for docking to the carts. 2 guidemarksare placed at fixed locations near the AGV start and pause position, and theirabsolute position is integrated in the AURS Mapbase module. By estimatingthe robot location in relation to the guidemark coordinates in state 1 and 7,the robot is capable of self-initializing the localizer as long as it is within visiblerange of the guidemark.
Figure 7.15 illustrates a plot of robot trajectories in localizer map-coordinateswhen performing a set of 13 loops through the mission sequence. The plot alsoillustrates the start, pause and two cart locations. Furthermore, the plot hasbeen annotated with the mission states and movement directions to clarify whichparts of the sequence belong to what mission state.
126

7.2. The AGV Logistics Robot
1 1.5 2 2.5 3 3.5 4 4.5 5−0.5
0
0.5
1
1.5
2
2.5
World x−coordinate [m]
Worldy−coordinate[m]
MapPose complete sequence (2Hz localizer update rate)
Robot (x,y) pose
Start location
Cart position
1
Cart pos.
2
Pause locationMission state n
1
23
45
6
7
8
9 1011
12
Figure 7.15: Robot trajectory plotted through the large 13-loop demonstration scenario.The robot begins at the start position, picks the cart at location 1, moves it to location 2and then moves to the pause location. After a short while, the robot returns to pick thecart at location 2 and moves it to location 1 and then it returns to the start location.
What is interesting to notice in figure 7.15 is that there is only little overlapof the trajectories between the loops. Especially the motion in state 4,10 and instate 6,8 has a large variation in the trajectories. Even the pick-up and drop-off of the cart in location 2 varies by almost 0.5 m at location 2, which workswithout problems, as the pick-up is guided by local estimation of the cart poseusing the guidemark on the cart.
The large variation in robot motion trajectory makes it challenging to con-struct reliable spatio-temporal models of the robot motion itself, as the similaritythreshold must be set low enough to suppress the variations in trajectory, whichmakes it difficult to capture any deviations from sequence before it might be toolate.
In the following experiments in this section, I investigate design of situationmodels designed to capture the characteristics of the AGV logistics robot appli-cation to capture errors early and to aid control system with prediction of thefuture behavior of the robot.
127

7. Experimental Evaluation
7.3 Detection of errors in AGV localization tracking
The primary source to global localization in DTU MobotWare is an EKF basedlocalizer, which uses a RANSAC process to extract line-based features from alaserscan of environment contours. These lines are matched against a static mapof expected lines in the environment to continuously track the global locationof the robot. This approach to localization is fairly robust, as the maps aremanually measured and can be tuned for best possible visibility for the robot.Nevertheless, being an incremental algorithm, Kalman filtering-based localizersare vulnerable to wrongful matches or too many measurements without anymatch, as the filter often is incapable of recovering the correct position whenposition tracking is lost. In MobotWare the most common source of applicationerrors is the localizer loosing track of the robot position and thus crashing therobot.
In this example I investigate a section of the AGV logistics application atDTU, where the robot performs 3 pick-up operations of the cart. In the end ofthe third iteration, the robot looses localizer tracking of the position and stops.The situation type addressed in this experiment is the Type 2: deviation fromknown situation pattern, where the initial correct behavior of the robot is usedto form the baseline of normal operation and significant deviation from this istreated as emergence of a critical situation.
Figure 7.16 illustrates the robot trajectory through the demonstration ascalculated by the localizer, following the scenario described in section 7.2.1 onpage 125. Notice that the robot is following different routes to and from thestart and pause locations due to the different motion commands used, whichwill be clearly visible in the later spatio-temporal analysis.
128

7.3. Detection of errors in AGV localization tracking
1 1.5 2 2.5 3 3.5 4 4.5 50
0.5
1
1.5
2
2.5
World x−coordinate [m]
World
y−co
ordina
te[m
]MapPose for all loops (2Hz localizer update)
loop 1loop 2loop 3
Start location
Cart position
1
Cart pos.
2
Pause location
Crash location
Figure 7.16: Robot trajectory in the evaluation scenario. During the third loop, the robotlooses localization and stops after the pause location.
Observing the robot trajectory itself does not reveal that anything bad hap-pens at the third loop, as the robot does not move significantly out of its normalpath before it is stopped in this experiment. Other means are required to identifythe localization error which can be found in the EKF covariance matrix Σt.
The covariance matrix Σt represents the robot location uncertainty at a giventime t. When the robot moves, position uncertainty grows due to the accumu-lating measurement noise of the robot odometry. Through the EKF correctionthe noisy position estimate is matched to the known line-features of the map andthus position uncertainty is reduced. High values of the covariance matrix alsoincrease the probability for wrongful association as associations depend on thecertainty of robot position. These characteristics of the EKF covariance matrixmake it obvious to include it in a situation model which monitors localizationperformance.
Figure 7.17 illustrates the first diagonal element (1,1) of the 3 x 3 covariancematrix Σt which represents the uncertainty with respect to the x coordinate ofthe robot. Covariance for each of the three loops follows similar patterns, wherecovariance grows at certain positions, where no localization matches provide cor-rection information in the x direction. The other diagonal elements representsimilar uncertainties in y and θ. When the localizer looses track of the robotposition in the third loop, it becomes visible by a jump in the covariance imme-diately. Other peaks in covariance are caused by re-initialization of the localizer,where an initial value of 0.05 is used.
129

7. Experimental Evaluation
0 200 400 600 800 1000 1200 1400 1600 18000
0.01
0.02
0.03
0.04
0.05
0.06
sample no. (10Hz update)
covariance
elem
entvalue
Covariance for (1,1) diagonal element
loop 1loop 2loop 3
Figure 7.17: Covariance element Σt(1, 1), representing the uncertainty in relation to theestimate of the robots x coordinate. In certain areas no measurements provide informationfor the x dimension, where the covariance steadily grows. When the localizer fails in thirdloop, it is clearly visible by a jump in the covariance.
7.3.1 Situation model design
Situation assessment is essentially the matter of evaluation of relations betweenentities, their characteristics and behavior within a given context. In order todesign a situation model which can capture the characteristics and behavior ofthe AGV application, the (x, y) coordinate of the map pose from the localiza-tion system is a natural choice. As I am interested in capturing and possiblypredicting eventual errors in the localization system, the relations between thelocalization pose (x, y) and localizer covariance Σt will add the information aboutlocalizer estimation quality, to reveal lost pose tracking.
A situation model was designed, containing the following elements:
sn =
{xmap, ymap x,y coordinate from map pose.
diag (Σt) Diagonal elements of 3x3 covariance matrix(7.11)
No initial pre-defined states are included in the model as the start and pauselocations as well as the route have no clear definition of exact location and variesthroughout the number of loops. Cart locations are unknown to a larger extendthan being within a pick-up zone, where the fine-positioning is performed by theKinect camera and the guidemark.
130

7.3. Detection of errors in AGV localization tracking
7.3.2 Situation assessment results
Running the experiment through SA-Platform, using the Jaccard distance met-ric with a similarity threshold of λ = 0.995, an EMM spatio-temporal modelis constructed. As a key variable component of the situation model is the ge-ographic (x, y) coordinate of the structure, the EMM structure follows similarpatterns as the robot trajectory.
Moving cart
pause loc. Cart pos. 2
Cart pos 1.
Start loc.
Crash location
Figure 7.18: Constructed EMM spatio-temporal model of the AGV application. Noticethat nodes are not positioned geographically but as a result of an on-line force-based layoutalgorithm, although it has been repositioned to have somewhat similar structure to the robottrajectory in figure 7.16.
The resulting Markov Chain is illustrated in figure 7.18, where the repetitivecycle of movement between start position, cart position 1 and 2 and the pauseposition has formed the structure of the chain. Loops in each end of the chainare caused by the robot moving in different routes on the way to and from thestart and pause positions.
The critical event of the localizer loosing position tracking at the end of thethird loop is identified and visualized by the red nodes in the left part of thegraph. The event is clearly identified as a Type 2 situation as a deviation fromthe known sequence with an abnormal relationship between robot position (x, y)and covariance Σt.
Through on-line visualization in Gephi an operator can easily follow thecurrent state of the robot through the state sequence of the EMM and haveimproved situation comprehension. The large red node in figure 7.18 marks thecurrent node (which is the state of crash in this example) and makes it easy forthe operator to understand where in the sequence the robot is, and what the
131

7. Experimental Evaluation
next moves are expected to be.
Adding the transition likelihoods to the edge weighting in figure 7.19 makesit visible which parts of the sequence are parts of the core sequence for therobot, and which are considered rare states, created by deviations from the corepatterns. The deviations are caused by different motion patterns around thestart and especially pause locations.
Figure 7.19: The EMM model of the AGV application sequence with edges weighted by thelikelihood of them being traversed.
The weight of edges in figure 7.19 corresponds to the number of times theedges have been traversed during the on-line construction of the model. Alreadyafter the three loops through the sequence, it is fairly possible for an operatorto predict the future states from the on-line visualization. Before it makes senseto look into automated prediction using the prediction engine, it is necessary tolook into a larger data-set.
7.4 AGV Situation characterization and prediction
AGV logistics robot installations are not limited to the normal 8-hour shifts oftheir human counterparts. But in order to have gain from this benefit, the robotinstallations must be reliable in long term operation and capable of handling thecritical situations.
In this experiment I investigate a larger data-set of 25 minutes operation ofthe AGV application performing 13 loops through the cart moving sequence, asillustrated earlier in figure 7.15 on page 127. The data-set is applied to constructa baseline EMM model for analysis of Type 1 situations (detection and predictionof known future events).
The purpose of this experiment is to investigate the performance of the prosedframework for situation assessment on a large data-set with repetitive mobilerobot behavior, as it is a common scenario for commercial AGV systems. The
132

7.4. AGV Situation characterization and prediction
initial challenge is to design a comprehensive situation model, which captures thedetails and structure of the AGV application. The situation model will be ap-plied in the SA-Platform to construct a spatio-temporal EMM model of this largedata-set. With basis in the reference model for human situation awareness byEndsley (1995) I analyze and discuss the situation assessment results accordingto the three level of SA: perception of elements in the situation, comprehensionof the current situation and prediction of future status.
This sequence eventually also ends in a localization error in the beginning ofthe 14th loop, but this detection is not the prime target of this investigation.Nevertheless, the event is actually captured by the model and is used to evaluatethe performance in handling Type 2 situations (deviation from known patterns)as well as methods of capturing random “black swan” events.
7.4.1 Situation model design
In order to obtain the first level of situation awareness, it is necessary to selectthe elements in the environment which defines perception of the situation. Theelements should capture the essential characteristics of the situation, so thatstates of the EMM model have a descriptive meaning in the situation, and yetnot so much data, that the situation picture becomes occluded.
The situation model to capture the motion behavior of the robot does againinclude the map pose from the localizer, but this time the entire pose of (x, y, θ)has been included to enable the spatio-temporal model to also capture any ro-tational motion.
When moving the cart between the two locations an important characteristicis the input, iswitch from the micro-switch, which detects if the cart is correctlyattached to the electromagnetic coupling. Including this value in the situationmodel will make state sequences depend on if the cart is attached and clearlyidentify errors if cart attachment fails or the cart are lost during movement.
The robot behavior depends on the mission state mstate, so including themission state in the situation model makes the model reactive to any robotbehavior which does not fit into the correct state as well as motion through thesame map poses in different states becomes separated.
The diagonal elements of the localizer covariance matrix Σt include the lo-calizer prediction quality into the situation states, which are crucial to detectlocalization errors early as seen in the earlier example in section 7.3 on page 128and detect significant changes, e.g. in the environment, which affect localizationperformance.
Combining these 8 attributes result in a situation model as defined in equa-tion 7.12:
133

7. Experimental Evaluation
sn =
xmap, ymap, θmap (x,y,θ) Coordinate from ma ppose
diag (Σt) Diagonal elements of 3x3 covariance matrix
iswitch Micro-switch state (0/1)
mstate Mission state(7.12)
This situation model clearly demonstrates the strength of the heterogeneousDataSource module in SA-Platform. A XML implementation of the sn situationmodel, as shown in listing 7.1, quickly connects the required data-source com-ponents to the SA-Platform which combines the input values into one streamingdata-set for processing by the clustering and EMM engine. A Jaccard similaritythreshold of λ = 0.97 is selected to determine if new data-sets should be assignedto existing clusters or new should be created.
<emm name="AGVApplication" >
<model name="AGVMotion">
<clustering method="Jaccard" threshold="0.97"/>
<probability enable="true"/>
<data source="aurs" variable="mappose.pose" sync="true" index="0
1 2"/>
<data source="aurs" variable="localize.covar" sync="false" index=
"0 4 8"/>
<data source="rhd" variable="digital" sync="false" index="0"/>
<data source="aurs" variable="global.dockdemo.state" sync="false"
index="0"/>
</model>
</emm>
Listing 7.1: XML situation model to configure the DataSource in the SA-Platform to combinelocalizer variables and mission execution states from AURS together with digital input fromthe Siemens PLC on the Guidebot platform via RHD.
This situation model has been designed without performing any pre-processingon any of the input variables. If a higher level of abstraction was desired inthe situation model, variables of high variance or improper reference, such asxmap, ymap, θmap or Σt, could be classified into categories (e.g. high/low covari-ance) or transformed into more suitable values by pre-processing scripts. Theclustering engine were specifically designed to allow use of raw and noisy values,as they are represented in real-world robot systems, which have been the mo-tivation to design this situation model only using raw values directly from therobot control framework.
Similar to the narrow passage detection example in section 7.1 on page 110,the first loop through the sequence creates the initial EMM sequence of states andthe consecutive loops are matched to these states or form new states if similaritydrops below the Jaccard threshold. If a certain data-points was well known andhad a certain interpretation in the application, they could have explicitly beenintroduced in the situation model as an initial point. In this scenario no exactprocedure is defined for the AGV and thus no initial data-points are introducedthrough the situation model.
134

7.4. AGV Situation characterization and prediction
7.4.2 Situation assessment results
According to the situation awareness model by Endsley (1995), the formationof situation awareness is a process in three levels. In the following section Iinvestigate the results of using the designed situation model on the large data-set to obtain these three levels of situation awareness in relation to the AGVlogistics application.
Level 1: Perception of elements of the situation
Perception of the situational elements in the AGV application is investigated byanalysis of the resulting graph structure after running the situation assessmentprocess in the SA-Platform. Key performance criteria are to evaluate if thegraph describes the application in adequate detail to identify the process butalso that the relationships between situation variables does not create large andnoisy graphs without any clear structure.
The EMM model is constructed by processing the 25 minute long data-setand a total of 20.499 data-points were clustered and tracked through the spatio-temporal EMM model. The data-reduction capability of stream-based clusteringwas proven by a reduction to an EMM model with only 48 clusters (nodes), whichwere connected by 58 directed edges as shown in table 7.3.
EMM data-set
Nodes 45
Edges 58
Table 7.3: The large AGV data-set resulted in an EMM model with 48 nodes, connected by58 directed edges. It was a significant reduction from 20.499 sets of raw data.
Visualizing the graph, where nodes are positioned by their geographic (xmap, ymap)pose as in figure 7.20, makes it easier to examine the EMM states in relation tothe raw robot trajectory plot in figure 7.15 on page 127. The motion pattern ofthe robot is clearly identifiable although the density of states varies.
135

7. Experimental Evaluation
Start location
Cart position
1
Cart pos.
2
Pause location
Figure 7.20: Geographic representation of states in the EMM model for the large AGV data-set. Most loops through the experiment follow the same sequence in the graph. Width ofedges represents how many frequently they have been traversed. As the robot did not followthe same trajectory through all loops, alternative nodes to the main sequence are createdespecially in the left side, as there was large variation in robot trajectories. Many states areoverlapping geographically, as they only differ in θmap orientation or mstate.
Figure 7.20 shows, that the (xmap, ymap) pose only represents a small partof the situation model in opposition to the earlier experiment in section 7.3 onpage 128. Regions with only linear robot motion between cart position are sparsein the graph, as only (xmap, ymap) changes significantly in this region. Regionsaround pick-up, drop-offs and pause location is dense, as there are much θmap
rotation as well as changes in digital input iswitch and mstate. The geographiclayout of the graph makes the graph-structure comparable to the robot trajectoryplots but also occludes the true structure of the graph. Figure 7.21 depicts thesame EMM graph after running a force-based layout algorithm, color-coding thenodes according to mstate and adding node ID numbers.
The force-based layout emphasizes the structure in the graph which is con-nected by edges of high likelihood. In figure 7.21 it reveals that the central partof states in the EMM model follows a circular pattern. Some branches divergefrom this pattern, which is caused by the variation of robot trajectories. Di-verging branches in the model only improve the performance in recognition ofvariations in the situation, as long as branching nodes do not appear spuriousand without creating any real new structure.
136

7.4. AGV Situation characterization and prediction
Loca
lizat
ion
erro
r
2
3
4
5 68
9
9
10
10
11
12
12
1
1
n Mission state
30
32
42
19 20
29
40
31
41
1516
1718 21
2223
35
28
36
3839
24
25 2627
37
10
11
1213
14
33
34
3456
7
8
9
4445
46
47
Figure 7.21: EMM model after running a force-based layout algorithm, adding node num-bering and color coding of nodes according to mstate. The pattern of a loop through thestates is now clearly identified and occasional outliers are not occluding the structure. Thered nodes illustrate the localizer failure, which was clearly and timely detected.
From the situation model in figure 7.21 it can be concluded that the pro-posed level 1 situation model manages to capture characteristics from the AGVapplication data-set. The resulting model has clear structure, which matchesthe geographic position of events in the application as well as describing thesequential loop nature of the application.
Level 2: Comprehension of current situation
Although the structure of the EMM graph shows that a good perception ofelements in the situation has been achieved, it is not certain that the states andspatio-temporal structure of the graph are useful for forming comprehensionof the situation. As described by Endsley (1995): “Level 2 SA goes beyondsimply being aware of the elements that are present to include an understandingof these elements in light of pertinent operator goals”. In order to contributeto the comprehension of the current situation, states of the EMM model mustrepresent a descriptive state for the system behavior. If such descriptive stateshave been achieved, e.g. rotating robot, attaching cart, etc., the comprehensionof the current situation is accomplished by recognizing the current state withina certain temporal sequence.
Digging into the states of the generated EMM model, I initially investigate
137

7. Experimental Evaluation
the states in a critical situation for the robot application, the pick-up of the cartin mstate = 3. As figure 7.21 illustrates, the most likely sequence through thismstate is given by the sequence states s in Xm3:
Xm3 = {10, 33, 34, 13, 14} (7.13)
Or as illustrated in figure 7.22
3
415
10
13
14
33
34
9
Figure 7.22: Sequence of states in mstate = 3 investigated.
Table 7.4 shows the center-values of the data-set of the states in X3 exceptmstate which has been omitted as mstate = 3 for all nodes in Xs. The precedingstate s9 is also included in table 7.4, to illustrate that the state-change s9 → s10
was caused only by change in mstate.
sid xmap ymap θmap Σt(1, 1) Σt(2, 2) Σt(3, 3) iswitch State change
[m] [m] [rad] [m2] [m2] [rad2] [0/1]
9 3.19 0.94 1.69 8.8e-5 1.1e-4 3.3e-4 0.0 Preceding state
10 3.19 0.94 1.69 7.2e-5 9.0e-5 1.9e-4 0.0 mstate = 3
33 3.27 1.16 0.63 7.0e-5 1.3e-4 3.8e-4 0.0 Moving and rotating
34 3.27 1.16 -0.41 3.6e-4 8.3e-5 6.4e-4 0.0 Rotation only
13 3.14 1.16 -1.58 8.8e-5 3.0e-4 6.4e-4 0.0 Rotation only
14 3.14 1.42 -1.58 3.0e-5 6.7e-4 5.2e-4 1.0 Move and attach cart
Table 7.4: Values of EMM states in Xm3 to analyze the changes which formed the sequence.Significant changes in situation parameters are highlighted in bold text.
Table 7.4 shows the state sequence formed from docking to the cart in position1 using the Kinect assisted docking script. The significant changes between statesare described in the last column of the table, which are all easily interpretable
138

7.4. AGV Situation characterization and prediction
robot behaviors. The sequence well describes the actual sequence of the cartdocking script. Table 7.5 compares the steps of the docking algorithm to theextracted states.
Dock state Dock behavior Xm3 EMM state EMM behavior
1 Find cart pose using front Kinect 10 State switch mstate=3
2 Move in front of cart 33 Move and rotate
3 Rotate 180◦ 34,13 Rotation only
4 Update cart pose using rear Kinect - Not detectable
5 Move until cart attaches 14 Move and attach cart
Table 7.5: States of cart docking script compared with the extracted states of the EMMmodel in the cart docking state at cart location 1 (mstate = 3).
As table 7.5 shows the automatically generated EMM model managed tocapture all characteristics of the cart docking script from the raw values definedin the situation model. The only exception is the second cart pose estimationas this is not expressed in any of the variables of the situation model. So forthe scenario of docking to cart in cart location 1, situation comprehension wasaccomplished.
As a second example of situation comprehension I examine the sequence fromthe beginning of movement from the pause location in state s25 where mstate = 8and until the end of the loop sequence in state s42 and mstate = 1. This partof the model has been selected, as it is generated in the section of the AGVapplication where there was the largest variation in trajectory and divergence instate sequence. Following the sequence of maximum likelihood between the twopoints yields the following Xend set of states.
Xend = {25, 24, 37, 38, 39, 40, 41, 42} (7.14)
Or as illustrated in figure 7.23.
139

7. Experimental Evaluation
2
8
9
10
12
142
40
41
35
3839
24
25 26
37
3
Figure 7.23: Sequence of states in maximum likelihood route from s25 → s42 investigated.
The center points of each state in the Xend data-set are listed in table 7.6and again the preceding state s35 is included to observe the state change intothe first examined state s25.
sid xmap ymap θmap Σt(1, 1) Σt(2, 2) Σt(3, 3) iswitch mstate State change
[m] [m] [rad] [m2] [m2] [rad2] [0/1]
35 1.79 0.12 3.45 1,3e-4 2.6e-4 3.9e-4 0.0 6 Preceding state
25 1.60 -0.05 3.32 2.1-4 4.2e-4 5.9e-4 0.0 8 State change
24 1.64 -0.04 -2.77 4.0e-4 4.3e-4 4.9e-4 0.0 8 Rotation
37 1.39 0.19 -4.60 8.8e-5 1.1e-4 3.6e-4 0.0 8 Move and rotate
38 2.03 0.88 -3.58 6.0e-5 4.7e-5 2.9e-4 0.0 9 Move and rotate
39 1.61 1.07 -5.98 1.8e-4 1.2e-4 6.5e-4 0.0 9 Rotate
40 3.05 1.09 -6.26 3.3e-3 1.9e-5 5.1e-4 1.0 10 Move with cart
41 3.24 1.44 -7.86 2.1e-5 8.0e-4 1.2e-4 0.0 12 Rotate and drop cart
42 4.40 1.70 -5.92 5.8e-5 2.9e-5 9.7e-5 0.0 1 Move and rotate
Table 7.6: Values of EMM states in Xend to analyze the changes which formed the maxi-mum likelihood sequence from s25 → s42. Significant changes in situation parameters arehighlighted in bold text.
As expected, the state change analysis in table 7.6 is not as clear and explicitas the earlier analysis in table 7.4. The sequence of cart pick-up in mstate = 9 isonly represented in 2 states, compared to 4 in the X3 sequence. The key questionis, if the states are informative enough to allow comprehension of the currentsituation. Table 7.7 compares the behavior in the states of the Xend sequenceto the goals of mission state mstate.
140

7.4. AGV Situation characterization and prediction
mstate Mission Xend EMM state EMM behavior
8 Move to cart loc. 2 25,24,37 Rotate, then move while rotating
9 Pick-up cart 38 Move in position
9 Pick-up cart 39 Rotate 180◦, pick cart
10 Move cart to loc. 1 40 Linear move
(11)12 Drop cart, move to start 41 Rotate 90◦, drop cart
1 Arrive at start loc. 42 Move and rotate
Table 7.7: Mission goals of each mstate compared with changes in each states of the Xend
sequence.
Comparing the resulting from situation comprehension in the EMM statesof Xend with the behavior described by the mstate shows that each state inthe Xend sequence is describing approximately the same behavior as defined inmstate. Some states, like s41, indicate that the cart has been dropped althoughmstate = 12 instead of mstate = 11, which is the cart drop state. This is becausethe cart is dropped at the very end of mstate = 11 and the change in orientationas well as iswicth and finally mstate = 12 triggers the transition s40 → s41.
In summary, the state sequence from s25 → s42 does form a fairly goodcomprehension of the situation, as the interpretation of the Xend sequence intable 7.7 would serve as just as reasonable an explanation of the situation in thesequence as the mission description of the mstate columns.
Although the situation model was not designed specifically to capture lo-calization errors, the failure in the last loop of the experiment was captured infour error states s44 − s47 in figure 7.24. Despite that the robot only left itsplanned trajectory slightly, the dramatic increase of Σt was assessed as a newsituation. Node s44 captured a rising anomaly but returned to the normal statesequence for one transition before the anomaly grew enough for the sequence tosplit completely from the regular sequence in nodes s45 → s47.
Loca
lizat
ion
erro
r
2142
3456
7
8
4445
46
47
Figure 7.24: The situation of localization failure was successfully captured by the EMM bya number of states diverging from the known states.
141

7. Experimental Evaluation
This in-depth analysis of significance of states in the generated EMM modelscompared with expected robot behavior leads to the conclusion that a goodlevel situation comprehension was achieved by the situation assessment process.In the clean section of the data-set, all significant information was successfullyextracted from the docking procedures at cart location 1 in the state-set X3.Even in the slightly noisier section of the data-set a fairly long sequence ofstates in the set Xend proved informative and able to describe the situation ingood accuracy and most importantly by correctly identified events.
Level 3: Projection of future status
When thinking of mobile robotics control as purely reactive systems, it would besufficient to implement the situation comprehension, in order to react to certainsituation. Prediction of future events has been described as the “ace-factor”for fighter-pilots, where correct prediction of what was going to happen gavea winning edge compared to pilots without that ability. The same applies tomobile robots, where prediction and avoidance of errors and critical situationsare much better than good error recovery, as errors always degrade performanceand sometimes recovery is even impossible.
Projection or prediction of future status in situation has always proven slightlydifficult. For humans Endsley (1995) describes the achievement of Level 3 SA as“it is achieved through knowledge and dynamics of the elements and the compre-hension of the situation (both Level 1 and Level 2 SA)”. In the spatio-temporalEMM model of situations prediction of future state-transitions is generated bymaintaining transition likelihoods along edges between the node structure (Level1 and 2) of the EMM model. These transition likelihoods represent the statisti-cal likelihood that transition from one state to another is going to occur, basedon the transition patterns identified, when the model was constructed.
The prediction engine (presented in section 4.5 on page 71) continuouslymaintains maximum transition likelihoods between the current state of the on-line EMM model to all other states in the model. This way, watches can be setup to monitor maximum transition likelihoods towards selected critical states inorder to activate preventive measures if the likelihood if a critical situation risesabove selected thresholds.
In the following experiment, I investigate the prediction capabilities of theproduced EMM model and how prediction of state transitions could be usedto possibly improve the reliability of the AGV Application. State transitionprediction can be considered especially useful for prediction of events in the verynear future, as reliability might be highest, but for well-known models predictionwith longer time frames might be accomplished as well.
The first state-sequences to look into is obviously the X3 and Xend sequences.Running the prediction calculation on the maximum likelihood of the X3 se-quence transition from s10 → s14 yields a maximum likelihood
L(s14|s10) =∏i∈X3
ai,i−1 = 0.917 (7.15)
142

7.4. AGV Situation characterization and prediction
which is a fairly good likelihood for the robot to follow the X3 sequence ofstates if it is recognized to enter s10. Inspecting the sequence in 7.19 wherethe value at each sn node represents the cumulative likelihood calculated by thechain rule and values at each →-transition are the individual edge transitionlikelihoods.
s10(1.00)0.917−−−→ s33(0.917)
1.0−−→ s34(0.917)1.0−−→ s13(0.917)
1.0−−→ s14(0.917) (7.16)
Although the L(s14|s10) is fairly good for theX3 sequence, the analysis in 7.19reveals that the critical transition in the sequence is from s10 with a 1− 0.917 =0.083 likelihood to follow the edge towards s11 instead of s33. If s11 was known tobe problematic, a recovery strategy could be prepared or mission control couldbe adjusted to reduce this transition likelihood even further.
The challenge of longer term prediction becomes evident when analyzingthe Xend sequence from s25 → s42. Maximum likelihood calculation from theprediction engine yields
L(s42|s25) =∏
i∈Xend
ai,i−1 = 0.141 (7.17)
Despite that the sequence has the maximum likelihood for transition betweens25 and s42, it contains so many possible branches that the cumulative likelihoodbecomes quite low and difficult to use for any prediction. Inspection into thechain of transitions can provide further details on the critical sections and howthis sequence can be applied for prediction.
s25(1.00)0.71−−→ s24(0.71)
0.83−−→ s37(0.59)1.0−−→ s38(0.59)
0.5−−→ s39(0.30)0.53−−→
s40(0.16)1.0−−→ s41(0.16)
0.90−−→ s42(0.14)
Already at the transition from s25 → s24 the likelihood drops L(s24|s25) =0.71, as possible branches are also towards s26 with L(s26|s25) = 0.21 and to-wards s36 with L(s36|s25) = 0.071. These likelihoods give a fairly good estimateon which transitions to prepare for next, thus in this case, it would most likelybe to s24 but possible transitions to s26 and even s36 must also be handled in thecontroller. If a transition towards s26 occurs, the most likely sequence throughthe application loop changes to Xend2
Xend2 = {s26, s27, s28, s29, s30, s31, s32} (7.18)
with the cumulative transition likelihoods
L(s32|s26) = 0.20 L(s42|s26) = 0.056
143

7. Experimental Evaluation
So if different control strategies are needed for following the sequence froms26 → s32 than s25 → s42 (it is not in this case), then the strategy shouldalready be prepared in s25 and evaluated if the controller is capable of executingthe sequence in Xend2. If not, countermeasures should be activated to ensurethat the robot would stay on Xend.
Using the localization error as regular section of the data-set sequences wouldnot be justified as there is only this one instance of the error. The localizationerror can be considered as an example of an unexpected random error or blackswan situation. As no prior evidence could point towards this error happening,it could not be predicted by the EMM.
Although no planning could be executed in advance of the error, it can beused as a postmortem examination of the likelihood of a random error occurringin the AGV application and thus evaluate its reliability. Investigating the max-imum likelihood for s6 → s47 yields a likelihood for random “black swan” eventsof
s6(1.00)0.071−−−→ s45(0.071)
1.0−−→ s46(0.071)1.0−−→ s47(0.071) (7.19)
which corresponds with a failure in the beginning of the 14th loop ( 114 =
0.071) and denotes the reliability of the AGV application at the current state ofthe EMM model. Running the model for many additional loops would naturallyimprove this prediction rate and possibly even create a certain pattern in theerrors, which would be useful for prediction and setting up control rules to avoidthe errors.
This prediction analysis shows that transition likelihoods within the EMMmodel can be very useful for predicting future status of the modeled application.In regions where there is clear graph structure without many branches, goodprediction results can be obtained several states into the future. Where thegraph-structure contains many branches, it can be useless to perform rely onmaximum likelihood calculations through many state transitions but predictioninto the very near future can be useful to prepare for branches in the graph andpossibly improve mission control. Reliability of the application can be estimatedby the likelihood a new branch of states would be assigned which could be causedby a random “black swan” error event, or simply a new structure in the graph,caused e.g. by environment changes.
7.5 Discussion
The presented results are primarily obtained in context of navigation tasks formobile robots, but the capabilities of the proposed situation assessment frame-work should cope with a variety of real world application scenarios. The experi-ments were selected with the purpose to highlight the capabilities of the proposedsituation assessment framework and address the different strategies presented,such as pre-processing of data to extract features, error detection on specificallyselected data-sources and general situation assessment using a heterogeneoussituation model.
144

7.5. Discussion
Characteristic of the selected experimental scenarios has been that the inputdata have in most cases been floating-point numeric data, such as laserscannerdistances, robot poses and localizer covariance. This has been chosen deliberatelyas this is how most information is represented in the control-oriented architectureof most mobile robot frameworks. The experimental results demonstrated thatproper higher level knowledge can be extracted from the actual data that areused in the controller without producing artificial symbolic facts or using over-simplified models.
Situation assessment has demonstrated its benefit in a number of differentapplications. The small module which continuously monitors the approach ofnarrow passages is an example of small house-keeping situation assessment mod-ules which work without being tied too closely to the robot application itself.Development of a number of these situation assessment modules for various pur-poses will supply the robot mission management with situation comprehensionsto adjust the control strategies and to sanity check the mission execution. Thesituation model of the large-scale experiment includes a large number of het-erogeneous data to form a complete situation assessment over a particular partof a mobile robot mission. This type of situation model learns the robot be-havior while performing repetitive tasks and thus enables detection of deviationfrom the normal sequences as well as the recognition of the overall status ofthe situation. It efficiently combines the internal robot status and status of theenvironment. Finally, this model proved useful for prediction of future statusand preparing the robot for approaching state changes and branches in courseof future actions. The prediction framework proved to depend significantly onthe model characteristics at the point of prediction, where some regions allowedhigh likelihood prediction for a fair number of future state transitions and othersonly provided a low quality prediction for the very next state transition.
Although the context of this thesis and all examples in this chapter have beenwithin the domain of mobile robotics, nothing in particular has been designedin the architecture to only suit this domain. Actually, the resulting situationassessment framework might suit other domains even better, as dealing with thelarge level of uncertainty that exists in the domain of mobile robotics is one ofthe key challenges for situation assessment framework. Industrial automationand industrial robotics operate in much more isolated environments and with amuch larger count of identical cycles, which are an ideal environment for situationassessment. Thus the future work on the proposed situation assessment platformwill continue within industrial robotics for flexible automation for small andmedium sized companies.
145

7. Experimental Evaluation
7.6 Performance considerations
Performance is a key issue, when designing systems to deal with data streamingdata sources. Clustering data-sets extracted from high volume data sourcessuch as robotic vision systems or laserscanners are challenging both in terms ofdimensionality, data rate and the number of clusters recognized in the data-set.When learning structures from these data-sets in an on-line way, the number ofdetected clusters can become very large, containing many interesting temporalpatterns in the same structure. Combining the large data-sets with data ratesof 100 Hz (10 ms) for robot control, 75 Hz (13.3 ms) for laserscanners and 30Hz (33.3 ms) for vision systems, it is necessary to look into high performancecomputing to design a system which can handle this load.
A recent trend of achieving High Performance Computing (HPC) capabilitieswithout investing fortunes in refrigerator sized computing clusters is the use ofGeneral Purpose GPU computing, using the massive parallel computing capabil-ities of common Graphics Processing Units (GPUs). Getting a position on theTop 500 list for the world’s supercomputers requires calculation performance of209 TFLOPS17, where a high-end consumer GPU like the AMD Radeon HD7970can produce as much as 4.3 TFLOPS for less than 400 euro.
GPGPU technology is also an optimal solution with respect to mobile robots.Low power platforms for mobile computing do now include potent GPUs, whereplatforms like the AMD E-450 computing platform include the Radeon HD6320GPU, capable of producing 80 GFLOPS single precision with a power consump-tion of less than 18 W. In comparison an Intel quad core i7 920 CPU at 2.6 GHzcan deliver 69 GFLOPS single precision consuming 130 W. Moderately sizedcomputing platforms like the E-450 are ideal for medium sized mobile robots,where power consumption is critical, but yet demanding data processing fromcameras and laserscanners must be handled.
With this goal in mind, a GPGPU version was designed of the Jaccard sim-ilarity coefficient for dynamic stream clustering. Key design decisions were:
• The algorithm should be portable across GPU vendors, so OpenCL waschosen as implementation platform.
• Modest and mobile suitable hardware specifications must be assumed.
The development and test platform was a modest Intel quad-core i7 720QMat 1.6 GHz (with Turbo Boost to 2.8 GHz) and an Nvidia Quattro 880M GPUfeaturing 48 GPU cores at 550Mhz (the E-450 has 80 cores at 600 Mhz).
7.6.1 Algorithm analysis
As previously described, the Jaccard similarity index is given by
f(A,B) =A ·B
|A|2 + |B|2 −A ·B(7.20)
17Top500 Supercomputer list, June 2012, http://www.top500.org/list/2012/06/100
146

7.6. Performance considerations
For an efficient calculation of the index three vector products are required:
• A ·B
• |A|2
• |B|2
These calculations themselves leave good possibility for parallization, as thevector products can be done as a parallel multiplication of each vector element,followed by a reduction sum of the multiplication products.
Furthermore, the vector B represents one data-vector of the cluster of existingstates, where the cluster is a growing collection of state vectors in the countsfrom tens to tens of thousands of vectors. So each similarity calculation can beparallelized by the number of vectors.
The square product |A|2 of vector A is calculated on basis of the new vectorand is only required as a scalar in the Jaccard calculation between all B vectorsin the cluster. That makes it obvious to perform |A|2 initially on CPU and onlyparallelize A ·B and |B|2.
7.6.2 Memory management
Many aspects of this algorithm are heavily related to memory operations andallocation. Memory management is a general problem in GPGPU as the simpleGPU cores do not have features like branch prediction and automatic caching.Main memory access is enormously slow compared to the calculation capabilityof the GPU, so much performance is gained by organizing memory layouts sothat GPU cores can retrieve blocks of memory to process in a number of threadsinstead of individual assess. As I will return to later, the algorithm itself isstrongly memory-bound, but there is also a general challenge of efficient memorymanagement of an ever growing list of vectors.
The memory management is implemented using large sequential memoryarea, where individual vectors are placed sequentially and simply addressed by arunning index. Although being slightly messy in the addressing, this implemen-tation allows efficient whole-block transfers to the GPU and efficient re-allocationfor growing buffers.
Stored vectors
Stored vectorsNew
vector
Newvector
Allocated memory
Allocated memory
Host buffer(CPU memory space)
Device buffer(GPU memory space)
Only new vectors are transferred from host to device memory
Figure 7.25: The GPU device memory holds a persistent mirror of existing vectors in thecluster, so only new vectors must be transferred to the device before running a calculation.
147

7. Experimental Evaluation
7.6.3 Measurement of performance
To evaluate the performance of the algorithm the runtime of the calculationsmust be compared with the number of calculations. As previously mentioned, avector product can be described as a product of each element and the sum as inthe pseudo code snippet in listing 7.2.
for each i in d :
2 product = A[i] * B[i]
productSum += product
Listing 7.2: Example product of vector A and vector Bwith dimension d
The number of floating point operations in listing 7.2 are one multiplicationand one addition resulting in 2 · d operations for each vector. Extending thecalculation to calculating the Jaccard similarity index between vector A andB with the dimensions d against all n elements in the cluster, the number offloating point operations can be calculated from the pseudo code in listing
sA = |A|^2 //2 * d FLOP
2 for n { //n * (
sB = |B|^2 // 2 * d FLOP
4 pAb = A * B // 2 * d FLOP
jaccard = pAb / (sA + sB - pAB) // 3 FLOP
6 } //)
Listing 7.3: Pseudo code of the calculation steps for running the jaccardsimilarity index on between all elements of the cluster.
Resulting in a total number of floating point operations pr. jaccard calcula-tion of
NFLOP = 2 · d+ n · (2 · d+ 2 · d+ 3) = 2 · d+ n · (4 · d+ 3)FLOP (7.21)
Running a naive CPU implementation of the pseudo code for a vector di-mension d = (2, 32, 512) elements yields the following performance
148

7.6. Performance considerations
Figure 7.26: Base CPU performance of calculating the Jaccard similarity index with vectorsof dimension d = (2, 32, 512) and cluster elements in the range from n = [1, 10000].
7.6.4 GPU implementation
GPU cores are simple arithmetic units whose performance and capability itselfare fairly low but their true power lies in their massive number. The architectureof most modern GPU is built with a number of multiprocessors which orchestratea number of stream processors or cores (often 32 pr. multiprocessor). Eachmultiprocessor has one single instruction unit, forcing all cores to execute theexact same sequence of instructions simultaneously, only separated by a numberof indices which allow them to select different elements in memory to process.Depending on the architecture, the GPU can have from 1 to more than hundredstream processors to handle different (or identical) instruction sequences.
Within OpenCL (and also Nvidia CUDA), the threading model can be designin a grid of m × n threads, all executing the same kernel. The cores in eachmultiprocessor executes m threads and the n thread blocks are allocated betweenthe multiprocessors, as they become idle. For the Jaccard similarity calculationsthis model is very suitable resulting in a dxn threading model as illustrated infigure 7.27.
149

7. Experimental Evaluation
Thread[1]
Thread[d]
Thread[1]
Thread[d]
ThreadBlock[1] ThreadBlock[n]ThreadBlock[...]
Figure 7.27: GPU Threading model for the Jaccard similarity calculations. A matrix structureof d×m threads unrolls the two loops required for the vector product and cluster elementiterations.
This breakdown allows also using shared memory for operations within onethread block, giving a significant speedup on multiple accesses to the same data.The addressing strategy even ensures a fully coalesced reading of the memory.Unfortunately, the decomposition also introduces some problems. Multiplicationof the individual elements works excellently in this model, but after the multi-plications the vector elements must be summed in a reduction operation to onefinal scalar which is not evident to run in parallel.
The optimization solution is to perform a parallel reduction of the final prod-uct. The parallel reduction does not ensure full utilization of the GPU cores,but it is significantly more efficient than letting a single core perform all thesummarization. The principle of the model is illustrated in figure 7.28.
0 21 3 54 76
0 21 3
0 1
0
Thread Id
Values (shared memory)
Result
Figure 7.28: Summarization of elements from a vector using parallel reduction.
150

7.6. Performance considerations
The calculation of the square of the new data vector |A|2 is still calculated onCPU and passed into the GPU kernel as a scalar function parameter. Runningthe calculation with vector dimensions of d = (2, 8, 32, 128, 512) on the NvidiaQuattro 880M 48 core GPU yields the performance as seen in figure 7.29
Figure 7.29: Performance of the optimized GPU implementation of the Jaccard similarityindex with vector dimensions of d = (2, 8, 32, 128, 512) and cluster elements in the rangefrom n = [1, 10000].
7.6.5 Performance comparison and evaluation
The GPU implementation was done in two variants; one was a simple port ofthe naive CPU version where each complete vector calculation was allocated toone GPU core. The optimized version uses the parallel reduction technique aswell as a few simple Nvidia specific optimizations. The performance measurescan be seen in figure 7.30 and in table 7.8.
Throughout the implementation, even the initial version of the GPU algo-rithm outperformed the CPU version of the algorithm. Table 7.8 illustrates theperformance achieved between the implementations. On smaller vector dimen-sions the GPU version suffers some performance impact, as the setup and datatransfer times become significant. The table also illustrates cumulative perfor-mance enhancement compared to the CPU implementation.
151

7. Experimental Evaluation
Figure 7.30: Performance comparison between the CPU and different GPU implementationson a vector dimension of 512 elements and cluster elements in the range from n = [1, 10000].
Implementation 1x2 vector 1x32 vector 1x128 vector 1x512 vector
[GFLOPS] [GFLOPS] [GFLOPS] [GFLOPS]
Naive CPU 0.272 0.316 0.332 0.316
Naive GPU 0.194 (0.71x) 0.429 (1.35x) 0.464 (1.39x) 0.469 (1.48x)
Optimized GPU 0.095 (0.35x) 1.253 (3.96x) 3.775 (11.37x) 4.947 (15.65x)
Table 7.8: Performance comparison of CPU, Unoptimized GPU and optimized GPU perfor-mance on vector dimensions of d = (2, 32, 128, 512). The performance measure is averageperformance of processing a cluster with element counts from n = 1, 10000.
Performance measures from table 7.8 clearly show the tremendous benefit ofusing a GPU for performing the Jaccard calculations. Using the optimized GPUvariant a performance enhancement of more than 15 times was achieved on largevector dimensions. Low power systems with moderately performing GPUs area cost effective way to enhance performance in critical and calculation intensivesections. It is evident that there is considerably more effort invested in makinga proper GPU implementation than just using the CPU but more and morerobot perception systems have a number of intensive algorithms running, suchas stereo vision, object recognition and point cloud processing.
Considering the sample-time requirements of real-time robot systems, an-other issue worth noting is the worst-case execution time. If we consider theclustering operation on a data-vector with a dimension of 512 elements and acluster size of 10.000 vectors, the execution time can be seen in table 7.9.
152

7.6. Performance considerations
Implementation Execution time
Naive CPU 85.87 ms
Naive GPU 58.02 ms
Optimized GPU 5.48 ms
Table 7.9: Worst case execution time for similarity calculations of a vector with dimensiond = 512 against a cluster with n = 10000 elements.
Table 7.9 shows where the real benefit of using GPU accelerated clusteringbecomes significant. Using the GPU it is possible to follow the data rates ofhigh-rate components such as the robot controller and laserscanners (10ms and13.3 ms respectively) which would not have been possible using the CPU version.
Using OpenCL it is fairly simple to design software to only run the GPUkernels when specific GPU hardware is available or data-sets match. Kernels areintegrated into traditional programs using the standard compilation frameworkand by invoking the OpenCL library to Just-In-Time compile the kernels to theavailable hardware, which could be GPUs from Nvidia, AMD, Intel or CPUsfrom Intel, IBM or Apple, or in the future even FPGAs. This flexible approachalso allows simple integration into many programming languages, such as Pythonand Java.
7.6.6 Summary
Although the on-line streaming clustering engine has been designed for highthroughput and on-line processing, data-volumes of modern robotic systems canbecome quite intense. Using GPGPU to run the distance calculations for clus-tering in parallel on a graphics processor (GPU), it was demonstrated that pro-cessing performance could be improved up to 15 times on hardware suitable formobile platforms. Using the GPU implementation processing times can be re-duced to a level, where the clustering can follow high-rate sensor systems, evenin high data dimensionality and high numbers of clusters without saturation. Afurther key benefit of using the GPU is that much of the workload is shiftedfrom the robot system CPU, relieving it to other tasks, such as controlling therobot.
153


8
Conclusions
The use of mobile robots in the global scene, both in industrial and domesticsettings is rapidly expanding. From being restricted to high volume logistics infactory settings and vacuum cleaning in our homes, mobile robots are now beingintroduced in hospitals, in agricultural fields, as packaging assistance in the mailorder industry, and have even gained the license to drive autonomously in thestreets of the US state Nevada under supervised test conditions.
An enormous body of scientific results within advanced navigation and per-ception exists and some of these results are slowly finding their way into com-mercial products, such as the Neato XV-15 vacuuming robot which uses SLAM.Using these technologies enable a significantly higher degree of freedom in thecapabilities and application for the robots, e.g. from being confined to navigatein areas with reflective markers for laser guidance to moving freely in offices us-ing only natural environments for navigation. This new freedom and flexibilitycomes at a price of higher complexity and loss of reliability.
A key obstacle for many new robot applications of finding their way intothe mass markets is the reliability of the applications. Operation in changingand only partially known environments requires a perfect recognition of theenvironments as well as the capability of understanding what is going on in orderto take the right decisions and continue operation, even when critical situationsoccur.
The work presented in this dissertation targets the challenge of understandingthe situation of the mobile robots and proposes a strategy towards answeringthe question of what is going on? As well as the equally critical question of whatis going to happen next?
With this knowledge, the mobile robots will have the potential to handlecritical situations before they develop into failures and improve the reliability ofapplications in a number of new domains.
155

8. Conclusions
8.1 Summary of Achievements
The overall contribution of the presented work is an introduction of the method-ology and presentation of a framework for situation assessment in the domain ofmobile robotics. The focus has been on creating connection between the chal-lenges of mobile robot applications and the scientific approaches to situationassessment. A further focus has been on how to interface situation assessmentwith real-world robot platforms to demonstrate and verify the achieved resultsas well as enabling the integration of situation assessment into future mobilerobot applications.
In summary, three major contributions have been presented:
Situation Assessment.Analysis and synthesis of a model for situation assessment in the domainof mobile robots.
Modeling framework.A novel situation assessment modeling framework for on-line construction,comprehension and prediction of situations.
Software architecture.A new software architecture to connect robotics software frameworks andsituation assessment.
The following sections outline the details of the achieved results.
8.1.1 Situation Assessment for mobile robots
The work presented in this thesis is the first of its kind to directly connectsituation assessment from an information fusion perspective to the challengesof on-line and real-time applications of mobile robotics with the many levels ofuncertainty and information sources that are present in this domain.
To support this contribution a thorough analysis is presented of the use-cases for mobile robots in commercial use, both industrially and in the serviceindustry, together with state-of-the-art applications within research robotics. Toinvestigate the connection between these applications and higher level processinglike situation assessment, an analysis of community driven software frameworksused for development of these state-of-the-art applications was presented. Com-mon for all analyzed frameworks is, that an enormous volume of work has beeninvested in modules for low level control and environment perception, which allcommunity frameworks offer in abundance. However, analysis shows that whenit comes to application development, hierarchical control architectures and reli-able mission control, none of the frameworks offers more than very rudimentaryfeatures and tools. As result, applications are executed in these frameworkswithout any plan B or back-up strategies if modules should fail, or if any of thebasic assumptions the control or even the entire application relies on, should fail.
Furthermore, a discussion and definition of situations in general were pre-sented and the concept of critical situations for mobile robots was addressed.
156

8.1. Summary of Achievements
Critical situations for the mobile robots are in particular when the basic assump-tions of application design fail. These assumptions will often not be detectedor even be directly detectable for the controller, e.g. motor failures or low levelcommunication errors. However, these errors could be directly detectable butare often simply ignored by current state-of-the-art algorithms, e.g. errors in thelocalization system.
As a result of this analysis I propose a technical model definition of situ-ations as spatio-temporal constructs of events and furthermore propose threeoperational strategies for achieving situation assessment in the spatio-temporalpatterns:
Type 1: Detection of known spatio-temporal relations.
Type 2: Deviation from known spatio-temporal patterns.
Type 3: Detection of known critical situations.
A fourth type was presented concerning “Black Swan events” which are unpre-dictable events with major impact. This type is not covered in the work ofthis thesis in larger detail than when the events fall into the category of eventscovered by the type 2 strategy.
8.1.2 Situation Assessment modeling framework
A novel situation assessment modeling framework has been presented which hasthe capabilities of specifying and representing situations in a general technicalcontext. The analysis and synthesis of the modeling framework has been with amobile robotics context, in which it has been evaluated with good results.
The widely adapted model of human situation awareness by Endsley (1995)suggests that human situational awareness can be organized in three levels:
Level 1: Perception of the elements in the current situation.
Level 2: Comprehension of the current situation.
Level 3: Prediction of future status.
The goal of the situation model design was to represent these three layers in themodel for best possible interpretability by humans as well as making it easier toapply common sense when parameterizing the models.
Perception of the elements of the situation is parameterized in the XML basedsituation model, which is part of the proposed Situation Assessment Platformarchitecture. Through this model, data from heterogeneous data sources can befused to form a comprehensive set of elements to capture the characteristics ofa scenario under investigation.
Comprehension of the situation is achieved by capturing the characteristicsof the situation in a spatio-temporal structure. The spatio-temporal structure is
157

8. Conclusions
represented in the framework by applying the Extensible Markov Model (EMM)by Dunham et al. (2004) as fundamental model. The EMM is a dynamic firstorder Markov model, which has the capabilities of evolving through time whilemaintaining its structure of state visits and transition likelihoods. This modelingapproach allows the situation model to be developed under on-line execution ofan application scenario for the robot and represent the situations as the robotactually perceives them. Furthermore, the model can evolve and adjust as theenvironment, the application, or even the robot changes through time.
On-line streaming data retrieved from robotics frameworks are connected tothe EMM by using stream-based clustering, which is ideal as a non-model drivenapproach to handling sensor noise and at the same time performing on-line datareduction. In most cases, it is only desired to capture the overall spatio-temporaldynamic structure of the data in the EMM, and thus noise and minor variationsshould be suppressed.
Prediction of future status is achieved by a proposed prediction engine whichcombines the use of the chain rule of probability and a modified version of Dijk-stra’s algorithm for on-line calculation of maximum likelihoods sequences in theEMM. As the EMM continues to evolve through on-line execution, likelihoodsof transitions changes and critical states might appear in the model which wouldbe beneficial to monitor in real-time. The prediction engine continuously calcu-lates the maximum likelihood from the current state to any other state in theEMM to predict the likelihood of ending in an identified critical situation andthus enable the controller to activate counter measures if necessary.
8.1.3 Software architecture
A new software architecture is proposed to integrate the contributed softwaremodules in a flexible, expandable, and modular framework. The architecture isimplemented in the Situation Assessment Platform (SA-Platform) software pack-age, which offers a cross platform and GUI driven platform for easy interactionand configuration of the system.
A key contribution of the software architecture is the flexible dataSourceSer-vice module, which enables seamless interfacing to the heterogeneous world ofdata sources used within robotics. Data sources are implemented in completelyindependent modules, and data are distributed in the architecture using thepublish-subscribe principle and event driven call-backs.
The evolution of the spatio-temporal EMM can be followed in real-time intables of the SA-Platform, but for true visualization of the graph-based struc-ture, the development and current status of the EMM are streamed on-line tothe Gephi graph visualization software. Using Gephi the layout of the graph-structures can be optimized in real-time, and past states together with predictedfuture state transitions can be highlighted using color coding. Furthermore, spe-cific details from the investigated data-sets can be channeled to the visualizationframework, such as geographic location of nodes in the layout or states of mis-sion execution for color coding of nodes. The use of on-line Graph visualizationis a tremendous benefit for transferring comprehension of situation models to
158

8.2. Experimental results
operators.
The use of this software framework has enabled demonstration and evalua-tion of the situation modeling framework using on-line and real-world examples.This enabled the testing of the capabilities and performance of the situationassessment, not only on recorded and pre-processed data-sets but under realmobile robot applications, and thus investigates how the system performs underreal-time conditions.
8.2 Experimental results
Experiments were conducted to evaluate the situation assessment framework inthree scenarios, where each of these experiments was designed to evaluate acertain type of situation assessment strategy:
• Narrow passage detection (Type 3)
• Detection of errors in AGV localization tracking (Type 2)
• AGV Situation characterization and prediction (Type 1)
The narrow passage detection experiment showed that feature extractionfrom raw laserscanner data could be used with situation assessment to detectand predict when the robot approached narrow passages. Narrow passages arenotoriously known as critical situations for mobile robot navigation systems. Theresult shows that situation assessment can be applied to this purpose successfully.
The type 2 situation assessment strategy, deviation from known patterns, wasinvestigated in the detection of errors in AGV localization tracking experiment.In the experiment the relation between AGV position and localization covariancewas investigated to perform early detection of navigation errors before criticalfailures occurs. The result showed that this strategy could successfully be appliedto detect a localization error on an AGV logistics robot, which performed arepetitive motion cycle. In the third loop, the AGV localizer failed and thiswas rapidly detected as an anomaly in the regular pattern of robot location andlocalizer covariance.
In the AGV Situation characterization and prediction experiment, a 25 minutelong sequence of an AGV performing 13 loops through a sequence of moving acart between two locations, was used to investigate the type 1 strategy, detec-tion of known spatio-temporal relations as well as prediction performance. Thelarge sequence was successfully applied to achieve all of Endsley’s three levels ofsituation awareness, as it was demonstrated that the produced EMM provided agood perception of the elements of the situation, as well as the state patterns inthe model provided a good comprehension of the current situations. On basis oflarge number of state transitions embedded in the model, the EMM also proveduseful for extracting likelihoods for prediction of future status for the robot.
159
8. Conclusions
8.3 Future work
Although the work of this thesis presented successful results, a number of openproblems were left for future research.
The strategy chosen for clustering streaming data uses a fairly simple prin-ciple for assigning correspondences between new data-sets and existing clusters.The chosen approach is sensitive to the choice of similarity threshold as well asboth the absolute scale and offset of processed data. Investigation in more ad-vanced and capable clustering strategies will improve the representation qualityof the EMM and make design of proper situation models simpler.
In order to significantly improve the performance of mobile robot systems, itis not enough to have a system for comprehension of the situations. A componentfor on-line inference is required to link the situation assessments to actions inthe robot control system. Inference is often discussed in relation to developmentof robotic systems with cognitive capabilities, and sometimes even mentionedas “just inference”. Although inference seems fairly simple to us humans, theinference problem is one of the key challenges within cognitive robotics, wherecurrent state-of-the-art still required complex structures of ontologies and knowl-edge representation before good inference results are possible.
Although mobile robotics has been the background of this work, there isnothing in the framework which limits it to this domain. Some other domains,for example industrial robotics might prove even more suitable, as the varia-tions in the processes and motion patterns are significantly less than for mobilerobots. As a result of this, the use of situation assessment in this context willbe investigated in the EU FP7 project SMErobotics under the ICT challenge 2call and in collaboration with a strong group of partners as illustrated in figure8.1.
Figure 8.1: The use of situation assessment in a human-robot cooperation scenario usingindustrial robots is investigated in the EU FP7 project SMErobotics.
160

8.3. Future work
In SMErobotics situation assessment will be applied in a human and robotcooperation scenario. To be productive in SME environments, industrial robotsmust be easily configurable and quick to instruct to small volume productionprocesses. Reliability and error handling are key issues in this context and willbe addressed by introducing situation assessment on robot skill level. By thisapproach it will be possible to detect deviations from predicted or learned rela-tions in execution of the skills as well as possibly predict future critical situationsearly to avoid failure. Cooperation with the operator has been discussed slightlywithin this thesis, but will also be investigated in much larger detail in theSMErobotics project.
161


Bibliography
J. S. Albus, H. G. McCain, and R. Lumia. NASA/NBS Standard Reference Modelfor telerobot control system architecture (NASREM). U.S. Dept. of Commerce,National Institute of Standards and Technology, Gaithersburg, MD :, 1989 ed.edition, 1989.
J. Andersen, N. Andersen, and O. Ravn. Vision Assisted Laser Scanner Nav-igation for Autonomous Robots, volume 39, pages 111–120. Springer, 2006a.ISBN 978-3-540-77456-3.
J. Andersen, M. Blas, N. Andersen, O. Ravn, and M. Blanke. Traversable ter-rain classification for outdoor autonomous robots using single 2d laser scans.Integrated Computer-Aided Engineering, 13(3):223–232, 2006b.
J. Andersen, O. Ravn, and N. Andersen. Autonomous rule based robot naviga-tion in orchards. In 7th IFAC Symposium on Intelligent Autonomous Vehicles.International Federation of Automatic Control, 2010.
J. C. Andersen. Mobile Robot Navigation. PhD thesis, Technical University ofDenmark, Department of Electrical Engineering, 2005.
N. A. Andersen and O. Ravn. Smr-cl, a real-time control language for mobilerobots. In in proc. of CIGR International Conference, Beijing, oct. 11-14 2004.
V. Andronache and M. Scheutz. ADE - a tool for the development of distributedarchitectures for virtual and robotic agents. In Proceedings of the Fourth In-ternational Symposium, “From Agent Theory to Agent Implementation”, 2004.
B. Babcock, S. Babu, M. Datar, R. Motwani, and J. Widom. Models and issuesin data stream systems. In In PODS, pages 1–16, 2002.
J. Barwise and J. Perry. Situations and attitudes. The Journal of Philosophy,78(11):pp. 668–691, 1981. ISSN 0022362X. URL http://www.jstor.org/
stable/2026578.
J. Barwise and J. Perry. Situations and Attitudes. MIT Press, 1983. ISBN0-262-02189-7.
163

Bibliography
M. Bastian, S. Heymann, and M. Jacomy. Gephi: An open source software forexploring and manipulating networks. In International AAAI Conference onWeblogs and Social Media, 2009. URL http://www.aaai.org/ocs/index.
php/ICWSM/09/paper/view/154.
A. B. Beck. Mission management for mobile robots. Master’s thesis, TechincalUniversity of Denmark, 2009.
A. B. Beck and N. A. Andersen. Robot hardware abstraction layer. Technicalreport, Technical University of Denmark, 2008.
A. B. Beck, N. A. Andersen, and O. Ravn. Mission management for mobilerobots. In L. Akdahl, editor, The fourth Swedish Workshop on AutonomousRobots, volume I, Vesteras, September 2009. Robotdalen, Robotdalen.
A. B. Beck, N. A. Andersen, J. C. Andersen, and O. Ravn. Mobotware - aplug-in based software framework for mobile robots. In 7th IFAC Symposiumon Intelligent Autonomous Vehicles, Lecce, Italy, 2010.
A. B. Beck, C. Risager, N. A. Andersen, and O. Ravn. Spacio-temporal situationassessment for mobile robots. In 14th International Conference on InformationFusion, Chicago, 2011.
J. Beringer and E. Hullermeier. Online-clustering of parallel data streams. Dataand Knowledge Engineering, 52:180–204, 2006.
R. Bischoff, T. Guhl, E. Prassler, W. Nowak, G. K. Kraetzschmar, H. Bruyn-inckx, P. Soetens, M. Hagele, A. Pott, P. Breedveld, J. Broenink, D. Brugali,and N. Tomatis. Brics - best practice in robotics. In Proceedings for thejoint conference of ISR 2010 (41st Internationel Symposium on Robotics) undROBOTIK 2010 (6th German Conference on Robotics), pages 1–8, Munich,Germany - Parallel to AUTOMATICA, 7-9 June 2010. VDE Verlag.
C. M. Bishop. Pattern recognition and Machine Learning. Springer, 2006.
H. Bruyninckx. Open robot control software: The orocos project. In Proc. ofIEEE Int. conf. on Robotics and Automation, 2001.
H. Bruyninckx. Real-time and embedded guide. Technical report, K.U.Leuven,Leuven, 2002.
J. Butterfield. Review - situation and attitudes. The Philosophical Quarterly,36(143):pp. 292–296, 1986. ISSN 00318094. URL http://www.jstor.org/
stable/2219775.
C. Cote, Y. Brosseau, D. Letourneau, C. Raievsky, and F. Michaud. Roboticsoftware integration using marie. International Journal of Advanced RoboticSystems, 3(1), 2008.
R. Diankov. Automated Construction of Robotic Manipulation Programs. PhDthesis, Carnegie Mellon University, Robotics Institute, August 2010. URLhttp://www.programmingvision.com/rosen_diankov_thesis.pdf.
164

Bibliography
R. Diankov and J. Kuffner. Openrave: A planning architecture for autonomousrobotics. Technical Report CMU-RI-TR-08-34, Robotics Institute, Pittsburgh,PA, July 2008.
P. Duda, M. Jaworski, and L. Pietruczuk. On pre-processing algorithms fordata stream. In Proceedings of the 11th international conference on Arti-ficial Intelligence and Soft Computing - Volume Part II, ICAISC’12, pages56–63, Berlin, Heidelberg, 2012. Springer-Verlag. ISBN 978-3-642-29349-8. doi: 10.1007/978-3-642-29350-4 7. URL http://dx.doi.org/10.1007/
978-3-642-29350-4_7.
R. O. Duda, P. E. Hart, and D. G. Stork. Pattern classification. Wiley, NewYork, 2001.
M. Dunham, Y. Meng, and J. Huang. Extensible markov model. In Fourth IEEEInternational Conference on Data Mining, pages 371–374, 2004.
N. Elkmann, J. Hortig, and J. Fritzsche. Cleaning automation. In Handbook ofAutomation. Springer, 2009.
M. Endsley. Towards a theory of situation awareness in dynamic systems. HumanFactors, 37:32–64, 1995.
M. R. Endsley. Automation and situation awareness. In L. Erlbaum, editor,Automation and human performance: Theory and applications, pages pp. 163–181. Lawrence Erlbaum, 2006.
M. R. Endsley. Bringing cognitive engineering to the information fusion problem:Creating systems that understand situations. In S. T. Inc., editor, Keynote atthe 14th International Conference on Information Fusion, Chicago, July 2011.
Fraunhofer IPA. Service robots in nursing homes - popular among residents andcarers alike. PRESS RELEASE, July 2011. URL http://www.care-o-bot.
de/Produktblaetter/WiMi-Care_Serviceroboter_eng.pdf.
D. Garagic, B. J. Rhodes, N. A. Bomberger, and M. Zandipour. Categorization ofmaritime anomalies for notification and alerting purpose. In NATO Workshopon Data Fusion and Anomaly Detection for Maritime Situational Awareness,La Spezia, Italy, 15-17 September, 2009.
B. Gates. A robot in every home. Scientific American, X:58–65, 2007.
B. P. Gerkey, R. T. Vaughan, K. Støy, A. Howard, G. S. Sukhatme, and M. J.Mataric. Most valuable player: A robot device server for distributed control. InProceedings of the IEEE/RSJ International Conference on Intelligent Robotsand Systems (IROS 2001), pages 1226–1231, Hawaii, October 29 - November3 2001.
D. Goldberg and M. J. Mataric. Augmented markov models. Technical report,Computer Science Department, University of Southern California, 1999.
165

Bibliography
G. Gross, R. Nagi, and K. Sambhoos. Soft information, dirty graphs and uncer-tainty representation/processing for situation understanding. In InformationFusion (FUSION), 2010 13th Conference on, pages 1 –8, july 2010.
S. Guha, N. Mishra, R. Motwani, and L. O’Callaghan. Clustering data streams.In 41st Annual Symposium on Foundations of Computer Science (FOCS2000), pages 359–366. IEEE, 2000.
D. Hall and J. Llinas. An introduction to multisensor data fusion. Proceedingsof the IEEE, 85(1):6 –23, jan 1997. ISSN 0018-9219. doi: 10.1109/5.554205.
M. Hall, E. Frank, G. Holmes, B. Pfahringer, P. Reutemann, and I. H. Witten.The weka data mining software: An update. SIGKDD Explorations, Volume11, 2009.
I. Herman, G. Melancon, and M. S. Marshall. Graph visualization and navigationin information visualization: A survey. IEEE Transactions on Visualizationand Computer Graphics, 6(1):24–43, Jan. 2000. ISSN 1077-2626. doi: 10.1109/2945.841119. URL http://dx.doi.org/10.1109/2945.841119.
IFR Statistical Department. World robotics 2012. Technical report, InternationalFederation of Robotics, 2012.
International Frederation of Robotics. Service robots. Website, August 2012.URL http://www.ifr.org/service-robots/.
R. N. Jørgensen, M. Nørremark, C. Sørensen, and N. A. Andersen. Utilisingscripting language for unmanned and automated guided vehicles operatingwithin row crops. Computers and Electronics in Agriculture, 62(2):190–203,2008. ISSN 0168-1699.
G. A. Klein. Recognition-primed decisions. Advances in man-machine systemsresearch, pages p. 47–92, 1989.
J. Kramer and M. Scheutz. Development environments for autonomous mobilerobots: A survey. Autonomous Robots, 22(2):101–132, Feb. 2007. ISSN 0929-5593. doi: 10.1007/s10514-006-9013-8. URL http://dx.doi.org/10.1007/
s10514-006-9013-8.
R. Lane, D. Nevell, S. Hayward, and T. Beaney. Maritime anomaly detection andthreat assessment. In Information Fusion (FUSION), 2010 13th Conferenceon, pages 1 –8, july 2010.
E. Little and G. Rogova. Ontology meta-model for building a situational pictureof catastrophic events. In Information Fusion, 2005 8th International Confer-ence on, volume 1, page 8 pp., july 2005. doi: 10.1109/ICIF.2005.1591935.
J. Llinas, C. Bowman, G. Rogova, A. Steinberg, E. Waltz, and F. White. Revis-iting the jdl data fusion model ii. In In P. Svensson and J. Schubert (Eds.),Proceedings of the Seventh International Conference on Information Fusion(FUSION 2004, pages 1218–1230, 2004.
166

Bibliography
D. MacKenzie and R. Arkin. Evaluating the usability of robot programmingtoolsets. The International Journal of Robotics Research, 17 - 4:381–401,1998.
A. Makarenko, A. Brooks, and T. Kaupp. On the benefits of mak-ing robotic software frameworks thin. In E. Prassler, K. Nilsson,and A. Shakhimardanov, editors, IEEE/RSJ Int. Conf. on IntelligentRobots and Systems (IROS’07) Workshop on Measures and Proceduresfor the Evaluation of Robot Architectures and Middleware, November2007. URL http://www.cas.edu.au/download.php/makarenko07_iros_
benefits_of_thin_frameworks.pdf?id=1748.
P. Mantegazza, E. Bianchi, and L. Dozioi. Rtai: Real-time application interface.Linux Journal, Issue 72:p. 142–150, 2000.
G. McLachlan and K. Basford. Mixture Models: Inference and Applications toClustering. Marcel Dekker, New York, 1988.
G. Metta, P. Fitzpatrick, and L. Natale. Yarp: Yet another robot platform.International Journal of Advanced Robotic Systems, 3(1):43–48, 2006. ISSN1729-8806.
D. Meyer-Delius, C. Plagemann, G. von Wichert, W. Feiten, G. Lawitzky, andW. Burgard. A probabilistic relational model for characterizing situations indynamic multi-agent systems. In In Proc. of the 31th Annual Conference ofthe German Classification Society on Data Analysis, Machine Learning, andApplications (GFKL), Freiburg, Germany, 2007.
D. Meyer-Delius, C. Plagemann, and W. Burgard. Probabilistic situation recog-nition for vehicular traffic scenarios. In 2009 IEEE International Conferenceon Robotics and Automation, pages 459–464, Kobe, Japan, May 12-17 2009a.
D. Meyer-Delius, J. Sturm, and W. Burgard. Regression-based online situationrecognition for vehicular traffic scenarios. In Proc. of the IEEE/RSJ Interna-tional Conference on Intelligent Robots and Systems (IROS), St. Louis, USA,2009b.
M. Montemerlo, N. Roy, and S. Thrun. Perspectives on standardization in mobilerobot programming: The carnegie mellon navigation (carmen) toolkit. In Proc.Of the IEEE/RSJ Int. Conf. On Intelligent Robots and Systems, Las Vegas,Nevada
”2003.
I. A. Nesnas, R. Simmons, D. Gaines, C. Kunz, A. Diaz-Calderon, T. Estlin,R. Madison, J. Guineau, M. McHenry, I.-H. Shu, and D. Apfelbaum. Claraty:Challenges and steps toward reusable robotic software. International Journalof Advanced Robotic Systems, Vol. 3:pp. 023–030, 2006.
L. O’Callaghan, N. Mishra, A. Meyerson, S. Guha, and R. Motwani. Streaming-data algorithms for high-quality clustering. In Data Engineering, 2002.Proceedings. 18th International Conference on, pages 685 –694, 2002. doi:10.1109/ICDE.2002.994785.
167

Bibliography
T. C. Pauchant and I. I. Mitroff. Transforming the Crisis Prone Organizatio.Jossey-Bass Publishers, 1992.
I. Paul. Google’s self-driving car licensed to hit nevada streets. PC-WorldWebsite, May 8 2012. URL http://www.pcworld.com/article/255204/
googles_selfdriving_car_licensed_to_hit_nevada_streets.html.
M. Prentice, M. Kandefer, and S. Shapiro. Tractor: A framework for soft infor-mation fusion. In Information Fusion (FUSION), 2010 13th Conference on,pages 1 –8, july 2010.
M. Quigley, K. Conley, B. Gerkey, J. Faust, T. B. Foote, J. Leibs, R. Wheeler,and A. Y. Ng. Ros: an open-source robot operating system. In In-ternational Conference on Robotics and Automation, Open-Source Soft-ware workshop, 2009. URL http://robotics.stanford.edu/~ang/papers/
icraoss09-ROS.pdf.
L. R. Rabiner. A tutorial on hidden markov models and selected applications inspeech recognition. Proceedings of the IEEE, 77, Issue 2:257–286, 1989.
R. Reiter. The frame problem in the situation calculus: a simple solution (some-times) and a completeness result for goal regression. In V. Lifshitz, editor,Artificial intelligence and mathematical theory of computation: papers in hon-our of John McCarthy, pages Pages 359–380, San Diego, CA, USA, 1991.
B. Ristic, B. L. Scala, M. Morelande, and N. Gordon. Statistical analysisof motion patterns in ais data: Anomaly detection and motion prediction.In 11th International Conference on Information Fusion, Cologne, Germany,July 2008.
G. Rogova. Higher level fusion and decision support for situation management: Challenges and computational approaches. In Toturial at FUSION 2011-The Fourteens International Conference on Information Fusion, Chicago, IL,5 July 2011 2011.
J. Roy. Automated reasoning for maritime anomaly detection. In NATO Work-shop on Data Fusion and Anomaly Detection for Maritime Situational Aware-ness, La Spezia, Italy, 15-17 September, 2009.
J. Roy and M. Davenport. Categorization of maritime anomalies for notificationand alerting purpose. In NATO Workshop on Data Fusion and Anomaly De-tection for Maritime Situational Awareness, La Spezia, Italy, 15-17 September,2009.
S. J. Russell and P. Norvig. Artificial Intelligence - A Modern Approach (3.internat. ed.). Pearson Education, 2010. ISBN 978-0-13-207148-2.
S. Schwoegler, S. Blackman, J. Holsopple, and M. Hirsch. On the applicationof multiple hypothesis tracking to the cyber domain. In Information Fusion(FUSION), 2011 Proceedings of the 14th International Conference on, pages1 –6, july 2011.
168
Bibliography
G. Shroff, S. Sharma, P. Agarwal, and S. Bhat. A blackboard architecture fordata-intensive information fusion using locality-sensitive hashing. In Informa-tion Fusion (FUSION), 2011 Proceedings of the 14th International Conferenceon, pages 1 –8, july 2011.
SICK. Nav3xx - laser measurement technology.https://www.mysick.com/saqqara/im0044787.pdf, May 2012.
C. Stachniss, U. Frese, and G. Grisetti. Openslam. Website, 2010. URL www.
openslam.org.
A. N. Steinberg, C. L. Bowman, and F. E. White. Revisions to the JDL datafusion model. In B. V. Dasarathy, editor, Sensor Fusion: Architectures,Algorithms, and Applications III, volume 3719, pages 430–441. SPIE, 1999.URL http://scitation.aip.org/getabs/servlet/GetabsServlet?prog=
normal&id=PSISDG003719000001000430000001&idtype=cvips&gifs=yes.
M. Sudit, M. Holende, and A. Stotz. Inferd and entropy for situational awareness.Journal of Advances in Information Fusion, Volume 2(Number 1):3–21, June2007.
N. N. Taleb. Fooled by Randomness: The Hidden Role of Chance in the Mar-kets and in Life. W. W. Norton & Company, 1st edition, Oct. 2001. ISBN1587990717. URL http://www.worldcat.org/isbn/1587990717.
N. N. Taleb. The Black Swan. The Impact of the Highly Improbable. RandomHouse Inc., 2008. ISBN 0812979184.
P. Tjell and S. Hansen. Laser-based navigation in orchard. Master’s thesis,Technical University of Denmark, 2008.
R. T. Vaughan. Massively multi-robot simulations in stage. Swarm Intelligence,2(2-4):189–208, 2008.
M. Viager. Flexible mission execution for mobile robots. Individual course, Tech-nical University of Denmark, Department of Electrical Engineering, 2012. Ad-visor(s): Jens Christian Andersen, Nils Axel Andersen, Anders Billesø Beck.
F. E. White. Data fusion lexicon. Technical report, Joint Directors of Labora-tories, Technical Panel for C3, Data Fusion Sub-Panel, Naval Ocean SystemsCenter, San Diego, 1987.
T. Zhang, R. Ramakrishnan, and M. Livny. Birch: an efficient data clusteringmethod for very large databases. In International Conference on Managementof Data, pages 103 – 114. ACM New York, NY, USA, 1996.
169


www.elektro.dtu.dk Department of Electrical Engineering
Automation and Control
Technical University of Denmark
Elektrovej
Building 326
DK-2800 Kgs. Lyngby
Denmark
Tel: (+45) 45 25 35 76
Fax: (+45) 45 88 12 95
Email: [email protected]
ISBN 978-87-92465-64-1