The ASIM Mission on the International Space Station - DTU Orbit
Upload
khangminh22Category
view
2download
0
General rights Copyright and moral rights for the publications made accessible in the public portal are retained by the authors and/or other copyright owners and it is a condition of accessing publications that users recognise and abide by the legal requirements associated with these rights.
Users may download and print one copy of any publication from the public portal for the purpose of private study or research.
You may not further distribute the material or use it for any profit-making activity or commercial gain
You may freely distribute the URL identifying the publication in the public portal If you believe that this document breaches copyright please contact us providing details, and we will remove access to the work immediately and investigate your claim.
Downloaded from orbit.dtu.dk on: Jul 06, 2022
Effects of unionized ammonia and suspended solids on rainbow trout (Oncorhynchusmykiss) in recirculating aquaculture systems
Becke, Cornelius; Schumann, Mark; Steinhagen, Dieter; Rojas-Tirado, Paula Andrea; Geist, Juergen;Brinker, Alexander
Published in:Aquaculture
Link to article, DOI:10.1016/j.aquaculture.2018.09.048
Publication date:2018
Document VersionPeer reviewed version
Link back to DTU Orbit
Citation (APA):Becke, C., Schumann, M., Steinhagen, D., Rojas-Tirado, P. A., Geist, J., & Brinker, A. (2018). Effects ofunionized ammonia and suspended solids on rainbow trout (Oncorhynchus mykiss) in recirculating aquaculturesystems. Aquaculture, 499, 348-357. https://doi.org/10.1016/j.aquaculture.2018.09.048

Accepted Manuscript
Effects of unionized ammonia and suspended solids on rainbowtrout (Oncorhynchus mykiss) in recirculating aquaculture systems
Cornelius Becke, Mark Schumann, Dieter Steinhagen, PaulaRojas-Tirado, Juergen Geist, Alexander Brinker
PII: S0044-8486(18)31503-5DOI: doi:10.1016/j.aquaculture.2018.09.048Reference: AQUA 633572
To appear in: aquaculture
Received date: 11 July 2018Revised date: 24 September 2018Accepted date: 25 September 2018
Please cite this article as: Cornelius Becke, Mark Schumann, Dieter Steinhagen, PaulaRojas-Tirado, Juergen Geist, Alexander Brinker , Effects of unionized ammonia andsuspended solids on rainbow trout (Oncorhynchus mykiss) in recirculating aquaculturesystems. Aqua (2018), doi:10.1016/j.aquaculture.2018.09.048
This is a PDF file of an unedited manuscript that has been accepted for publication. Asa service to our customers we are providing this early version of the manuscript. Themanuscript will undergo copyediting, typesetting, and review of the resulting proof beforeit is published in its final form. Please note that during the production process errors maybe discovered which could affect the content, and all legal disclaimers that apply to thejournal pertain.

ACC
EPTE
D M
ANU
SCR
IPT
1
Effects of unionized ammonia and suspended solids on rainbow trout (Oncorhynchus 1
mykiss) in recirculating aquaculture systems 2
3
Cornelius Beckea,*, Mark Schumanna, Dieter Steinhagenb, Paula Rojas-Tiradoc,d, Juergen 4
Geiste, Alexander Brinkera,f 5
6
aFisheries Research Station of Baden-Württemberg, Argenweg 50/1, 88085 Langenargen, 7
Germany 8
bFish Disease Research Unit, University of Veterinary Medicine Hannover, Bünteweg 17, 9
30559 Hannover, Germany 10
cTechnical University of Denmark, DTU Aqua, Section for Aquaculture, The North Sea 11
Research Centre, P.O. Box 101, DK-9850 Hirtshals, Denmark 12
dNorwegian Institute for Water Research, NIVA, Section for Aquaculture, Thormøhlensgate 13
53D, 5006 Bergen, Norway 14
eChair of Aquatic Systems Biology, Department of Ecology and Ecosystem Management, 15
Technical University of Munich, Mühlenweg 22, 85354 Freising, Germany 16
fUniversity of Konstanz, Mainaustraße 252, 78464 Konstanz, Germany 17
18
* Corresponding author at: Fisheries Research Station of Baden-Württemberg, 19
Argenweg 50/1, 88085 Langenargen, Germany. Tel.: +49 7543/9308337; 20
fax: +49 7543/9308320. E-mail address: [email protected] 21
ACCEPTED MANUSCRIPT

ACC
EPTE
D M
ANU
SCR
IPT
2
Abstract 22
This study investigates the individual and combined effects of chronic exposure of rainbow 23
trout to unionized ammonia and suspended solids in a farm-scale recirculating aquaculture 24
system (RAS) over 13 weeks. Unionized ammonia nitrogen concentration was four times 25
(0.05 mg/L) the generally accepted ‘safe’ threshold while total suspended solids (TSS) 26
exceeded the ‘safe’ threshold of 25 mg/L by a factor of > 2.5. Still, rainbow trout revealed 27
high survival rates of > 99% and no observable detrimental effects of TSS. Bacterial 28
activity showed a close positive linear correlation with solid load and was almost 29
exclusively explained by solid load for TSS concentration > 10 mg/L. However, bacterial 30
activity had no apparent detrimental effect on fish health or performance. Increased 31
unionized ammonia nitrogen concentrations had no relevant detrimental effect on rainbow 32
trout physiology and performance at concentrations of up to 0.05 mg/L. Furthermore, the 33
absent to minor solid-related effects across a wide range of physiological criteria combined 34
with chronic exposure to unionized ammonia demonstrates that chemical or physical 35
irritants are not problematic in RAS if other water and holding parameters are optimal. 36
These findings suggest a greater than expected tolerance of rainbow trout to chronic TSS-37
related effects which should result in a revision of water quality threshold criteria for RAS. 38
39
Keywords: Fish health, Water quality, Particle accumulation, Turbidity, Salmonid, Bacterial 40
activity 41
42
ACCEPTED MANUSCRIPT

ACC
EPTE
D M
ANU
SCR
IPT
3
Highlights: 43
Study of combined chronic effects of critical solid and unionized ammonia exposure 44
Full control of water parameters except turbidity in replicated RAS 45
Only minimal effects of NH3-N up to 0.05 mg/L on fish physiology 46
No interaction effects between unionized ammonia and suspended solid load 47
Close linear correlation of suspended solid load and bacterial activity 48
49
1 Introduction 50
Aquaculture is the fastest-growing sector in the animal food production industry worldwide 51
and already accounts for more than 44 percent of global total fish production (FAO, 2016). 52
As capture fishery production has remained relatively static since the late 1980s and the 53
world demand for fish is increasing (FAO, 2016), aquaculture has an important role to play 54
in ensuring a sufficient global fish supply (Naylor et al., 2000). Recirculating aquaculture 55
systems (RAS) are often regarded as an environmentally friendly alternative to open flow-56
through or cage-based aquaculture systems (Ayer and Tyedmers, 2009; Klinger and 57
Naylor, 2012; Verdegem et al., 2006), largely due to their efficient water use. However, 58
despite ongoing development, fish production in RASs remains energy- and cost-intensive 59
and its contribution to global production is still small (Badiola et al., 2012; Roque 60
d’Orbcastel et al., 2009). One approach to optimizing the economic output of RASs is to 61
increase stocking densities to reduce costs per unit of fish produced (Martins et al., 2005). 62
However, more fish reared in the same volume of water leads to increased excretion loads 63
per m³ of water. Fish feces are the principal constituent of suspended solids in 64
aquacultural facilities along with uneaten feed, bacterial material from biofilters and 65
microfauna (Chen and Malone, 1991; Noble and Summerfelt, 1996; Summerfelt et al., 66
1999; Wedemeyer, 1996). Accumulating particles, and especially fine particles, are 67
considered detrimental to fish health, welfare and performance (Bilotta and Brazier, 2008; 68
ACCEPTED MANUSCRIPT

ACC
EPTE
D M
ANU
SCR
IPT
4
Chapman et al., 1987; Chen et al., 1993; Chen and Malone, 1991; Herbert and Merkens, 69
1961). However, this assertion has been questioned for rainbow trout by recent 70
investigations (Becke et al., 2017, 2018). Nevertheless, intensification of aquacultural 71
production resulting in an increase in suspended solid concentration, will also lead to an 72
increase in dissolved wastes, such as unionized ammonia (NH3) (Ip et al., 2001). 73
High unionized ammonia levels have a wide range of detrimental effects on fish, e.g. 74
deterioration of gill structures, and might ultimately lead to mortality (Cameron and Heisler, 75
1983; Daoust and Ferguson, 1984; Ip et al., 2001; Randall and Tsui, 2002; Smart, 1976; 76
Thurston et al., 1984; Wicks et al., 2002). The common upper safe limit of unionized 77
ammonia-N proposed for salmonid aquaculture is 0.0125 mg/L (Timmons and Ebeling, 78
2010). However, there are studies reporting higher tolerance (Daoust and Ferguson, 1984; 79
Meade, 1985). Thus, there is still controversy about the safe threshold for unionized 80
ammonia in aquaculture operations. 81
A recent factor significantly influencing water quality in aquaculture is a change in feed 82
composition. Fish meal and fish oil are increasingly being substituted by plant alternatives 83
in salmonid diets (Glencross et al., 2007; Ytrestøyl et al., 2015). This is partly due to 84
declining fish stocks and rising prices for fish meal and fish oil (Naylor et al., 2009). This 85
replacement coincidently causes a less dense and more fragile composition of fish feces 86
(Schumann et al., 2018; Unger and Brinker, 2013), considerably increasing fine 87
suspended solids in fish farm waters (Brinker and Friedrich, 2012). 88
Against this background, the present study investigated the sole effect of critical unionized 89
ammonia-N concentrations (> 0.0125 mg/L) as well as interaction effects with suspended 90
solid load in a farm-scale RAS. It was hypothesized that chronic exposure to high 91
unionized ammonia concentrations would cause a reduction of fish wellbeing, while the 92
combined chronic exposure with increased suspended solid load would provoke an 93
interactive impact. Within this context, husbandry waters were set to optimal values except 94
ACCEPTED MANUSCRIPT

ACC
EPTE
D M
ANU
SCR
IPT
5
for the two variables, unionized ammonia and suspended solids, being tested. The 95
exception was bacterial activity which was held at an uncritical level (Pedersen et al., 96
2017; Rojas-Tirado et al., 2018), with possible covariate influences being controlled by the 97
experimental design. 98
99
2 Materials and Methods 100
2.1. Husbandry 101
The experiment used two replicate RASs, each with 10 tanks (capacity of 330 L, total RAS 102
volume 6m3) (Figure 1), as described by Becke et al. (2018). The study used all-female 103
rainbow trout (Oncorhynchus mykiss, Störk strain) to exclude sex-related effects. Each 104
RAS was stocked with 785 rainbow trout with an average initial weight of 87.2 ± 8.6 g 105
(control group) and 87.4 ± 9.2 g (treatment group). They were held at maximum stocking 106
densities of 67.8 ± 3.0 kg m−3 (control) and 68.3 ± 2.6 kg m−3 (treatment). The control RAS 107
was operated under regular conditions, while the particle load of the treatment RAS was 108
artificially elevated as described in Becke et al. (2018). Briefly, a mud pump (Wilo-EMU KS 109
8 ES, Dortmund, Germany) was used to pump the backwash water of the drum filter back 110
into the system. In both systems, the drum filter (HDF801-1H, Hydrotech, Vellinge, 111
Sweden) was equipped with a 100 μm gauze, so that particles < 100 µm accumulate over 112
time. 113
The photoperiod was fixed at 12L:12D with a sigmoidal transition period of 30 min (Lumilux 114
daylight lamps) with different light intensities of 50, 100, 200, 300 and 600 lx in duplicate 115
per system. However, without any significant effect on the results presented (unpublished 116
data). The fish were fed restrictively according to supplier recommendations with a 117
commercial feed (Biomar EFICO Enviro 921, Aarhus C, Denmark), by hand six days a 118
week (Sunday to Friday) at 2.5 % of body weight at the beginning of the trial, declining to 119
1.3 % by the end (maximum feed amount was 2.84 kg/day per RAS). Bacterial growth was 120
ACCEPTED MANUSCRIPT
ACC
EPTE
D M
ANU
SCR
IPT
6
controlled with UV irradiation of the system water (Barrier L20, Wallace & Tiernan, 121
Günzburg, Germany; UV dose: 40 mJ/cm2 flow volume: 6600 L/h, lamp wattage: 80 W, 122
measurement range UV sensor: 200W/m2). Fish (average weight approx. 15 g) were put 123
into the two RASs three months before the beginning of the experiment to ensure 124
acclimatization. 125
126
2.2. Water parameters 127
The experiment was subdivided into three phases (Figure 2): in phase 1 (week 1 – 5), 128
water parameters in both RASs were kept at levels known to preclude negative impacts on 129
fish health or performance (Table 1). In the treatment RAS, however, the total suspended 130
solid concentration was increased to over 35 mg/L and was subsequently held constantly 131
above this value. The control RAS operated under commercial conditions at around 5 132
mg/L throughout the experiment. In phase 2 (week 6 – 10), ammonium concentration was 133
artificially elevated in both RASs by adding ammonium chloride (A7012,9025; AppliChem, 134
Darmstadt, Germany). Additionally, biofilter efficiency in both RASs was reduced by 135
halving the volume of carrier material (originally designed for 4.5 kg feed/day) to attain 136
higher NH4-N concentrations. Ammonium nitrogen concentration was measured in both 137
RASs every 60 minutes using an automat (AMTAX SC, Hach, Germany). In addition, pH 138
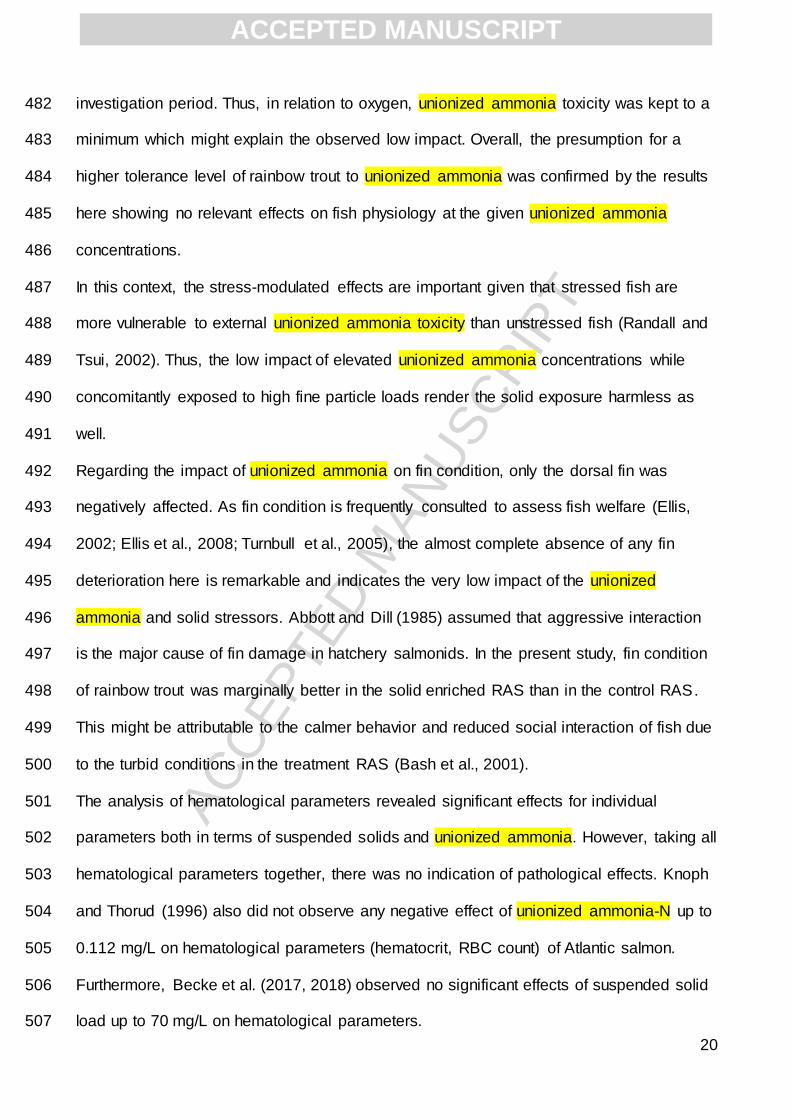
was increased from 7.5 to around 8 in both RASs to increase the proportion of unionized 139
ammonia nitrogen (NH3-N) to approximately 0.0125 mg/L (Figure 3). The increase in pH 140
was achieved by adding sodium hydrogen carbonate, dissolved in water, using a peristaltic 141
pump (Concept 420i, Saier Dosiertechnik, Germany). The pH was constantly monitored 142
using OxyGuard pH-probes (Farum, Denmark). The concentration of unionized ammonia-143
N was calculated based on actual pH and temperature according to Emerson et al. (1975). 144
In phase 3 (week 11 – 13), the concentration of unionized ammonia-N was further 145
increased to an average of approximately 0.025 mg/L (Figure 3). 146
ACCEPTED MANUSCRIPT

ACC
EPTE
D M
ANU
SCR
IPT
7
NH4-N, NO2-N and NO3-N were chemically determined three times per week throughout 147
the experiment with analysis kits (LCK 304: 0.2 – 2.5 mg/L; LCK 341: 0,05 – 2 mg/L; and 148
LCK 339: 1 – 6 mg/L, Hach, Germany, respectively), using water from the connecting tube 149
from the fish tanks of each RAS. Oxygen concentration (using Oxygen Probes, OxyGuard, 150
Farum, Denmark) and temperature (using Temperature Probes, Oxyguard, Farum, 151
Denmark) were monitored continuously at the outlets of two fish tanks in each system. 152
Carbon dioxide concentrations were determined two times per week in the fish tanks using 153
a portable dissolved CO2 analyzer (OxyGuard CO2 Portable, OxyGuard, Farum, 154
Denmark). Turbidity was determined three times per week in parallel with the 155
determination of total suspended solids using a turbidity meter (PCE-TUM 20, PCE 156
Instruments, Germany). 157
158
2.3. Analysis of suspended solids 159
2.3.1. Total suspended solids 160
The concentration of total suspended solids was determined three times per week in 161
duplicate for each system according to method 2540 D of the American Public Health 162
Association (APHA, 1998), with the exception that 0.45 µm cellulose-acetate filters 163
(diameter: 50mm, 11106-50-N, Sartorius AG, Göttingen, Germany) were used instead of 164
glass-fiber filters due to the smaller and better defined pore sizes. Filters were prepared as 165
described by Becke et al. (2018). Water samples were collected using a tube at a water 166
depth of ca. 30 cm from five tanks in each system, then duplicate samples were pooled to 167
create a representative sample for each system. Samples were collected in the early 168
morning before feeding, in order to represent the daily minimum solid loads (best case 169
scenario). To determine the within-day fluctuations and maximum values, measurements 170
were performed every two hours on one day in week 12. 171
172
ACCEPTED MANUSCRIPT

ACC
EPTE
D M
ANU
SCR
IPT
8
2.3.2. Particle size distribution (PSD) 173
For particle size measurement, water samples were collected as described above. Particle 174
sizes were determined according to Brinker et al. (2005) using a non-invasive laser particle 175
sizer (GALAI:CIS-1, GALAI Productions Ltd. Midgal Haemak, Israel) equipped with a flow 176
controller (GALAI:LFC- 100) and a flowthrough cell (GALAI:GM-7). The measurements 177
were performed in quadruplicate for each system in week 12 of experimental operation. 178
179
2.4. Fish performance 180
The specific growth rate (SGR) was calculated from mean weights recorded at the 181
beginning and the end of the experiment by using the following formula: 182
SGR (%d−1) = (ln(mean final weight)−ln(mean initial weight))/(t(final day)−t(initial day)) x 100; 183
where t is time (days). 184
The feed conversion ratio (FCR) was calculated as: 185
FCR = Feed (kg)/Weight gain (kg) 186
The thermal growth coefficient (TGC) was calculated according to Jobling (2003): 187
TGC = (Wt1/3 −W0
1/3) x (∑ T)−1 x 1000; 188
where Wt andW0 are the final and initial weights (g), respectively and ∑T is sum day-189
degrees Celsius (Cho, 1992; Iwama and Tautz, 1981). 190
191
2.5. Sampling protocol 192
Fish were sampled at the beginning, in week 5, in week 10 and in week 13 of the study. 193
Fish were fasted 24 h prior to each sampling. Two fish from each tank per system (n = 20) 194
were caught and anaesthetized using clove oil (concentration: 0.1 mL/L, exposure time: 195
ca. 60 s). Directly following anesthesia, wet weight (to the nearest 0.1 g) and total length 196
(measured from the tip of the mouth to the end of the tail fin; to the nearest 0.1 cm) of each 197
fish were measured and blood samples were taken from the caudal blood vessels and 198
ACCEPTED MANUSCRIPT

ACC
EPTE
D M
ANU
SCR
IPT
9
transferred to tubes containing lithium heparin (25 IU/mL blood, Sarstedt, Nümbrecht, 199
Germany). Subsequently, fish were killed and samples of gill tissue were collected for 200
histological examination. 201
202
2.6. Health parameters 203
2.6.1. Gill histology 204
Gill tissue was prepared and examined as described by Becke et al. (2018). Briefly, 205
observed changes were ranked rising in pathology from 0 (no change) to 3 (severe 206
change) including sub-steps 1 (minor change) and 2 (moderate change). For each section, 207
5 images showing 6–7 secondary gill lamellae were inspected at a magnification of 200× 208
using a photomicroscope (Zeiss, Oberkochen, Germany). Branchial epithelium thickness 209
(µm) was measured at 10 locations in each image and a mean value was calculated. The 210
number of goblet cells was counted per secondary lamella. The gills of 20 rainbow trout 211
from each RAS were investigated at each sampling point. 212
213
2.6.2. Fin condition 214
Fin erosion as an indicator of fish welfare was assessed according to Person-Le Ruyet et 215
al. (2007), and the fin index was determined according to Kindschi (1987), as follows: 216
Fin index = (fin length/total length)*100 217
218
2.6.3. Hematology 219
Hematological parameters (differential leukocyte count, hematocrit, leukocrit, hemoglobin 220
concentration, total red and white blood cell counts) were determined as described by 221
Becke et al. (2018). Glucose concentration was determined using a common glucose 222
measuring device (ACCU-CHEK Aviva, Roche, Mannheim, Germany) as it has been 223
ACCEPTED MANUSCRIPT

ACC
EPTE
D M
ANU
SCR
IPT
10
shown that devices for measuring human glucose level are also suitable for use with fish 224
blood (Bartoňková et al., 2017; Eames et al., 2010). 225
226
2.7. Bacterial assay 227
2.7.1. Bacterial load 228
Analysis of bacterial load of rainbow trout was conducted at the termination of the study 229
(20 rainbow trout per RAS) by the fish health service at a governmental veterinary institute, 230
the Staatliches Tierärztliches Untersuchungsamt (STUA) Aulendorf, Germany as 231
described in Becke et al. (2018). Briefly, the number of colony forming units was assessed 232
on skin and spleen and ranked as no, sporadic, slight, moderate or severe bacterial load. 233
Bacterial species were then determined by using bacteriological standard methods and 234
confirmed by MALDI-TOF MS (Lay, 2001). 235
236
2.7.2. Bacterial activity in the water 237
Bacterial activity in the fish tanks was assessed using a patented method called 238
BactiQuant® (Mycometer A/S, Copenhagen, Denmark), which is an indirect measure of 239
microbial enzyme activity. Reproducibility and repeatability of the method has been 240
documented in a verification report by the United States Environmental Protection Agency 241
(U.S.-EPA, 2011). Briefly, a 10 mL water sample was filtered through a Millipore 0.22 μm 242
closed filter unit (PES express). The filter was then incubated with a fluorogenic enzyme 243
substrate for 15 min. The synthetic fluorescent enzyme-substrate is hydrolyzed by 244
microbial enzymes in the water sample and the amount of released fluorophores was 245
quantified with a fluorometer (Mycometer A/S, Copenhagen, Denmark). The results were 246
expressed in standardized Bactiquant® values (BQV; hereafter termed bacterial activity). 247
Measurements were always performed in duplicate. During the first three weeks, bacterial 248
activity was measured every second day to gain a better overview of the development until 249
ACCEPTED MANUSCRIPT

ACC
EPTE
D M
ANU
SCR
IPT
11
the particle concentration exceeded 35 mg/L in the treatment RAS. From week 4 onwards, 250
bacterial activity was measured twice a week. 251
252
2.8. Data analysis 253
Data were checked for homoscedasticity using Levene’s test (Levene, 1960) and for 254
normality using normal quantile plots. If normal distribution and homoscedasticity tests 255
were passed, treatment effects were tested by t-tests, otherwise Wilcoxon tests were 256
employed (Sokal and Rohlf, 2003). For analysis of bacterial activity, branchial epithelium 257
thickness and number of goblet cells per secondary lamella a linear parametric model was 258
applied (Supplement 1). 259
Fin erosion and gill histology parameters (thickening of epithelial cells, cellular edema, cell 260
infiltration, tip thickening, detachment of the epithelium, telangiectasia and lamellar fusion) 261
were tested using a logistic regression on ordinal data. The method of least squares was 262
used to analyze the relation between TSS concentration and turbidity. Bacterial load data 263
of the gills was analyzed using Fisher´s exact test. A generalized linear model (GLM) was 264
used to analyze fin index and hematological parameters. 265
The coefficient of variation (CV) as a unit for the relative standard deviation was calculated 266
in terms of bacterial activity as follows: 267
CV (%) = (standard deviation (σ) / arithmetic mean (x )) x 100 268
All data analyses were performed with JMP Pro (SAS Institute Inc.) version 13.2.1. (64-bit) 269
Differences between treatment groups were considered to be significant at P < 0.05. 270
271
3 Results 272
3.1. Water parameters 273
Water temperature differed significantly (P < 0.001) between control and treatment RAS, 274
although the absolute difference was small and below 0.6 °C (Table 1). In week 11 to 13, 275
ACCEPTED MANUSCRIPT

ACC
EPTE
D M
ANU
SCR
IPT
12
NO2-N concentration was approximately 0.15 mg/L higher in the control RAS and differed 276
significantly (P < 0.05) between RAS systems, but not in phase one and two of the 277
experiment (P > 0.05). Water consumption was significantly higher (P < 0.05) in the control 278
system in week 1 to 5 (approx. 40 L/day) and in week 6 to 10 (approx. 22 L/day) than in 279
the treatment because the backwash water of the drum filter was reinjected into the 280
treatment system. From week 11 to 13 no significant difference (P > 0.05) was found 281
between systems due to adjusting the water consumption in the treatment system. 282
However, magnitudes of differences were minimal and were thus deemed biologically not 283
relevant. Turbidity differed significantly (P < 0.001) by up to 15 NTU (Nephelometric 284
Turbidity Units) between control and treatment RAS at individual sampling time points 285
(Table 1) as related to different suspended solid load. NH4-N concentrations, pH, O2 286
concentration and NO3-N concentration did not differ significantly (P > 0.05) between 287
control and treatment system. NH4-N concentrations were increased both in the control 288
and treatment RAS after week 5 and week 10 with concentrations peaks of up to 2.5 mg/L 289
(control) and 2.3 mg/L (treatment) respectively, but without significant differences (P > 290
0.05) between systems. Unionized ammonia-N concentrations were also increased after 291
week 5 from 0.005 to 0.012 mg/L and further to over 0.02 mg/L after week 10 (Figure 3), 292
however, without significant differences (P > 0.05). Overall, with the exception of NH4-293
N/NH3-N and suspended solid load, all water parameters remained within physiological 294
optimal range for rainbow trout (Timmons and Ebeling 2010). 295
296
3.2. Suspended solids analysis 297
3.2.1 Total suspended solids 298
Total suspended solid (TSS) concentration differed significantly (P < 0.0001) between 299
control and treatment RAS with an average concentration of 4.5 mg/L in the control and 300
35.2 mg/L in the treatment system (Figure 4 A). From week 3, the TSS concentration in 301
ACCEPTED MANUSCRIPT

ACC
EPTE
D M
ANU
SCR
IPT
13
the treatment system exceeded 30 mg/L and remained at an average of 40.5 mg/L. 302
Furthermore, the difference in TSS concentration between control and treatment RAS was 303
never less than 23.1 mg/L. Figure 4 B shows the within-day variation of the total 304
suspended solids concentration in the control and treatment RAS in week 12 of the 305
experiment with minimum values in the morning at 7:00 a.m. The highest TSS 306
concentration on that day was 65.8 mg/L in the treatment RAS while it was 14.1 mg/L in 307
the control RAS. 308
309
3.2.2. Particle size distribution 310
At week 12, the total number of particles per liter in the treatment RAS was on average 311
more than double that of the control. The average suspended particle load was 17.1 ± 2.1 312
mg dry weight/L in the control and 47.4 ± 2.7 mg dry weight/L in the treatment system. For 313
each particle size class, the absolute frequencies differed significantly (P < 0.001) between 314
control and treatment RAS (Figure 5). Overall, a high accumulation of fine particles 315
occurred in both the control and the treatment RAS, with 98.6 % and 98.3 % of all particles 316
respectively smaller than 15 µm, however, with higher quantities in the treatment RAS. 317
318
3.3. Fish performance 319
In contrast to the expectations based on recommended threshold values, fish performed 320
very well in both systems. A slight difference in feeding behavior was observed between 321
fish in the two systems with a less aggressive and calmer feeding behavior in the 322
treatment RAS. Overall, no significant differences (P > 0.05) were apparent for final 323
weight, survival rate, FCR, SGR and TGC between rainbow trout of the control and 324
treatment RAS (Table 2). 325
326
3.4. Health parameters 327
ACCEPTED MANUSCRIPT

ACC
EPTE
D M
ANU
SCR
IPT
14
3.4.1. Gill histology 328
No severe histological changes in gill structures were observed during the investigation. 329
Cases of cellular edema, tip-thickening of secondary lamellae, telangiectasia, thickening of 330
epithelial cells, cell infiltration, lamellar fusion, merging of secondary lamellae and 331
detachment of the epithelium were only minor or moderate (Supplement 2). In terms of 332
cellular edema, all factors were significantly altered by treatment (P < 0.05), but magnitude 333
of differences was small (0 – 15 %) and the observed histological change was only rated 334
as minor. The increased TSS concentration did not have any significant effect on all further 335
investigated histological parameters (P > 0.05). However, the increased unionized 336
ammonia concentration (P < 0.05) and the interaction of unionized ammonia concentration 337
and day of sampling (P < 0.05) led to a significantly more frequent occurrence of cell 338
infiltrations and tip thickening of secondary lamellae. All other histological parameters were 339
not significantly affected by the increased unionized ammonia concentration (P > 0.05). 340
Furthermore, no significant interaction of increased unionized ammonia concentration and 341
increased suspended solid load (P > 0.05) were found for any of the investigated 342
histological parameters. 343
Regarding thickness of branchial epithelium and number of goblet cells per secondary 344
lamella (Supplement 3), no significant effects (P > 0.05) of increased unionized ammonia 345
or suspended solid load were apparent at all. 346
347
3.4.2. Fin condition 348
Neither total suspended solid concentration (P > 0.05) or unionized ammonia (P > 0.05) 349
had a significant effect on fish welfare measured by fin erosion in the control and treatment 350
RAS (Supplement 4). Furthermore, no interaction effect of increased unionized ammonia 351
concentrations and suspended solid load was apparent (P > 0.05). 352
ACCEPTED MANUSCRIPT

ACC
EPTE
D M
ANU
SCR
IPT
15
The increased unionized ammonia concentrations caused a significantly lower fin index 353
(P < 0.05) for the dorsal fin (Supplement 5). However, fin indices of the left and right 354
pectoral fin were not affected (P > 0.05). Increased suspended solid load had no 355
significant effect (P > 0.05) on any fin index. Furthermore, the elevated unionized 356
ammonia concentrations did not significantly affect the impact of suspended solid load 357
(P > 0.05) on fin indices. 358
359
3.4.3. Hematology 360
Overall, all hematological parameters (Table 3) were approximately within the range 361
previously reported for salmonids (McCarthy et al., 1973, 1975; Pund, 1998; Řehulka et 362
al., 2004). However, hematocrit was significantly decreased (P < 0.05) both with 363
increasing TSS concentration and increasing body length, whereas hematocrit significantly 364
increased (P < 0.05) over time. Thus, the MCV value was also significantly lower (P < 365
0.01) and the MCHC value significantly higher (P < 0.01) with increasing TSS 366
concentrations. The interaction of TSS concentration and unionized ammonia 367
concentration revealed a significant effect (P < 0.05) on MCHC values. The number of 368
thrombocytes was significantly elevated (P < 0.05) with increasing unionized ammonia 369
concentration and the hemoglobin concentration significantly increased (P < 0.05) over 370
time. All the other parameters (glucose concentration, number of erythrocytes, MCH, 371
number of leukocytes, leukocrit and the proportions of lymphocytes, granulocytes and 372
monocytes) were not significantly affected (P > 0.05) by suspended solid load, unionized 373
ammonia concentration or the interaction of both parameters. 374
375
3.5. Bacterial assay 376
3.5.1. Bacterial load 377
ACCEPTED MANUSCRIPT

ACC
EPTE
D M
ANU
SCR
IPT
16
Overall, no critical bacterial load was detected in the control or treatment RAS. Bacterial 378
load of the gills differed significantly between fish of the control and treatment RAS in 379
terms of direct detection (P < 0.01) with 45 % and 10 % of the fish gills showing no 380
bacterial load in the control and treatment RAS respectively (Figure 6). In contrast, 90 % of 381
the fish gills in the treatment RAS and only 40 % of the fish gills in the control RAS 382
revealed slight to moderate bacterial load. However, no significant difference appeared in 383
terms of cultivation (P > 0.05). The bacterial load of the spleen was significantly higher (P 384
< 0.0001) for rainbow trout in the suspended solids enriched RAS. In the control RAS, 95 385
% of the spleens revealed no to sporadic bacterial load, whereas in the treatment system 386
75 % of the spleens revealed slight to moderate bacterial load. The examination of the skin 387
revealed no bacteria or ectoparasites in either RAS. The fish pathogenic bacteria 388
Flavobacterium columnare was detected on two rainbow trout from the control RAS and on 389
four rainbow trout from the treatment RAS by direct detection. The cultivation of gill smears 390
proved the occurrence of Aeromonas sobria for three fish in the treatment RAS, but not in 391
the control RAS. 392
393
3.5.2. Bacterial activity 394
Bacterial activity ranged between 0.12 x10⁵ and 0.47 x10⁵ in the control RAS (Cv = 18.0 %) 395
and between 0.33 x10⁵ and 3.42 x10⁵ in the treatment RAS (Cv = 18.3 %) (Figure 7). 396
Bacterial activity was only significantly affected (P < 0.0001) by the total suspended solid 397
concentration. With increasing particle load in the treatment RAS, bacterial activity 398
increased from about 0.3 x10⁵ to over 2.6 x10⁵ during the first three weeks. In contrast, 399
bacterial activity in the control RAS remained roughly static between 0.2 x10⁵ and 0.3 x10⁵ 400
during this time. Unionized ammonia-N concentration had no significant effect (P > 0.05) 401
on bacterial activity in either RAS. Bacterial activity measured on one representative day in 402
week 8 showed diurnal variations from 0.2 x10⁵ to 0.4 x10⁵ in the control RAS and from 403
ACCEPTED MANUSCRIPT

ACC
EPTE
D M
ANU
SCR
IPT
17
2.3 x10⁵ to 3.7 x10⁵ in the treatment RAS respectively. Overall, there was a significant 404
positive linear correlation between TSS concentration and bacterial activity (P < 0.0001, r² 405
= 0.98; Figure 8). However, the certainty measure of the linear correlation of bacterial 406
activity with TSS was very low in the control RAS (r² = 0.10) while it was high in the 407
treatment RAS (r² = 0.94). 408
409
4 Discussion 410
The experiment effectively decoupled the effects of chronic suspended solid load and 411
elevated unionized ammonia concentrations from other relevant water quality parameters. 412
This allowed an investigation of the sole effects of both increased unionized ammonia 413
concentrations and suspended solid load on rainbow trout as well as their combined 414
effects at a farm-scale. 415
Recent investigations (Becke et al., 2017, 2018) have shown that even massive 416
accumulation of fine solids alone caused no detrimental effects on rainbow trout in RAS. 417
These results were corroborated by the present findings which did not reveal relevant 418
detrimental effects of increased suspended solid concentrations on fish at concentrations 419
of up to almost 70 mg/L. Gills are of delicate structure and therefore highly sensitive to 420
physical impact (Evans, 2005; Morgan and Tovell, 1973), so the absence of any 421
histological alteration associated with suspended solid load is of particular note. This is in 422
line with Goldes et al. (1988) who also observed no branchial pathology in rainbow trout 423
even when exposed to up to 1017 mg/L of suspended clay kaolin. Thus, the assumption 424
that suspended solids alone are not a key issue affecting fish welfare in RAS is further 425
strengthened. 426
However, the increased particle load caused indirect effects. It led to increased turbidity 427
which suppressed feeding behavior of fish in the treatment RAS as previously described 428
(Barrett et al., 1992; Becke et al., 2017, 2018; Utne-Palm, 2002). This altered feed uptake 429
ACCEPTED MANUSCRIPT

ACC
EPTE
D M
ANU
SCR
IPT
18
can potentially lead to a loss of feed in commercial settings using automatic feeders. To 430
preclude this potentially disturbing effect, fish in this study were hand fed which secured 431
the uptake of all feed pellets. 432
Furthermore, the increased suspended solid load induced a substantial increased bacterial 433
load. Such a finding was expected (Becke et al., 2018) as an increased number of 434
particles in the treatment RAS promotes bacterial growth by providing a larger surface 435
area for bacterial colonization and food-substrate. Bacterial activity levels found in this 436
study have been observed in other recent studies rearing rainbow trout in intensive RAS 437
(Pedersen et al., 2017; Rojas-Tirado et al., 2018). Especially remarkable is the close linear 438
correlation between bacterial activity and TSS, which is however quite variable at low TSS 439
(< 5 mg/L), but nearly exclusively determined by TSS at high TSS loads. This novel 440
outcome is of high relevance for systems with need for bacterial control. However, the 441
physiological parameters investigated here did not reveal any evidence for bacterially 442
mediated physiological stress response in the control or in the treatment systems. This 443
was confirmed by the independent veterinary inspection of the rainbow trout which did not 444
reveal any relevant pathological bacterial infestation. In contrast, Redding et al. (1987) 445
observed a reduced tolerance to subsequent infection with Vibrio anguillarum for yearling 446
steelhead when exposed to high concentrations of suspended topsoil. In the present 447
study, however, no bacterial diseases occurred despite very high bacterial and suspended 448
solid load in the treatment RAS. However, under different conditions, the interaction of 449
suspended solids and bacterial occurrence might impair fish health and need to be 450
controlled (Herbert and Merkens, 1961; Qualls et al., 1983). 451
Increased particle concentrations, e.g. due to increased stocking densities in RAS, are 452
often accompanied by a decrease in water quality because of leaching of harmful 453
substances or particle-mediated growth of heterotrophic bacteria (Chen et al., 2003; Ling 454
and Chen, 2005). To simulate this phenomenon on a farm-scale, the concentration of 455
ACCEPTED MANUSCRIPT

ACC
EPTE
D M
ANU
SCR
IPT
19
unionized ammonia-N was increased to levels which exceeded the common upper safe 456
limit of 0.0125 mg/L proposed for salmonid aquaculture (Timmons and Ebeling, 2010). It 457
was hypothesized that the chronic exposure to increased unionized ammonia 458
concentrations would result in a deterioration of physiology and performance of rainbow 459
trout. However, contrary to the hypotheses and praxis as well as academic opinion (Smith 460
and Piper, 1975; Thurston et al., 1984; Timmons and Ebeling, 2010), rainbow trout 461
exposed to chronic unionized ammonia-N concentrations of more than four times the 462
critical threshold did not reveal deteriorated performance in our study. Fish in both systems 463
showed very good performance with nearly 100 % survival. Only minor physiological 464
effects of increased unionized ammonia concentration on gill structure were observed. 465
Nonetheless, the observed alterations of gill structures were only slight to moderate and 466
only two (cell infiltrations, tip thickening of secondary lamellae) out of seven parameters 467
were significantly affected by the increased unionized ammonia load. Thus, these results 468
suggest that the rainbow trout can cope well with the given unionized ammonia 469
concentrations. The common upper safe limit of unionized ammonia-N of 0.0125 mg/L 470
proposed for salmonid aquaculture is based on the findings of Smith and Piper (1975). 471
However, other authors, such as Meade (1985), Daoust and Ferguson (1984) (laboratory 472
experiment) and Kolarevic et al. (2013) (commercial scale) previously questioned the 473
proposed unionized ammonia limit. Nevertheless, the value of 0.0125 mg/L has been 474
echoed widely since then and established in aquaculture textbooks (e.g. Timmons and 475
Ebeling, 2010). However, it has to be noted that oxygen concentration was low (around 6 476
mg/L) in the Smith and Piper (1975) study. According to Lloyd (1961) and Brown (1968), 477
unionized ammonia toxicity increases with decreasing oxygen levels. Thus, the interaction 478
of low oxygen with high unionized ammonia concentration in the study of Smith and Piper 479
(1975) might be causative for the pathological changes in the gills of rainbow trout. During 480
the present study, however, the system water was saturated with oxygen during the whole 481
ACCEPTED MANUSCRIPT
ACC
EPTE
D M
ANU
SCR
IPT
20
investigation period. Thus, in relation to oxygen, unionized ammonia toxicity was kept to a 482
minimum which might explain the observed low impact. Overall, the presumption for a 483
higher tolerance level of rainbow trout to unionized ammonia was confirmed by the results 484
here showing no relevant effects on fish physiology at the given unionized ammonia 485
concentrations. 486
In this context, the stress-modulated effects are important given that stressed fish are 487
more vulnerable to external unionized ammonia toxicity than unstressed fish (Randall and 488
Tsui, 2002). Thus, the low impact of elevated unionized ammonia concentrations while 489
concomitantly exposed to high fine particle loads render the solid exposure harmless as 490
well. 491
Regarding the impact of unionized ammonia on fin condition, only the dorsal fin was 492
negatively affected. As fin condition is frequently consulted to assess fish welfare (Ellis, 493
2002; Ellis et al., 2008; Turnbull et al., 2005), the almost complete absence of any fin 494
deterioration here is remarkable and indicates the very low impact of the unionized 495
ammonia and solid stressors. Abbott and Dill (1985) assumed that aggressive interaction 496
is the major cause of fin damage in hatchery salmonids. In the present study, fin condition 497
of rainbow trout was marginally better in the solid enriched RAS than in the control RAS. 498
This might be attributable to the calmer behavior and reduced social interaction of fish due 499
to the turbid conditions in the treatment RAS (Bash et al., 2001). 500
The analysis of hematological parameters revealed significant effects for individual 501
parameters both in terms of suspended solids and unionized ammonia. However, taking all 502
hematological parameters together, there was no indication of pathological effects. Knoph 503
and Thorud (1996) also did not observe any negative effect of unionized ammonia-N up to 504
0.112 mg/L on hematological parameters (hematocrit, RBC count) of Atlantic salmon. 505
Furthermore, Becke et al. (2017, 2018) observed no significant effects of suspended solid 506
load up to 70 mg/L on hematological parameters. 507
ACCEPTED MANUSCRIPT

ACC
EPTE
D M
ANU
SCR
IPT
21
As a consequence of the massive accumulation of fine particles in the treatment RAS and 508
the additionally increased unionized ammonia concentration in both systems, it was 509
hypothesized that a multiplicative effect of these two parameters would occur in the 510
treatment RAS, resulting in significant consequences on trout physiology. However, none 511
of the investigated physiology parameters revealed any relevant multiplicative effects of 512
particle and unionized ammonia load. In contrast to our hypothesis, no synergistic impact 513
of increased unionized ammonia concentrations and suspended solid load on fish 514
physiology was found. These results indicate that the commonly used upper safe limits of 515
0.0125 mg/L for unionized ammonia-N and 25 mg/L for total suspended solids do not 516
represent the actual critical limits for salmonid aquaculture. Fish have evolved 517
mechanisms to counteract high unionized ammonia environments, as shown for rainbow 518
trout (Randall and Tsui, 2002; Wicks and Randall, 2002). This suggests that rainbow trout 519
have probably developed an improved tolerance to poor water quality in the course of 520
artificial selection for aquaculture. Positive effects of moderately elevated ammonia 521
concentrations have even been observed for rainbow trout when fed to satiation (Linton et 522
al., 1997, 1999; Wood, 2004). Thus, more research that keeps track of breeding 523
developments is needed to clarify the exact effects of water parameters on rainbow trout 524
and fish in general both in aquacultural production and natural conditions. It might be that 525
the upper safe limits of certain water quality parameters currently used in aquacultural 526
production no longer correspond to the present genetic makeup of fish and that they 527
should be revised. 528
529
5 Conclusions 530
The results from this study provide a fully controlled insight into the combined effects of 531
particle accumulation and unionized ammonia load on physiology of rainbow trout in RAS 532
on a farm-scale. Against expectations and widespread opinion, the solid fraction of the 533
ACCEPTED MANUSCRIPT

ACC
EPTE
D M
ANU
SCR
IPT
22
experimental system, comprising almost exclusively fine particles at concentrations 534
distinctly above values normally reached in aquacultural production, failed to provoke 535
detrimental effects on physiology and performance of rainbow trout. The same holds for 536
unionized ammonia and the combination of both. 537
The results therefore indicate with respect to suspended solids and unionized ammonia 538
that increasing fish densities to improve the economic performance of RAS beyond current 539
limits of suspended solids and unionized ammonia is feasible, if accompanying water 540
parameters are optimal. 541
542
Thus, the main conclusions are: 543
Bacterial activity was strongly affected by increased TSS concentrations, but 544
without detrimental effects on fish physiology 545
increased unionized ammonia-N concentrations up to 0.05 mg/L caused only minor 546
effects on fish physiology 547
no relevant combined effects of increased unionized ammonia-N concentrations 548
and suspended solid load were observed 549
upper safe limits of unionized ammonia-N and suspended solids need to be revised 550
for salmonid aquaculture 551
552
Acknowledgements 553
We thank Helga Bentele and HP Billmann for their excellent technical assistance, 554
especially with fish husbandry and system maintenance. We also thank the state 555
veterinary institute of Aulendorf for the bacteriological examination of the fish. We also 556
acknowledge the scientific language editing by Erica Bower as well as the valuable input of 557
three anonymous reviewers. This research was funded by the Deutsche Bundesstiftung 558
Umwelt (Az 30996). 559
ACCEPTED MANUSCRIPT
ACC
EPTE
D M
ANU
SCR
IPT
23
References 560
Abbott, J.C., Dill, L.M., 1985. Patterns of aggressive attack in juvenile steelhead trout 561
(Salmo gairdneri). Can. J. Fish. Aquat. Sci. 42, 1702–1706. 562 Ayer, N.W., Tyedmers, P.H., 2009. Assessing alternative aquaculture technologies: life 563
cycle assessment of salmonid culture systems in Canada. J. Clean. Prod. 17, 362–564 373. https://doi.org/10.1016/j.jclepro.2008.08.002 565
Badiola, M., Mendiola, D., Bostock, J., 2012. Recirculating Aquaculture Systems (RAS) 566
analysis: Main issues on management and future challenges. Aquac. Eng. 51, 26–567 35. https://doi.org/10.1016/j.aquaeng.2012.07.004 568
Barrett, J.C., Grossman, G.D., Rosenfeld, J., 1992. Turbidity-Induced Changes in Reactive 569 Distance of Rainbow Trout. Trans. Am. Fish. Soc. 121, 437–443. 570 https://doi.org/10.1577/1548-8659(1992)121<0437:TICIRD>2.3.CO;2 571
Bartoňková, J., Hyršl, P., Vojtek, L., 2017. Glucose determination in fish plasma by two 572 different moderate methods. Acta Vet. Brno 85, 349–353. 573
Bash, J., Berman, C.H., Bolton, S., 2001. Effects of turbidity and suspended solids on 574 salmonids. University of Washington Water Center. 575
Becke, C., Schumann, M., Steinhagen, D., Geist, J., Brinker, A., 2018. Physiological 576
consequences of chronic exposure of rainbow trout (Oncorhynchus mykiss) to 577 suspended solid load in recirculating aquaculture systems. Aquaculture 484, 228–578
241. https://doi.org/10.1016/j.aquaculture.2017.11.030 579 Becke, C., Steinhagen, D., Schumann, M., Brinker, A., 2017. Physiological consequences 580
for rainbow trout (Oncorhynchus mykiss) of short-term exposure to increased 581
suspended solid load. Workshop Recirc. Aquac. Syst. III 78, 63–74. 582 https://doi.org/10.1016/j.aquaeng.2016.11.001 583
Bilotta, G.S., Brazier, R.E., 2008. Understanding the influence of suspended solids on 584
water quality and aquatic biota. Water Res. 42, 2849–2861. 585 https://doi.org/10.1016/j.watres.2008.03.018 586
Brinker, A., Friedrich, C., 2012. Fish meal replacement by plant protein substitution and 587 guar gum addition in trout feed. Part II: effects on faeces stability and rheology. 588 Biorheology 49, 27–48. 589
Brinker, A., Schröder, H.G., Rösch, R., 2005. A high-resolution technique to size 590 suspended solids in flow-through fish farms. Aquac. Eng. 32, 325–341. 591
https://doi.org/10.1016/j.aquaeng.2004.07.002 592 Brown, V.M., 1968. The calculation of the acute toxicity of mixtures of poisons to rainbow 593
trout. Water Res. 2, 723–733. 594
Cameron, J.N., Heisler, N., 1983. Studies of ammonia in the rainbow trout: physico-595 chemical parameters, acid-base behaviour and respiratory clearance. J. Exp. Biol. 596
105, 107–125. 597 Chapman, P.M., Popham, J.D., Griffin, J., Leslie, D., Michaelson, J., 1987. Differentiation 598
of physical from chemical toxicity in solid waste fish bioassays. Water. Air. Soil 599
Pollut. 33, 295–308. 600 Chen, S., Malone, R.F., 1991. Suspended solids control in recirculating aquacultural 601
systems, in: Engineering Aspects of Intensive Aquaculture, Proceedings from the 602 Aquaculture Symposium. Ithaca, NY, pp. 170–186. 603
Chen, S., Timmons, M.B., Aneshansley, D.J., Bisogni, J.J., 1993. Suspended solids 604
characteristics from recirculating aquacultural systems and design implications. 605 Aquaculture 112, 143–155. https://doi.org/10.1016/0044-8486(93)90440-A 606
Chen, Y.-S., Beveridge, M.C.M., Telfer, T.C., Roy, W.J., 2003. Nutrient leaching and 607 settling rate characteristics of the faeces of Atlantic salmon (Salmo salar L.) and the 608 implications for modelling of solid waste dispersion. J. Appl. Ichthyol. 19, 114–117. 609
ACCEPTED MANUSCRIPT

ACC
EPTE
D M
ANU
SCR
IPT
24
Cho, C.Y., 1992. Feeding systems for rainbow trout and other salmonids with reference to 610 current estimates of energy and protein requirements. Aquaculture 100, 107–123. 611
Daoust, P.-Y., Ferguson, H.W., 1984. The pathology of chronic ammonia toxicity in 612
rainbow trout, Salmo gairdneri Richardson. J. Fish Dis. 7, 199–205. 613 Eames, S.C., Philipson, L.H., Prince, V.E., Kinkel, M.D., 2010. Blood sugar measurement 614
in zebrafish reveals dynamics of glucose homeostasis. Zebrafish 7, 205–213. 615 Ellis, T., 2002. The relationships between stocking density and welfare in farmed rainbow 616
trout. J. Fish Biol. 61, 493–531. https://doi.org/10.1006/jfbi.2002.2057 617
Ellis, T., Oidtmann, B., St-Hilaire, S., Turnbull, J., North, B., MacIntyre, C., Nikolaidis, J., 618 Hoyle, I., Kestin, S., Knowles, T., 2008. Fin erosion in farmed fish, in: Fish Welfare. 619
Blackwell Publishing, Oxford, pp. 121–149. 620 Emerson, K., Russo, R.C., Lund, R.E., Thurston, R.V., 1975. Aqueous ammonia 621
equilibrium calculations: effect of pH and temperature. J. Fish. Board Can. 32, 622
2379–2383. 623 Evans, D.H., 2005. The Multifunctional Fish Gill: Dominant Site of Gas Exchange, 624
Osmoregulation, Acid-Base Regulation, and Excretion of Nitrogenous Waste. 625 Physiol. Rev. 85, 97–177. https://doi.org/10.1152/physrev.00050.2003 626
FAO (Ed.), 2016. The state of world fisheries and aquaculture 2016. Contributing to food 627
security and nutrition for all. Rome. 628 Glencross, B.D., Booth, M., Allan, G.L., 2007. A feed is only as good as its ingredients–a 629
review of ingredient evaluation strategies for aquaculture feeds. Aquac. Nutr. 13, 630 17–34. 631
Goldes, S.A., Ferguson, H.W., Moccia, R.D., DAOUST, P.-Y., 1988. Histological effects of 632
the inert suspended clay kaolin on the gills of juvenile rainbow trout, Salmo 633 gairdneri Richardson. J. Fish Dis. 11, 23–33. 634
Herbert, D.W.M., Merkens, J.C., 1961. The effect of suspended mineral solids on the 635
survival of trout. Int. J. Air Water Pollut. 5, 46–55. 636 Ip, Y., Chew, S., Randall, D., 2001. Ammonia toxicity, tolerance, and excretion. Fish 637
Physiol. 20, 109–148. 638 Iwama, G.K., Tautz, A.F., 1981. A Simple Growth Model for Salmonids in Hatcheries. Can. 639
J. Fish. Aquat. Sci. 38, 649–656. https://doi.org/10.1139/f81-087 640
Jobling, M., 2003. The thermal growth coefficient (TGC) model of fish growth: a cautionary 641 note. Aquac. Res. 34, 581–584. https://doi.org/10.1046/j.1365-2109.2003.00859.x 642
Klinger, D., Naylor, R., 2012. Searching for Solutions in Aquaculture: Charting a 643 Sustainable Course. Annu. Rev. Environ. Resour. 37, 247–276. 644 https://doi.org/10.1146/annurev-environ-021111-161531 645
Knoph, M.B., Thorud, K., 1996. Toxicity of ammonia to Atlantic salmon (Salmo salar L.) in 646 seawater—Effects on plasma osmolality, ion, ammonia, urea and glucose levels 647
and hematologic parameters. Comp. Biochem. Physiol. A Physiol. 113, 375–381. 648 Kolarevic, J., Selset, R., Felip, O., Good, C., Snekvik, K., Takle, H., Ytteborg, E., 649
Baeverfjord, G., Åsgård, T., Terjesen, B.F., 2013. Influence of long term ammonia 650
exposure on Atlantic salmon (Salmo salar L.) parr growth and welfare. Aquac. Res. 651 44, 1649–1664. https://doi.org/10.1111/j.1365-2109.2012.03170.x 652
Lay, J.O., 2001. MALDI-TOF mass spectrometry of bacteria. Mass Spectrom. Rev. 20, 653 172–194. https://doi.org/10.1002/mas.10003 654
Levene, H., 1960. Robust test for the equality of variances, in: Olkin, I., Ghurge, S.G., 655
Hoeffding, W., Madow, W.G., Mann, H.B. (Eds.), Contributions to Probability and 656 Statistics. Stanford University Press, Stanford, CA, pp. 278–292. 657
Ling, J., Chen, S., 2005. Impact of organic carbon on nitrification performance of different 658 biofilters. Aquac. Eng. 33, 150–162. https://doi.org/10.1016/j.aquaeng.2004.12.002 659
ACCEPTED MANUSCRIPT

ACC
EPTE
D M
ANU
SCR
IPT
25
Linton, T.K., Reid, S.D., Wood, C.M., 1999. Effects of a restricted ration on the growth and 660 energetics of juvenile rainbow trout exposed to a summer of simulated warming and 661 sublethal ammonia. Trans. Am. Fish. Soc. 128, 758–763. 662
Linton, T.K., Reid, S.D., Wood, C.M., 1997. The metabolic costs and physiological 663 consequences to juvenile rainbow trout of a simulated summer warming scenario in 664
the presence and absence of sublethal ammonia. Trans. Am. Fish. Soc. 126, 259–665 272. 666
Lloyd, R., 1961. Effect of dissolved oxygen concentrations on the toxicity of several 667
poisons to rainbow trout (Salmo gairdnerii Richardson). J. Exp. Biol. 38, 447–455. 668 Martins, C.I.M., Eding, E.H., Schneider, O., Rasmussen, R., Olesen, B., Plesner, L., 669
Verreth, J.A.J., 2005. Recirculation aquaculture systems in Europe. CONSENSUS, 670 Oostende, Belgium, Consensus Working Group. European Aquaculture Society. 671
McCarthy, D.H., Stevenson, J.P., Roberts, M.S., 1975. Some blood parameters of the 672
rainbow trout (Salmo gairdneri Richardson). J. Fish Biol. 7, 215–219. 673 McCarthy, D.H., Stevenson, J.P., Roberts, M.S., 1973. Some blood parameters of the 674
rainbow trout (Salmo gairdneri Richardson). J. Fish Biol. 5, 1–8. 675 Meade, J.W., 1985. Allowable ammonia for fish culture. Progress. Fish-Cult. 47, 135–145. 676 Morgan, M., Tovell, P.W.A., 1973. The structure of the gill of the trout, Salmo gairdneri 677
(Richardson). Z. Für Zellforsch. Mikrosk. Anat. 142, 147–162. 678 https://doi.org/10.1007/BF00307029 679
Naylor, R.L., Goldburg, R.J., Primavera, J.H., Kautsky, N., Beveridge, M.C.M., Clay, J., 680 Folke, C., Lubchenco, J., Mooney, H., Troell, M., 2000. Effect of aquaculture on 681 world fish supplies. Nature 405, 1017–1024. https://doi.org/10.1038/35016500 682
Naylor, R.L., Hardy, R.W., Bureau, D.P., Chiu, A., Elliott, M., Farrell, A.P., Forster, I., 683 Gatlin, D.M., Goldburg, R.J., Hua, K., Nichols, P.D., 2009. Feeding aquaculture in 684 an era of finite resources. Proc. Natl. Acad. Sci. 106, 15103–15110. 685
https://doi.org/10.1073/pnas.0905235106 686 Noble, A.C., Summerfelt, S.T., 1996. Diseases encountered in rainbow trout cultured in 687
recirculating systems. Annu. Rev. Fish Dis. 6, 65–92. 688 https://doi.org/10.1016/S0959-8030(96)90006-X 689
Pedersen, P.B., von Ahnen, M., Fernandes, P., Naas, C., Pedersen, L.-F., Dalsgaard, J., 690
2017. Particle surface area and bacterial activity in recirculating aquaculture 691 systems. Aquac. Eng., Workshop on Recirculating Aquaculture Systems (III) 78, 692
18–23. https://doi.org/10.1016/j.aquaeng.2017.04.005 693 Pund, R.P., 1998. Anwendung hämatologischer Untersuchungsmethoden für Fischblut 694
und Beeinflussung des Blutbildes von Bachforellen (Salmo trutta f. fario) durch 695
Haltungs-und Umwelteinflüsse sowie endogene Faktoren. Freie Universität Berlin. 696 Qualls, R.G., Flynn, M.P., Johnson, J.D., 1983. The role of suspended particles in 697
ultraviolet disinfection. J. Water Pollut. Control Fed. 1280–1285. 698 Randall, D.J., Tsui, T.K.N., 2002. Ammonia toxicity in fish. Mar. Pollut. Bull. 45, 17–23. 699 Redding, J.M., Schreck, C.B., Everest, F.H., 1987. Physiological Effects on Coho Salmon 700
and Steelhead of Exposure to Suspended Solids. Trans. Am. Fish. Soc. 116, 737–701 744. https://doi.org/10.1577/1548-8659(1987)116<737:PEOCSA>2.0.CO;2 702
Řehulka, J., Minařík, B., Řehulková, E., 2004. Red blood cell indices of rainbow trout 703 Oncorhynchus mykiss (Walbaum) in aquaculture. Aquac. Res. 35, 529–546. 704 https://doi.org/10.1111/j.1365-2109.2004.01035.x 705
Rojas-Tirado, P., Pedersen, P.B., Vadstein, O., Pedersen, L.-F., 2018. Changes in 706 microbial water quality in RAS following altered feed loading. Aquac. Eng. 81, 80–707
88. https://doi.org/10.1016/j.aquaeng.2018.03.002 708 Roque d’Orbcastel, E., Person-Le Ruyet, J., Le Bayon, N., Blancheton, J.-P., 2009. 709
Comparative growth and welfare in rainbow trout reared in recirculating and flow 710
ACCEPTED MANUSCRIPT

ACC
EPTE
D M
ANU
SCR
IPT
26
through rearing systems. Aquac. Eng. 40, 79–86. 711 https://doi.org/10.1016/j.aquaeng.2008.11.005 712
Schumann, M., Brinker, A., Friedrich, C., 2018. Rheological characterization of an in vitro 713
model for salmonid chyme to quantify changes in feed composition. Biorheology 54, 714 167–184. https://doi.org/10.3233/BIR-18167 715
Smart, G., 1976. The effect of ammonia exposure on gill structure of the rainbow trout 716 (Salmo gairdneri). J. Fish Biol. 8, 471–475. 717
Smith, C.E., Piper, R.G., 1975. Lesions associated with chronic exposure to ammonia. 718
Pathol. Fishes W E Ribelin Ed Univ. Wis. Press Madison Wis. 1975 P 497-514. 719 Sokal, R.R., Rohlf, J.F., 2003. Biometry: the principles and practice of statistics in 720
biological research, 8th ed. W.H. Freemann and Company, New York. 721 Summerfelt, S.T., Adler, P.R., Glenn, D.M., Kretschmann, R.N., 1999. Aquaculture sludge 722
removal and stabilization within created wetlands. Aquac. Eng. 19, 81–92. 723
Thurston, R.V., Russo, R.C., Luedtke, R.J., Smith, C.E., Meyn, E.L., Chakoumakos, C., 724 Wang, K.C., Brown, C., 1984. Chronic toxicity of ammonia to rainbow trout. Trans. 725
Am. Fish. Soc. 113, 56–73. 726 Timmons, M.B., Ebeling, J.M., 2010. Recirculating Aquaculture, 2nd ed. Cayuga Aqua 727
Ventures, Ithaca, NY. 728
Turnbull, J., Bell, A., Adams, C., Bron, J., Huntingford, F., 2005. Stocking density and 729 welfare of cage farmed Atlantic salmon: application of a multivariate analysis. 730
Aquaculture 243, 121–132. https://doi.org/10.1016/j.aquaculture.2004.09.022 731 Unger, J., Brinker, A., 2013. Feed and treat: What to expect from commercial diets. Aquac. 732
Eng. 53, 19–29. https://doi.org/10.1016/j.aquaeng.2012.11.012 733
U.S.-EPA, 2011. Environmental technology verification report. Mycometer®-test Rapid 734 Fungi Detection and Bactiquant®-test Rapid Bacteria Detection Technologies. U.S. 735 Environmental Protection Agency, Office of Research and Development. 736
Utne-Palm, A.C., 2002. Visual feeding of fish in a turbid environment: Physical and 737 behavioural aspects. Mar. Freshw. Behav. Physiol. 35, 111–128. 738
https://doi.org/10.1080/10236240290025644 739 Verdegem, M.C.J., Bosma, R.H., Verreth, J.A.J., 2006. Reducing Water Use for Animal 740
Production through Aquaculture. Int. J. Water Resour. Dev. 22, 101–113. 741
https://doi.org/10.1080/07900620500405544 742 Wedemeyer, G.A., 1996. Physiology of Fish in Intensive Culture Systems. Springer US, 743
Boston, MA. 744 Wicks, B.J., Joensen, R., Tang, Q., Randall, D.J., 2002. Swimming and ammonia toxicity 745
in salmonids: the effect of sub lethal ammonia exposure on the swimming 746
performance of coho salmon and the acute toxicity of ammonia in swimming and 747 resting rainbow trout. Aquat. Toxicol. 59, 55–69. 748
Wicks, B.J., Randall, D.J., 2002. The effect of sub-lethal ammonia exposure on fed and 749 unfed rainbow trout: the role of glutamine in regulation of ammonia. Comp. 750 Biochem. Physiol. A. Mol. Integr. Physiol. 132, 275–285. 751
Wood, C.M., 2004. Dogmas and controversies in the handling of nitrogenous wastes: Is 752 exogenous ammonia a growth stimulant in fish? J. Exp. Biol. 207, 2043–2054. 753
https://doi.org/10.1242/jeb.00990 754 Ytrestøyl, T., Aas, T.S., Åsgård, T., 2015. Utilisation of feed resources in production of 755
Atlantic salmon (Salmo salar) in Norway. Aquaculture 448, 365–374. 756
https://doi.org/10.1016/j.aquaculture.2015.06.023 757 758
759
ACCEPTED MANUSCRIPT

ACC
EPTE
D M
ANU
SCR
IPT
27
Figure captions: 760 761 Figure 1: Scheme of the recirculating aquaculture systems with modification for particle 762
accumulation in the treatment system (light grey shaded). 763 764
Figure 2: Experimental setup of the rainbow trout exposure in the RAS. 765 766 Figure 3: Unionized ammonia nitrogen (NH3-N) concentration (mean, minimum (Min) and 767
maximum values (Max)) in the control and treatment RAS during the investigation period. 768 The dashed line shows the common limit value of NH3-N (0.0125 mg/L) for salmonids 769
(Timmons and Ebeling, 2010). 770 771 Figure 4: (A) Timeline of total suspended solids concentration (mean ± S.D.) in control and 772
treatment RAS over the experimental period. (B) Representative daily variation of total 773 suspended solids concentration (mean ± S.D.) in control and treatment RAS in week 12. 774
Samples were collected every two hours between 7:00 and 19:00 and at 23:00 (CET). 775 Please note the axis break on the x-axis. 776
777
Figure 5: Absolute frequency within particle size classes (mean ± S.E.) of the control (n = 778 4) and treatment RAS (n = 4) in week 12. All particle size classes differed significantly (P < 779
0.001) between control and treatment system. Please note the axis break on the y-axis. 780 781 Figure 6: Bacteriological examination of gills (direct detection and cultivation) and spleen 782
(cultivation) from 20 rainbow trout of the control (C) and treatment (T) RAS. ** = P < 0.01; 783 *** = P < 0.0001 784
785
Figure 7: Bacterial activity (BQV/mL, mean ± S.D.) in the treatment and control RAS during 786
the investigation period. 787 788 Figure 8: Linear relationship between bacterial activity (BQV/mL) and total suspended 789
solid concentration (mg/L) for control (open symbol) and treatment RAS (solid symbol) and 790 in sum. The dashed line shows the overall linear relationship, the solid lines show the 791
linear relationship of the treatment and control system respectively. 792 793
ACCEPTED MANUSCRIPT

ACC
EPTE
D M
ANU
SCR
IPT
28
Highlights: 794
Study of combined chronic effects of critical solid and unionized ammonia exposure 795
Full control of water parameters except turbidity in replicated RAS 796
Only minimal effects of NH3-N up to 0.05 mg/L on fish physiology 797
No interaction effects between ammonia and suspended solid load 798
Close linear correlation of suspended solid load and bacterial activity 799
ACCEPTED MANUSCRIPT

Figure 1

Figure 2

Figure 3

Figure 4

Figure 5

Figure 6

Figure 7

Figure 8
Copyright © 2022 FDOKUMEN