A novel perspective on pectin extraction - DTU Orbit
115
General rights Copyright and moral rights for the publications made accessible in the public portal are retained by the authors and/or other copyright owners and it is a condition of accessing publications that users recognise and abide by the legal requirements associated with these rights. Users may download and print one copy of any publication from the public portal for the purpose of private study or research. You may not further distribute the material or use it for any profit-making activity or commercial gain You may freely distribute the URL identifying the publication in the public portal If you believe that this document breaches copyright please contact us providing details, and we will remove access to the work immediately and investigate your claim. Downloaded from orbit.dtu.dk on: Jan 26, 2022 A novel perspective on pectin extraction Dominiak, Malgorzata Maria Publication date: 2014 Document Version Publisher's PDF, also known as Version of record Link back to DTU Orbit Citation (APA): Dominiak, M. M. (2014). A novel perspective on pectin extraction. Technical University of Denmark, Department of Chemical and Biochemical Engineering.
-
Upload
khangminh22 -
Category
Documents
-
view
1 -
download
0
Transcript of A novel perspective on pectin extraction - DTU Orbit

General rights Copyright and moral rights for the publications made accessible in the public portal are retained by the authors and/or other copyright owners and it is a condition of accessing publications that users recognise and abide by the legal requirements associated with these rights.
Users may download and print one copy of any publication from the public portal for the purpose of private study or research.
You may not further distribute the material or use it for any profit-making activity or commercial gain
You may freely distribute the URL identifying the publication in the public portal If you believe that this document breaches copyright please contact us providing details, and we will remove access to the work immediately and investigate your claim.
Downloaded from orbit.dtu.dk on: Jan 26, 2022
A novel perspective on pectin extraction
Dominiak, Malgorzata Maria
Publication date:2014
Document VersionPublisher's PDF, also known as Version of record
Link back to DTU Orbit
Citation (APA):Dominiak, M. M. (2014). A novel perspective on pectin extraction. Technical University of Denmark, Departmentof Chemical and Biochemical Engineering.

A novel perspective on pectin extraction
Malgorzata Maria Dominiak
Ph.D. Thesis 2014
Malgorzata Maria DominiakPh.D. Thesis2014
A novel perspective on pectin extraction

A novel perspective on pectin extraction
Malgorzata Maria DominiakPh.D. Thesis2014
1

Copyright©: Malgorzata Maria Dominiak
2014
Center For Bioprocess Engineering
Department of Chemical and Biochemical Engineering
Technical University of Denmark
Søltofts Plads, Building 229
DK-2800 Kgs. Lyngby
Denmark
Phone: +45 4525 2800
Fax: +45 4525 2258
Web: www.bioeng.kt.dtu.dk
ISBN : 978-87-93054-39-4
Print: J&R Frydenberg A/S
København
Juli 2014
2

3
Preface
This thesis is based on work carried out between August 2010 and December 2013 at DuPont Nutrition
Biosciences ApS, Department of Hydrocolloid Science under the supervision of Principal Scientist Karen
Marie Søndergaard, and at the Center for Bioprocess Engineering, Department of Chemical and
Biochemical Engineering, Technical University of Denmark under the supervision of Professor Jørn
Dalgaard Mikkelsen.
The PhD study was a part of the Lean Green Food project (EU-ITN 238084) and was financed by DuPont
Nutrition Biosciences ApS, Technical University of Denmark and Marie Curie 7th Framework Program.
I would like to thank my supervisor Jørn Dalgaard Mikkelsen for inspiration, encouragement and valuable
discussions. My co-supervisor, Karen Marie Søndergaard, is thanked for help, support and valuable
comments. Anne Grete Juul from the Department of Hydrocolloid Science, DuPont Nutrition Biosciences
ApS, is acknowledged for her help with project organization and troubleshooting.
Grit Fischer, Maren Plewe and Constanze Doese from DuPont Germany are acknowledged for their
hospitality and excellent company during my research stay in Niebüll, Germany.
All Early Stage Researchers from the Lean Green Food project and their supervisors are acknowledged
for sharing ideas, cooperation and excellent company during network meetings.
Finally I would like to thank my family, especially my husband Dominik, for always being there for me.
Malgorzata Maria Dominiak
DTU, 13th of January, 2014
3

4
4

5
This thesis is dedicated to the memory of my father, Andrzej Sniady.
I am glad he saw this process, offering me support and encouragement.
5

6
6

7
Abstract
The classical (current) extraction of pectin is based on an acid-catalyzed process, using nitric,
hydrochloric or sulphuric acid. The reaction takes place at low pH and high temperatures for several
hours. The main disadvantage of this technology, and one which raises environmental concerns, is
generation of large volumes of acidic effluent, which require further treatment before release. The main
focus of this PhD study was to replace acid with enzymes and thereby achieve sustainable, green
production of pectin. The first goal was to prove that an enzyme-based process could generate pectin with
the same yields and functional properties as an acid-based process. 13 commercial enzymes were selected
for the primary screen and 4 were examined in larger scale extractions. The best enzyme, Laminex C2K,
gave a yield of 23%, had a molecular weight of 69 kDa, and possessed functional properties comparable
with pectins obtained in a classical way. In the future it would be beneficial to optimize the Laminex C2K
production strain (Penicillium funiculosum) by molecular design to delete the residual pectinolytic
activity and include plant cell wall hydrolases.
Pectin production is complex and therefore its optimization is a long process because the evaluation of the
final product quality is accomplished at the end of the procedure, employing time-consuming off-line
laboratory tests. Fourier transform infrared spectroscopy (FTIR) and carbohydrate microarrays, combined
with chemometrics, were evaluated for their abilities to predict of pectin yields and assess pectin traits
during the pectin extraction process. Using crude lime peel extracts, both FTIR and carbohydrate
microarray analysis showed predictive and descriptive abilities with respect to acid and enzymatically
extracted pectins. Furthermore, FTIR determined the optimal extraction time for both the enzymatic and
acidic extraction processes. The combined results suggested major differences in the crude pectin extract
traits of enzymatically vs. acidically extracted pectin with respect to the degree of esterification, purity,
and abundance of rhamnogalacturonan I pectic regions.
Although the major pectin applications still include gelling, thickening and stabilization, other novel uses
employ its prebiotic potential, anti-cancer properties and heavy metal detoxification ability (Hotchkiss,
Rastall, Gibson, Eliaz, Liu, & Fishman, 2009). Sunflower pectin was extracted and fractionated into three
fractions according to size, SPF<50, SPF50-100 and SPF>100, using 50 and 100 kDa membranes. The
density of Bifidobacterium spp. was significantly higher (p<0.05) after fermentation on SPF>100 kDa.
All three sunflower pectin fractions did not influence the level of Lactobacillus spp., Bacteroidetes and
Firmicutes.
7

8
8

9
Dansk sammenfatning
Den klassiske ekstraktion af pektin er baseret på en syrekatalyseret proces, hvor der anvendes
salpetersyre, saltsyre eller svovlsyre. Reaktionen sker ved høj temperatur, lavt pH samt en reaktionstid på
flere timer.Ulempen ved denne proces er oprensningen af store mængder uorganiske kemikalier. Hoved
fokus på dette PhD studieer at erstatte syrer med enzymer og dermed opnå en bæredygtig grøn produktion
af pektin. Det første mål var at bevise, at et enzym baseret proces kunne fremstille pektin med samme
udbytte og funktionelle egenskaber, som den klassiske proces. Der blev anvendt 13 forskellige
kommercielle enzymer til den første screening, og 4 blev valgt til den endelige afprøvningi større skala.
Det bedste enzym, Laminex C2K, gav et udbyttepå 23%og en mol vægt på 69 kDa, samt en gelerings og
viskositetseffekt, der var på højde med de kvaliteter af pektin man kan fremstille ved den klassiske
metode.
Pektin processen er meget kompleks og optimeringen af reaktionsbetingelserne og kvaliteten af det
endelige produkt bliver normalt målt i slutningen af processen med arbejdskrævende analyser. Fourier
transform infrared spectroscopy (FTIR) og kulhydrat”micro-array” kombineret med chemometrics, er
blevet anvendt til at bestemme pektin udbytte og bestemme pektin struktur under ekstraktions processen,
ved at måle direkte på ekstraktions blandingen. Begge metoder kunne forudsige den optimale
ekstraktionstid, samt måle mængden af methyl estere, niveau af urenheder og mængde af RGI.
Selv om applikationen af pektin er rettet mod gelering, fortykningsmidler eller stabilisering, er der også et
stigende behov for pektin som prebiotika, anti-cancer egenskaber og til anvendelse somafgiftning af
tungmetaller (Hotchkiss, Rastall, Gibson, Eliaz, Liu, & Fishman, 2009). Solsikke pektin blev derfor
ekstraheret og fraktioneret efter størrelse SPF<50, SPF50 og SPF>100 ved hjælp af 50 og 100 kDa
membraner. Densiteten af Bifidobacterium spp. var betydelig højere (p<0.05) efter fermentering af
SPF>100. De tre pektiner fra solsikkegav den sameeffekt på de tre andre mave-tarm bakterier,
Lactobacillus spp., Bacteroidetes and Firmicutes.
9

10
10

11
List of publications
1. Application of enzymes for efficient extraction, modification and development of functional
properties of lime pectin.
Malgorzata Dominiak, Karen M. Søndergaard, Jesper Wichmann, Silvia Vidal-Melgosa, William
G.T. Willats, Anne S. Meyer, Jørn D. Mikkelsen (2014). Food Hydrocolloids, 40, 273-282.
2. FTIR, carbohydrate microarray and multivariate analysis for assessing pectin extracts.
Andreas Baum, Malgorzata Dominiak, Silvia Vidal-Melgosa, William G.T. Willats, Karen Marie
Søndergaard, Per Waaben Hansen, Anne S. Meyer, Jørn Dalgaard Mikkelsen
Submitted
3. Evaluation of the prebiotic potential of sunflower pectin fractions.
Malgorzata Dominiak, Louise K. Vigsnæs, Tine R. Licht, Karen M. Søndergaard, Jørn D.
Mikkelsen
Presented as manuscript
11

12
12

13
Abbreviations
ANOVA One-way analysis of variance
Ca2+ Calcium ion
Ct Cycle number
CBM Carbohydrate binding modules
DA Degree of amidation
DAc Degree of acetyl esterification (acetylation)
DE Degree of esterification
DM Degree of methyl esterification (methylation)
DP Degree of polymerization
EDTA Ethylene diaminetetraacetate
Endo-PG Endo-acting PG
Exo-PG Exo-acting PG
FOS Fructo-oligosaccharides
f-PME Fungal-PME
FTIR Fourier transform infrared spectroscopy
Gal Galactose
GalA -D-galactopyranosyluronic acid
GPC Gel permeation chromatography
HE-pectin High ester pectin
HG Homogalacturonan
HM-pectin High methyl ester pectin
HPAEC-PAD High performance anion exchange chromatography with pulsed amperometric
detection
LM pectin Low methyl ester pectin
MALLS Multi-angle laser light scattering
MBM Minimal basal medium
MSNF Milk solid non-fat
Mw Molecular weight
NEG Negative control
PBS Phosphate buffered saline
PAT Process analytical technologies
13

14
PCA Principal component analysis
PCs Principal components
PG Polygalacturonase
PGA Polygalacturonic acid
PL Pectin lyase
PLS Partial least squares
PME Pectin methylesterase
p-PME Plant-PME
qPCR Quantitative polymerase chain reaction
Q2 Predictivity
RGI Rhamnogalacturonan I
RGII Rhamnogalacturonan II
Rha Rhamnose
RMSEP Root mean square error of prediction
RPM Rounds per minute
R2 Correlation coefficient
RI Refractive index
SEC Size exclusion chromatography
SNV Standard normal variate
SPF<50 Sunflower pectin fraction of Mw< 50 kDa
SPF50-100 Sunflower pectin fraction of Mw between 50 and 100 kDa
SPF>100 Sunflower pectin fraction of Mw> 100 kDa
14

15
Table of Contents Preface .................................................................................................................................................... 3
Abstract ................................................................................................................................................... 7
Dansk sammenfatning ............................................................................................................................. 9
List of publications ................................................................................................................................ 11
Abbreviations ........................................................................................................................................ 13
1. Introduction ................................................................................................................................... 17
1.1 Hypotheses and objectives ......................................................................................................... 19
1.2 Plant cell wall architecture ......................................................................................................... 20
1.2.1 Structural domains.............................................................................................................. 20
1.2.2 Enzymatic degradation of the cell walls .............................................................................. 21
1.3 Structural features of pectin........................................................................................................ 22
1.3.1 Structural domains.............................................................................................................. 22
1.3.1.1 Galacturonans................................................................................................................. 22
1.3.1.2 Rhamnogalacturonan I .................................................................................................... 23
1.3.1.3 Other structural elements: arabinans and arabinogalactans .............................................. 24
1.3.2 High ester, low ester and amidated pectins. ......................................................................... 26
1.3.3 Molecular weight and aggregation ...................................................................................... 26
1.3.4 Stability.............................................................................................................................. 28
1.3.5 Pectin-degrading enzymes .................................................................................................. 28
1.3.6 Enzymatic fingerprinting of pectin. ..................................................................................... 30
1.4 Pectin as a functional food ingredient ......................................................................................... 32
1.4.1 Gelling ............................................................................................................................... 32
1.4.2 Stabilization of proteins ...................................................................................................... 33
1.5 Bioactivity of pectin. .............................................................................................................. 34
1.5.1 Prebiotic potential .............................................................................................................. 34
1.5.2 Anti-cancer properties, heavy metal detoxification and bacterial adhesion. ......................... 36
15

16
1.6 Pectin production ....................................................................................................................... 37
1.6.1 Traditional methods used in the industry ............................................................................. 37
1.6.2 Enzymatic extraction .......................................................................................................... 39
2. Enzymatic catalysis for efficient release of pectin with functional properties. ................................. 41
2.1 Hypotheses and objectives ........................................................................................................... 41
2.2 Key points ................................................................................................................................... 41
2.3 Experimental considerations ........................................................................................................ 41
2.4 Conclusions ................................................................................................................................. 42
3. Application of FTIR, carbohydrate microarrays and multivariate data analysis for prediction and
characterization of enzyme- versus acid-extracted pectin. ...................................................................... 53
3.1 Hypotheses and objectives...................................................................................................... 53
3.2 Key points .............................................................................................................................. 53
3.3 Experimental considerations ................................................................................................... 53
3.4 Conclusions ........................................................................................................................... 54
4. Prebiotic potential of sunflower pectin fractions ................................................................................. 79
4.1 Hypotheses and objectives ........................................................................................................... 79
4.2 Key points ................................................................................................................................... 79
4.2 Experimental considerations ........................................................................................................ 79
4.4 Conclusions ................................................................................................................................. 80
5. Concluding remarks ......................................................................................................................... 103
6. References ....................................................................................................................................... 105
16

17
1. Introduction
The refinery of biomass to recover labile, value-added components is an important future requirement for
the utilization of side-streams from the agricultural and dairy industries. Presently, most of the processes
using biomass are exclusively focused on the total hydrolysis of polymers to form fermentable sugars for
bio-ethanol production. Commercial enzymes are able to break down most plant cell wall materials, but
there is very little incentive to generate selective processes with several product lines, where value-added,
labile products could be recovered before residual biomass is used for bioethanol production. It is,
however, not a simple task to integrate an up-stream process, where labile polymers like hydrocolloids
could be harvested before degradation of the residual biomass to mono-saccharides.
The current pectin production method employs high temperature (70-90°C) in combination with acidic
hydrolysis using nitric, hydrochloric or sulfuric acid. The pH is between 1.5 and 2.5, and the reaction is
continued for several hours (Rolin, Nielsen, & Glahn, 1998). The main disadvantage of acid hydrolysis
technology, and one which raises environmental concerns, is the generation of large volumes of acidic
effluent that require further treatment before release. Moreover, harsh acidic treatment causes
depolymerization and deesterification of the pectin chains. Enzymatic extraction of pectin seems more
advantageous in terms of energy consumption and waste management. The enzymatic process is usually
carried out at a pH between 3-5 and temperatures around 50°C, which is more beneficial in terms of
economy and environmental impact. There have been a few attempts to extract pectin with enzymes
described in the literature. They involved the use of endo-arabinases and endo-galactanases (Thibault et
al., 1998), cellulases together with proteases (Zykwinska et al., 2008), cellulase together with pectin
esterase (Ptichkina, Markina, & Rumyantseva, 2007) or only cellulase (Yuliarti et al., 2011). The
problems associated with enzymatic extraction were, however, low pectin yields, low molecular weights
of the product and low galacturonan content.
Pectin production is complex and therefore its optimization is a long process, because the evaluation of
the final product quality is accomplished at the end of the procedure, employing time-consuming off-line
laboratory tests. Therefore, it would be of interest to pectin producers to shift the quality control upstream
in the process. Nowadays, there is a tendency to apply Process Analytical Technologies (PAT) for on-
line process monitoring and control. PAT involves the use of suitable sensor technologies, statistical
tools, e.g. chemometrics, and feedback process control to understand the impacts of different variables on
17

18
product quality. Such an approach is desirable for the production of pectin, which is currently based on
post-process product testing.
Although the major applications of pectin still include gelling, thickening and stabilization, other novel
applications employ its prebiotic potential, anti-cancer properties and heavy metal detoxification ability
(Hotchkiss et al., 2009).The field of prebiotics is expanding rapidly and new prebiotic candidates are
constantly being investigated. Prebiotic ingredients are developed with the help of enzymes, modern
molecular methods and advanced process knowledge. By exploring new prebiotic sources, molecules with
new functionalities are found. One such candidate could be sunflower pectin, present in head and stalk
residues of sunflower plants after removal of oil-rich seeds. The head and stalk residue wastes contain
6.5% proteins, 3.1% lipids, and 71.9% carbohydrates, such as cellulose, hemicelluloses and pectin
(Miyamoto & Chang, 1992) that could be further extracted. Sunflower pectin content in the heads varies
between 15 and 24% and after extraction the pectin contains between 29 and 40% methyl groups (Lin,
Sosulski, & Humbert, 1978; Miyamoto & Chang, 1992), which makes it an interesting alternative to
traditional citrus or apple pectins and a potential prebiotic candidate.
18

19
1.1 Hypotheses and objectives
Hypotheses:
1. Enzymes can catalyze the release of pectin with superior yields, viscosities and functional
properties to those of acid extracted pectin.
2. FTIR and carbohydrate microarrays are useful tools for the prediction of pectin yields during
pectin production processes and for characterization of crude pectin extracts.
3. Prebiotic compounds can be derived from sunflower pulp and their sizes are of importance for
their prebiotic responses.
Specific objectives:
1. Optimize enzymatic catalysis for the release of lime pectin. Test the applicability of the product
pectin as a food ingredient and compare its performance with pectins obtained in the traditional
way.
2. Apply FTIR and carbohydrate microarrays combined with chemometrics for characterization of
crude enzymatically extracted pectin versus acidically extracted pectin.
3. Release the pectic substances from sunflower pulp in high yields and test their biofunctionality by
using in vitro fecal fermentations.
19

20
1.2 Plant cell wall architecture
The cell walls of dicotyledonous plants consist of primary and secondary walls. Primary walls, formed in
developing cells, are predominantly composed of cellulose, hemicellulose, and pectin. They are non-
lignified and their thickness in mature cells depends on the cell type. Secondary walls are deposited on the
primary walls after the cells are fully expanded and are often rigidified by lignin. The interfacial layer
between adjacent cells, the middle lamella, is also typically lignified (Harris & Stone, 2008).
1.2.1 Structural domains of plant cell walls Primary cell walls consist of three interacting structural domains: cellulose-xyloglucan frameworks (about
50% of the wall mass), pectic polysaccharides (about 30% of the total mass) and structural proteins
(Carpita & Gibeaut, 1993). A schematic representation of a cell wall is presented in Figure 1.
Cellulose-xyloglucan framework contains a network of cellulose microfibrils, which are linear chains of
1,4- -linked D-glucose in the form of long crystals (Carpita & Gibeaut, 1993). The 1,4- -linked D-
glucose chains are typically several thousand units long (Marx-Figini, 1982; Timpa, 1991) and begin at
different places within a microfibril. Cellulose microfibrils are interlocked with xyloglucan
polysaccharides, which consist of linear chains of 1,4- -D-glucan. The 1,4- -D-glucan chains are
frequently substituted with xylosyl units at the 0-6 position and less frequently substituted with -D-
galactose and -L-arabinose at the 0-2 of xylosyl units (Carpita & Gibeaut, 1993).Other non-cellulosic
polysaccharides, such as gluco- and galactoglucomannans, galactomannans, 1,3- -D-glucans, and
glucuronoarabinoxylans, are found in much lower amounts in the cell wall (Maltby et al., 1979).
Pectic networks contain three major forms of pectin: homogalacturonan (HG), rhamnogalacturonan I
(RGI), and rhamnogalacturonan II (RGII). The major component of all the forms of pectin is a linear
chain of D-galacturonic acid units, in which varying proportions of the acid groups are present as methyl
esters (more detailed information in Chapter 1.3).
Proteins make up to 10% of the dry weight of the wall and include enzymes, signaling molecules and
structural proteins, which are quantitatively the most significant. Extensin is probably the best-described
structural protein in plants and consists of a repeating serine-hydroxyproline, and tyrosine-lysine-tyrosine
sequences (Harris & Stone, 2008).
20

21
Figure 1. Schematic representation of the spatial arrangements of the polymers in the cell walls of flowering plants adapted from (A) Carpita & Gibeaut, (1993); (B) McCann & Roberts (1991).
1.2.2 Enzymatic degradation of the cell walls Efficient conversion and utilization of plant cell wall carbohydrates is of major importance in
biotechnology. The process of plant cell wall degradation is complicated due to the complexity of cell
walls and the variety of bond types which need to be broken. Therefore, complex mixtures of degradative
enzymes are needed to break down the polysaccharide structures. The extent of recalcitrance of cell walls
to degradation by enzymes depends on the ability of enzymes to access the substrates in the cell walls
(Harris & Stone, 2008). Accessibility is related to the surface area of the cell wall that is exposed to the
hydrolytic agent and the complexity of the cell wall. The presence of lignin has a particularly strong effect
on the digestibility of plant cell walls. In most cases, non-lignified walls are highly degradable, while
lignified walls are less susceptible to degradation. Environmental factors affecting plant growth, such as
lack of nutrients, temperature deviations or water shortage, also impact cell wall digestibility (Buxton &
Casler, 1993).
Polysaccharides present in plant cell walls are degraded by the plant's endogenous enzymes during fruit
ripening, seed germination and cell wall extension. Enzymes associated with the biochemical processes of
cell wall degradation in the plant include endo- and exo-polygalacturonases (endo- and exo-PG),
cellulase, glycosidases, and pectin methyl esterases (PMEs) (Ward& Moo-Young, 1989). During
degradation, pectic substances undergo changes, such as demethylation, deacetylation and shortening of
the polymer chain. Many extracellular enzymes that degrade plant cell walls are produced by industrial
A B
21

22
microorganisms, particularly fungi, which grow on complex plant materials, namely Aspergillus,
Penicillium, Rhizopus and Trichoderma sp. (Ward & Moo-Young, 1989). Enzyme production processes,
which utilize industrial microorganisms are optimized to produce a particular enzyme activity and
products are standardized with respect to one or a small number of activities. As a result, side activities
are present in commercial enzyme preparations and are often important for effective cell wall
degradation. The modes of action of enzymes performing side activities are, however, often not known
and not optimized.
Although there have been significant advances in the structural analysis of plant cell wall-degrading
enzymes, still only a small percentage of the enzymes in CAZy database are characterized biochemically
and structurally (Gilbert, 2010). The biochemical properties of plant cell wall-degrading enzymes are
difficult to evaluate due to the chemical complexity of the cell wall and the requirement for a hierarchical
and synergistic hydrolytic processes.
1.3 Structural features of pectin
Pectic polymers are the most complex and diverse group of cell wall polysaccharides and have a range of
functions in plant tissue including: size and shape determination, integrity control, water holding capacity,
ion transport, ‘cementing’ and cell adhesion (Basic, Harris, & Stone, 1988; Rees, & Wright, 1969;
Voragen, Beldman, & Schols, 2001; Willats, McCartney, Mackie, & Knox, 2001). The term ‘pectic
substances’ is derived from the Greek ‘pektikos’ meaning to congeal or solidify (Willats et al., 2006).
Pectic substances include pectic acids esterified with methanol, the de-esterified pectin form and its salts,
as well as neutral polysaccharides, such as arabinans, galactans and arabinogalactans. The term
‘protopectin’ denotes the native form of pectin in the cell wall, before its extraction in a ‘degradative’ way
which affects the structure (Voragen, Pilnik, Thibault, Axelos, & Renard, 1995).
1.3.1 Structural domains of pectin
1.3.1.1 Galacturonans
Homogalacturonan (HG) is the dominant type of pectin in lime peel and consists of a linear chain of -
1,4-linked galactopyranosyluronic acid (GalA) residues, being partly methyl-esterified at O-6 position
and sometimes acetyl-esterified at O-2 or O-3 (Voragen et al., 2001). The presence of HG-domain is
crucial for gel formation (Voragen et al., 1995). Partly esterified or non-esterified HG domains form the
22

23
so called ‘smooth regions’ of the pectin chain, whereas the substituted domains form the ‘hairy regions’
(Figure 2).
Figure 2.Schematic representation of pectin molecule with smooth (grey) and hairy (black) regions.
Rhamnogalacturonan II (RGII) is composed of a linear backbone chain of GalA, substituted with L-Rha,
D-Gal (galactose) and many unusual sugars, such as apiose, 3-O-methyl-L-fucose, 2-O-methyl-D-xylose,
3-C-carboxy-5-deoxy-L-xylose, 3-deoxy-D-manno-octulosonic acid and 3-deoxy-D-lyxo-heptulosaric
acid (Mohnen, 2008; Voragen et al., 2001). The side chains of RGII consist of 12 different types of sugars
with over 20 different linkages. The structure of RGII, the most structurally complex pectin domain, is
largely conserved across many plant species. Cross-linking between RGII chains of two adjacent pectin
molecules increases the integrity of the pectin network (Mohnen, 2008).
Xylogalacturonan is a homogalacturonan substituted at O-3 with a -linked D-xylose, which is in turn
occasionally substituted at O-4 with an additional -linked xylose (Zandleven, Beldman, Bosveld, Schols,
& Voragen, 2006). The proportion of xylopyranosyl residues to galactosyluronic acid residues ranges
from 40 to 90% (Mohnen, 2008). The galacturonan backbone may also be methyl esterified independently
of the xylose substitutions. Xylogalacturonans in plant tissues are associated with functions including
storage and reproduction (Schols, & Voragen, 1996).
Apiogalacturonans are homogalacturonans with mono- and di- D-apiose substitutions. Apiogalacturonans
have previously been isolated from the cell walls of the aquatic duckweed and sea grass (Ovodov, 1975).
1.3.1.2 Rhamnogalacturonan I
RGI, composed of a repeating disaccharide units: 1,2-L-Rha-1,4-D-GalA (where Rha denotes rhamnose),
is abundantly substituted by arabinan, galactan and arabiongalactan side chains, predominantly at the O-4
position of rhamnose (Schols, & Voragen, 1994; Yapo, Lerouge, Thibault, & Ralet, 2007), as presented in
Figure 3A. RGI backbone may contain up to 300 rhamnosyl and 300 galactosyluronic acid residues
(Voragen et al., 2001).
23

24
Figure 3.RGI and its side chains. Figure adapted from Harris and Stone (2008).
1.3.1.3 Other structural elements: arabinans and arabinogalactans
Arabinans consist of a backbone of 1,5-linked -L-arabinose residues with -L-arabinose substitutions
attached at the 0-2 and 0-3 positions to about one-third of the backbone (Beldman et al., 1997). They can
be unbranched, substituted with single arabinose units, or substituted with short 1,3-linked -L-Ara
chains
Arabinogalactans occur in two structurally different forms: arabinogalactan type I and type II.
24
25
Type I is a linear chain of 1,4-linked -D-galactose, containing up to 25% -L-arabinose residues 1,5-
linked in short side chains, connected predominantly to O-4 of the rhamnosyl residues (Voragen et al.,
2001). Single galactose substitutions at O-6 have also been found. Pectin with type I arabinogalactans
have been isolated from citrus, potato, soybean, lupin, apple, onion, kiwi, tomato and cabbage (Voragen
et al., 1995). Arabinogalactan type II contains ramified chains of -D-galactose, joined predominantly by
1,3-linkages in the interior chains, and mainly by 1,6-linkages in the exterior chains. Type II
arabinogalactan is a component of arabinogalactan proteins (Basic et al., 1988).
Although it is generally accepted that HG and RGI domains form the ‘backbone’ of pectin, as shown in
Figure 4A, an alternative structure has been proposed by Vincken et al. (2003). In this model HG is a long
side chain of RGI (Figure 4B).
Figure 4. Schematic representations of the conventional (A) and alternative (B) structures of pectin. Figure adapted from Willats et al. (2006).
25

26
1.3.2 High ester, low ester and amidated pectins
The presence of non-sugar substituents, methyl and acetyl groups, is a very important feature of pectic
polymers, affecting their functionalities. Pectin producers traditionally divide pectin polymers into high-
and low-methoxyl pectins (HM and LM pectins). The boundary level between the two types is 50%,
meaning that if more than 50% of a pectins carboxyl groups are methylated, it is termed HM pectin, and if
this proportion is below 50%, it is LM pectin.
The degree of acetylation (DAc) of pectin is defined as the percentage of galacturonic acid residues in the
pectin that are esterified with acetyl groups. Acetyl groups are present in very low amounts in HG from
apple and citrus, but in much higher amounts in HG from sugarbeet and potato. Acetylated pectin does
not have the ability to form gels with Ca2+ ions, but possess emulsion-stabilizing properties (Voragen et
al., 2001).
LM pectins are often chemically amidated by manufacturers to change the polymer functionality. The
degree of amidation (DA) is then defined as a percentage of amidated galacturonic acid residues within
pectin (Voragen et al. 1995).
1.3.3 Molecular weight (Mw) and aggregation
The molecular weight (Mw) of pectins depends on the raw material and the conditions applied during
production. Pectin samples are heterogeneous and the molecules have a tendency to aggregate, which
makes determination of their molecular weights difficult. Viscosimetry is often employed for
determination of molecular weight of pectin samples. The results usually fall in the range 50 to 150 kDa.
Other techniques, such as light scattering, often result in apparent molecular weights of around 1000 kDa,
as they are more sensitive to the presence of aggregates (Sawayama, Kawabata, Nakahara, & Kamata,
1988; Sorochan, Dzizenko, Bodin, & Ovdov, 1971; Fishman, Chau, Kolpak, & Brady, 2001).
Additionally, pectin samples often contain a small fraction of high Mw pectins, which impact light
scattering measurements but have almost no effect on viscosity (Berth, 1988).
The phenomenon of pectin aggregation in solution was first recognized more than 40 years ago
(Sorochan, Dzizenko, Bodin, & Ovodov, 1971). Pectin molecules display a tendency to aggregate when
dispersed in water. Whether pectin aggregates depends on ionic strength and pH of the solution and the
presence of solvent additives (Sorochan et al., 1971; Sawayama, Kawabata, Nakahara, & Kamata, 1988).
26

27
Aggregation is promoted by complex forces resulting from a combination of gel formation, precipitation
and solubilization mechanisms (Yoo, Fishman, Savary, & Hotchkiss, 2003), and the presence of
aggregates is responsible for the increase of apparent size of pectin molecules. Pectin aggregates have
been investigated by many authors using electron microscopy (Hanke & Northcote,1975; Fishman,
Cooke, Hotchkiss, & Damert, 1993), membrane osmometry, end-group analysis (Fishman, Pepper, &
Pfeffer, 1986), and high performance size exclusion chromatography (HPSEC) (Fishman, Chau,
Hoagland, & Ayad, 2000).
Using electron microscopy, Fishman et al. (1992) observed aggregated spherical network structures in
peach pectin water solutions, which could be dissociated into linear structures by the addition of the
hydrogen bond breakers, NaCl and glycerol (Fishman et al., 1993). Cárdenas, Higuera-Ciapara and
Goycoolea (1997) reported an increased Mw of cactus mucilage (referred to as a pectin polysaccharide)
due to the formation of large macromolecular aggregates that were unable to dissociate during permeation
through the gel beads during SEC-HPLC. Fishmanet al. (2001) reported that a series of commercial
pectins had higher Mws when dissolved in NaNO3 than in LiAc/HAc, when Mws were measured by
HPSEC with on-line light scattering. The increased Mws in NaNO3 suggest that pectins were more
aggregated in NaNO3 than in LiAc/HAc.
Yoo, Fishman, Hotchkiss, & Lee (2006) investigated the intrinsic viscosities of high and low methoxy-
pectins at different salt concentrations and observed the presence of stronger aggregates in the case of LM
pectin. Stronger aggregation by LM pectins was explained by the fact that the primary driving force for
aggregation is hydrogen bonding and the larger number of carboxyl groups in LM-pectin than in HM-
pectin produced more hydrogen bonds and therefore stronger aggregates. The authors also distinguished
two types of pectin aggregation: i) lateral chain aggregation of LM-pectin at concentrations lower than
0.0004 g/ml, which was interrupted by high salt concentration, and ii) end to end chain aggregation at a
concentration above 0.0004 g/ml leading to gelation. Other authors suggested that the increase in Mw of
LM pectin occurred due to transacylation activity of PME (Jiang, Lai, Chang, & Chang, 2001).
Oakenfull & Scott (1984) suggested that the primary forces responsible for HM pectin aggregation are
hydrogen and hydrophobic bonding. Paoletti, Cesaro, Delben, & Ciana (1986) reported the formation of
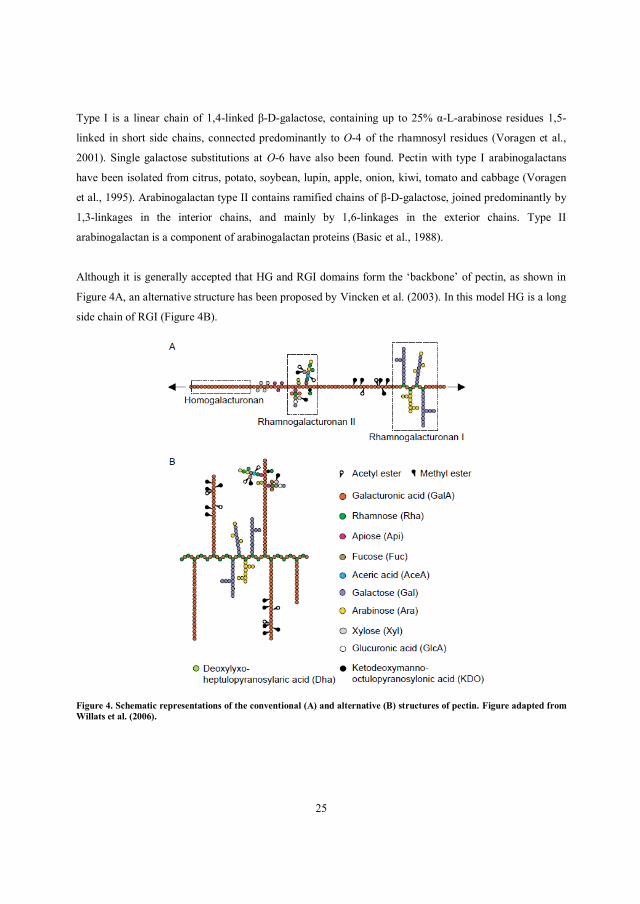
chain-chain aggregates, especially at low pH. Sawayama et al. (1988) observed a 25 fold increase in the
Mw of polygalacturonic acid accompanying a decrease in pH from 4.4 to 2.35 (Figure 5).
27
28
Figure 5.Effect of pH on the Mw of pectins with different functional groups. Pectin-NF is a HM pectin and the other three are low ester, obtained from pectin-NF by ammonia (ALM), acid (CLM) and pectin methyl esterase from Aspergillus japonicas (ELM) deesterification. PGA denotes polygalacturonic acid. Figure adapted from Sawayama et al. (1988).
1.3.4 Stability Conditions that render pectin stable or unstable are important when considering pectin extraction
processes. The conditions used during extraction must allow pectin molecules to remain stable in order to
prevent damage during the extraction process. Pectin in solution is most stable at pH between 3 and 4. At
temperatures above 60°C and pH below 5, glycosidic bonds at the non-reducing end of a metylated
galacturonic acid residue undergo -elimination and the pectin chains become depolymerized. Therefore,
HM pectins are quite vulnerable to high pH. At pH below 3, even at low temperatures, ester linkages are
broken and neutral sugar side chains are hydrolyzed. Low pH and elevated temperatures cause hydrolysis
of the galacturonan backbone (Albersheim, Neukom, & Deuel, 1960; May, 1990).
1.3.5 Pectin-degrading enzymes Pectin is susceptible to enzymatic degradation by endogenous and exogenous enzymes (Figure 6).
Endogenous enzymes can cause changes in the plant during ripening and storage. Exogenous microbial
and fungal enzymes disintegrate pectin and play a role in plant pathology (Voragen et al., 1995). Once the
pectin containing fruit is processed, the pectin is under attack of those enzymes. Therefore, it is essential
to either release the pectin fast from fresh materials, or to stabilize the pulp or pomace by drying.
28

29
Figure 6. Enzymatic degradation of pectin by endo-polygalacturonase, pectin lyase and pectin methyl esterase. Figure adapted from Lundt, Madsen, Christensen and Mikkelsen (2002).
The main enzymes that catalyze the breakdown of HG pectin domains are listed in Table 1.
Table 1.Pectolytic enzymes active against pectin HG domain.
Enzyme EC number Substrate Action
Polygalacturonase EC 3.2.1.15
EC 3.2.1.67
LM pectins, pectic
acid
Hydrolysis of glycosidic bonds
adjacent to free carboxyl group
Pectate lyase EC 4.2.2.2
EC 4.2.2.9
LM pectins, pectic
acid
-eliminative breakdown of
glycosidic bonds adjacent to free
carboxyl group
Pectin lyase EC 4.2.2.10 HM pectins -eliminative breakdown of
glycosidic bonds adjacent to
methoxylated carboxyl group
Pectin methyl
esterase
EC 3.1.1.11 Methylated HG Hydrolysis of ester bonds
Pectin
acetylesterase
EC 3.1.1.- Acetylated HG Hydrolysis of ester bonds
29

30
Polygalacturonases can be divided into endo- and exo- acting. Endo-polygalacturonases act inside the HG
chain, whereas exo-polygalacturonases act from non-reducing end of the HG chain and release monomers
and dimers of galacturonic acid (Voragen, 1995). Enzymes active in the degradation of RGI domains of
pectins include rhamnogalacturonan hydrolase (EC 3.2.1.-), rhamnogalacturonanlyase (EC 4.2.2.-) and
rhamnogalacturonan acetyl esterase (EC 3.1.1.-). Other enzymes, including galactanases and arabinases,
act towards pectin side chains.
1.3.6 Enzymatic fingerprinting of pectin The availability of purified, highly specific enzyme preparations has significantly contributed to the
structural characterization of pectins by so called enzymatic fingerprinting. Enzymes can be used to
disintegrate the long and highly complex pectin chains at certain positions, and the generated products can
be structurally characterized by e.g. chromatography and/or mass spectrometry (MS) (Limberg et al.,
2000a; Körner et al., 1999).
Using enzymatic fingerprinting Limberg et al. (2000a) studied the de-esterification mechanisms of fungal
and plant pectin methyl esterases (f- and p-PME) together with base de-esterification. Pectins with
different distributions of methyl groups were produced and enzymatically digested. The products were
analyzed using matrix assisted laser desorption ionization mass spectrometry (MALDIMS) and high-
performance anion-exchange chromatography with pulsed amperometric or UV detection (HPAEC–
PAD:UV). P-PME and f-PME were shown to produce significantly different deesterification patterns, as
revealed by the analysis of the oligomers after digestion. The action of p-PME resulted in the consecutive
removal of a number of neighboring methyl ester groups, whereas f-PME removed methyl groups in a
random fashion. MALDIMS identified the preferred substrates for pectin lyase (fully methyl esterified
HG) and polygalacuronase (HG without any methyl esterification).
In a subsequent publication, Limberg et al. (2000b) developed a method for pectin characterization based
on endo-PG and exo-PG digestion and subsequent quantification of the amount of galacturonic acid
residues in block sequences. The authors showed that endo-PG and exo-PG only acted between two free
galacturonic acid units (Figure 7). Measurement of the increase in galacturonic acid residues in block
sequences during de-esterification provided an insight into different methods used for de-esterification.
30

31
Figure 7. Specificities of pectinolytic enzymes on a partly methylesterified HG backbone. Figure adapted from Limberg et al. (2000b).
Körner, Limberg, Christensen, Mikkelsen, and Roepstorff (1999) digested partially methyl-esterified
pectin with PL, endo-PG, and exo-PG and studied the esterification patterns of the obtained oligomers by
collision-induced dissociation in a nanoelectrospray ionization ion trap mass spectrometer. Methyl
esterification patterns provided insight into substrate specificities of the enzymes used for digestion.
Remoroza et al. (2012) degraded sugarbeet pectin using endo-PG, PL, f-PME and RG-I degrading
enzymes. Hydrophilic interaction liquid chromatography (HILIC) with online electrospray ionization ion
trap mass spectrometry (ESI-IT-MSn) and evaporative light scattering detection (ELSD) were used for
separation, identification and quantification of the released oligomers. MS enabled elucidation of the
structures of the acetylated oligomers eluted from the HILIC column. The presence of methyl and acetyl
groups reduced the interaction of the oligomers with the HILIC column, as compared with the
unsubstituted oligomers.
Since pectin is highly complex and heterogeneous, methods like enzymatic fingerprinting play an
important role in the identification of structural motifs of pectin and elucidation of the overall pectin
structure. Furthermore, such techniques can be applied for prediction of the functional properties of
pectins.
31

32
1.4 Pectin as a functional food ingredient
Pectin is used in the food industry as an ingredient due to its functional properties including enabling
gelling, providing viscosity, stabilizing proteins and acting as a fat mimetic (Voragen et al., 1995;
Voragen et al., 2001; Willats, Knox, & Mikkelsen, 2006). The major applications of pectin in the food
industry include gelling and thickening of jams, jellies, bakery fillings, confectionery and fruit
preparations for dairies, as well as stabilization of milk and fruit beverages (Rolin, Nielsen, & Glahn,
1998). Other novel pectin applications employ its prebiotic potential, anti-cancer properties and heavy
metal detoxification ability (Hotchkiss et al., 2009). All of the above-mentioned features result in a
constant increase in worldwide pectin consumption (Ptichkina, 2007).
1.4.1 Gelling Traditionally, gelation is considered in the contexts of HM and LM pectins, but in fact there are many
gelation mechanisms that act together to form a continuous three-dimensional network of cross-linked
pectin molecules. Apart from the degree of methylation, gelation is also dependent on the distribution of
the ester groups along the chain and the average pectin Mw. Other factors such as solution pH, ionic
strength, sugar content and temperature also play a role in gel formation (Thakur, Singh, & Handa, 1997).
HM pectins gel at pH < 3.5 and in the presence of at least 55% sugar. Addition of sugar reduces water
activity in the system and promotes hydrophobic interactions between methyl ester groups (Oakenfull &
Scott, 1984). Low pH decreases the repulsion between pectin molecules and supports the formation of
hydrogen bonds between pectin chains. The increase in hydrophobic interactions and hydrogen bonds,
presented in Figure 8, is responsible for gel formation.
Figure 8. Hydrogen bonds (A) and hydrophobic interactions (B) responsible for gelling of HM pectin.
32
33
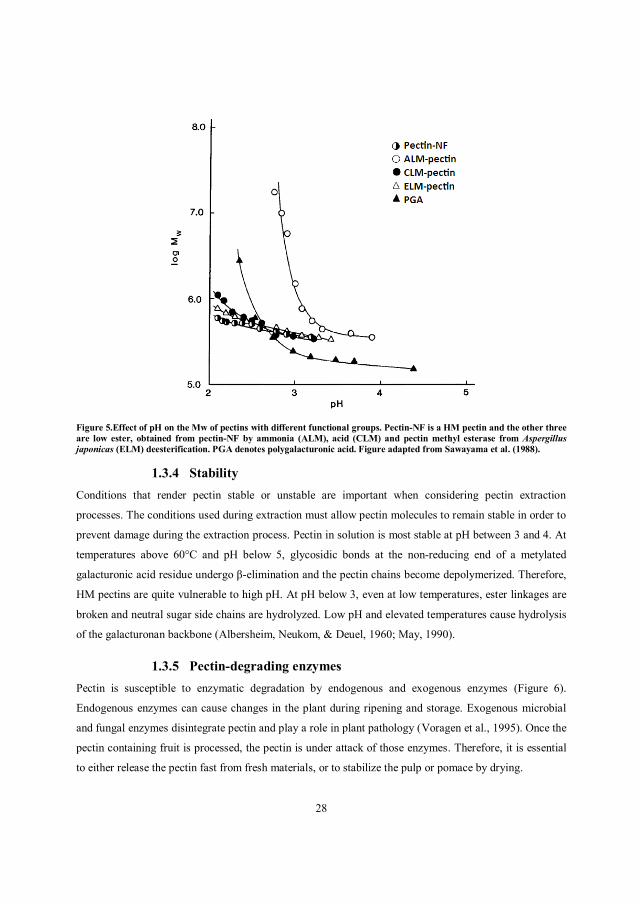
In LM pectins, gelation is initiated by the formation of calcium bridges between free carboxyl groups (in
addition to other mechanisms). The junction zones form the so called ‘egg boxes’, as shown in Figure 9
(Grant, Morris, Rees, Smith, & Thom, 1973). The pH of the gel could be higher than in case of HM
pectins, as only the dissociated carboxyl groups form calcium bridges.
Figure 9. Schematic representation of an ‘egg box’ gelling of LM pectin. Black dots represent Ca2+ ions.
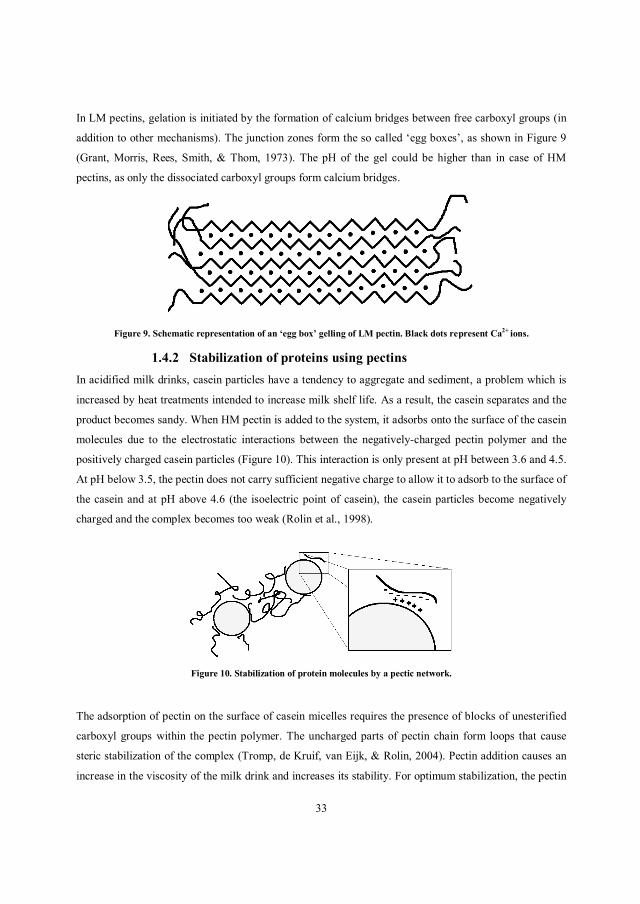
1.4.2 Stabilization of proteins using pectins In acidified milk drinks, casein particles have a tendency to aggregate and sediment, a problem which is
increased by heat treatments intended to increase milk shelf life. As a result, the casein separates and the
product becomes sandy. When HM pectin is added to the system, it adsorbs onto the surface of the casein
molecules due to the electrostatic interactions between the negatively-charged pectin polymer and the
positively charged casein particles (Figure 10). This interaction is only present at pH between 3.6 and 4.5.
At pH below 3.5, the pectin does not carry sufficient negative charge to allow it to adsorb to the surface of
the casein and at pH above 4.6 (the isoelectric point of casein), the casein particles become negatively
charged and the complex becomes too weak (Rolin et al., 1998).
Figure 10. Stabilization of protein molecules by a pectic network.
The adsorption of pectin on the surface of casein micelles requires the presence of blocks of unesterified
carboxyl groups within the pectin polymer. The uncharged parts of pectin chain form loops that cause
steric stabilization of the complex (Tromp, de Kruif, van Eijk, & Rolin, 2004). Pectin addition causes an
increase in the viscosity of the milk drink and increases its stability. For optimum stabilization, the pectin
33

34
needs to have a high Mw and high degree of esterification. The distribution of methyl esters is also
important. Too large blocks of unesterified galacturonic acid tend to interact with ions rather than
proteins, leading to increased viscosity and gelation. Therefore, LM pectins are not useful for this
application. Moreover, it has been found that up to 90% of the pectin added to the milk drink is not
interacting directly with casein, but is still necessary to produce a stable drink during homogenization.
This is the so-called ‘serum pectin’ (Tromp et al., 2004).The suitability of pectin for stabilization of
acidified milk drinks is assessed by the measurement of sediment as a function of pectin dose (Figure 11).
Figure 11.Pectin and milk stabilization. (A) Visible sedimentation of casein particles in an acidified milk drink with and without pectin (figure adapted from Lundt et al., 2002). (B) The assessment of the suitability of pectin for stabilization of proteins in acidified milk drinks. Milk drinks with different pectin concentrations are prepared and they are assessed, after a defined storage period, for the presence of sediment. The lowest pectin concentration, at which no sediment is observed, is defined as the optimum pectin dose.
1.5 Bioactivity of pectin Pectins have been reported to exert a positive impact on the human gastrointestinal tract, due to their
water-holding capacities and gelling abilities (Roberfroid, 1993). The positive effects of pectin on the
human gastrointestinal tract include slowing down gut transit and delaying gastrointestinal emptying
(Flourineet al., 1985; Spiller et al., 1980), as well as decreasing glucose absorption (Jenkins et al., 1977).
Pectin passes through the upper gastrointestinal tract to the large intestine in its intact form and is
extensively fermented in the colon (Olano-Martin, Mountzouris, Gibson, & Rastall, 2001). Low ester
pectins have been shown to be degraded faster than high ester pectins (Dongowski & Lorenz, 1998).
1.5.1 Prebiotic potential A prebiotic is a non-digestible food ingredient that is able to selectively enhance the growth and activity
of the gut microflora that benefits the host (Scantlebury Manning, & Gibson, 2004; Thammarutwasik et
al., 2009; Wichienchot et al., 2011). These beneficial effects include immunostimulation, improved
mineral absorption, cholesterol lowering, vitamin synthesis and colon cancer prevention. Typical
34
35
prebiotics are short-chain carbohydrates, such as fructo-oligosaccharides (FOS, produced from fructose
via biosynthesis or from inulin via hydrolysis) or polysaccharides, such as inulin or levan (Gibson, 1995).
Industrial prebiotics are either naturally occurring oligosaccharides or are produced by enzymatic
degradation of raw materials.
Evaluation of prebiotic potential is based on the selective stimulation of growth of beneficial bacteria,
such as Bifidobacterium and Lactobacillus strains, and/or a decline in the growth of pathogenic bacteria
like Clostridium (Olano-Martin, Gibson, & Rastall, 2002; Hotchkiss, Olano-Martin, Grace, Gibson, &
Rastall, 2003; Holck et al.2011a; Thomassen, Vigsnæs, Licht, Mikkelsen, & Meyer, 2011). Previous
studies have focused on the modification of the ratio between Bacteroidetes and Firmicutes, two
dominant human intestinal phyla, which may be related to the development of obesity (Licht et al. 2010;
Holck et al. 2011b). Studies of prebiotic potential have been conducted with both pure cultures and with
human mixed fecal cultures.
Pectins have previously been investigated for their prebiotic potentials. Production of pectin-derived
oligosaccharides from plant biomass typically involves pretreatment of cell-wall material, extraction of
pectin polysaccharides, generation of oligosaccharides and their purification by chromatography (Holck et
al., 2011a). Pectins were found to promote the growth and activity of bifidobacteria, inhibited pathogen
growth and caused bowel cancer cells apoptosis (Hotchkiss, Olano-Martin, Grace, Gibson, & Rastall,
2003). Olano-Martin, Gibson and Rastall (2002) found that oligosaccharides derived from LM and HM
pectins had more prebiotic activity than the pectins that they were derived from. Moreover, LM
oligosaccharides were more prebiotic than HM oligosaccharides. Furthermore, pectin size also had an
effect on prebiotic properties, indicating that the prebiotic potential of pectin could be improved by
hydrolysis.
Holck et al. (2011a) investigated the prebiotic potential of oligosaccharides derived from sugar beet
pectin. A series of highly purified homogalacturonides and rhamnogalacturonides were prepared by step-
wise enzymatic degradation. The ratio of Bacteroidetes to Firmicutes, which is believed to play a role in
the development of obesity, was different during in vitro fermentations using homogalacturonan oligos
with DP4 and DP5, indicating that a small difference in the structure of the prebiotic affects the biological
activity of the phyla. In another study, Holck et al. (2011b) selectively stimulated bifidobacteria in in vitro
fermentations using feruloylated and the non-feruloylated long-chain arabino-oligosaccharides.
35

36
Thomassen, Vigsnæs, Licht, Mikkelsen, & Meyer (2011) released fibers from potato pulp and examined
their prebiotic effects. Two broad fractions were obtained: 10–100 kDa and >100 kDa, both were found to
be more bifidogenic than the well-established prebiotic, FOS. Moreover, the densities of Bifidobacterium
spp. and Lactobacillus spp. increased 2–3 times, compared to FOS, in the case of fibers with molecular
masses above 100 kDa.
1.5.2 Anti-cancer properties, heavy metal detoxification and bacterial
adhesion. According to several studies, pectin-derived oligosaccharides have the capacity to prevent a number of
severe chronic diseases. Low Mw pectin has been shown to induce apoptosis in colon and prostate cancer
cells (Olano-Martin et al., 2003a; Jackson et al., 2007), as well as increased the life quality and decreased
pain in many types of cancer (Azemar et al., 2007). Reduction of pectin Mw was crucial for its anti-
cancer properties, therefore commercial pectin preparations that are currently available on the market do
not possess anti-cancer activity.
In addition to anti-cancer activity, pectins have been shown to aid heavy metal detoxification. It has been
demonstrated that the consumption of modified citrus pectin by Chinese children, hospitalized for toxic
levels of lead resulted in decreased levels of lead in the blood and increased urinary excretion of lead
(Zhao et al., 2008). Additionally, urinary excretion of toxic metals was not accompanied by the release of
essential minerals (Eliaz et al., 2006).The presence of RGII in the modified citrus pectin was believed to
be responsible for the selective chelation of toxic metals in the body. Therefore, pectin can be a safe
heavy metal chelating agent, especially for children, who are most vulnerable to the long-lasting effects of
heavy metal exposure.
Pectins have also shown beneficial bacterial adhesion properties. HG pectin domains have been reported
to prevent adhesion of pathogenic strains of E. coli to intestinal uroepithelial cells. Dimers and trimers of
galacturonic acid were the best pathogen blocking agents (Guggenbichleret al., 1997). Furthermore,
pectins and pectic-oligosaccharides, derived using enzymatic hydrolysis, were able to inhibit Shiga-like
toxins produced by pathogenic E. coli O157:H7 (Olano-Martin et al., 2003b).
Even though the abovementioned studies contain promising results in relation to the medical applications
of pectin, better understanding of the structure-function relationships of pectins is required to explain the
bioactive effects of pectin (and derived oligomers), which may be difficult due to their complexity and
heterogeneity.
36

37
1.6 Pectin production
Pectin can be released from raw materials by water, chelating agents, alkalis, acids and enzymatic
catalysis. Pectins extracted in different conditions and from different sources will differ not only in the
degree of esterification, but also in GalA and neutral sugar contents, as well as in Mw.
Citrus peel and apple pomace, by-products from juice manufacturing, are the most commonly used raw
materials for pectin production. Sugar beet pulp is used to a lesser extent, due to the high acetyl content
of the pectin and the resulting decreased gelling ability (Rolin et al., 1998).
1.6.1 Traditional methods of pectin production used in industry There are many naturally occurring endogenous and exogenous enzymes that will immediately attack
pectin when fruit is being processed. Therefore, it is essential to either liberate pectin as soon as possible
from the fresh raw material, or to stabilize the pomace or pulp by drying, which allows it to be stored or
transported long distances. Before drying, the material is washed to remove sugars and acids (Rolin et al.,
1998).
As most of the water-soluble pectin is extracted during juice manufacture, the pectin left in citrus peels or
apple pomace is in an insoluble form. The current pectin production method employs high temperature
acidic hydrolysis (70-90°C) with nitric, hydrochloric or sulfuric acid at pH between 1.5 and 2.5,
conducted for several hours. The acid hydrolysis conditions cause partial depolymerization of pectin
chain and other cell wall polymers. The low pH breaks ionic bonds holding the pectin in the plant tissue
and the polymer is released into the liquid phase. Additionally, ester bonds are broken and pectin loses a
proportion of its methyl and acetyl groups. Neutral sugar chains are also degraded. The pectin yield of the
process increases with temperature, acidity and extraction time, but the length of the polymer decreases
when more ‘harsh’ process conditions are applied and the product may lose some of its functional
properties (Rolin et al., 1998; Voragen et al. 1995).
Next, the liquid containing pectin is separated from solids by filtration and/or centrifugation in one or
more stages to remove the remaining plant tissue. The pectin extract is usually filtered hot to reduce its
viscosity. The remaining plant material is typically used as cattle feed (Rolin et al., 1998).To avoid further
degradation of the polymer by the acidic conditions, the pH of the pectin solution is increased to 3-4. The
clarified extract is then concentrated by vacuum evaporators to 3-4% pectin content in order to minimize
the volume of alcohol needed for precipitation (Voragen et al., 1995). Pectin can then be optionally
deesterified or amidated by acid or alkali treatment. In fact, deesterification or amidation can be
37

38
conducted on clarified pectin extracts, concentrated pectin extracts or during pectin precipitation in
alcohol.
Precipitation of pectin is carried out in alcohol. The precipitate is then washed in alcohol and pressed to
remove contaminants such as sugars, pigments, polyphenols and other alcohol-soluble material. The
alcohol is recovered by distillation. After the precipitated pectin is washed, it is dried and ground into a
powder. The final product is tested, before it is blended with sugar (standardized) in order to obtain a
product suitable for the final application. Standardization is performed with respect to a few properties,
which are measured in a system imitating the application (Rolin et al., 1998).
The main disadvantage of this technology, raising environmental concerns, is generation of large volumes
of acidic effluent that requires further treatment before release. Moreover, harsh acidic treatment causes
depolymerisation and deesterification of the pectin chain.
Figure 12. HM pectin production process.
Standarization
Milling
Drying
Pressing
Alcohol washing
Precipitation
Concentration
Purification
Extraction
Pretreatment of the raw material
38

39
1.6.2 Enzymatic extraction Pectin can also be extracted enzymatically. Enzymatic extraction seems more advantageous in terms of
energy consumption and waste management than acidic extraction. The process is usually carried out at
pH between 3-5 and temperatures of around 50°C, which is more advantageous in terms of economy and
environmental impact. Moreover, as the pH of the process is much higher than in the case of traditional
acid-based approach, there is no need for waste neutralization. There are two among researchers working
on the enzymatic pectin extraction process - the first one involves using HG and RG degrading enzymes,
whereas the other employs cellulases and proteinases for degradation of other cell wall components.
When using HG and RG degrading enzymes, caution has to be taken, because the degree of pectin
polymerization will decrease as the reaction proceeds. In the other approach, involving proteinases and
cellulases, the presence of any pectinolytic activities should be avoided to release the pectin in an intact
form.
There have been several studies on enzymatic extraction of pectins from different plant sources described
in literature. Thibault et al. (1998) extracted pectins from citrus, apple and sugarbeet pulps with endo-
arabinase and endo-galactanase in conditions minimizing the pectate lyase side activity. They reported a
relatively low pectin yield, namely 10.8% in the case of citrus pectin, and its Mw was highly reduced (47
kDa). These two enzymes were therefore found to be unsuitable for extraction of pectin on a commercial
scale.
Zykwinska et al. (2008) extracted pectin using proteases and cellulases from a variety of substrates,
including chicory roots, citrus peel, cauliflower florets and leaves, and sugar beet pulps. HM pectins
(DE=68%) of high Mws and high GalA content (75%) were extracted in yields reaching 12.6% in the
case of citrus peel. The authors noticed that higher pectin yields were obtained with enzymes possessing
pectinolytic activities. Moreover, the characteristics of the extracted pectins were dependent on both the
main enzyme activity and contaminant activities present. The extracted pectins possessed gelling abilities
- HM citrus pectins gelled with sugar at low pH, whereas their corresponding LM pectin forms gelled
with calcium (Zykwinska et al., 2009).
Ptichkina et al. (2008) tried extraction of pectin from pumpkin pulp, using an Aspergillus awamori
enzyme preparation with cellulolytic and pectin esterase activities. Due to the presence of esterase in the
preparation, the degree of esterification could be modified. The resulting pectins formed gels with 60%
w/w sucrose at pH 3.
39

40
Another attempt to extract pectin involved the extraction of pectin with Celluclast 1.5L from kiwifruit
(Yuliarti et al., 2011). Enzyme concentration had an effect on pectin yield and properties, such as
viscosity and Mw distribution. Medium enzyme concentration resulted in highest pectin yield, viscosity
and average-weight Mw, whereas at high enzyme concentration pectin was degraded, possibly due to the
pectinolytic side activities of Celluclast 1.5L.
In conclusion, enzymatic methods of extraction of pectins present interesting alternatives to traditional
acid hydrolysis technology. However, problems such as low pectin yields and reduced Mws are
associated with enzymatic pectin extraction. Nevertheless, some enzymatically extracted pectins
possessed functional properties (gelling), which makes enzymatic extraction a promising option that
requires less energy input and no waste neutralization.
40
41
2. Enzymatic catalysis for efficient release of pectin with
functional properties.
2.1Hypotheses and objectives Lime peel, a by-product from the food industry, contains large amounts of pectin, which is currently
extracted in the industry by acid hydrolysis. To our knowledge, there has been no successful attempt to
extract lime pectin enzymatically and reach the yields and functionality that is currently obtained by acid
technology. In this study we attempt to extract pectin in high yields and check whether the product
possesses some functionality that could make it an alternative to products obtained in a traditional way.
2.2Key points Dicotyledonous plants, including lime, contain typically 15-45% of pectic substances, 30-60% cellulose,
15-25% hemicelluloses and 10-15% glycoproteins in their primary cell walls on a dry basis (Selvendran,
1983). In this study, pectin was extracted using commercial cellulases, in order to degrade cellulosic and
hemicellulosic substances in the peel, but liberate pectin in an intact form. Released pectins were
characterized chemically and their functionality was assessed by US-SAG method, which evaluates
gelling ability (Cox & Higby, 1944), as well as by testing them in a milk system for casein stabilization.
2.3 Experimental considerations Six commercial cellulases were chosen for pectin extraction based on the previous experiments
(unpublished data). Screening was conducted in pH from 3 to 4.8 to assure stability of the pectin polymer.
In pH below 3 the enzymes would not be sufficiently active and the pectic polymer would be prone to
acid hydrolysis. In pH above 5, and even at room temperature, pectin undergoes -elimination reaction
that reduces the chain length. The reaction is accelerated when the solution is heated. Afterwards, four
small-scale extractions were chosen for a scale-up, based on pectin yields and their molecular weights.
Molecular weights of pectins were measured by two methods: viscometry and GPC coupled to light
scattering. As shown before, light scattering detection is very sensitive to the presence of aggregates,
which are always present in pectin solutions. Even a small amount of such aggregates will have a
dramatic effect on apparent molecular weight measured with light scattering, but almost no effect on
viscosity. Therefore molecular weights measured by GPC coupled to light scattering were at least two
times higher than those measured by viscometry.
41

42
Gelling ability was assessed by measuring °USA-SAG. All enzyme-extracted pectins were gelling,
despite their molecular weights and high amount of neutral sugars. The reason for such a good gelling
performance was probably very high DE of all pectin samples (around 80%) that allowed for hydrophobic
interactions (as shown in Figure 2b). Additionally, pectins extracted with Validase TRL, Multifect B and
GC 880 were also stabilizing acidified milk drinks. In this test, one has to assume a certain concentration
of pectin in the drink before preparation, and adjust the dose based on the result. This is why stability tests
were made with different doses of acid and enzyme-extracted pectins.
2.4Conclusions Application of enzymes for the extraction of pectin enabled the release of pectic polymers with yields and
functionality similar to the ones obtained in a traditional way. Commercial cellulases were very efficient
extractants, which allowed for lower process temperature and higher pH as compared with the currently
applied acid-based extraction technology. Even though the structure of enzyme-extracted pectin was
different from acid extracts, they worked well in application.
42
Application of enzymes for efficient extraction, modification, anddevelopment of functional properties of lime pectin
Malgorzata Dominiak a,b, Karen M. Søndergaard b, Jesper Wichmann c,Silvia Vidal-Melgosa d, William G.T. Willats d, Anne S. Meyer a, Jørn D. Mikkelsen a,*
aCenter for Bioprocess Engineering, Dept. Chemical and Biochemical Engineering, Technical University of Denmark, DK-2800 Lyngby, DenmarkbDuPont Nutrition Biosciences ApS, Dept. Hydrocolloid Science, DK-8220 Brabrand, DenmarkcDuPont Nutrition Biosciences ApS, Dept. Advanced Analysis, DK-8220 Brabrand, DenmarkdDepartment of Plant and Environmental Sciences, Faculty of Science, University of Copenhagen, Thorvaldsensvej 40,DK-1871 Frederiksberg C, Denmark
a r t i c l e i n f o
Article history:Received 12 January 2014Accepted 10 March 2014
Keywords:CellulaseLime peel pectinHigh ester pectinFunctional properties
a b s t r a c t
The objective of the present study was to transform “Waste to Food” using enzymes to recover value-added food ingredients from biomass. Six commercial cellulases were screened to generate proof ofconcept that enzymes are selective and efficient catalysts for opening of lime peel biomass to recoverpectin. The most efficient enzyme preparation was Laminex C2K derived from Penicillium funiculosumwhich, during 4 h treatment at pH 3.5, 50 �C, released pectin with similar yield (23% w/w), molecularweight (69 kDa), and functional properties e.g. gelling, stabilization of acidified milk drinks and viscosityas the classically acid-extracted pectins (8 h treatment at 70 �C, pH < 2). Carbohydrate microarrayanalysis showed that enzymatically extracted pectin mainly contained highly methylated pectin(chemical compositional analysis indicated degree of esterification up to 82%), whereas acidicallyextracted pectins were more heterogeneous with regard to degree of esterification and had lower de-grees of esterification (67e74%). A high degree of esterification in enzymatically extracted pectin may bedirectly exploited commercially as the so-called Ultra-Rapid-Set pectin, which gels particularly fast athigher temperatures. The Laminex CK2 extracted pectin polymers were not sensitive to the presence ofCa2þ ions, they formed a gel at low pH in the presence of sugar and were able to stabilize acidified milkdrinks. Further modification by enzymatic de-esterification of the pectin extracted with Laminex C2Kimproved its calcium sensitivity and ability to stabilize acidified milk drinks. The present study dem-onstrates that it is possible to substitute classical acid-based extraction by enzymatic catalysis and obtainpectin products with desirable functional properties.
� 2014 Elsevier Ltd. All rights reserved.
1. Introduction
Refinery of biomass to recover labile value-added componentsis an important future requirement to upgrade many million tonsof side-streams from the agricultural and dairy industries toimportant food ingredients. At present most of the processes usingbiomass are exclusively focused on total hydrolysis of the poly-mers to form fermentable monosaccharides for bio-ethanol pro-duction. The commercial enzymes are able to catalyse thedegradation of most of the plant cell wall materials including the
hydrocolloids, but there has so far been very little incentive togenerate selective processes with several product lines, wherevalue-added labile products could be isolated before the residualbiomass would be used for bioethanol. It is, however, not a simpletask to integrate an up-stream process, where labile polymerssuch as hydrocolloids are to be harvested before degradation ofthe residual biomass to monosaccharides. There is a need forimproved enzymatic processes, integrating hydrocolloid extractionwith side-stream and biofuel production.
The plant cell wall is very complex and in dicotyledonousplants it is comprised typically of 15e45% of pectic substances,30e60% cellulose, 15e25% hemicelluloses and 10e15% glycopro-teins on a dry basis (Selvendran, 1983). Pectin is mainly composed
* Corresponding author. Tel.: þ45 4525 2938; fax: þ45 4593 2906.E-mail address: [email protected] (J.D. Mikkelsen).
Contents lists available at ScienceDirect
Food Hydrocolloids
journal homepage: www.elsevier .com/locate/ foodhyd
http://dx.doi.org/10.1016/j.foodhyd.2014.03.0090268-005X/� 2014 Elsevier Ltd. All rights reserved.
Food Hydrocolloids 40 (2014) 273e282
43

of three structural domains: homogalacturonan (HG), type Irhamnogalacturonan (RG I) and type II rhamnogalacturonan (RGII) (Verhertbruggen & Knox, 2006). HG is the dominant type ofpectin in lime peel and consists of a linear chain of a-(1/4)-linked D-galacturonic acid (GalA) residues, being partly methyl-esterified at O-6 and sometimes acetyl-esterified at O-2 or O-3(Voragen, Beldman, & Schols, 2001). RG I, composed of repeatingdisaccharide units: (1 / 2)-L-Rha-(1 / 4)-D-GalA (where Rhadenotes rhamnose) is abundantly substituted by arabinan andgalactan side chains at the O-4 position of Rha (Schols & Voragen,1994; Yapo, Lerouge, Thibault, & Ralet, 2007). RG II, the leastabundant domain, is composed of a linear backbone chain of D-GalA, substituted with L-Rha, D-Gal (galactose) and many unusualsugars such as apiose, 3-O-methyl-L-fucose, 2-O-methyl-D-xylose,3-C-carboxy-5-deoxy-L-xylose, 3-deoxy-D-manno-octulosonic acidand 3-deoxy-D-lyxo-heptulosaric acid (Voragen et al., 2001).
Due to its functional properties, pectin is used in the food in-dustry as an ingredient - it enables gelling, provides viscosity, sta-bilizes proteins and acts as a fat mimetic (Voragen et al., 2001;Voragen, Pilnik, Thibault, Axelos, & Renard, 1995; Willats, Knox, &Mikkelsen, 2006). The current extraction methods employ hightemperature acidic hydrolysis with nitric or sulphuric acid at pHbetween 1.5 and 2.5. The main disadvantage of this technology,raising environmental concerns, is the generation of large volumesof acidic effluent that requires further treatment before release.Moreover, harsh acidic treatment may give rise to undesirablebreakdown of the pectin chain. Enzymatic extraction thus seemsmore advantageous in terms of selectivity, energy consumption andwaste management.
The hypothesis behind this study was that special enzymes cancatalyse release of pectin with yield, viscosity and functionalproperties similar to that of acidic extraction. Many enzyme activ-ities, including cellulases and hemicellulases, are necessary torelease pectin from the cell walls. In this paper the effects of fourcommercial cellulases were compared on the basis of pectin yieldsand functionality. Commercial enzymes were chosen because theirproduction is already optimized, safe and economical and thereforetheir implementation in the production of pectin would be morestraightforward than in case of newly designed enzymes. Thepresent study demonstrated that lime pectin can be enzymaticallyextracted at high yield and that it possesses gelling and stabilizingproperties with similar performance to acid extracted pectin fromlime fruits.
2. Methods
2.1. Peel and enzymes
Dry lime peel was obtained from the DuPont Pectin Plant(DuPont Nutrition and Biosciences Mexicana S.R.L,Tecomán, Col-ima, Mexico). The pretreatment involved milling the peel to pass a35-mesh size screen (centrifugal mill Retsch ZM 200, Haan, Ger-many). The enzymes (Table 1) Laminex C2K, Multifect B, GC220 andGC880 were supplied by DuPont Industrial Biosciences (Leiden, TheNetherlands). Validase TRL was purchased from DSM (South Bend,IN) and Cellulase from Trichoderma reesei ATCC 26921 was kindlyprovided by SigmaeAldrich (Steinheim, Germany). The overview ofthe six enzymes, including their sources, working conditions andactivities (given by the manufacturer) is presented in Table 1. En-zymes used for the de-esterification of pectin, Rapidase FP Superand Collupulin Liq, were obtained from DSM (South Bend, IN).Endo- and exo-polygalacturonases, used for enzymatic finger-printing, were obtained and purified as described in Limberg et al.(2000b).
2.2. Chemicals
Avicel PH 101, D-(þ)-galacturonic acid monohydrate, poly-galacturonic acid from orange, potassium sodium tartrate tetrahy-drate and 3-hydroxybiphenyl were purchased from SigmaeAldrich(Steinheinm, Germany). Disodium tetraborate-10-hydrate, sodiumacetate trihydrate, sodium sulphate, sodium arsenate dibasic hep-tahydrate, sodium carbonate and copper (II) sulphate pentahydratewere purchased from Merck (Darmstadt, Germany). Ammoniummolybdate tetrahydrate and sodium bicarbonate were purchasedfrom Riedel-de Haën (Seelze, Germany). PD-10 Desalting columnswere purchased from GE Healthcare Bio-Sciences AB (Uppsala,Sweden). Sodium hexametaphosphate and tri-sodium citratedihydrate were purchased from VWR International (Poole, En-gland). Glucono-d-lactone was purchased from SFK Food A/S(Viborg, Denmark). Milex 240 skimmed milk powder was pur-chased from Arla Food Ingredients (Viby J, Denmark). Pectins E81,F31 and F19 were provided by DuPont Nutrition and Biosciences(Brabrand, Denmark).
2.3. Determination of enzyme activities
The six enzyme preparations were analysed for the presence ofcellulase, polygalacturonase, pectin lyase and rhamnogalacturonan Ilyase activities. Cellulase was measured at 50 �C in 50 mM acetatebuffer, pH 4.8 containing 10% Avicel PH 101 as the substrate. Initialreaction rates were measured by quantification of reducing sugarsreleased according to Lever (1972). The absorbance was measured at410 nm in an Infinite 200microplate reader (Tecan, Salzburg, Austria)accordingtoThomassen,Vigsnæs, Licht,Mikkelsen, andMeyer (2011).Polygalacturonase was determined at 50 �C in 50 mM acetate buffer,pH 4.8 using 0.1 M polygalacturonic acid as the substrate. Initial re-action rates were quantified by measuring the amount of reducingsugars released by Nelson and Somogyi method (Nelson, 1944;Somogyi, 1945), at 620 nm using a SpectraMax 19 microplate reader(Molecular Devices, Sunnyvale, CA). Pectin lyase and RGI lyase weremeasured according to Silva, Larsen, Meyer, and Mikkelsen (2011).Substrates for enzymatic reactions were highly methyl esterifiedcitrus pectin (DuPont, Brabrand, Denmark) and RGI from potato(Megazyme, Bray Business Park, Ireland) respectively. The activitymeasurement was based on the formation of a double bond (unsat-urated galacturonic acid) having a strong absorbance at 235 nm.Before the assay, the enzymes were partly purified using PD-10desalting Columns, to remove UV impurities. The reactions werecarried out in Infinite 200 microplate reader at 40 �C.
2.4. Small scale enzymatic extraction protocol
1.35 g of milled lime peel was mixed with 40 ml of 50 mM citricacid buffer at a specified pH value (3, 3.5, 4 or 4.8). The mixture washeated to 50 �C before addition of 75 ml of the enzyme. Afteraddition, the sample was incubated in a water bath for 4 h at190 rpm. The reaction was terminated by heating at 100 �C for5 min to inactivate the enzyme. The released pectin polymer insolutionwas separated from the residual biomass by centrifugationfor 10 min at 3500 rpm (Varifuge 3.0, Heraeus Sepatech, Osterode,Germany). The pectin solution was decanted off and the remainingbiomass was mixed with 20 ml of water and incubated for an hourat 50 �C and 190 rpm to recover residual pectin. After centrifugationthe pectin solution was combined with the former pectin solutionand the resulting mixture was filtered through Celite 545 (CeliteFrance S.A., Nanterre Cedex, France). Pectin was precipitated bymixing with a double volume of propan-2-ol, followed by agitationfor 1 h. The precipitated pectin was separated by filtration througha cotton canvas and dried overnight in a 40 �C ventilated oven.
M. Dominiak et al. / Food Hydrocolloids 40 (2014) 273e282274
44

Dried pectinwas ground to<0.5mm in an Ultra CentrifugalMill ZM200 (Retsch, Haan, Germany). Pectin yield (% w/w) was calculatedas a weight ratio of the dried pectin to the starting material (milledlime peel), both expressed on dry matter basis.
2.5. Enzymatic extraction protocol for 3 L scale
Up-scaling to 3 L volume was performed using a 3-neck roundbottom flask with agitator inside, connected to a titration deviceTitrino 877 Plus (Metrohm, Herisau, Switzerland) to maintain thereaction pH constant by addition of 0.1 M NaOH. The pulp: waterratio was the same as in the small scale extraction. The experimentwas performed as described for the small scale process except forthe following modification: before precipitation the pectin solutionwas concentrated using a rotary evaporator.
2.6. Acidic extraction protocol for 3 L scale
The experiment was performed similarly to the protocol forenzymatic extraction for 3 L scale with minor modifications.Briefly, 100 g of lime peel was mixed with 3 L deionized water andheated to 70 �C. Next, the pH was adjusted to 1.7 (extraction A) or2.0 (extraction B) with 40% nitric acid and the mixture was incu-bated in a 3-neck round bottom flask with agitator inside for 8 h(extraction A) or 4 h (extraction B). The released pectin polymerwas separated from the residual biomass by centrifugation for10 min at 3500 rpm (Varifuge 3.0, Heraeus Sepatech, Osterode,Germany). Pectin was decanted off and the remaining biomasswas mixed with 2 L of water and incubated for an hour. Aftercentrifugation the pectin was combined with the former pectinsolution and the resulting mixture was filtered through Celite 545(Celite France S.A., Nanterre Cedex, France). The solution wasconcentrated using a rotary evaporator. Precipitation, drying andgrinding was performed as described in the protocol for smallscale enzymatic extractions.
2.7. Enzymatic de-esterification of pectin with Rapidase FP Super
25 g of enzymatically extracted pectin with Laminex C2K at pH3.5 (described in Section 2.5) was dissolved in 1 L of hot deionizedwater under efficient agitation. The pH was adjusted to 4.0 and10 ml of enzyme Rapidase FP Super was added. The temperature ofde-esterification was maintained at 50 �C and the pH was kept at4.0 by automatic addition of 1 M NaOH until the desired DE was
achieved (estimated from consumption of 1 M NaOH). The enzymewas inactivated by boiling the solution for 5 min and the pectinwasprecipitated, dried and milled as described in Section 2.4.
2.8. Enzymatic de-esterification of pectin with Collupulin Liq
25 g of enzymatically extracted pectin with Laminex C2K at pH3.5 (described in Section 2.5) was dissolved in 1 L of hot deionizedwater under efficient agitation. The pH was adjusted to 6.0 and10 ml of enzyme Collupulin Liq was added. The temperature of de-esterification was maintained at 40 �C and the pH was kept at 6.0by automatic addition of 1 M NaOH until the desired degree ofesterification was achieved (estimated from consumption of 1 MNaOH). Next, the pH was decreased to 3.0 by addition of 42%HNO3. The enzyme was inactivated by boiling the solution for5 min and the pectin was precipitated, dried and milled asdescribed in Section 2.4.
2.9. Determination of the degree of esterification
Degree of pectin esterification was determined according to themethod described in the Food Chemical Codex (3rd ed.) (1981, p.216). Briefly, pectin samples were washed in 60% propan-2-olcontaining 5% HCl, followed by washing in 60% and 100% propan-2-ol. Next, 0.2 g of washed and dried material was dissolved in100 ml deionized water and the sample was titrated with 0.1 MNaOH using phenolphthalein as an indicator (the volume of 0.1 MNaOH was recorded as V1). Then the sample was saponified byaddition of 10 ml 1 M NaOH, followed by mixing for 15 min. Next,10 ml of 1 M HCL was added to the sample and the mixture wasagain titrated with 0.1 M NaOH until colour change (volume V2).The DE was calculated according to the formula:
DE ¼ V2
V1 þ V2� 100%
2.10. Determination of galacturonic acid in pectin
Galacturonic acid content was determined by the colourimetricm-hydroxybiphenyl method (Blumenkrantz & Asboe-Hansen,1973). The measurements were performed in a microtiter plate,according to van den Hoogen et al. (1998), using Tim-200 platereader equipped with 492 nm filter (Teknunc A/S, Roskilde,Denmark).
Table 1The sources, working conditions and activities of six commercial cellulases used in the study. Data taken from the enzyme specification sheets provided by the manufacturers.
Description Source Working conditions (optimum)
pH Temperature (�C) Activity
GC220 Cellulase, hemicellulase(b-glucanase)
T. reesei 3.5e6.5 50e70 6200 CMCU/ga
GC880 Cellulase 4.5e6.5(4.5e5.0)
40e68(50e65)
10,300 CMCU/g
Laminex C2K Cellulase, hemicellulase(xylanase, arabinoxylanse)
P. funiculosum 3.5e6.5(5.0)
45e65(55)
3150 CMC-DNSU/gb
Validase TRL Cellulase,hemicellulase (xylanase, mannanase,b-glucanase)
T. longibrachiatum 3.5e6.5(4.0e5.0)
50e60(50e55)
6800 CU/gc
Multifect B Cellulase, hemicellulase(b-glucanase)
T. reesei 4.0e6.0(5.0)
40e60(50)
2250 BGLU/mld
Cellulase from T. reesei Cellulase T. reesei 4.5e6.0 50e60 1500 NCU/ge
a Carboxymethylcellulose units.b Carboxymethylcellulose-dinitrosalicylic acid units.c Cellulase units.d Beta-glucanase units.e Novo cellulase units.
M. Dominiak et al. / Food Hydrocolloids 40 (2014) 273e282 275
45

2.11. Determination of the total galacturonic acid content in thelime peel
The content of galacturonic acid in the milled lime peel wasmeasured according to Ahmed and Labavitch (1978). Briefly, 5 mgof the milled lime peel was hydrolysed in 3 ml of chilled concen-trated H2SO4. Next, the galacturonic acid content of the hydrolysatewas measured as described in Section 2.10. Polygalacturonic acidfrom orange was used as a control sample during acid hydrolysisand the measurement of galacturonic acid content.
2.12. Determination of the viscosityeaverage molecular weight
The viscosityeaverage molecular weights (Mw) of pectin sam-ples were determined using a Höppler viscometer, type 002-7580(Haake, Karlsruhe, Germany) according to Limberg et al. (2000a).Briefly, the duration of the fall periods of the ball in a 1% sodiumhexametaphosphate solution (pH 4.5) with and without 0.09%pectin were determined. The viscosityeaverage molecular weightwas calculated according to the formula:
MW ¼ TtestTref :
� 1
!� 200;000
Where Ttest was the average time of the fall of the ball in pectinsolution and Tref. was the average time of the fall of the ball in thesodium hexametaphosphate solution.
2.13. Determination of molecular weight by gel permeationchromatography (GPC)
Three GPC SUPREMA-LUX columns e 3000 Å, 10,000 �A and30,000 �A (PSS, Mainz, Germany) were used for gel permeationchromatography. Pectin solutions (1 g/L) were filtered through a0.45 mm filter before injection. The mobile phase was 0.05 M LiNO3with 0.02% NaN3 which was filtered through a 0.22 mm filter beforeuse. Separations were carried out at 40 �Cwith a flow rate of 0.6 ml/min. The eluent was monitored by a MALLS detector DAWN EOS(Wyatt Technology Corporation, Santa Barbara, CA) and a serialconnected refractive index detector Optilab reX (Wyatt TechnologyCorporation). The datawere analysed using Astra 5 software (WyattTechnology Corporation) and a value of 0.131 was used for therefractive index increment (Corredig, Kerr, & Wicker, 2000).
2.14. Neutral sugar composition
After hydrolysis of pectin in 1 M sulphuric acid, the neutralsugars were detected by High Performance Anion ExchangeChromatography with Pulsed Amperometric Detection (HPAEC-PAD). Before hydrolysis, the pectin sample was washed three timesin 80% ethanol followed by washing one time in 96% ethanol toremove sugars. The hydrolysis in 1 M sulphuric acid was carriedout at 100 �C for 6 h. After hydrolysis the sample was diluted andfiltered through a 0.45 mm filter. The content of D-fucose, L-rhamnose, D-arabinose, D-galactose, D-glucose and D-xylose inpectin was determined. The separation and quantification wasperformed by HPAEC-PAD using an ICS-3000 system (DionexCorp., Sunnyvale, CA).
The columns used were CarboPac� PA1 (4 mm � 250 mm)analytical column and a CarboPac� PA1 guard column. Eluent Aconsisted of deionised water and eluent B of 150 mMNaOH. 20 minisocratic elution with 15 mM NaOH was followed by 10 minwashingwith 150mMNaOH. The flowwas kept at 1ml/min. Beforeinjection of each sample (50 ml) the columnwas reequilibratedwith
15 mM NaOH for 8 min. Analysis was made with the programChromeleon 6.80 software (Dionex Corp., Sunnyvale, CA).
2.15. Characterization by carbohydrate microarrays
Enzymatic and acid extracted pectins as well as three standardlime pectin samples were dissolved in deionized water to a con-centration of 4 mg/ml. Three replicates per sample were prepared.Each replicate was printed as a two-fold dilution followed by 3 five-fold dilutions. Each dilution was printed in duplicate, resulting in atotal of 24 spots per sample. All dilutions were performed inprinting buffer (55.2% glycerol, 44% water, 0.8% Triton X-100).Samples were printed using a piezoelectric microarray robot(Sprint, Arrayjet, Roslin, UK) on nitrocellulose membrane with apore size of 0.45 mm (Whatman, Maidstone, UK). Standard pectinsamples included the commercial pectin E81 from lime peel with aDE of 81% and pectins F31 and F19 with a DE of 31% and 19%respectively, which are derived from E81 treated with pectinmethyl esterase from Aspergillus niger. The three samples (DuPontNutrition Biosciences, Brabrand, Denmark) were described inLimberg et al. (2000a).
Nitrocellulose microarrays were probed as described inPedersen et al. (2012). Briefly, arrays were probed with a collectionof anti-pectin monoclonal antibodies from PlantProbes (Leeds, UK)1/10 diluted in PBS (140 mM NaCl, 2.7 mM KCl, 10 mM Na2HPO4,1.7 mM KH2PO4, pH 7.5), containing 5% w/v low fat milk powder(MPBS) for 2 h. Once washed with PBS, microarrays were incubatedwith an anti-rat secondary antibody conjugated to alkaline phos-phatase (Sigma, Poole, UK) 1/5000 diluted in MPBS for 2 h.Developedmicroarrayswere scanned at 2400 dpi (CanoScan 8800F,Søborg, Denmark) and converted to TIFFs. Antibody signals werequantified using appropriate microarray software (Array-ProAnalyzer 6.3, Media Cybernetics, Rockville, USA). Data was pre-sented as a heatmap, where the maximal mean spot signal valuewas set to 100 per each antibody and all other values werenormalized accordingly. Colour intensities are correlated to meanspot signal. A cut off of 5 was applied.
2.16. Enzymatic fingerprinting
Enzymatic fingerprinting was performed according to Limberget al. (2000b). One ml of pectin solution (5 mg/ml in 50 mM ofsodium acetate buffer, pH 4.5) was incubated with 0.2 U of endo-polygalacturonase for 24 h at 40 �C. The reaction was stopped byboiling the samples for 5 min. After cooling, 0.1 U of exo-polygalacturonase was added to samples and the reaction pro-ceeded for another 24 h at 40 �C, followed by enzyme inactivation.1 mg/ml glucuronic acid was used as an internal standard.
Galacturonic acid content of samples was determined usingHPAEC-PAD with ICS-3000 system (Dionex Corp., Sunnyvale, CA).The columns used were CarboPac� PA10 (2 mm � 250 mm)analytical column and a CarboPac� PA10 guard column. Eluent Aconsisted of 100 mMNaOH and eluent B of 100 mMNaOHwith 1Msodium acetate. The flowwas kept at 0.15 ml/min. Elution gradient:90% A and 10% B at 0 min linearly changing to 50% A and 50% B at25 min. The columnwas rinsed with 100% eluent B for 5 min beforeequilibration with starting conditions for 10 min was executed.
2.17. Stabilization of milk drinks
Milex 240 skimmed milk powder was dissolved in water andacidified to pH 4.0 with glucono-d-lactone. The solution was com-binedwith pectin to mimic a drinking yogurt with 8% milk solidnon-fat. After homogenization at 20 MPa with APV-1000 homog-enizer (APV, Soeborg, Denmark), it was pasteurized at 75 �C for
M. Dominiak et al. / Food Hydrocolloids 40 (2014) 273e282276
46

10 min and stored overnight at 4 �C. Next day the sample wascentrifuged at 2800 g for 20 min and the weight of the wet sedi-ment was recorded and expressed in % of the total weight of thesample.
2.18. Gelling ability
Determination of the gelling ability of pectin was performedaccording to US-SAG method (Cox & Higby, 1944). Briefly, a pectingel containing 65% soluble solids (pH 2.2) was prepared in a glassand stored for 24 h at 25 �C. Next day, the gel was removed from theglass and the decrease of its height within 2 min was measuredwith a ridgelimeter. The results were expressed in �US-SAG.
2.19. Calcium sensitivity
Calcium sensitivity was measured according to Limberg et al.(2000a). Briefly, two 290 g portions of 0.6% pectin solution (pH1.5) were prepared, followed by addition of 10 ml of 0.25 M CaCl2 tothe first portion (test sample) and 10 ml of 1% sodium hexameta-phosphate to the second portion (reference sample). Next, 50 ml of1 M NaOAc buffer (pH 4.7) was added to both samples and theywere stirred for 15 min. Viscosities of the test and reference sam-ples were measured using Brookfield DV-II viscometer (BrookfieldEngineering Laboratories, Inc., Stoughton, MA), spindle 2, at 60 rpmand 21 �C. Calcium sensitivity was calculated as:
CS ¼ viscosity of the test sampleviscosity of the reference sample
� 1
2.20. Data analysis
One-way analysis of variance (ANOVA) and post hoc Tukey testswere performed using IBM SPSS Statistics 21.0.0 (New York, USA).
3. Results
3.1. Small-scale screening experiment at different pH
The major activity of the six enzymes used in the study wascellulase, whereas low activities of polygalacturonase, pectin lyaseand rhamnogalacturonan I lyase were also observed (Table 2). Sincepectin is known to be unstable at pH above 5 when exposed toelevated temperatures (Voragen et al., 2001), it was decided to testenzymes performance at pH between 3.0 and 4.8, at a temperatureof 50 �C. These experimental conditions were suitable for all en-zymes, as indicated in Table 1. Since all six commercial enzymescontained various cell-wall degrading activities (as indicated inTable 1), it was decided to add the same enzyme volume to eachextraction tube.
The yields and viscosityeaverage molecular weights (Mw) ofenzymatically extracted pectin at pH 3, 3.5 and 4 using GC220 (A),
cellulose from T. reesei (B), GC880 (C) or MultifectB (D) were at alow level (Fig. 1). In contrast the last two enzymes, Laminex C2K (E)and Validase TRL (F), gave very high yields (19e31%) and relativelyhigh viscosityeaverage Mw. At pH 4.8 pectin yields obtained by allenzymes were very high (24e32%), except for that of GC220 whereonly 15% yield was observed. A high yield and a high viscosityeaverage Mw of the pectin polymer are prerequisites for the econ-omy of the process and good pectin quality. The best solution for ahigh extraction recovery (>25%) and a large Mw (approx. 60 kDa)was achieved at pH 3.5 by the use of Laminex C2K (E) and ValidaseTRL (F).
Compositional analysis of the monomeric building blocksconfirmed that pectin samples extracted by the six commercialenzyme preparations were a genuine polymer composed mainly ofgalacturonic residues (71e85% w/w), which was higher than the65% legal boundary level, specified by FAO, FCC and EU on the acidwashed pectin.
3.2. 3-L extraction scale
Based on the results obtained in the screening experiments,four enzymes (GC880, Multifect B, Laminex C2K and Validase TRL)were selected for a scale up to 3 L volume to validate the structureand functional properties of enzymatically extracted pectin sam-ples. Due to decrease of pectins molecular weight with increasingpH, a value of 3.5 was chosen in the case of enzymes GC880,Laminex C2K and Validase TRL. At this pH value both yield andviscosityeaverage Mw were at high level. The screening experi-ment demonstrated that in the case of Multifect B molecularweight of pectin was preserved until pH 4, therefore this pH waschosen for a scale-up. Additionally, two classical acidic extractionsusing pH 1.7 and 2, both at 70 �C, were also performed on the samelime peels to compare the yields, molecular weights, compositionand functionality of both the enzymatic and acidic extracted pectinsamples.
3.2.1. CompositionThe yields of enzymatically extracted pectin samples at 3 L scale
were similar to their small scale equivalents in the screening phase(Table 3) ranging from 17.7% in the case of Multifect B to 26.3% forValidase TRL. The yields of two acid extracted pectin samplesdiffered significantly e pectin A, extracted at lower pH for longertime, was released in almost double amount as compared to pectinB, extracted at milder conditions for shorter time. All enzymeextracted pectin samples had a very high degree of esterification,reaching 80%. Pectic polymers extracted with acid had lower de-grees of esterification (74 and 67%), which could be attributed tohydrolysis of ester groups at the acidic extraction conditions.
Molecular weights of all pectin samples were measured by twomethods: viscosimetry and GPC. Viscosityeaverage Mw of enzymeextracted pectin samples ranged from 57 to 91 kDa, which waslower than in the case of acid extracted pectin B (145 kDa). Vis-cosityeaverage Mw of acid extracted pectin A was only 63 kDa,indicating degradation of the polymer by the more harsh extrac-tion conditions. GPC sorts the molecules by size, with the largesteluting first and the smallest last. The MALLS peak height is pro-portional to the product of concentration and hydrodynamic vol-ume of the molecules, whereas RI peak increases withconcentration (Wyatt, 1993). GPC profiles of enzyme extractedpectin samples (Fig. 2A) appeared more heterogeneous than acidextracted pectin samples (Fig. 2B), due to more diversified Mw andlarger amounts of neutral sugars. MALLS signals were eluting atlower retention volume than RI signals, which suggested thepresence of a high molecular weight component in low amount(low RI signal). In the case of acid extracts, presented in Fig. 2B,
Table 2Evaluation of commercial enzyme preparates for cellulase and pectolytic activities(polygalacturonase, pectin lyase and rhamnogalacturonan I lyase). All activities weremeasured at pH 4.8.
Enzyme Enzyme activities [U/ml]
Cellulase Polygalacturonase Pectin lyase RG1 lyase
GC220 14,990 2.2 0.5 1.3GC880 8681 0.3 4.4 5.7Laminex C2K 4790 3.8 0.4 1.3Validase TRL 5464 0.3 3.2 0.9Multifect B 7652 0.1 0.5 1Cellulase from T. reesei 7203 1.4 1.6 0.8
M. Dominiak et al. / Food Hydrocolloids 40 (2014) 273e282 277
47

MALLS and RI peaks were more superimposed, which suggestedlower heterogeneity of the polymers. The RI peak eluting between35 and 37 ml, present in both Fig. 2A and B, was due to thepresence of salt in pectin samples.
Weighteaverage molecular weights measured by GPC were1.4e4 times higher than viscosityeaverage molecular weightsmeasured by viscometry. There could be several reasons for thisdiscrepancy. First of all, these two methods measured differentpolymer characteristics (hydrodynamic volume and viscosity),neither of them being the true molecular weight of the polymer.Moreover different solvents used in the two systems, could causedifferent expansion of the molecules or stimulate the formation ofaggregate, which has been described in details by Fishman, Chau,Kolpak, and Brady (2001). Light scattering detection, usedtogether with GPC, is known to be particularly sensitive to thepresence of aggregates, resulting in molecular weights up to 1000kDA (Jordan & Brant, 1978; Sorochan, Dzizenko, Bodin, & Ovdov,1971). On the contrary, sodium hexametaphosphate present in
viscosity analysis eliminated the risk of viscosity increase, causedby the presence of residual calcium in the pectin sample.
Galacturonic acid content of enzyme extracted pectin sampleswas between 81 and 84% and they contained 12e15% neutral sugars(w/w), as presented in Table 4. In the case of acid extracted pectinsamples galacturonic acid content was higher (90%), but neutralsugars reached only 9%.
3.2.2. FunctionalityAll pectins gelled at low pH and presence of 65% sugar, as
expressed in �US-SAG (Table 5). Typically, commercial pectin isblended with sugar to obtain a gelling strength of 150 �US-SAG.High SAG value in raw pectin means that a low amount of pectin isneeded to obtain a desired gelling strength of the blend. Moderatelevels of US-SAG in case of enzyme extracted pectins were causedby pre-gelling, which occurred due to their very high DE level.Among enzyme extracted pectin samples best gelling was observedin the case of pectins extracted with Multifect B and GC880,
Table 3Extraction conditions, pectin yields, degrees of esterification and molecular weights of enzyme and acid extracted pectin samples in 3 L scale. Molecular weights weremeasured by two methods: viscometry and gel permeation chromatography in-line with multi-angle light scattering detection. Values are means of 2measurements � standard deviation. Values that do not share a letter within the column are significantly different (p < 0.05).
Enzyme/acid Extraction conditions Yield [%] DE [%] Mw [kDa]
Time [h] Temp [�C] pH Mwa Mw
b
Laminex C2K 4 50 3.5 22.5 82.2 � 2.5c 69.2 � 0.6c 115.0 � 1.4a
Validase TRL 4 50 3.5 26.3 79.1 � 0.8c 56.6 � 0.4a 225.5 � 9.2b
Multifect B 4 50 4 17.7 79.3 � 1.0c 91.2 � 0.6e 201.5 � 3.5b
GC880 4 50 3.5 17.9 78.4 � 1.4bc 82.3 � 0.6d 198.0 � 25.5b
HNO3 (A) 8 70 1.7 25.6 67.3 � 1.5a 63.3 � 0.5b 110.7 � 0.6a
HNO3 (B) 4 70 2 13.6 73.9 � 1.2b 145.5 � 5.5f 194.5 � 3.1b
a Viscosityeaverage molecular weight measured by viscosimetry.b Weighteaverage molecular weight measured by gel permeation chromatography in-line with multi-angle light scattering detection.
Fig. 1. Pectin yields (grey bars) and viscosityeaverage molecular weights (black points), obtained after 4 h digestion with GC220 (A), cellulase from T. reesei (B), GC880 (C), MultifectB (D), Laminex C2K (E) and Validase TRL (F) at pH 3, 3.5, 4 and 4.8. Error bars indicate standard deviation. Means that do not share a letter are significantly different (p < 0.05).
M. Dominiak et al. / Food Hydrocolloids 40 (2014) 273e282278
48

probably due to highest viscosityeaverage Mw. Acid extractedpectin B provided best gelling (226 �US-SAG) due to highest pectinviscosityeaverage Mw and low content of neutral sugars.
The ability of pectic polymers to stabilize milk drinks is pre-sented in Fig. 3. Stabilization occurred due to electrostatic in-teractions between HG pectin domains and casein, and repulsionbetween charged pectic stretches, surrounding casein micelles(Tromp, de Kruif, van Eijk, & Rolin, 2004). Enzymatically extractedpectins were tested at 3 concentration levels, namely 0.2, 0.3 and0.4% (w/w) (Fig. 3A). Such a broad concentration range was chosen,because it was difficult to predict the performance of the pectin inthe milk drink. In the case of acid extracts, lower pectin levels werechosen (0.15, 0.2 and 0.25%) as presented in Fig. 3B. This morenarrow concentration range was selected on the basis of the pre-vious experience with acid extracted pectins, produced in similarconditions. Pectin samples extracted with Validase TRL, Multifect BandGC 880were able to stabilizemilk drinks, whereas Laminex C2Kpectin did not prevent sedimentation even at highest concentrationtested. Validase TRL pectin was stabilizing the drinks already at the0.3% addition level, whereas Multifect B and GC880 pectins pre-vented sedimentation at 0.4% concentration. Acid extracted pectin Awas not stabilizing the drinks at the three levels initially chosen andtherefore it was tested at higher concentrations, where it providedsatisfactory stability. Acid extracted pectin B was a very good sta-bilizer already at 0.15% level, probably due to it having the highestviscosityeaverage Mw. The enzymatically extracted pectin sampleswere not sensitive to calcium due to high DE (Table 5). This was inagreement with the model commercial pectin E81 (URS 1200,DuPont Nutrition Biosciences, Grindsted, Denmark), described inLimberg et al. (2000a), having a comparable degree of esterification(81%), but low calcium sensitivity. Polygalacturonase, present inenzyme preparates, could attack the glycosidic bonds betweenunmethylated galacturonic acid units, thus decreasing the calciumsensitivity of enzyme extracted pectin. Acid extracted pectin B had
much higher calcium sensitivity than the rest of the samples, due tomuch higher viscosityeaverage Mw, which was essential for crea-tion of a strong pectin network in the gel.
The presence of stretches of unesterified galacturonic acid (blocksequences) was assessed by enzymatic fingerprinting (Table 5). Theblockwise distribution of unesterified galacturonic acid is essentialfor cross-linking with calcium molecules, even though the exactnumber of monomers forming this structure is unknown (Limberget al., 2000b). Presence of block structures and their length arealso important for the ability of pectin to stabilizemilk drinks. In thecase of too long blocks of free carboxyl groups, there are no suffi-ciently long dangling pectin chains, protruding into the liquid,repelling each other and thus increasing the stability of the dairysystem (Syrbe, Bauer, & Klostermeyer,1998). In an opposite case, tooshort free galacturonic acid fragments do not bind strongly to caseinparticles. The amount of galacturonic acid released by endo-polygalacturonase indicates non-esterified galacturonic acidmonomers in block sequence at the non-reducing end or inside theblock sequence, whereas endo þ exopolygalacturonase digestionrelease all non-esterified galacturonic acid monomers located be-tween other non-esterified monomers (Limberg et al., 2000b).Endo þ exo digestion of enzyme extracted pectin samples resultedin only between 1 and 1.5% GalA released, similarly to pectin E81,having comparable degree of esterification. Acid extracted pectinsamples hadmoremonomers located in block sequences. Digestionof polygalacturonic acid (PGA), added to Table 5 for comparison,resulted in release of over 57% of galacturonic acid (from Limberget al., 2000b).
3.2.3. Characterization by carbohydrate microarraysEnzyme and acid extracted pectins were also analysed using
carbohydrate microarrays. Pectin samples were spotted as micro-arrays and information about the structural composition of thedifferent samples was obtained by probing the arrays with five
Table 4Chemical composition of enzyme and acid extracted pectin samples in 3 L scale. Values are means of 2 measurements � standard deviation. Values that do not share a letterwithin the column are significantly different (p < 0.05).
Enzyme/acid Composition [%]
GalA Ara Fuc Gal Glu Rha Xyl
Laminex C2K 81.3 � 2.0a 9.3 � 0.3e 0.1 � 0.0a 1.7 � 0.1a 1.6 � 0.1d 0.7 � 0.1a 0.7 � 0.0d
Validase TRL 83.1 � 0.7a 8.2 � 0.2d 0.1 � 0.1a 4.1 � 0.1c 0.3 � 0.0ab 1.5 � 0.1c 0.3 � 0.0c
Multifect B 84.0 � 0.9a 7.2 � 0.3c 0.1 � 0.0a 2.4 � 0.0b 0.5 � 0.1c 0.9 � 0.0a 0.3 � 0.0c
GC880 83.8 � 0.7a 8.5 � 0.4de 0.1 � 0.0a 2.6 � 0.2b 0.1 � 0.0a 0.9 � 0.1a 0.2 � 0.0bc
HNO3 (A) 90.1 � 2.0b 3.3 � 0.0a 0.1 � 0.0a 3.9 � 0.0c 0.4 � 0.0bc 1.4 � 0.0c 0.2 � 0.0ab
HNO3 (B) 90.4 � 1.7b 5.0 � 0.0b 0.1 � 0.0a 2.7 � 0.0b 0.2 � 0.0ab 1.1 � 0.0b 0.1 � 0.0a
Fig. 2. GPC profiles of enzyme (A) and acid (B) extracted pectins. Dotted lines indicate MALLS signal (molecular weight and distribution detector), whereas continuous linesrepresent RI signal (concentration detector).
M. Dominiak et al. / Food Hydrocolloids 40 (2014) 273e282 279
49
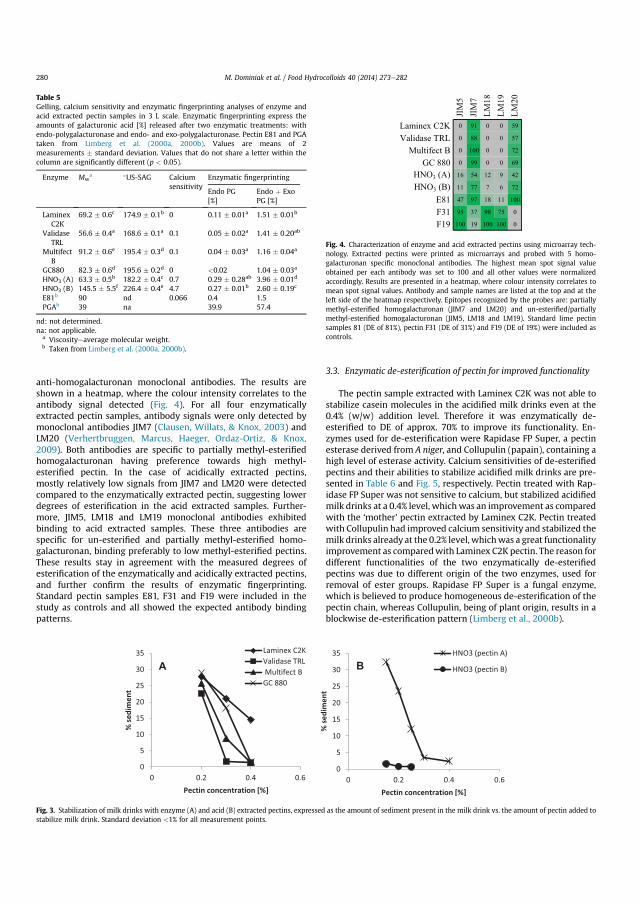
anti-homogalacturonan monoclonal antibodies. The results areshown in a heatmap, where the colour intensity correlates to theantibody signal detected (Fig. 4). For all four enzymaticallyextracted pectin samples, antibody signals were only detected bymonoclonal antibodies JIM7 (Clausen, Willats, & Knox, 2003) andLM20 (Verhertbruggen, Marcus, Haeger, Ordaz-Ortiz, & Knox,2009). Both antibodies are specific to partially methyl-esterifiedhomogalacturonan having preference towards high methyl-esterified pectin. In the case of acidically extracted pectins,mostly relatively low signals from JIM7 and LM20 were detectedcompared to the enzymatically extracted pectin, suggesting lowerdegrees of esterification in the acid extracted samples. Further-more, JIM5, LM18 and LM19 monoclonal antibodies exhibitedbinding to acid extracted samples. These three antibodies arespecific for un-esterified and partially methyl-esterified homo-galacturonan, binding preferably to low methyl-esterified pectins.These results stay in agreement with the measured degrees ofesterification of the enzymatically and acidically extracted pectins,and further confirm the results of enzymatic fingerprinting.Standard pectin samples E81, F31 and F19 were included in thestudy as controls and all showed the expected antibody bindingpatterns.
3.3. Enzymatic de-esterification of pectin for improved functionality
The pectin sample extracted with Laminex C2K was not able tostabilize casein molecules in the acidified milk drinks even at the0.4% (w/w) addition level. Therefore it was enzymatically de-esterified to DE of approx. 70% to improve its functionality. En-zymes used for de-esterification were Rapidase FP Super, a pectinesterase derived from A niger, and Collupulin (papain), containing ahigh level of esterase activity. Calcium sensitivities of de-esterifiedpectins and their abilities to stabilize acidified milk drinks are pre-sented in Table 6 and Fig. 5, respectively. Pectin treated with Rap-idase FP Super was not sensitive to calcium, but stabilized acidifiedmilk drinks at a 0.4% level, whichwas an improvement as comparedwith the ‘mother’ pectin extracted by Laminex C2K. Pectin treatedwith Collupulin had improved calcium sensitivity and stabilized themilk drinks already at the 0.2% level, whichwas a great functionalityimprovement as comparedwith Laminex C2K pectin. The reason fordifferent functionalities of the two enzymatically de-esterifiedpectins was due to different origin of the two enzymes, used forremoval of ester groups. Rapidase FP Super is a fungal enzyme,which is believed to produce homogeneous de-esterification of thepectin chain, whereas Collupulin, being of plant origin, results in ablockwise de-esterification pattern (Limberg et al., 2000b).
Fig. 3. Stabilization of milk drinks with enzyme (A) and acid (B) extracted pectins, expressed as the amount of sediment present in the milk drink vs. the amount of pectin added tostabilize milk drink. Standard deviation <1% for all measurement points.
Table 5Gelling, calcium sensitivity and enzymatic fingerprinting analyses of enzyme andacid extracted pectin samples in 3 L scale. Enzymatic fingerprinting express theamounts of galacturonic acid [%] released after two enzymatic treatments: withendo-polygalacturonase and endo- and exo-polygalacturonase. Pectin E81 and PGAtaken from Limberg et al. (2000a, 2000b). Values are means of 2measurements � standard deviation. Values that do not share a letter within thecolumn are significantly different (p < 0.05).
Enzyme Mwa �US-SAG Calcium
sensitivityEnzymatic fingerprinting
Endo PG[%]
Endo þ ExoPG [%]
LaminexC2K
69.2 � 0.6c 174.9 � 0.1b 0 0.11 � 0.01a 1.51 � 0.01b
ValidaseTRL
56.6 � 0.4a 168.6 � 0.1a 0.1 0.05 � 0.02a 1.41 � 0.20ab
MultifectB
91.2 � 0.6e 195.4 � 0.3d 0.1 0.04 � 0.03a 1.16 � 0.04a
GC880 82.3 � 0.6d 195.6 � 0.2d 0 <0.02 1.04 � 0.03a
HNO3 (A) 63.3 � 0.5b 182.2 � 0.4c 0.7 0.29 � 0.28ab 3.96 � 0.01d
HNO3 (B) 145.5 � 5.5f 226.4 � 0.4e 4.7 0.27 � 0.01b 2.60 � 0.19c
E81b 90 nd 0.066 0.4 1.5PGAb 39 na 39.9 57.4
nd: not determined.na: not applicable.
a Viscosityeaverage molecular weight.b Taken from Limberg et al. (2000a, 2000b).
Fig. 4. Characterization of enzyme and acid extracted pectins using microarray tech-nology. Extracted pectins were printed as microarrays and probed with 5 homo-galacturonan specific monoclonal antibodies. The highest mean spot signal valueobtained per each antibody was set to 100 and all other values were normalizedaccordingly. Results are presented in a heatmap, where colour intensity correlates tomean spot signal values. Antibody and sample names are listed at the top and at theleft side of the heatmap respectively. Epitopes recognized by the probes are: partiallymethyl-esterified homogalacturonan (JIM7 and LM20) and un-esterified/partiallymethyl-esterified homogalacturonan (JIM5, LM18 and LM19). Standard lime pectinsamples 81 (DE of 81%), pectin F31 (DE of 31%) and F19 (DE of 19%) were included ascontrols.
M. Dominiak et al. / Food Hydrocolloids 40 (2014) 273e282280
50
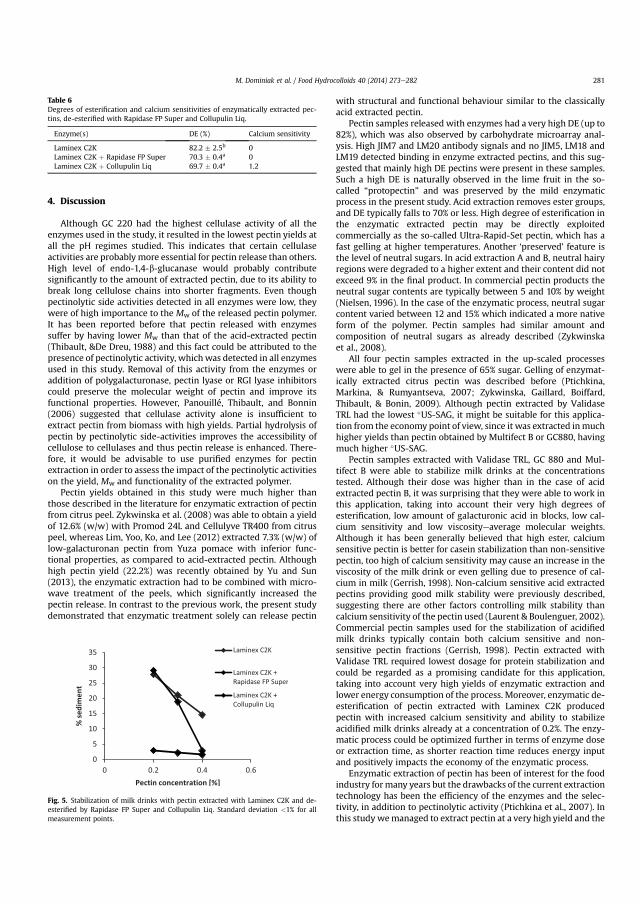
4. Discussion
Although GC 220 had the highest cellulase activity of all theenzymes used in the study, it resulted in the lowest pectin yields atall the pH regimes studied. This indicates that certain cellulaseactivities are probably more essential for pectin release than others.High level of endo-1,4-b-glucanase would probably contributesignificantly to the amount of extracted pectin, due to its ability tobreak long cellulose chains into shorter fragments. Even thoughpectinolytic side activities detected in all enzymes were low, theywere of high importance to the Mw of the released pectin polymer.It has been reported before that pectin released with enzymessuffer by having lower Mw than that of the acid-extracted pectin(Thibault, &De Dreu, 1988) and this fact could be attributed to thepresence of pectinolytic activity, which was detected in all enzymesused in this study. Removal of this activity from the enzymes oraddition of polygalacturonase, pectin lyase or RGI lyase inhibitorscould preserve the molecular weight of pectin and improve itsfunctional properties. However, Panouillé, Thibault, and Bonnin(2006) suggested that cellulase activity alone is insufficient toextract pectin from biomass with high yields. Partial hydrolysis ofpectin by pectinolytic side-activities improves the accessibility ofcellulose to cellulases and thus pectin release is enhanced. There-fore, it would be advisable to use purified enzymes for pectinextraction in order to assess the impact of the pectinolytic activitieson the yield, Mw and functionality of the extracted polymer.
Pectin yields obtained in this study were much higher thanthose described in the literature for enzymatic extraction of pectinfrom citrus peel. Zykwinska et al. (2008) was able to obtain a yieldof 12.6% (w/w) with Promod 24L and Cellulyve TR400 from citruspeel, whereas Lim, Yoo, Ko, and Lee (2012) extracted 7.3% (w/w) oflow-galacturonan pectin from Yuza pomace with inferior func-tional properties, as compared to acid-extracted pectin. Althoughhigh pectin yield (22.2%) was recently obtained by Yu and Sun(2013), the enzymatic extraction had to be combined with micro-wave treatment of the peels, which significantly increased thepectin release. In contrast to the previous work, the present studydemonstrated that enzymatic treatment solely can release pectin
with structural and functional behaviour similar to the classicallyacid extracted pectin.
Pectin samples released with enzymes had a very high DE (up to82%), which was also observed by carbohydrate microarray anal-ysis. High JIM7 and LM20 antibody signals and no JIM5, LM18 andLM19 detected binding in enzyme extracted pectins, and this sug-gested that mainly high DE pectins were present in these samples.Such a high DE is naturally observed in the lime fruit in the so-called “protopectin” and was preserved by the mild enzymaticprocess in the present study. Acid extraction removes ester groups,and DE typically falls to 70% or less. High degree of esterification inthe enzymatic extracted pectin may be directly exploitedcommercially as the so-called Ultra-Rapid-Set pectin, which has afast gelling at higher temperatures. Another ‘preserved’ feature isthe level of neutral sugars. In acid extraction A and B, neutral hairyregions were degraded to a higher extent and their content did notexceed 9% in the final product. In commercial pectin products theneutral sugar contents are typically between 5 and 10% by weight(Nielsen, 1996). In the case of the enzymatic process, neutral sugarcontent varied between 12 and 15% which indicated a more nativeform of the polymer. Pectin samples had similar amount andcomposition of neutral sugars as already described (Zykwinskaet al., 2008).
All four pectin samples extracted in the up-scaled processeswere able to gel in the presence of 65% sugar. Gelling of enzymat-ically extracted citrus pectin was described before (Ptichkina,Markina, & Rumyantseva, 2007; Zykwinska, Gaillard, Boiffard,Thibault, & Bonin, 2009). Although pectin extracted by ValidaseTRL had the lowest �US-SAG, it might be suitable for this applica-tion from the economy point of view, since it was extracted inmuchhigher yields than pectin obtained by Multifect B or GC880, havingmuch higher �US-SAG.
Pectin samples extracted with Validase TRL, GC 880 and Mul-tifect B were able to stabilize milk drinks at the concentrationstested. Although their dose was higher than in the case of acidextracted pectin B, it was surprising that they were able to work inthis application, taking into account their very high degrees ofesterification, low amount of galacturonic acid in blocks, low cal-cium sensitivity and low viscosityeaverage molecular weights.Although it has been generally believed that high ester, calciumsensitive pectin is better for casein stabilization than non-sensitivepectin, too high of calcium sensitivity may cause an increase in theviscosity of the milk drink or even gelling due to presence of cal-cium in milk (Gerrish, 1998). Non-calcium sensitive acid extractedpectins providing good milk stability were previously described,suggesting there are other factors controlling milk stability thancalcium sensitivity of the pectin used (Laurent & Boulenguer, 2002).Commercial pectin samples used for the stabilization of acidifiedmilk drinks typically contain both calcium sensitive and non-sensitive pectin fractions (Gerrish, 1998). Pectin extracted withValidase TRL required lowest dosage for protein stabilization andcould be regarded as a promising candidate for this application,taking into account very high yields of enzymatic extraction andlower energy consumption of the process. Moreover, enzymatic de-esterification of pectin extracted with Laminex C2K producedpectin with increased calcium sensitivity and ability to stabilizeacidified milk drinks already at a concentration of 0.2%. The enzy-matic process could be optimized further in terms of enzyme doseor extraction time, as shorter reaction time reduces energy inputand positively impacts the economy of the enzymatic process.
Enzymatic extraction of pectin has been of interest for the foodindustry formany years but the drawbacks of the current extractiontechnology has been the efficiency of the enzymes and the selec-tivity, in addition to pectinolytic activity (Ptichkina et al., 2007). Inthis study wemanaged to extract pectin at a very high yield and the
Fig. 5. Stabilization of milk drinks with pectin extracted with Laminex C2K and de-esterified by Rapidase FP Super and Collupulin Liq. Standard deviation <1% for allmeasurement points.
Table 6Degrees of esterification and calcium sensitivities of enzymatically extracted pec-tins, de-esterified with Rapidase FP Super and Collupulin Liq.
Enzyme(s) DE (%) Calcium sensitivity
Laminex C2K 82.2 � 2.5b 0Laminex C2K þ Rapidase FP Super 70.3 � 0.4a 0Laminex C2K þ Collupulin Liq 69.7 � 0.4a 1.2
M. Dominiak et al. / Food Hydrocolloids 40 (2014) 273e282 281
51

pectin moreover had functional properties equal or better thanthose of classically extracted pectin. By changing the pH of theprocess one could manipulate the yield and the length of pectinpolymer. The highest yields were obtained at the highest pH used(4.8), but the high yields were accompanied by loss of pectin mo-lecular weight. Pectin samples possessed functional properties,including gelling and stabilization of the milk drinks. Overall, theresults prove that commercial enzymes are useful for extraction ofthe pectin from lime peel and present an alternative to the currenttechnology, which eliminates the need for disposal of acidicwastewater. Further improvements of the enzymatic extractionprocess could be carried out by partial purification of the com-mercial enzymes to eliminate the pectolytic activities, similarly tothe study of Byg et al. (2012), involving purification of commercialenzymes for extraction of RGI from potato pulp. Another fairlysimple solution could be via genetic engineering to design Penicil-lium funiculosum or Trichoderma longibrachiatum strains, whichproduce Laminex C2K and Validase TRL, respectively. Deletion ofthe pectolytic genes, combined with addition of accessory genesencoding for enzymes, such as xyloglucanase and extensindegrading activity could pave the way for a novel large-scaleenzyme based process for selective biomass opening, allowingvalue-added products to be recovered prior to utilization of theresidual biomass in the bio-ethanol process. With the new genet-ically engineered Penicillium and Trichoderma strains it is possibleto produce bulk amounts of the optimized pectin extraction en-zymes and thereby lower the production cost to achieve aneconomically viable production. Alternatively, it is also possible togenerate monocomponent enzymes produced in Pichia pastoris toaccommodate a future study on enzymatic extraction with pureenzymes without galacturonan chain breaking activities, and toextract pectin with higher Mw and improved functional properties.
Acknowledgement
Jette Kirkeby Nielsen, Liselotte Kimose and Trine Nielsen areacknowledged for technical assistance. Furthermore, we aregrateful to Hans Christian Buchholt and Hanne Thorsøe for helpfulremarks on themanuscript. This work was partially financed by the7th Framework Program via the Marie Curie Initial TrainingNetwork, LeanGreenFood (EU-ITN 238084).
References
Ahmed, A. E. R., & Labavitch, J. M. (1978). A simplified method for accurate deter-mination of cell wall uronide content. Journal of Food Biochemistry, 1, 361e365.
Blumenkrantz, N., & Asboe-Hansen, G. (1973). New method for quantitativedetermination of uronic acids. Analytical Biochemistry, 54(2), 484e489.
Byg, I., Diaz, J., Øgendal, L. H., Harholt, J., Jørgensen, B., Rolin, C., et al. (2012). Large-scale extraction of rhamnogalacturonan I from industrial potato waste. FoodChemistry, 131, 1207e1216.
Clausen, M. H., Willats, W. G. T., & Knox, J. P. (2003). Synthetic methyl hex-agalacturonatehapten inhibitors of anti-homogalacturonan monoclonal anti-bodies LM7, JIM5 and JIM7. Carbohydrate Research, 338, 1797e1800.
Corredig, M., Kerr, W., & Wicker, L. (2000). Molecular characterization of commer-cial pectins by separation with linear mix gel permeation columns in-line withmulti-angle light scattering detection. Food Hydrocolloids, 14(1), 41e47.
Cox, R. E., & Higby, R. H. (1944). A better way to determine the gelling power ofpectins. Food Industries, 16, 441e442, 505e507.
Fishman, M. L., Chau, H. K., Kolpak, F., & Brady, J. (2001). Solvent effect on molecularproperties of pectins. Journal of Agricultural and Food Chemistry, 49, 4494e4501.
Food Chemical Codex (3rd ed.). (1981). Washington DC: National Academic Press.Gerrish, T.C. (1998). Pectin for stabilizing proteins. U. S. Patent 6,211,419.van den Hoogen, B. M., van Weeren, P. R., Lopes-Cardozo, M., van Golde, L. M. G.,
Barneveld, A., & van de Lest, C. H. A. (1998). A microtiter plate assay for thedetermination of uronic acids. Analitycal Biochemistry, 257, 107e111.
Jordan, R. C., & Brant, D. A. (1978). An investigation of pectin and pectic acid indilute aqueous solutions. Biopolymers, 17, 2885e2895.
Laurent, M. A., & Boulenguer, P. (2002). Stabilization mechanism of acid dairy drinks(ADD) induced by pectin. Food Hydrocolloids, 17, 445e454.
Lever, M. (1972). A new reaction for colorimetric determination of carbohydrates.Analytical Biochemistry, 47, 273e279.
Lim, J., Yoo, J., Ko, S., & Lee, S. (2012). Extraction and characterization of pectin fromYuza (Citrus junos) pomace: a comparison of conventional-chemical and com-bined physical-enzymatic extraction. Food Hydrocolloids, 29, 160e165.
Limberg, G., Körner, R., Buchholt, H. C., Christensen, T. M. I. E., Roepstorff, P., &Mikkelsen, J. D. (2000a). Analysis of different de-esterification mechanisms forpectin by enzymatic fingerprinting using endopectinlyase and endopolyga-lacturonase II from A. niger. Carbohydrate Research, 327, 293e307.
Limberg, G., Körner, R., Buchholt, H. C., Christensen, T. M. I. E., Roepstorff, P., &Mikkelsen, J. D. (2000b). Quantification of the amount of galacturonic acidresidues in blocksequences in pectin homogalacturonan by enzymatic finger-printing with exo- and endo-polygalacturonase II from Aspergillus niger. Car-bohydrate Research, 327, 321e332.
Nelson, N. A. (1944). A photometric adaptation of the Somogyi method for thedetermination of glucose. Journal of Biological Chemistry, 153, 375e380.
Nielsen, B. U. (1996). Fiber-based fat mimetics: pectin. In S. Roller, & S. A. Jones(Eds.), Handbook of fat replacers (p. 164). Boca Raton: CRC Press LLC.
Panouillé, M., Thibault, J. F., & Bonnin, E. (2006). Cellulase and protease preparationscan extract pectins from various plant byproducts. Journal of Agricultural andFood Chemistry, 54, 8926e8935.
Pedersen, H. L., Fangel, J. U., McCleary, B., Ruzanski, C., Rydahl, M. G., Ralet, M. C.,et al. (2012). Versatile high resolution oligosaccharide microarrays for plantglycobiology and cell wall research. Journal of Biological Chemistry, 287, 39429e39438.
Ptichkina, N. M., Markina, O. A., & Rumyantseva, G. M. (2007). Pectin extractionfrom pumpkin with the aid of microbial enzymes. Food Hydrocolloids, 22,192e195.
Schols, H., & Voragen, A. G. J. (1994). Occurrence of pectin hairy regions in variousplant cell wall materials and their degradability by rhamnogalacturonase.Carbohydrate Research, 256, 83e95.
Selvendran, R. R. (1983). The chemistry of plant cell walls. In G. G. Birch, & J. Parker(Eds.), Dietary fibre (p. 95). London: Applied Science Publ.
Silva, I. R., Larsen, D. M., Meyer, A. S., & Mikkelsen, J. D. (2011). Identification,expression, and characterization of a novel bacterial RGI lyase enzyme for theproduction of bio-functional fibers. Enzyme and Microbial Technology, 49(2),160e166.
Somogyi, M. (1945). A new reagent for the determination of sugars. Journal ofBiological Chemistry, 160, 61e68.
Sorochan, V. D., Dzizenko, A. K., Bodin, N. S., & Ovdov, Y. S. (1971). Light-scatteringstudies of pectic substances in aqueous solutions. Carbohydrate Research, 20,243e249.
Syrbe, A., Bauer, W. J., & Klostermeyer, H. (1998). Polymer science concepts in dairysystems-an overview of milk protein and food hydrocolloid interaction. Inter-national Dairy Journal, 8, 179e193.
Thibault, J.-F., De Dreu, F., Greaeds, C. C. J. M., & Rombouts, F. M. (1988). Studies onextraction of pectins from citrus peels, apple marks and sugar-beet pulps witharabinase and galactanase. Carbohydrate Polymers, 9, 119e131.
Thomassen, L. V., Vigsnæs, L. K., Licht, T. R., Mikkelsen, J. D., & Meyer, A. S. (2011).Maximal release of highly bifidogenic soluble dietary fibers from industrialpotato pulp by minimal enzymatic treatment. Applied Microbiology andBiotechnology, 90, 873e884.
Tromp, R. H., de Kruif, C. G., van Eijk, M., & Rolin, C. (2004). On the mechanism ofstabilization of acidified milk drinks by pectin. Food Hydrocollids, 18, 565e572.
Verhertbruggen, Y., & Knox, J. P. (2006). Pectic polysaccharides and expanding cellwalls. Plant Cell Monographs, 6, 139e158.
Verhertbruggen, Y., Marcus, S. E., Haeger, A., Ordaz-Ortiz, J. J., & Knox, J. P. (2009). Anextended set of monoclonal antibodies to pectic homogalacturonan. Carbohy-drate Research, 344, 1858e1862.
Voragen, A. G. J., Pilnik, W., Thibault, J.-F., Axelos, M. A. V., & Renard, C. M. C. G.(1995). Pectins. In A. M. Stephen (Ed.), Food polysaccharides and their applica-tions (pp. 287e339). New York: Marcel Dekker Inc.
Voragen, F., Beldman, G., & Schols, H. (2001). Chemistry and enzymology of pectins.In B. V. McCleary, & L. Prosky (Eds.), Advanced dietary fibre technology (pp. 379e398). Oxford: Blackwell Science Ltd.
Willats, W. G. T., Knox, J. P., & Mikkelsen, J. D. (2006). Pectin: new insights into anold polymer are starting to gel. Trends in Food Science & Technology, 17, 97e104.
Wyatt, P. J. (1993). Light scattering and the absolute characterization of macro-molecules. Analytica Chimica Acta, 272, 1e40.
Yapo, B. M., Lerouge, P., Thibault, J.-F., & Ralet, M.-C. (2007). Pectins from citrus peelcell walls contain homogalacturonans homogenous with respect to molar mass,rhamnogalacturonan I and rhamnogalacturonan II. Carbohydrate Polymers, 69,426e435.
Yu, X. C., & Sun, D. L. (2013). Microwave and enzymatic extraction of orange peelpectin. Asian Journal of Chemistry, 25, 5333e5336.
Zykwinska, A., Boiffard, M.-H., Kontkanen, H., Buchert, J., Thibault, J.-F., & Bonin, E.(2008). Extraction of green labelled pectins and pectic oligosaccharides fromplant byproducts. Journal of Agricultural and Food Chemistry, 56, 8926e8935.
Zykwinska, A., Gaillard, C., Boiffard, M.-H., Thibault, J.-F., & Bonin, E. (2009).“Green labelled” pectins with gelling and emulsifying properties can beextracted by enzymatic way from unexploited sources. Food Hydrocolloids, 23,2468e2477.
M. Dominiak et al. / Food Hydrocolloids 40 (2014) 273e282282
52
53
3. Application of FTIR, carbohydrate microarrays and multivariate data analysis for prediction and characterization of enzyme- versus acid-extracted pectin.
3.1 Hypotheses and objectives Pectin production is complex and final product quality assessment is accomplished at the end of the
procedure, employing time-consuming off-line laboratory tests. Therefore, it would be of interest to
pectin producers to shift the quality control upstream in the process and, in this way, enable continuous
process monitoring and reduce the risk of process failures. The hypothesis of this study was that FTIR
and carbohydrate microarrays are useful tools to predict pectin yield during the pectin production process
by analyzing crude pectin extracts. To our knowledge, neither FTIR nor carbohydrate microarrays have
been used before to predict the outcome of pectin extraction.
3.2 Key points Time-resolved enzymatic and acidic pectin extractions have been conducted. In each case, samples of
crude pectin extract were taken at specific time points and individual pectin yields were determined by
propan-2-ol precipitation. First aliquot of each crude extract was used to acquire the mid-infrared
spectrum between 950 cm-1 and 1550 cm-1according to the method described in Andersen, S. K., Hansen,
&Andersen, H. V. (2002). Second aliquot was analyzed by a microarray experiment, where pectin
samples were deposited onto nitrocellulose membrane and probed with a panel of antibodies and
carbohydrate binding modules (CBMs). Partial least squares regression (PLS) models were developed for
enzymatic extraction and enzymatic plus acidic extractions, using the data obtained by FTIR and
carbohydrate microarray. Additionally, principal component analysis (PCA) was utilized to analyze the
spectral changes of enzymatic and acidic extractions.
3.3 Experimental considerations Enzyme-extracted pectins possess higher amounts of neutral sugars than acid-extracted pectins, as
substantiated in Paper I. In this study this fact was confirmed by the analysis of FTIR peaks of enzyme-
and acid-extracted pectins. Microarray analysis, however, did not confirm the presence of neutral sugar
side chains in case of enzyme-extracted pectin, which suggests that they were detached from the pectin
chain and hence were not immobilized on glass slides. Smaller oligosaccharides and monosaccharides
were not expected to immobilize onto the membrane and would therefore be washed off. If RGI side
chains were degraded by the enzyme mixture, they would be cleaved into smaller fragments. These
fragments were detectable by FTIR measurements of the extract solutions, but when printing extracts
53
54
containing these fragments, they would most likely be too small to immobilize efficiently and therefore
they would not give raise to any antibody signals.
Additionally, FTIR and carbohydrate microarrays suggested that enzymatically extracted samples
contained pectin with higher degree of esterification in relation to pectin extracted by HNO3, which was
in agreement with the conclusions from Paper I. Moreover, the carbohydrate microarray results suggested
that acid-extracted pectin contained additional regions with low degree of esterification, which could not
be found in the enzyme-extracted pectin.
In carbohydrate microarray analysis, the specific binding of antibodies with specific epitopes is utilized to
obtain information about the sample deposited on the array. Within a certain dynamic range, the higher
the concentration of the deposited sample, the greater is the spot signal produced by antibody or CBM
binding. Such arrays therefore provide direct information about the relative abundance of specific
epitopes across the sample set tested. Nevertheless, the exact structure of the epitopes and the affinity of
an antibody towards different epitopes are not known. Hence, the lack of antibody signal specific to e.g.
HE pectin, does not mean that this structure is not present in the sample, but that some characteristic
structural motifs (epitopes) are not present.
3.4 Conclusions The study illustrated that it was possible to use FTIR and carbohydrate microarrays combined with
chemometrics to predict pectin yield and characterize pectin crude extract. Both methods showed
characterization abilities and helped understand the structural differences between acid- and enzyme-
extracted pectin.
The results suggested a major difference between enzymatic and acidic crude pectin extracts in the degree
of esterification and abundance of RGI pectic regions. While FTIR indicated high amounts of neutral
sugars for enzymatic extracted samples, carbohydrate microarray results suggested that those
oligosaccharides have been cleaved from the pectin and only existed independently in solution. That
indicated the high relevance of choosing the appropriate enzymatic composition to obtain pectin with
desired structural features.
54

55
FTIR, carbohydrate microarray and multivariate analysis for
assessing pectin extracts.
Andreas Baum a, b, &, Malgorzata Dominiak a, c, &, Silvia Vidal-Melgosa d, William G.T. Willats d, Karen
Marie Søndergaard c, Per Waaben Hansenb, Anne S. Meyera, Jørn Dalgaard Mikkelsen a, *
a Center for BioProcess Engineering, Department of Chemical and Biochemical Engineering, Technical
University of Denmark, DK-2800 Lyngby, Denmark
b Foss Analytical, Foss Allé 1, DK-3400 Hillerød, Denmark
c DuPont Nutrition Biosciences ApS, Department of Hydrocolloid Science, Edwin Rahrs Vej 38, DK-
8220 Brabrand, Denmark
dDepartment of Plant and Environmental Sciences, Faculty of Science, University of Copenhagen,
Thorvaldsensvej 40, DK- 1871 Frederiksberg C, Denmark
& Equal contributors
* Corresponding Author. Tel: +45 4525 2938; fax: +45 4593 2906. E-mail address: [email protected]
55

56
Abstract
Pectin production is complex and final product quality assessment is generally accomplished at the end of
the process using time-consuming off-line laboratory analysis. In this study Fourier transform infrared
spectroscopy (FTIR) and carbohydrate microarrays, combined with chemometrics, were employed to
predict pectin yields and structural features. Using crude lime peel extracts, both FTIR and carbohydrate
microarray analysis showed predictive and descriptive abilities on pectin samples extracted either by acid
or enzymes. Furthermore, FTIR determined the optimal extraction time for the enzymatic and acidic
extraction processes, respectively. The combined results of the two methods suggested major differences
in crude pectin extracts generated either by enzymes or acid. Enzymatic extracted pectin showed both
higher esterification (DE=82%) and had a more homogenous degree of esterification, whereas acidic
extracted pectin had a lower degree of esterification (DE=67%) and showed very heterogeneous esterified
pectin, when probed with the monoclonal antibodies JIM5, JIM7 and LM20.
Keywords: Pectin extraction, Chemometrics, Fourier transform infrared spectroscopy, Partial Least
Squares Regression, Antibodies, Homogeneous esterification
56
57
Introduction Pectin designates a family of plant cell wall polysaccharides, which are principally made up of four
structural units: homogalacturonan, xylogalacturonan, rhamnogalacturonan type I (RGI), and
rhamnogalacturonan type II (RGII). Homogalacturonan consists of an unbranched chain of -1, 4-linked
galacturonic acid residues, which may be methyl-esterified and/or acetylated, and which may be
intervened by rhamnose residues (Voragen, Beldman, & Schols, 2001). Homogalacturonan is the
quantitatively most dominant component in commercial “pectin”, which are the hydrocolloids used in
foods and in other products such as pharmaceuticals, personal care, cosmetics, thickening and gelation
agents. Pectin is approved for food use in the European Union (E440 (i) and E440 (ii)), and is usually
produced by extraction from apple pomace and citrus peels (lemon, lime and orange). Recently,
significant efforts have been made to develop pectin extraction methods that are more sustainable than the
classical acid-assisted extraction, by e.g. using enzymes instead of acid (Zykwinska et al. 2008; Lim,
Yoo, Ko, & Lee, 2012) or by employing new heating strategies in order to lower the energy expenditure
(Rudolph, & Petersen, 2011). Nevertheless, current industrial practice for large scale pectin production
involves extended acid extraction of the raw material, usually involving HNO3 treatment for 3-12 h at 50-
90°C (Rolin, Nielsen, & Glahn, 1998). Final pectin product quality assessment includes a number of
classical, empirical laboratory tests such as measurements of intrinsic viscosity, calcium sensitivity, as
well as size exclusion chromatography for molecular weight assessment and high performance liquid
chromatography for monosaccharide composition analysis.
Fourier transform infrared spectroscopy (FTIR) is based on the measurement of absorption in the mid-
infrared frequency range. Since organic molecules have intra- and intermolecular bonds that absorb in
this frequency range, each spectrum obtained will reflect the chemical (structural) composition of the
sample being analyzed. Hence, FTIR, in combination with appropriate chemometric methodology
required to extract patterns in the spectra obtained, is a rapid, non-destructive analytical method
(Kuligowski, Cascant, Garrigues, & de la Guardia, 2012), that can be employed for a number of complex,
analytical applications, including quality assessment once proper calibrations have been developed. FTIR
has thus proven useful for detecting e.g. the authenticity and adulteration of milk (Nicolaou, & Goodacre,
2010) and virgin olive oil samples (Rohman, & Man, 2010), and has more recently shown applicability
within more advanced applications such as “temporal evolution profiling” for fingerprinting of enzymatic
modifications and extractions of carbohydrates (Baum et al., 2013).
Carbohydrate microarrays are chip-based tools to study interactions of biomolecules with carbohydrates,
and thus represent a different kind of methodology for advanced carbohydrate analyses than FTIR (de
57

58
Paz& Seeberger, 2012). Thousands of binding events can be assessed in parallel on a single slide with
very small amounts of samples, making this analysis very high throughput (Fangel et al., 2012).
Carbohydrate microarrays are applied in medical, animal, and prokaryote research (de Paz & Seeberger,
2012; Fangel et al., 2012), but have also been found to be a valuable tool in pectin research, and HG-
directed monoclonal antibodies, differing in relation to pattern and degree of esterification have been
developed and applied for analysis of plant cell walls (Clausen, Willats, & Knox, 2003; Sørensen &
Willats, 2011).
The hypothesis of this study was that FTIR and carbohydrate microarrays might be useful in assessing
pectin yields and notably for detecting subtle differences in enzymatically versus chemically extracted
pectin. The objective of this work was therefore to assess the applicability and the knowledge obtainable
by FTIR and carbohydrate microarrays. Using crude pectin extracts, obtained by acidic and enzymatic
treatment of lime peels, both techniques were compared with respect to quantitative and qualitative
analytical abilities, i.e. yield assessment and structural characterization, such as degree of esterification
and levels of hairy regions of the differently extracted pectin.
Materials and Methods Three pectin extractions were performed and both crude pectin extracts and precipitated pectin were
examined. Pectin extraction I and II were conducted enzymatically using Laminex C2K, while extraction
III was conducted using HNO3. Extraction II, used for verification of the chemometric model, was
conducted as extraction I, but with fewer time points (as detailed in Table 1).
Aliquots of the crude extractions I-III were analyzed using FTIR spectroscopy and carbohydrate
microarray analysis and resulted in two separate data sets for individual chemometric analysis. The
corresponding pectin yields were determined by propan-2-ol precipitation. These pectin yields were used
as reference values for calibration of multivariate regression models. Samples from extraction II were
used for testing and validation of the established chemometric models. The individual techniques and
(chemometric) methods are described in further detail below.
Materials and chemicals Dry lime peel was obtained from DuPont’s pectin plant in Mexico (Dupont Nutrition and Biosciences
Mexicana S.R.L, Tecomán, Colima, Mexico). The pretreatment involved milling of the peel to pass a 35-
mesh size screen (centrifugal mill Retsch ZM 200, Haan, Germany). Several standard polysaccharides
were used as benchmarks in the final analytical evaluation, namely pectin E81 from lime peel, with a
degree of esterification (DE) of 81%, pectin F31 (DE 31%) derived from E81 treated with Aspergillus
58

59
niger’s pectin methyl esterase (both from DuPont Nutrition Biosciences, Brabrand, Denmark), prepared
as described in Limberg et al. (2000), and RGI from soy bean, purchased from Megazyme (Bray, Ireland).
The commercial enzyme preparation, Laminex C2K, derived from Penicillium funiculosum (obtained
from DuPont Industrial Biosciences, Leiden, The Netherlands) contained cellulase, xylanase and
arabinoxylanase activities and a low level of pectinase activity.
Enzymatic extraction
For each pectin sample, 1.35 g of milled lime peel was mixed with 40 ml of 50 mM citric acid buffer pH
3.5. The mixture was heated to 50°C before addition of 75 l of the enzyme Laminex C2K, equivalent to
235 carboxymethylcellulose-dinitrosalicylic acid activity units. After addition, the sample was incubated
in a water bath at 190 rpm for 0-240 minutes (exact incubation times for extractions I and II are presented
in Table 1). In each case, the reaction was terminated by heating at 100°C for 5 min to inactivate the
enzyme. The crude extract was separated from the residual biomass by centrifugation for 10 min at 3500
rpm and stored at -20°C until further analyses.
Acidic extraction For each acidic extracted pectin sample, 1.35 g lime peel was mixed with 40 ml deionized water and the
mixture was heated to 70°C. The pH was adjusted to 1.7 with 42% nitric acid and the mixture was then
incubated in a water bath at 190 rpm (more details about the incubation times in Table 1). The crude
extract was separated from the residual biomass by centrifugation for 10 min at 3500 rpm and stored at
-20°C until further analyses.
Determination of pectin yield
Pectin crude extracts were precipitated by mixing with a double volume of propan-2-ol, followed by
agitation for one hour. The precipitated pectin samples were separated by filtration through a cotton
canvas and dried overnight in a 40°C ventilated oven. Dried pectin samples were weighted and ground to
<0.5 mm in an Ultra Centrifugal Mill ZM 200 (Retsch, Haan, Germany). Pectin yields, expressed in
grams per 1.35 gram of the substrate, are presented in Table 1.
FTIR
An aliquot of crude extract was used to acquire the mid-infrared spectrum between 950 cm-1 and 1550
cm-1. All spectra were obtained using a MilkoScanTM FT2 (FOSS ANALYTICAL, Hillerød, Denmark).
The instrument consisted of an interferometer, which scanned the IR spectrum using a cuvette with a path
length of 50 m. Acquisition was carried out at 42 C with an optical resolution of 14 cm-1. All spectra
have been measured against an aqueous blank (FOSS Analytical, Hillerød, Denmark).
59

60
Carbohydrate Microarray analysis
Extracted pectin microarray printing
Crude extracts were 10-fold diluted with printing buffer (55.2% glycerol, 44% water, 0.8% Triton X-
100). Each dilution was printed in triplicate with six drops per spot. A piezoelectric microarray robot,
ArrayjetSprint (Arrayjet, Roslin, UK), equipped with a 12-sample high capacity JetSpyder sample pick-
up device was used to deposit the crude extracts onto a nitrocellulose membrane with a pore size of 0.45
m (Whatman, Maidstone, UK) at 22.5°C and 50% humidity. As positive controls, the three pectin
samples, E81, F31 and RGI (described earlier) were also deposited on the nitrocellulose membrane.
Extracted pectin microarray probing
Microarrays were blocked for 1 hour in PBS (140 mM NaCl, 2.7 mM KCl, 10 mM Na2HPO4, 1.7 mM
KH2PO4, pH 7.5) containing 5% w/v low fat milk powder (5%M-PBS). Thereafter, microarrays were
probed for 2 hours with a panel of 30 anti-rat antibodies, anti-mouse antibodies and carbohydrate binding
modules (CBMs) diluted in 5% M-PBS to 1/10, 1/1000 and 10 g/ml respectively. The antibodies and
CBMs were obtained from PlantProbes (Leeds, UK), INRA (Nantes, France), BioSupplies (Bundoora,
Australia) and NZYTech (Lisboa, Portugal), respectively. Afterwards arrays were washed with PBS and
incubated for 2 hours in either anti-rat, anti-mouse or anti-His tag secondary antibodies conjugated to
alkaline phosphatase (Sigma, Poole, UK) diluted 1/5000 (for anti-rat and anti-mouse) or 1/1500 (for anti-
His tag) in 5 % M-PBS. After the incubation, arrays were washed with PBS and developed with a
solution of 5-bromo-4-chloro-3-indolylphosphate and nitro blue tetrazolium in alkaline phosphatase
buffer (100 mM NaCl, 5 mM MgCl2, 100 mM diethanolamine, pH 9.5). Development was stopped by
washing the arrays in deionized water.
Quantification of the data
Developed microarrays were scanned at 2400 dpi (CanoScan 8800F, Canon, Søborg, Denmark),
converted to TIFF files and antibody and CBM signals were quantified using Array-Pro Analyzer 6.3
(Media Cybernetics, Rockville, USA). Results were presented in a heatmap, where the maximal mean
spot signal was set to 100 and the rest of values normalized accordingly. A cut off of 5 was implemented
and color intensity was correlated to mean spot signals.
Chemometrics
Chemometric modeling was done using MATLAB (The Mathworks Inc., MA, USA) and PLS Toolbox
6.0.1 (Eigenvector Research Inc., WA, USA).
60
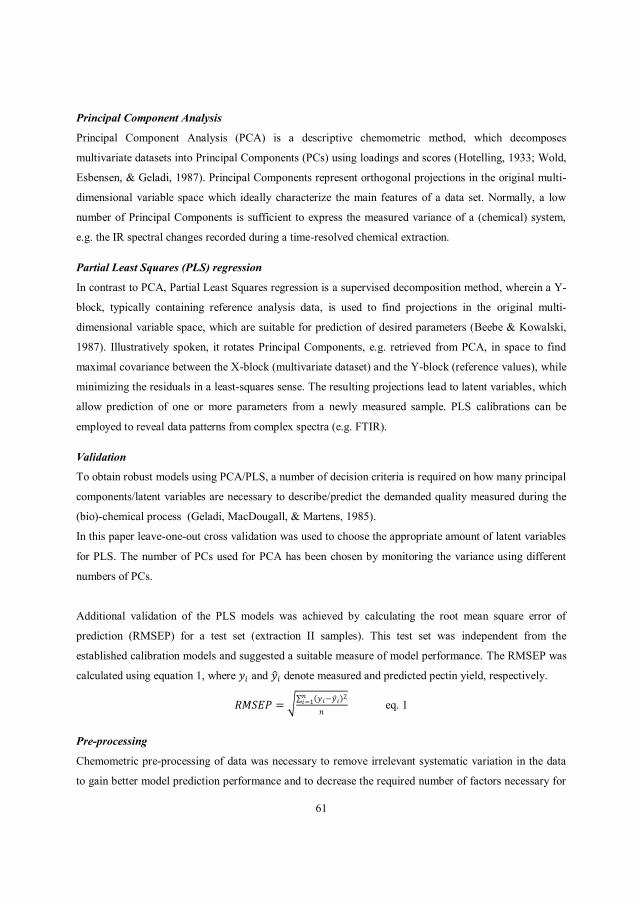
61
Principal Component Analysis
Principal Component Analysis (PCA) is a descriptive chemometric method, which decomposes
multivariate datasets into Principal Components (PCs) using loadings and scores (Hotelling, 1933; Wold,
Esbensen, & Geladi, 1987). Principal Components represent orthogonal projections in the original multi-
dimensional variable space which ideally characterize the main features of a data set. Normally, a low
number of Principal Components is sufficient to express the measured variance of a (chemical) system,
e.g. the IR spectral changes recorded during a time-resolved chemical extraction.
Partial Least Squares (PLS) regression
In contrast to PCA, Partial Least Squares regression is a supervised decomposition method, wherein a Y-
block, typically containing reference analysis data, is used to find projections in the original multi-
dimensional variable space, which are suitable for prediction of desired parameters (Beebe & Kowalski,
1987). Illustratively spoken, it rotates Principal Components, e.g. retrieved from PCA, in space to find
maximal covariance between the X-block (multivariate dataset) and the Y-block (reference values), while
minimizing the residuals in a least-squares sense. The resulting projections lead to latent variables, which
allow prediction of one or more parameters from a newly measured sample. PLS calibrations can be
employed to reveal data patterns from complex spectra (e.g. FTIR).
Validation
To obtain robust models using PCA/PLS, a number of decision criteria is required on how many principal
components/latent variables are necessary to describe/predict the demanded quality measured during the
(bio)-chemical process (Geladi, MacDougall, & Martens, 1985).
In this paper leave-one-out cross validation was used to choose the appropriate amount of latent variables
for PLS. The number of PCs used for PCA has been chosen by monitoring the variance using different
numbers of PCs.
Additional validation of the PLS models was achieved by calculating the root mean square error of
prediction (RMSEP) for a test set (extraction II samples). This test set was independent from the
established calibration models and suggested a suitable measure of model performance. The RMSEP was
calculated using equation 1, where and denote measured and predicted pectin yield, respectively.
eq. 1
Pre-processing
Chemometric pre-processing of data was necessary to remove irrelevant systematic variation in the data
to gain better model prediction performance and to decrease the required number of factors necessary for
61
62
the analyses. The FTIR data were normalized using Standard Normal Variate (SNV) (Barnes, Dhanoa, &
Lister, 1989) followed by mean-centering (van den Berg, Hoefsloot, Westerhuis, Smilde, & van der Werf,
2006). The carbohydrate microarray data were auto-scaled (van den Berg et al., 2006) and mean-centered.
While SNV is typically used for spectroscopic techniques to remove light scattering effects, auto-scaling
is used when variables indicate different units.
Monomeric composition of precipitated pectin samples
After hydrolysis of pectin in 1 M sulphuric acid (6 h, 100°C), the neutral sugars were quantitatively
determined by High Performance Anion Exchange Chromatography with Pulsed Amperometric Detection
(HPAEC-PAD). Before hydrolysis, each pectin sample was washed three times in 80% ethanol, followed
by washing one time in 96% ethanol to remove sugars. After hydrolysis, each sample was diluted and
filtered through a 0.45 m filter. The content of D-fucose, L-rhamnose, D-arabinose, D-galactose, D-
glucose and D-xylose in pectin was determined. The separation and quantification was performed by
HPAEC-PAD using an ICS-3000 system (Dionex Corp., Sunnyvale, CA).
The columns used were CarboPac TM PA1 (4mm×250mm) analytical column and a CarboPac TM PA1
guard column. Eluent A consisted of deionised water and eluent B of 150 mM NaOH. 20 min isocratic
elution with 15 mM NaOH was followed by 10 min washing with 150 mM NaOH. The flow was kept at 1
ml/min. Before injection of each sample (50 l) the column was reequilibrated with 15 mM NaOH for 8
min. Analysis was made with the program Chromeleon 6.80 (Dionex Corp., Sunnyvale, CA).
Galacturonic acid content was determined colorimetrically by the m-hydroxybiphenyl method in a
microtiterplate format reaction (van den Hoogen et al., 1998) after hydrolysis for 1 h at 80°C in
concentrated sulphuric acid with 0.0125 M tetraborate (Blumenkranz & Asboe-Hansen, 1973).
Results Pectin was extracted by enzymes (extraction I and II) or by acid (extraction III), respectively (as detailed
in Table 1), and aliquots of each of the crude extracts were sampled during the extraction period at
specific time points. The crude pectin samples were measured by FTIR and carbohydrate microarray
analyses for structural characterization and purity assessment of the pectin and for establishing pectin
yield calibration models. Pectin yields were also determined for each sample by precipitation with
propan-2-ol.
62

63
Table 1. Pectin yields (g), obtained by propan-2-ol precipitation of the crude pectin extracts released from 1.35 g starting
material at a specific time point during enzymatic (extractions I and II) and acidic (extraction III) process. Values are
means of 2 measurements.
Pectin yield (g) Extraction time (min) Extraction I Extraction II Extraction III
0 0.09 0.09 0.11 2.5 0.13 5 0.14 0.12 0.19
7.5 0.15 10 0.15 0.15 0.20
12.5 0.16 15 0.17
17.5 0.18 20 0.18 35 0.20 30 0.21 0.22 0.26 35 0.23 40 0.23 45 0.23 50 0.23 55 0.23 60 0.25 0.25 0.29 70 0.26 80 0.27 90 0.28
100 0.29 110 0.28 120 0.29 0.30 0.31 240 0.31 0.33
FTIR
The time-resolved spectra of each of the three crude pectin extractions are shown in Figure 1. They are all
difference spectra, which mean that the initial spectrum was subtracted from the whole series to eliminate
background signals. The background signals contained various bands originating from the sample matrix
(including enzymes, HNO3 and salts), being present to a different extent in the enzyme- and acid-
extracted samples. The first spectrum resulted in a zero line, while spectra at later stages evolved
according to the release of soluble biopolymers (pectin) and oligosaccharides during extraction. The
elapsing time is illustrated by grey scale, shifting from dark to light.
63
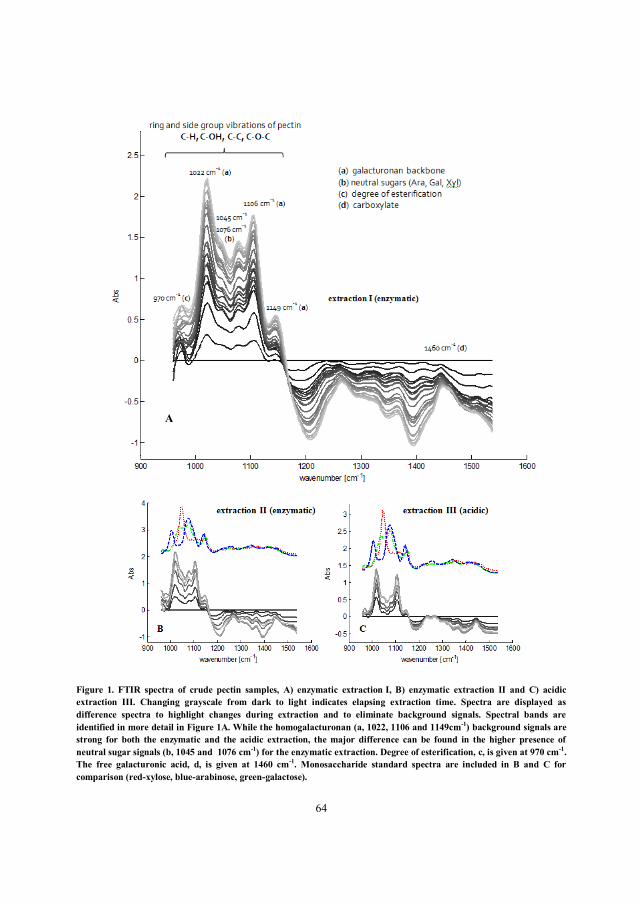
64
Figure 1. FTIR spectra of crude pectin samples, A) enzymatic extraction I, B) enzymatic extraction II and C) acidic extraction III. Changing grayscale from dark to light indicates elapsing extraction time. Spectra are displayed as difference spectra to highlight changes during extraction and to eliminate background signals. Spectral bands are identified in more detail in Figure 1A. While the homogalacturonan (a, 1022, 1106 and 1149cm-1) background signals are strong for both the enzymatic and the acidic extraction, the major difference can be found in the higher presence of neutral sugar signals (b, 1045 and 1076 cm-1) for the enzymatic extraction. Degree of esterification, c, is given at 970 cm-1. The free galacturonic acid, d, is given at 1460 cm-1. Monosaccharide standard spectra are included in B and C for comparison (red-xylose, blue-arabinose, green-galactose).
A
64

65
When investigating the spectra of the three extractions, it appears that the spectral evolutions of extraction
I and II are similar as expected, since these two extractions were done by enzyme catalysis, while the
spectra from acidic extraction III evolve differently. Spectral changes resulting from differential signals
due to interactions between extracted pectin and different solvents media are expected to be small
(Wellner, Ka uráková, Malovíková, Wilson, & Belton, 1998). Hence, the differences in the evolution of
the spectra of the acid- vs. the enzyme-extracted crude pectin samples are more likely a result of different
molecular properties of the pectin in the two types of extracted samples.
Individual spectral bands for pectin, including the backbone and side group vibration bands, were
identified in Figure 1A. The strong evolving peaks at 1022 cm-1, 1106 cm-1 and less abundant
at 1149 cm-1 (a) were due to the high homogalacturonan content (specifically due to C-C, C-O, CCH,
OCH vibrations) as reported earlier (Coimbra, Barros, Rutledge, & Delgadillo, 1999; Fellah, Anjukandi ,
Waterland, & Williams, 2009; Kacuráková, Capek, Sasinková, Wellner, & Ebringerová, 2000; Wellner et
al., 1998). The band at 1149 cm-1 is characteristic for C-O-C vibrations of glycosidic linkages (+
glycosidic ring) (Wellner et al., 1998) and is therefore also characteristic for pectin backbone structures.
Bands at 1045 cm-1 and 1076 cm-1 (b) were interpreted to be mainly caused by neutral sugars as
arabinose, xylose and galactose (Coimbra, Barros, A., Barros, M., Rutledge, & Delgadillo, 1998). For
comparison, the standard spectra of the three above mentioned sugars are included in Figures 1B and C.
FTIR spectra detected higher amounts of neutral sugars in the enzymatic vs. the acidic crude extracts.
This was especially evident when looking at the ratio of the two band groups (a) vs. (b) as shown in
Figure 1. The intensities of the (b) bands were relatively high for enzymatic samples, which suggested
higher amounts of neutral sugars in the enzymatic extracts (Figure 1 A and B), as compared to acidic
extracts (Figure 1C). As neutral sugars are mainly found in side-chains of pectin rhamnogalacturonan I
(RGI) structural domains, these bands could be interpreted as an indication of how branched the
investigated pectin was or how pure the crude extract was. However, the bands might also be a response
to the presumed free neutral sugars, which might be present independently in the crude extract.
An additional band at 970 cm-1 (c) indicated the degree of esterification. Accordingly, at 1460 cm-1 (d)
one can observe a carboxylate band which tends to be weaker, when highly esterified pectin is present.
Using the knowledge retrieved from Coimbra et al. (1998), Coimbra et al. (1999), Fellah et al. (2009),
Kacuráková et al . (2000), Wellner et al. (1998) and comparing the spectra with the monosaccharide
standard spectra in Figure 1, it could be concluded that the degree of esterification (DE) of the enzymatic
extracted pectin was higher than of acidic extracted pectin. However, the exact DE was not determined by
65

66
FTIR, as it was not the scope of this study. The DE was, however, quantified by chemical analysis, and
the DEs for acidic and enzymatic extracted pectins were 67% and 82%, respectively (in agreement with
the FTIR observation).
Principal Component Analysis
PCA was utilized to analyze the spectral changes of the crude pectin samples, extractions I and II in one
common model (Figure 2A) and extraction III in a separate model (Figure 2B).
Both PCA models required only one Principal Component to describe 97.3% and 98.6% of the variance
in the spectra, respectively. This was not surprising since the extraction pattern is expected to stay
constant over the whole time period in both cases, meaning that the action of e.g. the enzyme does not
change with time. The spectral loadings for both PCA models are given in Figure 2C and D and appear as
expected for neutral sugar rich and less neutral sugar rich material, respectively.
Figure 2. PC1 scores derived from PCA models plotted against extraction time for A) crude enzymatic extraction I (circles) and II
(triangles) and for B) the crude acidic extraction III. As extraction time elapses, the spectral changes converge around 120 min in both
cases, indicating that no additional pectin was released thereafter. PCA loadings are given in C) and D) and describe the main spectral
features of enzymatic crude pectin extracts (extraction I and II) and acidic crude pectin extracts (extraction III). Characteristic band
regions for neutral sugars are marked in both loadings with an arrow.
A B
PCPC
D C
PC1 PC1
66

67
As shown in Figure 1, the spectra converge for all three extractions with elapsing time. In addition, the
time-resolved scores of the individual PCA models also converge as shown in Figure 2A and B. This
observation was confirmed by reference analysis of the pectin yield, prepared from the crude pectin
samples by precipitation with propan-2-ol. In fact the Principal Component one scores of both PCA
models correlated to a high extend (R2> 0.92) with the estimated pectin yield, determined by propan-2-ol
precipitation. However, calibration models were approached using PLS and will be discussed in the
following section.
Nevertheless, the evolution of three different crude pectin extractions could be monitored by FTIR. The
method enabled possibilities to optimize the extraction time, as the spectral change after 120 min
declined, and therefore indicated no release of additional pectin in all three extraction cases.
Partial Least Squares Regression
PLS models were developed for i) extraction I (model 1); and for ii) extractions I and III (model 2) as
presented in Figure 3. In both cases the extraction II samples were used as a prediction test set for
validation of the model. The calibrations are presented in Figure 3A and B, whereas their performance
parameters are presented in Table 2. Calibration models were obtained using leave-one-out cross
validation (calibration samples indicated as circles), while the pectin yields of the extraction II samples
were predicted using the obtained models (triangles).
Figure 3. FTIR models A) PLS model 1 calibrated on crude enzymatic extraction I (circles) and tested on crude enzymatic
extraction II (triangles). B) PLS model 2 calibrated on crude extraction I and III (acidic extraction) (circles) and tested on
crude extraction II (triangles). Pectin yields (g), depicted on the x-axis, were obtained by propan-2-ol precipitation of the
crude pectin extracts, released from 1.35 g of the starting material. Predicted yields (g), depicted on the y-axis, were
obtained from PLS modeling of FTIR spectral data of the crude extracts. Yield of 0.3 g corresponds to 0.3/1.35=22%.
A B
67
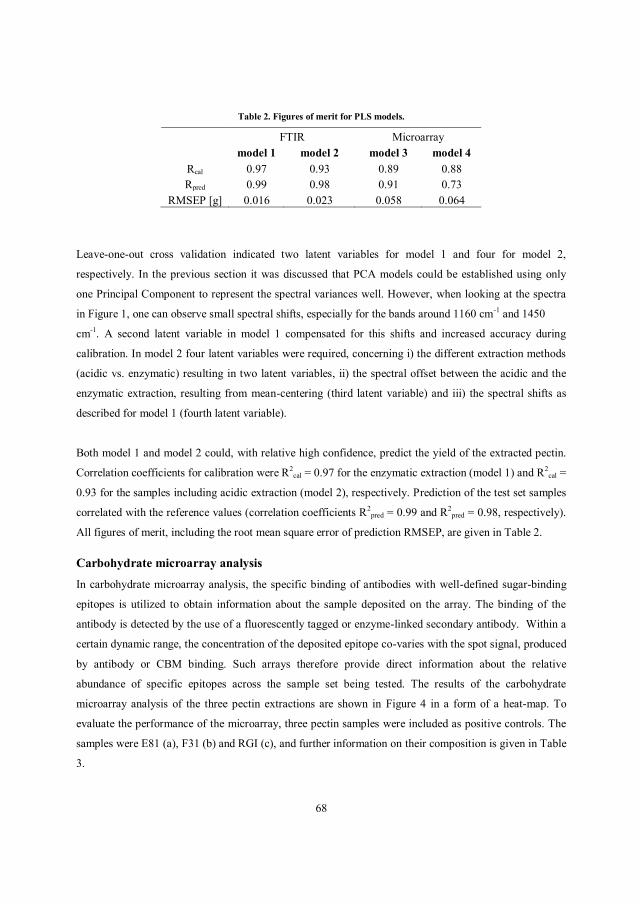
68
Table 2. Figures of merit for PLS models.
FTIR Microarray model 1 model 2 model 3 model 4
Rcal 0.97 0.93 0.89 0.88 Rpred 0.99 0.98 0.91 0.73
RMSEP [g] 0.016 0.023 0.058 0.064
Leave-one-out cross validation indicated two latent variables for model 1 and four for model 2,
respectively. In the previous section it was discussed that PCA models could be established using only
one Principal Component to represent the spectral variances well. However, when looking at the spectra
in Figure 1, one can observe small spectral shifts, especially for the bands around 1160 cm-1 and 1450
cm-1. A second latent variable in model 1 compensated for this shifts and increased accuracy during
calibration. In model 2 four latent variables were required, concerning i) the different extraction methods
(acidic vs. enzymatic) resulting in two latent variables, ii) the spectral offset between the acidic and the
enzymatic extraction, resulting from mean-centering (third latent variable) and iii) the spectral shifts as
described for model 1 (fourth latent variable).
Both model 1 and model 2 could, with relative high confidence, predict the yield of the extracted pectin.
Correlation coefficients for calibration were R2cal = 0.97 for the enzymatic extraction (model 1) and R2
cal =
0.93 for the samples including acidic extraction (model 2), respectively. Prediction of the test set samples
correlated with the reference values (correlation coefficients R2pred = 0.99 and R2
pred = 0.98, respectively).
All figures of merit, including the root mean square error of prediction RMSEP, are given in Table 2.
Carbohydrate microarray analysis
In carbohydrate microarray analysis, the specific binding of antibodies with well-defined sugar-binding
epitopes is utilized to obtain information about the sample deposited on the array. The binding of the
antibody is detected by the use of a fluorescently tagged or enzyme-linked secondary antibody. Within a
certain dynamic range, the concentration of the deposited epitope co-varies with the spot signal, produced
by antibody or CBM binding. Such arrays therefore provide direct information about the relative
abundance of specific epitopes across the sample set being tested. The results of the carbohydrate
microarray analysis of the three pectin extractions are shown in Figure 4 in a form of a heat-map. To
evaluate the performance of the microarray, three pectin samples were included as positive controls. The
samples were E81 (a), F31 (b) and RGI (c), and further information on their composition is given in Table
3.
68
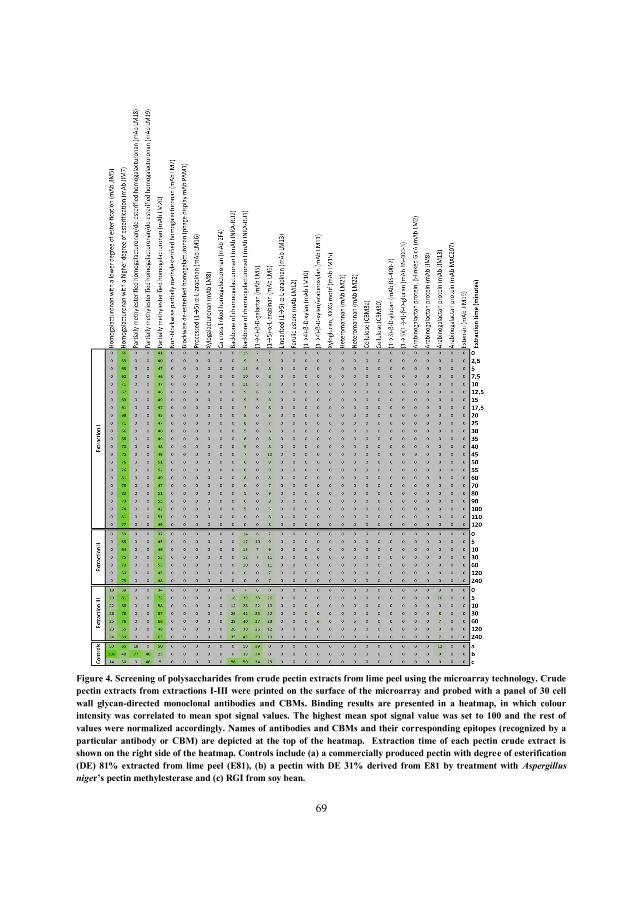
69
Figure 4. Screening of polysaccharides from crude pectin extracts from lime peel using the microarray technology. Crude pectin extracts from extractions I-III were printed on the surface of the microarray and probed with a panel of 30 cell wall glycan-directed monoclonal antibodies and CBMs. Binding results are presented in a heatmap, in which colour intensity was correlated to mean spot signal values. The highest mean spot signal value was set to 100 and the rest of values were normalized accordingly. Names of antibodies and CBMs and their corresponding epitopes (recognized by a particular antibody or CBM) are depicted at the top of the heatmap. Extraction time of each pectin crude extract is shown on the right side of the heatmap. Controls include (a) a commercially produced pectin with degree of esterification (DE) 81% extracted from lime peel (E81), (b) a pectin with DE 31% derived from E81 by treatment with Aspergillus niger’s pectin methylesterase and (c) RGI from soy bean.
69

70
From the heat-map data, assessing the microarray responses of 30 different antibodies and CBMs, it is
evident that predominantly pectin related epitopes were detected in the crude pectin samples. There was,
however, a clear difference in the profile of both the enzymatic extractions I and II and the acidic
extraction III. All crude extracts obtained during the acidic extraction III showed interactions with mAb
JIM5, a monoclonal antibody recognizing homogalacturonan with a low degree of esterification (DE). In
addition, JIM5 also recognized the epitopes of the control pectin (b, F31) with high affinity, confirming
the presence of a homogalacturonan structure with lower degree of esterification in the acidic extracted
pectin. In contrast, no JIM5 signal was detected for any of the enzymatically extracted samples. Instead,
relatively strong signals from mAb JIM7 and LM20, two monoclonal antibodies recognizing
homogalacturonan with a higher DE, were observed suggesting that the enzymatic crude extracts
contained pectin with a relatively high DE. It also indicates that the acid-extracted pectin contains both
low and high DE pectin and therefore is much more heterogeneous in the methylation pattern than the
enzyme-extracted pectin. The high degree of esterification (DE=82%) of enzymatic extracted pectin and
the lower DE (67%) of the acidic extracted pectin (Table 3) corroborates with this observation in the
micro-array.
PLS
When analyzing the obtained heat-map signals column-wise for each of the 30 antibodies/CBMs (Figure
4), none could be directly identified to correlate with the extracted amount of pectin. However, when
combining all 30 antibodies and CBM responses using methods, such as PLS regression, a correlation did
occur. Moreover, using PLS, the important descriptive and predictive antibodies were identified across
the heatmap. As performed for FTIR, two models were established (Figure 5). Model 3 (Figure 5A) was
calibrated on crude extraction samples I, while crude extraction samples II were used as the prediction
test set. Model 4 (Figure 5B) was calibrated on crude extraction III, followed by validation using the
crude extraction II samples.
70

71
Figure 5. Microarray models A) PLS model 3 calibrated on crude extraction I (circles) and tested on crude extraction II (triangles). B) PLS model 4 calibrated on crude extraction III (circles) and tested on crude extraction II (triangles). Pectin yields (g), depicted on the x-axis, were obtained by propan-2-ol precipitation of the crude pectin extracts, released from 1.35 g of the starting material. Predicted yields (g), depicted on the y-axis, were obtained from PLS modeling of FTIR spectral data of the crude extracts. Yield of 0.3 g corresponds to 0.3/1.35=22%.
The established PLS models and their calibration parameters are presented in Figure 5 and Table 2. The
correlation coefficients for the PLS calibrations were R2cal = 0.89 and R2
cal = 0.88 for model 3 and model
4, respectively. Prediction test sets indicated correlations coefficients of R2pred = 0.91 and R2
pred = 0.73 for
model 3 and 4, respectively. These high R2 values signified strong correlations in the data sets.
The number of latent variables was determined by leave-one-out cross validation. While only two latent
variables were used for modeling the enzymatic extraction (model 3), five were necessary to build a
combined model for acidic and enzymatic extraction (model 4). This was not surprising when looking at
the microarray heat-map (Figure 4), showing that the signal pattern was very different for the enzymatic
and the acidic extractions. Especially JIM5 antibodies and antibodies recognizing RGI regions gave
strong response mainly for crude samples from the acidic extraction, which led to a higher rank in the
data.
To reveal any covariance or associated properties in the different antibody binding patterns for enzymatic
and acidic crude pectin extracts, a bi-plot of the first two latent variables from model 4 was created
(Figure 6). Sample scores are indicated as triangles, while antibody loadings are illustrated as squares.
While certain antibodies showed higher impact for PLS modeling, others seemed to be insignificant by
showing zero abundance (or close to zero) on both loadings. This was expected due to the high degree of
sparsity in the carbohydrate microarray heat-map. In other words, the signal was constantly zero for
certain antibodies or did not significantly change during extraction. Hence, a zero loading abundance for
those antibodies showed that they did not have predictive ability during enzymatic or acidic extraction.
A B
71
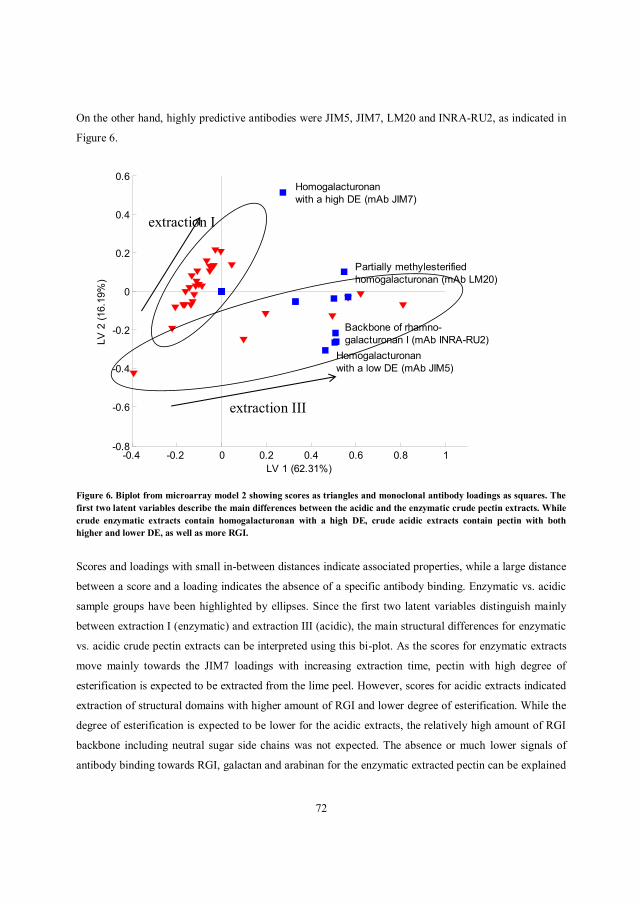
72
On the other hand, highly predictive antibodies were JIM5, JIM7, LM20 and INRA-RU2, as indicated in
Figure 6.
Figure 6. Biplot from microarray model 2 showing scores as triangles and monoclonal antibody loadings as squares. The first two latent variables describe the main differences between the acidic and the enzymatic crude pectin extracts. While crude enzymatic extracts contain homogalacturonan with a high DE, crude acidic extracts contain pectin with both higher and lower DE, as well as more RGI.
Scores and loadings with small in-between distances indicate associated properties, while a large distance
between a score and a loading indicates the absence of a specific antibody binding. Enzymatic vs. acidic
sample groups have been highlighted by ellipses. Since the first two latent variables distinguish mainly
between extraction I (enzymatic) and extraction III (acidic), the main structural differences for enzymatic
vs. acidic crude pectin extracts can be interpreted using this bi-plot. As the scores for enzymatic extracts
move mainly towards the JIM7 loadings with increasing extraction time, pectin with high degree of
esterification is expected to be extracted from the lime peel. However, scores for acidic extracts indicated
extraction of structural domains with higher amount of RGI and lower degree of esterification. While the
degree of esterification is expected to be lower for the acidic extracts, the relatively high amount of RGI
backbone including neutral sugar side chains was not expected. The absence or much lower signals of
antibody binding towards RGI, galactan and arabinan for the enzymatic extracted pectin can be explained
-0.4 -0.2 0 0.2 0.4 0.6 0.8 1-0.8
-0.6
-0.4
-0.2
0
0.2
0.4
0.6
LV 1 (62.31%)
LV 2
(16.
19%
)
Homogalacturonan with a low DE (mAb JIM5)
Homogalacturonan with a high DE (mAb JIM7)
Partially methylesterified homogalacturonan (mAb LM20)
Backbone of rhamno- galacturonan I (mAb INRA-RU2)
extraction III
extraction I
72

73
by the fact that the enzyme mixture might contain some arabinases, galactanases and RGI degrading
enzymes, leading to decline of the corresponding antibody signals. All extracted liquids were spotted onto
nitrocellulose membrane and polysaccharides bounded to the membrane by non-covalent passive
adsorption. Smaller oligosaccharides and monosaccharides were not expected to be immobilized and
would be washed off. If RGI side chains were degraded by the enzyme mixture, they would be cleaved
into smaller fragments and most likely be too small to immobilize efficiently to the nitrocellulose
membrane.
Chemical composition of precipitated pectin
To verify the information on the structure of acid- and enzyme-extracted pectin, provided by FTIR and
carbohydrate microarray analyses, the chemical composition of the propan-2-ol precipitated pectin
samples was determined. To compare the different responses of the antibodies and cell wall binding
domains, the composition analysis of the three pectin standards were also determined. The content of
galacturonic acid and neutral sugars was presented in Table 3.
Table 3. Chemical composition of enzymatic (extraction II) and acidic(extraction III) extracted pectin samples after 240 min reaction. Precipitation of both pectin samples was performed in propan-2-ol. Values are means of 2 measurements ± standard deviation. Means that do not share a letter within a column are significantly (p < 0.05) different. Samples E81, F31 and RGI were added for comparison.
Galacturonic
acid Arabinose Fucose Galactose Glucose Rhamnose Xylose
Enzyme
extracted
pectin
81.3±2.0b*** 9.3±0.3a 0.1±0.0a 1.7±0.1c 1.6±0.1a 0.8±0.1b 0.7±0.0a
Acid
extracted
pectin
90.1±2.0a**** 3.3±0.0b 0.1±0.0a 3.9±0.0a 0.4±0.0b 1.4±0.0a 0.2±0.0b
F 31 74.5* 0.2±0.0c 0.1±0.0a 3.3±0.2b 0.1±0.0d 1.0±0.1b 0.1±0.0c
E 81 78.7* 0.2±0.0c 0.1±0.0a 4.0±0.1a 0.2±0.0c 1.3±0.0a 0.1±0.0c
RGI from
soybean 51** 3.4** 10.3** 12.3** n.d. 6.4** 13.7**
*data from Limberg et al. (2000); **data from the manufacturer specification sheet; ***Degree of Esterification DE = 82%; **** Degree of
Esterification DE = 67%
73

74
Enzyme-extracted pectin contained relatively higher levels of arabinose and galactose, glucose, rhamnose
and xylose. On the contrary, acid- extracted pectin contained lower level of arabinose and significant
amounts of galactose and rhamnose. The total neutral sugar level of enzyme-extracted pectin reached
approx. 14%, whereas in case of acid-extracted pectin it was approx. 9% by weight. The higher content of
neutral sugars in enzyme-extracted pectin was in agreement with the FTIR analysis on the crude pectin
extract. On the contrary, in the crude extract, the carbohydrate microarrays detected higher amounts of
RGI, galactan and arabinan epitopes in acidic extract as compared to the enzymatic process. In addition,
the microarray also detected relatively more of homogalacturonan with a lower degree of esterification in
the crude acidic pectin extract than in the enzymatic extract. As expected, the control sample, F31 (b),
containing only 31% methyl esters, showed enhanced level of low ester pectin. The contemplation of the
measurements thus showed that the microarray analysis detected relatively more heterogeneity in the
crude acid extract than that of the enzymatic extracts. In contrast FTIR detected several neutral sugars in
the crude enzymatic extract in comparison with that of the crude acidic extract. The data may reflect that
some of the neutral pectin oligomers present in the enzymatic extract did not bind properly to the
nitrocellulose membrane in the microarray, but further work is required to confirm this. Nevertheless, the
analysis of the precipitated pectin composition (Table 3) showed that both extraction methods delivered a
pectin product very rich in galacturonic acid – and since both methodologies gave a higher than 65% by
weight of galacturonic acid in the precipitate, both methods were in essence valid pectin extraction
methods.
Discussion In this study two multivariate techniques, namely FTIR and carbohydrate microarray analysis were used
to analyze crude pectin extracts before propan-2-ol precipitation. Both methods could predict the pectin
extraction yield well using PLS modeling. PLS models 2 and 4, which included the crude acidic
extraction III samples, had lower prediction performance for both FTIR and microarray analysis. In
particular, the yield prediction ability for carbohydrate microarray data decreased more severely, when
including the crude acidic extraction III. The higher RMSEP did not only result from a worse precision,
but also from a bias induced by the prediction samples itself. This bias is evident by the fact that both
models 3 and 4 predicted all test set samples (extraction II) with a lowering offset (Table 2). This bias was
not recognizable for predictions using the FTIR models 1 and 2.
FTIR and carbohydrate microarrays provided the insight into the structural properties of the crude pectin
extracts and provided complementary information. FTIR detected a high amount of neutral sugars in the
enzymatic samples, which was in agreement with compositional analysis of precipitated pectins (Table 3)
74

75
and literature data (Nielsen, 1996; Zykwinska et al., 2008). On the contrary, carbohydrate microarray
suggested lower amounts of RGI and neutral sugars in those extracts. In fact, it detected a low level of
arabinan and neither RGI nor galactan in the analysed enzymatically extracted pectin sample (240 min
extraction). However, the crude extracts investigated in this study contained probably mono- and
oligomers, which would not be present in the pectin product after propan-2-ol precipitation. Additionally,
short oligomers do not bind strongly to the nitrocellulose membrane and hence would not be detected by
microarray analysis, but would be visible by FTIR.The results furthermore suggested that the enzymatic
cocktail decreased the amount of neutral sugars in the extracted pectin over time, as the antibody
responses of INRA-RU1 (RGI backbone) and LM5 (galactan) decreased with increasing extraction time.
Further analysis would be necessary to determine, if the detected RGI and neutral sugars belonged to the
pectin polymer or existed free in solution.
Additionally both FTIR and carbohydrate microarrays suggested that enzymatic extracts contained pectin
with higher degree of esterification (DE=82%) in relation to pectin extracted by HNO3 (DE=67%).
Moreover, the carbohydrate microarray results suggest that acidic extracted pectin contained additional
regions with low degree of esterification, which could not be detected in the enzymatic extracted pectin.
This was not surprising as low pH enhances the hydrolysis of ester bonds and therefore reduces the
degree of esterification in acidic extracted pectin (Rolin, Nielsen, & Glahn, 1998). Another explanation
might be that a low level of polygalacturonase activity in the Laminex C2K preparation (unpublished
data), would induce higher degradation of the non-esterified homogalacturonan stretches, thereby leaving
high esterified homogalacturonan stretches more available for binding to the nitrocellulose and in turn
respond in the microarray assay.
Conclusion The present study illustrated that FTIR spectroscopy and carbohydrate microarray analysis have potential
– in combination with multivariate data analysis - as analytical techniques for assessing crude pectin
extracts and predict pectin yields and, to a certain extent, quality, notably with respect to degree of
esterification of the pectin. Especially FTIR showed high accuracy and precision during PLS modeling
and, being a rapid and non-invasive method, it therefore enables possibilities for further intelligent
instrumentation and online monitoring. Furthermore, simple PCA on FTIR data indicated possibilities to
determine the optimal extraction time without the need for interrupting the process or use cumbersome,
classical reference analysis. The requirement for further exploitation of the FTIR in an on-line system is a
simple calibration of the pectin yield (as shown in Figure 3) and a robot device for crude pectin sampling.
75

76
Both methods enabled comprehensive characterization abilities of the crude pectin extracts. The results
suggested major differences between the enzyme- and the acid-extracted crude pectin extracts with
respect to degree of esterification and abundance of RGI pectin regions. Although it was difficult to
overview the complex results from the carbohydrate heat-map, multivariate tools as bi-plots derived from
PLS helped to identify highly descriptive and predictive antibodies during calibration modeling. Further
analysis would be necessary to determine if the detected RGI and neutral sugars were covalently linked to
the pectin polymer or existed free in solution.
The high throughput microarray analysis might be used to quantify the final pectin yield and in turn be
used to generate reference data for FTIR spectra and, in this way, replace time-consuming reference
analysis, necessary for calibration modeling. Such calibration models could then be used for online
monitoring. Hence, both FTIR and carbohydrate microarray analysis have high potential to move pectin
analysis closer to pectin production, which is particularly important in industrial process and quality
control.
Acknowledgement This work was financed by the 7th Framework Program via the Marie Curie Initial Training Network,
LeanGreenFood (EU-ITN 238084).
References Barnes, R. J., Dhanoa, M. S., & Lister, S. J. (1989). Standard normal variate transformation and de-
trending of near-infrared diffuse reflectance spectra. Applied Spectroscopy, 43, 772-777.
Baum A., Meyer A. S., Garcia J. L., Egebo, M., Hansen, P W., & Mikkelsen, J. D. (2013). Enzyme
activity measurement via spectral evolution profiling and PARAFAC. Analytica Chimica Acta,
778, 1– 8.
Beebe, K. R., & Kowalski, B. R. (1987). An introduction to multivariate calibration and analysis.
Analytical Chemistry, 59, 1007A-1017A.
Blumenkrantz, N., & Asboe-Hansen, G. (1973). New method for quantitative determination of uronic
acids. Analytical Biochemistry, 54, 484-489.
Clausen, M. H., Willats, W. G. T., & Knox, J. P. (2003). Synthetic methyl hexagalacturonate hapten
inhibitors of anti-homogalacturonan monoclonal antibodies LM7, JIM5 and JIM7.
Carbohydrate Research, 338, 1797–1800.
76

77
Coimbra, M. A., Barros, A., Barros, M., Rutledge, D. N., & Delgadillo, I. (1998). Multivaliate analysis of
uronic acid and neutral sugars in whole pectic samples by FT-IR spectroscopy. Carbohydrate
Polymers, 37,241–248.
Coimbra, M. A., Barros, A., Rutledge, D. N., & Delgadillo, I. (1999). FTIR spectroscopy as a tool for the
analysis of olive pulpcell-wall polysaccharide extracts. Carbohydrate Research, 317,145–154.
de Paz, J.L., & Seeberger, P. H. (2012). Recent Advances and future challenges in glycan microarray
technology. Methods in Molecular Biology, 808, 1-12.
Fangel, J.U., Pedersen, H.L., Vidal-Melgosa, S., Ahl L.I., Salmean, A. A., Egelund J., Rydahl, M. G.,
Clausen, M. H., & Willats, W. G. T. (2012). Carbohydrate microarrays in plant science,
Methods in Molecular Biology, 918, 351-362.
Fellah, A., Anjukandi, P., Waterland, M. R., & Williams, M. A. K. (2009). Determining the degree of
methylesterification of pectin by ATR/FT-IR: Methodology optimisation and comparison with
theoretical calculations. Carbohydrate Polymers, 78, 847-853.
Geladi, P., MacDougall, D., & Martens, H. (1985). Linearization and scatter-correction for near-infrared
reflectance Spectra of meat. Applied Spectroscopy, 39, 491-500.
Hotelling, H. (1933). Analysis of a complex of statistical variables with principal components. Journal of
Educational Psychology, 24, 498-520.
Kacuráková, M., Capek, P., Sasinková, V., Wellner, N., & Ebringerová, A. (2000). FT-IR study of plant
cell wall model compounds: pectic polysaccharides and hemicelluloses. Carbohydrate
Polymers, 43, 195-203.
Kuligowski, J., Cascant, M., Garrigues, S., & de la Guardia, M. (2012). An infrared spectroscopic tool for
process monitoring: Sugar contents during the production of a depilatory formulation. Talanta,
99, 660–667.
Lim, J., Yoo, J., Ko, S., & Lee, S. (2012). Extraction and characterization of pectin from Yuza (citrus
junos) pomace: A comparison of conventional-chemical and combined physical-enzymatic
extractions. Food Hydrocolloids, 29, 160-165.
Limberg, G., Körner, R., Buchholt, H. C., Christensen, T. M. I. E., Roepstorff, P., & Mikkelsen, J. D.
(2000). Analysis of different de-esterification mechanisms for pectin by enzymatic
fingerprinting using endopectin lyase and endopolygalacturonase II from A. niger.
Carbohydrate Research, 327, 293-307.
Nicolaou, N., & Goodacre, R. (2010). Fourier transform infrared spectroscopy and multivariate analysis
for the detection and quantification of different milk species. Journal of Dairy Science, 93,
5651-5660.
77

78
Nielsen, B. U. (1996). Fiber-based fat mimetics: pectin. In S. Roller, S. A. Jones (Eds.), Handbook of fat
replacers (p. 164). Boca Raton: CRC Press LLC.
Rohman, A., & Man, Y. B. C. (2010). Fourier transform infrared (FTIR) spectroscopy for analysis of
extra virgin olive oil adulterated with palm oil. Food Research International, 43, 886–892.
78

79
4. Prebiotic potential of sunflower pectin fractions
4.1 Hypotheses and objectives Sunflowers are grown for their seeds, whereas the residues such as heads and stalks, are considered
agricultural wastes (Lin, Sosulski, Humbert, & Downey, 1975). However, waste residues still contain
approx. 7% protein, 3% lipids, and 70% carbohydrates, such as cellulose, hemicelluloses and pectin,
which can be further extracted (Miyamoto, & Chang, 1992). The hypothesis of the study was that
sunflower pectin has a prebiotic potential and that the pectin chain length influences the prebiotic effect.
The purpose of the present study was, firstly, to efficiently extract pectins from sunflower heads and
subsequently divide them into fractions according to size and, secondly, to evaluate the prebiotic potential
of the fractions using in vitro fermentations.
4.2 Key points Statistically designed, small scale extractions were performed to find optimum pH and temperature of the
pectin extraction process. The selected conditions were applied in 3L scale, and the extracted pectin was
divided into fractions using membrane filtration. The fractions were characterized and their prebiotic
potentials were evaluated using in vitro fermentations.
4.2 Experimental considerations Most pigments in sunflower heads are strongly associated with the pectin extract (Shi, Chang, Schwarz,
Wiesenborn, & Shih, 1996). Pretreatment of sunflower pulp is therefore essential to remove those dark
pigments and other contaminants, such as simple sugars, proteins and minerals. In this study, alcohol was
chosen as the method for pulp washing, due to the highest visible removal of pigments and lowest
apparent pectin loss. Additionally, alcohol washing has the advantage of being capable of partial
inactivation of pectin methyl esterases, present in the sunflower plant (Sabir, Sosulski, & Campbell,
1976).
Water insoluble sunflower pectin can be extracted using of chelating agents, such as ammonium oxalate
and oxalic acid (Lin et al., 1975; Sabir et al., 1976), polyphosphates e.g. sodium hexametaphosphate/
Calgon (Miyamoto, & Chang, 1992; Mohamadzadeh, Sadeghi-Mahoonak, Yaghbani, & Aalami, 2010;
Sabir et al., 1976) or disodium ethylene diamine tetetraacetic acid (EDTA) (Sosulski, Lin, & Humbert,
1978). In this study sunflower pectin was extracted with McIlvaine’s buffer at different pH different
temperatures in order to determine the conditions for the highest pectin yield.
79
80
The experiment was scaled up to 3L scale and the extracted pectin was fractionated by membrane
filtration into the following three fractions: SPF>100 kDa, SPF50-100 kDa and SPF<50 kDa. The scale
up of the extraction process from 40 ml to 3L resulted in lower pectin yields (approx. 26%), which could
be attributed to more sample handling and the dialysis step, which removed remaining buffer salts and
low Mw compounds. The average Mws of the SPF<50, SPF50-100 and SPF>100 fractions, measured by
GPC (relative to standard dextrans), were 8 kDa, 16 kDa and 115 kDa, respectively. The measured Mws
of the pectin fractions were lower than expected when compared to the cut-off values of the membranes
that they were filtered through. There could be several reasons explaining this phenomenon. First of all,
pectin molecules in solution have a tendency to aggregate and low ester pectins are more susceptible to
aggregation than high ester pectins. Secondly, membrane systems are designed for filtration/concentration
of protein solutions. Polysaccharides in solution have larger hydrodynamic volumes than proteins of the
same Mws. Therefore, a membrane with a cut-off value of eg. 50 kDa may in fact allow passing
polysaccharide molecules of much lower Mw.
4.4 Conclusions It was possible to extract sunflower pectin in large amounts, to fractionate it and to test the biological
activity of the size fractions. Fermentation of fecal slurries, obtained from 5 human subjects was used to
evaluate the bioactivity of three sunflower pectin fractions. Results from in vitro fermentations showed
the selective stimulation of Bifidobacterium spp. only in case of SPF>100. SPF<50 and SPF50-100 did
not increase the density of Bifidobacteria compared to the negative control (NEG). Additionally, none of
the three sunflower pectin fractions or FOS stimulated the selective growth of Lactobacillus spp.
None of the three sunflower pectin fractions caused significant changes in the densities of Bacteroidetes
and Firmicutes after fecal fermentations. In the case of FOS, the relative ratio of Bacteroidetes decreased
significantly (P < 0.05) compared to NEG, which could be due to an increase in other types of bacteria
(Holck et al., 2011b). However, the increase of Firmicutes to Bacteroidetes ratio, observed in the case of
fermentation with FOS, may potentially increase the obesity risk and influence the development of
obesity-associated metabolic syndrome (Holck et al. 2011b; Ley, Turnbaugh, Klein, & Gordon, 2006;
Turnbaughet al., 2006). It was therefore beneficial that SPF>100, having a bifidogenic potential, did not
affect the ratio between the two phyla.
80

81
Evaluation of the prebiotic potential of sunflower pectin fractions.
Malgorzata Dominiaka,c, Louise K. Vigsnæsb, Tine R. Lichtb, Karen M. Søndergaardc, Jørn D.
Mikkelsena*
a Center for Bioprocess Engineering, Dept. Chemical and Biochemical Engineering, Technical University
of Denmark, DK-2800 Lyngby, Denmark
bNational Food Institute, Division of Food Microbiology, Technical University of Denmark, 2860 Søborg,
Denmark
cDuPont Nutrition Biosciences ApS, Dept. Hydrocolloid Science, DK-8220 Brabrand, Denmark
Corresponding Author
* Tel: +45 4525 2938. Fax: +45 4593 2906. E-mail: [email protected]
81

82
Abstract
Sunflowers are grown for their seeds, which are rich in edible oil, whereas the residues such as heads and
stalks are considered agricultural wastes. The content of pectin in sunflower heads varies between 15 and
24%, depending on the cultivar and the stage of harvest. The purpose of the study was to efficiently
extract pectins from sunflower heads and to evaluate their prebiotic potential using in vitro fermentations.
Sunflower pectin was extracted with McIlvaine’s buffer at pH between 3 and 7 and at temperatures
between 30 and 60°C, in order to determine the conditions of highest pectin release. The highest pectin
yield was obtained at pH 7 but temperature was found to be insignificant. Sunflower pectin was
fractionated into three fractions SPF<50, SPF50-100 and SPF>100 using 50 and 100 kDa membranes.
The density of human fecal Bifidobacterium spp. was significantly higher (p<0.05) after fermentation
with SPF>100 kDa compared to when no substrate was added. None of the three sunflower pectin
fractions influenced the level of Lactobacillus spp., Bacteroidetes or Firmicutes.
Keywords: sunflower pulp, pectin, prebiotic, Bifidobacterium, Lactobacillus
82
83
Introduction
As people become more aware of the health implications of their diets, the market for prebiotic
substances is growing rapidly. The development of novel prebiotics with better functionalities is possible
by exploring new biomass sources, such as plant cell wall carbohydrates obtained from waste biomass,
with the help of enzymes and advanced process knowledge. Recently, there has been much interest in the
novel prebiotics obtained from cell wall polysaccharides, such as arabinoxylans or pectins. Pectin and
pectic oligosaccharides, derived from different plant sources, have been found to promote the growth and
activity of beneficial gut microflora and inhibit pathogen growth (Holck et al., 2011a; Holck et al., 2011b;
Hotchkiss, Olano-Martin, Grace, Gibson, & Rastall, 2003; Thomassen, Vigsnæs, Licht, Mikkelsen, &
Meyer, 2011). Bifidogenic fibers from potato pulp with molecular masses above 100 kDa increased the
densities of Bifidobacterium spp. and Lactobacillus spp. 2–3 times more than fructo-oligosaccharides
(FOS) (Thomassen et al., 2011). Moreover, by manipulation of the size of pectic oligosaccharides derived
from sugar beet pectin, one could affect the ratio of Bacteroidetes to Firmicutes, which is believed to play
a role in the development of obesity (Holck et al., 2011a). Pectic oligosaccharides have been found to be
more bifidogenic than their parent pectins. Furthermore, pectins with lower degrees of esterification (DE)
and pectic oligosaccharides have been found to be more prebiotic than high DE material (Hotchkiss et al.,
2003).
Sunflowers are grown for their seeds, which are rich in edible oil, whereas the residues such as heads and
stalks are considered agricultural wastes (Lin, Sosulski, Humbert, & Downey, 1975). However, the waste
residues still contain approx. 7% protein, 3% lipids, and 70% carbohydrates, such as cellulose,
hemicelluloses and pectin that can be further extracted (Miyamoto, & Chang, 1992). Pectin content in the
sunflower heads varies between 15 and 24%, depending on the cultivar and stage of harvest (Miyamoto,
& Chang, 1992). Sunflower pectin is strongly bound to divalent metal ions in the cell wall (Lin et al.,
1975). The water insoluble pectin fraction can be extracted using chelating agents, such as ammonium
oxalate and oxalic acid (Lin et al., 1975; Sabir, Sosulski, & Campbell, 1976), polyphosphates e.g. sodium
hexametaphosphate/Calgon (Miyamoto, & Chang, 1992; Mohamadzadeh, Sadeghi-Mahoonak, Yaghbani,
& Aalami, 2010; Sabir et al., 1976) or disodium ethylenediaminete tetraacetic acid (EDTA) (Sosulski,
Lin, & Humbert, 1978). Application of sunflower pectin in the food industry is currently very limited and
restricted to utilization of its gelling ability (Iglesias, & Lozano, 2004; Kim, Sosulski, & Campbell, 1978).
The hypothesis of this study was that sunflower pectin, low ester type pectin, has a prebiotic potential and
that the pectin chain length influences the prebiotic effect in vitro. The purpose of the present study was,
83

84
firstly, to efficiently extract pectins from sunflower heads and subsequently divide them into fractions
according to size and, secondly, to evaluate the prebiotic potential of the fractions using in vitro
fermentations.
Methods
Chemicals
D-galactose, L-arabinose, L-rhamnose monohydrate, D-fucose, polygalacturonic acid from orange and 3-
hydroxybiphenyl were purchased from Sigma-Aldrich (Steinheinm, Germany). Disodium tetraborate-10-
hydrate, D-xylose and D-glucose were purchased from Merck (Darmstadt, Germany). Fructo-
oligosaccharide (FOS) (2-8 DP) (Orafti®95) was purchased from Beneo-Orafti (Tienen, Belgium).
Sunflower head pulp preparation
Fresh sunflower heads (Helianthus annuus L.) were harvested directly from the field and transported to
the laboratory. After seed removal, the sunflower heads were rinsed in deionized water to remove sand
and other impurities. Each head was cut into four fragments and each fragment was ground using a
kitchen blender and immediately placed in the microwave oven for blanching – to inactivate endogenous
pectin methyl esterases (2 minutes at 1470 watt in Husquarna Micronett, QN 2276F, UK). The sunflower
head pulp was placed in the microwave in approx. 100 g portions to ensure homogenous heat transfer.
After blanching, the pulp was placed in a 50°C ventilated oven for 48 h for drying. The dried pulp was
milled to 35 mesh in an Ultra Centrifugal Mill ZM 200 (Retsch, Haan, Germany).
Washing of the sunflower head pulp
Three methods of pulp washing were tried, namely (i) hot water washing (75°C) for 15 minutes at 1:25
solid: water ratio, according to the method by Mohamadzadeh et al. (2010), (ii) alkaline washing at pH
7.5 for 25 minutes at 1:28 solid: water ratio, according to the method by Shi, Chang, Schwarz,
Wiesenborn, & Shih (1996) and (iii) alcohol washing (80% ethanol, 30 minutes, 90°C, 1:40 soild: water
ratio) according to the method by Sabir et al. (1976). The results were compared on the basis of the colour
of the pectin after washing and the colour and viscosity of the washing medium.
Small scale extractions of sunflower pectin for determination of optimum extraction
conditions
A randomized full-factorial 3-levels design was used to determine the conditions for highest pectin yield.
The design contained 9 combinations of the following two factors: pH 3-7 and temperature 30-60°C. The
84

85
center point (pH 5, 45°C) was measured in triplicate. The investigated response was pectin yield. A
scheme of experimental design is presented in Table 1.
Table 1. Factors and their levels used in the experimental design.
Experiment pH Temperature[°C] 1 3 30 2 5 30 3 7 30 4 3 45 5 5 45 6 7 45 7 3 60 8 5 60 9 7 60
10 5 45 11 5 45 12 5 45
All pectin extractions were carried out for 1h in McIlvaine’s buffer with 1:30 pulp-buffer ratio. 1.35 g of
sunflower pulp was mixed with a pre-heated buffer and incubated in a shaking waterbath at 190 rpm. The
released pectin polymer present in solution was separated from the residual biomass by centrifugation for
10 min at 3500 rpm (Varifuge 3.0, Heraeus Sepatech, Osterode, Germany). After centrifugation, the
resulting solution was filtered through a Celite 545 (Celite France S.A., Nanterre Cedex, France) and the
pH was adjusted to 4.0 with 5 M citric acid. Pectin was precipitated by mixing the pectin solution with an
equal volume of propan-2-ol, followed by agitation for 1 hour. The precipitated pectin was washed in
50% propan-2-ol for 1 hour. It was separated by filtration through a cotton canvas and dried overnight in
a 40°C ventilated oven. Dried pectin was ground to <0.5 mm in an Ultra Centrifugal Mill ZM 200
(Retsch, Haan, Germany).
3L upscale extraction of pectin
Up-scaling of pectin extraction to 3L volume was performed using a 3-neck round bottom flask with an
agitator inside, which was placed in a heating mantle. The pulp: water ratio was the same as in the small
scale extraction. The experiment was performed as described for the small scale process, except for the
following modification: before precipitation, the pectin solution was filtered through a 10 kDa
polyethersulfone spiral wound ultrafiltration module (Milipore) to remove buffer salts.
85
86
Determination of pectin yield
The yield of pectin was calculated as a weight ratio of the extracted pectin to sunflower pulp (both on dry
matter basis).
Fractionation of the pectin using membrane filtration
A 0.5% pectin solution was prepared by dissolving pectin in hot (50°C) deionized water with vigorous
mixing. Next, an overnight filtration through a 100 kDa cross-flow PES membrane (Sartorius,
Goettingen, Germany) was performed. The retenate was defined as SPF>100 (Mw>100 kDa). The
permeate was then further filtered through a 50 kDa cross-flow PES membrane (Sartorius, Goettingen,
Germany) and defined as SPF50-100 (Mw between 50 kDa and 100 kDa). The permeate was defined as
SPF<50 (Mw<50 kDa). Due to the high volume of the SPF<50 fraction (approx. 8L), it was concentrated
using a rotary evaporator. All three pectin fractions were freeze-dried and stored at -20°C until further
analysis.
Determination of galacturonic acid
Galacturonic acid (GalA) content was determined using the colorimetric m-hydroxybiphenyl method
(Blumenkrantz, & Asboe-Hansen, 1973). The measurements were performed in a microtiter plate,
according to the method by van den Hoogen et al. (1998), using a Tim-200 plate reader equipped with
492 nm filter (Teknunc A/S, Roskilde, Denmark).
Determination of the degree of methylation and acetylation of the pectin fractions.
The methanol and acetic acid contents of SPF<50, SPF50-100 and SPF>100 were determined according
to the method by Melton and Smith (2001). Briefly, 30 mg of each pectin fraction was saponified with 1
ml of cold (4°C) isopropanol/NaOH solution for 2 hours at room temperature. Next, the suspensions were
centrifuged at 2000×g for 10 minutes and the supernatants were analyzed by HPLC for methanol and
acetic acid contents. The HPLC system used was a Summit LC (Dionex Corp., Sunnyvale, CA) equipped
with a P680 HPLC pump, an ASI-100automated sample injector, and an Aminex HPX-87H column (300
× 7.8 mm, Bio-Rad Labs, Richmond, CA, USA) in combination with a guard column (AG50W-X4. 50 ×
4.6 mm, Bio-Rad Labs). 5mM H2SO4 was used as the eluent at a constant flow rate of 0.6 ml/min at 30°C.
Components eluting from the column were detected with a Shodex RI-101(Showa Denko KK, Kawasaki,
Japan) refractive index detector thermostated at 40°C. Methanol and glacial acetic acid were used as
standards.
After determination of galacturonic acid content of each pectin fraction, degrees of methylation and
acethylation were calculated from the formulas:
86

87
Degree of methylation = (millimoles methanol/millimoles uronic acid) × 100
Degree of acetylation = (millimoles acetic acid/millimoles uronic acid) × 100
Neutral sugar composition
After hydrolysis of pectin in 1 M sulphuric acid, the neutral sugars are detected by High Performance
Anion Exchange Chromatography with Pulsed Amperometric Detection (HPAEC-PAD). Before
hydrolysis, the pectin sample was washed three times in 80% ethanol followed by washing one time in
96% ethanol to remove sugars. The hydrolysis in 1 M sulphuric acid was carried out at 100°C for 6 hours.
After hydrolysis the sample was diluted and filtered through a 0.45 m filter. The content of D-fucose, L-
rhamnose, D-arabinose, D-galactose, D-glucose and D-xylose in pectin was determined. The separation
and quantification was performed by HPAEC-PAD using an ICS-3000 system (Dionex Corp., Sunnyvale,
CA). The columns used were CarboPacTM PA1 (4mm×250mm) analytical column and a CarboPacTM PA1
guard column. Eluent A consisted of deionised water and eluent B of 150 mM NaOH. 20 min isocratic
elution with 15 mM NaOH was followed by 10 min washing with 150 mM NaOH. The flow was kept at
1 ml/min. Before injection of each sample (50 l) the column was reequilibrated with 15 mM NaOH for 8
min. Analysis was made with the program Chromeleon 6.80 software (Dionex Corp., Sunnyvale, CA).
Determination of molecular weight (Mw) by gel permeation chromatography (GPC)
Mw of the pectin fractions was determined using gel permeation chromatography. Two 3.000Å and one
100Å (PSS, Mainz, Germany) GPC SUPREMA-LUX columns were used for gel permeation
chromatography. Pectin solutions (1 g/L) were filtered through a 0.45 m filters before injection. The
mobile phase was 0.05 M LiNO3 with 0.02% NaN3 which was filtered through a 0.22 m filter before
use. Separations were carried out at 40°C with a flow rate of 0.6 ml/min. The eluent was monitored by a
refractive index detector Optilab reX (Wyatt Technology Corporation). Molecular mass markers used
were dextrans with molecular masses of 1080, 4440, 9890, 21400, 43500 and 66700 Da. The data were
analyzed using Astra 5 software (Wyatt Technology Corporation).
Analysis of the biological activity of sunflower pectins
Subjects and fecal sample collection
Fecal samples were obtained from five healthy volunteers (three women and two men). None of the
participants had been treated with antibiotics for at least 3 months before enrolment and had no history of
gastrointestinal disorders. The fecal samples were collected in airtight containers at home by the
participants and stored at 4°C (limited storage time was encouraged, in accordance with Ott et al., 2004),
87
88
until delivery to the laboratory, where they were processed immediately. The fecal samples were
homogenized in 50 % glycerol (1:1 dilution) in an anaerobic cabinet (Macs Work Station, Don Whitley)
containing 10% H2, 10% CO2, and 80% N2, and stored at -80°C until further analysis.
In vitro fermentation by human fecal bacterial communities
Small scale fermentation studies were carried out to assess the effect of sunflower pectin fractions on the
microbial composition in human fecal samples, in a similar manner to the method reported previously
(Holck et al., 2011b). Parallel incubations with the established bifidogenic substrate, FOS, (Rossi et al.,
2005) and no carbohydrates (NEG), respectively, which were used as controls. Fecal samples, prepared as
described above, were defrosted in an anaerobic cabinet and 10% (w/v) fecal slurries were prepared by
mixing the samples with anoxic phosphate buffered saline (PBS) (Oxoid, Greve, Denmark) immediately
before fermentation. The carbohydrate sources were added to an autoclaved minimal basal medium
(MBM) to give a final concentration of 5 g (dry matter)/l with reaction volumes of 2 ml. The MBM
contained 2 g/l of peptone water, 1 g/l of yeast extract, 0.1 g/l of NaCl, 0.04 g/l of K2HPO4, 0.04 g/l of
KH2PO4, 0.01 g/l of MgSO4 7H2O, 0.01 g/l of CaCl2 2H2O, 2 g/l of NaHCO3, 0.5 g/l of bile salts, 0.5 g/l
of l-cysteine hydrochloride, 0.005 g/l of hemin, 10 l/l of vitamin K1 (0.02 mM), 2 ml/l of Tween 80, and
1 ml/l of 0.05% (w/v) resazurin solution. The pH of the final solution was adjusted to 7. Positive controls
were made by adding FOS (5 g/l) to the MBM and negative controls were prepared by not adding any
fibers to the MBM. All solutions were reduced overnight in an anaerobic cabinet and inoculated with
fecal slurry, prepared as described above to a final concentration of 1% feces. Each fermentation was
carried out in triplicate for each fecal community, carbohydrate source and controls. The fermentation
assay was non-pH controlled and non-stirred due to the low reaction volume (2 ml) and was carried out in
an anaerobic cabinet at 37°C. After 24 hours, each fermentation sample was centrifuged at 13000 rpm for
8 min. Pellets were used for extraction of bacterial DNA, as described below.
Extraction of bacterial DNA
DNA was extracted from the fermentation samples using the QIAamp Stool DNA Mini Kit (Qiagen,
Hilden, Germany) with a bead-beater step in advance. The purified DNA was stored at -20°C until use.
Real-Time PCR assay conditions
Amplification and detection of purified bacterial DNA by real-time PCR were performed with the ABI-
Prism 7900 HT from Applied Biosystems using optical grade 384-well plates. PCR reagents and DNA
were loaded onthe 384-well plates using the EpMotion pipetting Robot (Eppendorf). Primers specifically
targeting 16S rRNA gene sequences of the total bacteria, the Bacteroidetes and Firmicutes phyla and the
Lactobacillus and Bifidobacterium genera were included in the qPCR analysis (Table 2).
88

89
Table 2. 16S rRNA primers used for q PCR for quantification of the level of Bifidobacterium spp, Lactobacillus spp., Firmicutes and Bacteroidetes in the in vitro fermentations of the fecal samples with sunflower pectin fractions SPF<50, SPF50-100 and SPF >100.
Target gene Forward primer (5’–3’) Reverse primer (5’–3 ) Product size (bp) Ref.
Bifidobacterium spp. gcgtgcttaacacatgcaagtc cacccgtttccaggagctatt 126 Penders et al., 2005
Lactobacillus spp. agcagtagggaatcttcca caccgctacacatggag 341 Heilig et al.,
2002;Walter et al., 2000
Firmicutes ggagyatgtggtttaattcgaagca agctgacgacaaccatgcac 126 Guo et al., 2008
Bacteroidetes ggarcatgtggtttaattcgatgat agctgacgacaaccatgcag 126 Guo et al., 2008
Total bacteria actcctacgggaggcagcagt gtattaccgcggctgctggcac 200 Walter et al., 2000
Prior to quantification, all primers were tested to confirm sensitivity and specificity using DNA from pure
bacterial species (Bergstrom et al., 2012). Each amplification reaction was done in duplicate for each of
the triplicate fermentation samples in a final volume of 11 l containing; 5.50 l SYBR® Green Master
Mix (Applied Biosystems, Denmark), 200 nM of each of the primers (Eurofins MWG Synthesis GmbH,
Ebersberg, Germany), 2 l template DNA (1 ng/ L), and Nuclease-free water purified for PCR (Qiagen).
The amplification program comprised one cycle at 50°C for 2 min; one cycle at 95°C for 10 min; 40
cycles at 95°C for 15 sec.; 60°C for 1 min, and finally one cycle of melting curve analysis for amplicon
specificity at 95°C for 15 sec, 60°C for 20 sec. and increasing ramp rate by 1.92°C/min until 95°C for 15
sec. The qPCR data was baseline corrected and N0-values, representing initial concentrations of the
specified 16S rRNA genes, were calculated using the LinRegPCR software (version 11.1, based on
Ruijter et al., 2009). All results were calculated as means of duplicate N0 estimations. The relative
quantities of gene targets encoding 16S rRNA sequences of the bacterial taxa were calculated using N0
(bacterial target)/N0 (total bacterial population).
Results
Pulp washing
The sunflower pulp used in the study was washed in three ways, by (i) hot water, (ii) base and (iii) alcohol
to remove pigments and impurities. In case of water and base washing, the colour of the pulp remained
unchanged (dark brow/black) and the washing medium became viscous, suggesting pectin loss during
washing. In case of alcohol washing, the color of pectin was significantly improved (light yellow) and the
washing medium became very dark, which suggested that pigments were removed from the pectin. There
89

90
was no apparent viscosity increase of the washing medium after alcohol washing, which suggested lower
pectin loss than in the case of hot water or base. Therefore alcohol washing was chosen as the method of
pulp washing.
Determination of the optimum pectin extraction conditions
Pectin can be extracted from the plant material by acid, enzymes or chelating agents. However, in the case
of sunflower, the pectin possesses a low amount of ester groups and is susceptible to gelling with residual
calcium when exposed to elevated temperatures during processing. It is therefore essential to use
chelating agents that capture divalent ions and prevent pectin form gelling during processing.
In this study, sunflower pectin was extracted with McIlvaine’s buffer at different pH and different
temperatures in order to determine the conditions for the highest pectin yield. The response contour plot,
prepared from the extraction data, identified the conditions for optimum pectin release (> 35% pectin
yield) (Figure 1).
Figure 1. Two dimensional contour response plot of pectin yield as a function of pH and temperature of the extraction process. All extractions were carried out for 1 h in Mcilvaine’s buffer with 1:30 pulp-buffer ratio.
According to Table 3, which summarizes multiple linear regression results of pectin yields during
optimization, the pectin yield was dependent on pH and increased with increasing pH, whereas the
temperature was not a significant factor (p >0.05). An increase in pH from 3 to 7 was accompanied by a
2-3 fold increase in pectin yield. A yield of > 35% was obtained at pH 7. Pectin release > 30% was
previously obtained with 1.5% Calgon by Sabir et al. (1976), but pectin contained only 64% galacturonic
acid and a high percentage of ash. The pectins obtained in this study were also ‘crude’ and contained
buffer salts. It was therefore essential to up-scale the process and purify the pectin polymer after release.
90

91
Table 3. Multiple linear regression analysis on pectin yield, after optimization of experimental conditions (Q2=0.829, R2=0.937). p =0.05 indicates significance at the 95% level.
Parameters and interactions Coeff. SC P
Constant 0.23 4.88e-8 pH 0.12 5.55e-6 temp 0.02 0.09 temp*temp 0.03 0.07
3-liter-scale pectin extraction and characterization
The pectin extraction experiment was up-scaled to 3 L scale. The extraction conditions were: pH 7 and
30 °C. The yield of the purified pectin was 25.9% (w/w) on dry basis and it contained 93.6 (±1.5) %
galacturonic acid (GalA). It has been reported that pectin content in sunflower heads varies between 15
and 24%, depending on the cultivar and stage of harvest (Miyamoto, & Chang, 1992). The content of
neutral sugars in the purified pectin was approx. 4%. Arabinose, galactose and rhamnose were the most
abundant neutral sugars, suggesting a low content of rhamnogalacturonan I (RGI) regions in sunflower
pectin (Table 4). Table 4. Neutral sugar composition of sunflower pectin extracted in 3 liter scale.
Neutral sugar Quantity (%)
Fucose 0.11±0.00
Rhamnose 0.84±0.00
Arabinose 1.15±0.01
Galactose 1.25±0.01
Glucose 0.39±0.00
Xylose 0.16±0.01
Fractionation and characterization of the fractions
The released pectin was fractionated by membrane filtration into the following three fractions: SPF>100
kDa, SPF50-100 kDa and SPF<50 kDa. The yields of fractionation, their degrees of methylation and
acetylation and galacturonic acid contents are presented in Table 5. Fractionation resulted in two fractions
very rich in galacturonic acid (SPF>100 kDa, SPF50-100 kDa), whereas SPF<50 fraction contained only
approx. 40% galacturonic acid. The fractions differed in the degrees of methylation and acethylation.
91
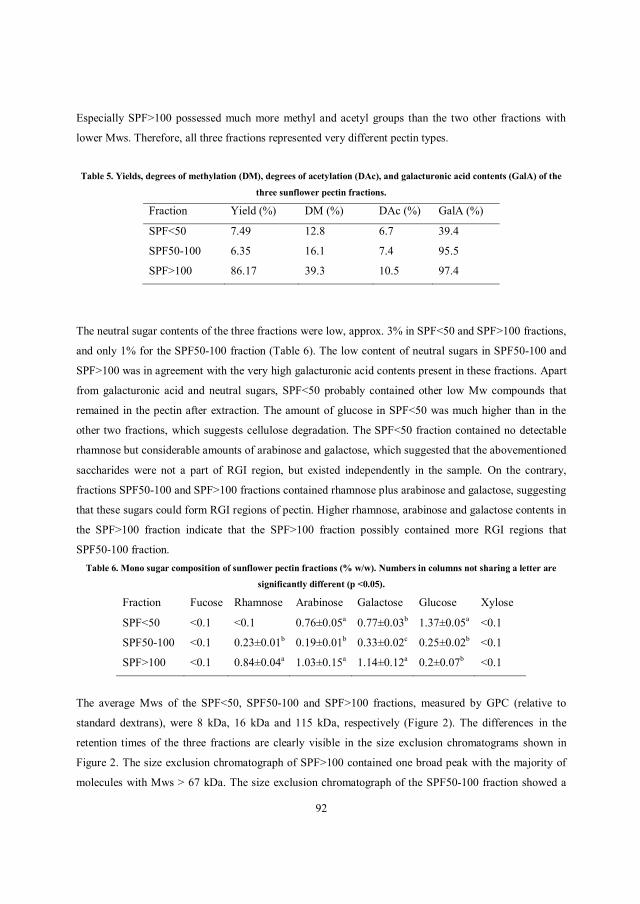
92
Especially SPF>100 possessed much more methyl and acetyl groups than the two other fractions with
lower Mws. Therefore, all three fractions represented very different pectin types.
Table 5. Yields, degrees of methylation (DM), degrees of acetylation (DAc), and galacturonic acid contents (GalA) of the
three sunflower pectin fractions.
Fraction Yield (%) DM (%) DAc (%) GalA (%)
SPF<50 7.49 12.8 6.7 39.4
SPF50-100 6.35 16.1 7.4 95.5
SPF>100 86.17 39.3 10.5 97.4
The neutral sugar contents of the three fractions were low, approx. 3% in SPF<50 and SPF>100 fractions,
and only 1% for the SPF50-100 fraction (Table 6). The low content of neutral sugars in SPF50-100 and
SPF>100 was in agreement with the very high galacturonic acid contents present in these fractions. Apart
from galacturonic acid and neutral sugars, SPF<50 probably contained other low Mw compounds that
remained in the pectin after extraction. The amount of glucose in SPF<50 was much higher than in the
other two fractions, which suggests cellulose degradation. The SPF<50 fraction contained no detectable
rhamnose but considerable amounts of arabinose and galactose, which suggested that the abovementioned
saccharides were not a part of RGI region, but existed independently in the sample. On the contrary,
fractions SPF50-100 and SPF>100 fractions contained rhamnose plus arabinose and galactose, suggesting
that these sugars could form RGI regions of pectin. Higher rhamnose, arabinose and galactose contents in
the SPF>100 fraction indicate that the SPF>100 fraction possibly contained more RGI regions that
SPF50-100 fraction. Table 6. Mono sugar composition of sunflower pectin fractions (% w/w). Numbers in columns not sharing a letter are
significantly different (p <0.05).
Fraction Fucose Rhamnose Arabinose Galactose Glucose Xylose
SPF<50 <0.1 <0.1 0.76±0.05a 0.77±0.03b 1.37±0.05a <0.1
SPF50-100 <0.1 0.23±0.01b 0.19±0.01b 0.33±0.02c 0.25±0.02b <0.1
SPF>100 <0.1 0.84±0.04a 1.03±0.15a 1.14±0.12a 0.2±0.07b <0.1
The average Mws of the SPF<50, SPF50-100 and SPF>100 fractions, measured by GPC (relative to
standard dextrans), were 8 kDa, 16 kDa and 115 kDa, respectively (Figure 2). The differences in the
retention times of the three fractions are clearly visible in the size exclusion chromatograms shown in
Figure 2. The size exclusion chromatograph of SPF>100 contained one broad peak with the majority of
molecules with Mws > 67 kDa. The size exclusion chromatograph of the SPF50-100 fraction showed a
92

93
narrower peak and consisted mainly of molecules between 10 and 67 kDa. The smallest fraction, SPF<50
was the most heterogeneous and contained molecules with Mws
< 4.4 kDa. Mws of SPF<50 and SPF50-100 were lower than expected, when compared to the cut-off
values of the membranes they were filtered through.
Figure 2. Size exclusion chromatograms of three sunflower pectin fractions. Lines represent the refractive index (RI) signal. Molecular weights were determined relative to a range of standard dextrans of molecular weights between 1.1 and 67 kDa. There could be several reasons explaining this phenomenon. First of all, pectin molecules in solution have
the tendency to aggregate and low ester pectins are more susceptible to aggregation than high ester
pectins. Aggregated pectin polymers could be too large to pass through the membrane, even though they
have relatively low Mws. Secondly, membrane systems are designed/calibrated for
filtration/concentration of protein solutions. Polysaccharides in solution have larger hydrodynamic
volumes than proteins of the same Mws. Therefore, a membrane with a cut-off value of e.g. 50 kDa may
in fact not allow polysaccharide molecules of 50 kDa Mw to pass through the membrane.
93

94
Biological activity
Fermentation of fecal bacterial communities obtained from 5 human subjects was used to evaluate the
bioactivity of three sunflower pectin fractions. QPCR was applied to measure the density of gene targets
encoding 16S rRNA genes of selected bacterial taxonomic units (Fig 3).
Fig 3. Relative quantities of genes encoding 16S rRNA from Bifidobacterium spp., Lactobacillus spp., Bacteroidetes and Firmicutes in fecal microbiota after fermentation of SPF<50, SPF50-100, SPF>100, FOS, and negative control (NEG). The bars represent the average response from five volunteers, whereas error bars represent SEM. Asterisks indicate a significant difference between target bacteria density in the negative control (no fibers added) and the sample fermented on particular fibers: P < 0.05, *; P < 0.01,**.
The overall composition of the intestinal microbiota in humans is dominated by Bacteroidetes and
Firmicutes, hence included in the qPCR analysis. The ratio of the two phyla is supposed to be a factor in
development of obesity and intestinal inflammation (Guo et al. 2008; Turnbaugh et al. 2006). The genera
Lactobacillus and Bifidobacterium were included in the qPCR analysis, since they are associated with
94

95
various health benefits in the colon and hence target for prebiotic treatment (Grimoud et al., 2010; Peranet
al., 2007; Shirasawa, Shibahara-Sone, Iino, & Ishikawa, 2010; Williams, 2010). Negative control (NEG)
represented fermentation with no fibers added, and FOS were used as a positive control, based on their
known selective effect on the content of Bifidobacterium and Lactobacillus (Palframan, Gibson, &
Rastall, 2002; Rycroft, Jones, Gibson, & Rastall, 2001; Sanz, Gibson, & Rastall, 2005).
The density of Bifidobacterium spp. was significantly higher (p<0.05) after fermentation on SPF>100
kDa compared to NEG (approx. 5 fold increase in the relative ratio of Bifidobacterium spp. compared to
NEG) (Figure 3). The effect of SPF>100 kDa, although significant, was however minor when compared
to FOS, which resulted in approx. 40 fold increase in the relative ratio of Bifidobacterium spp. after fecal
fermentation. SPF<50 and SPF 50-100 fractions did not affect the density of Bifidobacterium spp.
compared to NEG. Additionally, the density of Lactobacillus spp. was not stimulated by any of the
sunflower pectin fractions.
The density of Bacteroidetes was significantly lower in the fecal bacterial communities fermented on FOS
compared to NEG. However the three sunflower pectin fractions did not influence the density of
Bacteroidetes after fermentation. Similarly, neither FOS nor any of the sunflower pectin fractions
influenced the density of Firmicutes.
Discussion
Most pigments in sunflower heads are strongly associated with the pectin extract (Shi et al,
1996).Pretreatment of sunflower pulp is therefore essential to remove those dark pigments and other
contaminants, such as simple sugars, proteins and minerals. Different washing media can be used for this
purpose, and the type of the media used impacts the purity of the pulp and the pectin recovery after
extraction. In this study, alcohol was chosen as the method for pulp washing, due to highest visible
removal of pigments and lowest apparent pectin loss. Alcohol washing has the added advantage of
causing partial inactivation of pectin methyl esterases present in the sunflower plant, therefore preventing
natural pectin degradation (Sabir et al., 1976).
There are a few reports on the extraction of sunflower pectin in the literature. However, sunflower pectin
has been previously extracted from the heads and stalks of de-seeded plants with the help of chelating
agents, such as sodium hexametaphosphate (Miyamoto, & Chang, 1992; Shewfelt, &Worthington, 1953),
Calgon (Sabir et al., 1976) or ammonium oxalate - oxalic acid (Bishop, 1955). The sunflower pectin
95

96
yields were dependent on the extraction conditions and ranged from 7.3%, extracted using 0.75% sodium
hexametaphosphate (Miyamoto & Chang, 1992) to over 30% using 1.5% Calgon (Sabir et al., 1976). The
extraction temperature was also found to be important (Chang, Dhurandhar, You, & Miyamoto, 1994;
Sabir et al., 1976) and an increase from 60 to 90°C resulted in the increase of yields of oxalate- and
Calgon-extracted pectins from 9 to 17%, and from 15 to 20%, respectively (Sabir et al., 1976). However,
in another study, pectin yield decreased with increasing temperature (Chang et al., 1994). Our
observations indicated that it was possible to obtain very high pectin yields (>30%) by extraction with
McIlvaine’s buffer, and that pH was the only factor that significantly influenced the pectin yield.
According to the model, the temperature did not play any role in pectin release. This observation stays in
agreement with the work of Chang et al. (1994), who concluded that the pH of extraction of sunflower
pectin had stronger effect on the yield than temperature.
The extraction process scale up from 40 ml to 3L resulted in lower pectin yields (approx. 26%), which
could be attributed to more sample handling and the dialysis step, which removed remaining buffer salts
and low Mw compounds. The released pectin was very rich in galacturonic acid and contained a low
amount of neutral sugars. Such a high galacturonic acid content was previously described for sunflower
pectin (Chang et al., 1994; Kim et al., 1978; Lin et al., 1975; Miyamoto & Chang, 1992). The high
galacturonic acid contents in the pectin sample could be due to the removal of arabinans and galactans by
the alcohol washing (Kertesz, 1951).
Fractionation of sunflower pectin according to size resulted in three fractions with different properties.
SPF<50 had the lowest amount of methyl and acetyl groups and a very low amount of galacturonic acid.
SPF50-100 had a higher content of methyl and acetyl groups than SPF<50, galacturonic acid content
>90% and a much lower amount of neutral sugars than SPF<50 and SPF>100. The last fraction,
SPF>100, shared the most similarity with the ‘mother’ pectin, obtained after 3L extraction. It had
significantly more methyl and acetyl groups and was very rich in galacturonic acid. Therefore, all three
fractions were very different chemically. The methyl and acetyl contents of the pectins extracted by other
authors varied from 8.4 to 38.5% (Chang et al., 1994; Iglesias, & Lozano, 2004; Miyamoto, & Chang,
1992) and from 1.4 to 13.7%, respectively (Iglesias, & Lozano, 2004; Kim et al. 1978). The literature
values for methyl and acetyl contents match the results of this study and clearly indicate the low ester
nature of sunflower pectin.
The Mw of sunflower pectin described in the literature varies from 39-52 kDa, measured by viscosimetry
(Iglesias, & Lozano, 2004), to >523 kDa, measured by gel chromatography (Miyamoto, & Chang, 1992).
96

97
Measured Mws of sunflower pectin are affected by the extraction method, quality of the sunflower heads
and the cultivar. Additionally, measured Mws are also dependent of the method of determination.
Viscosimetry and gel chromatography determine Mw by measuring different polymer characteristics
(hydrodynamic volume and viscosity) and neither of them give the true Mw of the polymer. Size
exclusion chromatograms of the pectin fractions produced in this study revealed that the sizes of the
pectin fractions did not match the cut-off values of membranes used for pectin fractionation, which could
be caused by pectin aggregation or high hydrodynamic volume of polysaccharides compared to proteins
of the same Mw, which are used for calibration of the cut-off value of membranes. A similar disparity in
the measured Mws of biological polymers compared to membrane cut-off values was previously observed
by Thomassen et al. (2011). Thomassen et al. observed that potato pulp fibers fractions of Mw between
10 and 100 kDa, had a major peak at around 5.4 kDa on a size-exclusion chromatogram.
qPCR was used to determine the abundance of target genes encoding 16S rRNA of selected bacterial taxa
after fermentation in fecal slurries obtained from five subjects. The capacity of the three sunflower pectin
fractions to selectively promote the growth of Bifidobacterium spp. and Lactobacillus spp. was compared
to FOS, which was used as a standard due to its well-known prebiotic effect. Lactobacillus spp. and
Bifidobacterium spp. exert their probiotic effects through various mechanisms, including lowering
intestinal pH, decreasing colonization by pathogenic organisms and modifying the host immune response
(Williams, 2010). They are useful in preventing and treating various medical conditions, particularly
those involving the gastrointestinal tract. Recent studies have demonstrated the efficacy of the use of
lactobacilli and bifidobacteria in the treatment of inflammatory bowel diseases and their anti-proliferative
effect on cancerous HT-29 cells (Grimoud et al., 2010), anti-inflammatory activity in the TNBS model of
rat colitis (Peran et al., 2007), and suppression of Helicobacter pylori-induced genes in human epithelial
cells (Shirasawa et al., 2010).
Additionally, the densities of Bacteroidetes and Firmicutes were also measured to evaluate the changes in
the intestinal human microbiota. These two phyla dominate the human microbiota and the balance
between them supposedly influences the development of obesity and intestinal inflammation (Guo et al.,
2008).
Results from the in vitro fermentations showed selective stimulation of Bifidobacterium spp. by SPF>100.
No other reports of the prebiotic potential of sunflower pectin can be found in the literature. However, for
fibers released from potato pulp, the fraction with the largest size > 100 kDa was also the most
bifidogenic (Thomassen et al., 2011). No increase in the density of bifidobacteria grown on SPF<50 and
97

98
SPF50-100 compared to NEG was observed. Additionally, none of the three fractions or FOS could
stimulate the growth of Lactobacillus spp. compared to NEG.
None of the three sunflower pectin fractions caused significant changes in the densities of Bacteroidetes
or Firmicutes after fecal fermentations. In the case of FOS, the relative ratio of Bacteroidetes decreased
significantly (P < 0.05) compared to NEG, which could be due to the increase of bifidobacteria (Holck et
al., 2011b). However, the increase of the Firmicutes to Bacteroidetes ratio, observed in the case of FOS,
may be regarded as a negative effect because increased Firmicutes to Bacteroidetes ratio may increase the
risk of obesity and influence the development of obesity-associated metabolic syndrome (Holck et al.,
2011b; Ley, Turnbaugh, Klein, & Gordon, 2006; Turnbaugh et al., 2006).
Conclusion
Sunflower heads and stalks, which are rich in pectic substances, are considered agricultural wastes.
Application of sunflower pectin in the food industry is very limited and restricted to utilization of its
gelling ability. The results of this study provide the first positive indication for of the prebiotic potential
of sunflower pectin. It has been demonstrated that sunflower pectin can be efficiently extracted with
Mcilvaine’s buffer of pH 7 and fractionated using membrane filtration. Pectin fraction of the highest Mw,
SPF>100, possessed a bifidogenic potential, when compared to negative control, whereas two other
fractions, SPF<50 and SPF50-100 were not bifidogenic. None of the three sunflower pectin fractions
influenced the level of Lactobacillus spp., Bacteroidetes and Firmicutes. Further improvements could
involve purification of the oligo- and polysaccharides, derived from sunflower pulp and elucidation of the
structure of the fractions to derive more conclusions about the structure-function relationships.
Acknowledgement
This work was partially financed by the 7th Framework Program via the Marie Curie Initial Training
Network, LeanGreenFood (EU-ITN 238084).
98

99
References
Ahmed, A. E. R., & Labavitch, J. M. (1978). A simplified method for accurate determination of cell wall
uronide content. Journal of Food Biochemistry, 1, 361–365.
Bergstrom, A., Licht, T. R., Wilcks, A., Andersen, J. B., Schmidt, L. R., Gronlund, H. A., Vigsnaes, L.
K., Michaelsen, K. F., & Bahl, M. I. (2012)., Introducing GUt Low-Density Array (GULDA) - a
validated approach for qPCR-based intestinal microbial community analysis. Fems
Microbiology Letters, 337, 38-47.
Bishop, C. T. (1955). Carbohydrates of sunflower heads. Canadian Journal of Chemistry, 33, 1521-1529.
Blumenkrantz, N., & Asboe-Hansen, G. (1973). New method for quantitative determination of uronic
acids. Analytical Biochemistry, 54, 484-489.
Chang, K. C., Dhurandhar, N., You, X., & Miyamoto, A. (1994). Sunflower head residue pectin
extraction as affected by physical conditions. Journal of Food Science, 59, 1207-1210.
Grimoud, J., Durand, H., de Souza, S., Monsan, P., Ouarne, F., Theodorou. V., & Rogues, C. (2010). In
vitro screening of probiotics and synbiotics according to anti-inflammatory and anti-
proliferative effects. International Journal of Food Microbiology, 144, 42-50.
Guo, X., Xia, X., Tang, R., Zhou, J., Zhao, H., & Wang, K.(2008). Development of a real-time PCR
method for Firmicutes and Bacteroidetes in faeces and its application to quantify intestinal
population of obese and lean pigs. Letters in Applied Microbiology, 47, 367-373.
Heilig, H. G. H. J., Zoetendal, E. G., Vaughan, E. E., Marteau, P., Akkermans, A. D. L., & de Vos, W.
M. (2002). Molecular diversity of Lactobacillus spp. and other lactic acid bacteria in the human
intestine as determined by specific amplification of 16S ribosomal DNA. Applied and
Environmental Microbiology, 68, 114-123.
Holck, J., Hjernø, K., Lorenzen, A., Vigsnæs, L. K., Hemmingsen, L., Licht, T. R., Mikkelsen, J. D., &
Meyer, A. S. (2011a). Tailored enzymatic production of oligosaccharides from sugar beet pectin
and evidence of differential effect of a single DP chain lenght difference on human faecal
microbiota composition after in vitro fermentation. Process Biochemistry, 46, 1039-1049.
Holck, J., Lorenzen, A., Vigsnæs, L. K., Licht, T. R., Mikkelsen, J. D., & Meyer, A. S. (2011b).
Feruloylated and non- feruloylated arabino-oligosaccharides from sugar beet pectin selectively
99

100
stimulate the growth of Bifidobacterium spp. in human fecal in vitro fermentations. Journal of
Agricultural and Food Chemistry, 59, 6511-6519.
Hotchkiss, A. T., Olano-Martin, E., Grace, W. E, Gibson, G. R., & Rastall, R. A. (2003). Pectic
oligosaccharides as prebiotics. In G. Eggleston, & G. L. Cote (Eds), Oligosaccharides in Food
and Agriculture (pp. 54–62). Washington: American Chemical Society.
Iglesias, M. T., & Lozano, J. E. (2004). Extraction and characterization of sunflower pectin. Journal of
Food Engineering, 62, 215-223.
Kertesz, Z. I. (1951). The pectin substances. New York: Interscience Publishers.
Kim, W. J., Sosulski, F., & Campbell, S. J. (1978). Formulation and characteristics of low-ester gels from
sunflower pectin. Journal of Food Science,43, 746–749.
Ley, R. E., Turnbaugh, P. J., Klein, S., & Gordon, J. I. (2006). Microbial ecology: Human gut microbes
associated with obesity. Nature, 444, 1022–1023.
Lin, M. J. Y., Sosulski, F. W., Humbert, E. S., & Downey, R. K. (1975). Distribution and composition of
pectins in sunflower plants. Canadian Journal of Plant Science, 55, 507-513.
Melton, L. D., & Smith, B. G. (2001). Determining the degree of methylation and acetylation of pectin.
Current Protocols in Food Analytical Chemistry. E3.4.1- E3.4.6.
Miyamoto, A., & Chang, K. C. (1992). Extraction and physicochemical characterization of pectin from
sunflower head residues. Journal of Food Science, 57, 1439-1443.
Mohamadzadeh, J., Sadeghi-Mahoonak, A. R., Yaghbani, M., & Aalami, M. (2010). Extraction of pectin
from sunflower head residues of selected iranian cultivars. World Applied Science Journal, 8,
21-24.
Ott, S. J., Musfeldt, M., Timmis, K. N., Hampe, J., Wenderoth, D. F., & Schreiber S. (2004). In vitro
alterations of intestinal bacterial microbiota in fecal samples during storage. Diagnostic
Microbiology and Infectious Disease, 50,237-245.
Palframan, R. J., Gibson, G. R., & Rastall, R. A. (2002). Effect of pH and dose on the growth of gut
bacteria on prebiotic carbohydrates in vitro. Anaerobe, 8, 287–292.
Penders, J., Vink, C., Driessen, C., London, N., Thijs, C., Stobberingh, E. E. (2005). Quantification of
Bifidobacterium spp., Escherichia coli and Clostridium difficile in faecal samples of breast-fed
and formula-fed infants by real-time PCR. Fems Microbiology Letters, 243, 141-147.
100
101
Peran, L., Camuesco, D., Comalada, M., Bailon, E., Henriksson, A., Xaus, J., Zarzuelo, A., & Galvez, J.
(2007). A comparative study of the preventative effects exerted by three probiotics,
Bifidobacterium lactis, Lactobacillus casei and Lactobacillus acidophilus, in the TNBS model
of rat colitis. Journal of Applied Microbiology, 103, 836-844.
Rossi, M., Corradini, C., Amaretti, A., Nicolini, M., Pompei, A., Zanoni, S., & Matteuzzi, D. (2005).
Fermentation of fructooligosaccharides and inulin by bifidobacteria: A comparative study of
pure and fecal cultures. Applied and Environmental Microbiology, 71, 6150-6158.
Ruijter, J. M., Ramakers, C., Hoogaars, W. M. H., Karlen, Y., Bakker, O., van den Hoff, M. J. B., &
Moorman, A. F. M. (2009). Amplification efficiency: linking baseline and bias in the analysis of
quantitative PCR data. Nucleic Acids Research, 37.
Rycroft, C. E., Jones, M. R., Gibson, G. R., & Rastall, R. A. (2001). A comparative in vitro evaluation of
the fermentation properties of prebiotic oligosaccharides. Journal of Applied Microbiology, 91,
878–887.
Sabir, M. A., Sosulski, F. W., & Campbell, S. J. (1976). Polymethaphosphate and oxalate extraction of
sunflower pectins. Journal of Agricultural and Food Chemistry, 24, 348-350.
Sanz, M. L., Gibson, G. R., & Rastall, R. A. (2005). Influence of disaccharide structure on prebiotic
selectivity in vitro. Journal of Agricultural and Food Chemistry, 53, 5192–5199.
Shewfelt, A. L., & Worthington, O.J. (1953). The extraction of pectin from sunflower heads. Food
Technology, 7, 336-340.
Shi, X. Q., Chang, K. C., Schwarz, J. G., Wiesenborn, D. P., & Shih, M. C. (1996). Optimizing pectin
extraction from sunflower heads by alkaline washing. Bioresource Technology, 58, 291-297.
Shirasawa, Y., Shibahara-Sone, H., Iino, T., & Ishikawa F. (2010). Bifidobacterium bifidum BF-1
suppresses Helicobacter pylori-induced genes in human epithelial cells. Journal of Dairy
Science, 93, 4526-4534.
Sosulski, F. W., Lin, M. J. Y., & Humbert, E. S., (1978). Gelation characteristics of acid-precipitated
pectin from sunflower heads. Canadian Institute of Food Science and Technology Journal, 11,
113.
Thomassen, L. V., Vigsnæs, L. K., Licht, T. R., Mikkelsen, J. D., & Meyer, A.S. (2011). Maximal release
of highly bifidogenic soluble dietary fibers from industrial potato pulp by minimal enzymatic
treatment. Applied Microbiology and Biotechnology, 90, 873-884.
101

102
Turnbaugh, P. J., Ley, R. E., Mahowald, M. A., Magrini, V., Mardis, E. R., & Gordon, J. I. (2006). An
obesity-associated gut microbiome with increased capacity for energy harvest. Nature, 444,
1027–1131.
Van den Hoogen, B. M., van Weeren, P. R., Lopes-Cardozo, M., van Golde, L. M. G., Barneveld, A., &
van de Lest, C. H. A. (1998). A microtiter plate assay for the determination of uronic acids.
Analitycal Biochemistry, 257, 107-111.
Walter, J., Tannock, G. W., Tilsala-Timisjarvi, A., Rodtong, S., Loach, D. M., Munro, K., & Alatossava,
T. (2000). Detection and identification of gastrointestinal Lactobacillus species by using
denaturing gradient gel electrophoresis and species-specific PCR primers. Applied and
Environmental Microbiology, 66, 297-303.
Williams, N. T. (2010). Probiotics. American Journal of Health-System Pharmacy, 67, 449-458.
102

103
5. Concluding remarks
Enzymatic catalysis for efficient release of pectin with functional properties.
Commercial cellulases possessing hydrolytic activities with respect to lime cell wall components were
applied to extract pectin from lime peels. Yield and viscosity-average molecular weights of pectin
polymers were dependent on extraction pH and the enzymes used. The best solution for high pectin
recovery (>25% w/w) and high molecular weight (60 kDa) was achieved at pH 3.5 using the enzymes
Laminex C2K or Validase TRL.
Enzymatically extracted pectin samples contained higher amounts of neutral sugars (11-15%) than
classically acid-extracted pectins. Enzymatically extracted pectins were also rich in galacturonic acid (71-
85% w/w). The enzymatically extracted pectin polymers were not sensitive to the presence of Ca2+ ions,
they formed a gel at low pH in the presence of sugar and they were also able to stabilize acidified milk
drinks.
Enzymatic de-esterification of pectin extracted with Laminex C2K improved its calcium sensitivity and
further improved its ability to stabilize acidified milk drinks. Application of pectin methyl esterases
originated from plants resulted in pectins with better stabilization abilities than pectins modified by pectin
methyl esterases from fungi.
The study demonstrated that it was possible to substitute classical acid-based extraction with enzymatic
catalysis and to obtain pectin products with specific functional properties.
Application of FTIR, carbohydrate microarrays and multivariate data analysis for prediction and
characterization of enzyme- versus acid-extracted pectin.
FTIR spectroscopy and carbohydrate microarrays in combination with multivariate data analysis have the
potential to characterize crude pectin extracts and predict pectin yields and pectin quality, including the
degree of esterification of the pectin. FTIR showed especially high accuracy and precision during PLS
modeling, therefore enabling the possibility for further intelligent instrumentation and online monitoring.
Furthermore, simple PCA on FTIR data indicated the possibility to determine the optimal pectin
extraction time without the need for interrupting the extraction process or using cumbersome, classical
reference analysis techniques.
103

104
The results suggested major differences between the enzymatic and the acidically extracted crude pectin
extracts with respect to the degree of esterification and abundance of RGI pectic regions. Further analysis
would be necessary to determine if the detected RGI and neutral sugars belonged to the (precipitatable)
pectic polymer or existed free in solution.
Both FTIR and carbohydrate microarray analysis have high potential to move pectin analysis closer to
pectin production, which is particularly important in industrial process and quality control.
Evaluation of the prebiotic potential of sunflower pectin fractions.
Sunflower pectin can be efficiently extracted from sunflower heads. Our observations indicate that it was
possible to obtain very high pectin yield (>30%) with McIlvaine’s buffer and that pH is the only factor
that significantly influences pectin yield. According to the model, the temperature did not play any role in
pectin release.
Fractionation of sunflower pectin according to size resulted in three fractions with different properties.
SPF<50 had the lowest amount of methyl and acetyl groups and a very low amount of galacturonic acid.
SPF50-100 had higher content of methyl and acetyl groups than SPF<50, galacturonic acid content >90%
and much lower amount of neutral sugars than SPF<50 and SPF>100. The last fraction, SPF>100, shared
the most similarity with the ‘mother’ pectin, obtained after 3L extraction.
Results from in vitro fermentations showed the selective stimulation of Bifidobacterium spp. only in case
of SPF>100. Additionally, none of the three fractions stimulated the selective growth of Lactobacillus
spp. and nor did FOS. None of the three sunflower pectin fractions caused significant changes in the
densities of Bacteroidetes and Firmicutes. The relative increase of Firmicutes to Bacteroidetes ratio,
observed in case of FOS, may potentially increase the obesity risk and influence the development of
obesity-associated metabolic syndrome. It was therefore beneficial that SPF>100, having a bifidogenic
potential, did not affect the ratio between the two phyla.
104

105
6. References
Albersheim, P., Neukom, D., & Deuel, H. (1960). Splitting of pectin chain molecules in neutral solutions.
Archives of Biochemistry and Biophysics, 90, 46–51.
Azemar, M., Hildenbrand, B., Haering, B., Heim, M. E., & Unger, C. (2007). Clinical benefit in patients
with advanced solid tumors treated with modified citrus pectin: a prospective pilot study. Clinical
Medicine Insights: Oncology, 1, 73-80.
Basic, A., Harris, P. J., & Stone, B. A. (1988). Carbohydrates. In P. K. Stumpf, E. E. Conn, & J. Preiss
(Eds), The Biochemistry of Plants (pp. 297-369). London: Academic Press.
Beldman, G., Schols, H. A., Pitson, S. M, Searle-van Leeuwen, M. J. F., & Voragen, A. G. J. (1997).
Arabinans and arabinan degrading enzymes. In: R.J. Sturgeon (Ed.), Advances in Macromolecular
Research (pp. 1–64). London: JAI Press Inc.
Berth, G. (1988). Studies on the heterogeneity of citrus pectin by gel permeation chromatography on
Sepharose 2 B/Sepharose 4 B. Carbohydrate Polymers, 8, 105-117.
Buxton, D.R. & Casler, M.D. (1993). Environmental and genetic effects on cell wall composition and
digestibility. In Jung, H.G., Buxton, D.R., Hatfield R.D., & Ralph, J. (Eds), Forage Cell Wall
Structure and Digestibility (pp. 685–714). Madison: ASA, CSSA, SSSA.
Cárdenas, Higuera-Ciapara, & Goycoolea, 1997. Rheology and aggregation of cactus (Opuntia ficus-
indica) mucilage in solution. Journal of the Professional Association for Cactus Development, 152-
159.
Carpita, N. C., & Gibeaut, D. M. (1993). Structural models of primary cell walls in flowering plants:
consistency of molecular structure with the physical properties of the walls during growth. The
Plant Journal, 3, 1-30.
Cox, R. E., & Higby, R. H. (1944). A better way to determine the gelling power of pectins. Food
Industries, 16, 441–442, 505–507.
Dongowski, G., & Lorenz, A. (1998). Unsaturated oligogalacturonic acids are generated by in
vitrotreatment of pectin with human fecal flora. Carbohydrate Research, 314, 237–244.
Fishman, M. L., Pepper, L., & Pfeffer, P. E. (1986). Dilute solution properties of pectin. In J. E. Glass
(Ed.), Water Soluble Polymers: Beauty with Performance , Advances in Chemistry Series 213 (pp
57-70). Washington, DC: American Chemical Society Publications.
Fishman, M. L., Cooke, P., Levaj, B., Gillespie, D. T., Sondey, S. M., & Scorzat, R. (1992). Pectin
microgels and their subunit structure. Archives of Biochemistry and Biophysics, 294, 253–260.
105
106
Fishman, M. L., Cooke, P., Hotchkiss, A., & Damert, W. (1993). Progressive dissociation of pectin.
Carbohydrate Research, 248, 303–316.
Fishman, M. L., Chau, H. K., Hoagland, P., & Ayyad, K. (2000). Characterization of pectin flash
extracted from orange albedo by microwave heating under pressure. Carbohydrate Research, 323,
126-138.
Fishman, M. L., Chau, H. K., Kolpak, F., & Brady, J. (2001). Solvent effects on the molecular properties
of pectins. Journal of Agricultural and Food Chemistry, 49, 4494-4501.
Flourine, B., Vidon, N., Chayvialle, J. A., Palma, R., Franchisseur, C., & Bernier, J. J. (1985). Effect of
increased amounts of pectin on solid-liquid meal digestion in healthy man. The American Journal
of Clinical Nutrition, 42, 495-503.
Gibson, G.R. (1995). Dietary modulation of the human colonic microbiota – introducing the concept of
prebiotics. Journal of Nutrition, 125, 1401-12.
Gibson, G. R. (2004). Prebiotic. Journal Gastroenterology Supplement, 18, 287-298.
Gibson, G. R., & Roberfroid, M. B. (1995). Dietary modulation of the human colonic microbiota:
introducing the concept of prebiotics. Journal of Nutrition, 125, 1401-1412.
Gilbert, H. J. (2010). The biochemistry and structural biology of plant cell wall deconstruction. Plant
Physiology, 153, 444-455.
Grant, G. T., Morris, E. R., Rees, D. A., Smith, P. J. C., & Thom, D. (1973). Biological interactions
between polysaccharides and divalent cations: The egg-box model. Febs Letters, 32, 195-198.
Guggenbichler, J. P., de Bettignies-Dutz, A., Meissner, P., Schellmoser, S., & Jurenitsch, J. (1997).
Acidic oligosaccharides from natural sources block adherence of Escherichia coli on uroepithelial
cells. Pharmaceutical and Pharmacological Letters, 1, 35-38.
Hanke, D. E., & Northcote, D. H. (1975). Molecular visualization of pectin and DNA by Ruthenium Red.
Biopolymers, 14, 1-17.
Harris, P. J., &Stone, B. A. (2008). Chemistry and molecular organization of plant cell walls. In Himmel,
M. E. (Ed.), Biomass Recalcitrance (pp. 60–93). Oxford: Blackwell.
Holck, J., Hjernø, K., Lorenzen, A., Vigsnæs, L. K., Hemmingsen, L., Licht, T. R., Mikkelsen, J. D., &
Meyer, A. S. (2011a). Tailored enzymatic production of oligosaccharides from sugar beet pectin
and evidence of differential effect of a single DP chain lenght difference on human fecal microbiota
composition after in vitro fermentation. Process Biochemistry, 46, 1039-1049.
Holck, J., Lorenzen, A., Vigsnæs, L. K., Licht, T. R., Mikkelsen, J. D., & Meyer, A. S. (2011b).
Feruloylated and non- feruloylated arabino-oligosaccharides from sugar beet pectin selectively
stimulate the growth of Bifidobacterium spp. in human fecal in vitro fermentations. Journal of
Agricultural and Food Chemistry, 59, 6511-6519.
106
107
Hotchkiss, A. T., Olano-Martin, E., Grace, W. E., Gibson, G. R., & Rastall, R. A. (2003). Pectic
Oligosaccharides as Prebiotics. In G. Eggleston et al. (Eds), Oligosaccharides in Food and
Agriculture (pp 54–62). Washington, DC: American Chemical Society
Hotchkiss, A.T., Rastall, R., Gibson, G., Eliaz, I., Liu, L.S., Fishman, M. 2009. New bioactive and
biobased product applications of pectin. In: Schols, H.A., Visser, R.G.F., Voragen, A.G.J. (Eds),
Pectins and Pectinases (p. 305-312). Wageningen, The Netherlands: Wageningen Academic
Publisher.
Jackson, C. L., Dreaden, T. M., Theobald, L. K., Tran, N. M., Beal, T. L., Eid, M., Gao, M. Y., Shirley,
R. B., Stoffel, M. T., Kumar, M. V., & Mohnen, D.(2007). Pectin induces apoptosis in human
prostate cancer cells: correlation of apoptotic function with pectin structure. Glycobiology, 17, 805–
819.
Jenkins, D. J. A., Gassul, M. A., Leeds, A. R., Metz, G., Dilawari, J. B., Slavin, B., & Blendis, L. M.
(1977). Effect of dietary fiber on complication of gastric surgery. Gastroenterology, 72, 215-217.
Körner, R., Limberg, G., Christensen, T. M. I. E., Mikkelsen, J. D., & Roepstorff, P. (1999). Sequencing
of partially methyl-esterified oligogalacturonates by tandem mass spectrometry and its use to
determine pectinase specificities. Analytical Chemistry, 71, 1421-1427.
Ley, R. E., Turnbaugh, P. J., Klein, S.,& Gordon, J. I. (2006). Microbial ecology: Human gut microbes
associated with obesity. Nature, 444, 1022–1023.
Licht, T.R., Hansen, M., Bergstrom, A., Poulsen, M., Krath, B.N., Markowski, J., Dragsted, L.O., and
Wilcks, A. (2010). Effects of apples and specific apple components on the cecal environment of
conventional rats: role of apple pectin. BMC Microbiology, 10, 13–23.
Limberg, G., Körner, R., Buchholt, H. C., Christensen, T. M. I. E., Roepstorff, P., & Mikkelsen, J. D.
(2000a). Analysis of different de-esterification mechanisms for pectin by enzymatic fingerprinting
using endopectin lyase and endopolygalacturonase II from A. niger. Carbohydrate Research, 327,
293-307.
Limberg, G., Körner, R., Buchholt, H. C., Christensen, T. M. I. E., Roepstorff, P., & Mikkelsen, J. D.
(2000b). Quantification of the amount of galacturonic acid residues in blocksequences in pectin
homogalacturonan by enzymatic fingerprinting with exo- and endo-polygalacturonase II from
Aspergillus niger. Carbohydrate Research, 327, 321-332.
Lin, M. J. Y., Sosulski, F. W., Humbert, E. S., & Downey, R. K. (1975). Distribution and composition of
pectins in sunflower plants. Canadian Journal of Plant Science, 55, 507-513.
Lin, M. J. Y., Sosulski, F. W., & Humbert, E. S. (1978). Acidic Isolation of Sunflower Pectin. Canadian
Institute of Food Science and Technology Journal, 11, 75 77.
107

108
Lundt, I., Madsen, R., Christensen, T., & Mikkelsen, J. D. (2002). Pektin – et naturligt geleringsmiddel.
Dansk Kemi, 83, 41-44.
Maltby, D., Carpita, N.C., Monterinos, D., Kulow, C., & Delmer, D.P.(1979). -1,3- glucan in developing
cotton fibers. Structure, localization, and relationship of synthesis to that of secondary wall
cellulose. Plant Physiology, 63, 1158-1164.
Marx-Figini, M. (1982). The control of molecular weight and molecular-weight distribution in the
biogenesis of cellulose. In Brown, R.M., Jr (Ed.), Cellulose and Other Natural Polymer Systems
(pp. 243-271). New York: Plenum.
May, C. D. (1990). Industrial pectins: Sources, production and applications. Carbohydrate Polymers, 12,
79-99.
McCann, M.C. & Roberts, K. (1991). Architecture of the primary cell wall. In: Lloyd, C.W. (Ed.) The
Cytoskeletal Basis of Plant Growth and Form (pp. 109–129). London: Academic Press.
Miyamoto, A., & Chang, K. C., (2006). Extraction and physicochemical characterization of pectin from
sunflower head residues. Journal of Food Science, 57, 1439–1443.
Mohamadzadeh, J., Sadeghi-Mahoonak, A. R., Yaghbani, M., & Aalami, M.(2010). Extraction of pectin
from sunflower head residues of selected Iranian cultivars. World Applied Sciences Journal, 8, 21-
24.
Mohnen, D. (2008). Pectin structure and biosynthesis. Current Opinion in Plant Biology, 11, 266-277.
Oakenfull, D., & Scott, D. (1984). Hydrophobic interaction in the gelation of high methoxyl pectins.
Journal of Food Science, 49, 1093–1098.
Olano-Martin, E., Mountzouris, K. C., Gibson, G. R., & Rastall, R. A. (2001). Continuous production of
pectic oligosaccharides in an enzyme membrane reactor. Journal of Food Science, 66, 966-971.
Olano-Martin, E., Gibson, G. R., & Rastall, R. A. (2002). Comparison of the in vitrobifidogenic
properties of pectins and pectic-oligosaccharides. Journal of Applied Microbiology, 93, 505–511.
Olano-Martin, E., G. H. Rimbach, G. R. Gibson, & Rastall, R. A. (2003a). Pectin and pectic-
oligosaccharides induce apoptosis in in vitro human colonic adenocarcinoma cells. Anticancer
Research, 23, 341-346.
Olano-Martin, E., Williams, M. R., Gibson, G. R., & R. A. Rastall. (2003b). Pectins and pectic-
oligosaccharides inhibit Escherichia coli O157:H7 Shiga toxin as directed towards the human
colonic cell line HT29. FEMS Microbiology Letters, 218, 101-105.
Ovodov, Y.S. (1975). Structural chemistry of plant glycuronoglycans. Pure and Applied Chemistry, 42,
351–369.
Paoletti, S., Cesaro, A., Delben, F., & Ciana., A. (1986). In M.M. Fishman, & J. J. Joseph (Eds),
108

109
Chemistry and Function of Pectins(pp, 73-87). Washington DC: American Chemical Society
Publications.
Ptichkina, N. M., Markina, O.A., & Rumyantseva, G. M. (2007). Pectin extraction from pumpkin with the
aid of microbial enzymes. Food Hydrocolloids, 22, 192-195.
Rees, D. A., & Wright, N. J. (1969). Molecular cohesion in plant cell walls. Methylation analysis of
pectic polysaccharides from the cotyledons of white mustard. Biochemical Journal, 115, 431-439.
Remoroza, C., Cord-Landwehr, S., Leijdekkers, A. G. M., Moerschbacher, B. M., Schols, H. A., &
Gruppen, H. (2012). Combined HILIC-ELSD/ESI-MSn enables the separation, identification and
quantification of sugar beet pectin derived oligomers. Carbohydrate Polymers, 90, 41– 48.
Roberfroid, M. (1993). Dietary fiber, inulin, and oligofructose: a review comparing their physiological
effects. Critical Reviews in Food Science and Nutrition, 33, 103–148.
Rolin, C., Nielsen, B. U., & Glahn, P-E (1998). Pectin. In Dumitriu, S. (Ed.), Polysaccharides: structural
diversity and functional versatility (pp.377-431). New York: Marcel Dekker Inc.
Sabir, M. A., Sosulski, F. W.,& Campbell, S. J.,(1976). Polymethaphosphate and oxalate extraction of
sunflower pectins. Journal of Agricultural and Food Chemistry, 24, 348-350.
Salminen, S., Ramos, P., & Fonden R. (1993). Substrates and lactic acid bacteria. In Salminen, S., & von
Wright, A. (Eds), Lactic Acid Bacteria. New York: Marcel Dekker.
Sawayama, S., Kawabata, A., Nakahara, H., & Kamata, T. (1988). A light scattering study on the effects
of pH on pectin aggregation in aqueous solution. Food Hydrocolloids, 2, 31-37.
Scantlebury Manning, T.,&Gibson, G. R. (2004). Prebiotics. Best Practice & Research Clinical
Gastroenterology, 18, 287-298.
Schols, H., & Voragen, A. G. J. (1994). Occurrence of pectin hairy regions in various plant cell wall
materials and their degradability by rhamnogalacturonase. Carbohydrate Research, 256, 83-95.
Schols, H. A., Voragen, A. G. J. (1996). Complex pectins: Structure elucidation using enzymes. In J.
Visser, &A. G. J. Voragen (Eds), Pectins and Pectinases (pp. 3-19). Amsterdam: Elsevier Science
B. V.
Selvendran, R. R. (1983). The chemistry of plant cell walls. In G. G.Birch, & J. Parker (Eds), Dietary
Fibre (p. 95). London: Applied Science Publ.
Shi, X. Q., Chang, K. C., Schwarz, J. G., Wiesenborn, D. P., & Shih, M. C.(1996). Optimizing pectin
extraction from sunflower heads by alkaline washing. Bioresource Technology, 58, 291-297.
Sorochan, V. D., Dzizenko, A. K., Bodin, N. S., & Ovdov, Y. S. (1971). Light-scattering studies of pectic
substances in aqueous solutions. Carbohydrate Research, 20, 243-249.
Sosulski, F. W., Lin, M. J. Y., & Humbert, E. S., (1978). Gelation characteristics of acid-precipitated
pectin from sunflower heads. Canadian Institute of Food Science and Technology Journal, 11, 113.
109

110
Spiller, G. A., Chernoff, M. C., Hill, R. A., Gates, J. E., Nassar, J. J., & Shipley, E. A. (1980). Effect of
purified cellulose pectin and low residue diet on fecal volatile fatty acids transit time and fecal
weight in humans. The American Journal of Clinical Nutrition, 33, 754-759.
Thakur, B. R., Singh, R. K., & Handa, A. K. (1997). Chemistry and uses of pectin-a review. Critical
Reviews in Food Science and Nutrition, 37, 47-73.
Thammarutwasik, P., Hongpattarakere, T., Chantachum, S., Kijroongrojana, K., Itharat, A.,
Reanmongkol, W., Tewtrakul, S.,&Ooraikul, B. (2009). Prebiotics - a review. Songklanakarin
Journal of Science and Technology, 31, 401-408.
Thibault, J.-F., De Dreu, F., Greaeds, C. C.J.M., & Rombouts, F.M. (1988). Studies on extraction of
pectins from citrus peels, apple marks and sugar-beet pulps with arabinase and galactanase.
Carbohydrate Polymers, 9, 119-131.
Thomassen, L. V., Vigsnæs, L. K., Licht, T. R., Mikkelsen, J. D.,& Meyer, A.S. (2011). Maximal release
of highly bifidogenic soluble dietary fibers from industrial potato pulp by minimal enzymatic
treatment. Applied Microbiology and Biotechnology, 90, 873-884.
Timpa, J.D. (1991). Application of universal calibration in gel permeation chromatography for molecular
weight determinations of plant cell wall polymers: cotton fiber. Journal of Agricultural and Food
Chemistry, 39, 270-275.
Tromp, R. H., de Kruif, C. G., van Eijk, M., & Rolin, C. (2004). On the mechanism of stabilization of
acidified milk drinks by pectin. Food Hydrocollids, 18, 565–572.
Turnbaugh, P. J., Ley, R. E., Mahowald, M. A., Magrini, V., Mardis, E. R.,&Gordon, J. I. (2006). An
obesity-associated gut microbiome with increased capacity for energy harvest. Nature, 444, 1027–
1131.
Verhertbruggen, Y., & Knox, J. P. (2006). Pectic polysaccharides and expanding cell walls. Plant Cell
Monographs, 6, 139-158.
Vincken, J. P., Schols, H. A., Oomen, R. J., McCann, M. C., Ulvskov, P., Voragen, A. G., et al. (2003). If
homogalacturonan were a side chain of rhamnogalacturonan I. Implications for cell wall
architecture. Plant physiology, 132, 1781–1789.
Voragen, A. G. J., Pilnik, W., Thibault, J. –F., Axelos, M. A. V., & Renard, C. M. C. G. (1995). Pectins.
In A. M. Stephen (Ed.), Food Polysaccharides and their Applications (pp. 287-339). New York:
Marcel Dekker Inc.
Voragen, F., Beldman, G., & Schols, H (2001). Chemistry and Enzymology of Pectins. In B. V.
McCleary & L. Prosky (Eds), Advanced Dietary Fibre Technology (pp. 379-398).Oxford:
Blackwell Science Ltd.
110

111
Walter, R. H, & Matias, H. L. (1991). Pectin aggregation number by light scattering and reducing end-
group analysis. Carbohydrate Polymers, 15, 33-40.
Ward, O. P., & Moo-Young, M. (1989). Enzymatic degradation of cell wall and related plant
polysaccharides. CRC Critical Reviewsin Biotechnology, 8, 237-274.
Wichienchot, S., Thammarutwasik, P., Jongjareonrak, A., Chansuwan, W., Hmadhlu, P.,
Hongpattarakere, T., Itharat, A., & Ooraikul, B. (2011). Extraction and analysis of prebiotics from
selected plants from southern Thailand. Songklanakarin Journal of Science and Technology, 33,
517-523.
Willats, W. G. T., Knox, J. P., & Mikkelsen, J. D. (2006). Pectin: New insights into an old polymer are
starting to gel. Trends in Food Science & Technology, 17, 97-104.
Willats, W. G. T., McCartney, L., Mackie, W., & Knox, J. P. (2001). Pectin: Cell biology and prospects
for functional analysis. Plant Molecular Biology, 47, 9-27.
Yapo, B.M., Lerouge, P., Thibault, J.-F., & Ralet, M.-C. (2007). Pectins from citrus peel cell walls
contain homogalacturonans homogenous with respect to molar mass, rhamnogalacturonan I and
rhamnogalacturonan II. Carbohydrate Polymers, 69, 426-435.
Yoo, S.-H., Fishman, M. L., Savary, B. J., & Hotchkiss, A. T. (2003). Monovalent salt-induced gelling
system of enzymatically deesterified pectin. Journal of Agricultural and Food Chemistry, 51,
7410–7417.
Yoo, S. H., Fishman, M. L., Hotchkiss, A. T., & Lee, H. G. (2006). Viscometric behavior of high-
methoxy and low-methoxy pectin solutions. Food Hydrocolloids, 20, 62–67.
Yuliarti, O., Matia-Merino, L., Goh, K. K. T., Mawson, J.A.,& Brennan, C. S. (2011). Effect of Celluclast
1.5L on the physicochemical characterization of gold kiwifruit pectin. International Journal of
Molecular Sciences, 12, 6407-6417.
Zandleven, J., Beldman, G., Bosveld. M., Schols, H. A., Voragen, A. G. J. (2006).Enzymatic degradation
studies of xylogalacturonans fromapple and potato, using xylogalacturonan hydrolase.
Carbohydrate Polymers, 65, 495-503.
Zhao, Z.Y., Liang, L., Fan, X., Yu, Z., Hotchkiss, A.T., Wilk, B.J., &Eliaz, I. (2008). The role of
modified citrus pectin as a safe and effective chelator of lead in children hospitalized with toxic
lead levels. Alternative Therapies in Health and Medicine. 14, 34-38.
Zykwinska, A., Boiffard, M. –H., Kontkanen, H., Buchert, J., Thibault, J. –F., & Bonin, E. (2008).
Extraction of green labelled pectins and pectic oligosaccharides from plant byproducts. Journal of
Agricultural and Food Chemistry,56, 8926-8935.
111

112
Zykwinska, A., Gaillard, C., Boiffard, M.-H., Thibault, J.-F., & Bonin, E. (2009). ‘‘Green labelled’’
pectins with gelling and emulsifying properties can be extracted by enzymatic way from
unexploited sources. Food Hydrocolloids, 23, 2468-2477.
112

Center For Bioprocess Engineering
Department of Chemical and Biochemical Engineering
Technical University of Denmark
Søltofts Plads, Building 229
DK-2800 Kgs. Lyngby
Denmark
Phone: +45 4525 2800
Fax: +45 4525 2258
Web: www.bioeng.kt.dtu.dk
ISBN : 978-87-93054-39-4