![Photochemical reaction of 9-nitro-substituted anthracene-like molecules 9-methyl-10-nitroanthracene and 12-methyl-7-nitrobenz[a]anthracene](https://static.fdokumen.com/doc/165x107/6336a9004e9c1ac02e082ee9/photochemical-reaction-of-9-nitro-substituted-anthracene-like-molecules-9-methyl-10-nitroanthracene.jpg)
Characterization of pectin lyases on pectins and methyl ...
136
Characterization of pectin lyases on pectins and methyl oligogalacturonates A. G. J. Voragen NN08201,530
-
Upload
khangminh22 -
Category
Documents
-
view
0 -
download
0
Transcript of Characterization of pectin lyases on pectins and methyl ...

Characterization of pectin lyases
on pectins and methyl oligogalacturonates
A. G. J. Voragen
NN08201,530

A. G. J. Voragen
Characterization of pectin lyases on pectins and methyl oligogalacturonates
Proefschrift ter verkrijging van de graad van doctor in de landbouwwetenschappen, op gezag van de rector magnificus, prof. dr. ir. H. A. Leniger, hoogleraar in de technologie, in het openbaar te verdedigen op woensdag 25 oktober 1972 te 16.00 uur in de aula van de Landbouwhogeschool te Wageningen
fpudoel
Centre for Agricultural Publishing and Documentation
Wageningen -1972

ISBN 90 220 0409 0
This thesis will also be published as Agricultural Research Reports 780.
© Centre for Agricultural Publishing and Documentation, Wageningen, 1972.
No part of this book may be reproduced and/or published in any form, by print, photoprint, microfilm or any other means without written permission from the publishers. •,'•-•_.-*.•

Stellingen
I Het aandeel van pectine lyasen in de werking van pectinasen in de groente- en fruit-technologie mag niet onderschat worden.
Dit proefschrift, Hoofdstuk 5.
II Het is onjuist te veronderstellen (zoals Nagel doet), dat 0-(a-D-galactopyranosyluron-zuur)-(l-»4)-D-galactopyranuronzuur ten gevolge van sterische effecten bij voorkeur op de niet-reducerende uronzuurrest wordt veresterd.
C. W. Nagel, Carbohydrate Res. 18 (1971): 453-458. Dit proefschrift, Hoofdstuk 4.
I l l
De door Neukom gegeven classificatie van pectine splitsende enzymen dient te worden herzien.
H. Neukom, Schweiz. Landwirtsch. Forsch. 2 (1963): 112-121.
IV Het probleem bij de bepaling van het sappercentage in vruchtendranken is niet de analysemethode maar de keuze van de populatie waaraan de standaardanalyse uitgevoerd wordt. Hieraan is door Koch & Hess onvoldoende aandacht besteed.
J. Koch & D. Hess, Dt. Lebensmitt. Rdsch. 67 (1971): 185-195.
V Het is niet afdoende aangetoond, dat tijdens de reactie van chinoline met kaliumamide in alkylamine eerst 2-aminochinoline ontstaat, dat dan verder omgezet wordt in 2-alkylaminochinoline, zoals door Gibson is vermeld.
M. S. Gibson, in S. Palzi, The chemistry of the amino group, Interscience Publishers, 1968, p. 41. F. W. Bergstrom, H. G. Sturz & H. W. Tracy, J. org. Chem. 11 (1946), 239-241. N. G. Luthy, F. W. Bergstrom & H. S. Mosher, J. org. Chem. 14 (1949), 322-325.

VI De door Miller gegeven analyse van het PMR-spectrum van 2-broommethyl-2,3-dihydro-4,7-di-?-butylbenzofuraan is onvolledig.
B. Miller, Chem. Comm. (1966): 327-329.
VII Het gebruik van schimmels bij de fermentatie van levensmiddelen is door de ontdekking van mycotoxinen in diskrediet gebracht.
W. D. Gray, The use of fungi as food and in food processing, The Chemical Rubber Co. (1970), Cleveland.
VIII Het is bijzonder gewenst dat voor de preventie van voedselvergiftigingen voorlichting gegeven wordt die geen schrikeffecten maar verruiming van kennis beoogt.
IX Niets rechtvaardigt de bewering dat heldere vruchtesappen, bereid met behulp van klaringsenzymen, door hun hoger gehalte aan vrij methanol minder gezond zijn dan troebele.
A. Bertuzzi, II Succhi di Frutta in Italia 2 (1959): 67.
X Het onderscheid in persbaarheid tussen appels en peren berust hoofdzakelijk op verschillen in samenstelling van de celwand en in de structuur van de weefsels.
M. Rogaar-Karsten, Ir.-verslag, L. H. labs voor plantenfysiologie en levensmiddelen chemie en -microbiologie (1971).
XI Door de publiciteit rond "de laatste stelling" is een serieuze interpretatie van deze dubieus.
Proefschrift van A. G. J. Voragen Wageningen, 25 oktober 1972
Abstract
VORAGEN, A. G. J. (1972) Characterization of pectin lyases on pectins and methyl oligogalacturonates. Thesis, Wageningen. ISBN 90 220 0409 0, (xiv) + 121 p., 35 figs, 22 tbs, 145 refs, Eng. and Dutch summaries. Also: Agric. Res. Rep. (Versl. landbouwk. Onderz.) 780.
Pure saturated and unsaturated oligogalacturonic acids, including unsaturated monogalacturonic acid, were isolated and characterized. Their ultraviolet absorbance at 232 nm, and their reactivities in the periodate thiobarbituric acid test and carbazole tests were studied. From these compounds methyl oligogalacturonates were prepared, which were used as model substrates.
Pectin lyases (EC 4.2.99.8; poly-a-l,4-D-methyl-galacturonate lyase) were found to be very common in commercial 'pectinase' preparations. From each of three 'pectinase' preparations a pectin lyase was isolated free of other pectolytic enzymes. Their pH optimum, pH stability, isoelectric point and activation energy were determined. Information on the action of the enzymes on pectins with various degrees of esterification (DE) was obtained by kinetic studies, by determining the extent of degradation and by analysing the composition of the reaction mixtures. The breakdown mechanism on pectin and pattern of action on methyl oligogalacturonates was studied. Divalent cations were found to activate pectin lyase activity, their activation depended on the pH and DE. Literature on the isolation and characterization of oligogalacturonides and on pectin degrading enzymes is reviewed.
Aon mijn ouders Lea Michel Chantal

Acknowledgements
My thanks are due to: - my promoter Professor Dr. W. Pilnik for giving me the opportunity of undertaking this work, for his stimulating interest and for his valuable advice - my colleague, Dr. Ir. F. M. Rombouts who introduced me to the subject and with whom I have enjoyed working - Miss Maria M0ller and Mr. M. J. Hooydonk for their co-operation as technical assistants - Ir. J. Th. C. Bohm, Ir. F. E. A. van Houdenhoven, Ir. H. A. Kuiper, Ir. M. J. R. Nout, J. Riemer, Ir. S. C. E. Romkes and Ir. Th. G. Uijttenboogaart for their cooperation and assistance - Dr. S. B. Tjan of Unilever Research, Duiven, the Netherlands for the PMR analysis and Mr. W. Ch. Melger for his advice on thin layer chromatography - Messrs. Obipectin Ltd., Bischofszell, Switzerland, for kindly providing the pectin preparations - Messrs. Dr. Schubert, Laufen, Switzerland, Messrs. Grindstedvaerket, Aarhus, Denmark, and Messrs. Kikkoman Shoyu Co., Ltd., Chiba-Ken, Japan, for kindly providing the 'pectinase' preparations - Miss Helga Belling, Mrs. Laura Vlug-Hensbroek for typing the manuscript and to Messrs. M. Schimmel and C. Rijpma for drawing the figures - Mrs. E. Brouns-Murray for correcting the English and Mr. R. J. P. Aalpol for editing the manuscript.
Curriculum vitae
Na het behalen van het diploma HBS-B aan het Bernardinus College te Heerlen
ho8r t T ZrD1961 ***StUdJe ̂ d e Ievensmiddelentechnologie aan de landbouw-™ , t e W ag^gen. Hij specialiseerde zich in de levensmiddelenchemie met als
S ^ o S T ,deIenmicrobioI°g ie ^ fysische chemie. Na zijn afstuderen in S Z t ^ Wj ^ wetenschaPPeliJk assistent dit proefschrift op het als « 2 T T V°0 r fensmiddeIench^ en -microbiologie. Sinds juli 1971 is hij als medewerker aan deze afdeling aangesteld.
Samenvatting
Het doel van deze studie was uit commerciele 'pectinase' preparaten enkele pectine depolimerasen te isoleren en deze te karakteriseren om aldus een inzicht te krijgen in de rol van deze enzymen in technologische processen, die pectine afbraak impliceren. Daartoe zou het werkingsmechanisme van deze enzymen op gezuiverde, hoog poly-mere pectinestoffen en op goed gekarakteriseerde methyl oligogalacturonaten be-studeerd kunnen worden. Na opheldering van het werkingsmechanisme kunnen deze enzymen een bijdrage leveren aan het onderzoek van pectinestoffen.
Het eerste gedeelte van hoofdstuk 2 geeft een algemene beschrijving van de struc-tuur van pectinestoffen en van hun voorkomen in groenten en fruit. Tevens wordt de bereiding en de karakterisering van oligogalacturoniden aan de hand van de literatuur behandeld. In het tweede gedeelte van dit hoofdstuk volgt een algemene beschrijving van de pectine splitsende enzymen en een uitvoerige bespreking van de literatuur over pectine depolymerasen. Bij een kritische beschouwing van deze literatuur lijkt het bestaan van polymethylgalacturonasen twijfelachtig en zou het op grond van de beschikbare gegevens mogelijk zijn de depolymerasen in twee groepen in te delen: n.l. pectine lyasen met een pH optimum in zwak zuur milieu en pectine lyasen met een pH optimum in zwak alkalisch milieu.
De methoden die voor de bereiding en karakterisering van de verschillende oligogalacturoniden en hoogpolymere pectinestoffen gebruikt werden, zijn beschreven in hoofdstuk 3. Tevens zijn de technieken ter isolering en karakterisering van enige pectine lyase in dit hoofdstuk vermeld.
Oligogalacturonzuren werden verkregen door hydrolyse van gezuiverd pectinezuur met commerciele pectinase preparaten. Onverzadigde oligogalacturonzuren werden verkregen door pectinezuur af te breken met Bacillus polymyxa endo pectinezuur lyase (PAL). Onverzadigd monogalacturonzuur werd gei'soleerd uit de cultuurvloeistof van een Flavobacterium, die gekweekt was in een gebufferd pectaat medium. De verkregen reaktiemengsels werden gefractioneerd door middel van ionenwisselings-chromatografie. Deze fractionering werd uitgevoerd met Dowex 1 X8 (200-400 mesh) kolommen. De anionenwisselaar werd gebruikt in acetaat- of in formiaat vorm. Er werd zowel trapsgewijze als met een concentratie gradient geelueerd. Hierbij werd gebruik gemaakt van natriumacetaat of natriumformiaat buffers van stijgende concentratie. Methyl oligogalacturonaten werden bereid door de overeenkomstige oligogalacturonzuren in methanol-HCl mengsels volledig of gedeeltelijk te veresteren en de reactieproducten te zuiveren door middel van preparatieve papierchromatografie.
De karakterisering van de oligouronzuren omvatte: titrimetrische bepaling van het
IX

aantal carboxylgroepen, jodometrische bepaling van het aantal reducerende eind-groepen en papier- en/of dunnelaagchromatografie voor identificatie en controle op zuiverheid. De onverzadigde galacturonzuren werden bovendien gekarakteriseerd door hun absorptie bij 232 nm, hun reactie met perjodaat TBA en hun reactie met carbazol volgens de McComb & McCready modificatie en de Rouse & Atkins modi-ficatie.
De methyl oligogalacturonaten werden gekarakteriseerd door papierchromato-grafische analyse. Meer informatie over deze volledig en partieel veresterde oligo-galacturoniden werd verkregen door PMR studies, uitgevoerd op het Unilever Research Laboratorium te Duiven.
Pectine preparaten met verschillende veresteringsgraad werden bereid door alkalische verzeping bij 0°C en door enzymatische verzeping van 95 % veresterd pectine. Volgens de eerste bereidingswijze werden pectines verkregen met een willekeurige verdeling van veresterde en onveresterde carboxylgroepen. Door enzymatische verzeping ont-staan pectines met een bloksgewijze verdeling van veresterde en onveresterde carboxylgroepen.
Voor de isolatie van pectine lyasen werd gebruik gemaakt van gefractioneerde adsorptie aan calcium fosfaatgel, Sephadex-gelfiltratie en DEAE-Sephadex chromato-grafie. De aanwezigheid van polymethylgalacturonase (PMG) werd getoetst door bestudering van het verband tussen de toename van de reciproke specifieke viscositeit en de toename in absorptie bij 232 nm. De activiteiten van de lyasen werden hoofd-zakelijk spectrofotometrisch gemeten.
Het eerste gedeelte van hoofdstuk 4 bevat de resultaten van de bereiding en de karakterisering van de oligogalacturoniden. Deze resultaten zijn besproken in het eerste gedeelte van hoofdstuk 5.
Van verzadigd digalacturonzuur tot en met verzadigd hexagalacturonzuur en van onverzadigd digalacturonzuur tot en met onverzadigd tetragalacturonzuur werden zeer zuivere preparaten verkregen in hoeveelheden van enige grammen. Er werd een kleine hoeveelheid onverzadigd monogalacturonzuur bereid die papierchromato-grafisch zuiver bleek. De reeksen van de oligomeren bleken homogeen. Dit kon af-geleid worden uit het rechtlijnig verband tussen de migratie constante RM, afgeleid van papierchromatogrammen, en de polymerisatiegraad (DP) van de oligomeren. De molaire extinctiecoefficienten (e) voor de absorptie bij 232 nm van onverzadigd di-, tri- en tetragalacturonzuur waren van dezelfde orde van grootte, de waarden voor onverzadigd di- en trigalacturonzuur waren in overeenstemming met de waarden, vermeld in de literatuur. De kwantitatieve bepaling van de onverzadigde oligomeren met behulp van beide carbazoltesten werd nauwkeurig bevonden. Onverzadigd monogalacturonzuur reageerde alleen met carbazol wanneer de reactie volgens de modificatie van Rouse & Atkins uitgevoerd werd. De molaire extinctiecoefficient (e) van het onverzadigd monomeer in de perjodaat TBA test werd bepaald. Deze waarde was tienmaal groter dan de e welke voor het onverzadigd dimeer gevonden werd. Voor het onverzadigd trimeer en tetrameer werden waarden gevonden, die respectievelijk 1,7 en 2,7 groter waren dan de E voor het onverzadigd dimeer. De perjodaat TBA
test is daarom ongeschikt voor de kwantitatieve bepaling van onverzadigde oligo-galacturonzuren. Onverzadigd monogalacturonzuur vertoonde een a-ketozuur karak-ter, de stof had reducerende eigenschappen, maar absorbeerde geen ultraviolet licht.
Naast hun betekenis als grondstof voor de bereiding van de oligomethylesters waren de oligogalacturonzuren ook waardevol als referentiestoffen in papier- en dunnelaagchromatografie, PMR analyses van de methylesters en als teststoffen voor gebruikte methoden.
Methylesters van di- tot en met hexagalacturonzuur werden verkregen. De homo-geniteit van deze reeks oligogalacturonaten kon wederom afgeleid worden uit het rechtlijnig verband tussen de migratieconstante RM en de DP van de oligomeren. Er werd tevens een mengsel van onverzadigde methyl oligoggalacturonaten bereid. Monomethyldi-, monomethyltri- en dimethyltrigalacturonaat werden papierchromato-grafisch gekarakteriseerd als partiele esters met reducerende eigenschappen. PMR analyses toonden aan, dat in monomethyldigalacturonaat de carboxylgroep aan de reducerende galacturonzuureenheid veresterd was. In de partiele esters van tri-galacturonzuur bleek ook een voorkeur voor verestering van de carboxylgroep aan de reducerende galacturonzuureenheid te bestaan. Tevens kon aangetoond worden, dat tijdens de methylering geen methylglycosiden gevormd werden.
De resultaten van de isolering en de karakterisering van enige pectine lyasen werden gegeven in paragraaf 4.2 en besproken in paragraaf 5.2.
Uit elk der drie commerciele 'pectinase' preparaten Ultrazym 20, Pectolase FL32 en Pektosin C werd een pectine lyase ge'isoleerd. Deze isolatie werd zover doorgevoerd totdat geen andere pectolytische activiteiten meer aangetoond konden worden. Het IEP van de drie geisoleerde enzymen, U20 PL, FL32 PL en Pektosin PL lag in het pH gebied 3,5-3,8.
De activiteit van de pectine lyasen op 95 % veresterd pectine werd onderzocht als functie van de pH in zes verschillende buffer systemen. De grootste activiteiten werden gemeten in citraat-fosfaat buffers. Voor alle buffer systemen werd een optimaal pH traject gevonden tussen 6,1 en 6,5. Buffers van het citraat-fosfaat type met een molari-teit tussen 0,07 en 0,14 M, betrokken op de citraat concentratie, bleken optimaal. Op pectines met lagere veresteringsgraden werden lagere pH optima gevonden. Deze konden verklaard worden door de lage substraatconcentraties onder de gevolgde reactieomstandigheden.
Onderzoek naar de pH stabiliteit van de enzymen toonde aan, dat deze goed stabiel waren tussen pH 4 en pH 6. Boven en in mindere mate beneden deze grenzen werd inactivering waargenomen. Incubatie bij pH 7,8 en 38 °C gedurende 30 min resulteerde voor alle drie lyasen in 90 % activiteitverlies.
De activeringsenergie van U20 PL en FL32 PL werd bepaald door de enzymactivi-teiten bij oneindige substraat concentraties (Fmax) te bepalen als functie van de tempe-ratuur. Voor beide preparaten werd een waarde van 1,5 kcal/mol gevonden. Deze waarde is niet in overeenstemming met de gegevens uit de literatuur. De daar ver-melde waarden werden bepaald door de enzymactiviteiten te meten als functie van de temperatuur bij substraatconcentraties, die niet groot genoeg waren om de enzymen
XI

bij alle temperaturen in dezelfde mate te verzadigen met substraat. Er werden aan-wijzingen gevonden, dat de veresteringsgraad van het substraat geen invloed heeft op de activeringsenergie.
Er werd een uitvoerige studie gemaakt van de invloed van de veresteringsgraad van het pectine en van de verdeling van veresterde en onveresterde carboxylgroepen over het pectinemolecuul op de activiteit van de pectine lyasen. De enzymactiviteiten werden gemeten bij verschillende substraatconcentraties en bij 4 verschillende pH's, varierend tussen 6,5 en 4,3. De resultaten werden verwerkt in 'Lineweaver-Burk plots'. Voor ieder enzym-pH combinatie werd voor alle substraten dezelfde Vmax gevonden. Dit was niet het geval wanneer de pH lager was dan 4,8. De grootste F ^ waarde voor alle enzymen en alle substraten werden gevonden bij pH 6,5. De lyasen hadden de grootste affiniteit voor het hoogst veresterde pectine. De affiniteit werd kleiner naarmate de veresteringsgraad van het substraat afnam. De lyasen hadden een grotere affiniteit voor pectines met een bloksgewijze verdeling van veresterde en vrije carboxylgroepen dan voor de overeenkomstige preparaten met een willekeurige verdeling van deze groepen. Met het dalen van de pH nam de affiniteit voor de gedeeltelijk verzeepte preparaten toe. Bij de laagste pH waarden hadden alle drie lyasen een maximale affiniteit voor de preparaten met veresteringsgraden van 86 en 79 % (alkalisch ver-zeept) en waren bovendien het meest actief op deze substraten. FL32 PL had onder alle onderzochte reactie omstandigheden een aanmerkelijk hogere affiniteit voor de substraten dan beide andere lyasen.
De invloed van Ca2+ op de activiteit van de lyasen werd bestudeerd als functie van de pH en als functie van de veresteringsgraad van het substraat. Deze substraten hadden een willekeurige verdeling van veresterde en onveresterde carboxylgroepen. De drie lyasen preparaten gaven alien eenzelfde beeld te zien. Ca2 + activeerde vooral de lyase werking op gedeeltelijk verzeepte pectines. Een zeer sterke activering van de lyase werking op alle preparaten werd waargenomen bij pH's boven 6,5. Zonder Ca2 +
hadden de lyasen onder deze omstandigheden slechts een geringe activiteit op de gedeeltelijk verzeepte preparaten. Beneden pH 6,5 bleek Ca2+ de lyase activiteit op 95% veresterd pectine te remmen. Door toevoeging van Ca2+ werden de pH optima van de enzymen voor de diverse substraten verschoven naar een lagere pH. De optimale Ca2+ concentratie was 0.1 M. Nagenoeg identieke effecten werden waargenomen voor Mg2+en Sr2+.
Door het analyseren van de gevormde afbraakproducten en het bestuderen van het verband tussen de viscositeitsveranderingen en het aantal verbroken glycosidische bindingen, berekend uit de toename in absorptie bij 232 nm, werd informatie over het afbraakmechanisme van de pectine lyasen op pectine verkregen. Tijdens de enzymati-sche pectine afbraak kon de vorming van onverzadigde methyl oligogalacturonaten aangetoond worden. Met het vorderen van de afbraak nam de DP van de reactie-producten geleidelijk af. Dit wijst op een endo mechanisme. Als eindproducten werden vooral onverzadigd trimethyltri, tetramethyltetra- en pentamethylpentagalacturonaat gevonden. Een reductie van de viscositeit van pectineoplossingen van 50% als gevolg van pectine lyase activiteit bleek overeen te komen met 1,96% afbraak van de aan-
XH

wezige glycosidische bindingen. Voor de chemische trans-eliminatieve afbraak van pectine, waarvan aangenomen wordt dat deze stochastisch is, bedroeg dit percentage 2,3 %. Hieruit zou men kunnen concluderen, dat de pectine lyasen pectine niet volgens toeval afbreken maar dat er een voorkeur bestaat voor de glycosidische bindingen, die zich meer in het midden van de keten bevinden. Deze verklaring wordt ondersteund door de studie van het werkingsmechanisme op methyl oligogalacturonaten.
Tevens gaf de afbraaklimiet van pectines met verschillende veresteringsgraad en verschillende verdeling van de veresterde en onveresterde groepen door PL informatie over het werkingsmechanisme van de enzymen. Deze proeven werden uitgevoerd met FL32 PL. De afbraaklimiet werd berekend uit de toename van de absorptie bij 232 nm. Op 95% veresterd pectine bij pH 6 werd een maximale afbraaklimiet van ±25% gevonden. Met de daling van de veresteringsgraad nam ook de afbraaklimiet af. Deze afname was groter voor de preparaten met een willekeurige verdeling van veresterde en onveresterde carboxylgroepen dan voor de preparaten met een bloksgewijze verdeling. Bij lagere pH's echter nam de afbraaklimiet van de preparaten met willekeurige verdeling van veresterde en onveresterde groepen weer toe. Door verder nog Ca2+ toe te voegen werden nog hogere afbraaklimieten voor deze preparaten gevonden. De afbraaklimiet van 95% veresterd pectine werd niet bereikt. Deze ver-anderde niet door pH verlaging en Ca2+ toevoeging. De verkregen afbraakmengsels werden geanalyseerd door middel van papier- en dunnelaagchromatografie. Vorming van onverzadigde, partieel veresterde, methyl oligogalacturonaten kon worden aan-getoond. Bij stijgende afbraakgraden werden oligomeren met lagere polymerisatie-graad gevonden.
Er werd getracht de hierboven beschreven effecten te verklaren door aan te nemen dat een pectinemolecuul reactieve gedeelten bevat. De hoedanigheid van deze ge-deelten is van dien aard, dat een complex gevormd kan worden met de lyasen, waarna een glycosidische binding in het complex gebonden gedeelte van het pectinemolecuul gesplitst wordt. Daar de activiteit van de pectine lyasen groter was naarmate er van hogere veresteringsgraad sprake was, kan men aannemen, dat in genoemde reactive gedeelten voornamelijk veresterde galacturonzuureenheden zullen voorkomen. Met het dalen van de veresteringsgraad zal het aantal reactive gedeelten op het substraat molecuul afnemen, waardoor hogere substraatconcentraties noodzakelijk zijn om dezelfde activiteit te kunnen meten.
Op deze manier kan men verklaren, dat voor alle pectine preparaten onder gelijke omstandigheden steeds dezelfde Vmax gevonden werd. De laagste pH waarden vorm-den hierop een uitzondering: de lyasen vertoonden de hoogste activiteit op 86 en 79 % veresterd pectine. Onder deze omstandigheden raken niet veresterde galacturonzuureenheden waarschijnlijk meer betrokken in de reactive gedeelten. Calcium ionen die-nen waarschijnlijk als vervanger voor methoxylgroepen.
De werking van pectine lyasen op oligomethyloligogalacturonaten werd bestudeerd door spectrofotometrische activiteitsmetingen en door papier- en dunnelaagchromato-grafische analyse van de gevormde reactieproducten. Alle drie lyasen vertoonden hetzelfde beeld. Op hexamethylhexa-, pentamethylpenta- en tetramethyltetragalactu-
XIII
ronaat, werd activiteit gevonden, echter op trimethyltri-, dimethyltri-, monomethyltri-, dimethyldi- en monomethylmonogalacturonaat niet. De Km en Vmax waarde van U20 PL en FL32 PL werden bepaald voor het hexameer. Voor het pentameer en tetrameer konden geen Km en Vmax vastgesteld worden vanwege te lage activiteiten. Vergelijking van de relatieve reactiesnelheden toonde aan dat de activiteit van de lyasen sterk afneemt met de polymerisatiegraad. Voor U20 PL en FL32 PL werden een 1 /Km waarden bepaald voor het hexameer, die respectievelijk 2 maal en 4 maal zo klein waren als de waarden die voor 95% veresterd pectine gevonden werden. Uit de analyse van de reactieproducten bleek, dat voornamelijk binding 3 en in mindere mate binding 4 in het hexameer gesplitst werd. Hierbij zijn de glycosidische bindingen genummerd vanaf het reducerend keteneinde. In het pentameer en het tetrameer werd binding 3 gesplitst, echter zeer langzaam. Dit betekent, dat de lyasen de twee glycosidische bindingen, grenzend aan het reducerend einde van een volledig gemethyleerd poly-galacturonaat, niet kunnen splitsen en dat hun vermogen tot splitsing van de binding, welke grenst aan het niet reducerend einde, beperkt is. Ook werden aanwijzingen gevonden, dat de dubbele binding in de niet reducerende methylgalacturonaateenheid de aangrenzende glycosidische binding beschermt voor splitsing door pectine lyasen.
De pectine lyase activiteit werd geremd in aanwezigheid van onverzadigde methyl oligogalacturonaten (productremming). Verzadigde en onverzadigde oligogalacturon-zuren en verzadigde methyl oligogalacturonaten bleken de lyase activiteit niet te be-invloeden.
De in de literatuur beschreven testen voor het aantonen van pectine lyase activiteit bleken niet erg gevoelig. Door de gevolgde reactie omstandigheden te wijzigen, werd een grotere gevoeligheid verkregen. Met de verbeterde test kon in vrijwel alle commer-ciele 'pectinase' preparaten pectine lyase activiteit aangetoond worden. Pectolase FL32 werd onderzocht op aanwezigheid van PMG. Dit enzyme bleek niet voor te komen. Men mag aannemen, dat pectine lyase activiteit als gevolg van ontoereikende testen vaak niet onderkend werd. Het pectine splitsend vermogen werd dan abusieve-lijk toegeschreven aan enzymen van het PMG type. Het bestaan van deze laatste enzymen is echter twijfelachtig.
De betekenis van pectine lyasen in technologische processen werd besproken. Ge-zien de niet geringe activiteit op hoger veresterde pectines bij lage pH mag hun rol niet onderschat worden.
XIV
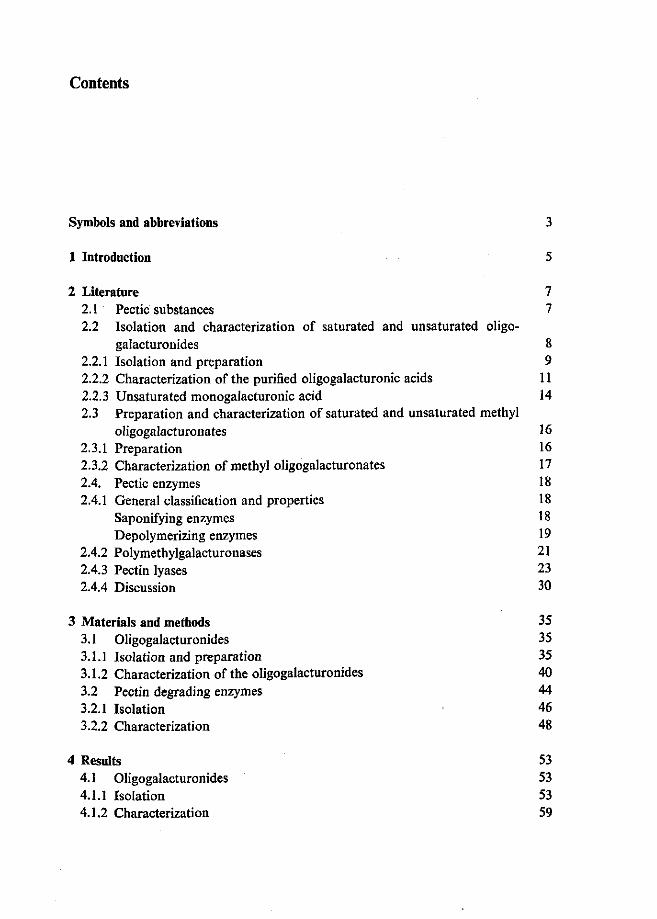
Contents
Symbols and abbreviations 3
1 Introduction 5
2 Literature 7 2.1 Pectic substances 7 2.2 Isolation and characterization of saturated and unsaturated oligo-
galacturonides 8 2.2.1 Isolation and preparation 9 2.2.2 Characterization of the purified oligogalacturonic acids 11 2.2.3 Unsaturated monogalacturonic acid 14 2.3 Preparation and characterization of saturated and unsaturated methyl
oligogalacturonates 16 2.3.1 Preparation 16 2.3.2 Characterization of methyl oligogalacturonates 17 2.4. Pectic enzymes 18 2.4.1 General classification and properties 18
Saponifying enzymes 18 Depolymerizing enzymes 19
2.4.2 Polymethylgalacturonases 21 2.4.3 Pectin lyases 23 2.4.4 Discussion 30
3 Materials and methods 35 3.1 Oligogalacturonides 35 3.1.1 Isolation and preparation 35 3.1.2 Characterization of the oligogalacturonides 40 3.2 Pectin degrading enzymes 44 3.2.1 Isolation 46 3.2.2 Characterization 48
4 Results 53 4.1 Oligogalacturonides 53 4.1.1 Isolation 53 4.1.2 Characterization 59
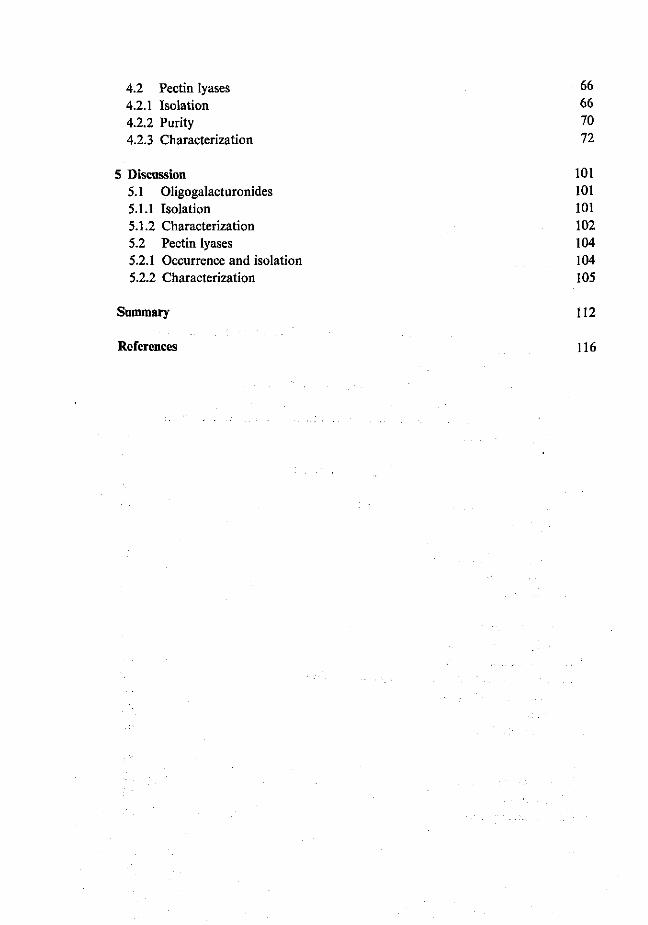
4.2 Pectin lyases 66 4.2.1 Isolation 66 4.2.2 Purity 70 4.2.3 Characterization 72
5 Discussion 101 5.1 Oligogalacturonides 101 5.1.1 Isolation 101 5.1.2 Characterization 102 5.2 Pectin lyases 104 5.2.1 Occurrence and isolation 104 5.2.2 Characterization 105
Summary 112
References 116
Symbols and abbreviations
A pectins (preparations) E pectins (preparations) DE DEAE DNS DP EA
EDTA FL32 IEP Km
L-B M
mM
mol N
nm PAL PE PG PL PMG R R,
gal
Megal
RM
T t
TBA tris
absorbance, cm - 1
pectins presaponified with alkali pectins presaponified with PE degree of esterification, % diethylamino-ethyl dinitrosalicylic acid number average degree of polymerization activation energy, kcal.mol-1
ethylenediaminetetra-acetate Pektolase FL32 isoelectric point Michaelis constant, M or mM Lineweaver-Burk molar concentration millimolar grammolecule normal nanometer pectate lyase pectin esterase polygalacturonase pectin lyase polymethylgalacturonase gasconstant 1.98 cal.degree-1
migration distance relative to front migration distance relative to galacturonic acid migration distance relative to monomethylmono-galacturonate migration constant, log(l/i?/ - 1). In my calculations monomer was used as reference compound {Rgal, RMegai) substrate concentration, M or mM monomer absolute temperature, K time, h, min or sec thiobarbituric acid tri(hydroxymethyi)methylamine
U20 = Ultrazym20 Vmax = maximum reaction velocity at infinite substrate con
centration, increase in absorbance per min v = reaction velocity at finite substrate concentration, in
crease in absorbance per min [a]*0 = specific rotation at 20 °C e = molar extinction coefficient, M - 1 c m - 1
rjs = specific viscosity ueq = micro-equivalent ug = microgram

1 Introduction
Pectic substances occur in all fruits and vegetables. Important changes in the properties of fruit and vegetable products during storing and processing are related to pectic changes. Native or added pectic enzymes may play an important role in these changes (Pilnik & Voragen, 1970).
Commercial pectolytic enzyme preparations are widely used in fruit juice technology. These preparations are mixtures of different pectic enzymes and often include cellu-lases, hemi-cellulases, proteinases and amylases (Rombouts & Pilnik, 1971). Usually these enzyme preparations are produced by fungi.
During the last decade enzyme preparations have been specially made and used for different processes such as clarification, maceration or juice extraction. However there is little known about which specific activities are important in the different processes. To gain more information about the different types of enzyme they have to be purified and characterized. It is also necessary to know more about their pattern of action. With well characterized enzymes special processes can be studied and it may be possible to obtain more information about pectic substances. The enzymes working on low esterified pectins have been extensively studied. Many of these enzymes are also characterized by their action on oligomers (Voragen & Pilnik, 1970a).
Less is known about the enzymes that degrade highly esterified pectin. Two such types of enzyme are described in literature: polymethylgalacturonases (hydrolases) and pectin lyases, which split the glycosidic bond by a /^-elimination reaction. Pectin lyase was discovered in 1960 in a commercial enzyme preparation by Albersheim et al. (1960b). Since 1960 there have only been a few publications about polymethylgalacturonases. Probably some of these enzymes described before 1960 were not hydrolases but lyases. Only one pectin lyase was characterized by its action on methyl oligogalacturonates (Edstrom & Phaff, 1964b).
Little is known about the influence of the degree of esterification on the activity of enzymes which degrade highly esterified pectins. For these enzymes according to the condition of the adjacent carboxyl groups (esterified or not) there could be three different types of glycosidic linkages which may have a substrate specific significance. Also the condition of the adjacent parts of the pectin molecule may influence the activities of the enzymes. From a study of the degradation products of pectic acid hydrolysed by a purified polygalacturonase Koller & Neukom (1969) derived evidence that two carboxyl groups of pectic acid become attached to the binding sites of the enzyme molecule. These two groups are separated from the active centre by three and six galacturonic acid units, respectively.
The purpose of this study was: 1. To prepare series of pure saturated and unsaturated methyl oligogalacturonates and to prepare and characterize partially esterified methyl oligogalacturonates. Thus the isolation of the corresponding oligogalacturonic acids was necessary. 2. To isolate polymethylgalacturonase and pectin lyase from commercial enzyme preparations. 3. To characterize these enzymes and to examine their pattern of action on high polymer substrates with varying degrees of esterification and different distribution of esterified and unesterified galacturonide units. 4. To characterize these enzymes and to examine their pattern of action on methyl oligogalacturonates.

2 Literature
2.1 Pectic substances
Pectic substances are part of practically all higher plant tissues. They are mainly deposited in the middle lamella and in the primary cell wall during the early stages of growth when the area of the wall is increasing. Meristematic and parenchemous tissue, which form the edible part of plants, are therefore particularly rich in pectic substances. These occur predominantly in a water insoluble form which is called protopectin. The main exceptions are ripe fruits where the cell walls may be partly dissolved and from which after grinding and pressing or extraction with water, an important part of the pectic substances can be found in the juice or extract. The texture of fruits and vegetables on growing, ripening and storage is strongly influenced by the amount and nature of the pectin present. Important changes - both desirable and undesirable - in the properties of fruit and vegetable products during storing and processing are related to pectic changes. Native or added pectic enzymes may play a dominant role in these changes.
Pectic substances are polygalacturonides with non-uronide carbohydrates co-valently bound to an unbranched chain of 1-4 linked a-galacturonic acid units. The carboxyl groups of the galacturonic acid are partly esterified with methanol and the free groups are more or less neutralized. Some of the hydroxyl groups on C2 and C3
may be acetylated. The monomer is thought to have the C 1 conformation. The glycosidic bonds are therefore of the axial-axial type which causes the polymer chain to have a screw axis with a tendency to coiling (Pilnik & Voragen, 1970).
The literature on structure, chemical and physical properties, analysis and biosynthesis of pectic substances has been summarized by Pilnik & Voragen (1970) and Voragen & Pilnik (1970b). From this survey the pectin molecule emerges as a chain structure of axial-axial a-(l-4) linked D-galacturonic acid units, containing blocks of L-rhamnose rich regions, with mainly arabinose, galactose and xylose as side chains. The carboxyl groups are partially methylated and the secondary hydroxyls may be acetylated.
Gee et al. (1959) showed the presence of highly esterified pectic substances in situ with degrees of esterification ranging from 70 to 100 % in peaches, apples and pears. These values were estimated with a histochemical test based on the reaction of ester groups in pectic substances with aqueous alkaline hydroxylamine. Pectic substances extracted from fruits were found to have 60 to 90% of their carboxyl groups esterified with methanol (Doesburg, 1965; Mehlitz & Minas, 1965). Endo (1965) reported a value of 90 % for pectins in freshly pressed apple juice. During ripening of fruits, the solubilization of a part of the pectic substances is one of the most outstanding features.
In general a rather striking decrease of degree of esterification of fruit pectin has been reported, except for ripening apples where a negligible decrease was shown (Doesburg, 1965). No general figure can be given for the molecular weight of pectic substances. Values given in the literature vary between 30 000 and 300 000. With a new method, based on the relationship between increase in reciprocal t]s and increase in absorbance at 232 nm during transeliminative breakdown of pectic substances, Rombouts (1972) determined values ranging between 30 000 and 120 000.
The glycosidic links to hemicellulose chains indicate how pectin can be chemically bound to other cell wall constituents. Soluble pectins of high molecular weight and with araban, galactan and xylan admixed or covalently bound to them therefore present a model of protopectin which appears as a giant molecule, mechanically and chemically enmeshed with other cell wall substances.
The American Chemical Society has given the following definitions (Kertesz, 1951): Pectic substances. Pectic substances is a group designation for those complex, colloidal carbohydrate derivatives which occur in, or are prepared from, plants and contain a large proportion of anhydrogalacturonic acid units which are thought to exist in a chain-like combination. The carboxyl groups of polygalacturonic acids may be partly esterified by methyl groups and partly or completely neutralized by one or more bases. Protopectin. The term protopectin is applied to the water insoluble parent pectic substance which occurs in plants and which, upon restricted hydrolysis, yields pectinic acids. Pectinic acids. The term pectinic acids is used for colloidal polygalacturonic acids containing more than a negligible proportion of methyl ester groups. Pectinic acids, under suitable conditions are capable of forming gels (jellies) with sugar and acid or, if suitable low in methoxyl content, with certain metallic ions. The salts of pectinic acids are either normal or acid pectinates. Pectin. The general term pectin (or pectins) designates those water soluble pectinic acids of varying methyl ester content and degree of neutralization which are capable of forming gels with sugar and acid under suitable conditions. Pectic acid. The term pectic acid is applied to pectic substances mostly composed of colloidal polygalacturonic acids and essentially free from methyl ester groups. The salts of pectic acid are either normal or acid pectates.
2.2 Isolation and characterization of saturated and unsaturated oligogalacturonides
Oligogalacturonides are very suitable substrates for definitive studies on the action of the different pectic enzymes. Especially for the study of enzymes that degrade pectic acid, oligogalacturonic acids are widely used. The literature on this work was reviewed by Wilson (1969) and by Voragen & Pilnik (1970a). In a study on the properties of a pectin lyase, Edstrom & Phaff (1964b) prepared and used fully esterified methyl esters of mono to hexa galacturonic acid and of unsaturated digalacturonic acid. In my studies on pectic enzymes I also needed these compounds:
8
(1) as substrate for pectin and pectic acid degrading enzymes, (2) as reference compounds in chromatographic studies of the degradation products of pectic substances, (3) as test compounds for different assay methods and (4) for standardization of methods.
My aim was to prepare and characterize homologous series of saturated oligo-galacturonic acids, unsaturated oligogalacturonic acids, fully esterified saturated oligogalacturonates, partly esterified saturated oligogalacturonates and fully esterified unsaturated oligogalacturonates.
2.2.1 Isolation and preparation
The literature on isolation and preparation of oligogalacturonic acids up to 1958 has already been reviewed by Derungs (1958).
The first attempts to isolate oligogalacturonic acids involved precipitation techniques. Phaff & Luh (1952) prepared pure mono, di and tri galacturonic acid from a digest of polygalacturonic acid by fractionated precipitation of the strontium salts in mixtures of water and ethanol, followed by a further purification based on the differences in solubility of their lead salts in water. The digest was obtained by the degradation of polygalacturonic acid with yeast polygalacturonase (PG). From the same mixture Demain & Phaff (1954) isolated the tetramer by repeated precipitation of its copper salt at pH 4.5.
Ayres et al. (1952) precipitated digalacturonic and trigalacturonic acid as calcium salts in 60 % ethanol. Calcium monogalacturonate is soluble at this concentration and was removed by filtration. The mixture of dimer and trimer was separated on account of the difference in solubility of their lead salts. In a rather similar way Altermatt & Deuel (1952, 1953, 1954) and Altermatt (1954) obtained di, tri and tetra galacturonic acid. From a digest of polygalacturonic acid prepared with a fungal pectinase, they removed monogalacturonic acid by crystallization of its sodium strontium salt. The remaining oligomers which stayed in solution, were precipitated by addition of ethanol up to a concentration of 85 %. The precipitate was added to a 40 % ethanol solution in which the sodium strontium salt of the dimer solubilized. The trimer and tetramer were separated as lead salts.
Ozawa (1952) separated digalacturonic and trigalacturonic acid by fractionated crystallization of their brucine salts. Nagel & Vaughn (1961a) obtained unsaturated digalacturonic acid from a digest of pectic acid acted upon by a Bacillus endo pectate lyase by fractionated precipitation of the strontium salts in ethanol water mixtures, free of contaminating saturated mono and dimer. A somewhat similar method was used by Moran et al. (1968a).
Partition and adsorption chromatography have also been used. Ozawa & Okamoto (1955) obtained a partial separation of digalacturonic and trigalacturonic acid on cellulose columns with a mixture of butanol, acetic acid and water as eluant. The fractions were further purified by fractionated precipitation of the barium salts.
McCready & McComb (1953) fractionated a mixture of mono, di and tri galacturonic acid by preparative paper chromatography, from the degradation products of poly-galacturonic acid acted upon by yeast PG. Unsaturated trimers to pentamers were isolated in the same way from the reaction mixture of Xanthomonas campestris acting upon polygalacturonic acid. Roller & Neukom (1967) isolated hexamer on a poly-amid column by eluting with mixtures of methanol and water. The hexamer was produced by the degradation of pectic acid with a fungal endo PG. The composition of the reaction mixture was studied by thin layer chromatography. The reaction was stopped when the hexamer was the main product.
Whistler & Durso (1950) were able to separate neutral oligosaccharides on charcoal-celite columns. Attempts by Ashby et al. (1955) and Altermatt (1954) to separate oligogalacturonic acids in this way, were not successful. However, Ashby et al. (1955) were able to separate the uronic acids as glycol esters by elution with mixtures of ethanol and water. The capacity of the column however was very low and removal of ethylene glycol after saponification of the esters was difficult.
At present the most satisfactory and practical technique is ion exchange chromatography. Separation of oligogalacturonic acids on ion exchangers was first described by Derungs & Deuel (1954). A more detailed report of these studies was given by Derungs (1958). In their experiments the strong anion exchangers Dowex 1 and Dowex 2 were not suitable, because of the strong fixation of the uronic acids. Good results were obtained with Deacidite FF (a strong anion exchanger); Dowex 3 (a weak anion exchanger) also gave satisfactory results. As eluant they preferred formic acid solutions, because this acid could be removed from the uronic acid containing fractions by distillation. The Deacidite FF formic acid system was also used by Ashby et al. (1955) and Reid (1962). However this method requires excessive amounts of eluants for a good separation and then the eluant (formic acid) is very difficult to remove completely.
To avoid the extreme pH and high concentrations of acids required to elute the uronic acids from Dowex 1, Nagel & Anderson (1965) and Hasegawa & Nagel (1966) used sodium acetate buffers at pH 6. They obtained good separation of saturated and unsaturated oligomers. Nagel & Wilson (1969) found that sodium formate at pH 4.7 was an even better eluant. For the production of the saturated oligomers these authors used yeast PG. The composition of the digest of pectic acid could be regulated by varying the reaction time and pH of the reaction mixture. For the production of unsaturated oligogalacturonide digests the endo pectate lyase of a Bacillus sp. was used (Hasegawa & Nagel, 1966).
Hatanaka & Ozawa (1966) separated oligogalacturonic acid homologues by column chromatography on DEAE cellulose applying a gradient elution with sodium bicarbonate. The capacity of this anion exchanger was however small. The factors which affect the affinity for the ion exchange resin and thus the selectivity of normal and unsaturated oligogalacturonic acids were discussed by Wilson (1969).
For assaying the oligogalacturonic acids in the fractions obtained by column chromatography, most authors used the carbazole method (Derungs & Deuel, 1954;
10

Derungs, 1958; Reid, 1962; Nagel & Anderson, 1965; Hasegawa & Nagel, 1966; Hatanaka & Ozawa, 1966). Nagel & Wilson (1969) and Wilson (1969) used a modified carbazole method for the semi-quantitative determination of normal uronides. Ashby et al. (1955) checked each fraction by paper chromatography. The concentrations of unsaturated uronides were determined by measuring the absorbance of 1/100 dilution of each fraction at 232 nm. Appropriate fractions were combined and identified by paper chromatography (practically all publications) or thin layer chromatography (Koller & Neukom, 1967). To isolate the uronides from the pooled fractions representing individual peaks, Ashby et al. (1955), Derungs & Deuel (1954) and Derungs (1958) first removed formic acid, which was used as eluant, by extraction with ether. Next the aqueous phase was concentrated under reduced pressure to a thin syrup. Ashby et al. (1955) evaporated this syrup several times with «-propanol and the monohydrates of the oligogalacturonic acids, which crystallized, were collected by filtration and vacuum-dried. Reid (1962) first concentrated the bulked fractions under reduced pressure and then extracted with ether. The aqueous phase was further concentrated under reduced pressure after addition of n-propanol. The oligogalacturonic acids separated as micro-crystalline monohydrates. Derungs (1958) evaporated the residue several times with water to remove the remaining formic acid. The uronic acids were further purified as lead salts, converted to the acid forms with Dowex 50 (H+), concentrated under reduced pressure and precipitated in a mixture of ethanol and ethyl acetate. This precipitate was collected by filtration, washed with absolute ether and vacuum-dried.
2.2.2 Characterization of the purified oligogalacturonic acids
For the analysis of the purified oligomers most authors determined reducing end groups with the hypoiodite method of Willstatter & Schudel (1918) or a modification of it. Carboxyl groups were determined by titration. The ratio of carboxyls to reducing groups gives the degree of polymerization (DP) of the oligomer. By titrating the carboxyl group in the longer uronides (DP > 6) Nagel & Wilson (1969) and Wilson (1969) found much smaller values than expected from other data. More consistent results were obtained by determining the galacturonide content with the carbazole method. The ratio galacturonide units to reducing groups also represents the DP. Luh &Phaff(1952) and Demain & PhafT (1954) estimated the DP from the ratio of reducing groups after and before complete hydrolysis by fungus polygalacturonase. Further indications of a homogeneous series of uronides were obtained from paper chromatography. De-main & PhafT (1954) showed that the logarithm of the Rgal values (ratio of the distance travelled by a particular oligomer to the distance of migration of the monomer) bore a linear relationship to the degree of polymerization. Nagel & Wilson (1969) and Wilson (1969) indicated the homogeneity of the homologous series of saturated uronides by the linear relationship between the RM value (RM = log(l/i?/ — 1)) and the DP. In the other publications only Rgal values are given. In a number of studies the uronic acids were characterized by determination of the specific rotation, the
11
melting point and by carbon and hydrogen analysis. From the end-group assay many authors calculated the equivalent weight. By plotting the theoretical DP against the experimental equivalent weight, Nagel & Wilson (1969) and Wilson (1969) obtained a straight line that illustrates a linear relationship. This result also indicates a homologous series of compounds of increasing chain length. From the difference between the equivalent weight and calculated anhydrous molecular weight they estimated the water content. In Table 1 all these data found by different investigators are summarized.
Unsaturated oligogalacturonic acids were especially studied by Nagel and coworkers. These uronides were characterized by the ratios of carboxyl to aldehyde groups, equivalent weights based on end-group and carboxyl group determinations, Rga, values and the molar absorptivities (e) at 232 nm. Nagel & Wilson (1969) and Wilson (1969) obtained indications of a homogeneous series of unsaturated uronides from the linear relationship between the equivalent weight and the DP
Special attention was paid to the characterization of the unsaturated dimer by Hasegawa & Nagel (1962). They studied the absorption spectra in the ultraviolet region and the absorption spectra of the chromogen formed by reaction with thio-barbitunc acid. Hydrolysis of the dimer with acid gave two spots on a paper chro-matogram one spot showed the same Rf as monogalacturonic acid, the other compound showed a Rgal of 1.68. It gave a positive reaction for acid groups, reducing groups and unsaturated bonds. This compound was presumed to be an unsaturated galacturomc acid. The dimer itself also gave a positive reaction for unsaturated bonds.
o he ITT < ? r f̂ fUrth6r P r ° V e d by b r ° m i n e <™sumPtion. Conization of the unsaturated dimer yielded an amount of oxalic acid that was 33°/ of the
o i f b ndield-Th;: H a s e r a & Nagei (i962) showed ** ̂ ^ * £ r lducL end of th T , °* "* °5 * t h e 8a Iac t-onic acid unit on the non-nd^thenrod ° ^ T * ' ^ ** *** t e t r a-ac*ate consumption of the dimer
iTteZen^Z °H r aC,,d Wh6n ̂ l 6 a d tetra"aCetate 0xidation was followed i t : ; T* ras shown that the M nnkage ° f the dim-w- ****** From these results the authors concluded that the structure of the dimer was 4*«.i>. v f d ^ a d d - N a g e l & Anderson (1965) found 7nton^L2T7 S m i l a r i t y ° f t hC g a l a C t U r ° n i d e u n i t o n t h e "on-reducing h o w b T C"C ° f U n S a t r C d dImer' trimer and tetramer- ™ s similarity was *Z&^* r ^ ^ betWeen the adsorption spectra of the °«i™"
ZlXy sf ro ̂ ^ ° n . p r o d u c t a ° f unsaturated trimer and tetramer acted
unLturated o. I d e g K l d a t l o n y i e , d e d galacturonic acid and the next lower Z ^ ^ d S ^ ' "fUratCd t r i m e r a n d t e t r a m e r — attacked at the non-^mT^ZST°aiC a d d ^ ^ ^ l 0 W e r ° l i g o m e r - f u m i n g a S ^ ^ l ? ^ I t h e Ttm?? COmP°UndS thCSe results indicate *atfhe L t^::iT^rrated bond occupies the same p ° s i t i ° n - *• *-summlrtld2 ^ ' ^ ° n U n S 3 t U r a t e d ° U g 0 m e r S from — 1 investigations are
12

Table 1. Characteristics of saturated oligogalacturonic acids (figures between parenthesis represent anhydrous molecular weight).
Equiv. COOH/ weight CHO
Digalacturonic acid (370) 377 1.98(2.02*)
2.02 1.98
462 1.92
Trigalacturonic acid (546) 600 3.01(2.96*)
3.01 3.05
615 2.94 568(558*) 2.92
Moles H 20 mol Cpd
0.9
5.1
3
3.8 1.1(0.55**)
Tetragalacturonic acid (722) 784 3.98(3.95*)
4.16 4.18
790 4.09 723(746**) 3.83
3.4
3.8 0 (1.3**)
Pentagalacturonic acid (898) 1012(935**) 5.02 965 5.02
6.3(2**) 3.7
Hexagalacturonic acid (1074) 1160 5.90*** 4.8
Heptagalacturonic acid (1250) 1306 6.78*** 3.1
Octagalacturonic acid (1426) 1469 7.80*** 2.4
Paper chrom.
Rgal
Rgal
Rgal
RM-DP
Rgal
Rgal
Rgal
RM-DP
Rgal
lOgRgal'DP Rgal
Rgal
RM-DP
Rgal
Rgal
RM-DP
RM-DP
RM-DP
RM-DP
[«]D
153 167 149 151-153
186 203 187 188-191
208 207 208
Melting point
130-140°C
130°C
130-140°C
143-155°C
150°C
140-145 °C
159-170°C
C-H analysis
37.31
37.28 37.20
38.46
38.41 38.32
37.4
39.97
5.06
5.23 5.26
4.90
5.07 4.97
5.21
4.88
Ref. No.
1 2 3 4 5 6
1 2 3 4 5 6 7
8 2 3 4 6 7
7 6
6
6
6
* Estimated from the ratio of reducing groups after, and before complete hydrolysis by fungus polygalacturonase ** Calculated from galacturonide content estimated with carbazole assay *** Calculated from galacturonide content, estimated with carbazole assay, and CHO groups
1. Luh & Phaff (1952) 5. Reid (1962) 2. McCready & McComb (1953) 6. Nagel & Wilson (1969), Wilson (1969) 3. Altermatt & Deuel (1952), Altermatt (1954) 7. Hasegawa & Nagel (1966) 4. Derungs (1958) 8. Demain & Phaff (1954)
13

Table 2. Characteristics of unsaturated oligogalacturonic acids (figures between parenthesis represent anhydrous molecular weight).
Equiv. COOH/CHO Moles HaO weight mol cpd
Unsaturated di galacturonic acid (352) 367 1.98 0.8
439 1.87 4.8
Unsaturated tri galacturonic acid (528) 563*,619** 2*,4.8** 618* 2.99 4.8 611* 3.00 4.6
Unsaturated tetra galacturonic acid (704) 713*,840** 0.5*,7.5** 752* 3.84 2.7 803* 4.07 5.5
Unsaturated pent a galacturonic acid (880) 951 4.98 3.9
* Based on reducing end-groups determination ** Based on carboxyl determination
Paper chrom.
Rgal
Rgal
Rgal
Rgal
Rgal
Rgal
Rgal
Rgal
s u.v.
4500 4800 5200 5750
5475
5725
5050
Literature ref.
Nagel & Vaughn (1961) Hasegawa & Nagel (1962) Macmillan & Vaughn (1964) Nasuno & Starr (1967) Nagel & Wilson (1969)
Nagel & Anderson (1965) Hasegawa & Nagel (1966) Nagel & Wilson (1969)
Nagel & Anderson (1965) Hasegawa & Nagel (1966) Nagel & Wilson (1969)
Nagel & Wilson (1969)
2.2.3 Unsaturated monogalacturonic acid
mer" w T n ' n t T &^TT ^ ^ ^ c h a r a c t e r i z a t ion of the unsaturated monomer was not discussed. However the production of this component during trans-
t ^ ^ t h m °'rlyBtCtUTOniC aCM WaS Sh°Wn * S e - a l investigation . p r o Z s t s i r T ih°Se °f thC hi8her UnSatUrated o l i g ° m e r s - d cause s ; « d ;:P;r,y
assay methods-For this reason the *«*» - ** »** is ( l i s ) d u Z t e d e f T ^ l T n ° m e r i C P r ° d U C t WaS S h 0 W n b v P r e i - & Ashwell iZ*Z7oU^Z P / I y g a l a c t u r o n i c a c * by a partially purified enzyme
f d X a t i o ^ t h e v l T at
P r d 0 m 0 n a d - T ° ° b t a i n SUff ic ient o f t h i s compound for o umn by e , u S with f a . f ^ - t u r o n a t e digest on a Dowex I formate
tTons were assaved^J T " ? °™ ° f i n C r e a s i nS concentration. The frac-
•J^^SSZES zzs^^t* Todland
Rechroma«vTf t t f P " " C o n t a m i n a t e d w i * D-galacturonic acid. with D T a t t u l f c ac d heoat ' 0 n S ^ " ^ ^ ^ ^ «* l a m i n a t e d galacturonic acid, the other was homogeneous. Upon paper chromatography,
14

using different solvent systems, the purified compound revealed a single spot. The chromogen formed in the periodate TBA reaction yielded a spectrum closely resembling that of jS-formyl pyruvate. Oxidation of the compound with periodate failed to produce significant amounts of formaldehyde or glycolic acid. However, reduction with NaBH4 before periodate oxidation resulted in a stoichiometric recovery of formaldehyde. Further supporting evidence for the presence of an intact aldehyde group was provided by the ultraviolet spectrum of the semi-carbazone derivative which exhibited a maximum at 233 nm. The compound also gave a positive reaction when treated with o-phenylenediamine. The presence of an a-keto acid was therefore inferred. The fact that the compound was readily decarboxylated in the presence of eerie sulphate was shown by the liberating of a stoichiometric yield of C02 . The orientation of the hydroxyl groups on carbon atoms 2 and 3 was demonstrated by the production of 2-deoxy-L-xylose by Ruff degradation of the metasaccharinic acids, which were obtained when the compound was reduced with NaBH4. Determination of periodate uptake indicated values close to the theoretical amount expected from a 4-deoxy-5-keto hexuronic acid. From these data, Preiss & Ashwell (1963a) concluded that this compound was 4-deoxy-L-threo-5-hexoseulose uronic acid. This compound was also described by Linker et al. (1956,1960) and Hofman et al. (1960) as a product of the bacterial catabolism of hyaluronic acid and chondroitin sulphate.
From an analysis with paper chromatography of the reaction products of unsaturated trigalacturonic acid acted upon by endo pectate lyase of Bacillus polymyxa, Nagel & Anderson (1965) found a monomeric product that was similar to the compound described by Preiss & Ashwell (1963). They demonstrated the a-keto acid character of the compound by its positive reaction with o-phenylenediamine. It also developed a faint colour with the w-phenylenediamine spray for aldehyde groups but not with the permanganate benzidine spray for unsaturated bonds. Thiobarbitu-rate reaction yielded a chromogen with an absorbance peak at 548-550 nm. The open chain, keto form, was suggested because the compound did not have an absorbance peak in the ultraviolet region which would be expected of an a, /? unsaturated car-boxylic acid group. From this data the product was tentatively identified as 5-keto-4-deoxy galacturonic acid. During the fractionation of the reaction products of unsaturated trigalacturonic acid acted upon by an a-l,4-(4,5-dehydrogalacturonosyl) galacturonate hydrolase on a Dowex 1 column, Nagel & Hasegawa (1968) observed that the unsaturated monomer appeared in two peaks. If the reaction product was stored for some time before chromatography one peak was not observed.
Moran et al. (1968b) produced the same compound by degradation of unsaturated digalacturonic acid with oligogalacturonide transeliminase ofErwinia carotovora. The product was isolated and purified by means of Dowex 1 column chromatography using formic acid solutions of increasing concentrations as eluant. The component appeared as a homogeneous peak at 0.5 N formic acid. It was shown that unsaturated digalacturonic acid yielded equimolar amounts of D-galacturonic acid and the unsaturated monomer. The product formed jS-formyl pyruvate when it was oxidized by periodate. This formation was indicated by the absorption maximum at 548-549
15

nm of the TBA-chromogen complex. The higher unsaturated oligomers were much less reactive in this assay. The compound did not show carbazole or orcinol reactions typical of uronic acids. The presence of an a-keto acid group was indicated by its reaction with o-phenylenediamine, the formation of the semi-carbazone and decarboxylation with eerie sulphate. Evidence for the presence of a free aldehyde group included the formation of a semi-carbazone with a maximum absorption in the region of 240 nm, and the formation of stoichiometric amounts of formaldehyde after the reduction of the compound with NaBH4 and oxidation withperiodate. The orientation of the hydroxyl group at carbon atom 3 was indicated by the enzymatic reduction of the molecule to 2-keto-3-deoxy-D-gluconic acid. Based on this data Moran et al. (1968b) considered the structure of the compound as 4-deoxy-5-hexoseulose uronic acid.
Production of unsaturated monogalacturonic acid was also indicated but not directly identified by Fuchs (1965), Nasuno & Starr (1967), Moran et al. (1968a), Nagel & Hasegawa (1967).
Preiss & Ash well (1963) and Moran et al. (1968b) showed that this acid is an important intermediate in the metabolism of polygalacturonic acid. When this compound is produced during the enzymatic degradation of pectic acid a quantitative evaluation of ultraviolet absorbance or the periodate thiobarbiturate assay is not correct for determining enzyme activity or extent of degradation, even more so when these enzymes are characterized on oligomers, especially unsaturated oligomers, or in the final stage of pectic acid degradation by these enzymes. Special care has to be taken with paper or column chromatography of digests containing unsaturated monomer.
2.3 Preparation and characterization of saturated and unsaturated methyl oligo-galacturonates
2.3.1 Preparation
For the methylation of carboxyl groups in pectins several methods have been described. However Deuel et al. (1950) mentioned that during esterification of silver pectate with methyliodide and of pectin with methanol-hydrogen chloride or with dimethyl sulphate, a partial hydrolysis of glycosidic linkages took place. Depoly-merization of pectin during esterification with methanol 2 N sulphuric acid at 3°C was also reported by Kohn & Furda (1967a,b). Neukom (1949) showed a degradation of pectin during methylation with diazomethan at 0°C. Vollmert (1950) reported a quantitative esterification with diazomethan at -20°C without degradation of the pectin. However, Smit & Bryant (1969) showed a considerable depolymerization during esterification with diazomethan at -30°C. Because of high concentrations of methanol reactions with the reducing end-groups also took place. The diazomethan method is rather laborious and somewhat hazardous.
Jansen & Jang (1946) studied the methylation of polyuronides and galacturonic acid
16

with methanol-hydrogen chloride. They demonstrated that the rate of esterification of D-galacturonic acid was about 25 times greater than that of glycoside formation at 25 °C, whereas at 0°C the difference in rates was 55 times. Pectic acid was esterifled at a much lower rate under the same reaction conditions. Alginic acid however was esterified much more readily. The rate and extent of glycoside formation and esterification were shown to increase with increasing normality of methanolic hydrogen chloride. Glycoside formation was very small at normalities lower than 0.02. Based on these results McCready & Seegmiller (1954) prepared dimethylester of digalacturo-nic acid by esterification of digalacturonic acid in methanol 0.02 N hydrochloric acid at 5 °C. The same procedure was used by Edstrom & Phaff (1964b) for the preparation of the methyl esters of saturated and unsaturated dimer, and saturated trimer to hexamer. The reaction was finished by addition of an anion exchanger to remove hydrochloric acid and unesterified uronic acids. The reaction products contained traces of neutral, non-reducing esters, which were removed by preparative paper chromatography.
Chanez & Sag (1959) and Wood (1963) described the preparation of the methyl ester of monogalacturonate (methyl a-D-galactopyranuronate) with 0.02 N hydrochloric acid methanol solution at 5 °C. The reaction was stopped by addition of silver carbonate to neutralize the solution. After filtration over a charcoal filter bed, the filtrate was concentrated under reduced pressure. The remaining syrup was dissolved in 2 volumes dioxan and the methyl ester was crystallized by cooling. The crystals were collected by filtration, washed with ether dioxan (1:1 v/v) and finally with absolute ether. The residue was dried in a vacuum desiccator. The material was re-crystallized in a methanol-dioxan mixture. In this way the non-reducing material was removed.
2.3.2 Characterization of methyl oligogalacturonates
The methyl esters were produced from the corresponding, pure galacturonic acids. By products were removed by ion exchange chromatography and preparative paper chromatography (McCready & Seegmiller, 1954; Edstrom & Phaff, 1964b) or by crystallization techniques (Chanez & Sag, 1959).
For the characterization of methyl-a-D-galacturonate Jansen & Jang (1946) estimated the [a]£5 value. They found an initial value of +94° and an equilibrium value of +34°. The same values are reported by Chanez & Sag (1959). These authors also found a melting point of 147 °C. Jansen & Jang (1946) further determined a a methoxyl content of 14.9% and a mol wt of 202 (by reducing value) and 210 (by saponification). The theoretical values were 14.9 and 208 respectively.
For the dimethyl ester of digalacturonic acid, McCready & Seegmiller (1954) estimated the molar ratio of - C H 3 0 : -CHO to be 2.08. Its equilibrium specific rotation was found to be +145°. Qualitative paper chromatography showed that the compound was a neutral (indicated with a pH indicator spray), reducing (indicated with aniline trichloroacetic acid treatment) ester (indicated with hydroxylamine
17

ferric chloride reagents), with a Rgal value of 1.33. Similarly Edstrom & Phaff (1964b) controlled the purity of their preparations, which
were all shown to be reducing, neutral esters. The dimethyl ester of unsaturated di-galacturonic acid showed an absorption maximum at 235 nm with a molar absorption coefficient of 6130. Homogeneity of a homologous series of -saturated methyl oligogalacturonates was indicated by the linear relationship between RMegal value and the DP {RMegai is the ratio of the distance travelled by a particular ester to the distance of migration of methyl galacturonate). Saponification of the esters yielded the corresponding free acids as was indicated by paper chromatography.
2.4 Pectic enzymes
2.4.1 General classification and properties
Saponifying enzymes The saponifying enzyme is a specific pectin methylesterase which splits the methyl ester group of polygalacturonic acids and which is now commonly called pectinesterase or pectin methylesterase and abbreviated to PE. According to the International Enzyme Commission PE is a pectin pectyl-hydrolase, number 3.1.1.11.
Plant PE is almost completely specific for methyl esters of polygalacturonides. Ethyl esters are de-esterified only very slow (McDonnell et al., 1950) by citrus PE; glycol and glycerol esters are not de-esterified (Deuel & Stutz, 1958). The methyl esters of mono, di and tri galacturonic acid are not saponified by PE. The methyl ester of acetic and tartaric acid as well as the methyl esters of alginate and tragacanth are resIStant to PE (Deuel & Stutz, 1958). Schultz et al. (1945) postulated that orange PE starts its saponifying activity on methyl ester groups next to a free carboxyl group and then continues to act along the molecule. Solms & Deuel (1955) have shown that PE acts more quickly on alkali presaponified pectin than on enzymatically presaponified
The difference between saponification by enzyme and by alkali is that with the first method the distribution of free and esterified carboxyl groups is blockwise whereas with the second method the distribution is more random. This difference in distribution was also demonstrated by Kohn et al. (1968) by measuring the stability of their calcium complex. According to Solms & Deuel (1955), free carboxyl groups are necessary for the formation of the complex between enzyme and substrate; the saponification then occurs along the molecule in both directions. These authors also observed that the enzymatic saponification was not complete; there always remained a preparation wrth a degree of esterification of about 10%. They thought this was caused ̂ irregulanties m the pectin molecule, for instance neutral sugars in the chain. Lee et al (1970) provided more information on the action of PE of tomatoes. During o h l T n i a C t l° n , ° f P E ^ a D CX0 PCCta t e l y a s e f r o m CL multifermentans, they L l a c ^ H ? ° n b.CtWeen P E aCt iYi ty a n d P f 0 d u c t i 0 n o f ^saturated di-galacturonic acid. Because the exo pectate lyase was found to attack the acid from the
18
reducing end at a rate depending on the PE activity, saponification has to occur along the molecule in the direction of the non-reducing end.
PE activity is inhibited by the acid groups formed. This phenomenon has also been observed for saponification by alkali and is explained by repulsion through the increasingly negatively charged colloid (Lineweaver & Ballou, 1945). The presence of neutral salt overcomes this repulsion and activates the enzyme.
PE has been found in many fruits and vegetables and can be produced by microorganisms. The optimum pH values for the various PEs depend on their origin: tomato and orange PE have an optimum pH of 7.5, for PE from fungi values between 4 and 5 are reported and for PE from bacteria values between 7.5 and 8.
Native PE may be involved in changes of the pectic substances of fruit and vegetables during ripening, storing and processing. Especially in the tomato and citrus industry this enzyme plays an important role (Rombouts & Pilnik, 1971; Pilnik, 1958; Joslyn & Pilnik, 1961). PE is present in practically all commercial pectolytic enzyme preparations. In the processes where these preparations are used PE activity appears to be important, although in many cases no clear explanation for this can be given.
Several methods are used to determine PE activity. For qualitative PE tests the enzyme is mixed with a pectin solution, pH is adjusted and the pH drop is observed either electrometrically or with indicators. An addition of calcium ions will give a calcium pectate gel (Kertesz, 1937; Somogyi & Romani, 1964; Pilnik & Rothschild, 1960).
Diffusion tests in gels of agar and pectin are also possible. Impregnation with acid will cause turbidity because of precipitation of pectic acid formed. Impregnation with a hydroxylamin ferric reagent will only give the insoluble ferric-hydroxamic acid complex with no PE present (McComb & McCready, 1957). Quantitatively most authors use a titrimetric method to follow the saponifying action of PE. This method has been thoroughly investigated by Vas et al. (1967), Leuprecht & Schaller (1968) and by Rombouts (1972). In reaction systems in which titration analysis is impossible, released methanol can be determined by distilling, oxidizing and determining formaldehyde with chromotropic acid (Boos, 1948), or with pentane-2.4-dione (Wood & Siddiqui, 1971).
Depolymerizing enzymes Enzymes that depolymerize pectic substances have been classified by Demain & Phaff (1957) and Deuel & Stutz (1958) as glycosidases with specific activities pertaining to the degree of esterification of the substrate and to random or terminal attack. However, Albersheim et al. (1960b) discovered that a commercial pectinase preparation caused transeliminative cleavage of the cc-1-4-glycosidic bond. This discovery was followed by many publications showing a trans-elimination mechanism in enzymes that depolymerize pectin. Therefore a new classification became necessary, especially as it was found that the lyases (transeliminases) could also be classified by their preference for a low or high methoxyl substrate and by random or terminal attack, at least for pectic acid lyases.
This new classification was introduced by Neukom (1963) who subdivided all
19
enzymes which split the a-l-4-glycosidic bonds between galacturonic monomers in pectic substances in eight groups. Koller (1966) assigned numbers to these groups according to the system of the International Enzyme Commission. This classification is presented in Table 3. The prefix endo or exo designates statistical or terminal cleavage (liquefying or saccharifying). Up till now enzymes from each group have been described except for exo PMG and exo PL. The remaining six groups consist of enzymes which can further be subdivided according to optimum pH values, inhibition or activation with cations, stability and - for exo enzymes - attack on reducing or non-reducing end and degree of polymerization of end-product (Voragen & Pilnik, 1970a). Names previously given to these enzymes include pectinase, polygalacturonase, depolymeric enzymes, polygalacturonases.
Polygalacturonase (PG) activity is frequently found in yeasts, moulds and bacteria. Plant PG has not been studied so extensively as microbial PG. Its activity has mostly been studied in situ without previous extraction or purification. One exception is the work of Hobson (1962), who investigated the activity of sodium EDTA extracts and found PG activity in various fruits and vegetables.
There is only one known instance of lyase activity in a higher plant, pectin lyase in pea seedling (Albersheim & Killias, 1962). However many micro-organisms produce such enzymes. In general pectate lyases have a high optimum pH and they are activated by Ca2+. Pectin lyases are discussed in more detail in Section 2.4.3.
Recently glycosidases and lyases acting on oligouronides only have been found in micro-organisms (Moran et al., 1968b; Hasegawa & Nagel, 1968; Nagel & Hasegawa, 1968).
The literature on pectic enzymes is very confused. Much work has obviously been done with mixtures of different types of enzymes; other scientists have worked with purified enzymes but used badly defined substrates or methods which were not specific enough to distinguish between the different types of activities. Rombouts & Pilnik (1972) screened practically all the literature on pectic enzymes and those articles that conformed to their criteria were reviewed. Many authors used oligogalacturonic
Table 3. Classification of depolymerizing pectic enzymes (according to Neukom (1963) and Koller (1966)).
Acting mainly on pectin Acting mainly on pectic acid
1. Endo PMG** (3.2.1.4.1)* 5. Endo PG** (3.2.1.15) 2. Exo PMG 6. Exo PG (3.2.1.40)
3. Endo PL** (4.2.2.3) 7. Endo PAL** (4.2.2.1) 4. Exo PL 8. Exo PAL (4.2.2.2)
* Number given by Koller (1966) according to the system of the International Enzyme Commission ** PMG = polymethylgalacturonase, PL = pectin lyase, PG = polygalacturonase, PAL = pectic acid lyase
20

acids as substrates for the study of purified enzyme preparations because they were well defined substrates. Oligogalacturonic acids were especially used for the study of pectic acid degrading enzymes. This work has been reviewed by Wilson (1969) and by Voragen & Pilnik (1970a). The following conclusions were made: Whether a pectic acid depolymerase is an endo or exo enzyme can not be determined from its action on oligogalacturonides. However it can be seen from the literature that the de-polymerizing activity of the endo enzymes increases with increasing chain length of the substrate, while exo enzymes degrade oligomers faster than polymers. Probably this phenomenon can be explained by differences in the concentration of attackable glycosidic linkages. The exo enzymes have a specific preference for either end of the molecule, but none for the interior bonds and they may be inhibited by either end of the molecule. Sometimes the reducing end-group was found to be directly involved in the formation of the enzyme-substrate complex. The chromatographic evidence for oligogalacturonide breakdown can be explained by postulating the interaction of the enzyme with a number of subunits in the substrate.
Relatively little literature has appeared on enzymes that degrade highly esterified pectin. Some authors have worked with purified enzymes but they used various methods and different substrates. The literature on polymethylgalacturonases (PMG) is very doubtful. As most publications appeared before 1960, most of the enzymes described were probably not pectin hydrolases but lyases. Sections 2.4.2 and 2.4.3 review the literature on pectin lyases and pectin hydrolases. Special attention is paid to the homogeneity of the enzyme preparations and to substrates and methods used in these studies. The most important data are tabulated and discussed.
2.4.2 Polymethylgalacturonases
Since the discovery of pectin lyases in 1960 there have been only a few publications dealing with PMG (Roller, 1966; Koller & Neukom, 1967; Rexova-Benkova & Slezarik, 1966; Rexova-Benkova, 1967; Tani, 1967). These authors were aware of the existence of pectin lyases but with the methods available they could not demonstrate transeliminative degradation of pectin with the more or less purified enzyme preparations.
During the fractionation of the pectic enzymes of a commercial enzyme preparation produced by Aspergillus niger, Koller (1966) and Koller & Neukom (1967) obtained a fraction which showed high activity on highly esterified pectin (DE 95 %) with optimum pH values of 4, 6 and 7. This fraction was obtained by chromatography of a methanol precipitate of the preparation on phosphate cellulose. At pH 4 pectin was degraded up to 57 %, leaving monomer, dimer, trimer, tetramer and pentamer as end-products. This was shown by thin layer chromatography. As 50% reduction in viscosity corresponded to about 9% hydrolysis this enzyme must have an endo character. Enzyme activity and extent of degradation were estimated by measuring the increase in reducing end-groups by the 3.5-dinitrosalicylic acid procedure with a preceeding saponification step in the cold. No increase in ultraviolet absorbance at
21

235 nm could be observed, so they considered this enzyme as an endo PMG. The fraction however was still contaminated with PE and PG which were also active in this pH range. The combined action of these enzymes may also result in the degradation of highly esterified pectin.
At pH 6.1 the pectin degradation was caused by a transelimination reaction, but at pH 7 it was not. By a heat treatment of 20 min at 75 °C pectin lyase and the other contaminating enzymes could greatly be inactivated selectively. The remaining enzyme degraded pectin to 39%, leaving dimers to pentamers as end-products, while no increase in ultraviolet absorbance could be observed. Also for this enzyme 50% viscosity reduction of the substrate corresponded to about 9 % hydrolysis. This enzyme was also considered as an endo PMG.
Rexova-Benkova & Slezarik (1966) and Rexova-Benkova (1967) described a PMG obtained from a surface culture of Aspergillus niger. The enzyme was purified by ammonium sulphate and alcohol precipitation, desalted by gel filtration, freeze-dried and further purified by repeated column chromatography on DEAE cellulose. The homogeneity of the preparation was confirmed by electrophoresis as well as by sedimentation analysis and by the detection of only lysin as N terminal amino acid. The degradation of 96.8% esterified pectin was not accompanied by an increase in absorbance at 235 nm. A sharp decrease in viscosity was observed during the first minutes of the reaction. Paper chromatography showed oligouronides as end-products. Because of these properties this enzyme was specified as an endo PMG. The enzyme was most active at pH 6.5 to 7 and quite heat stable: 54% of activity was retained after 24 h at: 50»c. A Km value of I.78.10- M (units of methylester of galacturonic
^ T ' n o ^ a " 1 " ? ° n d S ^ ^ m ° l e C U l e ° f t h e h i g h ly e s t e r i f i e d Pecti*) ^ s found. • T a m
i( 1 ^ 6 7 ) d e S c n b e d a P M G P au sed by Gloesporium kaki hori, a fungus which
is involved m the soft rot of kaki fruits. The enzyme rapidly decreased the viscosity of a pectin solution; maximum activity was shown at pH 4.5. No increase in absorbance at 235 nm could be detected. The enzyme preparation was obtained by ammonium su^hate precipitation and fractionation by zone electrophoresis. The preparation was more active on pectin than on pectic acid and contained no detectable amounts of PE. The enzyme was able to macerate potato slices
The work before 1960 was reviewed by Demain & Phaff (1957) who subdivided
Bv c o Z w 6 8 T tW° g r ° U P S ° n ^ b aS iS ° f ° p t i m u m p H a n d e x t e n t of hydrolysis,
ttsee™ PTrtir ? ' ^ CnZymeS Whh the properties of Pe«in lyases, t t wasTo f P T ° ̂ ^ ^ r a t h e t t h a n h y d r 0 l a s e s ' E v i d e n c e t o s»PP-t this iact was also found in my experiments (see Section 5 2)
enlteXV1 °952), ^ S e C g m i l I e r & J a n s e n <1952) d e s c r i°«I pectin degrading p S d e n tm P ^ ^ ^ **"**• R ° b ° Z * * ^ o b ^ a partially lZlt^ZZTT°a fr°m ^ CUltUrC H q u i d °f "«"»**» crassa. The e s X ^ e tWf "fJT N F m 6 ° % ) a n d PCCtic a d d a s substrate and the
S ^ S f 7 f TUlt t 0 l n t e r P r e t I t S P r ° p e r t i e s w e r e s i m i l a r to the enzyme
pectic enzyme preparation. By repeated precipitation at 40 % saturation of ammonium
22
sulphate, they obtained precipitates which showed increasing preference for pectin than for pectic acid substrates. Their final preparation degraded pectin 30 times faster than pectic acid. It had a negligible amount of PE. As substrate citrus pectin NF (DE 60 %) was used. By viscosity measurements they estimated an optimum pH in the range of 5.5 to 6. Only 26 % of the available uronide bonds of pectin were split and 17% of those of citrus methylglycoside of polygalacturonic methylester. There were no monomers and dimers detectable in the enzyme digests. 50 % reduction in viscosity corresponded to 0.5 % hydrolysis, indicating an endo mechanism.
Brooks & Reid (1955) demonstrated the occurrence of an enzyme in a submerged culture of Aspergillus foetidus that rapidly hydrolysed citrus pectin (DE 60%) at an optimum pH of 5.5 to a mixture of partially esterified oligogalacturonic acids, similar to the mixture found by Roboz et al. (1952). By heating the enzyme for 20 min at 60 °C and pH 5.3 the activity was completely destroyed. By studying the pectic enzyme complex of Aspergillus niger Schubert (1954) distinguished two 'pectin-glycosidases': a-pectinglycosidase (a-PG) and y-pectinglycosidase (y-PG). He obtained a purified a-PG by keeping the filtrate of Aspergillus niger cultures for 30 min at pH 4.6 and 50 °C, then the pH was adjusted to 4.2 and 20% Fullers' earth was added. After 20 min the mixture was filtered and the filtrate was desalted with a mixed bed of Dowex 2 and Dowex 50. A clear enzyme solution was obtained which showed no activity on pectic acid. For the study of this enzyme pectins with a DE of 89 and 70% (Brown Ribbon pectins, Obipectin Ltd., Bischofszell, Switzerland) were used, just as buffered native apple juice. The enzyme showed optimum activity at pH 5.5 and was activated very strongly by the addition of sodium ions. This activation increased with increasing pH of the substrate solution. In a salt-free reaction mixture of pH 6.3 the enzyme showed no activity. The optimum pH increased with increasing salt concentration. The y-PG showed an optimum at pH 8 to 9.
An enzyme similar to the y-PG was described by Wood (1955). The enzyme was partially purified from cell-free culture liquid of Erwinia aroideae by fractional precipitation with acetone. The purified preparation still showed activity on sodium pectate solutions. With citrus pectin NF as substrate (DE 56%) optimum activity was measured between pH 8.5 and 9. About 92 % loss in viscosity corresponded to 1.7 % hydrolysis, thus demonstrating the endo character of the enzyme action. About 20% of the available uronide bonds of pectin were split, but no galacturonic acid was produced although other low molecular weight uronides were detected by paper chromatography. Wood (1955) further showed that the enzyme required calcium ions for activation and was rapidly destroyed at temperatures above 60 °C and at pH 2.7. The enzyme was able to macerate slices of potato tubers.
2.4.3 Pectin lyases
The first enzyme of this type was described by Albersheim et al. (1960b). They demonstrated that an enzyme of a commercial 'pectinase' preparation degraded pectin in a similar way to the pectin degradation in neutral or alkaline conditions
23
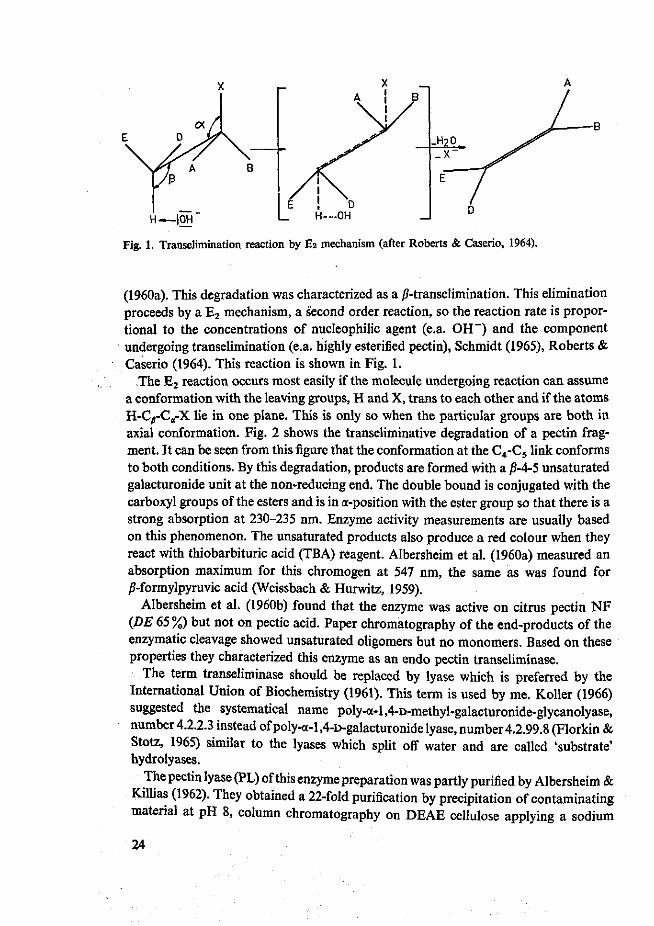
H—|0H
Fig. 1. Transelimination reaction by E2 mechanism (after Roberts & Caserio, 1964).
(1960a). This degradation was characterized as a /?-transelimination. This elimination proceeds by a E2 mechanism, a second order reaction, so the reaction rate is proportional to the concentrations of nucleophilic agent (e.a. OH") and the component undergoing transelimination (e.a. highly esterified pectin), Schmidt (1965), Roberts & Caserio (1964). This reaction is shown in Fig. 1.
The E2 reaction occurs most easily if the molecule undergoing reaction can assume a conformation with the leaving groups, H and X, trans to each other and if the atoms H-CyCg-X lie in one plane. This is only so when the particular groups are both in axial conformation. Fig. 2 shows the transeliminative degradation of a pectin fragment. It can be seen from this figure that the conformation at the C4-C5 link conforms to both conditions. By this degradation, products are formed with a /?-4-5 unsaturated galacturonide unit at the non-reducing end. The double bound is conjugated with the carboxyl groups of the esters and is in a-position with the ester group so that there is a strong absorption at 230-235 nm. Enzyme activity measurements are usually based on this phenomenon. The unsaturated products also produce a red colour when they react with thiobarbituric acid (TBA) reagent. Albersheim et al. (1960a) measured an absorption maximum for this chromogen at 547 nm, the same as was found for j?-formylpyruvic acid (Weissbach & Hurwitz, 1959).
Albersheim et al. (1960b) found that the enzyme was active on citrus pectin NF (DE 65 %) but not on pectic acid. Paper chromatography of the end-products of the enzymatic cleavage showed unsaturated oligomers but no monomers. Based on these properties they characterized this enzyme as an endo pectin transeliminase.
The term transeliminase should be replaced by lyase which is preferred by the International Union of Biochemistry (1961). This term is used by me. Roller (1966) suggested the systematical name poly-a-l,4-D-methyl-galacturonide-glycanolyase, number 4.2.2.3 instead ofpoly-a-l,4-D-galacturonidelyase, number4.2.99.8 (Florkin & Stotz, 1965) similar to the lyases which split off water and are called 'substrate' hydrolyases.
The pectin lyase (PL) of this enzyme preparation was partly purified by Albersheim & Killias (1962). They obtained a 22-fold purification by precipitation of contaminating material at pH 8, column chromatography on DEAE cellulose applying a sodium
24

/\^><U><M X0H
Fig. 2. Transeliminative degradation of a pectin fragment.
chloride gradient and gel filtration on Sephadex G75 and G50 (Albersheim, 1966). Paper electrophoresis indicated that the isoelectric point of the enzyme was between pH 3 and 4. In the same way a similar enzyme was isolated and purified from pea seedlings. With citrus pectin NF {DE 65%) in Mcllvaine buffer the enzyme showed an optimum pH in the range 5.1 to 5.3. Enzyme activity was assayed by measuring directly the increase in ultraviolet absorbance at 235 nm. The energy of activation of the enzymatic reaction at pH 5.3 and 0.5 % substrate solution was estimated to be 8.4 kcal/mol. From their data we calculated a Km value of about 1.8 mg/ml pectin. Albersheim & Killias (1962) further showed the stimulating effect of multivalent anions. Lyase activity in phosphate citrate buffer was twice that in acetate buffer. The enzyme was inhibited by calcium ions in phosphate citrate buffer. Also product inhibition was observed. The inhibitory effect of the unsaturated compounds could be destroyed by ozonation. Albersheim (1963) demonstrated that the degree of product inhibition was markedly increased by plant auxins and antauxins such as 2.4-dichloro-phenoxy-acetic acid, 2.4-dichlorophenoxy-isobutyric acid and 3 indole acetic acid. These compounds were not inhibitory in the absence of unsaturated product. It is suggested that auxins inhibit the action of pectin lyase by formation of a triple complex between auxin, the lyase and the unsaturated uronide. Bull (1968) presented results which indicate that the auxin product inhibition of the activity of pectin lyase in vitro can be attributed to errors in spectrophotometry associated with assaying optically dense reaction mixtures.
Edstrom & Phaff (1964a) obtained a pectin lyase by partial purification of the cul-
25
ture fluid of Aspergillus fonsecaeus. PG was removed by selective adsorption on calcium pectate gel. Next the lyase was adsorbed on calcium phosphate gel and desorbed with 1 M sodium acetate buffer at pH 4. This treatment resulted in a substantial increase in specific activity. The calcium phosphate eluate was further purified by DEAE cellulose column chromatography. They purified the enzyme 50 to 100 fold; it was free of PG, PE and cellulase. As substrate they used citrus pectin NF (DE 68 %) and pectin M, a soluble pectin which gives a clear solution suitable for spectrophoto-metric measurements. It was prepared by treating pectin NF with endo polygalacturonase produced by a yeast as described by Luh & Phaff (1951). This enzyme produced a maximum hydrolysis of about 1 % of the glycosidic linkages and rendered insoluble a small amount of amorphous gummy material.
On pectin NF in sodium acetate buffer, optimum activity was measured at pH 5.2. In the presence of calcium ions they also found an optimum at pH 8.5. The release of 1 umol of aldehyde groups in a 10 ml reaction mixture, estimated by the hypoiodite procedure, was equivalent to an increase of 0.555 in the absorbance at 235 nm measured for the same reaction mixture in a 1 cm cuvette.
By studying the effect of cations, Edstrom & Phaff (1964a) illustrated stimulatory effect of calcium and magnesium in the degradation of pectin M at an optimum concentration of 0.13 M. Sodium ions were also activators even in concentrations of 0.5 M. The stimulatory effect of calcium and sodium ions was influenced by the pH. Calcium ions brought about a second optimum pH at pH 8.5 with even higher activities than at pH 5.2. Without cations there was no activity at higher pH. Phosphate and acetate ions in concentrations higher than 0.15 M exhibited significantly lower activities than did sulphate and chloride ions. Pectin lyase was shown to catalyse a random cleavage of pectin M, 50 % loss in viscosity corresponded with 3.2 % degradation of the glycosidic linkages. The endo character of the enzyme was also demonstrated by paper chromatography of the reaction products of polymethyl polygalac-turonate methyl glycoside (link pectin, 95.5 % esterified) treated with the lyase (Edstrom & Phaff, 1964b). A gradual appearance of reaction products of increasing mobility with time was observed. Unsaturated trimer, tetramer and pentamer were the main end-products; there were only small amounts of unsaturated dimer. For paper chromatography 2 solvent systems were used for separating the methyl esters of oligogalacturonic acid. One system, butanol saturated with water, was able to separate unsaturated and saturated compounds. The other system, propanol, water, ethyl acetate (7:2:1), was not able to separate between saturated and unsaturated compounds. Unsaturated trimer showed the same migration as saturated monomer, unsaturated tetramer was not separated from saturated dimer. Additional information on the reaction product was obtained by saponification of the reaction mixture in the cold and separating the remaining oligogalacturonic acids with the epiphase of ethyl acetate, acetic acid, water (2:1:2). Detection of the spots was based on reactions for aldehyde groups (benzidine-trichloroacetic acid reagent), carboxyl groups (pH indicator spray), methyl esters (alkaline hydroxylamine followed by a mixture of feme chloride and HC1) and unsaturated esters (quinine sulphate). With the methyl
26

esters of oligogalacturonides, the enzyme catalysed a transelimination reaction with tetramethyl tetragalacturonate and the higher esters, but did not attack the trimer and lower esters. The hexa-ester was cleaved preferentially at bond 3 and at bond 4 at a lower rate (the glycosidic bond adjacent to the terminal reducing group is designated bond 1, the other bonds are numbered consecutively). The latter reaction yielded normal dimer and unsaturated tetramer. Pentamer was attacked at bond 3, just like tetramer. The pectin lyase apparently cannot cleave the two glycosidic bonds nearest the reducing end of fully esterified polygalacturonates and is severely limited in its ability to split the bonds nearest the non-reducing end. The relative initial rates of the reactions were: polymethyl polygalacturonide methylglycoside 100, pectin (DE 68 %) 75, hexamethylhexagalacturonate 2.6, pentamethylpentagalacturonate 0.65 and tetramethyltetragalacturonate 0.049. By measuring the increase in reducing end groups, the extent of pectin degradation was also studied. These experiments were done with and without 0.12 M calcium chloride. Calcium ions increased the extent of degradation of pectin M, but no effect was observed on either the rate or extent of the reaction with polymethyl polygalacturonate methyl glycoside. The final extent of the degradation of this pectin at pH 5.2 was about 30 %, pectin M was degraded for about 18 % without calcium ions and for about 22% with calcium ions present. At pH 7.5 and in the presence of calcium ions a more rapid degradation was observed in the initial stage, but the rate decreased rapidly because of enzyme inactivation at this pH. The enzyme lost 68 % of its activity in 1 h when it was incubated at 30 °C in 0.002 M sodium acetate at pH 7.5. As the final extent of degradation of pectin M in the presence of an optimum calcium chloride concentration was less than the degradation of polymethyl polygalacturonate methylglycoside pectin, Edstrom & PhafT (1964b) concluded that calcium ions merely stimulated the initial rate of the elimination reaction and that they did not serve as replacements of the methoxyl groups.
Bush & Codner (1970) compared the properties of the pectin lyases of Penicillium digitatum and Penicillium italicum. Both fungi are involved in the post-harvest decay of citrus fruit, but there are some differences in the pattern of decay. The pectin lyases were purified from bran extracts of the fungi by repeated ammonium sulphate precipitation. The active fractions were desalted by gel filtration on a Sephadex G25 column and then subjected to column chromatography on Ecteola cellulose that increased specific activity by 150 to 250 fold (Bush & Codner, 1968). Both lyases were found to be electrophoretically homogeneous when run on polyacrylamide gels at pH 9.5. By co-electrophoresis of a mixture of the purified enzymes only one protein band was detected so that it is very probable that the two enzymes are similar. As substrate citrus pectin in citrate phosphate buffer was used; this pectin is not further defined. By measuring reduction in viscosity and increase in ultraviolet absorbance, optimum activity was observed at pH 5.5 in both methods and for both enzymes. An apparent Km value for both enzymes of 0.06 mg/ml was estimated. The enzymes caused a rapid reduction in viscosity thus indicating random degradation of pectin. Pectic acid was not affected by the enzymes. The only difference which could be observed between the lyases of both enzymes was the temperature stability. Re-
27

duction in activity started after treating the enzymes for 5 min at 50 °C and was greatest for Penicillium italicum lyase. The reduction was complete after a treatment of 5 min at 70 °C. The authors suggested that this difference in stability may be influenced by impurities, since the Penicillium italicum preparation had a lower specific activity. They further showed that their purified lyases could macerate orange rind and also caused zones of softening when injected into the rind of intact oranges.
The pectin lyase found by Roller (1966) during the fractionation of a commercial enzyme preparation derived from Aspergillus niger was further studied by Amado (1970). The enzyme was purified by desalting an aqueous extract of the preparation by gel filtration with Sephadex G25. The active fractions were introduced in a calcium phosphate gel column and the lyase was eluted by a phosphate buffer gradient and rechromatographed in the same way. Further purification was achieved by preparative disc electrophoresis. Electrophoresis on cellulose acetate sheets indicated an isoelectric point of 3.5. The resulting lyase preparation was free of other pectic enzymes. Highly esterified apple pectin (DE 96.8 %) was used as substrate. This preparation was obtained by esterification of Pink Ribbon pectin (Messrs. Obipectin Ltd., Bischofszell, Switzerland) without preceeding purification of this pectin. Activity was measured by estimating increase in ultraviolet absorbance and increase in reducing end-groups with the 3.5-dinitrosalicylic acid procedure. The enzyme showed optimum activity at pH 5.9; as buffer the phosphate citrate system was used. No activity on pectic acid was observed. The enzyme was characterized as an endo pectin lyase because 50% reduction in viscosity corresponded with 5 % breakdown. The final extent of degradation was 47%, the end-products of this degradation were: a few saturated monomers and dimers, many unsaturated dimers, trimers and higher oligomers. This was illustrated by thin layer chromatography and paper chromatography using the solvent system of Nagel & Vaughn (1961) (ethyl acetate, pyridine, water, acetic acid (5:5:3:1)) which separates saturated and unsaturated compounds. TheXm value of the enzyme was found to be 2.17 mg/ml. Amado did not find any stimulatory or inhibitory effects of monovalent and divalent cations in the concentration range 0.001 M to 0.1 M. The enzyme turned out to be stable between pH 4 and 8 and showed macerating activity on potato slices. The macerating ability of pectin lyase was also reported by McClendon (1964). By chromatography of macerating enzymes he found a pectin lyase which macerated the cell walls of potato tubers very well.
Fun & Foster (1970) purified a pectin lyase produced by Byssochlamys fulva using ammonium sulphate precipitation, DEAE cellulose chromatography and Sephadex G100 gel filtration. Studies on the partially purified enzyme revealed that the lyase had an optimum pH around 4.9; it did not digest polygalacturonic acid. The enzymatic activity was enhanced greatly by magnesium and calcium ions and to a lesser extent by sodium ions. Paper chromatography showed the production of unsaturated oligo-galacturonides.
A quite different type of pectin lyases has been described by Sherwood (1966), Bateman (1966, 1967) and Byrde & Fielding (1968). These enzymes degrade pectate
28

as well as pectin with a preference for pectin. All these enzymes showed highest activity in slightly alkaline conditions.
Sherwood (1966) demonstrated that several isolates of Rhizoctonia solani and some other fungi produced a lyase that depolymerized pectin more rapidly than sodium polypectate and was more active at pH 7.2 than at pH 5.0. The pectin preparations were not further defined. The enzyme preparations were not purified and still contained PG. On pectin solutions in phosphate citrate borate buffers, optimum activity was shown at pH 8.2 by measuring decrease in viscosity and increase in absorbance at 550 nm of the chromogen formed in the TBA assay. The activity was not influenced by calcium ions or EDTA. In reaction mixtures of these preparations with pectin or sodium polypectate no oligomers were detectable. Potato tissue was macerated. This occurred most rapidly in the pH range 5-6.5.
Bateman (1967) showed two lyases in culture filtrates of & Rhizoctonia solani isolate. These enzymes were partly purified by starch gel electrophoresis. The enzymes showed higher activity on citrus pectin NF than on sodium polypectate. On pectin in citrate or tris buffers optimum activity was measured between pH 8 and 9. The enzymes were assayed by measuring decrease in viscosity, increase in ultraviolet absorbance at 230 nm and by the TBA reaction. Both lyases were stimulated by calcium ions and inhibited to a degree by EDTA.
A similar enzyme was found in the culture fluid of Fusarium solani f phaseoli (Bateman, 1966). A preparation free of other pectic enzymes was obtained by gel filtration on Sephadex G75. The lyase was active on both pectin (citrus pectin NF) and pectate with preference for pectin. The optimum pH was found to be about 8.6.
Besides the methods mentioned above the 3.5-dinitrosalicylic acid end-group method was also used for assaying enzyme activity. Reduction in viscosity of 50 % corresponded to a 1-2% increase in reducing power. A final extent of degradation of 55 to 60% was found.
The reaction products of pectin NF were separated by paper chromatography. The single spots were eluted and treated with TBA. From measurements of the absorbance at 548 nm of the chromogen formed production of unsaturated oligomers was indicated. The enzyme was able to macerate potato tissue, especially in slight alkaline conditions. This maceration was stimulated by addition of calcium ions.
In a study of the maceration factor of brown rot disease of apples, caused by Sclerotica fructigena, Byrde & Fielding (1968) found pectin lyase produced simultaneously with other pectolytic and non-pectolytic enzymes. Column chromatography of the culture filtrate of this organism on CM Sephadex revealed two lyase compounds. The reaction mixtures were centrifuged pectin solutions (Brown Ribbon pectin, DE 74%) in Mcllvaine and tris HC1 buffers. By measuring increase in ultraviolet absorbance at 240 nm, the lyases showed optimum pH values of 7.3 and 8.3 respectively. The enzyme with the optimum pH of 7.3 was activated by potato extract and by addition of polygalacturonic acid. This polygalacturonic acid itself was subject to negligible lyase attack. Cations did not effect enzyme activity. The lyases showed macerating activities on potato tissue, however the preparation with the optimum of pH 7.3 was
29
much more active. Both compounds showed a comparatively high similar tolerance towards extremes of pH (3-12), when they were exposed for 20 min to different pHs. Exposure of the enzymes for 20 min to 48 °C caused 50% reduction in activity while 50% reduction in macerating activity was caused by keeping the enzymes for 20 min at 49.4 °C.
2.4.4 Discussion
Table 4a summarizes the materials and methods used for the characterization of pectin degrading enzymes. The properties of these enzymes are given in Table 4b. The pectin degrading enzymes can be divided in five groups: I. PMG described after 1960 (Ref. No. 1, 2, 3, 4 in Table 4a) II. PMG described before 1960 with low optimum pH values (Ref. No. 5, 6, 8 in Table 4a) III. PMG described before 1960 with high optimum pH values (Ref. No. 7, 15 in Table 4a) IV. PL with low optimum pH values and not active on pectic acid (Ref. No. 9, 10, 11, 12, 13, 14 in Table 4a) V. PL with high optimum pH values and also active on pectic acid (Ref. No. 16, 17, 18, 19 in Table 4a)
The enzymes of Group II are similar to the pectin lyases of Group IV. This similarity is clearly shown by the enzyme described by Seegmiller & Jansen (1952) because of its optimum pH, % degradation at 50% viscosity reduction and its end-products of pectin degradation.
In their studies on the pectin depolymerases of Group I the authors (Ref. No. 1, 2, 3 and 4 in Table 4a) could not indicate transeliminative breakdown of pectin in the ultraviolet assay according to Albersheim et al. (1960b). They therefore considered these enzymes as polymethylgalacturonases.
There are, however, some doubts about these data. It is very likely that the activity on pectin at pH 4, shown by Roller (1966) and Roller & Neukom (1967) was caused by the combined action of PG and PE, which showed optimum activity in the same pH range. During my work I observed that, in the ultraviolet assay according to Albersheim et al. (1960b) in which the ultraviolet absorbance of diluted samples was measured, during enzymatic degradation of pectin with a 20-30 % loss in viscosity of a pectin solution caused by a pectin lyase there was no increase in ultraviolet absorbance. With further breakdown an increase in optical density was measured. In the early stage of breakdown the colloidal particles are solubilized by enzyme action and this results in an optically less dense solution. Thus the increase in ultraviolet absorbance is masked.
When assaying pectin lyase activity by plotting increase in ultraviolet absorbance directly with a recorder, purified substrate solutions are necessary. If the reaction mixture is an optically dense solution, light transmittance through the cuvette is only sufficient with a wide slit. But this means a loss in the sensibility of the assay. Therefore
30

Edstrom & Phaff (1964a, b) used a special pectin (pectin M) as substrate, while Bush & Codner (1970) and Byrde & Fielding (1968) centrifuged their pectin solutions at 34000 x g to remove colloidal particles. Bull (1968) indicates that the effect of auxin on the product inhibition of pectin lyase described by Albersheim (1963) are artefacts which can be attributed to errors in spectrophotometry associated with optically dense reaction mixtures. For these reasons a TBA or a periodate TBA assay should be a better test for transeliminative breakdown.
The pectin degrading enzymes discussed here were all produced by fungi except for the enzyme described by Wood (1955) which originated from Erwinia aroideae.
Considering the properties of the enzymes of groups I (except for 1), II and IV we see that the optimum pH values of these enzymes vary from 4.5-7. These differences may be explained by differences in the DE of the substrates used by the various authors. In my experiments I could demonstrate that the optimum pH of a pectin lyase depends on the DE of the substrate and the substrate concentration (Section 4.2.3).
The data on the % degradation can be divided in two groups i.e. data obtained by the 3.5-DNS method (varying between 39% and 60%) and data obtained by the iodite method (varying between 18-30%). Comparing the 3.5-DNS method with the iodite method Voragen et al. (1971a) found that the % degradation determined with the 3.5-DNS method was always higher than the values found with the iodite method. The data obtained with the iodite method indicated that the % degradation depends on the DE of the substrate.
The % degradation at 50% viscosity reduction found for the different enzymes ranges between 5 and 9% (determined with the 3.5-DNS method) and between 0.5 and 3.2% (determined with the iodite method). This value however depends on the initial DP of the substrate. As can be seen from tables 4a and 4b higher values were found for the preparations which were depolymerized during preparation or purification. The % degradation at 50% viscosity reduction is a good criterion for the characterization of the breakdown mechanism and with this criterion the enzymes studied in this way can be characterized as endo enzymes.
Random degradation of pectin was also indicated by the ability of the enzymes to cause a rapid loss in viscosity of pectin solutions, and from the end-products of pectin degradation analysed by paper or thin layer chromatography. The results of these chromatographic analyses were however difficult to interpret because solvent systems were often used which could not separate saturated and unsaturated compounds. Sometimes it is not clear whether the oligomers were separated as esters or as acids.
A thorough chromatographic study of the end-products was carried out by Edstrom & Phaff (1964b).
The lyases of Group V are active on high esterified pectin and on pectic acid. Both substrates are degraded by a transeliminative mechanism and highest activity is measured in slightly alkaline conditions. For these enzymes a further biochemical investigation is obviously needed. The y-PG described by Schubert (1954) and the enzyme described by Wood (1965) are very similar to these lyases.
31
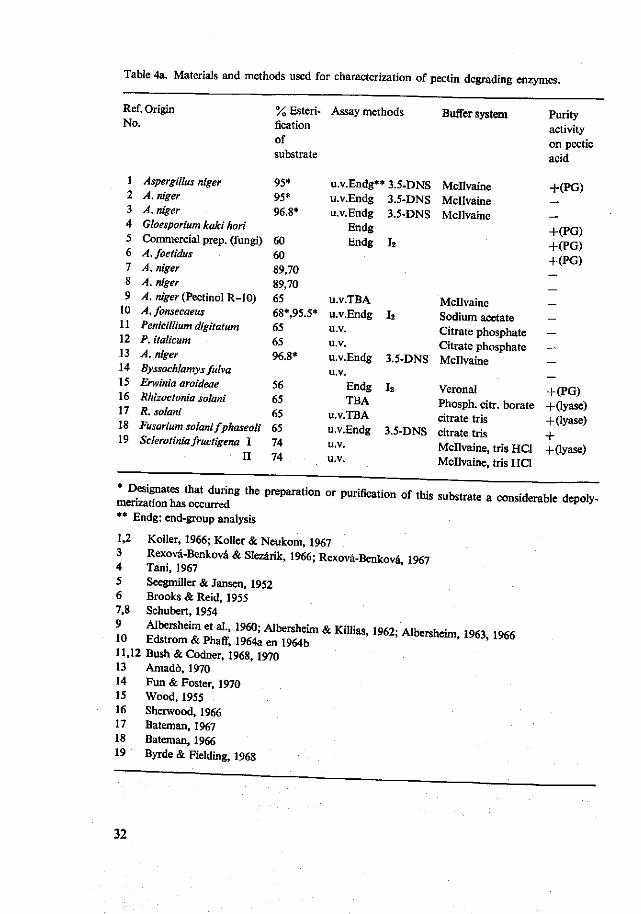
Table 4a. Materials and methods used for characterization of pectin degrading enzymes.
Ref. Origin
No.
1 Aspergillus niger
2 A. niger 3 A. niger 4 Gloesporium kaki hori 5 Commercial prep, (fungi) 6 A. foetidus
7 A. niger 8 A. niger 9 A. niger (Pectinol R-10)
10 A. fonsecaeus 11 Penicillium digitatum 12 P. italicum 13 A. niger
14 Byssochlamys fulva 15 Erwinia aroideae 16 Rhizoctonia solani 17 R. solani 18 Fusarium solani fphaseoli 19 Sclerotinia fructigena I
II
% Esteri-flcation of substrate
95* 95* 96.8*
60 60
89,70 89,70 65 68*,95.5* 65 65
96.8*
56 65 65 65 74 74
Assay methods
u.v.Endg** 3.5-DNS u.v.Endg u.v.Endg
Endg Endg
u.v.TBA u.v.Endg u.v. u.v. u.v.Endg u.v.
Endg TBA
u.v.TBA u.v.Endg u.v.
u.v.
3.5-DNS 3.5-DNS
I2
12
3.5-DNS
la
3.5-DNS
Buffer system
Mcllvaine Mcllvaine Mcllvaine
Mcllvaine Sodium acetate Citrate phosphate Citrate phosphate Mcllvaine
Veronal Phosph. citr. borate citrate tris citrate tris Mcllvaine, tris HC1 Mcllvaine, tris HC1
Purity activity on pectic acid
+(PG)
+(PG) +(PG) +(PG)
-
+(PG) +(lyase) +(lyase) + +(lyase)
L S n T a s t u t r *" """** " PUrifiCad°n °f «* "*«»* * — ' < ^ ** Endg: end-group analysis
1,2 3 4 5 6 7,8 9 10
Roller, 1966; Roller & Neukom, 1967 Rexova-Benkova & Slezarik, 1966; Rexova-Benkova, 1967 Tani, 1967 Seegmiller & Jansen, 1952 Brooks & Reid, 1955 Schubert, 1954
Albersheim et al., 1960; Albersheim & Killias, 1962; Albersheim, 1963, 1966 Edstrom & Phaff, 1964a en 1964b
11,12 Bush & Codner, 1968, 1970 13 Amad6, 1970
Fun & Foster, 1970 Wood, 1955 Sherwood, 1966 . Bateman, 1967 Bateman, 1966 Byrde & Fielding, 1968
14 15 16 17 18 19
32
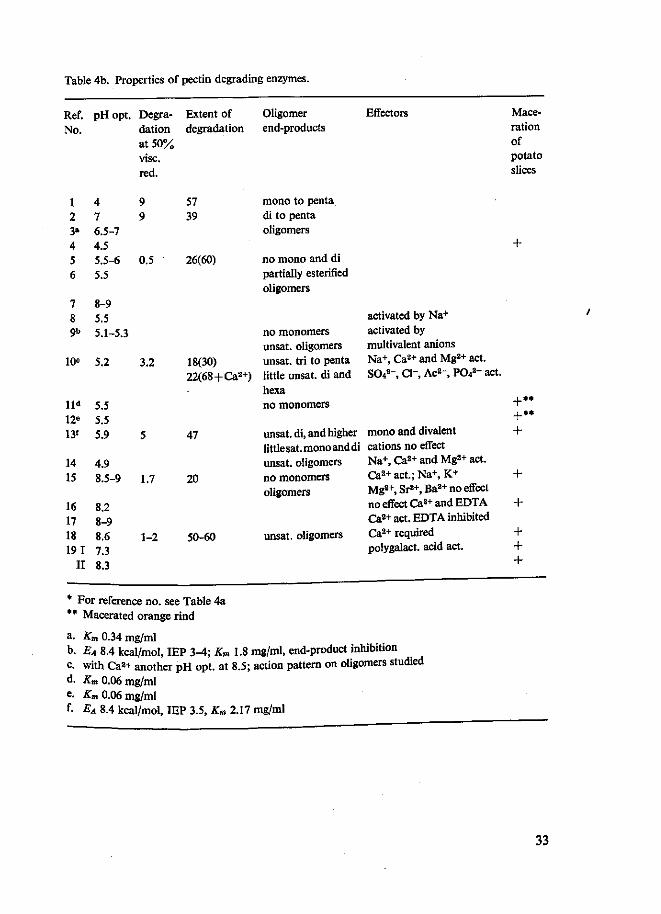
Table 4b. Properties of pectin degrading enzymes.
Ref. No.
pH opt. Degradation at 50% vise, red.
Extent of degradation
Oligomer end-products
Effectors Maceration of potato slices
4 7 6.5-7 4.5 5.5-6 5.5
7 8-9 8 5.5 9" 5.1-5.3
10° 5.2
l l d
12" 13'
14 15
16 17 18 19 1
II
5.5 5.5 5.9
4.9 8.5-9
8.2 8-9 8.6 7.3 8.3
0.5
3.2
1.7
1-2
* For reference no. see Table 4a ** Macerated orange rind
57 39
26(60)
18(30) 22(68+Ca2+)
47
20
50-60
mono to penta di to penta oligomers
no mono and di partially esterified oligomers
no monomers unsat. oligomers unsat. tri to penta little unsat. di and hexa no monomers
unsat. di, and higher little sat. mono and di unsat. oligomers no monomers oligomers
unsat. oligomers
activated by Na+
activated by multivalent anions Na+, Ca2+ and Mg2+ act. S04
2-, CI", Ac2-, PO43- act.
mono and divalent cations no effect Na+, Ca2+ and Mga+ act. Ca2+ act.; Na+, K+
Mg2+, Sr2+, Ba2+ no effect no effect Ca2+ and EDTA Ca2+ act. EDTA inhibited Ca2+ required polygalact. acid act.
+
+** +** +
+
+
+ + +
a. .Km 0.34 mg/ml b. EA 8.4 kcal/mol, IEP 3^1; Km 1.8 mg/ml, end-product inhibition c with Ca2+ another pH opt. at 8.5; action pattern on oligomers studied d. Km 0.06 mg/ml e. Km 0.06 mg/ml f- EA 8.4 kcal/mol, IEP 3.5, Km 2.17 mg/ml
33

The effect of cations on the activity of the enzymes of all groups is not one and the same. Divalent cations, especially calcium and magnesium and to a lesser extent sodium, are activators, but this is not found when citrate of phosphate ions are present in the buffers. Albersheim & Killias (1962) reported a stimulatory effect of multivalent anions. Edstrom & Phaff (1964a) also found an activation by anions, but at higher concentrations acetate and phosphate ions inhibited enzyme activity. Wherever the described depolymerizing enzymes were tested for their macerating ability, the results were positive on potato tissue.
34
3 Materials and methods
3.1 Oligogalacturonides
3.1.1 Isolation and preparation
The oligogalacturonic acids were prepared from highly purified pectic acid. This was obtained by purification of 'apple pectic acid' (Messrs. Obipectin Ltd., Bischofs-zell, Switzerland) according to the procedure of Derungs (1958). This procedure consists of complete saponification in the cold, sodium chlorite treatment, precipitation in a mixture of ethanol and hydrogen chloride and washing with ethanol 70 % until free from chloride and then with acetone and ether. The residue was vacuum-dried. A pectic acid preparation with a uronide content of 77 % determined by titration and a number average degree of polymerization of 45 (Rombouts et al., 1970a; Voragen et al., 1971a) was obtained. For the degradation of pectic acid I used two commercial enzyme preparations: Pectinase 2 LM (Takamine, Laboratory Inc., Clifton, New York, USA) and Rohament P (Messrs. Rohm & Haas Ltd., Darmstadt, W. Germany). Rombouts (1972) showed that these preparations were free of pectic acid lyase and contained high activities of polygalacturonase. Before use the liquid preparation Pectinase 2 LM and the aqueous extract of Rohament P were dialysed overnight in cellophane tubing against running tap water. For the production of unsaturated oligomers, pectic acid was degraded by an endo pectate lyase preparation from Bacilluspolymyxa. This preparation was obtained by lyophilization of the dialysed culture liquid of this organism, grown in a buffered calcium pectate medium (Rombouts, 1972). Unsaturated monogalacturonic acid was isolated from the culture liquid of a Flavobacterium grown in buffered pectate calcium medium. When screening pectin degrading micro-organism, Rombouts (1972) found that this Flavobacterium produced large amounts of a compound that was very reactive in the periodate TBA test and behaved like the unsaturated monomer described by Nagel& Anderson (1965) in paper chromatography analysis. The salts of oligogalacturonic acid were converted to the free acid by passing them over a Dowex 50W (50-100 mesh) H+ column. The diameter of the column was 28 mm. The height of the bed was varied with the amount of salt put on the column but was chosen so that the capacity of the column was approximately 10 times higher than the amount of cation equivalents.
Mixtures of saturated oligogalacturonic acids were prepared by hydrolysing pectic acid at 30 °C for different reaction times. The initial stage of degradation was followed by measuring decrease in viscosity with an Ubbelohde glass capillary viscosimeter.
35
From these measurements the time necessary to obtain 50% reduction in viscosity (t i ) was estimated. The composition of the reaction mixture after various reaction times (multiple t \ times) was studied by thin layer chromatography (see Section 3.1.2). A typical reaction mixture was a 1 % pectic acid solution adjusted to pH 4 with 1 N sodium hydroxide, to which 4 ml dialysed pectinase 2 LM per litre (or the dialysed enzyme extract of 0.2 g Rohament P) was added. A small amount of thymol was added for conservation. When the reaction mixture had the desired composition the reaction was terminated by addition of 10 g charcoal and 10 g celite per 1000 ml and by heating this suspension in a boiling water bath for 5 min. After filtration of the warm suspension, the filtrate was passed over a Dowex 50W (H+) column to convert the uronates to the free acids. The eluate was concentrated under reduced pressure to a concentration of about 10% (w/v) oligouronic acids.
When a hydrolysate contained to much D-galacturonic acid this compound was removed by precipitating it as sodium-strontium salt. The eluate of the Dowex 50W (H+) column, resulting from 1000 ml reaction mixture, was then concentrated under reduced pressure to 80 ml and 250 ml 95% ethanol were added. A white flocculate appeared which was removed by filtration. The filtrate was evaporated to dryness and the residue was dissolved in 90 ml distilled water, 30 ml of this solution was cooled to about 5°C and adjusted to pH 6.5 with 1 N NaOH. To the remaining 60 ml 0.149 g strontium carbonate per meq carboxyl groups present was added. This mixture was kept for one night and then filtered. The residual strontium carbonate on the filter was washed with distilled water at 50 °C. The filtrate and washings were pooled and added to the 30 ml portion. This solution was concentrated to 150 ml and then kept at 5 °C. The monogalacturonic acid crystallized as sodium-strontium salt within two days. The crystals were removed by filtration and washed with ice-water. By concentrating the filtrate and storing the concentrate at 5 °C again a part of the remaining monogalacturonate crystallized. By repeating this several times monogalacturonic acid could be completely removed from the mixture (Derungs, 1958).
A typical reaction mixture for the production of unsaturated oligogalacturonic acids contained 0.5 % pectic acid in 0.01 M tris succinate buffer pH 8, 25 x 10"5 M CaCl2 and 0.2 mg of the enzyme preparation per litre. The extent of degradation was followed by measuring the increase in absorbance at 232 nm. Samples were taken from the reaction mixture after various time intervals, and the absorbance of a suitable dilution of this sample was measured in a Zeiss PMQ II spectrophotometer. The percentage degradation of the pectic acid could be calculated from the ratio between the measured increase in absorbance and the theoretical increase which was measured when all glycosidic bonds were split by the enzyme. The theoretical increase could be calculated from the pectic acid concentration, the DP of the pectic acid and the molar extinction coefficient of unsaturated bonds. In my calculations I used e = 4800; this value is reported by McMillan & Vaughn (1964) for unsaturated digalacturonic acid. After the desired degradation the reaction was terminated by addition of EDTA to bind calcium ions. The entire mixture was then passed over a Dowex 50W (H+) column to convert the uronates to the free acid. The eluate was concentrated to 10%
36

w/v uronic acids. The production of unsaturated monomer was described by Rombouts (1972). When
an optimum amount of the compound had been accumulated in the culture liquid of the Flavobacterium the cells were removed by centrifuging for 30 min at 11000 x g. The supernatant was concentrated 10 times under reduced pressure at about 20 °C. This concentrate was freeze-dried and stored in a vacuum desiccator over silicagel.
The oligogalacturonides were fractionated according to the procedure of Hase-gawa&Nagel (1966). A column of Dowex 1 X8, (200^100) mesh in acetate form was used for the chromatography of the enzyme digest. For separation of saturated oligogalacturonides a typical column measured 30 by 650 mm and had a bed volume of about 490 ml. This column was loaded with 150 ml of the 10% oligouronic acids solutions. After loading the column was washed with distilled water until the eluate showed a negative reaction on uronides in the carbazole assay (see Section 3.1.2). The column was eluted by a linear gradient of 0.2 to 0.8 M sodium acetate buffer at pH 6. The liquid flow diagram is shown in Fig. 3. For separation of saturated oligo-uronides the ultraviolet monitor was not in the system. The reservoirs A and B contained 4000 ml 0.2 M sodium acetate buffer pH 6 and 4000 ml 0.8 M sodium acetate buffer pH 6, respectively. They were connected by a special device (similar to the device in a dropping funnel) for delivering single drops, so the gradient was not interferred with diffusion or convection. The reservoirs were placed in such a way that back flow was impossible. This was obtained by a small difference in level. With aLKB 10200 Perpex peristaltic pump, the liquid from reservoir A was pumped through the column and 20 ml fractions were collected in a LKB 700 Ultrarac fraction collector. Thus the equilibrium between A and B was disturbed and the liquid from reservoir B dropped into the device C from which it was introduced into reservoir A. Here the liquid was mixed by a stirrer. The column was eluted with 80 ml/h. Every fifth fraction was assayed for uronides by the carbazole assay according to Rouse & Atkins (1955). In later work the eluate was analysed continuously by a modified carbazole assay using a Technicon auto-analyser. Good fractionations of mixtures containing dimer through hexamer, with sharp peaks for the dimer, trimer and tetramer were obtained. By applying a 10 litre linear gradient (0.2-0.8 M) pentamer and hexamer were also well separated. Following the method of Nagel & Wilson (1969) I used a linear gradient from 0.2 M to 0.8 M sodium formate pH 4.7 and also observed a better separation.
The column used for separation of unsaturated compounds was 30 x 400 mm and had a bed volume of about 300 ml. This column was loaded with 10 g pectic acid digest. Elution was done with sodium formate buffers pH 4.7 by increasing the concentration stepwise or by a gradient. For separation of unsaturated dimer and trimer the column was first eluted with 1 litre 0.06 M sodium formate buffer pH 4.7, next with 1 litre 0.08 M buffer followed by a 5 litre linear gradient (0.1-0.6 M). For separation of higher unsaturated oligomers, gradient elution was not successful, so a stepwise elution according to the schedule of Nagel & Wilson (1969) was used. The eluate was assayed continuously measuring the absorbance at 240 nm with an ultraviolet monitor (Buchler Uviscan III). Every fifth fraction was also assayed with the carbazole reagent
37

Fig. 3. Apparatus for column chromatographic fractionation of oligogalacturonic acids.
or in later experiments continuously in the auto-analyser. Fig. 3 shows the liquid flow system for operation with ultraviolet monitor and auto-analyser.
The individual peaks from the normal uronides were identified by thin layer chromatography, for the unsaturated compounds paper chromatography was preferred because it allowed separation from saturated compounds. The homogeneous fractions were pooled and concentrated to 20 % of the total volume. Strontium chloride was added in 100% excess. By addition of 4 volumes 92% ethanol the strontium salts of the uronates precipitated. The precipitates were collected by filtration and washed several times with 70% ethanol until the washings were free of chloride ions. The residue was washed successively with 95% ethanol and acetone and finally dried in a vacuum desiccator at 50 °C.
The crude strontium salts of uronides from the same fractions from several fractionations were collected, dissolved in distilled water and converted to the free acids by a column of Dowex 50W (H+). The eluate was loaded onto Dowex 1 X8 in acetate form. The column was washed and the uronides were fractionated by a linear concentration gradient of sodium acetate buffer pH 6. For rechromatography of the dimer and tnmer a 5 litre gradient (0.2-0.6 M) was applied, for the tetramer and pentamer a 6 litre gradient (0.3-0.7 M) and for hexamer a 6 litre gradient (0.5-0.8 M).
Unsaturated dimer was rechromatographed with 2 litre 0.25 M and a 3 litre linear gradient (0.3-0.5 M) of formate buffer PH 4.7; unsaturated trimer with 1 litre 0.3 M and a 3 litre linear gradient (0.3-0.6 M); unsaturated tetramer with 1 litre 0.3 M and a
38

4 litre linear gradient (0.3-0.6 M) and unsaturated pentamer was rechromatographed with 1 litre 0.4 M, 1 litre 0.5 M and a 4 litre linear gradient (0.5-0.7 M). However for rechromatography of unsaturated tetramer and pentamer better results were obtained when a stepwise elution according to Nagel & Wilson (1969) was used. To prevent contamination with impurities which co-chromatographed with the front and tail of the peaks, the middle two thirds of the fractions of good separated peaks were pooled. The uronide was precipitated and washed with 70% ethanol as previously noted. The residue was dissolved in distilled water and converted to the free acid by a Dowex 50W (H+) column. The eluate was concentrated to a thin syrup and ethanol (96 %) was added. A white flocculate appeared. The alcohol and residual water was removed by evaporation. The residue was treated another two times with 96% ethanol and finally refluxed several times with ether, collected by filtration and vacuum-dried at 50 °C.
For the isolation of unsaturated monomer, orientating experiments showed that Dowex 1 X8 in formate form gave better results than the acetate form. Elution with a gradient from 0.02 to 0.1 M sodium formate buffer pH 4.7 was very successful. The fractions were analysed by the carbazole assay and by the periodate TBA test. In the literature (see Section 2.2.3) it is reported that the unsaturated monomer gives a strong periodate TBA test and does not react in the carbazole assay.
For fractionation of the digest of about 10 g pectic acid a column 400 x 30 mm was eluted with a 4 litre linear gradient (0.02-0.1 M). About 90% of the compound was recovered. The fractions, which contained the unsaturated compound, also showed a positive carbazole test. Therefore the fractions were further purified according to the procedure of Preiss & Ashwell (1963). The fractions of the peak were pooled and concentrated under reduced pressure at 20 °C. The compound was converted to the free acid form. The formic acid in the eluate was extracted with ether in a perforator. The ether was removed by evaporation and the residue loaded on a Dowex 1 X8 column in formate form. The dimensions of the column were 300 x 15 mm. Elution was done with a formic acid gradient from 0.02 M to 0.25 M (2 litre). A homogeneous well separated peak was obtained. The fractions of the peak were pooled, concentrated and formic acid was removed by extraction with ether. The aqueous phase was evaporated to remove the ether and a residue of 40 ml was stored in the deep-freeze.
Monomethylmonogalacturonate was prepared by esterification of monogalacturonic acid monohydrate (Messrs. Fluka Ltd., Basel, Switzerland) in methanol-hydrogen chloride according to the method of Chanez & Sag (1959). Before use the monogalacturonic acid was dried for 40 h at 70 °C in a vacuum desiccator over CaCl2. Absolute methanol and a methanolic solution of hydrogen chloride were prepared as described by Vogel (1948). The desired normality was obtained by diluting the methanolic solution of hydrogen chloride with absolute methanol.
The methyl esters of di to hexa galacturonic acids were obtained by esterification of the corresponding pure uronic acid in methanol 0.02 N hydrogen chloride at 2°C. The concentration of the vacuum-dried uronides in the reaction mixtures was 2%. After
39

various reaction times 1 ml samples of the reaction mixtures were titrated with 0.01 N NaOH for estimation of the extent of esterification. After about 170 h no further increase in methylation could be observed. At this time the degree of esterification of the uronides was about 95%. The reaction was stopped by addition of Ag2C03 to neutralize the solution. The suspension was filtered over a charcoal filter bed and the filtrate, which was shown to be free of chloride ions, was evaporated to dryness. Because of the low yield of unsaturated uronic acids with a high purity, a mixture of the compounds was esterified as described above. For the preparation of mono-methyldigalacturonide and monomethyl and dimethyltrigalacturonide, the esterification reaction was stopped by addition of Ag2C03 to the reaction mixtures when these three compounds were esterified to 50%, 33% and 66%, respectively. Further purification of the preparations was obtained by preparative paper chromatography according to the method of Edstrom & Phaff (1964b). Big sheets of Whatman 3 MM paper (46 by 57 cm) were loaded with 200 mg of the crude reaction products and irrigated with a w-propanol, ethyl acetate, water mixture (7:1:2). A strip of the paper was used for localization of the compounds and the parts of the papers which contained the compounds were eluted with water and the eluate evaporated to dryness.
3.1.2 Characterization of the oligogalacturonides
Carboxyl groups were titrated to a phenolphthalein end point with 0.01 N NaOH under nitrogen and by use of a Strohlein microburet. Reducing end-groups were estimated with the iodometric Willstatter-Schudel procedure according to PhafT
966) or a semimicro modification of this method as described by Patel & PhafT (1959), when only a small amount of the preparation was available. Monomer content was quantitatively estimated by reaction with carbazole. Two modifications of this reaction were carried out: the assay according to Rouse & Atkins (1955) and the assay according to McComb & McCready (1952). The Rouse & Atkins modification was also used for assaying the fractions obtained by column chromatography. Both modifications were used because the unsaturated monomer showed a difference in reactivity in both assays.
n in^H R T S C ^ " u m C t h 0 d ° 9 5 5 ) ' 1 m l ° f a P r°Per d i l u t i o n o f ^ e samples was adde? Ah T T S ( 2 5 X 2 0° m m ) a n d °"5 m l o f t h e c a r b a z ° k reagent was waf 0 , t i , 1 - W a S I T d ^ t a k l n g * m l d i s t i U e d w a t e r a s s a m ^ - ^ e - a g e n t bv refluxtr U T o1oC;rbaZOle * PU r i f i ed e t h ano1- ™ s purification was obtafned ^ZZnr r/°^Tnt 8rade Cthan01 Wi* 4 « Zinc dust and ^ ml concen-twat edistm dTr 1 ' ̂ ^ WaS d i S t i" e d i n a n a11 * l a s s *™™^ Next Z7o^^\f r d,ust and 4 8 potassium h^droxide- fiy a d d i t i ° n of the
6 ml at^ o r e S t H . , UlCnt Predpitate WaS f0rmed- With c o n s t a n t agitation 7 Z to obZ ;T P " r ̂ (rCagent grad6) WaS added to e - h of the tubes in ItZ Placed n a w T T ? ^ 8 5 ° C ^ ° f S° l u t i°n)- T h e t e s t t u b - - r e immedi-^ b e ? w e r m i :aT ^ h C a t e d t 0 8 5 ° C a n d ™*--d there for 5 min. Next the
were removed from the water bath and allowed to cool for 15 min in running 40
tap water. The solutions were transferred to a 1 cm cuvette and the extinction was read in a Zeiss PMQ II spectrophotometer at 525 nm. The concentration of anhy-drogalacturonic acid was read from a standard curve made with D-galacturonic acid monohydrate. A standard solution, containing 100 g anhydrogalacturonic acid per ml was prepared by weighing accurately 120.5 mg galacturonic acid monohydrate dried over P205 at room temperature. This amount was transferred quantitatively to a litre volumetric flask, 0.5 ml N NaOH was added and the contents were diluted to volume with distilled water. The solution was thoroughly mixed and allowed to stand overnight.
For continuous analysis in a Technicon auto-analyser the Rouse & Atkins method caused problems because a flocculate formed after the addition of the ethanolic carbazole reagent. Satisfactory results were obtained by dissolving the carbazole in the sulphuric acid. The following procedure was used: a sample stream was diluted with water and to this stream the carbazole sulphuric acid reagent (100 mg carbazole in 1 litre sulphuric acid) was added in the same ratio as in the Rouse & Atkins method, whilst under running tap water. The reaction mixture was heated for about 6 min at 85 °C, and than cooled with running tap water. The colour was continuously measured in a colorimeter at 525 nm and the transmittance was recorded. Good reproducible results were obtained when the carbazole sulphuric acid reagent was refreshed daily. Standards were run regularly and were used to estimate the uronide content of the samples.
Following the McComb & McCready test 2 ml samples (distilled water for the blank) containing 5 to 80 ng saponified galacturonide were added to test tubes containing 12 ml sulphuric acid, previously cooled to 3°C in an ice bath. The tubes were closed, the contents mixed thoroughly and again cooled in an ice bath to below 5 °C. Next the mixtures were heated for 10 min in a boiling water bath. After cooling to about 20 °C, 1 ml of 0.15% ethanolic carbazole reagent was added, mixed thoroughly and the tubes were allowed to stand at room temperature for 25 + 5 min. The absorbance of the reaction mixtures was measured in a Zeiss PMQ II spectrophotometer at 520 nm. The ethanol for the carbazole reagent was purified as in the Rouse & Atkins assay. The concentration of anhydrogalacturonic acid was read from a standard curve for galacturonic acid.
For the analysis of unsaturated oligouronic acids the following procedure was used (Uijttenboogaart, 1970): 10-15 mg compound were dissolved in 10 ml distilled water. Carboxyl groups were estimated by titration of 5 ml of this solution with 0.01 N NaOH to pH 8.2. The pH was measured with a micro-electrode. No phenolphthalein was added because after titration the mixture was made up with distilled water to exactly 25 ml. Of this dilution 0.2 ml was used for estimation of the molar extinction coefficient in the periodate TBA test. Of the original solution 2 ml was used for estimating the reducing end-groups and 1 ml for estimating the molar extinction coefficient at 232 nm. For measuring the ultraviolet absorbance, this 1 ml was diluted to 25 ml, the pH of this aqueous dilution was about 3. The absorptions at wavelength ranging from 220 to 250 nm in a 1 cm cuvette were measured with a Zeiss PMQ II
41
spectrophotometer. Optimum absorption was observed at 232 nm. From the ab-sorbance at this wavelength and the concentration of the unsaturated uronic acid solution the molar extinction was calculated. All measurements were taken at 30 °C.
The periodate TBA test was carried out as described by Rombouts (1972) who discussed this assay in detail and found that this modification gave most satisfactory results.
In paper chromatographic analysis, the descending technique was used. Because of the low Rf values of the compounds in the different solvents, I used a quick paper, Whatman No. 4 and allowed the solvent to drip off the paper for a certain time. For preparative purposes I used Whatman No. 3 MM. For separation of unsaturated oligogalacturonic acids I used: Solvent system A; the epiphase of the ethyl acetate, acetic acid, water (2:1:2) mixture, (Demain & Phaff, 1954). Solvent system B; «-butanol, acetic acid, water (50:12:25) mixture (Preiss & Ashwell, 1963; Fuchs, 1965). In these systems the unsaturated dimer showed the same migration as the saturated monomer, the same was so for unsaturated trimer and saturated dimer etc. For separation of saturated and unsaturated oligogalacturonic acids I used: Solvent system C; ethyl acetate, pyridine, water, acetic acid (5:5:3:1) mixture (Na-gel & Vaughn, 1961). Separation of saturated and unsaturated methyl oligogalacturo-nates was achieved with: Solvent system D; n-propanol, water, ethyl acetate (7:2:1) mixture (Edstrom & Phaff, 1964). These authors showed that this solvent did not separate saturated monomer and unsaturated trimer. Saturated and unsaturated methyl oligogalacturonates were separated by: Solvent system E; «-butanol saturated with water (Edstrom & Phaff, 1964b). Solvent system C was also used for the separation of fully and partially esterified methyl oligogalacturonates.
Before applying the compounds on the paper, the samples were first treated with Dowex 50W (H+) to remove cations. Whatman No. 4 chromatography paper was cut into pieces 15 x 57 cm and on each paper six samples were spotted with a micro-pipette. Every spot contained 100 to 200 ug uronide material. On all paper chromato-grams a reference mixture of saturated or unsaturated oligogalacturonic acids was spotted. These reference mixtures were suitable dilutions of the respective partially purified pectic acid digests. Before irrigations, the papers were equilibrated overnight with 50 ml solvent at the bottom of the tank. All separations were at room temperature.
Spots were made visible by using different sprays. After drying and before spraying, however, the chromatograms were viewed with ultraviolet light at 254 nm (Camag universal ultraviolet lamp) to detect as dark spots unsaturated oligomers other than unsaturated monomer. Compounds with a reducing end-group were detected by spraying with aniline phtalate (ready to use spray can, Merck AG, Darmstadt, W. Germany). The treated chromatograms were heated for 10 min at 105 °C. Red-brown spots on a yellow background appeared. Unsaturated compounds were detected with the thiobarbituric acid spray according to Warren (1960). In this method
42

the chromatograms are sprayed with three solutions: First with a 0.002 M sodium periodate solution, then after 15 min with an ethylene glycol, acetone, sulphuric acid (50:50:0.3) mixture and finally after 20 min with a sodium 2-thiobarbiturate solution. This solution was obtained by suspending 5.2 g thiobarbituric acid (BDH, Poole, England, purity by acidimetric assay not less than 98.5 %) in 70 ml distilled water and 20 ml 2 N NaOH. The suspension was dissolved by heating in boiling water. After cooling the pH was adjusted to 7.0 and the volume to 100 ml. The solution was stored in the dark and refreshed monthly. Any precipitate was filtered off before use. The treated chromatograms were heated for about 10 min at 100°C. Unsaturated breakdown products gave pink spots on a yellow background.
Acidic compounds were detected by the acridine-bromophenol blue spray according to the instructions of IFJU (1964). The chromatograms were first sprayed with a 1.25 % ethanolic acridine (Messrs. Fluka Ltd., Basel, Switzerland) solution. The acidic compounds appeared as yellow spots on a white background. Next the papers were sprayed with 0.04 ethanolic bromophenol blue solution pH 7. The compounds appeared as yellow-green spots on a blue background. This method proved to be very sensitive.
The hydroxylamine ferric chloride reagents were used as sprays to show the position of the carboxylic methyl esters. The first spray was obtained by mixing 1 volume 1 N methanolic hydroxylamine hydrochloride solution (Fluka puriss p.a.) with 1 volume 1.1 N methanolic KOH solution. The hydroxylamine hydrochloride had to be stored in the cold. The mixing was done just before use. After spraying the chromatograms were allowed to dry for 10 min in the air. Next they were spread with an aqueous solution of 1.5 % FeCl3 and 1 % HC1. The esters appeared as blue to purple spots on a yellow background. Attempts were made to find out which carboxyl group in mono-methyl digalacturonide was esterified. If one of the carboxyl groups in digalacturonic acid is more readily esterified than the other, the reaction product after 50 % esterifi-cation will not contain equal amounts of both isomers. A chemical transeliminative degradation of the glycosidic bond should only occur when the esterified carboxyl group is at the reducing end of the molecule. A transeliminative degradation of monomethyldigalacturonate was therefore tried (Romkes, 1970): 10 mg of the partial ester were dissolved in 2 ml 0.1 M Sorensen phosphate buffer pH 6 and heated for 30 min at 90 °C. In previous experiments these conditions were found to be most suitable. The reaction mixture was assayed for transeliminative breakdown by the periodate TBA test. The reaction mixture was also analysed for production of unsaturated compounds or other degradation products by paper chromatography. Before chromatographic analysis cations were removed by a Dowex 50W (H+) treatment. Solvent system B and various sprays were used.
Oligogalacturonic acids were also analysed by thin layer chromatography according to the method of Koller & Neukom (1964). Samples were spotted on a 'Kieselgel G' layer and run with a butanol, formic acid, water mixture (2:3:1). Spots were detected by spraying with 3% sulphuric acid and 0.5% vanilin in ethanol and by heating for 10 min at 100 °C. Uronic compounds appeared as brown spots on a yellow background.
43

This technique was quicker and more sensitive. I tried to find a solvent system for separation of methyl oligogalacturonates on thin layers. The mixture «-propanol, water (7:2) was found to give a good separation, but also partially esterified oligomers migrated near the starting point. With a mixture of n-propanol, water, ethyl acetate (7:1:1) as solvent this migration was reduced to a great extent. Higher Rf values were obtained when instead of /t-propanol, isopropanol was used. Preparative thin layer chromatography of the methyl oligogalacturonates was not successful. Although a good separation was obtained after extraction of a well separated band, this extract was not homogeneous but appeared to be a mixture of partially esterified galacturo-nides.
3.2 Pectin degrading enzymes
Three commercial pectinase preparations were used as source for the isolation of pectin degrading enzymes. Although the 16 commercial pectolytic and 3 cellulolytic enzyme preparations at our disposal were all shown to contain a reasonable pectin lyase activity, Ultrazym 20 (Messrs. Dr. Schubert Ltd., Laufen, Switzerland) and Pektolase FL32 (Messrs. Grindstedvaerket, Aarhus, Denmark) were chosen because of their high activity on high esterified pectin, as shown by Rombouts (1972). The third preparation was Pektosin C, a new type of pectinase preparation from Messrs. Kikkoman Shoyu Co. Ltd., Chiba-Ken, Japan. According to the data of the manufacturers it is a microbial pectin lyase.
All substrates used for assaying pectolytic enzymes were based on commercial pectins from Messrs. Obipectin Ltd., Bischofszell, Switzerland. A pure highly esterified preparation was obtained by saponification and purification of Pink Ribbon pectin (25% esterified) according to the method of Derungs (1958; see also Section 3.1.1) followed by esterification in an absolute methanol-2 N sulphuric acid mixture according to Heri et al. (1961). Fifty-five g purified and vacuum-dried polygalacturonic acid was suspended in 2 litre of this solution, which was previously cooled in an ice bath. The mixture was allowed to stand for 3 weeks at 3 °C under continuous stirring. Every week the methanol-sulphuric acid mixture was replaced by a fresh mixture. Therefore the pectin was collected by filtration, washed with methanol until sulphate free, vacuum-dried at 50 °C and resuspended in fresh methanol-sulphuric acid mixture. The reaction was stopped by filtering the reaction mixture in a Buchner funnel and washing the residue with 92% ethanol until the filtrate was neutral. Finally it was washed successively with 96% ethanol and acetone, vacuum-dried at 50 °C and stored over P205 . This preparation (I) had a degree of esterification (DE) of 95 % and a uronide content of 94 %. After two years the DE changed to 93 %. A less pure preparation was obtained by esterification of purified Brown Ribbon pectin (DE 75 %). The purification consisted of precipitating the pectin with aluminium ions, washing the precipitate with ethanolic hydrogen chloride, followed by washing with alcohol 70% until chloride free and finally with alcohol 96% and acetone. After drying in the air a preparation (II) was obtained with a DE of 95 % and a uronide content of 73 %.
44
Green Ribbon pectin was used for pectin esterase assays and 'sodium pectate' {DE 7 to 10%) for polygalacturonase assays.
The free carboxyl groups of pectins, their degree of esterification and the uronide content of the preparations were determined acidimetrically (Doesburg, 1965).
Pectin preparations with different degrees of esterification were prepared by saponification of pectin I with cold alkali and with enzyme. As indicated by Schultz et al. (1945), Jansen & McDonnell (1945), Solms & Deuel (1955) and Kohn et al. (1968), the pectin preparations prepared by alkaline saponification have a random distribution of free and esterified carboxyl groups while the preparations prepared by enzymatic saponification have a blockwise distribution of both groups.
Pectin was saponified with alkali as follows: 2.5 g pectin I was moistened with some ethanol and dissolved in about 60 ml distilled water by stirring it for about 6 h on a magnetic stirrer. The solution was filtered through a G3 sintered glass funnel (Schott & Gen, Mainz, W. Germany). The beaker in which the pectin solution was made and the filter were washed with 3 portions of distilled water. The filtrate was collected in a 100 ml volumetric flask. The contents of the flask were diluted to volume and 10 ml portions of this solution were pipetted in 25 ml volumetric flasks. These flasks were cooled in an ice bath and an amount of cold 0.1 N NaOH equivalent to the previously calculated amount of ester saponification required was added. After addition of the alkali the solutions were kept at 5°C for one night and then allowed to stand at room temperature for about 24 h. After this period of time, the pH of the solutions was about 8. The contents of the flasks were diluted to volume. Determination of the Diss of these preparations showed that the obtained DEs were in good agreement (± 1 %) with the required values at least for the preparations with DEs higher than 70%. In general the DE values found were higher than expected for the amount of alkali added. This deviation increased with decreasing DE. By measuring the ultraviolet absorbance of the obtained solutions no transeliminative breakdown could be indicated.
Pectin was enzymatically saponified by adding 1 ml orange pulp pectin esterase to 100 ml 1 % pectinl solution. This mixture was kept at 30°C. Pectin esterase was isolated from orange pulp according to the method of McDonnell et al. (1950). By automatic potentiometric titration (Combi Titrator 3 D Metrohm, Herisau, Switzerland) with 0.1 N NaOH the pH was kept at 7.5. When the amount of alkali equivalent to the desired saponification had been added the pectin preparation was recovered by Precipitation and washing. An equal volume of 70% ethanol containing 1.25 M HC1 was used for precipitation. The precipitate was washed 3 times with the same ethanol hydrochloric acid mixture, followed by washing with 92% ethanol until chloride free. Finally the residue was washed with acetone and vacuum-dried at 50 °C. From this preparation 1 % solutions in distilled water were prepared. Determination of the DE of these preparations showed that the values were in good agreement with the expected values (+1 %).
Pectins prepared by saponification with alkali will hereafter be called A pectins or A Preparations. Pectins prepared by saponification with orange PE will hereafter be
45

called E pectins or E preparations. The number average degree of polymerization of pectin preparations I and II were
estimated according to the method of Rombouts et al. (1970a,b). This method was based on the observation that during chemical or enzymatical transeliminative de-polymerization of pectin preparations the reciprocal specific viscosity increased linearly with time as well as with absorbancy at 232 nm. The procedure is described in detail by Rombouts (1972).
3.2.1 Isolation
To follow the purification steps the following assay methods were used. Lyase activity was measured with a Zeiss PMQ II spectrophotometer connected to a Servogor recorder. All data were obtained by taking the initial slope of the curve of the increasing absorbance at 232 nm that was due to the formation of double links at the non-reducing end of the pectin molecule. In general, unless otherwise mentioned, reaction mixtures consisted of 2 ml 0.5 % pectin II in a diluted Mcllvaine buffer of pH 6.5 (2 volumes water, 1 volume buffer), x ml enzyme and 0.5 - x ml distilled water. The reaction temperature was kept at 30 °C by thermostating the cuvette housing by circulating water of a water bath.
Pectin depolymerization was assayed viscosimetrically. The reaction mixtures consisted of 10 ml 0.5 % pectin II solution adjusted to pH 3.5 or 10 ml 0.5 % pectin II solution in diluted Mcllvaine buffer pH 6.3, x ml of a proper enzyme dilution and 2-x ml distilled water. The amount of enzyme was chosen so that viscosity was reduced to 50 % in about 30 min. The activity was expressed as the amount of protein necessary to reduce the viscosity to 50 % in 30 min.
With the viscosimetric assay, and also by measuring increase in reducing end-groups the activity of both pectin lyase and polymethylgalacturonase was estimated. However with these measurements it was not possible to distinguish between the two types of activity. Only lyases increase the ultraviolet absorbance at 232 nm. By expressing this absorbance in moles reducing end-groups and by comparing this value with measured increase in reducing end-groups a qualitative or even quantitative conclusion about the degree of lyase (hydrolase) purity can be made. I o calculate the increase in reducing end-groups from ultraviolet measurements the molar extinction coefficient (e) of the double link in a pectin molecule must be known. By measuring the activity of a purified lyase preparation with the ultraviolet assay and the iodometric reducing end-groups assay, Edstrom & Phaff (1964a) estimated a value of 5550. Unfortunately most end-group methods are not accurate enough for this purpose, except perhaps the chlorite method which, however, is extremely laborious (Voragen et al., 1971a).
Another possibility lies in the relationship between increase in absorbance at 232 nm and decrease of specific viscosity, as described by Rombouts et al. (1970a,b) for a pectic acid lyase preparation. These authors observed a linear increase of reciprocal specific viscosity against AA at 232 nm. Based on this observation they developed a
46
method for the determination of the number average degree of polymerization of pectic substances, which also allows conclusions regarding the purity of the enzyme used. By studying the degradation of high ester pectin with pectin lyase I observed the same relationship. According to the following procedure, enzyme preparations were examined for the presence of polymethylgalacturonase: 15 ml 0.5% pectin II solution, previously centrifuged for 30 min at 48000 x g and filtered over a G3 sintered glass filter, 10 ml citrate phosphate buffer pH 6.5, 0.3 M in respect to citrate and 5 ml of a suitable enzyme dilution were mixed. 24 ml of this reaction mixture was divided over two Ubbelohde glass capillary viscosimeters, immersed in a water bath at 30°C. The viscosity was read periodically until the specific viscosity had decreased to less than half the original value. The remaining 6 ml reaction mixture were used to measure the increase in ultraviolet absorbance over the same period of time. From this data and the initial DP of the pectin substrate conclusions regarding the purity of the enzyme preparation could be made.
Pectin esterase (PE) was assayed by automatic potentiometric titration (Metrohm Combi Titrator 3D) of a 1 % solution of Green Ribbon pectin (DE 63 %). The addition of 0.01 N NaOH necessary to maintain the predetermined suboptimum pH value of 4.5 was recorded and the activity was calculated from this curve. As a qualitative test I also used the colour change in a mixture of 2.4 ml 1 % Green Ribbon pectin solution, 0.5 ml bromophenol blue (6 mg % in water) solution and 0.1 ml enzyme solution. All solutions were adjusted to pH 4. The enzyme was added after equilibration of the solution at 30°C in a 1 cm cuvette. It had to be dialysed as the presence of buffer salt would influence the pH shift. The decrease in absorbance could then be measured at 595 nm (Grassl & Moelering, 1968).
Pectic acid lyase (PAL) and polygalacturonase (PG) were assayed together viscosi-metrically. The reaction mixture consisted of 6 ml 0.5 % sodium pectate, 4 ml citrate phosphate buffer pH 4 or 7, 0.3 M in respect to citrate, x ml enzyme and 2-x ml distilled water. .
AH viscosity measurements were done with calibrated Ubbelohde viscosimeters immersed in a water bath at 30°C. The water values of this viscometer were about 30 sec. At recorded time intervals, flow was measured with a 0.1 second stop watch. Protein contents were measured by the method of Warburg and Christian (Layne, 1957).
Purification operations consisted of: 1. Adsorption chromatography on calcium phosphate gel. This gel was prepared according to the procedure of Keilin & Hartree (1938). A 3 % w/v suspension in water was obtained from BDH Chemicals Ltd., Poole, England. The gel particles were collected by centrifuging in a clinical centrifuge and added to a dialysed enzyme solution. After stirring for 20 min, the gel was collected by centrifuging. The supernatant was about free of pectin lyase activity but very active in PE and rich m other proteins. The gel was washed with phosphate buffers at pH 7 of increasing molarity. Each treatment included stirring for 20 min followed by centrifuging. 2- Ion exchange chromatography on DEAE Sephadex A25. The exchanger was
47

prepared for chromatography according to the manufacturers recommendations. A typical column measured 600 by 20 mm. A linear gradient in pH and sodium chloride concentration was applied for elution. The elution velocity was 40 ml/h, 10 ml fractions were collected. 3. Gel filtration on a Sephadex G100 (fine) column (1000 by 10 mm) was also carried out. The column was equilibrated with 0.05 M phosphate buffer pH 7 and after loading with 2 ml enzyme concentrate the column was eluted with the same buffer. The elution velocity was 10 ml/h, 5 ml fractions were collected. 4. Desalting of enzyme preparations was usually done by dialysis against tap water in cellophane tubing. The aqueous extract of the Ultrazym 20 preparation was desalted on a Sephadex G25 (coarse) column. This column measured 800 by 30 mm and had a void volume of about 150 ml. Per run about 110 ml enzyme solution was introduced at the top of the column and eluted with distilled water (40 ml/h) and 10 ml fractions were collected. All the purification operations described were carried out at temperatures not exceeding 5 °C. In column chromatography operations the protein concentration of the eluate was estimated by measuring the ultraviolet absorbance at 280 nm with the Uvicord II type LKB 8300A which was connected with a Chopper Bar recorder type LKB 6520 for registration. Fractions were collected in an Ultrarac type LKB 700 fraction collector. Enzyme solutions were concentrated by lyophilization or by evaporation in a rotating vacuum evaporator. The temperature of the heating bath was kept at 20 °C, the condensor below — 5°C.
3.2.2 Characterization
The purified enzyme preparations, which showed only one pectin degrading activity were subjected to disc polyacrylamide gel electrophoresis in a Shandon analytical polyacrylamide electrophoresis apparatus according to the method described by Davis (1964). Electrophoresis was carried out in tris glycine buffer pH 9.5 (12.5 IDM). Samples of enzymes containing 100-300 ug protein were used for each run. During electrophoresis the temperature did not exceed 5°C. After electrophoresis, the gels were removed from the tubes. The position of the enzymes was detected by segmenting the gel in 0.25 cm high cylinders and extracting the 20 segments thus obtained in 0.5 ml 0.1 M citrate phosphate buffer pH 5.5 for one night at 5 °C. These extracts were assayed for enzyme activity. A duplicate gel was immersed in a fixative stain solution (0.5% Amido Schwarz in 5% trichloroacetic acid) for at least 2 h. Then this fixative stain solution was decanted and the gels were destained, washed and stored in a 7% glacial acetic acid solution.
The isoelectric point of the enzymes was determined by gel electrofocusing according to the method described by Wrigley (1969). Before use the enzyme preparations were thoroughly dialysed against running tap water. Varying amounts of the enzymes were applied on the gels. During electrophoresis the temperature was held at about 5°C. The voltage was gradually increased from 100 mV to 350 mV maintaining a maximum current of 1 mA per tube. The total time for a run varied from 2 to 4 h. The position
48
of the enzymes was detected as described for gel electrophoresis. A duplicate gel was stained with Amido Schwarz. Before this was done the carrier ampholytes were removed by repeated washing in a 7 % trichloroacetic acid solution. A triplicate gel, loaded with enzyme, was segmented and the segments extracted with 0.5 ml distilled water each for 24 h. From these extracts the pH was measured with a micro-electrode. In this way the pH gradient over the gel was estimated.
According to the Enzyme Commission of the International Union of Biochemistry one unit of enzyme is defined as that amount which will catalyse the transformation of 1 umol of the substrate per min under standard conditions. Furthermore this commission suggested that these standard conditions be at 30 °C and in an optimum chemical environment, incl. pH and substrate concentration. This definition of a unit of enzyme activity assumes zero-order kinetics (Finlayson, 1969). It is therefore reasonable to assay an enzyme in conditions when the reaction is zero-order because under these conditions the reaction rate is constant (i.e. Vmax). There are however some situations in which it is impossible to make use of zero-order conditions, for example when the assay method is limited, or the substrate is difficult to obtain or in cases of substrate inhibition. In such cases Finlayson (1969) advised to work in the concentration range corresponding to first-order kinetics and to calculate Vmax from the measured activities. Based on this maximum reaction velocity (Vmax) the amount of enzyme can then be expressed in units recommended by the Enzyme Commission.
Edstrom & Phaff (1964a) defined 1 unit of pectin lyase activity as that amount which releases 1 ueq of aldehyde groups per min at pH 5.2 and 30°C from pectin M in 0.1 M sodium acetate buffer. The release of 1 ueq of aldehyde groups in a 10 ml reaction mixture was found to be equivalent to an increase of 0.555 in the absorbance at 235 nm in a 1 cm cell. Albersheim (1966) defined 1 unit of pectin lyase activity as the amount which catalyses an increase in absorbance at 235 nm in a 1 cm cell of 0.555 during a one minute period at pH 5.2 and 25 °C. As substrate he used commercial citrus pectin (pectin NF, 68% esterified, Sunkist Growers, Inc., Corona, California USA) in phosphate citrate buffer. Pectin M is prepared by treating pectin NF with yeast endo PG. In this way they obtained an improved substrate that was less viscous and had improved spectral properties. However in the lyase assay used by Albersheim the total volume of the reaction mixture was 2.1 ml, so the unit he defined was 4.76 times smaller than that used by Edstrom & Phaff (1964a) i.e. his unit forms 0.21 ueq of double bonds per min instead of the usual 1 ueq.
The unit defined by Edstrom & Phaff (1964a) does not conform to the recommendations of the Enzyme Commission because the substrate they used was not optimal But the pH of the reaction mixture in which they carried out their assay was optimal for the kind and the concentration of the substrate used. From the results of my studies it appears that the optimum conditions for the lyases depend on the Dt ana on the concentration of the substrate (See page 85).
I therefore used the Vmax values estimated by extrapolation of Lineweaver & Burk Plots (L-B plots) for infinite substrate concentrations for the cal cula tion ofthe enzyme units. For the pectin lyases described here this has the advantage that differences
49

in the degree of esterification of the substrate do not influence the unit because for all substrates studied the same optimum conditions were found and the same Vmax values were extrapolated. These optimum conditions were reached in the citrate phosphate buffer system in the pH range 6-6.5. The units used here are based on Vmax estimated for pH 6.5.
In my opinion a more comparable unit is obtained in this way and excludes differences in the DE of the substrate. The influence of the degree of polymerization of polymer substrate on the Vmax value is still unknown; this effect requires further study.
The optimum pH values of the different lyases were estimated in citrate phosphate buffers with pectin I as substrate. Buffers of various pH were obtained by adjusting the pH of sodium citrate solutions with orthophosphoric acid. The final concentrations of the buffers were 0.1 M with respect to citrate. The reaction mixtures consisted of 2.4 ml of the buffer, 0.1 ml enzyme and 0.5 ml 0.5 % pectin solution. The pH of the reaction mixture was checked immediately after the activity measurement. The enzyme activity was also measured in this buffer system at pH 6.5 with varying molarity of citrate.
The influence of some buffer systems was studied by estimating the activities of the lyase preparations in different buffer systems as a function of the pH. The following systems were examined: 1. phosphate citrate buffers (Na2HP04 solution adjusted to pH with citric acid, end-concentration 0.1 M with respect to Na2HP04); 2. tris citrate; 3. tris HC1; 4. tris succinate and 5. tris acetate buffers (all obtained by adjusting the pH of a tris solution with the respective acid, the final concentration of tris was 0.1 M). The optimum values were also examined on A and E pectins. As buffer system 0.1 M tris succinate was used because of its broad pH range.
To study the pH stability of the pectin lyase preparations 0.1 ml of the enzymes were added to 2.4 ml phosphate citrate buffer portions. These mixtures were incubated at 38 °C, a temperature chosen arbitrarily to accelerate inactivation and shorten incubation time. After 5,10,15,20,25 and 30 min, 0.5 ml of a 0.5 % pectinl solution, previously equilibrated at 38 °C were added to the buffer enzyme mixtures and immediately assayed for lyase activity at 38 °C. From these measurements the residual activities were calculated as % of the original activities. To determine the energy of activation (EA) of the enzymes, the reaction velocity has to be measured at various temperatures. EA can be obtained by plotting the reaction velocities as a function of the reciprocal absolute temperature (Arhenius plot). The slope of the curve, multiplied by -2.303 R (gas-constant) gives the energy of activation. To make sure of a good substrate-enzyme ratio at each temperature I used Vmax as reaction velocity. This value being the maximum velocity at infinite substrate concentration. Vmax was estimated by constructing Lineweaver-Burk plots. The data for the L-B plots were
50

obtained by measuring the initial reaction velocity in the following reaction conditions; 2.4 ml 0.1 M citrate phosphate buffer pH 6, 0.5-x ml 0.5% pectin I solution, x ml distilled water and 0.1 ml enzyme. The substrate concentration ranged from 4 mM to 0.8 mM/1 and is expressed as anhydrogalacturonide monomers. The temperature was varied between 11 and 47 °C.
The influence of cations on the activity of the lyase preparations was studied as a function of the various substrates and the pH. The reaction mixture consisted of 0.25 ml 1 % pectin I solution, 2.65 ml tris succinate buffer with varying amounts of cations and 0.1 ml enzyme. The final concentration of the buffer was 0.1 M with respect to tris. The cations studied were Ca2+, Mg2+ and Sr2+, these cations were added as chloride salts. The CaCl2 concentrations examined were 5.0; 7.5; 10.0; 15.0 and 30.0 x 10~2 M in the reaction mixture. MgCl2 and SrCl2 were only examined at the 10.0 x 10~2 M level. For the kinetic study on the influence of the degree of esterification and the distribution of free and esterified carboxyl groups pectin lyase activity was measured in reaction mixtures (3 ml) which were 0.08 M with respect to citrate phosphate buffer (calculated on citrate) and 8 to 1.6 mM in galacturonide monomers. To these reaction mixtures known amounts of pectin lyase units were added. In some cases the substrate concentration was increased to 34 mM/1. The Am and Vmax constants were obtained from the double reciprocal plots of Lineweaver & Burk.
Information on the breakdown mechanism was obtained from the relationship between increase in optical density and reciprocal specific viscosity. A buffered 0.25 % pectin II solution was treated with the lyase preparations and increase in absorbance and viscosity reduction were estimated as mentioned before.
The extent of degradation of various pectin substrates was estimated by measuring the total increase in absorbance at 232 nm obtained with an excess of pectin lyase. The reaction mixtures contained 16 mM galacturonide monomers (pectin I) and a known amount of enzyme units in 0.04 M tris succinate buffers of various pH values. These mixtures were incubated at 30 °C. After 24 and 48 h the mixtures were filtered over a special membrane ultra filter Co 5 (Membran Filter Gesellschaft GmbH, Gottingen, W. Germany) to remove micro-organisms. After 48 h an additional amount of enzyme was added and the incubation was continued until no further increase in optical density could be observed which was 72 h. At that time the reaction mixtures were diluted to measure the optical density. The blank value was obtained by adding inactivated enzyme to the substrate solutions. Enzyme solutions were inactivated by boiling for 5 min.
The course of the degradation of pectinl was studied by paper and thin layer chromatographic analysis of intermediate samples of the reaction mixture. The samples Were t a k en after reaction times which were multiples of the t \ value.
Lyase activity on methyl oligogalacturonates were examined in (3 ml) reaction mixtures containing 12 mM of the oligomer esters (expressed as galacturonide mono-mers) and known amounts of pectin lyase units in 0.08 M citrate phosphate buffer P H 6- After measuring the increase in optical density a drop of toluene was added for
51
conservation. This reaction mixture was incubated at 30 °C and after 24 h another portion of enzyme was added. The reaction was stopped after 50 h by addition of Dowex 50W (H+). In this mixture the reaction products were analysed by chromatographic analysis (see page 42). Samples taken during and after enzymatic degradation of the various pectins and oligomer substrates were treated with Dowex 50W (H+) to remove cations. After removal of the ion exchanger by filtration the filtrates were lyophilized. The residue was dissolved in a small volume of water and from these solutions sufficient amounts were spotted on chromatography paper. The papers were run with solvent systems D or E (see page 42) for separation of esterified oligo-galacturonides. The residues of the sample solutions were saponified in the cold (0°C) by addition of a three-fold excess of a cooled 1 N sodium hydroxide solution. After 3 h the reaction mixture was kept at room temperature for 2 h. Next the sodium ions were removed by a Dowex 50W (H+) treatment in batch, the solutions lyophilized and the residues dissolved in a small volume of water. From this solution sufficient amounts were spotted on chromatography paper and thin layer plates for separation of oligouronic acids.
52

4 Results
4.1 Oligogalacturonides
4.1.1 Isolation
Degradation of pectic acid with Pectinase 2 LM yielded mixtures of oligogalacturonides. The composition of these digests varied with reaction time. Fig. 4 shows the composition of some digests as a function of multiple t \ times as was found by thin layer chromatography. This chromatogram shows a gradual decrease of the DP of the oligomers with increasing reaction times and the production of monogalacturo-nic acid from the beginning of degradation. This can be explained by the presence of endo and exo PGs in this enzyme preparation. Because of the action of exo PG this preparation is not suited to the selective production of large amounts of digalactu-ronic and trigalacturonic acid. In these circumstances the production of these compounds which needs long incubation times, is accompanied by the production of large amounts of monogalacturonic acid. The enzyme preparation was used with success
o o o o o o o 0 o 0
Ref
o o o o G>
2
0
o o a a o o o ©
5
0
o
o
O o o o
0
10
O • O
O O
o Ref
0
o 0
-'£) 20
o o
o ©
0 30
o o
Q
Q 40
o o ©
0 50
o o o o o 0 o o o © Ref
mono
di
tri
tetra
pento. hexa
hepta
octa nona
Fig. 4. Thin layer chromatogram showing the composition of pectic acid digests obtained by degradation with Pectinase 2 LM after various reaction times (expressed as multiple t } values).
53

for the production of series of oligouronides with DPs ranging between 2 and 8. For a more selective production of digalacturonic and trigalacturonic acid I used the Rohament P preparation. After a reaction time of 30 x t i time, the enzyme preparation had produced mono, di and tri galacturonic acid. The dimer and especially the trimer were produced in larger amounts as was the case with the Pectinase 2 LM preparation. The monogalacturonic acid was removed from this mixture by precipitation of its sodium-strontium salt.
The separation of some oligouronic acids mixtures by ion exchange chromatography on Dowex 1 (acetate) columns is shown in Figs. 5a and 5b. Fig. 5c represents the elution pattern of the rechromatography of some pooled tetragalacturonic acid fractions. The middle two thirds of the fractions of the peak were pooled, and from this solution the pure tetramer was obtained (see Section 3.1.1). By a similar procedure pure oligouronic acids (dimer up to and including hexamer) were obtained.
The unsaturated oligomers were formed by degradation of pectic acid with endo pectate lyase. The maximum increase in optical density at 232 nm that could be measured in this reaction mixture was 32. Assuming a molar extinction coefficient of 4800, this increase corresponds with the liberation of 6670 ueq reducing end-groups. The original reaction mixture contained 0.5 % of a pectic acid preparation which had a uronide content of 77% and a number average degree of polymerization of 45. This means that the original reaction mixture contained 490 ueq reducing end-groups and 22000 ueq anhydrogalacturonic acid units. Thus it can be calculated that 6670/(22 000 - 490) x 100% = 31 % of the glycosidic linkages are split by the lyase. Because this enzyme acts randomly, this percentage degradation indicates a reaction mixture containing unsaturated trimer in particular as well as unsaturated dimer and unsaturated oligomers with a higher DP. Paper chromatographic analysis of the reaction mixture (with solvent system C) showed about equal amounts of unsaturated dimer and trimer and smaller amounts ofunsaturated tetramer, pentamer and hexamer. A so some monogalacturonic acid was produced. For the preparation ofunsaturated tetramer pentamer and hexamer, pectic acid was degraded to 16%. This digest contained especially unsaturated pentamer and hexamer and smaller amounts of unsaturated tetramer.
The mixtures were fractionated on Dowex 1 (formate) columns by a stepwise elution according to the schedule of Nagel & Wilson (1969). Fig. 6a represents the elution pattern of a pectic acid digest (about 25% degradation) obtained by this
T n l U r e ' J ? a r a t l , ° n ° f U n s a t u r a t e d d i m e r and trimer by a combination of stepwise and gradient elution is shown in Fig. 6b. The compounds from the first fractionation were rechromatographed. Figures 6c and 6d show the elution pattern of he rechromatography ofunsaturated dimer and trimer respectively. The rechro-waTn^t" ° f
fUrr r a t ed tCtramer ^ PCntamer aS - ^ i o n e d inSection 3-1.1
S ) wasTd WCre aChiCVed WhCn thC SChedule ° f Na*el & Wilson
o n S t T n f eCati°n ° f !hC T a t U r a t e d m ° n 0 m e r °Q a D o w e x l ( formate) column in an orientating experiment is shown in Fig. 7a. Elution was done with a linear concentra-
54

7000
3000
250 , 300 fraction No.
Fig. 5. Elution patterns of saturated oligogalacturonic acids on Dowexl (acetate) columns. a. Fractionation of oligogalacturonic acid mixture prepared with Pectinase 2 LM. Elution with a 10 litre linear gradient (0.2-0.8 M) of sodium acetate buffer pH 6. b. Fractionation of oligogalacturonic acid mixture prepared with Rohament P. Elution with an 8 litre linear gradient (0.2-0.6 M) sodium acetate buffer pH 6. c Rechromatography of pooled tetramer fractions. Elution with a 6 litre linear gradient (0.3-0.6 M) sodium acetate buffers. Concentration is expressed in (xg anhydrogalacturonic acid per ml.
55
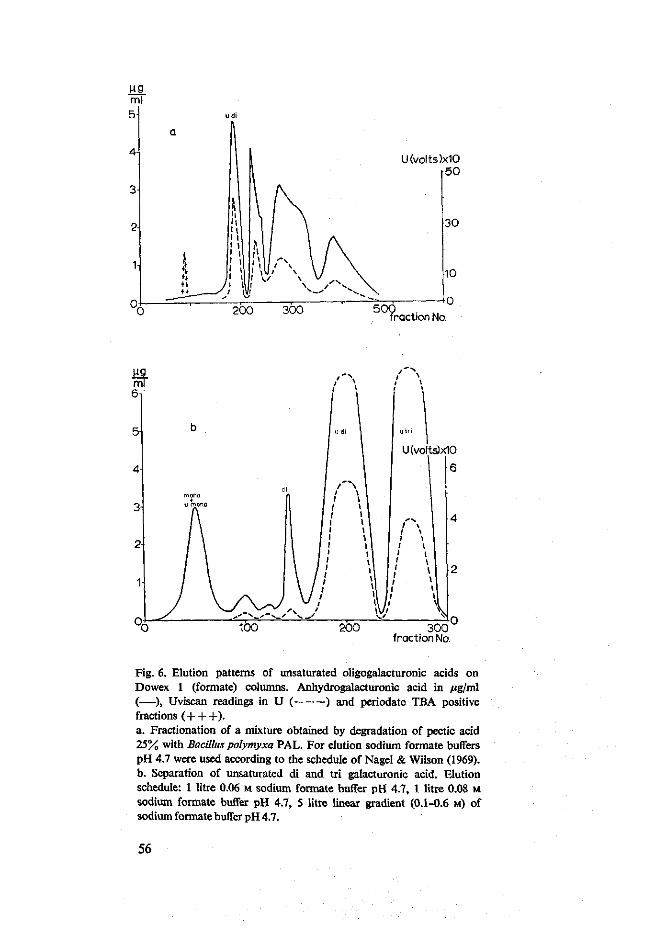
U(volts)x10 50
raction No.
300 fraction No.
Fig. 6. Elution patterns of unsaturated oligogalacturonic acids on Dowex 1 (formate) columns. Anhydrogalacturonic acid in ^g/ml (—), Uviscan readings in U ( ) and periodate TBA positive fractions (+ + +) . a. Fractionation of a mixture obtained by degradation of pectic acid 25% with Bacillus polymyxa PAL. For elution sodium formate buffers pH 4.7 were used according to the schedule of Nagel & Wilson (1969). b. Separation of unsaturated di and tri galacturonic acid. Elution schedule: 1 litre 0.06 M sodium formate buffer pH 4.7, 1 litre 0.08 M sodium formate buffer pH 4.7, 5 litre linear gradient (0.1-0.6 M) of sodium formate buffer pH 4.7.
56
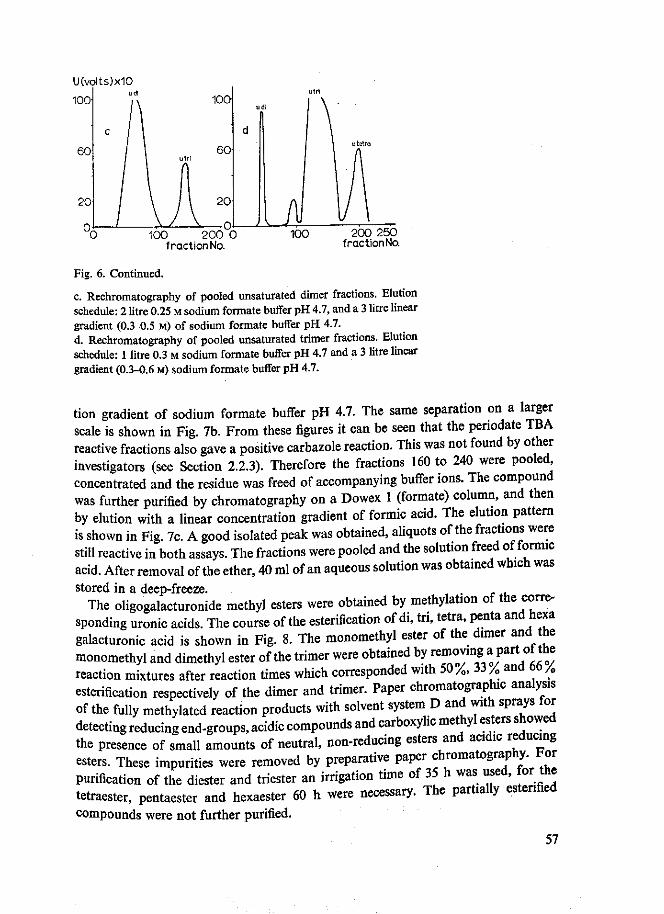
U(volts)x10
100-
100 200 0 f raction No.
200 250 fraction No.
Fig. 6. Continued.
c. Rechromatography of pooled unsaturated dimer fractions. Elution schedule: 2 litre 0.25 M sodium formate buffer pH 4.7, and a 3 litre linear gradient (0.3-0.5 M) of sodium formate buffer pH 4.7. d. Rechromatography of pooled unsaturated trimer fractions. Elution schedule: 1 litre 0.3 M sodium formate buffer pH 4.7 and a 3 litre linear gradient (0.3-0.6 M) sodium formate buffer pH 4.7.
tion gradient of sodium formate buffer pH 4.7. The same separation on a larger scale is shown in Fig. 7b. From these figures it can be seen that the periodate TBA reactive fractions also gave a positive carbazole reaction. This was not found by other investigators (see Section 2.2.3). Therefore the fractions 160 to 240 were pooled, concentrated and the residue was freed of accompanying buffer ions. The compound was further purified by chromatography on a Dowex 1 (formate) column, and then by elution with a linear concentration gradient of formic acid. The elution pattern is shown in Fig. 7c. A good isolated peak was obtained, aliquots of the fractions were still reactive in both assays. The fractions were pooled and the solution freed of formic acid. After removal of the ether, 40 ml of an aqueous solution was obtained which was stored in a deep-freeze. .
The oligogalacturonide methyl esters were obtained by methylation of the corresponding uronic acids. The course of the esterification of di, tri, tetra, penta and hexa galacturonic acid is shown in Fig. 8. The monomethyl ester of the dimer and he monomethyl and dimethyl ester of the trimer were obtained by removing; ai part:ot the reaction mixtures after reaction times which corresponded with 50%, 33 /„ and bo /„ esterification respectively of the dimer and trimer. Paper chromatographic analysis of the fully methylated reaction products with solvent system D and with sprays for detecting reducing end-groups, acidic compounds and carboxylic methyl esters showed the presence of small amounts of neutral, non-reducing esters and acidic reducing esters. These impurities were removed by preparative paper chromatography. For purification of the diester and triester an irrigation time of 35 h was used, for the tetraester, pentaester and hexaester 60 h were necessary. The partially estenfied compounds were not further purified.
57
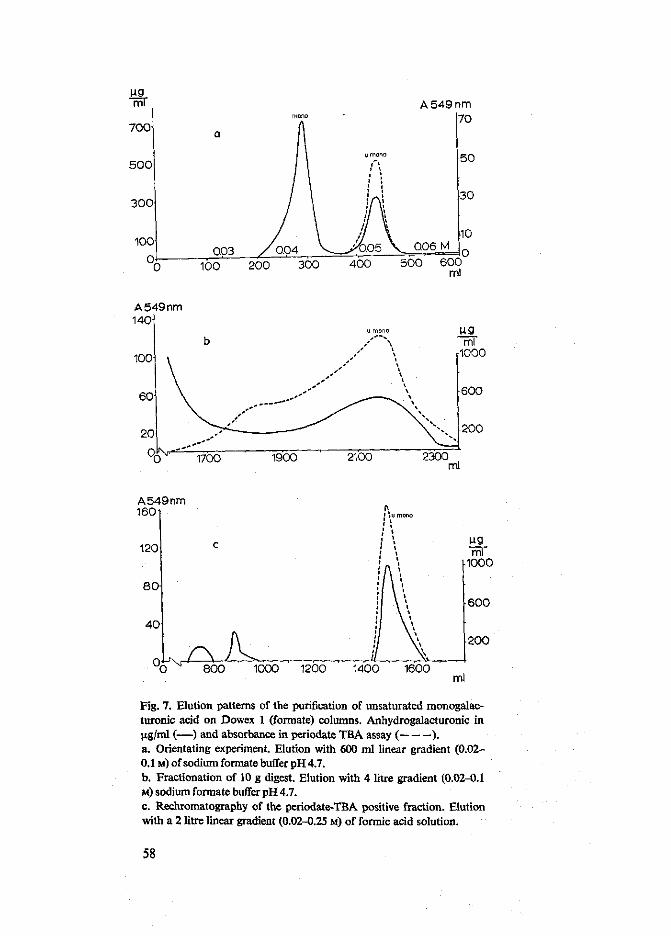
A 5 4 9 n m r70
100 200 300 4 0 0 5 0 0 600 ml
A 5 4 9 n m 140
100-
A549nm 160i
120
8 0
4 0
ru °0J 800 1000 1200
iu mono i
t l i i I I
. 1 \ I
1 1 I 1 \ 1 \ 1 \ \ \ * \ \ \ \ \ \ \ \ \ \
ml 1000
6 00
200
1400 1600 ml
Fig. 7. Elution patterns of the purification of unsaturated monogalac-turonic acid on Dowex 1 (formate) columns. Anhydrogalacturonic in (jig/ml (—) and absorbance in periodate TBA assay ( ). a. Orientating experiment. Elution with 600 ml linear gradient (0.02-0.1 M) of sodium formate buffer pH 4.7. b. Fractionation of 10 g digest. Elution with 4 litre gradient (0.02-0.1 M) sodium formate buffer pH 4.7. c. Rechromatography of the periodate-TBA positive fraction. Elution with a 2 litre linear gradient (0.02-0.25 M) of formic acid solution.
58
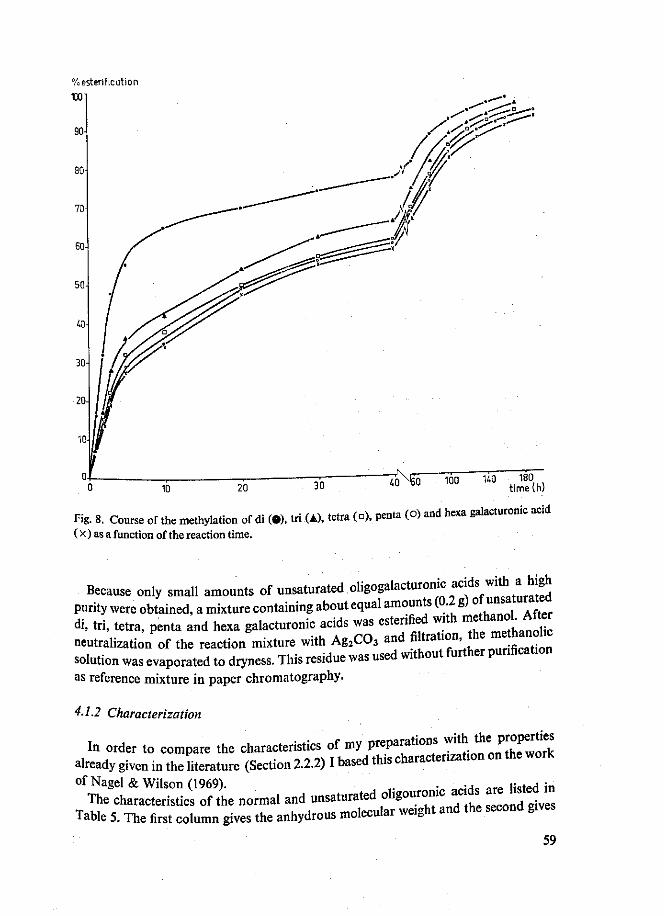
% esterification
100
40X|60 100 1W L.m, time (h)
Fig. 8. Course of the mediation of di (•). tri (A), tetra (a), penta (o) and hexa galacturonic acid
(x) as a function of the reaction time.
Because only small amounts of unsaturated oligogalacturonic ;acids withi ahigh purity were obtained, a mixture containing about equal amounts (0.2 g) ° ^ ™ « ) di, tri tetra, penta and hexa galacturonic acids was - ^ ^ t ^ S neutralization of the reaction mixture with Ag2C03 and fljtrail°n' r ; f i r a t i o n
solution was evaporated to dryness. This residue was used without further purification
as reference mixture in paper chromatography.
4.1.2 Characterization
In order to compare the characteristics of my preparations with_ t h e i p ^ already given in the literature (Section 2.2.2) I based this characterization on the work
of Nagel & Wilson (1969). ,. . . . .„ , 1 k t p d i n
The characteristics of the normal and unsaturated ohgouronic acids aictotedm Table 5. The first column gives the anhydrous molecular weight and the second gives
59

Table 5. Characteristics of saturated and unsaturated oligogalacturonic acids.
Compound
Saturated mono* di tri tetra penta
Unsaturated di tri tetra
194 370 546 722 898
352 528 704
Equiv. weight
219 435 658 758
1000
419 558 788**
Moles H20/mol Cpd
1.5 3.6 6.2 1.4 5.6
3.7 1.7 4.6
COOH/CHO Purity
1.05 2.03 2.92 4.0 5.10
2.04 2.90 3.7
105 101.5 97.3
100 102
102 97 92.3
* Obtained from Messrs. Fluka Ltd., Basel, Switzerland ** Determined from monomer content
the equivalent weight as determined from the end-group assay. From the difference between the experimental and calculated molecular weight the water content was determined. These values are listed in the third column. The fourth column shows the ratios of carboxyl to aldehyde group content. The same ratios were found for the monomer content to aldehyde group content. The degree of purity is given in the fifth column. These values indicate the percentage agreement between the theoretical and experimental DP.
In Table 6 the molar absorptivities (e) in the ultraviolet assay and the periodate TBA assay are listed.
Paper and thin layer chromatography showed that the preparations were homogeneous and free of contaminating impurities. Table 7 shows the results of the chromatographic analysis. In this table the Rgal values, obtained with different solvent systems, of the normal and unsaturated oligomers are listed. To get evidence for the
Table 6. Molar extinction coefficients (e) of the unsaturated compounds in ultraviolet (232 nm) and periodate TBA assay.
Compound e ultraviolet ultraviolet periodate TBA (Nagel & Wilson, 1969)
monomer dimer trimer tetramer
5500 5575 5100
78750 3800 6675
10400
5750 5475 5725
60

homogeneity of the homologous series of saturated and unsaturated oligogalacturo-nides, RM[RM = logO/.fy - 1)] was plotted against the theoretical DP of each compound. These relationships are shown in Fig. 9. The data in Fig. 9 and Fig. 11
Table 7. Rgai values obtained with solvent A, solvent B and solvent C.
Saturated monomer dimer trimer tetramer pentamer hexamer
Unsaturated monomer dimer trimer tetramer pentamer hexamer
A
1 0.69 0.50 0.34 0.215 0.14
1 0.69 0.50 0.34 0.215
A*
1 0.65 0.45 0.30 0.20 0.12
1 0.65 0.45 0.30 0.20
B
1 0.25 0.07 0.025
1.76 0.50 0.17 0.06
0.025
B*
1 0.30 0.11 0.004
0.50 0.18 0.07
c
1 0.44 0.19 0.07
1.40 0.89 0.44 0.19 0 07
C*
1.35 0.89 0.54 0.31 0.165
A*: Rgai values reported by Wilson (1969) B*: Rgai values reported by Nagel & Anderson (1965) C*: Rgai values reported by Fuchs (1965)
16H
1.0
0.4
-0.2J
-0.8
Pv 0 2 3
F i e 9 Relationship between the DP and the RM J s l f a t e d and unsaturated ° ^ ™ c acids shown for solvent system A (A), B (•) and C (X). Curves marked with u were found for
6 p unsaturated compounds.
61

0
0
0
0
0
0
0
0
0
0
mono
di
tri
tetra
pento
0
-®—o
0 di
0 tr
0 0
i 0
tetra
penta
Fig. 10. Thin layer chromatograms showing the separation of methyl oligogalacturonates. a. Solvent: n-propanol, water mixture (7:2) b. Solvent: n-propanol, water, ethyl acetate mixture (7:2:1). Both plates were irregated twice.
were obtained using monomer as reference compound (Rgal; RMegai)-The saturated oligogalacturonide methyl esters were analysed by paper chromato
graphy. They were shown to be neutral reducing esters. A quick and sensitive technique for controlling the purity of the preparations proved to be thin layer chromatography. Fig. 10 shows two typical chromatograms of the purified esters, in one case (Fig. 10a) a H-propanol, water mixture (7:2) was used as solvent system, and in the other (Fig. 10b) a n-propanol, water, ethyl acetate mixture (7:1:1). Both plates were irrigated twice with the respective solvent. Near the starting point weak spots of impurities could still be detected, these impurities moved faster in the «-propanol, water mixture. The intensity of these spots was weak when samples of fresh aqueous solutions of the esters were analysed, but increased when these solutions were kept for some weeks. Probably the compounds are not stable because of saponification of the methyl ester groups. I tried to purify the reaction products of the methylation by preparative thin layer chromatography. Well separated bonds were obtained, but after extraction of the particular compounds with water or methanol and evaporation of these extracts the obtained residues were not homogeneous but appeared to be mixtures of partial esters.
Unsaturated oligogalacturonide methyl esters were available in a mixture and were only characterized by their RMegal values in paper chromatographic analysis. Table 8 summarized the RMegal values for these compounds. The relationship between RM and theoretical DP is shown in Fig. 11.
The monomethyl ester of digalacturonic acid and the monomethyl and dimethyl ester of tngalacturonic acid were analysed by paper chromatography. Solvent system B gave a good separation of these preparations. For identification of the spots pure mono, di and tri galacturonic acid and pure monomethylmono, dimethyldi and
62

Table 8. RMe,ai values obtained with solvent D and solvent E.
monomer dimer trimer tetramer pentamer hexamer
Saturated
D
1 0.68 0.50 0.34 0.21 0.13
D*
1 0.735 0.535 0.36 0.23 0.17
E
1 0.35 0.13 0.052
dimer trimer tetramer pentamer hexamer
D*: Rutegai values reported by Edstrom & Phaff (1964b)
Unsaturated
D
1.25
1 0.69 0.50 0.35
D*
1.11
• •
•
E
1.3 0.58
0.22 0.09 •
1.6-
10
0.4
-0.2
-0.8
. / / /
/ / /
/ /
PN , , , r-0 2 3 I 5
6 DP
Fig 11 Relationship between the DP and the RM for'saturated methyl oligogalacturonates shown for solvent system D (A) and E (•). Curves marked with u were found for unsaturated compounds.
trimethyltrigalacturonate were used as reference compounds. Solvent system B also
achieved a separation of the esters. , ' „.„„„•„ mntained It was found that the crude preparation «™™**^
small impurities of digalacturonic acid and ^ ^ ^ f ^ of the trimer was contaminated with small amounts of ^ ^ L Z o i Z dimethyltrigalacturonate. The diester of the trimer contamed ^ » ™ ^ ^
. , * TU^ rM-onarat ons were shown to oe aciuii,, monoester and trimethyltngalacturonat^The ̂ ^ a n d i a l l y e s t e r i f i e d
bond in monomethyldigalacturonate resulted in a weak portve penodate TBA test.
63
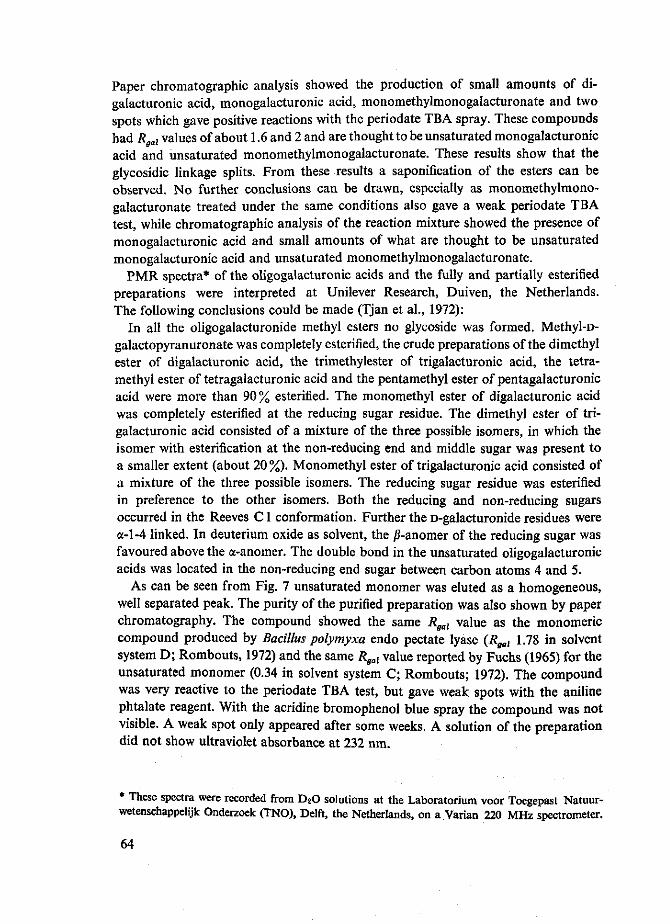
Paper chromatographic analysis showed the production of small amounts of di-galacturonic acid, monogalacturonic acid, monomethylmonogalacturonate and two spots which gave positive reactions with the periodate TBA spray. These compounds had Rgai values of about 1.6 and 2 and are thought to be unsaturated monogalacturonic acid and unsaturated monomethylmonogalacturonate. These results show that the glycosidic linkage splits. From these results a saponification of the esters can be observed. No further conclusions can be drawn, especially as monomethylmonogalacturonate treated under the same conditions also gave a weak periodate TBA test, while chromatographic analysis of the reaction mixture showed the presence of monogalacturonic acid and small amounts of what are thought to be unsaturated monogalacturonic acid and unsaturated monomethylmonogalacturonate.
PMR spectra* of the oligogalacturonic acids and the fully and partially esterified preparations were interpreted at Unilever Research, Duiven, the Netherlands. The following conclusions could be made (Tjan et al., 1972):
In all the oligogalacturonide methyl esters no glycoside was formed. Methyl-D-galactopyranuronate was completely esterified, the crude preparations of the dimethyl ester of digalacturonic acid, the trimethylester of trigalacturonic acid, the tetra-methyl ester of tetragalacturonic acid and the pentamethyl ester of pentagalacturonic acid were more than 90 % esterified. The monomethyl ester of digalacturonic acid was completely esterified at the reducing sugar residue. The dimethyl ester of trigalacturonic acid consisted of a mixture of the three possible isomers, in which the isomer with esterification at the non-reducing end and middle sugar was present to a smaller extent (about 20%). Monomethyl ester of trigalacturonic acid consisted of a mixture of the three possible isomers. The reducing sugar residue was esterified in preference to the other isomers. Both the reducing and non-reducing sugars occurred in the Reeves C1 conformation. Further the D-galacturonide residues were a-1-4 linked. In deuterium oxide as solvent, the /?-anomer of the reducing sugar was favoured above the a-anomer. The double bond in the unsaturated oligogalacturonic acids was located in the non-reducing end sugar between carbon atoms 4 and 5.
As can be seen from Fig. 7 unsaturated monomer was eluted as a homogeneous, well separated peak. The purity of the purified preparation was also shown by paper chromatography. The compound showed the same Rgal value as the monomeric compound produced by Bacillus polymyxa endo pectate lyase (Rga, 1.78 in solvent system D; Rombouts, 1972) and the same Rgal value reported by Fuchs (1965) for the unsaturated monomer (0.34 in solvent system C; Rombouts; 1972). The compound was very reactive to the periodate TBA test, but gave weak spots with the aniline phtalate reagent. With the acridine bromophenol blue spray the compound was not visible. A weak spot only appeared after some weeks. A solution of the preparation did not show ultraviolet absorbance at 232 nm.
* These spectra were recorded from D20 solutions at the Laboratorium voor Toegepast Natuur-wetenschappelijk Onderzoek (TNO), Delft, the Netherlands, on a.Varian 220 MHz spectrometer.
64
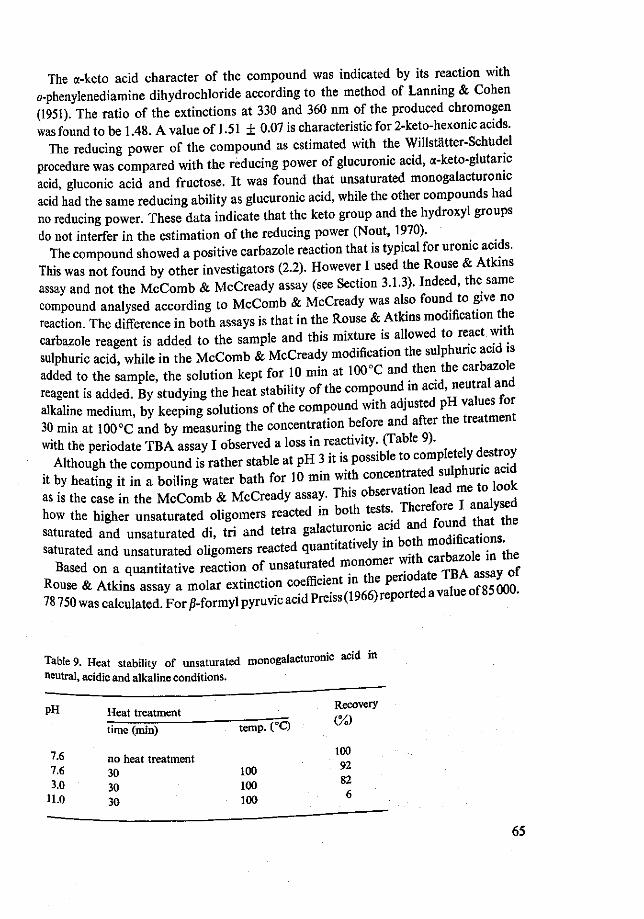
The a-keto acid character of the compound was indicated by its reaction with o-phenylenediamine dihydrochloride according to the method of Lanning & Cohen (1951). The ratio of the extinctions at 330 and 360 nm of the produced chromogen was found to be 1.48. A value of 1.51 ± 0.07 is characteristic for 2-keto-hexonic acids.
The reducing power of the compound as estimated with the Willstatter-Schudel procedure was compared with the reducing power of glucuronic acid, oc-keto-glutanc acid, gluconic acid and fructose. It was found that unsaturated monogalacturomc acid had the same reducing ability as glucuronic acid, while the other compounds had no reducing power. These data indicate that the keto group and the hydroxyl groups do not interfer in the estimation of the reducing power (Nout, 1970).
The compound showed a positive carbazole reaction that is typical for uronic acids. This was not found by other investigators (2.2). However I used the Rouse & Atkins assay and not the McComb & McCready assay (see Section 3.1.3). Indeed, the same compound analysed according to McComb & McCready was also found to give no reaction. The difference in both assays is that in the Rouse & Atkins modification the carbazole reagent is added to the sample and this mixture is allowed to react with sulphuric acid, while in the McComb & McCready modification the sulphuric acid is added to the sample, the solution kept for 10 min at 100°C and then the carbazole reagent is added. By studying the heat stability of the compound in acid, neutral and alkaline medium, by keeping solutions of the compound with adjusted pH values tor 30 min at 100°C and by measuring the concentration before and after the treatment with the periodate TBA assay I observed a loss in reactivity. (Table 9).
Although the compound is rather stable at pH 3 it is possible to <"f^J£™ it by heating it in a boiling water bath for 10 min with concentrated «*&**££ as is the case in the McComb & McCready assay. This observation lead me to look how the higher unsaturated oligomers reacted in both ^ / ^ ^ ' ^ saturated and unsaturated di, tri and tetra galacturonic ^ ^ ^ T saturated and unsaturated oligomers reacted quantitatively in both modificatons
Based on a quantitative reaction of unsaturated monomer with carbazole n the Rouse & Atkins assay a molar extinction coefficient in the P * ^ ^ ^ ^ 78750wascalculated.For^formylpyruvicacidPreiss(1966)reportedavalueof85000.
Table 9. Heat stability of unsaturated monogalacturonic acid in
neutral, acidic and alkaline conditions.
PH Heat treatment time (min) temp. (°C)
'•6 no heat treatment 7.6 30 100 3.0 30 100
11.0 30 100
Recovery
(%)
100 92 82 6
65

4.2 Pectin lyases
4.2.1 Isolation
Pectin lyase was isolated from Ultrazym 20 (U20 PL) by the following operations (van Houdenhoven, 1969): 1. Making a clear, concentrated extract from the commercial preparation: 100 g Ultrazym 20 were stirred in 2 litre water during 3 h and the suspension filtered through cheese-cloth and centrifuged at 12000 x g for 20 min. The 1980 ml clear supernatant obtained were concentrated to 320 ml in a rotating vacuum evaporator. The concentrate was again centrifuged. 2. Desalting this extract on Sephadex G25: The concentrate was desalted on a Sephadex G25 column. Per run, 110 ml concentrate were introduced at the top of the column and eluted with distilled water, collecting 10 ml fractions. The active fractions were pooled and concentrated to 190 ml. 3. Adsorbing lyase activity together with polygalacturonase but only little PE on phosphate gel: This concentrate was added to 400 ml of a 80% (w/v) calcium phosphate gel suspension and the mixture stirred for 20 min. The gel was removed by centrifuging in a clinical centrifuge. The supernatant S was almost free of lyase activity but very active in PE and rich in other proteins. 4. Desorbing the lyase activity batchwise from the phosphate gel: The gel was washed with phosphate buffers of pH 7 of increasing molarity. 5. Concentrating and dialysing the active fractions: The washings with a sufficient lyase activity (S3 to S10, see Table 10) were collected and concentrated to a protein concentration of about 30 mg/ml. This concentrate was dialysed against 0.05 M phosphate buffer pH 7. 6. Gel filtration on Sephadex G100: The fractionation obtained by gel filtration on Sephadex G100 is shown in Fig. 12. The active fractions of six runs were pooled, lyophilized, redissolved in 2 ml buffer and chromatographed again. A pectin lyase preparation free of detectable activities of polygalacturonase and PE was obtained. The results of the various steps applied in the purification of U20 pectin lyase are summarized in Table 10. 7. Freeze-drying the purified lyase preparation. This procedure resulted in 35-fold purification and 30 % recovery.
The purification operations for the isolation of pectin lyase from Pektolase FL32 (FL32 PL) consisted in (Bohm, 1970): 1. Adsorbing lyase activity on calcium phosphate gel: 75 ml of the 'Pektolase FL32' preparation was dialysed against running tap water for 8 h. The volume of the enzyme solution increased to 150 ml. 35 g of calcium phosphate gel (obtained by centrifuging a 3% (w/v) suspension and decanting the supernatant) was added to the enzyme solution. The mixture was stirred for 20 min and then centrifuged. The supernatant was removed and the gel was washed with 80 ml distilled water. About 60% of the lyase activity was adsorbed on the gel, while most of the PE and PG activity and
66
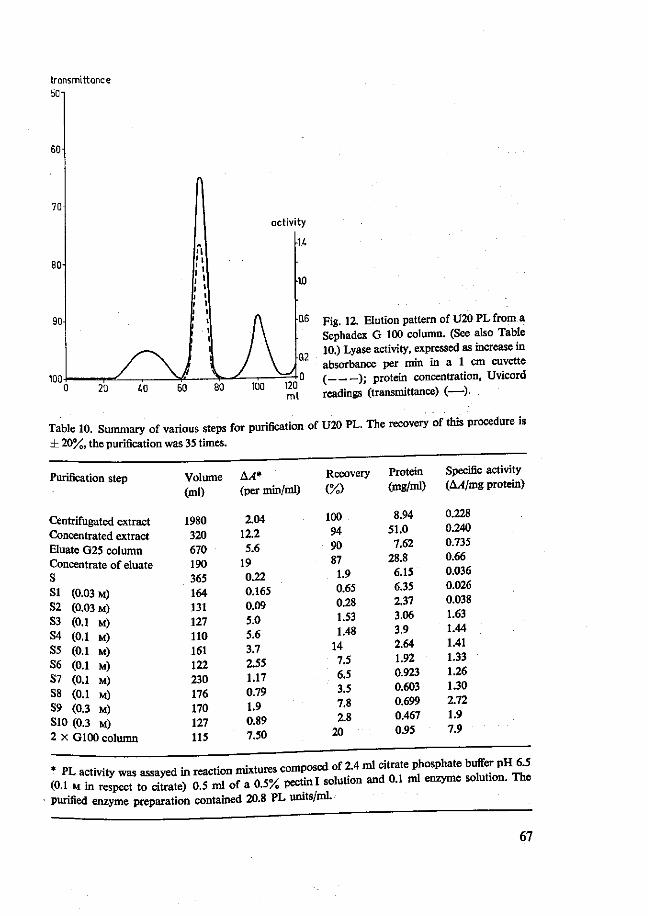
transmittance 50
Fig. 12. Elution pattern of U20 PL from a Sephadex G 100 column. (See also Table 10.) Lyase activity, expressed as increase in absorbance per min in a 1 cm cuvette ( ); protein concentration, Uvicord readings (transmittance) (—).
Table 10. Summary of various steps for purification of U20 PL. The recovery of this procedure is
± 20%, the purification was 35 times.
Purification step Volume A/4* (ml) (per min/ml)
Centrifugated extract 1980 2.04 Concentrated extract 320 12.2 Eluate G25 column 670 5.6 Concentrate of eluate 190 19 S 365 0.22 51 (0.03 M) 164 0.165 52 (0.03 M) 131 0.09 53 (0.1 M) 127 5.0 54 (0.1 M) 110 5.6 55 (0.1 M) 161 3.7 56 (0.1 M) 122 2.55 57 (0.1 M) 230 1.17 58 (0.1 M) 176 0.79 59 (0.3 M) 170 1.9 S10 (0.3 M) 127 0.89 2 x G100 column 115 7.50
Recovery Protein (%) (mg/ml)
100 94 90 87
1.9 0.65 0.28 1.53 1.48
14 7.5 6.5 3.5 7.8 2.8
20
8.94 51.0
7.62 28.8
6.15 6.35 2.37 3.06 3.9 2.64 1.92 0.923 0.603 0.699 0.467 0.95
Specific activity (A/l/mg protein)
0.228 0.240 0.735 0.66 0.036 0.026 0.038 1.63 1.44 1.41 1.33 1.26 1.30 2.72 1.9 7.9
* DT x- • J • *•„„ ,v.;vt,,rP<! composed of 2.4 ml citrate phosphate buffer pH 6.5 * PL activity was assayed in reaction mixtures compuscu u i * „„i„t;„„ TT,„ , „ , . ' « * » « » ; - s o l u t i o n and o.l ml enzyme solution. The (0.1 M m respect to citrate) 0.5 ml of a 0.5/„ pectin i M"" U U
purified enzyme preparation contained 20.8 PL units/ml.
67
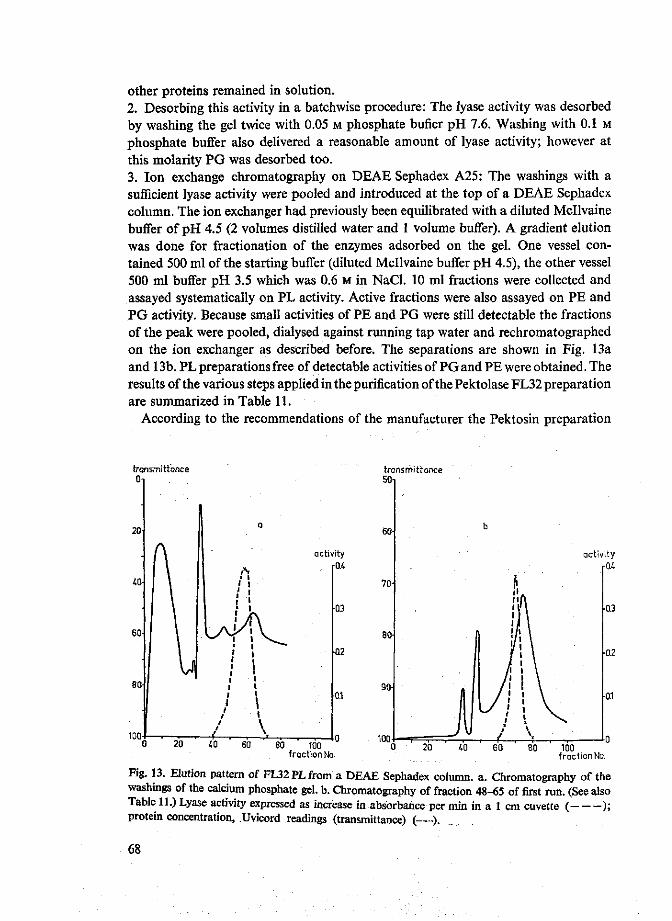
other proteins remained in solution. 2. Desorbing this activity in a batchwise procedure: The lyase activity was desorbed by washing the gel twice with 0.05 M phosphate bufier pH 7.6. Washing with 0.1 M phosphate buffer also delivered a reasonable amount of lyase activity; however at this molarity PG was desorbed too. 3. Ion exchange chromatography on DEAE Sephadex A25: The washings with a sufficient lyase activity were pooled and introduced at the top of a DEAE Sephadex column. The ion exchanger had previously been equilibrated with a diluted Mcllvaine buffer of pH 4.5 (2 volumes distilled water and 1 volume buffer). A gradient elution was done for fractionation of the enzymes adsorbed on the gel. One vessel contained 500 ml of the starting buffer (diluted Mcllvaine buffer pH 4.5), the other vessel 500 ml buffer pH 3.5 which was 0.6 M in NaCl. 10 ml fractions were collected and assayed systematically on PL activity. Active fractions were also assayed on PE and PG activity. Because small activities of PE and PG were still detectable the fractions of the peak were pooled, dialysed against running tap water and rechromatographed on the ion exchanger as described before. The separations are shown in Fig. 13a and 13b. PL preparations free of detectable activities of PG and PE were obtained. The results of the various steps applied in the purification of the Pektolase FL32 preparation are summarized in Table 11.
According to the recommendations of the manufacturer the Pektosin preparation
transmittance 50-
80 100 fraction No.
100 fraction No.
Fig. 13. Elution pattern of FL32PLfrom a DEAE Sephadex column, a. Chromatography of the washings of the calcium phosphate gel. b. Chromatography of fraction 48-65 of first run. (See also Table 11.) Lyase activity expressed as increase in absorbance per min in a 1 cm cuvette ( ); protein concentration, Uvicord readings (transmittance) (—)..
68

Table 11. Summary of various steps for the purification of FL32 PL and Pektosin PL.
Purification step Volume A A* Recovery Protein Specific (ml) (per min/ml) (%) mg/ml activity
AA/mg protein
F132 PL** crude preparation dialysed crude preparation calcium phosphate washings (0.05 M) fractions 48-65; 1 th DEAE run fractions 56-69; 2 t h DEAE run
Pektosin PL*** dialysed extract fractions 6-15 fractions 119-129 (I) fractions 112-119 and 130-136 (II)
75 170 85
170 130
40 90
100 30
17 7 3.4 1.54 1.88
13.3 2.08 0.98 0.57
100 93 23 20 19
100 35 28 15
160 59 8.6 0.57 0.40
8 1.36 0.09 0.11
0.1 0.1 0.4 2.7 4.7
1.66 1.53
11.13 5.38
* PL activity assayed as described in Section 3.2.1 ** Purification 45 times *** Purification I ± 7 times, II ± 3 times
should contain a high PL and little PE activity. Indeed, I found that this preparation had a specific lyase activity which was 16 times higher than for the Pektolase FL32 preparation and 7 times higher than for the Ultrazym 20 preparation. However the preparation also contained a reasonable PE activity. The following purification procedure resulted in a pectin lyase preparation free of other pectolytic enzymes: 4.2 g of the crude Pektosin preparation was suspended in 30 ml 0.05 M citrate phosphate buffer pH 6.5 (0.05 M with respect to citrate) and dialysed against this buffer for 16 h. The dialysate was centrifuged to remove the insoluble carrier material. The clear supernatant, 40 ml, was placed on a DEAE Sephadex column, which had previously been equilibrated with citrate phosphate buffer. Gradient elution was carried out for the fractionation of the enzyme mixture. Elution was started with 0.05 M citrate phosphate buffer pH 6.5 (400 ml) and the pH of this buffer was decreased by gradually adding 0.05 M citrate phosphate buffer pH 4.5 (400 ml). 10 ml fractions were collected and systematically assayed for pectin lyase activity. Thirty-five percent of the lyase activity appeared in the first 150 ml eluate. Apparently this fraction was not adsorbed. Further elution with this pH gradient did not result in desorption of pectin lyase. Therefore the elution was continued by a pH gradient obtained by gradually adding 0.05 M citrate phosphate buffer pH 3.5 containing 0.6 M NaCl (in total 400 ml) to 400 ml 0.05 M citrate phosphate buffer pH 4.5. This resulted in the elution of lyase activity in fractions 113 up to 135. No PG or PE activity was detectable in these fractions. This purification is summarized in Table 11.
69

4.2.2 Purity
Presence of polymethylgalacturonase in the puriefied pectin lyase preparations To find out whether PMG was present in the purified lyase preparations, the relationship between increase in absorbance at 232 nm and decrease in specific viscosity was studied as a function of the pH. Thus any possible contaminating hydrolase would be detectable. As can be seen from Fig. 14 the curves showing A A against l/ns are linear for pH 5.9; 6.5 and 7.3 but not for pH 4.4 and 5.2. The three preparations showed identical pictures. The increase in optical density was measured during the time necessary to reduce the viscosity by 25 %; AA t £ caused by the different preparations is shown in Table 12. This part of the degradation is chosen because the curves showing AA against l/ns for pH 4.4 and 5.2 are more or less linear in this region. From this table we can see that AA t i at pH 5.2 and 4.4 differ from the values measured at higher pH values which are rather uniform. This deviation may be caused by conta-
Table 12. Increase in absorbance caused by the different lyases at various pH values during the time necessary to reduce the viscosity by 25% (t $).
pH
4.4 5.2 5.9 6.55 7.3
AAti
FL32
0.42 0.46 0.55 0.55 0.56
U20
0.41 0.47 0.56 0.56 0.57
Pektosin
0.41 0.48 0.56 0.56 0.54
1
5
2.5 Q2 0.4 0.6 0.8 1.0 1.2
Fig. 14. Relationship between reciprocal specific viscosity (1/J/») and absorbance (A) for pectin breakdown by U20 PL at various pH values. Identical curves were obtained for FL32 PL and Pektosin PL. pH 4.4 ( x ) ; pH5.2(A);pH5.9,6.5and7.3(a,*andO).
70

A * 1 0
1.2-
0.6H
0 0
14
1.0
0.4-
0.2H
0.6
1-0.2
0 0
1 7 l/tl/2(sec *10 )
0.5
0.3
0.1
pH PH
Fig. 15. Optimum pH of FL32 (a), U20 (b) and Pektosin PL (c). Activity expressed as increase in absorbance per min in a 1 cm cuvette (x), and as reciprocal t i values (•).
mination with PMG. However I found about the same values for all three preparations, which originated from different sources and were purified by different methods. Therefore all these preparations must have been contaminated to the same extent with the same enzyme. Probably at lower pH values, other effects are involved, that are also evident in lower initial specific viscosities and in the nonlinear curves observed at these pH values.
The activities of the lyase preparations can be expressed as increase in optical density measured as initial velocities and by viscosity reduction expressed as the time necessary to reduce the viscosity by 50% (t i value). By plotting the lyase activities, expressed as initial velocities and as reciprocal t \ values, as a function of the pH, about the same optimum pH values are found as is shown in Fig. 15. This agreement also illustrates that contamination with PMG is very unlikely. The low values at pH 7.3 measured viscosimetrically can be explained by a loss in activity of the enzymes at this pH during the time necessary for 50 % viscosity reduction.
Preliminary comparative studies on the ratio of pectin degradation measured as lyase activity and pectin degradation measured as viscosity reduction for various commercial enzyme preparations indicated a high PMG activity in Pektolase FL32. This preparation seemed therefore suitable for the isolation of a PMG. Various fractionation procedures were tested. All the fractions were assayed viscosimetrically at various pH values for pectin depolymerizing activity. In this way the purification procedure described in Section 4.2.1 was developed (Bohm, 1970). However the active fractions obtained, all contained a correlating PL activity. It is possible that PMG activity was not desorbed from the calcium phosphate gel and was lost in this way. To prevent this loss the following fractionation procedure was carried out: 75 ml of
71

the crude enzyme preparation was dialysed against running tap water for 6 h and then loaded directly on a DEAE Sephadex column. This column had previously been equilibrated with diluted Mcllvaine buffer pH 7.5 (2 volumes water/1 volume buffer). The column was eluted with 100 ml of the diluted buffer, the pH of the buffer was decreased in steps of one unit to pH 4; the column had to be in equilibrium before the pH was changed. The elution was continued with 200 ml of a NaCl gradient from 0 to 0.3 M in diluted McJlvaine buffer of pH 4 and finished with a NaCl gradient from 0.3 to 0.5 M in diluted buffer pH 3.5. Fractions of 10 ml were collected and these were assayed systematically for pectin degrading activity at various pH values. Only in the fractions eluted with the NaCl gradient in the pH 4 buffer and pH 3.5 buffer was found such activity. These fractions again showed a correlating lyase activity. Based on these observations I concluded that there was little or no PMG in the preparation.
Electrophoretic studies With polyacrylamide gel electrophoresis, most of the pectin PL activity was found in one segment; only a little activity was found in the neighbouring segments. The lyases of the three preparations behaved similarly. By applying a mixture of the lyase preparations on the gels, the lyases could not be separated; colouring the gels with amido black showed that the U20 and FL32 preparations were not homogeneous. Bands for contaminating proteins could be shown. Only faint coloured bands were found for the enzyme-proteins.
4.2.3 Characterization
IEP The pectin lyases of the three enzyme preparations showed practically the same isoelectric point. This value was found to be in the pH range 3.5-3.8. Staining the gels with amido black confirmed the results obtained by way of segmenting, extraction and assaying for PL activity. Contaminating proteins, however, were found to have their isoelectric point in the same pH range.
pH optima of the enzymes The curves of the optimum pH values, estimated in the various buffer systems for the three lyase preparations, are shown in Figs. 16, 17 and 18. It can be seen from these curves that the enzymes are active over a broad pH range. The highest activities were measured in citrate phosphate buffers. In this system, the lyase activity at the optimum pH is about twice the activity in tris acetate buffer. In citrate phosphate and phosphate citrate all preparations show their optimum pH between pH 6.1 and 6.5. In the various tris buffers the pH optima were found between pH 6.1 and 6.3. From these buffers tris citrate showed the highest activities, however these activities are smaller than the activities measured in the phosphate citrate system and the citrate phosphate system. There was a small difference in the tris succinate and tris HC1 system. For the Pektosin and U20 preparation, the tris succinate buffers show somewhat higher activities; for the FL32 preparation the differences are very small. The tris succinate system has the advantage that it covers a broader pH range and has a better buffer capacity at low pH than the tris HC1
72
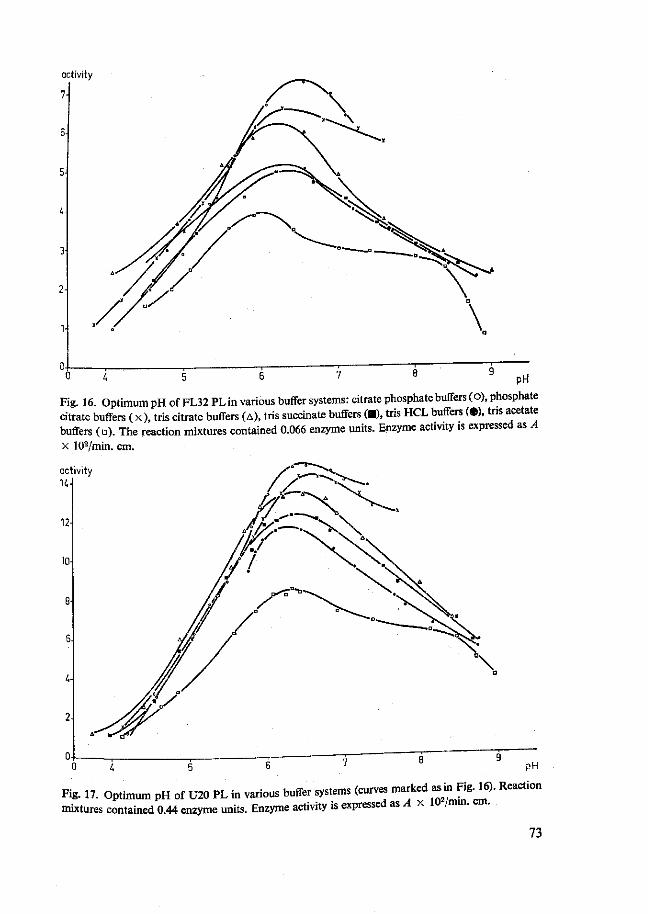
activity
7
5
2
0 4 5 6 / o pH
Fig. 16. Optimum pH of FL32 PL in various buffer systems: citrate phosphate buffers (o), phosphate citrate buffers ( x) , tris citrate buffers (A), tris succinate buffers (•), tris HCL buffers (•), tns acetate buffers (D). The reaction mixtures contained 0.066 enzyme units. Enzyme activity is expressed as A x 102/min. cm.
activity 14
12
10
2
0 0 4 5 6
Fig. 17. Optimum PH of U20 PL in various buffer systems (curves marked as fc.Fig 16). Reaction mixtures contained 0.44 enzyme units. Enzyme activity is expressed as A x 10 /mm. cm.
73

system. The low activities measured in tris acetate may be explained by the inhibitory effect of acetate ions as was indicated by Albersheim & Killias (1962) and van Hou-denhoven (1969).
activity 6-1
^ ,
pH'
Fig. 18. Optimum pH of Pektosin PL in various buffer systems (curves marked as in Fig. 16). Reaction mixtures contained 0.216 enzyme units. Enzyme activity is expressed as A x 102/min. cm.
activity
8iE /.70E
60E 86 A
Fig. 19. Activity of U20 PL on pectins with different DE as function of the pH. Reaction mixtures contained 0.44 enzyme units. Numbers of curves refer to DE. The suffix A indicates A pectins, the suffix E indicates E pectins. Enzyme activity is expressed as A x 102/min. cm.
74

DE substrate
95 86 84 79 74 70 60 30
Sa
A E A A E E E
Table 13. Optimum pH values found for U20 PL on pectins with different degrees of esterification and with different distributions of esterified and unesterified carboxyl groups.
Saponification method Optimum pH
6.1 5.4 6.0 5.2 4.8 5.8 5.7 4.5
The differences in optimum pH values reported by several investigators might be caused by differences in the substrates used. To check this the lyase activity (U20 preparation) was measured on pectins, with different DEs and with different distributions of methylated and free carboxyl groups over the pectin molecule, as a function of the pH. As buffer system tris succinate was used because of its broad pH range. The optimum pH values for the various substrates are shown in Fig. 19. A shift of the optimum pH values to lower pH values with decreasing DE of the substrates can be observed. This shift is stronger for the A preparations than for the E preparations (i.e. for substrates with a random distribution than for the substrates with a block-wise distribution). At pH values up to 8.6, activities are seen to decrease with decreasing DE. This decrease is stronger for the preparations with a random distribution. At pH values lower than 5 the 95 % esterified pectin shows the lowest activities except for the 30% esterified preparation. In Table 13 the optimum pH values that were found are given.
Influence of the molarity of citrate phosphate buffer on lyase activity The activity of the FL32 preparation was estimated in citrate phosphate buffers adjusted to pH 6.5
activity
Fig. 20. Activity of FL32 PL, expressed as A x 102/min. cm. as function of the molarity (M) of citrate phosphate buffers pH 6.5. Reaction mixtures contained 50 x
pi „ _ _ _ . 0 004 008 0.12 016 020 024 i0-3 enzyme units. M
75

%rest activity 100
20 25 30 incubation time
%rest activity 100
60
20
9 PH
Fig. 21a. Residual activities of FL32 PL incubated in buffers of different pH at 38 °C for various times. Numbers refer to pH of the buffer. U20 PL (o), FL32 PL ( x ) and Pektosin PL (A).
Fig. 21b. Residual activities of PL preparations after 30min incubation in buffers of different pH. (Curves marked as in Fig. 21a.)
with citrate concentrations varying from 0.004 M to 0.24 M. The results are shown in Fig. 20. A broad optimum molarity range from 0.07 M to 0.14 M can be observed. Similar results were obtained for the U20 preparation.
Stability of the pectin lyase preparations as a function of thepH The residual activities after incubation of samples of the FL32 preparation in various buffers as a function of the incubation time are shown in Fig. 21a. Fig. 21b represents % residual activity after 30 min incubation at various pH values of FL32, U20 and Pektosin preparations. It can be seen that at 38 °C the enzyme is not inactivated between pH 5 and 6, but above pH 6 there is a rapid inactivation. At pH 7.8, about 90% of the activity is lost after 30 min incubation. At pH 4.2 the Pektosin preparation seems to be less stable than the other preparations.
Energy of activation The energy of activation of U20 and FL32 pectin lyase was calculated from Figs. 22a and 22b. In these figures, log Vmax is plotted against l/T. The temperature range in which Vmax was estimated was not the same for the different enzymes. In the same curves I also plotted log Km as a function of 1/7". From the slopes of the curves EA was calculated. About the same value was found for both preparations: 1.5 kcal/mol. Fig. 22b further shows that the optimum temperature for FL32 PL is about 43 °C.
The influence of the degree of esterification on the activity of pectin lyases Pectic substances which occur in vegetables, fruits and fruit juices are, in general, highly
76

log Vmax 1.4
1.2
LO
OS
0.6 01;
3.3
logKm •1.4
12
3.35 3.4 3.45 3.5 3.55 1/Tx103
1.0
0.8
0.6 0
4+logKm
~0 "31 3.5 y rxKr
Fig. 22. Temperature dependence of V««r ( x ) and #m (o) of U20 (a) and FL32 (b) PL on pectin I.
esterified pectins (Section 2.1). Most of these products are also found to contain a native PE activity. During processing of these products, commercial pectolytic enzyme preparations are often applied. These preparations usually contain a high PE activity. These esterases may cause a decrease in the degree of esterification of the pectic substances. It has already been observed that the U20 PL showed lower activities and different optimum PH values on pectins with lower DEs. These differences appeared to be a function of the distribution of esterified and unestenfied galacturo-nide units in the pectin molecule. It seemed therefore of interest to study systematically the influence of the degree of esterification on pectin lyase activity. Therefore the
77
kinetics of pectin lyases on pectin preparations of different degrees of esterification and with different distributions of esterified and unesterified galacturonide units were studied.
First lyase activities were measured for various substrate concentrations in a reaction mixture buffered at pH 6.5. The following preparations were used: pectin I and A pectins with DEs of 86, 79 and 74 % and E pectins with DEs of 80, 70 and 60 %. The Pektolase FL32 preparation was studied more extensively. The activity of this enzyme was also studied on A pectins with DEs of 92, 90 and 52 %. The results obtained for the different PL preparations are presented as L-B plots in figs. 23a, b and c. The numbers of the curves refer to the degree of esterification of the substrates. The dotted lines show the curves for the E preparations. Sometimes the substrate concentration was increased to 34 mM/litre but no substrate inhibition could be observed. The plotted lines present the picture usually associated with competitive inhibition although no inhibitors had been added.
One could imagine that a pectin molecule contains reactive and unreactive sites. The reactive sites can form a complex with the lyase and a glycosidic bond in the complex-bound part of the pectin molecule is then split. The unreactive sites may also form a reversible or irreversible complex with the enzyme, but in these complexes no bonds can be split. These unreactive sites may thus inhibit lyase activity. If there be unreactive sites on the substrate molecules, the ratio between concentration of reactive and unreactive sites for the various substrates would be constant for the whole concentration range in which the lyase activities were measured. However straight lines were obtained in the L-B plots for all substrates, and the same Vmax was extrapolated for all the substrates. These results indicate that there are no reversible or irreversible complex formations between the enzyme and unreactive sites on the substrate molecule. Also there can be no irreversible complex formations because the measured activities of the FL32 PL preparation in reaction mixtures, containing 0.8 mM/litre pectin I and known amounts of other substrates, was in very close agreement with the sum of the activities measured under the same conditions on the separate components of the mixture. The results of these experiments are given in Table 14. Addition of various amounts of pectic acid to reaction mixtures which contained pectin I, did not influence lyase activity. Pectic acid concentrations 10 times higher than the pectin concentration (1.6 mM/litre) gave no loss in PL activity. Only when this ratio was increased to 17 times, a 35% loss in activity was observed. ; From these observations I thought that the molecules of the various pectin substrates may contain less reactive sites as the DE decreases, making higher substrate concentrations necessary for equal reaction velocity.
The influence of the distribution of esterified and unesterified units along the pectin molecule is evident from the L-B plots in figs. 23a and 23b. For both types of substrates the same Vmax is extrapolated. However on the enzymatic saponified substrates the lyases show much higher activities than on the corresponding preparations with the same DE obtained by partial saponification with alkali. The figures also show a remarkable difference in Km values for the FL32 preparation and for the other two
78
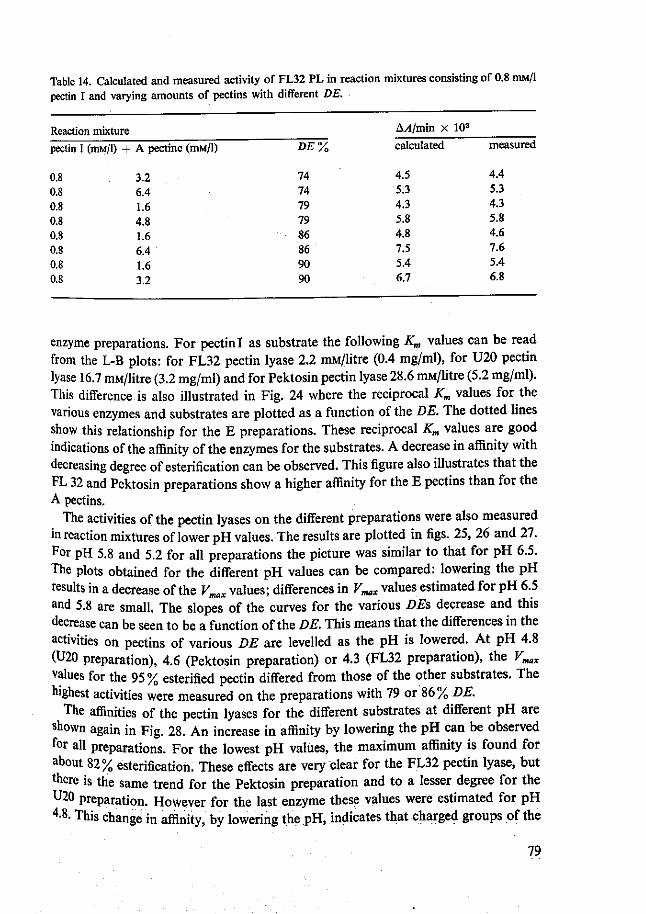
Table 14. Calculated and measured activity of FL32 PL in reaction mixtures consisting of 0.8 mM/1 pectin I and varying amounts of pectins with different DE.
Reaction mixture
pectin I (mM/1) 4- A pe
0.8 0.8 0.8 0.8 0.8 0.8 0.8 0.8
3.2 6.4 1.6 4.8 1.6 6.4 1.6 3.2
DE%
74 74 79 79 86 86 90 90
hA/min X 102
calculated
4.5 5.3 4.3 5.8 4.8 7.5 5.4 6.7
measured
4.4 5.3 4.3 5.8 4.6 7.6 5.4 6.8
enzyme preparations. For pectin I as substrate the following Km values can be read from the L-B plots: for FL32 pectin lyase 2.2 mM/litre (0.4 mg/ml), for U20 pectin lyase 16.7 mM/litre (3.2 mg/ml) and for Pektosin pectin lyase 28.6 mM/litre (5.2 mg/ml). This difference is also illustrated in Fig. 24 where the reciprocal Km values for the various enzymes and substrates are plotted as a function of the DE. The dotted lines show this relationship for the E preparations. These reciprocal Km values are good indications of the affinity of the enzymes for the substrates. A decrease in affinity with decreasing degree of esterification can be observed. This figure also illustrates that the FL 32 and Pektosin preparations show a higher affinity for the E pectins than for the A pectins.
The activities of the pectin lyases on the different preparations were also measured in reaction mixtures of lower pH values. The results are plotted in figs. 25, 26 and 27. For pH 5.8 and 5.2 for all preparations the picture was similar to that for pH 6.5. The plots obtained for the different pH values can be compared: lowering the pH results in a decrease of the Vmax values; differences in Vmax values estimated for pH 6.5 and 5.8 are small. The slopes of the curves for the various DEs decrease and this decrease can be seen to be a function of the DE. This means that the differences in the activities on pectins of various DE are levelled as the pH is lowered. At pH 4.8 (U20 preparation), 4.6 (Pektosin preparation) or 4.3 (FL32 preparation), the Vmax
values for the 95% esterified pectin differed from those of the other substrates. The highest activities were measured on the preparations with 79 or 86 % DE.
The affinities of the pectin lyases for the different substrates at different pH are shown again in Fig. 28. An increase in affinity by lowering the pH can be observed for all preparations. For the lowest pH values, the maximum affinity is found for about 82% esterification. These effects are very clear for the FL32 pectin lyase, but there is the same trend for the Pektosin preparation and to a lesser degree for the U20 preparation. However for the last enzyme these values were estimated for pH 4-8. This change in affinity, by lowering the pH, indicates that charged groups of the
79

5 6
Fig. 23. L-B plots of PL action on pectins with different DE and different distribution of esterified and unesterified galacturonide units at pH 6.5.
80

1 1 -2 i r - (Mx io ) K
0 52~ 60 70 74 79 86
Fig. 24. Influence of DE of pectin substrates on 1/JiTm at pH 6.5. Curve obtained
g pr-gr for A pectins (—), curve obtained for E DE pectins ( ).
enzymes or the substrate take part in the formation of the enzyme-substrate com-
On the basis of these results one can speculate what requirements the enzymes make of the reactive sites on the pectin molecule. Because at pH > 5.3 the highest affinity is found for the preparation with the highest DE and because the enzymes show higher affinities for the E preparations than for the A preparations under these reaction conditions, the esterified galacturonide units play an important part m the reactive sites. At pH < 5.3 maximum affinity and also maximum activity is found or a preparation with a DE of about 82 %. This indicates that in these circumstances al o unesterified galacturonide units are involved in the reactive sites. An approach to this problem could be to calculate the frequency of occurrence of certain « — of esterified units or combinations of esterified and unesterified units with. :s at stical models and to look if these frequencies correlate with the ™ ^ * T ^ * results indicate that the dissociation of the charged groups of the substrates and of the enzymes should be included.
Fig. 23. Continued. Numbers of curves refer to DE. Dotted lines expressed as increase in absorbance per min in a 1 cm cuvette
obtained for E preparations. Reaction velocity v is
a. Plots for FL32 PL, reaction mixtures contained 0.066 enzyme units. , mixtures contained 0.135 enzyme umts. b- Plots for Pektosin PL, reaction
c Plots for U20 PL, reaction mixtures contained 0.284 enzyme units.
81

pH 5 8
' • ' • J - ^ 2.H
10
-6 - 5 - - 3 - 2 - 1
BUMW)
Fig. 25. L-B plots of FL32 PL on pectins with different DE for pH 5.8,5.2 and 4.3. Specifications as in Fig. 23.
82

6 7 -, 1(MW)
Fig. 26. L-B plots of U20 PL on pectins with different DE for PH 5.8,
5.5 and 4.8. Specifications as in Fig. 23.
83

Fig. 27. L-B plots of Pektosin PL on pectins with different DEfor pH 5.6,5.3 and 4.6. Specifications as in Fig. 23.
84

1/KmWW)
"0 52 74 79 86 90 92 95 DE
Fig. 28. Influence of DE of pectin substrates on l/Km of PL at different pHs. FL32 PL (—), U20 PL ( ) and Pektosin PL (—.—. —). Numbers refer to pH.
The L-B plots of Fig. 23c and Fig. 26 show that for all substrates the extrapolated Vmax value of the U20 pectin lyase is the highest for pH 6.5 and 5.8. This seems to be in contradiction to the curves of optimum pH values for various substrates shown in Fig. 19. However under the reaction conditions in which the lyase activity was estimated as a function of the pH, the substrate concentration was 4 mM/litre. This concentration was far too low to saturate the enzyme. The above mentioned data showed that with lowering of the pH the affinity of the enzyme for the substrates increased. The measured activities are therefore not only dependent on the pH but they are also influenced by changes in the saturation of the enzyme. These saturation effects are not involved when Fmax is obtained by extrapolation of L-B plots.
85
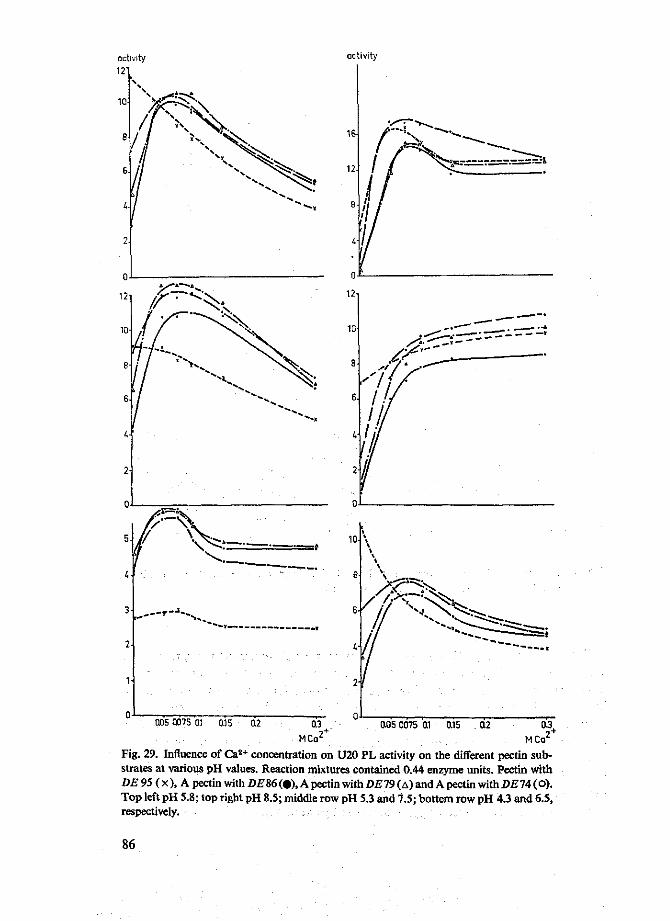
activity
MCcr MCa' Fig. 29. Influence of Ca2+ concentration on U20 PL activity on the different pectin substrates at various pH values. Reaction mixtures contained 0.44 enzyme units. Pectin with DE 95 ( x ), A pectin with DE 86 (•), A pectin with DE79 (A) and A pectin with DE74 (O). Top left pH 5.8; top right pH 8.5; middle row pH 5.3 and 7.5; bottem row pH 4.3 and 6.5, respectively.
86
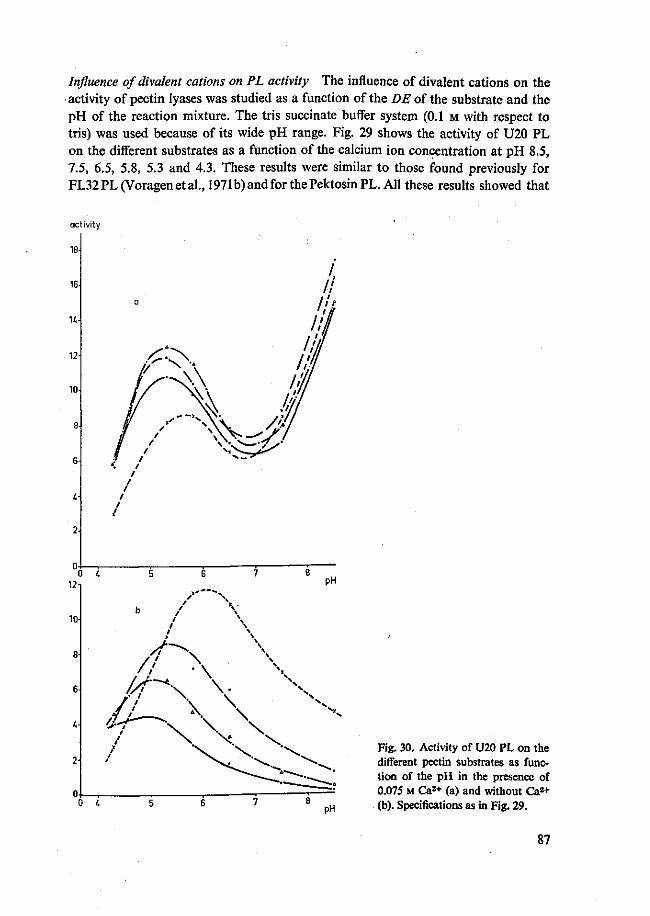
Influence of divalent cations on PL activity The influence of divalent cations on the activity of pectin lyases was studied as a function of the DE of the substrate and the pH of the reaction mixture. The tris succinate buffer system (0.1 M with respect to tris) was used because of its wide pH range. Fig. 29 shows the activity of U20 PL on the different substrates as a function of the calcium ion concentration at pH 8.5, 7.5, 6.5, 5.8, 5.3 and 4.3. These results were similar to those found previously for FL32PL(Voragenetal., 1971b) and for the Pektosin PL. All these results showed that
activity
18-
16-
14-
12-
10
2-
0 4 12
10-
pH
0 4 PH
Fig. 30. Activity of U20 PL on the different pectin substrates as function of the pH in the presence of 0.075 M Ca2+ (a) and without Ca3+ (b). Specifications as in Fig. 29.
87

up to a certain concentration calcium is an activator for A pectins with a DE of 74, 79 and 86%. The optimum concentration ranges were between 0.075 M and 0.15 M, except for pH 7.5 where the optimum was not yet reached at 0.3 M. For 95 % esterified pectin the action of Ca2+ depended on the pH. At pH 8.5 and 7.5 it activated, at pH 6.5 and 5.8 it acted as an inhibitor and at the still lower pH values 5.3 and 4.3 there was only a little influence on the enzyme activity. Calcium concentrations necessary to produce these effects may be different in other buffers with a calcium chelating action that is different from succinate. In the buffer system used the succinate concentrations varied from about 0.01 M in the buffer of pH 8.3 to 0.1 M in the buffer of pH 4.3. However, for the FL32 PL analogous results were obtained when 0.05 M
activity
10
8-
DE95
10'
8-
2- :•
8 9 PH
activity
10-
8-
DE7i
10
6-
2-
9 pH
DE 79
9 pH
Fig. 31. Influence of divalent cations on F132 PL activity on A pectins with different DE as a function of the pH. Reaction mixtures contained 0.038 enzyme units. Blanks without divalent cations (•), with 0.1 M Mg2+ (A) , with 0.1 M Ca2+ ( x ) and with 0.1 M Sr2+ (o).
88

tris succinate buffers (0.05 M with respect to succinate) were used. Fig. 30 shows the activity of U20 PL, as a function of the pH value, on the different
pectins with (a) and without 0.075 M Ca2+ (b). The curves without calcium show the optimum pH value shifting from about 6.1 for 95% esterification to about 4.9 for 74 % esterification. At the optimum pH and at pH values up to 8.5, activities decreased with decreasing degree of esterification. At pH 4.3 however, the 95% esterified pectin showed the lowest activity. Upon addition of Ca2+ various effects could be noted; the optimum pH values of the 95 and 86% esterified pectin shifted from about 6.1 to 5.6 and from about 5.4 to about 5.3 respectively. Under these conditions the enzyme now showed the least activity on the 95 % esterified pectin. Above pH 6.5 all activities were seen to increase. At pH 8.5 (the highest value which can be measured without saponification and chemical transelimination occurring) the activity on 86 % esterified pectin was still a little higher than on 95 % esterified pectin, followed by resp. 79 and 74% esterified pectin.
The influence of other divalent cations magnesium and strontium was studied for one concentration (0.1 M) and only on FL32 PL. The results are shown in Fig. 31. This graph illustrates that Mg2+ and Sr2+ have similar effects on PL activity on the different substrates in the various reaction conditions. On pectins with a DE of 74, 79 and 86% Sr2+ and Mg2+ produced higher activities than Ca2+. Above pH 6.5 and in the presence of Ca2+ and Sr2+ all activities were seen to increase. At pH 8.6, Mg precipitated as Mg(OH)2 so that activity measurements were impossible. Below pH 6.5 there also seemed to be a difference in the pH range where the different cations showed optimum activation. For all substrates optimum activation of Mg2+ occurred in the pH range 5.7 to 6; Sr2+ at about pH 5.5 for 74, 79 and 86% esterified pectin (about the same optimum was found for the blanks), and in the pH range 5.5 to 6 for 95% esterified pectin. Optimum activation of Ca2+ occurred at about pH 5.3 for 86, 79 and 74% esterified pectin and at pH 5.5 for 95% esterified pectin.
Requirement of multivalent cations The activity of FL32 PL on 95% and 74% esterified pectin in the presence of 0.005 M EDTA was studied for various pH values in the reaction mixture. This mixture consisted of tris succinate buffer (0.1 M with respect to tris), 8 mM/litre substrate, 85.8 x 10"3 units of enzyme and 0.005 M/litre EDTA. The results are summarized in Table 15. From this table it can be seen that multivalent ions are not required by the lyase for the degradation of both substrates.
Breakdown mechanism on high polymer substrates Information on the breakdown mechanism was obtained from the relationship between increase in ultraviolet ab-sorbance and reciprocal specific viscosity. This relationship has already been described and the results are shown in Fig. 14. For pH 5.9, 6.5 and 7.3 rather uniform and linear curves were obtained. At lower pH values the curves were nonlinear and evidence was found that in these circumstances other effects were involved. In Table 16, I summarized for different preparations at various pH values the increase in absorb-ance measured during the time necessary to reduce the viscosity by 50%.
89
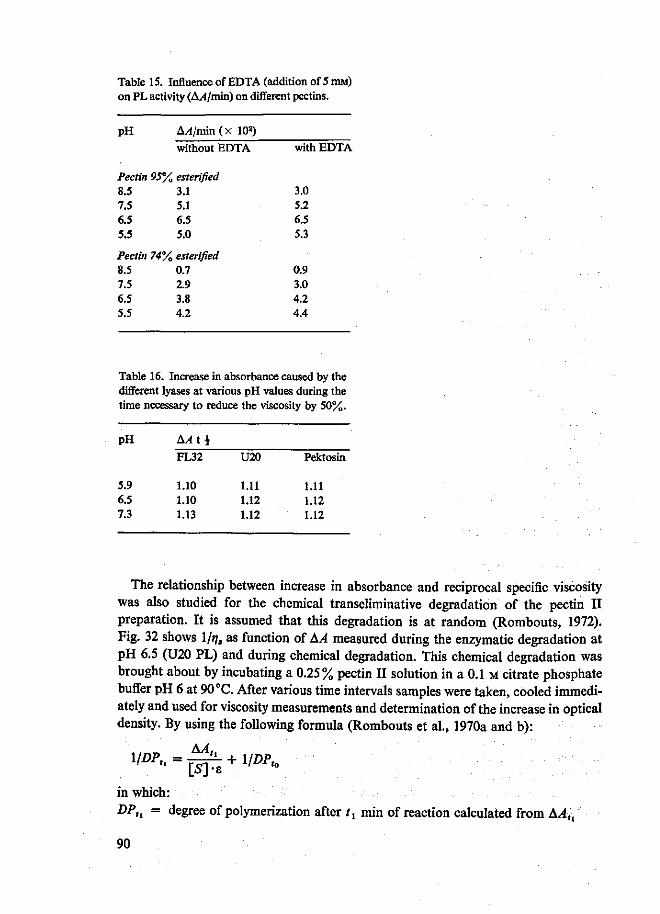
Table 15. Influence ofEDTA (addition of 5 min) on PL activity (A/l/min) on different pectins.
pH AAjmm ( x 102)
without EDTA
Pectin 95% esterified 8.5 3.1 7.5 5.1 6.5 6.5 5.5 5.0
Pectin 74% esterified 8.5 0.7 7.5 2.9 6.5 3.8 5.5 4.2
with EDTA
3.0 5.2 6.5 5.3
0.9 3.0 4.2 4.4
Table 16. Increase in absorbance caused by the different lyases at various pH values during the time necessary to reduce the viscosity by 50%.
PH
5.9 6.5 7.3
Ay4t i FL32
1.10 1.10 1.13
U20
1.11 1.12 1.12
Pektosin
1.11 1.12 1.12
The relationship between increase in absorbance and reciprocal specific viscosity was also studied for the chemical transeliminative degradation of the pectin II preparation. It is assumed that this degradation is at random (Rombouts, 1972). Fig. 32 shows \\r\s as function of A A measured during the enzymatic degradation at pH 6.5 (U20 PL) and during chemical degradation. This chemical degradation was brought about by incubating a 0.25% pectin II solution in a 0.1 M citrate phosphate buffer pH 6 at 90 °C. After various time intervals samples were taken, cooled immediately and used for viscosity measurements and determination of the increase in optical density. By using the following formula (Rombouts et al., 1970a and b):
l/DP" = W-e + l'DP* in which: DPtl = degree of polymerization after tt min of reaction calculated from AAtl
90
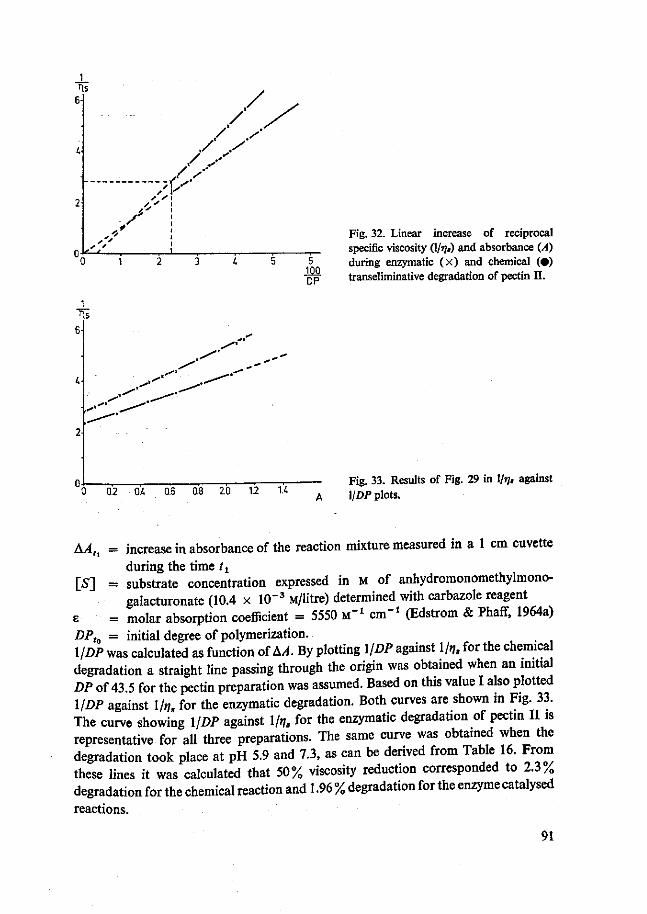
Fig. 32. Linear increase of reciprocal specific viscosity (l/?;») and absorbance {A) during enzymatic ( x ) and chemical (•) transeliminative degradation of pectin II.
1
0.2 0A OB 0.8 20 1.2 U A y D p j ^ Fig. 33. Results of Fig. 29 in l/rj, against
AAtl = increase in absorbance of the reaction mixture measured in a 1 cm cuvette
during the time tt [S] = substrate concentration expressed in M of anhydromonomethylmono-
galacturonate (10.4 x 10"3 M/litre) determined with carbazole reagent E = molar absorption coefficient = 5550 M"1 cm"1 (Edstrom & Phaff, 1964a) DPto = initial degree of polymerization. l/DP was calculated as function ofAA. By plotting l/DP against 1/ij. for the chemical degradation a straight line passing through the origin was obtained when an initial DP of 43.5 for the pectin preparation was assumed. Based on this value I also plotted l/DP against \hs for the enzymatic degradation. Both curves are shown in Fig. 33. The curve showing l/DP against 1/ij, for the enzymatic degradation of pectin II is representative for all three preparations. The same curve was obtained when the degradation took place at pH 5.9 and 7.3, as can be derived from Table 16. From these lines it was calculated that 50% viscosity reduction corresponded to 2.3/0
degradation for the chemical reaction and 1.96 % degradation for the enzyme catalysed reactions.
91
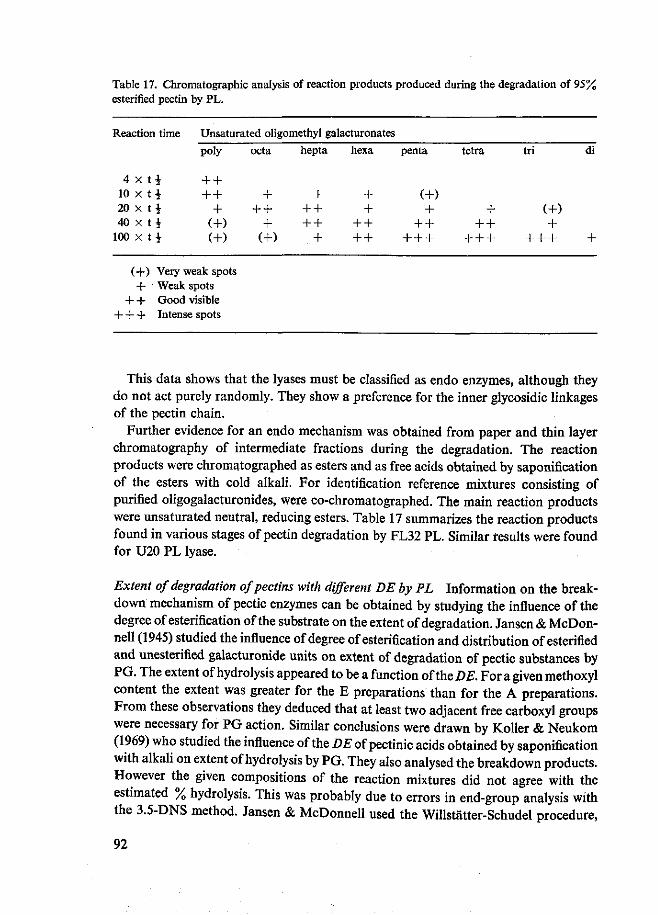
Table 17. Chromatographic analysis of reaction products produced during the degradation of 95% esterified pectin by PL.
Reaction time
4 x t i l O x t f 20 x t i 40 X t i
100 X t i
Unsaturated oligomethyl galacturonates
poly
+ + + +
+ (+) (+)
(+ ) Very weak spots + Weak spots
+ + Good visible + + + Intense spots
octa
+ + +
+ (+)
hepta
+ + + + +
+
hexa
+ +
+ + + +
penta
(+) +
+ + + + +
tetra
+ + +
+ + +
tri
(+) +
+ + +
di
+
This data shows that the lyases must be classified as endo enzymes, although they do not act purely randomly. They show a preference for the inner glycosidic linkages of the pectin chain.
Further evidence for an endo mechanism was obtained from paper and thin layer chromatography of intermediate fractions during the degradation. The reaction products were chromatographed as esters and as free acids obtained by saponification of the esters with cold alkali. For identification reference mixtures consisting of purified oligogalacturonides, were co-chromatographed. The main reaction products were unsaturated neutral, reducing esters. Table 17 summarizes the reaction products found in various stages of pectin degradation by FL32 PL. Similar results were found for U20 PL lyase.
Extent of degradation of pectins with different DE by PL Information on the breakdown mechanism of pectic enzymes can be obtained by studying the influence of the degree of esterification of the substrate on the extent of degradation. Jansen & McDonnell (1945) studied the influence of degree of esterification and distribution of esterified and unesterified galacturonide units on extent of degradation of pectic substances by PG. The extent of hydrolysis appeared to be a function of the DE. For a given methoxyl content the extent was greater for the E preparations than for the A preparations. From these observations they deduced that at least two adjacent free carboxyl groups were necessary for PG action. Similar conclusions were drawn by Roller & Neukom (1969) who studied the influence of the DE of pectinic acids obtained by saponification with alkali on extent of hydrolysis by PG. They also analysed the breakdown products. However the given compositions of the reaction mixtures did not agree with the estimated % hydrolysis. This was probably due to errors in end-group analysis with the 3.5-DNS method. Jansen & McDonnell used the Willstatter-Schudel procedure,
92
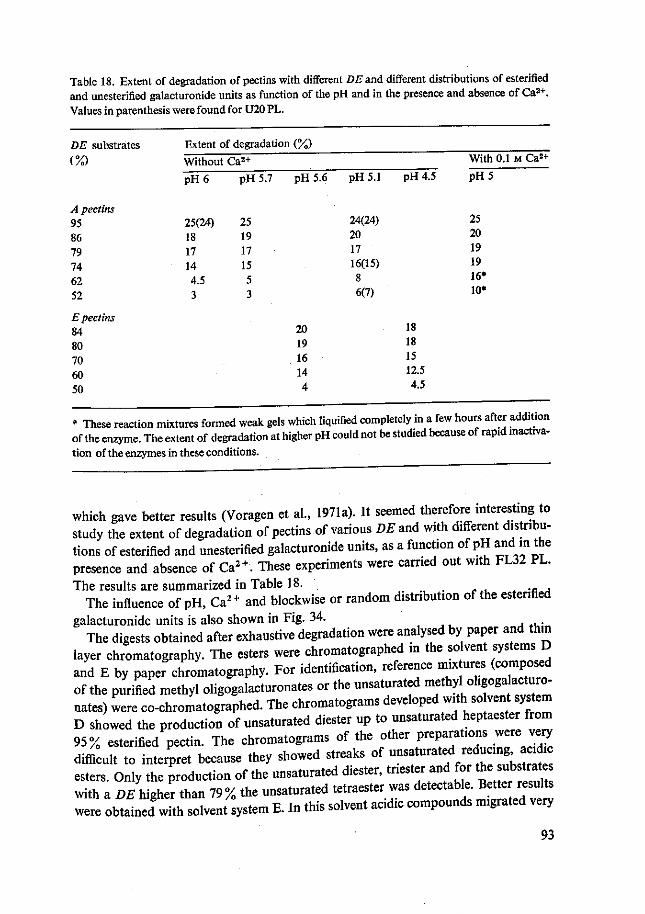
Table 18. Extent of degradation of pectins with different DE and different distributions of esterified and unesterified galacturonide units as function of the pH and in the presence and absence of Ca2+. Values in parenthesis were found for U20 PL.
DE substrates
(%)
A pectins 95 86 79 74 62 52
E pectins 84 80 70 60 50
Extent o
Without
pH6
25(24) 18 17 14 4.5 3
f degradation
Ca2+
pH
25 19 17 15 5 3
5.7
(%)
pH5.6
20 19 16 14 4
pH5.1
24(24) 20 17 16(15) 8 6(7)
pH4.5
18 18 15 12.5 4.5
With 0.1 M Ca2+
pH5
25 20 19 19 16* 10*
* These reaction mixtures formed weak gels which liquified completely in a few hours after addition of the enzyme. The extent of degradation at higher pH could not be studied because of rapid inactiva-tion of the enzymes in these conditions.
which gave better results (Voragen et al., 1971a). It seemed therefore interesting to study the extent of degradation of pectins of various DE and with different distributions of esterified and unesterified galacturonide units, as a function of pH and in the presence and absence of Ca2+. These experiments were carried out with FL32 PL. The results are summarized in Table 18. . . , . . , * -c A
The influence of pH, Ca2+ and blockwise or random distribution of the esterified
galacturonide units is also shown in Fig. 34. The digests obtained after exhaustive degradation were analysed by paper and thin
layer chromatography. The esters were chromatography in the solvent systems D and E by paper chromatography. For identification, reference mix ures (composed of the purified methyl oligogalacturonates or the unsaturated ™«Wohf*f«™-nates) were co-chromatographed. The chromatograms developed w^h so vent system D showed the production of unsaturated diester up to unsaturated heptaester from 95% esterified pectin. The chromatograms of the other preparations were very difficult to interpret because they showed streaks of unsaturated reducing aod c esters. Only the production of the unsaturated diester, tnester and for the sub trate with a ^ h i g h e r than 79% the unsaturated tetraester was detectabfc. B t er resul* were obtained with solvent system E. In this solvent acidic compounds migrated very
93

% degradation 301
20-
10-
^ 40 60 80 100 DE
Fig. 34. Extent of degradation of substrates with different DE and different distribution of esterified and unesterified galacturonide units (A and E preparations) with FL32 PL. A pectins, pH 6 (•), A pectins, pH 5.7 (A), A pectins, pH 5.1 (O), A pectins, pH 5 + 0.1 M Ca2+ (•) and E pectins, pH 5.6 (x ).
slowly. For preparations with a DE higher than 79 % spots for unsaturated penta-methylgalacturonates could be illustrated.
Further information on the size of the reaction products was obtained by saponification with cold alkali of the mixtures of fully and partially esterified oligogalacturo-nates to the corresponding acids. After removal of the cations, the samples were concentrated and analysed by paper chromatography in solvent system C and by thin layer chromatography. The results of the different chromatographic analyses were combined and set out in Table 19 to give a complete characterization of the reaction products. The compounds had an unsaturated character and especially the higher oligogalacturonates were identified as partial esters. The digests of all preparations except the 95 % esterified pectin, contained material that did not migrate from the starting point. These are reaction products with a DP higher than 7. The reaction products formed at pH 5.6 were practically the same as those produced at pH 6. Table 19 shows that the size of the reaction products increases with decreasing DE. Also the amounts of the higher oligomers produced increases. For the preparations with a DE higher than 79% the production of unsaturated tetramethyltetra, trimethyltri and dimethyldigalacturonates could be demonstrated. The higher reaction products and the reaction products of the preparations with a lower DE were partial esters. Probably small amounts of fully esterified products were also present. However these were not detectable.
The picture was different for the E preparations. For all preparations unsaturated
94
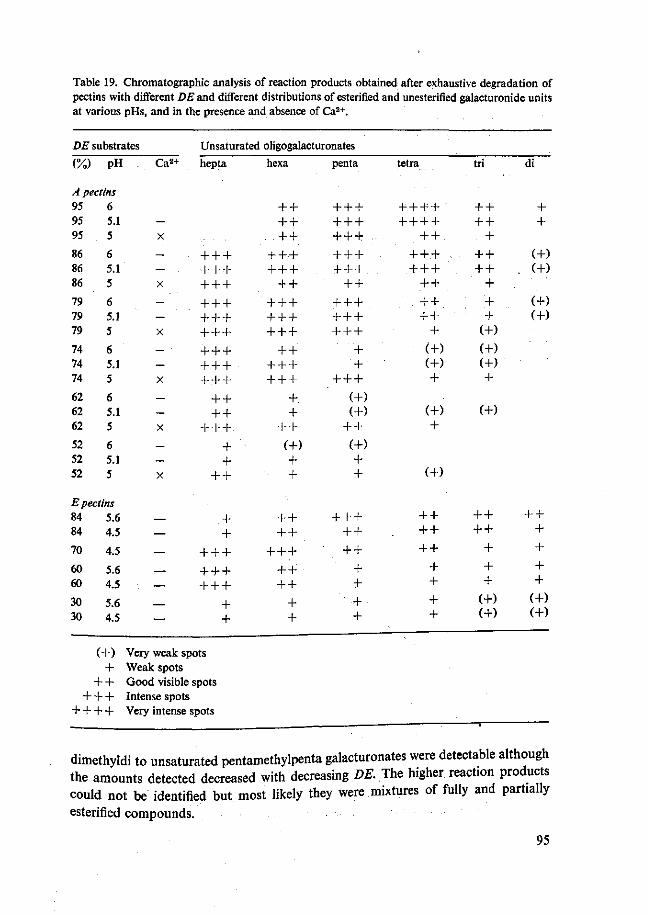
Table 19. Chromatographic analysis of reaction products obtained after exhaustive degradation of pectins with different DE and different distributions of esterified and unesterified galacturonide units at various pHs, and in the presence and absence of Ca2+.
DE substrates
(%) pH
A pectins 95 95 95
86 86 86
79 79 79
74 74 74
62 62 62
52 52 52
6 5.1 5
6 5.1 5
6 5.1 5
6 5.1 5
6 5.1 5
6 5.1 5
E pectins 84 84
70
60 60
30 30
5.6 4.5
4.5
5.6 4.5
5.6 4.5
(+) +
+ + + + +
+ + + +
Ca2+
— X
— — X
— — X
— — X
— — X
— — X
— —
—
—
Unsaturated oligogalacturonates
hepta
+ + + + + + + + + + + + + + + + + + + + + + + + + + +
+ + + +
+ + + + +
+ +
+ +
+ + + + + + + + +
+ +
Very weak spots Weak spots Good visible spots Intense spots Very intense spots
hexa
+ + + +
.+ + + + + + + +
+ + + + + + + + + + +
+ + + + + + + +
+, +
+ + (+) +
• +
+ + + +
+ + + + + + +
+ +
penta
+ + + + + + + + + -•
+ + + •
+ + +. + +
+ + + + + + + + +
+ +
+ + + (+) (+)
+ + (+) + +
+ + + + +
• + +
+ + + +
tetra
+ + + + + + + +
+ +. ++.+ + + +
+ + . + + + +
+ (+) (+) +
(+) +
(+)
+ + + + + +
+ + + +
tri
+ + + +
+ + + + +
+ + +
(+) (+) (+) +
(+)
+ + + +
+ + +
(+) (+)
di
+ +
(+) . (+)
(+) (+)
+ + + + + +
(+) (+)
dimethyldi to unsaturated pentamethylpenta galacturonates were detectable although the amounts detected decreased with decreasing DE. The higher reaction products could not be identified but most likely they were mixtures of fully and partially esterified compounds.
95

Ca2+ were found to cause an increase in the extent of degradation of A pectins. This greater extent of degradation was however not reflected in the amount and size of the reaction products. On the contrary, chromatographic analysis of these reaction products as esters and as acids showed that much smaller amounts of tetramer, trimer and dimer were produced.
The paper chromatograms of the acids however showed a dense spot of a reducing compound which migrated a bit faster than monogalacturonic acid. This compound has not yet been identified.
PL activity on methyl oligogalacturonates Additional characterization and differentiation of the pectin lyases can be obtained by studying their activities and patterns of action on oligogalacturonide methyl esters. Edstrom & Phaff (1964b) showed that their PL catalysed a transelimination reaction with tetramethyltetragalacturonate and the higher esters. From the reaction rates and from paper chromatographic analysis of the reaction products, they deduced that the lyase could not split the two glycosidic bonds nearest the reducing end of fully esterified polygalacturonates and was severely limited in its ability to split the bonds nearest the non-reducing end
Fig. 35. L-B plots of FL32 PL ( x ) and U20 PL (•) action on hexamethylhexagalactur-onate. Reaction mixtures contained 0.68 units of FL32 or 0.3 units of U20 PL. Reaction velocity, v is expressed as increase in absorbance per min in a 1 cm cuvette.
96

(see also Section 2.4). I tried to estimate the Km and FM J values for the oligomer substrates e.g. hexaester
to diester and the partial esters of the dimer and trimer and to analyse the reaction products of the oligomer degradation. Spectrophotometric activity was measured in 1.9 ml reaction mixtures consisting of 0.4 ml 0.3 M citrate phosphate buffer pH 6, 0.5 ml enzyme solution, x ml distilled water and 1-x ml of a fresh substrate solution.
Activities were lower when the substrate solutions had been stored for one or two weeks in a refrigerator. Results were only reproducible for hexamethylhexagalacturo-nate (see Fig. 35). The following Km values were found: For FL32 pectin lyase 1.8 mg/ml (9.4 mM) and for U20 pectin lyase 6.4 mg/ml (33 mM). From these data it also appeared that Vmax obtained for hexamethylhexagalacturonate with 1 unit of FL32 PL was not the same as the Vmax obtained with 1 unit of U20 pectin lyase. These values were 0.163 and 0.19 A A per min per unit of enzyme respectively.
Because of very low or no activity on the methyl oligogalacturonates smaller than hexamer it was not possible to make reliable L-B plots for these substrates and no Km and Vmax values could be estimated. Therefore the reaction rates on the various oligomers were measured at one high substrate concentration. Increase in absorbance of 3 ml reaction mixtures consisting of enzyme and 12 mM/litre of the oligomers in 0.08 M citrate phosphate buffer pH 6 were measured. The results are summarized in Table 20. The first part of this table gives the Fma;c values, measured for the hexamer and for pectin I in the same reaction conditions. The second part lists the activities measured on the oligomers at the same concentration level and under the same reaction conditions. This table also represents the relative rates which are calculated when the activity on the hexamer is fixed at 100. Parallel to these experiments blanks (without addition of enzyme) were also measured. Under these reaction conditions I observed an increase in A without enzyme, although it was very small for the hexa, penta, tetra and partial esters; for the diester and triester the increase
Table 20. Activities and relative rates of activities (A/f/min) of PLs on pectin and methyl oligoga
lacturonates.
Substrate
Pectin I Hexamethylhexagalacturonate
Hexamethylhexagalacturonate Pentamethylpentagalacturonate Tetramethyltetragalacturonate
* Vma» calculated from Fig. 31.
PL
U20 A/l/min
0.875* 0.057*
0.033 0.0066 0.0013
Rel. rate (%)
100 6.25
100 20 3.9
FL32
A/4/min
1.998* 0.111*
0.028 0.0055 .0.0015
Rel. rate (%)
100 5.55
100 19.6 5.6
Pektosin
A/4/min
r
0.044 0.011 0.0025
Rel. rate (%)
•
100 25 5.7
97

Table 21. Chromatographic analysis of reaction products of methyl oligogalacturanates-acted upon by PL.
Substrate
Dimethyldigalacturonate Trimethyltrigalacturonate Tetramethyltetragalacturonate Pentamethylpentagalacturonate Hexamethylhexagalacturonate
(+) Very weak spots + Weak spots
+•+ Good visible spots
Galacturonates formed
saturated
mono
(+) (+)
... + . (+) +
di
(+)
+ + +
tri
+ +
unsaturated
tri tetra
+ -+ • +
+ + +
was substantial. For trimethyltrigalacturonate there seemed to be a small difference between the increase in absorbance measured in the presence and absence of enzyme. However this difference was too small for any conclusion to be made about lyase activity on this triester. On the diester and the partial esters no activity was indicated.
The patterns of action of the lyases on the oligomer substrates were studied by paper chromatographic analysis of the reaction products obtained after 50 h incubation. The reaction products were also saponified in the cold and chromato-graphed as free acids in solvent system C. These chromatograms confirmed the results obtained by chromatography of the esters in solvents D and E. The action patterns of the PLs on the oligo galacturonide methyl esters are summarized in Table 21.
From this table it can be seen that small amounts of monomer were also found in the reaction mixtures of the dimer, trimer, pentamer and hexamer. In the reaction mixture of the triester some dimer was also indicated. Equivalent amounts of these products were indicated in the blanks (no enzyme added), so these compounds were probably due to artefacts connected with the Dowex 50W (H+) treatment or the lyophilization of the acidic solutions. Identical results were obtained for the three PL preparations and they agree with data reported by Edstrom & Phaff (1964b). From the chromatographic analysis of the reaction mixture of the triester no conclusion could be made about pectin lyase activity on the trimer.
Influence of oligouronic acids and methyl oligogalacturonaies (saturated and unsaturated) on the degradation of pectin by pectin lyase PLs occur in pectolytic enzyme preparations together with PEs, PGs and perhaps PMGs. During the action of a pectolytic enzyme preparation on pectic substances every enzyme gives characteristic products. These products may influence the activity of the enzyme itself (product inhibition) or the activity of other enzymes. It has already been shown that PL is not
98
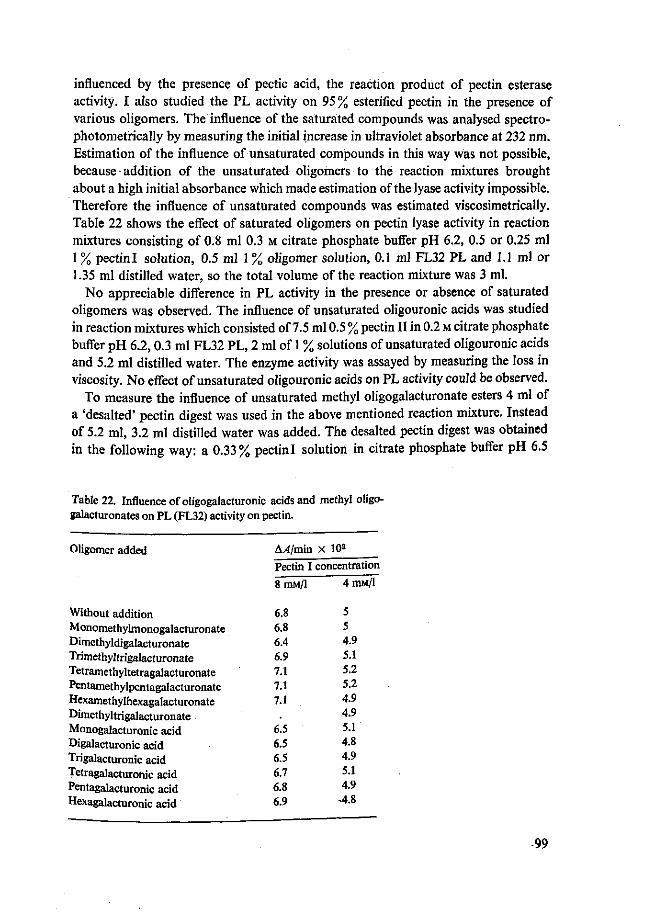
influenced by the presence of pectic acid, the reaction product of pectin esterase activity. I also studied the PL activity on 95 % esterified pectin in the presence of various oligomers. The influence of the saturated compounds was analysed spectro-photometrically by measuring the initial increase in ultraviolet absorbance at 232 nra. Estimation of the influence of unsaturated compounds in this way was not possible, because addition of the unsaturated oligomers to the reaction mixtures brought about a high initial absorbance which made estimation of the lyase activity impossible. Therefore the influence of unsaturated compounds was estimated viscosimetrically. Table 22 shows the effect of saturated oligomers on pectin lyase activity in reaction mixtures consisting of 0.8 ml 0.3 M citrate phosphate buffer pH 6.2, 0.5 or 0.25 ml 1 % pectinl solution, 0.5 ml 1 % oligomer solution, 0.1 ml FL32 PL and 1.1 ml or 1.35 ml distilled water, so the total volume of the reaction mixture was 3 ml.
No appreciable difference in PL activity in the presence or absence of saturated oligomers was observed. The influence of unsaturated oligouronic acids was studied in reaction mixtures which consisted of 7.5 ml 0.5 % pectin II in 0.2 M citrate phosphate buffer pH 6.2,0.3 ml FL32 PL, 2 ml of 1 % solutions of unsaturated oligouronic acids and 5.2 ml distilled water. The enzyme activity was assayed by measuring the loss in viscosity. No effect of unsaturated oligouronic acids on PL activity could be observed.
To measure the influence of unsaturated methyl oligogalacturonate esters 4 ml of a 'desalted' pectin digest was used in the above mentioned reaction mixture. Instead of 5.2 ml, 3.2 ml distilled water was added. The desalted pectin digest was obtained in the following way: a 0.33% pectinl solution in citrate phosphate buffer pH 6.5
Table 22. Influence of oligogalacturonic acids and methyl oligo-galacturonates on PL (FL32) activity on pectin.
Oligomer added A/i/min x 102
Pectin I concentration
8 mM/1 4 HIM/1
Without addition Monomethylmonogalacturonate Dimethyldigalacturonate Trimethyltrigalacturonate Tetramethyltetragalacturonate Pentamethylpentagalacturonate Hexamethylhexagalacturonate Dimethyltrigalacturonate Monogalacturonic acid Digalacturonic acid Trigalacturonic acid Tetragalacturonic acid Pentagalacturonic acid Hexagalacturonic acid
6.8 6.8 6.4 6.9 7.1 7.1 7.1
6.5 6.5 6.5 6.7 6.8 6.9
5 5 4.9 5.1 5.2 5.2 4.9 4.9 5.1 4.8 4.9 5.1 4.9 •4.8
99
was treated with pectin lyase. After 72 h incubation 25 % degradation was obtained. This digest was treated with Dowex 50 W (H+) and Dowex 3 (OH -) to remove buffer ions. Next the solution was boiled for 5 min to inactivate the enzyme. Addition of 4 ml of this desalted digest in the reaction mixture caused a much lower viscosity reduction. In this way product inhibition is demonstrated. These experiments also indicate that the lyase has affinity for the esterified and not for the unesterified unsaturated oligomers.
100
5 Discussion
5.1 Oligogalacturonides
5.1.1 Isolation
The production of mixtures of oligogalacturonic acids by hydrolysing pectic acid with commercial pectolytic enzyme preparations was satisfactory. Unfortunately these preparations also contained exo PGs that produced considerable amounts of monogalacturonic acid especially when reaction times were long. This resulted in a lower yield of the higher oligomers. For this reason degradation with a pure endo PG as used by Nagel & Wilson (1969) would have been better. Because I was interested in the isolation of the oligomers only (monogalacturonic acid is commercial available) the monogalacturonic acid was partly removed from the reaction mixture as sodium-strontium salt. In this way bigger amounts of the oligomers could be adsorbed on the anion exchanger.
Good results were obtained for the fractionation of the oligomers on Dowex 1 (acetate) columns by means of gradient elution with sodium acetate pH 6. Following the method of Nagel & Wilson (1969) I also used Dowex 1 formate columns and sodium formate pH 4.7 as eluant. This system gave better results especially for the fractionation of the unsaturated galacturonic acids. Because only a part of the fractions of well separated peaks were collected to prevent contamination with impurities, which co-chromatograph with the front and tail of the peaks, no data could be given for the output of this purification. Di to octa galacturonic acid was obtained in this way but heptamer and octamer in only very small amounts Ine degradation of pectic acid with endo PAL gave mixtures with compositions related to the extent of degradation. For the production of unsaturated d! and tn galacturonic acid, longer reaction times were necessary and these digests contained also some unsaturated and saturated monomer (figs. 7a and 7b).
To produce unsaturated oligouronic acids with a DP higher than 4 it may be better to degrade 86 or 79 % esterified pectin with pectin lyase and then saponif)r tfcreaction Products. Table 19 shows that relatively large amounts of unsaturated pentamers hexamers and heptamers are produced during the complete degradation of these
" S S ^ f r a c t i o n a t i o n of the unsaturated oligouronic ^ s - not as good as for the saturated compounds. A combination of s t e p w * . ^ ^ elution was satisfactory for the separation of unsaturated d, and tn galacturonic
101
acid (Fig. 7b). The higher oligomers could only be separated by stepwise elution according to Nagel & Wilson (1969).
The procedure described for the isolation of unsaturated monomer gave good results. The yields of the fractionations on the anion exchanger were more than 90%. However during concentration, conversion to the acid form and extraction of formic acid, 25 % of the material was lost. The compound, which was found to be pure by paper chromatography, still gave a positive carbazole test (Rouse & Atkins modification). In the McComb & McCready modification of the carbazole assay the compound gave a negative test. The compound was found to be very unstable at pH 11 and, to a lesser extent, at pH 3. Probably the compound was completely destroyed in the reaction conditions of the McComb & McCready assay. The unsaturated oligo-galacturonides were found to react quantitatively in both modifications.
The esterification of the oligouronic acids was almost quantitative. However, during purification of the crude reaction products by preparative paper chromatography only a yield of 30 % was obtained. By preparative thin layer chromatography good separations were obtained, but after extraction of the methylated compounds and evaporation of the extracts to dryness the residues were found to be mixtures of partially esterified oligogalacturonides.
5.1.2 Characterization
The characteristics of the saturated and unsaturated oligogalacturonic acids (Table 5 and 6) are comparable with those described in literature. Only unsaturated tetra-galacturonic acid showed a low COOHrCHO ratio, although chromatographically the compound was found to be homogeneous. The compounds still contained a considerable amount of water. The purity of the saturated oligogalacturonic acids is also indicated in Fig. 9 which shows a linear relationship for RM against DP for various solvent systems. The data were consistent for a homologous series of compounds of increasing chain length, showing that the increase in DP comes from the addition of the same monosaccharide by the same glycosidic linkage as already present. For the unsaturated oligogalacturonic acids a linear relationship was only found for the trimer and higher compounds. Fig. 11 indicates the homogeneity of the homologous series of saturated and unsaturated methyl oligogalacturonates. For compounds with a Rgai (or RMegal) > 1, RM cannot be calculated.
The molar extinction coefficients in the ultraviolet assay for unsaturated digalactu-ronic and trigalacturonic acid were in close agreement with the values reported by Nagel & Wilson (1969), (Table 6). For unsaturated tetragalacturonic acid my value was about 10% less. All the values were of about the same order and seemed to be independent of chain length. Therefore the ultraviolet assay may be used as a quantitative test. The periodate TBA test can not be used as a quantitative assay. In this assay, unsaturated monogalacturonic acid showed a molar absorptivity 20 times higher than the unsaturated dimer, while the values found for unsaturated trimer and tetramer were 1.7 and 2.7 times higher respectively. A quantitative evaluation of endo
102

lyase activity by this method was therefore impossible; the assay can only be used as a qualitative test.
It was noticed that in neutral, aqueous solutions the methyl oligogalacturonates were not stable; particularly the dimer and trimer. The pectin lyases showed higher activities on fresh solutions of the esters than on solutions which had been stored for a week. Therefore fresh solutions had to be used in the experiments.
Characterization of the partial esters of digalacturonide and trigalacturonide by effecting a chemical transelimination reaction was not possible. The reaction mixture showed only a weak positive periodate TBA assay. Its reaction products resulted from transeliminative degradation and saponification reactions. In a recent publication on the kinetics of the esterification of mono, di and tri galacturonic acid with methanol, Nagel (1971) suggested that during methylation of digalacturonic and trigalacturonic acid either one of the carboxyl groups is esterified more readily or as soon as one of the carboxyl groups is esterified the ester somehow hinders esterification of the carboxyl groups that remain. Based on a study of structural models, Nagel (1971) stated that if one of the carboxyl groups is more readily esterified, it is most likely to be the group at the non-reducing end of the molecule. Supporting data for the observation of Nagel that one carbolyl group is preferably methylated were found in the paper chromatographic analysis of the reaction products obtained after partial methylation of digalacturonic (50%) and trigalacturonic acid (33 and 66%). As main end-products respectively monomethyl digalacturonate, monomethyltrigalacturonate and dimethyltrigalacturonate were identified. This can only be explained by differences in reactivities of the carboxylic groups before or during methylation. PMR studies of these preparations showed that in monomethyldigalacturonate the carboxyl group on the reducing unit was esterified and not the carboxyl group on the non-reducing end. In monomethyltrigalacturonate and dimethyltrigalacturonate the reducing unit sugar was esterified in preference to the non-reducing and middle sugar unit.
The partial esters of dimer and trimer, which have been characterized very well, were thought to be interesting substrates, especially in relation to the illustrated influence on the degree of esterification of pectin substrates on PAL and PL activity (Voragen et al., 1971b). The PLs showed however no activity on these oligomers. Better substrates are probably the partial esters of tetramer and pentamer. With the knowledge obtained from the PMR studies it seems possible to characterize these compounds.
The purified, periodate TBA reactive compound isolated from the culture liquid of a Flavobacteriwn showed the same Rgal value in paper chromatographic analysis with solvents B and C as the monomeric compound produced by Bacillus polymyxa endo PAL (Rombouts, 1972). The Rgal value estimated in solvent B was the same as the value reported by Fuchs (1965) for unsaturated monomer. The compound showed no absorption in the ultraviolet region, it had the same reducing power as glucuronic acid and behaved as an a-keto acid. From this data the compound was identified as unsaturated monomer. Based on a quantitative reaction in the Rouse & Atkins carbazole assay, a molar extinction coefficient in the periodate TBA assay ot 7875U
103

was calculated. Therefore, especially for the study of transeliminative oligomer degradation, the periodate TBA assay can only be used as a qualitative test.
5.2 Pectin lyases
5.2.1 Occurrence and isolation
Qualitative assays for detecting the presence of pectin lyases were usually carried out according to the methods described by Albersheim et al. (1960b). In their ultraviolet assay, samples taken during the enzymatic degradation of pectin are diluted to a suitable extent and from these solutions the ultraviolet absorbance at 235 nm is measured. In the thiobarbituric acid assay, 1 ml pectin digest is reacted with thio-barbituric acid. The formation of a chromogen with an absorption maximum at 549 nm indicates the presence of unsaturated products in the digest. The absorption measured in the ultraviolet assay can be evaluated quantitatively. In my work I observed that reduction of the viscosity of a pectin solution up to 30 %, caused by a purified PL, did not give a positive ultraviolet or TBA assay. Only after longer reaction times did the tests become positive. Edstrom & Phaff (1964a) assayed PL activity by plotting directly the increase in ultraviolet absorbance with a recorder. For this procedure they used a purified substrate (Pectin M, Section 2.4.3). Bush & Codner (1968) and Byrde & Fielding (1968) using the same method, centrifuged their pectin solutions at 34 000 x g to remove colloidal particles. If the substrate solutions still contain such particles and are optically dense, enough light is only transmitted through the cuvette by using a wide slit. This causes a partial or complete loss in sensitivity for this direct assay.
By the action of pectic enzymes, the misty substrate solutions are clarified and there is a decrease in optical density. This may be the reason why lyase activity was only indicated in the indirect ultraviolet assay after longer reaction times and why only small lyase activities were measured while viscosimetrically a high activity on pectin was observed. This activity is then erroneously attributed to PMG activity.
Better results were obtained with a clear solution of highly esterified pectin in 0.1 M citrate phosphate buffer adjusted to pH 6 as substrate for direct spectrophoto-metric activity measurements. These conditions were chosen because it is evident that PLs prefer highly esterified pectin as substrate. A pH of 6.0 is disadvantageous for PGs and PEs of fungal origin (Rombouts, 1972), it is in the optimum pH range for PLs.
The reaction mixtures were composed of 0.25 ml pectin I, 95% esterified (1% solution, pH 6.0) 2.4 ml citrate phosphate buffer (0.1 M trisodium citrate, acidified to pH 6.0 with concentrated o-phosphoric acid) and 0.35 ml of a proper enzyme dilution. Before adding the enzyme sample, the 1-cm quartz cuvettes containing the substrate were equilibrated at 30 °C. The changes in A at 232 nm were recorded directly. Sixteen commercial pectolytic and five commercial cellulolytic enzyme preparations were assayed in this way and were all found to contain PL activity,
104

most of them in considerable amounts. There was a discrepancy between the visco-simetric and spectrophotometry measurements of the activity of Pektolase FL32 a highly esterified pectin. Thus the presence of polymethylgalacturonase in this preparation was suspected, however, efforts to isolate this enzyme by various fractionation procedures were unsuccessful. The relationship between l/r]s and increase in absorbance, brought about during pectin degradation by the fractions was studied systematically. However there was no evidence for the presence of PMG in Pektolase FL32. This relationship could successfully be used to show that the purified PL preparations were free of contaminating pectin hydrolases.
It has already been mentioned (Section 2.4.2) that the PMG, described before 1960 (Table 4a, b; Group II) are rather similar to the PLs which are only active on highly esterified pectin (Table 4a, b; Group IV). If errors are made by assaying pectin degrading enzymes in optically dense solutions, they may lead to the conclusion that PMGs are present in enzyme preparations. Ishii & Yokotsuka (1971) testing 8 commercial pectinases with an indirect ultraviolet assay found that all preparations contained no or only a negligible amount of PL activity. With my more sophisticated assay I found PL to be common in commercial pectinase preparations. I found no evidence for the presence of PMG in Pektolase FL32. From these facts the existence of PMG is unlikely. With the purification procedures used, fractional adsorption on calcium phosphate gel, gel filtration and ion exchange chromatography on DEAE Sephadex, PL preparations were obtained free of other pectolytic enzymes. These preparations however still contained contaminating proteins as was shown by polyacrylamide gel electrophoresis. The lyases all showed an IEP between 3.5 and 3.8.
5.2.2 Characterization
The effects of the pH and the various buffer systems on the activity of the three lyase preparations on 95% esterified pectin were similar. In the reaction conditions used, an optimum pH range of 6.1 to 6.5 was found (figs. 15, 16, 17 and 18) and the highest activities were measured in the citrate phosphate system, followed respectively by the phosphate citrate system, the tris citrate system, the tris succinate and tns HC1 system (not much difference) and finally the tris acetate system. The maximum activity measured in citrate phosphate was about twice the maximum activity measured in tris acetate. Albersheim & Killias (1962) found acetate ions to be inhibitive. Van Houdenhoven (1969) showed that acetate ions act as a competitive inhibitor.
The optimum pH of U20 PL activity on pectins with different degrees of estenfi-cation and with blockwise or random distribution of esterified and unestenned galacturonide units in the pectin molecules appeared to be dependent on the substrate (Fig. 19). With decreasing DE the optimum pH was found to decrease and this decrease was more progressive for the A pectins than for the E pectins. At pH values higher than 6, much higher activities were measured on the E pectins than on the A pectins. , „„ , . . , .
However, from the L-B plots presented in figs. 24, 25, 26 and 27, the highest
105
activities for all preparations at high substrate concentrations, are measured in the pH range 6 to 6.5. These contradictory results can be explained: in the reaction conditions used for the estimation of the optimum pH values, the substrate concentration was to low to saturate the enzyme as can be seen from the same L-B plots and from Fig. 28. These plots also show that by lowering the pH, affinity for the partially saponified pectins increases, so that the enzyme becomes more saturated with substrate and thereby exhibits a higher activity.
For both FL32 and U20 PL an energy of activation of 1.5 kcal/mol was estimated. This value deviates from the values reported by Albersheim & Killias (1962) and Amado (1970) which were 8.4 and 8.18 kcal/mol, respectively. Because of the method I used, I could not compare my results with data given in literature. Albersheim & Killias (1962) determined EA of a purified lyase by measuring the initial velocity of increasing absorbance at 235 nm during enzymatic degradation of a 0.5 % pectin solution at pH 5.3. As substrate 68 % esterified citrus pectin was used. Amado (1970) measured increase in reducing end-groups with the 3.5-DNS procedure during the enzymatic degradation of a 0.2 % pectin solution at pH 5.9. This pectin was obtained by esterification of apple pectin with methanol 2N sulphuric acid to a DE of 96.5 % at about 5 °C. This esterification was accompanied by depolymerization.
From Figs. 27a and 27b it can be seen that Km changes with temperature. The affinity of the enzyme for the substrate which is proportional with l/Km depends therefore on the temperature. It is therefore not sufficient to assume that a substrate concentration which saturates the enzyme at one temperature will saturate it at other temperatures. For a correct estimation of EA, the substrate concentration must be high enough to saturate the enzyme throughout the temperature range that is studied. Dixon & Webb (1965) recommended to extrapolate F^f rom LB or other plots. The substrate concentration in the system of Amado was 0.2 %. As the Km value of his enzyme at 25 °C was 2.17 mg/ml, the enzyme was not saturated with substrate. Albersheim & Killias (1962) used a higher substrate concentration but they did not give enough data for a similar calculation to be made.
Besides the differences already discussed, Albersheim & Killias (1962) and Amadd (1970) used different substrates and the activities were estimated at different pH values. The substrates differed in degree of esterification and as could be expected also in degree of polymerization. Nothing is known about the influence of the pH, DE and DP on the energy of activation of PLs.
As illustrated in Fig. 23 I found that Vmax for substrates of different degrees of esterification was the same for a fixed pH. This was estimated for a reaction temperature of 30 °C, but it was also found to be true for 25 °C and 20 °C. This means that the estimated EA is independent of the degree of esterification of the substrate.
From Fig. 22b it can be seen that the optimum temperature for FL32 PL is about 43 °C. This value was obtained by measuring initial reaction velocities as a function of the temperature, so that inactivation effects by temperature are not involved. This curve also shows a degressive increase of log Vmax at temperatures above ± 25 °C. This indicates that the enzyme activity is adversely influenced by factors other than
106
temperature inactivation. The pH stability curves of Fig. 21b show that incubation of the enzymes for 30 min at 37 °C at pH values between 5 and 6 caused no inactivation of the enzymes. These curves further show that the enzymes were rather stable between pH 4 and 7. At pH values over 7 a rapid inactivation can be observed. The pH stability of my enzymes is rather similar to that described by Edstrom & Phaff (1964b) and Amadd (1970) who found a rapid inactivation at pH values over 8.
From the L-B plots presented in figs. 23, 25, 26 and 27 it can be observed that for all substrates and for a fixed pH value the same Vmax was always extrapolated except for pH values below 5.3. For all concentrations the highest activity was always measured on 95% esterified pectin, although by decreasing the pH the partially saponified pectins improved as substrates in relation to 95 % esterified pectin. At pH values lower than 5.3 these pectins were even better substrates. The enzymes showed higher activities on preparations with a blockwise distribution of esterified and un-esterified galacturonide units than on the corresponding preparations with a random distribution. These data clearly showed that the PLs prefer highly esterified pectin as substrate. The molecules of the various pectin substrates contain less reactive sites with the lowering of the DE, so that higher substrate concentrations are necessary for equal reaction velocity. In these reactive sites the esterified galacturonide units play an important part. However at pH values below 5, maximum activity was measured on the 79 and 86 % esterified preparations. As can be seen from Fig. 28, the affinity for partially saponified pectins increases by lowering the pH and for the lowest pH value measured the enzymes also showed a maximum affinity for these substrates. This indicates that at lower pH values, unesterified galacturonide units are also involved in the reactive sites. From Table 18 and Fig. 33 that show the extent of degradation of pectins of various DEs by FL32 PL as a function of the pH, it can be seen that for all pH values measured, the extent of degradation decreases with decreasing DE. However the E preparations were degraded to a greater extent than the corresponding A preparations. At lower pH values the extent of degradation of the A pectins increases. This trend is also reflected in the results of the chromatographic analysis of the digests obtained after exhaustive degradation of the pectins as shown in Table 19. A decrease in molecular weight and an increase in the amount of oligomers by lowering the pH can be observed. The presence of Ca2+ in the reaction mixture even caused a higher increase in degradation, but this increase could not be seen from the oligomers analysed in the digests. Most probably this must be attributed to artefacts, connected with the preparation of the digests for chromatographic analysis. The E preparations also showed a different picture: For all preparations unsaturated dimethyldi to unsaturated pentamethylpenta galacturonate esters were detectable, thus also indicating a blockwise distribution of esterified and unesterified galacturonide units.
These data suggest that the lyase does not have an absolute requirement for blocks of esterified galacturonide units in the pectin molecule for the formation of an enzyme substrate complex and splitting a glycosidic linkage in this block. These data further indicate that by lowering the pH and by addition of Ca2+, these requirements change
107

and that more unesterified galacturonide units become involved in the reactive sites. Although more bonds are split, the specificity of the lyase does not necessarily change for the different types of glycosidic bonds, e.g. glycosidic bond between two adjacent esterified galacturonide units or glycosidic bond between two adjacent galacturonide units of which one is esterified and the other unesterified (2 types).
Because the affinity of the enzyme for the substrate increases with decreasing pH and DE it appears that the formation of the enzyme-substrate complex is stimulated and the fissionable glycosidic linkages become more accessible. An explanation for this may be that lowering the pH and addition of Ca2 + results in more binding sites or more reactive binding sites on the substrates or more highly reactive binding sites on the enzymes. Calcium ions may serve as replacements for the methoxyl groups.
Edstrom & Phaff (1964b) observed that the final extent of degradation of 68% esterified pectin at pH 5.3 was increased from 18 to 22 % by the addition of an optimum amount of calcium chloride. Because this extent falls short of that obtained with 95 % esterified pectin, they concluded that Ca2+ merely stimulated the initial rate of the elimination reaction and that they did not serve as replacements for the methoxyl groups. However, a stimulation of the initial rate of the elimination reaction does not involve a higher final degree of breakdown, it merely causes the limit of degradation to be reached more quickly.
The effect of divalent cations on the activity of the PLs was found to depend on the DE of the substrate and pH in the reaction mixture. The results presented in Fig. 29 (see also Voragen et al., 1971b) show that up to a certain concentration Ca2+ are activators for substrates with a DE of 74, 79 and 86 %. The optimum concentration ranges between 0.075 M and 0.15 M except for pH 7.5 where the optimum is not yet reached at 0.3 M. For 95 % esterified pectin the action of Ca2+ depended on the pH: At pH 8.5 and 7.5 Ca2+ activated, at pH 6.5 and 5.8 it acted as an inhibitor and at the still lower pH values 5.3 and 4.3 there was only little influence on the enzyme activity. The effect of calcium at pH 7.5 and 8.5 showed a different picture than the effect observed at lower pH values; a much higher activation was reached with smaller concentrations of Ca2+.
Plots of pectin lyase activity on the different pectins as a function of the pH with and without 0.075 M CaCl2 (Fig. 30a,b and also Fig. 31) show that in the absence of Ca2+ the optimum pH values for the various substrates shift from about 6.1 (95% esterified pectin) to about 4.9 (74% esterified pectin). Upon addition of Ca2+ various effects can be noted: the optimum pH values of the 95 and 86% esterified pectins shifted from about 6.1 to 5.6 and from 5.5 to about 5.3, respectively. Under these conditions the enzyme now showed the least activity on the 95 % esterified pectin. Above pH 6.5 all activities were seen to increase. The pH value of 8.5 is the highest that can be measured without saponification and chemical transelimination occurring. Strontium and magnesium ions showed a practically analogous effect to calcium ions (Fig. 31), but for Mg2+ this effect cannot be shown at higher pH values because Mg2+
precipitated as Mg(OH)2. The enzymes showed no absolute requirement for multivalent cations because
108

addition of 0.05 M EDTA had no noticeable influence on the activity of PL on 95 % and 74% esterified pectins at various pH values (Table 15).
The mechanism of calcium activation is unclear. It is remarkable that the amounts of calcium equivalents which cause maximum activation of PL are many times higher than the equivalents of unesterified galacturonide units in the various pectin substrates.
From the relationship between l/t]s and l/DP calculated from the increase in AA caused by PL activity (Fig. 32, Table 16) it can be deduced that the lyases degrade pectin by an endo mechanism. The gradual appearance of oligomers of decreasing degree of polymerization during the enzymatic degradation of pectin provide evidence for such a mechanism (Table 17). Oligomers with low DPs only appear in the final stage of degradation. However from the above mentioned relationship, presented in Fig. 32, it was calculated that 50% viscosity reduction corresponded to 2.3% degradation for the chemical transeliminative breakdown of pectin and 1.96% degradation for the enzyme catalysed reactions. This indicates that the lyases do not degrade pectin by a purely random mechanism but that they have a preference for the inner bonds. Support for this conclusion was derived from the pattern of action of the lyases on methylated oligomers. These action patterns could be determined by chromatographic analysis of the reaction products formed during the enzymatic degradation of these oligomers. Consistent results were found for the three lyases and these results were similar to those of Edstrom & PhafF (1964b). From the reaction products given in Table 21 it can be concluded that the hexamer is preferentially degraded at bond 3, and with a lower rate at bond 4. The glycosidic bond adjacent to the terminal reducing galacturonide unit is designated bond 1, the other bonds are numbered consecutively. Pentamer and tetramer are both degraded at bond 3 but at a much lower rate. This means, as already mentioned by Edstrom & Phaff (1964b) that PL apparently cannot cleave the two glycosidic bonds nearest the reducing end of fully esterified poly-galacturonates and is severely limited in its ability to split the bonds nearest the non-reducing end. The influence of the double bond on the fissionability of the glycosidic linkages is not known. However, after exhaustive degradation of highly esterified pectin, also after addition of a new dose of lyase, the digest still contained substantial amounts of unsaturated hexamethylhexa and pentamethylpenta galacturonate. This indicates that the double bonds protect the neighbouring glycosidic linkages from enzyme attack.
There was a remarkable difference between the affinities shown by the three lyase preparations for the various pectic substrates. FL32 PL showed the highest affinity for all substrates (Fig. 23). The effects of pH and DE on the enzyme affinity and activity described above were very clear for FL32 PL but much less so for the other two preparations, although the same trend could be observed.
For U20 and FL32 PL the Km values for hexamethylhexagalacturonate were estimated, these values were 33 mM/litre and 9.4 mM/litre respectively. For 95% esterified pectin values of 16.7 mM/litre and 2.2 mM/litre respectively were estimated under the same reaction conditions. The ratio between the Km value for pectin and
109
the Km value for the hexamer was about 4.3 for FL32 PL and about 2 for U20 PL. The lyases also showed a much lower activity on the oligomers. The Vmax value extrapolated for hexamethylhexagalacturonate with one unit of FL32 PL was 5.55 % of the Vmax extrapolated for 95% esterified pectin. For U20 PL this was 6.25%.
The relative rates of FL32, U20 and Pektosin PL on pentamer and tetramer in respect to the rate on hexamer were 19.6, 20, 25 and 5.6, 3.9, 5.7 respectively (see also Table 20). These data illustrate that the affinity and activity decrease with decreasing DP and explain why addition of saturated methyl oligogalacturonates did not influence the lyase activity on highly esterified pectin.
The properties of the three lyases described here correspond very well with the enzymes of Group IV (see Table 4a,b and page 30) (PLs with 'low' optimum pH values and not active on pectic acid) and also with the enzymes of Group II (see Table 4a,b and page 30) (PMGs described before 1960, especially the enzyme described by Seegmiller&Jansen (1952)). They showed a great similarity in their optimum pH values, their behaviour in various buffer systems, pH stability, IEP, mobility in disc polyacrylamide gel electrophoresis, action pattern on oligomers, mechanism of pectin degradation, influence of multivalent cations. For U20 and FL32 PL the same energy of activation was estimated. The lyases only differed in their Km values for the various pectic substrates. The Km values estimated for FL32 PL were lower so that in practice this enzyme is more active especially at low substrate concentrations.
As commercial pectinase preparations are used in the fruit juice industry, most fruit juices will have pectin concentrations that are to low to obtain a saturation of the pectin lyase enzymes present, especially as the average degree of esterification of these pectic substances varies between 60-90 % or is even lower. The low pH of the juice will be favourable for the affinity of the lyases for the pectic substances, however these pH values in general will be below the optimum pH values of the enzymes for the various substrates in the conditions mentioned. Also other factors may be involved, such as distribution of esterified and unesterified galacturonide units, presence of cations and anions.
The calcium content of fruit juices, fruits and vegetables ranges between 0.01 and 0.075 M. Because of the completely different reaction conditions of these products nothing can be said about the influence of these calcium amounts on PL activity.
Commercial 'pectinase' preparations usually contain a considerable amount of PE activity (Rombouts, 1972). This PE activity will lower the DE of the pectic substances, so that the enzyme has a lower affinity for these substrates. However at pH values over 5 PL shows a higher affinity for E preparations than for the corresponding A pectins. The E preparations are also degraded to a greater extent (Table 18). The L-B plots in Fig. 23 indicate that there are no reversible or irreversible complex formations between the enzyme and the unreactive sites of the substrate molecules. The presence of pectic acid has no influence on the PL activity on pectin. This means that the saponified blocks of galacturonide units in a pectin molecule resulting from PE action do not inhibit the lyase activity. The de-esterification will result in a shift of the optimum pH to lower values. Fruit juices have a pH < 5 so that the lyase activity still
110

may take part. Furthermore new substrate is created for other depolymerizing activities (PG, PAL).
Table 22 shows that as far as the FL32 pectin lyase is concerned the reaction products of PG activity (endo or exo) and polymethylgalacturonase activity, if any, have no effect on the activity of this enzyme. The same was found for unsaturated oligogalacturonic acids, however unsaturated oligogalacturonide methylesters were found to inhibit the PL. Product inhibition was thus indicated, as already reported by Albersheim & Killias (1962) and Albersheim (1963, 1966). From Table 4a it can be deduced that pectin degrading enzymes are suitable enzymes for the maceration of plant tissues. Bush & Codner (1968, 1970) found that their PL macerated orange rind while Amado (1970) illustrated the maceration of potato slices by PL. At our department the ability of FL32 PL to macerate apple and pear slices was tested. Both tissues were macerated (Rogaar-Karsten, 1972). PL was also found to clarify cloudy juices. Endo (1965) and Yamasaki et al. (1967) had already shown that cloudy apple juice was completely clarified by the combined action of PE and endo PG, although separately these enzymes had no effect on clarification. From these observations they concluded that degradation of glycosidic linkages in pectin is sufficient to cause clarification. Ishii & Yokotsuka (1971) found that cloudy juices of apple and grape were completely clarified by purified PL. Two purified PLs, produced by Aspergillus sojae showed similar clarifying activity. Also van Wijnendaele (1971) found PL to be active in apple juice clarification.
I l l
Summary
The purpose of this study was to characterize some pure pectin degrading enzymes isolated from commercial 'pectinase' preparations, to find their role in food processing involving pectolysis. The reaction mechanism of these enzymes was studied with purified high polymer pectic substances and on well defined methyl oligogalacturo-nates, also in order to characterize the structure of pectic substances.
Chapter 2 describes the structure of pectic substances and their occurrence in fruit and vegetables, discusses the preparation and characterization of oligogalactu-ronides as given in the literature, and describes pectic enzymes, in particular pectin depolymerizing enzymes, and literature on them. The evidence from this literature makes the existence of polymethylgalacturonases (PMG) doubtful; these depoly-merases could be classified in two groups: pectin lyases with a pH optimum in weakly acidic conditions and pectin lyases with a pH optimum in weakly alkaline conditions.
Chapter 3 gives methods used for the preparation and characterization of oligo-galacturonides and high polymer pectic substances and for the isolation and characterization of three pectin lyases.
Saturated and unsaturated oligogalacturonic acids were obtained by degrading purified pectic acid with commercial pectinase preparations and with Bacilluspolymyxa endo pectate lyase (PAL), respectively. Unsaturated monogalacturonic acid was isolated from the culture liquid of a Flavobacterium grown in a buffered pectate medium. The reaction mixtures were fractionated by ion exchange chromatography on Dowex 1 as acetate or formate. Fractions were eluted in steps and in gradients with acetate or formate buffers of increasing concentration. After partial or complete esterification of the corresponding oligogalacturonic acids in mixtures of methanol and hydrogen chloride, the methyl oligogalacturonates were purified by preparative paper chromatography.
The oligogalacturonic acids were characterized by titration of carboxyl groups, iodometric determination of reducing end-groups and by paper or thin layer chromatography. The unsaturated compounds were further characterized by their ultraviolet absorbance at 232 nm and their reactions with periodate and TBA, and with carbazole. Methyl oligogalacturonates were characterized by paper chromatography. These compounds have been further studied by PMR at Unilever Research, Duiven, the Netherlands.
Pectins with different degrees of esterification (DE) and with different distributions of esterified and unesterified carboxyl groups were obtained by saponification of 95 % esterified pectin with alkali at 0°C or with citrus pectin esterase (EC 3.1.1.11; pectin-
112

pectyl hydrolase). The lyases were isolated by fractional adsorption on calcium phosphate gel,
Sephadex gel filtration and DEAE Sephadex chromatography. PMG was not detected in studies on the relationship between increase in absorbance at 232 nm and increase in reciprocal specific viscosity. Pectin lyase activity was mainly measured spectro-photometrically.
The results of the preparation and characterization of the oligogalacturonides are given and discussed. Some grams of saturated oligogalacturonic acids up to hexamer and of unsaturated oligogalacturonic acids up to tetramer were obtained pure. Unsaturated monogalacturonic acid was obtained in small amounts and proved pure by paper chromatography. The series of oligomers were found regular in chromatographic behaviour, as seen in the linear relationship between the migration constant RM, calculated from paper chromatograms, and the degree of polymerization (DP) of the oligomers.
The estimate of the unsaturated compounds with the carbazole tests proved to be correct. Unsaturated monogalacturonic acid reacted only in the Rouse & Atkins modification of this test. In the periodate TBA assay great differences in molar absorption coefficients (e) of the unsaturated compounds were found. Hence this test is not suitable for quantitative determination of unsaturated oligogalacturonic acids. Unsaturated monogalacturonic acid was a reducing compound with an a-keto acid character. It absorbed no ultraviolet light at 232 nm.
Methyl esters of digalacturonide up to hexagalacturonide were obtained. The relationship between RM and DP showed the homogeneity of this series of compounds^ Monomethyldi, monomethyltri and dimethyltri galacturonates were characterized by paper chromatography as acidic reducing esters. Analysis by PMR showed that in monomethyldigalacturonate the carboxyl group in the reducing galacturonide unit was esterified. In partial esters of trigalacturonic acid the carboxyl group was preferentially esterified in the reducing galacturonide unit.
The results of isolation and characterization of some pectin lyases are presented
From each'of three pectinase preparations, Ultrazym 20, Pektolase FL32 and Pektosin, a pectin lyase (PL) was isolated free from other pectolytic enzymes. The lyases, U20 PL, FL32 PL and Pektosin PL were found to have their isoelectric point at pH 3.5-3.8. On 95% esterified pectin their activity was optimum between pH 6.1 and 6.5. From 6 different buffer systems, the highest activities were in citrate phosphate buffers. On partially saponified pectins optimum pH was lower. These could be explained by the low substrate concentrations for the reaction.
The enzymes showed the same pH stability. Between pH 4 and pH 6 they were very stable. Above and to a lesser extent below these limits, they were inactivated. Incubation at pH 7.8 and 38°C for 30 min resulted in 90% loss in activity
The energy of activation of U20 PL and FL32 PL were estimated to be 1.5 kcal/mol. Indications were found that the DE of the substrate had no influence on the energy of activation.
113
A study was made on the influence of the DE of the pectin substrates and of the distribution of esterified and unesterified carboxyl groups on the activity of the lyases. For all substrates, the same Vmax was found at pH 6.5,5.8 and 5.3 but not at lower pH. The highest Vmax for all lyases and substrates studied was found at pH 6.5. The enzymes showed the highest affinity for the pectin with the highest DE. The affinities for the various pectins were found to decrease with DE. The lyases showed a higher affinity for pectins with a distribution of esterified and unesterified carboxyl groups in blocks than for the corresponding pectins with a random distribution of these groups. By lowering the pH, the affinity for the partially saponified pectins increased. For the lowest pH measured, the three lyases showed the highest affinity for substrates with a DE of 86 and 79 %. Under these conditions too the highest activities were measured on these substrates. FL32 PL showed, in all the reaction conditions studied, markedly higher affinity for the substrates than the other two lyases.
The influence of Ca2+ on the activity of the lyases was studied as function of the pH and as function of DE. Identical results were found for the three lyases. Ca2+
was found to activate pectin lyase activity, their activation depended on pH and DE. High activation was observed above pH 6.5. Below pH 6.5 lyase activity on 95% esterified pectin was inhibited. The optimum Ca2 + concentration was about 0.1 M/litre. Similar effects were observed for Mg2+ and Sr2+.
The mechanism of breakdown was studied of 95 % esterified pectin by pectin lyases. The gradual appearance of unsaturated methyl oligogalacturonates of decreasing chain length showed the enzymes to be endo pectin lyases. Studies of the reduction in viscosity in relation to bond breakage showed that 50 % reduction in viscosity resulting from pectin lyase activity corresponded to 1.96% degradation. For the chemical trans-eliminative breakdown which was considered to be random, degradation was estimated at 2.3 %. Thus lyase prefers the inner bonds in a pectin molecule. This conclusion is supported by results from studies on the pattern of action of lyases on methyl oligogalacturonates.
From the maximum degradation of pectins with different DE and different distributions of esterified and unesterified groups by FL32 PL, additional information on lyase action was obtained. On 95% esterified pectin, the maximum was 25%, decreasing with DE, especially for randomly esterified pectins. At lower pH, however, the degradation limit of randomly esterified pectins increased. Even higher values were found when Ca2+ was added. The maximum degradation of 95% esterified pectin was not reached; the value did not change when pH was lowered and Ca2+
added. The reaction mixtures obtained were analysed by paper and thin layer chromatography, and proved to contain unsaturated partially esterified methyl oligo-galacturonides. At higher degradation limits, oligomers with shorter chains were found.
An attempt was made to explain the effects by assuming that a pectin molecule contains reactive sites. The nature of these sites is such that they can form a complex with the lyase and a glycosidic link in the complex-bound part of the pectin molecule is then split. In these reactive sites, esterified galacturonide units predominate. By
114

lowering DE, the number of reactive sites on the substrate molecule decreases, making a higher substrate concentration necessary to obtain the same reaction velocity. This explains the same Vmax found for all substrates. At low pH, the highest activities were found for 86 and 79 % esterified pectin, probably because unesterified galacturonide units are more reactive at low pH. Calcium ions may serve as replacements of methoxyl groups.
The patterns of action of the lyases on methyl oligogalacturonates were studied by spectrophotometry, and by paper and thin layer chromatography of reaction products. The results for the three lyases were consistent with published data. The relative reaction rates for the various esters showed that the lyase activity decreased with chain length. For U20 PL and FL32 PL, the reciprocal of the Michaelis constant (l/KM) for hexamethylhexagalacturonate was, respectively, a half and a quarter of the value found for 95 % esterified pectin.
Analysis of the reaction products showed that the split in the hexamer was usually in bond 3 and to a lesser extent in bond 4. In the pentamer and tetramer only bond 3 was split at a very low rate. Thus the lyases could not split the two glycosidic linkages next to the reducing end of a fully methylated polygalacturonate and that they could hardly split the glycosidic linkage next to the non-reducing end. Evidence was found that a double bound in the non-reducing galacturonide unit protects the adjacent glycosidic linkage from pectin lyase attack.
Activity of PL was not influenced by the presence of saturated and unsaturated oligogalacturonic acids and saturated methyl oligogalacturonates. Unsaturated methyl oligogalacturonates inhibited PL activity (product inhibition).
The methods described in the literature for assaying PL activity were insensitive. A change in the reaction conditions improved the sensitivity. With this improved test PL activity could be detected in practically all the commercial pectinase preparations. PMG activity could not be detected in Pectolase FL32. It may be concluded that PL activity is found rarely because of unreliable tests, and that pectin degrading ability is erroneously attributed to PMG activity, whose existence is doubtful.
The significance of pectin lyases for food processing is discussed. Because of their rather high activities on partially saponified pectins at low pH their role should not be underrated.
115

References
Albersheim, P., 1963. Auxin induced product inhibition of pectin trans-eliminase as shown by ozonolysis. PI. Physiol., Lancaster 38:426-429.
Albersheim, P., 1966. Pectin lyase from fungi. Meth. Enzym. 8: 628-631. Albersheim, P. & U. Killias, 1962. Studies relating to the purification and properties of pectin trans-
eliminase. Archs. Biochem. Biophys. 97:107-115. Albersheim, P., H. Neukom & H. Deuel, 1960a. Splitting of pectin chain molecules in neutral solutions.
Archs. Biochem. Biophys. 90:46-51. Albersheim, P., H. Neukom & H. Deuel, 1960b. Uber die Bildung von ungesattigten Abbauprodukten
durch ein pektinabbauendes Enzym. Helv. chim. Acta 43: 1422-1426. Altermatt, H., 1954. Darstellung von Oligogalakturonsauren. Diss, ETH, Zurich. Altermatt, H. & H. Deuel, 1952. Uber den enzymatischen Abbau von Pektinsaure und die Isolierung
von Oligogalakturonsauren. Helv. chim. Acta 35:1422-1426. Altermatt, H. & H. Deuel, 1953. Isolierung von Tetragalakturonsaure aus enzymatisch abgebauter
Pektinsaure. Helv. chim. Acta 36: 340-343. Altermatt, H. & H. Deuel, 1954. Uber die Konstitution der Digalakturonsaure. Helv. chim. Acta 27:
770-773. Amadd, R., 1970. Isolierung und Charakterisierung einer Pektinlyase von Aspergillus niger. Diss.
Nr. 4536 ETH Zurich. Ashby, J., J. Brooks & W. W. Reid, 1955. Preparation of pure mono-, di- and tri-galacturonic acids.
Chem.&Ind.26:360. Ayres, A., J. Dingle, A. Phipps, W. W. Reid & G. L. Solomons, 1952. Enzymic degradation of pectic
acid and the complex nature of polygalacturonase. Nature 170: 834-836. Bateman, D. F.( 1966. Hydrolytic and trans-eliminative degradation of pectic substances by extra
cellular enzymes of Fusarium solanif. phaseoli. Phytopathology 56: 238-244. Bateman, D. F., 1967. Alteration of cell wall component during pathogenesis by Rhizoctonia solani.
In: Dyn. Role mol. Const. Plant. Parasite Interaction, Proc. Conf. Gamagori, Japan, p. 58-75. Bohm, J. Th. C , 1970. Zuivering en karakterisering van een endo-P.T.E.-enzym uit een commercieel
enzympreparaat. M. Sc.-Thesis, Agricultural University, Department of Food Science, Wageningen, the Netherlands.
Boos, R. N., 1948. Quantitative colorimetric micro-determination of methanol with chromotropic acid reagent. Anal. Chem. 20:964-965.
Brooks, J. & W. W. Reid, 1955. The complex nature of polygalacturonase from Aspergillus foetidus thorn and raper. Chem. & Ind. 26: 325.
Bull, T. A., 1968. Auxin effects on the activity of pectin transeliminase in vitro. Phytochem. 7: 209-211.
Bush, D. A. & R. C. Codner, 1968. The nature of macerating factor of Penicillium digitatum saccardo. Phytochem. 7: 863-869.
Bush, D. A. & R. C. Codner, 1970. Comparison of the properties of the pectin transeliminases of Penicillium digitatum and Penicillium italicum. Phytochem. 9: 87-97.
Byrde, R. J. W. & A. H. Fielding, 1968. Pectin methyl-trans-eliminase as the maceration factor of Sclerotinia fructigena and its significance in brown rot of apple. J. gen. Microbiol. 52: 287-297.
116

Chanez, M. & G. Sag, 1959. Preparation of methyl-D-galacturonate. Bull. Soc. chim. Fr., p. 1500-1501. Davis, J. B., 1964. Disc electrophoresis. II. Method and application to human serum proteins. Ann.
N.Y. Acad. Sci. 121:404-427. Demain, A. L. & H. J. Phaff, 1954. The preparation of tetragalacturonic acid. Archs. Biochem.
Biophys. 51:114-121. Demain, A. L. & H. J. Phaff, 1957. Recent advances in the enzymatic hydrolysis of pcctic substances.
Communs. Wallerstein Labs. 20:119-140. Derungs, R., 1958. Trennung von Oligogalakturonsauren an Anionaustauschern. Diss. Nr. 2792
ETH Zurich. Derungs, R. & H. Duel, 1954. Quantitative Trennung von Oligogalakturonsauren an Ionenaustausch-
ern. Helv. chim. Acta 37:657-659. Deuel, H. & E. Stutz, 1958. Pectic substances and pectic enzymes. Adv. Enzymol. 20: 341-382. Deuel, H., G. Huber & R. Leuenberger, 1950. Ober das Geliervermogen von Polygalakturonsaure-
methylester. Helv. chim. Acta 33:1226-1228. Dixon, M. & E. C. Webb, 1965. In: Enzymes, Longmans, London, p. 157. Doesburg, J. J., 1965. Pectic substances in fresh and preserved fruits and vegetables. iBVT-communi-
cation 25, Institute for research on storage and processing of horticultural produce. Wageningen, the Netherlands.
Edstrom, R. D. & H. J. Phaff, 1964a. Purification and certain properties of pectin transeliminase from Aspergillusfonsecaeus. J. biol. Chem. 239:2403-2407.
Edstrom, R. D. & H. J. Phaff, 1964b. Eliminative cleavage of pectin and oligogalacturonide methyl-esters by pectin transeliminase. J. biol. Chem. 239:2409-2415.
Endo, A., 1965. Pectic enzymes of molds XIV. Properties of pectin in apple juice. Agric. biol. Chem., Tokyo, 29: 137-143.
Finlayson, J. S., 1969. Basic biochemical calculations: related procedures and principles. Addison-Wesley Publishing Co., London.
Florkin, M. & E. H. Stotz (eds.), 1965. Enzyme nomenclature in comprehensive biochemistry 13. Elseviers Publ. Comp., Amsterdam.
Fuchs, A., 1965. The transeliminative breakdown of Na-polygalacturonate by Pseudomonas fluorescein.
Antonie van Leeuwenhoek 31: 323-340. Fun Sun Chu & E. M. Foster, 1970. Pectolytic enzymes of Byssochlamys fulva. Bact. Proc. Soc. of
Am. Bacteriol., Washington, Abstr. G.P. 96, 63. Gee, M., R. M. Reeve & R. M. McCready, 1959. Reaction of hydroxylamine with pectimc acids.
Degree of esterification of pectic substances in fruit. J. agric. Fd Chem. 7: 34-39. Grassl, M. & H. Moelering, 1968. Spektrophotometrische Bestimmung von Phospholipase A. Z.
analyt. Chem. 243:416^23. Hasegawa, S. & C. W. Nagel, 1962. The characterization of an ^-unsaturated digalacturomc acid.
J. biol. Chem. 237: 619-621. Hasegawa, S. & C. W. Nagel, 1966. A new pectic acid transeliminase produced exocellularly by a
Bacillus. J. Fd Sci. 31: 838-845. ... Hasegawa, S. & C. W. Nagel, 1968. Isolation of an oligogalacturonate hydrolase from a Bacillus
specie. Archs. Biochem. Biophys. 124: 513-520. .„. Hatanaka, C. & J. Ozawa, 1966. Enzymic degradation of pectic acid. J. agric. Chem. Soc. Japan 4 .
93-106. Heri, W., H. Neukom & H. Deuel, 1961. Chromatographische Fraktionierung von Pektinstoffen an
Diathylaminoathylcellulose. Helv. chim. Acta 44:1939-1944. Hobson, G. E., 1962. Determination of polygalacturonase in fruits. Nature 195: 804-805. Hoffman, P., A. Linker, V. Lippan & K. Meyer, 1960. Structure of chondroitinsulfate B from stua.es
withFlavobacterium enzymes. J. biol. Chem. 235: 3066-3069. Vereitv Houdenhoven, F. E. A. van, 1969. Pectine transeliminase. M. Sc.-Thesis, Agricultural Un.vers. y,
Department of Food Science, Wageningen, the Netherlands.
117
IFJU, 1964. Detection of organic acids. In: iFju-analyses (International Federation of Fruit Juice Producers) 23: 2.
International Union of Biochemistry, 1961. Report of the commission on enzymes. 8. Pergamon Press, Oxford.
Ishii, S. & T. Yokotsuka, 1971. Pectin transeliminase with fruit juice clarifying activity. J. agric. Fd Chem. 19:958-961.
Jansen, E. F. & R. Jang, 1946. Esterification of galacturonic acid and polyuronides with methanol-hydrogen chloride. J. Am. chem. Soc. 68:1475-1477.
Jansen, E. F. & L. R. McDonnell, 1945. Influence of methoxyl content of pectic substances on the action of polygalacturonase. Archs. Biochem. 8: 97-118.
Joslyn, M. A. & W. Pilnik, 1961. Enzymes and enzyme activity. In: W. B. Sinclair (ed.) The Orange, its biochemistry and physiology, 375-435. University California Printing Department.
Keilin, D. & E. F. Hartree, 1938. Proc. Royal Soc. (B) 124: 397-405. Kertesz, Z. I., 1937. Pectic enzymes. I. The determination of pectin methoxylase activity. J. biol.
Chem. 121: 589-598. Kertesz, Z. I., 1951. The pectic substances. Interscience Publishing, New York - London. y
Kohn, R. &I. Furda, 1967a. Calcium ion activity in solutions of calcium pectinate. Colin. Czech. chem. Commun. Engl. Edn 32:1925-1937.
Kohn, R. & I. Furda, 1967b. Interaction of calcium and potassium ions with carboxyl groups of pectin. Colin. Czech, chem. Commun. Engl. Edn 32:4470-4484.
Kohn, R. & I. Furda, 1968. Binding of calcium ions to acetyl derivatives of pectin. Colin. Czech. chem. Commun. Engl. Edn 33:2217-2225.
Kohn, R., I. Furda & Z. Kopec, 1968. Distribution of free carboxylgroups in the pectin molecule after treatment with pectinesterase. Colin. Czech, chem. Commun. Engl. Edn 33: 264-269.
Koller, A., 1966. Fraktionierung und Charakterisierung der pektolytischen Enzyme von Aspergillus niger. Diss. Nr. 3774 ETH Zurich.
Koller, A. & H. Neukom, 1964. Detection of oligogalacturonic acids by thin-layer chromatography. Biochem. Biophys. Acta 83: 366-367.
Koller, A. & H. Neukom, 1967. Untersuchungen tiber die pektolytischen Enzyme von Aspergillus niger. Mitt. Geb. Lebensmittelunters.u.Hyg. 58: 512-517.
Koller, A. & H. Neukom, 1969. Untersuchungen iiber den Abbaumechanismus einer gereinigten Polygalakturonase aus Aspergillus niger. Eur. J. Biochem. 7:485-489.
Lanning, M. C. & S. S. Cohen, 1961. The detection and estimation of 2-keto-hexonic acids. J. biol. Chem. 237:109-114.
Layne, E., 1957. Spectrophotometric and turbidimetric methods for measuring proteins. Meth. Enzymol. 3:447-454.
Lee, M., L. Miller & J. D. Macmillan, 1970. Similarities in the action pattern of exopolygalacturonate lyase and pectinesterase from CI. multifermentans. J. Bact. 103: 595-600.
Leuprecht, H. & A. Schaller, 1968. Ergebnisse methodologischer Untersuchungen hinsichtlich der Messung der Pektinmethylesterase-Aktivitat in aufgetautem Tiefgefrier-Erdbeerpiiree. Fruchtsaft-Ind. 13: 50-74.
Lineweaver, H. & G. Ballou, 1945. The effect of cations on the activity of alfalfa pectinesterase (pectase). Archs. Biochem. 6:373-387.
Linker, A., K. Meyer & P. Hoffman, 1956. The production of unsaturated uronides by bacterial hyaluronidases. J. biol. Chem. 219:13-25.
Linker, A., P. Hoffman, K. Meyer, P. Sampson & E. D. Korn, 1960. Formation of unsaturated disaccharides from mucopolysaccharides and their cleavage to a-keto acids by bacterial enzymes. J. biol. Chem. 235:3061-3065.
Luh, B. S. & H. J. Phaff, 1951. Studies on polygalacturonase of certain yeasts. Archs. Biochem. Biophys. 33: 212-227.
118

McClendon, J. H., 1964. Evidence for the pectic nature of the middle lamella of potato tuber cell walls based on chromatography of macerating enzymes. Am. J. Bot. 51: 628-633.
McComb, E. A. & R. M. McCready, 1952. Colorimetric determination of pectic substances. Analyt. Chem. 24: 1630-1632.
McComb, E. A. & R. M. McCready, 1957. Determination of acetyl in pectin and in acetylated carbohydrate polymers. Hydroxamic acid reaction. Analyt. Chem. 29: 819-821.
McCready, R. M. & E. A. McComb, 1953. Course of action of polygalacturonase on polygalacturonic acids. J. agric. Fd Chem. 1:1165-1168.
McCready, R. M. & C. G. Seegmiller, 1954. Action of pectic enzymes on oligogalacturonic acids and some of their derivatives. Archs. Biochem. Biophys. 50:44CM50.
McDonnell, L. R., R. Jang, E. F. Jansen & H. Lineweaver, 1950. The specificity of pectinesterases from several sources with some notes on purification of orange pectinesterase. Archs. Biochem. 28: 260-273.
McMillan, J. D. & R. H. Vaughn, 1964. Purification and properties of a polygalacturonic acid transeliminase produced by Clostridium multifermentans. Biochemistry 3: 564-572.
Mehlitz, A. & Th. Minas, 1965. Ein neues Verfahren zur Ermittliing des Veresterungsgrades von Pektin-Stoffen durch IR-Spektroskopie. Ind. Obst- u. Gemuseverw. 50: 719-722.
Moran, F., S. Nasuno & M. P. Starr, 1968a. Extracellular and intracellular polygalacturonic acid trans-eliminases of Erwinia carotovora. Archs. Biochem. Biophys. 123: 298-306.
Moran, F., S. Nasuno & M. P. Starr, 1968b. Oligogalacturonide transeliminase of Erwinia carotovora.
Archs. Biochem. Biophys. 125: 734-741. Nagel, C. W., 1971. A kinetic study of the esteriflcation and glycosylation of D-galacturonic acid and
its a-D-(l->4)-linked di- and tri-saccharide analogs with methanol. Carbohydrate Res. 18: 453-458. Nagel, C. W. & M. M. Anderson, 1965. Action of a bacterial transeliminase on normal and unsaturat
ed oligogalacturonic acids. Archs. Biochem. Biophys. 112: 322-330. Nagel, C. W. & S. Hasegawa, 1967. Kinetics and site of attack of oligogalacturonic acids by an endo-
pectic acid transeliminase. Archs. Biochem. Biophys. 118:590-595. Nagel, C. W. & S. Hasegawa, 1968. The isolation and characterization of an a-1,4 (4,5 dehydroga-
lacturonosyl) galacturonate hydrolase. J. Fd Sci. 33:378-382. Nagel, C. W. & R. H. Vaughn, 1961. The degradation of oligogalacturonides by the polygalacturonase
of Bacillus polymyxa. Archs. Biochem. Biophys. 94: 328-332. Nagel, C. W. & T. M. Wilson, 1969. The isolation of oligogalacturonic acids by column chromato
graphy. J. Chromat. 41:410-416. Nasuno, S. & M. P. Starr, 1967. Polygalacturonic acid transeliminase of Xanthomonas campestns.
Biochem. J. 104:178-185. u i, i v Neukom, H., 1949. Studien iiber das Geliervermogen von Pektinstoffen und anderen hocnmoieKu-
laren Polyoxyverbindungen. Diss, ETH Zurich. . Neukom, H„ 1963. Ober den Abbau von Pektinstoffen. Schweiz. landw. Forsch. 2: n2-ul-Nout, M. J. R., 1970. Ophoping, winning en zuivering van het onverzadigd monomeer, +°*W-
L-threo-5-hexoseulose-uronzuur. M. Sc.-Thesis, Agricultural University, Department ot rooa Science, Wageningen, the Netherlands. T •
Ozawa, J., 1952. Studies on the pectic enzymes. I. On the specificity of polygalacturonases. J. agnc. Chem. Soc. Japan 26:505. . , , t i r n n
Ozawa, J. & K. Okamoto, 1955. Studies on the pectic enzymes. II. On the specificity of polygalacturon
ases. Ber.Ohara Inst, landw. 10:215-227. , , . „ „ „onn Patel, D. S. & H. J. Phaff, 1959. On the mechanism of action of yeast endo P^gac turanase on
oligogalacturonides and their reduced and oxidized derivatives. J. biol. Chem. 234. - -
Phaff, H. J., 1966.1,4-Polygalacturonide glycanohydrolase (endo-polygalacturonase) from baccnaro-
™KM/r<#//tt. Meth. Enzymol. 8:636-641 ' . . „;„„,,„_
Phaff, H. J. &B. S. Luh, 1952. The preparation of pure di- and trigalacturonic acids. Archs. B.ocnem. 36: 231-232.
119
Pilnik, W., 1958. Die Trubstabilitat von Citrus-Konzentraten. Ber. wiss. tech. Komm. int. Fruchtsaft-Union 1:203-218.
Pilnik, W. & G. Rothschild, 1960. Trubstabilitat und Pektinesterase-Restaktivitat in pasteurisiertem Orangenkonzentrat. Fruchtsaft-Ind. 5:131-139.
Pilnik, W. & A. G. J. Voragen, 1970. Pectic substances and other uronides. In: A. C. Hulme (ed.): The biochemistry of fruits and their products. Vol. I. Academic Press, London.
Preiss, J., 1966. Bacterial alginate lyase. Meth. Enzymol. 8: 641-644. Preiss, J. & G. Ashwel, 1963. Polygalacturonic acid metabolism in bacteria I. Enzymatic formation of
4-deoxy-L-threo-5-hexoseulose uronic acid. J. biol. Chem. 238: 1571-1576. Reid, W. W., 1962. Di- and trigalacturonic acids isolation from polygalacturonic acid. In: R. L.
Whistler & M. L. Wolfrom (eds.): Meth. Carbohydrate Chemistry, Vol. I: Analysis and preparation of sugars. Academic Press, New York and London, pages 309-313.
Rexova-Benkova, L., 1967. Characterization of extracellular polygalacturonases of Aspergillus niger. Colin. Czech, chem. Commun. Engl. Edn 32:4504-4509.
Rexova-Benkova, L. & A. Slezarik, 1966. Isolation of extracellular pectolytic enzymes produced by Aspergillus niger. Colin. Czech, chem. Commun. Engl. Edn 31:122-129.
Roberts, J. D. & M. C. Caserio, 1964. Basic principles of organic chemistry. W. A. Benjamin, Inc., New York - Amsterdam.
Roboz, E., R. W. Barrat & E. L. Tatum, 1952. Breakdown of pectic substances by a new enzyme from Neurospora. J. biol. Chem. 195:459-471.
Rogaar-Karsten, M. P., 1972. De persbaarheid van appels en peren en de invloed van de bewaring hierop. M. Sc.-Thesis, Agricultural University, Department of Food Science, Wageningen, the Netherlands.
Rombouts, F. M., 1972. Occurrence and properties of bacterial pectate lyases. Agric. Res. Rep. 779. Rombouts, F. M. & W. Pilnik, 1971. Pektolytische Enzyme in der Fruchtsaftindustrie. Flussiges
Obst 38: 93-98. Rombouts, F. M. & W. Pilnik, 1972. Research on pectin depolymerases in the sixties. A literature
review. Critical Rev. Fd Technol. 3:1-26. Rombouts, F. M., W. Norde, H. Oortwijn & W. Pilnik, 1970a. A method for the determination of the
number-average degree of polymerization of pectic substances, IUPAC International Symposium on Macromolecules, Leiden. Abstr. II41: 501-504.
Rombouts, F. M., W. Norde & W. Pilnik, 1970b. A simple method for the determination of the number-average degree of polymerization of pectic substances. Lebensmittel-Wiss.u.Technol. 3: 94-97.
Romkes, S. C. E., 1970. Onderzoek naar de structuur van partieel veresterde oligo-galacturonzuren. M. Sc.-Thesis, Agricultural University, Department of Food Science, Wageningen, the Netherlands.
Rouse, A. H. & C. D. Atkins, 1955. Pectinesterase and pectin in commercial citrus juices as determined by methods used at the citrus experiment station. Bull. Engng Exp. Stn Univ. Fla 570.
Schmidt, H. W. H., 1965. Untersuchungen zur Darstellung von 4-desoxyzuckern aus D-Galakturon-saure. Diss. Nr. 3597 ETH Zurich.
Schubert, E., 1954. Einfluss von Wasserstoff- und Alkali-Ionen auf den enzymatischen Abbau von Pektin verschiedenen Veresterungsgrades durch Pektinglykosidasen und Pektinglykosidasegemische. Helv. chim. Acta 37:691-700.
Schultz, T. H., H. Lotzkar, H. S. Owens & W. D. Maclay, 1945. Influence of method of deesteri-fication on the viscosity and acid behaviour of pectinic acid solutions. J. phys. Chem., Ithaca 49: 554-563.
Seegmiller, C. G. & E. F. Jansen, 1952. Polymethylgalacturonase, an enzyme causing the glycosidic hydrolysis of esterified pectic substances. J. biol. Chem. 195: 327-336.
Sherwood, R. T., 1966. Pectinlyase and polygalacturonase production by Rhizoctonia solani and other fungi. Phytopathology 56:279-286.
120
Smit, Ch. J. B. & E. F. Bryant, 1969. Changes in molecular weight of pectin during methylation with diazomethane. J. Fd Sci. 34:191-193.
Solms, J. & H. Deuel, 1955. Ober den Mechanismus der enzymatischen Verseifung von Pektinstoffen. Helv. chim. Acta 38: 321-329.
Somogyi, L. P. & R. J. Romani, 1964. Irradiation-induced textural change in fruits and its relation to pectin metabolism. J. Fd Sci. 29: 366-371.
Tani, T., 1967. The relation of soft rot caused by pathogenic fungi to pectic enzyme production by the host. In: Dyn. Role mol. Const. Plant. Parasite Interaction, Proc. Conf. Gamagori, Japan p. 40-45.
Tjan, S. B., A. G. J. Voragen & W. Pilnik, 1972. PMR analysis of methyl oligogalacturonates. To be published.
Uijttenboogaart, Th. G., 1970. De winning, zuivering enkarakteriseringvan:onverzadigdeoligomeren van galakturonzuur; pektaatlyase van Bacillus polymyxa. M. Sc.-Thesis, Agricultural University, Department of Food Science, Wageningen, the Netherlands.
Vas, K., M. Nedbalek, H. Scheffer & G. Kovacs-Proszt, 1967. Methodological investigations on the determination of some pectic enzymes. Fruchtsaft-Ind. 12:164-184.
Vogel, A., 1948. In: A textbook of practical organic chemistry, 169, 176. Longmans, Green & Co. London.
Vollmert, B., 1950. Complete methylation of pectin and pectic acid with diazomethane and the use of the esters in determining uronic content and molecular weight. Makromolek. Chem. 5: 101-109.
«. Voragen, A. G. J. & W. Pilnik, 1970a. Pectin depolymerases. I. Classification of pectic acid depolymer-ases according to their effect on oligogalacturonic acids. Z. Lebensmittelunters.u.Forsch. 142: 346-359.
- Voragen, A. G. J. & W. Pilnik, 1970b. Pectin research in the sixties. Dtsche. Lebensmittel Rdsch. 66: 325-329.
* Voragen, A. G. J., F. M. Rombouts, M. J. Hooydonk & W. Pilnik, 1971a. Comparison of endgroup methods for the measurement of pectin degradation. Lebensmittel-Wiss.u.Technol. 4: 7-11.
& Voragen, A. G. J., F. M. Rombouts & W. Pilnik, 1971b. The influence of the degree of esterification on the activity of pectin- and pectate-lyases. Lebensmittel-Wiss.u.Technol. 4: 126-128.
Warren, L., 1960. Thiobarbituric acid spray reagent for deoxy sugars and sialic acids. Nature 186:237. Weissbach, A. & J. Hurwitz, 1959. The formation of 2-keto-3-deoxyheptonic acid in extracts of
Escherichia coliB. J. biol. Chem. 234: 705-709. Whistler, R. L. &D. F. Durso, 1950. Chromatographic separation of sugars on charcoal. J. Am. chem.
Soc. 72: 677-679. Willstatter, R. & G. Schudel, 1918. Bestimmung von Traubenzucker mit Hypojodit. Ber. dt. chem.
Ges. 51: 780-781. Wilson, T. M., 1969. The purification and kinetics of the transeliminases of Bacillus polymyxa. Diss.
1968, Washington State University. University Microfilms, Inc., Ann Arbor, Michigan. Wrigley, C. W., 1969. Analytical fractionation of proteins according to isoelectric point by gel-electro-
focusing. Shandon Instrument Application 29, London. Wood, R. K. S., 1955. Studies in the physiology of parasitism. XVIII. Pectic enzymes secreted by
Bacterium aroideae.Aan.Bot.\9:1-27. , . M T
Wood, H. B., 1963. Methyl alduronates; esterification using methanol. In: R. L. Whistler & M. L. Wolfrom (eds.): Methods in Carbohydrate Chemistry, Vol. II. Reactions of carbohydrates. Academic Press, Inc. New York and London; p. 57-58.
Wood, P. J. & I. R . Siddiqui, 1971. Determination of methanol and its application to measurement or pectin ester content and pectin methylesterase activity. Analyt. Biochem. 39: 418-428.
Wijnendaele, F. A. van, 1970. Inleidend onderzoek naar de klarificerende werking van enkele pekto-lytische enzympreparaten. Internal report, Agricultural University, Department of Food Science, Wageningen, the Netherlands. . ' TI
Yamasaki, M., I. Jasui & K. Arima, 1967. Pectic enzymes in the clarification of apple juice. Part u . The mechanism of clarification. Agric. biol. Chem. 31: 552-560.
121


![N-[4-(3-methyl-3-mesityl-cyclobutyl)-thiazol-2-yl]-succinamic acid: X-ray structure, spectroscopic characterization and quantum chemical computational studies](https://static.fdokumen.com/doc/165x107/632d25baa00d0388c2095a8a/n-4-3-methyl-3-mesityl-cyclobutyl-thiazol-2-yl-succinamic-acid-x-ray-structure.jpg)