
Single tap identification for fast BCI control
10
RESEARCH ARTICLE Single tap identification for fast BCI control Ian Daly • Slawomir J. Nasuto • Kevin Warwick Received: 1 March 2010 / Revised: 12 August 2010 / Accepted: 24 August 2010 / Published online: 1 September 2010 Ó Springer Science+Business Media B.V. 2010 Abstract One of the major aims of BCI research is devoted to achieving faster and more efficient control of external devices. The identification of individual tap events in a motor imagery BCI is therefore a desirable goal. EEG is recorded from subjects performing and imagining finger taps with their left and right hands. A Differential Evolu- tion based feature selection wrapper is used in order to identify optimal features in the spatial and frequency domains for tap identification. Channel-frequency band combinations are found which allow differentiation of tap vs. no-tap control conditions for executed and imagined taps. Left vs. right hand taps may also be differentiated with features found in this manner. A sliding time window is then used to accurately identify individual taps in the executed tap and imagined tap conditions. Highly statisti- cally significant classification accuracies are achieved with time windows of 0.5 s and more allowing taps to be identified on a single trial basis. Keywords BCI DE Feature selection Finger tapping Single trial Introduction Brain Computer Interfaces (BCIs) provide a means for controlling a computer that bypasses the peripheral nervous system by extracting signals directly from the brain (Wolpaw 2007). Control is therefore achieved via thought alone making BCIs well suited for use by disabled indi- viduals who may otherwise by unable to use a computer, communicate or exert control over their environment (Vaughan 2006). BCIs may be used to control spelling and communica- tion programs; allowing users to chat, send email etc. They may also be used to control a range of devices such as wheelchairs and prosthetic limbs, allowing their users to achieve a level of communication and control that may not otherwise be possible (Birbaumer 2000). The Electroencephalogram (EEG) arises from the cur- rents recorded via electrodes placed across the surface of the scalp which are generated by the summed field poten- tials of the simultaneous firings of large numbers of cortical neurons. It is a commonly used method for attaining the brain signals used for BCI control (Wolpaw 2007). This is because EEG is non-invasive, simple to setup and use and relatively portable. It is hence considered to be highly suitable for use by individuals in their own homes (Vaughan 2006). A common paradigm for the control of a BCI is motor imagery. The BCI user imagines movement in some part of their body and in response the frequency content of the EEG recorded from electrodes located over, and close to, the motor cortex exhibits increases and/or decreases in power, referred to as Event Related Synchronization/De- synchronization (ERS/D); respectively (Pfurtscheller and Neuper 2001). Many different types of motor imagery paradigm are used in BCI control, including the use of imagined hand and foot movement to achieve various types of control. A particular type of motor imagery paradigm is based on finger tapping (Ang 2008). The user imagines they are tapping their fingers and the task of the BCI is to identify when the subject is tapping for use as a control signal. For example imagined tapping may be used to turn on or off a switch, select from a series of options, move a cursor etc. I. Daly (&) S. J. Nasuto K. Warwick University of Reading, Reading, UK e-mail: [email protected] 123 Cogn Neurodyn (2011) 5:21–30 DOI 10.1007/s11571-010-9133-x
-
Upload
independent -
Category
Documents
-
view
2 -
download
0
Transcript of Single tap identification for fast BCI control
RESEARCH ARTICLE
Single tap identification for fast BCI control
Ian Daly • Slawomir J. Nasuto • Kevin Warwick
Received: 1 March 2010 / Revised: 12 August 2010 / Accepted: 24 August 2010 / Published online: 1 September 2010
� Springer Science+Business Media B.V. 2010
Abstract One of the major aims of BCI research is
devoted to achieving faster and more efficient control of
external devices. The identification of individual tap events
in a motor imagery BCI is therefore a desirable goal. EEG
is recorded from subjects performing and imagining finger
taps with their left and right hands. A Differential Evolu-
tion based feature selection wrapper is used in order to
identify optimal features in the spatial and frequency
domains for tap identification. Channel-frequency band
combinations are found which allow differentiation of tap
vs. no-tap control conditions for executed and imagined
taps. Left vs. right hand taps may also be differentiated
with features found in this manner. A sliding time window
is then used to accurately identify individual taps in the
executed tap and imagined tap conditions. Highly statisti-
cally significant classification accuracies are achieved with
time windows of 0.5 s and more allowing taps to be
identified on a single trial basis.
Keywords BCI � DE � Feature selection � Finger tapping �Single trial
Introduction
Brain Computer Interfaces (BCIs) provide a means for
controlling a computer that bypasses the peripheral nervous
system by extracting signals directly from the brain
(Wolpaw 2007). Control is therefore achieved via thought
alone making BCIs well suited for use by disabled indi-
viduals who may otherwise by unable to use a computer,
communicate or exert control over their environment
(Vaughan 2006).
BCIs may be used to control spelling and communica-
tion programs; allowing users to chat, send email etc. They
may also be used to control a range of devices such as
wheelchairs and prosthetic limbs, allowing their users to
achieve a level of communication and control that may not
otherwise be possible (Birbaumer 2000).
The Electroencephalogram (EEG) arises from the cur-
rents recorded via electrodes placed across the surface of
the scalp which are generated by the summed field poten-
tials of the simultaneous firings of large numbers of cortical
neurons. It is a commonly used method for attaining the
brain signals used for BCI control (Wolpaw 2007). This is
because EEG is non-invasive, simple to setup and use and
relatively portable. It is hence considered to be highly
suitable for use by individuals in their own homes
(Vaughan 2006).
A common paradigm for the control of a BCI is motor
imagery. The BCI user imagines movement in some part of
their body and in response the frequency content of the
EEG recorded from electrodes located over, and close to,
the motor cortex exhibits increases and/or decreases in
power, referred to as Event Related Synchronization/De-
synchronization (ERS/D); respectively (Pfurtscheller and
Neuper 2001).
Many different types of motor imagery paradigm are
used in BCI control, including the use of imagined hand
and foot movement to achieve various types of control. A
particular type of motor imagery paradigm is based on
finger tapping (Ang 2008). The user imagines they are
tapping their fingers and the task of the BCI is to identify
when the subject is tapping for use as a control signal. For
example imagined tapping may be used to turn on or off a
switch, select from a series of options, move a cursor etc.
I. Daly (&) � S. J. Nasuto � K. Warwick
University of Reading, Reading, UK
e-mail: [email protected]
123
Cogn Neurodyn (2011) 5:21–30
DOI 10.1007/s11571-010-9133-x
Current finger tapping based BCIs make use of the self-
paced tapping condition for control. The subject simply
imagines they are repeatedly tapping their fingers at their
own pace and the detection of this action is used as a basis
for the BCI control (Congedo et al. 2006).
In Ang (2008) finger tapping over a period of 2 s is
identified at accuracies ranging from 53.0 to 96.0% with
mean accuracies of 73.3 ± 2.8% achieved by healthy
subjects they recorded. An improvement in accuracy is
achieved in (Blankertz et al. 2006) with a mean classifi-
cation accuracy of 89.5% achieved when identifying con-
tinuous finger tapping within trials of length 2 s.
This work takes a different approach and attempts to
investigates whether a more precise and accurate level of
BCI control could be achieved via the identification of
individual taps—as opposed to continuous tapping—and at
what time resolution this may be achieved. First by using
Differential Evolution to identify distinguishing features
and then identifying individual taps in a manner analogous
to online BCI operation. Hence this work comprises a step
towards more intuitive, accurate and faster BCI operation.
Individual finger taps are potentially a very intuitive
control paradigm, being analogous to key pressing, a
computer control paradigm a great many people are
familiar with. Hence identification of taps on a single trial
basis could allow for much faster and more intuitive BCI
control then is currently possible.
It is well known that executed finger movement and
imagined finger movement produce very similar responses
in the EEG (Ang 2008; Jeannerod 1995). Therefore EEG is
recorded both during executed finger taps and imagined
finger taps at different rates and with either the left or right
hands.
The problem is approached as one of feature selection. It
is necessary to identify first which channels and frequency
bands give the most information about the tap events. To
find the appropriate features—the channels and frequency
bands of interest—Differential Evolution (DE) is used to
search the parameter space of possible channel-frequency
band combinations; all the channels in the International
10/20 system of electrode placement and all frequencies
from 0.1 to 45 Hz are considered.
After identification of appropriate channels and fre-
quency bands online BCI operation is simulated. A sliding
window threshold function is trained and applied to clas-
sify the power of the selected frequency bands on the
selected channels into tap vs. no-tap conditions. The
shorter the time window at which taps can be accurately
identified the faster and more accurate the BCI control that
can potentially be achieved.
Section 2.1 first describes how the data is recorded for
this investigation. Section 2.2 then introduces DE as a
feature selection method and Sect. 2.3 describes how DE is
used to select channels and frequency bands for tap iden-
tification. Section 2.4 details the classification method used
in this work and Sect. 3 presents the results of first finding
appropriate channel-frequency band combinations and then
identifying taps in the executed and imagined conditions.
Finally Sect. 4 discusses the results and their applications
to BCI.
Methods
Data recording
Subjects
Twenty four volunteer subjects participated in this study;
12 male and 12 female. Ages ranged from 22 to 31 years
with a median age of 25. Ethical approval was obtained
following the School of Systems Engineering, University
of Reading procedures for experiments involving human
subjects. Informed consent was obtained from all partici-
pants. Five of the subjects (2 male and 3 female) were
eliminated due to left handedness/ambidextrousness and
very high levels of artifact contamination. Therefore
nineteen subjects are included in this study.
Recording
EEG is recorded via a Deymed Truscan32 amplifier system
at a sampling rate of 256 Hz from 19 channels placed
according to the international 10/20 system. Stimuli to cue
when the subjects should tap is presented via custom
written software. Stimuli presentation and EEG recording
are time locked via a system developed in (Portelli and
Nasuto 2008).
Subjects are seated in front of a 19 in. display monitor
with a keyboard placed in front of their hands. The monitor
is positioned 100 cm in front of the subject. Stimuli are
presented in the center of the screen (visual angle & 5.72�)
to minimize eye movement. Video is recorded of the
subjects hands and checked for unexpected movement.
Subjects are cued to—at specific times—perform one of
the following actions.
1. Tap once with the right hand index finger.
2. Tap once with the left hand index finger.
3. Imagine they are performing one tap with the right
hand index finger.
4. Imagine they are performing one tap with the left hand
index finger.
The experiment includes four sessions; two of which
record the executed movement condition and two of which
record the imagined movement condition. For each session
22 Cogn Neurodyn (2011) 5:21–30
123

cues are displayed on screen to indicate with which hand
the subject should tap. For the executed movement
condition when the subject taps they depress a key and
the cue disappears.
Cued taps have variable inter-stimulus intervals ranging
from between 0.5 and 2.0 s. The order of sessions; imag-
ined or executed taps, inter-stimulus intervals for the tap
cues and the duration of the rest periods are varied ran-
domly with the taps coming in blocks of between 4 and 6 to
avoid subject pattern learning. For example the subject
may be cued to perform 4 taps with their right hand each
2 s apart, then 5 taps with their left hand each 1 s apart then
given a rest period of random duration.
Preprocessing
For each subject EEG is filtered between 0.1 and 45 Hz on
every channel and visually inspected for artifacts; portions of
EEG containing artifacts are discounted from analysis. Prior
to the application of DE the data is segmented into trials.
Inspection of delay times between cue presentation and
subjects response (as measured by key presses in the exe-
cution condition) reveals a mean subject reaction time of
0.71 (±0.07 s). Assuming that the electrophysiological
correlates of movement intention and control occur before
and during tap execution a natural choice of trial time is to
define trials as portions of EEG from tap cues to 1.0 s after
for trials expected to contain tap events. Trials not expected
to contain taps are taken from 1 s portions of EEG recorded
during times when the subject is in a cued rest period.
Trials are split into three sets; training, testing and
verification. Each set contains either, a third of the tap trials
and a third of the non-tap trials for tap vs. no-tap differ-
entiation, or a third of the left tap trials and a third of the
right tap trials for left vs. right tap differentiation. After
artifact removal the training, testing and verification sets
each contain approximately 80 trials in each condition.
All trials are randomly shuffled; presented in random
order to prevent serial regularities. A frequency decom-
position of each channel in each trial is performed by
applying a fourier transform to calculate the power spectra
within each of the trials.
Trials are therefore constructed from frequency bands of
0.1–45 Hz (of width 1 Hz). Mean power of the frequency
content within each frequency band is calculated for each
trial on each of the 19 EEG channels recorded.
Differential evolution
Differential evolution (DE) is an evolutionary search
technique which may be used as a wrapper based evolu-
tionary meta-heuristic search technique, similar in opera-
tion to a Genetic Algorithm. It has been shown to be highly
successful in identifying near optimal solutions when
applied to a wide range of different search spaces (Storn
and Price 1995).
A population of candidate solutions is first generated.
From this initial population a new generation of candidates
is produced by combining selected individuals from the
first generation via a mutation—crossover scheme. These
new population members replace their parents if they have
a higher fitness; if they result in a better solution.
The DE algorithm operates as follows.
1. First generate a population of N D-dimensional
parameter vectors where each parameter vector con-
tains a randomly selected potential solution (a random
location in the search space). Formally Xi,G where
i = 1, 2, …, N and G denotes the current generation.
2. Mutation; For a given ‘target’ vector Xi,G in the
population X at generation G three vectors in the
population are picked at random—Xr1;G;Xr2;G and
Xr3;G—such that the indices i, r1, r2 and r3 are distinct.
The difference between two of these population
vectors is then calculated and this difference is
multiplied by some weighting factor, F and added to
the third selected population member. The resultant
new vector is referred to as the ‘donor’ vector Vi,G?1 in
the generation G ? 1. Formally
Vi;Gþ1 ¼ Xr1;G þ F Xr2;G � Xr3;G
� �ð1Þ
where the weighting factor F is a constant in the range
[0,2].
3. Crossover; A crossover scheme is applied to the
‘target’ vector Xi,G and the ‘donor’ vector Vi,G?1 using
the scheme detailed in (Storn and Price 1995) to
produce the ‘trial’ vector, Ui,G?1. The crossover
probability used in this step is determined by the
crossover constant (CR), which aims to bring diversity
into the population by selecting which elements of
each of the ‘target’ and ‘donor’ vectors to combine to
form the ‘trial’ vector. Formally the ‘trial’ vector is
constructed via
Uj;i;Gþ1 ¼Vj;i;Gþ1 if randj;i�CR or j ¼ Irand
Xj;i;G if randj;i [ CR and j 6¼ Irand
�
ð2Þ
where i = 1, 2, …, N, j = 1, 2, …, D, randj,i*U[0, 1]
and Irand denotes a random integer drawn from the range
[1, 2, …, D] which ensures that Vi,G?1 = Xi,G.
4. Selection; the ‘target’ vector of the generation
G ? 1, Xi,G?1, is replaced by the ‘trial’ vector Ui,G?1
if the ‘trial’ vector has a better fitness than the ‘target’
vector, otherwise place the ‘target’ vector from
generation G into the new generation. Formally
Cogn Neurodyn (2011) 5:21–30 23
123
Xi;Gþ1 ¼Ui;Gþ1if f Ui;Gþ1
� �� f Xi;G
� �
Xi;Gotherwise
(
ð3Þ
where i = 1, 2, …, N and f(.) evaluates the fitness of a
particular candidate vector for meeting the require-
ments of the desired solution.
The four steps in the DE algorithm are iterated until some
stopping criterion is met. This can, for example in the case
of a classification problem, be met by the classification
accuracy reaching 100% (or close to, within a certain
threshold). It can also be met by the number of iterations
for which the search has run exceeding some maximum
limit.
DE has been shown to outperform a range of other
common meta-heuristic search techniques, including
Genetic Algorithms (GAs), on a range of established search
space tests (Storn and Price 1995). It is therefore consid-
ered a suitable choice of search technique for use in this
study to identify the optimal channels and frequency bands
for tap identification.
Feature selection
DE is applied to select the most informative channels and
frequency bands for identifying tap events in the left hand/
right hand and movement/motor imagery conditions. The
objective function used is a Naive Bayes (NB) classifier
trained on the selected features from the training set. Thus
the task of DE is to identify a feature set—a selection of
channels-frequency bands—which maximizes the rate of
identification the trained classifiers can achieve on the
testing set.
The set of features identified by DE therefore indicates
which channels and frequency bands are most suitable for
the identification of tap events. The choice of channels-
frequency bands is then verified by applying the selected
channels and frequency bands to classify trials in the ver-
ification sets.
Thus the use of DE to select good channels-frequency
bands for identification of taps can be summarized as
follows.
1. The training and testing datasets are both made
available to the DE algorithm.
2. The DE algorithm makes some choice of which
features to use for the identification of taps.
3. The selected features are extracted from both the
training and testing sets.
4. The objective function—the NB classifier—is trained
on the features extracted from the training set and
applied to classify trials of features extracted from the
testing set.
5. The accuracy of the tap vs. no tap differentiation in the
verification set is evaluated via the Area Under the
ROC Curve (AUC) metric. The higher the AUC
the better the differentiation of taps and the higher the
value DE’s fitness evaluation function will return.
The ROC curve is calculated by applying a thresh-
old—varied from 0 to 1—to the posterior class
probabilities returned by the NB classifier.
6. Finally when the DE stopping criterion is reached the
choice of channels and frequency bands are verified by
using the best identified set of channels-frequency
bands and the associated trained classifier to classify
tap events in the verification set.
Note that the DE parameters N and D are set to 15 and 10,
respectively for this study. The weighting factor F is set to
0.8 and the cross-over probability CR is also set to 0.8.
Parameters are chosen based upon direct experimentation
looking for parameter values which produce a good
balance between fast convergence and accurate/robust
results.
Classification
After selection of the most informative channels and fre-
quency bands a thresholding function is applied within a
sliding window to identify taps in an approach analogous to
the operation of an online BCI. Within the window the
features selected by DE—the best channels-frequency
bands—are extracted and classified. The dataset is evenly
split into training and verification sets with the first half of
the data in the training set and the second half in the ver-
ification set. This is reflective of online BCI operation
where—by necessity of design—training data will be
recorded prior to BCI operation.
Classifiers are trained on the features extracted from the
sliding window applied across the training set. They are
then applied to the verification dataset. The classification
algorithm used is the NB classifier.
A range of time windows are used from 100 to
1,000 ms. The shorter the time window in which taps can
be accurately identified the greater the theoretical BCI bit
rate as the subject may achieve accurate control at a faster
rate of tapping.
Time windows that are identified as containing taps are
compared against the cue times to determine whether the
subject was cued to tap within that time window. A clas-
sification accuracy is hence calculated to judge the methods
accuracy at identifying single tap events. The Area Under
the ROC Curve (AUC) metric is used to evaluate the
success at differentiating tap vs. no tap events via the use of
a sliding window.
24 Cogn Neurodyn (2011) 5:21–30
123
Statistical significance of the AUC’s returned on each
dataset are evaluated against the null hypothesis that the
selected features may not enable discrimination/partition-
ing of data according to the class labels. Surrogate datasets
are created within which the trial orders are shuffled. Trials
are then classified and their AUC’s calculated against the
un-shuffled class labels. A distribution of AUC’s under
the null hypothesis is hence built and the probability of the
identified AUC being drawn from this distribution may be
calculated to identify a P-value of the AUC and hence its
statistical significance.
Results
The results may be split into a number of distinct sections
based upon the conditions; tapping vs. not tapping and left
tapping vs. right tapping in both the imagined and real
(executed) tap conditions that the subjects perform. Infor-
mation about the hand with which the tap is to be per-
formed (or imagined) may also be discounted such that DE
attempts to identify features for differentiating tap vs. no
tap conditions across all the trials regardless of the tapping
hand used.
Firstly the results achieved by using the DE feature
selection algorithm to find features for differentiating
between tap and no tap conditions on each of the datasets
for the different subjects and for both imaginary and exe-
cuted taps are listed. The selected channels and frequency
bands to be used in the subsequent sliding window based
task are also presented.
Secondly the results achieved by moving the sliding
window along the length of the EEG recorded from the
subjects under each of the conditions—imagined or exe-
cuted taps—are listed. This approach is analogous to the
operation of an online BCI and provides an indication of
the ability to differentiate control conditions, based upon
individual taps for use as a BCI control signal.
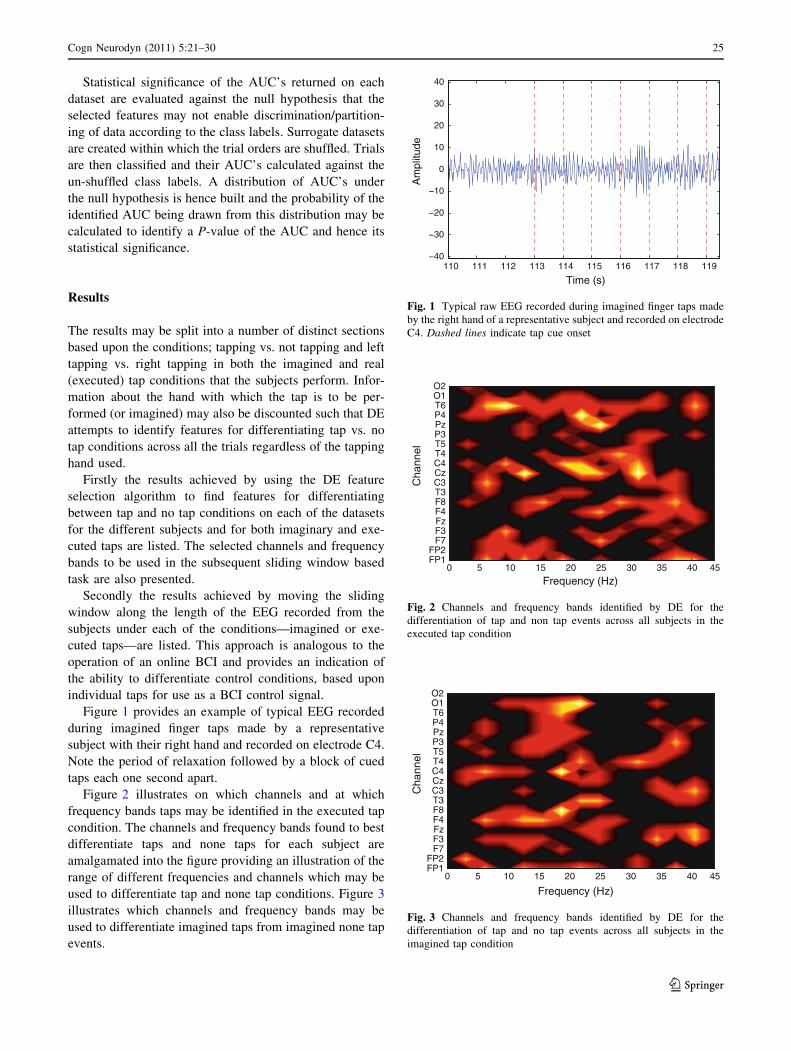
Figure 1 provides an example of typical EEG recorded
during imagined finger taps made by a representative
subject with their right hand and recorded on electrode C4.
Note the period of relaxation followed by a block of cued
taps each one second apart.
Figure 2 illustrates on which channels and at which
frequency bands taps may be identified in the executed tap
condition. The channels and frequency bands found to best
differentiate taps and none taps for each subject are
amalgamated into the figure providing an illustration of the
range of different frequencies and channels which may be
used to differentiate tap and none tap conditions. Figure 3
illustrates which channels and frequency bands may be
used to differentiate imagined taps from imagined none tap
events.
110 111 112 113 114 115 116 117 118 119−40
−30
−20
−10
0
10
20
30
40
Time (s)
Am
plitu
de
Fig. 1 Typical raw EEG recorded during imagined finger taps made
by the right hand of a representative subject and recorded on electrode
C4. Dashed lines indicate tap cue onset
Frequency (Hz)
Cha
nnel
0 5 10 15 20 25 30 35 40 45FP1FP2
F7F3FzF4F8T3C3CzC4T4T5P3PzP4T6O1O2
Fig. 2 Channels and frequency bands identified by DE for the
differentiation of tap and non tap events across all subjects in the
executed tap condition
Frequency (Hz)
Cha
nnel
0 5 10 15 20 25 30 35 40 45FP1FP2
F7F3FzF4F8T3C3CzC4T4T5P3PzP4T6O1O2
Fig. 3 Channels and frequency bands identified by DE for the
differentiation of tap and no tap events across all subjects in the
imagined tap condition
Cogn Neurodyn (2011) 5:21–30 25
123
As can be seen from Figs. 2 and 3 both the executed and
imagined tap events may be differentiated using a wide
range of channels and frequencies. There is a great deal of
inter-subject and inter-condition variability in the channels
and frequency bands which may be used to best identify
taps. It is difficult to identify a general pattern to the
channels and frequency bands that are best for tap identi-
fication. Channels over the Motor cortex such as Cz and
channels over the Paratial cortex such as Pz are frequently
selected although many of the other channels are also
selected occasionally. Frequencies in the range 10–30 Hz
are most often used to differentiate tap and none tap con-
ditions, although frequencies outside this range are also
used.
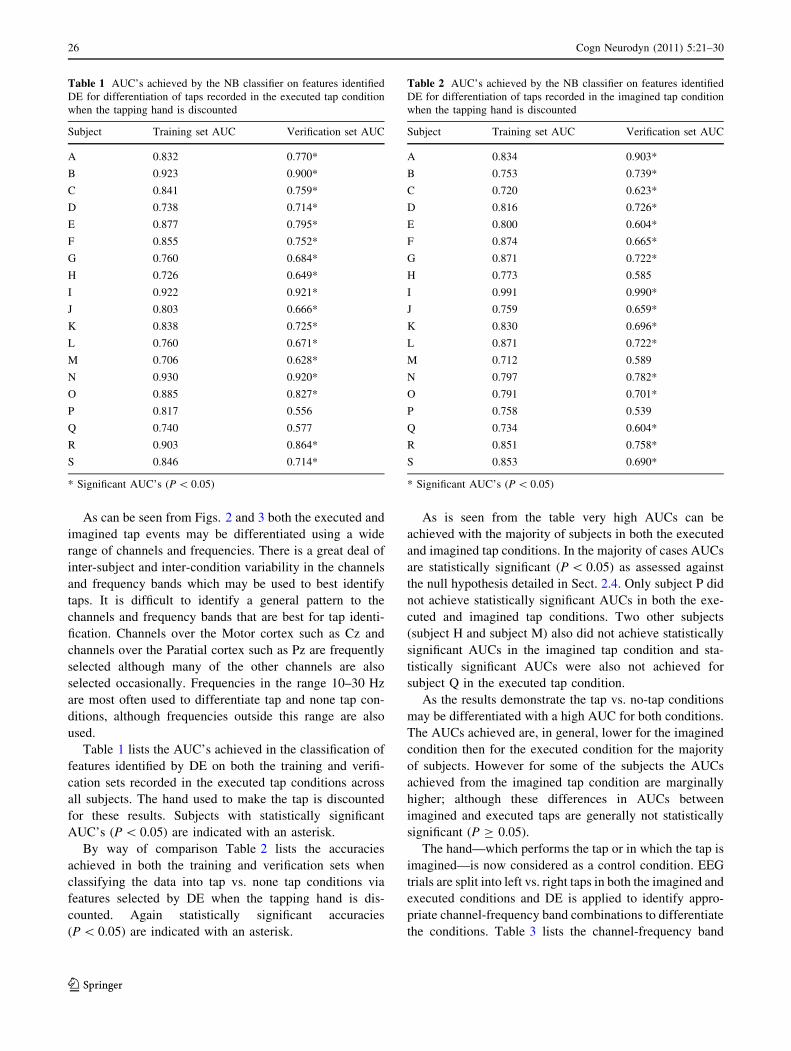
Table 1 lists the AUC’s achieved in the classification of
features identified by DE on both the training and verifi-
cation sets recorded in the executed tap conditions across
all subjects. The hand used to make the tap is discounted
for these results. Subjects with statistically significant
AUC’s (P \ 0.05) are indicated with an asterisk.
By way of comparison Table 2 lists the accuracies
achieved in both the training and verification sets when
classifying the data into tap vs. none tap conditions via
features selected by DE when the tapping hand is dis-
counted. Again statistically significant accuracies
(P \ 0.05) are indicated with an asterisk.
As is seen from the table very high AUCs can be
achieved with the majority of subjects in both the executed
and imagined tap conditions. In the majority of cases AUCs
are statistically significant (P \ 0.05) as assessed against
the null hypothesis detailed in Sect. 2.4. Only subject P did
not achieve statistically significant AUCs in both the exe-
cuted and imagined tap conditions. Two other subjects
(subject H and subject M) also did not achieve statistically
significant AUCs in the imagined tap condition and sta-
tistically significant AUCs were also not achieved for
subject Q in the executed tap condition.
As the results demonstrate the tap vs. no-tap conditions
may be differentiated with a high AUC for both conditions.
The AUCs achieved are, in general, lower for the imagined
condition then for the executed condition for the majority
of subjects. However for some of the subjects the AUCs
achieved from the imagined tap condition are marginally
higher; although these differences in AUCs between
imagined and executed taps are generally not statistically
significant (P C 0.05).
The hand—which performs the tap or in which the tap is
imagined—is now considered as a control condition. EEG
trials are split into left vs. right taps in both the imagined and
executed conditions and DE is applied to identify appro-
priate channel-frequency band combinations to differentiate
the conditions. Table 3 lists the channel-frequency band
Table 1 AUC’s achieved by the NB classifier on features identified
DE for differentiation of taps recorded in the executed tap condition
when the tapping hand is discounted
Subject Training set AUC Verification set AUC
A 0.832 0.770*
B 0.923 0.900*
C 0.841 0.759*
D 0.738 0.714*
E 0.877 0.795*
F 0.855 0.752*
G 0.760 0.684*
H 0.726 0.649*
I 0.922 0.921*
J 0.803 0.666*
K 0.838 0.725*
L 0.760 0.671*
M 0.706 0.628*
N 0.930 0.920*
O 0.885 0.827*
P 0.817 0.556
Q 0.740 0.577
R 0.903 0.864*
S 0.846 0.714*
* Significant AUC’s (P \ 0.05)
Table 2 AUC’s achieved by the NB classifier on features identified
DE for differentiation of taps recorded in the imagined tap condition
when the tapping hand is discounted
Subject Training set AUC Verification set AUC
A 0.834 0.903*
B 0.753 0.739*
C 0.720 0.623*
D 0.816 0.726*
E 0.800 0.604*
F 0.874 0.665*
G 0.871 0.722*
H 0.773 0.585
I 0.991 0.990*
J 0.759 0.659*
K 0.830 0.696*
L 0.871 0.722*
M 0.712 0.589
N 0.797 0.782*
O 0.791 0.701*
P 0.758 0.539
Q 0.734 0.604*
R 0.851 0.758*
S 0.853 0.690*
* Significant AUC’s (P \ 0.05)
26 Cogn Neurodyn (2011) 5:21–30
123
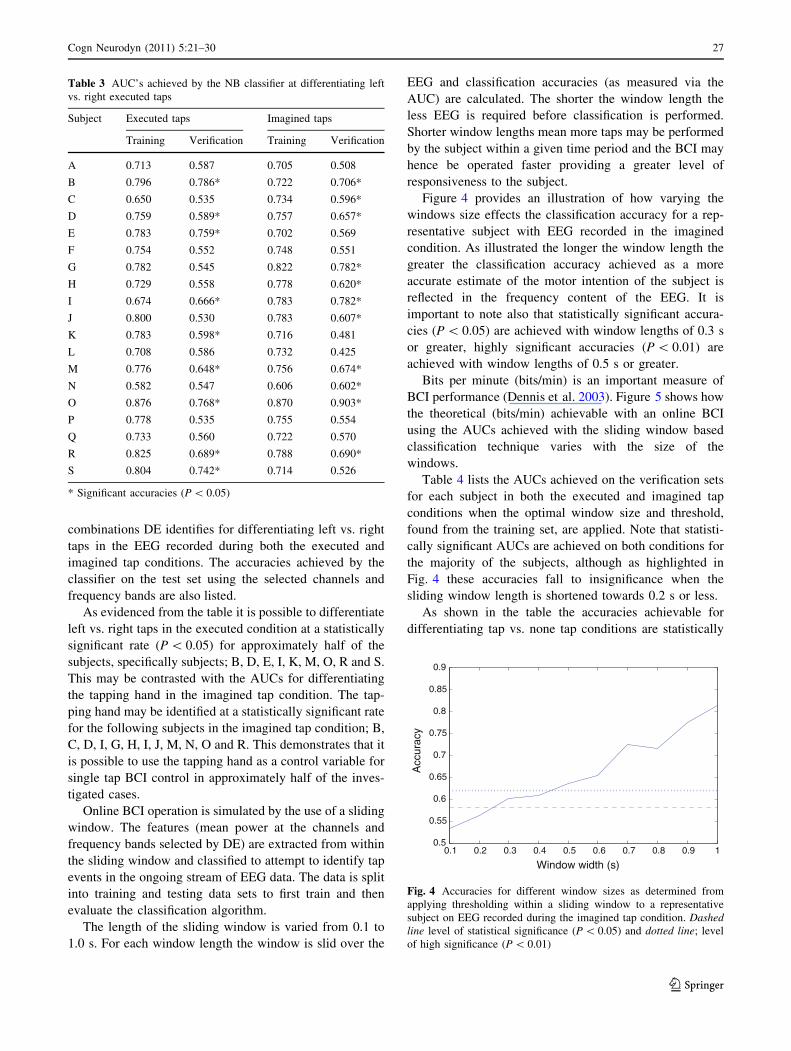
combinations DE identifies for differentiating left vs. right
taps in the EEG recorded during both the executed and
imagined tap conditions. The accuracies achieved by the
classifier on the test set using the selected channels and
frequency bands are also listed.
As evidenced from the table it is possible to differentiate
left vs. right taps in the executed condition at a statistically
significant rate (P \ 0.05) for approximately half of the
subjects, specifically subjects; B, D, E, I, K, M, O, R and S.
This may be contrasted with the AUCs for differentiating
the tapping hand in the imagined tap condition. The tap-
ping hand may be identified at a statistically significant rate
for the following subjects in the imagined tap condition; B,
C, D, I, G, H, I, J, M, N, O and R. This demonstrates that it
is possible to use the tapping hand as a control variable for
single tap BCI control in approximately half of the inves-
tigated cases.
Online BCI operation is simulated by the use of a sliding
window. The features (mean power at the channels and
frequency bands selected by DE) are extracted from within
the sliding window and classified to attempt to identify tap
events in the ongoing stream of EEG data. The data is split
into training and testing data sets to first train and then
evaluate the classification algorithm.
The length of the sliding window is varied from 0.1 to
1.0 s. For each window length the window is slid over the
EEG and classification accuracies (as measured via the
AUC) are calculated. The shorter the window length the
less EEG is required before classification is performed.
Shorter window lengths mean more taps may be performed
by the subject within a given time period and the BCI may
hence be operated faster providing a greater level of
responsiveness to the subject.
Figure 4 provides an illustration of how varying the
windows size effects the classification accuracy for a rep-
resentative subject with EEG recorded in the imagined
condition. As illustrated the longer the window length the
greater the classification accuracy achieved as a more
accurate estimate of the motor intention of the subject is
reflected in the frequency content of the EEG. It is
important to note also that statistically significant accura-
cies (P \ 0.05) are achieved with window lengths of 0.3 s
or greater, highly significant accuracies (P \ 0.01) are
achieved with window lengths of 0.5 s or greater.
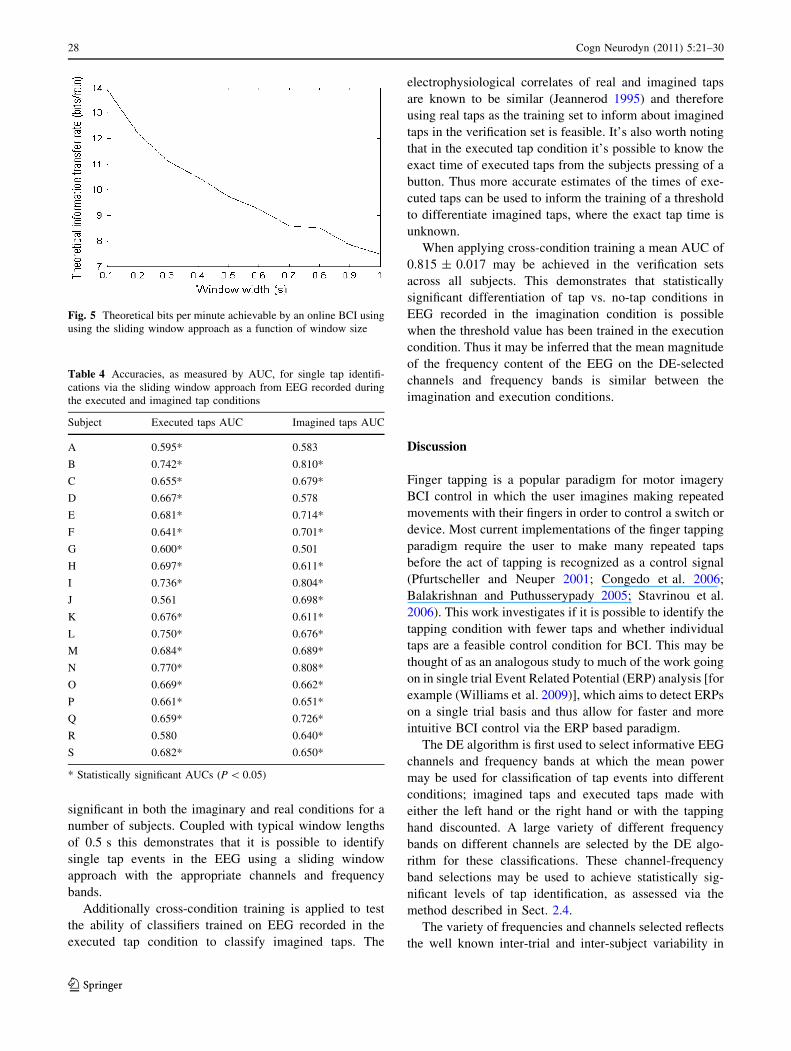
Bits per minute (bits/min) is an important measure of
BCI performance (Dennis et al. 2003). Figure 5 shows how
the theoretical (bits/min) achievable with an online BCI
using the AUCs achieved with the sliding window based
classification technique varies with the size of the
windows.
Table 4 lists the AUCs achieved on the verification sets
for each subject in both the executed and imagined tap
conditions when the optimal window size and threshold,
found from the training set, are applied. Note that statisti-
cally significant AUCs are achieved on both conditions for
the majority of the subjects, although as highlighted in
Fig. 4 these accuracies fall to insignificance when the
sliding window length is shortened towards 0.2 s or less.
As shown in the table the accuracies achievable for
differentiating tap vs. none tap conditions are statistically
Table 3 AUC’s achieved by the NB classifier at differentiating left
vs. right executed taps
Subject Executed taps Imagined taps
Training Verification Training Verification
A 0.713 0.587 0.705 0.508
B 0.796 0.786* 0.722 0.706*
C 0.650 0.535 0.734 0.596*
D 0.759 0.589* 0.757 0.657*
E 0.783 0.759* 0.702 0.569
F 0.754 0.552 0.748 0.551
G 0.782 0.545 0.822 0.782*
H 0.729 0.558 0.778 0.620*
I 0.674 0.666* 0.783 0.782*
J 0.800 0.530 0.783 0.607*
K 0.783 0.598* 0.716 0.481
L 0.708 0.586 0.732 0.425
M 0.776 0.648* 0.756 0.674*
N 0.582 0.547 0.606 0.602*
O 0.876 0.768* 0.870 0.903*
P 0.778 0.535 0.755 0.554
Q 0.733 0.560 0.722 0.570
R 0.825 0.689* 0.788 0.690*
S 0.804 0.742* 0.714 0.526
* Significant accuracies (P \ 0.05)
0.1 0.2 0.3 0.4 0.5 0.6 0.7 0.8 0.9 10.5
0.55
0.6
0.65
0.7
0.75
0.8
0.85
0.9
Window width (s)
Acc
urac
y
Fig. 4 Accuracies for different window sizes as determined from
applying thresholding within a sliding window to a representative
subject on EEG recorded during the imagined tap condition. Dashedline level of statistical significance (P \ 0.05) and dotted line; level
of high significance (P \ 0.01)
Cogn Neurodyn (2011) 5:21–30 27
123
significant in both the imaginary and real conditions for a
number of subjects. Coupled with typical window lengths
of 0.5 s this demonstrates that it is possible to identify
single tap events in the EEG using a sliding window
approach with the appropriate channels and frequency
bands.
Additionally cross-condition training is applied to test
the ability of classifiers trained on EEG recorded in the
executed tap condition to classify imagined taps. The
electrophysiological correlates of real and imagined taps
are known to be similar (Jeannerod 1995) and therefore
using real taps as the training set to inform about imagined
taps in the verification set is feasible. It’s also worth noting
that in the executed tap condition it’s possible to know the
exact time of executed taps from the subjects pressing of a
button. Thus more accurate estimates of the times of exe-
cuted taps can be used to inform the training of a threshold
to differentiate imagined taps, where the exact tap time is
unknown.
When applying cross-condition training a mean AUC of
0.815 ± 0.017 may be achieved in the verification sets
across all subjects. This demonstrates that statistically
significant differentiation of tap vs. no-tap conditions in
EEG recorded in the imagination condition is possible
when the threshold value has been trained in the execution
condition. Thus it may be inferred that the mean magnitude
of the frequency content of the EEG on the DE-selected
channels and frequency bands is similar between the
imagination and execution conditions.
Discussion
Finger tapping is a popular paradigm for motor imagery
BCI control in which the user imagines making repeated
movements with their fingers in order to control a switch or
device. Most current implementations of the finger tapping
paradigm require the user to make many repeated taps
before the act of tapping is recognized as a control signal
(Pfurtscheller and Neuper 2001; Congedo et al. 2006;
Balakrishnan and Puthusserypady 2005; Stavrinou et al.
2006). This work investigates if it is possible to identify the
tapping condition with fewer taps and whether individual
taps are a feasible control condition for BCI. This may be
thought of as an analogous study to much of the work going
on in single trial Event Related Potential (ERP) analysis [for
example (Williams et al. 2009)], which aims to detect ERPs
on a single trial basis and thus allow for faster and more
intuitive BCI control via the ERP based paradigm.
The DE algorithm is first used to select informative EEG
channels and frequency bands at which the mean power
may be used for classification of tap events into different
conditions; imagined taps and executed taps made with
either the left hand or the right hand or with the tapping
hand discounted. A large variety of different frequency
bands on different channels are selected by the DE algo-
rithm for these classifications. These channel-frequency
band selections may be used to achieve statistically sig-
nificant levels of tap identification, as assessed via the
method described in Sect. 2.4.
The variety of frequencies and channels selected reflects
the well known inter-trial and inter-subject variability in
Fig. 5 Theoretical bits per minute achievable by an online BCI using
using the sliding window approach as a function of window size
Table 4 Accuracies, as measured by AUC, for single tap identifi-
cations via the sliding window approach from EEG recorded during
the executed and imagined tap conditions
Subject Executed taps AUC Imagined taps AUC
A 0.595* 0.583
B 0.742* 0.810*
C 0.655* 0.679*
D 0.667* 0.578
E 0.681* 0.714*
F 0.641* 0.701*
G 0.600* 0.501
H 0.697* 0.611*
I 0.736* 0.804*
J 0.561 0.698*
K 0.676* 0.611*
L 0.750* 0.676*
M 0.684* 0.689*
N 0.770* 0.808*
O 0.669* 0.662*
P 0.661* 0.651*
Q 0.659* 0.726*
R 0.580 0.640*
S 0.682* 0.650*
* Statistically significant AUCs (P \ 0.05)
28 Cogn Neurodyn (2011) 5:21–30
123
the EEG (Thulasidas et al. 2006). Task relevant compo-
nents of the EEG are known to change in temporal, spatial
and spectral location and morphology from trial to trial and
from subject to subject. This variability is a known issue in
BCI research and can lead to a lack of robustness and
reliability in BCI systems.
In this work the DE algorithm selects—for every subject
and every condition—a number of different channels and
frequency bands to use in the classification of tap events. In
doing so the classifier is able to use a number of spectral
and spatial locations which could, potentially, lead to more
robust classification results. Further to this, because the
selection of the channels and frequency locations is made
individually for each subject and each condition inter-trial
and inter-subject variabilities may be better accommodated
for.
AUCs achieved in differentiating tap vs. none tap events
using mean frequency powers identified by DE exceed 0.90
for some of the subjects in the executed condition and one
subject in the imagined condition. In general the AUCs are
in the range of 0.6–0.9 which compares well with analo-
gous 1-dimensional motor imagery BCI paradigms such as
(Fabiani et al. 2004) which achieves accuracies of between
71.8 and 74.3% or (Ang 2008) which achieves a mean
accuracy of 73.3 ± 2.8%.
Differentiating left vs. right hand taps in the executed
and imagined tap conditions produces statistically signifi-
cant discriminations in a number of cases in the executed
tap condition. AUCs produced are around 0.70 with a
maximum of 0.79 this compares reasonably to (Pfurtsch-
eller and Neuper 2001) which reports an average accuracy
of left vs. right hand movement imagery differentiation of
75.0%. Although it should be noted that left-right taps
could only be differentiated at a statistically significant rate
in approximately half of the subjects.
A sliding window approach is applied to attempt to
identify individual tap events in the EEG. The electrode
channels chosen by DE are used as the basis for control. The
mean band powers of the EEG at the selected frequencies
are calculated on these channels. A classification function is
then applied within the sliding window to identify tap
events. Thus DE is used to first select which channels and
frequency bands to concentrate on. Classification is then
applied in a manner analogous to online BCI operation.
The subjects are cued to tap at different rates from once
every 0.5 s to once every 2 s, interspersed with occasional
blocks of rest periods. The length of the sliding window is
varied from 0.1 to 1.0 s in steps of 0.1 s. The sliding
window is therefore likely to contain just one tap event
and, when it’s length is 0.5 s or less, it’s guaranteed to
contain just one tap event.
Classification applied within time windows of 1 s and
less produces highly statistically significant identification
of taps, both imagined and executed. Shorter time windows
also allow classification of taps at a statistically significant
rate although the AUC decreases as an inverse function of
the window length. The minimum window length at which
highly statistically significant (P \ 0.01) rates of tap
identification can be achieved is 0.5 s, therefore single taps
can be identified via a sliding time window in an analogous
manner to online BCI operation.
Importantly using channel and frequency band combi-
nations identified by the DE feature selection algorithm
allows identification of the correct channels and frequency
bands for tap identification to be performed. Within these
channel-frequency band combinations classification may
be used to identify executed and imagined movements and
hence allow highly statistically significant identification of
executed and imagined taps.
The hand in which the subject performs, or imagines
performing, a tap may also be used as a control condition.
Statistically significant identification is achieved in iden-
tifying the tapping hand for approximately half of the
subjects, suggesting a possibility for the use of the tapping
hand as an additional control condition in a number of
cases
Additionally EEG recorded during imagined taps is
informative for the differentiation of tap vs. none tap
events in the imagined tap condition. This indicates that the
channels and frequency bands used to differentiate taps
from none taps in the executed condition may also be used
to differentiate taps from none taps in the imagination
condition. This further confirms the results reported in
(Jeannerod 1995) that the neurophysiological correlates of
motor imagery and motor execution are similar.
An important criterion for ranking BCIs is the bit rate—
bits per minute (bits/min)—a measure of the speed of
information transfer that the BCI may achieve. As shown in
Fig. 5 the theoretical bit rate for a BCI based upon single
finger tap identifications in the left and right hands varies as
a function on the size of the sliding window. The shorter
the window the better the bit rate the BCI can achieve but
also the lower the accuracy, as the bit rate measure
incorporates individual trial accuracies this suggests that
the best choice for a practical BCI is to use a short window
length which still achieves statistically significant levels of
accuracy, e.g. 0.5 s.
Single tap identification is an important result for BCI
because it paves the way for much faster, more accurate
motor imagery based BCI’s. This could potentially include
BCIs operated by users imagining patterns or sequences of
rapid taps to achieve different control conditions in a fast
and intuitive manner. It could also lead to the use of pat-
terns of taps as a control mechanism for BCI, something
akin to a tap based morse code for BCI control. Future
work will focus on building online BCI systems to
Cogn Neurodyn (2011) 5:21–30 29
123
differentiate different tap conditions, including tap pattern
recognition.
Conclusion
Motor imagery is a common BCI paradigm that can make
use of finger tapping imagery. This work looks at identi-
fication of single taps as a control signal, as opposed to
other finger tapping based BCIs which rely on the user
making/imagining repeating many taps to achieve control
of the BCI.
A DE algorithm is applied to identify appropriate
channels and frequency bands for tap identification. A
sliding window is then applied, in a manner analogous to
online BCI operation, to attempt to identify taps from the
mean band power on the selected channels and at the
selected frequency bands.
Taps are identified over very short time windows in both
the executed movement and imagined movement condi-
tions. Left hand vs. right hand single taps may also be
differentiated for approximately half the subjects. This
presents the possibility for both faster BCI control and tap
pattern based control.
Acknowledgments The authors would like to thank the reviewers
for their many helpful comments which were instrumental in
improving the quality of this work. They would also like to extend
their thanks to the numerous friends and colleagues who freely gave
their time to volunteer as subjects in this study.
References
Ang KK (2008) A clinical evaluation of non-invasive motor imagery-
based brain-computer interface in stroke. Proc A Int Conf IEEE
Eng Med Biol Soc 2008:4178–4181
Balakrishnan D, Puthusserypady S (2005) Multilayer perceptrons for
the classification of brain computer interface data. In: Proceed-
ings of the IEEE 31st annual Northeast bioengineering confer-
ence, 2005. IEEE, pp 118–119
Birbaumer N (2000) The Thought Translation Device (TTD) for
completely paralyzed patients. IEEE Trans Rehab Eng 8(2):
190–193
Blankertz B, Dornhege G, Krauledat M, Muller KR, Kunzmann V,
Losch F, Curio G (2006) The Berlin Brain-computer interface:
EEG-based communication without subject training. IEEE Trans
Neural Syst Rehab Eng Publ IEEE Eng Med Biol Soc 14(2):
147–152
Congedo M, Lotte F, Lecuyer A (2006) Classification of movement
intention by spatially filtered electromagnetic inverse solutions.
Phys Med Biol 51(8):1971–1989
Dennis J, McFarland William A, Sarnacki JRW (2003) Brain-
computer interface (BCI) operation: optimizing information
transfer rates. Biol Psychol 63:237–251
Fabiani GE, McFarland DJ, Wolpaw JR, Pfurtscheller G (2004)
Conversion of EEG activity into cursor movement by a brain-
computer interface (BCI). IEEE Trans Neural Syst Rehab Eng
Publ IEEE Eng Med Biol Soc12(3):331–338
Jeannerod M (1995) Mental imagery in the motor cortex. Neuro-
psychologia 33:1143–1419
Pfurtscheller G, Neuper C (2001) Motor imagery and direct brain-
computer communication. Proc IEEE 89(7):1123–1134
Portelli AJ, Nasuto SJ (2008) Toward construction of an inexpensive
brain computer interface for goal oriented applications. In:
AISB, Aberdeen, AISB, pp 2–7
Stavrinou ML, Moraru L, Pelekouda P, Kokkinos V (2006) A wavelet
tool to discriminate imagery versus actual finger movements
towards a brain computer interface. In: Biological and medical
data analysis of 7th international symposium, Thessaloniki,
Greece, pp 323–333
Storn R, Price K (1995) Differential evolution—a simple and
effiecient adaptive scheme for global optimzation over continous
spaces
Thulasidas M, Guan C, Wu J (2006) Robust classification of EEG
signal for brain–computer interface. IEEE Trans Neural Syst
Rehab Eng Publ IEEE Eng Med Biol Soc 14(1):24–29
Vaughan TM (2006) The Wadsworth BCI research and development
program: at home with BCI. IEEE Trans Neural Syst Rehab Eng
Publ IEEE Eng Med Biol Soc 14(2):229–233
Williams N, Daly I, Nasuto SJ, Saddy D, Warwick K (2009) ERP
classification using empirical mode decomposition. In: The 5th
UK and RI postgraduate conference in biomedical engineering &
medical physics, Oxford, pp 5–6
Wolpaw JR (2007) Brain–computer interfaces as new brain output
pathways. J Physiol 579(Pt 3):613–619
30 Cogn Neurodyn (2011) 5:21–30
123