

Single motor unit activity in human extraocular muscles during the vestibulo-ocular reflex
35
1 Single motor unit activity in human extraocular muscles during the vestibulo-ocular reflex Running title: Extraocular motor unit activity during the VOR Konrad P. Weber* 1,2 , Sally M. Rosengren* 2,3 , Rike Michels 1 , Veit Sturm 1 , Dominik Straumann 2 and Klara Landau 1 *These authors contributed equally to this work 1 Ophthalmology Department, University Hospital Zurich, Switzerland 2 Neurology Department, University Hospital Zurich, Switzerland 3 Neurology Department, Royal Prince Alfred Hospital, Sydney, Australia. Correspondence should be addressed to Konrad P. Weber ([email protected] , Ophthalmology Department, Frauenklinikstrasse 24, CH-8091, Zurich, Switzerland). Key words: vestibulo-ocular reflex, extraocular muscles, electromyography Word count: 4802 TOC Category: Neuroscience - behavioural/systems/cognitive ) at CAPES - Usage on May 7, 2012 jp.physoc.org Downloaded from J Physiol (
Transcript of Single motor unit activity in human extraocular muscles during the vestibulo-ocular reflex

1
Single motor unit activity in human extraocular muscles during the vestibulo-ocular reflex Running title: Extraocular motor unit activity during the VOR
Konrad P. Weber*1,2, Sally M. Rosengren*2,3, Rike Michels1, Veit Sturm1, Dominik Straumann2 and Klara Landau1 *These authors contributed equally to this work 1Ophthalmology Department, University Hospital Zurich, Switzerland 2Neurology Department, University Hospital Zurich, Switzerland 3Neurology Department, Royal Prince Alfred Hospital, Sydney, Australia. Correspondence should be addressed to Konrad P. Weber ([email protected], Ophthalmology Department, Frauenklinikstrasse 24, CH-8091, Zurich, Switzerland). Key words: vestibulo-ocular reflex, extraocular muscles, electromyography Word count: 4802 TOC Category: Neuroscience - behavioural/systems/cognitive
) at CAPES - Usage on May 7, 2012jp.physoc.orgDownloaded from J Physiol (

2
KEY POINTS SUMMARY
• While the eye movements have been well characterized during the vestibulo-ocular reflex,
the corresponding motor unit activity in human eye muscles is not well understood.
• The present study describes the first single motor unit recordings during the vestibulo-
ocular reflex in human eye muscles.
• Simultaneous needle and surface recordings identified the inferior oblique as the eye
muscle of origin of the ocular vestibular evoked myogenic potential (oVEMP), thus
validating the physiological basis of this clinical test of otolith function.
• The results demonstrate short-latency vestibulo-ocular projections from the otoliths to
individual eye muscles.
• Single motor unit activity of eye muscles provides a window into neural activity of the
ocular motor nuclei in humans.
Word count: 116
) at CAPES - Usage on May 7, 2012jp.physoc.orgDownloaded from J Physiol (

3
ABSTRACT
Motor unit activity in human eye muscles during the vestibulo-ocular reflex (VOR) is not well
understood, since the associated head and eye movements normally preclude single unit
recordings. Therefore we recorded single motor unit activity following bursts of skull
vibration and sound, two vestibular otolith stimuli that elicit only small head and eye
movements. Inferior oblique (IO) and inferior rectus (IR) muscle activity was measured in
healthy humans with concentric needle electrodes. Vibration elicited highly synchronous,
short-latency bursts of motor unit activity in the IO (latency: 10.5 ms) and IR (14.5 ms)
muscles. The activation patterns of the two muscles were similar, but reciprocal, with delayed
activation of the IR muscle. Sound produced short-latency excitation of the IO muscle (13.3
ms) in the eye contralateral to the stimulus. Simultaneous needle and surface recordings
identified the IO as the muscle of origin of the vestibular evoked myogenic potential
(oVEMP) thus validating the physiological basis of this recently developed clinical test of
otolith function. Single extraocular motor unit recordings provide a window into neural
activity in humans that can normally only be examined using animal models and help identify
the pathways of the translational VOR from otoliths to individual eye muscles.
ABBREVIATIONS
cVEMP, cervical vestibular evoked myogenic potential; EMG, electromyography; IO, inferior
oblique eye muscle; IR, inferior rectus eye muscle; oVEMP, ocular vestibular evoked
myogenic potential; VOR, vestibulo-ocular reflex.
) at CAPES - Usage on May 7, 2012jp.physoc.orgDownloaded from J Physiol (

4
INTRODUCTION
Little is known about the motor unit activity of individual extraocular muscles during
vestibular-evoked eye movements. One reason for this is that the large eye and head
movements normally associated with vestibular stimulation preclude holding single motor
units for electromyographic (EMG) needle recording. As the activity of ocular motor neurons
during the vestibulo-ocular reflex (VOR) often closely reflects that of extraocular motor units,
neural activity is typically recorded directly from the brainstem in animals. Only few studies
have recorded extraocular muscle activity following vestibular stimulation in animals
(Lorente de Nó, 1934; Szentágothai, 1950; Cohen & Suzuki, 1963). In humans, Magora et al.
(1973) recorded vestibular nystagmus using intramuscular electrodes during caloric
stimulation. They confirmed the principle of reciprocal innervation of agonist and antagonist
eye muscles during both the slow and quick phases of horizontal nystagmus. These studies
reported global EMG activity, but did not record from single motor units. In contrast, direct
recordings from extraocular motor units provide a window into VOR activation in humans
that can otherwise only be studied in animal models.
To allow safe single motor unit recordings in extraocular muscles during the VOR in
humans, we used unique forms of vestibular stimulation which leave the head still and evoke
only very small eye movements: skull vibration and loud sound (Todd et al., 2007;
Welgampola et al., 2009). Sound and vibration have long been known to activate vestibular
afferents, and evidence from recent animal studies suggests that in the normal ear they
preferentially activate the receptors of irregularly-firing otolith afferents (Murofushi &
Curthoys, 1997; Curthoys et al., 2006). This is likely due to the common evolutionary origin
of the otolith and hearing organs in vertebrates, preserving the sensitivity to vibration and
sound in mammalian otoliths (Carey & Amin, 2006). Eye movements evoked by these
stimuli are therefore a type of otolith-mediated, translational VOR.
) at CAPES - Usage on May 7, 2012jp.physoc.orgDownloaded from J Physiol (

5
Although the eye movements evoked by vibration and sound are very small, the
extraocular muscle activity associated with them is robust and can be recorded from surface
electrodes placed near the eyes. This muscle activity is independent of the electrical activity
generated by the corneoretinal dipole (i.e. the electro-oculogram, EOG; Todd et al., 2007;
Welgampola et al., 2009) and the response is called an ocular vestibular evoked myogenic
potential (oVEMP) due to its similarity with the cervical VEMP recorded from the neck
muscles (Rosengren et al., 2010). The cVEMP is a short-latency, inhibitory potential
typically measured from the sternocleidomastoid muscle in response to stimulation of the
ipsilateral ear with air-conducted sound (Colebatch et al., 1994; Colebatch & Rothwell,
2004). The oVEMP is also a short-latency reflex, but has a ‘crossed’ projection, i.e. is
primarily recorded in the eye contralateral to the stimulated ear (Iwasaki et al., 2007). Recent
clinical studies in patients with selective lesions of the superior or inferior divisions of the
vestibular nerve have suggested that oVEMPs are mediated by afferents coursing in the
superior nerve division (e.g. Iwasaki et al., 2009; Shin et al., 2012), which includes afferents
from the utricle and anterior hook of the saccule. oVEMPs are largest when measured from
surface electrodes placed beneath the eyes during up-gaze, suggesting that the inferior
extraocular muscles are important contributors to the reflex. Under these conditions, the
oVEMP consists of a series of peaks of electrical activity, typically beginning with a negative
peak at ~10 ms (n10) (Todd et al., 2007; Chihara et al., 2009; Welgampola et al., 2009). As
this n10 peak is abolished in the eye contralateral to a vestibular lesion, the oVEMP can be
used to test otolith function in patients with vestibular dysfunction (Iwasaki et al., 2007).
The oVEMP provides a rare opportunity to investigate eye muscle activity during the
translational VOR in humans. As evidence from oVEMP studies suggests involvement of the
inferior extraocular muscles, we targeted the inferior oblique (IO) and inferior rectus (IR)
muscles and recorded single motor unit activity using concentric needle electrodes. The
technique was based on a method used to determine the basis of the cVEMP recorded from
) at CAPES - Usage on May 7, 2012jp.physoc.orgDownloaded from J Physiol (

6
the cervical muscles (Colebatch & Rothwell, 2004). Our main interest was in the initial
latency and the time course of muscle activity. We determined the contribution of these
muscles to the clinical oVEMP and used the oVEMP as a model to study the VOR in
response to impulsive otolith stimulation at the level of individual extraocular muscles.
METHODS
Subjects
Three normal volunteers were studied over 11 sessions and each subject was tested at
least 3 times (1 female, 2 males; age range 34-48 years; 1 left and 10 right eye recordings).
The subjects had no history of conductive hearing loss or vestibular, neurological or
ophthalmologic disease (excepting a refractive error). The participants (all co-investigators)
gave written informed consent according to the Declaration of Helsinki and the study was
approved by the local ethics committee (Kantonale Ethik-Kommission Zurich, 2010-0177/3).
We tested only co-investigators due to the high level of cooperation required. This is not
likely to have biased the results as the very short reflex latency precludes voluntary control.
Vestibular stimulation
The vestibular stimuli were unshaped 500 Hz bursts of vibration and sound. These
stimuli were chosen as they are used in both clinical end experimental contexts to elicit
oVEMPs and assess otolith function. Vibration produces robust oVEMPs with large
amplitude and is a common oVEMP stimulus. In contrast, sound stimulation is a more
traditional cVEMP stimulus, but evokes smaller oVEMPs. Both stimuli were included as
they likely test varying, though probably overlapping, populations of otolith afferents with
different directional sensitivity. Sound stimulation also activates a single ear, allowing
investigation of the laterality of the response.
) at CAPES - Usage on May 7, 2012jp.physoc.orgDownloaded from J Physiol (

7
Vibration was delivered with a hand-held ‘minishaker’ positioned over the hairline
near Fz (500 Hz, 4 ms, minishaker model 4810; amplifier model 2706, Brüel & Kjaer P/L).
Measurement of the head acceleration evoked by this stimulus showed that the initial
acceleration peak was largest and most consistent in the interaural (y) axis (a ‘bowing out’ of
the mastoids of 0.1 g), with smaller peaks in inconsistent directions in the x (0.06 g) and z
(0.03 g) axes (n = 10 subjects, accelerometer ADXL330, Analog Devices, Norwood, MA,
USA).
The sound stimuli were delivered with calibrated headphones and custom amplifier at
142 dB peak SPL (500 Hz, 4 ms, TDH 39, Telephonics Corp.). Both stimuli were generated
with customized software using a laboratory interface (micro1401, Cambridge Electronic
Design (CED)) and delivered at a rate of 7.5 Hz up to a maximum of 2000 repetitions per trial
(typically 1000 per trial).
Single motor unit recordings
Subjects reclined to approximately 20 deg above the horizontal. We used ultra thin
(0.3 mm diameter, 30G) disposable concentric needles (Neuroline, Ambu A/S) to record
single motor units. For IO recordings, topical anaesthetic was applied to the skin beneath the
eye (lidocaine gel 2%, Cantonal Pharmacy). The needle was inserted through the skin at the
medial aspect of the inferior orbital margin into the muscle belly and held in position during
the recording period (Breinin, 1962). For IR recordings, topical anaesthetic was applied to the
eye (oxybuprocaine drops 0.4%, Théa Pharma S.A.) and a lid retractor was inserted. The eye
was rotated manually using forceps and the needle inserted into the IR under visual guidance.
We attempted to record data in all three subjects from both the IO and IR muscles using
vibration and sound stimulation. This was achieved for the IO muscle (from all three subjects
and both stimulation types). However, measurement from the IR muscle was discontinued
due to a minor scleral perforation in one subject, and thus IR data was available only in two
) at CAPES - Usage on May 7, 2012jp.physoc.orgDownloaded from J Physiol (

8
subjects with vibration stimulation. In all cases, audio feedback was provided to aid
placement of the electrode, to help subjects maintain constant activation of one or more motor
units and to confirm that a motor unit originated from the intended muscle. The needle
insertion was always performed by the same ophthalmologist (KL). In contrast to standard
surface oVEMPs recorded in maximal up-gaze, gaze angle varied in needle recordings and
was adjusted to allow only a small, distinguishable number of units to be recorded at once,
however it was typically near neutral position. EMG was recorded with the same micro1401
data acquisition interface and custom software as described above. Data were sampled at 50
kHz for 100 ms (from 40 ms before to 60 ms following stimulus onset), amplified and
bandpass filtered (5 Hz to 10 kHz).
Surface oVEMP recordings
Surface potentials were recorded simultaneously using an active electrode placed just
below the infra-orbital margin and a reference directly below it on the cheek, with the earth
placed nearby (Blue sensor N, Ambu A/S). For comparison, standard surface oVEMPs were
recorded during maximal up-gaze with the active electrode placed closer to the lower lid.
Negative potentials at the active electrodes were displayed as upward deflections. Latencies
were measured at the response peak.
Data analysis
Motor unit spikes were identified using a threshold level and clustered with custom
software (MatLab, The MathWorks Inc.) based on an automatic algorithm using wavelets and
super-paramagnetic clustering (Quiroga et al., 2004). The recordings typically included
multiple units, from which single units were extracted (Figure 1A-C). Peri-stimulus time
histograms consisting of 100 bins of 1 ms width (centered at whole numbers) were
constructed for each unit (Figure 1EF). The cluster software was set to maximise specificity
) at CAPES - Usage on May 7, 2012jp.physoc.orgDownloaded from J Physiol (

9
rather than sensitivity in order to ensure that single unit clusters were not contaminated with
extraneous spikes. The accuracy of the software was confirmed for each single unit by visual
comparison of the selected spikes with the raw data. For recordings in which spikes from a
single unit could not be reliably differentiated, multiple unit histograms were constructed to
show the behaviour of several units recorded simultaneously. The number of spikes in each
histogram ranged from 305 to 2734 for single unit histograms and 580 to 21345 for multiple
unit histograms. Local maxima and minima in the histogram were detected based on the
known properties of the surface oVEMP (Iwasaki et al., 2008). The tallest bin within the first
15 ms after stimulus onset but after the stimulus artefact (5 ms) was selected as the first peak.
The peak was accepted if the change in spike count exceeded the mean baseline spike count
measured over the 40 ms pre-stimulus period by 2 standard deviations (SD). Using this
method, the rate of false positives detected during the pre-stimulus period was under 5%.
Subsequent local minima and maxima at expected intervals (~5 ms) were accepted without
applying the SD criterion. Latencies were measured at the local minima and maxima and
adjusted to correct for a 0.5 ms delay in the recording system.
Statistical analysis
The values reported are mean ± standard deviation. Statistical analysis was performed
on data from multiple unit histograms only, due to the small number of single unit histograms.
Non-parametric statistics were used (i.e. the Mann-Whitney U and Kruskal-Wallis tests) and
the significance level was set at P = 0.05.
RESULTS
The peri-stimulus time histograms showed that the initial motor unit response to brief
bursts of vibration and sound was an increase in discharge, for each extraocular muscle tested.
The initial increase was followed by a decrease in discharge and then additional increases and
) at CAPES - Usage on May 7, 2012jp.physoc.orgDownloaded from J Physiol (

10
decreases, such that the entire response consisted of a series of peaks and troughs of activity
with diminishing amplitude over time. The characteristics of the response recorded in the
different extraocular muscles (IO and IR) and with the different types of vestibular
stimulation (vibration and sound) are described in detail below.
Inferior oblique muscle
Vibration
Following stimulation of the forehead with 4 ms pulses of vibration, we recorded an
initial increase in single motor unit discharge in the IO muscle at a mean latency of 10.5 ± 1.1
ms (range 9.5-12.5 ms, n = 6 single units). The discharge at this latency was up to ~10 times
the baseline level seen during the 40 ms pre-stimulus period (mean 3.9 ± 3.2, range 1.8 to 9.9
times baseline). The duration was very short: for four of six single units duration was only 1
ms (Figure 2A). The initial peak was followed by a decrease in activity at 17.0 ± 1.6 ms, a
second peak in discharge at 22.0 ± 1.4 ms and a subsequent decrease at 27.5 ± 3.0 ms, and the
mean interval between the first two peaks was 11.1 ± 2.3 ms. The single units sometimes
showed a complete absence of firing after the initial peak (Figure 2A). We found similar
modulation in multiple unit histograms (Table 1). Figure 2B shows an example of a typical
multiple unit histogram, which had broad peaks and at least three cycles of increasing and
decreasing activity. The addition of several units with slightly different temporal
characteristics during the same recording gave the multiple unit histograms a smoother and
broader form than the single unit ones. This effect was further enhanced when all units from
the same experimental condition recorded in a single subject over several sessions were
combined (Figure 2C).
) at CAPES - Usage on May 7, 2012jp.physoc.orgDownloaded from J Physiol (

11
Sound
The responses evoked by sound versus vibration are compared in Figure 2. Following
stimulation with 4 ms bursts of air-conducted sound, there was an initial increase in discharge
of the IO muscle contralateral to the stimulus at a mean latency of 13.3 ± 1.3 ms (range 11.5-
14.5 ms, amplitude 2.0 ± 0.2 times baseline, duration 1 ms, n = 4 single units), with
subsequent troughs and peaks of activity at latencies of 17.3, 29.3 and 34.3 ms (Figure 2).
The effect was similar in the multiple unit histograms (Table 1). The initial peak evoked by
sound occurred significantly later than that evoked by vibration (13.1 vs 10.2 ms, P < 0.001)
and the interval between peaks of increased discharge was longer for sound stimulation (14.3
vs 11.1 ms, P = 0.003), possibly due to the sound stimuli being less intense relative to
vibration.
In contrast to the contralateral ear, stimulation of the ear ipsilateral to the IO muscle
produced no consistent effect across the three subjects. For two of the subjects, insufficient
vestibular activation by sound may have contributed to this lack of effect. The stimulus
intensity was at the upper limit of safe acoustic stimulation levels, but was still close to the
threshold to sound in the ipsilateral ears of these subjects. However, in one subject no
response was seen even with stimulation at 10 dB above the oVEMP threshold for that ear.
Inferior rectus muscle
In recordings from the IR muscle using vibration (Figure 3), the initial increase in
discharge occurred at 14.5 ± 0 ms (3.5 ± 1.3 times baseline level, n = 4 multiple unit
recordings in two subjects), significantly delayed compared to that recorded from the IO
muscle following identical vestibular stimulation (14.5 vs 10.2 ms, P = 0.002). The
subsequent peaks showed a similar delay, such that the entire IR response was offset from the
IO response by approximately 4-5 ms (Table 1). This delay by half a cycle caused the IR to
) at CAPES - Usage on May 7, 2012jp.physoc.orgDownloaded from J Physiol (

12
be active while the IO was not (and vice versa). Therefore the activity of the IO and IR
muscles was reciprocal.
Relationship to surface recordings
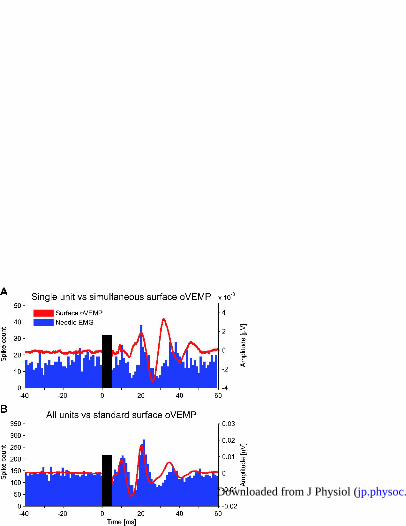
The surface response is compared to the motor unit response in Figure 4. An initial
negativity was recorded in the simultaneous surface oVEMPs in the majority of instances, i.e.
the n10 potential of the oVEMP. The surface recordings tended to resemble one another and
had similar n10 latencies in all conditions, probably due to the fact that the surface response
represents a combination of activity from both the IO and IR muscles during neutral gaze (n10
from IO vibration histograms 11.8 ± 1.9 ms, IO sound 11.5 ± 0.7 ms, IR vibration 12.0 ± 2.0
ms, P = 0.393). The pattern of repeated increases in discharge at intervals of ~10 ms was also
reflected in these surface recordings.
The simultaneously-recorded surface responses were small (Figure 4A) and there was
a small positive peak preceding the n10 in a small minority (4 of 28) of multiple unit
recordings. In contrast, large, well-formed oVEMPs were recorded in all subjects under the
conditions typically used for this test (during up-gaze and with electrodes close to the eyes)
(Figure 4B). This difference was due to the compromise necessary to record from needle and
surface electrodes simultaneously: namely restricted vertical gaze to reduce the number of
active motor units, and surface electrodes placed further away from the eye to allow space for
needle insertion. Despite this, the simultaneous surface recordings resembled the single unit
peri-stimulus histograms (Figure 4A). This relationship was, however, much clearer on
comparison of the oVEMP recorded under optimal conditions with the sum of all motor units
of the respective subject (Figure 4B), though the surface response tended to precede the motor
unit response.
) at CAPES - Usage on May 7, 2012jp.physoc.orgDownloaded from J Physiol (

13
DISCUSSION
We successfully recorded single unit extraocular muscle activity in response to
vestibular stimulation in alert human subjects. Stimulation of the vestibular otolith organs
with 4 ms bursts of vibration produced a series of excitability changes in the IO and IR
muscles. There was a highly reproducible initial increase in activity of the IO at 10.5 ms and
of the IR at 14.5 ms. The latency of this initial peak was consistent within each stimulus
condition, and the duration was very short, often just 1 ms, confirming that the extraocular
muscles exercise great precision in the control of vestibular-evoked eye movements.
Evidence of origin of the ocular vestibular evoked myogenic potential (oVEMP)
Our results provide strong evidence that the surface potential recorded in the clinical
oVEMP test is indeed produced by an excitation of the IO muscle. Although the nature of our
data does not allow us to distinguish between excitation and disinhibition, inhibition and
disfacilitation, for simplicity and consistency with other vestibular studies, we refer to the
peaks of activity as excitation and the troughs as inhibition. Our findings represent the
missing link in the chain of evidence for this test of otolith function. The striking burst of IO
motor unit firing at 10.5 ms following the vibration stimulus was reflected in the simultaneous
surface recordings that showed an initial negative peak, similar to the n10 peak typically
recorded in the clinical oVEMP. In addition, oVEMPs recorded under optimal conditions in
up-gaze closely matched the summated peri-stimulus histograms from the IO (Figure 4).
Previous studies of surface oVEMPs in several stimulation and gaze conditions had suggested
that the IO played an important role (Rosengren et al., 2005; Todd et al., 2008a; Welgampola
et al., 2009), however definitive evidence of the reflex polarity and muscle of origin could
only be provided by direct recordings from within the muscle. We also recorded excitation in
the IR muscle, however this consistently occurred some 4-5 ms later, indicating that the IR
muscle does not contribute to the initial, clinically-relevant n10 oVEMP peak. Although we
) at CAPES - Usage on May 7, 2012jp.physoc.orgDownloaded from J Physiol (

14
did not record from the horizontal rectus muscles, we expect that they would have also been
activated by our otolith stimulus, due to the involvement of the otoliths (in particular the
utricle) in responding to laterally-directed translational acceleration (Fernandez & Goldberg,
1976). Animal studies have shown strong projections from the utricle to these muscles
(Suzuki et al., 1969; Uchino et al., 1996). Experimental oVEMP studies have shown that
distinct responses can be recorded from surface electrodes placed over the lateral rectus
muscle when the muscle is activated by abduction (Todd et al., 2008a; Govender et al., 2011).
However, although we cannot rule out a contribution from these muscles, we propose that
they probably do not contribute significantly to the clinical oVEMP recorded from beneath
the eye as they are not activated with vertical gaze and their bellies lie further away from the
electrodes.
Our data provide new evidence for a short-latency, crossed projection to the IO muscle
following otolith stimulation in humans. Most of our recordings were made with vibration, as
it is a more powerful vestibular stimulus, however, it is a bilateral stimulus and cannot be
used to stimulate one ear in isolation. The recordings with sound were therefore important to
examine the laterality of the projections, although sound and vibration may not activate
identical populations of otolith afferents. We found that the motor unit response to sound
stimulation was similar to that following vibration, but was present only when the ear
contralateral to the muscle was stimulated. This confirms that the otolith projection
underlying the IO muscle response is crossed, and supports the data from surface recordings,
which showed a contralateral oVEMP projection (Chihara et al., 2007; Iwasaki et al., 2007).
The small surface responses seen with ipsilateral sound stimulation may therefore have an
alternate source, possibly the IR muscle. It is currently not clear which otolith afferents are
responsible for this crossed projection to the IO muscle. Recent evidence from human studies
has suggested that oVEMPs are mediated by fibres coursing in the superior nerve division of
the vestibular nerve (e.g. Iwasaki et al., 2009; Shin et al., 2012), which contains all utricular
) at CAPES - Usage on May 7, 2012jp.physoc.orgDownloaded from J Physiol (

15
and some saccular afferents. Saccular projections to the eyes are not well understood and
may be weaker than utriculo-ocular projections (Isu et al., 2000). Our data are consistent with
those of Suzuki et al. (1969), who demonstrated a contralateral excitatory projection from the
utricle to the IO muscle in cats, however contradictory data from Uchino et al. (1996) suggest
that this projection is predominantly ipsilateral. Our results are consistent with studies of
translational head movements in humans, which have recorded similar VOR latencies around
12-15 ms (Bronstein & Gresty, 1988; Crane et al., 2003), however human studies have also
provided conflicting data of otolith-ocular projections (Diamond & Markham, 1983; Lempert
et al., 1998). Further studies will be needed to elucidate the detailed projections from
different vestibular organs to individual eye muscles.
The latency of the surface response recorded during up-gaze appeared to slightly
precede the IO motor unit response, increasingly so for subsequent peaks. A similar
‘acceleration’ can also be seen in the later waves of surface responses recorded with different
vertical gaze angles (Govender et al., 2009). The mechanism underlying this effect is likely
to involve the normal pattern of muscle recruitment, whereby an increase in muscle tension
leads to recruitment of progressively larger muscle fibres with higher conduction velocity
(Henneman et al., 1965; Grantyn et al., 1977; Toft et al., 1989).
Implications for the vestibulo-ocular reflex
Our motor unit recordings demonstrate how individual eye muscles respond to an
impulsive vestibular stimulus. The method is analogous to animal studies that record from
neurons in the ocular motor nuclei, providing a window into the same neural circuit in
humans. In addition, it allows differentiation between the innervation patterns of individual
eye muscles, although we could not distinguish different types of muscle fibres (i.e. twitch
and nontwitch fibres) (Wasicky et al., 2004). We found reciprocal activity in the IO and IR
muscles, which are both controlled by the oculomotor nucleus and nerve (Figure 3), consistent
) at CAPES - Usage on May 7, 2012jp.physoc.orgDownloaded from J Physiol (

16
with Sherrington’s law of reciprocal innervation of antagonist muscles (Sherrington, 1906).
Although the IO and IR muscles are not classic antagonists, they produce opposing vertical
movements and can therefore be expected to show reciprocal activation during vertical eye
movements. Based on this law, one might have predicted an initial inhibition of the IR,
coinciding with the excitation of the IO, but we recorded only a delayed excitation of the IR,
coinciding with the first inhibition of the IO. As single motor unit responses recorded from
the neck muscles under similar experimental conditions begin with a clear inhibition of
muscle activity (Colebatch & Rothwell, 2004), our technique would have allowed us to see an
early inhibition if it were present. The basis of this 4-5 ms reflex delay in the IR compared to
the IO muscle is not known, but it illustrates the complexity of the otolith-ocular reflex. The
delay is greater than expected for a single additional synapse, suggesting that there is refined
processing within the translational VOR pathway to produce the appropriate combination of
muscle activity. In fact, these latencies are probably not absolute and may change with
different initial directions of skull vibration and consequent activation of different populations
of otolith afferents, even when the afferents originate from the same otolith organ. As
extraocular muscle activity and eye movements are intrinsically linked, any change in evoked
eye movement will result in a different pattern and timing of eye muscle activity. Latency
shifts have been reported in oVEMP surface recordings following a simple reversal in the
initial direction of skull vibration, with stimulus frequencies up to 500 Hz (Todd et al., 2008a;
Cai et al., 2011; Jombik et al., 2011). This suggests that the translational VOR is capable of
encoding the net direction of such stimulation and produces meaningful responses in the
appropriate extraocular muscles, even though vibration and sound are short-duration, high
frequency stimuli.
The extraocular motor unit response to impulsive otolith stimulation consisted of
multiple peaks of activity. In both the IO and IR muscles alternating peaks and troughs of
activity followed the initial excitation, at intervals of ~5 ms (i.e. a ~10 ms cycle). The
) at CAPES - Usage on May 7, 2012jp.physoc.orgDownloaded from J Physiol (

17
resonance in the IR recordings was identical to that in the IO, but was offset by half a cycle
(~5 ms), suggesting that the frequency is a general feature of the ocular motor system
following this type of stimulation. The same resonance of ~100 Hz has been noted in surface
oVEMP recordings and is independent of the frequency of the stimulus (Todd et al., 2008b;
Todd et al., 2009). The origin of this effect is unclear. Todd et al. (2009) suggested it was
due to a positive feedback loop involving afferents from the extraocular muscles. We
wondered whether these secondary peaks and troughs just reflected simple synchronisation of
the motor units (Türker & Powers, 2005). Yet this would presuppose a regular baseline firing
rate of 100 Hz, higher than the firing rate of most recorded units (e.g. Figure 1). Moreover,
surface recordings suggest that the resonance persists at this frequency with different angles
of gaze and is independent of the background motor unit firing rate (Govender et al., 2009).
Data from oVEMP studies in patients with unilateral vestibular loss suggest that the later
peaks may be recorded in the absence of the first peak and trough (Iwasaki et al., 2007).
Evidence from patients with bilateral vestibular loss indicates that the entire surface response
is vestibular-dependent, as all peaks disappear with complete vestibular loss (Iwasaki et al.,
2008), while the later peaks may receive bilateral input, as unilateral loss of vestibular
function often abolishes only the first surface peak in response to vibration (Iwasaki et al.,
2007). Studies using similar sound and vibration stimuli (delivered with smaller vibrators that
can be operated in magnetic fields for eye movement measurement with search coils) have
reported transient eye movements which appear to show some resonance as well, albeit at
slightly lower frequency (Todd et al., 2007; Welgampola et al., 2009; Aw et al., 2011).
Pulses of galvanic vestibular stimulation also produce a VOR response with very small, 100
Hz resonance of position (Aw et al., 2006). This suggests that, regardless of the mechanism,
the pattern of increasing and decreasing muscle activity has a measurable effect on the evoked
eye movements.
) at CAPES - Usage on May 7, 2012jp.physoc.orgDownloaded from J Physiol (

18
Conclusion
By recording EMG activity directly from the IO and IR muscles during vestibular
stimulation with vibration and sound, we were able to determine the myogenic basis of the
oVEMP, a new measure of otolith function, and identify the IO as the source for the clinically
relevant n10 potential. However, our use of oVEMP stimulation and recording techniques
also provided a unique opportunity to record single unit motor activity during vestibular
activation, as the extraocular muscles are significantly activated but the evoked eye
movements are very small. This allowed stable measurement of VOR-related extraocular
muscle activity in alert human subjects. Using this technique, we were able to demonstrate
the presence of short-latency, excitatory projections from the otoliths to the IO and IR
muscles in humans. Unilateral stimulation with sound confirmed that the projection to the IO
muscle is crossed. Our data therefore provide evidence for very short-latency VOR
projections from the otolith organs, similar to those evoked by the semicircular canals during
the rotational VOR. The data also showed that the IO and IR muscles, which are antagonists
for vertical eye movements, had reciprocal activation in response to our stimulus and that both
muscles responded with repeated bursts of activity. As the contribution of individual
extraocular muscles to eye movements cannot reliably be deduced from eye movement
recordings, studies of the single motor unit activity of extraocular muscles are important as
they provide a window into the underlying neural commands controlling eye movements in
humans.
) at CAPES - Usage on May 7, 2012jp.physoc.orgDownloaded from J Physiol (

19
REFERENCES
Aw ST, Aw GE, Todd MJ, Bradshaw AP & Halmagyi GM. (2011). Three-dimensional vibration-induced vestibulo-ocular reflex identifies vertical semicircular canal dehiscence. J Assoc Res Otolaryngol 12, 549-558.
Aw ST, Todd MJ & Halmagyi GM. (2006). Latency and initiation of the human vestibuloocular reflex to pulsed galvanic stimulation. J Neurophysiol 96, 925-930.
Breinin GM. (1962). The electrophysiology of extraocular muscle with special reference to electromyography. University of Toronto Press, Toronto.
Bronstein AM & Gresty MA. (1988). Short latency compensatory eye movement responses to transient linear head acceleration: a specific function of the otolith-ocular reflex. Exp Brain Res 71, 406-410.
Cai KY, Rosengren SM & Colebatch JG. (2011). Cervical and ocular vestibular evoked myogenic potentials are sensitive to stimulus phase. Audiol Neurootol 16, 277-288.
Carey J & Amin N. (2006). Evolutionary changes in the cochlea and labyrinth: Solving the problem of sound transmission to the balance organs of the inner ear. Anat Rec 288A, 482-489.
Chihara Y, Iwasaki S, Ushio M, Fujimoto C, Kashio A, Kondo K, Ito K, Asakage T, Yamasoba T, Kaga K & Murofushi T. (2009). Ocular vestibular-evoked myogenic potentials (oVEMPs) require extraocular muscles but not facial or cochlear nerve activity. Clin Neurophysiol 120, 581-587.
Chihara Y, Iwasaki S, Ushio M & Murofushi T. (2007). Vestibular-evoked extraocular potentials by air-conducted sound: another clinical test for vestibular function. Clin Neurophysiol 118, 2745-2751.
Cohen B & Suzuki J-I. (1963). Eye movements induced by ampullary nerve stimulation. Am J Physiol 204, 347-351.
Colebatch JG, Halmagyi GM & Skuse NF. (1994). Myogenic potentials generated by a click-evoked vestibulocollic reflex. J Neurol Neurosurg Psychiatry 57, 190-197.
) at CAPES - Usage on May 7, 2012jp.physoc.orgDownloaded from J Physiol (

20
Colebatch JG & Rothwell JC. (2004). Motor unit excitability changes mediating vestibulocollic reflexes in the sternocleidomastoid muscle. Clin Neurophysiol 115, 2567-2573.
Crane BT, Tian J, Wiest G & Demer JL. (2003). Initiation of the human heave linear vestibulo-ocular reflex. Exp Brain Res 148, 247-255.
Curthoys IS, Kim J, McPhedran SK & Camp AJ. (2006). Bone conducted vibration selectively activates irregular primary otolithic vestibular neurons in the guinea pig. Exp Brain Res 175, 256-267.
Diamond SG & Markham CH. (1983). Ocular counterrolling as an indicator of vestibular otolith function. Neurology 33, 1460-1469.
Fernandez C & Goldberg JM. (1976). Physiology of peripheral neurons innervating otolith organs of the squirrel monkey. I. Response to static tilts and to long-duration centrifugal force. J Neurophysiol 39, 970-984.
Govender S, Rosengren SM & Colebatch JG. (2009). The effect of gaze direction on the ocular vestibular evoked myogenic potential produced by air-conducted sound. Clin Neurophysiol 120, 1386-1391.
Govender S, Rosengren SM, Todd NP & Colebatch JG. (2011). Ocular vestibular evoked myogenic potentials produced by impulsive lateral acceleration in unilateral vestibular dysfunction. Clin Neurophysiol 122, 2498-2504.
Grantyn R, Grantyn A & Schaaf P. (1977). Conduction velocity, input resistance and size of cat ocular motoneurons stained with Procion yellow. Brain Res 135, 167-173.
Henneman E, Somjen G & Carpenter DO. (1965). Excitability and inhibitability of motoneurons of different sizes. J Neurophysiol 28, 599-620.
Isu N, Graf W, Sato H, Kushiro K, Zakir M, Imagawa M & Uchino Y. (2000). Sacculo-ocular reflex connectivity in cats. Exp Brain Res 131, 262-268.
Iwasaki S, Chihara Y, Smulders YE, Burgess AM, Halmagyi GM, Curthoys IS & Murofushi T. (2009). The role of the superior vestibular nerve in generating ocular vestibular-
) at CAPES - Usage on May 7, 2012jp.physoc.orgDownloaded from J Physiol (
21
evoked myogenic potentials to bone conducted vibration at Fz. Clin Neurophysiol 120, 588-593.
Iwasaki S, McGarvie LA, Halmagyi GM, Burgess AM, Kim J, Colebatch JG & Curthoys IS. (2007). Head taps evoke a crossed vestibulo-ocular reflex. Neurology 68, 1227-1229.
Iwasaki S, Smulders YE, Burgess AM, McGarvie LA, MacDougall HG, Halmagyi GM & Curthoys IS. (2008). Ocular vestibular evoked myogenic potentials to bone conducted vibration of the midline forehead at Fz in healthy subjects. Clin Neurophysiol 119, 2135-2147.
Jombik P, Spodniak P & Bahyl V. (2011). Direction-dependent excitatory and inhibitory ocular vestibular-evoked myogenic potentials (oVEMPs) produced by oppositely directed accelerations along the midsagittal axis of the head. Exp Brain Res 211, 251-263.
Lempert T, Gianna C, Brookes G, Bronstein A & Gresty M. (1998). Horizontal otolith-ocular responses in humans after unilateral vestibular deafferentation. Exp Brain Res 118, 533-540.
Lorente de Nó R. (1934). Observations on nystagmus. Acta Otolaryngol 21, 416-437.
Magora A, Gonen B, Zelig S, Sachs U & Zauberma.H. (1973). Electromyographic investigation of extraocular muscles in vestibular nystagmus evoked by caloric stimulation. Ophthalmic Res 4, 91-98.
Murofushi T & Curthoys IS. (1997). Physiological and anatomical study of click-sensitive primary vestibular afferents in the guinea pig. Acta Otolaryngol 117, 66-72.
Quiroga RQ, Nadasdy Z & Ben-Shaul Y. (2004). Unsupervised spike detection and sorting with wavelets and superparamagnetic clustering. Neural Comput 16, 1661-1687.
Rosengren SM, Todd NP & Colebatch JG. (2005). Vestibular-evoked extraocular potentials produced by stimulation with bone-conducted sound. Clin Neurophysiol 116, 1938-1948.
Rosengren SM, Welgampola MS & Colebatch JG. (2010). Vestibular evoked myogenic potentials: past, present and future. Clin Neurophysiol 121, 636-651.
) at CAPES - Usage on May 7, 2012jp.physoc.orgDownloaded from J Physiol (

22
Sherrington CS. (1906). The integrative action of the nervous system. Yale University Press, New Haven, USA.
Shin BS, Oh SY, Kim JS, Kim TW, Seo MW, Lee H & Park YA. (2012). Cervical and ocular vestibular-evoked myogenic potentials in acute vestibular neuritis. Clin Neurophysiol 123, 369-375.
Suzuki JI, Tokumasu K & Goto K. (1969). Eye movements from single utricular nerve stimulation in the cat. Acta Otolaryngol 68, 350-362.
Szentágothai J. (1950). The elementary vestibulo-ocular reflex arc. J Neurophysiol 13, 395-407.
Todd NP, Rosengren SM, Aw ST & Colebatch JG. (2007). Ocular vestibular evoked myogenic potentials (OVEMPs) produced by air- and bone-conducted sound. Clin Neurophysiol 118, 381-390.
Todd NP, Rosengren SM & Colebatch JG. (2008a). Ocular vestibular evoked myogenic potentials (OVEMPs) produced by impulsive transmastoid accelerations. Clin Neurophysiol 119, 1638-1651.
Todd NP, Rosengren SM & Colebatch JG. (2008b). Tuning and sensitivity of the human vestibular system to low-frequency vibration. Neurosci Lett 444, 36-41.
Todd NP, Rosengren SM, Govender S & Colebatch JG. (2009). Low-frequency tuning in the human vestibular-ocular projection is determined by both peripheral and central mechanisms. Neurosci Lett 458, 43-47.
Toft E, Sinkjaer T & Andreassen S. (1989). Mechanical and electromyographic responses to stretch of the human anterior tibial muscle at different levels of contraction. Exp Brain Res 74, 213-219.
Türker KS & Powers RK. (2005). Black box revisited: a technique for estimating postsynaptic potentials in neurons. Trends Neurosci 28, 379-386.
) at CAPES - Usage on May 7, 2012jp.physoc.orgDownloaded from J Physiol (

23
Uchino Y, Sasaki M, Sato H, Imagawa M, Suwa H & Isu N. (1996). Utriculoocular reflex arc of the cat. J Neurophysiol 76, 1896-1903.
Wasicky R, Horn AK & Buttner-Ennever JA. (2004). Twitch and nontwitch motoneuron subgroups in the oculomotor nucleus of monkeys receive different afferent projections. J Comp Neurol 479, 117-129.
Welgampola MS, Migliaccio AA, Myrie OA, Minor LB & Carey JP. (2009). The human sound-evoked vestibulo-ocular reflex and its electromyographic correlate. Clin Neurophysiol 120, 158-166.
) at CAPES - Usage on May 7, 2012jp.physoc.orgDownloaded from J Physiol (

24
AUTHOR CONTRIBUTIONS
K.P.W. and S.M.R. both equally designed the study, analysed the data and wrote the
manuscript. R.M. and V.S. contributed to the recordings and review of the manuscript. D.S.
contributed to the study conception, recordings and the manuscript. K.L. performed the needle
recordings and contributed to the manuscript. All authors approved the final version of the
manuscript. The research was conducted at the University Hospital Zurich, Switzerland.
ACKNOWLEDGEMENTS
We would like to thank J.G. Colebatch for his help in developing the single unit recording
technique and for kindly providing some of the recording software and equipment.
Additional equipment was funded by the Neuro-Otology Society of Australia. We are
grateful to R. Quian Quiroga for providing open access to the code of his spike detection and
sorting algorithm. We would like to thank B.J. Hess and C.J. Bockisch for providing helpful
comments on the manuscript. The study was supported by the Swiss National Science
Foundation, the Betty and David Koetser Foundation for Brain Research and the Zurich
Center for Integrative Human Physiology (University of Zurich). S. M. Rosengren was
supported by the National Health and Medical Research Council of Australia. The authors
declare no conflict of interest.
) at CAPES - Usage on May 7, 2012jp.physoc.orgDownloaded from J Physiol (

25
Table 1. Latencies and amplitudes of the first three peaks of extraocular motor unit activity
from multiple unit histograms.
Excitation 1 Inhibition 1 Excitation 2
Latencya Amplitudeb Latency Amplitude Latency Amplitude
Inferior oblique muscle
Vibration Mean 10.2 2.8 15.5 0.5 21.3 1.5
SD 1.4 1.3 2.3 0.2 1.9 0.4
n 13 13 13 13 13 13
Sound Mean 13.1 1.5 19.2 0.7 27.4 1.3
SD 0.5 0.4 1.8 0.1 2.4 0.1
n 11 11 11 11 11 11
Inferior rectus muscle
Vibration Mean 14.5 3.5 20.5 0.4 27.8 1.4
SD 0.0 1.3 3.2 0.3 1.0 0.2
n 4 4 4 4 4 4
aLatency units are milliseconds. bAmplitude units are a ratio of the spike count at the response
peak compared to the mean spike count over the baseline period.
) at CAPES - Usage on May 7, 2012jp.physoc.orgDownloaded from J Physiol (

26
FIGURES
-40 -20 0 20 40 60
115
116
117
118
119
120
121
122
123
124
Tria
ls
Time [ms]
Needle EMG
-20 0 20 40 600
100
200
300
400
500
600
700
800
900
1000
Time [ms]
Raster plot
-1 -0.5 0 0.5 1-1
-0.5
0
0.5
1
Am
plitu
de[µ
V]
Unit 1
-1 -0.5 0 0.5 1-1
-0.5
0
0.5
1
Am
plitu
de[µ
V]
Time [ms]
Unit 2
-40 -20 0 20 40 600
10
20
30
40
50
Spi
keco
unt
Unit 1
-40 -20 0 20 40 600
10
20
30
40
50
Spi
keco
unt
Unit 2
Time [ms]
A
B
C
D
E
F
-40
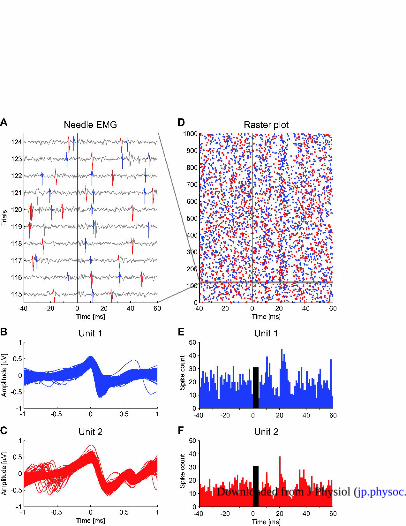
Figure 1: Single motor unit recording of the inferior oblique muscle in response to bone-
conducted vibration.
A, Needle EMG recording of 10 consecutive trials out of 1000 stimuli with 4 ms bursts of 500
Hz vibration, showing two distinct motor units (blue and red). The black vertical line
indicates stimulus onset. B, C, The two distinct single motor units (blue: 2107 spikes, red:
) at CAPES - Usage on May 7, 2012jp.physoc.orgDownloaded from J Physiol (

27
1597 spikes) were aligned to the peaks and identified with a sorting algorithm using wavelets
and super-paramagnetic clustering (Quiroga et al., 2004). D, Raster plot of the two single
motor units over all 1000 stimuli. Spikes from the two units are randomly distributed over the
pre-stimulus interval (-40 to 0 ms). After the stimulus (0 to 60 ms) two bands of increased
activity emerge at about 11 and 21-22 ms, with bands of decreased activity in between. The
horizontal grey band represents the ten consecutive trials illustrated in A. E, F, Peri-stimulus
histograms of the firing pattern of the two units derived from the data in the raster plot D
illustrate increased discharge at 11 and 22 ms for the blue unit and 11 and 21 ms for the red
unit with periods of decreased discharge in between. The black bars indicate the duration of
the stimulus.
) at CAPES - Usage on May 7, 2012jp.physoc.orgDownloaded from J Physiol (

28
-40 -20 0 20 40 600
5
10
15
20
25Single unit
Spi
keco
unt
-40 -20 0 20 40 600
50
100
150
200Multiple unit
Spi
keco
unt
-40 -20 0 20 40 600
50
100
150
200
250
300
350All units
Time [ms]
Spi
keco
unt
-40 -20 0 20 40 600
5
10
15
20Single unit
-40 -20 0 20 40 600
50
100
150
200Multiple unit
-40 -20 0 20 40 600
500
1000
1500All units
Time [ms]
dnuoSnoitarbiVA
B
C
D
E
F
Figure 2: Peri-stimulus histograms of single, multiple and summated motor units in response
to vibration and sound.
A, The single unit histogram shows the response of one distinct unit to 4 ms bursts of 500 Hz
vibration. A sharp peak in discharge is seen at 11 and 22 ms with complete suppression in
between. B, The multiple unit histogram shows the behaviour of several indistinguishable
) at CAPES - Usage on May 7, 2012jp.physoc.orgDownloaded from J Physiol (

29
units recorded simultaneously. The same pattern of increased and decreased discharge as
above is seen, but with broader peaks. C, Summation of the spikes from all units recorded in
the same subject confirms the pattern. D, The single unit recording in response to 4 ms tone
bursts of 500 Hz sound in the contralateral ear shows a similar pattern of increased and
decreased discharge with slightly longer latencies. E, The pattern is replicated in multiple
unit histograms and F, the summated histogram of spikes from all recorded units. The black
bars indicate the duration of the stimulus.
) at CAPES - Usage on May 7, 2012jp.physoc.orgDownloaded from J Physiol (

30
-40 -20 0 20 40 600
1
2
3
4Inferior rectus vs inferior oblique muscle
Time [ms]
Spi
keco
unt[
norm
aliz
ed] Inferior oblique
Inferior rectus
Figure 3: Comparison of inferior rectus and inferior oblique eye muscle response to
vibration.
Multiple unit histograms from the two muscles in the same subject show similar discharge
patterns in response to the identical stimulus (black bar), but with a delay of half a cycle (~5
ms) in the IR muscle. The spike count was normalized for comparison of the two units.
) at CAPES - Usage on May 7, 2012jp.physoc.orgDownloaded from J Physiol (

31
-40 -20 0 20 40 600
10
20
30
40
50S
pike
coun
tSingle unit vs simultaneous surface oVEMP
Surface oVEMPNeedle EMG
-4
-2
0
2
4
x 10-3
Am
plitu
de[µ
V]
-40 -20 0 20 40 600
50
100
150
200
250
300
350All units vs standard surface oVEMP
Spi
keco
unt
Time [ms]
-0.02
-0.01
0
0.01
0.02
0.03
Am
plitu
de[µ
V]
A
B
Figure 4: Relationship of needle EMG recordings to surface oVEMP recordings.
A, Single unit histogram in response to vibration (blue bars) overlaid with simultaneous
surface oVEMP recording (red trace). Both data sets show peaks of increased activity at
about 10-11 and 21 ms with periods of suppression in between. B, The sum of spikes from all
units recorded in the same subject (same histogram as in figure 2C) matches closely the
surface oVEMP recorded under standard conditions in up-gaze.
Supplementary video: Experimental procedure.
) at CAPES - Usage on May 7, 2012jp.physoc.orgDownloaded from J Physiol (