
The role of KRT5+ progenitors in chronic otitis media - UCL ...
Neuron, Vol. 38, 161–175, April 24, 2003, Copyright 2003 by Cell Press
NeurotechniqueSingle-Cell TranscriptionalAnalysis of Neuronal Progenitors
transcriptional regulators has led to significant insightsinto the transcriptional control of neurogenesis in higherorganisms (Bertrand et al., 2002; Tanabe and Jessell,
Ian Tietjen,1,4 Jason M. Rihel,1,4 Yanxiang Cao,2,4
Georgy Koentges,1,3 Lisa Zakhary,1
and Catherine Dulac1,*1Howard Hughes Medical Institute 1996). However, these “vertical” approaches can only
attempt to reconstruct in vertebrates the regulatory hier-Department of Molecular and Cellular BiologyHarvard University archies that have already been discovered in other spe-
cies. In turn, parallel approaches of expression profiling,Cambridge, Massachusetts 021382 Department of Applied Research as afforded by microarray analysis, have provided new
guiding principles to illuminate the fine structure of regu-Affymetrix Inc.3380 Central Expressway latory networks (Panda et al., 2002). However, the ex-
traordinary cellular and molecular complexity of theSanta Clara, California 950513 Functional Genomics mammalian nervous system has considerably limited
the scope of present microarray approaches (Cao andWolfson Institute of Biomedical ResearchUniversity College London Dulac, 2001), as highly specific transcripts within rare
precursor populations are rendered undetectable by ho-The Cruciform BuildingGower Street mogenizing whole brain areas for RNA isolation.
We have developed an experimental protocol in whichLondon WC1E 6AUUnited Kingdom single-cell cDNA synthesis (Dulac and Axel, 1995; Ta-
nabe et al., 1998; Yamagata et al., 2002) is combinedwith Gene chip analysis and laser capture-mediated cellisolation. To test the accuracy and reliability of this pro-Summarycedure, we have focused our analysis on the mammalianolfactory system, which includes the highly heteroge-The extraordinary cellular heterogeneity of the mam-
malian nervous system has largely hindered the mo- neous population of olfactory sensory neurons (OSN) inthe main olfactory epithelium (MOE) and the progenitorslecular analysis of neuronal identity and diversity. In
order to uncover mechanisms involved in neuronal of OSN target cells, the mitral cells of the olfactory bulb.Mature OSNs each express a unique olfactory receptordifferentiation and diversification, we have monitored
the expression profiles of individual neurons and pro- gene from a large family of a thousand genes. The MOEis partitioned into four broad zones of receptor expres-genitor cells collected from dissociated tissue or cap-
tured from intact slices. We demonstrate that this sion such that, within each zone, neurons expressingdistinct receptors are randomly interspersed (Buck,technique provides a sensitive and reproducible repre-
sentation of the single-cell transcriptome. In the olfac- 2000). Despite advances on the essential role played bybasic helix-loop-helix (bHLH) containing transcriptiontory system, hundreds of transcriptional differences
were identified between olfactory progenitors and ma- factors Mash1, Ngn1, and NeuroD in ensuring olfactorydifferentiation (Cau et al., 1997, 2002; Guillemot et al.,ture sensory neurons, enabling us to define the large
variety of signaling pathways expressed by individual 1993), the identity of transcriptional regulators involvedin further sensory diversity, including the choice of aprogenitors at a precise developmental stage. Finally,
we show that regional differences in gene expression given olfactory receptor or the formation of the MOEzones, has remained largely elusive, primarily becausecan be predicted from transcriptional analysis of sin-
gle neuronal precursors isolated by laser capture from progenitor cells represent such a rare and diverse popu-lation.defined areas of the developing brain.
We show here that a genome-wide transcriptionalanalysis can be performed successfully at the single-Introductioncell level, whether the cells are isolated from dissociatedtissue or laser captured from intact brain slices. TheIn the highly complex mammalian brain, thousands of
different classes of neurons can be distinguished based unprecedented sensitivity and cellular resolution ofthese large-scale, single-cell molecular fingerprintson morphological, physiological, and molecular criteria.
Developmental neuroscience must tackle the formida- have led us to uncover multiple regulatory pathwaysunderlying olfactory neuronal diversity.ble challenge of uncovering the numerous and intricate
cascades of signaling events and regulatory networksunderlying the establishment of neuronal diversity and Resultsspecificity. Genetic approaches in invertebrates havesuccessfully identified discrete classes of genes involved General Strategyin the emergence of specific neuronal cell types (Sagasti Olfactory neurogenesis was analyzed at the single-cellet al., 1999; Wolff et al., 1997). In turn, the identification level by comparing the transcriptional profiles of matureof vertebrate homologs of Drosophila and C. elegans olfactory sensory neurons (OSNs) and olfactory progeni-
tor cells (OPCs) (Figure 1). OPCs are actively dividingneuroepithelial cells committed to the olfactory lineage,*Correspondence: [email protected]
4 These authors contributed equally to this work. which ultimately give rise to fully mature OSNs (Murray

Neuron162
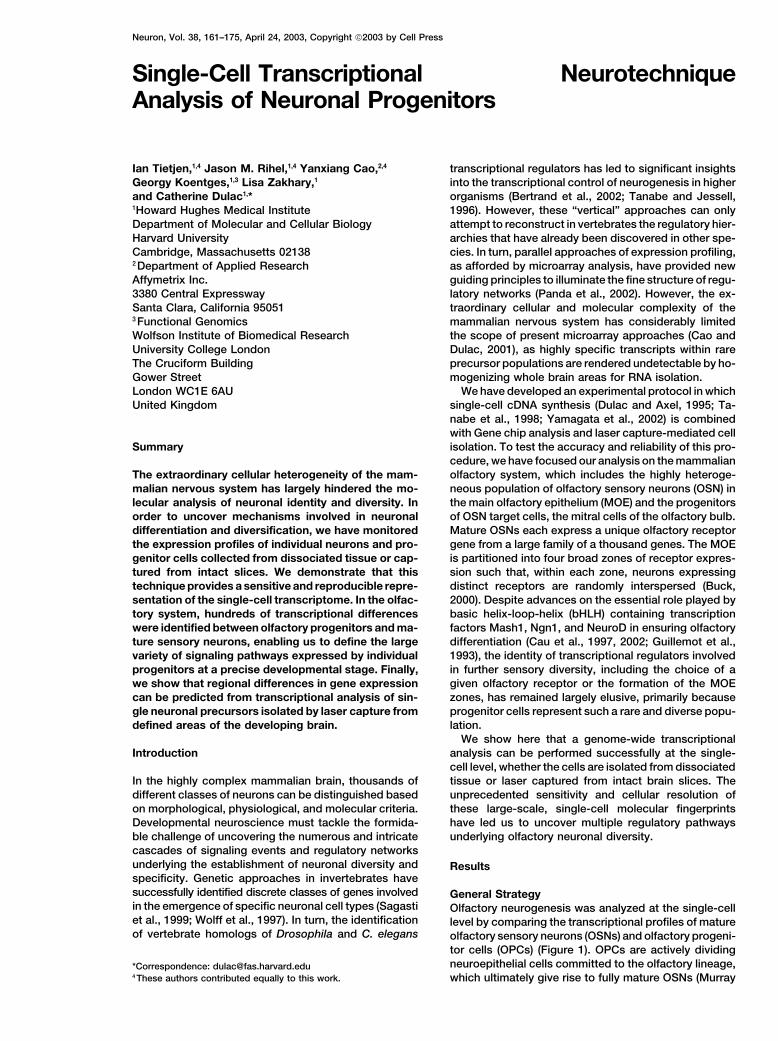
Figure 1. Monitoring Transcription in Single Olfactory Neurons and Precursors
The main olfactory epithelium (MOE) of mammals continuously regenerates OSNs and comprises neuronal precursors at various stages ofdevelopment (cells with different shapes and colors). Individual OSNs or OPCs were picked at random from dissociated MOEs and seededinto individual PCR tubes before undergoing cell lysis, first-strand cDNA synthesis, and PCR amplification. The identity and the developmentalstage of each cell were retrospectively determined by PCR Southern blot analysis of single-cell cDNAs to identify presence of developmental-and olfactory-specific markers. cDNA samples representing OSNs or OPCs of interest were then hybridized to Affymetrix Mu11K GeneChipprobe arrays. MOB, main olfactory bulb.
and Calof, 1999). The respective ratios of these three (ADV) and the “Present/Absent” absolute call algorithm(Lockhart et al., 1996; see Supplemental Data set S1 atcell types change as the animal develops, such that
OPCs are abundant in the embryonic epithelium but are http://www.neuron.org/cgi/content/full/38/2/161/DC1).very rare in the adult. This prompted us to harvest OSNsand OPCs from adult and embryonic day 15 (E15) MOE, General Characteristics of the Single-Cell Profiles
The hybridization of amplified single-cell cDNAs to mi-respectively, to increase the probability of successfullyisolating multiple representatives of each cell type. croarrays is an entirely unvalidated method; therefore,
prior to any analysis of biological significance of theIndividual cells were picked at random under the mi-croscope from dissociated MOEs and seeded into lysis single-cell profiles, we investigated their general charac-
teristics, including the reproducibility, complexity, andbuffer-containing PCR tubes as previously described(Dulac and Axel, 1995; see Experimental Procedures). fidelity of the data obtained.
Reproducibility of Microarray HybridizationSubsequent reverse transcription and PCR amplificationof the whole-cell transcriptome typically generated 10 Duplicate hybridizations of the same OSN cDNA to dis-
tinct batches of microarrays yielded nearly identical pro-to 20 �g of single-cell cDNA. The cell type representedby each single-cell cDNA was identified retroactively by files with an average correlation coefficient of 0.97 (Fig-
ure 2A, left; Table 1). In contrast, comparison of theSouthern blot analysis and PCR amplification aimed atdetecting various markers (Figure 1 and see Experimen- transcriptional profiles of two individual OSNs revealed
larger variation with a lower correlation coefficient (Fig-tal Procedures). OSNs were characterized by the robustexpression of olfactory marker protein (OMP) and olfac- ure 2A, second from left; Table 1), presumably reflecting
biologically significant differences in gene expression.tory receptor (OR) together with the lack of Mash1. Inturn, OPCs were identified by the robust expression of Representation of Transcriptome Complexity
Is the complexity of the single-cell cDNA sufficient toMash1, by the cell division markers cdc2 (Riabowol etal., 1989) and Ki67 (Scholzen and Gerdes, 2000), and by provide useful transcriptional information profiles? Ap-
proximately 20%–25% of the total number of probe setsthe absence of OMP and OR.A stringent selection was performed to eliminate sin- in OSNs and OPCs predicted a “Present” signal by the
Affymetrix GeneChip analysis software algorithmsgle-cell cDNAs failing to display robust expression ofubiquitous transcripts such as �-tubulin and GAPDH as (2657 � 347 and 3158 � 1046 probe sets, respectively).
Although these numbers are somewhat lower than thosewell as cell type-specific markers. In total, cDNAs from9/45 adult and 7/45 E15 MOE cells were kept for further obtained from whole tissue such as heart, liver, and
MOE (3248, 4437, and 3612, respectively), these valuesanalysis. To obtain sufficient amounts of cDNA for mi-croarray hybridization from each sample, an additional are comparable, suggesting that a large number of
genes are detected in amplified single-cell cDNAround of PCR amplification was performed (see Experi-mental Procedures). Samples were then rechecked for samples.
Is the distribution of rare to abundant genes compara-the robust expression of all appropriate markers bySouthern blot and PCR amplification. Ten micrograms ble in single-cell cDNA and whole-tissue RNA? On aver-
age, approximately 38.4% of all Present probe sets perof each single-cell cDNA sample was then labeled andhybridized to Affymetrix Mu11K high-density oligonucle- OSN sample detected transcripts at a very low abun-
dance level, as defined by a mean ADV (mADV) of 250otide arrays containing 13027 probe sets (see Experi-mental Procedures). Using the Affymetrix GeneChip or lower (Figure 2B). In contrast, 6.1% of all Present
probe sets per OSN detected transcripts with ananalysis software, the expression level of each probeset was quantified by both the average difference value mADV �10,000, suggesting that few transcripts were

Transcriptional Profile of Single Cells163
Figure 2. Accuracy of Transcript Amplification in Single-Cell cDNA Samples
(A) Reproducibility of the single-cell cDNA profiles. Scatter plots of data obtained from two repeat hybridizations of the same olfactory neuroncDNA (OSN7, left), from hybridization of cDNAs from two olfactory neurons (OSN3 and OSN9, second from left), from two single HGCs (HGC4and HGC8, second from right), and from two samples of ten HGCs (HGC12 and HGC15, right). Each data point represents an individual probeset whose hybridization intensity is described by the ADV. As seen on the left panel, the duplicate hybridization to microarrays is highlyreproducible (correlation coefficient � 0.97), and “identical” cells (single HGC correlation coefficient � 0.85) or groups of “identical” cells (tenHGC correlation coefficient � 0.90) provide similar profiles. In contrast, cDNA samples from different OSNs have considerably more variability(correlation coefficient � 0.68). Red curves denote the equation describing the 95% confidence interval in (D). The large majority of datapoints in all examples lies between the two red curves and denote transcripts with lower variability. However, a subset of data points predictsdifferentially expressed transcripts in one of two OSNs.(B) Distribution of transcripts according to expression level. For each cell or tissue type, data points represent the cumulative percentage ofprobe sets predicted to be “Present” at a given mean average difference value (mADV) or lower (mean � SEM). Comparison of data obtainedfrom single olfactory sensory neurons (1 OSNs), single human glioblastoma cells (1 HGCs), unamplified heart, liver, and MOE RNA indicatesthat the single-cell cDNA amplification does not dramatically distort the overall distribution of rare (ADV �102), moderate (ADV � 102 to 104),and high (ADV � 104) abundant transcripts.(C) Detection of transcripts at known copy number in single cells. Control bacterial poly(A)-tailed RNAs of known concentrations were “spiked”into the single-cell lysis buffer. Individual cells were seeded into the spiked lysis buffer, followed by cDNA synthesis and amplification. A totalof four RNA spikes (dots of different colors), corresponding to roughly 1, 2, 10, and 100 RNA copies per cell, were spiked into four singleOSN samples (dots of different shapes). Each data point represents duplicate microarray hybridizations (mean � SEM). Spike transcriptsadded at �100 copies/cell were detected in four of four experiments with a mADV of 19,959 � 4,652, while spikes added at �10 copies/cellwere consistently detected with a mADV of 1,367 � 451. Thus, the mADV of spikes at these concentrations appears proportional to theestimated spike copy number in the original single cell. Moreover, spiked transcripts originally present at �1 and �2 copies per cell wereeach amplified and detected by the array in two of four experiments, with a mADV in these experiments of 189 � 54 and 525 � 145, respectively.(D) Variability in gene expression as a function of mADV. The average variability in gene expression (log fold change) was scored for allpairwise combinations of single HGCs as a function of the mADV (see Experimental Procedures). The regression curve that best fits the dataat a mADV � 250 approximates the level of variability that can be expected at a given mADV (black curve). A curve representing the 95%confidence interval is then determined (red curve). When comparing two cell samples or groups of cell samples, a probe set with a log foldchange greater than that defined by the 95% confidence interval equation may be considered to have significant variability in expression.
detected at high abundance. Comparison with data ob- were successfully detected by the microarrays includ-ing, but not limited to, constitutive neuronal and OSN-tained with unamplified tissue samples (Figure 2B) sug-
gests that the relative proportion of transcripts ex- specific markers (see Supplemental Table S1 and Dataset S1 at http://www.neuron.org/cgi/content/full/38/2/pressed at low, moderate, and high levels has not been
significantly altered in the single-cell cDNA synthesis 161/DC1). In addition, the single-cell profiles for a largenumber of transcripts including the diagnostic probesand amplification.
Hybridization Efficiency of Single-Cell cDNA described above, OCAM, RGS11, and five expressedsequence tags of unknown function, were verified inde-Single-cell cDNA represents only the 3�-most 600 bp of
mRNA transcripts. Is the short single-cell cDNA template pendently by Southern blot. Microarray probe sets andSouthern blot analyses of these markers in single-cellhybridizing efficiently to microarray probe sets? Numer-
ous transcripts expected to be present in OSNs or OPCs cDNA samples were consistently in agreement (76 of 89

Neuron164
Table 1. Statistical Analysis of Single-Cell Transcriptional Profiles
Cell Type Pairwise Corr. Coeff. (Mean � SD)
OSN (repeat) n � 4 0.97 � 0.01Single HGC n � 6 0.86 � 0.03Groups of 10 HGCs n � 5 0.92 � 0.0410 pg dilution n � 6 0.84 � 0.03100 pg dilution n � 7 0.95 � 0.02OSNs n � 9 0.68 � 0.05OPCs n � 7 0.71 � 0.05OSNs versus OPCs 0.57 � 0.04MOBCs n � 5 0.58 � 0.02AOBCs n � 5 0.60 � 0.02MOBCs versus AOBCs 0.54 � 0.03MOE 1 versus 2 n � 2 0.88MOE versus heart 0.42
Pairwise correlation coefficients of gene expression levels (mean � standard deviation) are shown for various cell and tissue samples, asmeasured by the Average Difference Value (ADV) for each microarray probe set.
trials, 85.4%, not shown). Disagreements usually re- tions could result from either the stochastic absence ofthese spikes in two of four experiments, or from thesulted from the 5� localization of probe sets that couldlower limits of detection. In either case, these data illus-not accommodate the 3� biased single-cell cDNA. Thistrate the ability of the single-cell cDNA synthesis andwas the case for OMP which, although strongly detectedamplification procedure to conserve the respective ra-by Southern blot, was rarely detected by microarraytios of transcripts between the original single-cell RNAbecause the OMP probe sets are located 2 kb upstreamand the amplified single-cell cDNA. Moreover, they illus-of the transcript 3� end (probe set information is availabletrate the ability to consistently amplify and detect lowat http://www.netaffx.com). We also noted that Mash1to extremely low levels of transcription in the single-cellconsistently failed to appear on microarray data ob-profiles.tained from Mash1-positive samples, including single-Genome-Wide Transcriptional Similaritycell cDNAs (our data) and a variety of embryonic neuralamong Identical Cellstissues (not shown), suggesting an unidentified problemA transcriptome-wide measure for the accuracy of thewith this particular probe set. Thus, it appears from oursingle-cell cDNA synthesis was performed by compar-initial set of controls that single-cell cDNA templatesing the entire profile of individual cells and groups ofcontain complex transcriptional information that can becells obtained from a homogeneous population. A T98Gsuccessfully and reproducibly analyzed by hybridizationhuman glioblastoma cell line (HGC) was synchronizedto microarrays.at Go-phase by serum starvation. Individual cells (HGC1to 10) and suspensions of �10 cells (HGC11 to 15) were
Proportionality and Reproducibility isolated, and amplified cDNAs were hybridized to Affy-of cDNA Amplification metrix HuGeneFL microarrays containing 7070 probeA critical issue for the validity of our experimental strat- sets (see Experimental Procedures and Supplementalegy is to determine whether the respective ratios of Data set S5 at http://www.neuron.org/cgi/content/full/transcripts in the amplified single-cell cDNA represent 38/2/161/DC1). The relative number and distribution ofthe original single-cell transcriptome. Although the na- probe sets predicted to be Present were comparableture of the original single-cell RNA is inaccessible, we to those of olfactory samples (Figure 2B and data notreasoned that the degree of confidence in our procedure shown). Strikingly, correlation coefficients of gene ex-could be directly evaluated by the reproducibility of data pression in pairwise comparison of profiles of singleobtained from multiple samples containing low (i.e., cel- HGCs and of groups of 10 HGCs, with an average oflular) amounts of identical starting material. 0.86 � 0.03 and 0.92 � 0.04, respectively (Figure 2A,“Spiking” Experiments right and second from right; Table 1), equaled those ofTo provide a first measure of the accuracy of single-cell whole MOE profiles and approached those obtained byPCR amplification, we spiked four distinct poly(A)-tailed duplicate hybridization of the same single-cell cDNA tobacterial RNAs, each diluted to a known concentration, distinct microarrays, demonstrating that “identical” cellsinto the lysis buffer of each tube (see Experimental Pro- indeed generate similar transcriptional profiles. Addi-cedures). A single cell was then added, and the regular tionally, correlation coefficients of gene expression ob-cDNA synthesis and amplification procedure was per- tained by pairwise comparison of 10 HGCs were similarformed. The experiment was performed four times. Sub- to that of 1 HGCs (Figure 2A, Table 1), suggesting thatsequent analysis of control probe sets specific for the a 10-fold increase in the amount of starting material does3� region of each bacterial spike indicated that the ADVs not significantly increase the quality of the procedure.were roughly proportional to the estimated copy number Amplification from RNA versus Single-Cell Sourcesof each spike mRNA (Figure 2C). Moreover, bacterial To test further the fidelity of single-cell PCR amplifica-spikes at concentrations as low as �1 and �2 copies tion, total RNA was prepared from the human glioblas-per cell were detected in two out of four experiments. toma cell culture, and cDNA synthesis and amplification
was performed from dilutions containing 10 pg and 100The variable detection of bacterial spikes at these dilu-

Transcriptional Profile of Single Cells165
pg total RNA. These dilutions correspond to the range preferentially expressed in OSNs, and 249 probe setsrepresenting 197 individual genes were predicted to beof total RNA hypothesized to exist in single mammalianenriched in OPCs. A complete list of transcripts iscells. Hybridization of cDNA derived from 10 pg totalprovided in Supplemental Table S1 and Data set S2 atRNA (�0.3–0.5 pg mRNA, n � 6) and 100 pg total RNAhttp://www.neuron.org/cgi/content/full/38/2/161/DC1.(�3–5 pg mRNA, n � 7) to HuGeneFL microarrays
The expression of 40 transcripts predicted in OSNsyielded high correlation coefficients of gene expressionor OPCs, including randomly selected genes of unknown(0.84 � 0.03 and 0.95 � 0.02, respectively), remarkablyfunction, transcriptional regulators, and signaling mole-similar to those obtained from single HGC and groupscules, was systematically verified by RNA in situ hybrid-of 10 HGCs (Table 1; see Supplemental Data set S6).ization. Of these transcripts, 36 out of 40 (90%) matchedThus, these experiments clearly demonstrate that, al-the respective patterns predicted by microarray, whilethough some distortion of the original single-cell tran-4 gave an ambiguous or no signal, demonstrating ascript distribution cannot be excluded, the procedurevery tight concordance between predicted and actualappears extremely reproducible from sample to sample,expression patterns of the sampled transcripts. We alsosuch that a high degree of confidence can be grantedexpanded our investigation to a small subset of tran-to the comparison of single-cell profiles.scripts that were predicted preferentially in OPCs butdid not meet 1–2 of the criteria described above. WithinQuantitative Model of Single-Cell Variabilitythis pool, 6 of 9 transcripts (66%) matched the patternsThe transcriptional profile of single HGCs also offeredpredicted by microarray. A complete summary of thea unique opportunity to quantify the cell-to-cell noiseexpression patterns of these transcripts is shown inamong “identical” cells and thus enabled us to distin-Supplemental Table S3, and representative examplesguish biologically significant transcriptional differencesare shown in Figures 3A and 3B and Supplemental Fig-from random inaccuracies in the reverse transcriptionure S1. Direct comparison of OPC-specific transcriptionand PCR amplification or from the intrinsic variabilitywith profiles defined for other early neuronal progenitorsof transcription in single cells. For this purpose, foldrevealed that 42% of the OPC-enriched transcripts arechanges in transcript expression level among pairwisealso enriched in neurospheres (data not shown), sug-combinations of HGCs were scored in log scale andgesting a high degree of similarity between the two pop-plotted as a function of the mADV of each transcriptulations of olfactory and brain-derived rapidly dividing(Figure 2D and see Experimental Procedures). As ex-neuronal progenitors, while only 3% are common be-pected, more variability is observed for genes expressedtween OPCs, embryonic, neuronal, and hematopoieticat lower levels, as summarized by the best-fit regressionstem cells (Ramalho-Santos et al., 2002)curve of the data for mADV � 250 (dark line in Figure
Transcripts with predicted enrichment in OSNs were2D). From the spike mRNA experiments, a mADV of 250found to have expression in the neuroepithelial layer ofroughly corresponds to 1–2 transcript copies per cell,the mature and E15 MOE, but not in the basal layer,allowing us to choose this number as a natural cutoffwhere immature progenitors are thought to reside. Inlimit. Another curve can then be deduced that encom-contrast, most transcripts with preferential expressionpasses 95% of the data points, thus representing a sta-in OPCs (19 out of 23) were found in the precursor cellstistically significant prediction or confidence intervalof the E15 MOE and basal layer of the mature MOE. Anwithin which a particular fold change can be consideredadditional four transcripts were detected in precursorabove the background cell-to-cell noise (red line in Fig-cells of the E15 MOE but not in the mature MOE. Thisure 2D).observation suggests that although there are some dif-
This led us to establish a stringent set of criteria for theferences between OPCs originating from E15 and from
successful identification of transcriptional differencesmature MOE, the transcriptional profile of the two pro-
between two cell populations. We considered a given genitors is mostly similar.transcript to have significant differences between two Although all the OSNs and OPCs chosen for analysiscell types based on three criteria. First, the mADV of the in our study share expression of key marker proteins,probe set, inclusive of all single-cell samples, should be such as OMP and Mash1, respectively, it remains possi-equal to or greater than 250, the equivalent of 1–2 copies ble that they could be subdivided into different cellularper cell. Second, the variability in probe set expression classes. This possibility seems especially critical for thelevel, as defined by the ratio of mADVs between the two Mash-positive OPCs, which may represent separate de-cell types, should exceed the fold change threshold velopmental lineages or different developmental stages.as defined by the confidence interval described above To test this hypothesis, we used Genecluster 2.0 to(Figure 2D and Experimental Procedures). Finally, the perform class predictions based on the generation ofcorresponding probe set should display differences in self-organized maps (SOMs) (Golub et al., 1999). WhenADV levels between the two types of samples that are a 2-cluster SOM is generated, the OSNs and OPCs seg-considered statistically significant by the Student’s un- regate perfectly along the OSN-OPC distinction; more-paired t test (p � 0.05). over, crossvalidation studies (see Golub et al., 1999)
demonstrate these two categories are readily distin-OPC- and OSN-Specific Transcription guished (not shown). When 3 1 and 4 1 clusterWe then searched for differences in gene expression SOMs are generated, the algorithm does segregate thebetween single OSNs and OPCs. Using the three criteria OSNs and OPCs into further subdivisions, but theseestablished above, 458 probe sets were predicted to be subcategories perform very poorly on crossvalidation.enriched in one of the two cell types. Among those, This analysis supports the idea that our Mash-positive
samples reflect a common cell type at a similar develop-209 probe sets representing 187 individual genes were

Neuron166
Figure 3. Gene Expression in OSNs and OPCs
(A and B) Microarray (A) and in situ hybridization (B) data from selected transcripts with predicted differential expression by OSNs and OPCs.(A) For each transcript, the corresponding microarray probe set, gene name, and values for the three criteria for predicted differential expression(p value, mADV [for OSNs and OPCs], and log FC/95 Confidence Interval ratio) are shown. When comparing the profiles of OSNs versus OPCs,

Transcriptional Profile of Single Cells167
mental stage. Due to the low abundance of most tran- identified in the developing MOE (Cau et al., 2002), couldnot be investigated through the Affymetrix Murine11Kscripts identified in our study, definitive demonstrationprobe arrays. Hes5, as assessed by Southern Blot analy-of the coexpression of Mash1 and OPC-specific tran-sis, does not appear to be present at significant levelsscripts will await further improvement in the sensitivityin OPC cDNAs.of transcript detection by double in situ hybridization.
OPCs also express multiple factors involved in boththe positive and negative regulations of cell proliferation,
The Transcriptional Profile of Mash1-Positivesuggesting that this cell type is in a highly dynamic state.
Olfactory ProgenitorsThree members of the Id protein family, Id1, Id2, and
The transient expression of the bHLH-containing tran-Id3, had strong and specific expression in OPCs, hinting
scription factor Mash1 by olfactory progenitors corre-at a potential role in preventing neuroblasts from cell
sponds to a critical step in their progression to a neu- cycle withdrawal further neuronal differentiation (Nortonronal fate. In the early embryonic MOE, Mash1 is et al., 1998). However, the simultaneous detection ofexpressed by a population of rapidly dividing apical neu- the antiproliferative gene Tis21 indicates that OPCs alsoroepithelial cells, which then translocate to form a basal receive signals to leave the cell cycle. Indeed, Tis21pool of dividing Mash1-positive neuronal progenitors expression has been shown in neuroepithelial cells(Cau et al., 1997, 2000, 2002). These OPCs fail to appear which, at their last division, will generate postmitoticin the Mash1 mutant, which consequently does not pro- neurons (Iacopetti et al., 1999).duce any substantial number of OSNs (Guillemot et al., Interestingly, the vast majority of differentially ex-1993). Mash1 has also been shown to control Notch pressed transcripts appear exclusively expressed insignaling components and transcription factors essen- basal neuronal progenitors, consistent with the idea thattial for olfactory differentiation of basal cells, leading to the process of neurogenesis and patterning is initiatedthe hypothesis that it functions as a proneural gene in these cells. We identified two interacting Polycomb-during olfactory development. Therefore, the ability to group genes, Enx1 and Eed (Figure 3A), which suggestmonitor the transcriptional profile of single progenitors a role in chromatin remodeling in olfactory specificationprovides a unique opportunity to uncover early Mash1- (Beuchle et al., 2001; Schumacher and Magnuson,dependent and -independent signaling events that are 1997). In addition, we identified the embryonic TEA do-essential for olfactory neurogenesis. main-containing transcription factor ETF (Guss et al.,
OPC-specific transcripts displayed distinct types of 2001; Yasunami et al., 1995) and a LIM domain-con-expression patterns in the E15 MOE. A subset of tran- taining nuclear protein expressed in specific areas ofscripts, including Hes6, Tis21, Enx1, ETF, and Eed, were the developing brain, Rhombotin1 (Rbtn1) (Figure 3A;found predominantly or exclusively in basal neuronal Hinks et al., 1997). ETF appears transiently expressedprogenitors, while others, notably Pax6, Id2, Eya2, and by Mash1-positive precursors of the basal embryonicSix1, were equally expressed by both apical and basal epithelium, while Rbtn1, although clearly excluded fromprogenitors (Figure 4; see Supplemental Figure S1 at apical precursors, is more widely expressed in basalhttp://www.neuron.org/cgi/content/full/38/2/161/ precursors as well as in immature olfactory neurons,DC1). This result is in agreement with the existence of suggesting a role throughout olfactory differentiation.distinct pools of basal and apical Mash1-positive pro- Finally, we identified three genes, Eya2, Six1, and Pax6,genitors and further indicates that the transcriptional which belong to a regulatory network involved in eyeprograms of basal and apical progenitors have already development (Figure 3A). Eya2 and Six1 are homologssignificantly diverged. Moreover, the presence of tran- of Drosophila eyes absent (eya) and sine occulis (so),scripts with exclusive basal expression in all OPCs of respectively. Eya and so interact physically, synergizeour collection enables us to further and more precisely to induce ectopic eyes, and function within a transcrip-identify these Mash1-positive cells as basal neuronal tional network that also includes eyeless/Pax6 in orderprogenitors. to control cell proliferation, patterning, and neuronal
Among the OPC-specific transcripts, we identified specification within the developing eye (Heberlein andmembers of the Notch pathway. RBP, a member of the Treisman, 2000; Pignoni et al., 1997). The expressiontranscriptional complex controlled by Notch signaling, of three members of the same genetic network in theand Hes6, which inhibits Hes1 transcription (Bae et al., developing MOE may indicate that the function of the2000; Koyano-Nakagawa et al., 2000) both appear complex is conserved in olfactory neurogenesis.upregulated in Mash1-positive cells. In contrast, noneof the OPCs were found to express Hes1, shown to be Mash1-Dependent and -Independentpresent in apical Mash1-positive precursors (Cau et al., Transcriptional Control of Olfactory Neurogenesis2002). Expression of other members of the Notch path- The availability of the Mash1/ knockout (Guillemot et
al., 1993), which lacks the open reading frame of theway, Hes5, Serrate1, and Serrate2, which have been
a logFC/95% confidence interval value greater than 1 indicates that the average variability of OSNs versus OPCs is significantly greater thanthe threshold defined by the 95% confidence interval equation in Figure 2D. A subset of transcripts shown (Id3, Eya2, Six1, Eed, Rbtn1) wasinvestigated by RNA in situ hybridization but did not meet 1–2 of the three criteria.(B) In situ hybridization shows that transcripts predicted to be enriched in OPCs (top three rows) are preferentially expressed in the globosebasal layer of P21 olfactory epithelium, which corresponds to the location of Mash1-positive OPCs (top left panel). In contrast, transcriptspredicted to be enriched in OSNs (lower row) are preferentially expressed in the neuronal layer of P21 MOE, identified by the expression ofOMP (left panel). Dotted lines indicate the basal layer/lamina propria border. S, Sustentacular cell layer; N, neuronal layer; B, globose basalcell layer; LP, lamina propia.

Neuron168
Figure 4. Mash1-Dependent and -Independent Pathways in Olfactory Development
Expression patterns of OPC-enriched transcripts were investigated by RNA in situ hybridization on wild-type (wt, left of each column) andMash1-deficient (/, right of each column) E15 MOE. Top left: Mash1 transcript expression is abundant in both wt and Mash1/ MOE.Bottom left: the expression of several OPC-enriched transcripts is dependent on Mash1. Expression of these transcripts is significantly reduced(Hes6, Notch1, Lhx2) or virtually eliminated (Hes5, Rbtn1, Tis21) in Mash1 mutants. Right: several OPC-enriched transcripts associated withneurogenesis are still expressed in the absence of Mash1 function.
Mash1 gene, has allowed us to perform partial epistasis of Hes5, Hes6, Notch1, and Tis21, thereby promotingneurogenesis and exit of cell cycle.analysis between Mash1 and other transcriptional regu-
lators as identified in OPCs on arrays. The expression In contrast, the expression of a large subset of OPC-specific transcripts involved in neurogenesis and neu-of genes related to cell proliferation or Notch signaling,
mainly Hes5, Hes6, Notch1, and Tis21, was abolished ronal specification was maintained in the Mash1/ epi-thelium. The extent of expression of these genesor strongly reduced in the mutant E15 MOE (Figure 4).
Control in situ hybridization with a full-length Mash1 throughout the entire MOE well exceeds that of the verysmall subset of OSNs known to survive in the ventro-probe reveals the presence of numerous Mash1-positive
progenitors in the E15 mutant epithelium (Figure 4), sug- lateral region of the Mash1/ MOE. The expression ofRbtn1 and Lhx2, another transcription factor expressedgesting that, in these cells, Mash1 controls expression

Transcriptional Profile of Single Cells169
in the embryonic MOE and potentially associated with only minor contamination by adjacent cells, we re-stricted the thickness of tissue sections to 5–7 �m, cor-Rbtn1 function (Cau et al., 2002; Porter et al., 1997), isresponding to a single-cell layer, and narrowed to itsabolished in Mash1/ MOE (Figure 4). However, theminimum the diameter of the laser beam (see Experi-two interacting Polycomb-group genes (Enx1 and Eed),mental Procedures). Tissue sections were treated withas well as the transcription factors ETF, Sox11, an earlyhematoxylin stain, enabling us a thorough visual inspec-olfactory marker (C.D., unpublished), and the threetion of the captured sample under the microscope tomembers of the retinal development signaling networkassess the presence of a single nucleus (see Figure 6A,(Six1, Eya2, and Pax6), were consistently detected ininsert). In a pilot experiment, we investigated the abilitythe Mash1 mutant epithelium, suggesting that althoughto successfully generate amplified single-cell cDNA fromthe ultimate survival of neuronal precursors relies onlaser-captured samples. Single neurons were laser cap-Mash1 function, some aspects of neurogenesis andtured from frozen sections of vomeronasal organ (VNO),neuronal specification might be readily initiated in theand single-cell cDNAs generated according to our stan-absence of Mash1 expression.dard protocol were checked extensively by Southernblot analysis for a large variety of ubiquitous and VNO-Transcriptional Patterning of the Embryonic MOEspecific markers. Results consistently indicated that theThe expression of olfactory receptor genes is segre-quality of single-cell cDNAs obtained from laser-cap-gated along a dorso-ventral axis such that all neuronstured samples was indistinguishable from that of hand-expressing a given OR reside within one of four distinctpicked VNO neurons from our lab collection (not shown).zones of the olfactory epithelium. Although some tran-
Based on these results, we directly aimed at dis-scripts have been shown to display gradients of genecovering genes differentially expressed between twoexpression along the dorso-ventral axis of the MOE (Nor-targets of olfactory neuronal projections, the nascentlin et al., 2001), no systematic approach has been per-precursor cells from the main olfactory bulb (MOBCs)formed to investigate how this patterning is achieved.and from the accessory olfactory bulb (AOBCs). ForAlthough olfactory receptor (OR) transcripts are notthis purpose, we laser captured cells from parasagittaldetectable in OPCs, in situ hybridization on the E15 MOEsections at E15.5, a stage at which only mitral cell pro-detects OR expression in more advanced precursors,genitors have become postmitotic and have migratedwhich are already segregated into four distinct epithelialinto the future bulb (Hinds, 1968). To provide a spatialzones (Buck, 2000). We performed systematic in situguide for the laser dissection of AOB versus MOB pre-hybridization on serial sections of the MOE with RNAcursors, we performed in situ hybridization on adjacentprobes corresponding to ORs and to OPC-specific tran-sections with Id2, a marker that distinguishes the twoscription factors. This set of experiments revealed thatembryonic bulb structures at E15.5 (Figure 6A, top pan-a subset of the genes identified with the single-cell pro-els, and Experimental Procedures). Following laser cap-filing study display a dramatic restriction of their expres-ture, single cells were dissected from the plastic capssion to a subset of the MOE zones both in adult and in(Figure 6A, third panel) and placed into individual PCRthe embryo. Indeed, while Sox 11, Hes6, and Mash1tubes for single-cell cDNA amplification (see Experimen-(Figure 5, left column), as well as Six1 and Lhx2 (nottal Procedures). Confirmation of the identity of eachshown), are widely expressed along the whole epithe-cell was obtained by Southern blot with Id2 (Figure 6A,lium, Eya2, Rbtn1, Id2, and Id3 are present in progenitorsbottom panel). Of 36 amplified cDNAs, 10 samples (5of one or two ventral zones exclusively (Figure 5, middleMOBCs and 5 AOBCs) were labeled and hybridized toand right columns). Thus, it appears that restricted ex-Murine11K Affymetrix microarrays as described (see
pression of transcriptional regulators in distinct zonesSupplemental Data set S3 at http://www.neuron.org/
of the MOE can be detected in early progenitors thatcgi/content/full/38/2/161/DC1). Systematic inspection
have yet to express a given OR. These genes in turn of data quality was performed, confirming that single-represent good candidates to participate in the combi- cell cDNA obtained by laser microdissection was similarnatorial coding of a dorso-ventral MOE patterning axis, in quality to that obtained from live cells in suspension.a process that ultimately results in the zonal organization The average number of genes expressed in MOBCsof OR expression. (2985 � 329) and in AOBCs (3092 � 368) was similar to
Remarkably, the zonal expression of Eya2 (Figure 5A, that obtained from live cells. Moreover, the complexityright) and Id2 (not shown) appear unaffected in the of low, middle, and high abundance transcripts was alsoMash1 mutant, suggesting that the control of the MOE comparable (data not shown). In addition, comparisonsdorso-ventral patterning is at least partially independent between samples give correlation coefficients compara-from Mash1-dependent neurogenesis. ble to, although slightly lower than, live OPCs picked
from the MOE (Table 1). This lower correlation coefficientTranscriptional Profile of Neuronal Progenitors between early bulb precursors is expected becauseCaptured from Brain Slices these cells are present at different maturation stagesPatterning events in the embryo rely on the spatial segre- and have not been selected for the expression of agation of molecularly distinct subpopulations, and neu- defined developmental marker as were Mash1-positiverons and neuronal precursors of specific types are often OPCs.closely intermingled within a defined structure. Laser To find genes differentially expressed betweencapture microscopy on tissue slices offers the unique MOBCs and AOBCs, we applied the three criteria estab-opportunity to isolate specific cell types from precise lished previously. 131 probes representing 125 genestissue locations. were specifically and highly upregulated in MOBCs,
while 20 probes representing 18 genes were specificallyIn order to successfully isolate single precursors with

Neuron170
Figure 5. OPC-Enriched Transcription Fac-tors in Olfactory-Receptor Zones
(A) RNA in situ hybridization patterns on adja-cent, coronal sections of E15 MOE. Sox11,Hes6, and Mash1 are strongly expressedthroughout the embryonic MOE. In contrast,Eya2, Rbtn1, Id2, and Id3 (not shown) arepreferentially expressed in ventral zones. Theexpression of Eya2 in Mash1-deficient MOE(Eya2/Mash1/) is similar to the zone-re-stricted pattern in wild-type tissue. A sche-matic of the four zones in e15 MOE is shownat lower right.(B) The zone-restricted expression of tran-scripts is maintained in p21 MOE. Represen-tative examples of Sox11, Eya2, and Rbtn1expression in dorsal (zone 4) and ventral(zone 1) regions of MOE are shown, as deter-mined by olfactory receptor expression onadjacent sections (not shown).
upregulated in AOBCs (see Supplemental Table S2 and DiscussionData set S4 at http://www.neuron.org/cgi/content/full/
We have demonstrated here the ability to monitor the38/2/161/DC1). A significant number of these enrichedgenes have known functions in transcriptional regulation transcriptional profile of individual cells. Although others
have reported on the representation of cDNA amplifiedand repression, cell cycle control, translational control,the regulation of the cytoskeleton, and cell adhesion, from dilute starting material (Iscove et al., 2002) or the
ability to detect amplified material on nylon filters (Kleinthus offering promising leads toward the dissection oftranscriptional networks specifying distinct mitral cell et al., 2002), the hybridization of amplified single-cell
cDNAs to microarrays for the purpose of monitoringpopulations.The expression pattern of several of these transcripts large-scale changes in gene expression is an unvali-
dated method. We have documented the sensitivity, re-was tested by in situ hybridization on E15.5 olfactorybulbs (Figure 6C), confirming the very tight concordance liability, and fidelity of the single-cell cDNA amplification,
resulting in a faithful representation of the original single-between array and expression data already observedwith hand-picked cells: 11/13 (85%) transcripts gave the cell transcriptome and therefore the ability to predict
meaningful differences between specific and rare cellexpected expression patterns as predicted by the array(see Supplemental Table S3 at http://www.neuron. types.
We have established useful criteria that permit theorg/cgi/content/full/38/2/161/DC1). Two of these genes(aa611744 and COUP-TF1) selectively stained only the successful identification of transcriptional differences
between individual cells, while reducing false calls re-posterior half of the AOB (Figure 6C and data not shown),attesting to the cellular heterogeneity of mitral cell pre- sulting from random variability in gene expression or
PCR distortions. Similar results were obtained using thecursors at that stage.

Transcriptional Profile of Single Cells171
Figure 6. Laser Capture of Single Cells and Gene Expression in Embryonic Olfactory Bulb
(A) Laser capture microscopy of single MOBCs and AOBCs from a section of E15.5 olfactory bulb. Top: Id-2 is expressed in the developingMOB, but not in the AOB. Second from top: adjacent section following laser capture of single cells. Dark circles indicate areas where laserpulses melted the plastic cap. Second from bottom: cell samples adhering to the cap. Close inspection of captured samples (insert) demonstratethe presence of single nuclear structures. Bottom: Southern blot on single-cell cDNAs from captured cells confirms expression of Id-2 inMOBCs (cells 4–5) but not AOBCs (cells 1–3).(B and C) Microarray (B) and in situ hybridization (C) data of selected transcripts with predicted differential expression in the MOB (Id2, Ugalt2)and AOB (coup-tf1). Details are the same as Figure 3.
self-organizing map and class predictor strategies of difference, however, is that the 95% confidence intervalprovides an experimentally defined approach to varyGolub et al. (1999) to identify those genes that behave
as strong “predictors” of OSN versus OPC cells. One the fold change required for selection as a function of

Neuron172
min at 37�C in phosphate-buffered saline (PBS) (without Ca2� andthe mADV, instead of a simple uniform fold change forMg2�), 0.025% trypsin, 0.75 mM EDTA. After gentle trituration of theall mADV, thereby providing a more stringent filter fortissues in Dulbecco’s modified Eagle’s medium plus 10% fetal calfgene selection. We also found that one could reduceserum, cells were collected by centrifugation and resuspended in
the stringency of transcript selection, by using only a ice-cold PBS. The cell suspension was observed on a Leitz invertedsubset of the established criteria, and still obtain mean- microscope. OSNs from adult MOE preparations were identified as
bipolar neurons with an axonal process and a dendrite terminatingingful information, although with a higher percentage ofin an olfactory knob. Cells from E15 preparations were picked inde-error. In particular, it appears from our data that a lowerpendent of cell morphology. Isolated cells were picked with a mouthstringency filter permits identification of transcripts withpipette fitted with a beveled microcapillary. Single cells were seededexpression by a cell subset only, for example, coup-TF1into thin-walled PCR tubes (Perkin-Elmer) containing 4 �l of ice-
in the posterior AOB. cold cell lysis buffer (50 mM Tris-HCl [pH 8.3], 75 mM KCl, 3 mMSome limitations of the presented strategy have MgCl2, 0.5% NP-40, containing 80 ng/ml pd(T)19-24 [Pharmacia], 5
emerged during our study. First, although the vast ma- U/ml Prime RNase inhibitor [5�-3� Incorporated], 324 U/ml RNAguard[Pharmacia], and 10 �M each of dATP, dCTP, dGTP, and dTTP).jority of microarray probe sets appear to function nor-Lysis was subsequently performed at 65�C for 1 min. First-strandmally, probe sets that do not correspond to the 3�-mostcDNA synthesis was then initiated by adding 50 U of MMLV and 0.5portions of the transcript do not successfully detectU of AMV reverse transcriptases (Invitrogen) followed by incubation
single-cell cDNA. In addition, in the absence of cell- at 37�C for 15 min. Samples were heat inactivated at 65�C for 10specific markers for rare or poorly characterized cell min, and poly(A) was added to the first-strand cDNA product bytypes, the ability to identify and isolate one’s favorite adding an equal volume of 200 mM potassium cacodylate (pH 7.2),
4 mM CoCl2, 0.4 mM DTT, 200 �M dATP containing 10 U of terminalneuronal cell type and precursor might present sometransferase (Roche Diagnostics) at 37�C for 15 min. Samples werechallenge, a problem further enhanced by the fact that,heat inactivated at 65�C for 10 min, and the contents of each tubedue to cell-to-cell variability, the analysis of at leastwas brought to 100 �l with a solution made of 1 PCR buffer II4–5 samples per cell type is required to eliminate false(Applied Biosystems), 2.5 mM MgCl2, 100 �g/ml bovine serum albu-
positives from cell type comparisons. This issue is likely min, 0.05% Triton X-100 and containing 1 mM of dATP, dCTP, dGTP,to be partially alleviated by enhanced cell identification dTTP, 10 U of AmpliTaq polymerase (Applied Biosystems), and 5afforded by the laser capture microscopy. �g of the PCR primer AL1. The AL1 sequence is 5�-ATT GGA TCC
AGG CCG CTC TGG ACA AAA TAT GAA TTC (T)24-3�. PCR amplifica-The large-scale analysis of transcriptional profiles ob-tion was then performed according to the following schedule: 94�Ctained from individual olfactory neurons and olfactory1 min, 42�C 2 min, and 72�C 6 min with 10 s extension per cycle forprogenitors has provided a unique snapshot of the dif-25 cycles. An additional 5 U of Taq polymerase was added before
ferent regulatory networks concurring or competing performing 25 more cycles of PCR without the 10 s extension perwithin a single cell at a specific developmental stage to cycle. In this manner, 10–20 �g of PCR-amplified cDNA was synthe-control cell proliferation and olfactory specification. sized from RNA of individual neurons.
Five microliter aliquots of each single-cell cDNA were checkedIn order to test the utility of our new experimentalfor the presence of ubiquitous and cell type-specific markers bystartegy, we focused our attention on unraveling Mash1-Southern blot hybridization (see below). All single-cell cDNA consid-dependent and -independent epistatic interactions. Theered for further study showed strong expression of �-tubulin andpersistent expression of OPC-specific transcripts asso-GAPDH. OPCs were identified by the strong expression of Mash1,
ciated with neurogenesis in basal cells throughout the cdc2, and Ki67 (Guillemot et al., 1993; Riabowol et al., 1989; Schol-entire epithelium of the Mash1/ mutant well exceeds zen and Gerdes, 2000). OSNs were identified by the strong expres-the presence of a small subset of surviving OSNs already sion of olfactory marker protein (OMP).
In addition, the olfactory receptor sequence was identified fromdescribed in the mutant MOE. Thus, our data indicatessingle OSNs using degenerate PCR essentially as previously de-that some aspects of neurogenesis still occur in thescribed (Malnic et al., 1999). Olfactory receptor sequences wereabsence of Mash1. Our identification of an Eya2, Six1,confirmed by DNA sequencing. In no case was �1 OR sequence
and Pax6 transcriptional network in OPCs of wild-type detected per single OSN sample.and Mash1 mutant documents how networks that con- Single OPC and OSN samples that met the above criteria weretrol the expression of bHLH factors are changed and subsequently reamplified by PCR. 2.25 �l of each single-cell cDNA
was added to 300 �l of 1 PCR buffer II, 2.5 mM MgCl2, 0.2 mMredeployed under Mash1-dependent and -independentdNTPs, 5 U AmpliTaq, and 5 �g AL1 primer. Samples were thenconditions in different developmental systems (HeanuePCR amplified with 30 cycles of 94�C 1.5 min, 42�C 2 min, 72�C 3et al., 1999; Ohto et al., 1999).min. Approximately 50 �g of sample was obtained in this manner.In conclusion, the level of reproducibility, sensitivity,100 �l aliquots were added to PCR purification columns (Qiagen)
and accuracy of our single-cell approach provides unri- and rechecked for the presence and intensity of control markers byvalled cellular resolution for large-scale transcriptional Southern blot. OSN samples were also rechecked for the presenceanalysis that has immediate application for the study of of olfactory receptor sequence by degenerate PCR. Samples with
robust expression of all diagnostic markers were then hybridizedolfactory neurogenesis and can be more vastly appliedto microarrays (see below).to investigate the molecular nature of neuronal diversity
throughout the developing, the adult, and the diseasedbrain. “Spiked” Single OSN Preparation and Analysis
Poly(A)-tailed B. subtilus Lys, Dap, Phe, and Thr RNA were preparedas described (Lockhart et al., 1996) and “spiked” into a subset ofExperimental ProceduresOSN samples. Spike RNAs were added into the single-cell lysisbuffer to the following final concentrations: Lys, 106 pg/sample;Single OSN and OPC cDNA Preparation and AnalysisDap, 2 106 pg/sample; Phe, 105 pg/sample; Thr, 104 pg/sample.Single-cell cDNA synthesis and amplification was performed for allAssuming 1 �g of poly(A)-RNA with an average length of 2 kb �samples according to Dulac and Axel (1995). Single OSNs and OPCs1.52 pmol, this translates into �1, 2, 10, and 100 copies/sample,were obtained from c57Bl/6J mice. OSNs and OPCs were obtainedrespectively. Samples were then amplified by single-cell PCR andfrom dissected MOEs from adult and embryonic day 15 (E15) em-
bryos, respectively. Small pieces of tissue were dissociated for 10 analyzed as described above.

Transcriptional Profile of Single Cells173
HGC cDNA Preparation and Analysis Microarray Data AnalysisMicroarray image data were analyzed using Affymetrix GeneChipA T98G human glioblastoma cell line (CR1-1690) was serum starvedSystem v3.2 software with the following changes to Data Analysis3 days, trypsinized 5 min, and resuspended in PBS without Ca2� orparameters: positive/negative minimum, 2.2; positive/negative max-Mg2�. 88% of all cells were determined to be in G1/G0 phase byimum, 3.0; positive ratio minimum, 0.24; positive ratio maximum,FACS analysis (data not shown). Resuspended cells were counted0.33; average log ratio minimum, 0.80; average log ratio maximum,with a hemocytometer and diluted to a concentration of 20 cells/1.2. These values lower the stringency of the Absolute call to com-�l. 1HGC samples were picked as described above. 10HGC samplespensate for the lack of full-length transcripts in single-cell cDNA.were obtained by adding 0.5 �l of the cell suspension directly to
All subsequent analysis was performed using Microsoft Excel. Tothe single-cell lysis buffer. cDNA was obtained as described aboveobtain the 95% confidence interval equation quantifying significantand checked for the strong expression of �-tubulin and GAPDH by1HGC gene expression variability, the mean ADVs (mADVs) andSouthern blot. Samples with robust expression of these markersabsolute values of the log fold change (logFC) were calculated forwere directly hybridized to microarrays (see below).each probe set in pairwise comparisons of the 1HGC microarraydata (6 samples for 15 total pairwise comparisons). All pairwise
Diluted HGC RNA Preparation and Analysis comparisons were independently ranked from highest to lowest byTotal RNA was extracted with RNAzol (Tel-Test) from a T98 human mADV, and the corresponding logFC and mADV were then averagedglioblastoma cell line according to manufacturer’s specifications. across all ranked, pairwise comparisons. This ranked logFC wasThe total RNA (�2000 ng/�l) was then serially diluted to a concentra- plotted against the ranked mADV, thereby providing a measure oftion of 200 pg/�l and 20 pg/�l. 0.5 �l of each dilution was directly FC variability at a given mADV that is independent of gene identity.added to the single-cell lysis buffer. cDNA was obtained as de- The best-fit regression curve through all points with a pairwisescribed above and checked for the strong expression of �-tubulin mADV � 250 was calculated using Excel’s data analysis feature asand GAPDH by Southern blot. Samples with robust expression of y � 4.6714x0.3544 (R2 � 0.5838), where y is the log fold change andthese markers were directly hybridized to microarrays (see below). x is the mADV. The 95% prediction or confidence interval was then
calculated for all values as described by Rosner (2000), which forour HGC data set is approximated by the equation y � 2.67x0.1984.Laser Capture Microdissection and Sample Preparation
A total of nine OSNs, seven OPCs, five OBCs, and five AOBCsE15.5 mouse olfactory and accessory olfactory bulbs were dis-
were used to find differentially enriched transcripts. A transcript ofsected and freshly embedded in Tissue-Tek OCT compound (Sa-
interest was isolated based on three criteria. First, the correspondingkura). 5–7 �m parasaggital cryosections of E15.5 bulbs were placed
probe set had differential expression between OSNs and OPCs thaton permafrost-coated glass slides and taken through the following was statistically significant (p � 0.05, Student’s unpaired t test).staining and dehydration procedure: 70% EtOH 30 s, H2O 5 s, May- Second, for the corresponding probe set, the mADV across all cellser’s Hematoxylin (Sigma) 1 min, H2O 5 s, Bluing Reagent (Shandon) analyzed was �250. Third, the logFC, based on the ratio of the1 min, 70% EtOH 10 s, 95% EtOH 10 s, Eosin Y (Shandon) 20 s, mADVs of all OSNs and all OPCs for the corresponding probe set,95% EtOH 30 s 2, 100% EtOH 1 min 2, xylene 5 min 2, air dry exceeded the fold change threshold defined by the same 95% confi-15 min. Single-cell nuclei were then laser microdissected using a dence interval equation described above. For this calculation, thePixCell II Laser Capture Microdissection microscope (Arcturus). Sin- mADV for each probe set across all cells was used to determinegle cells were removed from the Capsure caps (Arcturus) using a the 95% confidence interval that must be exceeded by the observedmicroneedle and placed into PCR tubes. Lysis buffer was added fold change. A mADV in OSNs or OPCs that was 1 was roundeddirectly to the laser-captured sample, and single-cell cDNA was up to 1. All differentially expressed transcripts described in the textgenerated as described above. Samples were checked by Southern were isolated using the criteria defined here unless otherwise notedblot for the strong expression of �-tubulin and GAPDH, and Id2 (see text and Supplemental Table S3 at http://www.neuron.org/cgi/expression in MOBCs and absence in AOBCs was confirmed. Sam- content/full/38/2/161/DC1).ples were reamplified as described above, rechecked for the pres-ence and intensity of control markers, and hybridized to microarrays Whole-Tissue Preparation, Hybridization, and Analysis(see below). RNA extraction from whole tissues and microarray hybridization
were performed as previously described (Mody et al., 2001). Dataanalysis was performed as described above.
Microarray HybridizationTen micrograms of single-cell cDNA was digested with 1U RQ1
Probes for Southern Blot and RNA In SituDNase (Promega) in 1 One-Phor All buffer (Pharmacia) in 80 �l
Hybridization Analysistotal volume at 37�C for 13 min, followed by 99�C for 15 min. DNA
All cDNA probes for Southern blot and RNA in situ hybridizationfragments were end-labeled with 25 �M Biotin-N6 ddATP (NEN) and analyses were obtained using specific PCR primers spanning most,45 U terminal transferase (GIBCO-BRL) at 37�C for 1.5 hr, 65�C for if not all, of the 3�-most 600 bp of full-length cDNA sequences as5 min, then on ice for 5 min. annotated in GenBank (http://www.ncbi.nlm.nih.gov). PCR products
DNA fragments were then hybridized to HuGeneFL or Mu11K were obtained from cDNA derived from adult or E15 mouse brainGeneChip probe arrays (Affymetrix) (Mody et al., 2001). Microarrays using Superscript II reverse transcriptase (Promega) or from awere prewarmed on a rotisserie at 60 rpm, 45�C, 15 min with 1 Lambda-ZAP cDNA library generated from adult MOE (Stratagene).MES (0.1 M Mes, 1.0 M NaCl, 0.01% Triton X-100 [pH 6.7]), 0.5 mg/ All PCR products were cloned into the pTOPOII vector (Invitrogen).ml acetylated BSA (GIBCO-BRL), and 0.5 mg/ml herring sperm DNA Sequences confirmed by DNA sequencing or restriction enzyme(Promega). Immediately before hybridization, single-cell cDNA was analysis were used as templates for both Southern blot and digoxi-warmed to 99�C for 5 min and cooled in a water bath at 45�C. cDNA genin-labeled RNA probes (Roche Diagnostics).was then added to microarrays and incubated in a rotisserie at 60rpm, 45�C for 16 hr. In Situ Hybridization Analysis
Following hybridization, arrays were washed with 6 SSPE-T (0.9 RNA in situ hybridization was performed as described (Schaeren-M NaCl, 60 mM NaH2PO4, 6 mM EDTA, 0.01% Triton X-100 [pH 7.6]) Weimers and Gerlin-Mose, 1993). MOEs were dissected from youngat 22�C on a fluidics station (Affymetrix) for 10 2 cycles, followed adult (3- to 4-week-old) mice or from the whole heads of E15 mice.by incubation with 0.1 MES buffer on a rotisserie at 60 rpm, 45�C, OB/AOBs were dissected from e15 mice. Tissues were either fixed30 min. Arrays were again washed as above. Hybridized samples in 4% paraformaldehyde or freshly embedded in Tissue-Tek OCTwere then stained with a streptavidin-phycoerythrin conjugate (Mo- compound (Sakura). Antisense and sense digoxigenin-labeledlecular Probes) at 40�C for 15 min and washed as above. To enhance probes were generated as described above.the signals, arrays were further stained with anti-streptavidin anti-body (Vector) at 40�C for 30 min, washed as above, stained with a Acknowledgmentsstreptavidin-phycoerythrin conjugate at 40�C for 15 min, and washedas above. Arrays were scanned at a resolution of 3 �m, using a We wish to acknowledge Lubert Stryer for making this work possible
and for inspired support and advice. We thank Renate Hellmiss-specifically designed confocal scanner (Affymetrix).

Neuron174
Peralta for artistic work and illustrations and Cecilia Lee for help TIS21 at the onset of neurogenesis identifies single neuroepithelialcells that switch from proliferative to neuron-generating division.with the manuscript. We also thank Francois Guillemot for providing
Mash1 mutant embryos and helpful discussions, and Erica Pan- Proc. Natl. Acad. Sci. USA 96, 4639–4644.tages, Bryan Dynlacht, Vahan Indjeian, and Kelvin Pham for assis- Iscove, N.N., Barbara, M., Gu, M., Gibson, M., Modi, C., and Winegar-tance with some experiments. This work was supported by the den, N. (2002). Representation is faithfully preserved in global cDNAHoward Hughes Medical Institute, and by a HFSPO LT fellowship amplified exponentially from sub-picogram quantities of mRNA. Nat.(G.K.) and a Wellcome Trust Functional Genomics Programme grant Biotechnol. 20, 940–943.(066790/E/02/Z to C.D. and G.K.).
Klein, C.A., Seidl, S., Petat-Dutter, K., Offner, S., Geigl, J.B., Schmidt-Kittler, O., Wendler, N., Passlick, B., Huber, R.M., Schlimok, G., et
Received: November 22, 2002 al. (2002). Combined transcriptome and genome analysis of singleRevised: March 25, 2003 micrometastatic cells. Nat. Biotechnol. 20, 387–392.Accepted: April 9, 2003
Koyano-Nakagawa, N., Kim, J., Anderson, D., and Kintner, C. (2000).Published: April 23, 2003Hes6 acts in a positive feedback loop with the neurogenins to pro-mote neuronal differentiation. Development 127, 4203–4216.ReferencesLockhart, D.J., Dong, H., Byrne, M.C., Follettie, M.T., Gallo, M.V.,Chee, M.S., Mittmann, M., Wang, C., Kobayashi, M., Horton, H., andBae, S., Bessho, Y., Hojo, M., and Kageyama, R. (2000). The bHLHBrown, E.L. (1996). Expression monitoring by hybridization to high-gene Hes6, an inhibitor of Hes1, promotes neuronal differentiation.density oligonucleotide arrays. Nat. Biotechnol. 14, 1675–1680.Development 127, 2933–2943.
Malnic, B., Hirono, J., Sato, T., and Buck, L.B. (1999). CombinatorialBertrand, N., Castro, D.S., and Guillemot, F. (2002). Proneural genesreceptor codes for odors. Cell 96, 713–723.and the specification of neural cell types. Nat. Rev. Neurosci. 3,
517–530. Mody, M., Cao, Y., Cui, Z., Tay, K.Y., Shyong, A., Shimizu, E., Pham,K., Schultz, P., Welsh, D., and Tsien, J.Z. (2001). Genome-wide geneBeuchle, D., Struhl, G., and Muller, J. (2001). Polycomb group pro-expression profiles of the developing mouse hippocampus. Proc.teins and heritable silencing of Drosophila Hox genes. DevelopmentNatl. Acad. Sci. USA 98, 8862–8867.128, 993–1004.
Murray, R.C., and Calof, A.L. (1999). Neuronal regeneration: lessonsBuck, L. (2000). Smell and taste: the chemical senses. In Principlesfrom the olfactory system. Semin. Cell Dev. Biol. 10, 421–431.of Neural Science, E. Kandel, T. Jessell, and J. Schwartz, eds. (New
York: McGraw-Hill Publishing), pp. 625–647. Norlin, E.M., Alenius, M., Gussing, F., Hagglund, M., Vedin, V., andBohm, S. (2001). Evidence for gradients of gene expression correlat-Cao, Y., and Dulac, C. (2001). Profiling brain transcription: neuronsing with zonal topography of the olfactory sensory map. Mol. Cell.learn a lesson from yeast. Curr. Opin. Neurobiol. 11, 615–620.Neurosci. 18, 283–295.Cau, E., Gradwohl, G., Fode, C., and Guillemot, F. (1997). Mash1Norton, J.D., Deed, R.W., Craggs, G., and Sablitzky, F. (1998). Idactivates a cascade of bHLH regulators in olfactory neuron progeni-helix-loop-helix proteins in cell growth and differentiation. Trendstors. Development 124, 1611–1621.Cell Biol. 8, 58–65.Cau, E., Gradwohl, G., Casarosa, S., Kageyama, R., and Guillemot,Ohto, H., Kamada, S., Tago, K., Tominaga, S.I., Ozaki, H., Sato, S.,F. (2000). Hes genes regulate sequential stages of neurogenesis inand Kawakami, K. (1999). Cooperation of six and eya in activationthe olfactory epithelium. Development 127, 2323–2332.of their target genes through nuclear translocation of Eya. Mol. Cell.Cau, E., Casarosa, S., and Guillemot, F. (2002). Mash1 and Ngn1Biol. 19, 6815–6824.control distinct steps of determination and differentiation in thePanda, S., Antoch, M.P., Miller, B.H., Su, A.I., Schook, A.B., Straume,olfactory sensory neuron lineage. Development 129, 1871–1880.M., Schultz, P.G., Kay, S.A., Takahashi, J.S., and Hogenesch, J.B.Dulac, C., and Axel, R. (1995). A novel family of genes encoding(2002). Coordinated transcription of key pathways in the mouse byputative pheromone receptors in mammals. Cell 83, 195–206.the circadian clock. Cell 109, 307–320.
Golub, T.R., Slonim, D.K., Tamayo, P., Huard, C., Gaasenbeek, M.,Pignoni, F., Hu, B., Zavitz, K.H., Xiao, J., Garrity, P.A., and Zipursky,Mesirov, J.P., Coller, H., Loh, M.L., Downing, J.R., Caligiuri, M.A.,S.L. (1997). The eye-specification proteins So and Eya form a com-et al. (1999). Molecular classification of cancer: class discovery andplex and regulate multiple steps in Drosophila eye development.class prediction by gene expression monitoring. Science 286,Cell 91, 881–891.531–537.Porter, F.D., Drago, J., Xu, Y., Cheema, S.S., Wassif, C., Huang,Guillemot, F., Lo, L.C., Johnson, J.E., Auerbach, A., Anderson, D.J.,S.P., Lee, E., Grinberg, A., Massalas, J.S., Bodine, D., et al. (1997).and Joyner, A.L. (1993). Mammalian achaete-scute homolog 1 isLhx2, a LIM homeobox gene, is required for eye, forebrain, andrequired for the early development of olfactory and autonomic neu-definitive erythrocyte development. Development 124, 2935–2944.rons. Cell 75, 463–476.Ramalho-Santos, M., Yoon, S., Matsuzaki, Y., Mulligan, R.C., andGuss, K.A., Nelson, C.E., Hudson, A., Kraus, M.E., and Carroll, S.B.Melton, D.A. (2002). “Stemness”: transcriptional profiling of embry-(2001). Control of a genetic regulatory network by a selector gene.onic and adult stem cells. Science 298, 597–600.Science 292, 1164–1167.Riabowol, K., Draetta, G., Brizuela, L., Vandre, D., and Beach, D.Heanue, T.A., Reshef, R., Davis, R.J., Mardon, G., Oliver, G., To-(1989). The cdc2 kinase is a nuclear protein that is essential formarev, S., Lassar, A.B., and Tabin, C.J. (1999). Synergistic regulationmitosis in mammalian cells. Cell 57, 393–401.of vertebrate muscle development by Dach2, Eya2, and Six1, homo-
logs of genes required for Drosophila eye formation. Genes Dev. Rosner, B. (2000). Fundamentals of Biostatistics, Fifth ed. (Boston:PWS-Kent Publishing Co.).13, 3231–3243.
Heberlein, U., and Treisman, J.E. (2000). Early retinal development Sagasti, A., Hobert, O., Troemel, E.R., Ruvkun, G., and Bargmann,C.I. (1999). Alternative olfactory neuron fates are specified by thein Drosophila. In Invertebrate Eye Development, M.E. Fini, ed. (Berlin:
Springer-Verlag), pp. 37–50. LIM homeobox gene lim-4. Genes Dev. 13, 1794–1806.
Schaeren-Weimers, N., and Gerlin-Mose, A. (1993). A single protocolHinds, J.W. (1968). Autoradiographic study of histogenesis in themouse olfactory bulb. J. Comp. Neurol. 134, 305–322. to detect transcripts of various types and expression levels in neural
tissue and culture cells: in situ hybridization using digoxigenin-Hinks, G.L., Shah, B., French, S.J., Campos, L.S., Staley, K., Hughes,labeled cRNA probes. Histochemistry 100, 431–440.J., and Sofroniew, M.V. (1997). Expression of LIM protein genes
Lmo1, Lmo2, and Lmo3 in adult mouse hippocampus and other Scholzen, T., and Gerdes, J. (2000). The Ki-67 protein: from theknown and the unknown. J. Cell. Physiol. 182, 311–322.forebrain regions: differential regulation by seizure activity. J. Neu-
rosci. 17, 5549–5559. Schumacher, A., and Magnuson, T. (1997). Murine Polycomb- andtrithorax-group genes regulate homeotic pathways and beyond.Iacopetti, P., Michelini, M., Stuckmann, I., Oback, B., Aaku-Saraste,
E., and Huttner, W.B. (1999). Expression of the antiproliferative gene Trends Genet. 13, 167–170.

Transcriptional Profile of Single Cells175
Tanabe, Y., and Jessell, T.M. (1996). Diversity and pattern in thedeveloping spinal cord. Science 274, 1115–1123.
Tanabe, Y., William, C., and Jessell, T.M. (1998). Specification ofmotor neuron identity by the MNR2 homeodomain protein. Cell 95,67–80.
Wolff, T., Martin, K., Rubin, G., and Zipursky, S.L. (1997). The devel-opment of the Drosophila visual system. In Molecular and CellularApproaches to Neural Development, W.M. Cowan, T. Jessell, andS.L. Zipursky, eds. (New York: Oxford University Press), pp. 474–508.
Yamagata, M., Weiner, J., and Sanes, J. (2002). Sidekicks: synapticadhesion molecules that promote lamina-specific connectivity inthe retina. Cell 110, 649–660.
Yasunami, M., Suzuki, K., Houtani, T., Sugimoto, T., and Ohkubo,H. (1995). Molecular characterization of cDNA encoding a novelprotein related to transcriptional enhancer factor-1 from neural pre-cursor cells. J. Biol. Chem. 270, 18649–18654.
Copyright © 2022 FDOKUMEN