Transcriptional Regulation of Hematopoietic ... - UC Berkeley
Upload
khangminh22Category
view
0download
0
RESEARCH ARTICLE
Transcriptional study of hyperoxaluria and
calcium oxalate nephrolithiasis in male rats:
Inflammatory changes are mainly associated
with crystal deposition
Sunil Joshi1, Wei Wang1, Saeed R. Khan1,2*
1 Department of Pathology, Immunology & Laboratory Medicine, College of Medicine, University of Florida,
Gainesville, Florida, United States of America, 2 Department of Urology, College of Medicine, University of
Florida, Gainesville, Florida, United States of America
Abstract
Hyperoxaluria associated with renal deposition of calcium oxalate (CaOx) crystals causes
renal injury and inflammation leading to number of diseases including chronic kidney dis-
ease (CKD). It is however, not been possible to separate the renal consequences of hyper-
oxaluria from that of CaOx crystal deposition. We decided to utilize ethylene glycol (EG)
model where hyperoxaluria and CaOx crystal deposition can be separated in time. To test
our hypothesis, male rats were made hyperoxaluric by administering EG, rats were eutha-
nized and kidneys were extracted on day 14, when occasional crystal is seen in the kidneys
and day 28, when all animals have developed renal CaOx crystal deposits. Total RNA was
extracted for microarray analysis and genome wide analysis of differentially expressed
genes was performed to investigate differences between hyperoxaluria and crystal induced
alterations in the kidneys. Immunohistochemical and Hematoxylin and Eosin (H&E) staining
was also done for macromolecules with significant role in stone formation. All EG fed rats
became hyperoxaluric by day 7, showed a few crystal deposits on day 14, and had heavy
crystal deposition by day 28. There were significant changes in the expression of genes
encoding for NADPH Oxidases; macromolecular crystallization modulators; genes involved
in inflammasome activation; and osteogenic marker genes. Results demonstrate major dif-
ferences between hyperoxaluria and CaOx crystal induced changes in the kidneys. Injury
and inflammation are mainly associated with crystal deposition indicating significant role
played by crystal retention.
Introduction
Oxalate is an organic compound found naturally in many foods such as spinach, rhubarb, beets,
wheat bran, strawberries, almonds and peanuts [1]. Higher concentration of oxalate in the
human body can lead to a number of pathological conditions including hyperoxaluria which
can further lead to a large spectrum of diseases such as nephrocalcinosis, cardiomyopathy,
PLOS ONE | https://doi.org/10.1371/journal.pone.0185009 November 1, 2017 1 / 21
a1111111111
a1111111111
a1111111111
a1111111111
a1111111111
OPENACCESS
Citation: Joshi S, Wang W, Khan SR (2017)
Transcriptional study of hyperoxaluria and calcium
oxalate nephrolithiasis in male rats: Inflammatory
changes are mainly associated with crystal
deposition. PLoS ONE 12(11): e0185009. https://
doi.org/10.1371/journal.pone.0185009
Editor: Nick Ashton, The University of Manchester,
UNITED KINGDOM
Received: February 22, 2017
Accepted: September 5, 2017
Published: November 1, 2017
Copyright: © 2017 Joshi et al. This is an open
access article distributed under the terms of the
Creative Commons Attribution License, which
permits unrestricted use, distribution, and
reproduction in any medium, provided the original
author and source are credited.
Data Availability Statement: All microarray data
have been deposited with Gene Expression
Omnibus (GSE-89028).
Funding: This study was supported by National
Institutes of Health grant #RO1-DK078602,
DK092311 and University of Florida Center for the
Study of Lithiasis. Publication of this article was
funded in part by the University of Florida Open
Access Publishing Fund. The funders had no role in
study design, data collection and analysis, decision
to publish, or preparation of the manuscript.
cardiac conductance disorders, systemic oxalosis, renal failure and specially CaOx kidney
stones. Hyperoxaluria is excessive urinary excretion of oxalate and can be classified into differ-
ent types such as primary, secondary, idiopathic and enteric hyperoxaluria caused by a variety
of factors including genetic defects or mutation of specific genes (Primary hyperoxaluria), eat-
ing oxalate rich foods (Secondary hyperoxaluria), interplay of dietary, genetic and environmen-
tal factors with unknown causes (Idiopathic hyperoxaluria) and due to fat malabsorption,
jejunal bypass surgery, and modern gastric bypass (Enteric hyperoxaluria) [2–6]. Kidney stone
formation is a chronic disease which is becoming widespread nowadays, both in the United
States and globally. Due to increased prevalence in the US, it is causing a significant economic
burden on US health care [7]. According to National Health and Nutrition Examination Sur-
veys (NHANES) of US adults, kidney stone prevalence increased from 5.2% (1988–1994) to
8.4% (2007–2010) [7] and a recent study showed that the number of kidney stone patients
increased from 1 in 20 persons to 1 in 11 persons since 1994. Among men, the prevalence was
10.6% as compared to 7.1% among women and Caucasians were more likely to report a history
of kidney stones as compared to African American and Hispanic individuals [8]. Also, recent
studies show a link between stone formation and hypertension, chronic kidney disease and
even end stage renal disease [9–12].
To understand the pathogenesis of hyperoxaluria and CaOx stone formation, many animal
models have been developed [13–15]. Two rat models in which hyperoxaluria is induced by
the administration of the ethylene glycol (EG) or hydroxy-L-proline (HLP) [16] have been
studied in detail. Previous research has shown that hyperoxaluria and renal CaOx crystal depo-
sition produced reactive oxygen species (ROS), upregulated mineralization modulators [17–
20], caused lipid peroxidation, and renal cellular injury [16,21–23]. The free radicals or ROS
appeared to play significant role in the expression of various factors and pathways [24,25],
involved in the activation of inflammasomes [23], production of macromolecules implicated
in crystal formation and retention [26,27], and osteogenesis [28]. These studies were however
performed in the kidneys with extensive CaOx crystal deposition. As a result, nature of instiga-
tion, hyperoxaluria or CaOx crystals could not be established. Current study was performed
using EG as hyperoxaluria inducing agent where, in our laboratory, administration of 0.75%
EG in drinking water to male Sprague-Dawley rats lead to consistent hyperoxaluria by 2 weeks
and CaOx crystal deposition by 4 weeks. We analyzed changes in global transcriptome of renal
tissue, following development of hyperoxaluria at 2 weeks and CaOx crystal deposition or
nephrolithiasis at 4 weeks of EG treatment. Emphasis was placed on the genes and pathways
involved in production of reactive oxygen species, crystallization modulators, development of
inflammation and osteogenesis. Results presented herein demonstrate that several pathways
were commonly expressed at both day 14 and 28. Similarly, many significantly differentially
expressed genes were common between day 14 and day 28. However significant differences
were found between day 14 and 28, in the relative expression of genes involved in osteogenesis,
activation of inflammasome and macromolecular production.
Materials and methods
Animal model
Eight weeks old, male Sprague- Dawley rats (n = 40), with average weight of about 110–120
grams, were bought from Harlan Laboratories (Harlan, Tampa, Florida). The rats were accus-
tomed for 2 weeks within the Animal care facilities in their normal as well as metabolic cages
for 2 days within the 2-week period at University of Florida before any experimental proce-
dures and prior to start their dietary regimen. All the cages, food and water were sterilized by
autoclaving before doing any experiments. Rats were divided into 2 groups (n = 20): Group 1
Time lapse study to differentiate between hyperoxaluria and calcium oxalate nephrolithiasis
PLOS ONE | https://doi.org/10.1371/journal.pone.0185009 November 1, 2017 2 / 21
Competing interests: The authors have declared
that no competing interests exist.
rats (control) were fed normal rat chow and sterile water and divided into 4 subgroups (day7,
day14, day21 and day28) of 5 rats in each subgroup, Group 2 rats had a similar diet to Group 1
rats except were fed 1.25% Ethylene glycol (EG) in drinking water. Group 2 rats were also
divided into 4 subgroups (day7, day14, day21, and day 28) of 5 rats in each subgroup. The rats
were placed in metabolic cages for urine collection 1 day before sacrificing. On day 7, 5 rats
from each group (total 10) belonging to day7 subgroup were euthanized and the kidneys
freshly extracted. Rats were anesthetized with an injection of Pentobarbital IP. Once the rats
were anesthetized and reached a surgical plane of anesthesia demonstrated by the lack of a
pedal withdrawal reflex, their body cavity was opened to expose their internal organs. The rats
were perfused with sterile saline and heparin was flushed throughout the body. Shortly after
starting the perfusion process an over dose of Pentobarbital was added to ensure that the ani-
mal was dead. This study was carried out in strict accordance with the recommendations in
the Guide for the Care and Use of Laboratory Animals of the National Institute of Health. All
research was approved by the Institutional Animal Care and Use Committee (IACUC) at Uni-
versity of Florida (IACUC study # 201101850).
One Kidney was carefully divided into cortex and medulla and was stored in RNA later
solution at -20 degrees for RNA isolation and at -80 degrees for protein isolation. The other
kidney was cut into parts and was also kept in formalin to be embedded in paraffin for histo-
logical analysis. Similar procedure was followed for day14, 21, and day 28.
Urine collection and analysis
Every week, 24-hour urine was collected with 0.02% sodium azide to prevent bacterial growth.
Rats were placed in metabolic cages for collection of urine. After determining volume and pH,
urine was aliquoted for various assays. Light microscopy was used to determine crystalluria.
Urinary lactate dehydrogenase (LDH) was measured using CytoTox1 Non-Radioactive Cyto-
toxicity Assay (Cat. # G1780) as per the manufacturer’s instructions (Promega Corporation,
Madison, WI). Urinary creatinine was measured using the Colorimetric Microplate Assay for
Creatinine (Product No. CR 01) from Oxford Biomedical Research, Oxford, MI as per their
protocol. Urinary Oxalate was measured using the Oxalate assay kit (Cat. # 591D) from Trinity
Biotech, Bray CO as per the manufacturer’s instructions, similar to methods described in our
previous studies [29]. The data was further analyzed using 2-way Analysis of Variance in
Graph Pad Prism V 5.0 (La Jolla, CA).
RNA extraction and differential expression of genes by microarray
analysis
The total RNA from each of the different specimens was isolated from the kidneys of rats
within the two different treatment groups simultaneously using the RNeasy Mini-Kit (QIA-
GEN, Valencia, CA), as per the manufacturer’s instructions as described in our previous stud-
ies [23,30,31].
Microarray analysis and data mining
The microarray analysis was done in the Interdisciplinary Center for Biotechnology Research
(ICBR), University of Florida, using the Agilent 8x60k single color arrays under the Agilent
microarray incentive program. Under this program, we used 2 different time points as day 14
and day 28, with the control, and EG treated group. There were four replications for all the
samples.
The data analysis of these samples was done at the Interdisciplinary Center for Biotechnol-
ogy Research (ICBR) using the Bioconductor limma (Linear models for microarray analysis)
Time lapse study to differentiate between hyperoxaluria and calcium oxalate nephrolithiasis
PLOS ONE | https://doi.org/10.1371/journal.pone.0185009 November 1, 2017 3 / 21
package using R [32]. Before the analysis, the individual signal intensity values retrieved from
the microarray probes were log transformed (using 2 as a base) and normalization was done
for all the individual samples within all the groups in this study. After normalizing the signal
intensity values for each of the arrays, the Student’s t-test was used to do a probe-by probe
comparison between two groups concurrently. For each comparison, the fold change (FC) and
p-value was calculated for each gene based on the n = 4 replicate samples within each experi-
mental group and heat map, raw data box plot, relative log expression (RLE), and volcano
plots were drawn for each comparison i.e. (Group2-1). The heat map was drawn using heat
map package in R [32] and gene rows were clustered according to the fold change levels.
GO:TERM and KEGG pathway analyses based on differentially-expressed genes were car-
ried out using DAVID (Database for Annotation, Visualization of Integrated Discovery)
enrichment analysis tool from National Institute of Allergy and Infectious Diseases (NIAID),
NIH [33]. The DAVID knowledgebase is built around DAVID gene concept and is intended
to facilitate high throughput gene functional analysis. Cluster analyses of genes permitted iden-
tification of biological processes, cellular component, and molecular function ontology. All
Microarray data have been deposited with Gene Expression Omnibus (GSE-89028).
Histological and immunohistological examinations
Kidneys from all the rats were extracted after euthanasia, one of which was used for RNA prepa-
ration, while the second was placed in 10% phosphate buffered formalin for 24 hours for histo-
logical analysis as previously described [31]. The tissue already fixed with formalin were
embedded in paraffin and cut into sections of 5μm thickness. Deparaffinization of paraffin-
embedded slides was performed by xylene immersion and subsequent dehydration in ethanol.
Kidney sections were processed for immunohistochemistry using specific primary antibodies
reactive to Osteopontin (OPN- Polyclonal Rb-Anti-OPN, 1:100 dilute, Abcam Cat. # ab8448),
Matrix Gla-Protein (MGP- Polyclonal Rb-Anti-MGP, 1:50 dilute, Santa Cruz Cat. # 66965), Kid-
ney Injury Molecule (KIM-1 Polyclonal Rb-Anti-KIM1, 1:100 dilute, Abcam Cat. # ab47635),
Collagen (Col1a1 Polyclonal Rb-Anti-Col1a1, 1:00 dilute, Novus Biologicals Cat. # NB600-408),
Fibronectin 1 (Fn 1 Monoclonal Ms-Anti-FN1, 1:50 dilute, Santa Cruz Cat. # sc59826), Tamm-
Horsfall Protein (THP Polyclonal Rb-Anti-THP, 1:50 dilute, Santa Cruz Cat. # sc20631), Fetuin
B (Fetub Monoclonal Rb-Anti-Fetuin B, 1:50 dilute, Abcam Cat. # ab191569) NADPH oxidase 2
(NOX2 Polyclonal Rb-Anti-Nox2, 1:100 dilute, (Abcam Cat. # ab31092) and NADPH oxidase 4
(NOX4 Polyclonal Rb-Anti-Nox4, Abcam Cat. # ab61248). Isotype controls were performed
using rabbit IgG. Slides were incubated for 30 min in biotinylated goat anti-rabbit IgG followed
by incubation with biotinylated horseradish peroxidase using the Vectastain1 ABC kit. Staining
was developed by addition of diaminobenzidine (DAB) substrate (Vector Labs, Burlingame,
CA) and counterstained with hematoxylin. To ensure that positive infiltrate staining for these
antibodies was not due to high background staining, an additional run was performed using 10
mM citrate buffer for antigen-retrieval with all other procedures unchanged. Antigen-retrieval
was carried out in 25 mMTris/EDTA buffers, pH 9.1 at 60˚C for 20 min under 18 psi pressure.
Images were taken using the Zeiss Axiovert 200M microscope (Carl Zeiss Microimaging, Inc.,
Thornwood, NY).
Results
Histology and urinary assays
As anticipated, EG administration to the rats produced hyperoxaluria and CaOx nephrolithia-
sis i.e. crystal deposition in the kidneys. There was a significant increase in urinary excretion
of oxalate by the rats consuming EG as compared to the control group peaking at day 14 and
Time lapse study to differentiate between hyperoxaluria and calcium oxalate nephrolithiasis
PLOS ONE | https://doi.org/10.1371/journal.pone.0185009 November 1, 2017 4 / 21

remaining significantly high till day 28. Urinary LDH increased significantly for Days 7, 14,
21and 28 for the EG consuming rats as compared to the control rats (Fig 1). Urinary creatinine
increased significantly on day 21 and day 28 in the EG fed rats as compared to the control
group (Fig 1).
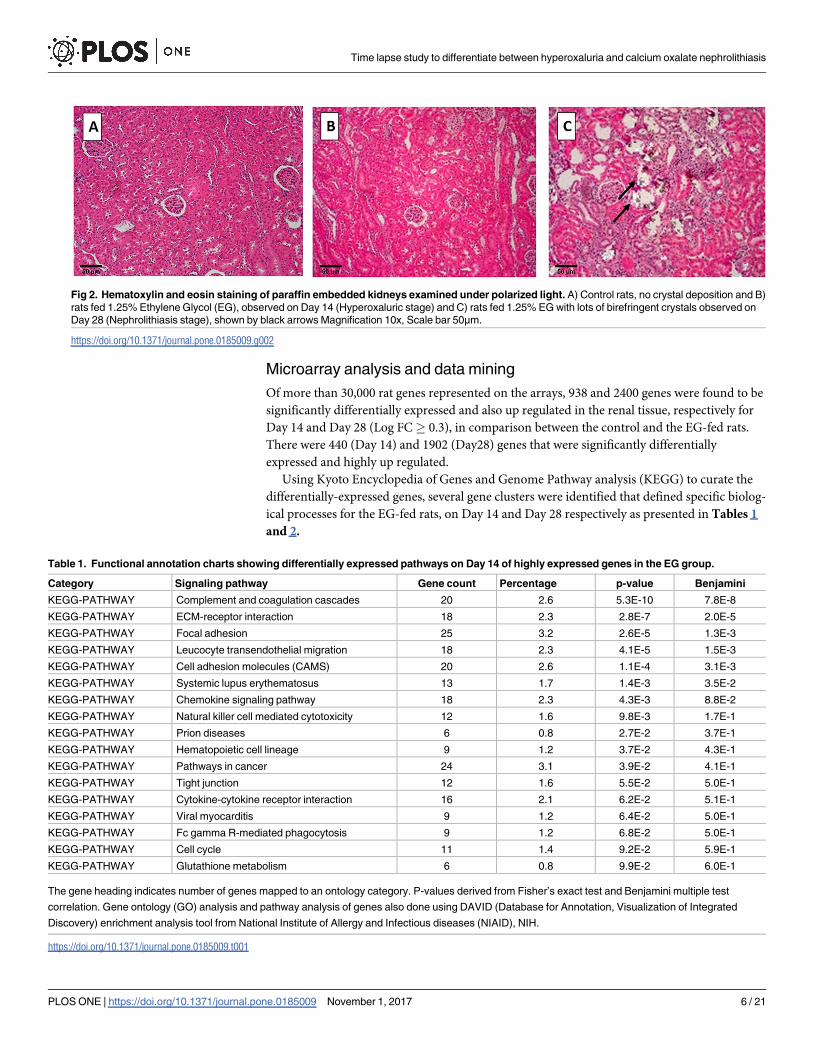
When sacrificed on day 28, kidneys of control rats appeared normal without any crystal
deposits. Kidneys of rats sacrificed on day 14 of EG treatment also did not contain easily
detectable CaOx crystal deposits. However, kidneys of rats sacrificed on day 28 of the EG
administration showed copious amounts of birefringent CaOx crystals in the kidneys (Fig 2).
Most of the crystals were found in the cortex and outer medulla, with few on the inner
medulla. Crystals were generally located in the tubular lumens of the distal tubules and collect-
ing ducts. Most of the renal tubules where crystals were present were distended. Crystal depo-
sition also caused tissue disruption.
Fig 1. Urinary excretion of control and ethylene glycol (EG) treated rats. A) EG fed rats showed significant increase in urinary oxalate (mg/24hrs)
excretion on day 7, 14, 21 and 28 respectively B) Urinary Lactate Dehydrogenase (LDH) was elevated in the EG fed rats on Day 7, 14, 21 and 28 respectively
as compared to the control rats, Cytotoxicity level of LDH was measured as expressed as percentage (%) and C) Urinary Creatinine (mg/24hrs) was
significantly higher on day 21 and 28 in the EG fed rats as compared to the control group. The data was analyzed using Graph Pad Prism with 2-way Analysis
of Variance. *P < 0.05 Control versus EG within the same time period.
https://doi.org/10.1371/journal.pone.0185009.g001
Time lapse study to differentiate between hyperoxaluria and calcium oxalate nephrolithiasis
PLOS ONE | https://doi.org/10.1371/journal.pone.0185009 November 1, 2017 5 / 21
Microarray analysis and data mining
Of more than 30,000 rat genes represented on the arrays, 938 and 2400 genes were found to be
significantly differentially expressed and also up regulated in the renal tissue, respectively for
Day 14 and Day 28 (Log FC� 0.3), in comparison between the control and the EG-fed rats.
There were 440 (Day 14) and 1902 (Day28) genes that were significantly differentially
expressed and highly up regulated.
Using Kyoto Encyclopedia of Genes and Genome Pathway analysis (KEGG) to curate the
differentially-expressed genes, several gene clusters were identified that defined specific biolog-
ical processes for the EG-fed rats, on Day 14 and Day 28 respectively as presented in Tables 1
and 2.
Fig 2. Hematoxylin and eosin staining of paraffin embedded kidneys examined under polarized light. A) Control rats, no crystal deposition and B)
rats fed 1.25% Ethylene Glycol (EG), observed on Day 14 (Hyperoxaluric stage) and C) rats fed 1.25% EG with lots of birefringent crystals observed on
Day 28 (Nephrolithiasis stage), shown by black arrows Magnification 10x, Scale bar 50μm.
https://doi.org/10.1371/journal.pone.0185009.g002
Table 1. Functional annotation charts showing differentially expressed pathways on Day 14 of highly expressed genes in the EG group.
Category Signaling pathway Gene count Percentage p-value Benjamini
KEGG-PATHWAY Complement and coagulation cascades 20 2.6 5.3E-10 7.8E-8
KEGG-PATHWAY ECM-receptor interaction 18 2.3 2.8E-7 2.0E-5
KEGG-PATHWAY Focal adhesion 25 3.2 2.6E-5 1.3E-3
KEGG-PATHWAY Leucocyte transendothelial migration 18 2.3 4.1E-5 1.5E-3
KEGG-PATHWAY Cell adhesion molecules (CAMS) 20 2.6 1.1E-4 3.1E-3
KEGG-PATHWAY Systemic lupus erythematosus 13 1.7 1.4E-3 3.5E-2
KEGG-PATHWAY Chemokine signaling pathway 18 2.3 4.3E-3 8.8E-2
KEGG-PATHWAY Natural killer cell mediated cytotoxicity 12 1.6 9.8E-3 1.7E-1
KEGG-PATHWAY Prion diseases 6 0.8 2.7E-2 3.7E-1
KEGG-PATHWAY Hematopoietic cell lineage 9 1.2 3.7E-2 4.3E-1
KEGG-PATHWAY Pathways in cancer 24 3.1 3.9E-2 4.1E-1
KEGG-PATHWAY Tight junction 12 1.6 5.5E-2 5.0E-1
KEGG-PATHWAY Cytokine-cytokine receptor interaction 16 2.1 6.2E-2 5.1E-1
KEGG-PATHWAY Viral myocarditis 9 1.2 6.4E-2 5.0E-1
KEGG-PATHWAY Fc gamma R-mediated phagocytosis 9 1.2 6.8E-2 5.0E-1
KEGG-PATHWAY Cell cycle 11 1.4 9.2E-2 5.9E-1
KEGG-PATHWAY Glutathione metabolism 6 0.8 9.9E-2 6.0E-1
The gene heading indicates number of genes mapped to an ontology category. P-values derived from Fisher’s exact test and Benjamini multiple test
correlation. Gene ontology (GO) analysis and pathway analysis of genes also done using DAVID (Database for Annotation, Visualization of Integrated
Discovery) enrichment analysis tool from National Institute of Allergy and Infectious diseases (NIAID), NIH.
https://doi.org/10.1371/journal.pone.0185009.t001
Time lapse study to differentiate between hyperoxaluria and calcium oxalate nephrolithiasis
PLOS ONE | https://doi.org/10.1371/journal.pone.0185009 November 1, 2017 6 / 21
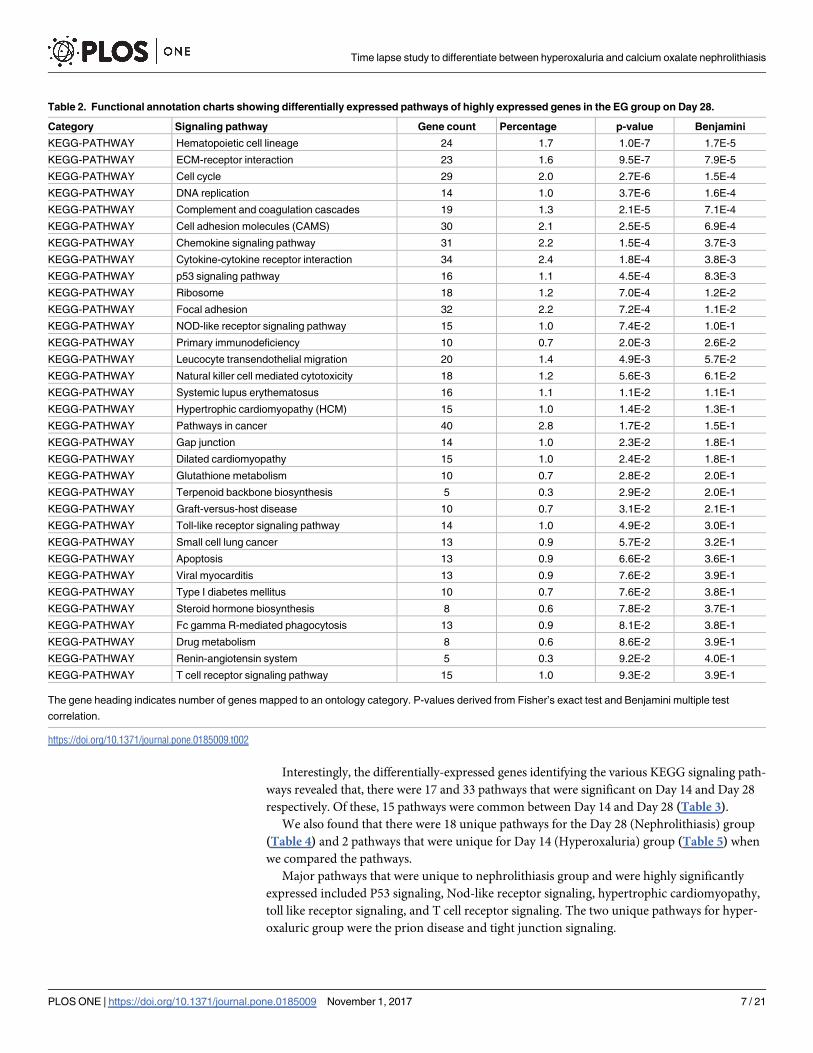
Interestingly, the differentially-expressed genes identifying the various KEGG signaling path-
ways revealed that, there were 17 and 33 pathways that were significant on Day 14 and Day 28
respectively. Of these, 15 pathways were common between Day 14 and Day 28 (Table 3).
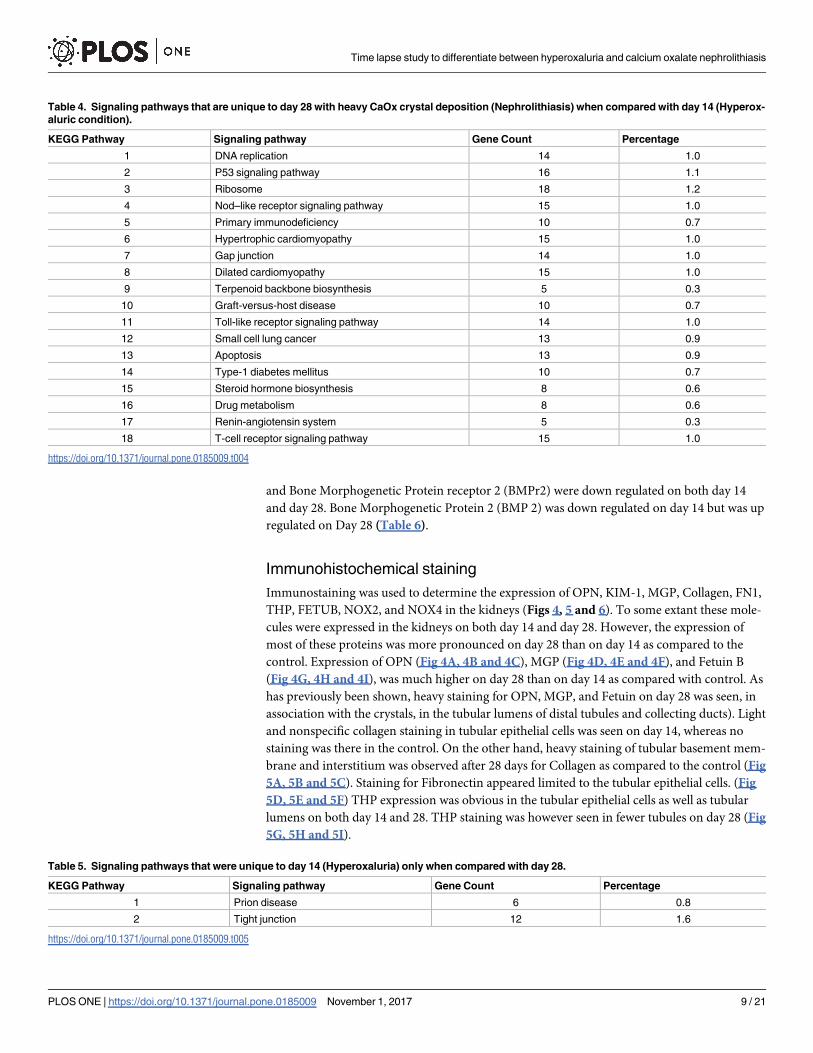
We also found that there were 18 unique pathways for the Day 28 (Nephrolithiasis) group
(Table 4) and 2 pathways that were unique for Day 14 (Hyperoxaluria) group (Table 5) when
we compared the pathways.
Major pathways that were unique to nephrolithiasis group and were highly significantly
expressed included P53 signaling, Nod-like receptor signaling, hypertrophic cardiomyopathy,
toll like receptor signaling, and T cell receptor signaling. The two unique pathways for hyper-
oxaluric group were the prion disease and tight junction signaling.
Table 2. Functional annotation charts showing differentially expressed pathways of highly expressed genes in the EG group on Day 28.
Category Signaling pathway Gene count Percentage p-value Benjamini
KEGG-PATHWAY Hematopoietic cell lineage 24 1.7 1.0E-7 1.7E-5
KEGG-PATHWAY ECM-receptor interaction 23 1.6 9.5E-7 7.9E-5
KEGG-PATHWAY Cell cycle 29 2.0 2.7E-6 1.5E-4
KEGG-PATHWAY DNA replication 14 1.0 3.7E-6 1.6E-4
KEGG-PATHWAY Complement and coagulation cascades 19 1.3 2.1E-5 7.1E-4
KEGG-PATHWAY Cell adhesion molecules (CAMS) 30 2.1 2.5E-5 6.9E-4
KEGG-PATHWAY Chemokine signaling pathway 31 2.2 1.5E-4 3.7E-3
KEGG-PATHWAY Cytokine-cytokine receptor interaction 34 2.4 1.8E-4 3.8E-3
KEGG-PATHWAY p53 signaling pathway 16 1.1 4.5E-4 8.3E-3
KEGG-PATHWAY Ribosome 18 1.2 7.0E-4 1.2E-2
KEGG-PATHWAY Focal adhesion 32 2.2 7.2E-4 1.1E-2
KEGG-PATHWAY NOD-like receptor signaling pathway 15 1.0 7.4E-2 1.0E-1
KEGG-PATHWAY Primary immunodeficiency 10 0.7 2.0E-3 2.6E-2
KEGG-PATHWAY Leucocyte transendothelial migration 20 1.4 4.9E-3 5.7E-2
KEGG-PATHWAY Natural killer cell mediated cytotoxicity 18 1.2 5.6E-3 6.1E-2
KEGG-PATHWAY Systemic lupus erythematosus 16 1.1 1.1E-2 1.1E-1
KEGG-PATHWAY Hypertrophic cardiomyopathy (HCM) 15 1.0 1.4E-2 1.3E-1
KEGG-PATHWAY Pathways in cancer 40 2.8 1.7E-2 1.5E-1
KEGG-PATHWAY Gap junction 14 1.0 2.3E-2 1.8E-1
KEGG-PATHWAY Dilated cardiomyopathy 15 1.0 2.4E-2 1.8E-1
KEGG-PATHWAY Glutathione metabolism 10 0.7 2.8E-2 2.0E-1
KEGG-PATHWAY Terpenoid backbone biosynthesis 5 0.3 2.9E-2 2.0E-1
KEGG-PATHWAY Graft-versus-host disease 10 0.7 3.1E-2 2.1E-1
KEGG-PATHWAY Toll-like receptor signaling pathway 14 1.0 4.9E-2 3.0E-1
KEGG-PATHWAY Small cell lung cancer 13 0.9 5.7E-2 3.2E-1
KEGG-PATHWAY Apoptosis 13 0.9 6.6E-2 3.6E-1
KEGG-PATHWAY Viral myocarditis 13 0.9 7.6E-2 3.9E-1
KEGG-PATHWAY Type I diabetes mellitus 10 0.7 7.6E-2 3.8E-1
KEGG-PATHWAY Steroid hormone biosynthesis 8 0.6 7.8E-2 3.7E-1
KEGG-PATHWAY Fc gamma R-mediated phagocytosis 13 0.9 8.1E-2 3.8E-1
KEGG-PATHWAY Drug metabolism 8 0.6 8.6E-2 3.9E-1
KEGG-PATHWAY Renin-angiotensin system 5 0.3 9.2E-2 4.0E-1
KEGG-PATHWAY T cell receptor signaling pathway 15 1.0 9.3E-2 3.9E-1
The gene heading indicates number of genes mapped to an ontology category. P-values derived from Fisher’s exact test and Benjamini multiple test
correlation.
https://doi.org/10.1371/journal.pone.0185009.t002
Time lapse study to differentiate between hyperoxaluria and calcium oxalate nephrolithiasis
PLOS ONE | https://doi.org/10.1371/journal.pone.0185009 November 1, 2017 7 / 21
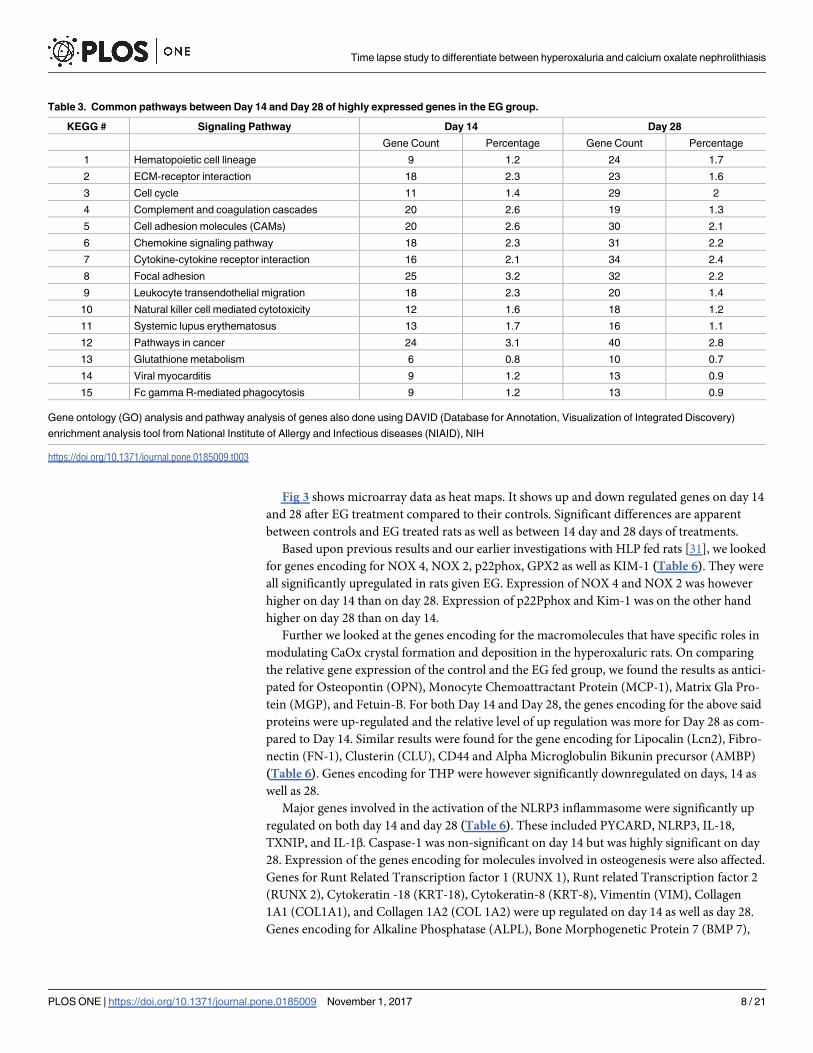
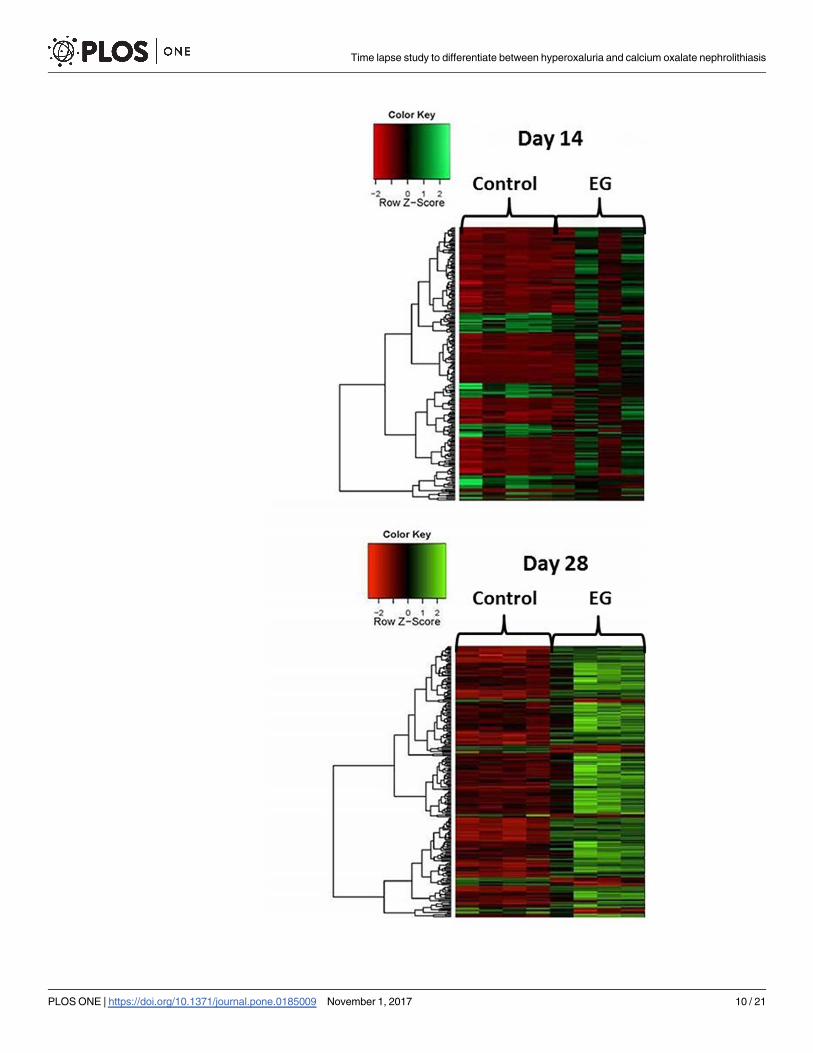
Fig 3 shows microarray data as heat maps. It shows up and down regulated genes on day 14
and 28 after EG treatment compared to their controls. Significant differences are apparent
between controls and EG treated rats as well as between 14 day and 28 days of treatments.
Based upon previous results and our earlier investigations with HLP fed rats [31], we looked
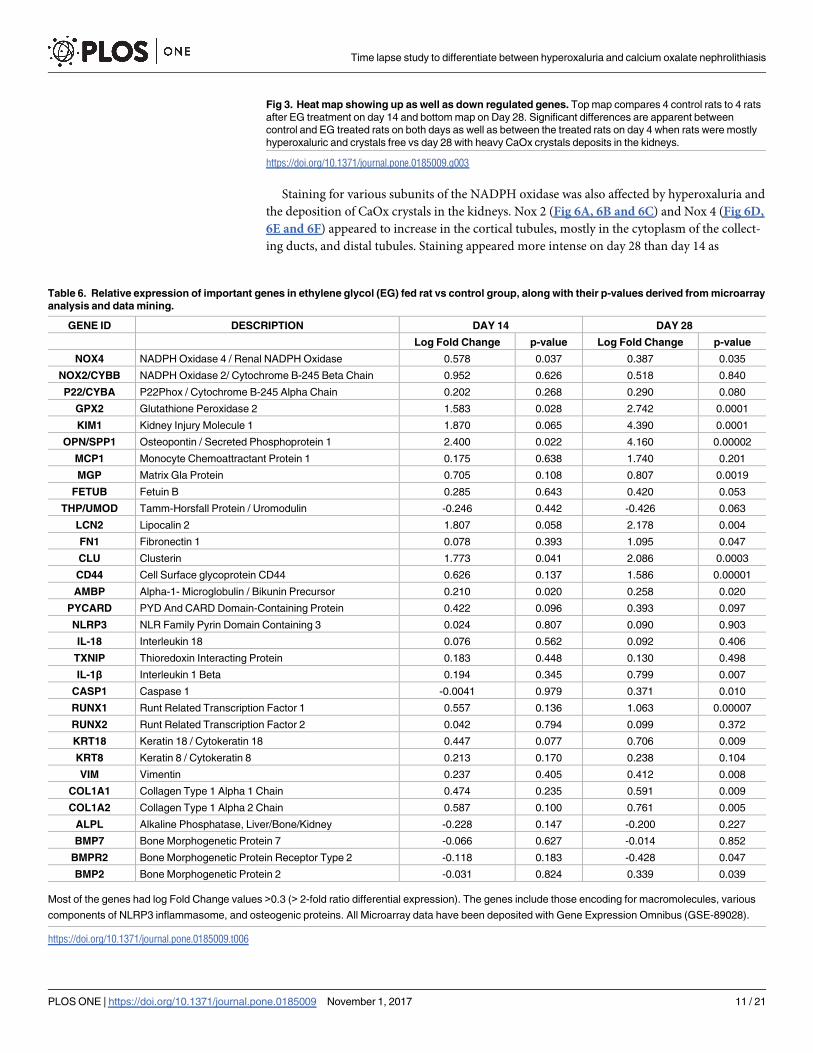
for genes encoding for NOX 4, NOX 2, p22phox, GPX2 as well as KIM-1 (Table 6). They were
all significantly upregulated in rats given EG. Expression of NOX 4 and NOX 2 was however
higher on day 14 than on day 28. Expression of p22Pphox and Kim-1 was on the other hand
higher on day 28 than on day 14.
Further we looked at the genes encoding for the macromolecules that have specific roles in
modulating CaOx crystal formation and deposition in the hyperoxaluric rats. On comparing
the relative gene expression of the control and the EG fed group, we found the results as antici-
pated for Osteopontin (OPN), Monocyte Chemoattractant Protein (MCP-1), Matrix Gla Pro-
tein (MGP), and Fetuin-B. For both Day 14 and Day 28, the genes encoding for the above said
proteins were up-regulated and the relative level of up regulation was more for Day 28 as com-
pared to Day 14. Similar results were found for the gene encoding for Lipocalin (Lcn2), Fibro-
nectin (FN-1), Clusterin (CLU), CD44 and Alpha Microglobulin Bikunin precursor (AMBP)
(Table 6). Genes encoding for THP were however significantly downregulated on days, 14 as
well as 28.
Major genes involved in the activation of the NLRP3 inflammasome were significantly up
regulated on both day 14 and day 28 (Table 6). These included PYCARD, NLRP3, IL-18,
TXNIP, and IL-1β. Caspase-1 was non-significant on day 14 but was highly significant on day
28. Expression of the genes encoding for molecules involved in osteogenesis were also affected.
Genes for Runt Related Transcription factor 1 (RUNX 1), Runt related Transcription factor 2
(RUNX 2), Cytokeratin -18 (KRT-18), Cytokeratin-8 (KRT-8), Vimentin (VIM), Collagen
1A1 (COL1A1), and Collagen 1A2 (COL 1A2) were up regulated on day 14 as well as day 28.
Genes encoding for Alkaline Phosphatase (ALPL), Bone Morphogenetic Protein 7 (BMP 7),
Table 3. Common pathways between Day 14 and Day 28 of highly expressed genes in the EG group.
KEGG # Signaling Pathway Day 14 Day 28
Gene Count Percentage Gene Count Percentage
1 Hematopoietic cell lineage 9 1.2 24 1.7
2 ECM-receptor interaction 18 2.3 23 1.6
3 Cell cycle 11 1.4 29 2
4 Complement and coagulation cascades 20 2.6 19 1.3
5 Cell adhesion molecules (CAMs) 20 2.6 30 2.1
6 Chemokine signaling pathway 18 2.3 31 2.2
7 Cytokine-cytokine receptor interaction 16 2.1 34 2.4
8 Focal adhesion 25 3.2 32 2.2
9 Leukocyte transendothelial migration 18 2.3 20 1.4
10 Natural killer cell mediated cytotoxicity 12 1.6 18 1.2
11 Systemic lupus erythematosus 13 1.7 16 1.1
12 Pathways in cancer 24 3.1 40 2.8
13 Glutathione metabolism 6 0.8 10 0.7
14 Viral myocarditis 9 1.2 13 0.9
15 Fc gamma R-mediated phagocytosis 9 1.2 13 0.9
Gene ontology (GO) analysis and pathway analysis of genes also done using DAVID (Database for Annotation, Visualization of Integrated Discovery)
enrichment analysis tool from National Institute of Allergy and Infectious diseases (NIAID), NIH
https://doi.org/10.1371/journal.pone.0185009.t003
Time lapse study to differentiate between hyperoxaluria and calcium oxalate nephrolithiasis
PLOS ONE | https://doi.org/10.1371/journal.pone.0185009 November 1, 2017 8 / 21
and Bone Morphogenetic Protein receptor 2 (BMPr2) were down regulated on both day 14
and day 28. Bone Morphogenetic Protein 2 (BMP 2) was down regulated on day 14 but was up
regulated on Day 28 (Table 6).
Immunohistochemical staining
Immunostaining was used to determine the expression of OPN, KIM-1, MGP, Collagen, FN1,
THP, FETUB, NOX2, and NOX4 in the kidneys (Figs 4, 5 and 6). To some extant these mole-
cules were expressed in the kidneys on both day 14 and day 28. However, the expression of
most of these proteins was more pronounced on day 28 than on day 14 as compared to the
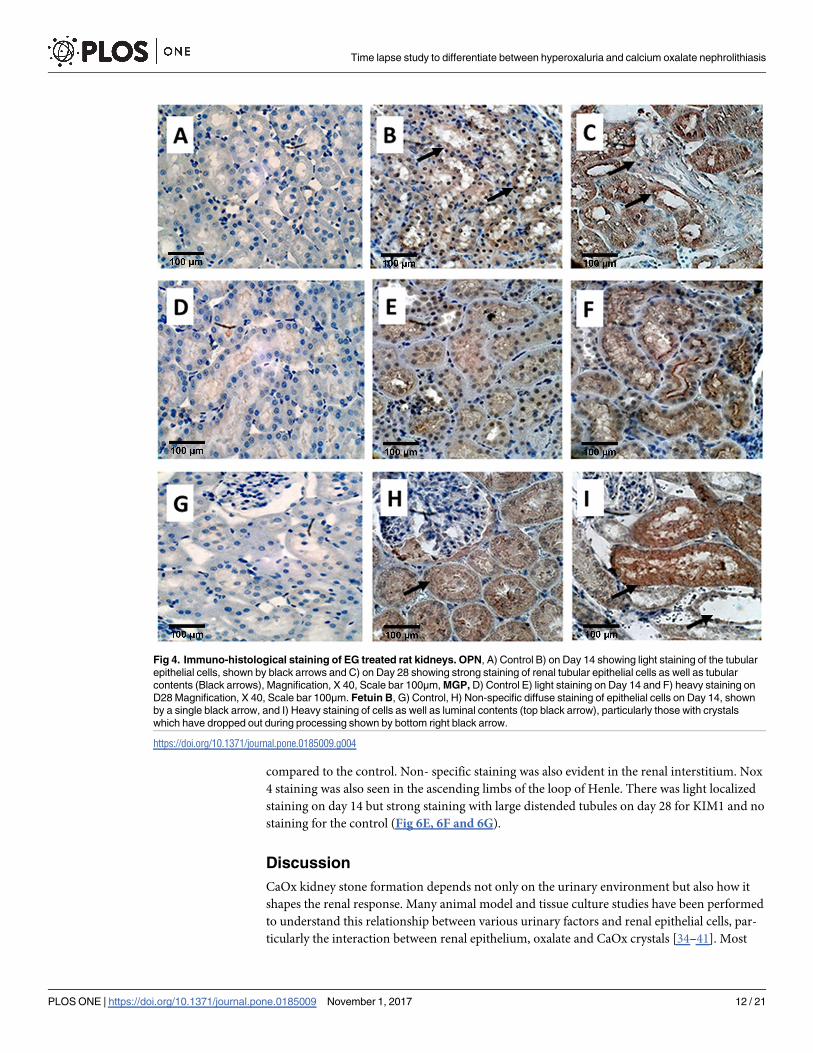
control. Expression of OPN (Fig 4A, 4B and 4C), MGP (Fig 4D, 4E and 4F), and Fetuin B
(Fig 4G, 4H and 4I), was much higher on day 28 than on day 14 as compared with control. As
has previously been shown, heavy staining for OPN, MGP, and Fetuin on day 28 was seen, in
association with the crystals, in the tubular lumens of distal tubules and collecting ducts). Light
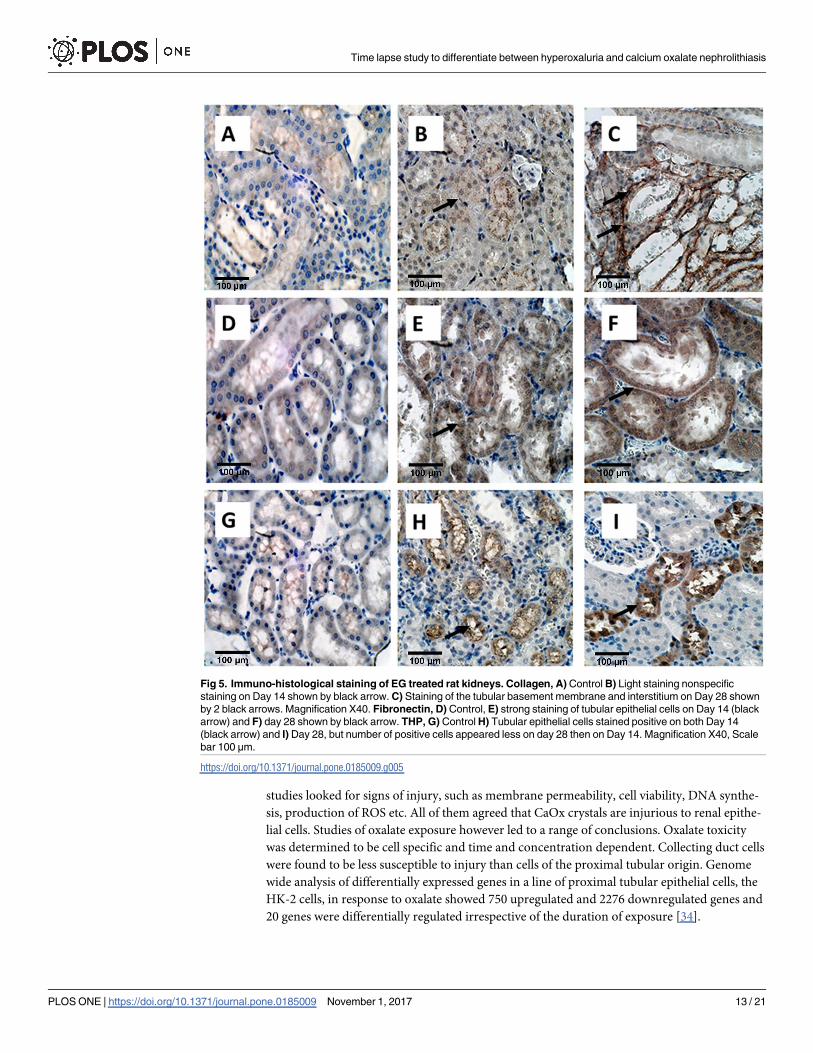
and nonspecific collagen staining in tubular epithelial cells was seen on day 14, whereas no
staining was there in the control. On the other hand, heavy staining of tubular basement mem-
brane and interstitium was observed after 28 days for Collagen as compared to the control (Fig
5A, 5B and 5C). Staining for Fibronectin appeared limited to the tubular epithelial cells. (Fig
5D, 5E and 5F) THP expression was obvious in the tubular epithelial cells as well as tubular
lumens on both day 14 and 28. THP staining was however seen in fewer tubules on day 28 (Fig
5G, 5H and 5I).
Table 4. Signaling pathways that are unique to day 28 with heavy CaOx crystal deposition (Nephrolithiasis) when compared with day 14 (Hyperox-
aluric condition).
KEGG Pathway Signaling pathway Gene Count Percentage
1 DNA replication 14 1.0
2 P53 signaling pathway 16 1.1
3 Ribosome 18 1.2
4 Nod–like receptor signaling pathway 15 1.0
5 Primary immunodeficiency 10 0.7
6 Hypertrophic cardiomyopathy 15 1.0
7 Gap junction 14 1.0
8 Dilated cardiomyopathy 15 1.0
9 Terpenoid backbone biosynthesis 5 0.3
10 Graft-versus-host disease 10 0.7
11 Toll-like receptor signaling pathway 14 1.0
12 Small cell lung cancer 13 0.9
13 Apoptosis 13 0.9
14 Type-1 diabetes mellitus 10 0.7
15 Steroid hormone biosynthesis 8 0.6
16 Drug metabolism 8 0.6
17 Renin-angiotensin system 5 0.3
18 T-cell receptor signaling pathway 15 1.0
https://doi.org/10.1371/journal.pone.0185009.t004
Table 5. Signaling pathways that were unique to day 14 (Hyperoxaluria) only when compared with day 28.
KEGG Pathway Signaling pathway Gene Count Percentage
1 Prion disease 6 0.8
2 Tight junction 12 1.6
https://doi.org/10.1371/journal.pone.0185009.t005
Time lapse study to differentiate between hyperoxaluria and calcium oxalate nephrolithiasis
PLOS ONE | https://doi.org/10.1371/journal.pone.0185009 November 1, 2017 9 / 21
Time lapse study to differentiate between hyperoxaluria and calcium oxalate nephrolithiasis
PLOS ONE | https://doi.org/10.1371/journal.pone.0185009 November 1, 2017 10 / 21
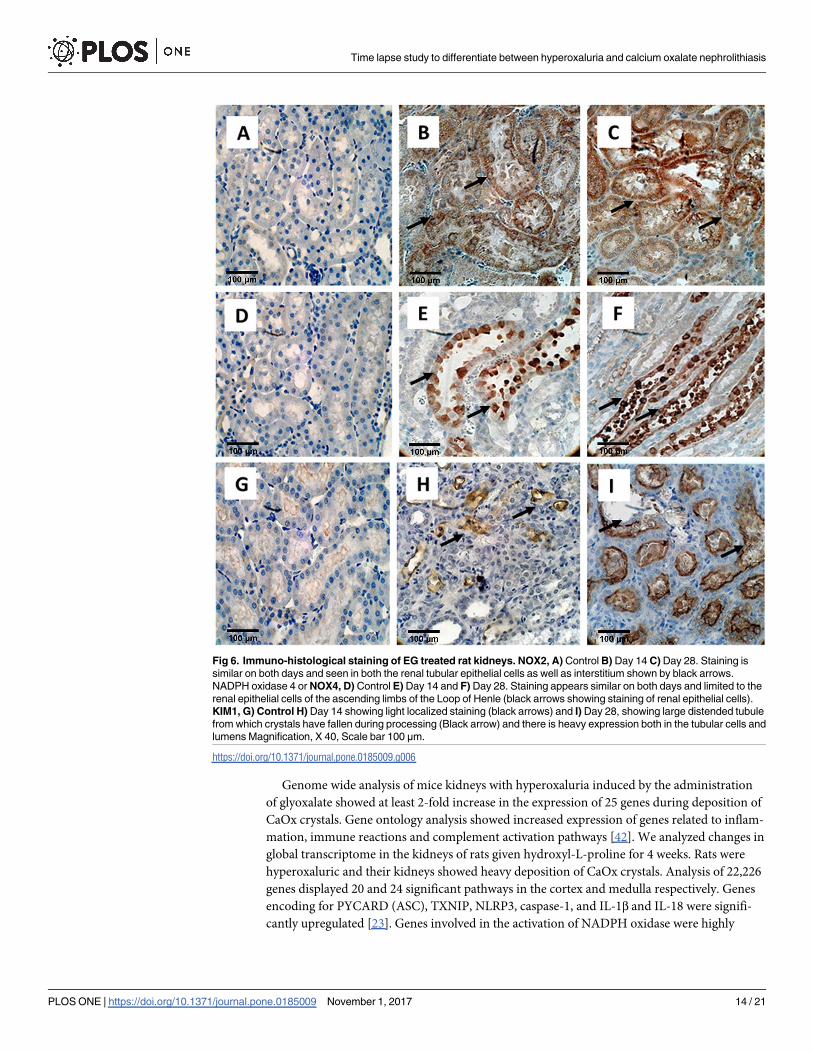
Staining for various subunits of the NADPH oxidase was also affected by hyperoxaluria and
the deposition of CaOx crystals in the kidneys. Nox 2 (Fig 6A, 6B and 6C) and Nox 4 (Fig 6D,
6E and 6F) appeared to increase in the cortical tubules, mostly in the cytoplasm of the collect-
ing ducts, and distal tubules. Staining appeared more intense on day 28 than day 14 as
Fig 3. Heat map showing up as well as down regulated genes. Top map compares 4 control rats to 4 rats
after EG treatment on day 14 and bottom map on Day 28. Significant differences are apparent between
control and EG treated rats on both days as well as between the treated rats on day 4 when rats were mostly
hyperoxaluric and crystals free vs day 28 with heavy CaOx crystals deposits in the kidneys.
https://doi.org/10.1371/journal.pone.0185009.g003
Table 6. Relative expression of important genes in ethylene glycol (EG) fed rat vs control group, along with their p-values derived from microarray
analysis and data mining.
GENE ID DESCRIPTION DAY 14 DAY 28
Log Fold Change p-value Log Fold Change p-value
NOX4 NADPH Oxidase 4 / Renal NADPH Oxidase 0.578 0.037 0.387 0.035
NOX2/CYBB NADPH Oxidase 2/ Cytochrome B-245 Beta Chain 0.952 0.626 0.518 0.840
P22/CYBA P22Phox / Cytochrome B-245 Alpha Chain 0.202 0.268 0.290 0.080
GPX2 Glutathione Peroxidase 2 1.583 0.028 2.742 0.0001
KIM1 Kidney Injury Molecule 1 1.870 0.065 4.390 0.0001
OPN/SPP1 Osteopontin / Secreted Phosphoprotein 1 2.400 0.022 4.160 0.00002
MCP1 Monocyte Chemoattractant Protein 1 0.175 0.638 1.740 0.201
MGP Matrix Gla Protein 0.705 0.108 0.807 0.0019
FETUB Fetuin B 0.285 0.643 0.420 0.053
THP/UMOD Tamm-Horsfall Protein / Uromodulin -0.246 0.442 -0.426 0.063
LCN2 Lipocalin 2 1.807 0.058 2.178 0.004
FN1 Fibronectin 1 0.078 0.393 1.095 0.047
CLU Clusterin 1.773 0.041 2.086 0.0003
CD44 Cell Surface glycoprotein CD44 0.626 0.137 1.586 0.00001
AMBP Alpha-1- Microglobulin / Bikunin Precursor 0.210 0.020 0.258 0.020
PYCARD PYD And CARD Domain-Containing Protein 0.422 0.096 0.393 0.097
NLRP3 NLR Family Pyrin Domain Containing 3 0.024 0.807 0.090 0.903
IL-18 Interleukin 18 0.076 0.562 0.092 0.406
TXNIP Thioredoxin Interacting Protein 0.183 0.448 0.130 0.498
IL-1β Interleukin 1 Beta 0.194 0.345 0.799 0.007
CASP1 Caspase 1 -0.0041 0.979 0.371 0.010
RUNX1 Runt Related Transcription Factor 1 0.557 0.136 1.063 0.00007
RUNX2 Runt Related Transcription Factor 2 0.042 0.794 0.099 0.372
KRT18 Keratin 18 / Cytokeratin 18 0.447 0.077 0.706 0.009
KRT8 Keratin 8 / Cytokeratin 8 0.213 0.170 0.238 0.104
VIM Vimentin 0.237 0.405 0.412 0.008
COL1A1 Collagen Type 1 Alpha 1 Chain 0.474 0.235 0.591 0.009
COL1A2 Collagen Type 1 Alpha 2 Chain 0.587 0.100 0.761 0.005
ALPL Alkaline Phosphatase, Liver/Bone/Kidney -0.228 0.147 -0.200 0.227
BMP7 Bone Morphogenetic Protein 7 -0.066 0.627 -0.014 0.852
BMPR2 Bone Morphogenetic Protein Receptor Type 2 -0.118 0.183 -0.428 0.047
BMP2 Bone Morphogenetic Protein 2 -0.031 0.824 0.339 0.039
Most of the genes had log Fold Change values >0.3 (> 2-fold ratio differential expression). The genes include those encoding for macromolecules, various
components of NLRP3 inflammasome, and osteogenic proteins. All Microarray data have been deposited with Gene Expression Omnibus (GSE-89028).
https://doi.org/10.1371/journal.pone.0185009.t006
Time lapse study to differentiate between hyperoxaluria and calcium oxalate nephrolithiasis
PLOS ONE | https://doi.org/10.1371/journal.pone.0185009 November 1, 2017 11 / 21
compared to the control. Non- specific staining was also evident in the renal interstitium. Nox
4 staining was also seen in the ascending limbs of the loop of Henle. There was light localized
staining on day 14 but strong staining with large distended tubules on day 28 for KIM1 and no
staining for the control (Fig 6E, 6F and 6G).
Discussion
CaOx kidney stone formation depends not only on the urinary environment but also how it
shapes the renal response. Many animal model and tissue culture studies have been performed
to understand this relationship between various urinary factors and renal epithelial cells, par-
ticularly the interaction between renal epithelium, oxalate and CaOx crystals [34–41]. Most
Fig 4. Immuno-histological staining of EG treated rat kidneys. OPN, A) Control B) on Day 14 showing light staining of the tubular
epithelial cells, shown by black arrows and C) on Day 28 showing strong staining of renal tubular epithelial cells as well as tubular
contents (Black arrows), Magnification, X 40, Scale bar 100μm, MGP, D) Control E) light staining on Day 14 and F) heavy staining on
D28 Magnification, X 40, Scale bar 100μm. Fetuin B, G) Control, H) Non-specific diffuse staining of epithelial cells on Day 14, shown
by a single black arrow, and I) Heavy staining of cells as well as luminal contents (top black arrow), particularly those with crystals
which have dropped out during processing shown by bottom right black arrow.
https://doi.org/10.1371/journal.pone.0185009.g004
Time lapse study to differentiate between hyperoxaluria and calcium oxalate nephrolithiasis
PLOS ONE | https://doi.org/10.1371/journal.pone.0185009 November 1, 2017 12 / 21
studies looked for signs of injury, such as membrane permeability, cell viability, DNA synthe-
sis, production of ROS etc. All of them agreed that CaOx crystals are injurious to renal epithe-
lial cells. Studies of oxalate exposure however led to a range of conclusions. Oxalate toxicity
was determined to be cell specific and time and concentration dependent. Collecting duct cells
were found to be less susceptible to injury than cells of the proximal tubular origin. Genome
wide analysis of differentially expressed genes in a line of proximal tubular epithelial cells, the
HK-2 cells, in response to oxalate showed 750 upregulated and 2276 downregulated genes and
20 genes were differentially regulated irrespective of the duration of exposure [34].
Fig 5. Immuno-histological staining of EG treated rat kidneys. Collagen, A) Control B) Light staining nonspecific
staining on Day 14 shown by black arrow. C) Staining of the tubular basement membrane and interstitium on Day 28 shown
by 2 black arrows. Magnification X40. Fibronectin, D) Control, E) strong staining of tubular epithelial cells on Day 14 (black
arrow) and F) day 28 shown by black arrow. THP, G) Control H) Tubular epithelial cells stained positive on both Day 14
(black arrow) and I) Day 28, but number of positive cells appeared less on day 28 then on Day 14. Magnification X40, Scale
bar 100 μm.
https://doi.org/10.1371/journal.pone.0185009.g005
Time lapse study to differentiate between hyperoxaluria and calcium oxalate nephrolithiasis
PLOS ONE | https://doi.org/10.1371/journal.pone.0185009 November 1, 2017 13 / 21
Genome wide analysis of mice kidneys with hyperoxaluria induced by the administration
of glyoxalate showed at least 2-fold increase in the expression of 25 genes during deposition of
CaOx crystals. Gene ontology analysis showed increased expression of genes related to inflam-
mation, immune reactions and complement activation pathways [42]. We analyzed changes in
global transcriptome in the kidneys of rats given hydroxyl-L-proline for 4 weeks. Rats were
hyperoxaluric and their kidneys showed heavy deposition of CaOx crystals. Analysis of 22,226
genes displayed 20 and 24 significant pathways in the cortex and medulla respectively. Genes
encoding for PYCARD (ASC), TXNIP, NLRP3, caspase-1, and IL-1β and IL-18 were signifi-
cantly upregulated [23]. Genes involved in the activation of NADPH oxidase were highly
Fig 6. Immuno-histological staining of EG treated rat kidneys. NOX2, A) Control B) Day 14 C) Day 28. Staining is
similar on both days and seen in both the renal tubular epithelial cells as well as interstitium shown by black arrows.
NADPH oxidase 4 or NOX4, D) Control E) Day 14 and F) Day 28. Staining appears similar on both days and limited to the
renal epithelial cells of the ascending limbs of the Loop of Henle (black arrows showing staining of renal epithelial cells).
KIM1, G) Control H) Day 14 showing light localized staining (black arrows) and I) Day 28, showing large distended tubule
from which crystals have fallen during processing (Black arrow) and there is heavy expression both in the tubular cells and
lumens Magnification, X 40, Scale bar 100 μm.
https://doi.org/10.1371/journal.pone.0185009.g006
Time lapse study to differentiate between hyperoxaluria and calcium oxalate nephrolithiasis
PLOS ONE | https://doi.org/10.1371/journal.pone.0185009 November 1, 2017 14 / 21
expressed with concurrent decrease in the expression of genes encoding for ROS scavenger
proteins [31]. Expression of genes involved in the epithelial transformation and bone morpho-
genesis was also altered [28]. In addition, CaOx nephrolithiasis affected the expression of
genes encoding for various crystallization modulators [27].
In the present study, we investigated differences in renal response to continuous exposure
to high oxalate with or without the deposition of CaOx crystals by analyzing changes in global
transcriptome of renal tissue, following EG induced hyperoxaluria in male rats. Emphasis was
placed on the genes and pathways involved in the production of reactive oxygen species, crys-
tallization modulators, development of inflammation and osteogenesis. We looked at the rela-
tive gene expression in hyperoxaluric and nephrolithic kidneys compared to the control group
to determine the signaling pathways activated during hyperoxaluria and nephrolithiasis to bet-
ter understand the pathophysiology of oxalate induced diseases of the kidneys. 15 pathways
were common between hyperoxaluric and nephrolithic kidneys. Interesting thing to observe
was that 18 unique pathways became significant only in nephrolithic kidneys while only 2
unique pathways were significant in the hyperoxaluric kidneys. Unique pathways in the
nephrolithic rats included Nod-like receptor pathway which involves NFκB signaling, MAPK
signaling, apoptosis and activation of inflammasomes. Our previous study has already shown
the involvement and activation of the Renin-angiotensin pathway along with DAG/PKC path-
way of neutrophil activation [31].
Our study also considered important set of genes involved in the activation of NLRP3
(NACHT, LLR and PYD domains containing protein 3). We saw significant up regulation of
genes encoding for PYCARD (PYD and CARD domain containing) also known as ASC (Apo-
ptosis Associated Spec like protein), Caspase 1, IL-18 (Interleukin-18), TXNIP (Thioredoxin
Interacting Protein), and IL-1β. Relative gene expression for Caspase-1 and IL-1β was, how-
ever, not significant at day 14 but when crystals were formed around day 28 we saw highly sig-
nificant gene expression. Caspase-1 and IL-1β are important end products of NLRP3
inflammasome activation [43]. This indicates that inflammation pathways are activated during
crystal formation as compared to hyperoxaluric conditions as shown in this study.
We further looked at genes encoding for proteins responsible for epithelial to osteogenic
transformation including Runx-1 (Runt-related transcription factor-1), Runx-2, ALPL (Alka-
line phosphatase), Bone morphogenetic proteins (BMP) genes such as BMP-2, BMP-7, BMPr2
as well as Cytokeratin’s such as KRT 8, KRT 18, Vimentin (VIM), Fibronectin (Fn-1), Collagen
1a (COL1a1) and COL1a2. Genes encoding for Runx1, Runx2, KRT 18, KRT 8, VIM, Fn-1,
Col1a1 and Col1a2 were up regulated during hyperoxaluric conditions and further increased
after crystal deposition or nephrolithiasis. Gene encoding for ALPL (Alkaline Phosphatase)
was down regulated as shown in our previous study [28].
As mentioned earlier, CaOx nephrolithiasis in a rat model is associated with the activation
of NADPH oxidase, production of ROS, development of oxidative stress and renal injury
[22,44,45]. In our current study, Nox 2, Nox 4 as well as P22 were upregulated during hyperox-
aluria as well as during nephrolithiasis suggesting early activation of NADPH oxidase. KIM-1,
a recognized marker of renal injury [46], was highly expressed at both the gene and protein
levels during nephrolithiasis. Glutathione Peroxidase (Gpx) is an antioxidant enzyme that is
highly expressed in the kidney and removes peroxides and peroxynitrite that can cause renal
damage. During oxidative stress, there is an increased expression of Gpx as shown previously.
In our data, Gpx 2 was highly upregulated in the kidneys particularly during nephrolithiasis.
Results indicate that CaOx crystals are more injurious to the kidneys.
Results also showed increased urinary excretion of LDH, a marker of membrane permeabil-
ity and damage. The increase was evident early during hyperoxaluria indicating that oxalate
alone can induce changes in the renal epithelial cells. Urinary creatinine levels were not
Time lapse study to differentiate between hyperoxaluria and calcium oxalate nephrolithiasis
PLOS ONE | https://doi.org/10.1371/journal.pone.0185009 November 1, 2017 15 / 21
affected during hyperoxaluria but increased after crystal deposition, highly significantly so on
day 28 indicating renal damage.
As shown in previous studies [27,31] many macromolecular crystallization modulators are
upregulated when renal epithelial cells are exposed to oxalate and CaOx crystals [24–27,47–
49]. Results of our present study show that OPN, MGP, Fetuin B, Fn1, CD 44, Clusterin, Biku-
nin/AMBP genes are upregulated during hyperoxaluria and further increased with crystal
deposition. Osteopontin is one of the most studied macromolecular modulator of CaOx and
Calcium Phosphate (CaP) stone formation and plays a vital role in bio mineralization and
crystallization of CaOx and CaP kidney stones [50–55]. Matrix Gla Protein (MGP) also known
as the cell growth-inhibiting gene 36 protein is a vitamin K dependent protein whose main
role is inhibitor of bone formation/vascular calcification [56]. Previous studies have shown
increased expression of MGP in renal tubules of hyperoxaluric rats [57,58], as well as renal epi-
thelial cell lines NRK-52E and MDCK on exposure to oxalate and CaOx crystals [58,59].
Fetuin-A and B are expressed in humans, rats and mice at both the mRNA and protein levels
[60]. Both actively inhibit precipitation of basic calcium phosphate in vitro. Fetuin A is consid-
ered an important inhibitor of pathological calcification in the humans [61]. Fetuin A deficient
mice develop soft tissue calcification, including nephrocalcinosis [62]. The role of fetuin in
kidney stone formation has not been analytically examined; however, it has been reported that
kidney stone patients have lower urinary Fetuin A levels than normal controls [63].
Clusterin, like Kim-1, is expressed on the tubular cells after kidney injury and is also
induced in polycystic kidney disease [64], and renal cell carcinoma [65]. CD44 is a cell surface
receptor of OPN and has been shown to be highly expressed during injury, inflammation and
wound healing and plays a role in formation of peri cellular matrix on surface of proliferating
and migrating cells. CD44 has been shown to be increased in the kidneys of hyperoxaluric rats
[16]. The AMBP gene encodes for Bikunin and α1-microglobulin, both inhibitors of CaOx
crystallization [66,67]. Previous studies have shown that expression of AMBP was increased in
the renal tubular cells of hyperoxaluric rats [18,68]. Bikunin mRNA expression was increased
when renal epithelial cells were exposed to oxalate and CaOx crystals [69]. Our microarray
data also showed up regulation of AMBP gene in the hyperoxaluric rats. Fibronectin is a
known inhibitor of CaOx kidney stones [70]. Previous studies based on microarray analysis of
genes in renal epithelial cells exposed to CaOx crystals have shown high expression of Fibro-
nectin [42,71,72]. Our study based on microarray analysis of genes obtained from the kidney
of hyperoxaluric rat showed comparable results.
Studies have shown that renal epithelial cells on exposure to oxalate/CaOx crystals produce
inflammatory molecules such as Monocyte Chemoattractant Protein (MCP-1) [73]. MCP-1 or
Ccl2 (Chemokine -CC motif Ligand 2) recruits monocytes, T-cells and dendritic cells at site of
renal injury/inflammation and plays a significant role in the progression of renal failure.
Results of this study show that MCP-1 was only slightly increased during hyperoxaluria, but
highly expressed in the kidneys with CaOx crystals indicating that crystal exposure plays a key
role in its expression.
Lipocalin 2 (Lcn 2) also known as Neutrophil Gelatinase-Associated Lipocalin or NGAL is
a critical inflammatory mediator, contributing to tubular damage and kidney failure [74]. In
our data, Lcn2 was highly up regulated, indicating tubular damage due to CaOx crystals.
Interestingly THP gene was downregulated during hyperoxaluria as well as CaOx nephro-
lithiasis. Similar results were obtained in our previous study using hydroxyl-L-proline as a
hyperoxaluria inducing agent [27], as well as another study where EG was used to induce
hyperoxaluria [75]. Inactivation of THP gene increases the frequency and severity of CaOx
crystal deposition during EG induced hyperoxaluria, compared to the wild type control mice.
Time lapse study to differentiate between hyperoxaluria and calcium oxalate nephrolithiasis
PLOS ONE | https://doi.org/10.1371/journal.pone.0185009 November 1, 2017 16 / 21
In addition absence of THP leads to OPN induction suggesting that THP serves as a constitu-
tive inhibitor of crystallization while OPN may act as an inducible inhibitor [76].
In this study, we identified 15 pathways that were common between the hyperoxaluria (day
14) and nephrolithiasis (day 28) (Table 3). These common pathways do provide an up or
down stream response to development of hyperoxaluria and subsequently CaOx crystal forma-
tion. Looking at the common pathways we see a number of immunological and pathological
changes taking place in various cells of the renal tissue in response to an oxalate load. After the
onset of hyperoxaluria, we see up regulation of different signaling pathways including the
extracellular matrix, complement and coagulation cascades, cell adhesion molecules, focal
adhesion and pathways in cancer, to name a few. We observe that the immune response of the
animal is triggered as evident by the activation of signaling pathways such as chemokine sig-
naling pathway, cytokine-cytokine receptor interaction, leukocyte transendothelial migration,
natural killer cell mediated cytotoxicity, and Fc Gamma R-mediated phagocytosis. These path-
ways remain active and significantly expressed till crystal formation stage.
There were 18 unique pathways that were significantly expressed after or during the onset
of crystals as shown in Table 4. These pathways include but are not limited to P53 signaling
which can be triggered due to different stress signal and may result in cell cycle arrest and apo-
ptosis, Nod-like receptor signaling which leads to the activation of various proinflammatory
cytokines such as IL-18 and IL1-β, after the activation of various inflammasomes, Hypertro-
phic cardiomyopathy, dilated cardiomyopathy, Toll-like receptor signaling pathway, T-cell
receptor signaling pathway and Renin-angiotensin system pathway. These unique pathways
give us an insight into how to differentiate between the renal consequences of hyperoxaluria
and nephrolithiasis.
Conclusions
This transcriptional study of the ethylene glycol fed rat hyperoxaluric model at two different
time intervals provides a better insight on the different pathways involved in hyperoxaluria
and CaOx crystal deposition in the EG fed rat kidneys. Hyperoxaluria alone upregulates sev-
eral genes, but crystal deposition further increases their expression. Hyperoxaluria is also asso-
ciated with the activation of NADPH oxidase which generally leads to the production of ROS
[44,77]. In addition crystal deposition is associated with substantially increased renal expres-
sion of KIM-1, and its urinary excretion [29], which is a well-recognized sign of renal injury
[44]. Hyperoxaluria alone did not cause a change in urinary excretion of creatinine which was
significantly increased after crystal deposition indicating renal damage. Apparently changes
brought about by the exposure to oxalate without crystal deposition are not sufficient for
noticeable renal injury. ROS produced during hyperoxaluria are most likely taken care of by
antioxidant defense of the kidneys such as the upregulation of glutathione peroxidase as seen
here.
Acknowledgments
The authors thank Dr. Jin Yao and Dr. Yijun Sun from the University of Florida’s Interdisci-
plinary Center for Biotechnology Research (ICBR) for running the microarrays and data anal-
yses, Dr. Ammon B. Peck for his advice and suggestions during studies, and Dr. Vineet Sangar
from Institute of Systems Biology (ISB), Seattle, WA for providing expert assistance in data
analysis and Bioinformatics. Supported by National Institutes of Health grant #RO1-DK078602,
DK092311 and University of Florida Center for the Study of Lithiasis. The funders had no
role in study design, data collection and analysis, decision to publish, or preparation of the
manuscript.
Time lapse study to differentiate between hyperoxaluria and calcium oxalate nephrolithiasis
PLOS ONE | https://doi.org/10.1371/journal.pone.0185009 November 1, 2017 17 / 21
Author Contributions
Conceptualization: Sunil Joshi, Saeed R. Khan.
Data curation: Sunil Joshi, Wei Wang, Saeed R. Khan.
Formal analysis: Sunil Joshi, Wei Wang.
Funding acquisition: Saeed R. Khan.
Investigation: Saeed R. Khan.
Methodology: Sunil Joshi, Wei Wang.
Project administration: Saeed R. Khan.
Resources: Saeed R. Khan.
Software: Sunil Joshi, Wei Wang.
Supervision: Sunil Joshi, Saeed R. Khan.
Validation: Saeed R. Khan.
Visualization: Saeed R. Khan.
Writing – original draft: Sunil Joshi.
Writing – review & editing: Sunil Joshi, Saeed R. Khan.
References1. Holmes RP, Ambrosius WT, Assimos DG (2005) Dietary oxalate loads and renal oxalate handling. J
Urol 174: 943–947; discussion 947. https://doi.org/10.1097/01.ju.0000169476.85935.e2 PMID:
16094002
2. Asplin JR (2002) Hyperoxaluric calcium nephrolithiasis. Endocrinol Metab Clin North Am 31: 927–949.
PMID: 12474639
3. Joshi S, Peck AB, Khan SR (2013) NADPH oxidase as a therapeutic target for oxalate induced injury in
kidneys. Oxid Med Cell Longev 2013: 462361. https://doi.org/10.1155/2013/462361 PMID: 23840917
4. Holmes RP, Kennedy M (2000) Estimation of the oxalate content of foods and daily oxalate intake. Kid-
ney Int 57: 1662–1667. https://doi.org/10.1046/j.1523-1755.2000.00010.x PMID: 10760101
5. Monico CG, Persson M, Ford GC, Rumsby G, Milliner DS (2002) Potential mechanisms of marked
hyperoxaluria not due to primary hyperoxaluria I or II. Kidney Int 62: 392–400. https://doi.org/10.1046/j.
1523-1755.2002.00468.x PMID: 12110000
6. Canales BK, Reyes L, Reinhard MK, Khan SR, Goncalves CG, et al. (2012) Renal glomerular and tubu-
lar injury after gastric bypass in obese rats. Nutrition 28: 76–80. https://doi.org/10.1016/j.nut.2011.03.
003 PMID: 21723091
7. Stamatelou KK, Francis ME, Jones CA, Nyberg LM, Curhan GC (2003) Time trends in reported preva-
lence of kidney stones in the United States: 1976–1994. Kidney Int 63: 1817–1823. https://doi.org/10.
1046/j.1523-1755.2003.00917.x PMID: 12675858
8. Scales CD Jr., Smith AC, Hanley JM, Saigal CS (2012) Prevalence of kidney stones in the United
States. Eur Urol 62: 160–165. https://doi.org/10.1016/j.eururo.2012.03.052 PMID: 22498635
9. Rule AD, Roger VL, Melton LJ 3rd, Bergstralh EJ, Li X, et al. (2010) Kidney stones associate with
increased risk for myocardial infarction. J Am Soc Nephrol 21: 1641–1644. https://doi.org/10.1681/
ASN.2010030253 PMID: 20616170
10. Khan SR (2012) Is oxidative stress, a link between nephrolithiasis and obesity, hypertension, diabetes,
chronic kidney disease, metabolic syndrome? Urol Res 40: 95–112. https://doi.org/10.1007/s00240-
011-0448-9 PMID: 22213019
11. Jungers P, Joly D, Barbey F, Choukroun G, Daudon M (2004) ESRD caused by nephrolithiasis: preva-
lence, mechanisms, and prevention. Am J Kidney Dis 44: 799–805. PMID: 15492945
12. Rule AD, Bergstralh EJ, Melton LJ 3rd, Li X, Weaver AL, et al. (2009) Kidney stones and the risk for
chronic kidney disease. Clin J Am Soc Nephrol 4: 804–811. https://doi.org/10.2215/CJN.05811108
PMID: 19339425
Time lapse study to differentiate between hyperoxaluria and calcium oxalate nephrolithiasis
PLOS ONE | https://doi.org/10.1371/journal.pone.0185009 November 1, 2017 18 / 21

13. Khan SR, Glenton PA (2010) Experimental induction of calcium oxalate nephrolithiasis in mice. J Urol
184: 1189–1196. https://doi.org/10.1016/j.juro.2010.04.065 PMID: 20663521
14. Khan SR (1997) Animal models of kidney stone formation: an analysis. World J Urol 15: 236–243.
PMID: 9280052
15. Mandel NS, Henderson JD Jr., Hung LY, Wille DF, Wiessner JH (2004) A porcine model of calcium oxa-
late kidney stone disease. J Urol 171: 1301–1303. https://doi.org/10.1097/01.ju.0000110101.41653.bb
PMID: 14767337
16. Khan SR, Glenton PA, Byer KJ (2006) Modeling of hyperoxaluric calcium oxalate nephrolithiasis: exper-
imental induction of hyperoxaluria by hydroxy-L-proline. Kidney Int 70: 914–923. https://doi.org/10.
1038/sj.ki.5001699 PMID: 16850024
17. Umekawa T, Hatanaka Y, Kurita T, Khan SR (2004) Effect of angiotensin II receptor blockage on osteo-
pontin expression and calcium oxalate crystal deposition in rat kidneys. J Am Soc Nephrol 15: 635–
644. PMID: 14978165
18. Iida S, Peck AB, Johnson-Tardieu J, Moriyama M, Glenton PA, et al. (1999) Temporal changes in
mRNA expression for bikunin in the kidneys of rats during calcium oxalate nephrolithiasis. J Am Soc
Nephrol 10: 986–996. PMID: 10232684
19. Moriyama MT, Glenton PA, Khan SR (2001) Expression of inter-alpha inhibitor related proteins in kid-
neys and urine of hyperoxaluric rats. J Urol 165: 1687–1692. PMID: 11342956
20. Gokhale JA, Glenton PA, Khan SR (2001) Characterization of Tamm-Horsfall protein in a rat nephro-
lithiasis model. J Urol 166: 1492–1497. PMID: 11547119
21. Huang HS, Ma MC, Chen J, Chen CF (2002) Changes in the oxidant-antioxidant balance in the kidney
of rats with nephrolithiasis induced by ethylene glycol. J Urol 167: 2584–2593. PMID: 11992092
22. Thamilselvan S, Hackett RL, Khan SR (1997) Lipid peroxidation in ethylene glycol induced hyperoxa-
luria and calcium oxalate nephrolithiasis. J Urol 157: 1059–1063. PMID: 9072543
23. Joshi S, Wang W, Peck AB, Khan SR (2015) Activation of the NLRP3 Inflammasome in Association
with Calcium Oxalate Crystal Induced Reactive Oxygen Species in Kidneys. J Urol 193: 1684–1691.
https://doi.org/10.1016/j.juro.2014.11.093 PMID: 25437532
24. Khan SR (2004) Crystal-induced inflammation of the kidneys: results from human studies, animal mod-
els, and tissue-culture studies. Clin Exp Nephrol 8: 75–88. https://doi.org/10.1007/s10157-004-0292-0
PMID: 15235923
25. Khan SR (2013) Reactive oxygen species as the molecular modulators of calcium oxalate kidney stone
formation: evidence from clinical and experimental investigations. J Urol 189: 803–811. https://doi.org/
10.1016/j.juro.2012.05.078 PMID: 23022011
26. Khan SR, Kok DJ (2004) Modulators of urinary stone formation. Front Biosci 9: 1450–1482. PMID:
14977559
27. Khan SR, Joshi S, Wang W, Peck AB (2014) Regulation of macromolecular modulators of urinary stone
formation by reactive oxygen species: transcriptional study in an animal model of hyperoxaluria. Am J
Physiol Renal Physiol 306: F1285–1295. https://doi.org/10.1152/ajprenal.00057.2014 PMID:
24598804
28. Joshi S, Clapp WL, Wang W, Khan SR (2015) Osteogenic changes in kidneys of hyperoxaluric rats. Bio-
chim Biophys Acta 1852: 2000–2012. https://doi.org/10.1016/j.bbadis.2015.06.020 PMID: 26122267
29. Zuo J, Khan A, Glenton PA, Khan SR (2011) Effect of NADPH oxidase inhibition on the expression of
kidney injury molecule and calcium oxalate crystal deposition in hydroxy-L-proline-induced hyperoxa-
luria in the male Sprague-Dawley rats. Nephrol Dial Transplant 26: 1785–1796. https://doi.org/10.1093/
ndt/gfr035 PMID: 21378157
30. Khan SR, Khan A, Byer KJ (2011) Temporal changes in the expression of mRNA of NADPH oxidase
subunits in renal epithelial cells exposed to oxalate or calcium oxalate crystals. Nephrol Dial Transplant
26: 1778–1785. https://doi.org/10.1093/ndt/gfq692 PMID: 21079197
31. Joshi S, Saylor BT, Wang W, Peck AB, Khan SR (2012) Apocynin-treatment reverses hyperoxaluria
induced changes in NADPH oxidase system expression in rat kidneys: a transcriptional study. PLoS
One 7: e47738. https://doi.org/10.1371/journal.pone.0047738 PMID: 23091645
32. Ritchie ME, Phipson B, Wu D, Hu Y, Law CW, et al. (2015) limma powers differential expression analy-
ses for RNA-sequencing and microarray studies. Nucleic Acids Res 43: e47. https://doi.org/10.1093/
nar/gkv007 PMID: 25605792
33. Huang da W, Sherman BT, Lempicki RA (2009) Systematic and integrative analysis of large gene lists
using DAVID bioinformatics resources. Nat Protoc 4: 44–57. https://doi.org/10.1038/nprot.2008.211
PMID: 19131956
Time lapse study to differentiate between hyperoxaluria and calcium oxalate nephrolithiasis
PLOS ONE | https://doi.org/10.1371/journal.pone.0185009 November 1, 2017 19 / 21
34. Koul S, Khandrika L, Meacham RB, Koul HK (2012) Genome wide analysis of differentially expressed
genes in HK-2 cells, a line of human kidney epithelial cells in response to oxalate. PLoS One 7:
e43886. https://doi.org/10.1371/journal.pone.0043886 PMID: 23028475
35. Koul S, Chaturvedi LS, Sekhon A, Bhandari A, Menon M, et al. (2002) Effects of oxalate on the re-initia-
tion of DNA synthesis in LLC-PK1 cells do not involve p42/44 MAP kinase activation. Kidney Int 61:
525–533. https://doi.org/10.1046/j.1523-1755.2002.00163.x PMID: 11849392
36. Koul S, Khandrika L, Pshak TJ, Iguchi N, Pal M, et al. (2014) Oxalate upregulates expression of IL-
2Rbeta and activates IL-2R signaling in HK-2 cells, a line of human renal epithelial cells. Am J Physiol
Renal Physiol 306: F1039–1046. https://doi.org/10.1152/ajprenal.00462.2013 PMID: 24523387
37. Schepers MS, van Ballegooijen ES, Bangma CH, Verkoelen CF (2005) Crystals cause acute necrotic
cell death in renal proximal tubule cells, but not in collecting tubule cells. Kidney Int 68: 1543–1553.
https://doi.org/10.1111/j.1523-1755.2005.00566.x PMID: 16164631
38. Thamilselvan S, Hackett RL, Khan SR (1999) Cells of proximal and distal tubular origin respond differ-
ently to challenges of oxalate and calcium oxalate crystals. J Am Soc Nephrol 10 Suppl 14: S452–456.
39. Khan SR, Thamilselvan S (2000) Nephrolithiasis: a consequence of renal epithelial cell exposure to
oxalate and calcium oxalate crystals. Mol Urol 4: 305–312. PMID: 11156696
40. Khan SR, Byer KJ, Thamilselvan S, Hackett RL, McCormack WT, et al. (1999) Crystal-cell interaction
and apoptosis in oxalate-associated injury of renal epithelial cells. J Am Soc Nephrol 10 Suppl 14: 457–
463.
41. Khan SR (2011) Crystal/cell interaction and nephrolithiasis. Arch Ital Urol Androl 83: 1–5. PMID:
21585160
42. Okada A, Yasui T, Hamamoto S, Hirose M, Kubota Y, et al. (2009) Genome-wide analysis of genes
related to kidney stone formation and elimination in the calcium oxalate nephrolithiasis model mouse:
detection of stone-preventive factors and involvement of macrophage activity. J Bone Miner Res 24:
908–924. https://doi.org/10.1359/jbmr.081245 PMID: 19113933
43. Mulay SR, Kulkarni OP, Rupanagudi KV, Migliorini A, Darisipudi MN, et al. (2013) Calcium oxalate crys-
tals induce renal inflammation by NLRP3-mediated IL-1beta secretion. J Clin Invest 123: 236–246.
https://doi.org/10.1172/JCI63679 PMID: 23221343
44. Zuo J, Khan A, Glenton PA, Khan SR (2011) Effect of NADPH oxidase inhibition on the expression of
kidney injury molecule and calcium oxalate crystal deposition in hydroxy-L-proline-induced hyperoxa-
luria in the male Sprague-Dawley rats. Nephrol Dial Transplant 26: 1785–1796. https://doi.org/10.1093/
ndt/gfr035 PMID: 21378157
45. Khand FD, Gordge MP, Robertson WG, Noronha-Dutra AA, Hothersall JS (2002) Mitochondrial super-
oxide production during oxalate-mediated oxidative stress in renal epithelial cells. Free Radic Biol Med
32: 1339–1350. PMID: 12057772
46. Han WK, Bailly V, Abichandani R, Thadhani R, Bonventre JV (2002) Kidney Injury Molecule-1 (KIM-1):
a novel biomarker for human renal proximal tubule injury. Kidney Int 62: 237–244. https://doi.org/10.
1046/j.1523-1755.2002.00433.x PMID: 12081583
47. Asselman M, Verhulst A, De Broe ME, Verkoelen CF (2003) Calcium oxalate crystal adherence to hya-
luronan-, osteopontin-, and CD44-expressing injured/regenerating tubular epithelial cells in rat kidneys.
J Am Soc Nephrol 14: 3155–3166. PMID: 14638914
48. Ryall RL (2004) Macromolecules and urolithiasis: parallels and paradoxes. Nephron Physiol 98: p37–
42. https://doi.org/10.1159/000080262 PMID: 15499213
49. Stapleton AM, Timme TL, Ryall RL (1998) Gene expression of prothrombin in the human kidney and its
potential relevance to kidney stone disease. Br J Urol 81: 666–671. PMID: 9634038
50. Kleinman JG, Wesson JA, Hughes J (2004) Osteopontin and calcium stone formation. Nephron Physiol
98: p43–47. https://doi.org/10.1159/000080263 PMID: 15499214
51. Khan SR, Kok DJ (2004) Modulators of urinary stone formation. Front Biosci 9: 1450–1482. PMID:
14977559
52. Hunter GK (2013) Role of Osteopontin in Modulation of Hydroxyapatite Formation. Calcif Tissue Int.
53. Hunter GK, Grohe B, Jeffrey S, O’Young J, Sorensen ES, et al. (2009) Role of phosphate groups in inhi-
bition of calcium oxalate crystal growth by osteopontin. Cells Tissues Organs 189: 44–50. https://doi.
org/10.1159/000151430 PMID: 18703867
54. Kohri K, Yasui T, Okada A, Hirose M, Hamamoto S, et al. (2012) Biomolecular mechanism of urinary
stone formation involving osteopontin. Urol Res 40: 623–637. https://doi.org/10.1007/s00240-012-
0514-y PMID: 23124115
55. Wesson JA, Johnson RJ, Mazzali M, Beshensky AM, Stietz S, et al. (2003) Osteopontin is a critical
inhibitor of calcium oxalate crystal formation and retention in renal tubules. J Am Soc Nephrol 14: 139–
147. PMID: 12506146
Time lapse study to differentiate between hyperoxaluria and calcium oxalate nephrolithiasis
PLOS ONE | https://doi.org/10.1371/journal.pone.0185009 November 1, 2017 20 / 21
56. Schurgers LJ, Cranenburg EC, Vermeer C (2008) Matrix Gla-protein: the calcification inhibitor in need
of vitamin K. Thromb Haemost 100: 593–603. PMID: 18841280
57. Yasui T, Fujita K, Sasaki S, Sato M, Sugimoto M, et al. (1999) Expression of bone matrix proteins in uro-
lithiasis model rats. Urol Res 27: 255–261. PMID: 10460895
58. Khan A, Wang W, Khan SR (2014) Calcium oxalate nephrolithiasis and expression of matrix GLA pro-
tein in the kidneys. World J Urol 32: 123–130. https://doi.org/10.1007/s00345-013-1050-2 PMID:
23475213
59. Gao B, Yasui T, Lu X, Zhou H, Liu J, et al. (2010) Matrix Gla protein expression in NRK-52E cells
exposed to oxalate and calcium oxalate monohydrate crystals. Urol Int 85: 237–241. https://doi.org/10.
1159/000314947 PMID: 20689249
60. Denecke B, Graber S, Schafer C, Heiss A, Woltje M, et al. (2003) Tissue distribution and activity testing
suggest a similar but not identical function of fetuin-B and fetuin-A. Biochem J 376: 135–145. https://
doi.org/10.1042/BJ20030676 PMID: 12943536
61. Herrmann M, Kinkeldey A, Jahnen-Dechent W (2012) Fetuin-A function in systemic mineral metabolism.
Trends Cardiovasc Med 22: 197–201. https://doi.org/10.1016/j.tcm.2012.07.020 PMID: 22902178
62. Schafer C, Heiss A, Schwarz A, Westenfeld R, Ketteler M, et al. (2003) The serum protein alpha 2-Here-
mans-Schmid glycoprotein/fetuin-A is a systemically acting inhibitor of ectopic calcification. J Clin Invest
112: 357–366. https://doi.org/10.1172/JCI17202 PMID: 12897203
63. Stejskal D, Karpisek M, Vrtal R, Student V, Solichova P, et al. (2008) Urine fetuin-A values in relation to
the presence of urolithiasis. BJU Int 101: 1151–1154. https://doi.org/10.1111/j.1464-410X.2007.07432.
x PMID: 18190622
64. Harding MA, Chadwick LJ, Gattone VH 2nd, Calvet JP (1991) The SGP-2 gene is developmentally reg-
ulated in the mouse kidney and abnormally expressed in collecting duct cysts in polycystic kidney dis-
ease. Dev Biol 146: 483–490. PMID: 1864465
65. Correa-Rotter R, Ibarra-Rubio ME, Schwochau G, Cruz C, Silkensen JR, et al. (1998) Induction of clus-
terin in tubules of nephrotic rats. J Am Soc Nephrol 9: 33–37. PMID: 9440084
66. Atmani F, Khan SR (1999) Role of urinary bikunin in the inhibition of calcium oxalate crystallization. J
Am Soc Nephrol 10 Suppl 14: S385–388.
67. Atmani F, Mizon J, Khan SR (1996) Identification of uronic-acid-rich protein as urinary bikunin, the light
chain of inter-alpha-inhibitor. Eur J Biochem 236: 984–990. PMID: 8665922
68. Grewal JS, Tsai JY, Khan SR (2005) Oxalate-inducible AMBP gene and its regulatory mechanism in
renal tubular epithelial cells. Biochem J 387: 609–616. https://doi.org/10.1042/BJ20041465 PMID:
15533056
69. Iida S, Peck AB, Byer KJ, Khan SR (1999) Expression of bikunin mRNA in renal epithelial cells after
oxalate exposure. J Urol 162: 1480–1486. PMID: 10492241
70. Tsujihata M, Miyake O, Yoshimura K, Kakimoto KI, Takahara S, et al. (2000) Fibronectin as a potent
inhibitor of calcium oxalate urolithiasis. J Urol 164: 1718–1723. PMID: 11025758
71. Miyazawa K, Aihara K, Ikeda R, Moriyama MT, Suzuki K (2009) cDNA macroarray analysis of genes in
renal epithelial cells exposed to calcium oxalate crystals. Urol Res 37: 27–33. https://doi.org/10.1007/
s00240-008-0164-2 PMID: 19066878
72. Okada A, Yasui T, Fujii Y, Niimi K, Hamamoto S, et al. (2010) Renal macrophage migration and crystal
phagocytosis via inflammatory-related gene expression during kidney stone formation and elimination
in mice: Detection by association analysis of stone-related gene expression and microstructural obser-
vation. J Bone Miner Res 25: 2701–2711. https://doi.org/10.1002/jbmr.158 PMID: 20577968
73. Umekawa T, Chegini N, Khan SR (2002) Oxalate ions and calcium oxalate crystals stimulate MCP-1
expression by renal epithelial cells. Kidney Int 61: 105–112. https://doi.org/10.1046/j.1523-1755.2002.
00106.x PMID: 11786090
74. Glaros T, Fu Y, Xing J, Li L (2012) Molecular mechanism underlying persistent induction of LCN2 by
lipopolysaccharide in kidney fibroblasts. PLoS One 7: e34633. https://doi.org/10.1371/journal.pone.
0034633 PMID: 22514649
75. Marengo SR, Chen DH, Kaung HL, Resnick MI, Yang L (2002) Decreased renal expression of the puta-
tive calcium oxalate inhibitor Tamm-Horsfall protein in the ethylene glycol rat model of calcium oxalate
urolithiasis. J Urol 167: 2192–2197. PMID: 11956477
76. Mo L, Liaw L, Evan AP, Sommer AJ, Lieske JC, et al. (2007) Renal calcinosis and stone formation in
mice lacking osteopontin, Tamm-Horsfall protein, or both. Am J Physiol Renal Physiol 293: F1935–
1943. https://doi.org/10.1152/ajprenal.00383.2007 PMID: 17898038
77. Khan SR, Khan A, Byer KJ (2011) Temporal changes in the expression of mRNA of NADPH oxidase
subunits in renal epithelial cells exposed to oxalate or calcium oxalate crystals. Nephrol Dial Transplant
26: 1778–1785. https://doi.org/10.1093/ndt/gfq692 PMID: 21079197
Time lapse study to differentiate between hyperoxaluria and calcium oxalate nephrolithiasis
PLOS ONE | https://doi.org/10.1371/journal.pone.0185009 November 1, 2017 21 / 21
Copyright © 2022 FDOKUMEN