
Simulation study of structural changes in zeolite RHO (JPCC 2012)
10
Simulation study of structural changes in zeolite RHO S. R. G. Balestra, 1 J. J. Guti´ errez–Sevillano, 1 P. J. Merkling, 1 D. Dubbeldam, 2 and S. Calero 1, * 1 Department of Physical, Chemical, and Natural Systems, University Pablo de Olavide, Ctra. Utrera km 1, 41013 Seville, Spain 2 Van ’t Hoff Institute for Molecular Sciences, University of Amsterdam, Science Park 904, 1098XH Amsterdam, The Netherlands Flexibility in zeolite RHO manifests itself in its ability to adopt one of two structures, depending on the composition and the applied external conditions. In this work, structural changes of dehydrated zeolite RHO of composition (Na6Cs3)O96Al9Si39 and pure silica were investigated by molecular dynamics (MD) and Monte Carlo methods using the force field by Nicholas et al. (J. Am. Chem. Soc. 1991, 113, 4792). The structure was found, depending on temperature, to be stable in the acentric form (space group I ¯ 43m ) below ∼300 K and in the centric form (Im ¯ 3m ) above, in qualitative agreement with experimental findings from the literature. Additionally, the structure may remain in the centric form in metastable conditions at all temperatures and exhibits a negative thermal expansion (NTE) of -(13 ± 3) × 10 -6 K -1 . Calculated X-ray diffraction patterns match the experimental ones closely confirming the assignments to space groups made on the basis of lattice sizes. Modifications on the force field were investigated and other established force fields probed. A detailed knowledge and control over the behaviour of this structure should lead to more reliable predictions on applications like separation of gases. Graphical TOC Entry: Keywords: zeolite, RHO, flexibility, phase transition * [email protected]
Transcript of Simulation study of structural changes in zeolite RHO (JPCC 2012)

Simulation study of structural changes in zeolite RHO
S. R. G. Balestra,1 J. J. Gutierrez–Sevillano,1 P. J. Merkling,1 D. Dubbeldam,2 and S. Calero1, ∗
1Department of Physical, Chemical, and Natural Systems,University Pablo de Olavide, Ctra. Utrera km 1, 41013 Seville, Spain
2Van ’t Hoff Institute for Molecular Sciences, University of Amsterdam,Science Park 904, 1098XH Amsterdam, The Netherlands
Flexibility in zeolite RHO manifests itself in its ability to adopt one of two structures, depending onthe composition and the applied external conditions. In this work, structural changes of dehydratedzeolite RHO of composition (Na6Cs3)O96Al9Si39 and pure silica were investigated by moleculardynamics (MD) and Monte Carlo methods using the force field by Nicholas et al. (J. Am. Chem.Soc. 1991, 113, 4792). The structure was found, depending on temperature, to be stable in theacentric form (space group I 43m ) below ∼300 K and in the centric form (Im3m ) above, inqualitative agreement with experimental findings from the literature. Additionally, the structuremay remain in the centric form in metastable conditions at all temperatures and exhibits a negativethermal expansion (NTE) of −(13±3)×10−6 K−1. Calculated X-ray diffraction patterns match theexperimental ones closely confirming the assignments to space groups made on the basis of latticesizes. Modifications on the force field were investigated and other established force fields probed.A detailed knowledge and control over the behaviour of this structure should lead to more reliablepredictions on applications like separation of gases.
Graphical TOC Entry:
Keywords: zeolite, RHO, flexibility, phase transition

2
I. INTRODUCTION
Zeolites are crystalline aluminosilicate materials that possess intra-crystalline voids of molecular dimensions. All ofthe frameworks they form are known to show small deformations, although some structures are particularly flexible[1]. Amongst these, zeolite RHO exhibits unique structural changes. Depending on the conditions, it has been shownto appear in one of two cubic space groups, a centric Im3m form or an acentric I 43m form, as shown in Figure 1.Factors that affect the preferred form include the nature of the cations [2], amount of hydration [3], temperature [4]and pressure [5]. This high sensitivity to the conditions and composition of this zeolite makes it an excellent candidatefor a theoretical study modelling it as a flexible framework.
The RHO topology is composed of α-cages linked via double 8-rings. The double 8-rings are deformable and havea degree of ellipticity or distortion as shown in Figure 1. It is quantified by a parameter ∆ as defined by Parise etal.:[6]
∆ijkl =1
2‖rij − rkl‖ (1)
where rij = |~ri − ~rj | and i, j, k, l are defined in Figure 1. The distortions in double 8-rings are accompanied by alarge change in unit cell length a [4].
FIG. 1. Zeolite RHO (a) Im3m space group with a ∼ 15.0 A, (b) I 43m space group with a ∼ 14.6 A.
The flexibility of this zeolite has been extensively studied in the past. However, to the best of our knowledge,this aspect has not been studied by simulation previously. The aim of this work is to study zeolite RHO of an idealcomposition at low pressure using flexible force fields. The success of predictions critically depends on the force fieldschosen. Several of them have been previously reported and found wide use in the area of flexible zeolites, such as themodel of Nicholas et al.[7], Hill and Sauer [8, 9], Demontis et al.[10] and a core–shell model of Schroder and Sauer[11]. A recent simulation study supports Nicholas’ model as the one that performs better in infrared studies thanother force fields investigated [12]. Unless indicated otherwise, this is the default force field used in this work.
Another recent experimental study reports high selectivity of zeolite RHO for CO2 in CO2/CH4 separations. Theauthors find that the partial pressure of CO2 causes a change in structure and hypothesize that the phenomenonis induced by interactions between the flexible framework and the CO2 in the proximities of the window [13]. Un-derstanding this phenomenon may lead to interesting contributions to environmental technology and the capture ofgreenhouse gases, but before that it is necessary to gain a better, more fundamental understanding of the flexibilityof zeolite RHO.
II. SIMULATION METHODS
Zeolitic frameworks are treated as periodic networks based on periodic boundary conditions (PBC). This crystallinetessellation —the framework— is performed from the simulation box by endless Euclidean translations in all threespatial directions. The interactions between particles are calculated according to the force field chosen. Unless specifiedotherwise, this is the force field by Nicholas et al.[7]. Electrostatic energy of a crystalline system is conditionallyconvergent. To avoid infinities, Ewald summation was used. The cut off radius for short-range interactions was setto 12 A.
The crystal is considered vacuous and in vacuum. To make the structures (Im3m and I 43m forms) we have usedthe atomic coordinates provided by the crystallographic study of Palomino et al.[13].

3
To calculate micro-states compatible with environmental conditions (constant particle number, volume, and tem-perature) canonical Monte Carlo (abbreviated MC NVT) was used. Isothermal-isobaric ensemble (constant particlenumber, pressure, and temperature, abbreviated NPT) molecular dynamics (MD) was used to study the evolution ofthe system. The method used to equilibrate is the Parrinello–Rahman barostat[14]. The Martyna et al. algorithm[15] is used for velocity Verlet integrators —validated by Tuckerman et al.[16, 17]—. When we keep fixed the pressure,it is equal to 1 mTorr —an experimental vacuum—. Simulations were run for 100-1000 ps using an integration timestep of τ = 5× 10⁻⁴ ps.
Energy minimizations have been calculated at fixed volume using the Baker method.[18]
Since the space groups involved in this study are cubic but cell lengths in the simulations are allowed to evolveindependently from each other, the length of the unit cell at temperature T was considered as the time averageaT = 1
3 〈atxT + atyT + atzT 〉t.
III. RESULTS AND DISCUSSION
A first concern that arises when dealing with this structure is the observation that the phase transition Im3m ↔I 43m was observed in zeolite RHO of composition Na6Cs3)O96Al9Si39,[13] while a pure silica version has yet to besynthesized. It is therefore important to assess the role of tetrahedral aluminium in enabling this structural change.
Atomic coordinates were taken from Palomino et al.[13] for the I 43m form. The aluminium atoms have a non-periodic occupation of lattice sites in the crystalline structure. To model this system, a crystalline configuration is setup in which a random replacement of 9 SiO4 by 9 AlO4 tetrahedra is undertaken and bound to obey Lowenstein’s rule.Monovalent cations (6 Na+ and 3 Cs+) were randomly added to compensate for the charge of the framework. Around∼ 1000 different configurations were generated and MC simulations run on them that yielded as many values forinternal energies U . Volume, temperature, and number of atoms were fixed (NVT ensemble) so that the experimentaldensity was reproduced and temperature was set to a low 3 K. Each configuration k = 1, . . . , 1000 is characterizedby its average distance between aluminium atoms 〈Al Al〉k and its internal energy Uk and represented in Figure 2(top). Internal energies were computed because of their independence from pressure so the simulations were expectedto be a bit more robust. However, they compare favourably with simulations in the isothermal-isobaric ensemble.Under these conditions of low temperature, the internal energy U is almost equal to the free energy F and thereforethe internal energy serves as a measure of the stability of the framework. If each configuration k is in equilibriumat temperature T , it can be assigned a weighting factor Pk ∝ exp(−Uk/kBT ). In Figure 2, the obtained probabilitydensity is depicted in a histogram. The distance vs internal energy data on the other side scatter strongly. A linecorresponding to a linear fit was laid through the simulation data and showed a correlation that is essentially withinthe error bars. The correlation coefficient is r2 ' 0.035.
−1
−0.99
−0.98
−0.97
−0.96
−0.95
−0.94
−0.93
7.2 7.4 7.6 7.8 8 8.2 8.4 8.6 8.8 9 9.2
[X]
FIG. 2. Top: Dimensionless internal energy U U−1min (with U−1
min ' 6.4kB × 106 K, absolute value of the configuration withlowest energy) versus average distance between Al atoms in randomly generated RHO frameworks. The dashed line representsa linear fit through the data. Bottom: Probability density as a function of average distance between aluminium atoms. Thedashed line represents a normal distribution fit.
4
Any configurations of SiO4 → AlO4 replacements in presence of monovalent cations is valid as long Lowenstein’srule is fulfilled. Since, the aluminium distribution does not seem to be the primary cause of the structural changes ofideal flexible zeolite RHO, and to gain simplicity it will assumed that the role of aluminium should not be critical forthe observation of structural changes. From now on, only the hypothetical pure silica zeolite RHO will be considered.
A. Temperature effect
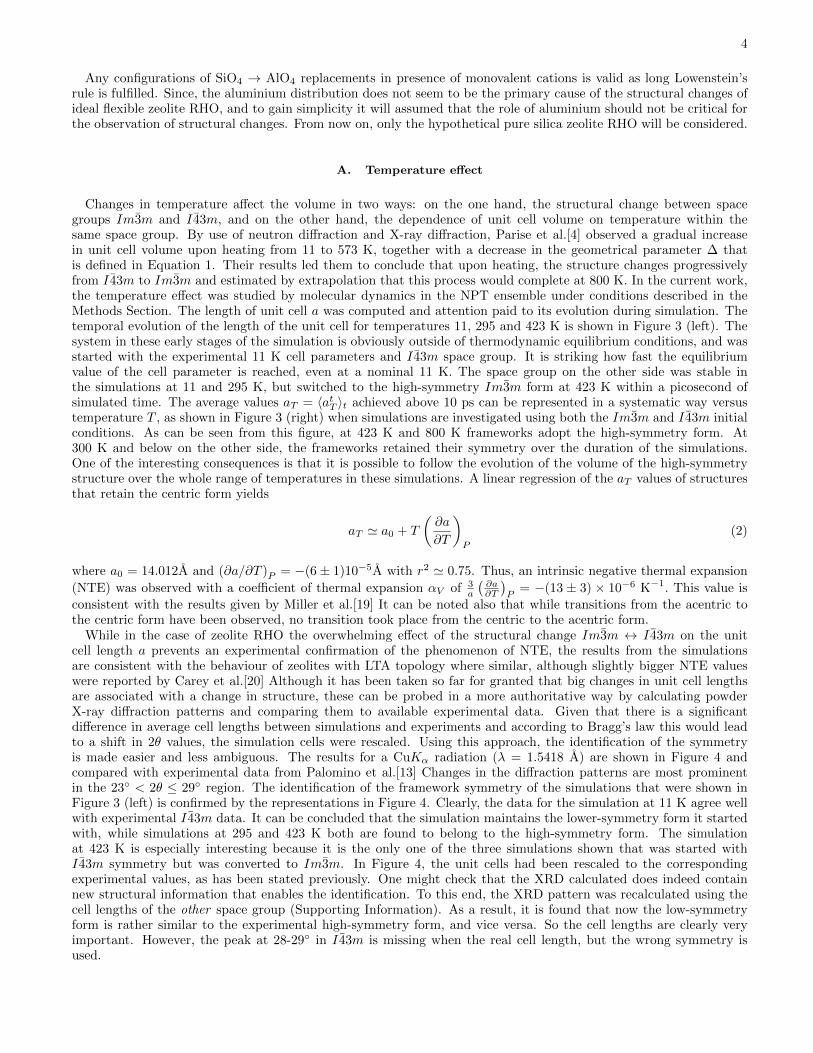
Changes in temperature affect the volume in two ways: on the one hand, the structural change between spacegroups Im3m and I 43m, and on the other hand, the dependence of unit cell volume on temperature within thesame space group. By use of neutron diffraction and X-ray diffraction, Parise et al.[4] observed a gradual increasein unit cell volume upon heating from 11 to 573 K, together with a decrease in the geometrical parameter ∆ thatis defined in Equation 1. Their results led them to conclude that upon heating, the structure changes progressivelyfrom I 43m to Im3m and estimated by extrapolation that this process would complete at 800 K. In the current work,the temperature effect was studied by molecular dynamics in the NPT ensemble under conditions described in theMethods Section. The length of unit cell a was computed and attention paid to its evolution during simulation. Thetemporal evolution of the length of the unit cell for temperatures 11, 295 and 423 K is shown in Figure 3 (left). Thesystem in these early stages of the simulation is obviously outside of thermodynamic equilibrium conditions, and wasstarted with the experimental 11 K cell parameters and I 43m space group. It is striking how fast the equilibriumvalue of the cell parameter is reached, even at a nominal 11 K. The space group on the other side was stable inthe simulations at 11 and 295 K, but switched to the high-symmetry Im3m form at 423 K within a picosecond ofsimulated time. The average values aT = 〈atT 〉t achieved above 10 ps can be represented in a systematic way versustemperature T , as shown in Figure 3 (right) when simulations are investigated using both the Im3m and I 43m initialconditions. As can be seen from this figure, at 423 K and 800 K frameworks adopt the high-symmetry form. At300 K and below on the other side, the frameworks retained their symmetry over the duration of the simulations.One of the interesting consequences is that it is possible to follow the evolution of the volume of the high-symmetrystructure over the whole range of temperatures in these simulations. A linear regression of the aT values of structuresthat retain the centric form yields
aT ' a0 + T
(∂a
∂T
)P
(2)
where a0 = 14.012A and (∂a/∂T )P = −(6± 1)10−5A with r2 ' 0.75. Thus, an intrinsic negative thermal expansion
(NTE) was observed with a coefficient of thermal expansion αV of 3a
(∂a∂T
)P
= −(13 ± 3) × 10−6 K−1. This value is
consistent with the results given by Miller et al.[19] It can be noted also that while transitions from the acentric tothe centric form have been observed, no transition took place from the centric to the acentric form.
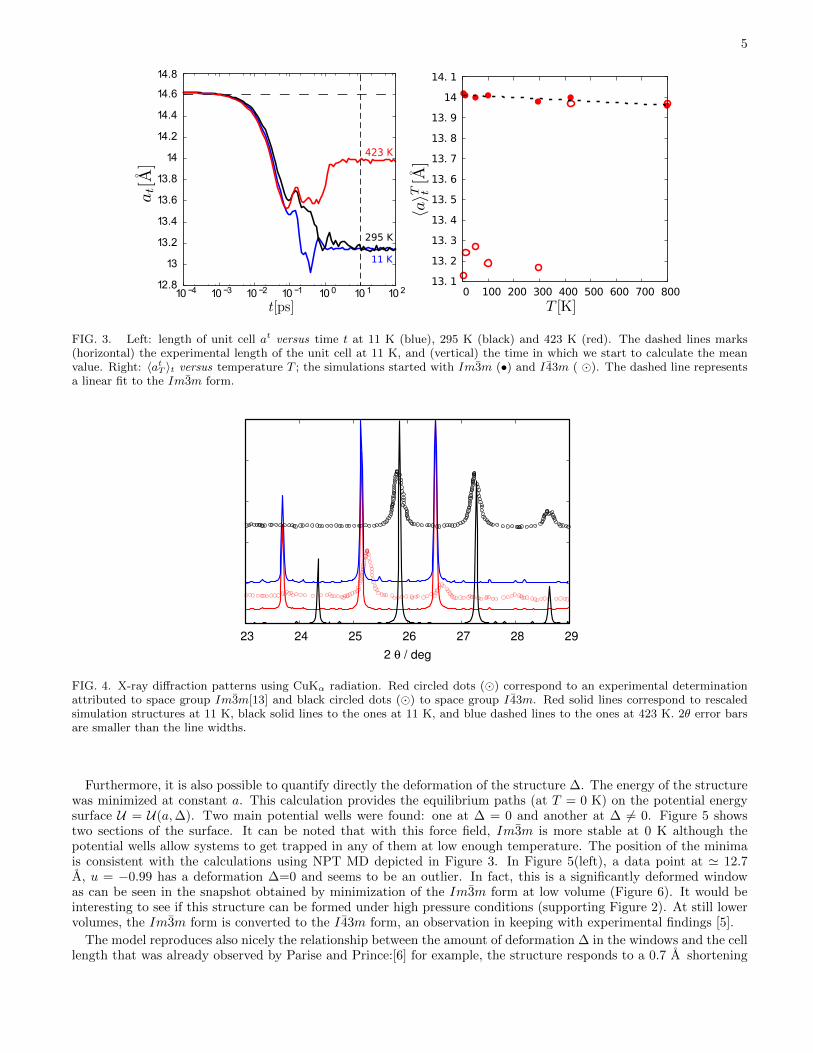
While in the case of zeolite RHO the overwhelming effect of the structural change Im3m ↔ I 43m on the unitcell length a prevents an experimental confirmation of the phenomenon of NTE, the results from the simulationsare consistent with the behaviour of zeolites with LTA topology where similar, although slightly bigger NTE valueswere reported by Carey et al.[20] Although it has been taken so far for granted that big changes in unit cell lengthsare associated with a change in structure, these can be probed in a more authoritative way by calculating powderX-ray diffraction patterns and comparing them to available experimental data. Given that there is a significantdifference in average cell lengths between simulations and experiments and according to Bragg’s law this would leadto a shift in 2θ values, the simulation cells were rescaled. Using this approach, the identification of the symmetryis made easier and less ambiguous. The results for a CuKα radiation (λ = 1.5418 A) are shown in Figure 4 andcompared with experimental data from Palomino et al.[13] Changes in the diffraction patterns are most prominentin the 23◦ < 2θ ≤ 29◦ region. The identification of the framework symmetry of the simulations that were shown inFigure 3 (left) is confirmed by the representations in Figure 4. Clearly, the data for the simulation at 11 K agree wellwith experimental I 43m data. It can be concluded that the simulation maintains the lower-symmetry form it startedwith, while simulations at 295 and 423 K both are found to belong to the high-symmetry form. The simulationat 423 K is especially interesting because it is the only one of the three simulations shown that was started withI 43m symmetry but was converted to Im3m. In Figure 4, the unit cells had been rescaled to the correspondingexperimental values, as has been stated previously. One might check that the XRD calculated does indeed containnew structural information that enables the identification. To this end, the XRD pattern was recalculated using thecell lengths of the other space group (Supporting Information). As a result, it is found that now the low-symmetryform is rather similar to the experimental high-symmetry form, and vice versa. So the cell lengths are clearly veryimportant. However, the peak at 28-29◦ in I 43m is missing when the real cell length, but the wrong symmetry isused.
5
12.8
13
13.2
13.4
13.6
13.8
14
14.2
14.4
14.6
14.8
10 −4 10 −3 10 −2 10 −1 10 0 10 1 10 2
11 K
295 K
423 K
13. 1
13. 2
13. 3
13. 4
13. 5
13. 6
13. 7
13. 8
13. 9
14
14. 1
0 100 200 300 400 500 600 700 800
FIG. 3. Left: length of unit cell at versus time t at 11 K (blue), 295 K (black) and 423 K (red). The dashed lines marks(horizontal) the experimental length of the unit cell at 11 K, and (vertical) the time in which we start to calculate the meanvalue. Right: 〈atT 〉t versus temperature T ; the simulations started with Im3m (•) and I 43m ( �). The dashed line representsa linear fit to the Im3m form.
23 24 25 26 27 28 29
2 θ / deg
FIG. 4. X-ray diffraction patterns using CuKα radiation. Red circled dots (�) correspond to an experimental determinationattributed to space group Im3m[13] and black circled dots (�) to space group I 43m. Red solid lines correspond to rescaledsimulation structures at 11 K, black solid lines to the ones at 11 K, and blue dashed lines to the ones at 423 K. 2θ error barsare smaller than the line widths.
Furthermore, it is also possible to quantify directly the deformation of the structure ∆. The energy of the structurewas minimized at constant a. This calculation provides the equilibrium paths (at T = 0 K) on the potential energysurface U = U(a,∆). Two main potential wells were found: one at ∆ = 0 and another at ∆ 6= 0. Figure 5 showstwo sections of the surface. It can be noted that with this force field, Im3m is more stable at 0 K although thepotential wells allow systems to get trapped in any of them at low enough temperature. The position of the minimais consistent with the calculations using NPT MD depicted in Figure 3. In Figure 5(left), a data point at ' 12.7A, u = −0.99 has a deformation ∆=0 and seems to be an outlier. In fact, this is a significantly deformed windowas can be seen in the snapshot obtained by minimization of the Im3m form at low volume (Figure 6). It would beinteresting to see if this structure can be formed under high pressure conditions (supporting Figure 2). At still lowervolumes, the Im3m form is converted to the I 43m form, an observation in keeping with experimental findings [5].
The model reproduces also nicely the relationship between the amount of deformation ∆ in the windows and the celllength that was already observed by Parise and Prince:[6] for example, the structure responds to a 0.7 A shortening

6
-1
-0.99
-0.98
-0.97
-0.96
-0.95
-0.94
-0.93
-0.92
12.5 13 13.5 14 14.5 15 15.50
0.5
1
1.5
2
2.5
3
12.5 13 13.5 14 14.5 15 15.5
FIG. 5. Equilibrium paths on the potential energy surface at 0 K u = −U−1minU(a,∆) with k−1
B Umin = −6.77×10⁶ K for Nicholaset al.’s force field. Systems with ∆ < 0.5 A in red and ∆ ≥ 0.5 A in blue.
FIG. 6. Minimized structure at low volume belonging to space group Pm3. ∆ijkl = 0 but ∆mnop = 0.92 A.
of its unit cell with a deformation ∆ ≈ 1.8 A and the downwards curvature is similar to the experimental one.So far, the model of Nicholas et al. has been used. In the next section, modifications on this model are studied to
assess the sensitivity of the properties calculated hitherto on details of the force field. The first parameter modifiedwas the set of partial charges.
B. Effect of charges
Electrostatic interactions are long-ranged and small modifications in charges can lead to relevant effects on thevolume of the cell or on its symmetry. In order to assess the sensitivity of the structures on partial charges in thesystem, two modifications of Nicholas et al.’s[7] force field were tested: a zero-charge model and a model by Garcıa–Sanchez et al.[21] This model uses the same intramolecular contributions as Nicholas et al.’s model, but charges andvan der Waals contributions have been fitted for a more accurate reproduction of CO2 adsorption in zeolites. Veryroughly speaking, charges are reduced by around 40%. So in comparison with Nicholas et al.’s model, the modelsconsidered in this part weaken the electrostatic interactions.
With these new parameters, NPT MD calculations were repeated under the same conditions of pressure andtemperatures as in Figure 3 (left). The time averaged values aT at different temperatures have been added in Figures7a and 7c for the corresponding model.
Energy minimization calculations of the structure for Garcıa–Sanchez et al.’s model and the zero-charge model wereperformed and are shown in Figure 7.
The simulations revealed that independently of the starting structure and of the model, the framework ended upin the high-symmetry, ∆ = 0 structure since this is the lowest energy structure according to these models. Howmuch thermal activation is required for the structure to be converted into the high-symmetry variant can be related

7
15.5-1
-0.99
-0.98
-0.97
-0.96
-0.95
-0.94
-0.93
-0.92
-0.91
12 12.5 13 13.5 14 14.5 150
0.5
1
1.5
2
2.5
3
3.5
12 12.5 13 13.5 14 14.5 15 15.5
-1
-0.5
0
0.5
1
1.5
2
2.5
3
12 12.5 13 13.5 14 14.5 15 15.50
0.5
1
1.5
2
2.5
3
3.5
4
12 12.5 13 13.5 14 14.5 15 15.5
a b
c d
11 K295 K425 K
11 K, 425 K295 k
FIG. 7. (a) Equilibrium paths on the potential energy surface u = U−1minU(a,∆) and (b) ∆-parameter for Garcıa–Sanchez
et al.’s model, where k−1B Umin = 3.46 × 10⁶ K/ unit cell, and corresponding plots for a zero-charge model (c and d) where
k−1B Umin = 1.51 × 10⁵ K/unit cell. Systems with ∆ < 0.5 A in red and ∆ ≥ 0.5 A in blue. The orange arrows indicate 〈atT 〉t
computed by NPT MD.
qualitatively to barrier height δ = ε0 − ε1. The variables represent the energy ε0 of the principal barrier and ε1 ofthe bottom of the well of ∆ ≥ 0.5 structures. These variables are marked in Figures 5 and 7. Nicholas et al.’s modelpredicts a difference of 2δk−1
B (3N−6)−1 ' 633.8 K, Garcıa–Sanchez et al.’s a difference of 2δk−1B (3N−6)−1 ' 44.3 K,
and the zero-charge model has no energy barrier for ∆ > 0.However, with decreasing point charges, the length of the minimum-energy unit cell increases. For the centric
structure, a decrease of the charges by 40% results in a unit cell length increase of ∼ 0.54 A, while a decrease ofcharges by 100% involves an increase by ∼ 1 A.
To conclude this section, the structure has been found to be very sensitive to a scaling of the point charges, bothwith respect to temperatures of conversion from asymmetric to symmetric structure and to the length of the unit cell.
C. Modifications of the rigidity of the lattice
It is interesting at this point to estimate just how dependent the findings are on details of the force field employed.While it may intuitively be easily understandable that the charges in the system should have a strong effect on theunit cell length vs. temperature graph, it is far less obvious how or whether a change in force constants of the latticeshould affect this representation.
The contributions to potential energy given by bond stretching and bending are given by the set of equations (3).
Uij(rij) = kr(rij − r0)2
Uijk(θijk) = kθ(θijk − θ0)2(3)
In the previous section, it was found that over the temperature range 11-423 K no expansion or shrinkage of theunit cell was observed for the model of Garcıa–Sanchez et al. In this section, systematic modifications of kr and kθby a factor of 1/2 or 2 were undertaken. In all cases, the frameworks formed had a ∆-parameter of zero. It wasfurther found that the magnitude of kr governs the absolute value of the unit cell length. A change by a factortwo corresponds roughly to an increase of 0.1 A. Moreover, the simultaneous halving of kr and doubling of kθ force

8
14.15
14.2
14.25
14.3
14.35
14.4
14.45
14.5
14.55
14.6
14.65
10−4
10−3
10−2
10−1
100
101
102
13.9
14
14.1
14.2
14.3
14.4
14.5
14.6
14.7
10−4
10−3
10−2
10−1
100
101
102
FIG. 8. Length of unit cell a versus time t using kr → 2kr and kθ → kθ2
(left) and kr → kr2
and kθ → 2kθ (right) at 11 K(blue), 295 K (black), and 423 K (red).
constants led to a positive thermal expansion, while on the contrary a doubling of kr and halving of kθ led to anegative thermal expansion. This opens up the possibility in the development of a force field, of tuning the forceconstants to reproduce known thermal expansions
D. Other potentials
While in previous sections the model of Nicholas and modifications of this model have been investigated, in thissection other popular approaches were tested. Probably the simplest force field one can imagine was proposed byDemontis et al.[10]. This force field is not stable in NPT-ensemble calculations, possibly due to the lack of Van derWaals and charge-charge long-range interactions. Oscillations and vibrations in the equilibrium introduce asymmetriesin the structure, the lack of charges hinder their disappearance. This potential worked well in a number of applicationsin the NVT-ensemble in which it was developed, but folded unrealistically due to the lack of torsional, charges andother terms to restrain the movement of the atoms.
Similar graphics to Figure 5 can be constructed for the model by Hill and Sauer[9] and a further refinement of thelatter that includes a core shell.[11]
The results are shown in Figure 9 (top and bottom, respectively). Unit cell lengths at roughly 15 A are in betteragreement to experiment than Nicholas et al’s model. However, as energy minimizations show, both the symmetricand asymmetric structure converge towards the same minimum and present no secondary minima. Hill and Sauer’smodel contains strong torsional force constants capable of maintaining the structure. Schroder and Sauer’s model onthe other side, based on a consistent force field, adapts a core shell to it. Normally, the fixed high symmetry in thestructures tends to cancel out any small variation in charge.[7] But, if the volume and geometry of the unit cell arenot fixed, the incidence of charges on the symmetry of the lattice is marked.
The simulations with Schroder and Sauer’s core shell model increased the degrees of freedom, relaxing the systemand thereby resulting in more realistic electrostatic interactions.
Figure 9-b, 9-d, and the corresponding representations in Figures 5 and 7 all show a downwards curvature in theellipticity vs. unit cell length that is matched by the experiment. This behaviour that appears to be fairly universalis probably best understood in the context of flexing mechanically a structure with essentially rigid bond lengthsgradually from a distorted geometry (I 43m space group) towards a higher-symmetry geometry (Im3m space group).It is the potential energy analysis discussed previously (Figures 9-a and 9-c) and the applied external pressure thatdetermine ultimately how inevitable a falling back to the high symmetry model is.
IV. CONCLUSIONS
Structural changes in zeolite RHO between I 43m and Im3m space groups lead to a change in unit cell length. Forthis reason, flexible force fields for zeolites are worthwhile studying when the volume is not fixed.
In this work, it was found that the aluminium distribution does not seem to be the primary cause for the structuralchanges in flexible zeolite RHO. All framework models are unable to reproduce correctly the structural phase transition

9
0
0.5
1
1.5
2
2.5
3
3.5
12.5 13 13.5 14 14.5 15 15.5
-1
-0.995
-0.99
-0.985
-0.98
-0.975
-0.97
-0.965
12.5 13 13.5 14 14.5 15 15.50
0.5
1
1.5
2
2.5
3
3.5
4
12.5 13 13.5 14 14.5 15 15.5
0
-1
-0.9
-0.8
-0.7
-0.6
-0.5
-0.4
-0.3
-0.2
-0.1
12.5 13 13.5 14 14.5 15 15.5
a b
c d
FIG. 9. Equilibrium paths on the potential energy surface u = −U−1minU(a,∆) for (a,b in plot) for Hill and Sauer’s force field,[8, 9]
with k−1B Umin = −1.077 × 10⁶ K and (c,d in plot) for a core-shell model,[11] with k−1
B Umin = −7.25 × 10⁷ K. Systems with∆ < 0.5 A in red and ∆ ≥ 0.5 A in blue.
with use of energy minimization and molecular dynamics techniques for the isothermal–isobaric ensemble. Energyminimization results were consistent with molecular dynamics simulations.
However, a series of important conclusions could be drawn. Nicholas et al’s model was shown by X-ray diffractionand by recording the degree of ellipticity to reproduce the structural changes within the framework. The latterindicator correlates very well with changes in unit cell length in the exact way found experimentally. The maindrawback of Nicholas’ model consists in too small unit cell lengths. A low volume structure belonging to space groupPm3 is predicted with this force field as an energetically competitive alternative to high ellipticity structures.
From the point of view of potential energy, decreasing the partial charges in the model reduces the barrier betweenstructural phases and increases the volume of the unit cell. In this way, the study of modifications in the charges of theNicholas model, in section III-B, and the simulations with Demontis model in section III-D, for the isothermal–isobaricensemble, suggest that the role of the charges is notable. The Schroder and Sauer model with a core shell model,and Sauer and Hill model with strong torsions maintained the stability of the structure within NPT simulations,reproduced the experimental cell length well, but failed to account for the existence of I 43m symmetry. Thus, thepotential of Nicholas predicts for the pure silica zeolite RHO two stable structures (Im3m and I 43m ). The otherpotentials predict a single stable structure (Im3m ) and predict a more realistic length of the unit cell.
Finally, it is worth highlighting the effects of modifying simultaneously the bond stretching and bending parametersin a framework model. These parameters drive the thermal expansion of the framework.
V. ACKNOWLEDGMENTS
Dr. S. Hamad is acknowledged for helpful discussions and support on GULP.[22] This work was supported by theEuropean Research Council through an ERC Staring Grant (ERC 279520) and the Spanish Ministerio de Economıay Competitividad (CTQ2010-16077) and a VIDI Grant (D. Dubbeldam).

10
VI. SUPPORTING INFORMATION AVAILABLE
This material is available in a separated document.
[1] V. Kapko, C. Dawson, M. M. J. Treacy, and M. F. Thorpe, Phys. Chem. Chem. Phys. 12, 8531 (2010).[2] D. R. Corbin, L. Abrams, G. A. Jones, M. M. Eddy, W. T. A. Harrison, G. D. Stucky, and D. E. Cox, Journal of the
American Chemical Society 112, 4821 (1990).[3] J. B. Parise and D. E. Cox, The Journal of Physical Chemistry 88, 1635 (1984).[4] J. B. Parise, L. Abrams, T. E. Gier, D. R. Corbin, J. D. Jorgensen, and E. Prince, The Journal of Physical Chemistry
88, 2303 (1984).[5] Y. Lee, J. A. Hriljac, T. Vogt, J. B. Parise, M. J. Edmondson, P. A. Anderson, D. R. Corbin, and T. Nagai, Journal of
the American Chemical Society 123, 8418 (2001).[6] J. B. Parise and E. Prince, Materials Research Bulletin 18, 841 (1983).[7] J. B. Nicholas, A. J. Hopfinger, F. R. Trouw, and L. E. Iton, Journal of the American Chemical Society 113, 4792 (1991).[8] J. R. Hill and J. Sauer, The Journal of Physical Chemistry 98, 1238 (1994).[9] J. R. Hill and J. Sauer, The Journal of Physical Chemistry 99, 9536 (1995).
[10] P. Demontis, G. B. Suffritti, S. Quartieri, E. S. Fois, and A. Gamba, The Journal of Physical Chemistry 92, 867 (1988),http://pubs.acs.org/doi/pdf/10.1021/j100315a003.
[11] K.-P. Schroder and J. Sauer, The Journal of Physical Chemistry 100, 11043 (1996).[12] R. Bueno-Perez, S. Calero, D. David, C. O. Ania, J. B. Parra, A. P. Zaderenko, and P. J. Merkling, Journal of Physical
Chemistry C 116, 25797 (2012).[13] M. Palomino, A. Corma, J. L. Jorda, F. Rey, and S. Valencia, Chem. Commun. 48, 215 (2012).[14] M. Parrinello and A. Rahman, Journal of Applied Physics 52, 7182 (1981).[15] G. L. Martyna, D. J. Tobias, and M. L. Klein, Journal of Chemical Physics 101, 4177 (1994).[16] M. E. Tuckerman, Y. Liu, G. Ciccotti, and G. J. Martyna, Journal of Chemical Physics 115, 1678 (2001).[17] M. E. Tuckerman, J. Alejandre, R. Lopez-Rendon, A. L. Jochim, and G. J. Martyna, Journal of Physics A: Mathematical
and General 39, 5629 (2006).[18] J. Baker, Journal of Computational Chemistry 7, 385 (1986).[19] W. Miller, C. W. Smith, D. S. Mackenzie, and K. E. Evans, Journal of Materials Science 44, 5441 (2009).[20] T. Carey, A. Corma, F. Rey, C. C. Tang, J. A. Hriljac, and P. A. Anderson, Chem. Commun. 48, 5829 (2012).[21] A. Garcıa-Sanchez, C. O. Ania, J. B. Parra, D. Dubbeldam, T. J. H. Vlugt, R. Krishna, and S. Calero, The Journal of
Physical Chemistry C 113, 8814 (2009).[22] J. D. Gale and A. L. Rohl, Molecular Simulation 29, 291 (2003), http://www.tandfonline.com/doi/pdf/10.1080/0892702031000104887.