Paramagnetic polyvinylbutyral particles containing activated carbon as a new adsorbent
Upload
khangminh22Category
view
8download
0
165
Proceedings of
The 5th Sriwijaya International Seminar on Energy and Environmental Science & Technology
Palembang, Indonesia
September 10-11, 2014
Application of Activated Carbon and Natural Zeolite for Phosphate
Removal from Laundry Wastewater
Tuty Emilia Agustina
1* , Muhammad Faizal
1 and Tine Aprianti
1
1Chemical Engineering Department, Faculty of Engineering, Sriwijaya University
*Corresponding author : [email protected]
ABSTRACT
The number of laundry industry has been increasing rapidly which influences the amount of detergent
usage in the washing process. Generally the laundry industries dump their wastewater directly to
environment without any treatment. Phosphate contained in detergent shall accumulate in the environment
then finally would cause eutrofication where the water body becomes rich of dissolved nutrient which
effects the dissolved oxygen contained in water body. One of wastewater treatment methods is adsorption.
Two different kinds of adsorbents were applied in this investigation namely activated carbon and natural
zeolite. Synthetic laundry wastewater was used in order to control the phosphate concentration. The
objective of this experiment was to study the removal of phosphate concentration of each adsorbent filled
in adsorption column by using circulation method. The column has 1 inch of diameter, 50 cm of height, and
50 ml/minute of flowrate. The concentration of phosphate was varied between 2-8 mg/l whereas the
adsorbent height in the column was varied between the ranges of 10-40 cm. The size of both adsorbents
was 10 mesh. It was found that the natural zeolite was superior to remove the phosphate compared to
activated carbon. The highest phosphate removal of 90% was obtained by using 40 cm of natural zeolite
height in the adsorption column when make use the phosphate concentration of 2 mg/l.
Keywords: phosphate, laundry wastewater, activated carbon, natural zeolite
1. INTRODUCTION
Laundry industries use detergent in the washing
process, because detergent works better than
soap in hard water. Increasing the number of
laundry industries make the use of detergent
increase as well. The primary substance in the
detergent is natrium tripoly-phosphat that acts as
builder and surfactant, so the wastewater from
the washing process contain phosphate
compound. However, at the mean time, almost
all industries dump effluent from the process
directly to the river or water body without any
treatment. According to Palembang City
Regulation No. 2 of 2003 on River Water
Quality Standards and Wastewater Quality
Standard, the maximum levels allowable
phosphorus content is 2 mg/l and according to
PP 82 of 2001 on water quality management and
pollution control, the content of total phosphate
as P allowed for class II of water is 0.2 mg/l.
Eutrophication is water pollution caused by
the emergence of excess nutrients into the
aquatic ecosystem. Eutrophication occurs
because of the chemical content of the phosphate
(PO43-
). A water body is called eutrophication if
the total concentration of phosphate into the
water in the range of 35 – 100 µg/L. Actually the
process of eutrophication requires a very long
time (thousands of years), but due to the
development of science and technology that
underpin modernization is not accompanied by
the wisdom of the environment, so in a matter of
decades or years alone eutrophication can occur.
Some detergents contain relatively quite lot
phosphates; therefore the detergent is also a
source of e utrophication which needs special
attention. Although many laws and regulations
that restrict or prohibit the use of detergents
containing phosphates, but until now there has
not been an impact on the elimination of
eutrophication problem.
Effect of moderate eutrophication in nutrient
poor water is not negative, but if eutrophication
continues resulting plankton growth to be very
dense, so it will cover the water. This process

166
Proceedings of
The 5th Sriwijaya International Seminar on Energy and Environmental Science & Technology
Palembang, Indonesia
September 10-11, 2014
will lead to dark under the water surface, and the
condition is harmful to benthic vegetation.
Serious problems due to eutrophication caused
by single-cell algae growth is great, the
decomposition process of dead cells will reduce
dissolved oxygen. Aquatic plants (including
algae) will affect the O2 concentration and pH of
the surrounding waters. The rapid growth of
algae will cause greater fluctuations in pH and
dissolved oxygen. This will lead to disruption of
metabolic processes in the organism, which can
ultimately lead to death.
Eutrophication is a natural process and can
occur in a variety of water body, but if there is
contamination of phosphate materials due to
human activities and takes place continuously,
the eutrophication process will increase.Various
methods have been investigated in order to
remove the nutrients such as phosphate and
ammonium. On the other hand, natural zeolite is
potentially a cheap and abundant adsorbent
suited for water and wastewater treatment.
Compared with other adsorbent materials such as
organic resins [1], zeolite offers a number of
advantages including low-cost, excellent
selectivity at low temperatures, the release of
non-toxic exchangeable cations (K+
, Na+
, Ca+
and Mg2+
) to the environment [2], simple
operation and easy maintenance [3]. Results
showed that zeolite can be used to remove both
ammonium and phosphate from aqueous
solutions [4].
There are many natural zeolites identified in
the world. Among the zeolites clinoptilolite is
the most abundant natural zeolite and is widely
used in the world. In zeolite structure, three
relatively independent components are found: the
aluminosilicate framework, exchangeable
cations, and zeolitic water. The general chemical
formula of zeolites is
Mx/n[AlxSiyO2(x+y)]·pH2O where M is (Na, K,
Li) and/or (Ca, Mg, Ba, Sr), n is cation charge;
y/x = 1–6, p/x = 1–4 [5].
However, existing problem in detergent
wastewater treatment particularly comes from
laundry process is the absence of effective and
efficient treatment systems by technically and
economically. Treatment methods that have so
far is coagulation and flocculation which require
a lot of chemicals and biological methods that
produce sludge that becomes another problem
for the environment. The purpose of the research
is to study phosphate temoval of laundry
industrial wastewater by using two different
types of adsorbents, namely activated carbon and
natural zeolite.
In preliminary research, wastewater
sampling was conducted at three different places
of laundry industry. Samples were taken from the
first wastewater washing process which contains
a lot of clothes detergent, so the phosphate
contained in the wastewater is the highest during
the process of washing clothes. Results from the
preliminary research indicate that all the three
samples still meet the quality standard of
wastewater except for test results of phosphate,
TSS and pH, which for BOD, COD and fat & oil
is still below the quality standards set by the
government, but here we will only focus on the
decrease of phosphate.
Based on preliminary research results, it
were known the magnitude of phosphate
concentration in each of the laundry wastewater
are 4.2 mg/l, 4.0 mg/l and 2.3 mg/l which all
exceed allowed thresholds and should be got
prior treatment before being discharged into
drainage. In this study the synthetic laundry
wastewater was used, it is intended that
researchers can adjust the concentration of
phosphate to be applied.
2. METHODS
The synthetic laundry wastewater was made
by dissolving detergent to obtain desired
phosphate concentration. The wastewater is
contacted with an adsorbent in circulation mode
to decrease the amount of phosphate contained.
Preparation of artificial wastewater was preceded
by weighing the amount of detergent phosphate
adjusted to the desired concentration, and then
dissolved in a volume of distilled water. This
was done after knowing the phosphates content
in the detergent. The phospate contained in the
detegent is 0.037 % of detergent mass
2.1 Chemicals and Materials
Activated carbon and natural zeolite of 10
mesh were used as adsorbent. The carbon was
activated by means of soaked in 15% HCl
solution (1:1) for 24 hours. Activated carbon was
filtered and washed with distilled water until the
water pH close to 7 (neutral). Once neutral,
activated carbon was dried in an oven at 110oC
for 15 minutes. Natural zeolite was activated by
heating in a muffle furnace at a temperature of
300oC for 3 hours. The synthetic laundry
wastewater was made by dissolve a certain
weight of commercial detergent.

Proceedings of
The 5th Sriwijaya International Seminar on Energy and Environmental Science & Technology
Palembang, Indonesia
September 10-11, 2014
2.2 Charactherization and Analysi
Scanning Electron Microscope and Energy
Dispersive X-ray Spectroscopy (SEM
JEOL JSM-6360/EDX type of 6510 LA
used to determine the topography (surface
texture of the sample), morphology (shape and
size), and composition (constituent elements) of
the adsorbent. Surface Area Analyzer (SAA) was
used to determine the surface area of
adsorbent by nitrogen gas adsorption
Phosphate concentration was measured by using
a HACH spectrophotometer.
2.3 Procedure
Experiment carried out by means of flow
250 ml of synthetic wastewater
phosphate concentration of 2 mg/l, 4 mg/l, 6
mg/l, and 8 mg/l at a flowrate of 50 ml
adsorption column filled with activated carbon or
natural zeolite. Then the wastewater circulates
from the bottom to the top of the
column up to 1 hour by using a pump
column filled with the adsorbent of 10 cm, 2
cm, 30 cm and 40 cm height. Samples were
taken after 1 hour and the
concentration of the sample solution was
measured by using a spectrophotometer
3. RESULTS
3.1 Characterization
Table 1. EDX Carbon Analysis Results
No. Elements
Percentage
Before
Activation
1. C 46.93
2. Na 1.35
3. Mg 0.70
4. Al 9.12
5. Si 10.39
6. O 19.56
7. Ca 1.68
8. Ti 0.15
9. Fe 2.49
10. Cu 5.48
11. K 1.83
Table 1 shows an increased on the
elements (C) from 46.93% to 77.37%. Whi
167
Sriwijaya International Seminar on Energy and Environmental Science & Technology
herization and Analysis
Scanning Electron Microscope and Energy
ray Spectroscopy (SEM-EDX) of
6510 LA was
used to determine the topography (surface
texture of the sample), morphology (shape and
size), and composition (constituent elements) of
Surface Area Analyzer (SAA) was
used to determine the surface area of the
s adsorption method.
concentration was measured by using
iment carried out by means of flow
water stream with
phosphate concentration of 2 mg/l, 4 mg/l, 6
flowrate of 50 ml/min in an
adsorption column filled with activated carbon or
water circulates
from the bottom to the top of the adsorption
by using a pump. The
adsorbent of 10 cm, 20
. Samples were
taken after 1 hour and the phosphate
concentration of the sample solution was
using a spectrophotometer.
Results
ercentage (%)
ctivation
After
Activation
77.37
1.32
0.22
2.95
5.39
0.30
1.68
0.15
2.81
5.23
1.10
an increased on the Carbon
elements (C) from 46.93% to 77.37%. While
other elements decreased, the Titanium (Ti) and
calcium (Ca) elements did not change. The
increase of the carbon percentage
reduction in the percentage of other elements as
impurities on the activated carbon,
impurities soluble in activator solution
Table 2. EDX Natural Zeolit
Results
According to natural zeolite
results, there is an increase in the percentage of
Si and Al, this is caused by the reduction in th
percentage of other elements as impurities
as Mg, Ti and O in the activated
in which the impurity elements in the
zeolite may evaporate due to the
activation of heating process, but other elements
such as Ca, K and Fe was not
suggesting the activation process ha
occurred to the fullest. A little decrease
ratio makes the natural zeolite more hydrophilic
that will increase absorptive capacity of
zeolite. From the Si/Al ratio, the natural
include in moderat content of Si [6].
Fig. 1. SEM image of carbon before activated
(1000x of magnitude)
No Elements
Percentage
Before
Activation
1. Si 56
2. Al 10.33
3. Ca 3.0
4. K 2.2
5. Fe 2.0
6. Mg 1.2
7. Ti 0.5
8. O 16.69
Sriwijaya International Seminar on Energy and Environmental Science & Technology
Titanium (Ti) and
did not change. The
percentage caused by the
other elements as
carbon, in which the
solution.
Zeolite Analysis
EDX analysis
there is an increase in the percentage of
Si and Al, this is caused by the reduction in the
percentage of other elements as impurities such
activated natural zeolite,
ity elements in the natural
te due to the physical
heating process, but other elements
such as Ca, K and Fe was not changed
the activation process has not
decrease in Si/Al
more hydrophilic
absorptive capacity of natural
the natural zeolites
[6].
Fig. 1. SEM image of carbon before activated
rcentage (%)
ctivation
After
Activation
73
14.21
3.0
2.2
2.0
0.18
0.27
5.02
Proceedings of
The 5th Sriwijaya International Seminar on Energy and Environmental Science & Technology
Palembang, Indonesia
September 10-11, 2014
Fig. 2. SEM image of carbon after
(1000x of magnitude)
As demonstrated in Figure 1 and Figure
there is a change in the carbon pores before and
after activation, the open pores
Figure 2 is more than in Figure 1
because the soaking process of
solution (HCl 15%) resulted in impurities that
were previously covered the pores of the carbon
dissolved in the activator solution and leave the
pores of carbon; this is resulting in no impurities
that clog the pores of the carbon. With the
opening of the carbon pore, adsorption
carbon will increase.
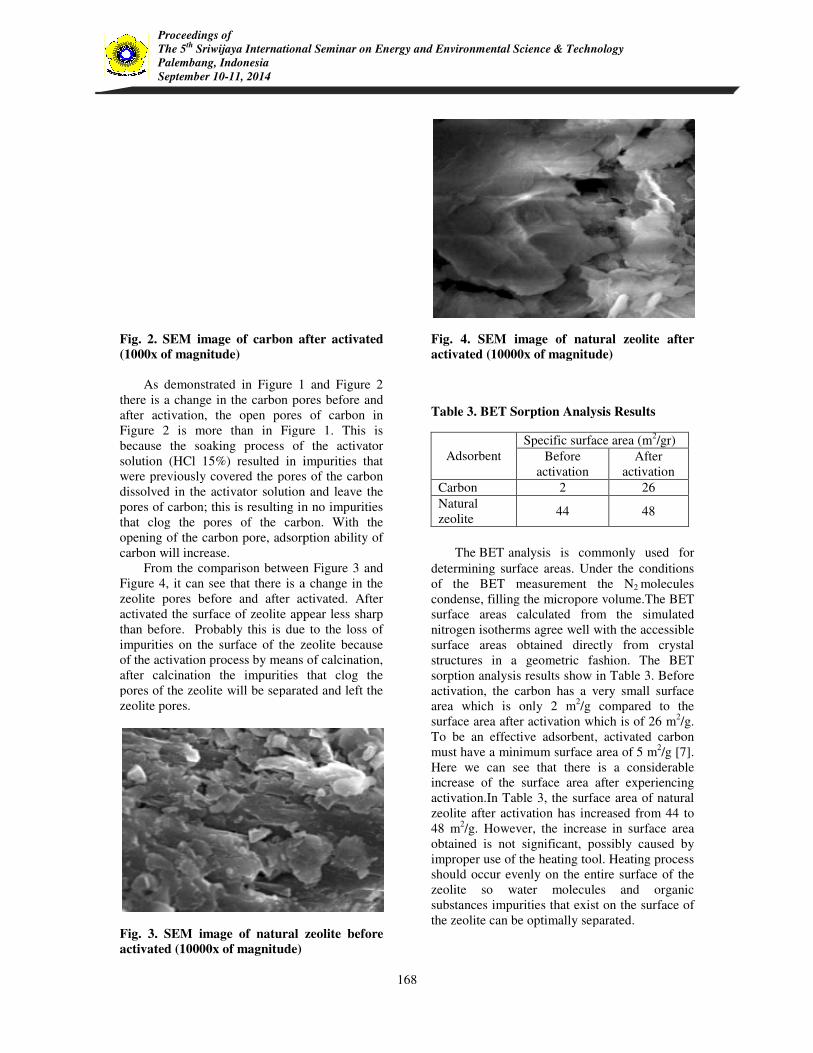
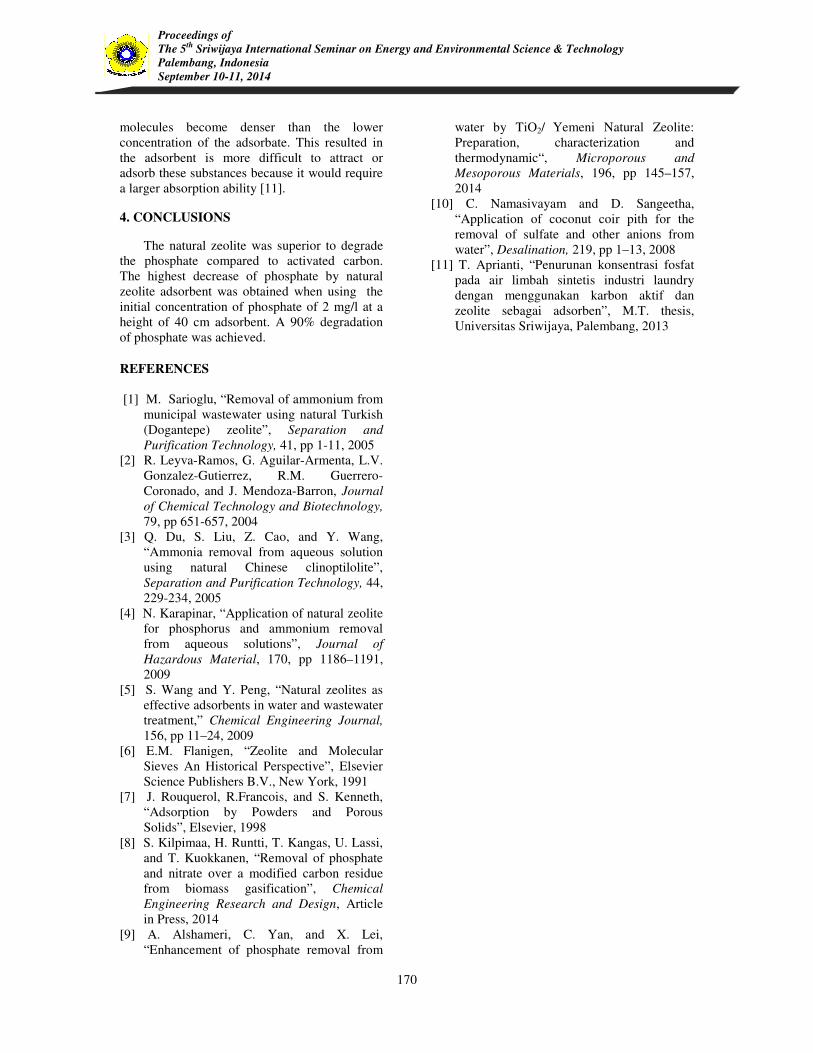
From the comparison between Figure 3 and
Figure 4, it can see that there is a change in the
zeolite pores before and after activated.
activated the surface of zeolite appear less sharp
than before. Probably this is due to the loss of
impurities on the surface of the zeolite
of the activation process by means of calcination,
after calcination the impurities that clog the
pores of the zeolite will be separated and left the
zeolite pores.
Fig. 3. SEM image of natural zeolite
activated (10000x of magnitude)
168
Sriwijaya International Seminar on Energy and Environmental Science & Technology
after activated
As demonstrated in Figure 1 and Figure 2
there is a change in the carbon pores before and
of carbon in
in Figure 1. This is
process of the activator
solution (HCl 15%) resulted in impurities that
were previously covered the pores of the carbon
dissolved in the activator solution and leave the
this is resulting in no impurities
that clog the pores of the carbon. With the
adsorption ability of
he comparison between Figure 3 and
can see that there is a change in the
before and after activated. After
activated the surface of zeolite appear less sharp
his is due to the loss of
impurities on the surface of the zeolite because
the activation process by means of calcination,
after calcination the impurities that clog the
pores of the zeolite will be separated and left the
natural zeolite before
Fig. 4. SEM image of natural zeolite
activated (10000x of magnitude)
Table 3. BET Sorption Analysis
Adsorbent
Specific surface area (m
Before
activation
Carbon 2
Natural
zeolite 44
The BET analysis is commonly used for
determining surface areas. Under the conditions
of the BET measurement the N
condense, filling the micropore volume.
surface areas calculated from the simulated
nitrogen isotherms agree well with the accessible
surface areas obtained directly from crystal
structures in a geometric fashion.
sorption analysis results show in Table 3. Before
activation, the carbon has a very small
area which is only 2 m2/g compared to the
surface area after activation which is of 26
To be an effective adsorbent, activated carbon
must have a minimum surface area of
Here we can see that there is a considerable
increase of the surface area after experiencing
activation.In Table 3, the surface area of
zeolite after activation has increase
48 m2/g. However, the increase in surface area
obtained is not significant, possibly
improper use of the heating tool. Heating process
should occur evenly on the entire surface of the
zeolite so water molecules and organic
substances impurities that exist on the surface of
the zeolite can be optimally separated
Sriwijaya International Seminar on Energy and Environmental Science & Technology
natural zeolite after
00x of magnitude)
nalysis Results
Specific surface area (m2/gr)
After
activation
26
48
analysis is commonly used for
Under the conditions
of the BET measurement the N2 molecules
condense, filling the micropore volume.The BET
areas calculated from the simulated
nitrogen isotherms agree well with the accessible
surface areas obtained directly from crystal
structures in a geometric fashion. The BET
sorption analysis results show in Table 3. Before
ry small surface
/g compared to the
after activation which is of 26 m2/g.
To be an effective adsorbent, activated carbon
must have a minimum surface area of 5 m2/g [7].
Here we can see that there is a considerable
ease of the surface area after experiencing
the surface area of natural
has increased from 44 to
g. However, the increase in surface area
, possibly caused by
tool. Heating process
entire surface of the
o water molecules and organic
substances impurities that exist on the surface of
separated.

169
Proceedings of
The 5th Sriwijaya International Seminar on Energy and Environmental Science & Technology
Palembang, Indonesia
September 10-11, 2014
3.2 Effect of adsorbent height on phosphate
removal
Fig. 5. Effect of activated carbon adsorbent
height on phosphate removal
Figure 5 and 6 shows a graph of phosphate
removal by using different adsorbent height of
activated carbon and natural zeolite. The higher
the adsorbent height, the heigher phosphate
content decreases. This shows that the higher the
adsorbent height, the greater number of
adsorbent were added and the larger active pores
available so the higher the amount of phosphate
could adsorbed.
As can be shown Figure 5, there has been a
decrease in the amount of phosphate adsorbent
ranging from a height of 10 cm, but the amount
of phosphate adsorbed were not significant. It is
proved that the activated carbon adsorption of
the phosphate is low. The less optimal of
activation process can lead to poor adsorption of
activated carbon adsorbent.
At the highest activated carbon adsorbent
height of 40 cm, final phosphate concentration of
0.8, 2.5, 2.9, and 5.8 mg/l were found by means
of initial phosphate concentration of 2, 4, 6, and
8 mg/l, respectively as illustrated in Figure 5.
The highest phosphate removal of 60% was
obtained when applied the lowest initial
phosphate concentration of 2 mg/l. This result is
in agreement with Kilpimaa et al [8] who found
the phosphate removal efficiency over the
activated carbon residue decreased when the
initial phosphate concentration was increased.
This can be explained by the fact that optimal
adsorption sites are occupied first at low
concentrations. This phenomenon could be
explained by the increasing of a driving force
provided by the concentration gradient when the
initial phosphate concentration in the solution
increased.
Figure 6 displays that the decrease in
phosphate concentration occurred from the
natural zeolite adsorbent height of 10 cm, a
decrease in the concentration of phosphate
occurs quite significant when compared to the
amount of original content. This proves that the
natural zeolite has a high absorption of the
phosphate.
Fig. 6. Effect of natural zeolite adsorbent
height on phosphate removal
The phosphate removal increases by
increasing natural zeolite adsorbent height. It is
can be said degradation of phosphate improved
by increasing the amount of zeolite, as illustrated
in Figure 6. The highest removal of phosphate by
natural zeolite adsorbent was obtained at a height
of 40 cm. This effect can be attributed to the
greater amount of surface area and available
binding sites of the adsorbent [9]. Other
researchers found that an increase in adsorbent
dose increased the removal of sulfate. The
percent removal reached maximum of 97% at
adsorbent doses of 800 mg/50 mL, for the
minimum sulfate concentration of 20 mg/L [10].
At the highest natural zeolite adsorbent
height of 40 cm, final phosphate concentration of
0.2, 1.2, 2.5, and 3.1 mg/l were found by means
of initial phosphate concentration of 2, 4, 6, and
8 mg/l, respectively. The highest phosphate
removal of 90% was achieved by using initial
phosphate concentration of 2 mg/l. The highest
phosphate removal was achieved at the lowest
initial phosphate concentration. Similar results
found by other researchers, whereas the highest
ammonium removal efficiency was achieved at
the lowest used initial ammonium concentration
[4], and also the sulfate removal decreased as the
sulfate concentration was increased [10]. This
occurrence might be because of the higher
concentration of adsorbate, the adsorbate
0
5
10
0 10 20 30 40 50
2
4
Activated
Phosphate
concentratio
n (mg/l)
0
5
10
0 10 20 30 40 50
2
4
Natural zeolite
Phosphate
concentratio
n (mg/l)
170
Proceedings of
The 5th Sriwijaya International Seminar on Energy and Environmental Science & Technology
Palembang, Indonesia
September 10-11, 2014
molecules become denser than the lower
concentration of the adsorbate. This resulted in
the adsorbent is more difficult to attract or
adsorb these substances because it would require
a larger absorption ability [11].
4. CONCLUSIONS
The natural zeolite was superior to degrade
the phosphate compared to activated carbon.
The highest decrease of phosphate by natural
zeolite adsorbent was obtained when using the
initial concentration of phosphate of 2 mg/l at a
height of 40 cm adsorbent. A 90% degradation
of phosphate was achieved.
REFERENCES
[1] M. Sarioglu, “Removal of ammonium from
municipal wastewater using natural Turkish
(Dogantepe) zeolite”, Separation and
Purification Technology, 41, pp 1-11, 2005
[2] R. Leyva-Ramos, G. Aguilar-Armenta, L.V.
Gonzalez-Gutierrez, R.M. Guerrero-
Coronado, and J. Mendoza-Barron, Journal
of Chemical Technology and Biotechnology,
79, pp 651-657, 2004
[3] Q. Du, S. Liu, Z. Cao, and Y. Wang,
“Ammonia removal from aqueous solution
using natural Chinese clinoptilolite”,
Separation and Purification Technology, 44,
229-234, 2005
[4] N. Karapinar, “Application of natural zeolite
for phosphorus and ammonium removal
from aqueous solutions”, Journal of
Hazardous Material, 170, pp 1186–1191,
2009
[5] S. Wang and Y. Peng, “Natural zeolites as
effective adsorbents in water and wastewater
treatment,” Chemical Engineering Journal,
156, pp 11–24, 2009
[6] E.M. Flanigen, “Zeolite and Molecular
Sieves An Historical Perspective”, Elsevier
Science Publishers B.V., New York, 1991
[7] J. Rouquerol, R.Francois, and S. Kenneth,
“Adsorption by Powders and Porous
Solids”, Elsevier, 1998
[8] S. Kilpimaa, H. Runtti, T. Kangas, U. Lassi,
and T. Kuokkanen, “Removal of phosphate
and nitrate over a modified carbon residue
from biomass gasification”, Chemical
Engineering Research and Design, Article
in Press, 2014
[9] A. Alshameri, C. Yan, and X. Lei,
“Enhancement of phosphate removal from
water by TiO2/ Yemeni Natural Zeolite:
Preparation, characterization and
thermodynamic“, Microporous and
Mesoporous Materials, 196, pp 145–157,
2014
[10] C. Namasivayam and D. Sangeetha,
“Application of coconut coir pith for the
removal of sulfate and other anions from
water”, Desalination, 219, pp 1–13, 2008
[11] T. Aprianti, “Penurunan konsentrasi fosfat
pada air limbah sintetis industri laundry
dengan menggunakan karbon aktif dan
zeolite sebagai adsorben”, M.T. thesis,
Universitas Sriwijaya, Palembang, 2013
Copyright © 2022 FDOKUMEN