SIMULATION OF SUBURBAN DEVELOPMENT FEATURES BASED ON SCENARIOS IN THE EASTERN SIDE OF IASI CITY
10
GEOGRAPHIA NAPOCENSIS AN. VI, nr. 2/2012 http://geographianapocensis.acad-cluj.ro Geographia Napocensis Anul VI, Nr. 2, 2012 130 SIMULATION OF SUBURBAN DEVELOPMENT FEATURES BASED ON SCENARIOS IN THE EASTERN SIDE OF IASI CITY ALEXANDRA BLĂGEANU 1 , IONUŢ-CIPRIAN IACOB 2 , LUCIAN ROŞU 1 Abstract: - Simulation of suburban development features based on scenarios in the eastern side of Iasi city Suburbanization, a complex process well-developed pre-eminently after the fall of communism, is characterized by a spontaneous, sometimes ambiguous, evolution comparatively to the urban planning specific to the former period. The phenomenon, typical to large cities, has known different stages that were enforced by local factors, creating, thus, an uncertain, chaotic and hard to control suburban fringe. This approach highlights the features of the named process; the first step is aimed to identify some urban models by analyzing those administrative units which are into a continuous motion, namely the communes Barnova, Miroslava and Valea Lupului. Based on the urban blueprints identified in the first part of the approach, will be imagined/built scenarios which will predict the rhythm of suburban expansion in two chosen communes located in the eastern side of Iasi city. Key words: suburbanization, scenario, time-distance, accessibility, growth rate 1 Introduction Suburbanization is a process whereby people, housing, industry, commerce, and retailing spread out beyond traditional urban areas, forming dispersed landscapes that are still connected to cities by commuting. (Gregory, Johnston, Pratt, Watts, & Whatmore, 2009) During the last two decades, suburbanization was the most dynamic and actively process that influenced the development of settlements in Romania, changing the shape of localities at all levels (socio-demographic, economic, land use) (Grigorescu, Mitrică, Kucsicsa, Popovici, Dumitrascu, & Cuculici, 2012). It is favored by proximity of large urban centers and accessibility of private actors to the lands located favorably to the development at low prices. Due to its size and economic status, Iasi is the engine for movement of periurbanisation in north-eastern region (Stoleriu, 2008). Iaşi Metropolitan Area, located in the north-eastern part of the country, 12 kilometres from the border to the Republic of Moldova, has developed as the second functional metropolitan system, since 2004. It includes the town of Iaşi and 13 surrounding villages spanning over a 79,917 ha area with a population of over 400,000 inhabitants (Grigorescu, Mitrică, Kucsicsa, Popovici, Dumitrascu, & Cuculici, 2012). The built-up limits of settlements expand rapidly along the communication axes, as a consequence of decentralisation of services from the core of the city, low prices for households and good accessibility to different services. These are at the basis of new districts well individualized by the socio-professional structure, the architecture and the urban aspects: luxurious villa districts, situated along the principal roads, on high quality terrains (Miroslava, Bârnova, Valea Lupului). 2. Materials and methods In order to assess the process of suburbanization in the communes located in the near proximity of Iasi city several data sources had to be assembled in order to come up with 1 Alexandru Ioan Cuza University of Iaşi, Faculty of Geography and Geology, Department of Geography, Carol I Boulevard, No. 20 A, Iaşi, Romania, e-mail: [email protected] 2 Babes-Bolyai University of Cluj-Napoca, Faculty of Geography and Geology, Department of Geography, Mihail Kogălniceanu nr. 1, 400084, Cluj-Napoca, Romania, e-mail: [email protected]
Transcript of SIMULATION OF SUBURBAN DEVELOPMENT FEATURES BASED ON SCENARIOS IN THE EASTERN SIDE OF IASI CITY

GEOGRAPHIA N
APOCENSIS AN. V
I, nr. 2
/2012
http:/
/geog
raphia
napo
censis
.acad
-cluj.
ro
Geographia Napocensis Anul VI, Nr. 2, 2012
130
SIMULATION OF SUBURBAN DEVELOPMENT FEATURES BASED ON SCENARIOS IN THE EASTERN SIDE OF IASI CITY
ALEXANDRA BLĂGEANU
1, IONUŢ-CIPRIAN IACOB
2, LUCIAN ROŞU
1
Abstract: - Simulation of suburban development features based on scenarios in the eastern side of Iasi city
Suburbanization, a complex process well-developed pre-eminently after the fall of communism, is characterized by a spontaneous, sometimes ambiguous, evolution comparatively to the urban planning specific to the former period. The phenomenon, typical to large cities, has known different stages that were enforced by local factors, creating, thus, an uncertain, chaotic and hard to control suburban fringe. This approach highlights the features of the named process; the first step is aimed to identify some urban models by analyzing those administrative units which are into a continuous motion, namely the communes Barnova, Miroslava and Valea Lupului. Based on the urban blueprints identified in the first part of the approach, will be imagined/built scenarios which will predict the rhythm of suburban expansion in two chosen communes located in the eastern side of Iasi city. Key words: suburbanization, scenario, time-distance, accessibility, growth rate
1 Introduction Suburbanization is a process whereby
people, housing, industry, commerce, and retailing spread out beyond traditional urban areas, forming dispersed landscapes that are still connected to cities by commuting. (Gregory, Johnston, Pratt, Watts, & Whatmore, 2009)
During the last two decades, suburbanization was the most dynamic and actively process that influenced the development of settlements in Romania, changing the shape of localities at all levels (socio-demographic, economic, land use) (Grigorescu, Mitrică, Kucsicsa, Popovici, Dumitrascu, & Cuculici, 2012). It is favored by proximity of large urban centers and accessibility of private actors to the lands located favorably to the development at low prices. Due to its size and economic status, Iasi is the engine for movement of periurbanisation in north-eastern region (Stoleriu, 2008).
Iaşi Metropolitan Area, located in the north-eastern part of the country, 12 kilometres from the border to the Republic of Moldova, has
developed as the second functional metropolitan system, since 2004. It includes the town of Iaşi and 13 surrounding villages spanning over a 79,917 ha area with a population of over 400,000 inhabitants (Grigorescu, Mitrică, Kucsicsa, Popovici, Dumitrascu, & Cuculici, 2012). The built-up limits of settlements expand rapidly along the communication axes, as a consequence of decentralisation of services from the core of the city, low prices for households and good accessibility to different services. These are at the basis of new districts well individualized by the socio-professional structure, the architecture and the urban aspects: luxurious villa districts, situated along the principal roads, on high quality terrains (Miroslava, Bârnova, Valea Lupului).
2. Materials and methods In order to assess the process of
suburbanization in the communes located in the near proximity of Iasi city several data sources had to be assembled in order to come up with
1 Alexandru Ioan Cuza University of Iaşi, Faculty of Geography and Geology, Department of Geography, Carol I Boulevard, No. 20 A, Iaşi, Romania, e-mail: [email protected] 2 Babes-Bolyai University of Cluj-Napoca, Faculty of Geography and Geology, Department of Geography, Mihail Kogălniceanu nr. 1, 400084, Cluj-Napoca, Romania, e-mail: [email protected]
GEOGRAPHIA N
APOCENSIS AN. V
I, nr. 2
/2012
http:/
/geog
raphia
napo
censis
.acad
-cluj.
ro
SIMULATION OF SUBURBAN DEVELOPMENT FEATURES BASED ON SCENARIOS IN THE EASTERN SIDE OF IASI CITY
131
two coherent and valid databases: one that summarizes the information provided by INSSE (National Institute of Statistics), the other one which will be processed in ArcGis 9.3. Both were adjusted according to our field observations in order to understand better the evolution, current situation and future development of the study area. 2.1 Study Area Our study takes into considerations 3 areas:
a. Bârnova, Miroslava, Valea Lupului1 communes are the most representative for the suburban evolution during the last 20 years. There is a spontaneous expanding and densification of the urban outskirts which attract rich people but also poor population returning to a semi rural way of life. The rapid and uncontrolled expansion of the urban limits generates a continuous built space between the city and the neighboring settlements (Miroslava, Valea Lupului, Bârnova) (Stoleriu & Stoleriu, 2004). Valea Lupului represents an opportunity for urban inhabitants to move back into a more rural setting, but without having to sacrifice any of the comforts associated with urban living (Breabăn, Ceucă, Rusu, Stoican, Roşu, & Ţibuleac, 2010). All three communes are representative for the metropolitan area of Iaşi, having all requirements (accessibility, land-use changes, demographic and socio-economic changes) for being integrated into urban system.
b. The second area was chosen according to the future plans of the new highway which will connect Tg. Mureş – Iaşi- Ungheni. The highway will pass through the North side of Iaşi city, creating a new connection with Republic of Moldavia.
c. In order to create scenarios for suburban expansion were selected two communes (Holboca and Ungheni) situated in the eastern side of Iaşi city. 2.2 Data collection
Our first database consists of demographic 1 Since 2004, the small settlement Valea Lupului has declared a commune, through population census, effectively doubling its old village plot.
and economic information, respectively population, households, enterprises and the real estate price and covers a period of 20 years. Demographic variables were collected from the INSSE’s database - 1992, 2002, 20112 Census. The number of enterprises was taken from http://www.firme.info/iasi/ and then sorted by the year of registration. The price of the real estate was obtained by searching on specialized websites by year, starting with 2005, different prices for the built up-areas with the same characteristics. The average price for each year was used to determine the growth of real-estate prices.
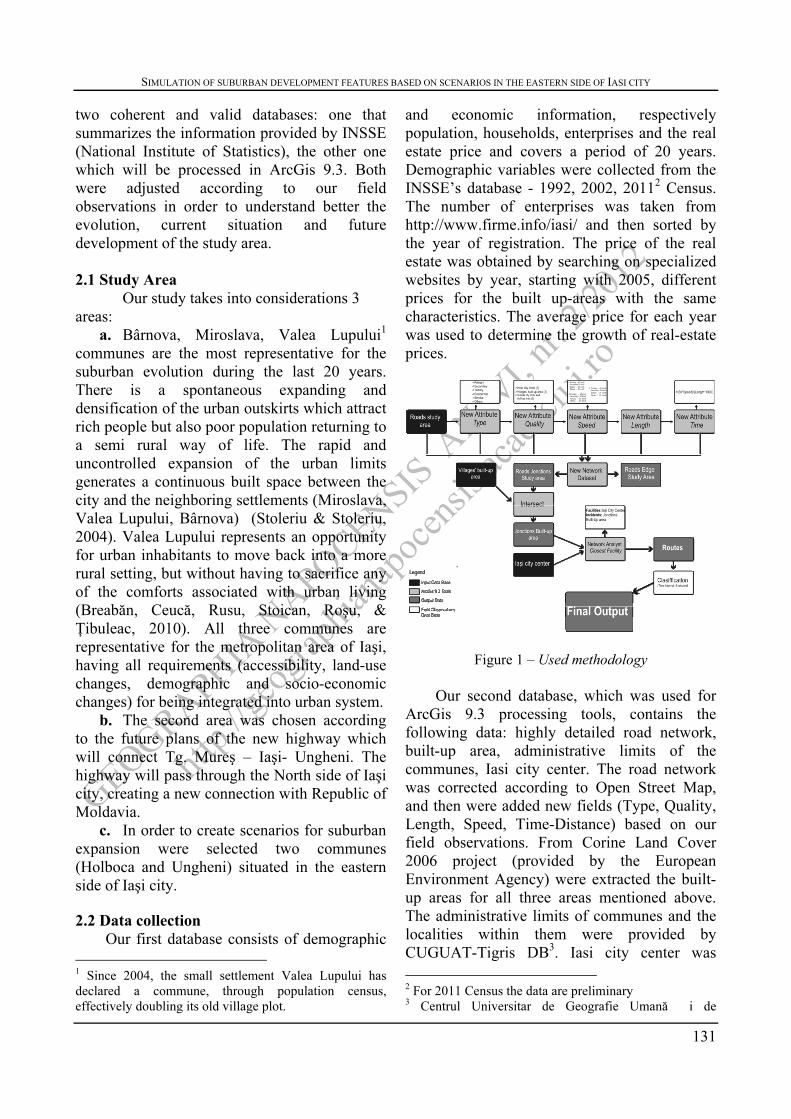
Figure 1 – Used methodology
Our second database, which was used for ArcGis 9.3 processing tools, contains the following data: highly detailed road network, built-up area, administrative limits of the communes, Iasi city center. The road network was corrected according to Open Street Map, and then were added new fields (Type, Quality, Length, Speed, Time-Distance) based on our field observations. From Corine Land Cover 2006 project (provided by the European Environment Agency) were extracted the built-up areas for all three areas mentioned above. The administrative limits of communes and the localities within them were provided by CUGUAT-Tigris DB3. Iasi city center was 2 For 2011 Census the data are preliminary 3 Centrul Universitar de Geografie Umană i de

GEOGRAPHIA N
APOCENSIS AN. V
I, nr. 2
/2012
http:/
/geog
raphia
napo
censis
.acad
-cluj.
ro
Alexandra Blăgeanu, Ionuţ-Ciprian Iacob, Lucian Roşu
132
established in Podu Ros intersection which is the most important junction for urban road network. The plans for the highway were taken from the official website of CNADNR4; these were used to add it to the existing road network. The next step was to create a Network Dataset which allowed us to calculate the time-distance using Closest Facility tool from the Network Analyst extension [fig. 1]. As facility was used Iasi city center and as Incidents were used the junctions from built-up areas within the analyzed communes. As final output were generated 1744 routes which were then classified by five minutes interval time-distance. 2.3 Data analysis
The data were analysed to account for the differences that exist between the communes where the suburban processes is well developed (Bârnova, Valea Lupului, Miroslava) and communes where the process had barely begun.
The entire database was processed using the ArcGIS 9.3 software pack, resulting a complex spatial database up to date with modern standards, and then processed with Excel 2010 software.
3. Results and Discussions In this section we present the results of the above-mentioned method applied to several communes that are part of Iasi Metropolitan Area in order to analyze the suburban development. It has three main parts: in the first one, the method is used to appreciate the extent, to which the process has evolved until now, in the second, is used to identify whether an improvement of the road network can accelerate the rhythm of the suburban expansion and finally some scenarios will be imagined in order to predict the suburban development in a chosen area. 3.1 The analysis of suburban development in Barnova, Miroslava and Valea Lupului
According to the definitions presented in the first part of the paper, one of the most Amenajare a Teritoriului; Teritorii Inovante – Gestiune Regională şi Interacţiune Spaţială 4 National Company of Motorways and National Roads
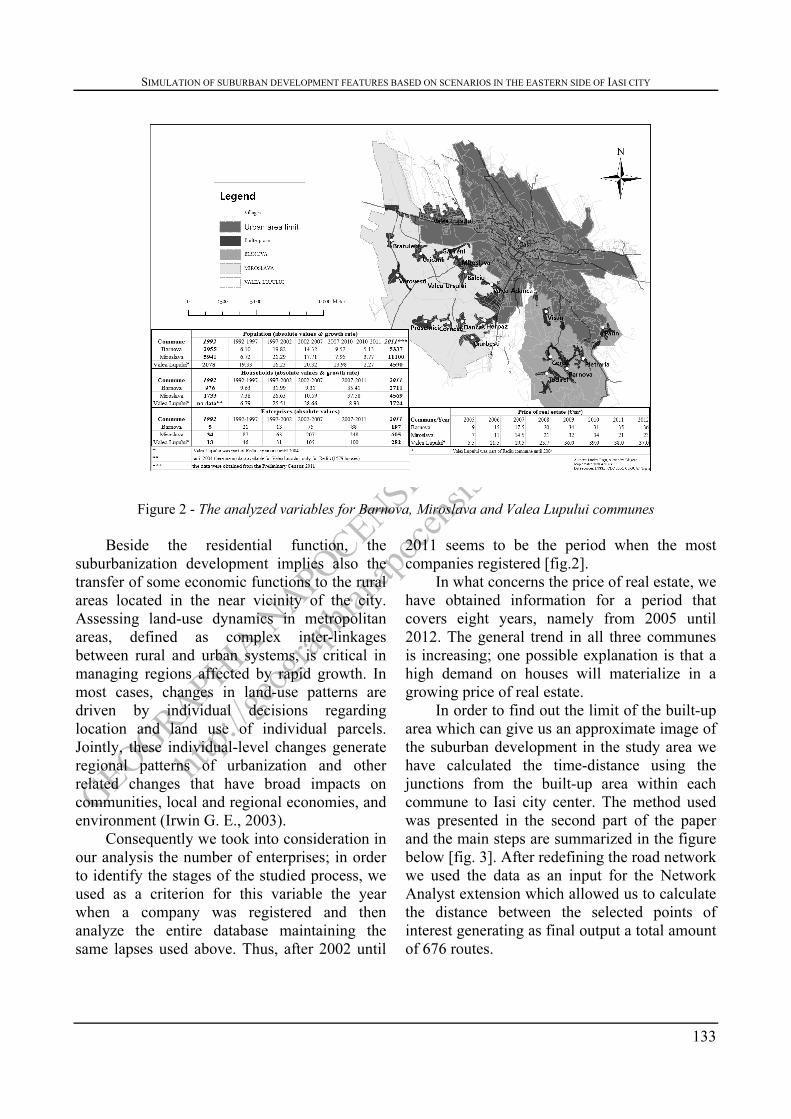
common ways of identifying the process of suburbanization in a certain area is to analyze the dynamics of population, which is also reflected in the evolution of households’ number. Since our database contains information for 20 years, we divided the analyzed period of time in four lapses, namely 1992-1997, 1997-2002, 2002-2007 and 2007-20115 [fig. 2]. Thus the highest growth rates in what concerns the population of the three communes in the study area, were registered starting with 1997 until 2007 (19.82% in Barnova, 21.29% in Miroslava and 20.32 % in Valea Lupului); after that the number of inhabitants was still growing, but the rhythm was diminishing with 5% (Barnova) up to 10% (Miroslava). Nonetheless the population of all three communes has almost doubled in the last 20 years, aspects which is a proof of the existence of suburban features in our study area. If we correlate the evolution of the inhabitants’ number with the number of households, the following conclusions can be drawn:
a. for Barnova and Miroslava the highest growth rates were registered from 1997 until 2002 and 2007-2011; the lapse in between is characterized by a decline of households’ growth rates (for example, in Barnova in 2002 were 1588 dwellings and by the end of the analyzed interval, according to our statistics another 163 houses were built); the low values of growth rates for the first five years indicate the beginning of the suburban development in the our area;
b. for Valea Lupului the numbers indicate a different dynamics of the variable – the highest growth rates were registered from 1997 until 2007 (25,51% in the first five years and 38.66% in the following period); after that the next five years are characterized by a drastic decline of the rhythm of building new houses (the growth rates is only 8.9%), because the commune has known a rapid and chaotic growth of households which has generated the increase of the price of real estate and implicitly the decrease of the available space for building new houses. 5 For population we have created a fifth interval (from 2010 to 2011) because the data for 2011 Census are preliminary.
GEOGRAPHIA N
APOCENSIS AN. V
I, nr. 2
/2012
http:/
/geog
raphia
napo
censis
.acad
-cluj.
ro
SIMULATION OF SUBURBAN DEVELOPMENT FEATURES BASED ON SCENARIOS IN THE EASTERN SIDE OF IASI CITY
133
Figure 2 - The analyzed variables for Barnova, Miroslava and Valea Lupului communes
Beside the residential function, the suburbanization development implies also the transfer of some economic functions to the rural areas located in the near vicinity of the city. Assessing land-use dynamics in metropolitan areas, defined as complex inter-linkages between rural and urban systems, is critical in managing regions affected by rapid growth. In most cases, changes in land-use patterns are driven by individual decisions regarding location and land use of individual parcels. Jointly, these individual-level changes generate regional patterns of urbanization and other related changes that have broad impacts on communities, local and regional economies, and environment (Irwin G. E., 2003).
Consequently we took into consideration in our analysis the number of enterprises; in order to identify the stages of the studied process, we used as a criterion for this variable the year when a company was registered and then analyze the entire database maintaining the same lapses used above. Thus, after 2002 until
2011 seems to be the period when the most companies registered [fig.2].
In what concerns the price of real estate, we have obtained information for a period that covers eight years, namely from 2005 until 2012. The general trend in all three communes is increasing; one possible explanation is that a high demand on houses will materialize in a growing price of real estate.
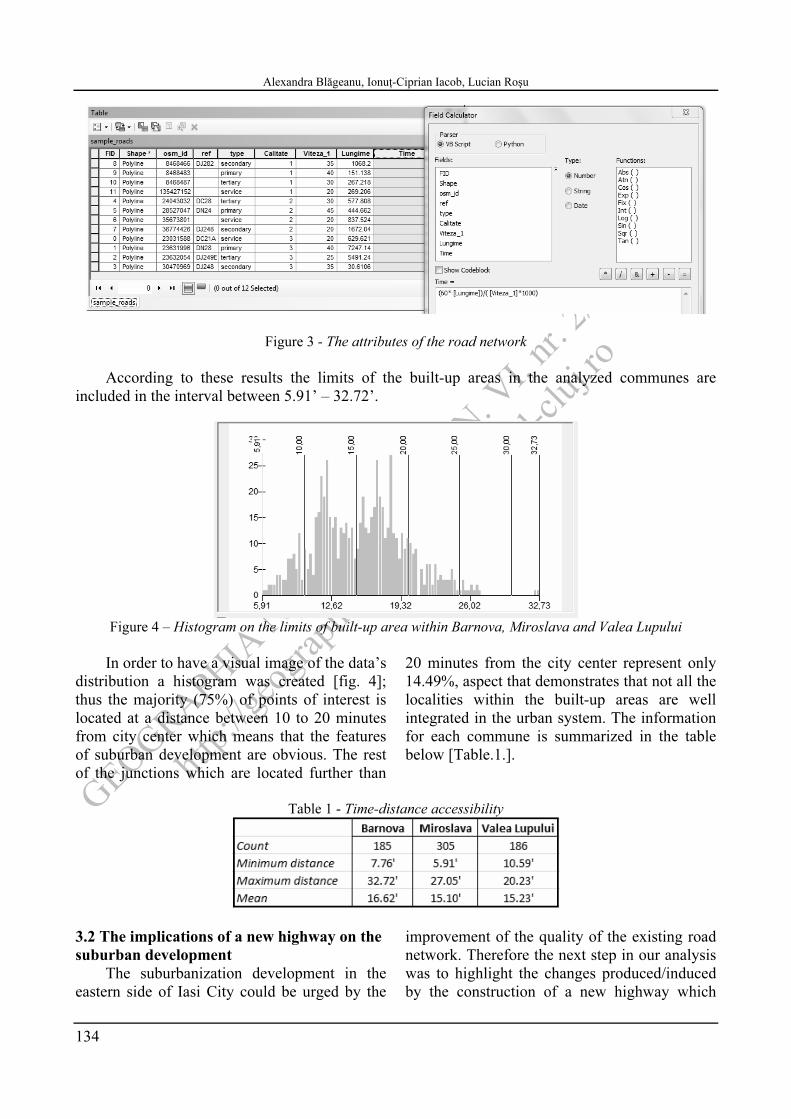
In order to find out the limit of the built-up area which can give us an approximate image of the suburban development in the study area we have calculated the time-distance using the junctions from the built-up area within each commune to Iasi city center. The method used was presented in the second part of the paper and the main steps are summarized in the figure below [fig. 3]. After redefining the road network we used the data as an input for the Network Analyst extension which allowed us to calculate the distance between the selected points of interest generating as final output a total amount of 676 routes.
GEOGRAPHIA N
APOCENSIS AN. V
I, nr. 2
/2012
http:/
/geog
raphia
napo
censis
.acad
-cluj.
ro
Alexandra Blăgeanu, Ionuţ-Ciprian Iacob, Lucian Roşu
134
Figure 3 - The attributes of the road network
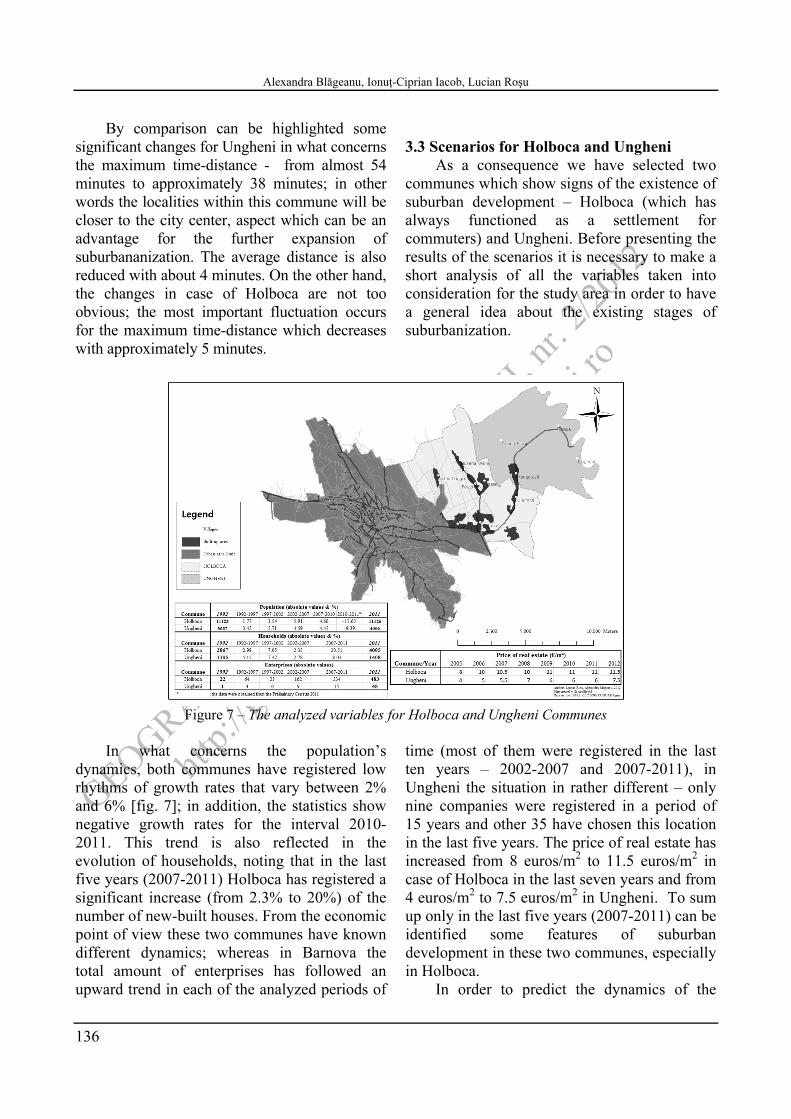
According to these results the limits of the built-up areas in the analyzed communes are included in the interval between 5.91’ – 32.72’.
Figure 4 – Histogram on the limits of built-up area within Barnova, Miroslava and Valea Lupului
In order to have a visual image of the data’s
distribution a histogram was created [fig. 4]; thus the majority (75%) of points of interest is located at a distance between 10 to 20 minutes from city center which means that the features of suburban development are obvious. The rest of the junctions which are located further than
20 minutes from the city center represent only 14.49%, aspect that demonstrates that not all the localities within the built-up areas are well integrated in the urban system. The information for each commune is summarized in the table below [Table.1.].
Table 1 - Time-distance accessibility
3.2 The implications of a new highway on the suburban development
The suburbanization development in the eastern side of Iasi City could be urged by the
improvement of the quality of the existing road network. Therefore the next step in our analysis was to highlight the changes produced/induced by the construction of a new highway which

GEOGRAPHIA N
APOCENSIS AN. V
I, nr. 2
/2012
http:/
/geog
raphia
napo
censis
.acad
-cluj.
ro
SIMULATION OF SUBURBAN DEVELOPMENT FEATURES BASED ON SCENARIOS IN THE EASTERN SIDE OF IASI CITY
135
will connect Tg. Mures – Iasi – Ungheni. In order to do that we redefined the attribute “speed” of the existing road network and then applied the same method as before [fig. 5] According to the results the limits of the built-up areas in the communes along the highway vary between 5.91’ and 45.59’. Comparing them with the results of the study area the following conclusion can be drawn:
a. the settlements located within 25 minutes-limit can present some incipient features of suburban development;
b. the highway itself will not have a decisive role in the further evolution of the analyzed process, but it will improve the accessibility (in our case time-distance) to the city center which usually is transposed in the sprawl of built-up areas;
c. opening a new route to the Republic of Moldavia (Iasi-Holboca-Ungheni) may have as an implication the development of the suburban fringes along it, respectively in Holboca and Ungheni communes.
Figure 5 - Time-distance accessibility
In order to see the implications of a new highway (in this case Tg. Mures-Iasi-Ungheni) on the accessibility of the communes situated in the eastern side of Iasi city, we compared the results obtained in the second step of the analysis with the real ones (the attributes of the road network were not changed). The date are displayed in figure [fig. 6]
Figure 6 – Time-accessibility for built-up areas in Holboca and Ungheni Communes
GEOGRAPHIA N
APOCENSIS AN. V
I, nr. 2
/2012
http:/
/geog
raphia
napo
censis
.acad
-cluj.
ro
Alexandra Blăgeanu, Ionuţ-Ciprian Iacob, Lucian Roşu
136
By comparison can be highlighted some significant changes for Ungheni in what concerns the maximum time-distance - from almost 54 minutes to approximately 38 minutes; in other words the localities within this commune will be closer to the city center, aspect which can be an advantage for the further expansion of suburbananization. The average distance is also reduced with about 4 minutes. On the other hand, the changes in case of Holboca are not too obvious; the most important fluctuation occurs for the maximum time-distance which decreases with approximately 5 minutes.
3.3 Scenarios for Holboca and Ungheni
As a consequence we have selected two communes which show signs of the existence of suburban development – Holboca (which has always functioned as a settlement for commuters) and Ungheni. Before presenting the results of the scenarios it is necessary to make a short analysis of all the variables taken into consideration for the study area in order to have a general idea about the existing stages of suburbanization.
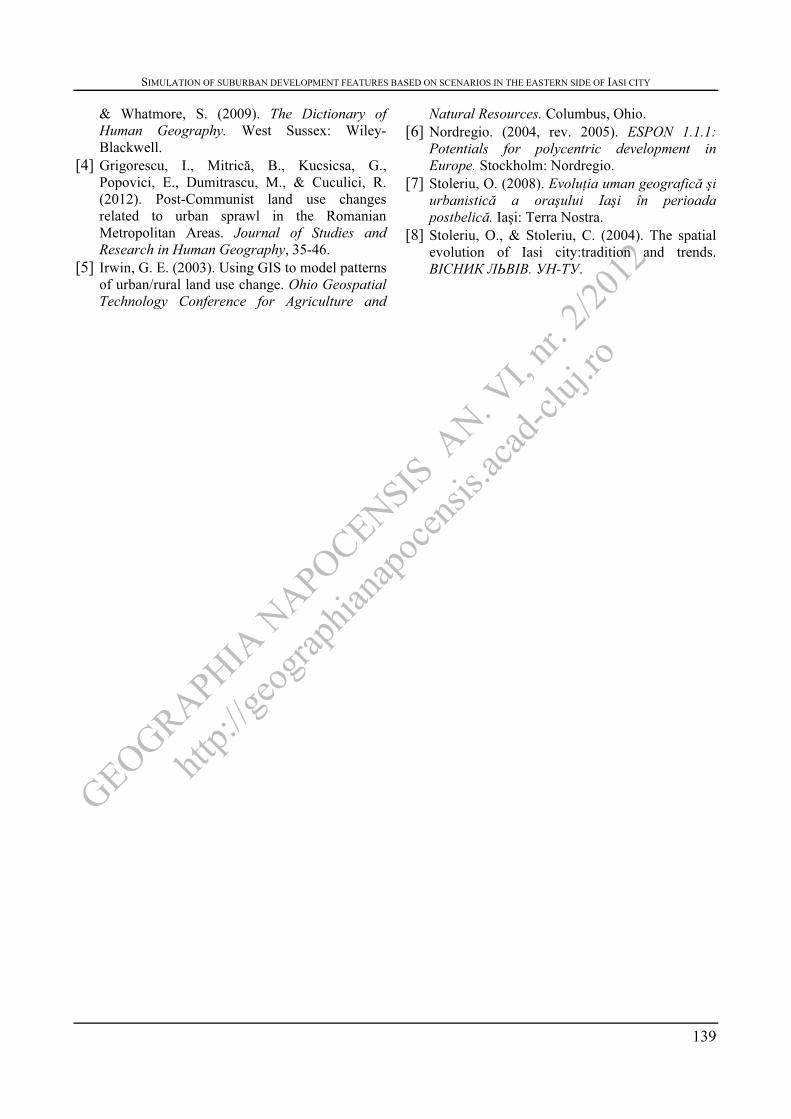
Figure 7 – The analyzed variables for Holboca and Ungheni Communes
In what concerns the population’s
dynamics, both communes have registered low rhythms of growth rates that vary between 2% and 6% [fig. 7]; in addition, the statistics show negative growth rates for the interval 2010-2011. This trend is also reflected in the evolution of households, noting that in the last five years (2007-2011) Holboca has registered a significant increase (from 2.3% to 20%) of the number of new-built houses. From the economic point of view these two communes have known different dynamics; whereas in Barnova the total amount of enterprises has followed an upward trend in each of the analyzed periods of
time (most of them were registered in the last ten years – 2002-2007 and 2007-2011), in Ungheni the situation in rather different – only nine companies were registered in a period of 15 years and other 35 have chosen this location in the last five years. The price of real estate has increased from 8 euros/m2 to 11.5 euros/m2 in case of Holboca in the last seven years and from 4 euros/m2 to 7.5 euros/m2 in Ungheni. To sum up only in the last five years (2007-2011) can be identified some features of suburban development in these two communes, especially in Holboca.
In order to predict the dynamics of the

GEOGRAPHIA N
APOCENSIS AN. V
I, nr. 2
/2012
http:/
/geog
raphia
napo
censis
.acad
-cluj.
ro
SIMULATION OF SUBURBAN DEVELOPMENT FEATURES BASED ON SCENARIOS IN THE EASTERN SIDE OF IASI CITY
137
above-analyzed features of suburban development three scenarios were imagined which cover a period of fifteen years divided in three lapses (2011-2015, 2015-2020, and 2020-2025):
a. baseline scenario – keeps the actual rhythm for all the variables taken into consideration, aspects that will not determine significant changes of the landscape;
b. optimist scenario – were used the highest values for each variable having as bench-marks the three communes analyzed in the first part of the paper; the final result will be the sprawl of suburban development in the eastern part of Iasi city;
c. pessimist scenario – were used the lowest values of each variable registered by the communes from the eastern side of the city.
No scenarios were imagined for enterprises, because it could not be identified a pattern in what concerns the year of registration; usually choosing the location where to found of
a new company depends both on local (accessibility, the price of the real estate, the existence of other firms / economic clusters etc.) and national factors (the economic situation, laws etc.) which cannot be predicted.
In what concerns the future dynamics of the population, in fifteen years the number of inhabitants in Holboca commune will vary between shortly 7.000 persons (worst case scenario) and almost 20.000 persons (according to the optimist scenario); it also has to be mentioned that the total population of the commune in 2011 is 11.126; if the trend from the last five years is maintained, then the commune will face a growth rate of 34%, the total population reaching 15.000 persons. In Ungheni the fluctuations are comprised within approximately 3200 and over 6500 inhabitants comparatively with the year 2011 when the population reached 4006 inhabitants. The predicted results are displayed in fig. 8.
Figure 8 – Population scenarios for Holboca and Ungheni Commune
Figure 9 – Households scenarios for Holboca and Ungheni Commune

GEOGRAPHIA N
APOCENSIS AN. V
I, nr. 2
/2012
http:/
/geog
raphia
napo
censis
.acad
-cluj.
ro
Geographia Napocensis Anul VI, Nr. 2, 2012
138
The second variable which was analyzed is the number of households [fig. 9]. In this case the differences between the optimist and the pessimist scenario are more obvious. If the optimist scenario predicts a number of almost 7500 house for Holboca and 2500 for Ungheni (in 2011 there were 4095, respectively 1408
houses in each commune), the pessimist one estimates a total number of about 4400 houses in Holboca and 1500 in Ungheni. According to the baseline scenarios the number of households will increase with 38% in Holboca and 17% in the other commune.
Figure 10 – Real estate price scenarios for Holboca and Ungheni Commune
The last scenarios offer predictions for the
price of the real estate in the next fifteen years. According to them the changes cover an interval between about 10 euro/m2 to 26 euro/ m2 in Holboca and 4.3 euro/m2 to 17 euro/m2 in Ungheni. In 2011 the owner sold the land with 11.5 euro/m2, respectively 7.5 euro/m2. The data are presented in the figure above [fig. 10].
4. Conclusion The paper has presented an exploratory
approach to analyze the suburban development. The following conclusions can be highlighted
a. The suburban development characterizes the communes which are located in the near vicinity of the city (10’-20’) and have the advantage of being situated along the important access roads, thus having significant implications on their demographic and socio-economic structure.
b. The new highway Tg. Mures-Iasi-Ungheni will not necessary contribute to the sprawl of the suburban development in its proximity, but it will create an adjacent infrastructure that will improve the accessibility of the area, aspect which represents an important factor that may encourage a further development of suburban fringes.
c. By opening a new link to Ungheni the process of suburbanization is biased to appear and to change the landscape of the area.
d. Taking into consideration the improvement of the road network and, implicitly, of the accessibility to the city, the incipient suburban features that could be identified in Holboca might follow the predictions of the optimist scenario in the next 15 to 20 years. On the other hand, Ungheni commune does not present the same characteristics in matters of accessibility (many localities at located further then 35 minutes to city center) which makes the optimist scenario unattainable, but rather the baseline scenario considering the key-position of Ungheni within the communication axis to Iasi.
References
[1] Breabăn, I., Ceucă, C., Rusu, S., Stoican, E., Roşu, L., & Ţibuleac, C. (2010). Agricultural land use changes in the Valea Lupului between 1965 – 2010. Scientific Papers Journal, Agronomy series, 67-7
[2] Douglas, I. (2006). Peri-urban Ecosystems and Societies: Transitional Zones and Contrasting Values. London: Earthscan.
[3] Gregory, D., Johnston, R., Pratt, G., Watts, M.,
GEOGRAPHIA N
APOCENSIS AN. V
I, nr. 2
/2012
http:/
/geog
raphia
napo
censis
.acad
-cluj.
ro
SIMULATION OF SUBURBAN DEVELOPMENT FEATURES BASED ON SCENARIOS IN THE EASTERN SIDE OF IASI CITY
139
& Whatmore, S. (2009). The Dictionary of Human Geography. West Sussex: Wiley-Blackwell.
[4] Grigorescu, I., Mitrică, B., Kucsicsa, G., Popovici, E., Dumitrascu, M., & Cuculici, R. (2012). Post-Communist land use changes related to urban sprawl in the Romanian Metropolitan Areas. Journal of Studies and Research in Human Geography, 35-46.
[5] Irwin, G. E. (2003). Using GIS to model patterns of urban/rural land use change. Ohio Geospatial Technology Conference for Agriculture and
Natural Resources. Columbus, Ohio. [6] Nordregio. (2004, rev. 2005). ESPON 1.1.1:
Potentials for polycentric development in Europe. Stockholm: Nordregio.
[7] Stoleriu, O. (2008). Evoluţia uman geografică şi urbanistică a oraşului Iaşi în perioada postbelică. Iaşi: Terra Nostra.
[8] Stoleriu, O., & Stoleriu, C. (2004). The spatial evolution of Iasi city:tradition and trends. ВІСНИК ЛЬВІВ. УН-ТУ.