
Simulation of Structure, Orientation, and Energy Transfer between AlexaFluor Molecules Attached to...
11
Simulation of Structure, Orientation, and Energy Transfer between AlexaFluor Molecules Attached to MscL Ben Corry and Dylan Jayatilaka School of Biomedical, Biomolecular and Chemical Sciences, University of Western Australia, Crawley, Western Australia ABSTRACT Measurements of time-resolved fluorescence anisotropy and fluorescence resonance energy transfer are finding many applications in the study of biological macromolecules as they enable structural properties of the host molecules to be determined in their natural environment. A difficulty in interpreting these experiments is that they both require knowledge of the relative orientation of the fluorophores, a property that is almost impossible to measure. Here we conduct simulations of AlexaFluor488 and AlexaFluor568 attached to two sites on the membrane channel MscL to provide an alternative mechanism for determining the likely configurations and orientational freedom of the fluorophores, as well as the most likely value of the orientation factor k 2 for energy transfer between them. The fluorophores are relatively mobile, and are found to be more so when immersed in bulk water than when they interact with the lipid membrane. The fluorophores never insert deeply into the lipid, despite their hydrophobic linkers and aromatic headgroup structures. Properties such as the fluorescence anisotropy decay can be predicted from simulations of the fluorophores in bulk water that closely match experimental data. In contrast, when the fluorophores were attached to the large MscL protein it was difficult to sample all the possible configurations of the fluorophores due to the computational time required. While this approach is likely to provide useful data on solvent-accessible fluorophores attached to small proteins, simulations lasting .50 ns or the use of biasing forces are required to accurately predict orientation factors for use in energy transfer experiments on larger membrane-bound proteins. INTRODUCTION Fluorescence spectroscopy is an important tool for under- standing molecular biophysics. Not only can fluorescent tags be used to track the localization of proteins and molecules within cells, they can also be used to probe the operation of individual macromolecules themselves. Fluorophores pref- erentially absorb and emit light polarized in certain directions due to the presence of transition moments within the mo- lecular scaffold. Tracing the degree to which initially polar- ized incident light becomes depolarized upon emission, for example, yields information about how much the fluorophore can rotate between absorption and emission. This in turn can be used to examine the mobility or flexibility of the protein to which it is attached. If the fluorophore is held relatively rigidly to the host molecule, then tracking changes in the orientation of the fluorophore can be used to trace confor- mational changes in the host. Sase et al. (1), for example, were able to follow the axial rotation of actin filaments sliding over myosin fixed to a surface using this approach, while Adachi et al. (2) were able to directly observe the rotary motion of F 1 -ATPase. Fluorescence can also be used as a way to measure dis- tances in macromolecular systems by utilizing the process known as fluorescence resonance energy transfer (FRET). In this, one fluorescent molecule (the donor) excited by a photon of light spontaneously transfers its energy to another mole- cule (the acceptor) by a nonradiative dipole-dipole interac- tion (3–5). The fraction, or efficiency, of energy transferred depends on the distance between the molecules, and typically takes place over distances of 10–100 A ˚ , depending on the spectral characteristics of the molecules. Thus, if fluo- rophores are attached to known sites, measurement of the efficiency of energy transfer provides an ideal probe of inter- and intramolecular distances over macromolecular length scales. With this in mind, FRET has been used for measuring the structure and conformational changes within molecules (6–10), interactions between molecules (11,12), and as a powerful indicator of biochemical events (13). A complica- tion is that as well as being dependent on the distance be- tween the fluorophores, the efficiency of energy transfer is also dependent on the relative orientation of the transition moments of the donor and acceptor molecules. One major difficulty with fluorescence techniques that involve the orientation of the fluorophores is that measuring these orientations and their relation to the host molecule experimentally can be extremely difficult. Indeed, most successful applications involve rigidly binding the fluo- rophore to a single host molecule, and this host molecule to a surface (1,2). In most applications, however, neither of these is achieved, which can introduce a large degree of uncertainty into the interpretation of any results. In FRET, for example, the relative orientation of the donor and acceptor molecules is used to relate the efficiency of energy transfer to the distance between the molecules via the so-called orientation factor k 2 , which can take values between 0 and 4. The difficulties in- volved in determining the orientations mean that in most cases the molecules are simply assumed to rapidly diffuse through all possible orientations to one another, in which case doi: 10.1529/biophysj.107.126243 Submitted November 21, 2007, and accepted for publication May 21, 2008. Address reprint requests to Ben Corry, Tel.: 61-8-64-88-31-66; E-mail: ben. [email protected]. Editor: Helmut Grubmu ¨ller. Ó 2008 by the Biophysical Society 0006-3495/08/09/2711/11 $2.00 Biophysical Journal Volume 95 September 2008 2711–2721 2711
Transcript of Simulation of Structure, Orientation, and Energy Transfer between AlexaFluor Molecules Attached to...
Simulation of Structure, Orientation, and Energy Transfer betweenAlexaFluor Molecules Attached to MscL
Ben Corry and Dylan JayatilakaSchool of Biomedical, Biomolecular and Chemical Sciences, University of Western Australia, Crawley, Western Australia
ABSTRACT Measurements of time-resolved fluorescence anisotropy and fluorescence resonance energy transfer are findingmany applications in the study of biological macromolecules as they enable structural properties of the host molecules to bedetermined in their natural environment. A difficulty in interpreting these experiments is that they both require knowledge of therelative orientation of the fluorophores, a property that is almost impossible to measure. Here we conduct simulations ofAlexaFluor488 and AlexaFluor568 attached to two sites on the membrane channel MscL to provide an alternative mechanism fordetermining the likely configurations and orientational freedom of the fluorophores, as well as the most likely value of the orientationfactor k2 for energy transfer between them. The fluorophores are relatively mobile, and are found to be more so when immersed inbulk water than when they interact with the lipid membrane. The fluorophores never insert deeply into the lipid, despite theirhydrophobic linkers and aromatic headgroup structures. Properties such as the fluorescence anisotropy decay can be predictedfrom simulations of the fluorophores in bulk water that closely match experimental data. In contrast, when the fluorophores wereattached to the large MscL protein it was difficult to sample all the possible configurations of the fluorophores due to thecomputational time required. While this approach is likely to provide useful data on solvent-accessible fluorophores attached tosmall proteins, simulations lasting .50 ns or the use of biasing forces are required to accurately predict orientation factors for use inenergy transfer experiments on larger membrane-bound proteins.
INTRODUCTION
Fluorescence spectroscopy is an important tool for under-
standing molecular biophysics. Not only can fluorescent tags
be used to track the localization of proteins and molecules
within cells, they can also be used to probe the operation of
individual macromolecules themselves. Fluorophores pref-
erentially absorb and emit light polarized in certain directions
due to the presence of transition moments within the mo-
lecular scaffold. Tracing the degree to which initially polar-
ized incident light becomes depolarized upon emission, for
example, yields information about how much the fluorophore
can rotate between absorption and emission. This in turn can
be used to examine the mobility or flexibility of the protein
to which it is attached. If the fluorophore is held relatively
rigidly to the host molecule, then tracking changes in the
orientation of the fluorophore can be used to trace confor-
mational changes in the host. Sase et al. (1), for example,
were able to follow the axial rotation of actin filaments
sliding over myosin fixed to a surface using this approach,
while Adachi et al. (2) were able to directly observe the rotary
motion of F1-ATPase.
Fluorescence can also be used as a way to measure dis-
tances in macromolecular systems by utilizing the process
known as fluorescence resonance energy transfer (FRET). In
this, one fluorescent molecule (the donor) excited by a photon
of light spontaneously transfers its energy to another mole-
cule (the acceptor) by a nonradiative dipole-dipole interac-
tion (3–5). The fraction, or efficiency, of energy transferred
depends on the distance between the molecules, and typically
takes place over distances of 10–100 A, depending on the
spectral characteristics of the molecules. Thus, if fluo-
rophores are attached to known sites, measurement of the
efficiency of energy transfer provides an ideal probe of inter-
and intramolecular distances over macromolecular length
scales. With this in mind, FRET has been used for measuring
the structure and conformational changes within molecules
(6–10), interactions between molecules (11,12), and as a
powerful indicator of biochemical events (13). A complica-
tion is that as well as being dependent on the distance be-
tween the fluorophores, the efficiency of energy transfer is
also dependent on the relative orientation of the transition
moments of the donor and acceptor molecules.
One major difficulty with fluorescence techniques that
involve the orientation of the fluorophores is that measuring
these orientations and their relation to the host molecule
experimentally can be extremely difficult. Indeed, most
successful applications involve rigidly binding the fluo-
rophore to a single host molecule, and this host molecule to a
surface (1,2). In most applications, however, neither of these
is achieved, which can introduce a large degree of uncertainty
into the interpretation of any results. In FRET, for example,
the relative orientation of the donor and acceptor molecules is
used to relate the efficiency of energy transfer to the distance
between the molecules via the so-called orientation factor k2,
which can take values between 0 and 4. The difficulties in-
volved in determining the orientations mean that in most
cases the molecules are simply assumed to rapidly diffuse
through all possible orientations to one another, in which case
doi: 10.1529/biophysj.107.126243
Submitted November 21, 2007, and accepted for publication May 21, 2008.
Address reprint requests to Ben Corry, Tel.: 61-8-64-88-31-66; E-mail: ben.
Editor: Helmut Grubmuller.
� 2008 by the Biophysical Society
0006-3495/08/09/2711/11 $2.00
Biophysical Journal Volume 95 September 2008 2711–2721 2711
a value of k2¼ 2/3 can be used (4,14). The use of this value in
general situations has been long debated (see, for example,
(14,15)), and although it yields reasonable results in many
situations, it is at best an approximation whose validity can only
be determined by comparison with distance measurements
obtained from other means such as from x-ray diffraction.
Recently, techniques have been developed to measure the
orientation of fluorophores relative to the host molecule in
macroscopically ordered systems such as when the host
molecules are embedded in a cell membrane using mea-
surements of the polarization of the emission (16–19) or di-
rectly from confocal images (20). However, at best these
approaches can only be used to place limits on the possible
orientations of the fluorophore relative to the host and cannot
easily discriminate between different models of diffusion of
the fluorophore orientation.
Computational techniques now provide alternative ways to
examine the behavior of large biophysical systems. A recent
publication demonstrated that simulation can be helpful in
interpreting the results of fluorescence anisotropy experi-
ments (21) by differentiating the effect of fast dynamics of the
dye relative to the protein and the slower dynamics of the
protein loop itself and the overall tumbling of the molecule.
Molecular dynamics simulation has also been used to directly
compare the distribution in distances between donor and
acceptor pairs attached to a prion repeat protein allowing the
dynamics of the protein to be determined in atomic detail
(22). More-recent simulations have been used to directly cal-
culate FRET between fluorophores attached to a polyproline
linker (23) or involving tryptophan in a tetracycline repressor
protein (24). No computational studies have been made, how-
ever, to study how the orientation of fluorescent tags added to
proteins influence FRET taking place between them. This sit-
uation is becoming increasingly common as FRET is used to
gather detailed structural information about proteins as they
operate (10,25).
Here, we utilize computer simulation to help solve the
problem of measuring fluorophore orientations with a spe-
cific application to FRET. We examine the orientation of dye
molecules attached to an integral membrane protein MscL.
This protein forms a safety valve in bacterial cells opening a
wide pore under membrane tension to relieve pressure during
hypoosmotic stress (26–28). By carefully parameterizing the
dyes AlexaFluor488 (AF488) and AlexaFluor568 (AF568)
the dye molecules can be simulated when attached to the host
protein embedded in a lipid bilayer. This enables the relative
orientation of the molecules to be determined during simu-
lations for use in relating FRET efficiency measurements to
the distance between the molecules and for comparison with
corresponding experimental measurements. The distances
between the fluorophores during the simulation can also be
compared with values determined in experimental FRET
measurements. Although fluorescent proteins are commonly
used to label proteins when measuring FRET, we concentrate
in this article on the smaller AlexaFluors to complement our
experimental studies and, because, small molecule dyes are
more commonly used when specific distances are being
measured.
METHODS
Structures of the dyes
The structures of the AF488 and AF568 dyes were obtained by performing a
sequence of geometry optimizations using the program Gaussian03 (29). Al-
though the dyes are only available as a mixture of 5- and 6-isomers (Invitrogen-
Molecular Probes, Eugene, OR), we restricted our study to the 5-isomer, hoping
that this would make only a small adjustment to the final orientation of the dye
molecule relative to the protein and membrane. An initial guess of each
structure based upon a previously reported study of AF488 (21) was first ge-
ometry-optimized using Hartree-Fock theory and a 3-21G basis set. The results
of this were then fed into a similar calculation using a 6-31G basis set, then a
6-31G* basis set before a final geometry was obtained using the 6-311G* basis
set for consistency with the CHARMM force field. Unlike the previous study of
AF488 (21), five CH2 groups were included in the linker to make the structure
consistent with that published by Invitrogen-Molecular Probes.
Parameterization of the dyes
The AlexaFluor dyes are comprised of an alkane linker attached to a large
aromatic headgroup with an extended p-electron system. For this reason,
they pose difficult targets for accurate parameterization for use with classical
force-field methods. Fortunately, the headgroups of the dyes are likely to
remain relatively planar in most situations. Thus, the overall orientation of
the dye relative to the host molecule is most strongly influenced by the be-
havior of the linker region that is much more similar to well-parameterized
molecules, an assertion that is supported by the simulations presented here.
Partial charges on the atoms were determined by fitting the electrostatic
potential (i.e., the ESP method) (30,31) on the results of a BLYP density
functional calculation utilizing the geometry-optimized structures. Due to the
presence of sulfur atoms, a triple-z 6-3111G** basis set was used for this
purpose. During resonance energy transfer, the donor molecule exists in an
excited state before passing its energy to the acceptor molecule. As we are
interested in the relative orientation of the molecules during such transfer
events, we must calculate partial charges on the donor molecule in its first
excited state. Atomic charges were calculated for both the ground and first
excited states using time-dependent methods (32), and in all cases these
charges were within 0.05 e of each other. Thus, the same set of partial charges
could reasonably be used to represent both states. Any slightly asymmetric
charges were adjusted to maintain the symmetry of the dye headgroup. Also,
the aliphatic hydrogens were assigned a charge of 0.09 and the carbon to
which they were attached adjusted to neutralize this as is standard in the
CHARMM force field. Unlike in the previous study of AF488 (21), the total
charge of each dye was set to�1 (rather than�2) as suggested by Invitrogen-
Molecular Probes, and to make the molecule a closed shell system.
The equilibrium bond lengths, bond angles, and dihedral angles were de-
termined from the quantum mechanical structures. Force constants, however,
were determined from comparison to atoms with similar chemical environ-
ments in the CHARMM27 force field. The van der Waals parameters of the
atoms are much less sensitive to the environment and were similarly derived
from similar atom types in the force field. Partial charges and bond parameters
for the bound form of the AlexaFluor molecules were obtained from quantum
mechanical calculations of the AlexaFluor linker to a cysteine residue.
Determination of transition dipole moments
To be able to determine the angle between the transition moments of the dyes
to the plane of the membrane as well as the angle between the donor and
acceptor transition moments during molecular dynamics simulations, the
2712 Corry and Jayatilaka
Biophysical Journal 95(6) 2711–2721
orientation of these moments within the molecular structure must be deter-
mined. Calculations were made on both the entire geometry-optimized
AlexaFluor structures, and on just the three-ring headgroup to allow larger
basis sets to be used. Excited state calculations were made using both the
single excitation CI-singles (33) and time-dependent methods (32) using
either Hartree-Fock or density functional theory. Basis sets ranging from
STO-3G to 6-31111G** were used for the headgroup calculations, while
basis sets up to 6-31G* were examined for calculations on the entire molecule.
Calculations were made using both Gaussian03 (29) and MOLPRO (34).
Molecular dynamics simulations
To conduct MD simulations, the imaged structure of the MscL protein (35)
(PDB entry 1MSL) was placed within a 120 3 120 A patch of POPC lipid
membrane and solvated in a flexible TIP3 water- and ion-containing box (150
mM NaCl) making sure the entire system remained neutral as illustrated in
Fig. 1. The entire system contained ;170,000 atoms. Molecular dynamics
simulations were performed with NAMD (36) using the CHARMM27 all-
atom parameter set with a timestep of 1 fs and periodic boundaries. Electro-
static interactions were calculated using the particle-mesh Ewald scheme,
while Lennard-Jones interactions are cut-off distance at 12 A. All simulations
were carried out at constant pressure (1 atmosphere) and temperature (310 K).
Initially, the MscL protein was equilibrated without dye molecules at-
tached. To do this, the lipid and water was initially energy-minimized for
1000 steps while the protein was held fixed. Then, the protein backbone was
fixed and all other atoms were minimized for a further 5000 steps before
releasing the backbone and minimizing for a further 1000 steps. After this,
harmonic constraints (3 kcal/A2) were applied to the a-carbon atoms of the
protein and the system was heated to 310 K over 3 ps of simulation before
simulating for an additional 20 ps. Finally the restraints on the backbone
atoms were halved for another 20 ps of simulation before turning all restraints
off and simulating the entire system for 3.7 ns.
After this initial equilibration, separate simulations were conducted with
AlexaFluor dyes attached at either residue 42 (end of a transmembrane helix)
or at residue 55 (periplasmic domain). As the functional protein is pen-
tameric, when one fluorophore is attached to each subunit a total of five
fluorophores are included in the simulation. In this case we attach three
AF488 molecules and two AF568. To attach the dye molecules, a mutation
was introduced into each of the five subunits of the protein to mimic the
introduction of a cysteine residue at that position as done experimentally
when labeling the protein (10). Then, the dye molecules were positioned with
their linkers adjacent to the cysteine residues to which they are attached and
the headgroup pointing away from the protein and the dye was joined to the
protein with a covalent bond. Water or ions overlapping with the dye were
removed from the system. The system was then energy-minimized for 5000
steps before dynamics simulations were run. In addition, simulations were
also made in which part of the protein and just one of the dye molecules were
simulated as described in detail below.
Separate simulations were also conducted to examine the behavior of the
free dye molecules in water. In these, the dye molecule was placed in a 40 A3
box of water molecules with one Na1 ion to keep the system neutral. Simu-
lations were performed with periodic boundary conditions as described above.
Calculation of fluorescence anisotropy andorientation factor
The fluorescence anisotropy was calculated from the simulations using an
approach similar to that described previously, assuming the absorption and
emission dipoles are parallel (21). The vector describing the transition mo-
ment was saved at every step and the anisotropy as a function of time cal-
culated from
rðtÞ ¼ 2
5ÆP2 mðsÞ � mðs 1 tÞ½ �æ; (1)
where P2(x) ¼ (3x2 – 1)/2, m(s) is the transition moment at the time of
excitation and m(s 1 t) is the transition moment some time later. The averaging
is achieved by taking results using each frame of the simulation as the time of
excitation in turn and averaging results for the given time t after this.
The orientation factor k2 can be easily calculated at any frame of the
simulation from the transition moments using
k2 ¼ ðcosuT � 3cosuDcosuAÞ2; (2)
where uT is the angle between the transition moments of the donor and
acceptor, uD is the angle between the donor transition moment and the line
connecting the donor and acceptor, and uA is the angle between the acceptor
transition moment and this line.
Measures of the mobility ofindividual fluorophores
The average orientation of the fluorophores relative to the membrane and
their mobility cannot be measured experimentally. All that can be determined
is the B-factor that depends on both of these quantities (20),
B ¼ ð3cos2a� 1Þ u� 1
3
� �; (3)
in which a is the average angle between the fluorophore transition moment
and the membrane normal. The quantity u represents a measure of the
orientational freedom of the fluorophore with values closer to 1 representing
more rigidly held orientations. The value u ¼ 1 implies fixed fluorophore
orientations and u ¼ 1/3 completely free orientations. The parameter u does
not contain informational about the rate of orientational rearrangement, only
the average orientational distribution and cannot be directly related to the
fluorescence anisotropy decay r(t). The expression u ¼ 1, however, does
imply that the anisotropy is constant r(t) ¼ 2/5.
RESULTS
Structures of the dyes
The geometry-optimized structures of the AlexaFluor dyes
are shown in Fig. 2, A and B, respectively. Consistent
transition moments were obtained using both CIS and TD
Hartree-Fock methods for both the entire molecule and
the headgroup only (provided the basis set was larger than
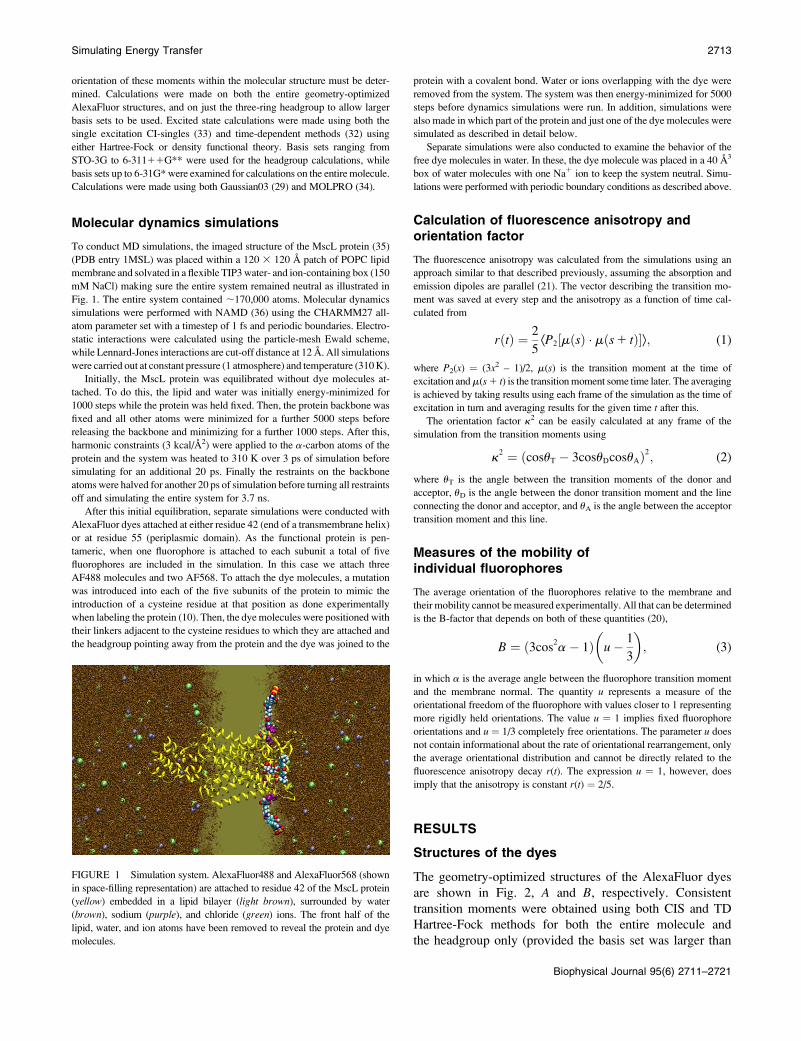
FIGURE 1 Simulation system. AlexaFluor488 and AlexaFluor568 (shown
in space-filling representation) are attached to residue 42 of the MscL protein
(yellow) embedded in a lipid bilayer (light brown), surrounded by water
(brown), sodium (purple), and chloride (green) ions. The front half of the
lipid, water, and ion atoms have been removed to reveal the protein and dye
molecules.
Simulating Energy Transfer 2713
Biophysical Journal 95(6) 2711–2721
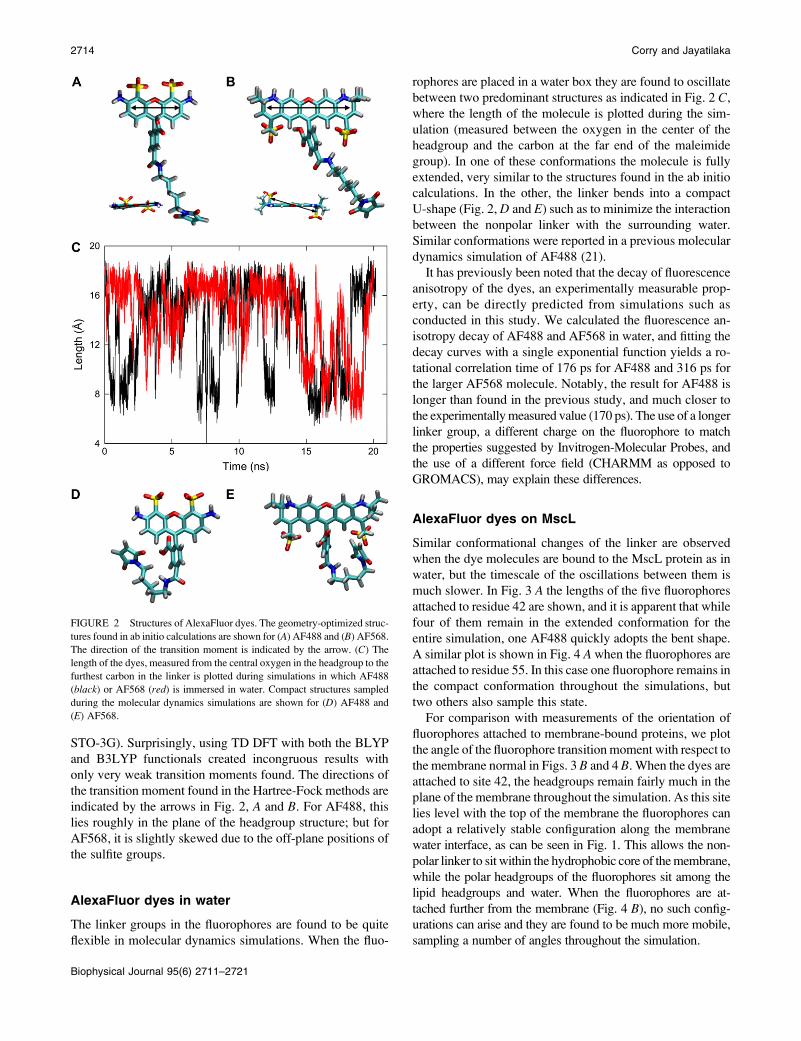
STO-3G). Surprisingly, using TD DFT with both the BLYP
and B3LYP functionals created incongruous results with
only very weak transition moments found. The directions of
the transition moment found in the Hartree-Fock methods are
indicated by the arrows in Fig. 2, A and B. For AF488, this
lies roughly in the plane of the headgroup structure; but for
AF568, it is slightly skewed due to the off-plane positions of
the sulfite groups.
AlexaFluor dyes in water
The linker groups in the fluorophores are found to be quite
flexible in molecular dynamics simulations. When the fluo-
rophores are placed in a water box they are found to oscillate
between two predominant structures as indicated in Fig. 2 C,
where the length of the molecule is plotted during the sim-
ulation (measured between the oxygen in the center of the
headgroup and the carbon at the far end of the maleimide
group). In one of these conformations the molecule is fully
extended, very similar to the structures found in the ab initio
calculations. In the other, the linker bends into a compact
U-shape (Fig. 2, D and E) such as to minimize the interaction
between the nonpolar linker with the surrounding water.
Similar conformations were reported in a previous molecular
dynamics simulation of AF488 (21).
It has previously been noted that the decay of fluorescence
anisotropy of the dyes, an experimentally measurable prop-
erty, can be directly predicted from simulations such as
conducted in this study. We calculated the fluorescence an-
isotropy decay of AF488 and AF568 in water, and fitting the
decay curves with a single exponential function yields a ro-
tational correlation time of 176 ps for AF488 and 316 ps for
the larger AF568 molecule. Notably, the result for AF488 is
longer than found in the previous study, and much closer to
the experimentally measured value (170 ps). The use of a longer
linker group, a different charge on the fluorophore to match
the properties suggested by Invitrogen-Molecular Probes, and
the use of a different force field (CHARMM as opposed to
GROMACS), may explain these differences.
AlexaFluor dyes on MscL
Similar conformational changes of the linker are observed
when the dye molecules are bound to the MscL protein as in
water, but the timescale of the oscillations between them is
much slower. In Fig. 3 A the lengths of the five fluorophores
attached to residue 42 are shown, and it is apparent that while
four of them remain in the extended conformation for the
entire simulation, one AF488 quickly adopts the bent shape.
A similar plot is shown in Fig. 4 A when the fluorophores are
attached to residue 55. In this case one fluorophore remains in
the compact conformation throughout the simulations, but
two others also sample this state.
For comparison with measurements of the orientation of
fluorophores attached to membrane-bound proteins, we plot
the angle of the fluorophore transition moment with respect to
the membrane normal in Figs. 3 B and 4 B. When the dyes are
attached to site 42, the headgroups remain fairly much in the
plane of the membrane throughout the simulation. As this site
lies level with the top of the membrane the fluorophores can
adopt a relatively stable configuration along the membrane
water interface, as can be seen in Fig. 1. This allows the non-
polar linker to sit within the hydrophobic core of the membrane,
while the polar headgroups of the fluorophores sit among the
lipid headgroups and water. When the fluorophores are at-
tached further from the membrane (Fig. 4 B), no such config-
urations can arise and they are found to be much more mobile,
sampling a number of angles throughout the simulation.
FIGURE 2 Structures of AlexaFluor dyes. The geometry-optimized struc-
tures found in ab initio calculations are shown for (A) AF488 and (B) AF568.
The direction of the transition moment is indicated by the arrow. (C) The
length of the dyes, measured from the central oxygen in the headgroup to the
furthest carbon in the linker is plotted during simulations in which AF488
(black) or AF568 (red) is immersed in water. Compact structures sampled
during the molecular dynamics simulations are shown for (D) AF488 and
(E) AF568.
2714 Corry and Jayatilaka
Biophysical Journal 95(6) 2711–2721
The actual angle of the fluorophore relative to the mem-
brane cannot be measured directly using experimental methods
(20). Rather, what can be measured is the so-called B-factor
that relates the average angle and the mobility of the fluo-
rophore. In Table 1, we show the average angle, mobility, and
B-factor for each of the fluorophores in the two simulations.
The mobility, or orientational freedom of the fluorophores is
denoted by the parameter u that can range from 0 for com-
pletely mobile fluorophores to 1 for fluorophores with a fixed
orientation (20). The values of u show that the fluorophores
are more mobile when attached to the periplasmic domain in
agreement with previous results. Surprisingly, this freedom
means that the values of the B-factor are very different for
each fluorophore, adopting both positive and negative values,
and show greater variation than when the fluorophores are
attached to site 42. The B parameter has been measured ex-
perimentally for these situations, yielding values of �0.10,
�0.19 for AF488 and AF568 attached to site 42 and �0.08,
and �0.15 when attached to site 55 (20). The difference
between the simulated values and the measured ones, as well
as the variation within the results for the different fluo-
rophores, suggests that the simulation has not been conducted
for long enough to obtain reliable average values, a point that
will be discussed in more detail below.
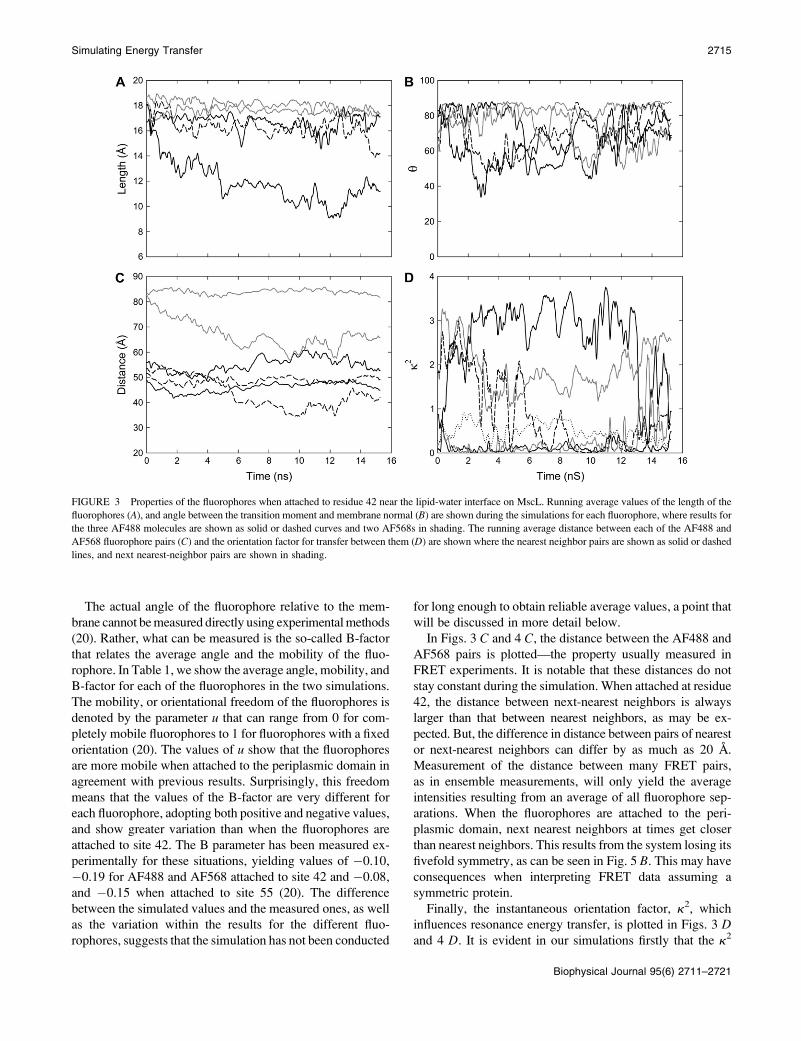
In Figs. 3 C and 4 C, the distance between the AF488 and
AF568 pairs is plotted—the property usually measured in
FRET experiments. It is notable that these distances do not
stay constant during the simulation. When attached at residue
42, the distance between next-nearest neighbors is always
larger than that between nearest neighbors, as may be ex-
pected. But, the difference in distance between pairs of nearest
or next-nearest neighbors can differ by as much as 20 A.
Measurement of the distance between many FRET pairs,
as in ensemble measurements, will only yield the average
intensities resulting from an average of all fluorophore sep-
arations. When the fluorophores are attached to the peri-
plasmic domain, next nearest neighbors at times get closer
than nearest neighbors. This results from the system losing its
fivefold symmetry, as can be seen in Fig. 5 B. This may have
consequences when interpreting FRET data assuming a
symmetric protein.
Finally, the instantaneous orientation factor, k2, which
influences resonance energy transfer, is plotted in Figs. 3 Dand 4 D. It is evident in our simulations firstly that the k2
FIGURE 3 Properties of the fluorophores when attached to residue 42 near the lipid-water interface on MscL. Running average values of the length of the
fluorophores (A), and angle between the transition moment and membrane normal (B) are shown during the simulations for each fluorophore, where results for
the three AF488 molecules are shown as solid or dashed curves and two AF568s in shading. The running average distance between each of the AF488 and
AF568 fluorophore pairs (C) and the orientation factor for transfer between them (D) are shown where the nearest neighbor pairs are shown as solid or dashed
lines, and next nearest-neighbor pairs are shown in shading.
Simulating Energy Transfer 2715
Biophysical Journal 95(6) 2711–2721
value is often significantly different between different pairs
of fluorophores. Secondly, these values change significantly
during the simulation, and it is not unusual for the fluo-
rophores to sample the entire range of possible values (0–4)
within the short simulation time (15 ns). Given that the fluo-
rescence lifetime of most fluorophores is a few nanoseconds,
it is quite likely that their relative orientation will change
while the donor is excited, a fact that should be apparent in
measurements of fluorescence anisotropy.
The average value of k2 for each fluorophore pair is shown in
Table 2. The MscL protein is made from five identical subunits,
meaning that the fluorophores are attached to identical sites.
Thus, the fact that differing pairs of fluorophores have very
different average k2 values suggests that the simulations have
not been run for long enough to obtain good average values,
and that longer simulations are required to directly predict the
orientation factor from such simulations. Unfortunately, the
size of the simulation makes this computationally demanding.
Single AlexaFluor dyes on MscL
As simulations of fluorophores attached to the complete
MscL pentamer did not allow the average orientation factor
(or FRET efficiency) to be determined, two alternative ap-
proaches were examined to overcome the computational re-
quirements of long simulations. The first involved conducting
simulations on smaller systems containing only one fluo-
rophore while the second approach was to assume that each
fluorophore moves independently to increase the ensemble
that was being averaged.
Six additional simulations were conducted on smaller
systems, each containing just one-fifth of the protein and one
fluorophore. Two independent simulations were conducted
with each of AF488 and AF568 attached to site 42 (one for 50
ns and one for 25 ns), while one was conducted with each
fluorophore attached to site 55 (each 30 ns in length). To do
this, a region of the large simulations containing the desired
fluorophore along with the surrounding protein, lipid, and
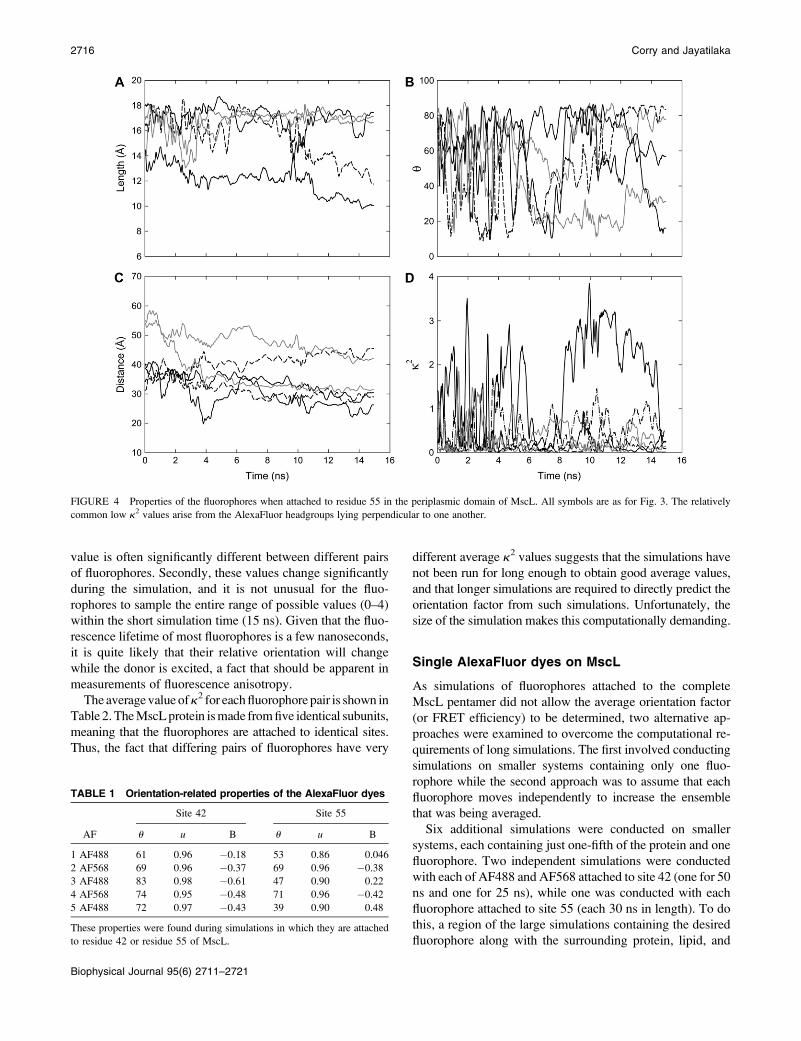
FIGURE 4 Properties of the fluorophores when attached to residue 55 in the periplasmic domain of MscL. All symbols are as for Fig. 3. The relatively
common low k2 values arise from the AlexaFluor headgroups lying perpendicular to one another.
TABLE 1 Orientation-related properties of the AlexaFluor dyes
Site 42 Site 55
AF u u B u u B
1 AF488 61 0.96 �0.18 53 0.86 0.046
2 AF568 69 0.96 �0.37 69 0.96 �0.38
3 AF488 83 0.98 �0.61 47 0.90 0.22
4 AF568 74 0.95 �0.48 71 0.96 �0.42
5 AF488 72 0.97 �0.43 39 0.90 0.48
These properties were found during simulations in which they are attached
to residue 42 or residue 55 of MscL.
2716 Corry and Jayatilaka
Biophysical Journal 95(6) 2711–2721
water was selected. Atoms within 2 A of the edge were held
by strong harmonic constraints (2 kcal/mol A2) to maintain
the integrity of the system, while the remainder of the atoms
could move freely. Snapshots showing the selected protein
and fluorophore are shown in Fig. 5.
Simulations on these smaller systems could be conducted
for up to 50 ns—significantly longer than any conducted on
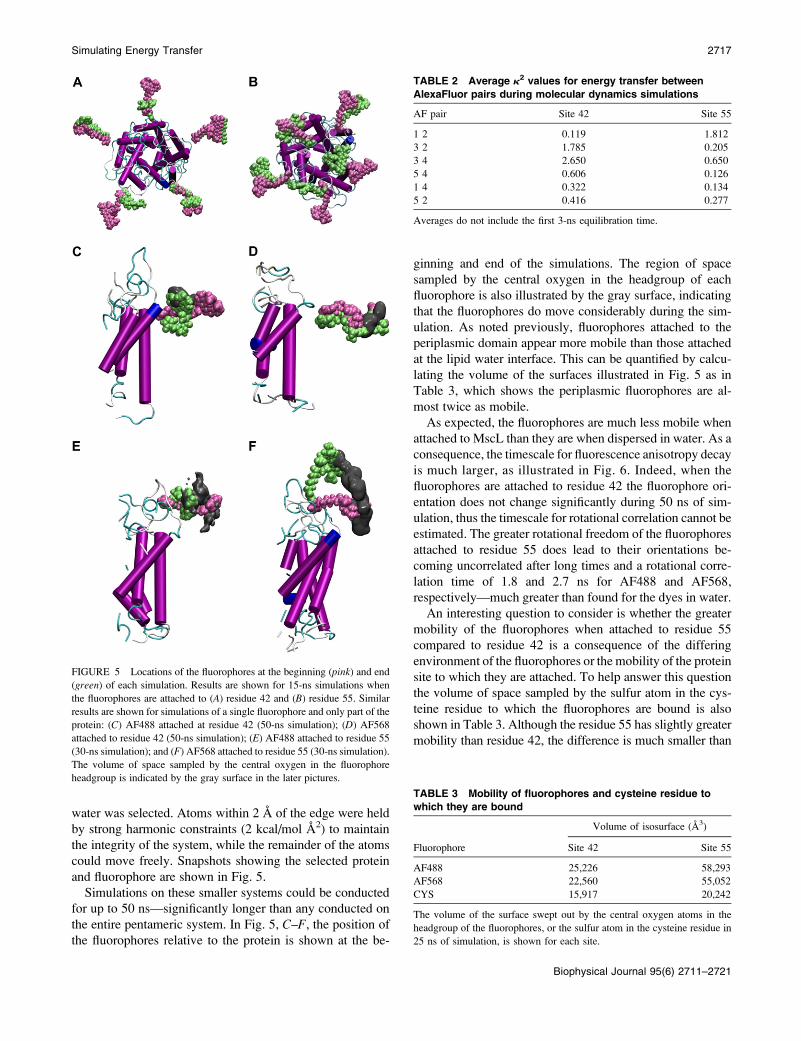
the entire pentameric system. In Fig. 5, C–F, the position of
the fluorophores relative to the protein is shown at the be-
ginning and end of the simulations. The region of space
sampled by the central oxygen in the headgroup of each
fluorophore is also illustrated by the gray surface, indicating
that the fluorophores do move considerably during the sim-
ulation. As noted previously, fluorophores attached to the
periplasmic domain appear more mobile than those attached
at the lipid water interface. This can be quantified by calcu-
lating the volume of the surfaces illustrated in Fig. 5 as in
Table 3, which shows the periplasmic fluorophores are al-
most twice as mobile.
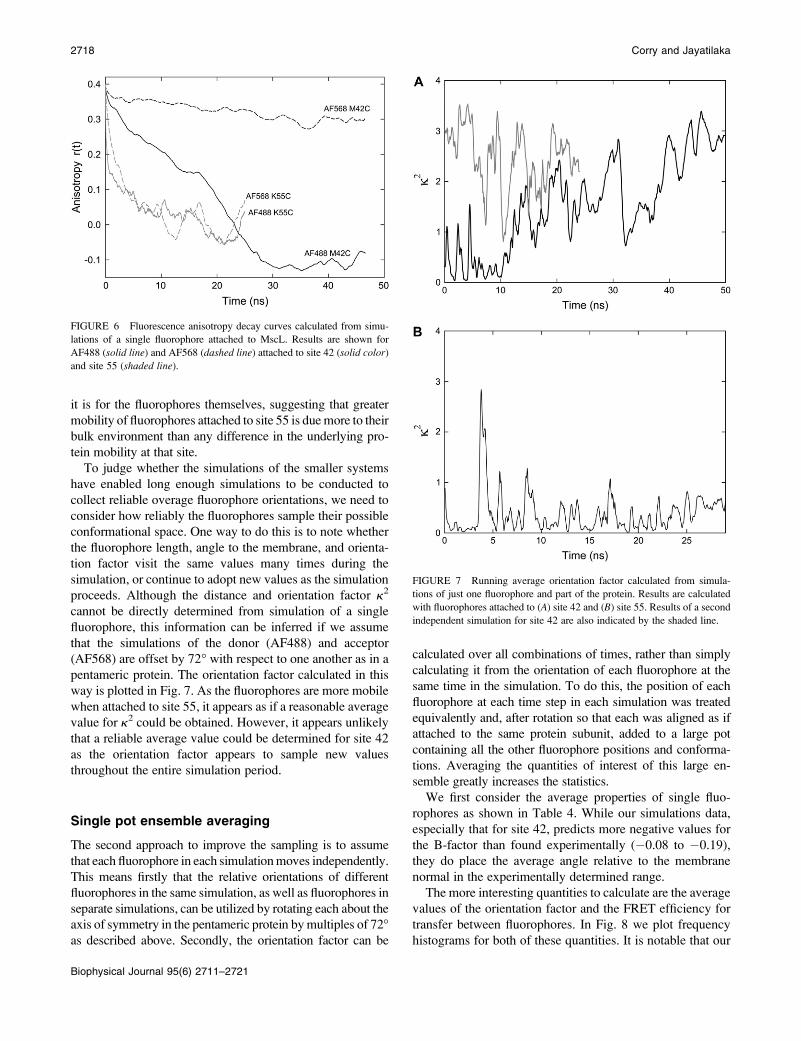
As expected, the fluorophores are much less mobile when
attached to MscL than they are when dispersed in water. As a
consequence, the timescale for fluorescence anisotropy decay
is much larger, as illustrated in Fig. 6. Indeed, when the
fluorophores are attached to residue 42 the fluorophore ori-
entation does not change significantly during 50 ns of sim-
ulation, thus the timescale for rotational correlation cannot be
estimated. The greater rotational freedom of the fluorophores
attached to residue 55 does lead to their orientations be-
coming uncorrelated after long times and a rotational corre-
lation time of 1.8 and 2.7 ns for AF488 and AF568,
respectively—much greater than found for the dyes in water.
An interesting question to consider is whether the greater
mobility of the fluorophores when attached to residue 55
compared to residue 42 is a consequence of the differing
environment of the fluorophores or the mobility of the protein
site to which they are attached. To help answer this question
the volume of space sampled by the sulfur atom in the cys-
teine residue to which the fluorophores are bound is also
shown in Table 3. Although the residue 55 has slightly greater
mobility than residue 42, the difference is much smaller than
FIGURE 5 Locations of the fluorophores at the beginning (pink) and end
(green) of each simulation. Results are shown for 15-ns simulations when
the fluorophores are attached to (A) residue 42 and (B) residue 55. Similar
results are shown for simulations of a single fluorophore and only part of the
protein: (C) AF488 attached at residue 42 (50-ns simulation); (D) AF568
attached to residue 42 (50-ns simulation); (E) AF488 attached to residue 55
(30-ns simulation); and (F) AF568 attached to residue 55 (30-ns simulation).
The volume of space sampled by the central oxygen in the fluorophore
headgroup is indicated by the gray surface in the later pictures.
TABLE 2 Average k2 values for energy transfer between
AlexaFluor pairs during molecular dynamics simulations
AF pair Site 42 Site 55
1 2 0.119 1.812
3 2 1.785 0.205
3 4 2.650 0.650
5 4 0.606 0.126
1 4 0.322 0.134
5 2 0.416 0.277
Averages do not include the first 3-ns equilibration time.
TABLE 3 Mobility of fluorophores and cysteine residue to
which they are bound
Volume of isosurface (A3)
Fluorophore Site 42 Site 55
AF488 25,226 58,293
AF568 22,560 55,052
CYS 15,917 20,242
The volume of the surface swept out by the central oxygen atoms in the
headgroup of the fluorophores, or the sulfur atom in the cysteine residue in
25 ns of simulation, is shown for each site.
Simulating Energy Transfer 2717
Biophysical Journal 95(6) 2711–2721
it is for the fluorophores themselves, suggesting that greater
mobility of fluorophores attached to site 55 is due more to their
bulk environment than any difference in the underlying pro-
tein mobility at that site.
To judge whether the simulations of the smaller systems
have enabled long enough simulations to be conducted to
collect reliable overage fluorophore orientations, we need to
consider how reliably the fluorophores sample their possible
conformational space. One way to do this is to note whether
the fluorophore length, angle to the membrane, and orienta-
tion factor visit the same values many times during the
simulation, or continue to adopt new values as the simulation
proceeds. Although the distance and orientation factor k2
cannot be directly determined from simulation of a single
fluorophore, this information can be inferred if we assume
that the simulations of the donor (AF488) and acceptor
(AF568) are offset by 72� with respect to one another as in a
pentameric protein. The orientation factor calculated in this
way is plotted in Fig. 7. As the fluorophores are more mobile
when attached to site 55, it appears as if a reasonable average
value for k2 could be obtained. However, it appears unlikely
that a reliable average value could be determined for site 42
as the orientation factor appears to sample new values
throughout the entire simulation period.
Single pot ensemble averaging
The second approach to improve the sampling is to assume
that each fluorophore in each simulation moves independently.
This means firstly that the relative orientations of different
fluorophores in the same simulation, as well as fluorophores in
separate simulations, can be utilized by rotating each about the
axis of symmetry in the pentameric protein by multiples of 72�as described above. Secondly, the orientation factor can be
calculated over all combinations of times, rather than simply
calculating it from the orientation of each fluorophore at the
same time in the simulation. To do this, the position of each
fluorophore at each time step in each simulation was treated
equivalently and, after rotation so that each was aligned as if
attached to the same protein subunit, added to a large pot
containing all the other fluorophore positions and conforma-
tions. Averaging the quantities of interest of this large en-
semble greatly increases the statistics.
We first consider the average properties of single fluo-
rophores as shown in Table 4. While our simulations data,
especially that for site 42, predicts more negative values for
the B-factor than found experimentally (�0.08 to �0.19),
they do place the average angle relative to the membrane
normal in the experimentally determined range.
The more interesting quantities to calculate are the average
values of the orientation factor and the FRET efficiency for
transfer between fluorophores. In Fig. 8 we plot frequency
histograms for both of these quantities. It is notable that our
FIGURE 6 Fluorescence anisotropy decay curves calculated from simu-
lations of a single fluorophore attached to MscL. Results are shown for
AF488 (solid line) and AF568 (dashed line) attached to site 42 (solid color)
and site 55 (shaded line).
FIGURE 7 Running average orientation factor calculated from simula-
tions of just one fluorophore and part of the protein. Results are calculated
with fluorophores attached to (A) site 42 and (B) site 55. Results of a second
independent simulation for site 42 are also indicated by the shaded line.
2718 Corry and Jayatilaka
Biophysical Journal 95(6) 2711–2721
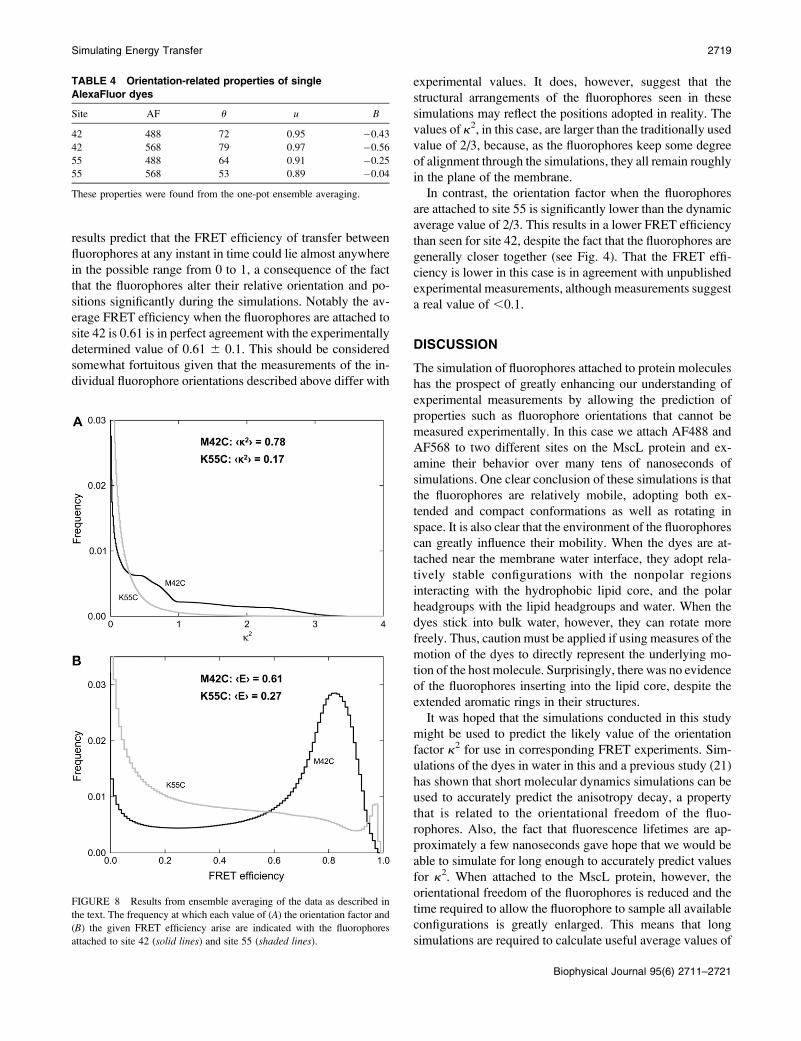
results predict that the FRET efficiency of transfer between
fluorophores at any instant in time could lie almost anywhere
in the possible range from 0 to 1, a consequence of the fact
that the fluorophores alter their relative orientation and po-
sitions significantly during the simulations. Notably the av-
erage FRET efficiency when the fluorophores are attached to
site 42 is 0.61 is in perfect agreement with the experimentally
determined value of 0.61 6 0.1. This should be considered
somewhat fortuitous given that the measurements of the in-
dividual fluorophore orientations described above differ with
experimental values. It does, however, suggest that the
structural arrangements of the fluorophores seen in these
simulations may reflect the positions adopted in reality. The
values of k2, in this case, are larger than the traditionally used
value of 2/3, because, as the fluorophores keep some degree
of alignment through the simulations, they all remain roughly
in the plane of the membrane.
In contrast, the orientation factor when the fluorophores
are attached to site 55 is significantly lower than the dynamic
average value of 2/3. This results in a lower FRET efficiency
than seen for site 42, despite the fact that the fluorophores are
generally closer together (see Fig. 4). That the FRET effi-
ciency is lower in this case is in agreement with unpublished
experimental measurements, although measurements suggest
a real value of ,0.1.
DISCUSSION
The simulation of fluorophores attached to protein molecules
has the prospect of greatly enhancing our understanding of
experimental measurements by allowing the prediction of
properties such as fluorophore orientations that cannot be
measured experimentally. In this case we attach AF488 and
AF568 to two different sites on the MscL protein and ex-
amine their behavior over many tens of nanoseconds of
simulations. One clear conclusion of these simulations is that
the fluorophores are relatively mobile, adopting both ex-
tended and compact conformations as well as rotating in
space. It is also clear that the environment of the fluorophores
can greatly influence their mobility. When the dyes are at-
tached near the membrane water interface, they adopt rela-
tively stable configurations with the nonpolar regions
interacting with the hydrophobic lipid core, and the polar
headgroups with the lipid headgroups and water. When the
dyes stick into bulk water, however, they can rotate more
freely. Thus, caution must be applied if using measures of the
motion of the dyes to directly represent the underlying mo-
tion of the host molecule. Surprisingly, there was no evidence
of the fluorophores inserting into the lipid core, despite the
extended aromatic rings in their structures.
It was hoped that the simulations conducted in this study
might be used to predict the likely value of the orientation
factor k2 for use in corresponding FRET experiments. Sim-
ulations of the dyes in water in this and a previous study (21)
has shown that short molecular dynamics simulations can be
used to accurately predict the anisotropy decay, a property
that is related to the orientational freedom of the fluo-
rophores. Also, the fact that fluorescence lifetimes are ap-
proximately a few nanoseconds gave hope that we would be
able to simulate for long enough to accurately predict values
for k2. When attached to the MscL protein, however, the
orientational freedom of the fluorophores is reduced and the
time required to allow the fluorophore to sample all available
configurations is greatly enlarged. This means that long
simulations are required to calculate useful average values of
TABLE 4 Orientation-related properties of single
AlexaFluor dyes
Site AF u u B
42 488 72 0.95 �0.43
42 568 79 0.97 �0.56
55 488 64 0.91 �0.25
55 568 53 0.89 �0.04
These properties were found from the one-pot ensemble averaging.
FIGURE 8 Results from ensemble averaging of the data as described in
the text. The frequency at which each value of (A) the orientation factor and
(B) the given FRET efficiency arise are indicated with the fluorophores
attached to site 42 (solid lines) and site 55 (shaded lines).
Simulating Energy Transfer 2719
Biophysical Journal 95(6) 2711–2721
the orientation of the transition moments of the fluorophores
relative to the plane of the membrane and to each other.
Alternatively, given the short length of the excited state
compared to the timescale of mobility of the fluorophores, it
is possible that FRET measurements could be sampling
nonequilibrium configurations. We simulated for up to 50 ns,
but were unable to obtain useful values as is apparent in the
discrepancies between our predicted B factors and measured
values. As a consequence, we were unable to predict the most
likely value of k2 to use when interpreting our experiments.
It is worthwhile reflecting under what conditions the ap-
proach developed here will be of use in determining likely
orientation factors in situations of biological relevance. The
methodology is not straightforward; it requires accurate pa-
rameterization of the fluorophores for use in MD simulations,
since this has not previously been done for many such mol-
ecules. It requires knowledge of the orientation of the tran-
sition dipoles within the molecule from experimental
measurements or a willingness to calculate these using ab
initio methods. Finally it requires long molecular dynamics
simulations to derive accurate average properties. The poor
sampling arising in our simulations results both from having
a large protein that requires a large simulation system, and the
interaction of the fluorophores with the lipid that reduces
their mobility. Such issues may be less of a problem in small
soluble proteins, or could be countered by using greater
computational power. This means that an assessment of the
solvent accessibility of the fluorophores and the size of the
protein may help to determine whether the computational
effort involved in simulating it is likely to achieve worth-
while results.
Alternatively, rather than using a brute force approach that
requires large simulations times to determine the fluorophore
orientations as in this study, biasing forces could be used to
make the fluorophores sample a greater range of configura-
tions is a shorter simulation time. Using umbrella sampling
(37–39) with the location of the center of the fluorophore
headgroup as the reaction coordinate, for example, could
enable a probability distribution function for the fluorophore
configurations to be determined, from which much better
average orientations could be extrapolated.
Although still in its infancy, the use of molecular simula-
tions to better understand and interpret fluorescence experi-
ments holds great promise.
Parameter files for the AlexaFluor dyes are available from the authors.
This work is supported by funding from the Australian Research Council,
an award under the Merit Allocation Scheme on the Australian Partnership
for Advanced Computing National Facility at the Australian National
University, and additional computer time from iVEC.
REFERENCES
1. Sase, I., H. Miyata, S. Ishiwata, and K. Kinosita. 1997. Axial rotationof sliding actin filaments revealed by single-fluorophore imaging. Proc.Natl. Acad. Sci. USA. 94:5646–5650.
2. Adachi, K., R. Yasuda, H. Noji, H. Itoh, Y. Harada, M. Yoshida, andJ. K. Kinosita. 2000. Stepping rotation of F1-ATPase visualized throughangle-resolved single-fluorophore imaging. Proc. Natl. Acad. Sci. USA.97:7243–7247.
3. Forster, T. 1959. Transfer mechanisms of electronic excitation. Dis-cuss. Faraday Soc. 27:7–17.
4. van der Meer, B., G. Coker, and S. Chen. 1994. Resonance EnergyTransfer: Theory and Data. VCH, New York.
5. Clegg, R. 1996. Fluorescence resonance energy transfer (FRET). InFluorescence Imaging Spectroscopy and Microscopy. X. F. Wang andB. Herman, editors. Wiley and Sons, New York.
6. Haas, E., E. Katchalski-Katzir, and I. Steinberg. 1975. Effect of theorientation of donor and acceptor on the probability of energy transferinvolving electronic transitions of mixed polarization. Biochemistry.17:5065–5070.
7. Lakowicz, J., I. Gryczynski, W. Wiczk, G. Laczko, F. Prendergast, andM. Johnson. 1990. Conformational distributions of melittin in water/methanol mixtures from frequency-domain measurements of non-radiative energy transfer. Biophys. Chem. 36:99–115.
8. Chapman, E., K. Alexander, T. Vorherr, E. Carafoil, and D. Storm.1992. Fluorescence energy transfer analysis of calmodulin-peptide com-plexes. Biochemistry. 31:12819–12825.
9. Heyduk, T. 2002. Measuring protein conformational changes byFRET/LRET. Curr. Opin. Biotechnol. 13:292–296.
10. Corry, B., P. Rigby, Z. Liu, and B. Martinac. 2005. Conformationalchanges involved in MscL channel gating measured using FRETspectroscopy. Biophys. J. 89:L49–L51.
11. Hink, M., T. Bisselin, and A. Visser. 2002. Imaging protein-proteininteractions in living cells. Plant Mol. Biol. 50:871–883.
12. Parsons, M., B. Vojnovic, and S. Ameer-Beg. 2004. Imaging protein-protein interactions in cell motility using fluorescence resonanceenergy transfer (FRET). Biochem. Soc. Trans. 32:431–433.
13. Bunt, G., and F. Wouters. 2004. Visualization of molecular activ-ities inside living cells with fluorescent labels. Int. Rev. Cytol. 237:205–277.
14. Remedios, C. D., and P. Moens. 1995. Fluorescence resonance energytransfer spectroscopy is a reliable ‘‘ruler’’ for measuring structuralchanges in proteins. J. Struct. Biol. 115:175–185.
15. Dale, R., J. Eisinger, and W. Blumberg. 1979. The orientationalfreedom of molecular probes: the orientation factor in intramolecularenergy transfer. Biophys. J. 26:161–194.
16. van der Meer, B., R. P. H. Kooyman, and Y. K. Levine. 1982. A theoryof fluorescence depolarization in macroscopically ordered membranesystems. Chem. Phys. 66:39–50.
17. van Gurp, M., H. van Langen, G. van Ginkel, and Y. Levine. 1988.Angle resolved techniques in studies of organic molecules in orderedsystems using polarized light. In Polarized Spectroscopy of OrderedSystems. Kluwer, Dordrecht, the Netherlands.
18. van der Heide, U., B. Orbons, H. Gerritsen, and Y. Levine. 1992. Theorientation of transition moments of dye molecules used in fluores-cence studies of muscle systems. Eur. Biophys. J. 21:263–272.
19. Benninger, R., B. Onfelt, M. Neil, D. Davis, and P. French. 2005.Fluorescence imaging of two-photon linear dichroism: cholesteroldepletion disrupts molecular orientation in cell membranes. Biophys. J.88:609–622.
20. Corry, B., D. Jayatilaka, B. Martinac, and P. Rigby. 2006. Determi-nation of the orientational distribution and orientation factor for transferbetween membrane bound fluorophores using a confocal microscope.Biophys. J. 91:1032–1045.
21. Schroder, G., U. Alexiev, and H. Grubmuller. 2005. Simulation offluorescence anisotropy experiments: probing protein dynamics. Bio-phys. J. 89:3757–3770.
22. Gustiananda, M., J. Liggins, P. Cummins, and J. Gready. 2004.Conformation of prion protein repeat peptides probed by FRET mea-surements and molecular dynamics simulations. Biophys. J. 86:2467–2483.
2720 Corry and Jayatilaka
Biophysical Journal 95(6) 2711–2721
23. Best, R., K. Merchant, I. Gopich, B. Schuler, A. Bax, and W. Eaton.
2007. Effect of flexibility and cis residues in single-molecule FRET
studies of polyproline. Proc. Natl. Acad. Sci. USA. 104:18964–
18969.
24. Beierlein, F., O. Othersen, H. Lanig, S. Schneider, and T. Clark. 2006.
Simulating FRET from tryptophan: is the rotamer model correct?
J. Am. Chem. Soc. 128:5142–5152.
25. Posson, D., C. M. P. Ge, F. Bezanilla, and P. Selvin. 2005. Small
vertical movement of a K1 channel voltage sensor measured with
luminescence energy transfer. Nature. 436:848–851.
26. Martinac, B. 2004. Mechanosensitive ion channels: molecules of
mechanotransduction. J. Cell Sci. 117:2449–2460.
27. Hamill, O., and B. Martinac. 2001. Molecular basis of mechanotrans-
duction in living cells. Physiol. Rev. 81:685–740.
28. Levina, N., S. Totemeyer, N. Stokes, P. Louis, M. Jones, and I. Booth.
1999. Protection of Escherichia coli cells against extreme turgor by
activation of MscS and MscL mechanosensitive channels: identifica-
tion of genes required for MscS activity. EMBO J. 18:1730–1737.
29. Frisch, M. J., G. W. Trucks, H. B. Schlegel, G. E. Scuseria, M. A.
Robb, J. R. Cheeseman, J. A. Montgomery Jr., T. Vreven, K. N. Kudin,
J. C. Burant, J. M. Millam, S. S. Iyengar, J. Tomasi, V. Barone, B.
Mennucci, M. Cossi, G. Scalmani, N. Rega, G. A. Petersson, H.
Nakatsuji, M. Hada, M. Ehara, K. Toyota, R. Fukuda, J. Hasegawa, M.
Ishida, T. Nakajima, Y. Honda, O. Kitao, H. Nakai, M. Klene, X. Li,
J. E. Knox, H. P. Hratchian, J. B. Cross, V. Bakken, C. Adamo, J.
Jaramillo, R. Gomperts, R. E. Stratmann, O. Yazyev, A. J. Austin, R.
Cammi, C. Pomelli, J. W. Ochterski, P. Y. Ayala, K. Morokuma, G. A.
Voth, P. Salvador, J. J. Dannenberg, V. G. Zakrzewski, S. Dapprich,
A. D. Daniels, M. C. Strain, O. Farkas, D. K. Malick, A. D. Rabuck, K.
Raghavachari, J. B. Foresman, J. V. Ortiz, Q. Cui, A. G. Baboul, S.
Clifford, J. Cioslowski, B. B. Stefanov, G. Liu, A. Liashenko, P.
Piskorz, I. Komaromi, R. L. Martin, D. J. Fox, T. Keith, M. A. Al-
Laham, C. Y. Peng, A. Nanayakkara, M. Challacombe, P. M. W. Gill,
B. Johnson, W. Chen, M. W. Wong, C. Gonzalez, and J. A. Pople.
2004. Gaussian 03, Rev. C.02. Gaussian, Wallingford CT.
30. Singh, U. C., and P. A. Kollman. 1984. An approach to computing
electrostatic charges for molecules. J. Comput. Chem. 5:129–145.
31. Besler, B. H., K. M. Merz, Jr., and P. A. Kollman. 1990. Atomic
charges derived from semiempirical methods. J. Comput. Chem. 11:
431–439.
32. Stratmann, R. E., G. E. Scuseria, and M. J. Frisch. 1998. An efficient
implementation of time-dependent density-functional theory for the
calculation of excitation energies of large molecules. J. Chem. Phys.109:8218–8224.
33. Foresman, J. B., M. Head-Gordon, J. A. Pople, and M. J. Frisch. 1992.
Toward a systematic molecular orbital theory for excited states.
J. Phys. Chem. 96:135–149.
34. Werner, H.-J., P. J. Knowles, R. Lindh, F. R. Manby, M. Schutz, P.
Celani, T. Korona, G. Rauhut, R. D. Amos, A. Bernhardsson, A.
Berning, D. L. Cooper, M. J. O. Deegan, A. J. Dobbyn, F. Eckert, C.
Hampel, G. Hetzer, A. W. Lloyd, S. J. McNicholas, W. Meyer, M. E.
Mura, A. Nicklaß, P. Palmieri, R. Pitzer, U. Schumann, H. Stoll, A. J.
Stone, R. Tarroni, and T. Thorsteinsson. 2006. MOLPRO, Ver. 2006.1.
A package of ab initio programs. http://www.molpro.net.
35. Chang, G., R. Spencer, A. Lee, M. Barclay, and D. Rees. 1998.
Structure of the MscL homologue from Mycobacterium tuberculosis: a
gated mechanosensitive ion channel. Science. 282:2220–2226.
36. Phillips, J., R. Braun, W. Wang, J. Gumbart, E. Tajkhorshid, E. Villa, C.
Chipot, R. Skeel, L. Kale, and K. Schulten. 2005. Scalable molecular
dynamics with NAMD. J. Comput. Chem. 26:1781–1802.
37. Torrie, G., and J. Valleau. 1974. Monte Carlo free energy estimates
using non-Boltzmann sampling: application to the sub-critical Lennard-
Jones fluid. Chem. Phys. Lett. 28:578–581.
38. Kumar, S., D. Bouzida, R. Swendsen, P. Kollman, and J. Rosenberg.
1992. The weighted histogram analysis method for free energy calcu-
lations on biomolecules.1. The method. J. Comput. Chem. 13:1011–
1021.
39. Roux, B. 1995. The calculation of potential of mean force using
computer simulations. Comput. Phys. Commun. 91:275–282.
Simulating Energy Transfer 2721
Biophysical Journal 95(6) 2711–2721