Slot waveguide-based splitters for broadband terahertz radiation
Upload
independentCategory
view
2download
0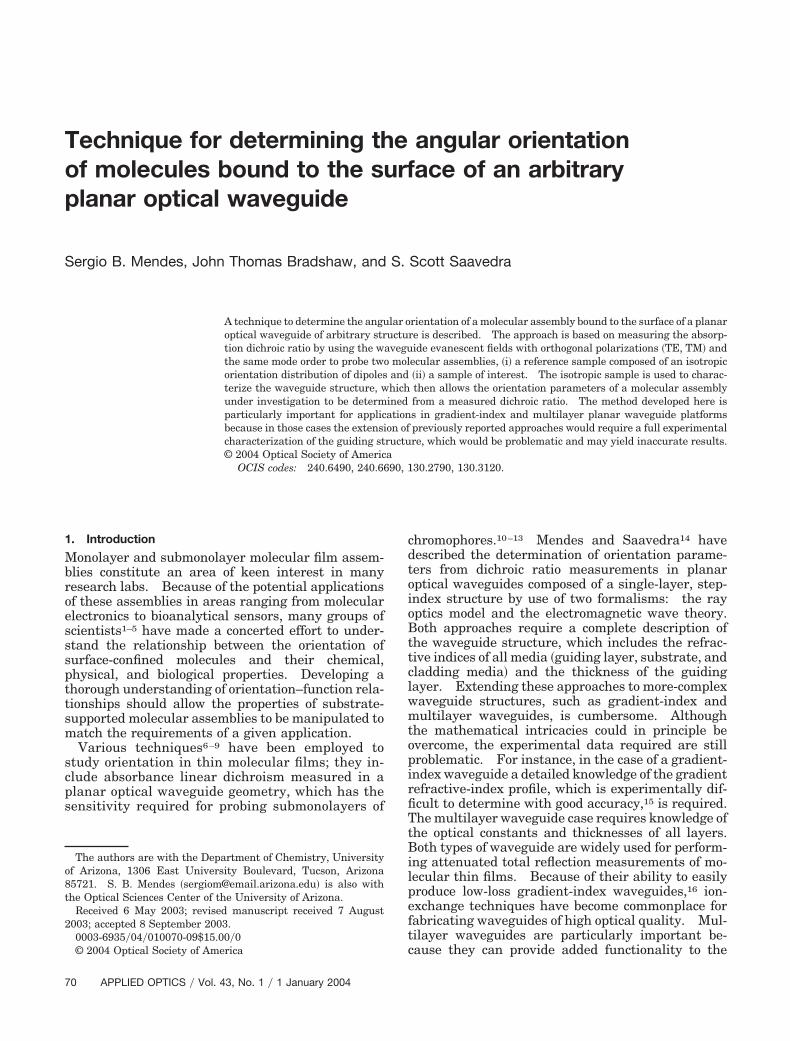
Top
S
1
Mbroessspttsm
scps
o8t
2
7
echnique for determining the angular orientationf molecules bound to the surface of an arbitrarylanar optical waveguide
ergio B. Mendes, John Thomas Bradshaw, and S. Scott Saavedra
A technique to determine the angular orientation of a molecular assembly bound to the surface of a planaroptical waveguide of arbitrary structure is described. The approach is based on measuring the absorp-tion dichroic ratio by using the waveguide evanescent fields with orthogonal polarizations �TE, TM� andthe same mode order to probe two molecular assemblies, �i� a reference sample composed of an isotropicorientation distribution of dipoles and �ii� a sample of interest. The isotropic sample is used to charac-terize the waveguide structure, which then allows the orientation parameters of a molecular assemblyunder investigation to be determined from a measured dichroic ratio. The method developed here isparticularly important for applications in gradient-index and multilayer planar waveguide platformsbecause in those cases the extension of previously reported approaches would require a full experimentalcharacterization of the guiding structure, which would be problematic and may yield inaccurate results.© 2004 Optical Society of America
OCIS codes: 240.6490, 240.6690, 130.2790, 130.3120.
cdtoioBttclwmtopirfiTtBilpeftc
. Introduction
onolayer and submonolayer molecular film assem-lies constitute an area of keen interest in manyesearch labs. Because of the potential applicationsf these assemblies in areas ranging from molecularlectronics to bioanalytical sensors, many groups ofcientists1–5 have made a concerted effort to under-tand the relationship between the orientation ofurface-confined molecules and their chemical,hysical, and biological properties. Developing ahorough understanding of orientation–function rela-ionships should allow the properties of substrate-upported molecular assemblies to be manipulated toatch the requirements of a given application.Various techniques6–9 have been employed to
tudy orientation in thin molecular films; they in-lude absorbance linear dichroism measured in alanar optical waveguide geometry, which has theensitivity required for probing submonolayers of
The authors are with the Department of Chemistry, Universityf Arizona, 1306 East University Boulevard, Tucson, Arizona5721. S. B. Mendes �[email protected]� is also withhe Optical Sciences Center of the University of Arizona.
Received 6 May 2003; revised manuscript received 7 August003; accepted 8 September 2003.0003-6935�04�010070-09$15.00�0© 2004 Optical Society of America
0 APPLIED OPTICS � Vol. 43, No. 1 � 1 January 2004
hromophores.10–13 Mendes and Saavedra14 haveescribed the determination of orientation parame-ers from dichroic ratio measurements in planarptical waveguides composed of a single-layer, step-ndex structure by use of two formalisms: the rayptics model and the electromagnetic wave theory.oth approaches require a complete description of
he waveguide structure, which includes the refrac-ive indices of all media �guiding layer, substrate, andladding media� and the thickness of the guidingayer. Extending these approaches to more-complexaveguide structures, such as gradient-index andultilayer waveguides, is cumbersome. Although
he mathematical intricacies could in principle bevercome, the experimental data required are stillroblematic. For instance, in the case of a gradient-ndex waveguide a detailed knowledge of the gradientefractive-index profile, which is experimentally dif-cult to determine with good accuracy,15 is required.he multilayer waveguide case requires knowledge ofhe optical constants and thicknesses of all layers.oth types of waveguide are widely used for perform-
ng attenuated total reflection measurements of mo-ecular thin films. Because of their ability to easilyroduce low-loss gradient-index waveguides,16 ion-xchange techniques have become commonplace forabricating waveguides of high optical quality. Mul-ilayer waveguides are particularly important be-ause they can provide added functionality to the
wwoca
ftkaTccatswtoiosmTffmtpc�reswtioffoocdsuotptp
2
Lwintcw
eo
f
fEptFagAacfptfcpTirme
a
wt
Fsmst
aveguide structure; one example of such aaveguide is a multilayer electroactive integrated
ptical waveguide used to perform spectroelectro-hemical measurements of submonolayer molecularssemblies.17,18
The research presented here provides a straight-orward procedure for the determination of orienta-ion parameters that does not require detailednowledge of the guiding structure and can easily bepplied to a variety of waveguide configurations.he procedure involves the measurement of the di-hroic ratio in two distinct experiments. First, di-hroic ratio �, defined as the ratio of the linearbsorbance measured at the TE and TM polariza-ions, � � ATE�ATM, is measured either for a bulkolution whose absorbing species do not adhere to theaveguide surface �therefore the molecular absorp-
ion dipoles are randomly oriented in the bulk phase�r for an adlayer with absorbing dipoles that aresotropically oriented when they are immobilizednto the waveguide surface. The absorbance is mea-ured by use of a guided-wave mode of a particularode order at the two orthogonal polarizations �TE,M� to produce a dichroic ratio, �iso. Next, in a dif-
erent experiment with the same waveguide plat-orm, dichroic ratio �sample is measured for a
olecular adlayer of unknown orientation by use ofhe same waveguide mode order. These two inde-endent dichroic ratio measurements are used to cal-ulate a normalized dichroic ratio, �norm � �sample�iso. As is shown below, the normalized dichroicatio can uniquely determine the orientation param-ters for the sample under investigation, without anypecific information about the structure of theaveguide platform. The derivation below shows
hat, besides the normalized dichroic ratio, the onlynformation required is the effective refractive indexf the guided mode, which can easily be measuredrom the waveguide coupling condition, and the re-ractive index of the cladding medium. Applicationsf the developed approach for an overlayer composedf linear or circular molecular absorption dipoles areonsidered, and boundary values for the normalizedichroic ratio are established for each type of ad-orbed layer. Next, experimental data collected byse of a single-mode step-index solgel glass planarptical waveguide are used to validate the developedheory by comparison of the calculated orientationarameters with those calculated by an approachhat requires detailed knowledge of all waveguidearameters.
. Theory
et us consider an arbitrary planar opticalaveguide structure formed by any number of layers,
ncluding gradient refractive-index media, with anyumber of modes. As a convention, we assume thathe waveguide surface is in the x–y plane and that theonfined guided modes propagate along the x axisith an effective refractive index N calculated for
ach polarization and mode order. For each moderder j, the field eigenmodes can be described by
Ej � Aj� z�exp��i2�x�
NTE, j�exp�i�t� y (1)
or the transverse electric �TE� polarization and
Hj � Bj� z�exp��i2�x�
NTM, j�exp�i�t� y (2)
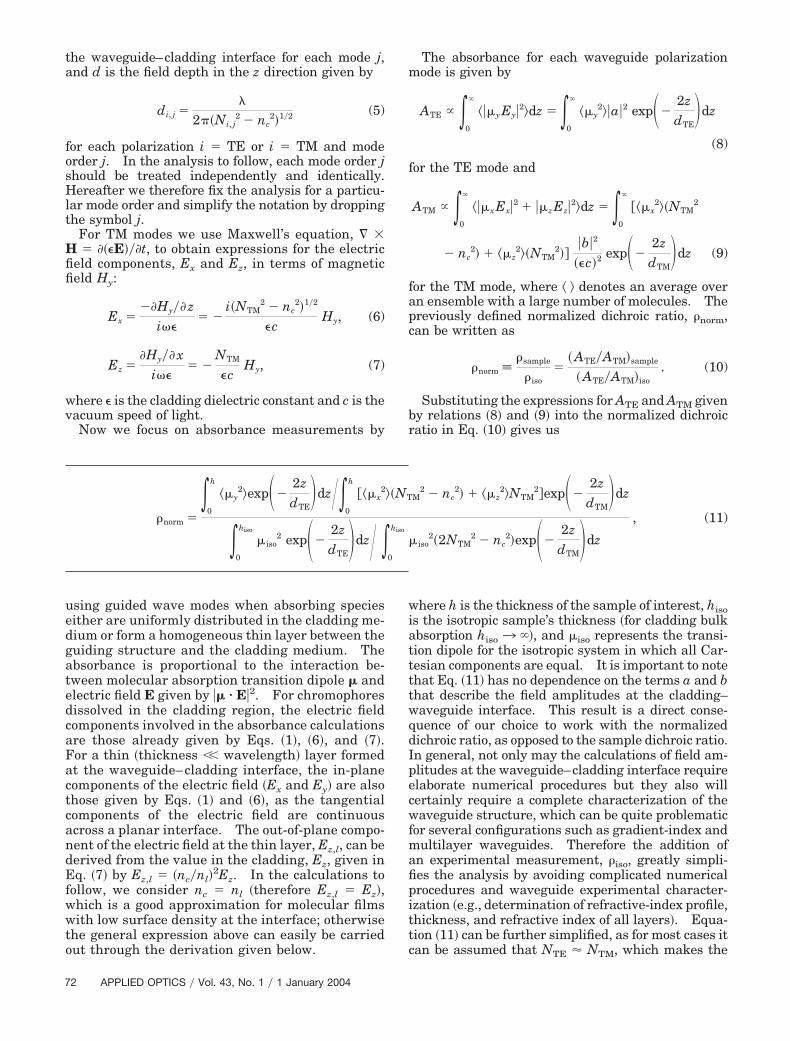
or the transverse magnetic �TM� polarization. Inqs. �1� and �2�, � is the angular frequency of theropagating light wave, � is the vacuum wavelength,is time, and y is a unit vector along the y axis.igure 1 illustrates a field profile, either Ey or Hy, forparticular mode of an arbitrary waveguide. In
eneral, providing a description of the field profiles,j�z� and Bj�z�, across the entire waveguide �i.e., forll values of z� can be quite challenging, as it requiresomplete knowledge of the waveguide structure �re-ractive index and thickness for each layer, indexrofile for gradient-index media, or both�. However,he evanescent field that decays exponentially awayrom the waveguide surface into the semi-infiniteladding region �z 0� can easily be described inde-endently of the intricacies of the guiding structure.he exponential decay is determined by the refractive
ndex of the cladding medium, nc, and the effectiveefractive index N of the waveguide mode. Mathe-atically,19 the field in the cladding region �z 0� is
xpressed for TE modes by
Aj� z� � aj exp�� zdTE, j
� , (3)
nd for TM modes by
Bj� z� � bj exp�� zdTM, j
� , (4)
here aj and bj are constants that describe the elec-ric and magnetic field amplitudes, respectively, at
ig. 1. General waveguide field profile. The field profile repre-ented can be either an electric field Ey�z� for TE modes, or aagnetic field Hy�z� for TM modes. Note that the waveguide
urface is chosen in the x–y plane and that the x axis correspondso the direction of light propagation.
1 January 2004 � Vol. 43, No. 1 � APPLIED OPTICS 71
7
the waveguide–cladding interface for each mode j,and d is the field depth in the z direction given by
di, j ��
2��Ni, j2 � nc
2�1�2 (5)
for each polarization i TE or i TM and modeorder j. In the analysis to follow, each mode order jshould be treated independently and identically.Hereafter we therefore fix the analysis for a particu-lar mode order and simplify the notation by droppingthe symbol j.
For TM modes we use Maxwell’s equation, � �H ��E�� t, to obtain expressions for the electricfield components, Ex and Ez, in terms of magneticfield Hy:
Ex �� Hy� z
i��� �
i�NTM2 � nc
2�1�2
�cHy, (6)
Ez � Hy� x
i��� �
NTM
�cHy, (7)
where � is the cladding dielectric constant and c is thevacuum speed of light.
Now we focus on absorbance measurements by
using guided wave modes when absorbing specieseither are uniformly distributed in the cladding me-dium or form a homogeneous thin layer between theguiding structure and the cladding medium. Theabsorbance is proportional to the interaction be-tween molecular absorption transition dipole � andelectric field E given by �� � E�2. For chromophoresdissolved in the cladding region, the electric fieldcomponents involved in the absorbance calculationsare those already given by Eqs. �1�, �6�, and �7�.For a thin �thickness �� wavelength� layer formedat the waveguide–cladding interface, the in-planecomponents of the electric field �Ex and Ey� are alsothose given by Eqs. �1� and �6�, as the tangentialcomponents of the electric field are continuousacross a planar interface. The out-of-plane compo-nent of the electric field at the thin layer, Ez,l, can bederived from the value in the cladding, Ez, given inEq. �7� by Ez,l �nc�nl�
2Ez. In the calculations tofollow, we consider nc nl �therefore Ez,l Ez�,which is a good approximation for molecular filmswith low surface density at the interface; otherwisethe general expression above can easily be carriedout through the derivation given below.
2 APPLIED OPTICS � Vol. 43, No. 1 � 1 January 2004
The absorbance for each waveguide polarizationmode is given by
ATE � �0
�
���y Ey�2�dz � �0
�
��y2��a�2 exp�� 2z
dTE�dz
(8)
for the TE mode and
ATM � �0
�
���x Ex�2 � ��z Ez�2�dz � �0
�
���x2��NTM
2
� nc2� � ��z
2��NTM2��
�b�2
��c�2exp�� 2z
dTM�dz (9)
for the TM mode, where � � denotes an average overan ensemble with a large number of molecules. Thepreviously defined normalized dichroic ratio, �norm,can be written as
�norm ��sample
�iso��ATE�ATM�sample
�ATE�ATM�iso. (10)
Substituting the expressions for ATE and ATM givenby relations �8� and �9� into the normalized dichroicratio in Eq. �10� gives us
where h is the thickness of the sample of interest, hisois the isotropic sample’s thickness �for cladding bulkabsorption hiso 3 ��, and �iso represents the transi-tion dipole for the isotropic system in which all Car-tesian components are equal. It is important to notethat Eq. �11� has no dependence on the terms a and bthat describe the field amplitudes at the cladding–waveguide interface. This result is a direct conse-quence of our choice to work with the normalizeddichroic ratio, as opposed to the sample dichroic ratio.In general, not only may the calculations of field am-plitudes at the waveguide–cladding interface requireelaborate numerical procedures but they also willcertainly require a complete characterization of thewaveguide structure, which can be quite problematicfor several configurations such as gradient-index andmultilayer waveguides. Therefore the addition ofan experimental measurement, �iso, greatly simpli-fies the analysis by avoiding complicated numericalprocedures and waveguide experimental character-ization �e.g., determination of refractive-index profile,thickness, and refractive index of all layers�. Equa-tion �11� can be further simplified, as for most cases itcan be assumed that N � N , which makes the
�norm �
�0
h
��y2�exp�� 2z
dTE�dz��
0
h
���x2��NTM
2 � nc2� � ��z
2�NTM2�exp�� 2z
dTM�dz
�0
hiso
�iso2 exp�� 2z
dTE�dz� �
0
hiso
�iso2�2NTM
2 � nc2�exp�� 2z
dTM�dz
, (11)
TE TM

fie
�
agwihebtp
EtwaTcihdId
woppdmiavEi�rvrelafi
tfp
cmummpnwln
ds1t�omfia
3
A
Atpme�t
eld depths for TE and TM modes approximatelyqual �dTE � dTM�, giving us
norm � �2NTM2 � nc
2�
�
�0
h
��y2�exp�� 2z
dTE�dz
�0
h
���x2��NTM
2 � nc2� � ��z
2�NTM2�exp�� 2z
dTM�dz
.
(12)
When NTE � NTM may not be considered a goodpproximation �e.g., for highly birefringent wave-uides�, it is straightforward to show that Eq. �12�ill still hold as long as the isotropic dichroic ratio �iso
s measured with an isotropic film whose thicknessiso is much smaller than the penetration depth of thevanescent field. We can simplify Eq. �12� furthery noting that, for a molecular monolayer, the filmhickness is much less than the evanescent depth ofenetration, h �� dTE,TM, which gives us
�norm ���y
2��2NTM2 � nc
2�
��x2��NTM
2 � nc2� � ��z
2�NTM2 . (13)
quation �13� clearly shows that the determination ofhe normalized dichroic ratio is independent of theaveguide structure. The only required parametersre the waveguide’s effective refractive index for theM mode, NTM, and the index of refraction of theladding medium, nc. Next we apply Eq. �13� to anmportant specific case: An immobilized film thatas in-plane symmetry because molecules are ran-omly oriented in the x–y �waveguide surface� plane.n this case the absorption dipole components can beescribed by
��x2� � ��y
2� � ��in2�, (14)
��z2� � ��out
2�, (15)
2��in2� � ��out
2� � �2, (16)
here �in and �out are, respectively, the in- and out-f-plane Cartesian components of the absorption di-ole, whose strength is given by �. Under the in-lane symmetry assumption, Eq. �13� can be used toetermine the range of possible values for the nor-alized dichroic ratio. The results are summarized
n Table 1, where ��out2���2 spanning the physically
cceptable domain �0, 1� is used as an independentariable with which to calculate ��in
2���2 �throughq. �16�� and �norm �through Eq. �13��. The normal-
zed dichroic ratio spans the range 0 � �norm �2NTM
2 � nc2���NTM
2 � nc2�, and an experimental
esult outside this region is not consistent with pre-ious assumptions. Furthermore, we can apply theesults of Table 1 for a molecular layer composed ofither linearly polarized absorption dipoles or circu-arly polarized absorption dipoles. For a molecularssembly composed of linear dipoles, where � is de-ned as the angle between the absorption dipole and
he waveguide surface normal �z axis�, we have theollowing expressions for the absorption dipole com-onents:
��in2�
�2 �12�sin2 ��, (17)
��out2�
�2 � �cos2 ��. (18)
As 0 � ��out2���2 � 1, the normalized dichroic ratio
an span the entire range listed in Table 1. Theeasurement of the normalized dichroic ratio willniquely determine the orientation parameter for theolecular assembly through Eqs. �13�–�18�. For aolecular layer composed of circularly polarized di-
oles, where � is defined as the angle between theormal to the circular dipole plane and theaveguide surface normal �z axis�, we have the fol-
owing expressions for the absorption dipole compo-ents:
��in2�
�2 �14�1 � �cos2 ���, (19)
��out2�
�2 �12�sin2 ��. (20)
Therefore, for an adlayer of circularly polarizedipoles, the in- and out-of-plane dipole componentspan a smaller range �for example, 0 � ��out
2���2 ��2�, and the normalized dichroic ratio is limited tohe range �2NTM
2 � nc2���3NTM
2 � nc2� � �norm �
2NTM2 � nc
2���NTM2 � nc
2�. Again, measurementf the normalized dichroic ratio can be used to deter-ine the molecular orientation parameter of the thinlm under investigation through Eqs. �13�–�16�, �19�,nd �20�.
. Experiment
. Integrated Optical Waveguide Spectrometer
n experimental demonstration of the aforemen-ioned theory was performed by use of a broadbandlanar waveguide spectrometer, which is shown sche-atically in Fig. 2 and has been described in detail
lsewhere.20 Briefly, this attenuated total reflectionATR� spectrometer includes a planar integrated op-ical waveguide �IOW� fabricated by dip coating a
Table 1. Range of Values for the Normalized Dichroic Ratio
��out2�
�2
��in2�
�2�norm
0 1�2 2NTM2 � nc
2
NTM2 � nc
2
1�3 1�3 1
1�2 1�4 2NTM2 � nc
2
3NTM2 � nc
2
1 0 0
1 January 2004 � Vol. 43, No. 1 � APPLIED OPTICS 73

swT6SclfipowbttsttlrtAcaggeppao
wacgpa
B
1Ftlwd�ttRctsttttwoRtaaRc
2Totlc�lLoipopbi
rDtpme�cbf
FtpILpc�3le
7
olgel layer onto a soda lime glass substrate.21 Thisaveguide layer was found to support only TE0 andM0 modes for all wavelengths in the range 454.5–32.8 nm. A truncated right-angle �45°–45°–90°�chott glass prism �SF6�mounted in a Plexiglass flowell was used as the incoupling element. A white-ight source �150-W xenon arc lamp� was spatiallyltered, collimated, and polarized by a Glan–Taylorrism before being focused onto the hypotenuse facef the incoupling prism. The prism–waveguide gapas filled with a 50-mM, pH 7, sodium phosphateuffer solution, and pressure was applied to the top ofhe prism to achieve optimal coupling.22 By placinghe IOW element on a rotary stage we adjusted thepectrometer throughput by setting the angle be-ween the Xe source beam and the incoupling prismo optimize the response for both TE0 and TM0 po-arization in the region 520–570 nm, as this spectralegion encompasses the absorption bands of bothypes of molecular film used in this study �vide infra�.n integral surface-relief diffraction grating fabri-ated into the glass substrate before solgel depositioncted as the dispersive outcoupling element. Therating was fabricated by development of a holo-raphic photoresist pattern followed by reactive iontching of the grating into the glass substrate, asreviously described.20,23 We determined gratingeriod � to be 0.362 �m by measuring the diffractionngle at the Littrow configuration. The light beamutcoupled by the diffraction grating was collected
ig. 2. Optical setup for performing broadband IOW–ATR spec-roscopic experiments. The beam path through the optical com-onents is as follows: L1, 48-cm effective-focal-length �efl� lens;r Iris; L2, 8-cm efl lens; P, Glan–Taylor prism polarizer; Ir, iris;3, 43-cm efl lens. The light is focused into the SF6 prism cou-ling corner, coupled into the solgel waveguiding layer, and out-oupled through the glass substrate by a surface-relief gratinggrating period, 362 nm�. The outcoupled light is collimated with3-mm efl cylindrical lens L4 onto a CCD camera placed at theens’s back focal plane. Incoupler-to-outcoupler distance for thexperiments reported herein, 10 mm.
4 APPLIED OPTICS � Vol. 43, No. 1 � 1 January 2004
ith a 33-mm effective-focal-length cylindrical lensnd directed onto a thermoelectrically cooled CCDamera located at the lens’s Fourier plane. The sol-el waveguide surface used for all experiments re-orted here was cleaned before experimentation inccordance with previously described procedures.20
. Molecular Films
. Isotropicor the measurement of the isotropic dichroic ratio, ahin layer of randomly oriented molecules immobi-ized at the waveguide–aqueous cladding interfaceas used. This layer consisted of an adsorbed film ofextran labeled with Rhodamine B �Rh-B� dye40,000 MW; Molecular Probes D-1840�. Accordingo the supplier, this material �Rh-B dextran� is syn-hesized by random labeling of amino dextran withhodamine B �5.7 mol�mol of dextran�, followed by
apping of unreacted amines, which generates a zwit-erionic, labeled dextran.24 Rh-B dextran was cho-en to create an isotropic molecular film because ofhe lack of organized secondary and tertiary struc-ure in dextrans and because of the random nature ofhe Rh-B labeling process. A reasonable assump-ion is that adsorption of Rh-B dextran onto a glassaveguide surface does not create a macroscopicallyrdered structure. Furthermore, because 5.7 mol ofh-B are randomly conjugated to each mole of dex-
ran, it is also reasonable to assume that the Rh-Bbsorption dipoles are isotropically oriented in thedsorbed film. The isotropic assumption for theh-B dextran film was independently tested and isorroborated in Subsection 4.C below.
. Anisotropiche molecular layer chosen to be investigated as anrdered sample consisted of 1,1�-dioctadecyl-3,3,3�,3�-etramethylindocarbocyanine perchlorate �DiI; Mo-ecular Probes D-282� dispersed in a lipid bilayeromposed of 1,2-dioleoyl-sn-glycero-3-phosphocholineDOPC; Avanti Polar Lipids 850375�. The molecu-ar orientation properties of DiI incorporated intoangmuir–Blodgett films of arachidic acid depositednto the surface of planar solgel waveguides werenvestigated previously.11 The dipoles of the incor-orated DiI were found to be oriented at a mean anglef 75° from the normal of the waveguide surfacelane. DiI incorporated into a DOPC bilayer shoulde similarly oriented and thus was selected for exam-nation in this study.
Lipid dispersion was prepared by vacuum evapo-ation of solvent from a mixture of 0.15 mol % DiI inOPC dissolved in chloroform. The DiI–DOPC mix-
ure was then resuspended in a 50-mM pH 7 sodiumhosphate buffer to a final DOPC concentration of 0.6M. A freeze–thaw process, followed by repeated
xtrusion through a 50-nm polycarbonate filterWhatman�, produced unilamellar lipid bilayer vesi-les.25,26 Vesicle fusion �see below� was used to formilayers of DiI–DOPC upon planar waveguide sur-aces.

4
A
TwRbiartcwpsatiotpe
wDaavwnsass3bdicTtd
sinpfia
tt4tTfoCio
B
Ptwrtlrwawbmg1tua
Ds
Fas F
aas
. Results and Discussion
. Polarized Spectral Response
o form an isotropic film adsorbed onto a planaraveguide surface we injected a 6-�M solution ofh-B dextran in a 50-mM pH 7 sodium phosphateuffer into the waveguide flow cell and allowed it toncubate for 15 min. The cell was then flushed with
50-mM pH 7 sodium phosphate buffer solution toemove nonadsorbed material, and the spectral in-ensity �I� in both TE0 and TM0 waveguide modes wasollected. A blank spectrum with the flow cell filledith only buffer was recorded previously �I0� for eacholarization mode, and the measured absorbancepectra, A � �log10�I�I0�, are plotted in Fig. 3. Thebsorbance in the TM0 polarization is higher than inhe TE0 polarization. Inasmuch as the Rh-B dipolesn the dextran film are assumed to be isotropicallyriented, the difference in absorbance intensity is at-ributed to differences in the effective TE0 and TM0ath lengths for the particular waveguide structuremployed in this experiment.To form an anisotropic film adsorbed to a planaraveguide surface we injected the 0.6-mM DiI–OPC vesicle solution into the waveguide flow cellnd incubated it for �10 min. During this period,waveguide-supported lipid bilayer was formed by
esicle fusion and spreading.27–29 The flow cellas then flushed with buffer solution to remove anyonfused vesicles, and the TE0 and TM0 polarizedpectra were collected. The absorbance spectrare plotted in Fig. 4, which displays a significantlytronger absorbance in TE0 than in TM0, the oppo-ite of the data obtained on the isotropic film �Fig.�. Because the DiI molecular dipole is thought toe oriented in the plane of the lipid bilayer,11 itsichroic ratio is expected to be higher than in thesotropic case. However, there are two effects thatontribute to the difference between the TE and theM spectra: an anisotropic orientation distribu-ion of DiI molecules and waveguide path-lengthifferences between the two polarizations. The
ig. 3. Experimental IOW–ATR spectra of a film of Rh-B dextrandsorbed onto the surface of a solgel glass waveguide: absorbancepectra for TE0 �filled squares� and TM0 �solid curve� polarization.
ample dichroic ratio, �sample
ATE,sample�ATM,sample,ncorporates both effects. As shown above, theormalized dichroic ratio, �norm, factors out theath-length difference and provides a clear quanti-cation of the dichroism that is due solely to thenisotropic molecular orientation.We used the polarized spectra acquired for the iso-
ropic Rh-B dextran film �Fig. 3� to calculate the iso-ropic dichroic ratio, �iso���, at each wavelength in the80–580-nm spectral window, which is the windowhat was used for all the calculations given below.he corresponding dichroic ratio at each wavelength
or the anisotropic DiI–DOPC film, �sample���, wasbtained from the polarized spectra shown in Fig. 4.ombining these two results provided us the normal-
zed dichroic ratio �norm��� over the spectral windowf analysis.
. Molecular Orientation
roceeding with the method described herein, we de-ermined the effective refractive index of theaveguide structure for the TM0 mode, NTM, and the
efractive index of the cladding medium, nc. We de-ermined NTM by measuring the incident angle of aight beam impinging upon a grating coupler thatesulted in a bound TM0 mode. This measurementas performed at several wavelengths produced byn Ar�-ion laser with the waveguide flow cell filledith the same cladding solution �50-mM phosphateuffer� that was used in the dichroic ratio measure-ents. A polynomial fit to the data was used to
enerate a dispersion curve approximated by NTM .473 � 18,000 nm2��2. The optical dispersion ofhe cladding �buffer solution�was estimated from tab-lated values for the refractive index of water30 withCauchy fit given by nc 1.32384 � 3117 nm2��2.A planar supported lipid bilayer composed ofOPC doped with DiI is expected to have in-plane
ymmetry because of its molecular structure.
ig. 4. Experimental IOW–ATR spectra of DiI incorporated intoDOPC lipid bilayer deposited by vesicle fusion onto the surface ofsolgel glass waveguide: absorbance spectra for TE0 �filled
quares� and TM0 �solid curve� polarization.
1 January 2004 � Vol. 43, No. 1 � APPLIED OPTICS 75

7
Therefore we can use Eqs. �13�–�16� to solve for the in-and out-of-plane dipole moments, yielding
��in2�
�2 �12
���out
2�
2�2
��normNTM
2
�2NTM2 � nc
2� � �norm�NTM2 � nc
2�. (21)
We then used the measured values for �norm, NTM,and nc at each wavelength �292 points equally spacedin the 480–580-nm spectral region� to calculate��in
2���2 and ��out2���2. An average value and a
standard deviation were calculated over the specifiedwavelength range with the following results: ��in
2���2 0.44 0.01 and ��out
2���2 0.13 0.03. As��in
2����out2� 3.4, the molecular absorption dipoles
show a preferred orientation toward the film plane.In the next step, we determined a mean orientationangle �� by invoking the commonly used assumption ofa delta function for the molecular orientation distri-bution. Because the DiI molecule in DOPC can beconsidered an ensemble of linear absorption dipoles,the mean angle can be solved by either Eq. �17� or �18�by use of the calculated values for ��in
2���2 or ��out2��
�2, respectively. The result, �� 69° 2°, agreeswell with previously published results11 of �� 75° 4° for DiI doped into an arachidic acid film depositedby the Langmuir–Blodgett technique. The smalldifference in mean tilt angle between DiI dispersed in
DOPC and arachidic acid films is likely due to differ-ences in film structure and film deposition tech-niques.9,31
It is important to emphasize that the informationrequired for determining the absorption dipole com-ponents and the mean orientation angle were com-posed of �a� the measured dichroic ratio of the sampleunder investigation �DiI–DOPC�, �b� the measureddichroic ratio of a randomly oriented film �Rh-B dex-tran�, �c� measurement of the waveguide’s effectiverefractive index NTM, and �d� the refractive index ofthe cladding medium, nc. All these parameters areobtainable by relatively simple experimental mea-surements. Considering that the theoretical deriva-tion described in Section 2 is general, meaning that itdoes not assume a particular waveguide structure,the new approach presented here provides a straight-forward and simple procedure with which to treatmore-complex guiding configurations such asgradient-index and multilayer waveguides for simi-lar studies of molecular film orientation.
As a final note, we point out the utility of the broad-band solgel IOW spectrometer for measuring dichro-
6 APPLIED OPTICS � Vol. 43, No. 1 � 1 January 2004
ism in molecular films. The ability to measurebroadband spectra allows dichroic parameters to becalculated over a broad spectral range. Averagingthe dichroic response over a molecular absorptionband reduces the likelihood that artifacts associatedwith performing measurements at single wave-lengths will produce erroneous results.
C. Comparison with an Existing Method
It is interesting to compare the results obtained fromthe new approach presented above with those ob-tained by use of an approach previously applied14 todetermine molecular orientation in films depositedonto single-layer step-index waveguides. The ear-lier approach requires full characterization of thewaveguide structure, including the refractive indexand the thickness of the guiding layer �nwg and twg�,the refractive indices of the cladding �nc� and thesubstrate �ns� media, and the waveguide’s effectiverefractive index at both polarizations, NTE and NTM.For a single-layer step-index waveguide these quan-tities can be determined with good accuracy. Be-cause this simple waveguide structure was also usedto test the new approach, a comparison of the twoapproaches for extraction of molecular orientation in-formation can be made. As described in Ref. 14, thedichroic ratio for a single-layer step index waveguideis given by
where teff,TE�TM� is the waveguide’s effective thicknessfor the TE �TM�mode. The effective refractive indexfor the TE mode, NTE, of the solgel waveguide wasdetermined to follow a dispersion curve fitted byNTE 1.473 � 20,700 nm2��2 �measured by use ofthe grating coupling condition as described above�.We used the effective refractive indices, NTE andNTM, in both polarizations to determine the opticalproperties �nwg, twg� of the solgel waveguide layer,which displayed a dispersion curve approximated bynwg 1.53 � 25,000 nm2��2 and a thickness of 250nm. The refractive index for the soda lime glasssubstrate, ns, used for determination of teff,TE�TM�wasapproximated by ns 1.51, and we used the approx-imation nc nl. All remaining parameters in Eq.�22� were as stated above. Using the polarized ab-sorbance spectra for the DiI�DOPC film �Fig. 4�, wesolved Eq. �22� for the molecular dipole components,assuming in-plane symmetry, as described above.The calculated average value for the in-plane compo-nent was ��in
2���2 0.435 0.005, from which anaverage tilt angle of �� 68.9° 0.8° was calculated.These values for �� 2���2 and �� agree well with those
�sample ���in
2��nwg2 � NTE
2�
NTE�nwg2 � nc
2�
NTM�nwg4�NTM
2 � nc2� � nc
4�nwg2 � NTM
2��
nwg2�nwg
2 � NTM2���NTM
2 � nc2���in
2� � �nc
nl�4
NTM2��out
2��teff,TM
teff,TE, (22)
in

cti
iiosal�sia�tpaRdpa
5
Wdtssbdmppo
bCktw
R
1
1
1
1
1
1
1
1
1
1
2
2
2
2
2
2
alculated by the new approach. Consistency withhe previous approach further establishes the valid-ty of the new approach.
Finally, we emphasize an important point regard-ng implementation of the new approach. A trulysotropic molecular ensemble must be characterizedn the same waveguide platform that is used for mea-urement of the film of unknown �but presumablynisotropic� structure. Here, the use of the single-ayer step-index waveguide platform described by Eq.22� is useful for assessing whether a molecular filmatisfies the isotropic requirement. Using the polar-zed spectra for Rh-B dextran film shown in Fig. 3nd solving Eq. �22�, we calculated a value of ��in
2��2 0.33 0.01. This value agrees well with theheoretically predicted value of 1�3 for a truly isotro-ic film. These results validate the assumption ofn isotropic orientation distribution for an adsorbedh-B dextran film and therefore make the procedureescribed here a useful test system for characterizingath-length differences between TE and TM modes inn arbitrary waveguide structure.
. Conclusions
e have developed a straightforward, simple proce-ure for determining mean angular orientation inhin-film molecular assemblies deposited onto theurface of a planar optical waveguide of arbitrarytructure. Planar optical waveguides of any num-er of layers, including gradient-refractive-index me-ia, and any number of modes can be treated by theethod presented here. This approach overcomes
revious difficulties in the application of many im-ortant waveguide platforms to studies of molecularrientation in surface-immobilized assemblies.
This paper is based on research partially supportedy the National Science Foundation under grantHE-0108805 to S. S. Saavedra. We gratefully ac-nowledge assistance from Eric Ross in the produc-ion of unilamellar vesicles and a helpful discussionith Wally Doherty.
eferences and Notes1. J. D. Swalen, D. L. Allara, J. D. Andrade, E. A. Chandross, S.
Garoff, J. Israelachvili, T. J. McCarthy, R. Murray, R. F. Pease,J. F. Rabolt, K. J. Wynne, and H. Yu, “Molecular monolayersand films,” Langmuir 3, 932–950 �1987�.
2. M. Losche, “Protein monolayers at interfaces,” Curr. Opin.Solid State Mater. Sci. 2, 546–556 �1997�.
3. A. Ulman, Characterization of Organic Thin Films �Butterworth-Heinemann, Stoneham, UK, 1995�.
4. C. Nicolini, “Supramolecular architecture and molecular bio-electronics,” Thin Solid Films 285, 1–5 �1996�.
5. B. J. Ratner, “The engineering of biomaterials exhibiting rec-ognition and specificity,” J. Mol. Recog. 9, 617–625 �1996�.
6. M. A. Bos and J. M. Kleijn, “Determination of the orientationdistribution of adsorbed fluorophores using TIRF. 2. Mea-surements on porphyrin and cytochrome-c,” Biophys. J. 68,2573–2579 �1995�.
7. P. H. Axelsen and M. J. Citra, “Orientational order determi-nation by internal reflection infrared spectroscopy,” Prog. Bio-phys. Mol. Biol. 66, 227–253 �1996�.
8. G. J. Simpson, S. G. Westerbuhr, and K. L. Rowlen, “Molecular
orientation and angular distribution probed by angle-resolvedabsorbance and second harmonic generation,” Anal. Chem. 72,887–898 �2000�.
9. A. Tronin and J. K. Blasie, “Variable acquisition angle totalinternal reflection fluorescence: a new technique for orienta-tion distribution studies of ultrathin films,” Langmuir 17,3696–3703 �2001�.
0. D. M. Cropek and P. W. Bohn, “Surface molecular orientationsdetermined by electronic linear dichroism in optical waveguidestructures,” J. Phys. Chem. 94, 6452–6457 �1990�.
1. P. L. Edmiston, J. E. Lee, L. L. Wood, and S. S. Saavedra,“Dipole orientation distributions in Langmuir–Blodgett filmsby planar waveguide linear dichroism and fluorescence anisot-ropy,” J. Phys. Chem. 100, 775–784 �1996�.
2. P. L. Edmiston, J. E. Lee, S. S. Cheng, and S. S. Saavedra,“Molecular orientation distributions in protein films. 1. Cy-tochrome c adsorbed to substrates of variable surface chemis-try,” J. Am. Chem. Soc. 119, 560–570 �1997�.
3. P. L. Edmiston and S. S. Saavedra, “Molecular orientationdistributions in protein films. 4. A multilayer composed ofyeast cytochrome c bound through an intermediate streptavi-din layer to a planar supported phospholipid bilayer,” J. Am.Chem. Soc. 120, 1665–1671 �1998�.
4. S. B. Mendes and S. S. Saavedra, “Comparative analysis ofabsorbance calculations for integrated optical waveguide con-figurations by use of the ray optics model and the electromag-netic wave theory,” Appl. Opt. 39, 612–621 �2000�.
5. M. B. Pereira and F. Horowitz, “Simple polarimetric approachto direct measurement of the near-surface refractive index ingraded-index films,” Appl. Opt. 42, 3268–3270 �2003�.
6. H. Nishihara, M. Haruna, and T. Suhara, Optical IntegratedCircuits �McGraw-Hill, New York, 1989�.
7. D. R. Dunphy, S. B. Mendes, S. S. Saavedra, and N. R. Arm-strong, “The electroactive integrated optical waveguide: ul-trasensitive spectroelectrochemistry of submonolayeradsorbates,” Anal. Chem. 69, 3086–3094 �1997�.
8. J. T. Bradshaw, S. B. Mendes, N. R. Armstrong, and S. S.Saavedra, “Broadband coupling into a single-mode, electroac-tive integrated optical waveguide for spectroelectrochemicalanalysis of surface-confined redox couples,” Anal. Chem. 75,1080–1088 �2003�.
9. H. Kogelnik, “Theory of optical waveguides,” in Guided-WaveOptoelectronics, T. Tamir ed. �Springer-Verlag, Berlin, 1990�,pp. 43–50.
0. J. T. Bradshaw, S. B. Mendes, and S. S. Saavedra, “A simpli-fied broadband coupling approach applied to chemically robustsol-gel, planar integrated optical waveguides,” Anal. Chem. 74,1751–1759 �2002�.
1. L. Yang, S. S. Saavedra, N. R. Armstrong, and J. Hayes, “Fab-rication and characterization of low-loss, sol-gel planarwaveguides,” Anal. Chem. 66, 1254–1263 �1994�.
2. S. S. Saavedra and W. M. Reichert, “Prism coupling into poly-mer integrated optical waveguides with liquid superstrates,”Appl. Spectrosc. 44, 1210–1217 �1990�.
3. L. Li, M. Xu, G. I. Stegeman, and C. T. Seaton, “Fabrication ofphotoresist masks for submicrometer surface relief gratings,”in Integrated Optical Circuit Engineering V, M. A. Mentzer,ed., Proc. SPIE 835, 72–82 �1987�.
4. R. P. Haugland, “Fluorescent and biotinylated dextrans,” inHandbook of Fluorescent Probes and Research Products, 9thed., J. Gregory and M. T. Z. Spence, eds. �Molecular Probes,Eugene, Ore., 2002�, pp. 581–583.
5. S. Liu, T. M. Sisson, and D. F. O’Brien, “Synthesis and poly-merization of heterobifunctional amphiphiles to cross-link su-pramolecular assemblies,” Macromolecules 34, 465–473�2001�.
1 January 2004 � Vol. 43, No. 1 � APPLIED OPTICS 77

2
2
2
2
3
3
7
6. E. Kalb, S. Frey, and L. K. Tamm, “Formation of supportedplanar bilayers by fusion of vesicles to supported phospholipidmonolayers,” Biochim. Biophys. Acta 1103, 307–316 �1992�.
7. Vesicle fusion is a well-known self-assembly technique. Onadsorption at a hydrophilic substrate–buffer interface, fluidbilayer vesicles spontaneously fuse to produce an extended,continuous lipid bilayer. See, for example, Refs. 28 and 29.
8. E. Sackmann, “Supported membranes: scientific and practi-cal applications,” Science 271, 43–48 �1996�.
9. A. L. Plant, “Supported hybrid bilayer membranes as rugged
8 APPLIED OPTICS � Vol. 43, No. 1 � 1 January 2004
cell membrane mimics,” Langmuir 15, 5128–5135�1999�.
0. I. Thormaehlen, J. Straub, and U. Grigull, “Refractive index ofwater and its dependence on wavelength, temperature, anddensity,” J. Phys. Chem. Ref. Data 14, 933–945 �1985�.
1. M. N. Timbs and N. L. Thompson, “Slow rotational mobilitiesof antibodies and lipids associated with substrate-supportedphospholipid monolayers as measured by polarized fluores-cence photobleaching recovery,” Biophys. J. 58, 413–428�1990�.
Copyright © 2022 FDOKUMEN