Simulation of Nickel Morphological and Crystal Structures Evolution in Solid Oxide Fuel Cell Anode...
6
Journal of The Electrochemical Society, 161 (5) F577-F582 (2014) F577 0013-4651/2014/161(5)/F577/6/$31.00 © The Electrochemical Society Simulation of Nickel Morphological and Crystal Structures Evolution in Solid Oxide Fuel Cell Anode Using Phase Field Method Zhenjun Jiao a,b and Naoki Shikazono a,b, z a Institute of Industrial Science, University of Tokyo 4-6-1 Komaba, Meguro-ku, Tokyo 153-8505, Japan b CREST, JST In the present study, a phase field method is used to simulate the morphological and crystal structural evolution of nickel-yttria stabilized zirconia composite anode of solid oxide fuel cell based on three-dimensional microstructures reconstructed by focused ion beam-scanning-electron-microscopy technique. A three-dimensional reconstruction of the anode sample after initial reduction is used as the initial microstructure. In order to simulate the nickel crystal grain growth and the corresponding morphological change at the same time, both material composition and crystallographic orientation order parameters are introduced in the model. In order to quantitatively study the nickel coarsening effect on anode performance, the evolution of three-phase boundary density and nickel specific surface area are quantitatively calculated in the simulations. Simulation results reproduced well the initial microstructural evolution in the experiments. © 2014 The Electrochemical Society. [DOI: 10.1149/2.009405jes] All rights reserved. Manuscript submitted February 6, 2014; revised manuscript received February 25, 2014. Published March 4, 2014. For decades, solid oxide fuel cell (SOFC, hereafter) has attracted more and more attentions as an efficient power generation system with high fuel flexibility. 1 In order to meet durability and stability targets, the SOFC electrode degradation mechanisms have been in- vestigated intensively. In the current stage, high temperature SOFC anodes exhibit significant degradation in a long time operation, which is mainly due to the coarsening phenomena of nickel (Ni, hereafter) in yttria-stablized zirconia (YSZ, hereafter) porous skeleton. 2-10 Most of the current investigations focus on the studies of anode microstruc- ture temporal evolution under high temperature operation. Simwonis et al. 2 studied coarsening phenomena of Ni in porous Ni-YSZ anode based on two-dimensional (2D, hereafter) scanning electron micro- scope (SEM, hereafter) images. The changes in the microstructure as well as electrical conductivity of the material were investigated. The reduction of active three phase boundary (TPB, hereafter) length are caused by the Ni coarsening at high temperature. Recently, focused ion beam-scanning electron microscopy (FIB- SEM) technique has been applied to reconstruct three-dimensional (3D, hereafter) electrode microstructures of SOFC. 9-16 The technique provides quantitative 3D information of the anode microstructure, which can be correlated to the anode electrochemical performance via active TPB density. This approach leads to more accurate mi- crostructure analysis and facilitates further elaborative 3D numerical simulations. Phase field method has emerged as a powerful computational method to simulate complex microstructure evolution in materials, which has been investigated by many researchers. 17-26 In phase field model, interfaces of the phases are handled implicitly. All phases and interfaces are incorporated into a grand function of the free energy in the entire system. Based on the FIB-SEM 3D reconstruction tech- nique, Chen et al. 20,21 firstly applied phase field method to simulate the coarsening process of Ni based on finite-difference method. The evolu- tion of microstructure is then characterized quantitatively by tracking TPB density, Ni specific surface area and tortuosity factors of Ni and pore phases. In their paper, the simulation results were not compared with the experimental results. In addition, FIB-SEM sample size was small. Jiao et al. 22 have implemented efficient semi-implicit fourier- spectral approximation method in the phase field simulation, which can handle larger sample size. The simulation results were compared with the experimental results quantitatively. In both two simulations, Ni was treated as an uniform material without considering its crystal structure. In the present paper, a general phase-field model is applied to sim- ulate the 3D evolutions of coupled materials coarsening and crystal grain growth in SOFC anode. In this model, the volume fractions of z E-mail: [email protected] both Ni and YSZ phases and the corresponding crystallographic ori- entation fields are defined independently. The new composition fields are introduced to represent the different crystallographic orientations of both Ni and YSZ phases. The corresponding temporal evolutions of TPB density and Ni specific surface area are quantitatively calculated. The simulation results are then compared with the experimental data to verify the model. Experimental Anode sample preparation— Electrolyte-supported cells were used in this study. The anode cermet powder was prepared by me- chanically mixed NiO and 8 mol% Yttria Stabilized Zirconia pow- ders (AGC Seimi Chem. Corp., Japan), where the volume ratio of NiO to YSZ was 60% : 40%. 10 The anode was screen-printed onto 8 mol%YSZ pellet with a diameter of 10 mm. The anode was then sintered at 1450 ◦ C for 3 hours. The anode thickness was about 30 microns after sintering. The cathode was prepared by mixing (La 0.8 Sr 0.2 ) 0.97 MnO 3 (LSM, hereafter) powder with YSZ powder in a mass ratio of 50% : 50%. The cathode was sintered at 1200 ◦ C for 2 hours. After reduction, three samples were discharged at a current density of 200 mAcm −2 under 3 vol%H 2 O humidified hydrogen at 800 ◦ C for 0, 100 and 650 hours, respectively. Pure oxygen was in- troduced as an oxidant for the cathode side. The gas flow rates were 100 mlmin −1 for both fuel and oxidant. The hydrogen fuel utiliza- tion for anode is around 1.1%, which indicates that the whole anode can be treated as operated in an environment with uniform humidity of 3%. FIB-SEM reconstruction— The anode samples after experiments were observed by FIB-SEM (Carl Zeiss, NVision 40). All the samples were taken from the region close to the anode-electrolyte interface at the center of the anode. The samples were first infiltrated by low vis- cosity epoxy resin under low pressure atmosphere (ca. 15 Pa), so that the pores of the porous electrode could be easily distinguished during FIB-SEM reconstruction. The cured samples were then polished by using Ar-ion beam cross-section polisher (JEOL Ltd., SM-09010). The details of dual-beam FIB-SEM reconstruction technique are in- troduced in Refs. 9 and 10. The 2D SEM images are shown in Fig. 1 and the reconstructed 3D microstructures of the samples are shown in Fig. 2, with different operation time. In 2D images, the white, gray and black regions correspond to Ni, YSZ and pore, respectively. It can be observed that Ni particles shape experiences certain morphological change during the operation. Sharp Ni particles becomes round and the particle size increases with operation time, which is consistent with the coarsening mechanism of Ni phase. At the same time, the Ni crystal grain growth phenomena can also be observed according to the brightness difference in the Ni phase, which is caused by the different ) unless CC License in place (see abstract). ecsdl.org/site/terms_use address. Redistribution subject to ECS terms of use (see 157.82.152.190 Downloaded on 2014-03-06 to IP
Transcript of Simulation of Nickel Morphological and Crystal Structures Evolution in Solid Oxide Fuel Cell Anode...
Journal of The Electrochemical Society, 161 (5) F577-F582 (2014) F5770013-4651/2014/161(5)/F577/6/$31.00 © The Electrochemical Society
Simulation of Nickel Morphological and Crystal StructuresEvolution in Solid Oxide Fuel Cell Anode Using PhaseField MethodZhenjun Jiaoa,b and Naoki Shikazonoa,b,z
aInstitute of Industrial Science, University of Tokyo 4-6-1 Komaba, Meguro-ku, Tokyo 153-8505, JapanbCREST, JST
In the present study, a phase field method is used to simulate the morphological and crystal structural evolution of nickel-yttriastabilized zirconia composite anode of solid oxide fuel cell based on three-dimensional microstructures reconstructed by focusedion beam-scanning-electron-microscopy technique. A three-dimensional reconstruction of the anode sample after initial reduction isused as the initial microstructure. In order to simulate the nickel crystal grain growth and the corresponding morphological changeat the same time, both material composition and crystallographic orientation order parameters are introduced in the model. In orderto quantitatively study the nickel coarsening effect on anode performance, the evolution of three-phase boundary density and nickelspecific surface area are quantitatively calculated in the simulations. Simulation results reproduced well the initial microstructuralevolution in the experiments.© 2014 The Electrochemical Society. [DOI: 10.1149/2.009405jes] All rights reserved.
Manuscript submitted February 6, 2014; revised manuscript received February 25, 2014. Published March 4, 2014.
For decades, solid oxide fuel cell (SOFC, hereafter) has attractedmore and more attentions as an efficient power generation systemwith high fuel flexibility.1 In order to meet durability and stabilitytargets, the SOFC electrode degradation mechanisms have been in-vestigated intensively. In the current stage, high temperature SOFCanodes exhibit significant degradation in a long time operation, whichis mainly due to the coarsening phenomena of nickel (Ni, hereafter)in yttria-stablized zirconia (YSZ, hereafter) porous skeleton.2-10 Mostof the current investigations focus on the studies of anode microstruc-ture temporal evolution under high temperature operation. Simwoniset al.2 studied coarsening phenomena of Ni in porous Ni-YSZ anodebased on two-dimensional (2D, hereafter) scanning electron micro-scope (SEM, hereafter) images. The changes in the microstructure aswell as electrical conductivity of the material were investigated. Thereduction of active three phase boundary (TPB, hereafter) length arecaused by the Ni coarsening at high temperature.
Recently, focused ion beam-scanning electron microscopy (FIB-SEM) technique has been applied to reconstruct three-dimensional(3D, hereafter) electrode microstructures of SOFC.9-16 The techniqueprovides quantitative 3D information of the anode microstructure,which can be correlated to the anode electrochemical performancevia active TPB density. This approach leads to more accurate mi-crostructure analysis and facilitates further elaborative 3D numericalsimulations.
Phase field method has emerged as a powerful computationalmethod to simulate complex microstructure evolution in materials,which has been investigated by many researchers.17-26 In phase fieldmodel, interfaces of the phases are handled implicitly. All phases andinterfaces are incorporated into a grand function of the free energyin the entire system. Based on the FIB-SEM 3D reconstruction tech-nique, Chen et al.20,21 firstly applied phase field method to simulate thecoarsening process of Ni based on finite-difference method. The evolu-tion of microstructure is then characterized quantitatively by trackingTPB density, Ni specific surface area and tortuosity factors of Ni andpore phases. In their paper, the simulation results were not comparedwith the experimental results. In addition, FIB-SEM sample size wassmall. Jiao et al.22 have implemented efficient semi-implicit fourier-spectral approximation method in the phase field simulation, whichcan handle larger sample size. The simulation results were comparedwith the experimental results quantitatively. In both two simulations,Ni was treated as an uniform material without considering its crystalstructure.
In the present paper, a general phase-field model is applied to sim-ulate the 3D evolutions of coupled materials coarsening and crystalgrain growth in SOFC anode. In this model, the volume fractions of
zE-mail: [email protected]
both Ni and YSZ phases and the corresponding crystallographic ori-entation fields are defined independently. The new composition fieldsare introduced to represent the different crystallographic orientationsof both Ni and YSZ phases. The corresponding temporal evolutions ofTPB density and Ni specific surface area are quantitatively calculated.The simulation results are then compared with the experimental datato verify the model.
Experimental
Anode sample preparation— Electrolyte-supported cells wereused in this study. The anode cermet powder was prepared by me-chanically mixed NiO and 8 mol% Yttria Stabilized Zirconia pow-ders (AGC Seimi Chem. Corp., Japan), where the volume ratio ofNiO to YSZ was 60% : 40%.10 The anode was screen-printed onto8 mol%YSZ pellet with a diameter of 10 mm. The anode was thensintered at 1450◦C for 3 hours. The anode thickness was about30 microns after sintering. The cathode was prepared by mixing(La0.8Sr0.2)0.97MnO3 (LSM, hereafter) powder with YSZ powder ina mass ratio of 50% : 50%. The cathode was sintered at 1200◦C for2 hours. After reduction, three samples were discharged at a currentdensity of 200 mAcm−2 under 3 vol%H2O humidified hydrogen at800◦C for 0, 100 and 650 hours, respectively. Pure oxygen was in-troduced as an oxidant for the cathode side. The gas flow rates were100 mlmin−1 for both fuel and oxidant. The hydrogen fuel utiliza-tion for anode is around 1.1%, which indicates that the whole anodecan be treated as operated in an environment with uniform humidityof 3%.
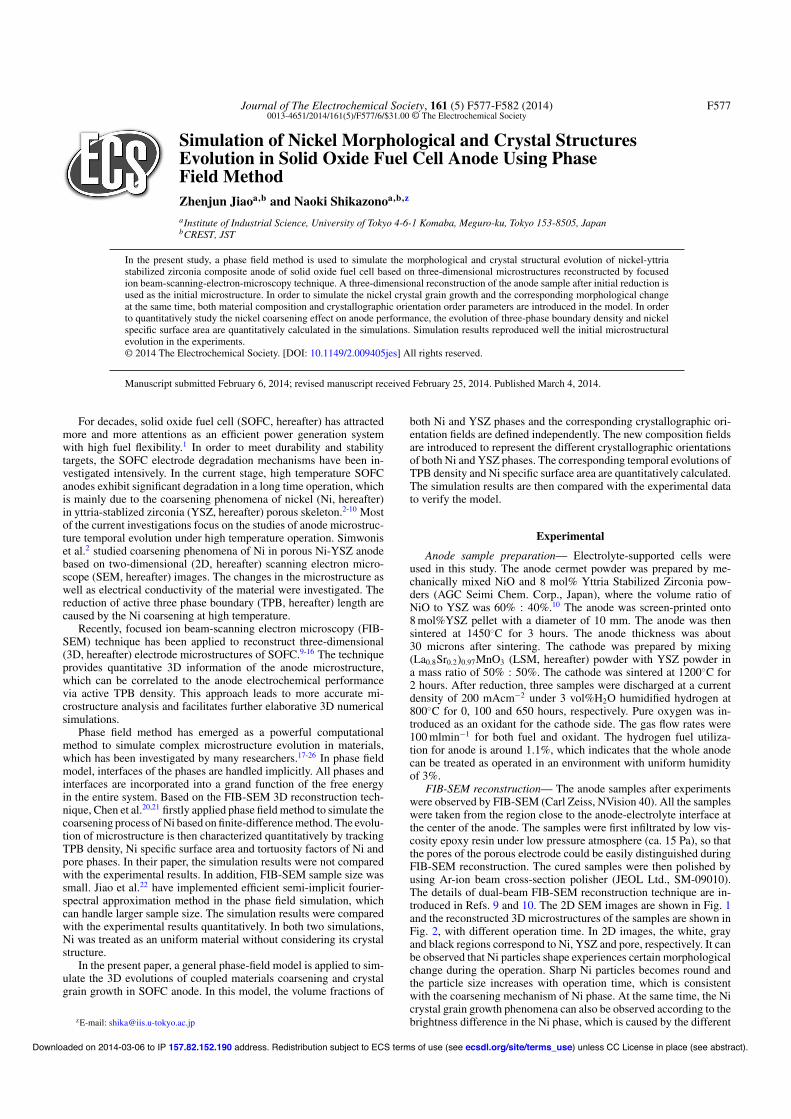
FIB-SEM reconstruction— The anode samples after experimentswere observed by FIB-SEM (Carl Zeiss, NVision 40). All the sampleswere taken from the region close to the anode-electrolyte interface atthe center of the anode. The samples were first infiltrated by low vis-cosity epoxy resin under low pressure atmosphere (ca. 15 Pa), so thatthe pores of the porous electrode could be easily distinguished duringFIB-SEM reconstruction. The cured samples were then polished byusing Ar-ion beam cross-section polisher (JEOL Ltd., SM-09010).The details of dual-beam FIB-SEM reconstruction technique are in-troduced in Refs. 9 and 10. The 2D SEM images are shown in Fig. 1and the reconstructed 3D microstructures of the samples are shown inFig. 2, with different operation time. In 2D images, the white, grayand black regions correspond to Ni, YSZ and pore, respectively. It canbe observed that Ni particles shape experiences certain morphologicalchange during the operation. Sharp Ni particles becomes round andthe particle size increases with operation time, which is consistentwith the coarsening mechanism of Ni phase. At the same time, the Nicrystal grain growth phenomena can also be observed according to thebrightness difference in the Ni phase, which is caused by the different
) unless CC License in place (see abstract). ecsdl.org/site/terms_use address. Redistribution subject to ECS terms of use (see 157.82.152.190Downloaded on 2014-03-06 to IP

F578 Journal of The Electrochemical Society, 161 (5) F577-F582 (2014)
11
1
1
(a) After reduction
(b) After 100 hrs operation
(c) After 650 hrs operation
Grain boundary Grain boundary
Grain boundary Grain boundary
Grain boundary Grain boundary
Figure 1. 2D FIB-SEM images of the anodes after (a) 0, for (b) 100 and (c)650 hours of operation with a current density of 200 mAcm−2. (White: Ni,gray:YSZ, black: pore).
x x
yy
18.3 µm
18.6 µm
10.6
µm
x
y
z
18.4 µm
15.4 µm
12.1
µm
x
y
z
13.7 µm
13.0 µm
8.3 µm
x
y
z
(a)
(b)
(c)
Figure 2. 3D reconstruction images of the anodes after (a) 0, for (b) 100 and(c) 650 hours of operation corresponding to Fig. 1. (Gray: Ni, green: YSZ).
Table I. Volume fractions and percolation connectivities of Ni andYSZ phases in anodes after different operation time.
After 100 hrs 650 hrsParameter Phase reduction operation operation
Volume fraction (%) Ni 26.81 25.00 26.65YSZ 33.52 35.19 37.53
Percolated phase fraction (%) Ni 98.20 95.28 95.92YSZ 98.59 99.36 99.34
reflectivity of electron beam from different Ni crystallographic orien-tations. The YSZ phase showed little change with operation time. Thecorresponding volume fractions and phase percolation connectivitiesof Ni and YSZ phases are shown in Table I. It can be seen that Ni lostpercolation connectivity from 98.2% to 95.9%, after a 650 hours oper-ation, while YSZ percolation connectivity remained the same againstoperation time.
Numerical Model
In previous study, the coarsening of Ni in SOFC anode operatedat high temperature has been quantitatively studied based on FIB-SEM reconstruction.9,10 Anode performance degradation has beencorrelated to the coarsening of Ni, which results in the reductionof Ni percolation and the corresponding active TPB density. In or-der to simulate the coarsening of Ni in YSZ network in SOFCanode, three composition order parameters (OPs, hereafter) CNi(r),CYSZ(r), and Cpore(r) are introduced to represent the correspondingphase volume fractions of Ni, YSZ and pore, respectively, wherer is the space parameter. In Ni phase, CNi(r) = 1, CYSZ(r) = 0and Cpore(r) = 0. In YSZ phase, CNi(r) = 0, CYSZ(r) = 1 andCpore(r) = 0. In pore phase, Cpore(r) = 1 − CNi(r) − CYSZ(r). Atinterface, the OP transits smoothly from 0.0 to 1.0. The physical in-terface can be defined by tracking OPs= 0.5. In order to simulatethe phase and crystal grain evolutions at the same time, two series ofgrain crystallographic orientation OPs
[η1 (r) , η2 (r) , . . . , ηp/q (r)
]
= (1, 0, . . . , 0) , (0, 1, . . . , 0) , · · · (0, 0, . . . , 1), are introduced withinthe diffuse-interface context for the corresponding solid material phasein space, while p and q are the corresponding crystallographic orien-tation numbers of Ni and YSZ. The non-conserved orientation OP ηtransits smoothly from −1.0 to 1.0 at the interface of any two adja-cent grains, while ±1.0 indicate opposite crystal orientations. At thegrain boundary between any two grains with different orientations, ηhas its absolute value transient between 0.0 and 1.0. All orientationOPs are zero for pore phase. The total free energy of the three phasecomposition and orientation OPs thus can be constructed within thediffuse-interface field theory as19
F =∫
V
dV
⎡
⎢⎢⎣
f0(CNi, CYSZ; ηNi
i , ηYSZi
)+ κNi
C2 (∇CNi)2+ κYSZ
C2 (∇CYSZ)2
+p∑
i=1
κNii2
(∇ηNi
i
)2 +q∑
i=1
κYSZi2
(∇ηYSZ
i
)2
⎤
⎥⎥⎦,
[1]where κNi
C , κYSZC and κNi
i , κYSZi are the corresponding gradient energy
coefficients and f0 is the local free energy density which is given by
f0 = f1(CNi) + f1(CYSZ) +p∑
i=1f2
(CNi,η
Nii
)+
q∑i=1
f2(CYSZ, ηYSZ
i
)
+p∑
i=1
p∑j ̸=i
f3(ηNi
i , ηNij
)+
q∑i=1
q∑j ̸=i
f3(ηYSZ
i , ηYSZj
)+ f4(CNi, CYSZ),
[2]
) unless CC License in place (see abstract). ecsdl.org/site/terms_use address. Redistribution subject to ECS terms of use (see 157.82.152.190Downloaded on 2014-03-06 to IP

Journal of The Electrochemical Society, 161 (5) F577-F582 (2014) F579
where⎧⎪⎪⎪⎪⎨
⎪⎪⎪⎪⎩
f1 (C)=− (A/2) (C−Cm)2+(B/4) (C−Cm)4+(D/4) (C−C0)4
f2 (C, ηi ) = − (γ/2) (C − C0)2(ηi )2 + (γ/4) (ηi )4
f3(ηi , η j
)=
(εi j/2
)(ηi )2(η j
)2
f4(Cx , Cy
)= (λ/2) (Cx )2(Cy
)2
.
[3]The phenomenological parameters in Eq. (3) are assumed asCm = 0.5, C0 = 0.0, A = 1.0, B = 4.0, D = 1.0, γ = 1.0, εi j = 3.0and λ = 1.0.19 These coefficients are chosen so that f0 has degenerateminima to prohibit the inter-diffusion between different phases andgrains. This forces each point in space to belong to a single phasewith the given grain orientation. Based on the standard Cahn-Hilliarddynamics evolution equation, the conserved governing equation of Nivolume fraction coarsening evolution can be obtained as
⎧⎪⎨
⎪⎩
∂CNi∂t = ∇ ·
{MNi
C ∇[
∂ f0∂CNi
− κNiC ∇2CNi
]}
∂CYSZ∂t = ∇ ·
{MYSZ
C ∇[
∂ f0∂CYSZ
− κYSZC ∇2CYSZ
]} , [4]
where t is time and MC is the material mobility in the correspondinganode operation condition.
Based on the standard Allen-Cahn dynamics evolution equation,the non-conserved governing equation of solid crystal grain growthcan be obtained as
⎧⎪⎨
⎪⎩
∂ηNii
∂t = −LNii
[∂ f0∂ηNi
i− κNi
i ∇2ηNii
]; i = 1, 2, . . . , p
∂ηYSZi∂t = −LYSZ
i
[∂ f0
∂ηYSZi
− κYSZi ∇2ηYSZ
i
]; i = 1, 2, . . . , q
,
[5]where Li are the coefficients of grain boundary mobilities according todifferent orientations in the specific phase, respectively. The gradientcoefficients ratios for phase parameters are set as κNi
C : κYSZC : κNi
i :κYSZ
i = 1 : 0.82 : 0.71 : 0.52.27 Upthegrove et al.28,29 have reportedthat the ratio of Ni grain boundary self-diffusion coefficient to thelattice diffusion coefficient varies from 103 to 107 in a temperaturerange of 973–1373 K. In this paper, the diffusion is considered to bedominated by Ni grain boundary diffusion while lattice diffusion isneglected according to the large ratio of Ni grain boundary and latticediffusion coefficients. In this study, YSZ is treated as a stable phase,the mobilities of Ni and YSZ are described as
⎧⎨
⎩
MNiC = MNi−GB
(1 −
∑p1 ηNi
2)
g (1 − CYSZ)
MYSZC = 0
, [6]
where MNi−GB is Ni grain boundary mobility. Function g (x)= x6
(10x2 − 15x + 6
)is used to ensure that Ni phase is immo-
bile at Ni-YSZ interface by limiting Ni mobility transiently rangingfrom MNi−GB at CYSZ = 0.5 to 0.0 at CYSZ = 1.0.
In simulation, cubic 256 × 256 × 256 discrete voxels wereused to describe the initial 3D structure with a size of10µm×10µm×10µm. In order to facilitate the simulation, the gov-erning equations Eqs. (4) and (5) are non-dimensionalized as MNi∗
C
=(1 −
∑p1 ηNi
2)
g (1 − CYSZ), LNi∗i = LNi
i l20/MNi−GB, ∇∗ = l0∇ and
t∗ = MNi−GBt/l20 , while l0 = 41.2 nm is the characteristic length
of a voxel. Fourier-spectral approximation is introduced to transformthe partial differential equation into a sequence of ordinary differen-tial equations in Fourier space.22,24-26 By using semi-implicit schemein the time iterations, the time-step constrain can also be alleviatedwithout losing stability and accuracy. For Fourier-spectral approxi-mation method, direct periodic boundary conditions are applied alongthe three axes for the cubic sample.22 The time step for the evolu-tion is "t∗ = 0.05. The kinetic coefficients for Allen-Cahn equationsare LNi∗
i = 1 and LYSZ∗i = 0, and the mobilities for Cahn-Hilliard
equation are MNi∗C = 1. It is difficult to reconstruct the initial crys-
tallographic orientations based on the contrast difference of originalFIB-SEM images. In order to obtain the initial crystallographic ori-entations of both Ni and YSZ phases, the simulation was started fromdisordered phases, i.e., phases with random values (±0.001) for bothNi and YSZ. The mobilities of Cahn-Hilliard equations are all setto 0.0 and the kinetic coefficients of Allen-Cahn equations are setto be LNi∗
i = 1 and LYSZ∗i = 1. This ensures the initial 3D vol-
ume fractions and the volume conservation. The initial crystal graingrowth simulation was completed within 4200 time steps as shown inFig. 5(a).
The microstructure evolution is driven by the total interfacialboundary energy. The gradient energy coefficients together with thekinetic mobilities thus control the kinetics of microstructure evolutionand the contact angles of Ni on YSZ. It is found that the gradientcoefficients play a key role in determining the contact angles.19 Inthis study, as YSZ is treated as a stable phase, the contact angle isdetermined by the local interfacial energy ratio κNi
C : κYSZC between Ni
and YSZ phases, instead of being fixed to a constant value.
Results and Discussion
Figures 3 and 4 show the 3D reconstructions of the anode andthe corresponding independent Ni phase microstructures at differentdimensionless times in the simulation corresponding to direct peri-odic boundary condition method. The surface of Ni particles becomessmooth, which corresponds to the reduction of surface energy. The
(a) (b) t = 0 t = 80 t =520
(c)
Figure 3. 3D reconstruction images of Ni-YSZ anode at different dimensionless times in simulation with direct periodic boundary conditions. (Axis unit: gridnumber, gray: Ni, green: YSZ.)
) unless CC License in place (see abstract). ecsdl.org/site/terms_use address. Redistribution subject to ECS terms of use (see 157.82.152.190Downloaded on 2014-03-06 to IP

F580 Journal of The Electrochemical Society, 161 (5) F577-F582 (2014)
(a) (b) t = 0 t = 80 t =520
(c)
Figure 4. 3D reconstruction images of independent Ni phase corresponding to Fig. 3. (Axis unit: grid numbe, gray: Ni.)
(a) (b) t = 0 t = 80 t =520* * *
(c)
Figure 5. 2D cross-sections of Ni-YSZ anode corresponding to Fig. 3. (Axis unit: grid number, white: Ni, gray: YSZ, black: pore).
influence of Ni crystal grain growth can also be observed, whichslows down the Ni particle surface from becoming perfectly roundin certain extent. Figure 5 show the specific 2D cross-sections of theanode microstructure at different dimensionless times in the simula-tion so that the grain growth phenomena can be observed. In orderto visualize crystal grains, the 2D image gray-scale is defined asφ(r) =
∑pi=1 [ηNi
i (r)]2 + 0.5∑q
j=1 [ηYSZj (r)]2. It can be seen from
Figs. 4 and 5 that Ni phase coarsening leads to the smoothing of par-ticles while the microstructural evolution appears to slow down afterthe initial stage. At the same time, the increase of particle size and thecoalescence of Ni grains can be observed in the 2D images. Figure 6shows the Ni phase network percolation percentage evolution versusdimensionless time. It can be seen that Ni lost percolation connectivityfrom 98.2% to about 94.0% after the simulation, which is similar tothe experimental data as described in Table I. Thus it can be concludedthat the breakup of Ni net work contributed little to the degradation ofactive TPB density.
Both TPB density and Ni surface area were tracked against timein the simulation. Figures 7(a) and 7(b) show the evolutions of TPBdensity and Ni surface area density versus dimensionless time. BothTPB density and Ni surface area densities decreases rapidly in theinitial short period, and then enter a relatively stable stage with a lowdegradation rate. In order to estimate the unknown Ni grain boundarymobility MNi−GB, the real-time volumetric TPB density and Ni surfacearea at 0, 100 and 650 hours in experiments were measured based onthe original FIB-SEM 3D reconstructions as shown in Fig. 2. The ex-
perimentally measured TPB density and specific Ni surface area werethen used for fitting the time scale as shown in Figs. 7(a) and 7(b). Itis very difficult to obtain the actual kinetic mobilities for the SOFCanode materials under operation condition. In order to perform the
0 100 200 300 400 500 600 700 80050
60
70
80
90
100
dimensionless time
peco
latio
n pe
rcen
tage
(%
)
Figure 6. Ni phase network percolation percentage versus dimensionlesstime.
) unless CC License in place (see abstract). ecsdl.org/site/terms_use address. Redistribution subject to ECS terms of use (see 157.82.152.190Downloaded on 2014-03-06 to IP

Journal of The Electrochemical Society, 161 (5) F577-F582 (2014) F581
0 100 200 300 400 500 600 700 8000
0.5
1
1.5
2
2.5
3
0 100 200 300 400 500 600 700 8000
0.5
1
1.5
2
2.5
3
3.5
4
4.5
dimensionless time
TP
B d
ensi
ty (
umum
−3)
dimensionless time
Ni s
peci
fic s
urfa
ce a
rea
(um
2 um−3
)
SimulationExperimental
SimulationExperimental
(a)
(b)
Figure 7. (a) Volumetric TPB and (b) Ni specific surface area evolutionsversus dimensionless time.
phase-field model to simulate the specific SOFC electrode microstruc-ture, the mobility must be evaluated by fitting the experimental data.According to the definition of dimensionless time, t∗ = MNi−GBt/ l2
0, it is estimated that MNi−GB ≈ 3.8 × 10⁻¹⁹ m2 s−1 and LNi
i ≈ 2.2×10⁻⁴ s−1 fit well with the present operation environment, i.e. 3 vol%H2O humidified hydrogen at 800◦C. The whole simulation period thuscan be estimated to be about 980 hours in real time scale. Figure 8shows the particle size accumulation curves generated by intercept-length method for Ni phase at different dimensionless time.2 Theincrease of the average particle size can be observed against dimen-sionless time, which proves the coarsening phenomena of Ni phase.The average particle size increasing speed decreases with time, whichis caused by the decreasing surface energy gradient in particle smooth-ing process.
Based on the results of phase field simulations, it is seen that theNi coarsening causes the reduction of the total anode TPB density andNi specific surface area in operation. In the future investigation, byimproving the computation efficiency, higher voxel resolution, largersample size and longer time simulation for Ni coarsening evolutionwill be conducted to obtain more accurate prediction of the anode mi-crostructure and performance degradation under long-time operation.Besides, the influences of the initial Ni grain size and the differentcombinations of gradient coefficients of both phases on the simulationresults will also be investigated. Further more, by using both of themorphological and crystal structures of Ni phase, the NiO reductionprocess can also be simulated based on 3D FIB-SEM reconstruction
0 0.5 1 1.5 2 2.5 30
0.2
0.4
0.6
0.8
1
Intercept length (µm)
Acc
umul
ated
frac
tion
t*= 0t*= 80t*= 520t*= 780
Figure 8. Particle size accumulation curves generated by intercept-lengthmethod for Ni phase at different dimensionless time.
of NiO-YSZ microstructure so that the influence of reduction processon anode initial performance can be investigated quantitively.
Conclusion
Phase field method has been applied to quantitatively simulate thecoarsening of Ni in SOFC Ni-YSZ composite anode in high tempera-ture operation. In addition to the simulation of Ni phase morphologicalchange, new crystallographic orientation order parameters are intro-duced in the model to simulate the corresponding crystal grain growthat the same time. Both TPB density and Ni specific surface area evo-lution versus time were quantitatively simulated. After the initial fastdecrease of TPB density and Ni specific surface area, both tend toenter a stable evolution stage with a low degradation rate. Ni particlesize increase caused in coarsening was verified by intercept-lengthmethod.
Acknowledgments
This work was partly supported by the Core Research for EvolutionScience and Technology (CREST), JST.
References
1. C. S. Subhash and K. Kevin, High Temperature Solid Oxide Fuel Cells: Fundamen-tals, Design and Applications, Elsevier Advanced Technology (2003).
2. D. Simwonis, F. Tietz, and D. Stover, Solid State Ionics, 132, 241 (2000).3. S. P. S. Badwal, M. J. Bannister, and R. H. J. Hannink, Science and Technology of
Zirconia V, Technomic publishing Company (2003).4. S. Koch, P. V. Hendriksen, M. Mogensen, Y-L. Liu, N. Dekker, B. Rietveld,
B. De. Haart, and F. Tietz, Fuel Cells, 2, 130 (2006).5. B. de Boer, Ph.D. Thesis, University of Twente, the Netherlands (1998).6. J. Mizusaki, H. Tagawa, T. Saito, T. Yamamura, K. Kamitani, K. Hirano, S. Ehara,
T. Takagi, T. Hikita, M. Ippommatsu, S. Nakagawa, and K. Hashimoto, Solid StateIonics, 70-71, 52 (1994).
7. J. Mizusaki, H. Tagawa, T. Saito, T. Yamamura, K. Kamitani, K. Hirano, S. Ehara,T. Takagi, T. Hikita, M. Ippommatsu, S. Nakagawa, and K. Hashimoto, J. Elec-trochem. Soc., 141, 2129 (1994).
8. M. S. Schmidt, K. V. Hansen, K. Norrman, and M. Mogensen, Solid State Ionics,180, 431 (2009).
9. Z. Jiao, N. Shikazono, and N. Kasagi, J. Electrochem. Soc., 159(3), B285 (2012).10. Z. Jiao, N. Shikazono, and N. Kasagi, J. Electrochem. Soc., 159, F278 (2012).11. H. Sumi, H. Kishida, J-Y. Kim, H. Muroyama, T. Matsui, and K. Eguchi, J. Elec-
trochem. Soc., 157, B1747 (2009).12. N. Vivet, S. Chupin, E. Estrade, T. Piquero, P. L. Pommier, D. Rochais, and
E. Bruneton, J. Power Sources, 196, 7541 (2011).13. T. Matsui, R. Kishida, J-Y. Kim, H. Muroyama, and K. Eguchi, J. Electrochem. Soc.,
157, B776 (2010).
) unless CC License in place (see abstract). ecsdl.org/site/terms_use address. Redistribution subject to ECS terms of use (see 157.82.152.190Downloaded on 2014-03-06 to IP

F582 Journal of The Electrochemical Society, 161 (5) F577-F582 (2014)
14. H. Iwai, N. Shikazono, T. Matsui, H. Teshima, M. Kishimoto, R. Kishida, D. Hayashi,K. Matsuzaki, D. Kanno, M. Saito, H. Muroyama, K. Eguchi, N. Kasagi, andH. Yoshida, J. Power Sources, 195, 955 (2010).
15. J. S. Cronin, K. Muangnapoh, Z. Patterson, K. J. Yakal-Kremski, V. P. Dravid, andS. A. Barnett, J. Electrochem. Soc., 159(3), B385 (2012).
16. L. Holzer, B. Munch, B. Iwanschitz, M. Cantoni, T. Hocker, and T. Graule, J. PowerSources, 196, 7076 (2011).
17. R. S. Qin and H. K. Bhadeshia, Mater. Sci. Tech. Ser., 26, 803 (2010).18. L-Q. Chen, Annu. Rev. Mater. Res., 32, 113 (2002).19. Q. Li, L. Liang, K. Gerdes, and L-Q. Chen, Appl. Phys. Lett., 101, 033909 (2012).20. H-Y. Chen, Ph.D. Thesis, the University of Michigan, the USA (2011).21. H-Y. Chen, H-C. Yu, J. S. Cronin, J. R. Wilson, S. A. Barnett, and K. Thornton, J.
Power Sources, 196, 1333 (2011).
22. Z. Jiao and N. Shikazono, J. Electrochem. Soc., 160, F709 (2013).23. Fadi Abdeljawad, Benjamin Volker, Ryan Davis, Robert M. McMeeking, and
Mikko Haataja, J. Power Sources, 250, 319 (2014).24. J. Zhu, L.-Q. Chen, J. Shen, and V. Tikare, Physical Review E, 60, 3564
(1999).25. D. J. Seol, S. Y. Hu, Y. L. Li, J. Shen, K. H. Oh, and L. Q. Chen, Acta Materialia,
51, 5173 (2003).26. L. Q. Chen and J. Shen, Comput. Phys. Commun., 108, 147 (1998).27. S. Hara, K. Shikata, N. Shikazono, S. Izumi, and S. Sakai, ECS Trans., 57, 2857
(2012).28. W. R. Upthegrove and M. J. Sinnott, Trans. Am. Soc. Metals., 50, 1031
(1958).29. A. R. Wazzan, J. Appl. Phys., 36, 3596 (1965).
) unless CC License in place (see abstract). ecsdl.org/site/terms_use address. Redistribution subject to ECS terms of use (see 157.82.152.190Downloaded on 2014-03-06 to IP