Simulation and Optimization of Sour Gas Processing
12
RJCES Vol 4 [4S] 2016 140 | P age © 2016 AELS, INDIA FULL LENGTH ARTICLE Simulation and Optimization of Sour Gas Processing S. V. Kadoli*, S. V. Anekar, P. J. Patil Tatyasaheb Kore Instituteof Engineering & Technology, Warananagar ABSTRACT Selection of an amine for gas sweetening is complex and must be based on several process considerations. These factors are analyze based process simulation program for gas sweetening called TSWEET. Providing MEA concentration from 15-20 wt% with the steam ratio from 0.8 to 1.0 lb/gal it found that the H2S content in sweet gas stream as well as MEA circulation rate decreases. Processing with MDEA it is possible to reduce circulation rate as a result process cost decreases. TSWEET used to examine the performance of other amines. A mixture of 20-50 wt% MDEA and 0.5 wt% Phosphoric acid yields a sweet gas with less than 4.0 ppm H2S and 0.7% Carbon dioxide whereas rich loading is below 0.5 which is reasonable. The blending with Phosphoric acid would likely be the most desirable choice for this application .This can be safely operated over wide range of concentration. Keywords: TSWEET, Sour Gas, MEA INTRODUCTIONThe art using alkanolamines for removal of hydrogen sulfide and carbon dioxide from natural gases has been used for decades. Since the 1960’s and 70’s several amines have come into general use, however, limited information has been reported in the literature concerning the amine best suited to a particular service. Many amine units which are operating very inefficiently could be optimized by simply changing amines [1]. The basic flow scheme for an amine sweetening unit is shown in above Fig. No.1 In the design of the process, the primary concern is that the sweetened gas meet the required purity specifications with respect to H2S and CO2.The secondary objective is to select the amine which optimizes equipment size and minimizes plant operating costs. Some of the factors to be considered in the selection of the proper amine for design or existing plant evaluation include: 1. Can the amine circulation rate be reduced by selecting an amine which may be used at a higher concentration and/or solution acid gas loading? 2. Could the reboiler/condenser size and duty be minimized by use of an amine which requires a lower circulation rate, and/or which has lower heats of reaction with H2S and CO2? 3. If the sales gas specifications allow, could H2S be selectively absorbed from the sour gas whilerejecting CO2? Can the H2S and CO2 absorption from the sour gas be optimized by use of an amine mixture? 4. Do corrosion problems exist? If so, is there an amine or mixture of amines more resistant to degradation which can be used to minimize corrosion problems and reduce solution losses? 5. Could an alternate flow scheme increase the efficiency of the process (i.e. split flow, absorbers in series or parallel, use of a precontactor for bulk CO2 removal, or bulk CO2 removal using a pressure swing plant with no stripper?) A 50 to 70% of the initial investment for an amine sweetening unit is directly associated with the magnitude of the solvent circulation rate, and another 10 to 20% of the initial investment is dependent on the regeneration energy requirement [2]. R R R J J J C C C E E E S S S Research Journal of Chemical and Environmental Sciences Res J. Chem. Environ. Sci. Vol 4 [4S] 2016: 140-151 Online ISSN 2321-1040 CODEN: RJCEA2 [USA] ©Academy for Environment and Life Sciences, INDIA Website: www.aelsindia.com/rjces.htm
-
Upload
khangminh22 -
Category
Documents
-
view
3 -
download
0
Transcript of Simulation and Optimization of Sour Gas Processing

RJCES Vol 4 [4S] 2016 140 | P a g e © 2016 AELS, INDIA
FFUULLLL LLEENNGGTTHH AARRTTIICCLLEE
Simulation and Optimization of Sour Gas Processing
S. V. Kadoli*, S. V. Anekar, P. J. Patil Tatyasaheb Kore Instituteof Engineering & Technology, Warananagar
ABSTRACT
Selection of an amine for gas sweetening is complex and must be based on several process considerations. These factors are analyze based process simulation program for gas sweetening called TSWEET. Providing MEA concentration from 15-20 wt% with the steam ratio from 0.8 to 1.0 lb/gal it found that the H2S content in sweet gas stream as well as MEA circulation rate decreases. Processing with MDEA it is possible to reduce circulation rate as a result process cost decreases. TSWEET used to examine the performance of other amines. A mixture of 20-50 wt% MDEA and 0.5 wt% Phosphoric acid yields a sweet gas with less than 4.0 ppm H2S and 0.7% Carbon dioxide whereas rich loading is below 0.5 which is reasonable. The blending with Phosphoric acid would likely be the most desirable choice for this application .This can be safely operated over wide range of concentration. Keywords: TSWEET, Sour Gas, MEA
INTRODUCTIONThe art using alkanolamines for removal of hydrogen sulfide and carbon dioxide from natural gases has been used for decades. Since the 1960’s and 70’s several amines have come into general use, however, limited information has been reported in the literature concerning the amine best suited to a particular service. Many amine units which are operating very inefficiently could be optimized by simply changing amines [1]. The basic flow scheme for an amine sweetening unit is shown in above Fig. No.1 In the design of the process, the primary concern is that the sweetened gas meet the required purity specifications with respect to H2S and CO2.The secondary objective is to select the amine which optimizes equipment size and minimizes plant operating costs. Some of the factors to be considered in the selection of the proper amine for design or existing plant evaluation include: 1. Can the amine circulation rate be reduced by selecting an amine which may be used at a higher concentration and/or solution acid gas loading? 2. Could the reboiler/condenser size and duty be minimized by use of an amine which requires a lower circulation rate, and/or which has lower heats of reaction with H2S and CO2? 3. If the sales gas specifications allow, could H2S be selectively absorbed from the sour gas whilerejecting CO2? Can the H2S and CO2 absorption from the sour gas be optimized by use of an amine mixture? 4. Do corrosion problems exist? If so, is there an amine or mixture of amines more resistant to degradation which can be used to minimize corrosion problems and reduce solution losses? 5. Could an alternate flow scheme increase the efficiency of the process (i.e. split flow, absorbers in series or parallel, use of a precontactor for bulk CO2 removal, or bulk CO2 removal using a pressure swing plant with no stripper?) A 50 to 70% of the initial investment for an amine sweetening unit is directly associated with the magnitude of the solvent circulation rate, and another 10 to 20% of the initial investment is dependent on the regeneration energy requirement [2].
RRRJJJCCCEEESSS
Research Journal of Chemical and Environmental Sciences Res J. Chem. Environ. Sci. Vol 4 [4S] 2016: 140-151 Online ISSN 2321-1040 CODEN: RJCEA2 [USA] ©Academy for Environment and Life Sciences, INDIA Website: www.aelsindia.com/rjces.htm

RJCES Vol 4 [4S] 2016 141 | P a g e © 2016 AELS, INDIA
Fig.No.1 Process flow sheet for common sweetening plant
GENERAL CONSIDERATIONS FOR SELECTING AMINES: The general criteria for amine selection in sweetening plants have very much important issues and updated over the years. Until the 1970’smonoethanolamine (MEA) was the amine first considered for any sweetening application. Then switching from MEA to ethanolamine (DEA) yielded favorable results [3-4]. In the era the MDEA, DGA, and mixed amines have steadily gained popularity. As different operating conditions were tested and proven with a particular amine, adopted on an industry-wide basis POPULAR CHEMICAL SOLVENTS: Nearly all chemical solvents used for gas sweetening are alkanolamines. An amine is an ammonia molecule (NH3) with one, two or all three of the hydrogen atoms replaced by some other substituent shown in Fig. No. 2. Amines are classified as primary, secondary or tertiary depending on the number of substituents.
Fig. No.2: Different types of amines: primary (left), secondary (middle) and tertiary (right)
The nitrogen atom on an amine group contains a lone pair of electrons, and this lone pair is free to interact with surrounding molecules. As substituents are added, this lone pair becomes more stable (delocalized), which decreases its affinity for surrounding molecules. Thus, primary amines generally interact most aggressively with their surroundings, while tertiary amines are typically the least aggressive of the three. When one or more of the amine substituents is an alcohol, the molecule is referred to as an “alkanolamine”. Alkanolamines are very effective at selectively removing acid gases from gas streams. In practice they are diluted with water, with the amine content typically ranging anywhere from 10 to 70% by mass. Adding water reduces the viscosity and corrosivity of the solution to within acceptable limits, and also reduces the hydrocarbon solubility [5]. In addition, it makes regeneration much easier, since the acid gases are better able to vaporize if there is also a relatively large volume of water being vaporized as well. The specific chemical reactions between acid gases and an alkanolamine can be expressed in a variety ofdifferent ways. For H2S removal with alkanolamines, the most significant interactions are the following:
�� �↔ �� + ��� (1.1) ��� ↔ �� + ��� (1.2)
�� + ��� ↔ ��� ��� (1.3)
In these reactions, H2S is first ionized, after which the hydrogen ions interact with the lone pair of electrons on the nitrogen atom. This stabilizes the hydrogen ions in solution and prevents them from recombining back into H2S molecules. The result is that H2S molecules are drawn from the gas into solution. Note that Reaction (1.3) refers specifically to primary amines but applies to both secondary and
Kadoli et al

RJCES Vol 4 [4S] 2016 142 | P a g e © 2016 AELS, INDIA
tertiary amines as well, only with one or both of the H atoms on the amine replaced with an arbitrary R group. For CO2 removal with alkanolamines, the most significant interactions are the following:
��� + ��� ↔ �� + �����(1.4)
����� ↔ �� + ���
��(1.5) ����
� + ��� � ↔ ������ + �� 0(1.6) �� + ���� ↔ ������ (1.7)
Note that Reactions (1.3) and (1.7) are identical (i.e. the same reaction contributes to both H2S and CO2 removal). Also, Reaction (1.6) is for primary amines but with the proper modification it also applies to secondary amines. It does not, however, apply to tertiary amines. The latter can only absorb CO2 by attracting hydrogen ions and thereby promoting Reactions (1.4) and (1.5). Because of this, tertiary amines typically absorb much more H2S than CO2, a fact which is leveraged whenever CO2 removal is of lesser concern. As evidenced by these reactions, it is generally the nitrogen atom of an alkanolamine that drives the acid gas removal. The alcohol groups serve to improve the solubility of the molecule in water, and to reduce its vapor pressure, which helps minimize the amount of amine lost during the solvent regeneration process [6]. Acid gas loading is the ratio of moles of acid gas to moles of amine in a given stream. Rich loading refers to this ratio in the liquid stream leaving the absorber (the “rich” solvent), while lean loading refers to the liquid stream leaving the regenerator (the “lean” solvent). The rich loadingprovides a relative measure of the acid gas concentration in the solvent, while the lean loading provides a relative measure of how effectively the solvent has been regenerated. Experience has indicated that keeping the rich loading within certain empirically-determined limits is critical to preventing corrosion in equipment constructed of carbon steel. Each alkanolamine has a recommended concentration range and maximum rich loading associated with it. These recommendations are very general guidelines designed to maintain the solvent safely within corrosion limits. Note, however, that operating outside these conditions is possible, particularly if stainless construction materials are used [7]. MEA MEA is a primary amine that can effectively remove both H2S and CO2 to within most specifications. Of the available amines, it is perhaps the most aggressive, which allows it to remove acid gases down to very low levels even at low pressures. Its structure is shown in Fig. No. 3
Fig. No.3:Monoethanolamine(MEA)
While long popular for acid gas removal, MEA has a number of drawbacks. It forms degradation products with COS, CS2, SO2 and SO3 and thus requires use of a reclaimer when these compounds are present in the feed [8]. These degradation products are also relatively corrosive, so that the usable concentration of MEA is limited to 15-20 wt%, and the rich loading should not exceed 0.35 with carbon steel equipment. DEA DEA is a secondary amine that offers similar performance to that of MEA, but generally with lower operating costs, and without the same tendency to form degradation products with COS and CS2. It is not as aggressive as MEA, though, so it cannot be used at as low a pressure as MEA. Its structure is shown in fig 4.
Kadoli et al
RJCES Vol 4 [4S] 2016 143 | P a g e © 2016 AELS, INDIA
Fig. No.4: Diethanolamine(DEA)
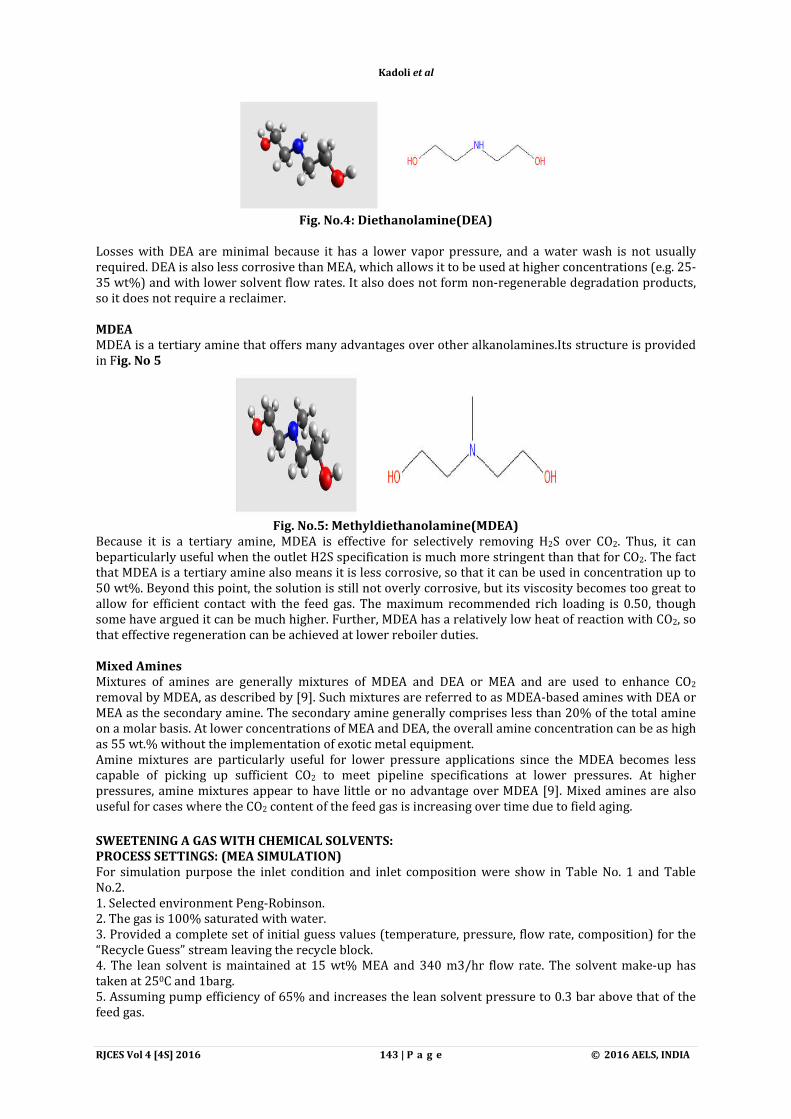
Losses with DEA are minimal because it has a lower vapor pressure, and a water wash is not usually required. DEA is also less corrosive than MEA, which allows it to be used at higher concentrations (e.g. 25- 35 wt%) and with lower solvent flow rates. It also does not form non-regenerable degradation products, so it does not require a reclaimer. MDEA MDEA is a tertiary amine that offers many advantages over other alkanolamines.Its structure is provided in Fig. No 5
Fig. No.5: Methyldiethanolamine(MDEA)
Because it is a tertiary amine, MDEA is effective for selectively removing H2S over CO2. Thus, it can beparticularly useful when the outlet H2S specification is much more stringent than that for CO2. The fact that MDEA is a tertiary amine also means it is less corrosive, so that it can be used in concentration up to 50 wt%. Beyond this point, the solution is still not overly corrosive, but its viscosity becomes too great to allow for efficient contact with the feed gas. The maximum recommended rich loading is 0.50, though some have argued it can be much higher. Further, MDEA has a relatively low heat of reaction with CO2, so that effective regeneration can be achieved at lower reboiler duties. Mixed Amines Mixtures of amines are generally mixtures of MDEA and DEA or MEA and are used to enhance CO2 removal by MDEA, as described by [9]. Such mixtures are referred to as MDEA-based amines with DEA or MEA as the secondary amine. The secondary amine generally comprises less than 20% of the total amine on a molar basis. At lower concentrations of MEA and DEA, the overall amine concentration can be as high as 55 wt.% without the implementation of exotic metal equipment. Amine mixtures are particularly useful for lower pressure applications since the MDEA becomes less capable of picking up sufficient CO2 to meet pipeline specifications at lower pressures. At higher pressures, amine mixtures appear to have little or no advantage over MDEA [9]. Mixed amines are also useful for cases where the CO2 content of the feed gas is increasing over time due to field aging.
SWEETENING A GAS WITH CHEMICAL SOLVENTS: PROCESS SETTINGS: (MEA SIMULATION) For simulation purpose the inlet condition and inlet composition were show in Table No. 1 and Table No.2. 1. Selected environment Peng-Robinson. 2. The gas is 100% saturated with water. 3. Provided a complete set of initial guess values (temperature, pressure, flow rate, composition) for the “Recycle Guess” stream leaving the recycle block. 4. The lean solvent is maintained at 15 wt% MEA and 340 m3/hr flow rate. The solvent make-up has taken at 250C and 1barg. 5. Assuming pump efficiency of 65% and increases the lean solvent pressure to 0.3 bar above that of the feed gas.
Kadoli et al
RJCES Vol 4 [4S] 2016 144 | P a g e © 2016 AELS, INDIA
6. The cooler has a pressure drop of 0.3 bar and decreases the lean solvent temperature to 50C above that of the feed gas. 7. For this simulation the absorber has 8 ideal stages, operated at 75% flooding, and has a pressure drop of 0.3 bar. All trays are sieve trays with 0.6m spacing and weir height of 7.5cm. 8. The pressure drop of lean/rich exchanger is 0.3 bar. 9. The rich solvent enters ideal stage 2 of the regenerator of the 990C. 10. The regenerator has 11 ideal stages and operates with a top stage pressure of 0.5 barg and pressure drop of 0.3bar. 11. The condenser operates at 500C. 12. The reboiler is driven by condensing 320kg/min of saturated steam at 3.5 barg.
Table No. 1:Inlet Condition (“Wet SourFeed”)
Temperature 400c Pressure 40barg Flow rate 28000Nm3/hr
Table No. 2:Inlet Composition (“Dry Sour Feed”,mol%)
Sr.No. Composition Mole%
1. H2S 5.0 2. CO2 5.0 3. C1 81.0 4. C2 4.0 5. C3 2.0 6. iC4 1.0 7. nC4 1.0 8. i-C5 0.5 9. n-C5 0.5
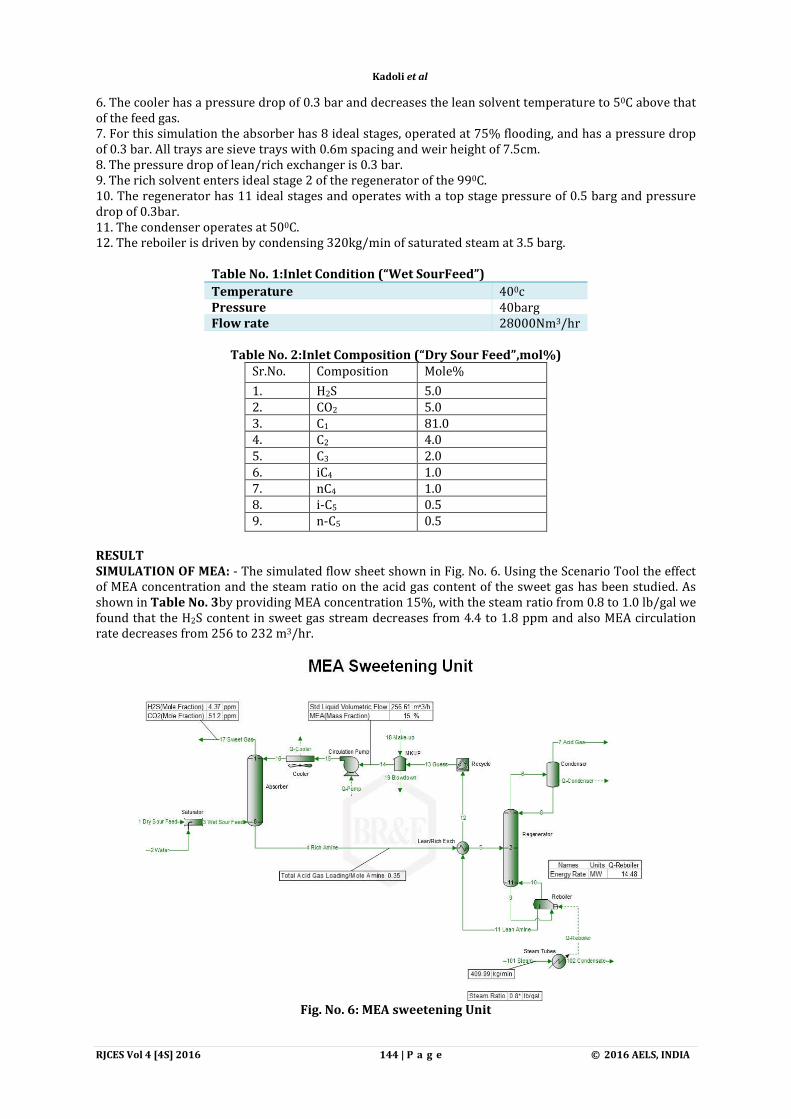
RESULT SIMULATION OF MEA: - The simulated flow sheet shown in Fig. No. 6. Using the Scenario Tool the effect of MEA concentration and the steam ratio on the acid gas content of the sweet gas has been studied. As shown in Table No. 3by providing MEA concentration 15%, with the steam ratio from 0.8 to 1.0 lb/gal we found that the H2S content in sweet gas stream decreases from 4.4 to 1.8 ppm and also MEA circulation rate decreases from 256 to 232 m3/hr.
Fig. No. 6: MEA sweetening Unit
Kadoli et al

RJCES Vol 4 [4S] 2016 145 | P a g e © 2016 AELS, INDIA
Table No. 3: Result of MEA sweetening Unit MEA Steam Ratio Sweet Gas (ppm) Circulation
Run # wt% lb/gal H2S CO2 m3/h 1 15 0.80 4.4 51.3 256 2 15 0.90 2.7 49.3 243 3 15 1.00 1.8 47.7 232 4 20 0.80 3.9 48.2 231 5 20 0.90 2.3 47.1 215 6 20 1.00 1.4 46.0 204
The simulation was also extended by providing MEA concentration 20% and steam ratio from 0.8 to 1.0 lb/gal which showed that H2S content decreases from 3.9 to 1.4 ppm as well as circulation rate decreases from 231 to 204 m3/hr. The Fig. No.7and Fig. No. 8 shows that as the steam ratio reduces the acid gas content of the sweet gas and reduces the amount of solvents required to maintain the rich loading at 0.35; whereas increasing the MEA concentration has the same effect. COMPARING CHEMICAL SOLVENTS: To compare the performance of MEA, DEA and MDEA for H2S and CO2 removal. The sweet gas specification is 4 ppm H2S, with no requirement on the CO2 content. PROCESS SETTINGS: 1. The process handles 28000Nm3/hr of the sour gas specified at below. This gas is 100% saturated with water. 2. Assume the process parameters e.g columns, heat exchangers, pumps etc. 3. The solvent flow rate has set by maintaining the rich loading at a specified maximum allowable value. 4. The reboiler steam rate has a direct function of the solvent flow rate (e.g. 1.0lb of steam per standard gallon of lean solvent [0.12kg/lit]).
Table 4. Inlet Condition (“Wet Sour Feed”)
Temperature 400c
Pressure 70barg
Flow rate 28000Nm3/hr
0.0
2.5
5.0
7.5
10.0
35
40
45
50
55
0.80 0.85 0.90 0.95 1.00
H2
S (p
pm
)CO
2 (
pp
m)
Reboiler Steam Ratio (lb/gal)Fig. No. :7
Sweet Gas Concentrations
15 wt% MEA
20 wt% MEA
200
220
240
260
0.80 0.85 0.90 0.95 1.00
Cir
cula
tio
n R
ate
(m
3/h
)
Reboiler Steam Ratio (lb/gal)Fig. No. : 8
15 wt% MEA20 wt% MEA
Kadoli et al

RJCES Vol 4 [4S] 2016 146 | P a g e © 2016 AELS, INDIA
Table 5. Inlet Composition (“Dry Sour Feed”,mol%)
Sr.No. Composition Mole%
1. H2S 5.0
2. CO2 10.0
3. C1 77.6
4. C2 4.0
5. C3 2.0
6. iC4 0.4
7. nC4 0.4
8. i-C5 0.3
9. n-C5 0.3
DISCUSSION The obtained results are summarized in Table No. 6 using metric unit specification for this feed given Table No. 4 and Table No. 5 three solvents are compared namely MEA, DEA and MDEA respectively. From this Table No.6 it observed that keeping 20wt% MEA and varying steam ratio from 0.07 to 0.1 H2S content in sweet gas drop from 19.44 to 1.51ppm with decrease in circulation rate from 534.32 to 310.4 m3/hr for maximum rich loading of 0.35.From the Fig. No.10 for 4ppm obtained simulated value was 0.086 and solvent flow rate was 358m3/hr. Whereas keeping 35wt% DEA and varying steam ratio from 0.090 to 0.120, H2S content in sweet gas drops from 40.69 to 1.26 ppm with decrease in circulation rate from 179.8 to 142.5m3/hr for maximum rich loading of 0.35.From the Fig. No. 10, for 4ppm obtained simulated value was 0.106 and solvent flow rate was 148.0m3/hr. Also for 50wt% MDEA and varying steam ratio from 0.110 to 0.140, H2S content in sweet gas drop from 210.06 to 1.46 ppm with decrease in circulation rate from 95.2 to 85.5m3/hr for maximum rich loading of 0.35.From Fig. No. 10, for 4ppm obtained simulated value was 0.125 and solvent flow rate was 85.7m3/hr. The result obtained in Fig. No. 11 indicates that as steam ratio increases the circulation rate decreases. For the above obtained simulated result it conclude that, MDEA is a best choice. Since it achieve 4ppm H2S specification with lowest solvent flow rate and the lowest reboiler duty.
Fig. No. 9: Amine Sweetening Unit
Kadoli et al

RJCES Vol 4 [4S] 2016 147 | P a g e © 2016 AELS, INDIA
Table No. 6: performance results of MEA, DEA and MDEA INPUTS OUTPUTS
Feed P
Amine wt% Steam Ratio
Rich Loading Solvent Flow
Sweet Gas Reboiler Duty
Amine Lost
Run #
barg MEA
DEA
MDEA
kg/L Max Actual m^3/h H2S (ppm)
CO2 (ppm)
MW kg/hr
1 70 20 0 0 0.070 0.350 0.3502 534.3 19.44 41.22 22.01 0.236
2 70 20 0 0 0.080 0.350 0.3503 400.7 7.31 31.36 18.87 0.263
3 70 20 0 0 0.090 0.350 0.3500 338.9 2.84 26.50 17.95 0.290
4 70 20 0 0 0.100 0.350 0.3499 310.4 1.51 24.15 18.27 0.276
5 70 0 35 0 0.090 0.400 0.4000 179.8 40.69 112.87 9.52 0.023
6 70 0 35 0 0.100 0.400 0.4001 159.1 13.66 81.91 9.36 0.000
7 70 0 35 0 0.110 0.400 0.4000 144.6 2.14 44.36 9.36 0.007
8 70 0 35 0 0.120 0.400 0.3999 142.5 1.26 36.84 10.07 0.000
9 70 0 0 50 0.110 0.500 0.4998 95.2 210.06 2800.55 6.16 0.110
10 70 0 0 50 0.120 0.500 0.4996 88.1 33.16 4069.76 6.22 0.147
11 70 0 0 50 0.130 0.500 0.5003 85.5 2.53 4885.56 6.54 0.138
12 70 0 0 50 0.140 0.500 0.4995 85.5 1.46 4906.64 7.04 0.138
13 70 20 0 0 0.086 0.350 0.3502 357.6 4.00 28.01 18.08 0.283
14 70 0 35 0 0.106 0.400 0.4000 148.0 3.98 55.62 9.24 0.007
15 70 0 0 50 0.125 0.500 0.5000 85.7 3.97 4814.30 6.31 0.137
Fig. No.10: H2S (sweet gas) ppm Versus Steam ratio
Fig.No.11: Solvent Flow versus Steam Ratio
0.001.002.003.004.005.006.007.008.009.00
10.00
0.000 0.020 0.040 0.060 0.080 0.100 0.120 0.140 0.160H2
S (s
we
et
Gas
) p
pm
Steam Ratio(kg/lit)
MEA DEA
MDEA
0.0
100.0
200.0
300.0
400.0
500.0
0.070 0.080 0.090 0.100 0.110 0.120 0.130 0.140
Solv
ent
Flo
w /
Cir
cula
tio
n R
ate
Steam Ratio
MEA DEA MDEA
Kadoli et al
RJCES Vol 4 [4S] 2016 148 | P a g e © 2016 AELS, INDIA
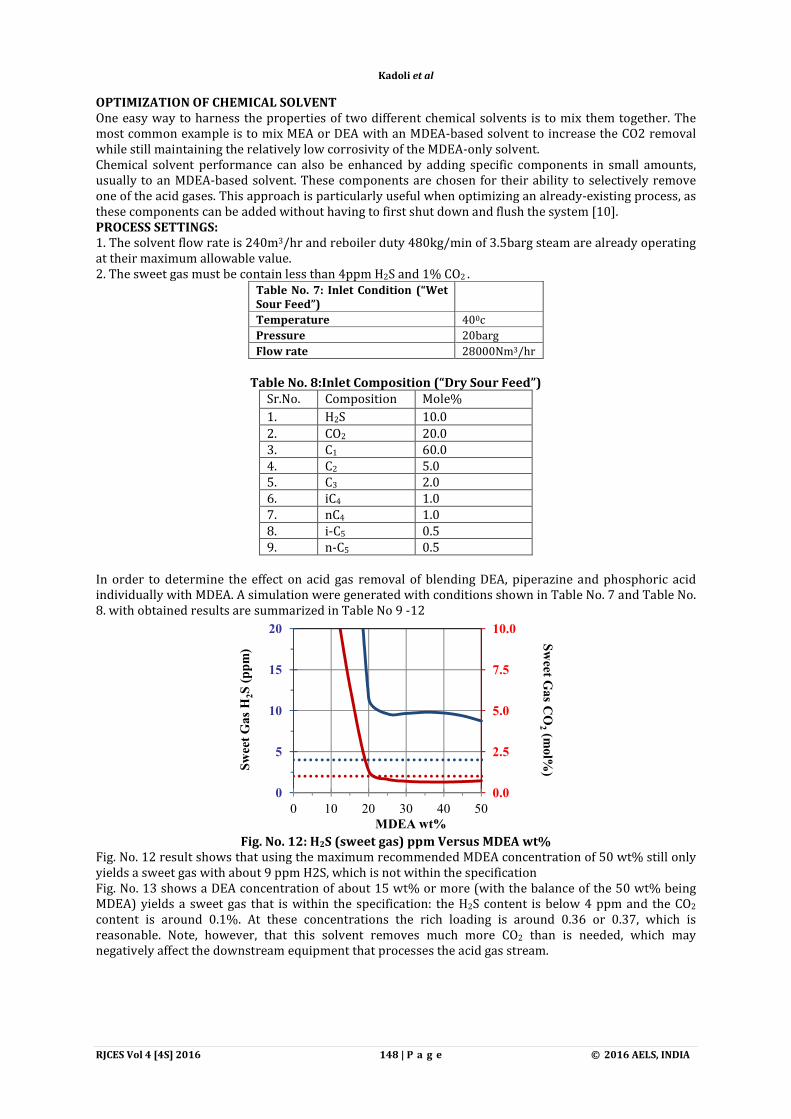
OPTIMIZATION OF CHEMICAL SOLVENT One easy way to harness the properties of two different chemical solvents is to mix them together. The most common example is to mix MEA or DEA with an MDEA-based solvent to increase the CO2 removal while still maintaining the relatively low corrosivity of the MDEA-only solvent. Chemical solvent performance can also be enhanced by adding specific components in small amounts, usually to an MDEA-based solvent. These components are chosen for their ability to selectively remove one of the acid gases. This approach is particularly useful when optimizing an already-existing process, as these components can be added without having to first shut down and flush the system [10]. PROCESS SETTINGS: 1. The solvent flow rate is 240m3/hr and reboiler duty 480kg/min of 3.5barg steam are already operating at their maximum allowable value. 2. The sweet gas must be contain less than 4ppm H2S and 1% CO2 .
Table No. 7: Inlet Condition (“Wet Sour Feed”)
Temperature 400c
Pressure 20barg
Flow rate 28000Nm3/hr
Table No. 8:Inlet Composition (“Dry Sour Feed”)
Sr.No. Composition Mole%
1. H2S 10.0
2. CO2 20.0 3. C1 60.0 4. C2 5.0 5. C3 2.0 6. iC4 1.0 7. nC4 1.0 8. i-C5 0.5 9. n-C5 0.5
In order to determine the effect on acid gas removal of blending DEA, piperazine and phosphoric acid individually with MDEA. A simulation were generated with conditions shown in Table No. 7 and Table No. 8. with obtained results are summarized in Table No 9 -12
Fig. No. 12: H2S (sweet gas) ppm Versus MDEA wt%
Fig. No. 12 result shows that using the maximum recommended MDEA concentration of 50 wt% still only yields a sweet gas with about 9 ppm H2S, which is not within the specification Fig. No. 13 shows a DEA concentration of about 15 wt% or more (with the balance of the 50 wt% being MDEA) yields a sweet gas that is within the specification: the H2S content is below 4 ppm and the CO2 content is around 0.1%. At these concentrations the rich loading is around 0.36 or 0.37, which is reasonable. Note, however, that this solvent removes much more CO2 than is needed, which may negatively affect the downstream equipment that processes the acid gas stream.
0.0
2.5
5.0
7.5
10.0
0
5
10
15
20
0 10 20 30 40 50
Sw
eet Ga
s CO
2(m
ol%)S
wee
t G
as H
2S (
pp
m)
MDEA wt%
Kadoli et al

RJCES Vol 4 [4S] 2016 149 | P a g e © 2016 AELS, INDIA
Fig. No.13: H2S (sweet gas)ppm Versus DEA wt%
Target Outlet Conc. Sweet Gas
MDEA DEA Piperazine H3PO4 H2S CO2 Rich Loading Lean Loading
Run wt% wt% wt% wt% Ppm mol% --- ---
1 50.00 0.00 0.00 0.00 8.74 0.72 0.361 0.003
2 45.00 0.00 0.00 0.00 9.37 0.67 0.403 0.003
3 40.00 0.00 0.00 0.00 9.72 0.65 0.455 0.004 4 35.00 0.00 0.00 0.00 9.80 0.65 0.521 0.004 5 30.00 0.00 0.00 0.00 9.67 0.69 0.609 0.005 6 25.00 0.00 0.00 0.00 9.62 0.82 0.729 0.005
7 20.00 0.00 0.00 0.00 11.56 1.34 0.900 0.005
8 15.00 0.00 0.00 0.00 59.94 6.50 1.039 0.006
9 10.00 0.00 0.00 0.00 10084.46 13.06 1.149 0.007
10 5.00 0.00 0.00 0.00 47066.78 16.25 1.411 0.006
Table No.9 Result for Only MDEA solvent
Table No. 10 Result of MDEA+DEA
Target Outlet Conc. Sweet Gas
MDEA DEA Piperazine H3PO4 H2S CO2 Rich Loading Lean Loading
Run wt% wt% wt% wt% Ppm mol% --- ---
1 50.00 0.00 0.00 0.00 8.74 0.72 0.361 0.003
2 45.00 5.00 0.00 0.00 8.12 0.01 0.363 0.005
3 40.00 10.00 0.00 0.00 5.65 0.01 0.359 0.003
4 39.00 11.00 0.00 0.00 5.24 0.01 0.358 0.003 5 38.00 12.00 0.00 0.00 4.86 0.01 0.358 0.002 6 37.00 13.00 0.00 0.00 4.51 0.01 0.357 0.002 7 36.00 14.00 0.00 0.00 4.19 0.01 0.357 0.002
8 35.00 15.00 0.00 0.00 3.89 0.01 0.356 0.002 9 34.00 16.00 0.00 0.00 3.61 0.01 0.356 0.002
10 33.00 17.00 0.00 0.00 3.36 0.01 0.355 0.001 11 32.00 18.00 0.00 0.00 3.12 0.01 0.355 0.001 12 31.00 19.00 0.00 0.00 2.90 0.01 0.355 0.001 13 30.00 20.00 0.00 0.00 2.71 0.01 0.354 0.001
Table No.11 Result of MDEA+ Piperazine
Target Outlet Conc. Sweet Gas
MDEA DEA Piperazine H3PO4 H2S CO2 Rich Loading Lean Loading
Run wt% wt% wt% wt% Ppm mol% --- ---
1 50.00 0.00 0.00 0.00 8.74 0.72 0.361 0.003 2 49.75 0.00 0.25 0.00 6.28 0.21 0.366 0.003 3 49.50 0.00 0.50 0.00 4.60 0.06 0.367 0.003
0.0
2.5
5.0
7.5
10.0
0
5
10
15
20
0 5 10 15 20
Sw
eet Gas C
O2 (m
ol%)S
wee
t G
as H
2S
(p
pm
)
DEA wt%
Kadoli et al

RJCES Vol 4 [4S] 2016 150 | P a g e © 2016 AELS, INDIA
4 49.25 0.00 0.75 0.00 4.22 0.03 0.368 0.003
5 49.00 0.00 1.00 0.00 4.12 0.02 0.368 0.003 6 48.75 0.00 1.25 0.00 4.70 0.01 0.368 0.003 7 48.50 0.00 1.50 0.00 6.32 0.01 0.368 0.005 8 48.25 0.00 1.75 0.00 8.01 0.00 0.368 0.006 9 48.00 0.00 2.00 0.00 9.19 0.00 0.369 0.007
Table No. 12 Result of MDEA+ Phosphoric Acid
Target Outlet Conc. Sweet Gas
MDEA DEA Piperazine H3PO4 H2S CO2 Rich Loading Lean Loading
Run wt% wt% wt% wt% Ppm mol% --- --- 1 50.00 0.00 0.00 0.00 8.74 0.72 0.361 0.003 2 50.00 0.00 0.00 0.50 3.18 0.57 0.358 0.000 3 47.00 0.00 0.00 0.50 3.56 0.54 0.382 0.001 4 44.00 0.00 0.00 0.50 3.82 0.53 0.409 0.001 5 41.00 0.00 0.00 0.50 3.95 0.52 0.440 0.001 6 38.00 0.00 0.00 0.50 3.94 0.52 0.475 0.001 7 35.00 0.00 0.00 0.50 3.79 0.53 0.516 0.001 8 32.00 0.00 0.00 0.50 3.49 0.55 0.565 0.001 9 29.00 0.00 0.00 0.50 3.08 0.60 0.623 0.001
10 26.00 0.00 0.00 0.50 2.58 0.68 0.694 0.001 11 23.00 0.00 0.00 0.50 2.08 0.88 0.782 0.001 12 20.00 0.00 0.00 0.50 1.73 1.59 0.884 0.000
Fig. No. 14 shows effect of 49/1 wt% mixture of MDEA and piperazine yields a sweet gas that is very close to the 4 ppm H2S specification and well below the 1% CO2 specification (~0.02%). However, even slight variations away from 1% piperazine quickly move the sweet gas outside of the H2S specification. Given that maintaining an exact solvent concentration is nearly impossible in practice—even though it is straightforward in steady-state simulation—a piperazine/MDEA blend would not be a good choice for this case.
Fig. No. 14: H2S (sweet gas)ppm Versus Piperazine wt%
Fig. No. 15 shows effect of A mixture of 20-50 wt% MDEA and 0.5 wt% Phosphoric acid yields a sweet gas with less than 4.0 ppm H2S and 0.7% Carbon dioxide whereas rich loading is below 0.5 which is reasonable. The blending with Phosphoric acid would likely be the most desirable choice for this application. This can be safely operated over wide range of concentration.
0.0
2.5
5.0
7.5
10.0
0
5
10
15
20
0.00 0.50 1.00 1.50 2.00
Sw
eet Gas C
O2 (m
ol%
)Sw
eet
Gas
H2
S (
pp
m)
Piperazine wt%
Kadoli et al

RJCES Vol 4 [4S] 2016 151 | P a g e © 2016 AELS, INDIA
Fig. No.15: H2S (sweet gas) ppm Versus Piperazine
CONCLUSION Selection of an amine for gas sweetening is complex and must be based on several process considerations. These factors are analyze based process simulation program for gas sweetening called TSWEET. Providing MEA concentration from 15-20 wt% with the steam ratio from 0.8 to 1.0 lb/gal we found that the H2S content in sweet gas stream as well as MEA circulation rate decreases. Processing with MDEA it is possible to reduce circulation rate as a result process cost decreases. TSWEET used to examine the performance of other amines. This analysis demonstrated that the proper selection of the amine can have a major impact on the performance and cost of a gas sweetening unit. REFERENCES 1. Polasek, J. C. and J. A. Bullin, "Selective Absorption Using Amines," Proceedings of 61st Annual Gas Processors
Convention (1994). 2. Astarita, G., D. W. Savage, and A. Bisio, Gas Treating with Chemical Solvents, J. Wiley and Sons(1983). 3. Beck, J. E., "Diethanolamine an Energy Conserver," Gas Conditioning Conference, Norman Oklahoma(1975). 4. Butwell, K. F. and C. R. Perry, "Performance of Gas Purification Systems Utilizing DEA Solutions," Gas
Conditioning Conference(1975). 5. Polasek, J.; Iglesias-Silva, G.A.; Bullin, J.A. Using Mixed Amine Solutions for Gas Sweetening. Proceedings of the
71st GPA Annual Convention. Tulsa, OK: Gas Processors Association,1992: 58-63. 6. Polasek, J.; Bullin, J.A. Influence of Ammonia on Gas Sweetening Units Using Amine Solutions. AIChE, March 1993. 7. Cornelissen, A. E., "Simulation of Absorption of H2S and CO2 into Aqueous Alkanolamines," Shell Laboratory, p.
3.1-3.15 (1982). 8. Daviet, G. R., S. T. Donnelly and J. A. Bullin, "Dome’s North Caroline Plant Successfully Converted to MDEA,"
Proceedings of 63rd Annual Gas Processors Association Convention, p. 69(1984). 9. Polasek, J. C., J. A. Bullin and G. A. Iglesias-Silva," Using Mixed Amine Solutions for Gas Sweetening", Presented at
the 71st Annual Gas Processors Association Convention(1992). 10. Lyddon, L.; Nguyen, H. Analysis of Various Flow Schemes for Sweetening with Amines. Proceedings of the 78th
GPA Annual Convention. Nashville, TN: Gas Processors Association,1999: 177-184
CITE THIS ARTICLE S. V. Kadoli, S. V. Anekar, P. J. Patil. Simulation and Optimization of Sour Gas Processing. Res. J. Chem. Env. Sci. Vol 4 [4S] 2016.140-151
0.0
2.5
5.0
7.5
10.0
0
5
10
15
20
20 25 30 35 40 45 50
Sw
eet Gas C
O2 (m
ol%
)Sw
eet
Gas
H2
S (
pp
m)
MDEA wt% +Phosphoric Acid
Kadoli et al