Simulating the Shallow Groundwater Level Response ... - MDPI
17
sustainability Article Simulating the Shallow Groundwater Level Response to Artificial Recharge and Storage in the Plain Area of the Daqing River Basin, China Guangyao Chi 1,2 , Xiaosi Su 1,2 , Hang Lyu 3, *, Guigui Xu 1,2 , Yiwu Zhang 4 and Ningfei Li 1,2 Citation: Chi, G.; Su, X.; Lyu, H.; Xu, G.; Zhang, Y.; Li, N. Simulating the Shallow Groundwater Level Response to Artificial Recharge and Storage in the Plain Area of the Daqing River Basin, China. Sustainability 2021, 13, 5626. https:// doi.org/10.3390/su13105626 Academic Editors: Yunqing Xuan, Zhiyong Liu and Hongyan Li Received: 12 April 2021 Accepted: 7 May 2021 Published: 18 May 2021 Publisher’s Note: MDPI stays neutral with regard to jurisdictional claims in published maps and institutional affil- iations. Copyright: © 2021 by the authors. Licensee MDPI, Basel, Switzerland. This article is an open access article distributed under the terms and conditions of the Creative Commons Attribution (CC BY) license (https:// creativecommons.org/licenses/by/ 4.0/). 1 College of Construction Engineering, Jilin University, Changchun 130026, China; [email protected] (G.C.); [email protected] (X.S.); [email protected] (G.X.); [email protected] (N.L.) 2 Institute of Water Resources and Environment, Jilin University, Changchun 130021, China 3 College of New Energy and Environment, Jilin University, Changchun 130012, China 4 Nanjing Center of China Geological Survey, Nanjing 210016, China; [email protected] * Correspondence: [email protected] Abstract: Water shortage and overexploitation of groundwater (GW) have become the key factors restricting the development of the Xiongan New Area (XNA), the environmental management of Baiyangdian Lake, and the social and economic development of surrounding areas. This study used a numerical GW flow model to quantitatively analyze the changes to the shallow GW level and GW reserves of the plain area of the Daqing River Basin over the next 15 years (2021–2035) under different artificial recharge schemes with the south to north water diversion project (SNWDP) acting as the GW recharge source. The results showed increasing GW storage and GW levels and that the regional GW resources are in a positive equilibrium state. The rates of change of the well irrigation supply scheme and the joint river-well irrigation supply scheme in the XNA will increase by 14.56% and 11.04% by 2035 as compared with the current situation. The well irrigation recharge scheme for the XNA was determined to be the most effective when comparing with the effects of the different artificial recharge schemes on the GW levels and recharge. This study provides a reference for the management and protection of aquifers in other areas suffering serious GW overexploitation. Keywords: groundwater flow; water diversion; numerical modeling; artificial recharge of groundwa- ter; Xiongan New Area 1. Introduction Groundwater (GW) is an essential source of water for the environment, domestic water supply, agriculture, and industry due to its generally good quality and widespread occurrence [1]. While GW has supported rapid socioeconomic development in China and globally, overexploitation of groundwater has caused many environmental and geological problems. The negative environmental impacts of GW depletion from overexploitation are well known, and include deteriorating GW quality, ecosystem degradation, and in some cases, land subsidence and/or seawater intrusion [2–5]. The excessive depletion of GW over the last 50 years has become a global problem affecting major regions of North Africa, the Middle East, South and Central Asia, North China, North America, and Australia [6–8]. The North China Plain (NCP) is recognized to be one of the areas experiencing serious GW depletion [9,10]. The Chinese government established the Xiongan New Area (XNA) on the 1st April, 2017. The establishment of the XNA is of great practical and far-reaching historical significance [11]. However, achieving sustainable development in the XNA is currently being hindered by water deficits, severe water pollution, and overexploitation of GW. Although the GW system has a certain natural regulation ability, this has been in- creasingly degraded under the strong influence of human activities. Therefore, artificial GW storage has become an important measure implemented to prevent the continuous Sustainability 2021, 13, 5626. https://doi.org/10.3390/su13105626 https://www.mdpi.com/journal/sustainability
-
Upload
khangminh22 -
Category
Documents
-
view
0 -
download
0
Transcript of Simulating the Shallow Groundwater Level Response ... - MDPI

sustainability
Article
Simulating the Shallow Groundwater Level Response toArtificial Recharge and Storage in the Plain Area of the DaqingRiver Basin, China
Guangyao Chi 1,2, Xiaosi Su 1,2 , Hang Lyu 3,*, Guigui Xu 1,2, Yiwu Zhang 4 and Ningfei Li 1,2
�����������������
Citation: Chi, G.; Su, X.; Lyu, H.; Xu,
G.; Zhang, Y.; Li, N. Simulating the
Shallow Groundwater Level
Response to Artificial Recharge and
Storage in the Plain Area of the
Daqing River Basin, China.
Sustainability 2021, 13, 5626. https://
doi.org/10.3390/su13105626
Academic Editors: Yunqing Xuan,
Zhiyong Liu and Hongyan Li
Received: 12 April 2021
Accepted: 7 May 2021
Published: 18 May 2021
Publisher’s Note: MDPI stays neutral
with regard to jurisdictional claims in
published maps and institutional affil-
iations.
Copyright: © 2021 by the authors.
Licensee MDPI, Basel, Switzerland.
This article is an open access article
distributed under the terms and
conditions of the Creative Commons
Attribution (CC BY) license (https://
creativecommons.org/licenses/by/
4.0/).
1 College of Construction Engineering, Jilin University, Changchun 130026, China;[email protected] (G.C.); [email protected] (X.S.); [email protected] (G.X.); [email protected] (N.L.)
2 Institute of Water Resources and Environment, Jilin University, Changchun 130021, China3 College of New Energy and Environment, Jilin University, Changchun 130012, China4 Nanjing Center of China Geological Survey, Nanjing 210016, China; [email protected]* Correspondence: [email protected]
Abstract: Water shortage and overexploitation of groundwater (GW) have become the key factorsrestricting the development of the Xiongan New Area (XNA), the environmental management ofBaiyangdian Lake, and the social and economic development of surrounding areas. This study useda numerical GW flow model to quantitatively analyze the changes to the shallow GW level andGW reserves of the plain area of the Daqing River Basin over the next 15 years (2021–2035) underdifferent artificial recharge schemes with the south to north water diversion project (SNWDP) actingas the GW recharge source. The results showed increasing GW storage and GW levels and that theregional GW resources are in a positive equilibrium state. The rates of change of the well irrigationsupply scheme and the joint river-well irrigation supply scheme in the XNA will increase by 14.56%and 11.04% by 2035 as compared with the current situation. The well irrigation recharge scheme forthe XNA was determined to be the most effective when comparing with the effects of the differentartificial recharge schemes on the GW levels and recharge. This study provides a reference for themanagement and protection of aquifers in other areas suffering serious GW overexploitation.
Keywords: groundwater flow; water diversion; numerical modeling; artificial recharge of groundwa-ter; Xiongan New Area
1. Introduction
Groundwater (GW) is an essential source of water for the environment, domesticwater supply, agriculture, and industry due to its generally good quality and widespreadoccurrence [1]. While GW has supported rapid socioeconomic development in China andglobally, overexploitation of groundwater has caused many environmental and geologicalproblems. The negative environmental impacts of GW depletion from overexploitation arewell known, and include deteriorating GW quality, ecosystem degradation, and in somecases, land subsidence and/or seawater intrusion [2–5]. The excessive depletion of GWover the last 50 years has become a global problem affecting major regions of North Africa,the Middle East, South and Central Asia, North China, North America, and Australia [6–8].
The North China Plain (NCP) is recognized to be one of the areas experiencing seriousGW depletion [9,10]. The Chinese government established the Xiongan New Area (XNA)on the 1st April, 2017. The establishment of the XNA is of great practical and far-reachinghistorical significance [11]. However, achieving sustainable development in the XNA iscurrently being hindered by water deficits, severe water pollution, and overexploitationof GW.
Although the GW system has a certain natural regulation ability, this has been in-creasingly degraded under the strong influence of human activities. Therefore, artificialGW storage has become an important measure implemented to prevent the continuous
Sustainability 2021, 13, 5626. https://doi.org/10.3390/su13105626 https://www.mdpi.com/journal/sustainability

Sustainability 2021, 13, 5626 2 of 17
shortage in GW resources and to maintain the vitality of the GW system. Artificial rechargecan be defined as the artificial regulation and storage of water resources in space and timeto ensure their full and reasonable utilization. An important prerequisite for artificial GWreplenishment is the availability of a rechargeable source of abundant and good waterquality. Water for GW replenishment in the plain area of the Daqing River Basin mainlyincludes regulated water from the middle route of the south to north water diversionproject (SNWDP), reservoir-regulated water, and rainfall runoff. The middle route of theSNWDP has provided ecological water replenishment to Hebei Province through the Fu,Bao, Beiyishui, Nanjuma, Hutuo, and other rivers since September, 2018. To date, the totalvolume of replenished water has exceeded 1.2 billion m3 [12]. The Wangkuai, Xidayang,Angozhuang, and Longmen reservoirs have been built in the plain area of the DaqingRiver Basin since the 1950s. In recent years, each reservoir has continuously replenishedwater through each river to the plain area of the Daqing River Basin to meet ecologicalrequirements. Approximately 420 million m3 of regulated water from each reservoir entersthe plain area of the Daqing River Basin every year [12]. Therefore, the study area ischaracterized by conditions conducive to artificial GW recharge. The Chinese governmenthas issued a series of policies to reduce GW exploitation and increase recharge to solvethe problem of continuous GW overexploitation. These developments are likely to lead tocomplex changes in the GW level in this area.
The numerical simulation of GW is the main technical method used to study theresponse of GW processes system to GW regulation and storage measures. GW flow modelscan assist in the formulation of GW regulation and storage management policies [13].Numerical GW models are clearly appropriate for the assessment of sustainable GW usegiven the complexity and heterogeneity of aquifer systems and the ability of numericalmodeling to integrate different data and to evaluate regional GW dynamics [14–16]. Severalnumerical models have been constructed to evaluate the GW resources and flow dynamicsin the NCP. Zhang et al. [17] simulated and analyzed the initial state of GW exploitation inplain area of the Haihe River Basin, with their simulation results providing a basis for waterresource management and restoration of the water environment. Wang et al. [18] evaluatedthe GW depletion in the NCP from January 2002 to December 2003 with their resultsestimating a total inflow and outflow of 49.4 km3 and 56.5 km3, respectively, for a budgetdeficit of 7.1 km3. Cui et al. [19] used GW modeling to evaluate the effects of reductionsin GW extraction over a ten-year period in response to the additional water providedby the SNWDP. Their study concluded that the SNWDP plays an important role in therecovery of GW in the NCP. Xue et al. [20] use numerical simulation to comprehensivelyanalyze the change in the GW system and the impact of long-term GW exploitation of theshallow aquifer in the plain area of the Haihe River Basin. Liu et al. [21] simulated GWflow dynamics from 1960 to 2004 to evaluate the effects of urbanization of rural areas inthe vicinity of Shijiazhuang City and the SNWDP. Hu et al. [22] integrated a crop-growthmodel and a GW model to evaluate the effects of a reduction in irrigation in Shijiazhuang,with the results of their study showing that a reduction in irrigation of 140 mm/yr couldreverse GW depletion in this area.
The implementation of policies mandating GW artificial recharge and GW compres-sion mining will result in changes to the GW-dependent water supply of the NCP. Thesechanges will relieve water deficits to some extent, thereby allowing an opportunity for therecovery of the GW system. The present study established a GW flow numerical model toevaluate the recovery of the GW level and the change in GW reserves. Artificial rechargeof GW can directly and effectively increase GW resources, regulate and store surface water,prevent or control the decline in GW levels, control the formation and further expansionof depression cones, and prevent or control land subsidence and other environmentalgeological problems. It is hoped that the results of the present study can guide a suitableGW recharge and storage scheme to alleviate the environmental risk resulting from thecontinuous decline of the GW level.

Sustainability 2021, 13, 5626 3 of 17
2. Hydrogeological Settings
The plain area of the Daqing River Basin is in the piedmont plain of the TaihangMountains and covers an area of 13,338 km2 (Figure 1). The elevation increases slightly fromnorthwest to southeast, the terrain is flat, and the surface slope is 1–4‰. The Daqinghe RiverBasin falls within a temperate semihumid and semiarid continental monsoon climate zonewith four distinct seasons. The annual average temperature of the region is 12.3 ◦C (2015–2018a) [12]. Precipitation in the plain area shows both intra- and interannual heterogeneityand a regional distribution with an annual average of 526 mm (2015–2018a) [12]. Annualaverage evaporation in the plain area is 1309.7 mm (2015–2018a) [12].
Figure 1. Location and model boundaries of the plain area of the Daqing River Basin, China.
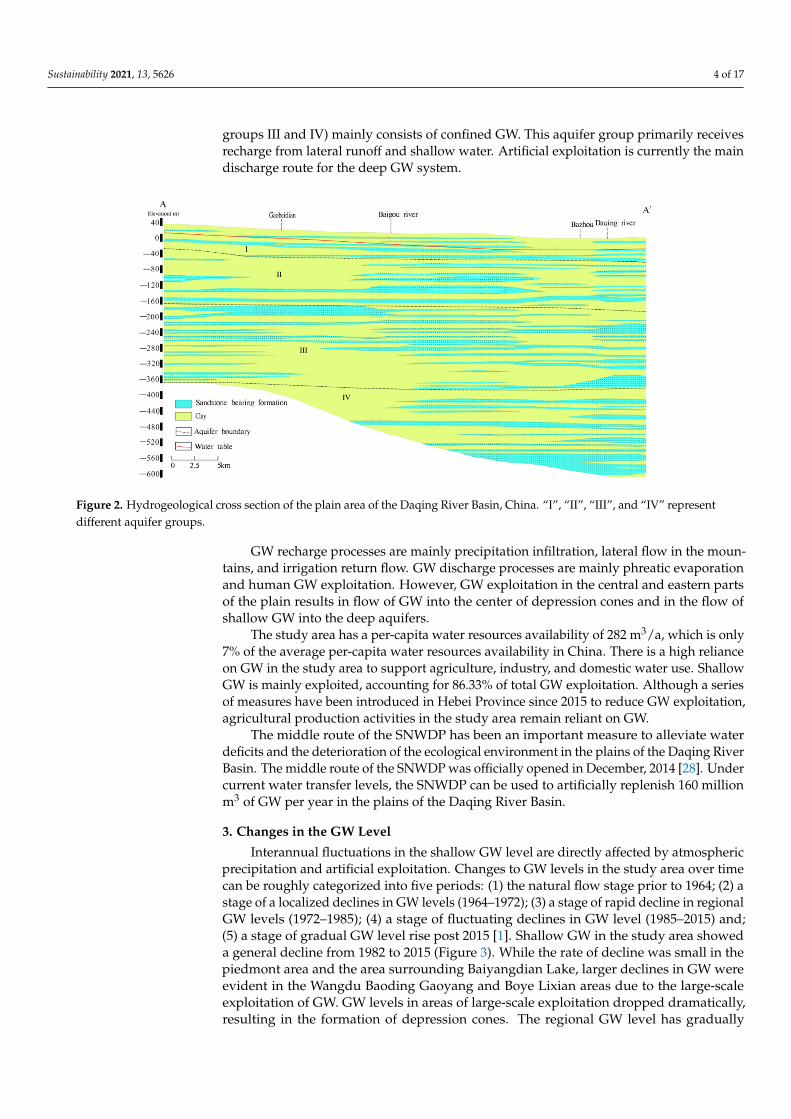
The stratigraphy of the study area consists mainly of unconsolidated quaternarysediments. These sediments contain most of the GW [23]. Previous studies [24–26] haveshown that the aquifer structure varies from a single aquifer composed of gravels andpebbles in the upper parts of the piedmont fan in the west to multiple aquifers composedof sand, silt, and clay in the east. The GW system can be divided into four aquifer groupsbased on this stratigraphy (I–IV). Aquifer groups I and II represent shallow aquifers,whereas groups III and IV represent deep aquifers [27] (Figure 2). Aquifer groups I (10–50 m depth) and II (≤210 m) represent unconfined and semiconfined aquifers, respectively,and are exploited for irrigation and ecosystem services. Aquifer groups III (≤310 m) andIV (>400 m) represent confined aquifers. The shallow GW system is characterized by afaster water cycle as compared to the deep GW system, and mainly includes the aquifergroups I and II. GW exploitation in the study area is mainly of the shallow GW system.Overexploitation of the shallow GW system has resulted in water shortages, GW fall cones,and a series of environmental and geological problems. Artificial GW recharge is urgentlyrequired to assist in the recovery of this aquifer. Therefore, the present study concentratedon the shallow aquifer system under aquifer groups I and II. The deep GW system (aquifer
Sustainability 2021, 13, 5626 4 of 17
groups III and IV) mainly consists of confined GW. This aquifer group primarily receivesrecharge from lateral runoff and shallow water. Artificial exploitation is currently the maindischarge route for the deep GW system.
Figure 2. Hydrogeological cross section of the plain area of the Daqing River Basin, China. “I”, “II”, “III”, and “IV” representdifferent aquifer groups.
GW recharge processes are mainly precipitation infiltration, lateral flow in the moun-tains, and irrigation return flow. GW discharge processes are mainly phreatic evaporationand human GW exploitation. However, GW exploitation in the central and eastern partsof the plain results in flow of GW into the center of depression cones and in the flow ofshallow GW into the deep aquifers.
The study area has a per-capita water resources availability of 282 m3/a, which is only7% of the average per-capita water resources availability in China. There is a high relianceon GW in the study area to support agriculture, industry, and domestic water use. ShallowGW is mainly exploited, accounting for 86.33% of total GW exploitation. Although a seriesof measures have been introduced in Hebei Province since 2015 to reduce GW exploitation,agricultural production activities in the study area remain reliant on GW.
The middle route of the SNWDP has been an important measure to alleviate waterdeficits and the deterioration of the ecological environment in the plains of the Daqing RiverBasin. The middle route of the SNWDP was officially opened in December, 2014 [28]. Undercurrent water transfer levels, the SNWDP can be used to artificially replenish 160 millionm3 of GW per year in the plains of the Daqing River Basin.
3. Changes in the GW Level
Interannual fluctuations in the shallow GW level are directly affected by atmosphericprecipitation and artificial exploitation. Changes to GW levels in the study area over timecan be roughly categorized into five periods: (1) the natural flow stage prior to 1964; (2) astage of a localized declines in GW levels (1964–1972); (3) a stage of rapid decline in regionalGW levels (1972–1985); (4) a stage of fluctuating declines in GW level (1985–2015) and;(5) a stage of gradual GW level rise post 2015 [1]. Shallow GW in the study area showeda general decline from 1982 to 2015 (Figure 3). While the rate of decline was small in thepiedmont area and the area surrounding Baiyangdian Lake, larger declines in GW wereevident in the Wangdu Baoding Gaoyang and Boye Lixian areas due to the large-scaleexploitation of GW. GW levels in areas of large-scale exploitation dropped dramatically,resulting in the formation of depression cones. The regional GW level has gradually

Sustainability 2021, 13, 5626 5 of 17
increased since 2015 due to the implementation of a policy restricting GW exploitation andpromoting artificial recharge (Figure 4).
Figure 3. Variations in groundwater level in the plain area of the Daqing River Basin, China from1982 to 2015.
Figure 4. Variations in the groundwater level in the plain area of the Daqing River Basin, China from2015 to 2020.
4. GW Flow Model4.1. Conceptual Model
Figure 1 shows a map of the plain area of the Daqing River Basin. A model wasconstructed to represent the complex multilayer aquifer system, including two aquifergroups and one aquitard. Aquifer groups I and II were combined into one aquifer group
Sustainability 2021, 13, 5626 6 of 17
representing the shallow aquifer system due to the presence of several incomplete aquitards.These incomplete aquitards showed enhanced hydraulic connections due to the presenceof many pumping wells. Aquifer group III was taken to represent the deep aquifer sys-tem. Aquitards were located between the aquifer groups. These aquifers were eithercharacterized by strong horizontal flow due to their wide distribution and thickness orslight flow in the vertical direction. The recharge and discharge of this area changes overtime along with the GW level, showing features of transient flow. At the same time, GWparameters show spatial variation, representing heterogeneous flow. As a result, the GWsystem of the Daqing River Basin could be described using a conceptual hydrologic modelcomprising three tiers and a heterogeneous, three-dimensional transient flow system withhorizontal isotropy.
The mountains form the western boundary of the plain study area and also act toprovide lateral GW recharge; therefore, the mountains are treated as a flow boundary inthe model. The study area falls within the Daqing River Basin, with the eastern part of thestudy area bounded by the Daqing and Zhongting rivers and the northeast by the MangniuRiver. The southern, northern, and eastern parts of the model were based on the surfacewatershed obtained from hydrological analysis conducted in the ArcGIS software. Sincethere are two possibilities for inflow and outflow of GW at the boundary, these boundarieswere treated as general head boundaries in the model. The GW table was regarded asthe top boundary in the model within which exchange between the GW and the othersystems occurred through infiltration of precipitation and evaporation of phreatic water.The bottom of the system was regarded as impermeable due to the presence of loam andclay beneath the quaternary strata.
Since infiltration of precipitation is the dominant source of GW recharge in the studyarea, GW recharge is affected by the amount of precipitation and the infiltration coefficient.Within the model, the monthly precipitation was evenly distributed across the studyarea, whereas the infiltration coefficient differed spatially according to six zones, withthe coefficient ranging from 0.12 to 0.3 [29]. Although lateral flow from the west is asignificant source of recharge in the study area, it is poorly quantified [30]. The rechargerates originating from lateral flow used in the model were based on previous studies inwhich they were estimated by the profile method [31] and hydrological analysis [32,33].GW is the primary source of water for irrigation in the study area, accounting for 90% ofthe total irrigation water [33,34]. The infiltration coefficient of irrigation used in the modelwas less than that of precipitation considering land use since evaporation is higher duringthe irrigation season. The irrigation infiltration used in the present study was distributedin 42 zones based on the monthly irrigation and infiltration coefficients. Groundwaterrecharge through surface water infiltration decreased after the 1960s in the study area, andby the 1980s, the rivers had nearly dried up [20,35]. Before the establishment of the XNA,river GW recharge in the basin mainly occurred through infiltration recharge from theNanjuma River. Ephemeral streams only influence GW recharge rates in the study areaduring the flood season. The recharge from ephemeral streams during the flood seasonwas incorporated into total recharge in the model. Most of the rivers in the study area havedried up or have become ephemeral streams during the flood season due to decreasingprecipitation and upstream reservoirs retaining runoff [35]. Under the current situation,seepage from Baiyangdian Lake recharges the surrounding GW, and the average lake levelin 2017 used in the model was 6.5 m.
The current study generated the evapotranspiration rate by Thiessen polygons usingdaily potential evaporation data measured by four meteorological stations. These datawere provided by the China Meteorological Data Sharing Service system and were basedon the phreatic evaporation coefficient, which is decided by the characteristics of the vadosezone. The extinction depth of the entire modelled study area was set to 4 m [35]. Artificialdischarge from the aquifers in the study area occurs through well pumping [35,36]. Datafor GW exploitation were obtained from the hydrological bureau of each municipality in

Sustainability 2021, 13, 5626 7 of 17
the study area and previous field research [35–39]. Although detailed information on thelocations and depths of the wells was not available, the layers of exploitation were known.
4.2. Numerical Model
The GW flow model was developed using MODFLOW [40]. MODFLOW includes aset of stress packages that allows the simulation of external flow stresses, such as wells,areal recharge, evapotranspiration, drains, and rivers [41,42].
The simulation was divided horizontally into 100 rows and 100 columns with a cellsize of 1.5 km × 1.5 km. The model was divided into three vertical layers based onthe hydrogeological conditions and data on the porous aquifers at the study site. Layer1 included the aquifer groups I and II, layer 3 represented aquifer group III, and layer2 represented the aquitards. The simulation period extended from December 2016 toDecember 2017 due to data limitations. Each calendar month represented a stress periodwith constant source and sink terms. Contour maps for December 2016 were used as theinitial head.
All sources and sinks were input using MODFLOW packages such as well (WEL),recharge (RCH), and evapotranspiration (EVT). Hydrogeological parameters such as thehydraulic conductivity, specific yield, and storage coefficient were imported by subarea [43].
4.3. Model Calibration
The model calibration period extended from December 2016 to June 2017, whereasmodel validation extended from July 2017 to December 2017. The calibration processwas divided into two parts: (1) fitting of the observed and simulated GW flow fields and(2) comparison between the observed and simulated hydrographs at typical observationwells [31]. The simulated flow fields were similar to the observed water level contours in2017 for the shallow and deep aquifers (layers 1 and 3; Figure 1). A total of 45 observationwells were selected for comparison of the GW hydrographs. Figure 5 shows the goodness-of-fit between simulated and observed water levels at all monitoring wells. Figure 6 showsa comparison between the simulated and observed water levels for five observation. Theseresults showed that the model simulations provided a good representation of the actualGW flow field and the features of the GW regime.
Figure 5. Fitting of simulated and observed groundwater flow fields in the plain area of the DaqingRiver Basin, China in 2017. (a) Shallow aquifer; (b) deep aquifer.

Sustainability 2021, 13, 5626 8 of 17
Figure 6. Observed vs. simulated hydrographs at typical observation wells in the plain area of theDaqing River Basin, China. LSC, CC, GYP, GJZ, GL, and XZ are the names of observation wells.
The model parameters, including hydraulic conductivity and storage parameters,were manually adjusted during the calibration. The variations in the parameters wereconsistent with the actual hydrogeological conditions in the model parameter zones, withhydraulic conductivities of 3–80 m/d for the shallow aquifers and 0.5–15 m/d for the deepaquifers (Figure 7; Table 1).
Table 1. Summary of model parameters of aquifers in the model representing the plain area of theDaqing River Basin, China.
ModelLayer
Parameters
HydraulicConductivity
(m/d)
StorageParameters
InfiltrationCoefficient ofPrecipitation
InfiltrationCoefficient
of Irrigation
ExtinctionDepth (m)
1 3–80 0.02–0.15 0.18–0.25 0.115 43 0.5–15 10−4–10−6 - - -
Note: Specific yield (Sy) for layer 1; specific storage (Ss) for layers 3; layers 2 represents an aquitard

Sustainability 2021, 13, 5626 9 of 17
Figure 7. Division of hydrogeological parameters in the plain area of the Daqing River Basin,China. (a) Shallow aquifer and (b) deep aquifer, the numbers represent different hydrogeologicalparameter zones.
An equilibrium analysis of the transient GW flow model was used to compute the GWequilibrium in the Daqing River Basin from December 2016 to December 2017. The rechargevalue for the entire GW system was 1.858 billion m3 and the recharge–discharge shortfallwas 1.008 billion m3. These results suggest that the GW discharge exceeded recharge forseveral years, resulting in the continuous reduction in GW storage.
5. Artificial Recharge Scenarios and the Response of the GW Level
The calibrated and verified model was used to investigate scenarios to predict andevaluate GW levels for the next 15 years (2021–2035). The present study only analyzed theshallow GW levels as this GW layer was the focus of the current study. The study areawas in a significantly negative equilibrium state under the current conditions, which couldbe attributed to the local overexploitation of GW, resulting in the formation of severalGW depression cones. The regional GW main recharge and discharge processes wereprecipitation recharge and artificial exploitation, accounting for 70% and 90% of totalrecharge and discharge, respectively. This result indicated the need to conduct artificialGW recharge through the use of river channels and recharge wells in the study area whilealso regulating GW exploitation. Under this approach, water consumed by exploitationcan be counterbalanced by recharge to the aquifer. Four scenarios were developed basedon these assumptions.
6. Scenarios6.1. Scenario 1: River Recharge across the Entire Study Area
The action plan for comprehensive treatment of GW overexploitation in North Chinaissued by the Ministry of Water Resources in January 2019 sets a target plan for future GWreplenishment by major rivers. Therefore, the Zhulong, Tang, Baohe, and Nanjuma riverswill be recharged in the future. These rivers will become a major supply channel for GWresources and for surface water resources in Baiyangdian Lake. The comprehensive riverrecharge scheme under the pressure mining conditions in the study area is designed toprovide each of the Nanjuma, Bao, Tang, and Zhulong rivers with 100 million m3/a ofrecharge water.

Sustainability 2021, 13, 5626 10 of 17
6.2. Scenario 2: River Recharge in the XNA
The average GW recharge for each river was set with reference to ecological waterrecharge and GW recharge in the implementation plan of the Ministry of Water Resources.The focus of the model prediction was on the GW recharge schemes for the Nanjumaand Baigou rivers flowing through the main GW level cone within the XNA. Since thewater source of the middle route of the SNWDP mainly recharges the Nanjuma river, theNanjuma River and Baigou Diversion River were designed to facilitate GW recharge of40 million m3/a and 10 million m3/a, respectively on the basis of natural river infiltration.
6.3. Scenario 3: Well Recharge in the XNA
A number of recharge wells were set within 1 km of the Baigou Diversion Riveraccording to the regional GW flow field and GW level cone distribution characteristics. Thewater source of the middle route of the SNWDP was used to recharge the regional GW. Thefocus of the scenario was on the recovery of the GW table in the district depression cone inXiongxian and Rongcheng. The evaluation of the regional suitability showed that naturalinfiltration near the Baigou Diversion River is poor. Therefore, the pressurized method wasselected for injection of recharge water within the reinjection wells. Recharge water wasinjected into the phreatic aquifer. Artificial recharge of 50 million m3/a was implementedand single-well recharge of 5000 m3/d was required for a minimum of 27 recharge wells.
6.4. Scenario 4: Combined Supply of River and Well GW Recharge in the XNA
A combined supply of river and well recharge (river–well GW recharge) was estab-lished in the XNA according to the regional GW flow field and GW level cone distributioncharacteristics. A river recharge volume of 10 million m3/a and well recharge volumeof 40 million m3/a were implemented. The pressurized method was used for artificialrecharge at the recharge wells due to the poor natural infiltration near the Baigou DiversionRiver. The recharge water was injected into the phreatic aquifer. A single well rechargerate of 5000 m3/d was implemented and a minimum of 22 recharge wells were required.
7. Results and Discussion7.1. Changes in the GW Level
A comparison of the predicted flow field in 2035 under various recharge schemeswith that for the same year under current conditions showed an upward trend in the GWflow field in the study area (Figure 8). The trend in the GW flow field was consistentacross the Western Piedmont area, the flow field in the XNA showed obvious changes, thearea of the depression cone decreased, and there was an obvious rise in the GW level of20 m. The GW level in the Rongcheng depression cone area increased by 11 m whereasthat in the Xiongxian depression cone area increased by 4 m. The downward trend inthe GW flow field had a certain inhibitory effect. These results showed that the differentrecharge schemes adopted in the Baigou Diversion River and within 1 km of the rivercould effectively act to recharge the GW level of the depression cone area on the easternand western sides of the river. The storage condition of aquifer is the key factor affectingthe effect of groundwater recharge. The storage condition of the aquifer is characterized bytwo parts. One is that the target aquifer should have enough space to store recharge water,that is, the size of underground water storage space. The other is that the groundwater canbe rapidly distributed in the whole water storage space without forming a groundwatermound after entering the aquifer, that is, the water transmitting ability of the aquifer.
The results showed that all the recharge schemes will result in a rise in the shallow GWlevel of the Rongcheng depression cone area, with the most obvious rise in the GW levelunder the pressure extraction of the GW scheme. Similar increases in the shallow ground-water levels were achieved under well GW recharge and river–well GW recharge schemesin the XNA. This result could be attributed to the ratio of the river–well GW recharge towell GW recharge being 1:4. Therefore, river GW recharge across the entire study area ishelpful for facilitating the recovery of the GW level in the Rongcheng depression cone area.

Sustainability 2021, 13, 5626 11 of 17
The results showed that all the recharge schemes resulted in increases to the shallowGW level in the depression cone area of Xiongxian, among which well GW recharge hadthe largest effect followed by combined river–well GW recharge. This result showed thatall the recharge schemes are helpful for the recovery of the GW level in the Xiongxiandepression cone area.
Figure 8. Cont.

Sustainability 2021, 13, 5626 12 of 17
Figure 8. Comparison between current groundwater conditions with the shallow groundwaterlevel contour after artificial groundwater recharge in the plain area of the Daqing River Basin,China. (a) Current situation; (b) river recharge implemented across the whole area; (c) river rechargeimplemented in the Xiongan New Area (XNA); (d) well recharge in the XNA; (e) combined river andwell GW recharge in the XNA.
A comparison of the GW level of the depression cone in 2035 under the currentsituation with that under various recharge schemes showed that pressure mining resultedin a significant rise in the water level in the cone area. The GW level in the depression conearea of Rongcheng increased significantly under river GW recharge across the entire area,with the GW level rising by 11 m (Figure 9). The well irrigation GW recharge plan in theXNA greatly increased the GW level in the depression cone area of Xiongxian, with a risein the water level of 4 m (Figure 10).
Figure 9. Changes to the shallow groundwater level in the Rongcheng depression cone area in theplain area of the Daqing River Basin, China.
Sustainability 2021, 13, 5626 13 of 17
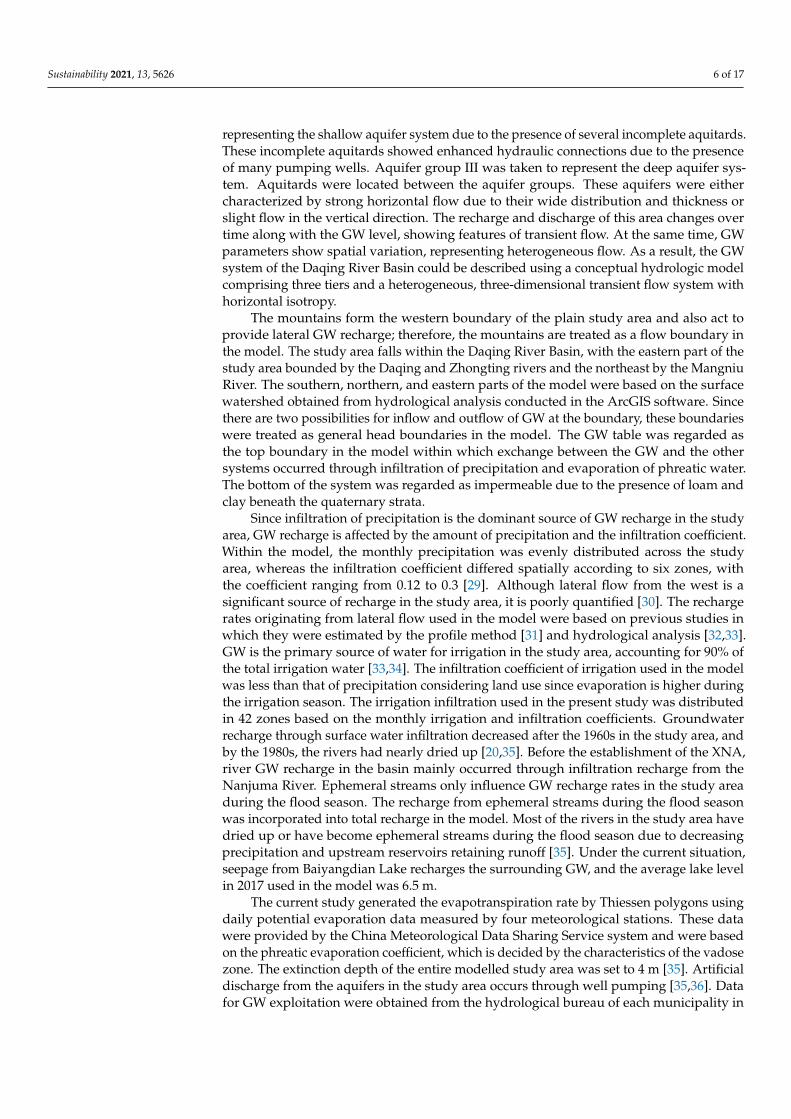
Figure 10. Changes to the shallow groundwater level in the Xiongxian depression cone area in theplain area of the Daqing River Basin, China.
7.2. Changes to Supply
Four artificial GW recharge schemes were implemented in the study area within thecase of pressure extraction. The results showed that the regional GW resources entered apositive equilibrium state (Table 2). The relative changes in well GW recharge in the XNA,combined river–well GW recharge in the XNA, river GW recharge across the entire area,and river recharge in the XNA were 14.56%, 11.04%, −0.12%, and −3.18%, respectively. Acomprehensive comparison of various recharge schemes from the perspective of the overalleffect of artificial recharge on GW level and the increase in recharge showed that the wellirrigation recharge scheme for the XNA was relatively reasonable.
The results indicated that the influence of the SNWDP helped to control the decreasein the GW levels. The results of the present study are consistent with those of otherstudies [1,44,45]. The present study can improve the understanding of the impact of theSNWDP on GW levels in the plain area of the Daqing River Basin. Beijing has less than100 m3 per capita water resources within its administrative area, 1/20 of the nationalaverage, 1/80 of the global average, and far below the internationally recognized dangerlevel of 1700 m3 and absolute scarcity of less than 500 m, the degree of groundwaterdepletion is similar to that in plain area of Daqing River Basin. Long et al. used physicalbased hydrological models to quantify the impact of SNWD in the context of the effects ofclimate extremes and water policies (e.g., reduction in irrigation pumpage) using physicallybased hydrologic modeling, and to project how these factors may influence GWS in thefuture. The results show that water diverted to Beijing reduced cumulative GW depletionby 3.6 km3, accounting for 40% of total GW storage recovery during 2006–2018. Increasedprecipitation contributes similar volumes to GW storage recovery of 2.7 km3 (30%) alongwith policies on reduced irrigation (2.8 km3, 30%) [14]. The conclusion is similar to that ofthis study.

Sustainability 2021, 13, 5626 14 of 17
Table 2. Comparison of the effect on groundwater recharge of different groundwater recharge schemes for shallow groundwater in the Xiongan New Area (XNA) in the plain area of theDaqing River Basin, China (106 m3).
Time Source-Sink Term CurrentSituation
PressureExtraction ofGroundwater
Artificial Recharge under a Reduction in Groundwater Exploitation
River GW acrossthe Entire Area
River GWRecharge
Well GWRecharge
Combined Riverand Well GW
Recharge
2035a
Recharge
Precipitation infiltration 114.46 114.46 114.46 114.46 114.46 114.46Lateral inflow 29.77 22.56 23.21 21.09 18.33 18.39
Irrigation infiltration 19.92 19.92 19.92 19.92 19.92 19.92River infiltration 26.65 26.65 38.93 33.10 26.65 27.81
Infiltration of Baiyangdian Lake 31.82 26.99 25.84 26.96 26.40 26.44Well irrigation 0 0 0 0 49.28 40.15
total 222.62 210.58 222.36 215.53 255.03 247.18Rate of change from the current
situation 0 −5.41% −0.12% −3.18% 14.56% 11.04%
Discharge
Artificial exploitation 227.00 158.90 158.90 158.90 158.90 158.90Lateral outflow 34.76 25.31 20.84 26.17 31.54 31.40
Evaporation 0 0 44.24 18.17 56.80 49.37Total 261.76 184.21 223.98 203.24 247.24 239.67
Rate of change from the currentsituation 0 −29.63% −14.43% −22.36% −5.54% −8.44%
Storage variation 11.15 58.70 66.59 60.89 57.78 57.93

Sustainability 2021, 13, 5626 15 of 17
8. Conclusions
A conceptual GW flow model was developed by analyzing the hydrogeologicalconditions in the Daqing River Basin. A three-dimensional transient numerical flow modelwas then developed using MODFLOW. The hydrogeologic parameters were identified andthe model was calibrated by fitting the simulated GW flow field with the hydrographs ofobservation wells. The model was then used to simulate the response of the GW levels todifferent artificial recharge schemes. The GW levels were simulated and analyzed underfour scenarios. When compared with the current situation, the GW level increased to acertain extent in 2035 after the implementation of four artificial recharge schemes. Theorder of the different recharge schemes according to the relative rate of change in GW waswell GW recharge in the XNA (14.56%) > combined river and well GW recharge in theXNA (11.04%) > river GW recharge across the entire area (−0.12%) > river GW recharge inthe XNA (−3.18%). A comprehensive comparison of various recharge schemes from theperspective of the overall effect of artificial recharge on the GW levels and the increase inrecharge showed that the well GW recharge scheme for the XNA was relatively reasonable.Therefore, the implementation of artificial GW recharge can alleviate the environmentalrisk resulting from the continuous decline in the GW level in the plain area of the DaqingRiver Basin. This study provides a reference for the management and protection of aquifersin other areas suffering serious GW overexploitation.
The present study considered the impact of artificial recharge on GW under onlyone climate scenario. The interactions between climate change, multisource recharge, andsocioeconomic activity for integration into a GW flow model requires further research.
Author Contributions: Conceptualization and methodology, G.C., X.S. and H.L.; investigation andanalysis G.C., G.X., Y.Z., N.L.; data curation, G.X., N.L.; writing—original draft preparation, G.C., X.S.and H.L.; writing—review and editing, X.S., H.L. All authors have read and agreed to the publishedversion of the manuscript.
Funding: This article was funded by the national key research and development project “Artificialrecharge and storage of groundwater in Xiongan New Area (2018YFC0406503)”.
Institutional Review Board Statement: Not applicable.
Informed Consent Statement: Informed consent was obtained from all subjects involved in the study.
Data Availability Statement: Data sharing not applicable.
Conflicts of Interest: The authors declare no conflict of interest.
References1. Cao, G.; Zheng, C.; Scanlon, B.R.; Liu, J.; Li, W. Use of flow modeling to assess sustainability of groundwater resources in the
North China Plain. Water Resour. Res. 2013, 49, 159–175. [CrossRef]2. Sophocleous, M. Interactions between groundwater and surface water: The state of the science. Hydrogeol. J. 2002, 10, 52–67.
[CrossRef]3. Konikow, L.F.; Kendy, E. Groundwater depletion: A global problem. Hydrogeol. J. 2005, 13, 317–320. [CrossRef]4. Fogg, G.E.; LaBolle, E.M. Motivation of synthesis, with an example on groundwater quality sustainability. Water Resour. Res.
2006, 42, W03S05. [CrossRef]5. Konikow, L.F. Contribution of global groundwater depletion since 1900 to sea-level rise. Geophys. Res. Lett. 2011, 38, L17401.
[CrossRef]6. Shah, T.; Molden, D.; Sakthivadivel, R.; Seckler, D. The Global Groundwater Situation: Overview of Opportunities and Challenges;
International Water Management Institute: Colombo, Sri Lanka, 2000.7. Shah, T.; Roy, A.D.; Qureshi, A.S.; Wang, J. Sustaining Asia’s groundwater boom: An overview of issues and evidence. Nat.
Resour. Forum 2003, 27, 130–141. [CrossRef]8. Wada, Y.; van Beek, L.P.H.; van Kempen, C.M.; Reckman, J.W.T.M.; Vasak, S.; Bierkens, M.F.P. Global depletion of groundwater
resources. Geophys. Res. Lett. 2010, 37, L20402. [CrossRef]9. Alley, W.M.; Healy, R.W.; LaBaugh, J.W.; Reilly, T.E. Flow and storage in groundwater systems. Science 2002, 296, 1985–1990.
[CrossRef]10. Zheng, C.; Liu, J.; Cao, G.; Kendy, E.; Wang, H.; Jia, Y. Can China cope with its water crisis? Perspectives from the North China
Plain. Ground Water 2010, 48, 350–354. [CrossRef]

Sustainability 2021, 13, 5626 16 of 17
11. Xia, J.; Zhang, Y.Y. Water Resource and Pollution Safeguard for Xiongan New Area Construction and Its Sustainable Development.Bull. Chin. Acad. Sci. 2017, 11, 31–37.
12. Zhang, Y.W. Evaluation of Groundwater Artificial Recharge Suitability in Plain Area of Daqing River Basin Based on GIS—EWM; JilinUniversity: Changchun, China, 2020.
13. Hao, Q.; Shao, J.; Zhen, X. A Study of the artificial adjustment of groundwater storage of the Yongding River alluvial fan inBeijing. Hydrogeol. Eng. Geol. 2012, 39, 12–18.
14. Long, D.; Yang, W.T.; Scanlon, B.R. South-to-North Water Diversion stabilizing Beijing’s groundwater levels. Nat. Commun. 2020,11, 3665. [CrossRef] [PubMed]
15. Kinzelbach, W.; Bauer, P.; Siegfried, T.; Brunner, P. Sustainable groundwater management—Problems and scientific tool. Episodes2003, 26, 279–284. [CrossRef]
16. Welsh, W.D. Great Artesian Basin Transient Groundwater Model; Bureau of Rural Science, Fisheries and Forestry: Canberra, Australia,2006.
17. Zhang, X.; Xue, L.; Zhang, Q.; Li, J. Simulation of groundwater exploitation at early stage and analysis on water budget in HaiheRiver Basin. J. Arid Land Resour. Environ. 2008, 9, 102–107.
18. Wang, S.; Shao, J.; Song, X.; Zhang, Y.; Huo, Z.; Zhou, X. Application of MODFLOW and geographic information system togroundwater flow simulation in North China Plain, China. Environ. Geol. 2008, 55, 1449–1462. [CrossRef]
19. Cui, Y.; Wang, Y.; Shao, J.; Chi, Y.; Lin, L. Research on groundwater regulation and recovery in North China Plain after theimplementation of south-to-north water transfer. Resour. Sci. 2009, 31, 382–387.
20. Xue, L.; Li, W.; Yang, W.; Li, J.; Zhu, X. Numerical modelling on exploited shallow groundwater flow in the plain of Haihe riverbasin. Geotech. Invest. Surv. 2010, 3, 50–55.
21. Liu, J.; Zheng, C.; Zheng, L.; Lei, Y. Ground water sustainability: Methodology and application to the North China Plain. GroundWater 2010, 46, 897–909. [CrossRef]
22. Hu, Y.K.; Moiwo, J.P.; Yang, Y.H.; Han, S.M.; Yang, Y.M. Agricultural water-saving and sustainable groundwater management inShijiazhuang Irrigation District, North China Plain. J. Hydrol. 2010, 393, 219–232. [CrossRef]
23. Li, X.; Ye, S.Y.; Wei, A.H.; Zhou, P.P.; Wang, L.H. Modelling the response of shallow groundwater levels to combined climate andwater-diversion scenarios in beijing-tianjin-hebei plain, China. Hydrogeol. J. 2017, 25, 1733–1744. [CrossRef]
24. Foster, S.; Garduno, H.; Evans, R.; Olson, D.; Tian, Y.; Zhang, W.; Han, Z. Quaternary Aquifer of the North China Plain: Assessingand achieving groundwater resource sustainability. Hydrogeol. J. 2004, 12, 81–93. [CrossRef]
25. Qin, H.; Cao, G.; Kristensen, M.; Refsgaard, J.C.; Rasmussen, M.O.; He, X.; Liu, J.; Shu, Y.; Zheng, C. Integrated hydrologicalmodeling of the North China Plain and implications for sustainable water management. Hydrol. Earth Syst. Sci. 2013, 17,3759–3778. [CrossRef]
26. Shen, H.; Leblanc, M.; Tweed, S.; Liu, W. Groundwater depletion in the Hai River basin, China, from in situ and GRACEobservations. Hydrol. Sci. J. 2015, 60, 671–687. [CrossRef]
27. Chen, W. Groundwater in Hebei Province; Earthquake Publishing House: Beijing, China, 1999.28. Yue, J.T. Research on Water Resources Allocation at the Intake Area in Hebei Province of Central Line Project of the South-to-North Water
Diversion; Donghua University: Shanghai, China, 2016.29. Meng, S.; Fei, Y.; Zhang, Z.; Lei, T.; Qian, Y.; Li, Y. Research on spatial and temporal distribution of the precipitation infiltration
amount over the past 50 years in North China Plain. Adv. Earth Sci. 2013, 28, 923–929.30. Kendy, E.; Zhang, Y.; Liu, C.; Wang, J.; Steenhuis, T. Groundwater recharge from irrigated cropland in the North China Plain:
Case study of Luancheng County, Hebei Province, 1949–2000. Hydrol. Process 2006, 18, 2289–2302. [CrossRef]31. Shao, J.; Li, L.; Cui, Y.; Zhang, Z. Groundwater flow simulation and its application in groundwater resource evaluation in the
North China Plain, China. Acta Geol. Sin. 2013, 87, 243–253.32. Chung, I.; Kim, N.; Lee, J.; Sophocleous, M. Assessing distributed groundwater recharge rate using integrated surface water–
groundwatermodelling: Application to Mihocheon watershed, South Korea. Hydrogeol. J. 2010, 18, 1253–1264. [CrossRef]33. Zhang, Y.; Li, G. Long-term evolution of cones of depression in shallow aquifers in the North China Plain. Water 2013, 5, 677–697.
[CrossRef]34. Zhang, X.; Pei, D.; Hu, C. Conserving groundwater for irrigation in the North China Plain. Irrigation Sci. 2003, 21, 159–166.
[CrossRef]35. Zhang, Z.; Fei, Y.H.; Chen, Z.Y. Investigation and Assessment of Sustainable Utilization of Groundwater Resources in the North China
Plain; Geological Publishing House: Beijing, China, 2009.36. Fei, Y. Evolution and Conservation of Groundwater in Hebei Plain to the South of Beijing and Tjianjin; Hohai University: Nanjing, China,
2006.37. Xu, X. A study of Numerical Simulation for Groundwater Flow in the Beijing Plain, China; University of Geosciences: Beijing, China,
2006.38. Yang, Y.; Li, X.; Wang, L.; Li, C.; Liu, Z. Characteristics of the groundwater level regime and effect factors in the plain region of
Tianjin City. Geolog. Surv. Res. 2011, 34, 313–320.39. Zhang, Z.; Shen, Z.; Xue, Y. Groundwater Environment Evolution in the North China Plain; Geological Publishing House: Beijing,
China, 2000.

Sustainability 2021, 13, 5626 17 of 17
40. McDonald, M.G.; Harbaugh, A.W. A Modular Three-Dimensional Finite Difference Ground-Water Flow Model; US Geological Survey:Reston, VA, USA, 1984.
41. Harbaugh, A.W. The US Geological Survey Modular Ground-Water Model: The Ground-Water Flow Process; US Geological Survey:Reston, VA, USA, 2005.
42. Harbaugh, A.W.; Banta, E.R.; Hill, M.C.; McDonald, M.G. The US Geological Survey Modular Ground-Water Model: User Guide toModularization Concepts and the Ground-Water Flow Process; US Geological Survey: Reston, VA, USA, 2000.
43. Zhang, Z.; Fei, Y. Atlas of Sustainable Utilization of Groundwater Resources in the North China Plain; SinoMaps Press: Beijing, China,2009.
44. Zhang, Y.; Li, G. Influence of south-to-north water diversion on major cones of depression in North China Plain. Environ. EarthSci. 2014, 71, 3845–3853. [CrossRef]
45. Chen, H.R.; Gao, Z.Y.; Wang, S.L. Modeling on impacts of climate change and human activities variability on the shallowgroundwater level using MODFLOW. J. Hydraulic. Eng. 2012, 43, 344–363.