Occurrence of uranium in groundwater of a shallow granitic aquifer and its suitability for domestic...
11
Occurrence of uranium in groundwater of a shallow granitic aquifer and its suitability for domestic use in southern India K. Brindha • L. Elango Received: 19 March 2012 / Published online: 28 September 2012 Ó Akade ´miai Kiado ´, Budapest, Hungary 2012 Abstract Groundwater used for domestic purpose with- out proper treatment should be free from chemical and biological contaminants. This study was carried out to assess the groundwater quality with respect to uranium in a part of Nalgonda district, Andhra Pradesh, India. Ground- water was regularly monitored for uranium concentration by collection of samples once every two months from March 2008 to November 2009 from 44 wells. The con- centration of uranium in groundwater ranged from 0.2 to 118.4 ppb. Groundwater is unsuitable for domestic use in 2 % of this area based on the limit of 60 ppb prescribed by the Atomic Energy Regulatory Board of India. However, due the wide variation in limit suggested by different organizations and countries, the no-observed-adverse- effect level and lowest-observed-adverse-effect level (in mg/kg day) was used to understand the dosage of uranium that reaches the people through drinking water pathway. This level varied from 0 to 0.02 mg/kg day and 0 to 0.08 mg/kg day based on an uncertainty factor of 10 and 50 respectively for the mean uranium concentration in groundwater in each well. With an uncertainty factor of 50, 5 groundwater samples had uranium above 0.06 mg/kg day which is the lowest-observed-adverse-effect level. This study showed that with the presence of present level of uranium concentration in groundwater of this area there is no major threat to humans through the drinking water pathway. Keywords Geology Granitic rock Drinking water Uranium standard NOAEL LOAEL Nalgonda India Introduction Naturally groundwater consists of major ions, minor ions, trace metals, heavy metals, radionuclides, organic matter etc. It is often used for drinking and domestic purposes apart from agricultural and industrial purposes due to its wide distribution and as it is comparatively less polluted than surface water. The groundwater quality needs to be monitored regularly so as to check that its composition do not exceed the limits of drinking water quality standards. Assessment of groundwater quality for different uses based on these standards has been carried out in several parts of the world [1–5]. India is one among several developing countries where treated piped water supply is not available throughout the day and hence the people depend on using groundwater for their basic needs without treatment from private wells. It is therefore important to monitor the groundwater quality in such areas regularly to advice the community to exercise proper caution while using the groundwater for different domestic purposes. The ground- water quality in these areas may be controlled by several factors. Geochemical processes and geology of an area control the groundwater quality [6–8]. The geology in an area play a significant role especially in an ore mineralised region. The present study was carried out in a part of Nalgonda district, Andhra Pradesh, southern India (Fig. 1) where unconformity related uranium deposits have been reported [9]. Uranium is a radionuclide present in minute quantity in groundwater naturally which has been studied by several researchers [10–12]. In this area uranium is abundant in the K. Brindha L. Elango (&) Department of Geology, Anna University, Chennai 600 025, India e-mail: [email protected]; [email protected] K. Brindha e-mail: [email protected] 123 J Radioanal Nucl Chem (2013) 295:357–367 DOI 10.1007/s10967-012-2090-6
Transcript of Occurrence of uranium in groundwater of a shallow granitic aquifer and its suitability for domestic...
Occurrence of uranium in groundwater of a shallow graniticaquifer and its suitability for domestic use in southern India
K. Brindha • L. Elango
Received: 19 March 2012 / Published online: 28 September 2012
� Akademiai Kiado, Budapest, Hungary 2012
Abstract Groundwater used for domestic purpose with-
out proper treatment should be free from chemical and
biological contaminants. This study was carried out to
assess the groundwater quality with respect to uranium in a
part of Nalgonda district, Andhra Pradesh, India. Ground-
water was regularly monitored for uranium concentration
by collection of samples once every two months from
March 2008 to November 2009 from 44 wells. The con-
centration of uranium in groundwater ranged from 0.2 to
118.4 ppb. Groundwater is unsuitable for domestic use in
2 % of this area based on the limit of 60 ppb prescribed by
the Atomic Energy Regulatory Board of India. However,
due the wide variation in limit suggested by different
organizations and countries, the no-observed-adverse-
effect level and lowest-observed-adverse-effect level (in
mg/kg day) was used to understand the dosage of uranium
that reaches the people through drinking water pathway.
This level varied from 0 to 0.02 mg/kg day and 0 to
0.08 mg/kg day based on an uncertainty factor of 10 and
50 respectively for the mean uranium concentration in
groundwater in each well. With an uncertainty factor of 50,
5 groundwater samples had uranium above 0.06 mg/kg day
which is the lowest-observed-adverse-effect level. This
study showed that with the presence of present level of
uranium concentration in groundwater of this area there is
no major threat to humans through the drinking water
pathway.
Keywords Geology � Granitic rock � Drinking water �Uranium standard � NOAEL � LOAEL � Nalgonda � India
Introduction
Naturally groundwater consists of major ions, minor ions,
trace metals, heavy metals, radionuclides, organic matter
etc. It is often used for drinking and domestic purposes
apart from agricultural and industrial purposes due to its
wide distribution and as it is comparatively less polluted
than surface water. The groundwater quality needs to be
monitored regularly so as to check that its composition do
not exceed the limits of drinking water quality standards.
Assessment of groundwater quality for different uses based
on these standards has been carried out in several parts of
the world [1–5]. India is one among several developing
countries where treated piped water supply is not available
throughout the day and hence the people depend on using
groundwater for their basic needs without treatment
from private wells. It is therefore important to monitor
the groundwater quality in such areas regularly to advice
the community to exercise proper caution while using the
groundwater for different domestic purposes. The ground-
water quality in these areas may be controlled by several
factors. Geochemical processes and geology of an area
control the groundwater quality [6–8]. The geology in an
area play a significant role especially in an ore mineralised
region.
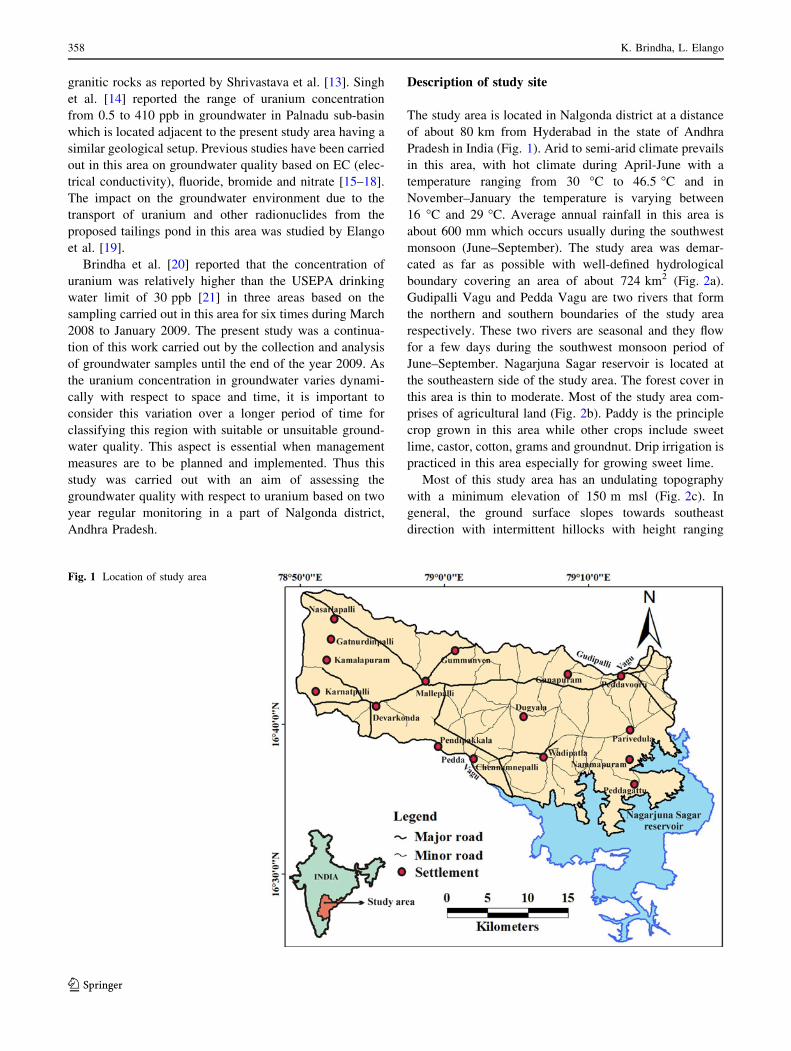
The present study was carried out in a part of Nalgonda
district, Andhra Pradesh, southern India (Fig. 1) where
unconformity related uranium deposits have been reported
[9]. Uranium is a radionuclide present in minute quantity in
groundwater naturally which has been studied by several
researchers [10–12]. In this area uranium is abundant in the
K. Brindha � L. Elango (&)
Department of Geology, Anna University, Chennai 600 025,
India
e-mail: [email protected]; [email protected]
K. Brindha
e-mail: [email protected]
123
J Radioanal Nucl Chem (2013) 295:357–367
DOI 10.1007/s10967-012-2090-6
granitic rocks as reported by Shrivastava et al. [13]. Singh
et al. [14] reported the range of uranium concentration
from 0.5 to 410 ppb in groundwater in Palnadu sub-basin
which is located adjacent to the present study area having a
similar geological setup. Previous studies have been carried
out in this area on groundwater quality based on EC (elec-
trical conductivity), fluoride, bromide and nitrate [15–18].
The impact on the groundwater environment due to the
transport of uranium and other radionuclides from the
proposed tailings pond in this area was studied by Elango
et al. [19].
Brindha et al. [20] reported that the concentration of
uranium was relatively higher than the USEPA drinking
water limit of 30 ppb [21] in three areas based on the
sampling carried out in this area for six times during March
2008 to January 2009. The present study was a continua-
tion of this work carried out by the collection and analysis
of groundwater samples until the end of the year 2009. As
the uranium concentration in groundwater varies dynami-
cally with respect to space and time, it is important to
consider this variation over a longer period of time for
classifying this region with suitable or unsuitable ground-
water quality. This aspect is essential when management
measures are to be planned and implemented. Thus this
study was carried out with an aim of assessing the
groundwater quality with respect to uranium based on two
year regular monitoring in a part of Nalgonda district,
Andhra Pradesh.
Description of study site
The study area is located in Nalgonda district at a distance
of about 80 km from Hyderabad in the state of Andhra
Pradesh in India (Fig. 1). Arid to semi-arid climate prevails
in this area, with hot climate during April-June with a
temperature ranging from 30 �C to 46.5 �C and in
November–January the temperature is varying between
16 �C and 29 �C. Average annual rainfall in this area is
about 600 mm which occurs usually during the southwest
monsoon (June–September). The study area was demar-
cated as far as possible with well-defined hydrological
boundary covering an area of about 724 km2 (Fig. 2a).
Gudipalli Vagu and Pedda Vagu are two rivers that form
the northern and southern boundaries of the study area
respectively. These two rivers are seasonal and they flow
for a few days during the southwest monsoon period of
June–September. Nagarjuna Sagar reservoir is located at
the southeastern side of the study area. The forest cover in
this area is thin to moderate. Most of the study area com-
prises of agricultural land (Fig. 2b). Paddy is the principle
crop grown in this area while other crops include sweet
lime, castor, cotton, grams and groundnut. Drip irrigation is
practiced in this area especially for growing sweet lime.
Most of this study area has an undulating topography
with a minimum elevation of 150 m msl (Fig. 2c). In
general, the ground surface slopes towards southeast
direction with intermittent hillocks with height ranging
Fig. 1 Location of study area
358 K. Brindha, L. Elango
123

from 250 to 300 m. The rainfall, topography and nature of
formation have lead to dentritic to subdentritic drainage
pattern in this area (Fig. 2a). Trellis type drainage pattern is
also seen. Numerous small reservoirs are present in the
depressed parts of the undulating topography of the study
area. There are also wide lined canal networks catering for
irrigation purposes.
Geologically this region is largely comprised of granite/
granitic gneisss, pink biotite granite, grey hornblende biotite
gneiss, migmatite granite and metabasalt belonging to late
Archean (Fig. 2d). These rocks are generally medium to
coarse grained. Most part of the investigated area has
exposures of granitic rocks belonging to late Archaen. The
granitic rocks are characterised by criss crossing joints and
they are the most commonly observed structural feature in
the area. The Srisailam formation, the youngest member of
the Cuddapah supergroup overlies the basement granite with
a distinct unconformity. This Srisailam formation is exposed
in the southeastern part of the study area. The Srisailam
formation are mainly arenaceous and include pebbly–gritty
quartzite shale with dolomitic limestone, intercalated
sequence of shale–quartzite and massive quartzite. The litho
units of this formation are dipping at an angle ranging from
38 to 58 towards SE. In the early 1990s uranium minerali-
sation was located in the unconformity of this area between
Srisailam formation of Cuddapah supergroup and the base-
ment granites [22].
Materials and methods
Data collection
To prepare the base map and drainage map of the study
area, toposheet nos. 56 L/13 SE, 56 L/13/SW, 56 P/1/SW,
56 P/1/SE, 56 L/14/NW, 56 L/14/NE, 56 P/2/NW, 56 P/2/
NE, 56 P/6/NW, 56 P/2/SW, 56 P/2/SE, 56 P/5/SW and 56
P/6/SW (scale-1:25,000) covering the study area was
obtained from Survey of India, Hyderabad, Andhra Pra-
desh, India. The Shuttle Radar Topography Mission
(SRTM) data was used to prepare the topographic map of
the study area. The geological map (scale-1:50,000)
was acquired from Geological Survey of India (GSI)
[23], Hyderabad, and this was modified based on field
investigations.
Fig. 2 a Drainage with monitoring wells, b land use, c topography, and d geology of the study area
Uranium occurrence in groundwater and its suitability for domestic use in southern India 359
123

Groundwater sampling and analysis
An intensive field survey was carried out and nearly 240 wells
were studied for choosing appropriate sampling wells for
periodical monitoring of uranium concentration. Based on the
EC a representative well approximately at a distance of 5 km
each was chosen. Forty-four wells were thus selected for peri-
odical monitoring which is shown in Fig. 2a. Groundwater
samples were collected from these wells from March 2008 to
November 2009, once every 2 months. The sampling bottles of
500 ml capacity were cleaned prior to sampling by soaking
them in 1:1 diluted HNO3 for 24 h and they were washed
thoroughly with distilled water. Further, these bottles were
washed again before each sampling at least two times with the
filtrates of the sample. The uranium concentration in these
groundwater samples was determined using laser fluorimeter
which has a detection limit of 0.1 ppb [24, 25]. All the ana-
lytical reagents used were procured from Merck. Blanks and
standards were run intermittently during the measurement for
ensuring accuracy of the result. For every ten samples, three
samples were run in triplicates by varying the concentration of
the standard and a calibration curve was obtained to cross check
the accuracy of the instrument and to avoid handling errors.
Software used
Groundwater quality maps based on uranium were plotted out
using Arc GIS 9.3. This software was also used for the prep-
aration of topography, drainage, geology and land use maps.
Fig. 3 Uranium concentration (ppb) in groundwater of different locations
360 K. Brindha, L. Elango
123

Results and discussion
It is essential to study the groundwater quality of areas
where ores of any mineral occur as there are chances that
the groundwater may be enriched by that mineral due to
natural processes. Taking account of this the uranium
concentration in groundwater of this uranium mineralised
area is studied. No other studies carried out from this area
have reported adverse-effect of major ions on groundwater
quality except for the spatial and temporal variation in the
concentration of EC, fluoride, bromide and nitrate [15–18].
Several studies have also reported uranium occurrence in
groundwater and surface water around the world based on
one time sampling and hence they did not take into account
the temporal variation. A total of 446 groundwater samples
were collected and analysed in this study based on which
the interpretation has been made.
Variation in uranium concentration
Uranium concentration in groundwater of the study area
varies significantly with respect to space and time. The
Fig. 4 Variation in uranium concentration (ppb) from March 2008 to November 2009 along with the maximum permissible limits
Fig. 5 Temporal variation in uranium concentration (ppb) in groundwater of few wells
Uranium occurrence in groundwater and its suitability for domestic use in southern India 361
123

concentration of uranium in groundwater samples collected
from various wells for September 2008 and September
2009 are shown in Fig. 3. Uranium concentration in
groundwater ranged from 0.2 to 118.4 ppb with an average
of 18.5 ppb in the study area and the range varied with time
(Fig. 4). The temporal variation in uranium concentration
is in the order of magnitude of 2 to 10. As an example the
temporal variation in a few wells are shown in Fig. 5.
The concentration of uranium in groundwater greatly
depends on the composition of the rocks in the aquifer. The
concentration of uranium in granitic rocks has been studied
widely by several researchers (Table 1) which is up to
35.4 ppm [26–30]. The granitic rocks which occur in most
of the study area contain uranium in the range of
10.2–116 ppm with an average of 35 ppm and thorium
between 25.5 and 60.7 ppm with an average of 50 ppm
[13].
Interaction between the uranium rich weathered granitic
rocks or top soil and groundwater has resulted in increase
in uranium concentration in groundwater of this study area.
Based on the rock type the sampling wells were divided to
understand its relationship with uranium (Fig. 6). Uranium
concentration was higher in wells located in granitic gneiss,
followed by migmatite granite and pink biotite granite
respectively. This shows that granitic rocks contribute
significantly to uranium concentration in groundwater of
this area.
Water quality based on uranium
Continuous monitoring of uranium concentration in
groundwater over a period of two years was used to assess
the groundwater quality in this area. WHO [31] had rec-
ommended 15 ppb of uranium in drinking water as safe
limit. USEPA [21] has put forth 30 ppb of uranium as the
permissible limit. Though the Indian standards specifica-
tion for drinking water [32] does not specify any maximum
permissible limit for uranium, a maximum limit of 60 ppb
as recommended by the Atomic Energy Regulatory Board
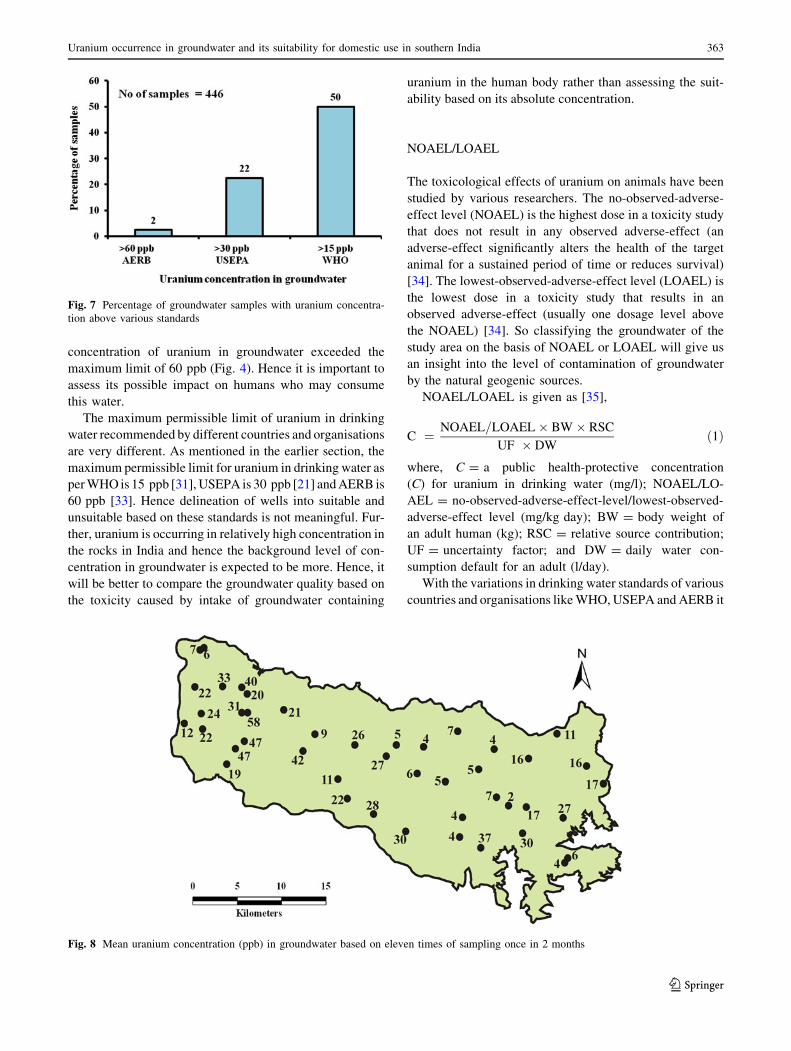
(AERB), India [33]. Of the total 446 groundwater samples
collected and analyzed, 2 % of the groundwater samples
were above the AERB limit (Fig. 7). The number of
groundwater samples exceeding this limit is also shown in
Fig. 4. Based on USEPA limit, 22.5 % of the groundwater
samples had uranium above the maximum permissible
limit of 30 ppb (Fig. 7).
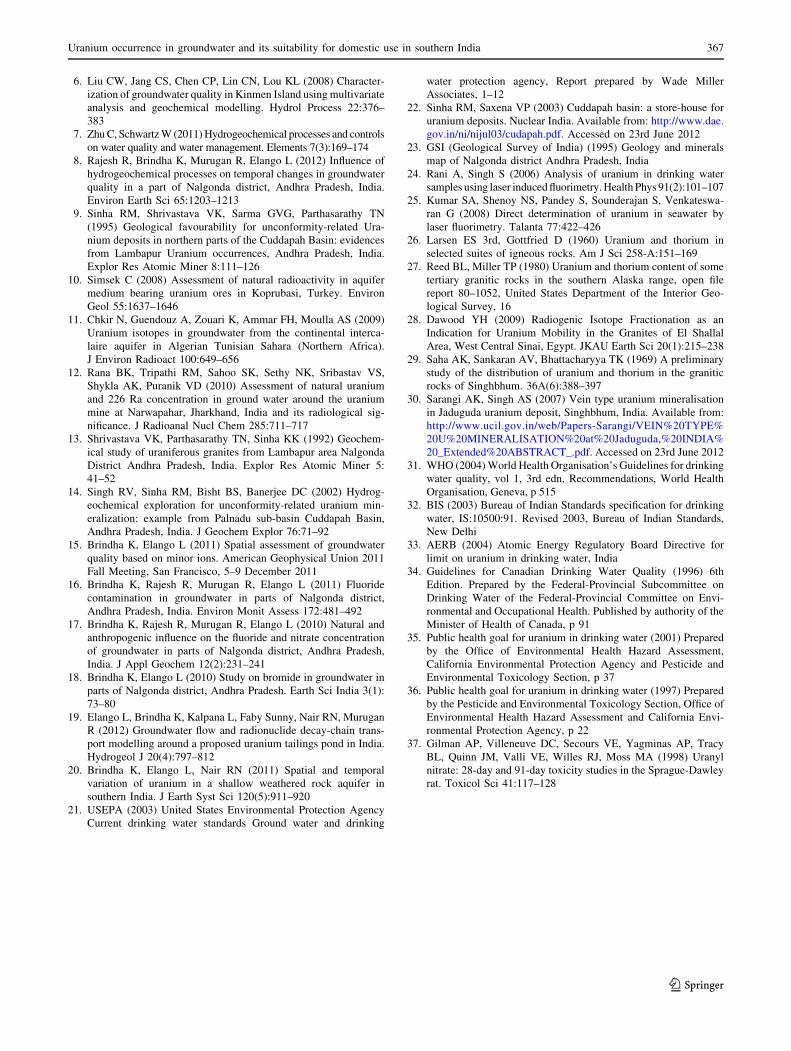
The mean uranium concentration in different wells
based on AERB limit and its suitability for drinking is
shown in Fig. 8. Groundwater of these locations are suit-
able for domestic use such as cooking and drinking as it
contains average uranium concentration below 60 ppb.
Number of groundwater samples with various ranges of
uranium concentration is shown in Fig. 9. Nearly 40 % of
the groundwater samples had uranium concentration within
10 ppb. Even though the mean uranium concentration
based on eleven bimonthly measurements is within the
AERB limit of 60 ppb (Fig. 8) during certain times the
Table 1 Uranium content in granite rocks
Rock type Location Uranium
concentration
(ppm)
Reference
Quartz monzonite
and granite
South
California
5.2–5.3 [26]
Idaho 2.2–6.3
Sierra
Nevada
2.3–7.2
Granite Alaska 5.6–35.4 [27]
Mica granite Egypt 20.3 average [28]
Hornblende biotite
granite
4.9 average
Granite Shingbhum,
India
4.75 average [29]
Granite Shingbhum,
India
7 average [30]
Fig. 6 Uranium concentration
in groundwater under different
rock types
362 K. Brindha, L. Elango
123
concentration of uranium in groundwater exceeded the
maximum limit of 60 ppb (Fig. 4). Hence it is important to
assess its possible impact on humans who may consume
this water.
The maximum permissible limit of uranium in drinking
water recommended by different countries and organisations
are very different. As mentioned in the earlier section, the
maximum permissible limit for uranium in drinking water as
per WHO is 15 ppb [31], USEPA is 30 ppb [21] and AERB is
60 ppb [33]. Hence delineation of wells into suitable and
unsuitable based on these standards is not meaningful. Fur-
ther, uranium is occurring in relatively high concentration in
the rocks in India and hence the background level of con-
centration in groundwater is expected to be more. Hence, it
will be better to compare the groundwater quality based on
the toxicity caused by intake of groundwater containing
uranium in the human body rather than assessing the suit-
ability based on its absolute concentration.
NOAEL/LOAEL
The toxicological effects of uranium on animals have been
studied by various researchers. The no-observed-adverse-
effect level (NOAEL) is the highest dose in a toxicity study
that does not result in any observed adverse-effect (an
adverse-effect significantly alters the health of the target
animal for a sustained period of time or reduces survival)
[34]. The lowest-observed-adverse-effect level (LOAEL) is
the lowest dose in a toxicity study that results in an
observed adverse-effect (usually one dosage level above
the NOAEL) [34]. So classifying the groundwater of the
study area on the basis of NOAEL or LOAEL will give us
an insight into the level of contamination of groundwater
by the natural geogenic sources.
NOAEL/LOAEL is given as [35],
C ¼ NOAEL=LOAEL� BW� RSC
UF � DWð1Þ
where, C = a public health-protective concentration
(C) for uranium in drinking water (mg/l); NOAEL/LO-
AEL = no-observed-adverse-effect-level/lowest-observed-
adverse-effect level (mg/kg day); BW = body weight of
an adult human (kg); RSC = relative source contribution;
UF = uncertainty factor; and DW = daily water con-
sumption default for an adult (l/day).
With the variations in drinking water standards of various
countries and organisations like WHO, USEPA and AERB it
Fig. 7 Percentage of groundwater samples with uranium concentra-
tion above various standards
Fig. 8 Mean uranium concentration (ppb) in groundwater based on eleven times of sampling once in 2 months
Uranium occurrence in groundwater and its suitability for domestic use in southern India 363
123

is not reasonable to estimate the suitability of water for
drinking purposes. It is more meaningful to estimate the
intake of natural uranium through drinking water and then
comparing it with the NOAEL/LOAEL. The measured ura-
nium concentration in groundwater of each sampling loca-
tion was used and the NOAEL/LOAEL were calculated to
determine its suitability for drinking purpose. This method
will help in assessing the groundwater quality with respect to
the chemical toxicity of uranium.
So, NOAEL/LOAEL is calculated by,
NOAEL=LOAEL ¼ DW� UF� Cð Þ= BW� RSCð Þ ð2Þ
The daily water consumption for an adult is 2 l/day and
the average adult body weight is considered 70 kg for this
Fig. 9 Groundwater samples
with uranium concentration in
different ranges
Fig. 10 Range and mean LOAEL of uranium at different sampling locations
364 K. Brindha, L. Elango
123

purpose. Instead of C which helps to arrive at a
public health-protective concentration (C) for uranium in
drinking water, in this equation, C was substituted with the
concentration of uranium in groundwater. For conservative
estimates of the intakes, a UF of 10, 50 and 100 was used in
the derivation.
The NOAEL for natural uranium is estimated as 0.2 mg/
kg day for adult by California Environmental Protection
Agency in 1997 [36]. But studies by Gilman in 1998 [37]
has estimated the LOAEL based on toxicity in rats evi-
denced by a variety of kidney and liver histological lesions
to be 0.06 mg/kg day [35]. Hence it is reasonable to
consider the LOAEL for comparison of uranium concen-
tration in groundwater obtained from this study.
The LOAEL with UF = 10 calculated for mean ura-
nium concentration of each sampling location varied from
0 to 0.02 mg/kg day. As the LOAEL did not exceed the
limit of 0.06 mg/kg day [35] with an UF of 10 at any of the
sampling wells, the spatial variation based on this is not
shown. The range and mean LOAEL of uranium at dif-
ferent sampling locations for UF = 50 and 100 is given in
Fig. 10. Figure 11 shows the variation in LOAEL with
UF = 50 and 100 at different sampling locations. The
suitability of groundwater based on the LOAEL of 0.6 mg/
Fig. 11 Variation in LOAEL with UF = 50 and 100 at sampling locations
Uranium occurrence in groundwater and its suitability for domestic use in southern India 365
123

kg day and UF of 50 calculated for mean uranium con-
centration in each sampling location is given in Fig. 12. Of
the 44 sampling wells, 5 wells had LOAEL above 0.06 mg/
kg day. Thus 11 % of the groundwater samples exceeded
the LOAEL of uranium in groundwater of this study area
with an uncertainty factor of 50. The LOAEL was also
calculated for the overall mean uranium concentration in
this study area of 18.5 ppb (based on 446 groundwater
samples) with UF = 10, 50 and 100. The level varied from
0.005 (UF = 10); 0.03 (UF = 50) and 0.05 (UF = 100).
Hence, in general considering the average uranium con-
centration in groundwater even with an UF of 100, there is
no major threat due to consumption to the people of this
area.
Conclusion
Periodical monitoring of uranium concentration in
groundwater was carried out from March 2008 to
November 2009 once every 2 months from 44 wells in a
part of Nalgonda district, Andhra Pradesh, India. The
uranium concentration varied from 0.2 to 118.4 ppb with a
mean of 18.5 ppb. The uranium concentration in ground-
water of 446 groundwater samples analysed was compared
with the maximum permissible limit of 60 ppb as put forth
by AERB of India and was found that 2 % of groundwater
samples were above this limit. The groundwater suitability
was also determined based on the LOAEL using the mean
concentration of uranium in each sampling well. Ground-
water was suitable based on LOEAL with an UF of 10.
With an UF of 50, 11 % of the groundwater samples were
above the LOAEL of 0.06 mg/kg day. Thus this study
helped to understand the groundwater suitability based on
uranium in a region where groundwater is used for drinking
and domestic purposes.
Acknowledgments The authors would like to acknowledge the
Board of Research in Nuclear Sciences, Department of Atomic
Energy, Government of India for funding this work (Grant no.
2007/36/35). Authors also like to thank the Department of Science
and Technology’s Funds for Improvement in Science and Technology
scheme (Grant No. SR/FST/ESI-106/2010) and University Grants
Commission’s Special Assistance Programme (Grant No. UGC DRS
II F.550/10/DRS/2007(SAP-1)) for their support in creating labora-
tory facilities, which helped in carrying out part of this work. The
authors also thank the anonymous reviewer for the critical and
valuable comments that helped in significantly improving the
manuscript.
References
1. Korfali SI, Jurdi M (2007) Assessment of domestic water quality:
case study, Beirut, Lebanon. Environ Monit Assess 135:241–251
2. Dawoud MA, Raouf ARA (2009) Groundwater exploration and
assessment in rural communities of Yobe State, Northern Nigeria.
Water Resour Manag 23(3):581–601
3. Toshisuke M, Fumikazu N, Hiroshi T, Kimihito N, Takeo O
(2011) Assessment of the long-term variation in the nitrogen
pollution load potential from farmland to groundwater in the
Tedori River Basin, Japan. Paddy Water Environ 9:441–449
4. Nosrati K, Eeckhaut MVD (2012) Assessment of groundwater
quality using multivariate statistical techniques in Hashtgerd
Plain, Iran. Environ Earth Sci 65:331–344
5. Brindha K, Elango L (2011) Hydrochemical characteristics of
groundwater for domestic and irrigation purposes in Madhuran-
thakam, Tamil Nadu, India. Earth Sci Res J 15(2):101–108
Fig. 12 LOAEL calculated with mean uranium in groundwater and UF = 50 in sample locations
366 K. Brindha, L. Elango
123
6. Liu CW, Jang CS, Chen CP, Lin CN, Lou KL (2008) Character-
ization of groundwater quality in Kinmen Island using multivariate
analysis and geochemical modelling. Hydrol Process 22:376–
383
7. Zhu C, Schwartz W (2011) Hydrogeochemical processes and controls
on water quality and water management. Elements 7(3):169–174
8. Rajesh R, Brindha K, Murugan R, Elango L (2012) Influence of
hydrogeochemical processes on temporal changes in groundwater
quality in a part of Nalgonda district, Andhra Pradesh, India.
Environ Earth Sci 65:1203–1213
9. Sinha RM, Shrivastava VK, Sarma GVG, Parthasarathy TN
(1995) Geological favourability for unconformity-related Ura-
nium deposits in northern parts of the Cuddapah Basin: evidences
from Lambapur Uranium occurrences, Andhra Pradesh, India.
Explor Res Atomic Miner 8:111–126
10. Simsek C (2008) Assessment of natural radioactivity in aquifer
medium bearing uranium ores in Koprubasi, Turkey. Environ
Geol 55:1637–1646
11. Chkir N, Guendouz A, Zouari K, Ammar FH, Moulla AS (2009)
Uranium isotopes in groundwater from the continental interca-
laire aquifer in Algerian Tunisian Sahara (Northern Africa).
J Environ Radioact 100:649–656
12. Rana BK, Tripathi RM, Sahoo SK, Sethy NK, Sribastav VS,
Shykla AK, Puranik VD (2010) Assessment of natural uranium
and 226 Ra concentration in ground water around the uranium
mine at Narwapahar, Jharkhand, India and its radiological sig-
nificance. J Radioanal Nucl Chem 285:711–717
13. Shrivastava VK, Parthasarathy TN, Sinha KK (1992) Geochem-
ical study of uraniferous granites from Lambapur area Nalgonda
District Andhra Pradesh, India. Explor Res Atomic Miner 5:
41–52
14. Singh RV, Sinha RM, Bisht BS, Banerjee DC (2002) Hydrog-
eochemical exploration for unconformity-related uranium min-
eralization: example from Palnadu sub-basin Cuddapah Basin,
Andhra Pradesh, India. J Geochem Explor 76:71–92
15. Brindha K, Elango L (2011) Spatial assessment of groundwater
quality based on minor ions. American Geophysical Union 2011
Fall Meeting, San Francisco, 5–9 December 2011
16. Brindha K, Rajesh R, Murugan R, Elango L (2011) Fluoride
contamination in groundwater in parts of Nalgonda district,
Andhra Pradesh, India. Environ Monit Assess 172:481–492
17. Brindha K, Rajesh R, Murugan R, Elango L (2010) Natural and
anthropogenic influence on the fluoride and nitrate concentration
of groundwater in parts of Nalgonda district, Andhra Pradesh,
India. J Appl Geochem 12(2):231–241
18. Brindha K, Elango L (2010) Study on bromide in groundwater in
parts of Nalgonda district, Andhra Pradesh. Earth Sci India 3(1):
73–80
19. Elango L, Brindha K, Kalpana L, Faby Sunny, Nair RN, Murugan
R (2012) Groundwater flow and radionuclide decay-chain trans-
port modelling around a proposed uranium tailings pond in India.
Hydrogeol J 20(4):797–812
20. Brindha K, Elango L, Nair RN (2011) Spatial and temporal
variation of uranium in a shallow weathered rock aquifer in
southern India. J Earth Syst Sci 120(5):911–920
21. USEPA (2003) United States Environmental Protection Agency
Current drinking water standards Ground water and drinking
water protection agency, Report prepared by Wade Miller
Associates, 1–12
22. Sinha RM, Saxena VP (2003) Cuddapah basin: a store-house for
uranium deposits. Nuclear India. Available from: http://www.dae.
gov.in/ni/nijul03/cudapah.pdf. Accessed on 23rd June 2012
23. GSI (Geological Survey of India) (1995) Geology and minerals
map of Nalgonda district Andhra Pradesh, India
24. Rani A, Singh S (2006) Analysis of uranium in drinking water
samples using laser induced fluorimetry. Health Phys 91(2):101–107
25. Kumar SA, Shenoy NS, Pandey S, Sounderajan S, Venkateswa-
ran G (2008) Direct determination of uranium in seawater by
laser fluorimetry. Talanta 77:422–426
26. Larsen ES 3rd, Gottfried D (1960) Uranium and thorium in
selected suites of igneous rocks. Am J Sci 258-A:151–169
27. Reed BL, Miller TP (1980) Uranium and thorium content of some
tertiary granitic rocks in the southern Alaska range, open file
report 80–1052, United States Department of the Interior Geo-
logical Survey, 16
28. Dawood YH (2009) Radiogenic Isotope Fractionation as an
Indication for Uranium Mobility in the Granites of El Shallal
Area, West Central Sinai, Egypt. JKAU Earth Sci 20(1):215–238
29. Saha AK, Sankaran AV, Bhattacharyya TK (1969) A preliminary
study of the distribution of uranium and thorium in the granitic
rocks of Singhbhum. 36A(6):388–397
30. Sarangi AK, Singh AS (2007) Vein type uranium mineralisation
in Jaduguda uranium deposit, Singhbhum, India. Available from:
http://www.ucil.gov.in/web/Papers-Sarangi/VEIN%20TYPE%
20U%20MINERALISATION%20at%20Jaduguda,%20INDIA%
20_Extended%20ABSTRACT_.pdf. Accessed on 23rd June 2012
31. WHO (2004) World Health Organisation’s Guidelines for drinking
water quality, vol 1, 3rd edn, Recommendations, World Health
Organisation, Geneva, p 515
32. BIS (2003) Bureau of Indian Standards specification for drinking
water, IS:10500:91. Revised 2003, Bureau of Indian Standards,
New Delhi
33. AERB (2004) Atomic Energy Regulatory Board Directive for
limit on uranium in drinking water, India
34. Guidelines for Canadian Drinking Water Quality (1996) 6th
Edition. Prepared by the Federal-Provincial Subcommittee on
Drinking Water of the Federal-Provincial Committee on Envi-
ronmental and Occupational Health. Published by authority of the
Minister of Health of Canada, p 91
35. Public health goal for uranium in drinking water (2001) Prepared
by the Office of Environmental Health Hazard Assessment,
California Environmental Protection Agency and Pesticide and
Environmental Toxicology Section, p 37
36. Public health goal for uranium in drinking water (1997) Prepared
by the Pesticide and Environmental Toxicology Section, Office of
Environmental Health Hazard Assessment and California Envi-
ronmental Protection Agency, p 22
37. Gilman AP, Villeneuve DC, Secours VE, Yagminas AP, Tracy
BL, Quinn JM, Valli VE, Willes RJ, Moss MA (1998) Uranyl
nitrate: 28-day and 91-day toxicity studies in the Sprague-Dawley
rat. Toxicol Sci 41:117–128
Uranium occurrence in groundwater and its suitability for domestic use in southern India 367
123