Signal Analyzer R&S FSQ - ELEX
18
◆ Up to 3.6 GHz, 8 GHz and 26.5 GHz ◆ 28 MHz I/Q demodulation bandwidth ◆ 16 Msample I and Q memory ◆ Software for measurements on 802.11a wireless LAN ◆ I/Q data extraction, e.g. for MCPA adjustment ◆ Code domain power measurement for 3GPP WCDMA optional ◆ Versatile resolution filters: Gaussian, FFT, channel, RRC ◆ Full choice of detectors ◆ Dynamic range of a high-end spectrum analyzer – TOI +25 dBm typ. – 1 dB compression +13 dBm – 84 dB ACLR/3GPP with noise correction Signal Analyzer R&S FSQ Signal analysis with the dynamic range of a high-end spectrum analyzer and a demodulation bandwidth of 28 MHz
-
Upload
khangminh22 -
Category
Documents
-
view
0 -
download
0
Transcript of Signal Analyzer R&S FSQ - ELEX

Up to 3.6 GHz, 8 GHz and 26.5 GHz 28 MHz I/Q demodulation bandwidth 16 Msample I and Q memory Software for measurements on
802.11a wireless LAN I/Q data extraction, e.g. for
MCPA adjustment
Code domain power measurement for 3GPP WCDMA optional
Versatile resolution filters:Gaussian, FFT, channel, RRC
Full choice of detectors
Dynamic range of a high-end spectrum analyzer– TOI +25 dBm typ.– 1 dB compression +13 dBm– 84 dB ACLR/3GPP with noise
correction
Signal Analyzer R&S FSQSignal analysis with the dynamic range of a high-end spectrum analyzerand a demodulation bandwidth of 28 MHz

2 Signal Analyzer R&S FSQ
Spectrum and signal analysisin a single unit
Future transmission methods in mobile radio and related fields call for wider transmission bandwidths to handle increasing data throughput. Even today, multiple carriers of a GSM or 3GPP base station are often boosted in common power output stages. This reduces the technical effort and costs on the one hand, but increases the bandwidth to be transmitted on the other. In both cases, analysis bandwidths exceeding those provided by present-day spectrum analyz-ers are required in development and pro-duction, while at the same time the dynamic range must satisfy stringent requirements.
The R&S FSQ combines the outstanding spectrum analyzer features and functions of the R&S FSU with a demodulation and analysis bandwidth that has been enhanced to 28 MHz. The R&S FSQ is thus ideal for applications in the development and production of the following:
Wireless LAN (WLAN) 3GPP and GSM-MCPA
The R&S FSQ additionally supports mea-surements on 2G, 2.5G and 3G mobile radio systems when using application firmware such as:
R&S FS-K5, GSM/EDGE R&S FS-K72, 3GPP FDD BTS R&S FS-K73, 3GPP FDD UE
The operating concept of the R&S FSQ is identical with that of the Spectrum Ana-lyzers R&S FSU and R&S FSP, including the GPIB/IEEC commands. These instru-ments thus offer a uniform platform for a variety of applications.
The R&S FSQ family
R&S FSQ3 20 Hz to 3.6 GHzR&S FSQ8 20 Hz to 8 GHzR&S FSQ26 20 Hz to 26 GHz
Future-proof performance and bandwidth

Signal Analyzer R&S FSQ 3
R&S FSQ – world champion in spectrum analysis
The R&S FSQ has the same outstanding RF features as the Spectrum Analyzer R&S FSU: 84 dB ACLR for 3GPP with noise
correction 77 dB ACLR for 3GPP multicarrier
signals (4 adjacent carriers) TOI >+20 dBm, +25 dBm typ. 1 dB compression +13 dBm Displayed average noise level
–158 dBm (1 Hz bandwidth) Phase noise –160 dBc (1 Hz) at
10 MHz carrier offset Phase noise –123 dBc (1 Hz) at 10 kHz
carrier offset
In addition to the broadband demodula-tion capabilities, the R&S FSQ provides the dynamic range that is required for multicarrier measurements or the mea-surement of spurious emissions at base transceiver stations (BTS).
Functionality
With its wide range of functions, the R&S FSQ is practically unparalleled on the spec-trum analyzer market. Even the basic unit comes standard with all important func-tions.
Highly selective digital filters from 10 Hz to 100 kHz
Fast FFT filters from 1 Hz to 30 kHz
Channel filters from 100 Hz to 5 MHz
RRC filters
1 Hz to 50 MHz resolution bandwidth
QP detector and EMI bandwidths 200 Hz, 9 kHz, 120 kHz
2.5 ms sweep time in frequency domain
1 µs sweep time in time domain
Number of measurement points/trace selectable between 155 and 10001
Time-selective spectrum analysis with gating function
GPIB interface, IEEE 488.2
RS-232-C serial interface, 9-pin D-SUB
VGA output, 15-pin D-SUB
PC-compatible screenshots on diskette or hard disk
Up to 20 measurements/s in manual mode
Up to 30 measurements/s in GPIB mode
SCPI-compatible GPIB command set
R&S FSE/R&S FSIQ-compatible GPIB command set
Fast ACP measurement in time domain
Statistical signal analysis with CCDF function
RMS detector with 100 dB dynamic range
Transducer factor for correcting antenna or cable frequency responses
2-year calibration interval
3-year warranty1)
1) Except parts subject to wear and tear (e.g. attenuators).
External reference from 1 MHz to 20 MHz in 1 Hz steps
GSM/EDGE modulation measurements(with option R&S FS-K5)
Code domain power measurements for 3GPP (with options R&S FS-K72 and R&S FS-K73)
Software for measurements to WLAN 802.11a
LAN interface 100BaseT
16 Msample I and Q memory

4 Signal Analyzer R&S FSQ
fS = 81.6 MHz
14 bit
20.4 MHz
IF filter
300/500 kHz1/2/3/5/10/20 MHz wide
Resampler0.5 to 1
Sampling rate10 kHz to 81.6 MHz
I memory16 Msample
Q memory16 Msample
NCO20.4 MHz
cos
sin
ProcessorDecimation
20 to 211Equalizer/resampler
A
D
Trigger
A signal analyzer with 28 MHz bandwidth – that says it all
The R&S FSQ features a newly developed digital back end that benefits from the progress in ADC and ASIC development. Time-consuming evaluation algorithms can be implemented directly in hardware – a prerequisite for fast measurement and high accuracy.
14-bit A/D converter 81.6 MHz Digital hardware resampler to match
the sampling rate to the signal Sampling rate from 10 kHzto
81.6 MHz adaptable to the modula-tion rate
SFDR >80 dBfs Digital downconversion to baseband
with high output bandwidth (28 MHz referred to RF)
Future-proof performance and bandwidth
Block diagram of vector signal analysis section in the R&S FSQ
Intermodulation distortion of I/Q data: a distortion-free transmission range is particularly important for amplifier measurements; the illustration above shows the intermodulation characteristics of the I/Q data of a two-tone signal.

Signal Analyzer R&S FSQ 5
The R&S FSQ determines the linear distor-tion in the RF and IF paths with the aid of the built-in calibration source and cor-rects such distortion online using a com-pensation filter. Moreover, the band-width-limiting YIG filter can be switched off in the microwave range at carrier fre-quencies greater than 3.6 GHz to ensure that even the smallest modulation errors can be measured with high accuracy.
The I/Q data can be transferred to a pro-cess controller via either the IEC/IEEE bus interface or the factory-installed LAN interface and then imported into pro-grams such as MatLab for further analy-sis.
Frequency response and group-delay distortion of 20 MHz resolution filter (example)
Frequency response and group-delay distortion of 50 MHz resolution filter (example)

6 Signal Analyzer R&S FSQ
The WLAN test software for the R&S FSQ analyzes the I/Q data that has been mea-sured by the R&S FSQ and transferred via the IEC/IEEE bus to an external process controller in line with the requirements of the 802.11a standard:
Modulation formats– BPSK– QPSK– 16QAM– 64QAM
Modulation measurements– Constellation diagram– Constellation diagram per OFDM
carrier– I/Q offset and I/Q imbalance– Carrier and symbol frequency
errors– Modulation error (EVM) per OFDM
carrier or symbol– Amplitude response and group-
delay distortion (spectral flatness) Amplitude statistics (CCDF) and
crest factor Transmit spectrum mask FFT, also over a selected part of the
signal, e.g. preamble Payload bit information Recording time selectable up to
800 ms Trigger:
– Free run– External
Typical inherent errors in 802.11a measurements EVM –40 dB Spectral flatness 0.5 dB
Using the WLAN test software, the R&S FSQ is a powerful tool for carrying out measurements in line with the relevant standard and for troubleshooting on 802.11a systems.
WLAN measurements
Measurement of 802.11a signal; data rate with 64QAM and simul-taneous display of time characteris-tic, constellation diagram, EVM per OFDM symbol, and result sum-mary with display of global error
Test setup for the analysis of 802.11a signals
Example of adjacent-channel interference: the constellation ver-sus carrier dia-gram clearly shows that the high EVM is caused by carriers on one side of the spectrum and that all steps of the 64QAM constella-tion are equally affected

Signal Analyzer R&S FSQ 7
To handle the large variety of measure-ment tasks in product development, an instrument should provide ample func-tionality and excellent performance in every area of interest. The R&S FSQ has it all.
Full choice of detectors (Fig. 1) for match-ing a wide range of signal types:
RMS AUTO PEAK MAX PEAK MIN PEAK SAMPLE AVERAGE QUASI PEAK (QPK)
The most versatile resolution filter char-acteristics and largest bandwidth found in a spectrum analyzer:
Standard resolution filters from 10 Hz to 50 MHz in steps of 1, 2, 3, 5
FFT filters from 1 Hz to 30 kHz 32 channel filters with bandwidths
from 100 Hz to 5 MHz RRC filters for NADC, TETRA and
3GPP EMI filters 200 Hz, 9 kHz, 120 kHz
Full range of analysis functions:
Time domain power in conjunction with channel or RRC filters make the R&S FSQ a full-fledged channel power meter (Fig. 2)
TOI marker (Fig. 3) Noise/phase noise marker Versatile channel/adjacent-channel
power measurement functions with wide selection of standards; user-configurable (Fig. 4)
Split-screen mode with selectable settings
CCDF measurement function Peak list marker for fast search of all
peaks within the set frequency range (search for spurious)
Shorter development cycles through versatile functions …
4
2
3
1
5

8 Signal Analyzer R&S FSQ
-180
-160
-140
-120
-100
-80
-60
-40
-20
10 Hz 100 Hz 1 kHz 10 kHz 100 kHz 1 MHz 10 MHz
R&S FSQ center frequency 200 MHzR&S FSQ center frequency 1 GHzR&S FSQ center frequency 5 GHzR&S FSQ center frequency 25 GHz
dBc (1 Hz)
Whether in synthesizer development or front-end design, additional applications expand the R&S FSQ functionality while ease-of-use is maintained.
Phase Noise Measurement Software R&S FS-K4 automates measurement over a complete offset frequency range, and determines residual FM from the phase noise characteristic. In conjunction with the extremely low phase noise of the R&S FSQ, this eliminates in many cases the need for an extra phase noise measure-ment system that may even be difficult to operate.
Noise Measurement Software R&S FS-K3 is a convenient tool to determine the noise figure of amplifiers and fre-quency-converting DUTs throughout the frequency range of the R&S FSQ, thus enabling complete documentation. The high linearity and extremely accurate power measurement routines of the R&S FSQ provide precise and reproducible results, making a separate noise figure meter unnecessary.
… wide dynamic range and future-proof performancePhase noise mea-surement using Software R&S FS-K4
Fast and simple analysis of anomalies. The cause – spurious or RFI – can eas-ily be traced with the basic analyzer function without additional measuring equipment.
Noise figuremeasure-
ment usingSoftware
R&S FS-K3
Phase noise of R&S FSQ at various center frequencies

Signal Analyzer R&S FSQ 9
From GSM to UMTS – fit for 3G mobile radio
In conjunction with GSM/EDGE Applica-tion Firmware R&S FS-K5, the R&S FSQ provides complete functionality for RF and modulation measurements in GSM systems. EDGE, which is generation 2.5, is already included in the R&S FS-K5 option. Phase/frequency error for GSM Modulation accuracy for EDGE with:
– EVM and ETSI-conformant weight-ing filters
– OOS– 95:th percentile– Power versus time with
synchronization to midamble– Spectrum due to modulation– Spectrum due to transients
The above features plus the wide dynamic range make the R&S FSQ an ideal tool in base station development and testing. This is enhanced by the excellent features that are provided by the R&S FSQ as standard, such as <0.3 dB total measurement uncertainty, gated sweep function and IF power trig-ger.
Even in its basic version, the R&S FSQ pro-vides the functionality and characteristics needed to develop, verify and manufac-ture 3G mobile radio systems:
RMS detector, provided as standard in Rohde&Schwarz analyzers for many years and allowing accurate power measurements independently of the waveform. 3GPP specifications stipulate RMS power measurements for most tests.
From GSM to UMTS …
Measurement of modulation accuracy on EDGE burst
Measurement of power ramp on EDGE burst
Ref 3 dBm Att 20 dB
Center 890.2 MHz 52.43 µs/
1 SA
CLRWR
2 PK
MAXH
3 MI
MINH
TRG
SWT 524.25 µs
%%
PRN
0
4
8
12
16
20
24
28
32
36
40
Marker 1 [T1]
0.110 %
504.176400 µs
SUMMARY [T1]
PEAK HLD 1.157 %
PEAK AVG 0.642 %
RMS HLD 0.362 %
RMS AVG 0.262 %
FREQ HLD 164.55 Hz
FREQ AVG 163.53 Hz
OOS HLD 39.70 dB
OOS AVG 43.59 dB
PERC HLD 0.630 %
PERC AVG 0.510 %
1

10 Signal Analyzer R&S FSQ
ACP measurement function for 3GPP with 3.84 MHz bandwidth RRC filter for standard-conformant adjacent-channel power measurements with a dynamic range limit of 77.5 dB, or 84 dB with noise correction (one carrier)
Dedicated CCDF measurement func-tion that determines the probability of instantaneous signal power exceed-ing average power. The CCDF mea-surement is indispensable in deter-mining the optimum transmit power for CDMA signals, assuming that clip-ping at known, short intervals is toler-able.
Standard 3GPP modulation and code domain power measure-ments
For BTS/NodeB signals:Application Firmware R&S FS-K72
For UE signals:Application Firmware R&S FS-K73
High measurement speed of1.5 s/measurement typ.
Code domain power and CPICH power EVM and PCDE Code domain power vs. slot EVM/code channel Spectrum emission mask
… fit for 3G mobile radio
Measurement of adjacent-channel power on a 3GPP four-carrier signal with noise correction
WCDMA code domain power measurement with R&S FSQ and R&S FS-K72
1
Tx ChannelBandwidth 3.84 MHz
Adjacent ChannelBandwidth 3.84 MHzSpacing 5 MHz
Alternate ChannelBandwidth 3.84 MHzSpacing 10 MHz
2nd Alternate ChannelBandwidth 3.84 MHzSpacing 15 MHz
Power -15.99 dBm
Lower -77.80 dBUpper 0.34 dB
Lower -81.35 dBUpper 0.41 dB
Lower -83.98 dBUpper 0.45 dB
Ref -22 dBm * Att 5 dBm
* RBW 30 kHz
* VBW 300 kHz
* SWT 25 s
-30-40-50-60-70-80-90
-100-110
1 RM *CLRWR
Center 2117.5 MHz 3.68424 MHz / Span 36.8424 MHz
NOR
A
Marker 1 [T1]
-36.63 dBm
928.640009216 MHz
c13c12
c11
c13
c11
c12
c0c0
cu1cu1
cu2cu2
cu3cu3

Signal Analyzer R&S FSQ 11
Take advantage of networking
Versatile documentation and networking
The standard disk drive makes it easy for you to integrate the measurement results into documentation – simply save the screen contents as a BMP or WMF file and import them into your word processing system. To process trace data, save the data as an ASCII file (CSV format), which not only documents trace data but also the main instrument settings.
Advantage of networkingThe standard LAN interface opens up versatile networking capabilities: Link to standard network
(Ethernet 10/100 BaseT) Running under WindowsNT, the R&S
FSQ can be configured for network operation. Applications such as data output to a central network printer or saving results on a central server can easily be implemented. The R&S FSQ can thus be optimally matched to your work environment.
Screen contents can be imported di-rectly into MS Word for Windows or, by using an MS Excel macro, into your documentation programs. Data sheets for your products or docu-ments for quality assurance can thus immediately be created.
Remote control via Ethernet is even sim-pler. The special RSIB interface links your application to the TCP/IP protocol and acts like an IEC/IEEE bus driver. The RSIB interface is available for Windows and the UNIX world. The R&S FSQ can be pro-grammed via this interface just like on the familiar IEC/IEEE bus.
R&S FSQ in networked operation

12 Signal Analyzer R&S FSQ
Specifications
R&S FSQ3 R&S FSQ8 R&S FSQ26
Specifications apply under the following conditions: 30 minutes warmup time at ambient temperature, specified environmental conditions met, calibration cycle adhered to, and total calibration performed. Data without tolerances: typical values only. Specifications designated nominal apply to design parameters and are not tested. Specification of σ = xx dB refers to standard uncertainty.
FrequencyFrequency range
DC coupledAC coupled
20 Hz to 3.6 GHz1 MHz to 3.6 GHz
20 Hz to 8 GHz1 MHz to 8 GHz
20 Hz to 26.5 GHz10 MHz to 26.5 GHz
Frequency resolution 0.01 Hz
Internal reference frequency (nominal) with standard OCXO
Aging per day1) 1 x 10⁻⁹
Aging per year1) 1 x 10⁻⁷
Temperature drift (0°C to 50°C) 8 x 10⁻⁸
Total error (per year) 1) 2 x 10⁻⁷
Internal reference frequency (nominal); option R&S FSU-B4
Aging per day1) 2 x 10⁻¹⁰
Aging per year1) 3 x 10⁻⁸
Temperature drift (0°C to 50°C) 1 x 10⁻⁹
Total error (per year)1) 5 x 10⁻⁸
External reference frequency 1 MHz to 20 MHz, in 1 Hz steps
Frequency display with marker or frequency counter
Marker resolution 0.1 Hz to 10 kHz (depending on span)
Accuracy (sweep time >3 x auto sweep time)
±(marker frequency x reference error + 0.5% x span + 10% x resolution bandwidth + ½ (last digit))
Frequency counter resolution 0.1 Hz to 10 kHz (selectable)
Count accuracy (S/N >25 dB) ±(frequency x reference error + ½ (last digit))
Frequency span 0 Hz, 10 Hz to 3.6 GHz 0 Hz, 10 Hz to 8 GHz 0 Hz, 10 Hz to 26.5 GHz
Resolution/accuracy of span 0.1 Hz/1%
Spectral purity (dBc (1 Hz)), SSB phase noise, f = 640 MHz
Carrier offset 10 Hz typ. –73 dBc (1 Hz), with option R&S FSU-B4 typ. –86 dBc
100 Hz <–90 dBc (1 Hz), –104 dBc (1 Hz) typ.
1 kHz <–112 dBc (1 Hz), –118 dBc (1 Hz) typ.
10 kHz <–120 dBc (1 Hz), –123 dBc (1 Hz) typ.
100 kHz <–120 dBc (1 Hz), –123 dBc (1 Hz) typ.
1 MHz <–138 dBc (1 Hz), –144 dBc (1 Hz) typ.
10 MHz <–155 dBc (1 Hz) nominal, –160 dBc (1 Hz) typ.
Sweep
Span 0 Hz 1 µs to 16000 s in steps of 5%
Span ≥10 Hz 2.5 ms to 16000 s in steps ≤10%
Max. deviation of sweep time 3%
Measurement in time domain with marker and display lines (resolution 31.25 ns)
Resolution bandwidths
3 dB bandwidths 10 Hz to 20 MHz, in 1/2/3/5 sequence, 50 MHz
Bandwidth accuracy
10 Hz to 100 kHz (digital Gaussian) <3%
200 kHz to 5 MHz (analog Gaussian) <10%
10 MHz, 20 MHz –30% to +10%
50 MHz –30% to + 10% –30% to + 10% for f<3.6 GHz–30% to + 100% for f> 3.6 GHz
Shape factor –60 dB:–3 dB
≤100 kHz <6
200 kHz to 2 MHz <12
3 MHz to 10 MHz <7
20 MHz, 50 MHz <6, nominal
Video bandwidths 1 Hz to 10 MHz, in 1/2/3/5 sequence

Signal Analyzer R&S FSQ 13
FFT filters
6 dB bandwidths 1 Hz to 30 kHz in 1/2/3/5 sequence
Bandwidth accuracy <5%, nominal
Shape factor –60 dB:–3 dB <3, nominal
EMI filters
6 dB bandwidths 200 Hz, 9 kHz and 120 kHz
Bandwidth accuracy <3%, nominal
Shape factor –60 dB:–3 dB <6, nominal
Channel filters
Bandwidth 100; 200; 300; 500 Hz; 1; 1.5; 2; 2.4; 2.7; 3; 3.4; 4; 4.5; 5; 6; 8.5; 9; 10; 12.5; 14; 15; 16; 18 (RRC); 20; 21; 24.3 (RRC); 25; 30; 50;
100; 150; 192; 200; 300; 500 kHz; 1; 1.228; 1.5; 1.516; 2; 3; 5 MHz
Bandwidth accuracy 2%, nominal
Shape factor–60 dB:–3 dB <2, nominal
LevelDisplay range displayed average noise level to 30 dBm
Maximum input level
DC voltage (AC coupled) 50 V
DC voltage (DC coupled) 0 V
RF attenuation 0 dB
CW RF power 20 dBm (=0.3 W)
Pulse spectral density 97 dBµV/MHz
RF attenuation ≥10 dB
CW RF power 30 dBm (=1 W)
Max. pulse voltage 150 V
Max. pulse energy (10 µs) 1 mWs
1 dB compression of input mixer(0 dB RF attenuation)
+13 dBm nominal +13 dBm nominal up to 3.6 GHz
+10 dBm nominal from 3.6 GHz to 8 GHz
+7 dBm nominal from 3.6 GHz to 26 GHz
Intermodulation
Third-order intermodulation distortion
Third-order intercept (TOI), level 2 x –10 dBm, ∆f >5 x RBW or 10 kHz, whichever is larger
>17 dBm, 20 dBm typ.for f=10 MHz to 300 MHz
>20 dBm, 25 dBm typ.for f >300 MHz
>17 dBm, 20 dBm typ.for f=10 MHz to 300 MHz
>20 dBm, 25 dBm typ.for f=300 MHz to 3.6 GHz
>19 dBm, 23 dBm typ.for f=3.6 GHz to 8 GHz
>17 dBm, 20 dBm typ.for f=10 MHz to 300 MHz
>22 dBm, 27 dBm typ.for f=300 MHz to 3.6 GHz
>12 dBm, 15 dBm typ.for f=3.6 GHz to 26.5 GHz
Second harmonic intercept (SHI)
fin ≤100 MHz >35 dBm
100 MHz < fin ≤ 400 MHz >45 dBm, 55 dBm typ.
400 MHz < fin ≤ 500 MHz >52 dBm, 60 dBm typ.
500 MHz < fin ≤ 1 GHz >45 dBm, 55 dBm typ.
1 GHz < fin ≤ 1.8 GHz >35 dBm
fin > 1.8 GHz – >80 dBm (nominal)
Displayed average noise level (0 dB RF attenuation, RBW 10 Hz, VBW 30 Hz, 20 averages, trace average, span 0 Hz, 50 Ω termination)
Frequency20 Hz <–80 dBm
100 Hz <–100 dBm
1 kHz <–110 dBm
10 kHz <–120 dBm
100 kHz <–126 dBm
1 MHz <–136 dBm
10 MHz to 2 GHz <–145 dBm, –148 dBm typ. <–142 dBm, –146 dBm typ.
2 GHz to 3 GHz <–143 dBm, –147 dBm typ. <–140 dBm, –143 dBm typ.
3 GHz to 3.6 GHz <–142 dBm, –146 dBm typ. <–140 dBm, –142 dBm typ.
3.6 GHz to 7 GHz – <–140 dBm, –142 dBm typ. <–141 dBm, –145 dBm typ.
7 GHz to 8 GHz – <–139 dBm, –141 dBm typ. <–141 dBm, –145 dBm typ.
8 GHz to 13 GHz – <–139 dBm, –143 dBm typ.
R&S FSQ3 R&S FSQ8 R&S FSQ26

14 Signal Analyzer R&S FSQ
13 GHz to 18 GHz – <–137 dBm, –141 dBm typ.
18 GHz to 22 GHz – <–135 dBm, –138 dBm typ.
22 GHz to 26.5 GHz – <–133 dBm, –136 dBm typ.
Log level display, RBW <=100 kHz, S/N >20 dB
Maximum dynamic range1 dB compression to DANL (1 Hz) 170 dB
Immunity to interference
Image frequency
f ≤3.6 GHz >90 dB, >110 dB typ.
f >3.6 GHz – >70 dB, 100 dB typ.
Intermediate frequency
f ≤3.6 GHz >90 dB, >110 dB typ.
3.6 GHz ≤ f ≤4.2 GHz – 70 dB typ.
f >4.2 GHz – >70 dB, >90 dB typ.
Spurious responses (f >1 MHz, without input signal, 0 dB attenuation)
<–103 dBm
Other spurious (∆f >100 kHz)
fin <2.3 GHz <–80 dBc (mixer level ≤ –10 dBm)
2.3 GHz ≤ fin <4 GHz <–70 dBc (mixer level ≤ –35 dBm)
4 GHz ≤ fin <26.5 GHz <–80 dBc (mixer level ≤ –10 dBm)
Level display (spectrum mode)
Screen 625 x 500 pixels (one diagram), max. 2 diagrams with independent settings
Logarithmic level axis 1 dB, 10 dB to 200 dB in 10 dB steps
Linear level axis 10% of reference level per level division, 10 divisions or logarithmic scaling
Traces max. 6 with 2 diagrams on screen, max. 3 per diagram
Trace detectors Max Peak, Min Peak, Auto Peak (Normal), Sample, RMS, Average, Quasi Peak
Trace functions Clear/Write, Max Hold, Min Hold, Average
Number of measurement points 625, settable between 155 and 100001 in steps of approx. factor 2
Setting range of reference level
Logarithmic level display –130 dBm to (+5 dBm + RF attenuation), max. 30 dBm, in 0.1 dB steps
Linear level display 7.0 nV to 7.07 V, in steps of 1 %
Units of level axis dBm, dBµV, dBmV, dBµA, dBpW (log level display)µV, mV, µA, mA, pW, nW (linear level display)
Level measurement accuracy
Reference error at 128 MHz,RBW ≤ 100 kHz, reference level –30 dBm,RF attenuation 10 dB
<0.2 (σ = 0.07) dB
Frequency response (DC coupling, RF attenuation ≥10 dB)
10 MHz to 3.6 GHz <0.3 dB (σ = 0.1 dB)2)
3.6 GHz to 8 GHz – <1.5 dB (σ = 0.5 dB)3)
8 GHz to 22 GHz – – <2 dB (σ = 0.7 dB)3)
22 GHz to 26.5 GHz – – <2.5 dB (σ = 0.8 dB)3)
Attenuator (≥5 dB) <0.2 dB (σ = 0.07 dB)
Reference level switching <0.15 dB (σ = 0.05 dB)
Display nonlinearity (20°C to 30°C, mixer level ≤–10 dBm)
Logarithmic level display RBW ≤100 kHz, S/N >20 dB
0 dB to –70 dB <0.1 dB (σ = 0.03 dB)
–70 dB to –90 dB <0.3 dB (σ = 0.1 dB)
Logarithmic level display RBW ≥ 200 kHz, S/N >16 dB
0 dB to –50 dB <0.2 dB (σ = 0.07 dB)
–50 dB to –70 dB <0.5 dB (σ = 0.17 dB)
Linear level display 5% of reference level
R&S FSQ3 R&S FSQ8 R&S FSQ26

Signal Analyzer R&S FSQ 15
Bandwidth switching uncertainty (ref. to RBW = 10 kHz)
10 Hz to 100 kHz –
200 kHz to 10 MHz <0.2 dB (σ = 0.07 dB)
5 MHz to 50 MHz <0.5 dB (σ = 0.15 dB)
FFT 1 Hz to 3 kHz <0.2 dB (σ = 0.07 dB)
Total measurement uncertainty(0 dB to –70 dB, S/N >20 dB, span/RBW <100, 95% confidence level, 20°C to 30°C, mixer level ≤–10 dBm)
<3.6 GHz 0.3 dB for RBW ≤100 kHz0.5 dB for RBW >100 kHz
3.6 GHz to 8 GHz – < 1.5 dB2)
8 GHz to 22 GHz – < 2.0 dB2)
22 GHz to 26.5 GHz – < 2.5 dB2)
I/Q dataGeneral
Sampling rate programmable: 10 kHz to 81.6 MHz in 0.1 Hz steps
ADC resolution 14 bit
I/Q memory 16 Msample each for I and Q data
RF path
Max. information bandwidth 28 MHz
Harmonic distortion(with full-scale input signal)
<–70 dBc typ.
3rd order distortion (with two input tones 6 dB below full scale)
<–80 dBc typ.
LO feedthrough (fI/Q = 81.6 MHz – fcenter) (mixer level = –10 dBm)
<–65 dBfs typ.
Aliased DC offset (fI/Q = 20.4 MHz, within ±10 K temperature change after I/Q or total calibra-tion)
<–65 dBfs typ.
Frequency response (within 2/3 RBW; RBW = 3, 5, 10, 20, 50 MHz)
f ≤3.6 GHz 0.3 dB typ.
f >3.6 GHz – 0.5 dB typ.
Linear phase error (within 2/3 RBW; RBW = 3, 5, 10, 20, 50 MHz)
f ≤3.6 GHz 1° dB typ.
f >3.6 GHz 2° dB typ.
Audio demodulationModulation modes AM and FM
Audio output loudspeaker and headphones output
Marker hold time in spectrum mode 100 ms to 60 s
Trigger functionsTrigger
Span ≥10 Hz
Trigger source free run, video, external, IF level (selectable, mixer level 10 dBm to −50 dBm)
Trigger offset 125 ns to 100 s, resolution 125 ns min. (or 1% of offset)
Span = 0 Hz
Trigger source free run, video, external, IF level (mixer level 10 dBm to −50 dBm)
Trigger offset ±(125 ns to 100 s), resolution 125 ns min., dependent on sweep time
Trigger offset accuracy ± (125 ns + (0.1% x delay time))
Gated sweep
Trigger source external, IF level, video
Gate delay 1 µs to 100 s
Gate length 125 ns to 100 s, resolution 125 ns min. or 1% of gate length
Gate length accuracy ±(125 ns + (0.05% x gate length))
R&S FSQ3 R&S FSQ8 R&S FSQ26
Signal Analyzer R&S FSQ 16
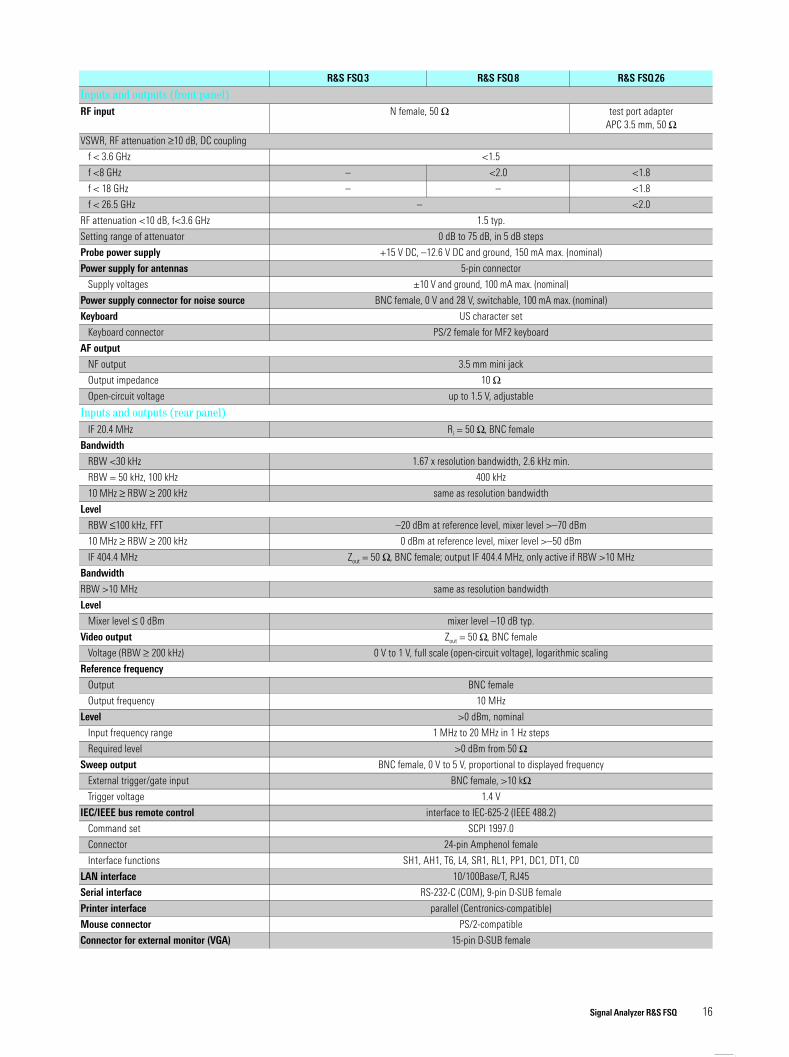
Inputs and outputs (front panel)RF input N female, 50 Ω test port adapter
APC 3.5 mm, 50 ΩVSWR, RF attenuation ≥10 dB, DC coupling
f < 3.6 GHz <1.5
f <8 GHz – <2.0 <1.8
f < 18 GHz – – <1.8
f < 26.5 GHz – <2.0
RF attenuation <10 dB, f<3.6 GHz 1.5 typ.
Setting range of attenuator 0 dB to 75 dB, in 5 dB steps
Probe power supply +15 V DC, –12.6 V DC and ground, 150 mA max. (nominal)
Power supply for antennas 5-pin connector
Supply voltages ±10 V and ground, 100 mA max. (nominal)
Power supply connector for noise source BNC female, 0 V and 28 V, switchable, 100 mA max. (nominal)
Keyboard US character set
Keyboard connector PS/2 female for MF2 keyboard
AF output
NF output 3.5 mm mini jack
Output impedance 10 Ω Open-circuit voltage up to 1.5 V, adjustable
Inputs and outputs (rear panel)IF 20.4 MHz Ri = 50 Ω, BNC female
Bandwidth
RBW <30 kHz 1.67 x resolution bandwidth, 2.6 kHz min.
RBW = 50 kHz, 100 kHz 400 kHz
10 MHz ≥ RBW ≥ 200 kHz same as resolution bandwidth
Level
RBW ≤100 kHz, FFT –20 dBm at reference level, mixer level >–70 dBm
10 MHz ≥ RBW ≥ 200 kHz 0 dBm at reference level, mixer level >–50 dBm
IF 404.4 MHz Zout = 50 Ω, BNC female; output IF 404.4 MHz, only active if RBW >10 MHz
Bandwidth
RBW >10 MHz same as resolution bandwidth
Level
Mixer level ≤ 0 dBm mixer level –10 dB typ.
Video output Zout = 50 Ω, BNC female
Voltage (RBW ≥ 200 kHz) 0 V to 1 V, full scale (open-circuit voltage), logarithmic scaling
Reference frequency
Output BNC female
Output frequency 10 MHz
Level >0 dBm, nominal
Input frequency range 1 MHz to 20 MHz in 1 Hz steps
Required level >0 dBm from 50 ΩSweep output BNC female, 0 V to 5 V, proportional to displayed frequency
External trigger/gate input BNC female, >10 kΩTrigger voltage 1.4 V
IEC/IEEE bus remote control interface to IEC-625-2 (IEEE 488.2)
Command set SCPI 1997.0
Connector 24-pin Amphenol female
Interface functions SH1, AH1, T6, L4, SR1, RL1, PP1, DC1, DT1, C0
LAN interface 10/100Base/T, RJ45
Serial interface RS-232-C (COM), 9-pin D-SUB female
Printer interface parallel (Centronics-compatible)
Mouse connector PS/2-compatible
Connector for external monitor (VGA) 15-pin D-SUB female
R&S FSQ3 R&S FSQ8 R&S FSQ26

Signal Analyzer R&S FSQ 17
General specificationsDisplay 21 cm TFT LCD colour display (8.4")
Resolution 800 x 600 pixels (SVGA resolution)
Pixel failure rate <1 x 10⁻⁵
Mass memory 1.44 Mbyte 3½ " disk drive, hard disk
Temperature ranges
Operating temperature range +5°C to +40°C
Permissible temperature range +0°C to +50°C
Storage temperature range –40°C to +70°C
Damp heat +40°C at 95% relative humidity (DIN EN 60068-2-3)
Mechanical resistance
Vibration, sinusoidal 5 Hz to 150 Hz, max. 2 g at 55 Hz; 0.5 g const. from 55 Hz to 150 Hz; meets DIN EN 60068-2-6, DIN EN 60068-2-3, IEC 61010, MIL-T-28800D, class 5
Vibration, random 10 Hz to 100 Hz, acceleration 1 g (rms)
Shock 40 g shock spectrum, meets MIL-STD-810C and MIL-T-28800D, classes 3 and 5
Recommended calibration interval 2 years for operation with external reference, 1 year with internal reference
RFI suppression meets EMC directives of EU (89/336/EEC) and German EMC law
Power supply
AC supply 100 V to 240 V AC, 3.1 A to 1.3 A, 50 Hz to 400 Hz, protection class I to VDE 411
Power consumption 130 VA typ. 150 VA typ
Safety meets EN 61010-1, UL 3111-1, CSA C22.2 No. 1010-1
Test mark VDE, GS, CSA, CSA-NRTL
Dimensions in mm (W x H x D) 435 x 192 x 460
Weight 14.6 kg 15.4 kg 15.6 kg
1) After 30 days of continuous operation.2) Valid for temperature range 20 °C to 30 °C, <0.6 dB for temperature range 5 °C to 45 °C.3) Valid for temperature range 20 °C to 30 °C and span <1 GHz; add <0.5 dB for temperature range 5 °C to 45 °C or span >1 GHz.
R&S FSQ3 R&S FSQ8 R&S FSQ26
Certified Environmental System
ISO 14001REG. NO 1954
Certified Quality System
ISO 9001DQS REG. NO 1954

Prin
ted
in G
erm
any
0702
(Bi a
s/w
e)
ROHDE&SCHWARZ GmbH & Co. KG ⋅ Mühldorfstraße 15 ⋅ 81671 München ⋅ Germany ⋅ P.O.B. 8014 69 ⋅ 81614 München ⋅ Germany ⋅ Telephone +49 89 4129-0
www.rohde-schwarz.com ⋅ Customer Support: Tel. +49 1805124242, Fax +49 89 4129-13777, E-mail: [email protected]
PD 0
757.
7652
.21
⋅ Sig
nal A
naly
zer R
&S F
SQ ⋅
Trad
e na
mes
are
trad
emar
ks o
f the
ow
ners
⋅ Su
bjec
t to
chan
ge ⋅
Data
with
out t
oler
ance
s: ty
pica
l val
ues
Optional Electronic Attenuator R&S FSU-B25
Ordering information
Frequency
Frequency range
R&S FSQ 3R&S FSQ 8R&S FSQ26
10 MHz to 3.6 GHz 10 MHz to 8 GHz
10 MHz to 3.6 GHz
Setting range
Electronic attenuator 0 dB to 30 dB, 5 dB steps
Preamplifier 20 dB, switchable
Level measurement accuracy
Frequency response, with preamplifier or electronic attenuator
10 MHz to 50 MHz 50 MHz to 3.6 GHz3.6 GHz to 8 GHz
<1 dB<0.6 dB<2.0 dB
Reference accuracy at 128 MHz, RBW ≤ 100 kHz, reference level –30 dBm, RF attenuation 10 dB
Electronic attenuator <0.3 dB
Preamplifier <0.3 dB
Displayed average noise level
RBW = 1 kHz, VBW = 3 kHz, zero span, sweep time 50 ms, 20 averages, mean marker, normalized to 10 Hz RBW
Preamplifier on
10 MHz to 2.0 GHz 2.0 GHz to 3.6 GHz3.6 GHz to 8.0 GHz
<–152 dBm<–150 dBm<–147 dBm
With the R&S FSU-B25 option built-in, the DANL values of the basic units degrade by (R&S FSU-B25 off):
20 Hz to 3.6 GHz3.6 GHz to 8 GHz
1 dB2 dB
Preamplifier off, electronic attenuator 0 dB
20 Hz to 3.6 GHz3.6 GHz to 8 GHz
2.5 dB typ.3.5 dB typ.
Intermodulation
Third-order intermodulation, third-order intercept (TOI), electronic attenuator on, ∆f >5 x RBW or 10 kHz
10 MHz to 300 MHz 300 MHz to 3.6 GHz3.6 GHz to 8 GHz
>17 dBm>20 dBm>18 dBm
Order designation Type Order No.
Signal Analyzer 20 Hz to 3.6 GHz R&S FSQ3 1155.5001.03
Signal Analyzer 20 Hz to 8 GHz R&S FSQ8 1155.5001.08
Signal Analyzer 20 Hz to 26.5 GHz R&S FSQ26 1155.5001.26
Accessories suppliedPower cable, operating manual, service manual, R&S FSQ26: test port adapter 3.5 mm female (1021.0512.00) and N female (1021.0535.00) connector
Options
Recommended extras
Order designation Type Order No.
Options
Highly Accurate Reference Frequency R&S FSU-B4 1144.9000.02
External Generator Control R&S FSP-B10 1129.7246.02
Electronic Attenuator 0 dB to 30 dB and 20 dB Preamplifier R&S FSU-B25 1144.9298.02
Software
Noise Measurement Software R&S FS-K3 1057.3028.02
Phase Noise Measurement Software R&S FS-K4 1108.0088.02
GSM/EDGE Application Firmware R&S FS-K5 1141.1496.02
FM Measurement Demodulator R&S FS-K7 1141.1796.02
3GPP BTS/NodeB FDD Application Firmware
R&S FS-K72 1154.7000.02
WLAN Application Software on request
Order designation Type Order No.
Headphones – 0708.9010.00
US Keyboard with trackball R&S PSP-Z2 1091.4100.02
PS/2 Mouse R&S FSE-Z2 1084.7043.02
Colour Monitor, 17", 230 V R&S PMC3 1082.6004.04
IEC/IEEE Bus Cable, 1 m R&S PCK 0292.2013.10
IEC/IEEE Bus Cable, 2 m R&S PCK 0292.2013.20
19 " Rack Adapter R&S ZZA-411 1096.3283.00
Adapter for mounting on telescopic rails (only with 19" Adapter ZZA-411)
R&S ZZA-T45 1109.3774.00
Matching Pads, 75 ΩL Section R&S RAM 0358.5414.02
Series Resistor, 25 Ω R&S RAZ 0358.5714.02
SWR Bridges
SWR Bridge, 5 MHz to 3 GHz R&S ZRB2 0373.9017.52
SWR Bridge, 40 kHz to 4 GHz R&S ZRC 1039.9492.52
High-Power Attenuators, 100 W
3/6/10/20/30 dB R&S RBU 100 1073.8820.XX(XX=03/06/10/20/30)
High-Power Attenuators, 50 W
3/6/10/20/30 dB R&S RBU 50 1073.8895.XX (XX=03/06/10/20/30)