POWER QUALITY ANALYZER - Hioki
158
POWER QUALITY Quick Start Manual 3196 January 2009 Revised edition 10 3196A981-10 09-01H ANALYZER
-
Upload
khangminh22 -
Category
Documents
-
view
2 -
download
0
Transcript of POWER QUALITY ANALYZER - Hioki

POWER QUALITY
Quick Start Manual
3196
January 2009 Revised edition 10 3196A981-10 09-01H
ANALYZER


Contents
i
1
2
3
4
5
6
7
8
9
10
11
APPX
IDX
Contents
Introduction .................................................................. 1Standard Accessories and Options .............................. 1Safety Notes ................................................................ 4Usage Notes ................................................................ 7Reading the Operation Procedures ........................... 12
1 Overview 13
1.1 Product Overview ............................................. 131.2 Features ........................................................... 14
2 Parts Names 19
2.1 Instrument Labels and Functions ..................... 202.2 Screen Names and Display Elements .............. 24
2.2.1 Common Display Elements ...............................25
3 Measurement Preparations 29
3.1 Connection Procedure ...................................... 293.2 Attaching the Strap ........................................... 303.3 Installing the Battery Pack ................................ 313.4 Connecting the AC Adapter .............................. 323.5 Connecting the Voltage Cords ......................... 333.6 Wiring Adapter Connection (Option) ................ 353.7 Using a Clamp-On Sensor (Option) ................. 37
3.7.1 Clamp-On Sensor Specifications .......................383.7.2 Connecting a Clamp-on Sensor ........................41
3.8 Turning the Power On/Off ................................ 42

Contents
Quick Start Manualii
4 Connecting to Lines to be Measured 45
4.1 Connection Procedure ...................................... 454.2 Connection Methods ........................................ 46
4.2.1 Single-Phase System Connections ...................474.2.2 Connecting to Multiple Systems ........................49
5 Quick Reference 51
5.1 Connection and System Settings ..................... 515.2 Data Display ..................................................... 525.3 Data Recording, Saving, Loading and Deleting 535.4 Event Analysis .................................................. 545.5 Using Peripheral Devices ................................. 55
6 Measurement Method 57
6.1 Checking Three-phase Systems ...................... 576.2 Change in Power .............................................. 646.3 Harmonic Fluctuation ....................................... 706.4 Monitoring Interruptions .................................... 786.5 Detecting Transients and Waveform Distortion 886.6 ΔV10 Flicker ..................................................... 966.7 IEC Flicker ...................................................... 102
7 Peripheral Devices 109
7.1 Using a PC Card ............................................ 1097.2 Using a Printer (Option) .................................. 1167.3 Using the Instrument with a Computer ........... 121
7.3.1 RS-232C Connection .......................................1227.3.2 LAN Connection ..............................................123
7.4 Using the External Control Terminals ............. 124

Contents
iii
1
2
3
4
5
6
7
8
9
10
11
APPX
IDX
8 Specifications 125
9 Maintenance and Service 137
9.1 Cleaning and Storage ..................................... 1379.2 Repair and Servicing ...................................... 1389.3 Battery Pack Charging ................................... 1399.4 Battery Pack Replacement and Disposal ....... 1409.5 Instrument Disposal ........................................ 141
Appendix 143
Troubleshooting ....................................................... 143FAQ .......................................................................... 145Reference ................................................................ 146

Contents
Quick Start Manualiv

Introduction
0
1
Introduction1
1
2
3
4
5
6
7
8
9
1
1
Introduction
Thank you for purchasing the HIOKI “3196 POWER QUALITY ANA-LYZER”. To obtain maximum performance from the product, pleaseread this manual first, and keep it handy for future reference.
• Refer to the Instruction Manual (CD-R version) provided with thisdevice.
• For current input with this device, a clamp-on sensor (optional) isrequired. For details, refer to the instruction manual for theclamp-on sensor you are using.
• For detailed information on the EN50160, see the InstructionManual for EN50160.
• The Models 9624, 9624-10 and 9624-50 are afterwards referredto as the “PQA-HiVIEW series”.
Standard Accessories and Options
Checking the contents of the packageWhen you receive the product, inspect it carefully to ensure that nodamage occurred during shipping. In particular, check the accesso-ries, panel switches, and connectors. If damage is evident, or if itfails to operate according to the specifications, contact your dealeror Hioki representative.
9458 AC ADAPTER(power cord included)
Input Cord Label(For distinguishing the voltage cord and clamp-on sensor channels.)
9438-02 VOLTAGE CORD1 set (8 cords)(One each red, yellow, blue, and gray cord, and four black cords.)
Strap
3196 POWER QUALITY ANALYZER
• Quick Start Manual• Instruction Manual
for EN50160
Software (CD-R)• Instruction Manual• Instruction Manual for EN50160• "Down96" Data Download
Application Software(The latest version can be downloaded from our web site.)
LAN Connector Cover
9459 BATTERY PACK(7.2 V, 2700 mAh)
Standard Accessories and Options
2 Quick Start Manual
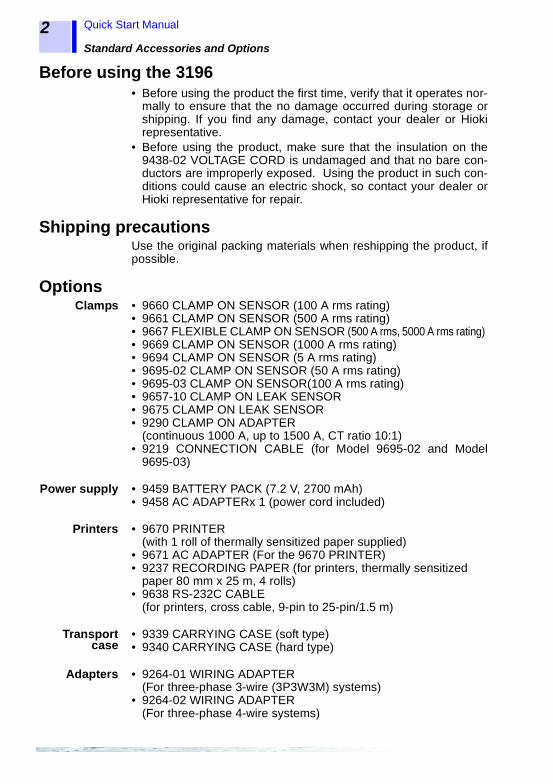
Before using the 3196• Before using the product the first time, verify that it operates nor-
mally to ensure that the no damage occurred during storage orshipping. If you find any damage, contact your dealer or Hiokirepresentative.
• Before using the product, make sure that the insulation on the9438-02 VOLTAGE CORD is undamaged and that no bare con-ductors are improperly exposed. Using the product in such con-ditions could cause an electric shock, so contact your dealer orHioki representative for repair.
Shipping precautionsUse the original packing materials when reshipping the product, ifpossible.
OptionsClamps • 9660 CLAMP ON SENSOR (100 A rms rating)
• 9661 CLAMP ON SENSOR (500 A rms rating) • 9667 FLEXIBLE CLAMP ON SENSOR (500 A rms, 5000 A rms rating) • 9669 CLAMP ON SENSOR (1000 A rms rating)• 9694 CLAMP ON SENSOR (5 A rms rating)• 9695-02 CLAMP ON SENSOR (50 A rms rating)• 9695-03 CLAMP ON SENSOR(100 A rms rating)• 9657-10 CLAMP ON LEAK SENSOR• 9675 CLAMP ON LEAK SENSOR• 9290 CLAMP ON ADAPTER
(continuous 1000 A, up to 1500 A, CT ratio 10:1)• 9219 CONNECTION CABLE (for Model 9695-02 and Model
9695-03)
Power supply • 9459 BATTERY PACK (7.2 V, 2700 mAh)• 9458 AC ADAPTERx 1 (power cord included)
Printers • 9670 PRINTER(with 1 roll of thermally sensitized paper supplied)
• 9671 AC ADAPTER (For the 9670 PRINTER)• 9237 RECORDING PAPER (for printers, thermally sensitized
paper 80 mm x 25 m, 4 rolls)• 9638 RS-232C CABLE
(for printers, cross cable, 9-pin to 25-pin/1.5 m)
Transportcase
• 9339 CARRYING CASE (soft type)• 9340 CARRYING CASE (hard type)
Adapters • 9264-01 WIRING ADAPTER(For three-phase 3-wire (3P3W3M) systems)
• 9264-02 WIRING ADAPTER(For three-phase 4-wire systems)

Standard Accessories and Options
0
1
Standard A
ccessories and Options
3
1
2
3
4
5
6
7
8
9
1
1
Otherperipherals
• 9726 PC CARD 128M (128MB compact flash card + adapter)• 9727 PC CARD 256M (256MB compact flash card + adapter)• 9728 PC CARD 512M (512MB compact flash card + adapter)• 9642 LAN CABLE (5 m, straight-through cable, crossover
adapter included)• 9444 CONNECTION CABLE (for RS-232C, Straight-through
cable)• XD112 GPS BOX
Software 9624-50 PQA-HiVIEW PRO (PC application software)
9624 PQA-HiVIEW (PC application software) *9624-10 PQA-HiVIEW PRO (PC application software) **:discontinued product

Safety Notes
4 Quick Start Manual
Safety Notes
Safety SymbolsThis manual contains information and warnings essential for safeoperation of the product and for maintaining it in safe operatingcondition. Before using the product, be sure to carefully read thefollowing safety notes.
This instrument is designed to comply with IEC 61010 SafetyStandards, and has been thoroughly tested for safety prior toshipment. However, mishandling during use could result ininjury or death, as well as damage to the instrument. How-ever, using the instrument in a way not described in thismanual may negate the provided safety features.Be certain that you understand the instructions and precau-tions in the manual before use. We disclaim any responsibil-ity for accidents or injuries not resulting directly frominstrument defects.
In the manual, the symbol indicates particularlyimportant information that the user should read beforeusing the product.
The symbol printed on the product indicates that theuser should refer to a corresponding topic in the manual
(marked with the symbol) before using the relevantfunction.
Indicates a double-insulated device.
Indicates AC (Alternating Current).
Indicates DC (Direct Current).
Indicates both DC (Direct Current) and AC (AlternatingCurrent).
Indicates a grounding terminal.
Indicates the ON side of the power switch.
Indicates the OFF side of the power switch.

Safety Notes
0
1
Safety N
otes5
1
2
3
4
5
6
7
8
9
1
1
The following symbols in this manual indicate the relative impor-tance of cautions and warnings.
Other Symbols
AccuracyWe define measurement tolerances in terms of f.s. (full scale) andrdg. (reading) with the following meanings:
f.s. (maximum display value or scale length)The maximum displayable value or the full length of the scale. This is usually the maximum value of the currently selected range.
rdg. (reading or displayed value)The value currently being measured and indicated on the measur-ing product.
Indicates that incorrect operation presents anextreme hazard that could result in serious injury ordeath to the user.
Indicates that incorrect operation presents a signifi-cant hazard that could result in serious injury ordeath to the user.
Indicates that incorrect operation presents a possi-bility of injury to the user or damage to the product.
Advisory items related to performance or correctoperation of the product.
Indicates the prohibited action.
❖ Indicates the reference.
Indicates quick references for operation and reme-dies for troubleshooting.
* Indicates terminology explained at the bottom ofthe page.

Safety Notes
6 Quick Start Manual
Measurement categories (Overvoltage categories)
This instrument complies with CAT III safety requirements.To ensure safe operation of measurement instruments, IEC 61010establishes safety standards for various electrical environments,categorized as CAT I to CAT IV, and called measurement catego-ries. These are defined as follows.
Higher-numbered categories correspond to electrical environmentswith greater momentary energy. So a measurement devicedesigned for CAT III environments can endure greater momentaryenergy than a device designed for CAT II.Using a measurement instrument in an environment designatedwith a higher-numbered category than that for which the instrumentis rated could result in a severe accident, and must be carefullyavoided.Never use a CAT I measuring instrument in CAT II, III, or IV envi-ronments.The measurement categories comply with the Overvoltage Catego-ries of the IEC60664 Standards.
CAT I Secondary electrical circuits connected to an AC elec-trical outlet through a transformer or similar device.
CAT II Primary electrical circuits in equipment connected toan AC electrical outlet by a power cord (portable tools,household appliances, etc.)
CAT III Primary electrical circuits of heavy equipment (fixedinstallations) connected directly to the distributionpanel, and feeders from the distribution panel to out-lets.
CAT IV The circuit from the service drop to the serviceentrance, and to the power meter and primary over-current protection device (distribution panel).

Usage Notes
0
1
Usage N
otes7
1
2
3
4
5
6
7
8
9
1
1
Usage Notes
Follow these precautions to ensure safe operation and to obtainthe full benefits of the various functions.
To avoid electric shock• To avoid electric shock, do not allow the product to get wet,
and do not use it when your hands are wet.• To avoid electric shock when measuring live lines, wear
appropriate protective gear, such as insulated rubbergloves, boots and a safety helmet.
• Before turning the product on, make sure the source volt-age matches that indicated on the product's power connec-tor. Connection to an improper supply voltage may damagethe product and present an electrical hazard.
• Use only the supplied Model 9458 AC ADAPTER. ACadapter input voltage range is 100 to 240 VAC (with ±10%stability) at 50/60 Hz. To avoid electrical hazards and dam-age to the product, do not apply voltage outside of thisrange.
• Turn the product off before connecting the AC adapter tothe product and to AC power.
• For battery operation, use only the HIOKI Model 9459 BAT-TERY PACK. We cannot accept responsibility for accidentsor damage related to the use of any other batteries.
• Do not use the product where it may be exposed to corro-sive or combustible gases. The product may be damagedor cause an explosion.
AC 100 V to 240 V
Use the 9458 AC ADAPTER or 9459 BATTERY PACK.
Do not touch with bare hands.
Do not get wet.
Check the voltage.

Usage Notes
8 Quick Start Manual
*IP30:This indicates the degree of protection provided by the enclosureof the device against use in hazardous locations, entry of solid for-eign objects, and the ingress of water."3":Protected against access to hazardous parts with tools more
than 2.5 mm in diameter. The equipment inside the enclosure is protected against entry by solid foreign objects larger than 2.5 mm in diameter.
"0":The equipment inside the enclosure is not protected against the harmful effects of water.
• This product is designed for indoor use, and operates reliablyfrom 0°C to 40°C. It can be used in the temperature range -10°Cto 0°C, but LCD operation and accuracy are not assured. Fur-ther, 9459 BATTERY PACK and PC Card operation are notguaranteed.
• Do not store or use the product where it could be exposed todirect sunlight, high temperature or humidity, or condensation.Under such conditions, the product may be damaged and insu-lation may deteriorate so that it no longer meets specifications.
• The protection rating for the enclosure of this device (based onEN60529) is *IP30.This product is not designed to be entirely water- or dust-proof.To avoid damage, do not use it in a wet or dusty environment.
• Do not use the product near a device that generates a strongelectromagnetic field or electrostatic charge, as these maycause erroneous measurements.
Setting up the 3196
Avoid the follow-ing:
Direct sunlight
High temper-ature High humidity
Dust
Electomagnetic radiation
Corrosive or explosive gases
• To avoid damage to the product, protect it from vibration orshock during transport and handling, and be especially careful toavoid dropping.
• Be careful to avoid dropping the clamps or otherwise subjectingthem to mechanical shock, which could damage the mating sur-faces of the core and adversely affect measurement.
Handling this device

Usage Notes
0
1
Usage N
otes9
1
2
3
4
5
6
7
8
9
1
1
Connect the clamp-on sensors or voltage cords to the instru-ment first, and then to the active lines to be measured.Observe the following to avoid electric shock and short cir-cuits.• To avoid short circuits and potentially life-threatening haz-
ards, never attach the clamp to a circuit that operates atmore than the maximum rated voltage to earth (1000 VAC:9667, 600 VAC: 9661, 9669, 300 VAC: 9660, 9694, 9695-02,9695-03, 9657-10, 9675), or over bare conductors.
• Clamp sensor and voltage cable should only be connectedto the secondary side of a breaker, so the breaker can pre-vent an accident if a short circuit occurs. Connectionsshould never be made to the primary side of a breaker,because unrestricted current flow could cause a seriousaccident if a short circuit occurs.
• Do not allow the voltage cable clips to touch two wires atthe same time. Never touch the edge of the metal clips.
• Use only the supplied 9438-02 VOLTAGE CORD to connectthe product input terminals to the circuit to be tested.
• When the clamp sensor is opened, do not allow the metalpart of the clamp to touch any exposed metal, or to shortbetween two lines, and do not use over bare conductors.
Using the clamp-on sensors and voltage
• Be careful when handling the cords, since the conductorbeing measured may become very hot.
• To avoid electrocution, turn off the power to all devicesbefore plugging or unplugging any of the interface connec-tors.
Handling the cords

Usage Notes
10 Quick Start Manual
• To avoid damaging the power cord, grasp the plug, not the cord,when unplugging the cord or AC adapter from the power outlet.
• To avoid damaging the voltage cords or clamp sensor cables, donot bend or pull near their ends.
• Avoid stepping on or pinching the cable, which could damagethe cable insulation.
• Keep the cables well away from heat sources, as bare conduc-tors could be exposed if the insulation melts.
• When disconnecting the BNC connector, be sure to release thelock before pulling off the connector. Forcibly pulling the connec-tor without releasing the lock, or pulling on the cable, can dam-age the connector.
• Failure to fasten the connectors properly may result is sub-spec-ification performance or damage to the equipment.
Maximum input voltage and maximum rated voltageto earth.• The maximum input voltage of the product is 780 Vrms,
1103 V peak. Do not measure the voltage exceeding that. Itcauses the personal injury as well as damages the product.
• The maximum rated voltage to earth of the product is 600Vrms. Do not measure the voltage to earth exceeding that.It causes the personal injury as well as damages the prod-uct.
• The maximum rated voltage to earth of clamp sensordepends on the type of clamp sensor used. To avoid elec-tric shock, refer to the instruction manual of a clamp sen-sor used.
Input
Usage Notes
0
1
Usage N
otes11
1
2
3
4
5
6
7
8
9
1
1
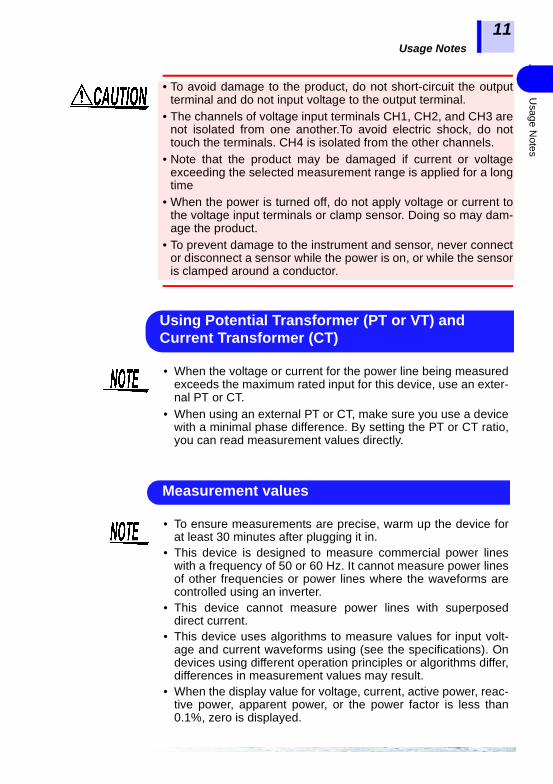
• To avoid damage to the product, do not short-circuit the outputterminal and do not input voltage to the output terminal.
• The channels of voltage input terminals CH1, CH2, and CH3 arenot isolated from one another.To avoid electric shock, do nottouch the terminals. CH4 is isolated from the other channels.
• Note that the product may be damaged if current or voltageexceeding the selected measurement range is applied for a longtime
• When the power is turned off, do not apply voltage or current tothe voltage input terminals or clamp sensor. Doing so may dam-age the product.
• To prevent damage to the instrument and sensor, never connector disconnect a sensor while the power is on, or while the sensoris clamped around a conductor.
• When the voltage or current for the power line being measuredexceeds the maximum rated input for this device, use an exter-nal PT or CT.
• When using an external PT or CT, make sure you use a devicewith a minimal phase difference. By setting the PT or CT ratio,you can read measurement values directly.
Using Potential Transformer (PT or VT) and Current Transformer (CT)
• To ensure measurements are precise, warm up the device forat least 30 minutes after plugging it in.
• This device is designed to measure commercial power lineswith a frequency of 50 or 60 Hz. It cannot measure power linesof other frequencies or power lines where the waveforms arecontrolled using an inverter.
• This device cannot measure power lines with superposeddirect current.
• This device uses algorithms to measure values for input volt-age and current waveforms using (see the specifications). Ondevices using different operation principles or algorithms differ,differences in measurement values may result.
• When the display value for voltage, current, active power, reac-tive power, apparent power, or the power factor is less than0.1%, zero is displayed.
Measurement values

Reading the Operation Procedures
12 Quick Start Manual
Reading the Operation Procedures
Indicates the operation keys.
Indicates the screen name selected using the DF key.
Indicates a display item that can be moved using the cursor key or an item selection.
HARDWARE RS-232
0
1
Overview
1.1 Product Overview
13
1
2
3
4
5
6
7
8
9
1
1
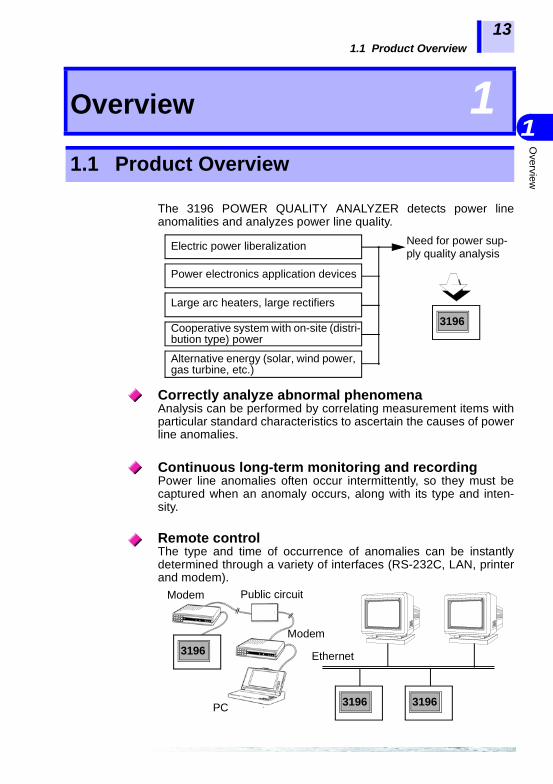
The 3196 POWER QUALITY ANALYZER detects power lineanomalities and analyzes power line quality.
Correctly analyze abnormal phenomenaAnalysis can be performed by correlating measurement items withparticular standard characteristics to ascertain the causes of powerline anomalies.
Continuous long-term monitoring and recordingPower line anomalies often occur intermittently, so they must becaptured when an anomaly occurs, along with its type and inten-sity.
Remote controlThe type and time of occurrence of anomalies can be instantlydetermined through a variety of interfaces (RS-232C, LAN, printerand modem).
Overview 11.1 Product Overview
Need for power sup-ply quality analysis
Electric power liberalization
Power electronics application devices
Large arc heaters, large rectifiers
Cooperative system with on-site (distri-bution type) power
Alternative energy (solar, wind power, gas turbine, etc.)
3196
3196
3196 3196
Ethernet
Public circuitModem
Modem
PC

1.2 Features
14 Quick Start Manual
Safe designDesigned to comply with safety standard EN61010-1:2001.
Supports a variety of power linesMeasures single-phase 2-wire, single-phase 3-wire, three-phase 3-wire and three-phase 4-wire systems.An extra input channel is provided for uses such as measuringpower lines of a second system, for DC voltage measurement orfor measuring a neutral line.
Simultaneous measurement of multiple elements ofpower supply qualityMultiple power supply quality parameters can be selected asdesired for simultaneous measurement. 1. High speed voltage quality parameter
Transient overvoltage (impulse)2. RMS voltage quality parameters
Voltage swell (surge), voltage dip (sag), voltage interruption3. Power quality parameters
Frequency, voltage, current, active power, apparent power, reac-tive power, power factor (displacement power factor)
4. 3-Phase quality parametersVoltage unbalance factor, current unbalance factor
5. Harmonic quality parametersHarmonic voltage, current and power; inter-harmonic voltageand current; harmonic voltage and current phase angle; totalharmonic voltage and current distortion factors (THD-F, THD-R);total inter-harmonic voltage and current distortion factors (THD-F, THD-R)
6. Other parametersK factor, flicker
High-speed impulse detection and waveform displayfunctionFour voltage channels are sampled at 2 MS/s, so high-speeddetection and waveform display can be performed at up to 0.5 µsand high voltage (2000 Vpk transient overvoltage (impulse)).
ΔV10 Flicker, IEC flicker measurementSelect either IEC flicker (Pst,Plt) regulated by international stan-dards, or ΔV10 Flicker commonly used in Japan, and measure withpower quality parameters.
1.2 Features
0
1
Overview
1.2 Features
15
1
2
3
4
5
6
7
8
9
1
1
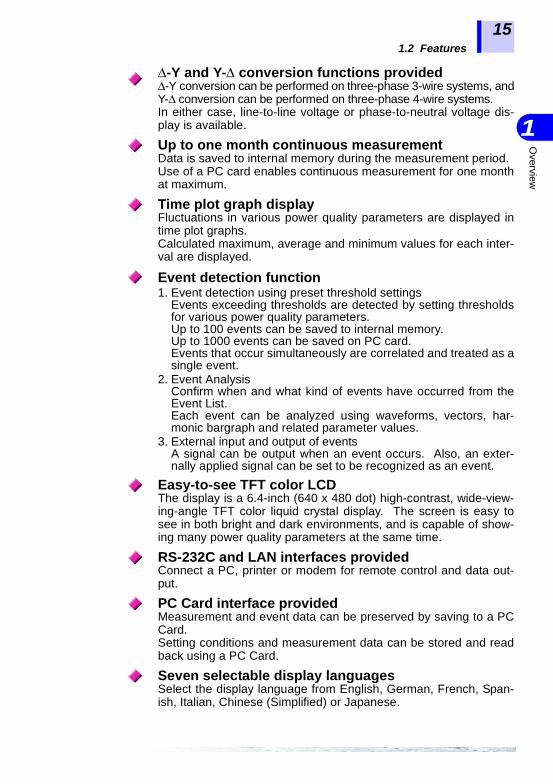
Δ-Y and Y-Δ conversion functions providedΔ-Y conversion can be performed on three-phase 3-wire systems, andY-Δ conversion can be performed on three-phase 4-wire systems. In either case, line-to-line voltage or phase-to-neutral voltage dis-play is available.
Up to one month continuous measurementData is saved to internal memory during the measurement period.Use of a PC card enables continuous measurement for one monthat maximum.
Time plot graph displayFluctuations in various power quality parameters are displayed intime plot graphs. Calculated maximum, average and minimum values for each inter-val are displayed.
Event detection function1. Event detection using preset threshold settings
Events exceeding thresholds are detected by setting thresholdsfor various power quality parameters. Up to 100 events can be saved to internal memory. Up to 1000 events can be saved on PC card.Events that occur simultaneously are correlated and treated as asingle event.
2. Event AnalysisConfirm when and what kind of events have occurred from theEvent List.Each event can be analyzed using waveforms, vectors, har-monic bargraph and related parameter values.
3. External input and output of eventsA signal can be output when an event occurs. Also, an exter-nally applied signal can be set to be recognized as an event.
Easy-to-see TFT color LCDThe display is a 6.4-inch (640 x 480 dot) high-contrast, wide-view-ing-angle TFT color liquid crystal display. The screen is easy tosee in both bright and dark environments, and is capable of show-ing many power quality parameters at the same time.
RS-232C and LAN interfaces provided Connect a PC, printer or modem for remote control and data out-put.
PC Card interface providedMeasurement and event data can be preserved by saving to a PCCard. Setting conditions and measurement data can be stored and readback using a PC Card.
Seven selectable display languagesSelect the display language from English, German, French, Span-ish, Italian, Chinese (Simplified) or Japanese.

1.2 Features
16 Quick Start Manual
Nickel-Metal-Hydride battery pack suppliedThe Ni-MH battery backs up internal data when power is off. When fully charged, data is backed up for 30 minutes when poweris turned off.
Compact and light weightThe compact size and light weight allows installation even in lim-ited space, such as in a cubicle.
Carrying case options for portabilityThe optional cases allow measurements to be taken withoutremoving the instrument. Choose from a light-weight soft case orwater-resistant hard case.
A choice of optional clamp-on sensors Select either the 9660 CLAMP ON SENSOR (100 A rms rating),the 9661 CLAMP ON SENSOR (500 A rms rating), the 9667 FLEX-IBLE CLAMP ON SENSOR (500/ 5000 A rms rating), 9669 CLAMPON SENSOR (1000 A rms rating), or 9694 CLAMP ON SENSOR(5 A rms rating).The 9657-10 CLAMP ON LEAK SENSOR and the 9675 CLAMPON LEAK SENSOR also can be used.
Control instrument settings and data acquisition byWeb browserHTTP server functions are built in.Instrument settings and data acquisition can be controlled by com-mon Internet Web browsers like Internet Explorer or NetscapeNavigator.
PC application software (option) for analyzing a largevolume of dataBy using the optional PQA-HiVIEW series, a large volume of long-term measurement data recorded on a PC card can be analyzed.
Remotely downloaded application software providedBy using the Down96 download application supplied with the prod-uct, data in the main unit can be downloaded from a distant loca-tion via LAN or RS-232C (modem).
EN50160-compliant evaluationsConforms to the European standard EN50160 (Voltage character-istics of electricity supplied by public distribution systems) and suit-able for evaluation of the voltage quality of a power system.
Optional GPS BOX available for precisely timed mea-surementsUsing the XD112 GPS BOX, measurements can be precisely timedusing communications satellites.
0
1
Overview
1.2 Features
17
1
2
3
4
5
6
7
8
9
1
1
Measurement is possible on 400 Hz power linesMeasure 400 Hz power such as that used for aircraft equipmentand shipping tests. Because the usual shipping tests do not include 400 Hz measure-ments, please advise when ordering if your application requiresguaranteed accuracy at 400 Hz.
• For details about low power supply quality anomalies and capturing phenomena, See the Instruction Manual (CD-R ver-sion).
• For detailed information on the EN50160, see the Instruction Manual for EN50160.

1.2 Features
18 Quick Start Manual

0
1
Parts N
ames
19
1
2
3
4
5
6
7
8
9
1
1
Parts Names 2
RS-232C
10Base-T
❖ 7.2 "Using a Printer (Option)" (page 116)
❖ 7.3 "Using the Instrument with a Computer" (page 121)
PC Card
Printer
❖ 4 "Connecting to Lines to be Measured" (page 45)
❖ 3 "Measurement Preparations" (page 29)
❖ 7.1 "Using a PC Card" (page 109)
PC
2.1 Instrument Labels and Functions
20 Quick Start Manual
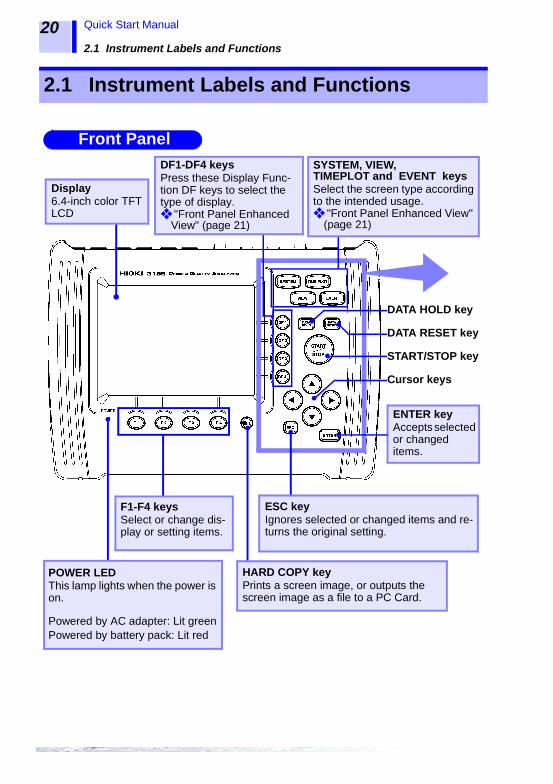
2.1 Instrument Labels and Functions
Display6.4-inch color TFT LCD
F1-F4 keysSelect or change dis-play or setting items.
Front Panel
POWER LEDThis lamp lights when the power is on.
Powered by AC adapter: Lit greenPowered by battery pack: Lit red
SYSTEM, VIEW, TIMEPLOT and EVENT keysSelect the screen type according to the intended usage. ❖ "Front Panel Enhanced View"
(page 21)
HARD COPY keyPrints a screen image, or outputs the screen image as a file to a PC Card.
ESC keyIgnores selected or changed items and re-turns the original setting.
ENTER keyAccepts selected or changed items.
DF1-DF4 keysPress these Display Func-tion DF keys to select the type of display.❖ "Front Panel Enhanced
View" (page 21)
DATA HOLD key
DATA RESET key
START/STOP key
Cursor keys

0
1
Parts N
ames
2.1 Instrument Labels and Functions
21
1
2
3
4
5
6
7
8
9
1
1
SYSTEM keyDisplays the [SYSTEM] screen (for selecting display of system settings).
Front Panel Enhanced View
DATA HOLD keyTemporarily stops display of measured values. Press again to cancel. While recording, display of the measured value can be stopped for con-firmation.
Cursor keysThese keys move the cursor on the screen. Use to scroll the time series graph screen.
DATA RESET keyAll measurement data is erased from internal memory. Press this key to reset before restarting record-ing.
EVENT keyDisplays the [EVENT] screen (for selecting events).
VIEW keyDisplays the [VIEW] screen (for selecting an Analysis view).
TIME PLOT keyDisplays the [TIME PLOT] screen (for se-lecting the time plot graph).
START/STOP keyStarts and stops recording. To start recording, press the DATA RESET key to reset the data, then press this key.
DF1-DF4 keys (Display Function)Select a screen to display from the selected screen type: SYSTEM, VIEW, TIME PLOT or EVENT.The screen selections are as follows:[SYSTEM] ...... Wiring diagram, Main settings, Event settings, Load/Save, etc. [TIME PLOT] .. RMS fluctuations, Voltage fluctuations, Harmonic fluctuations,
Flicker display, etc.[VIEW] ............ Waveforms, Vectors, DMM, Harmonic display, etc.[EVENT] ......... List, Monitor, etc.

2.1 Instrument Labels and Functions
22 Quick Start Manual
Voltage Input terminals Connect the supplied 9438-02 VOLTAGE CORD.❖ 3.5 "Connecting the Voltage Cords" (page 33)
CH1 CH2 CH3 CH4
Top Panel
CH1 CH2 CH3 CH4Black Red BlackYellow Black Blue Black Gray
Current Input terminalsConnect an optional clamp-on sensor.❖ 3.7 "Using a Clamp-On Sensor (Option)" (page 37)
Left Panel
KEY LOCK switchSliding this switch in the di-rection of the arrow disables all key operation except the POWER switch.
POWER switchTurns the instrument on and off.
Power OFFPower ON
❖ 3.8 "Turning the Power On/Off" (page 42)
AC Adapter socketThe supplied 9458 AC ADAPTER connects here.❖ 3.4 "Connecting the AC
Adapter" (page 32)
External Event Output terminal (EVENT OUT)A signal is output each time the instrument detects an event.
GND terminalThis is the signal ground terminal for the Event Input/Out-put terminals.
External Event Input terminal (EVENT IN)An external input signal can serve as an event trigger.
❖ 7.4 "Using the External Control Terminals" (page 124)

0
1
Parts N
ames
2.1 Instrument Labels and Functions
23
1
2
3
4
5
6
7
8
9
1
1
RS-232C Interface connectorConnects to a PC, modem or printer using an RS-232C cable.❖ 7.2 "Using a Printer (Option)" (page 116)❖ 7.3 "Using the Instrument with a Computer"
(page 121)
PC Card slotA PC Card can be inserted here.❖ 7.1 "Using a PC Card" (page 109)
10Base-T Interface connectorConnects to a PC using a LAN cable.❖ 7.3.2 "LAN Connection" (page 123)
Eject buttonPress this button to eject a PC Card from the slot.
Right Panel
Rear Panel
Battery compartmentInstall the supplied 9459 BATTERY PACK here.❖ 3.3 "Installing the Bat-
tery Pack" (page 31)
LabelThe label includes notices regarding Cautions, CE Mark, Double-Insulation, country of origin and manufacturer.
MAC Address LabelThis label indicates the unique MAC address as-signed to each unit for LAN operation. Please do not re-move, as this information is required for product manage-ment.
Number plateContains manufacturer’s ID numbers. Please do not remove, as this infor-mation is required for product management.

2.2 Screen Names and Display Elements
24 Quick Start Manual
For details about each screen, refer to the See the Instruction Man-ual (CD-R version).
2.2 Screen Names and Display Elements
WIRING• WIRING• VECTOR
WAVE• VOLT/CURR• VOLTAGE• CURRENT
RMS• 1 ELEMENT• 2 ELEMENT
EVENT• LIST• MONITOR
MAIN• MEASURE• RECORDING• HARDWARE
VECTOR VOLTAGE• INTERVAL• EVENT
EN50160 *• Over View
EVENT• VOLTAGE• POWER• HARMONICS
DMM• POWER• VOLTAGE• CURRENT
HARMONICS• HARM• INTERHARM
EN50160 *• Harmonics• Signaling• Events
LOAD/SAVE• MEMORY• PC-CARD
HARMONICS• GRAPH• LIST
FLICKER• GRAPH• LIST
EN50160 *• Setting1• Setting2• Setting3
Screen Selection
Other Displays
Display Selection
Internal Status Indicator
Each screen type (SYSTEM, VIEW, TIMEPLOT and EVENT) displays the following information in response to the DF keys.
Power ON
[RECORDING] [ANALYZING][SETTING]
* Used when the EN50160 function is ON.

0
1
Parts N
ames
2.2 Screen Names and Display Elements
25
1
2
3
4
5
6
7
8
9
1
1
2.2.1 Common Display ElementsThe display elements common to all screens on the 3196 are as follows.
Time DisplayShows the current time.
Power Supply IndicatorIndication Power supply status
White/ Red
Powered by AC adapter Battery pack is charging
White/ White
Powered by AC adapter Installed battery pack, charging completed
WhitePowered by battery pack
WhitePowered by battery pack, but charge is low.
SYSTEM Settings Indicators*5(page 28)Displays the contents specified in DF2 [MEA-SURE].
Memory Usage Indica-tors*3(page 27)Level meters indicate the us-age status of internal memory and flash ATA card.
Interface & Hold/Lock Indicators*4(page 27)Indicates interface usage and HOLD/LOCK status.
Internal Status Indicator*2(page 26)Indicates the current inter-nal operating status.
Screen Selection*1(page 26)Indicates the screen type se-lected by the corresponding key.
Number of repeated recording operations*6 (page 28)The number of repeated re-cording operations current-ly set will be indicated.
Top of Screen
Help Comment DisplayShows a brief description of the item at the cursor position on the SYSTEM screen.
Bottom of Screen

2.2 Screen Names and Display Elements
26 Quick Start Manual
*1: Screen Selection Display
*2: Internal Operating Status DisplayOne of [SETTING], [RECORDING] ([WAITING] until preset time to start measuring), or [ANALYZING] is displayed to indicate the inter-nal status of the instrument.
The internal status is changed by pressing to start/stop
recording.
If the preset measurement start time has already passed, measure-ment starts immediately.
[SYSTEM] [TIME PLOT]
[VIEW] [EVENT]
Indicator Internal status descriptionReal-time measure-ment
Recording status
[SETTING] When turned on, there is no re-corded data in the instrument
Possible Preparation for recording(not recording)
[WAITING] Waiting until a preset start time to begin measuring
Possible
[RECORD-ING]
Recording has started and mea-surement data is being saved to the instrument’s internal memory (and perhaps to a PC Card)
Possible Recording in progress
[ANALYZ-ING]
Recording has finished and the instrument is ready for analysis of the measurement data in internal memory
Possible Finished re-cording
Normal Measurement
Measurement starts
Measurement finished
[SETTING] [RECORDING] [ANALYZING]
Measurement with Specified Time Settings
[SETTING] [WAITING] [RECORDING][ANALYZ-ING]
Starts measurement at the measurement start time.
Finishes measure-ment at the measure-ment end time.
0
1
Parts N
ames
2.2 Screen Names and Display Elements
27
1
2
3
4
5
6
7
8
9
1
1
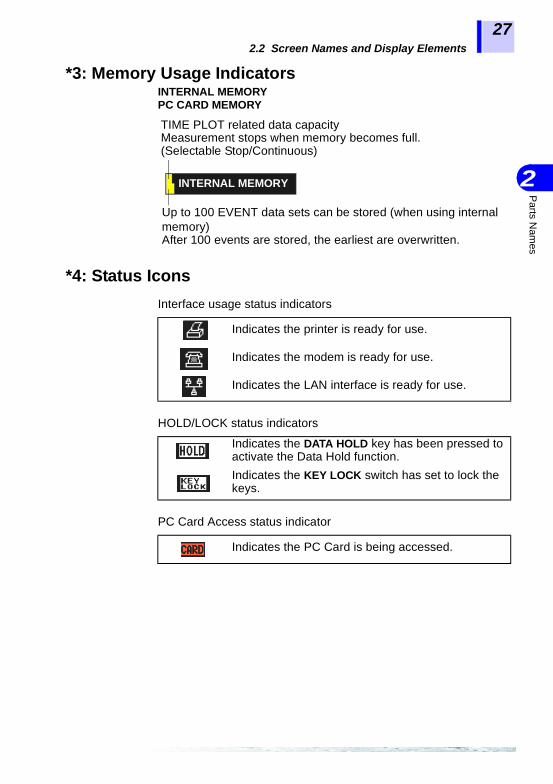
*3: Memory Usage IndicatorsINTERNAL MEMORYPC CARD MEMORY
*4: Status Icons
INTERNAL MEMORY
TIME PLOT related data capacityMeasurement stops when memory becomes full.(Selectable Stop/Continuous)
Up to 100 EVENT data sets can be stored (when using internal memory)After 100 events are stored, the earliest are overwritten.
Interface usage status indicators
Indicates the printer is ready for use.
Indicates the modem is ready for use.
Indicates the LAN interface is ready for use.
HOLD/LOCK status indicators
Indicates the DATA HOLD key has been pressed to activate the Data Hold function.
Indicates the KEY LOCK switch has set to lock the keys.
PC Card Access status indicator
Indicates the PC Card is being accessed.

2.2 Screen Names and Display Elements
28 Quick Start Manual
*5: SYSTEM Settings Indicators
*6: Number of repeated recording operations
Measurement Line typeSet on the SYSTEM screen
Voltage/Current RangeRed Indication: means out of rangeIn this case, increase the range setting.
Frequency of Measured LineRed Indication: means the measurement frequency is dif-ferent from the line frequency
CH4 Voltage mea-surement function(AC/ DC/OFF)
PLL Sync Frequency sourceIndicates red when no input is applied at the selected source.
PT/CT Ratio[SC] (scaling) Appears when the PT or CT ratio has been set.(Not displayed): Displayed when the PT and CT ratios are both 1.
When the repeated recording function is set, the number of repeated recording operations currently set will be indicated.Repeated recording operations can be conducted up to 99 days at one-day measuring intervals, and up to 99 weeks at one-week measuring intervals.The measured data file of repeated recording is saved as a sepa-rate binary file for each one-day or one-week period on the PC card.
0
Measurem
ent Preparations
3.1 Connection Procedure
29
1
2
3
4
5
6
7
8
9
1
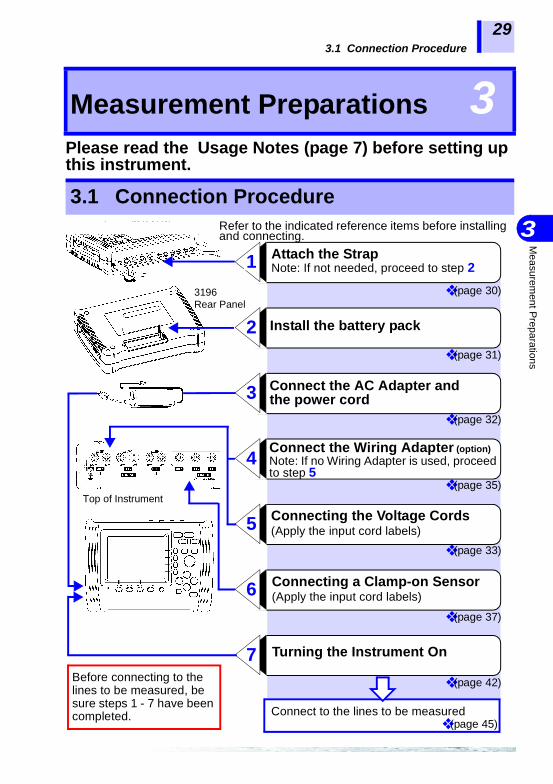
Please read the Usage Notes (page 7) before setting up this instrument.
Measurement Preparations 3
3.1 Connection Procedure
2
7
4
5
6
Install the battery pack
Turning the Instrument On
Connect the Wiring Adapter (option)Note: If no Wiring Adapter is used, proceed to step 5
Connecting the Voltage Cords(Apply the input cord labels)
Connecting a Clamp-on Sensor(Apply the input cord labels)
1 Attach the StrapNote: If not needed, proceed to step 2
3 Connect the AC Adapter and the power cord
Connect to the lines to be measured❖ (page 45)
❖ (page 30)
❖ (page 31)
❖ (page 32)
❖ (page 35)
❖ (page 33)
❖ (page 37)
❖ (page 42)
3196Rear Panel
Top of Instrument
Before connecting to the lines to be measured, be sure steps 1 - 7 have been completed.
Refer to the indicated reference items before installing and connecting.

3.2 Attaching the Strap
30 Quick Start Manual
Use the strap to carry the instrument, or to hang it up at the instal-lation location.
3.2 Attaching the Strap
Attach both ends of the Strap securely to the instrument.If insecurely attached, the instrument may fall and be damaged whencarrying.
1. Insert each end of the Strapthrough an installation sloton the instrument.
2. Feed each end of the Strapthrough its clasp.
3. Feed each end through itsstopper.
Tighten the Strap sufficiently to prevent loosening or twisting.
Attaching the strap to the instrument

0
Measurem
ent Preparations
3.3 Installing the Battery Pack
31
1
2
3
4
5
6
7
8
9
1
The battery pack backs up instrument data when power is turned off. When completely charged, data recorded in the instrument is backed up for about 30 minutes. The battery charges during nor-mal measurement operation, so it should be fully charged when power is turned off. Be aware that if the battery pack is not installed, recorded data is erased when the instrument is turned off.
3.3 Installing the Battery Pack
Use only the HIOKI Model 9459 BATTERY PACK. We cannotaccept responsibility for accidents or damage related to theuse of any other batteries.Before installing the Battery Pack, make sure the instrument isturned OFF.
• The battery pack is subject to self-discharge. Be sure to chargethe battery before initial use. If the battery capacity remainsvery low after correct recharging, the useful battery life is at anend.
❖ 9.3 Battery Pack Charging (page 139)• To avoid problems with battery operation, remove the battery
pack from the instrument if it is to be stored for a long time.
1. Turn the instrument off.
2. Turn the instrument over, removethe screw affixing the battery com-partment cover, and remove thecover.
3. Connect the battery pack connec-tor (the two projections on thesides should be face-up).
4. With the wired side of the batterypack facing downwards, insert thepack (fold the wires toward theright).
5. Replace the battery compartmentcover, and its screw.
Tool required for installation: One Phillips-head screwdriver
Installing the Battery Pack
Avoid pinching the battery pack wires.

3.4 Connecting the AC Adapter
32 Quick Start Manual
3.4 Connecting the AC Adapter
• Use only the supplied Model 9458 AC ADAPTER. ACadapter input voltage range is 100 to 240 VAC (with ±10%stability) at 50/60 Hz. To avoid electrical hazards and dam-age to the instrument, do not apply voltage outside of thisrange.
• Turn the instrument off before connecting the AC adapterto the instrument and to AC power.
• To avoid electric shock and ensure safe operation, connectthe power cord to a grounded (3-contact) outlet.
AC adapter operation with the 9459 BATTERY PACK installedprotects against loss of data when power is turned off.Note that if the battery pack is not installed when operating withthe 9458 AC ADAPTER, a power interruption longer than 0.5 cyclewill abort measurement and cause the instrument to turn off.When the AC adapter and battery pack are used together, theAC adapter has priority.
1. Connect the power cord tothe AC adapter.
2. Connect the AC adapteroutput plug to the instru-ment.
3. Plug the power cord intothe AC mains outlet.
AC Adapter
Insert the plug into the outlet
(example)
Power Cord
1
2
3
Connecting the AC Adapter to the Instrument
Insert with the arrow pointing upward.

0
Measurem
ent Preparations
3.5 Connecting the Voltage Cords
33
1
2
3
4
5
6
7
8
9
1
Because the channel 4 input terminal is isolated from the other inputs, it can be used for the following types of measurement.• Measuring voltage on the neutral line in the same system• Measuring line voltage in another system• Measuring DC power
3.5 Connecting the Voltage Cords
Connect the voltage cords to the instrument first, and then tothe active lines to be measured.Observe the following to avoid electric shock and short cir-cuits.• Voltage cable should only be connected to the secondary
side of a breaker, so the breaker can prevent an accident ifa short circuit occurs. Connections should never be madeto the primary side of a breaker, because unrestricted cur-rent flow could cause a serious accident if a short circuitoccurs.
• Do not allow the voltage cable clips to touch two wires atthe same time. Never touch the edge of the metal clips.
• For safety reasons, when taking measurements, only use the9438-02 VOLTAGE CORD provided with the product
• The supplied voltage cords consist of one each red, yellow, blueand gray cords, and four black cords. Connect only the cordsactually needed for measurement. Cords not being used formeasurement should be disconnected.
Insert plugs all the way in.
1. At each end of each cord,apply the labels that corre-spond to the (same-color)input terminal to which it isto be connected.
2. Insert each voltage cordinto the input terminal ofthe same color.
Connecting the voltage cords to the instrument
Input cord label
3.5 Connecting the Voltage Cords
34 Quick Start Manual
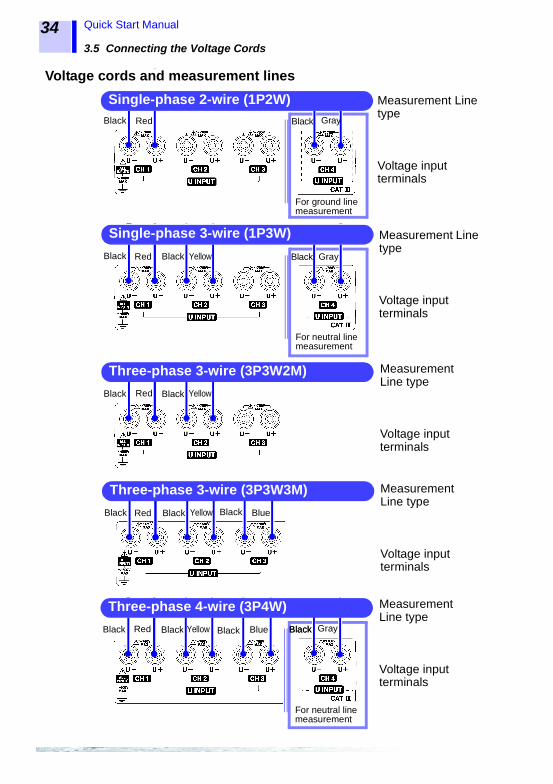
Black Red
For ground line measurement
Single-phase 2-wire (1P2W) Measurement Line type
Voltage input terminals
Black Gray
Voltage cords and measurement lines
Black Red Black
Single-phase 3-wire (1P3W)
For neutral line measurement
Measurement Line type
Voltage input terminals
Black GrayYellow
Black Red Black
Three-phase 3-wire (3P3W2M) Measurement Line type
Voltage input terminals
Yellow
Black Red Black
Three-phase 3-wire (3P3W3M)
Black Blue
Measurement Line type
Voltage input terminals
Yellow
Black Red Black Black Blue
Measurement Line type
Voltage input terminals
For neutral line measurement
BlackBlack
Three-phase 4-wire (3P4W)GrayYellow

0
Measurem
ent Preparations
3.6 Wiring Adapter Connection (Option)
35
1
2
3
4
5
6
7
8
9
1
The Wiring Adapter are specially designed to facilitate connections to three-phase 3- and 4-wire systems.
For three-phase 3-wire (3P3W3M): Model 9264-01 WIRING ADAPTEROnly three voltage cords need to be connected to the circuit, instead of six.
For three-phase 4-wire: Model 9264-02 WIRING ADAPTEROnly four voltage cords need to be connected to the circuit, instead of six.
The voltage cords required depends on the lines to be measured. ❖ Voltage cords and measurement lines(page 34)
3.6 Wiring Adapter Connection (Option)
• To avoid electric shock, turn the instrument off when con-necting a wiring adapter.
• The maximum rated working voltage is 780 Vrms, 1103 Vpeak. Attempting to measure voltage in excess of the maxi-mum rating could destroy the product and result in per-sonal injury or death.
• The maximum rated voltage between input terminals andground is 600 Vrms. Attempting to measure voltagesexceeding 600 Vrms with respect to ground could damagethe product and result in personal injury.
Connect all six output leadsfrom the Wiring Adapter to thevoltage input terminals withthe corresponding colors onthe instrument.
Insert plugs all the way in.
Connecting a Wiring Adapter to the Instrument

3.6 Wiring Adapter Connection (Option)
36 Quick Start Manual
9264-01, 9264-02 WIRING ADAPTER Specifications
Internal connection diagram
Operating environment Indoors, altitude up to 2000 m (6562-ft.)
Storage temperature and humidity -20 to 50°C (-4 to 122°F), 80% RH or less (non-condensating)
Operating temperature and humidity 0 to 40°C (32 to 104°F), 80% RH or less (non-condensating)
Maximum input voltage 780 Vrms, 1103 V peak (between A and B, B and C, C and A)
Maximum rated voltage to earth 600 Vrms (9264-02 WIRING ADAPTER: between A and N, B and N, C and N)
Dielectric strength (50/60 Hz) 5.55 kVrms for one minute (current sensitivity 1 mA) (Between voltage input terminals and case)
Applicable Standards Safety EN61010-1:2001Voltage Input: Pollution Degree 2, Measurement Category III (anticipated transient overvoltage 6000V)
Dimensions Approx. 125W x 80H x 32D mm (4.92"W x 3.15"H x 1.26"D)(Cable length: 152 mm, 5.98")
Mass Approx. 180 g (6.3 oz)
Red Blue
Voltage input terminals
Three-phase 3-wire (3P3W3M)
9264-01 WIRING ADAPTER
Red Blue
Three-phase 4-wire (3P4W)
9264-02 WIRING ADAPTER
Yellow Yellow Black
A B C A B C N
For 3P3W2M, cross these connections.
U- U+ U- U+ U- U+CH1 CH2 CH3
A B C
U- U+ U- U+ U- U+CH1 CH2 CH3
A B C N
9264-01 WIRING ADAPTER 9264-02 WIRING ADAPTER

0
Measurem
ent Preparations
3.7 Using a Clamp-On Sensor (Option)
37
1
2
3
4
5
6
7
8
9
1
This instrument supports voltage-output type clamp-on sensors. The clamp-on sensor should provided about 0.5V rms output for full-scale current measurement.• To use Model 9661, 9660, 9694, 9669 and 9667 Clamp-On Sen-
sors, select the model name displayed in the instrumentÅfsclamp sensor settings.
• To use the Model 9695-02 CLAMP ON SENSOR, set the clamp-on sensor setting to "10 mV/A".
• To use the Model 9695-03 CLAMP ON SENSOR, set the clamp-on sensor setting to "9660".
• The Model 9657-10 and 9675 CLAMP ON LEAK SENSOR canbe used with this instrument. Set the clamp-on sensor setting to"100 mV/A".
3.7 Using a Clamp-On Sensor (Option)
Connect the clamp-on sensor to the instrument first, andthen clamp around the line to be measured.Observe the following to avoid electric shock and short cir-cuits.• The clamp sensor should only be connected to the second-
ary side of a breaker, so the breaker can prevent an acci-dent if a short circuit occurs. Connections should never bemade to the primary side of a breaker, because unrestrictedcurrent flow could cause a serious accident if a short cir-cuit occurs.
• When the clamp sensor is opened, do not allow the metalpart of the clamp to touch any exposed metal, or to shortbetween two lines, and do not use over bare conductors.
• To prevent damage to the instrument and sensor, neverconnect or disconnect a sensor while the power is on, orwhile the sensor is clamped around a conductor.

3.7 Using a Clamp-On Sensor (Option)
38 Quick Start Manual
3.7.1 Clamp-On Sensor SpecificationsRefer to the Instruction Manual for the specific model for more details.
(Hioki recommendations)9661 CLAMP ON SENSOR
9660 CLAMP ON SENSOR
Primary current rating 500 A AC
Output voltage 1 mVAC/A
Maximum input current 550 A continuous (at 45 to 66 Hz , 50°C)
Amplitude accuracy ±0.3% rdg. ±0.01% f.s. (f.s.=500 A, 45 to 66 Hz)
Phase accuracy ±0.5° or less (45 Hz to 5 kHz)
Amplitude frequency characteristic
±1% accuracy or better from 40 Hz to 5 kHz
Maximum rated voltage to earth
600 Vrms
Measurable conductor diameter
46 mm max.
Operating temperature and humidity
0 to 50°C (32 to 122°F), 80% RH or less
Primary current rating 100 A AC
Output voltage 1 mVAC/A
Maximum input current 130 A continuous (at 45 to 66 Hz, 50°C)
Amplitude accuracy ±0.3%rdg. ±0.02%f.s.(f.s.=100 A, 45 to 66 Hz)
Phase accuracy ±1° or less (45 Hz to 5 kHz)
Amplitude frequency characteristic
±1% accuracy or better from 40 Hz to 5 kHz
Maximum rated voltage to earth
300 Vrms
Measurable conductor diameter
15 mm max.
Operating temperature and humidity
0 to 50°C (32°F to 122°F), 80% RH or less

0
Measurem
ent Preparations
3.7 Using a Clamp-On Sensor (Option)
39
1
2
3
4
5
6
7
8
9
1
9694 CLAMP ON SENSOR
Accuracy of the combination of the 9660/9661/9669/9694 and the 3196:Example: Using the 9661, 50 A range setting (3196), when measuring 50 ArmsError of 9661 + Error of 3196 = Total errorError of 9661 = 50 A(measurement) x 0.3% rdg. + 500 A(rating) x 0.01% f.s.
= (50 x 0.3/100) + (500 x 0.01/100)= 0.15 + 0.05 = 0.20 A
Error of 3196 = 50 A (measurement)x 0.2% rdg. + 50 A (range) x 0.1% f.s.= (50 x 0.2/100) + (50 x 0.1/100)= 0.1 + 0.05 = 0.15 A
Total error = 0.20 A + 0.15 A = ±0.35 A
9669 CLAMP ON SENSOR
Primary current rating 5 A AC
Output voltage 10 mVAC/A
Maximum input current 50 A continuous (at 45 to 66 Hz , 50°C)
Amplitude accuracy ±0.3%rdg. ±0.02%f.s.(f.s.=5 A, 45 to 66 Hz)
Phase accuracy ±2° or less (45 Hz to 5 kHz)
Amplitude frequency characteristic
±1% accuracy or better from 40 Hz to 5 kHz
Maximum rated voltage to earth
300 Vrms
Measurable conductor diameter
15 mm max.
Operating temperature and humidity
0 to 50°C (32 to 122°F), 80% RH or less
Primary current rating 1000 A AC
Output voltage 0.5 mV AC/A
Maximum input current 1000 A continuous (at 45 to 66 Hz , 50°C)
Amplitude accuracy ±1.0% rdg. ±0.01% f.s. (f.s.=1000 A , 45 to 66 Hz)
Phase accuracy ±1° or less (45 Hz to 5 kHz)
Amplitude frequency characteristic
±2% accuracy or better from 40 Hz to 5 kHz
Maximum rated voltage to earth
600 Vrms
Measurable conductor diameter
55 mm max.
Operating temperature and humidity
0 to 50°C (32 to 122°F), 80% RH or less
3.7 Using a Clamp-On Sensor (Option)
40 Quick Start Manual
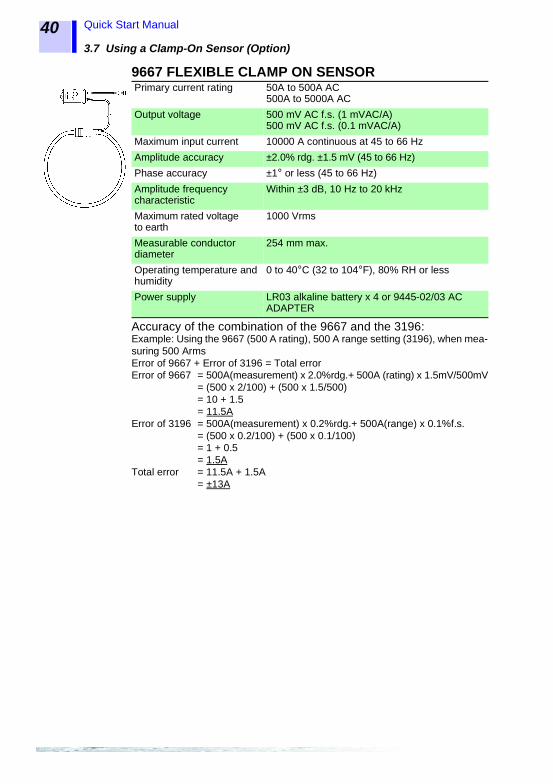
9667 FLEXIBLE CLAMP ON SENSOR
Accuracy of the combination of the 9667 and the 3196:Example: Using the 9667 (500 A rating), 500 A range setting (3196), when mea-suring 500 ArmsError of 9667 + Error of 3196 = Total errorError of 9667 = 500A(measurement) x 2.0%rdg.+ 500A (rating) x 1.5mV/500mV
= (500 x 2/100) + (500 x 1.5/500)= 10 + 1.5= 11.5A
Error of 3196 = 500A(measurement) x 0.2%rdg.+ 500A(range) x 0.1%f.s.= (500 x 0.2/100) + (500 x 0.1/100)= 1 + 0.5= 1.5A
Total error = 11.5A + 1.5A= ±13A
Primary current rating 50A to 500A AC500A to 5000A AC
Output voltage 500 mV AC f.s. (1 mVAC/A)500 mV AC f.s. (0.1 mVAC/A)
Maximum input current 10000 A continuous at 45 to 66 Hz
Amplitude accuracy ±2.0% rdg. ±1.5 mV (45 to 66 Hz)
Phase accuracy ±1° or less (45 to 66 Hz)
Amplitude frequency characteristic
Within ±3 dB, 10 Hz to 20 kHz
Maximum rated voltage to earth
1000 Vrms
Measurable conductor diameter
254 mm max.
Operating temperature and humidity
0 to 40°C (32 to 104°F), 80% RH or less
Power supply LR03 alkaline battery x 4 or 9445-02/03 AC ADAPTER

0
Measurem
ent Preparations
3.7 Using a Clamp-On Sensor (Option)
41
1
2
3
4
5
6
7
8
9
1
3.7.2 Connecting a Clamp-on Sensor
The current input terminal of channel 4 can be used in the following two ways. • Measuring current on the neutral or ground line in the same sys-
tem• Measuring line current in a separate system
When disconnecting the BNC connector, be sure to release the lock before pulling the connectors apart. Forcibly pulling the con-nector without releasing the lock, or pulling on the cable, can damage the connector.
Lock
BNC plug slots
1. At each end of the cable, apply thelabels having the same color as thecurrent input terminal to which it isto be connected.
2. Align the slots in the BNC plug withthe guide pins on the connector atthe instrument side, then push andturn the plug clockwise. (to unplug the connector, push the plug and turn it counterclockwise before pulling it apart.)
Connecting a Clamp Sensor to the Instrument
3196 Current input terminal connector guide pins
Input cord label
Red Red Yellow
Red Yellow Blue
Measurement line type
Current Input terminals
Red Yellow BlueRed Yellow
Single-phase 2-wire(1P2W)
Gray
Gray Gray
Three-phase 3-wire (3P3W2M)
Single-phase 3-wire (1P3W)
Three-phase 3-wire (3P3W3M)
Three-phase 4-wire (3P4W)

3.8 Turning the Power On/Off
42 Quick Start Manual
3.8 Turning the Power On/Off
• Before turning power on, verify that the instrument andperipheral devices are correctly installed and connected.
• When using the AC adapter: AC adapter input voltagerange is 100 to 240 VAC (with ±10% stability) at 50/60 Hz. Toavoid electrical hazards and damage to the product, do notapply voltage outside of this range.
• When the POWER LED is red or the mark is not displayed,power is not being supplied from the mains. In this case, mea-surements can be taken using battery power for up to about 30minutes. Make sure the AC Adapter is securely connected tothe power outlet and to the instrument.
• Data in internal memory is erased whenever the instrument isturned off. Therefore, to preserve recorded data, be sure tosave it to a PC Card.
❖ Saving, Loading and Deleting(page 53)
1. Turn the POWER switch ON ( | ).
2. The POWER LED lights
3. Symbol on the screen at the lowerleft indicate the power status
Turn the POWER switch OFF ( ).**: See NOTE
Green Indicates the AC Adapter is in use
Red Indicates operation from the battery pack without the AC Adapter*
Indication Power supply status
White / Red
Powered by AC adapter Battery pack is charging
White / White
Powered by AC adapter Installed Battery Pack
WhitePowered by battery pack*
White
Powered by battery pack, but charge is low.*
Power On
Turning the Instrument On/Off
Powering On
Powering Off
Power switch On:
Power switch Off:

0
Measurem
ent Preparations
3.8 Turning the Power On/Off
43
1
2
3
4
5
6
7
8
9
1
Screen Display at Power On
Before turning off the power
If an error occurs during self-testing, the instrument may be dam-aged. Contact your dealer or Hioki representative.
Data in internal memory is erased whenever the instrument is turned off. Therefore, to preserve recorded data, be sure to save it to a PC Card. ❖ Saving, Loading and Deleting(page 53)❖ Saving a Settings File to a PC Card (from [SETTING]/[ANALYZING]
modes)(page 112)❖ Automatically Saving Measurement Data to a PC Card(page 113)❖ Storing data on a PC card after measurement (during [ANALYZ-
ING])(page 114)
The initial screen appears when power is turned on and during self-testing. When the self-test finishes, [SYSTEM] - DF1 [WIRING] screen appears.
HIOKI 3196 POWER QUALITY ANALYZER
Ver 1.40MAIN Boot Complete!!!SUB Boot Complete!!!AMP Boot Complete!!!DRAM Check!!! Pass!VRAM Check!!! Pass! !!!
INIT RTCINIT PC-CARDINIT WinSystemINIT AMP
Model Information
Version
Internal component test results
Internal memory test results
Initialization information

3.8 Turning the Power On/Off
44 Quick Start Manual

0
1
Connecting to Lines to be M
easured
4.1 Connection Procedure
45
1
2
3
4
5
6
7
8
9
1
1
Please read the Usage Notes (page 7) before making connections.
Connecting to Lines to be Measured 4
4.1 Connection ProcedureVerify that the voltage cord or clamp-on sensor is properly connected to the input terminals.
2 Turn on ( | ) the 3196.
1
5Verify the currently selected connection states(the voltage, power and active power selections for each channel).
6Check the connection states and set the appropriate ranges (check the voltage and current amplitude and phase on the vector display).
❖ Connecting the Voltage Cords(page 33)
❖ Using a Clamp-On Sensor (Option)(page 37)
❖ Turning the Power On/Off(page 42)
❖ (page 51)
❖ (page 51)
Connect the voltage cords and clamp-on sensor to the lines to be measured in accordance with the displayed connec-tion diagram.
❖ (page 46)
❖ (page 51)
OK NGGo to 4
Measurement❖ Measurement Method(page 57)
VECTOR
3 Set up the connection (wiring) configu-ration, nominal voltage and frequency.
WIRING
❖ Quick Reference(page 51)❖ Peripheral Devices(page 109)❖ Data Recording, Saving, Load-
ing and Deleting(page 53)
MEASURESetting Details
4
7 Set up for recording or events as needed.

4.2 Connection Methods
46 Quick Start Manual
4.2 Connection Methods
• To measure 3-phase lines, the instrument channels (CHs 1 to 3)should be connected in corresponding phase order.
• The instrument can measure from single-phase 2-wire to three-phase 4-wire circuits, but voltage measurement at three points insingle-phase circuits is not supported.
• For voltage and current measurements in which power valuesare not needed, the measurement mode can be set to three-phase 4-wire to enable the input terminals of all four channelsfor voltage or current measurements. However, be aware thatchannels 1 to 3 are not isolated from one another.
• To ensure correct measurement results, follow the instrumentsetup and connection instructions precisely.
Clip securely to metal parts such as connection screws or bus bars at the power side.
Connecting the Voltage Cords to the Lines to be Measured
(Example)
OK
Clamp around only one con-ductor. Measurement is not possible if the clamp is placed around two lines in a single-phase circuit, or three lines in a three-phase circuit.
(Example: 9660)
Clamping a Sensor to a Line to be Measured
The arrows on the clamp indicating the direction of current flow should point toward the load side.
(Example: 9660)
ConductorLOAD
SOURCE
Current flow direction arrow
LOAD
SOURCE
(Example: 9661)
Conductor
Current flow direction arrow

0
1
Connecting to Lines to be M
easured
4.2 Connection Methods
47
1
2
3
4
5
6
7
8
9
1
1
4.2.1 Single-Phase System Connections
Source side
LOA
D
Load side
A
N
G
Black
Red
SO
UR
CE
Face the arrow toward the Load
A: Line, N: Neutral, G: Ground
Black
Gray
U- U+ U- U+ U- U+ U- U+
U INPUT I INPUTCH1 CH2 CH3 CH4CH1 CH2 CH3 CH4
Ground line mea-surement, etc.
Single-phase 2-wire (1P2W)
U1=100 VI1=15 AU4=10 VI4=1.5 A
Source side
SO
UR
CE
LOA
D
Load side
A
N
B
Black
Red
Yellow
Black
G
A: Line, N: Neutral, G: Ground
Black
Gray
U- U+ U- U+ U- U+ U- U+
U INPUT I INPUTCH1 CH2 CH3 CH4CH1 CH2 CH3 CH4
Ground line mea-surement, etc.
Face the arrow toward the Load
Single-phase 3-wire (1P3W)
U1=U2=100 VI1=I2=15 AU4=10 VI4=1.5 A

4.2 Connection Methods
48 Quick Start Manual
Three-phase 3-wire (3P3W2M)
Source side
SO
UR
CE
LOA
D
Load side
A
B
C
Black
Red
Yellow
Black
A, B, C: Lines
Face the arrow toward the Load
U- U+ U- U+ U- U+ U- U+
U INPUT I INPUTCH1 CH2 CH3 CH4CH1 CH2 CH3 CH4
U1=U2=200 VI1=I2=50 A
Three-phase 3-wire (3P3W3M)
Source side
SO
UR
CE
LOA
D
Load side
A
B
C
Black
Red
Yellow
Black
A, B, C: Lines
Blue
Black
Face the arrow toward the Load
U- U+ U- U+ U- U+ U- U+
U INPUT I INPUTCH1 CH2 CH3 CH4CH1 CH2 CH3 CH4
U1=U2=U3=200 VI1=I2=I3=50 A

0
1
Connecting to Lines to be M
easured
4.2 Connection Methods
49
1
2
3
4
5
6
7
8
9
1
1
4.2.2 Connecting to Multiple Systems
Three-phase 4-wire (3P4W)
Source side
SO
UR
CE
LOA
D
Load side
A
B
CBlack
Red
Black
Yellow
Black
Blue
N
G
Black
Gray
A, B, C: Lines, N: Neutral, G: Ground
Face the arrow toward the Load
U- U+ U- U+ U- U+ U- U+
U INPUT I INPUTCH1 CH2 CH3 CH4CH1 CH2 CH3 CH4
Ground line mea-surement, etc.
U1=U2=U3=115.5 VI1=I2=I3=50 AU4=0 VI4=0 A
Source side
SO
UR
CE
LOA
D
Load side
A
N
Black
Gray
Used for sepa-rate system
Face the arrow toward the
A: Line, N: Neutral
U- U+ U- U+ U- U+ U- U+
U INPUT I INPUTCH1 CH2 CH3 CH4CH1 CH2 CH3 CH4
2 systems
Source side
SO
UR
CE
LOA
D
Load side
Used for sepa-rate system
Black
Gray
A: Line, N: Neutral
U- U+ U- U+ U- U+ U- U+
U INPUT I INPUTCH1 CH2 CH3 CH4CH1 CH2 CH3 CH4
A
N
1 system and DC power supply

4.2 Connection Methods
50 Quick Start Manual

0
1
Quick R
eference
5.1 Connection and System Settings
51
1
2
3
4
5
6
7
8
9
1
1
This chapter describes the operating procedures for var-ious applications. For instrument setting details, See the Instruction Manual (CD-R version).
Quick Reference 5
5.1 Connection and System Settings
Connection SettingsConnection Methods(page 46), Checking Three-phase Systems(page 57)
Verify the connection diagram
Check the connections
Select the connection method
WIRING
VECTOR
WIRINGWiring
MEASURE ❖ 1
System SettingsSelect measurement-related system settings
Select recording-related system settings
Select hardware-related system settings
Confirm the version of the instrument
System reset
MEASURE Select items❖ 1
RECORDING Select items❖ 1
HARDWARE Select items❖ 1
HARDWARE
HARDWARE SYSTEM RESET
Select from pull-
down menu❖ 1

5.2 Data Display
52 Quick Start Manual
5.2 Data Display
Displaying Measurement DataWaveform Display
Vector Display
DMM (Digital Multi-Meter) Display
Harmonic Display
Displaying Recording GraphsDisplays the time series graph of RMS values
Displays the time series graph of voltage values
Displays the voltage fluctuation graph for the event occurrence
Displays the time series graph of harmonic val-ues
Displays the time series graph of Flicker
VOLT/CURRVOLT/CURR
VOLTAGE
CURRENT
VECTOR
POWER
VOLTAGE
CURRENT
GRAPH
LIST
1 ELEMENT
2 ELEMENT
INTERVAL
EVENT
HARM
INTERHARM
GRAPH
LIST

0
1
Quick R
eference
5.3 Data Recording, Saving, Loading and Deleting
53
1
2
3
4
5
6
7
8
9
1
1
❖ 2: When setting, only the setting status stored. When analyzing, select whether to save setting status or measurement data (binary or text format) and then save.
5.3 Data Recording, Saving, Loading and Deleting
RecordingManual Recording
Automatic Recording Set the times to start and end recording
Saving, Loading and DeletingUsing a PC Card(page 109)
Saving, Loading and Deleting Internal Mem-ory Data
Up to 10 setting status files can be saved.
Saving, Loading and Deleting PC Card Data
Setting states and mea-surement data can be stored.
NOTE:We recommend the use of automatic saving in binary format to save measurement data to a PC card.(page 113)
Insert a PC Card
Start Finished
RECORDING
Actual time
START TIME
STOP TIME
ON(optional)
(optional)
Select the save No.
Load
Save
Delete
MEMORY
Cancel
Accept
File Name Entry
Select the save No.
Load
Save❖ 2Delete
PC-CARD
Cancel
Accept
File Name Entry

5.4 Event Analysis
54 Quick Start Manual
Hard CopyUsing a PC Card(page 109),Using a Printer (Option)(page 116)
Manual Hard Copy
Auto Hard Copy❖ Using a PC Card(page
109)❖ Using a Printer (Option)
(page 116)
Display the screen to be output
Timer
Select interval
COPY
1 min
Display the screen to be output (Start measuring)
HARDWARE
(Example)
5.4 Event Analysis
Event SettingTo set an event
AnalysisTo determine if an event occurs
To analyze waveforms for event occurrence
Select itemVOLTAGE
POWER
HARMONICS ❖ 3
Set the threshold❖ 3
Confirm event occurrence
MONITOR
Select the Event No.
LIST
Manual EventManual event setting
External event ONVOLTAGE
To set event (Press simultaneously.)
0
1
Quick R
eference
5.5 Using Peripheral Devices
55
1
2
3
4
5
6
7
8
9
1
1
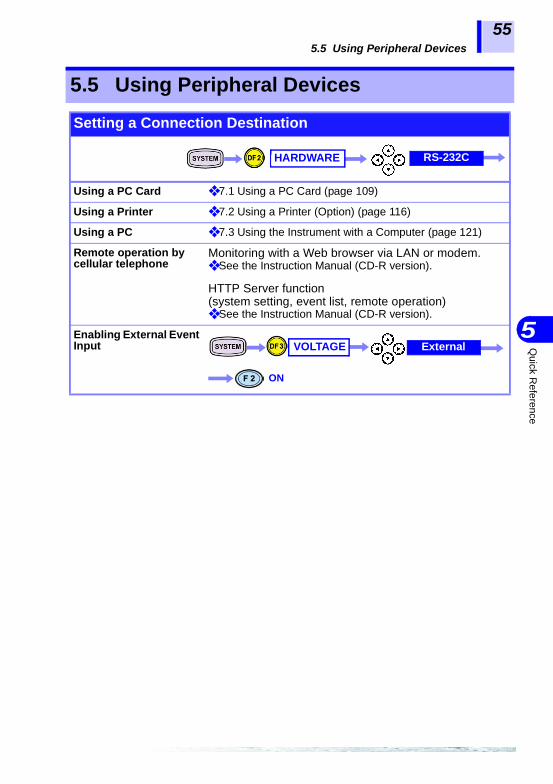
5.5 Using Peripheral Devices
Setting a Connection Destination
Using a PC Card ❖ 7.1 Using a PC Card (page 109)
Using a Printer ❖ 7.2 Using a Printer (Option) (page 116)
Using a PC ❖ 7.3 Using the Instrument with a Computer (page 121)
Remote operation by cellular telephone
Monitoring with a Web browser via LAN or modem.❖ See the Instruction Manual (CD-R version).
HTTP Server function(system setting, event list, remote operation)❖ See the Instruction Manual (CD-R version).
Enabling External Event Input
HARDWARE RS-232C
VOLTAGE External
ON

5.5 Using Peripheral Devices
56 Quick Start Manual

0
1
Measurem
ent Method
6.1 Checking Three-phase Systems
57
1
2
3
4
5
6
7
8
9
1
1
Before measuring, make sure you read the information on precautions for using this device and connection methods. For screen setting details, See the Instruction Manual (CD-R version).
Check that the power distribution board you are using has a 400 V three-phase 3-wire configuration.
Measurementlocation
Three-phase 3-wire 400 V power line on a distribution board (50 Hz, 50 A load)
Application • To connect the 3196 to the measured power line while viewing the connection diagram on the screen
• To check whether the connection is correct on the vector screen• To check the three-phase voltage and three-phase current wave-
forms• To check the voltage unbalance factor and current unbalance
factor
Measurement Method 6
6.1 Checking Three-phase Systems
1. Measurement preparations
Required for connection: • 3196 + 9458 AC ADAPTER +
9459 BATTERY PACK• 9438-02 VOLTAGE CORD
(One cord each of red, yellow, and blue, and three black cords.)
• 9661 CLAMP ON SENSOR, 3 each
When using the three-phase connec-tion adapter• 9264-01 WIRING
ADAPTER(3P3W3M)• 9438-02 VOLTAGE CORD
(One cord each of red, yellow, and blue.)
Breaker for power distribution
Load side
Source side
Power dis-tribution board
A B C
ON
6.1 Checking Three-phase Systems
58 Quick Start Manual
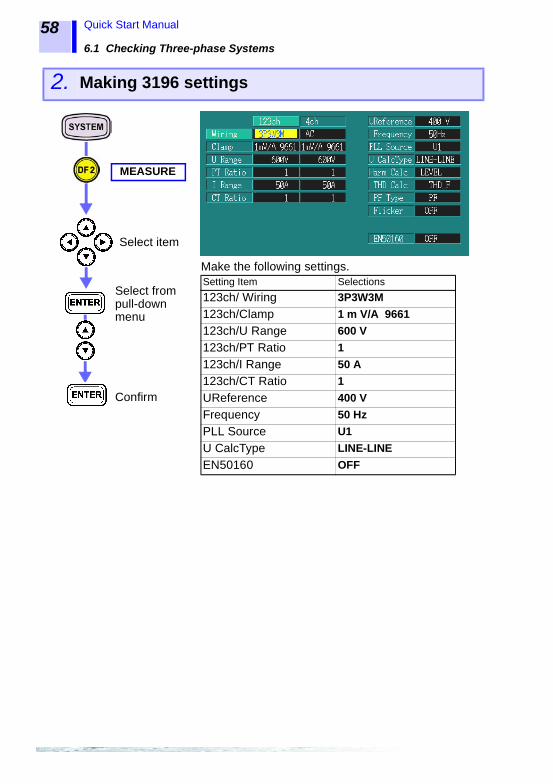
2. Making 3196 settings
MEASURE
Make the following settings.Setting Item Selections
123ch/ Wiring 3P3W3M
123ch/Clamp 1 m V/A 9661
123ch/U Range 600 V
123ch/PT Ratio 1
123ch/I Range 50 A
123ch/CT Ratio 1
UReference 400 V
Frequency 50 Hz
PLL Source U1
U CalcType LINE-LINE
EN50160 OFF
Select item
Select from pull-down menu
Confirm

0
1
Measurem
ent Method
6.1 Checking Three-phase Systems
59
1
2
3
4
5
6
7
8
9
1
1
3. Connecting to the lines to be measured
Source side
SO
UR
CE
LOA
D
Load side
A
B
C
Black
Red
Yellow
Black Blue
Black
Face the arrow toward the Load 3P3W3M
U- U+ U- U+ U- U+ U- U+
U INPUT I INPUTCH1 CH2 CH3 CH4CH1 CH2 CH3 CH4
• Is the voltage displayed for CH1, CH2, and CH3 approximately 400 V?• Is the current displayed for CH1, CH2, and CH3 approximately 50A?• Is the active power displayed for CH1, CH2, and CH3 a positive
value?
When using the 9264-01 WIRING ADAPTER, the black cords are not required.
Confirm the connec-tion on the screen.
• Check that the voltage cord for the channel that is displaying the nega-tive value is connected properly.
• Check that the clamp-on sensor for the channel that is displaying the negative value is clamped to the power line so that it points in the direction of the Load (current direction display).
WIRING
Connect the 3196 to the measured power line while viewing the connection diagram.
Remedy When a negative value is displayed for active power
A/B/C: Line

6.1 Checking Three-phase Systems
60 Quick Start Manual
4. Checking the connections
Select item
Select from pull-down menu
Confirm
Make the following settings.
Setting Item Selec-tions Checking the vector
ΔPhase(Phase range)
±10 Is the vector being measured within ±10° of the nominal phase range for the ideal vector of each phase?
ΔLevel(Amplitude range)
±10 Is the vector being measured within ±10% of the nominal level range for the ideal vector of each phase? (Voltage is set to a percentage of the nominal voltage, and current is set to a percentage of the range.)
U/I Angle(U/I phase dif-ference)
-15 Is the vector being measured within -15° of the nominal range for the phase differ-ence of the voltage vector and current vector for each phase? (Current is set to a LAG of 15 degrees for the voltage.)
• Voltage vector diagram: Are the U1, U2, and U3 vectors within the same colored nominal ranges?
• Current vector diagram: Are the I1, I2, and I3 vectors within the same colored nominal ranges?
VECTOR
Confirm the connec-tion on the screen.
Remedy
(Go to the next page)
0
1
Measurem
ent Method
6.1 Checking Three-phase Systems
61
1
2
3
4
5
6
7
8
9
1
1
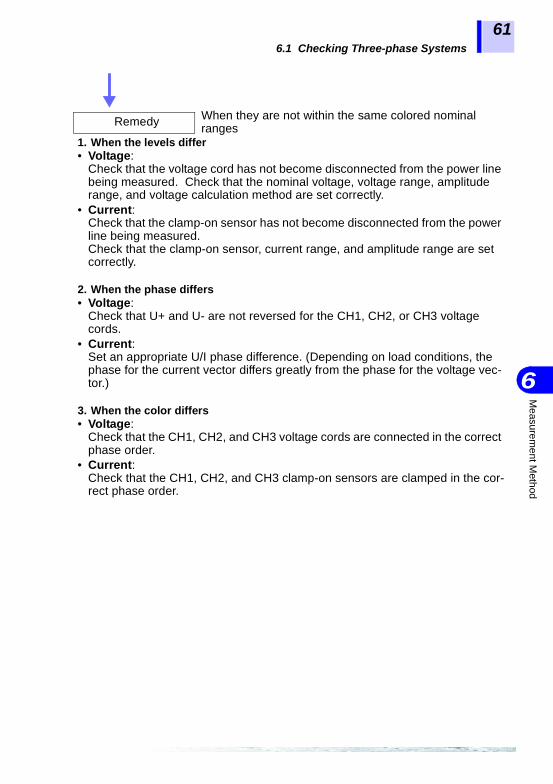
1. When the levels differ• Voltage:
Check that the voltage cord has not become disconnected from the power line being measured. Check that the nominal voltage, voltage range, amplitude range, and voltage calculation method are set correctly.
• Current: Check that the clamp-on sensor has not become disconnected from the power line being measured. Check that the clamp-on sensor, current range, and amplitude range are set correctly.
2. When the phase differs• Voltage:
Check that U+ and U- are not reversed for the CH1, CH2, or CH3 voltage cords.
• Current: Set an appropriate U/I phase difference. (Depending on load conditions, the phase for the current vector differs greatly from the phase for the voltage vec-tor.)
3. When the color differs• Voltage:
Check that the CH1, CH2, and CH3 voltage cords are connected in the correct phase order.
• Current: Check that the CH1, CH2, and CH3 clamp-on sensors are clamped in the cor-rect phase order.
Remedy When they are not within the same colored nominal ranges

6.1 Checking Three-phase Systems
62 Quick Start Manual
5. Viewing measured data
(1) Checking three-phase voltage and three-phase current waveforms
VOLT/CURR
VOLTAGE
CURRENT
VOLT/CURR When viewing the waveforms for CH1, CH2, and CH3, you can view CH2 with a 120 degree LAG for CH1, and CH3 with a 120 degree LAG for CH2 for both voltage and current waveforms.
VOLTAGE You can view the CH1, CH2, and CH3 voltage wave-forms for each phase.
CURRENT You can view the CH1, CH2, and CH3 current waveforms for each phase.
Example:VOLT/CURR
WAVE
To change the waveform’s amplitude and its number of waves
To measure the cursor
To scroll the waveform
Changing the voltage amplitude U: x1/3, x1/2, x1, x2, x5, x10Changing the current amplitude I: x1/3, x1/2, x1, x2, x5, x10Changing the number of waves: 2 cycles, 4 cycles, 10 cycles
Press this button to stop the waveform display. The cursors can be aligned easily.

0
1
Measurem
ent Method
6.1 Checking Three-phase Systems
63
1
2
3
4
5
6
7
8
9
1
1
(2) Checking the voltage unbalance factor and current unbal-ance factor
VECTOR
• Check the numerical value for the voltage unbalance factor Uunb. 0%The closer the value is to 0%, the more even three-phase volt-age is. The larger the degree of unbalance, the larger the Uunb value.
• Check the numerical value for the current unbalance factor Iunb. The closer the value is to 0%, the more even three-phase current is. The larger the degree of unbalance, the larger the Iunb value.
To change the vector’s display axis
To change the value displayed for the phase angle
LOG, LINEAR
PHASE
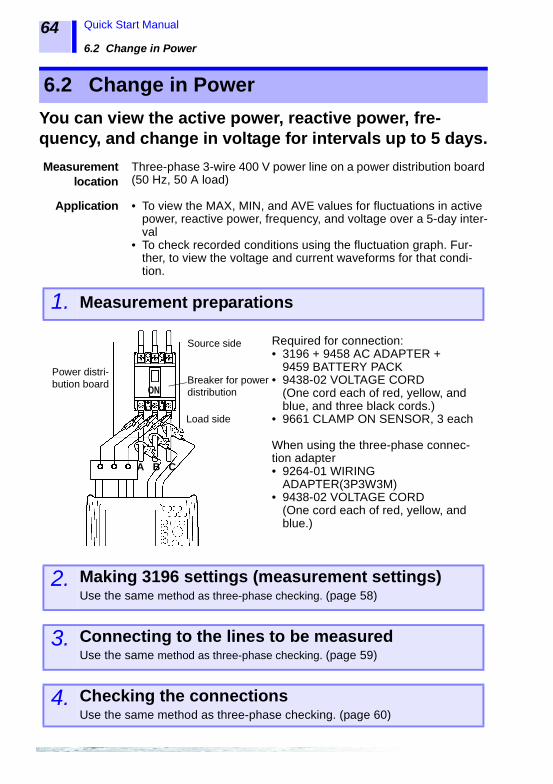
6.2 Change in Power
64 Quick Start Manual
You can view the active power, reactive power, fre-quency, and change in voltage for intervals up to 5 days.
Measurementlocation
Three-phase 3-wire 400 V power line on a power distribution board (50 Hz, 50 A load)
Application • To view the MAX, MIN, and AVE values for fluctuations in active power, reactive power, frequency, and voltage over a 5-day inter-val
• To check recorded conditions using the fluctuation graph. Fur-ther, to view the voltage and current waveforms for that condi-tion.
6.2 Change in Power
1. Measurement preparations
2. Making 3196 settings (measurement settings)Use the same method as three-phase checking. (page 58)
3. Connecting to the lines to be measuredUse the same method as three-phase checking. (page 59)
4. Checking the connectionsUse the same method as three-phase checking. (page 60)
Required for connection: • 3196 + 9458 AC ADAPTER +
9459 BATTERY PACK• 9438-02 VOLTAGE CORD
(One cord each of red, yellow, and blue, and three black cords.)
• 9661 CLAMP ON SENSOR, 3 each
When using the three-phase connec-tion adapter• 9264-01 WIRING
ADAPTER(3P3W3M)• 9438-02 VOLTAGE CORD
(One cord each of red, yellow, and blue.)
Breaker for power distribution
Load side
Source side
Power distri-bution board
A B C
ON

0
1
Measurem
ent Method
6.2 Change in Power
65
1
2
3
4
5
6
7
8
9
1
1
5. Making 3196 settings (recording settings)
RECORDING
Make the following settings.
Shows the maximum interval that you can record for using the above settings.
When recording to a PC card: Insert a Flash ATA card into the PC card slot. Recorded data is automatically saved to the internal memory at the same time.
You can increase the maximum recording interval by using an ATA Flash card.Example: When using a 32-MB PC card, the record-ing capacity increases about 4 times. A recording interval of 20 days, 7 hours, and 24 minutes is pos-sible.
Setting Item Selections
Rec. Data Power, MAX/MIN/AVE
Memory Full STOP
Interval 1 min (5 days, 1 h, 51 m)
Setting Item Selections
Memory Full LOOP
Auto Save BINARY
Select item
Select from pull-down menu
Confirm
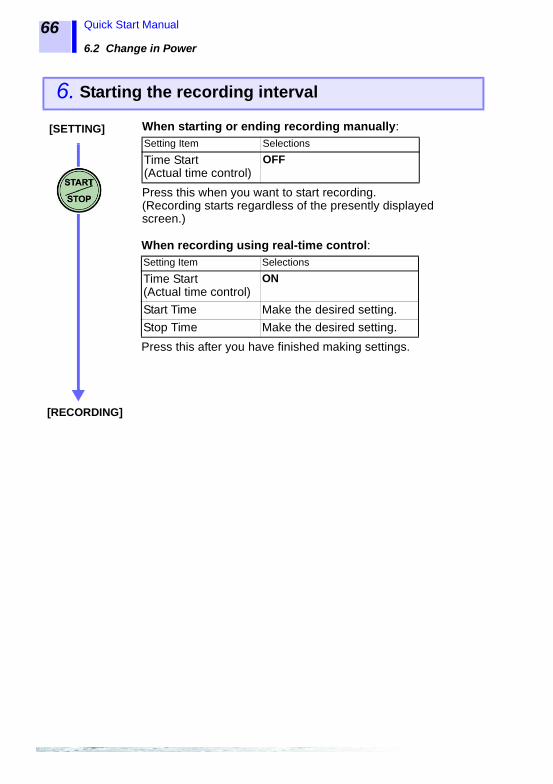
6.2 Change in Power
66 Quick Start Manual
6. Starting the recording interval
When recording using real-time control:
Press this after you have finished making settings.
Setting Item Selections
Time Start(Actual time control)
ON
Start Time Make the desired setting.
Stop Time Make the desired setting.
[SETTING]
[RECORDING]
When starting or ending recording manually:
Press this when you want to start recording. (Recording starts regardless of the presently displayed screen.)
Setting Item Selections
Time Start(Actual time control)
OFF
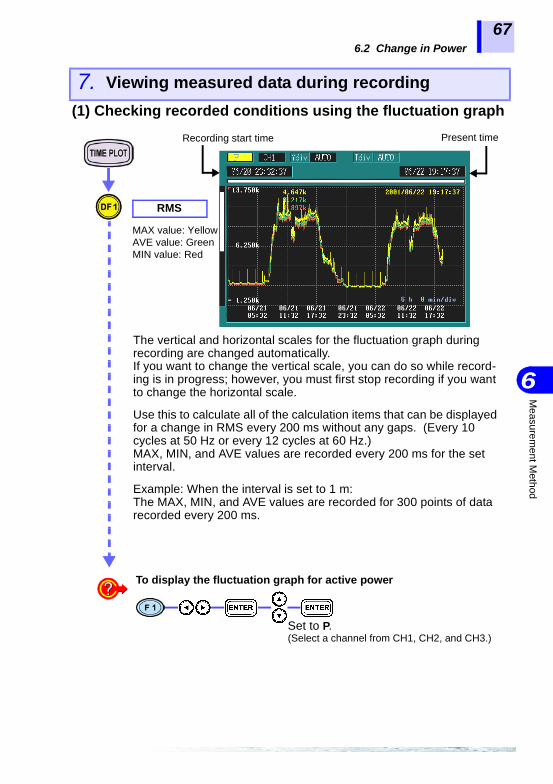
0
1
Measurem
ent Method
6.2 Change in Power
67
1
2
3
4
5
6
7
8
9
1
1
7. Viewing measured data during recording
(1) Checking recorded conditions using the fluctuation graph
RMS
The vertical and horizontal scales for the fluctuation graph during recording are changed automatically. If you want to change the vertical scale, you can do so while record-ing is in progress; however, you must first stop recording if you want to change the horizontal scale.
Use this to calculate all of the calculation items that can be displayed for a change in RMS every 200 ms without any gaps. (Every 10 cycles at 50 Hz or every 12 cycles at 60 Hz.)MAX, MIN, and AVE values are recorded every 200 ms for the set interval.
Example: When the interval is set to 1 m: The MAX, MIN, and AVE values are recorded for 300 points of data recorded every 200 ms.
To display the fluctuation graph for active power
Set to P.(Select a channel from CH1, CH2, and CH3.)
MAX value: YellowAVE value: GreenMIN value: Red
Recording start time Present time

6.2 Change in Power
68 Quick Start Manual
(2) Confirming voltage and current waveforms during record-ing
8. Ending the recording interval
VOLT/CURR
You can confirm the setting contents (SYSTEM-DF2) and wave-form display (VIEW-DF1/2/3/4) during recording, but you cannot change the contents of setting. When you want to change the setting contents, you must stop recording first.
When recording was started manually: Press this when you want to end recording.(You can end recording regardless of the presently displayed screen.)
When set to record using real-time control: Recording ends automatically when the recording end time is reached.
[ANALYZING] If the internal memory becomes full (when the memory is full and "STOP" is selected) or the PC card memory becomes full (when the memory is full and "LOOP" is selected), recording ends automatically.
To end recording and start it again
Start recording
In this case, recorded data is deleted. Therefore, to preserve data, be sure to save it to a PC Card.
Recorded data is erased whenever the instrument is turned off. Therefore, to preserve recorded data, be sure to save it to a PC Card. ❖ Data Recording, Saving, Loading and Deleting(page 53)
[RECORDING]

0
1
Measurem
ent Method
6.2 Change in Power
69
1
2
3
4
5
6
7
8
9
1
1
9. Viewing measured data that has been recorded
Viewing the change in MAX, MIN, and AVE values for RMS voltage over a 5-day interval
RMS
This indicates the area that displays the fluctuation graph for recorded internal memory capacity.
To display the fluctuation graph for active power, reactive power,frequency, and voltage
To change the scale for the Y- or X-axis
Use the same method as three-phase checking for cursor mea-surement and scrolling.❖ To measure the cursor(page 62)❖ To scroll the waveform(page 62)
Displayed items: P, Q, Freq, U, Uave, Displayed channel: CH1, CH2, CH3, sum(Shows 1, 2, 3: channel, sum: total value for three-phase, and ave: average value for three-phase.)
Y-axis Y div: x1, x2, x5, x10, x25, x50X-axis T div: x1, x1/2, x1/4, x1/8, x1/16, x1/32, x1/64
MAX value: YellowAVE value: GreenMIN value: Red
Recording start time Present time
You can display either screen 1 or screen 2.
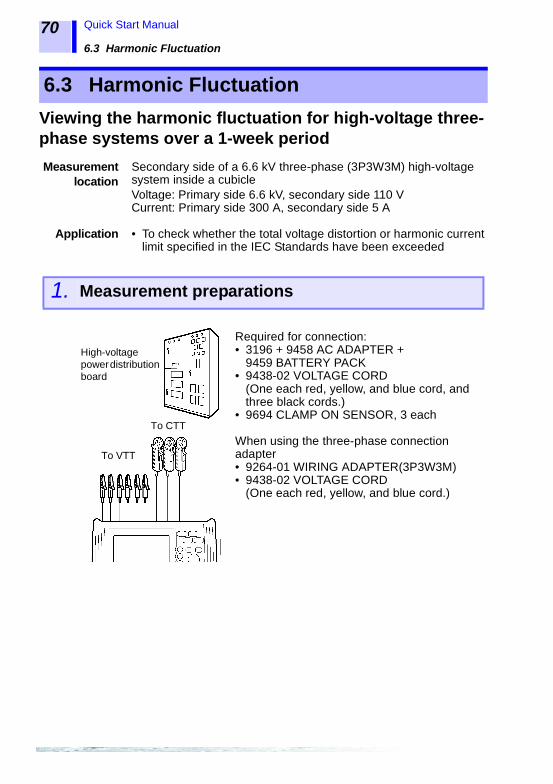
6.3 Harmonic Fluctuation
70 Quick Start Manual
Viewing the harmonic fluctuation for high-voltage three-phase systems over a 1-week period
Measurementlocation
Secondary side of a 6.6 kV three-phase (3P3W3M) high-voltage system inside a cubicleVoltage: Primary side 6.6 kV, secondary side 110 VCurrent: Primary side 300 A, secondary side 5 A
Application • To check whether the total voltage distortion or harmonic current limit specified in the IEC Standards have been exceeded
6.3 Harmonic Fluctuation
1. Measurement preparations
Required for connection: • 3196 + 9458 AC ADAPTER +
9459 BATTERY PACK• 9438-02 VOLTAGE CORD
(One each red, yellow, and blue cord, and three black cords.)
• 9694 CLAMP ON SENSOR, 3 each
When using the three-phase connection adapter• 9264-01 WIRING ADAPTER(3P3W3M)• 9438-02 VOLTAGE CORD
(One each red, yellow, and blue cord.)
High-voltage power distribution board
To VTT
To CTT

0
1
Measurem
ent Method
6.3 Harmonic Fluctuation
71
1
2
3
4
5
6
7
8
9
1
1
2. Making 3196 settings (measurement settings)
MEASURE
Make the following settings.Setting Item Selections
123ch/ Wiring 3P3W3M123ch/ Clamp 10mV/A 9694123ch/ U Range 150V123ch/ PT Ratio 60123ch/ I Range 50 A123ch/ CT Ratio 60UReference 110VFrequency 50 HzPLL Source U1U CalcType LINE-LINEHarm Calc LEVELTHD Calc THD_FEN50160 OFF
Select item
Select from pull-down menu
Confirm
3. Connecting to the lines to be measuredUse the same method as with three-phase checking. (page 59)
4. Checking the connectionsUse the same method as with three-phase checking. (page 60)
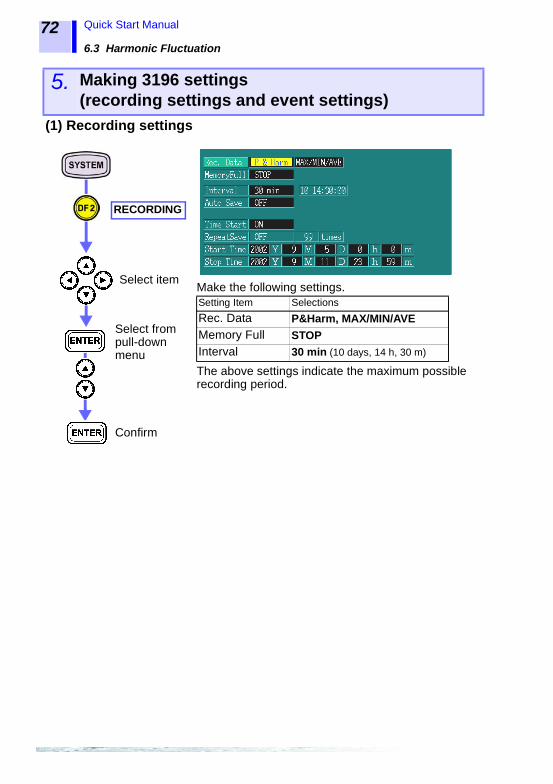
6.3 Harmonic Fluctuation
72 Quick Start Manual
5. Making 3196 settings (recording settings and event settings)
(1) Recording settings
RECORDING
Make the following settings.
The above settings indicate the maximum possible recording period.
Setting Item Selections
Rec. Data P&Harm, MAX/MIN/AVEMemory Full STOPInterval 30 min (10 days, 14 h, 30 m)
Select item
Select from pull-down menu
Confirm

0
1
Measurem
ent Method
6.3 Harmonic Fluctuation
73
1
2
3
4
5
6
7
8
9
1
1
(2) Event settings
POWER
Make the following settings.[POWER]
[HARMONICS]
Setting Item Selections
123ch/U THD(Voltage distortion factor)
5%
Setting Item Selections
123ch/I THD(Current harmonic)
Set the harmonic current limit specified in the IEC Standards
Select item
Select from pull-down menu
Confirm
EVENT
HARMONICS
6. Starting the recordingUse the same method as when measuring power fluctuation. (page 66)

6.3 Harmonic Fluctuation
74 Quick Start Manual
7. Viewing measured data during recording
Checking recording conditions with the fluctuation graph
HARMONICS
The horizontal scale of the fluctuation graph are changed automati-cally during recording. If you want to change the scale, you must stop recording first.
All calculation items that can be displayed for harmonic fluctuation are calculated without gaps every 200 ms. (Every 10 cycles at 50 Hz or every 12 cycles at 60 Hz.)MAX, MIN, and AVE values are recorded every 200 ms for the set interval. The graph displays values such the MAX, MIN, and AVE val-ues as a single line.
Example: When the interval is set to 1 m: The MAX, MIN, and AVE values are recorded for 300 points of data recorded every 200 ms.
To display the fluctuation graph for harmonic current I1
To display the 5th, 7th, 11th, 13th, and 19th harmonic orders
Set to I1.
Set to 5, 7, 11, 13, 17, 19.
Recording start time Current time

0
1
Measurem
ent Method
6.3 Harmonic Fluctuation
75
1
2
3
4
5
6
7
8
9
1
1
8. Ending the recording intervalUse the same method as when measuring power fluctuation. (page 68)
9. Viewing recorded measurement data
Monitoring fluctuation in MAX, MIN, and AVE values for har-monic RMS voltage over a 1-week period
(1) Checking whether total voltage distortion specified in the IECStandards has been exceeded.
Checking using the time series graph
RMS
To display the fluctuation graph for the total voltage distortion factor
Total voltage distortion: U-THD (Select from CH1, CH2, and CH3.)
Recording start time Current time
This indicates the area in recorded in-ternal memory that is shown in the fluctua-tion graph.
MAX value: YellowAVE value: GreenMIN value: Red
An event occurs when the total voltage distortion factor or harmonic current limit specified in the IEC Standards is exceeded.If the mark is displayed in the time series graph, an event has occurred. However, an event occurs whenever recording starts and stops.

6.3 Harmonic Fluctuation
76 Quick Start Manual
(2) Checking whether the harmonic current limit specified in theIEC Standards has been exceeded.
Checking using the time series graph
HARMONICS
To display the fluctuation graph for harmonic current
Harmonic current: I (Select a channel from CH1, CH2, and CH3.)
Recording start time Recording end time
This indicates the area in recorded in-ternal memory that is shown in the fluctua-tion graph.
An event occurs when the total voltage distortion factor or harmonic current limit specified in the IEC Standards is exceeded.If the mark is displayed in the time series graph, an event has occurred.

0
1
Measurem
ent Method
6.3 Harmonic Fluctuation
77
1
2
3
4
5
6
7
8
9
1
1
Checking using the event list
LIST
To display waveforms for event occurrence
Select the number that you want to display from the event list.
VIEW screen
VOLT/CURRReturns the screen to the event list.
An event occurs when the total voltage distortion factor or harmonic current limit specified in the IEC Standards is exceeded.If HARM or THD is displayed in the event category area, an event has occurred.
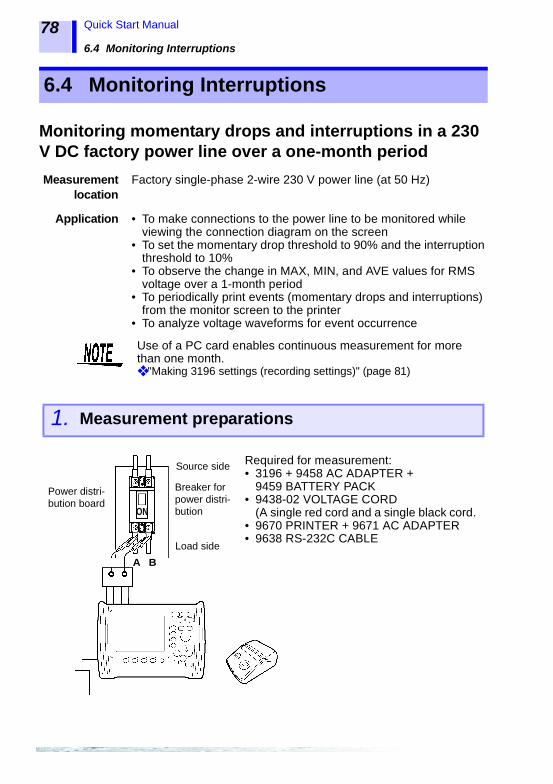
6.4 Monitoring Interruptions
78 Quick Start Manual
Monitoring momentary drops and interruptions in a 230 V DC factory power line over a one-month period
Measurementlocation
Factory single-phase 2-wire 230 V power line (at 50 Hz)
Application • To make connections to the power line to be monitored while viewing the connection diagram on the screen
• To set the momentary drop threshold to 90% and the interruption threshold to 10%
• To observe the change in MAX, MIN, and AVE values for RMS voltage over a 1-month period
• To periodically print events (momentary drops and interruptions) from the monitor screen to the printer
• To analyze voltage waveforms for event occurrence
6.4 Monitoring Interruptions
Use of a PC card enables continuous measurement for more than one month.❖ "Making 3196 settings (recording settings)" (page 81)
1. Measurement preparations
Required for measurement: • 3196 + 9458 AC ADAPTER +
9459 BATTERY PACK• 9438-02 VOLTAGE CORD
(A single red cord and a single black cord.)• 9670 PRINTER + 9671 AC ADAPTER• 9638 RS-232C CABLE
Breaker for power distri-bution
Load side
Source side
Power distri-bution board
A B
ON
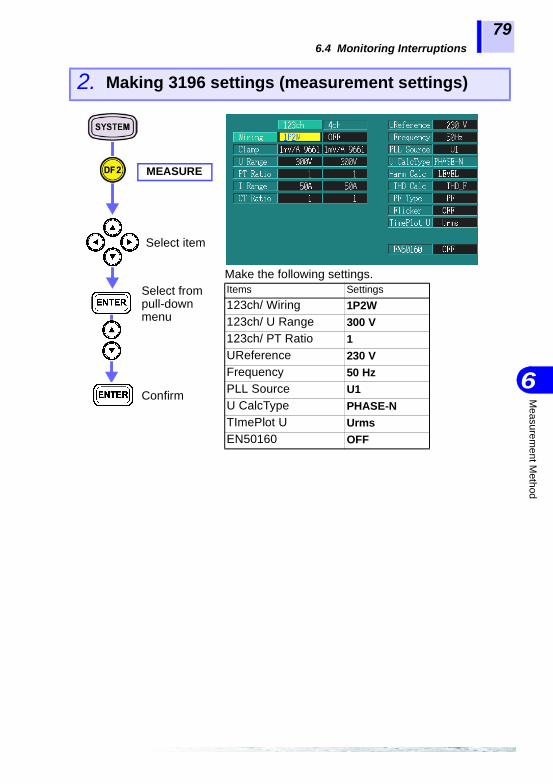
0
1
Measurem
ent Method
6.4 Monitoring Interruptions
79
1
2
3
4
5
6
7
8
9
1
1
2. Making 3196 settings (measurement settings)
MEASURE
Make the following settings.Items Settings
123ch/ Wiring 1P2W123ch/ U Range 300 V123ch/ PT Ratio 1UReference 230 VFrequency 50 HzPLL Source U1U CalcType PHASE-NTImePlot U UrmsEN50160 OFF
Select item
Select from pull-down menu
Confirm

6.4 Monitoring Interruptions
80 Quick Start Manual
3. Connecting to the lines to be measured
Source side
LOA
D
Load side
L
N
E
Black
Red
SO
UR
CE
Point the arrows toward the Load
L: Line, N: Neutral, E:
U- U+ U- U+ U- U+ U- U+
U INPUT I INPUTCH1 CH2 CH3 CH4CH1 CH2 CH3 CH4
• Is the voltage displayed for CH1 approximately 230 V?
Confirm the connection on the screen.
WIRING
Connect the 3196 to the power line to be moni-tored while viewing the connection diagram.
1P2W
Black voltage cord: Power outlet N terminalRed voltage cord: Power outlet L terminal

0
1
Measurem
ent Method
6.4 Monitoring Interruptions
81
1
2
3
4
5
6
7
8
9
1
1
4. Making 3196 settings (recording settings)
RECORDING
Make the following settings.
The above settings indicate the maximum possible recording period.
When recording to a PC card: Insert an ATA Flash card into the PC card slot. Recorded data is automatically saved to the inter-nal memory at the same time.
You can increase the maximum recording interval by using an ATA Flash card.
Example: When using a 64 MB PC card, the recording capacity is increased about 9 times. When measuring for an identical recording interval over one month, you can set the interval to 15 s.
Items Settings
Rec. Data
Power, AVE(You can observe the MAX and MIN values on the voltage fluctua-tion graph even if only AVE set-tings are made.)
Memory Full STOPInterval 5 m (31 days)
Items Settings
Memory Full LOOPAuto Save BINARY
Select item
Select from pull-down menu
Confirm
When recording data for more than one month:Make the same setting as described in “When recording to a PCcard:” and turn on the setting for repeated recording (for whichthe number of repeated recording operations must be set).Data is recorded in files on a PC card, each containing the data of a one-month period.For details, See the Instruction Manual (CD-R version).

6.4 Monitoring Interruptions
82 Quick Start Manual
5. Making 3196 settings (hardware settings)
HARDWARE
Make the following settings.
If you set the 3196 to print a hard copy to the printer every 2 hours, you can print 360 times in a single month.If you connect the printer, the printer mark appears in the upper left of the screen when hard copying becomes possible.When manually printing hard copies as required:
Press .
Items Settings
RS-232C PRINTER, 19200 bpsTimer COPY, 2 hour
Select item
Select from pull-down menu
Confirm

0
1
Measurem
ent Method
6.4 Monitoring Interruptions
83
1
2
3
4
5
6
7
8
9
1
1
6. Making 3196 settings (event settings)
VOLTAGE
Make the following settings.
Dips and voltage interruptions are observed as RMS values.
When you want to detect partial dropouts in a waveform:
Items Settings
Urms DIP(Voltage Dip)
90%(Voltage is 90% of nominal 230 V: 207 V)
U Interrupt(Voltage interrup-tions)
10%(Voltage is 10% of nominal 230 V: 23 V)
Items Settings
U wave(Voltage waveform comparison)
(ON) Set the event level. You can detect partial waveform drop-outs on the order of ms.
U Transient(Voltage Transient)
(ON) Set the event level. You can detect partial waveform drop-outs on the order of μs.
Select item
Select from pull-down menu
Confirm

6.4 Monitoring Interruptions
84 Quick Start Manual
7. Changing to a screen for hard copy
MONITOR
"0" is displayed when no event has occurred.If an event occurs, the color changes to red and the count is incre-mented. Starts and stops in recording are classed as events. Note that when recording starts, "Other (Ext)" changes to red and the value becomes "1."When TIMER or PRINTER is set by SYSTEM-DF2-HARDWARE, a hard copy is printed to the printer at the set interval.
Display the screen to be printedExample: Event monitor screen
8. Starting the recording intervalUse the same method as when measuring power fluctuation. (page 66)

0
1
Measurem
ent Method
6.4 Monitoring Interruptions
85
1
2
3
4
5
6
7
8
9
1
1
9. Viewing measurement data
(1) Checking recording conditions with the fluctuation graph
INTERVAL
The vertical and horizontal scales of the fluctuation graph change auto-matically during recording. If you want to change the vertical scale, you can do so while recording is in progress; however, you must first stop recording if you want to change the horizontal scale.
The change in voltage display settings are sampled at 256 points per cycle, and are calculated without any gaps for one wave shifted over half a wave. You can record MAX and MIN values from RMS voltage data every half wave over the set interval.
Example: When the interval is set to 1 s: The MAX and MIN values are recorded from 100 points of half wave voltage data. (At 50 Hz.)
You can confirm the contents of settings (SYSTEM-DF2) and waveform display (VIEW-DF1/2/3/4) during recording, but you cannot change them. When you want to change the settings, you must stop recording first.
Recording start time Current time
Shows the MAX and MIN real-time values.The MAX and MIN val-ues are recorded to-gether. Displays a time series graph in red only for single-phase 2-wire settings (effective for CH1 only).

6.4 Monitoring Interruptions
86 Quick Start Manual
(2) View the voltage fluctuation graph for an event
EVENT
Voltage values calculated for a single waveform shifted by a half wave are displayed without alteration as a voltage fluctuation graph.With the single-phase 2-wire setting (measurement of CH1 only), only a red time series graph is displayed.
The vertical and horizontal scales of the fluctuation graph change auto-matically during recording. If you want to change the vertical scale, you can do so while recording is in progress; however, you must first stop recording if you want to change the horizontal scale.
The change in voltage display settings are sampled at 256 points per cycle, and are calculated without any gaps for one wave shifted over half a wave. Recording is preset for a pre-trigger of 0.5 second and a fixed recording length of 10 seconds.
Only one fluctuation graph is recorded in internal memory.You can read multiple fluctuation graphs by using a PC card.In [SYSYTEM]-DF2 MAIN[RECORDING], set “Auto Save” to “BINARY”.
Recording start time Current time
When a voltage dip or voltage interruption occurs, display a graph of voltage fluctuation at the time of event occurrence.
10. Ending the recording intervalUse the same method as when measuring power fluctuation. (page 68)

0
1
Measurem
ent Method
6.4 Monitoring Interruptions
87
1
2
3
4
5
6
7
8
9
1
1
11. Analyzing voltage waveforms upon event occur-rence
LIST
Methods for changing the amplitude and number of waveformcycles, measuring the cursor, and scrollingUse the same method as with three-phase checking. ❖ To change the waveform’s amplitude and its number of waves(page 62)❖ To measure the cursor(page 62)❖ To scroll the waveform(page 62)
Returning from the VIEW screen to the EVENT screen
Event occurrence displayFor the start of voltage dip occurrences: DIP, CH1, INFor the end of voltage dip occurrences: DIP, CH1, OUTFor the start of interruptions: Inter, CH1, INFor the end of interruptions: Inter, CH1, OUT
Displays the waveform for the event occurrence.
Select the number that you want to display from the event list.
VIEW screen dis-play upon event occurrence
• WAVE• VECTOR• DMM• HARMONICS
You can scroll to display the waveform at the point where the threshold was exceeded.

6.5 Detecting Transients and Waveform Distortion
88 Quick Start Manual
Detecting the intermittently occurring transients (impulse) and distortion in voltage waveforms of large electrical devices
Measurementlocation
Power lead-in for large electrical devices that operate using a three-phase 3-wire 400 V system
Application • To set the transient threshold• To set the waveform distortion threshold• To observe the change in MAX and MIN values for RMS voltage
over a 1-month period• To confirm whether an event (transient or waveform distortion)
has occurred• To display and analyze distorted waveforms that have been
detected• To display and analyze transient waveforms that have been
detected
6.5 Detecting Transients and Waveform Dis-tortion
1. Measurement preparations
Power distribution circuit breaker
Load side
Source side
Power distribu-tion board
A B C
ON
Required for measurement: • 3196 + 9458 AC ADAPTER +
9459 BATTERY PACK• 9438-02 VOLTAGE CORD
(One each red, yellow, and blue cord, and three black cords.)
When using the three-phase connec-tion adapter• 9264-01 WIRING
ADAPTER(3P3W3M)• 9438-02 VOLTAGE CORD
(One each red, yellow, and blue cord.)

0
1
Measurem
ent Method
6.5 Detecting Transients and Waveform Distortion
89
1
2
3
4
5
6
7
8
9
1
1
2. Making 3196 settings
MEASURE
Make the following settings.Items Settings
123ch/ Wiring 3P3W3M123ch/ U Range 600V123ch/ PT Ratio 1123ch/ I Range 50 AUReference 400 VFrequency 50 HzPLL Source U1U CalcType LINE-LINETimePlot U Urms
EN50160 OFF
Select item
Select from pull-down menu
Confirm
3. Connecting to the lines to be measuredUse the same method as with three-phase checking. (page 59)
4. Checking the connectionsUse the same method as with three-phase checking. (page 60)

6.5 Detecting Transients and Waveform Distortion
90 Quick Start Manual
5. Making 3196 settings (recording settings)
RECORDING
Make the following settings.
Shows the maximum interval that you can record with the settings above.
When recording to a PC card: Insert an ATA Flash card into the PC card slot. Recorded data is automatically saved to the inter-nal memory at the same time.
You can increase the maximum recording interval by using an ATA Flash card.
Example: When using a 64 MB PC card, the recording capacity is increased about 9 times. When measuring for an identical recording interval over one month, you can set the interval to 15 s.
Items Settings
Rec. Data
Power, AVE(You can observe the MAX and MIN values on the voltage fluctua-tion graph when AVE is set.)
Memory Full STOP
Interval 5 m (31 days)
Items Settings
Memory Full LOOP
Auto Save BINARY
Select item
Select from pull-down menu
Confirm

0
1
Measurem
ent Method
6.5 Detecting Transients and Waveform Distortion
91
1
2
3
4
5
6
7
8
9
1
1
6. Making 3196 settings (event settings)
VOLTAGE
Make the following settings.Items Settings
U wave(Voltage waveform comparison)
10%The distortion component is detected by comparison with the immediately preced-ing waveform measurement, and is set as a percentage (%) of range. The upper and lower threshold levels are set.
U Transient(Voltage Transient)
0.0600 kVSpecified as the noise level (in kV units) superposed on the normal voltage wave-form. Upper and lower threshold levels are set. To find the superposition area, you can also detect extremely small amounts of noise included where the normal voltage waveform approaches the zero crossing.
Select item
Select from pull-down menu
Confirm
7. Starting the recordingUse the same method as when measuring power fluctuation. (page 66)

6.5 Detecting Transients and Waveform Distortion
92 Quick Start Manual
8. Viewing measurement data
Checking recording conditions with the fluctuation graph
VOLTAGE
The vertical and horizontal scales of the fluctuation graph change auto-matically during recording. If you want to change the vertical scale, you can do so while recording is in progress; however, you must first stop recording if you want to change the horizontal scale.
Voltage fluctuation display items are sampled at 256 points per cycle, and are calculated without any gaps for one wave shifted over half a wave. You can record MAX and MIN values calculated every 200 ms over the set interval (including RMS voltage data every half wave).
Example: When the interval is set to 1 s: The MAX and MIN values are recorded from 100 points of half wave voltage data. (At 50 Hz.)
You can confirm the contents of settings (SYSTEM-DF2) and wave-form display (VIEW-DF1/2/3/4) during recording, but you cannot change them. When you want to change the settings, you must stop recording first.
Recording start time Current time
Shows the MAX and MIN real-time values.The MAX and MIN val-ues are recorded to-gether. Records the voltage for CH1, CH2, and CH3 using three-phase 4-wire settings.
CH1: red CH2: Yellow CH3: Blue

0
1
Measurem
ent Method
6.5 Detecting Transients and Waveform Distortion
93
1
2
3
4
5
6
7
8
9
1
1
9. To determine if an event occurs
MONITOR
"0" is displayed when no event has occurred.If an event occurs, the color changes to red and the count is incremented.
Starts and stops in recording are classed as events. Note that when recording starts, "Other (Ext)" changes to red and the value becomes "1".
10. Ending the recording intervalUse the same method as when measuring power fluctuation. (page 68)

6.5 Detecting Transients and Waveform Distortion
94 Quick Start Manual
11. Analyzing waveforms in which events are detected
(1) Displays the event waveform
LIST
Methods for changing the amplitude and number of waveformcycles, measuring the cursor, and scrollingUse the same method as with three-phase checking. ❖ To change the waveform’s amplitude and its number of waves(page 62)❖ To measure the cursor(page 62)❖ To scroll the waveform(page 62)
Returning from the VIEW screen to the EVENT screen
Event occurrence displayFor voltage waveform comparison event occurrences: Wave(The channel that the event occurred on is displayed.)For voltage transient event occurrences: Tran(The channel that the event occurred on is displayed.)
Displays the waveform for the event occur-rence.
Select the number that you want to display from the event list.
VIEW screen dis-play for an event occurrenceIndicator
• WAVE• VECTOR• DMM• HARMONICS
You can scroll to display the waveform at the point where the threshold was exceeded.

0
1
Measurem
ent Method
6.5 Detecting Transients and Waveform Distortion
95
1
2
3
4
5
6
7
8
9
1
1
(2) Displaying the transient waveform
The screen is divided into two screens, and the lower one switches from current waveform display to transient waveform display. You cannot display the transient waveform display unless the voltage/current screen is displayed.
Transient waveform
(VIEW voltage/current screen)
You can switch to the current waveform dis-play.
Selecting a specific transient from among multiple event categories
To change the transient waveform’s amplitude and display interval
Scrolling transient waveforms
Methods for changing the amplitude and number of waves for volt-age waveforms, measuring the cursor, and scrollingUse the same method as with three-phase checking. ❖ To change the waveform’s amplitude and its number of waves(page 62)❖ To measure the cursor(page 62)(Only for current waveform display.)❖ To scroll the waveform(page 62)(Only for current waveform display.)
Returning from the VIEW screen to the EVENT screen
Selects a transient to be displayed in the voltage waveform. The mark is displayed where the transient occurred on the voltage waveform screen.
Changing the amplitude: x1/2, x1, x2, x4, x8, x16Changing the display interval: 25, 50,100, 200, 400 μs/div

6.6 ΔV10 Flicker
96 Quick Start Manual
Recording ΔV10 flicker in one phase of a high-voltage, three-phase system over a 5-day period
Measurementlocation
RS interline voltage on the secondary side of a 6.6 kV three-phase (3P3W3M) high-voltage system inside a measurement cubicle:Primary side 6.6 kV, secondary side 110 V
Application • To check whether Δ V10 flicker exceeds limits specified in the domestic guidelines
• To check the deviation of voltage fluctuations with respect to a standard voltage
6.6 ΔV10 Flicker
Other measurements (such as harmonic measurements) can be performed simultaneously with Δ V10 flicker measurement.Here, we discuss the case in which only a voltage is connected.
1. Measurement preparations
A B C
Required for measurement: • 3196 + 9458 AC ADAPTER +
9459 BATTERY PACK• 9438-02 VOLTAGE CORD
(One each red, yellow, and blue cord, and three black cords.)
When using the three-phase connec-tion adapter• 9264-01 WIRING
ADAPTER(3P3W3M)• 9438-02 VOLTAGE CORD
(One each red, yellow, and blue cord.)
High-voltage power distribution board
To VTT
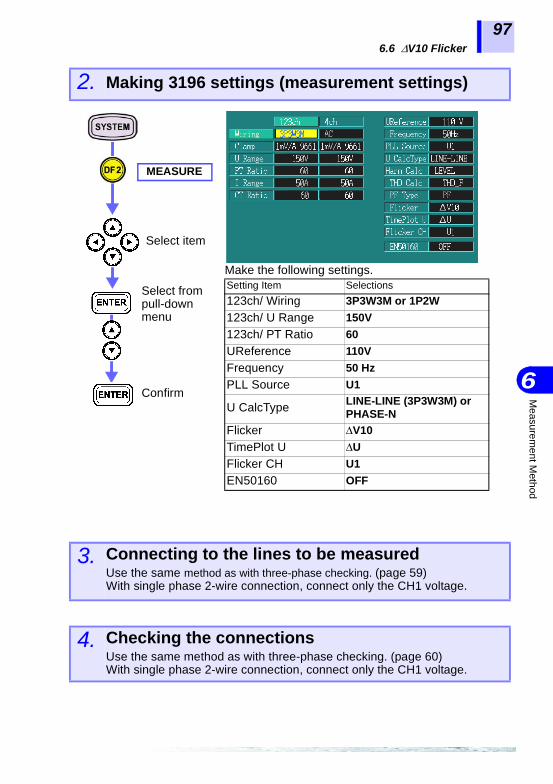
0
1
Measurem
ent Method
6.6 ΔV10 Flicker
97
1
2
3
4
5
6
7
8
9
1
1
2. Making 3196 settings (measurement settings)
MEASURE
Make the following settings.Setting Item Selections
123ch/ Wiring 3P3W3M or 1P2W
123ch/ U Range 150V
123ch/ PT Ratio 60
UReference 110V
Frequency 50 Hz
PLL Source U1
U CalcType LINE-LINE (3P3W3M) orPHASE-N
Flicker ΔV10
TimePlot U ΔU
Flicker CH U1
EN50160 OFF
Select item
Select from pull-down menu
Confirm
3. Connecting to the lines to be measuredUse the same method as with three-phase checking. (page 59)With single phase 2-wire connection, connect only the CH1 voltage.
4. Checking the connectionsUse the same method as with three-phase checking. (page 60)With single phase 2-wire connection, connect only the CH1 voltage.

6.6 ΔV10 Flicker
98 Quick Start Manual
5. Making 3196 settings (recording settings)
Event detection is not possible using the Δ V10 flicker value. Accordingly, event settings are not made.
RECORDING
Make the following settings.
Shows the maximum interval that you can record with the settings above.
Items Settings
Rec. Data
Power, AVE(You can observe the MAX and MIN values on the voltage fluctuation graph when AVE is set.)
Memory Full STOP
Interval 30 sec (6 days 22 hours 10 minutes)
Select item
Select from pull-down menu
Confirm
6. Starting the recordingUse the same method as when measuring power fluctuation. (page 66)
The Δ V10 reference value is generated automatically using AGC (automatic gain control) generated over 1-minute with a low pass filter.BPF (bandpass filters) are used for flicker detection. Due to theeffect of the HPF (highpass filter), the first and second Δ V10flicker values measured may be large if measurement is begunimmediately after making settings. Therefore, after making con-nections and settings, we recommend waiting about 3 minutesbefore starting measurement.

0
1
Measurem
ent Method
6.6 ΔV10 Flicker
99
1
2
3
4
5
6
7
8
9
1
1
7. Viewing measurement data
Checking recording conditions with the fluctuation graph(1) Checking the deviation of voltage fluctuations with respect to
a standard voltage
INTERVAL
The vertical and horizontal scales of the fluctuation graph change auto-matically during recording. If you want to change the vertical scale, you can do so while recording is in progress; however, you must first stop recording if you want to change the horizontal scale.
Voltage fluctuation value (ΔU) are sampled at 256 points per cycle, and are calculated without any gaps for one wave shifted over half a wave. You can record MAX and MIN values from RMS voltage data every half wave over the set interval.
Example: When the interval is set to 1 s: The MAX and MIN values are recorded from 100 points of half wave voltage data. (At 50 Hz.)
Recording start time Current time
Shows the MAX and MIN real-time values.The MAX and MIN val-ues are recorded to-gether. When 3P3W3M setting:Red: CH1Yellow: CH2Blue: CH3
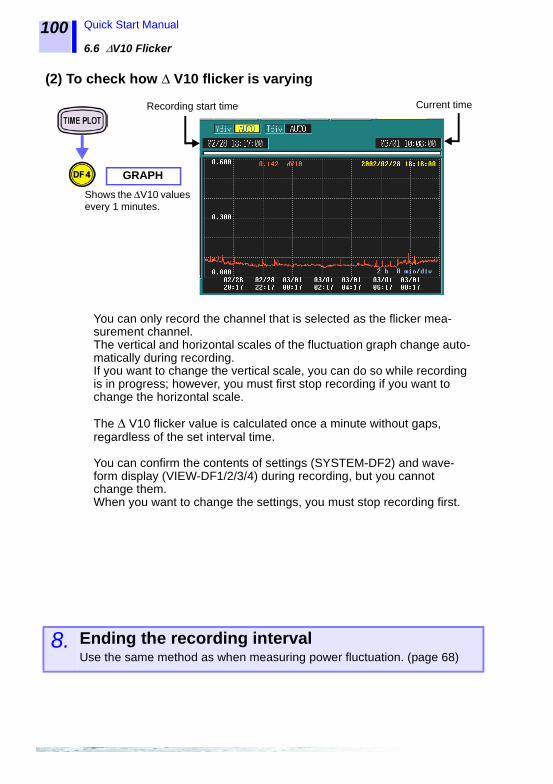
6.6 ΔV10 Flicker
100 Quick Start Manual
(2) To check how Δ V10 flicker is varying
GRAPH
You can only record the channel that is selected as the flicker mea-surement channel.The vertical and horizontal scales of the fluctuation graph change auto-matically during recording. If you want to change the vertical scale, you can do so while recording is in progress; however, you must first stop recording if you want to change the horizontal scale.
The Δ V10 flicker value is calculated once a minute without gaps, regardless of the set interval time.
You can confirm the contents of settings (SYSTEM-DF2) and wave-form display (VIEW-DF1/2/3/4) during recording, but you cannot change them. When you want to change the settings, you must stop recording first.
Recording start time Current time
Shows the ΔV10 values every 1 minutes.
8. Ending the recording intervalUse the same method as when measuring power fluctuation. (page 68)

0
1
Measurem
ent Method
6.6 ΔV10 Flicker
101
1
2
3
4
5
6
7
8
9
1
1
9. Checking recorded measurement data
To check whether Δ V10 flicker has exceeded a threshold
LIST
Fourth maximum value over 1 hour
The Δ V10 statistics are confirmed from the list display.
Values displayed as statistics are the average over one hour, the maxi-mum value over one hour, the fourth maximum value over one hour, and the overall maximum (during the measurement period.)Ordinarily, the Δ V10 value must be taken as the threshold, the aver-age prevented from exceeding 0.32, and the maximum prevented from exceeding 0.45.The average over one hour value is used as the average.One of the maximum value over one hour, the fourth maximum value over one hour, or the overall maximum (during the measurement period) is used for the maximum value.
Average over 1 hour
Maximum value over 1 hour

6.7 IEC Flicker
102 Quick Start Manual
Record IEC flicker for three phases on a 230V distribu-tion board over a period of 5 days.
Measurementlocation
3-phase 4-wire 230 V distribution board line (50 Hz)
Application • Check the degree of flicker (Pst, Plt) using the international IEC procedure.
• Determine the degree of fluctuation in instantaneous flicker value S(t), which is a measure of perceived instantaneous flickering.
6.7 IEC Flicker
The IEC flicker function is based on international standard IEC61000-4-15, “Flickermeter - Functional and design specifications”.Simultaneous measurement of IEC flicker and ΔV10 flicker is not pos-sible. Select one or the other for measurement.Other measurements (such as harmonic measurements) can be per-formed simultaneously with IEC flicker measurement.Here, we discuss the case in which only a voltage is connected.
1. Measurement preparations
Required for measurement: • 3196 + 9458 AC ADAPTER +
9459 BATTERY PACK• 9438-02 VOLTAGE CORD
(One each red, yellow, and blue cord, and three black cords.)
When using the three-phase connec-tion adapter• 9264-02 WIRING ADAPTER(3P4W)• 9438-02 VOLTAGE CORD
(One each red, yellow, blue, and black cord.)
Power distribution circuit breaker
Load side
Source side
Power distribution board
ON
A B C N

0
1
Measurem
ent Method
6.7 IEC Flicker
103
1
2
3
4
5
6
7
8
9
1
1
2. Making 3196 settings (measurement settings)
Characteristics of weighting filters set forth in the IEC standards differfor 230 V lamp, 50 Hz systems and 120 V lamp, 60 Hz systems.Select the filter that matches the voltage of the point being measured.
3. Connecting to the lines to be measuredUse the same method as with three-phase checking. (page 59)For three phase 4-wire connection; (page 49)
4. Checking the connectionsUse the same method as with three-phase checking. (page 60)For three phase 4-wire connection check, (page 49)
MEASURE
Make the following settings.Setting Item Selections
123ch/ Wiring 3P4W
123ch/ U Range 300V
123ch/ PT Ratio 1
UReference 230V
Frequency 50 Hz
PLL Source U1
U CalcType PHASE-N
Flicker Pst, Plt
TimePlot U S(t)
Filter 230V lamp
EN50160 OFF
Select item
Select from pull-down menu
Confirm
6.7 IEC Flicker
104 Quick Start Manual
5. Making 3196 settings (recording settings)Use the same method as ΔV10 Flicker (page 98)
Event detection is not possible using the Pst, Plt, S(t) value. Accordingly, event settings are not made.
6. Starting the recordingUse the same method as when measuring power fluctuation. (page 66)
The IEC reference value is generated automatically using AGC (automatic gain control) generated over 1-minute with a low pass filter.

0
1
Measurem
ent Method
6.7 IEC Flicker
105
1
2
3
4
5
6
7
8
9
1
1
7. Viewing measurement data
Checking recording conditions with the fluctuation graph(1) Investigate the degree of fluctuation in instantaneous flicker
value S(t), which is a measure of perceived instantaneousflicker.
VOLTAGE
The vertical and horizontal scales of the fluctuation graph change auto-matically during recording. If you want to change the vertical scale, you can do so while recording is in progress; however, you must first stop recording if you want to change the horizontal scale.
Instantaneous flicker values (S(t)) are sampled at 256 points per cycle, and are calculated without any gaps for one wave shifted over half a wave. You can record MAX and MIN values from RMS voltage data every half wave over the set interval.
Example: When the interval is set to 1 s: The MAX and MIN values are recorded from 100 points of half wave voltage data. (At 50 Hz.)
Recording start time Current time
Shows the MAX and MIN real-time values.The MAX and MIN values are recorded together. When 3P3W3M setting:Red: CH1Yellow: CH2Blue: CH3

6.7 IEC Flicker
106 Quick Start Manual
(2) Check the occurrence of IEC flicker (Pst, Plt).
GRAPH
The vertical and horizontal scales of the fluctuation graph change auto-matically during recording. If you want to change the vertical scale, you can do so while recording is in progress; however, you must first stop recording if you want to change the horizontal scale.
The short-term flicker indicator “Pst” indicates the degree of percepti-bility (severity) of flicker measured over a 10-minute period.The long-term flicker indicator “Plt” indicates the degree of perceptibil-ity (severity) of flicker determined from successive Pst measurements over a 2-hour period.Plt is calculated from moving averages of Pst.
The Pst, Plt flicker value is calculated once a minute without gaps, regardless of the set interval time.
You can confirm the contents of settings (SYSTEM-DF2) and wave-form display (VIEW-DF1/2/3/4) during recording, but you cannot change them. When you want to change the settings, you must stop recording first.
Recording start time Current time
Shows the Pst, Plt val-ues every 10 minutes.
8. Ending the recording intervalUse the same method as when measuring power fluctuation. (page 68)

0
1
Measurem
ent Method
6.7 IEC Flicker
107
1
2
3
4
5
6
7
8
9
1
1
9. Checking recorded measurement data
Determine the maximum value of Pst and Plt during the measurement period.
LIST
The Pst, Plt statistics are confirmed from the list display.
Statistics on Pst and Plt are displayed every 10 minutes, along with the date and time.• Pst: short interval flicker value• Plt: long interval flicker value• EN50160, “Voltage characteristics of electricity supplied by public
distribution systems”, specifies "In any period of one week the long term flicker severity caused by voltage fluctuation should be Plt≤1 for 95% of the time."
Pst Plt

6.7 IEC Flicker
108 Quick Start Manual

0
1
Peripheral D
evices
7.1 Using a PC Card
109
1
2
3
4
5
6
7
8
9
1
1
● : Possible/ × : Not Possible
Peripheral Devices 77.1 Using a PC Card
File and File Format Directory Name File Name
SYSTEM_DF4[PC-CARD]
Files can be opened on a PC
Using with the 96249624-10/9624-50SAVE LOAD
Setting Files ____________ ########.SET ● ● ● ×B+Date+No.*8 3196SET.SET ● ● × ●
Measure-ment Data Files
Binary format
Time-series data*4 96INTVL.ITV ● ● × ●
Event data*1, *3 96EVT000.EVT to 96EVT999.EVT ● ● × ●
Transient waveform data *1
00000000.TRN to 99999999.TRN ● ● × ●
ΔV10/ IEC Flicker data *1 96FLICK.FLC ● ● × ●
Voltage fluctuation event data *3,*7
96DV000.WDU to 96DV999.WDU ● ● × ●
Text format
Time-series data*1 T+Date+No.*8 96INTVL.CSV ● × ● ×Event list data *1, *5 96EVENT.TXT ● × ● ×ΔV10/ IEC Flicker data*1 96FLICK.TXT ● × ● ×Voltage fluctuation event data *3,*7
HHMM000.CSV toHHMM999.CSV ● × ● ×
Event waveform data *2, *6
TEXTWAVE HHMM000.CSV toHHMM999.CSV *9
●*10
× ● ×
Screen Hard Copy Files ____________ H3196000.BMP toH3196999.BMP ● × ● ×
Storage method*1: Files can be saved automatically every interval, or saved manually after measurement is fin-
ished (when analyzing).*2: After measurement is finished (when analyzing), you can select an event number and save files
manually.*3: Data is saved automatically each time an event occurs.
Creating event files*4: A file is created for each event (event data for all of the contents, including waveforms).*5: All of the events in the list are created within a single file.*6: A file is created for each event waveform.*7: A file is created for each voltage fluctuation event graph.
Creating a directory and file name*8: A number is appended to files each time measurement data is saved.
Binary format: B/ Text format:T(1-digit)+Date(5-digit: year,month,day) + Number(2-digit:01 to 99) The year is indicated using the lowest digit. (Example: The year 2002 is represented as “2”.)3196SET.SET is also saved in the text format directory.
*9: HH indicates hours, and MM indicates minutes.*10:EVENT_DF1[LIST] is used to save event waveform data in text format.
Card type: Flash ATA Types I and IISlot: One Type IIFormat: MS-DOSStorage capacity: Up to 528 MB
The PC Card interface of this instrument complies with PCMCIA (Personal Computer Memory Card Internation-al Association) and JEIDA (Japan Electric Industry De-velopment Association) PC Card standards.

7.1 Using a PC Card
110 Quick Start Manual
PC CardCapacity
The instrument contains 13 MB of internal memory. So 13 MB is required on a PC Card to store all of the contents recorded in inter-nal memory. Therefore, PC Cards used with the instrument should have at least 13 MB capacity. The 1 GB Model 9729 PC CARD is not supported.
Hioki Options PC cards (includes adapter)• 9726 PC CARD 128M • 9727 PC CARD 256M • 9728 PC CARD 512M
For more details about PC Cards, See the Instruction Manual (CD-R version).
Use only PC Cards sold by Hioki.Compatibility and performance are not guaranteed for PCcards made by other manufacturers. You may be unable toread from or save data to such cards.
• Make sure that you format your PC card before using it. (Formatthe PC card using this device or the PC.)
• Do not use the device where oil permeates the air or in dustyplaces. Doing so can cause the deterioration of connector con-tacts.
• When formatting a PC card on a PC, use the FAT-16 format.Formatting a card in FAT-32 format may result in incompatibilityproblems.
• PC Cards should always be formatted before use (format theCard within the instrument.)
• Some PC Cards may not be usable. • Do not handle Cards in dusty environments, or where caustic
vapors may be present. The connector contacts can be fouledin such conditions.
• The PC Card or the instrument can be damaged if the card isinserted forcefully in the wrong direction.
• Keep the cover closed when a PC Card is not installed. • Never eject a PC Card while it is being accessed by the instru-
ment. Data on the PC Card may be lost. • When the instrument is to be transported, remove the PC Card
and close the cover.

0
1
Peripheral D
evices
7.1 Using a PC Card
111
1
2
3
4
5
6
7
8
9
1
1
Open the cover and insert the PCCard with the arrow facing up andin the direction of the PC cardslot, as far as it will go.
Inserting and Removing a PC Card
Press the Eject button and pullthe PC Card out.
Inserting a PC Card
Removing a PC Card
Initializing a PC Card
PC-CARD
FORMAT "Now Formatting!" is displayed during formatting. When this message disappears, formatting is finished.
Bear in mind that formatting permanently erases all files on a PC Card.
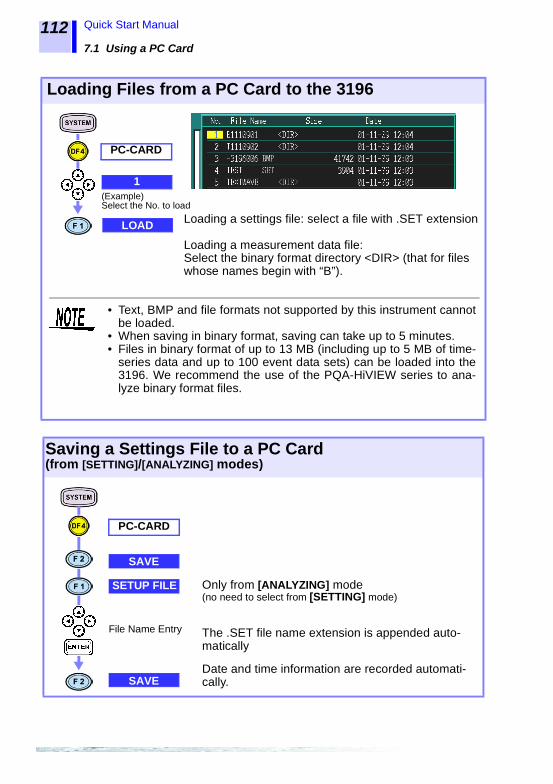
7.1 Using a PC Card
112 Quick Start Manual
Loading Files from a PC Card to the 3196
PC-CARD
1
LOAD
(Example) Select the No. to load
Loading a settings file: select a file with .SET extension
Loading a measurement data file: Select the binary format directory <DIR> (that for files whose names begin with “B”).
• Text, BMP and file formats not supported by this instrument cannotbe loaded.
• When saving in binary format, saving can take up to 5 minutes.• Files in binary format of up to 13 MB (including up to 5 MB of time-
series data and up to 100 event data sets) can be loaded into the3196. We recommend the use of the PQA-HiVIEW series to ana-lyze binary format files.
Saving a Settings File to a PC Card (from [SETTING]/[ANALYZING] modes)
PC-CARD
SAVE
SAVE
File Name Entry The .SET file name extension is appended auto-matically
Date and time information are recorded automati-cally.
SETUP FILE Only from [ANALYZING] mode(no need to select from [SETTING] mode)

0
1
Peripheral D
evices
7.1 Using a PC Card
113
1
2
3
4
5
6
7
8
9
1
1
Automatically Saving Measurement Data to a PC Card
Select other settings as needed
When the [RECORDING] internal operating status is enabled, the screen image is copied automatically.
Setting Item Selections
MemoryFull Continue/StopInterval (select from menu)
Auto Save BINARY(save in binary format)TEXT(save in text format)*1
RECORDING
Data saved to internal memory is automatically saved to a PC Card simultaneously.
Select from pull-down menu
*1: When saving as textSelect
OFF
ON
RETURN
Select the items to be savedThe currently selected items are indicated by num-ber at the right side of the Auto Save display.
Select item
(Deselect)
(Select)
• In binary format, all measurement data of the 3196 can be saved toa PC card.
• When data is automatically saved in text format, only time seriesdata and event list data can be saved.

7.1 Using a PC Card
114 Quick Start Manual
Storing data on a PC card after measurement(during [ANALYZING])
PC-CARD
SAVE
BINARY FILE The folder name is created automatically from the date within the directory structure.
Select the items to be saved when saving as text.
TEXT FILE
TEXT Select
OFF
ON
RETURN
(Deselect)
(Select)
• When saving in binary format, saving can take up to 4 minutes, 30seconds.
• When data is saved in text format from the SYSTEM screen, onlytime series data and event list data can be saved.
Storing Event waveform data as text on a PC card after measurement (during [ANALYZING])
LIST
Select the No. of text waveform data to be saved.1
WaveText Save
(Example)
Select the number (No.) of the event to be saved. The channel whose waveform is saved depends on the connection settings.

0
1
Peripheral D
evices
7.1 Using a PC Card
115
1
2
3
4
5
6
7
8
9
1
1
Deleting a PC Card File
PC-CARD
1
DELETE
Select the No. to delete
(Example)
Automatically Copying a Screen Image to PC Card (Auto Copy)
Manually Copying a Screen Image to PC Card (Manual Copy)
Select other settings as needed
Setting Item Selections
RS-232C OFF/MODEMTimer(interval setting)
COPY (select from menu)
HARDWARE
When the [RECORDING] internal operating status is enabled, the screen image is copied automatically.
A bitmap image (BMP data) is automatically saved to the PC Card.
Select from pull-down menu
Select item
Display the screen to be printed
Display the screen to be printed
Press to copy an image of the displayed screen.
Manually copy a bitmap image of the screen (BMP data) to a PC Card.RS-232 connection setting is the same as for Auto Copy.
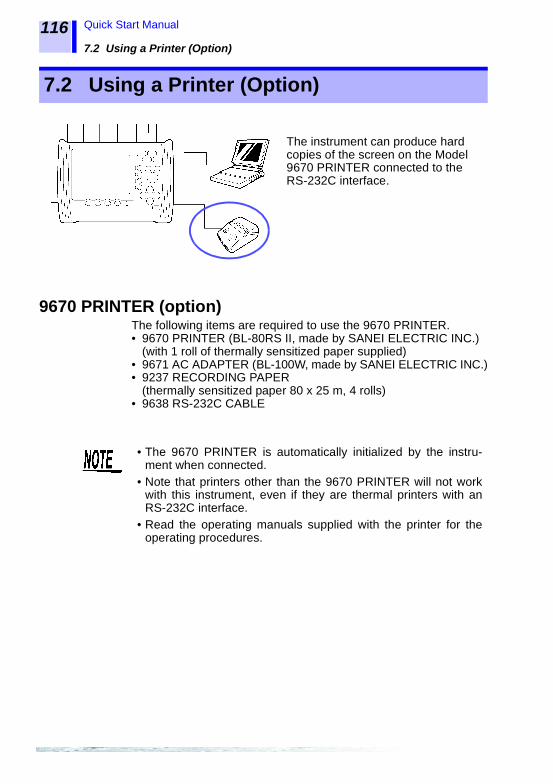
7.2 Using a Printer (Option)
116 Quick Start Manual
9670 PRINTER (option)The following items are required to use the 9670 PRINTER.• 9670 PRINTER (BL-80RS II, made by SANEI ELECTRIC INC.)
(with 1 roll of thermally sensitized paper supplied)• 9671 AC ADAPTER (BL-100W, made by SANEI ELECTRIC INC.)• 9237 RECORDING PAPER
(thermally sensitized paper 80 x 25 m, 4 rolls)• 9638 RS-232C CABLE
7.2 Using a Printer (Option)
The instrument can produce hard copies of the screen on the Model 9670 PRINTER connected to the RS-232C interface.
• The 9670 PRINTER is automatically initialized by the instru-ment when connected.
• Note that printers other than the 9670 PRINTER will not workwith this instrument, even if they are thermal printers with anRS-232C interface.
• Read the operating manuals supplied with the printer for theoperating procedures.
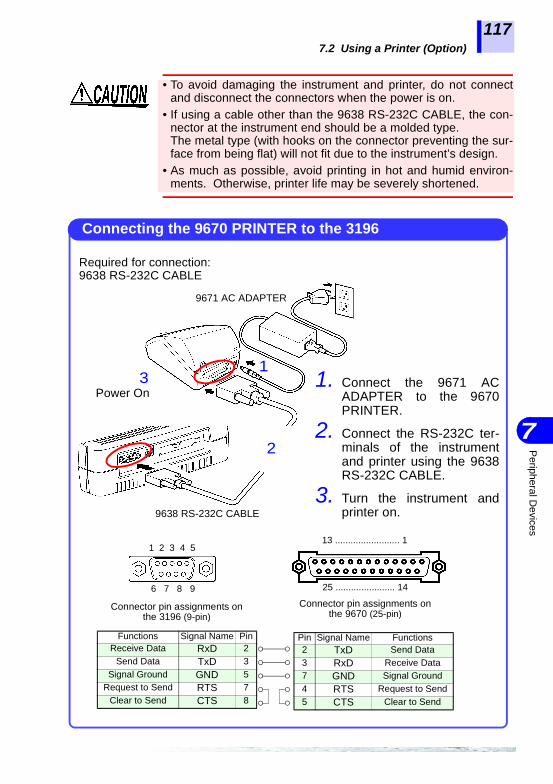
0
1
Peripheral D
evices
7.2 Using a Printer (Option)
117
1
2
3
4
5
6
7
8
9
1
1
• To avoid damaging the instrument and printer, do not connectand disconnect the connectors when the power is on.
• If using a cable other than the 9638 RS-232C CABLE, the con-nector at the instrument end should be a molded type. The metal type (with hooks on the connector preventing the sur-face from being flat) will not fit due to the instrument’s design.
• As much as possible, avoid printing in hot and humid environ-ments. Otherwise, printer life may be severely shortened.
1. Connect the 9671 ACADAPTER to the 9670PRINTER.
2. Connect the RS-232C ter-minals of the instrumentand printer using the 9638RS-232C CABLE.
3. Turn the instrument andprinter on.
Required for connection: 9638 RS-232C CABLE
9638 RS-232C CABLE
9671 AC ADAPTER
Connecting the 9670 PRINTER to the 3196
2
31
Power On
25 ....................... 14
Connector pin assignments on the 9670 (25-pin)
1 2 3 4 5
6 7 8 9
Connector pin assignments on the 3196 (9-pin)
Pin Signal Name Functions2 TxD Send Data3 RxD Receive Data7 GND Signal Ground4 RTS Request to Send5 CTS Clear to Send
13 ......................... 1
Functions Signal Name PinReceive Data RxD 2
Send Data TxD 3Signal Ground GND 5
Request to Send RTS 7Clear to Send CTS 8

7.2 Using a Printer (Option)
118 Quick Start Manual
Paper insertion window
Cut the paper hori-zontally.
Observe paper direction!
OK
Load the recording paper into the9670 PRINTER.
Handling and Storing Recording PaperThe recording paper is thermally and chemically sensitized. Observe the following precautions to avoid paper changing color or fading.
Avoid exposure to direct sunlight
Avoid 40°C, 90%RH
Avoid stacking with wet Diazo copy paper.
Avoid exposure to volatile organic sol-vents like alcohol, ethers and ketones
Avoid contact with adhesive tapes like soft vinyl chloride and masking tape.
Loading Recording Paper

0
1
Peripheral D
evices
7.2 Using a Printer (Option)
119
1
2
3
4
5
6
7
8
9
1
1
• The internal settings for the 9670 PRINTER to be used withthis instrument are as follows.
• As shipped from the factory, the following settings areselected: Japanese (Language), 9600bps(baud rate) and AutoPower Off (90 minutes).
• The baud rate, language and auto power off selections areautomatically set by this instrument. Perform Auto printer set-ting.
• Be aware that changing any other settings may disable hardcopy operation.
Printer Setup
BL-80RS II/RSII [VX.XX] XXXX/XX/XXSANEI ELECTRIC INC.*********Data input = SerialInternational char = JapanPrint mode = GraphicCharacter set = 24Dot ANK Gothic typeSelect switch = Available (ON)Baud rate = 19200bpsBit length = 8 bitParity= NonData control = SBUSYPaper selection = Normal paperUpright/inverted = Upright printingAuto Power Off = Invalidity (OFF)Battery mode= Invalidity (OFF)Interface = RS232Cshr=0119 temp=026 shvp=718
After Auto Printer Setup, turn the printer OFF and back on again.
Setting Item Selections
RS-232C(baud rate setting)
PRINTER9600bps (slow printing)19200bps (medium speed printing)9600bps (fast printing)All of these are available
HARDWARE
The 9670 PRINTER is automatically set up for use by the instrument.
Select from pull-down menu
Select item
Auto Printer Setup
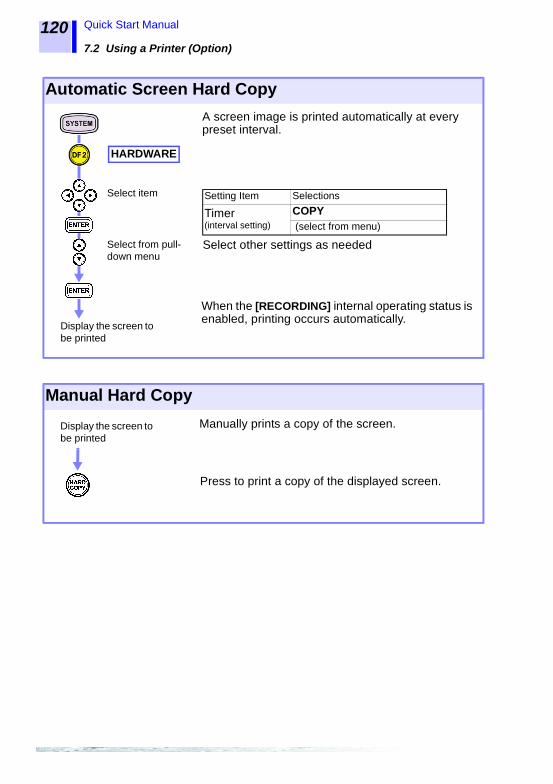
7.2 Using a Printer (Option)
120 Quick Start Manual
Automatic Screen Hard Copy
Display the screen to be printed
Select other settings as needed
Setting Item Selections
Timer(interval setting)
COPY (select from menu)
HARDWARE
When the [RECORDING] internal operating status is enabled, printing occurs automatically.
A screen image is printed automatically at every preset interval.
Select from pull-down menu
Select item
Manual Hard Copy
Display the screen to be printed
Press to print a copy of the displayed screen.
Manually prints a copy of the screen.

0
1
Peripheral D
evices
7.3 Using the Instrument with a Computer
121
1
2
3
4
5
6
7
8
9
1
1
7.3 Using the Instrument with a Computer
This instrument comes equipped with RS-232C and LAN interfaces. This chapter describes use of the instrument with a personal computer (PC) or modem.
The HTTP Server function*1 within the instrument can be used with any of these connection methods. For details, See the Instruction Manual (CD-R ver-sion).*1: The HTTP Server function provides setting, data acquisition and screen display using a
common Web browser like Internet Explorer, without requiring special application software on the PC.
• Both the RS-232C and LAN interfaces use the TCP/IP proto-col. The TCP/IP connection over the RS-232C interfacerequires PPP (point-to-point protocol). Note that on the PC,Visual Basic cannot be used for programming, sending com-mands to or receiving data from the instrument.
• The instrument is not able to send data to a PC when con-nected through a modem. Some PCs produce unacceptablelevels of noise. To minimize noise interference, we recom-mend using PCs with a built-in LAN (RJ-45) connector.
3196 ModemRS-232C
Straight cable
RS-232C
Straight cable
ModemPublic circuit
The instrument can be connected by RS-232C cable to a modemfor remote control and monitoring from a modem-equipped PC atanother location. (A cellular telephone can also be used.)
3196 Hub10Base-T
Straight cable
10Base-T
Straight cable
HubLAN
The instrument can be connected by LAN cable to a hub forremote control an monitoring from a PC at another location.
319610Base-T
Crossover Cable
The instrument can be connected by LAN cable to a PC, for con-trol and monitoring on the PC.

7.3 Using the Instrument with a Computer
122 Quick Start Manual
7.3.1 RS-232C Connection
• To avoid electric shock, always remove the power cordfrom the instrument and disconnect any test leads beforeconnecting the RS-232C cable to the instrument.
• The instrument and modem should be turned off beforeconnecting them.
• Do not connect or disconnect the cable with power on.Otherwise, the devices could be damaged.
• Always tighten the screws when connecting the RS-232C cable.• The instrument end of the connector should be a molded type
plug. The metal type (with protrusions on the connector prevent-ing the surface from being flat) will not fit due to the instrument’sdesign.
1. Turn the instrumentand modem off.
2. Connect the RS-232Cconnectors on theinstrument and modemtogether with astraight-through cable.
The RS-232C cable must have straight-through connections. Use a straight-through cable with a connector that mates with the modem connector. If the modem connector is a 9-pin D-sub type, the 9444 CONNECTION CABLE (option) can be used.
RS-232C cable(Straight-through cable)
123456789
123456789
6 7 8 9
9444 CONNECTION CABLEmale side pinout (9-pin)
1 2 3 4 5
6 7 8 9Connector pin
assignments on the 3196 (9-pin)
Pin FunctionsCCITT EIA JIS
Signal NameCircuit No. Code Addr. Code Addr.
2 Receive Data 104 BB RD RxD3 Send Data 103 BA SD TxD5 Signal Ground 102 AB SG GND7 Request to Send 105 CA RS RTS8 Clear to Send 106 CB CS CTS
Connecting a Modem to the Instrument
1 2 3 4 5

0
1
Peripheral D
evices
7.3 Using the Instrument with a Computer
123
1
2
3
4
5
6
7
8
9
1
1
7.3.2 LAN Connection
For details about this instrument’s settings, See the Instruction Manual (CD-R version).
• To avoid electric shock, always remove the power cordfrom the instrument and disconnect any test leads beforeconnecting the LAN cable to the instrument.
• The instrument and hub or PC should be turned off beforeconnecting them.
• Do not connect or disconnect the cable with power on. Oth-erwise, the devices could be damaged.
1. Turn the instrument and hub off.
2. Connect the 10Base-T connec-tors on the instrument and thehub with a LAN cable (straight-through).
Connect the instrument to the hub with the 9642 LAN CABLE (option).
9642 LAN CABLE (option)
Connecting a Hub to the Instrument
1. Turn the instrument and PC off.
2. Connect the 10Base-T connec-tors on the instrument and the PCwith the 9642 LAN CABLE andsupplied crossover adapter.
Connect the instrument to the PC with the 9642 LAN CABLE (option).
9642 LAN CABLE (option)
Connecting a PC to the Instrument
Crossover Adapter(provided with the 9642)

7.4 Using the External Control Terminals
124 Quick Start Manual
For more details, See the Instruction Manual (CD-R ver-sion).
7.4 Using the External Control Terminals
The external control terminals can be used to signal the instrument of the occur-rence of an event with an external input trigger signal, or to signal the detection of an event by the instrument with an output signal.
To avoid damage to the instrument, do not apply voltage outside therange of -5 V to +10 V (EVENT IN terminal), or 0 to +50 V (EVENT OUTterminal).
External event inputs are recorded as EXT events.During a measurement startup, measurement stop, and manualevent, signals are also recorded as EXT events.Pressing the [ESC] and [EVENT] keys simultaneously generates a manual event.
Event output terminal (EVENT OUT)
The instrument provides an external signal when it detects an anomaly. The event output terminal can be connect-ed to the trigger input terminal of a wave-form recording instrument such as a Memory HiCorder to control waveform re-cording by the timing of event occurrence.
Event input terminal (EVENT IN)
An external device can be used to con-trol the timing of analysis of anomalies. The event input terminal can be con-nected to an anomaly detecting instru-ment such as an overcurrent relay to control the timing of this instrument’s an-alyzing functions by externally detected events.
HIOKIMEMORY HiCORDER
Trigger input terminal
Anomality Detecting Device
IN GNDEVENT
GNDEVENT
OUT

0
1
Specifications
8 Specifications
125
1
2
3
4
5
6
7
8
9
1
1
These specifications apply to the 3196 Power Quality Analyzer
Specifications 8
Environmental & Safety SpecificationsOperating environment Indoors, altitude up to 2000 m (6562-ft.)
Storage temperature and humidity
-20°C to 50°C (-4°F to 122°F), 80% RH or less (non-conden-sating)
Operating temperature and humidity
0°C to 40°C (32°F to 104°F), 80% RH or less (non-condensat-ing)(Battery pack and PC Card operation is not supported between -10°C and 0°C (14°F to 32°F), and LCD operation and accura-cy are not guaranteed in this range)
Maximum input voltage (50/ 60 Hz)
Voltage inputs: 780 Vrms, 1103 V peakCurrent inputs: 1.7 Vrms, 2.4 V peak
Maximum rated voltage to earth
Voltage input terminals: 600 Vrms (50/60 Hz)
Dielectric strength (50/60 Hz for 1 min.)
5.55 kVrms for one minute (current sensitivity 1 mA)Between voltage and clamp input terminals, between voltage input terminals and instrument case, between voltage input ter-minals U1 to U3 and U4
Enclosure protection IP30 (per EN60529)
Applicable Standards Safety EN61010Voltage Input: Pollution Degree 2, Measurement Category III (anticipated transient overvoltage 6000V)
EMC EN61326 Class AEN61000-3-2EN61000-3-3

8 Specifications
126 Quick Start Manual
Input SpecificationsMeasurement line type One single-phase 2-wire (1P2W), single-phase 3-wire (1P3W),
three-phase 3-wire (3P3W2M,3P3W3M) or three-phase 4-wire (3P4W) plus one extra input channel
Input channels Voltage:Four channels U1 to U4 (extra channel U4 can mea-sure AC or DC)
Current:Four channels I1 to I4
Input methods Voltage:Isolated inputs and differential operationBetween U1,U2 and U3: these channels are not isolat-ed from one anotherBetween U1 to U3 and U4: channel U4 is isolated
Current:input is isolated by the clamp-on sensor (voltage input)
Input resistance (50/60 Hz)
Voltage:4 MΩ ±10% (differential input)Current:200 kΩ ±10%
Measurement method Simultaneous digital sampling of voltage and currentPLL synchronization (during instantaneous low period of PLL synchronization source, switches to a fixed clock, with no sam-pling gap during switching)
PLL synch channel source
One of voltages U1, U2 or U3
PLL synch frequency range
42.5 to 69 Hz
Sampling frequency For calculations (including DC measurements): 256 per cycle (50, 60 Hz)256 per 8 cycles (400 Hz)
For harmonic and inter-harmonic analysis:2048 per 10 cycles (50 Hz)2048 per 12 cycles (60 Hz)2048 per 80 cycles (400 Hz, high frequency only)
For transient overvoltage (impulse): 2 MHz
A/D converter resolution
For calculations (including DC measurements): 16 bitsFor transient overvoltage (impulse): 12 bits
Compatible clamp sensors
0.5 Vrms output or more for full-scale current (0.5 Vrms recom-mended) Output-to-input ratios of 0.1, 1, 10 or 100 mV/A

0
1
Specifications
8 Specifications
127
1
2
3
4
5
6
7
8
9
1
1
Basic SpecificationsBackup lithium battery life
Lithium battery to back up clock and settings, approx. 10 years (reference at 23°C, 73°F)
Clock functions Auto calendar, auto leap year, 24-hour clock
Real-time clock accuracy
±0.3 s/day or better (instrument on), ±3 s/day or better (instru-ment off)
Internal memory data capacity
13 MB
Maximum recording period
1 month (when using internal memory)
Maximum recordable events
100 events (when using internal memory)(1000 events when using the PC card)
External Control terminals
External event input and output
Power supply • 9458 AC ADAPTER (SINO-AMERICAN SA165E-12V) (12 VDC ±5%, 4.5A)Rated voltage: 100 to 240 VAC (a change in voltage of ±10%taken into consideration), 50/60 Hz, maximum rated current:1.2 A
• 9459 BATTERY PACK (Sanyo 6HR-AU Ni-MH) for backupduring power off
Maximum rated power 40 VA
Continuous battery operation time
Approx. 30 minutes with the 9459 BATTERY PACK (fully charged, 23°C, 73°F)
Dimensions Approx. 298W x 215H x 67D mm (not including protrusions) (11.73"W x 8.46"H x 2.64"D)
Mass Approx. 2.0 kg (70.5 oz) (without the battery pack), (mass of battery pack: approx. 250 g (8.8 oz))
Power quality conforming standard
IEEE1159, EN50160:1999, IEC61000-4-30:2003
Display SpecificationsDisplay language English, German, French, Italian, Spanish, Chinese (Simpli-
fied), Japanese
Display device 6.4-inch TFT color LCD (640 x 480 dots)
Dot pitch 0.202(V) x 0.202(H) mm (0.01"V x 0.01"H)

8 Specifications
128 Quick Start Manual
External Interface SpecificationsPC Card Interface
Slot TYPE II conforming to the PCMCIA/JEIDA PC Card Standard x 1 base
Supported cards Flash ATA cards (at least 13 MB)
Supported storage capacity
528 MB
Data format MS-DOS
Recording contents Binary, text and screen image data
RS-232C Interface
Compliant standards RS-232C EIA RS-232C, CCITT V.24, JIS X5101
Connector One 9-pin D-sub
Connection devices Printer or modem
LAN Interface
Connector One 10Base-T RJ-45 receptacle
Communication protocols
Ethernet, TCP/IP
Conditions of Guaranteed AccuracyConditions of guaran-teed accuracy
After 30 min warm-up, when measuring AC voltage; sine-wave input, PF=1, synchronized PLL
Temperature and humidity for guaran-teed accuracy
23 ±5°C (73±9°F), 80% RH or less (applies to all specifications unless otherwise noted)
Guaranteed accuracy period
6 months
Fundamental wave-form range for guaran-teed accuracy
42.5 to 69 Hz (360 to 440 Hz for 400 Hz measurements, al-though guaranteed accuracy is only for separately conducted shipping tests)
Display area for guaran-teed accuracy
Effective measurement area

0
1
Specifications
8 Specifications
129
1
2
3
4
5
6
7
8
9
1
1
IndicatorTotal display area 0.15 to 130% of selected range (RMS voltage and current; ef-
fective, apparent and reactive power; power factor)Display is suppressed to zero when less than 0.15%.0.3 to 130% of selected range (DC voltage)Display is suppressed to zero when less than 0.3%.0 to 130% of selected range (measurement items other than the above)
Effective measurement area
1 to 110% of selected range
Miscellaneous Measurement Items(for all calculation items, there are no gaps of measurements)RMS Voltage
Measurement method True RMS methodWaveform consists of 256 points/cycle, measured every 12 or 10 cycles at 50 or 60 Hz, respectively (approx. 200 ms) Waveform consists of 256 points/8cycles, measured every 80 cycles at 400 Hz (approx. 200 ms)
Display conversion function
Three-phase 3-wire (3P3W3M):Δ (line-to-line voltage) - Y (phase-to-neutral voltage) conversion (center point calculated by weighting)Three-phase 4-wire: Y (phase-to-neutral voltage) - Δ (line-to-line voltage) conversion
Range selection Manual ranging (range for channels 1 to 3 selected in the same operation)
DC measurement MEAN calculation
Measurement accuracy AC: ±0.2%rdg.±0.1%f.s. (50/ 60 Hz), ±0.2%rdg.±0.6%f.s. (400 Hz)DC: ±0.3%rdg.±0.4%f.s.
RMS Current
Measurement method True RMS methodWaveform consists of 256 points/cycle, measured every 12 or 10 cycles at 50 or 60 Hz, respectively (approx. 200 ms) Waveform consists of 256 points/8cycles, measured every 80 cycles at 400 Hz (approx. 200 ms)
Range selection Manual ranging (range for channels 1 to 3 selected in the same operation)
Measurement accuracy ±0.2% rdg. ±0.1% f.s. + clamp sensor accuracy (50/ 60 Hz)±0.2% rdg. ±0.6% f.s. + clamp sensor accuracy (400 Hz)

8 Specifications
130 Quick Start Manual
Transient Overvoltage (impulse)
Measurement method For detection, samples at 2 MHz are compared with calculation samples
Measurement range 2000 Vpk for channels 1 to 4
Displayed items Peak voltage: Value between the threshold and the maximum valuePeriod: Period threshold is exceeded (max. 4 ms)
Minimum detectable duration
0.5 μsec
Measurement accuracy ±5.0% rdg. ±20 V (at 1000 VDC and 700 Vrms, 100 kHz)
RMS Voltage
Measurement method True RMS methodData samples of each half of one cycle (256 points) of the volt-age waveform are overlapped, and the RMS voltage is ob-tained by calculating from one half cycle at 50 or 60 Hz measurement. When measuring 400 Hz, calculation is performed by averag-ing the squares of the sample data consisting of 256 points over 8 cycles of a waveform.(the line-to-line voltage is used for three-phase 3-wire (3P3W3M) systems, and the phase-to-neutral voltage is used for three-phase 4-wire systems)
Voltage Swell
Measurement method Detected from RMS voltage (value calculated for one wave-form shifted over half a wave) at 50 or 60 Hz measurement.For 400 Hz measurements, detection uses the value calculated over one cycle.
Displayed items Swell amplitude and duration
Voltage Dip
Measurement method Detected from RMS voltage (value calculated for one wave-form shifted over half a wave) at 50 or 60 Hz measurement.For 400 Hz measurements, detection uses the value calculated over one cycle.
Displayed items Dip depth and duration
Interruption
Measurement method Detected from RMS voltage (value calculated for one wave-form shifted over half a wave) at 50 or 60 Hz measurement.For 400 Hz measurements, detection uses the value calculated over one cycle.
Displayed items Interruption depth and duration

0
1
Specifications
8 Specifications
131
1
2
3
4
5
6
7
8
9
1
1
Frequency
Measurement range 42.500 to 69.000 Hz, 360 Hz to 440 Hz
Measurement source One of voltages U1, U2 or U3 (the same as the PLL synchroni-zation source)
Measurement accuracy ±10 mHz with sine wave input of 10 to 110% of voltage range at 50 or 60 Hz measurement±100 mHz with sine wave input of 30 to 110% of voltage range at 400 Hz measurement
Active Power
Measurement method Waveform consists of 256 points/cycle, measured every 12 or 10 cycles at 50 or 60 Hz, respectively (approx. 200 ms) Waveform consists of 256 points/8 cycles, measured every 80 cycles at 400 Hz (approx. 200 ms) Calculated from sampled voltage and current waveform data
Measurement accuracy ±0.2% rdg. ±0.1% f.s. + clamp sensor accuracy at 50 or 60 Hz mea-surement. (with PF=1, the sum consisting of all channels used) ±0.4% rdg. ±0.6% f.s. + clamp sensor accuracy at 400 Hz mea-surement. (with PF=1, the sum consisting of all channels used)
Apparent Power
Measurement accuracy ±1 dgt. (±3 dgt. aggregated) of calculation from each measured value
Reactive Power
Measurement accuracy ±1 dgt. (±3 dgt. aggregated) of calculation from each measured value
Power Factor
Measurement range -1.000 (leading) to 0.000 to +1.000 (lagging)
Measurement accuracy ±1 dgt. (±3 dgt. aggregated) of calculation from each measured value
Displacement Power Factor
Measurement method Calculated from the phase difference between the fundamental waveforms of voltage and current
Measurement range -1.000 (leading) to 0.000 to +1.000 (lagging)
Measurement accuracy ±0.5% rdg. ±0.2% f.s. ±1 dgt. at 50 or 60 Hz measurement (±3 dgt. aggregated)±0.5% rdg. ±0.6% f.s. ±1 dgt. at 400 Hz measurement (±3 dgt. aggregated)

8 Specifications
132 Quick Start Manual
Voltage Unbalance Factor
Measurement method For three-phase 3-wire (3P3W3M) and three-phase 4-wire sys-tems, calculation is based on the three-phase voltage funda-mental waveform (line-to-line voltage, refer to the calculation formula for details - Instruction Manual (CD-R version))
Current Unbalance Factor
Measurement method For three-phase 3-wire (3P3W3M) and three-phase 4-wire sys-tems, calculation is based on the three-phase current funda-mental waveform (line-to-line current, refer to the calculation formula for details - Instruction Manual (CD-R version))
ΔU Voltage Fluctuation
Measurement method Deviation in RMS voltage with respect to the standard voltage
Standard Voltage Nominal voltage
S(t) Instantaneous Flicker value
Measurement method Per IEC61000-4-15
Weighting filters 230 V lamp 50 Hz system, 120 V lamp 60 Hz system
ΔV10 Flicker
Measurement method Calculated using the “Δ V10 perceived flicker curve”.
Displayed items Δ V10 measured at one minute intervals, average value for one hour, maximum value for one hour, fourth largest value for one hour, total (within the measurement interval) maximum value
Standard Voltage Automatic (AGC)
Measurement accuracy ±4%rdg.±0.01V (For 100 V RMS fundamental wave (50/60 Hz), 1 V RMS fluctuating voltage, and 10 Hz fluctuating frequency.)
IEC Flicker : short interval flicker value Pst and long interval flicker value Plt
Measurement method Per IEC61000-4-15:1997+A1:2003Pst and Plt are calculated from continuous measurement over 10 min. and 2 hours, respectivelyThe 100 V lamp is per IEC SC77A National Committee, "IEC61000-4-15 Flickermeter Conformity Discussion Report for 100 Series Flicker Meter Ad-Hoc W/G"
Flicker filter 120V lamp, 230V lamp
Measurement accuracy Pst: ±5% rdg.(as set forth for IEC61000-4-15 performance test-ing)Valid for input ranging from 50 to 100% of the voltage measure-ment range

0
1
Specifications
8 Specifications
133
1
2
3
4
5
6
7
8
9
1
1
Harmonic Voltage, Current and Power (including fundamental wave-form content)
Measurement method Per IEC61000-4-7:2002• Harmonic voltage/current:
after harmonics are analyzed, inter-harmonic contents areadded and displayed adjacent to harmonic content, accord-ing to harmonic order
• Harmonic power: the value of harmonic power of each channel and aggregatevalue of multiple channels are displayed (refer to the calcu-lation formula for details - Instruction Manual (CD-R ver-sion))
Harmonic analysis window width
10 or 12 cycles for 50 or 60 Hz, respectively80 cycles for 400 Hz
Harmonic analysis window
Rectangular
Harmonic analysis frequencies
1st to 50th orders (of 42.5- to 69-Hz fundamental waveform)
Measurement accuracy (50/60 Hz)• Harmonic voltage/ current:
1st to 20th order: ±0.5% rdg. ±0.2% f.s.21st to 50th order: ±1.0% rdg. ±0.3% f.s.
• Harmonic power: 1st to 20th order: ±0.5% rdg. ±0.2% f.s.21st to 30th order: ±1.0% rdg. ±0.3% f.s.31st to 40th order: ±2.0% rdg. ±0.3% f.s.41st to 50th order: ±3.0% rdg. ±0.3% f.s.
(400 Hz)• Harmonic voltage/ current:
1st to 2nd order: ±0.5% rdg. ±0.2% f.s.3rd to 6th order: ±1.0% rdg. ±0.3% f.s.7th to 10th order: ±1.0% rdg. ±0.3% f.s.±0.5x(k-6)% rdg.(k:harmonic order)
• Harmonic power: 1st to 2nd order: ±0.5% rdg. ±0.2% f.s.3rd to 4th order: ±1.0% rdg. ±0.3% f.s.5th to 10th order: ±1.0% rdg. ±0.3% f.s.±1.0x(k-4)% rdg.(k:harmonic order)
However, for harmonic current and power, clamp sensor accu-racy must be included
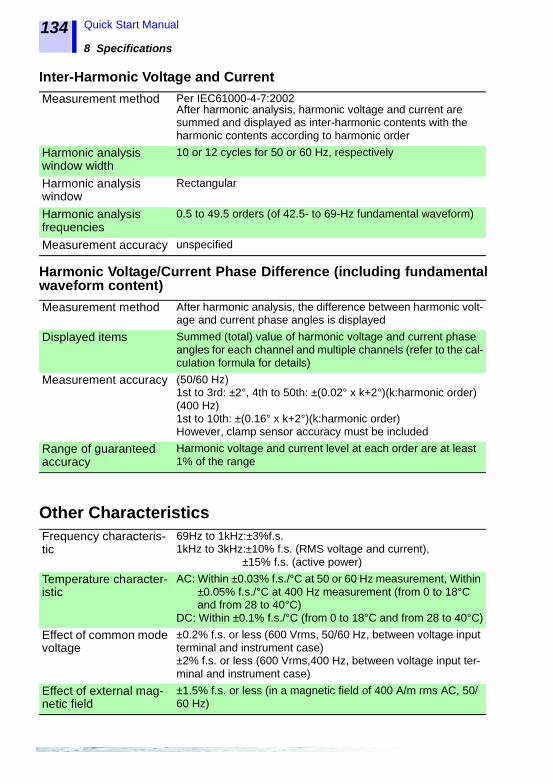
8 Specifications
134 Quick Start Manual
Inter-Harmonic Voltage and Current
Measurement method Per IEC61000-4-7:2002After harmonic analysis, harmonic voltage and current are summed and displayed as inter-harmonic contents with the harmonic contents according to harmonic order
Harmonic analysis window width
10 or 12 cycles for 50 or 60 Hz, respectively
Harmonic analysis window
Rectangular
Harmonic analysis frequencies
0.5 to 49.5 orders (of 42.5- to 69-Hz fundamental waveform)
Measurement accuracy unspecified
Harmonic Voltage/Current Phase Difference (including fundamentalwaveform content)
Measurement method After harmonic analysis, the difference between harmonic volt-age and current phase angles is displayed
Displayed items Summed (total) value of harmonic voltage and current phase angles for each channel and multiple channels (refer to the cal-culation formula for details)
Measurement accuracy (50/60 Hz)1st to 3rd: ±2°, 4th to 50th: ±(0.02° x k+2°)(k:harmonic order)(400 Hz)1st to 10th: ±(0.16° x k+2°)(k:harmonic order)However, clamp sensor accuracy must be included
Range of guaranteed accuracy
Harmonic voltage and current level at each order are at least 1% of the range
Other CharacteristicsFrequency characteris-tic
69Hz to 1kHz:±3%f.s.1kHz to 3kHz:±10% f.s. (RMS voltage and current),
±15% f.s. (active power)
Temperature character-istic
AC: Within ±0.03% f.s./°C at 50 or 60 Hz measurement, Within ±0.05% f.s./°C at 400 Hz measurement (from 0 to 18°C and from 28 to 40°C)
DC: Within ±0.1% f.s./°C (from 0 to 18°C and from 28 to 40°C)
Effect of common mode voltage
±0.2% f.s. or less (600 Vrms, 50/60 Hz, between voltage input terminal and instrument case)±2% f.s. or less (600 Vrms,400 Hz, between voltage input ter-minal and instrument case)
Effect of external mag-netic field
±1.5% f.s. or less (in a magnetic field of 400 A/m rms AC, 50/60 Hz)

0
1
Specifications
8 Specifications
135
1
2
3
4
5
6
7
8
9
1
1
For other specifications and details: See the Instruction Manual (CD-R version).For the product specifications of the EN50160, see the Instruction Manual for EN50160.
Time Series Graph Recording Time (When Internal memory only)With Power selected, THD data is saved, but harmonic order data is not.
IntervalALL DATA (Save All)
P&Harm (RMS and Harmonic Save)
Power (Save RMS only)
MAX/MIN/AVG AVG MAX/MIN/AVG AVG MAX/MIN/AVG AVG
1 s 5 min 45 s 17 min 12 s 8 min 29 s 25 min 18 s 2 h 1 min 51 s 5 h 32 min 21 s
3 s 17 min 15 s 51 min 36 s 25 min 27 s 1 h15 min 54 s
6 h 5 min 33 s 16 h 37 min 3 s
15 s 1 h 26 min 15 s
4 h 18 min 2 h 7 min 15 s 6 h 19 min 30 s
1 days 6 h27 min 45 s
3 days 11 h5 min 15 s
30 s 2 h 52 min 30 s
8 h 36 min 4 h 14 min 30 s
12 h 39 min 2 days 12 h55 min 30 s
6 days 22 h10 min 30 s
1 min 5 h 45 min 17 h 12 min 8 h 29 min 1 days 1 h18 min
5 days 1 h51 min
13 days 20 h21 min
5 min 1 days 4 h45 min
3 days 14 h 1 days 18 h25 min
5 days 6 h30 min
25 days 9 h15 min
31 days
10 min 2 days 9 h30 min
7 days 4 h 3 days 12 h50 min
10 days 13 h
31 days 31 days
30 min 7 days 4 h30 min
21 days 12 h
10 days 14 h30 min
31 days 31 days 31 days
1 h 14 days 9 h 31 days 21 days 5 h 31 days 31 days 31 days2 h 28 days 18 h 31 days 31 days 31 days 31 days 31 days

8 Specifications
136 Quick Start Manual

0
1
Maintenance and S
ervice
9.1 Cleaning and Storage
137
1
2
3
4
5
6
7
8
9
1
1
Cleaning
Storage• Storage temperature and humidity should be kept between -20
and 50°C, at less than 80% RH.
• Do not store or use the product where it could be exposed todirect sunlight, high temperature or humidity, or condensation.Under such conditions, the product may be damaged and insula-tion may deteriorate so that it no longer meets specifications.
• We recommend removing the battery pack when storing theinstrument. However, the battery pack is subject to self-dis-charge. So when storing the battery pack for a long time, chargethe battery at least once every two months.
• When storing the instrument for a long time (six months or more),the specifications are no longer guaranteed. Therefore, beforeuse, have the instrument recalibrated.
Maintenance and Service 9
9.1 Cleaning and Storage
• To clean the product, wipe it gently with a soft cloth moistenedwith water or mild detergent. Never use solvents such as ben-zene, alcohol, acetone, ether, ketones, thinners or gasoline, asthey can deform and discolor the case.
• Wipe the LCD gently with a soft, dry cloth.• Measurements are degraded by dirt on the mating surfaces of
the clamp-on sensor, so keep the surfaces clean by gently wip-ing with a soft cloth.
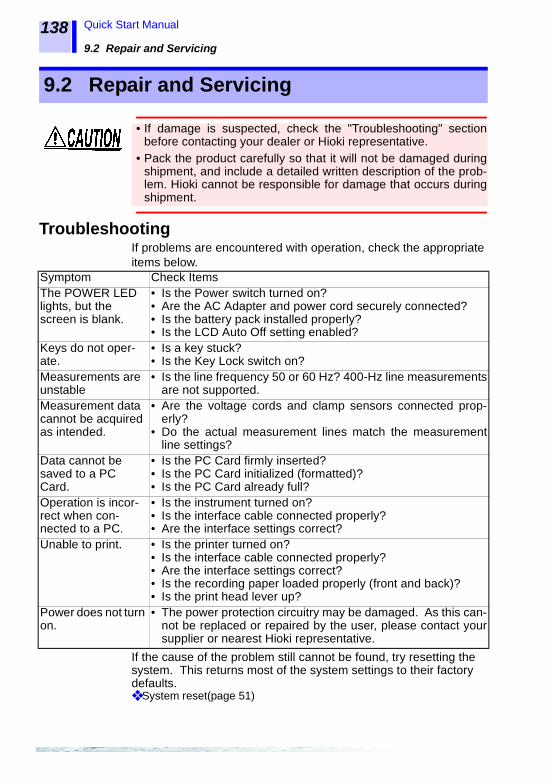
9.2 Repair and Servicing
138 Quick Start Manual
TroubleshootingIf problems are encountered with operation, check the appropriate items below.
If the cause of the problem still cannot be found, try resetting the system. This returns most of the system settings to their factory defaults.❖ System reset(page 51)
9.2 Repair and Servicing
• If damage is suspected, check the "Troubleshooting" sectionbefore contacting your dealer or Hioki representative.
• Pack the product carefully so that it will not be damaged duringshipment, and include a detailed written description of the prob-lem. Hioki cannot be responsible for damage that occurs duringshipment.
Symptom Check ItemsThe POWER LED lights, but the screen is blank.
• Is the Power switch turned on?• Are the AC Adapter and power cord securely connected?• Is the battery pack installed properly?• Is the LCD Auto Off setting enabled?
Keys do not oper-ate.
• Is a key stuck?• Is the Key Lock switch on?
Measurements are unstable
• Is the line frequency 50 or 60 Hz? 400-Hz line measurementsare not supported.
Measurement data cannot be acquired as intended.
• Are the voltage cords and clamp sensors connected prop-erly?
• Do the actual measurement lines match the measurementline settings?
Data cannot be saved to a PC Card.
• Is the PC Card firmly inserted?• Is the PC Card initialized (formatted)?• Is the PC Card already full?
Operation is incor-rect when con-nected to a PC.
• Is the instrument turned on?• Is the interface cable connected properly?• Are the interface settings correct?
Unable to print. • Is the printer turned on?• Is the interface cable connected properly?• Are the interface settings correct?• Is the recording paper loaded properly (front and back)?• Is the print head lever up?
Power does not turn on.
• The power protection circuitry may be damaged. As this can-not be replaced or repaired by the user, please contact yoursupplier or nearest Hioki representative.

0
1
Maintenance and S
ervice
9.3 Battery Pack Charging
139
1
2
3
4
5
6
7
8
9
1
1
When first purchased, the 9459 BATTERY PACK may not be fully charged due to self-discharge. Before using the pack the first time, be sure to charge it completely. When completely charged, recorded data is backed up for about 30 minutes when the instrument is turned off.
When using the 9459 BATTERY PACK without the 9458 AC ADAPTER, when the battery charge is depleted, the low-battery symbol ( ) appears. When this mark appears, connect the 9458 AC ADAPTER to recharge the 9459 BATTERY PACK.
9.3 Battery Pack Charging
1. Connect the 9458 AC ADAPTER.
2. Turn the POWER switch On.The POWER LED should light green to indicate charging.
(Battery indicator lights red)Charging should finish within about two hours.When the battery indicator turns white, charging is finished. ( )
3. When charging is finished, start measuring or turn the Power switch Off.
Power On
9458 AC ADAPTER1
2
Charging the Battery Pack
Charging is disabled when the Power switch is Off.Verify that the battery is properly charged before using it.
If the battery is properly charged, the indicator appears when the AC Adapter is unplugged.
• This instrument is designed to charge the 9459 BATTERYPACK during normal operation.When the 9458 AC ADAPTERis used, the charging indicator is displayed while measuring,but measurements are not affected.

9.4 Battery Pack Replacement and Disposal
140 Quick Start Manual
Å@
9.4 Battery Pack Replacement and Disposal
• To avoid electric shock, turn off the power switch and dis-connect the voltage cords, clamp-on sensors and powercord before replacing the battery pack.
• To avoid the possibility of explosion, do not short circuit,disassemble or incinerate the battery pack. Handle and dis-pose of batteries in accordance with local regulations.
• The battery pack can be expected to be recharged about 500times, or for about one year before replacement. Replace the pack only with the HIOKI Model 9459 BATTERYPACK.
• The battery pack is subject to self-discharge. Be sure to chargethe battery before initial use. If the battery capacity remainsvery low after correct recharging, the useful battery life is at anend.
1. Turn the instrument over, removethe screw affixing the batterycompartment cover, and removethe cover.
2. Remove the battery pack anddisconnect the plug from theconnector. (This is easy to do when theinstrument is upside down.)
3. Connect the plug from the newbattery pack, and insert it and itswiring.
4. Replace the battery compart-ment cover, and its screw. Avoid pinching the battery pack wires.
Required tools: Phillips screwdriver
Replacing the battery pack

0
1
Maintenance and S
ervice
9.5 Instrument Disposal
141
1
2
3
4
5
6
7
8
9
1
1
The instrument contains a lithium battery for system backup.
9.5 Instrument Disposal
To avoid electrocution, turn off the power switch and discon-nect the power cord before removing the lithium battery.
• If the protective functions of the instrument are damaged, eitherremove it from service or mark it clearly so that others do notuse it inadvertently.
• When disposing of this instrument, remove the lithium batteryand dispose of battery and instrument in accordance with localregulations.
1. Turn the instrument upsidedown and remove the fivescrews affixing the bottomcover.
2. Turn the instrument right sideup and remove the top cover.
3. Cut the two leads of the button-type lithium battery near thecorner of the circuit boards.
Bottom cover
Circuit Board
Lead
Required tools:• Phillips screwdriver• Wire cutter
Lithium Battery Removal
CALIFORNIA, USA ONLYThis product contains a CR Coin LithiumBattery which contains Perchlorate Mate-rial - special handling may apply.See www.dtsc.ca.gov/hazardouswaste/perchlorate

9.5 Instrument Disposal
142 Quick Start Manual

0
1
PPX
DX
Appendix
143
1
2
3
4
5
6
7
8
9
1
1
A
I
Troubleshooting
Appendix
Setting problems
Changing settings while [RECORDING] or [ANALYZING] is dis-played?
In either case, data stored in internal memory is erased.
Measurement problems
The Start key does not start recording during [ANALYZING] opera-tion!
CAUTION! Pressing erases all data stored in internal memory.
The measurement period is unknown.
Refer to the recording time table for time series graphs.❖ (page 135)
To measure over a long period
Install a Flash ATA Card.If a 128-MB card is installed: the recording period is about 10 times that listed. (However, the maximum recording period in all cases is limited to 31 days.)
The Real-Time View is not available on the VIEW screen
The previous event selection is being retained.
Press once to revert to the EVENT screen, then return to the VIEW screen.
[SETTING]During [RECORDING] operation:
During [ANALYZING] operation: [SETTING]
Return to the setting mode from analysis
[RECORDING]Start recording
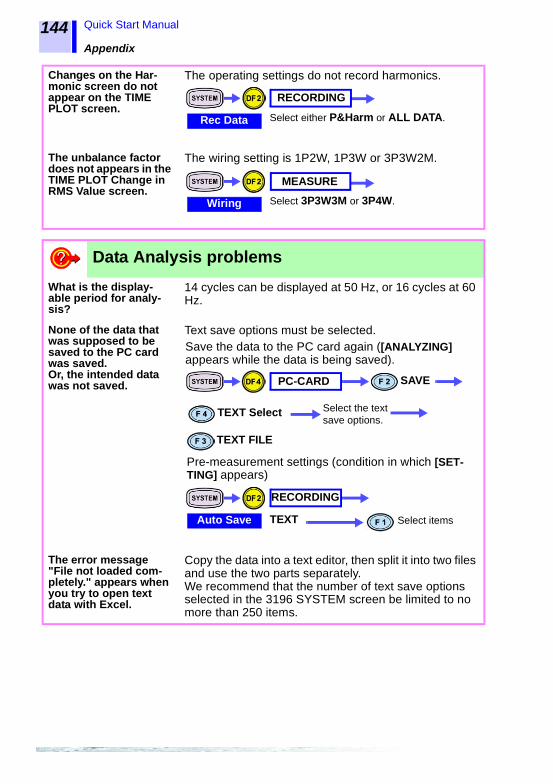
Appendix
144 Quick Start Manual
Changes on the Har-monic screen do not appear on the TIME PLOT screen.
The operating settings do not record harmonics.
The unbalance factor does not appears in the TIME PLOT Change in RMS Value screen.
The wiring setting is 1P2W, 1P3W or 3P3W2M.
Data Analysis problems
What is the display-able period for analy-sis?
14 cycles can be displayed at 50 Hz, or 16 cycles at 60 Hz.
None of the data that was supposed to be saved to the PC card was saved.Or, the intended data was not saved.
Text save options must be selected.
The error message "File not loaded com-pletely." appears when you try to open text data with Excel.
Copy the data into a text editor, then split it into two files and use the two parts separately.We recommend that the number of text save options selected in the 3196 SYSTEM screen be limited to no more than 250 items.
Rec Data Select either P&Harm or ALL DATA.
RECORDING
Wiring Select 3P3W3M or 3P4W.
MEASURE
PC-CARD SAVE
TEXT Select Select the text save options.
TEXT FILE
Save the data to the PC card again ([ANALYZING] appears while the data is being saved).
Auto Save TEXT
RECORDING
Select items
Pre-measurement settings (condition in which [SET-TING] appears)

0
1
PPX
DX
Appendix
145
1
2
3
4
5
6
7
8
9
1
1
A
I
FAQ
How can I measure for a period of more than one month?
Answer: By using a PC card and setting SYSTEM-DF2 [RECORDING] for repeated recording, it is possible to record measurement data for up to 99 weeks.
How can the threshold be changed during recording? I need to change the threshold to suit conditions while measuring.
Answer: Event settings cannot be changed while recording. However, from the setting mode ([SETTING]) the Event monitor can be used to observe occurrences while changing the threshold, but without switching to the recording mode ([RECORDING]).
How can I monitor several locations (such as multiple chan-nels on a distribution panel or multiple outlets in a building) in a single-phase system?
Answer: Ignore power measurement values, and use the 3P4W mea-surement mode.
How can I measure in-rush current (about 3-kHz frequency range).
Answer: Monitor peak current on the :TIME PLOT screen.
How can I observe an interruption (several ms) that cuts part of the waveform?
Answer: Use a waveform comparison event.
How can I observe an interruption (several µs) that cuts part of the waveform?
Answer: Use the transient method.
I want a bound instruction manual.
Answer: Bound manuals are available. Contact your nearest dealer or distributor for information.

Appendix
146 Quick Start Manual
Reference
List of PC cards certified for useHioki options only (includes adapter)• 9726 PC CARD 128M• 9727 PC CARD 256M• 9728 PC CARD 512M
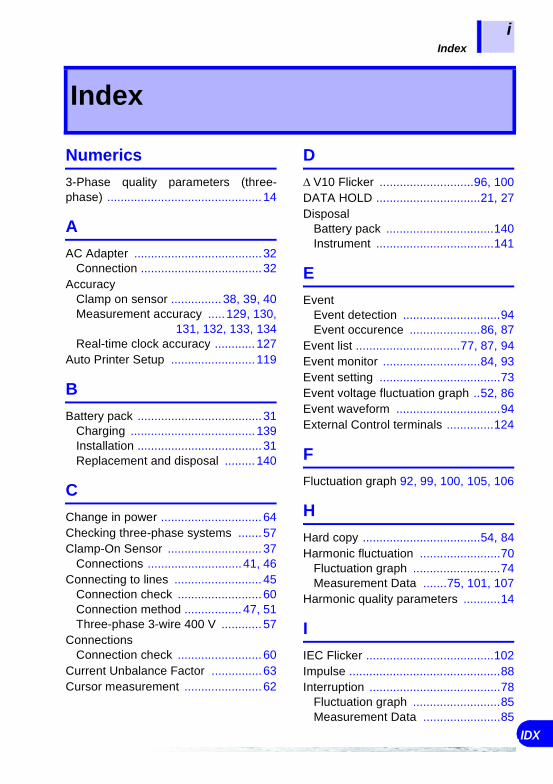
Index
0
1
DX
i
1
2
3
4
5
6
7
8
9
1
1
I
Numerics
3-Phase quality parameters (three-phase) .............................................. 14
A
AC Adapter ......................................32Connection ....................................32
AccuracyClamp on sensor ............... 38, 39, 40Measurement accuracy .....129, 130,
131, 132, 133, 134Real-time clock accuracy ............ 127
Auto Printer Setup ......................... 119
B
Battery pack .....................................31Charging ..................................... 139Installation .....................................31Replacement and disposal ......... 140
C
Change in power .............................. 64Checking three-phase systems ....... 57Clamp-On Sensor ............................ 37
Connections ............................41, 46Connecting to lines .......................... 45
Connection check ......................... 60Connection method ................. 47, 51Three-phase 3-wire 400 V ............ 57
ConnectionsConnection check ......................... 60
Current Unbalance Factor ...............63Cursor measurement ....................... 62
D
Δ V10 Flicker ............................96, 100DATA HOLD ...............................21, 27Disposal
Battery pack ................................140Instrument ...................................141
E
EventEvent detection .............................94Event occurence .....................86, 87
Event list ...............................77, 87, 94Event monitor .............................84, 93Event setting ....................................73Event voltage fluctuation graph ..52, 86Event waveform ...............................94External Control terminals ..............124
F
Fluctuation graph 92, 99, 100, 105, 106
H
Hard copy ...................................54, 84Harmonic fluctuation ........................70
Fluctuation graph ..........................74Measurement Data .......75, 101, 107
Harmonic quality parameters ...........14
I
IEC Flicker ......................................102Impulse .............................................88Interruption .......................................78
Fluctuation graph ..........................85Measurement Data .......................85
Index

Index
ii Quick Start Manual
Observation ................................ 145
K
Key operationsTroubleshooting .......................... 138
L
LAN ................................................ 121Connection ................................. 123
M
Manual event ................................. 124Modem ........................................... 121
P
PC Card ......................................... 109Auto Save ................................... 113Delete ......................................... 115Hard Copy .................................. 115Initialization ................................. 111Inserting and removing ............... 111Loading ....................................... 112Save ........................................... 112Saving after measurement ......... 114Troubleshooting .......................... 138
Power quality parameters ................ 14Power supply
Troubleshooting .......................... 138Power supply quality
Harmonic voltage quality .............. 14Power supply quality parameters ..... 14Printer ............................................ 116
Connection ................................. 117Hard Copy .................................. 120Loading paper ............................. 118Setup .......................................... 119Troubleshooting .......................... 138
R
RecordingFinished recording ........................ 68
Start ..............................................66RMS Voltage ....................................69RMS voltage quality parameters ......14RS-232C
Connection ..................................122Interface ......................................121
S
Self-test ............................................43System reset ....................................51
T
Three-phase current ........................62Three-phase voltage ........................62Time series graph ............................52Transient ....................................88, 91
Transient waveform ......................95Troubleshooting .....................138, 143
V
Version .......................................43, 51Voltage cord .....................................33
Connections ......................33, 34, 46Voltage fluctuation .....................85, 86Voltage Unbalance Factor ...............63
W
Waveform distortion .........................88Waveform scrolling ..........................62Wiring Adapter .................................35
Connection ....................................35

4
5
6
7
8
9
10
11