Automated Hematology Cell Counters Analyzer BC-5800
25
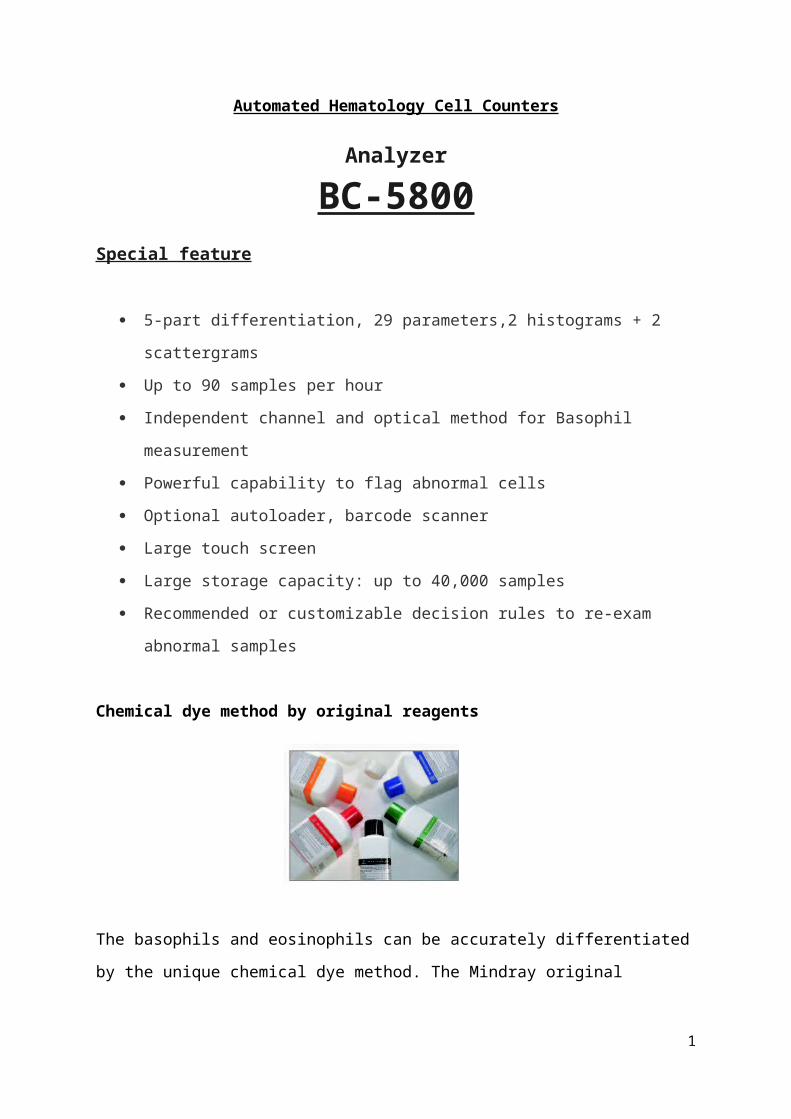
Automated Hematology Cell Counters Analyzer BC-5800 Special feature 5-part differentiation, 29 parameters,2 histograms + 2 scattergrams Up to 90 samples per hour Independent channel and optical method for Basophil measurement Powerful capability to flag abnormal cells Optional autoloader, barcode scanner Large touch screen Large storage capacity: up to 40,000 samples Recommended or customizable decision rules to re-exam abnormal samples Chemical dye method by original reagents The basophils and eosinophils can be accurately differentiated by the unique chemical dye method. The Mindray original 1
Transcript of Automated Hematology Cell Counters Analyzer BC-5800
Automated Hematology Cell Counters
Analyzer
BC-5800Special feature
5-part differentiation, 29 parameters,2 histograms + 2
scattergrams
Up to 90 samples per hour
Independent channel and optical method for Basophil
measurement
Powerful capability to flag abnormal cells
Optional autoloader, barcode scanner
Large touch screen
Large storage capacity: up to 40,000 samples
Recommended or customizable decision rules to re-exam
abnormal samples
Chemical dye method by original reagents
The basophils and eosinophils can be accurately differentiated
by the unique chemical dye method. The Mindray original
1
reagents , control and calibrator is a complete system to
ensure high accuracy.
M 58 LEO (I) lyse –it breaks down red cell membrane and co-
operates with the M 58 LEO (II) lyse to differentiate WBC s.
M 58 LEO (II) lyse – it co-operates with the M 58 LEO (I) lyse
to differentiate WBC s.
M 58 LBA lyse - it breaks down red cell membrane and
differentiate WBC s.
M 58 LH lyse - it breaks down red cell membrane and converts
Hb to a haemoglobin complex to determine the HGB.
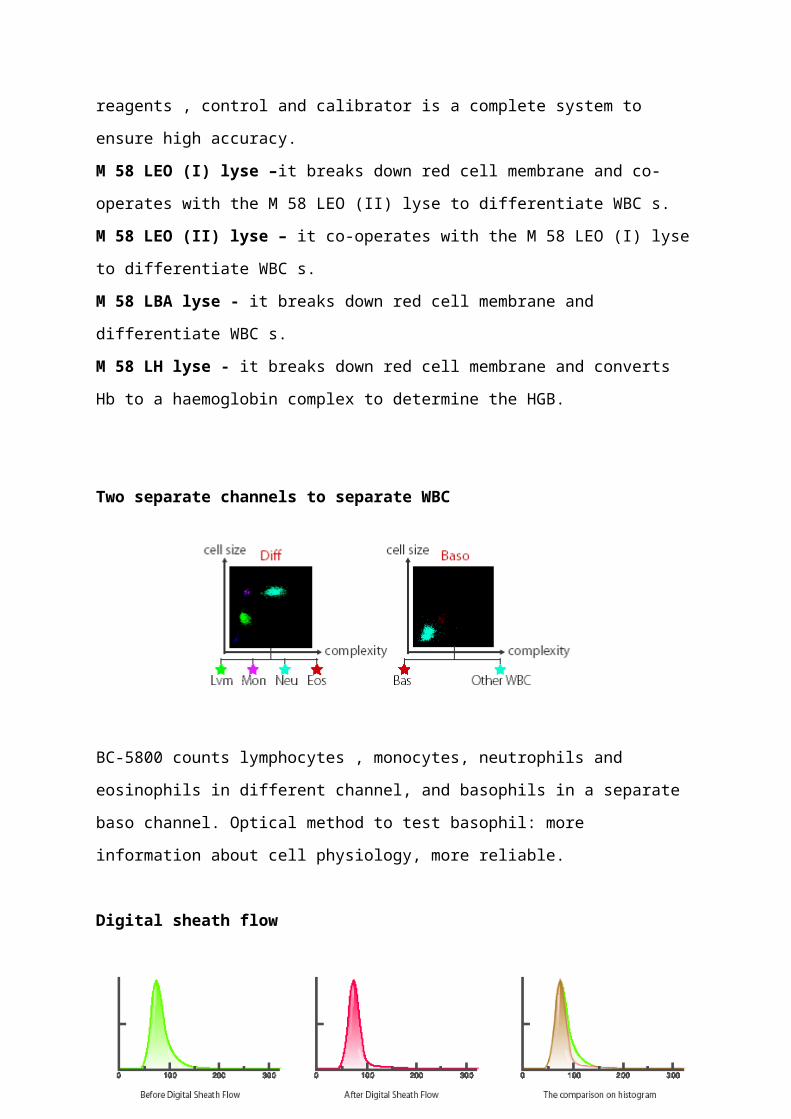
Two separate channels to separate WBC
BC-5800 counts lymphocytes , monocytes, neutrophils and
eosinophils in different channel, and basophils in a separate
baso channel. Optical method to test basophil: more
information about cell physiology, more reliable.
Digital sheath flow
2

This can monitor every cell’s status while going through the
aperture, this accurately measures the volume of cells, giving
a standardized histogram shape.
Re- exam
Decision rules recommended by Mindray can help remind to re-
exam abnormal samples, reduce post analytical errors and
review rate. Decision rules can also be customerized with new
input support to fit any standard laboratory practices.
Data management software (DMS)
With DMS , data can be transmitted to PC. DMS is a standard
configuration of BC – 5800 to meet different laboratories’
3

demand , and offer more customization on report , data editing
and net connection.
Principle
Impedance technique
These counters are based on the Coulter principle,
i.e. electrical resistance principle, which depends on the
fact that blood cells are nonconductive to electricity, so
when they pass through an electrical field they will increase
the electrical impedance (resistance).
Well mixed blood is greatly diluted/suspended in an
isotonic electrolyte solution, so that cell sizes are not
altered/changed in terms of cell shrinkage nor cell swelling,
this isotonic electrolyte solution conduct electricity very
well, while blood cells are nonconductive.
A counting chamber consists of
(1) a beaker,
(2) two electrodes with a direct
current pass through them, and an orifice/small opening the
aperture with specified dimensions.
when the suspended cells/particles passes through the aperture
it will displace its own volume of isotonic electrolyte
solution and increase the electrical resistance (impedance),
because of their non-conductivity between the two electrodes
4
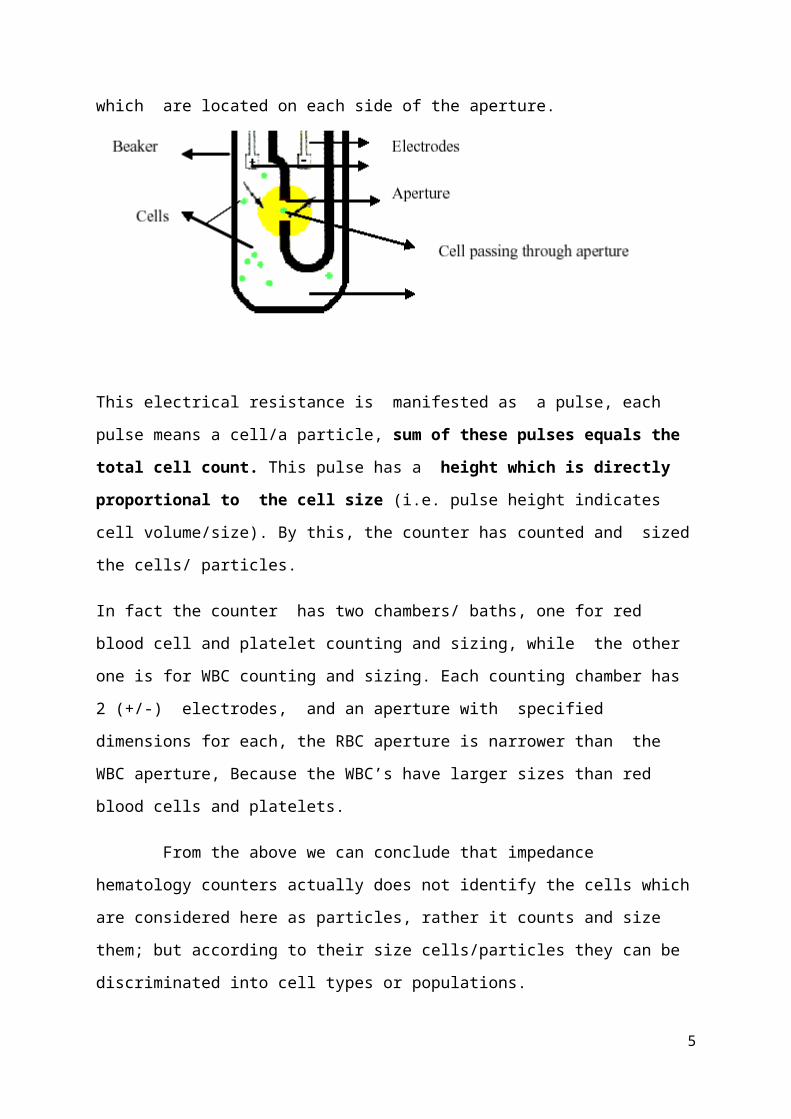
which are located on each side of the aperture.
This electrical resistance is manifested as a pulse, each
pulse means a cell/a particle, sum of these pulses equals the
total cell count. This pulse has a height which is directly
proportional to the cell size (i.e. pulse height indicates
cell volume/size). By this, the counter has counted and sized
the cells/ particles.
In fact the counter has two chambers/ baths, one for red
blood cell and platelet counting and sizing, while the other
one is for WBC counting and sizing. Each counting chamber has
2 (+/-) electrodes, and an aperture with specified
dimensions for each, the RBC aperture is narrower than the
WBC aperture, Because the WBC’s have larger sizes than red
blood cells and platelets.
From the above we can conclude that impedance
hematology counters actually does not identify the cells which
are considered here as particles, rather it counts and size
them; but according to their size cells/particles they can be
discriminated into cell types or populations.
5
As soon as patient well mixed blood sample is aspirated into
the counter, blood is highly diluted with the isotonic
solution (the isotonic solution is called the diluent
reagent), then this dilution is divided into 2 portions/parts;
o First portion will be enforced through the tubing toward
the RBC chamber, where it is further diluted with the
isotonic solution, and then cells/particles are passed
through the aperture, in which red blood cells and
platelets are counted and sized according to the
total number and heights.
Cell passing through a perture of created pulses.
cells/particles which have a volume between 2-20 fl are
considered and counted as platelets, while cells between 36
to 360 fl are considered and counted as red blood cells.
When we have microcytic red cells (decreased volume),
or fragmented red cells (schistocytes, which are characterized
by greatly reduced volume/size) they may be counted as
platelets, on the other hand, also when we have large
platelets they may be counted as red blood cells, causing
erroneous counting results according to the defect.
o The second portion of diluted blood sample will be moved
through tubing towards the WBC chamber, where it is
further diluted with a lyse reagent; not the diluent;
this lyse reagent has several functions:
(1).will lyse the red blood cells, so that red
blood cells will not be counted or interfere with white blood
6
cells; whereas in RBC chamber WBC’s are not lysed, but because
of their low count (WBC’s, are in thousands/cumm) in
comparison to the very high RBC count which are in millions
per cumm, they will not affect significantly the total red
blood cell count, only in cases of very high WBC count as
seen in leukemias, they may affect the RBC total count.
(2). lyse reagent contains Drabkin’s solution which
is provided for hemoglobin determination, when the red cells
are lysed they release hemoglobin.
(3). lyse reagent will puncture the WBC membranes
so that they will collapse around the nucleus with their
granules. So, when the WBC’s pass through the aperture they
are counted and sized in the same manner as red blood cells
and platelets are counted and sized, but the difference here
that the counter in counting and sizing the WBC nucleuses
because their membranes are punctured by the lyse reagent.
e.g.:- three part WBC differential
The particles/collapsed cells can be discriminated into three
zones, the first zone is considering cells with a volume of
35-90 fl - which are differentiated as lymphocytes, the
second zone with cell volumes between 90-160 fl, which are
differentiated as monocytes, and the third last zone with
cell volumes between 160-450 fl, are differentiated as
neutrophils. By this the counter has counted the total WBC
count, and performed three part differential.
7

We know that the monocytes are bigger than neutrophils,
but why the counter considered neutrophils as bigger?
The answer is because the lyse reagent puncture the cell
membranes, with subsequent collapse around the nucleus with
the granules, the nucleus plus granules size of
neutrophils is bigger than monocyte nucleus with it’s
granules, the counter is not sizing the whole WBC cell
rather it is sizing the collapsed punctured WBC cell in
which the neutrophil collapsed cell is bigger than monocyte
collapsed cell.
o One point also should be considered here, that platelets
are not lysed here, but because of there small size they
are not counted as WBC’s, but when platelet clumps or
aggregated platelets are present they can be counted as
one big particle, they may be counted as WBC’s and
interfere with WBC count.
Hb determination
After the WBC’s are counted, the WBC diluted blood portion is
moved toward the spectrophotometer which is provided inside
the counter for hemoglobin determination at 530-540 nm,
according to Drabkin’s method. Hb is measured using modified
cyanomethhaemoglobin method. Non ionic detergent is added to
ensure rapid cell lysis and reduced turbidity caused by
membrane. Measurement of absorbance is done at a set time
interval after mixing the reagent with blood but before the
reaction is completed.
8
White cell differential count
Differential white cell count is based on various physical
characteristics of white cells. Three simultaneous
measurements are done on each white cells ( two electrical and
one optical measurements)
I. Impedance measurement
II. Conductivity measurement
III. Light scattering
Impedance measurement depends on the cell volume. Conductivity
measurement depends on the internal structure of the cell ,
nuclear cytoplasmic ratio, nuclear density and nuclear
granularity.
Light scattering depends on the cell structure , shape and
reflectivity of cells.
Light scattering measurements
A solution containing blood cells are allowed to flow through
a cuvette .A beam of light is focused on to this cuvette. Then
this light be is pass through it to a dark field. When a light
beam is interrupted by a cell , it causes the light to be
scattered.
These scattered light rays radiate out beyond the periphery
of dark field disk. These are collected by photomultiplier
tube.
9

It generates electrical pulse and then it is counted. When no
cell flow through the cuvette, the dark field disc catches all
light rays and therefore no pulses are generated by
photomultiplier tube.
BC-5800 haematology analyser utilizes the semi conductor laser
for the flowcytometry system. Through calculations of
different angles via laser scatters, the instrument provides
complete analysis including cell size, granularity and
complexity.
Differential white cell count is based of the different light
absorption and scattering characteristics of each white cell
type.
Eg;-
00 –indicator of cell size
100 –indicator of the structure and complexity.
900 – indicates nuclear lobularity and cell granularity.
10

Conductivity measurements
This is done by alternating current in the radio frequency
range.It circuits the bipolar lipid layer of the cell membrane
allowing the energy to penetrate the cell. Powerful probe is
used to collect information about cell size and internal
structures including chemical composition and nuclear volume.
Errors in auto analyzers.
Red cell agglutinations can be counted as one cell.
Cell deformities- appear smaller
Cells which recirculation causes for the aberrant impulse
Cells which pass simultaneously counted as a single cell.
Two or more cells enter at the same time to the aperture and
be sized and counted as one cell (as one high pulse), giving
a high pulse indicating a very large cell. This is called the
coincidence error. But this error is minimized by the huge
dilution ( but more and more dilutions, causes dilution
error.), by decreasing the aperture dimensions, and by the
computer which statistically corrects for this error.
Counting of bubbles, lipid droplets and micro organisms
as cells.
Causes for inaccurate automated blood counts.
11
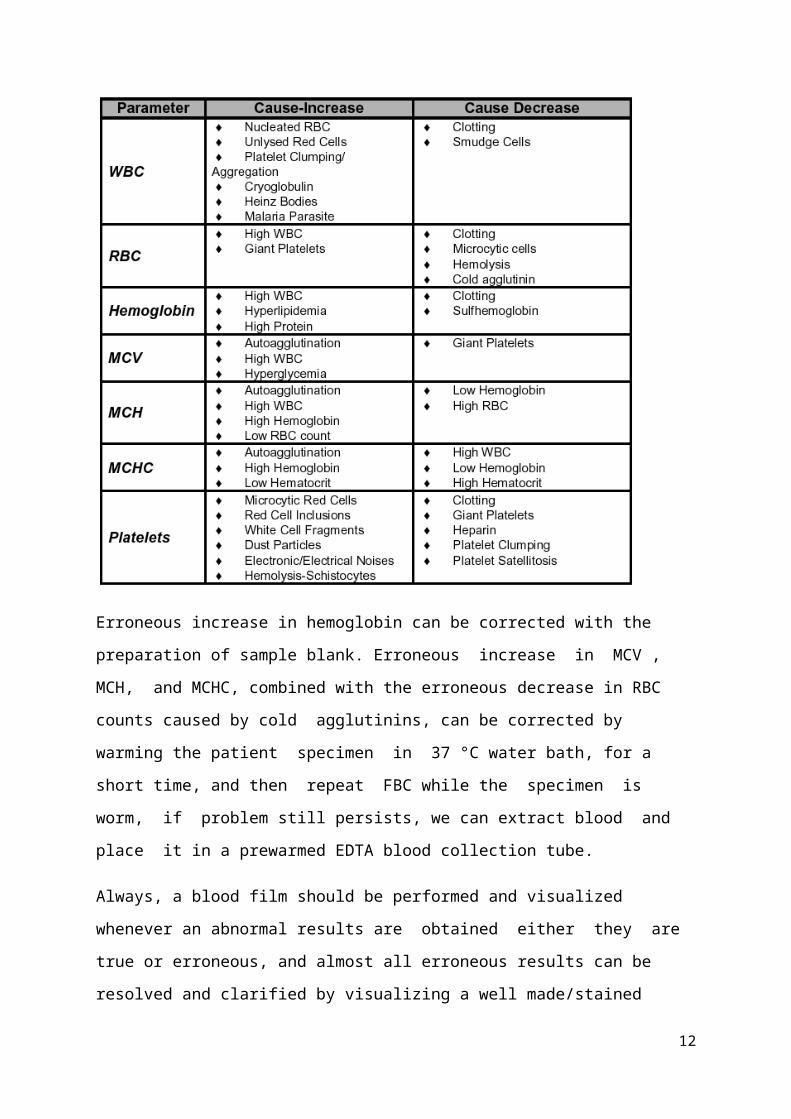
Erroneous increase in hemoglobin can be corrected with the
preparation of sample blank. Erroneous increase in MCV ,
MCH, and MCHC, combined with the erroneous decrease in RBC
counts caused by cold agglutinins, can be corrected by
warming the patient specimen in 37 °C water bath, for a
short time, and then repeat FBC while the specimen is
worm, if problem still persists, we can extract blood and
place it in a prewarmed EDTA blood collection tube.
Always, a blood film should be performed and visualized
whenever an abnormal results are obtained either they are
true or erroneous, and almost all erroneous results can be
resolved and clarified by visualizing a well made/stained
12

blood film, because the machine does not always detect what
the eye does.
Automated Hematology Counter Histograms
Histograms are graphical representations of relative
cell/particle frequency versus cell/particle volume/size.
Normally three histograms are displayed; RBC, WBC, and
platelets histogram. Not only the histograms supply us with
information about RBC’s, WBC’s, and platelets frequency, their
distribution, and average sizes, but also depict the presence
of cell subpopulations. Shifting of the histogram in one
direction or the other direction can be of diagnostic
importance. X-axis represents cell size , and theY axis
represents relative frequency of cells/particles.
Red Blood Cell Histogram
Fig: Normal RBC histogram
RBC
have a
cell
13
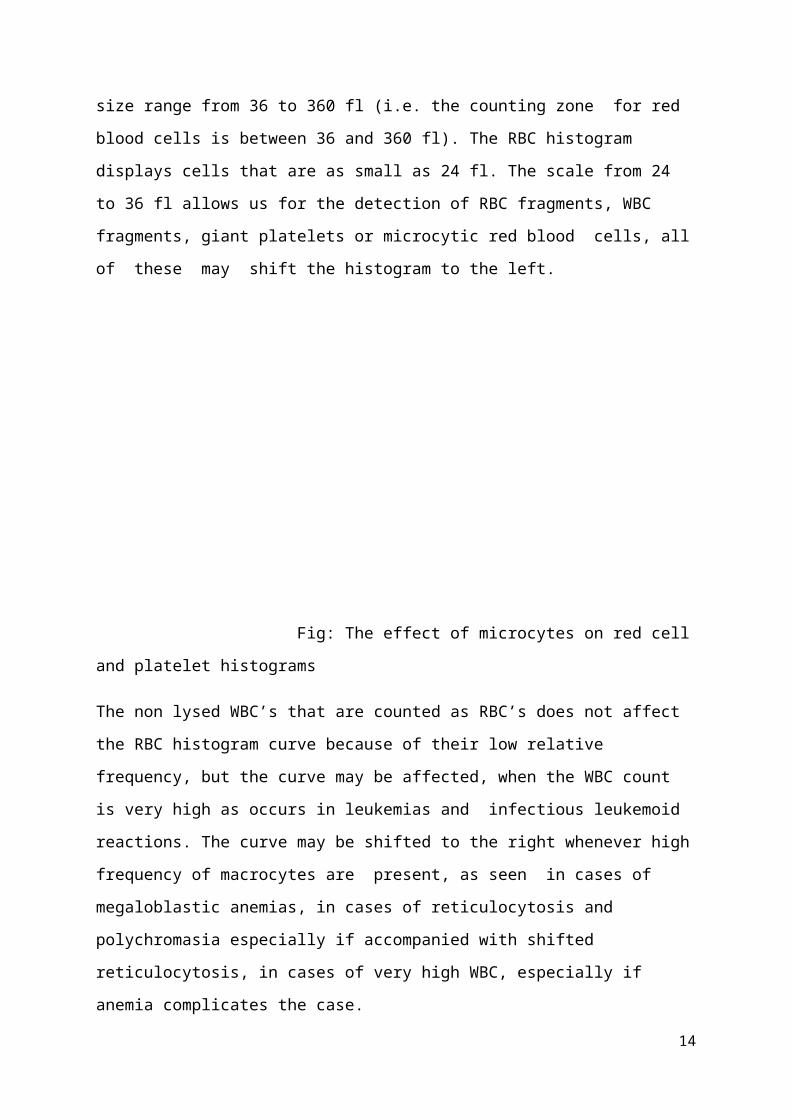
size range from 36 to 360 fl (i.e. the counting zone for red
blood cells is between 36 and 360 fl). The RBC histogram
displays cells that are as small as 24 fl. The scale from 24
to 36 fl allows us for the detection of RBC fragments, WBC
fragments, giant platelets or microcytic red blood cells, all
of these may shift the histogram to the left.
Fig: The effect of microcytes on red cell
and platelet histograms
The non lysed WBC’s that are counted as RBC’s does not affect
the RBC histogram curve because of their low relative
frequency, but the curve may be affected, when the WBC count
is very high as occurs in leukemias and infectious leukemoid
reactions. The curve may be shifted to the right whenever high
frequency of macrocytes are present, as seen in cases of
megaloblastic anemias, in cases of reticulocytosis and
polychromasia especially if accompanied with shifted
reticulocytosis, in cases of very high WBC, especially if
anemia complicates the case.
14
The RBC histogram may be bi-modal in various conditions, and
this may indicate the presence of two cell populations. Bi-
modal curve may be seen in cold agglutinin disease, in iron
deficiency anemia with recent blood transfusion, in
sideroblastic anemia especially in the acquired forms, and in
megaloblastic anemia with recent blood transfusion.
White Blood Cell Histogram
WBC histogram displays the classification of WBC’s
according to their sizes after cytoplasmic puncture by the
lyse reagent, i.e. does not display the native WBC sizes. From
the histogram the percent, absolute counts, and frequency
distribution of the WBC differential, i.e. lymphocytes,
middle cells (normally monocytes, abnormally may be immature
cells such as myeloblasts, and myelocytes), and granulocytes
can be determined.
WBC histogram displays particles/cells as small as 30 fl, but
only those cells which are greater than 35 fl are counted as
WBC’s. The counter differentiate between lymphocytes, middle
cells (or you can use the term mononuclear cells), and
granulocytes. Mononuclear cells includes blasts, and other
immature cells, however, in normal specimens, monocytes
represents the mononuclear counting zone.
On the histogram 4 regions are displayed at 35, 90, 160, and
450 fl. A valley should be seen between the lymphocytes and
mononuclear cells, and between the mononuclear cells and
granulocytes, the automated counter determines the percentage
of each cell type/ subpopulation according to these
15
depression regions, if one or the two valleys is/are absent
this triggers an alert.
The region below 35 fl zone should be clear, with no
interfering cells, if this region is not clear, it is expected
to have either NRBC, or clumped/ aggregated platelets, or
Heinz bodies, or cryoglobulin, or unlysed mature red blood
cells, or malaria parasite, or any other causes, a blood film
should be made to clarify the reason for interference.
Cells that can trigger an alert (interfere) in the region
between the lymphocytes, and mononuclear cells are certain
blast cell forms, plasma cells, or in some cases eosinophilia
and basophilia. Cells that can trigger an alert in the region
between mononuclear cells and the granulocytes includes
immature granulocytes, blasts, and eosinophils. Cells that
interfere in the far right side of the curve usually indicates
a high absolute granulocytic count and/or presence of toxic
granulation. Multiple region alerts may be encountered , in
one patient sample. Also, an alert may be triggered at exactly
35 fl region, which is usually seen in cases of chronic
lymphocytic leukemia (CLL).
Platelets Histogram
Platelets histogram is useful in interpreting
platelets sizes and abnormal platelet morphology.
Particles/Platelets that are between 2 to 20 fl are counted as
platelets by the automated counter.
16
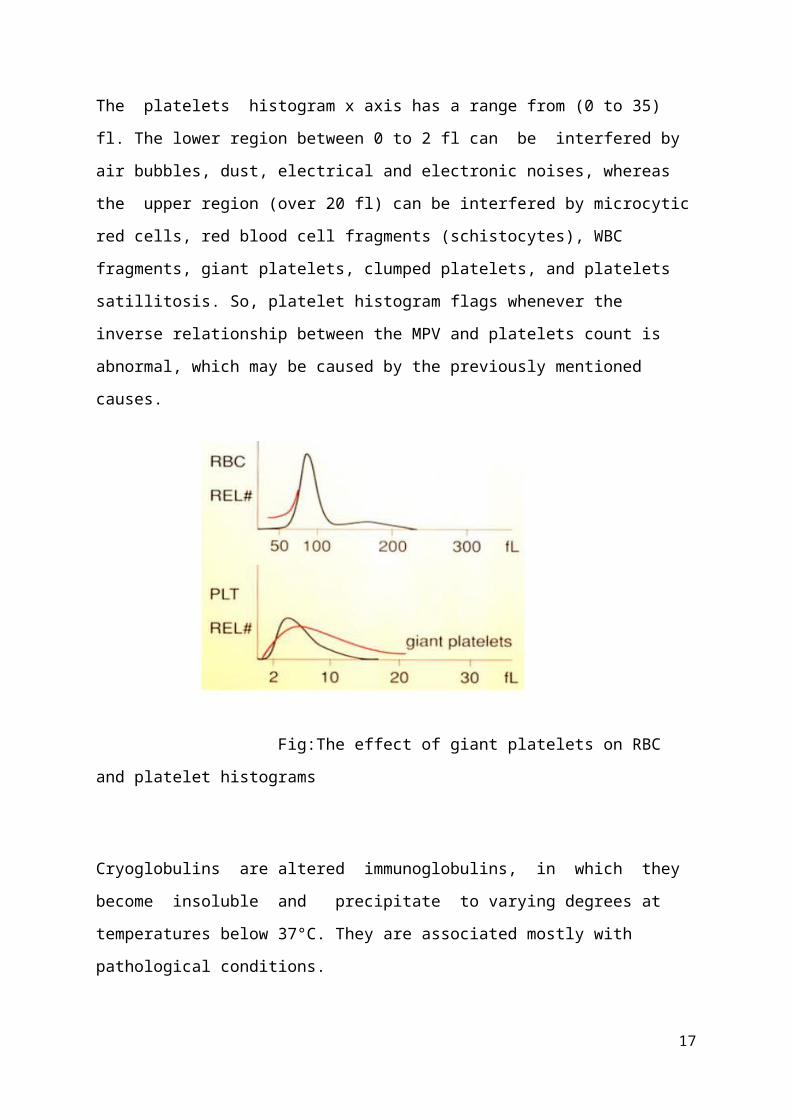
The platelets histogram x axis has a range from (0 to 35)
fl. The lower region between 0 to 2 fl can be interfered by
air bubbles, dust, electrical and electronic noises, whereas
the upper region (over 20 fl) can be interfered by microcytic
red cells, red blood cell fragments (schistocytes), WBC
fragments, giant platelets, clumped platelets, and platelets
satillitosis. So, platelet histogram flags whenever the
inverse relationship between the MPV and platelets count is
abnormal, which may be caused by the previously mentioned
causes.
Fig:The effect of giant platelets on RBC
and platelet histograms
Cryoglobulins are altered immunoglobulins, in which they
become insoluble and precipitate to varying degrees at
temperatures below 37°C. They are associated mostly with
pathological conditions.
17

From the above discussion we can conclude that the blood cell
histograms supplied by the automated hematology analyzers
are of great diagnostic and morphologic importance, also they
alert us if a patient sample need blood film preparation and
examination or not.
Although practice and blood films examination will increase
the knowledge of interpreting and analyzing these blood cell
histograms. Normal RBC Histogram Curve to the left represents
microcytic red cells, whereas curve to the right represents
normocytic RBC curve.
18
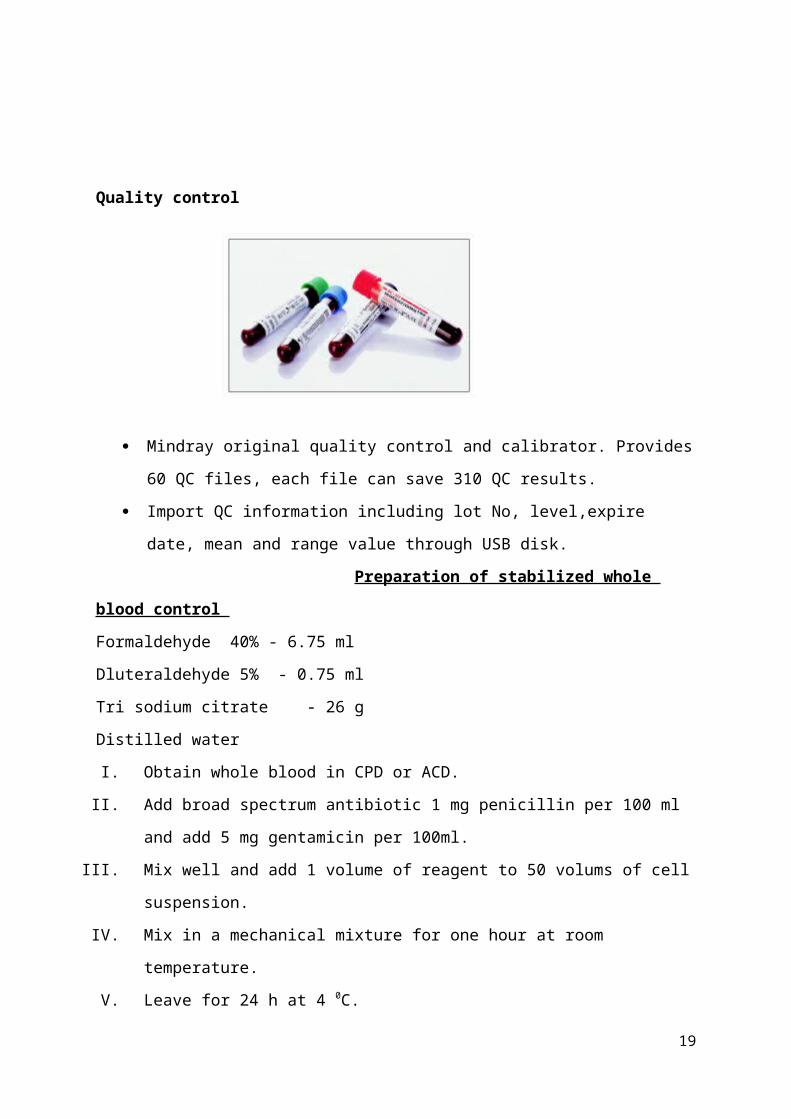
Quality control
Mindray original quality control and calibrator. Provides
60 QC files, each file can save 310 QC results.
Import QC information including lot No, level,expire
date, mean and range value through USB disk.
Preparation of stabilized whole
blood control
Formaldehyde 40% - 6.75 ml
Dluteraldehyde 5% - 0.75 ml
Tri sodium citrate - 26 g
Distilled water
I. Obtain whole blood in CPD or ACD.
II. Add broad spectrum antibiotic 1 mg penicillin per 100 ml
and add 5 mg gentamicin per 100ml.
III. Mix well and add 1 volume of reagent to 50 volums of cell
suspension.
IV. Mix in a mechanical mixture for one hour at room
temperature.
V. Leave for 24 h at 4 0C.
19

VI. With continuous mixing dispence in to a sterile
container.
VII. Cap tightly and seal. Refrigerate at 4 0C.
VIII. Keep ½ h at room temperature before analysis mix on a
roler mixer, assign values doing testing two times. Draw
control charts.
Report-A
20
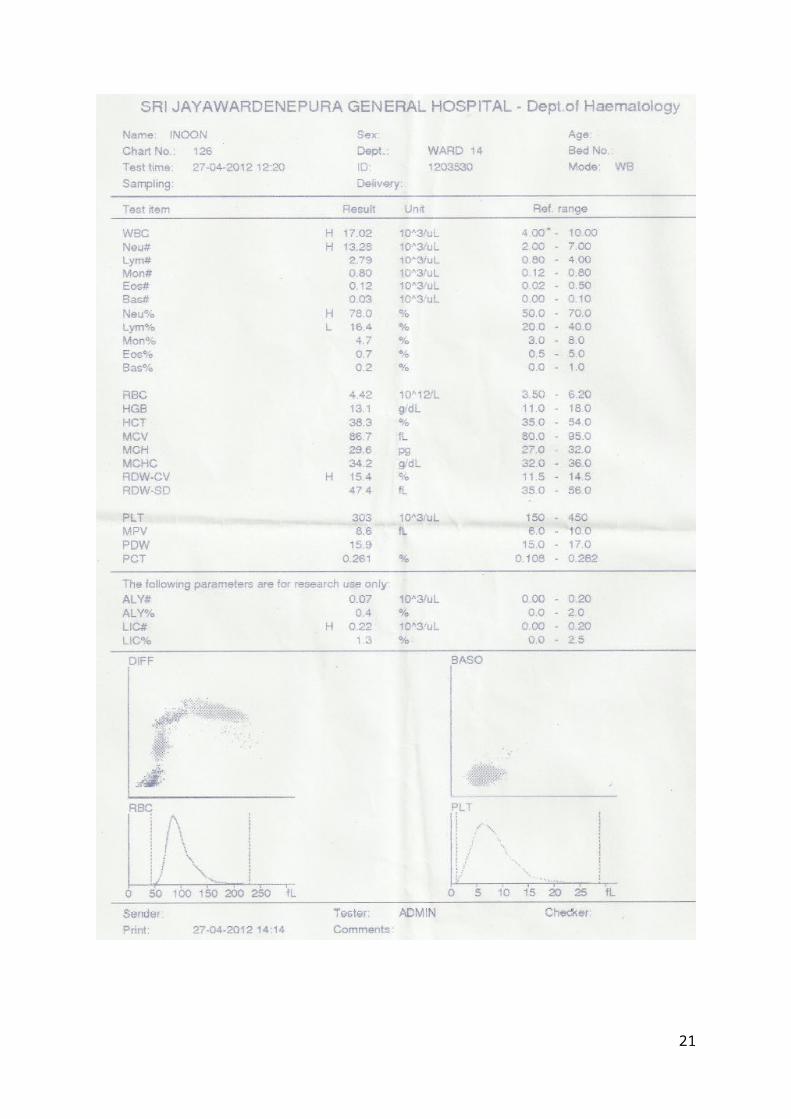
21
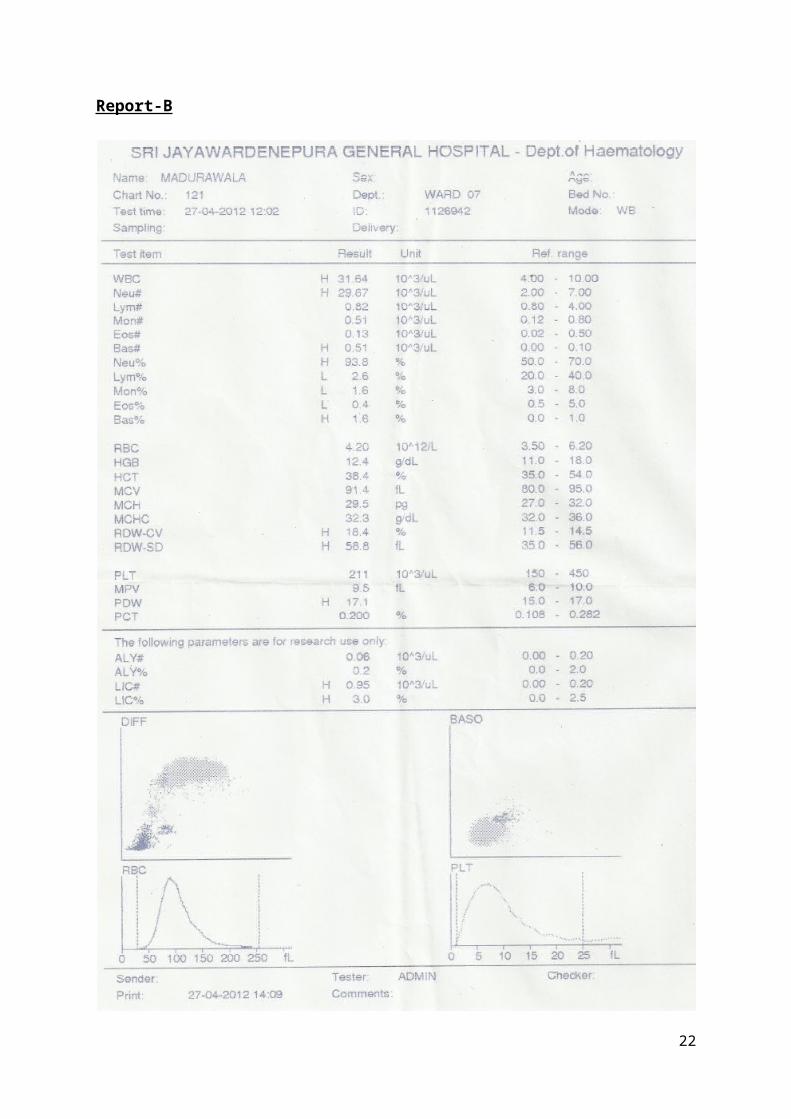
Report-B
22
All of the above is supplied to the counter computer,
which do its calculations to give meaningful data. The counter
is not only supplying us with,
(1) RBC count, (2) Platelets count, (3)
Hemoglobin concentration,
(4) WBC count, with its 5 part differential,
(5) MCV, which is here is considered as a measured
parameter, not calculated parameter, and it is derived from
the RBC histogram.
(6) Hct, which is a calculated parameter here; the counter
does have a hematocrit centrifuge inside it; it is derived
from RBC total count and the MCV, by applying the following
formula (Hct = MCV x RBC/10),
(7) MCH, which is calculated from Hb and RBC count,
(8) MCHC, which is calculated from Hct , and Hb,
(9) RDW, Red cell Distribution Width, which measures the
degree of anisocytosis; RDW is a calculated parameter, RDW
is helpful in many instances, it is the first parameter to
increase in cases of nutritional deficiencies, especially
iron deficiency anemia, it is also used to differentiate
between iron deficiency anemia (low MCV , high RDW), and
uncomplicated thalassemia minor (low MCV, normal RDW).
RDW has a normal range between 11.6 and 14.6, so when RDW
is normal it is expected to have red cells which are
homogeneous and exhibit very minimal anisocytosis on
23

peripheral blood films, but when RDW is high it is expected
to find red cells with altered sizes.
(10) MPV, Mean Platelets Volume, which analogues the MCV for
red cells, MPV have a nonlinear inverse relationship with
platelets count, i.e. when platelet count is low, MPV is
high (platelets are large in size), a technical point should
be mentioned here, that when blood is extracted from the
patient, platelets change shape from discoid to spheroid,
this alteration in shape, causes an increase in MPV, this is
why it is advisable to analyze the blood specimens after 30
to 60 minutes of blood extraction.
When platelets count is low, and MPV is low, it is expected
that the bone marrow platelet production is defected,
because when platelets are low in number (thrombocytopenia)
the bone marrow will react by producing platelets with
increased volume/size (large platelets functions more than
small platelets), while if we have low platelets count with
high MPV, the cause of thrombocytopenia is expected to be
peripheral not bone marrow in origin, because here the bone
marrow responded to thrombocytopenia by producing and
releasing large platelets,
(11) PDW, Platelet Distribution Width, is a measure of the
uniformity of platelet sizes, normal PDW is less than 20%,
increased PDW is associated with abnormal megakaryocytic
development and maturation.
(12) Pct, Plateletcrit, this parameter represents an
estimate of the percent platelet mass, this parameter is
24

especially in Europe, to determine if the thrombocytopenic
patient is of great need of platelet concentrate transfusion
or not, because patients with reduced Pct may bleed
spontaneously and are considered as candidates for platelet
concentrate transfusions.
25