SIFT Texture Description for Understanding Breast Ultrasound Images
8
SIFT Texture Description for Understanding Breast Ultrasound Images Joan Massich 12, , Fabrice Meriaudeau 2 , Melcior Sent´ ıs 3 , Sergi Ganau 3 , Elsa P´ erez 4 , Domenec Puig 5 , Robert Mart´ ı 1 , Arnau Oliver 1 , and Joan Mart´ ı 1 1 Computer Vision and Robotics Group, University of Girona, Spain [email protected] 2 Laboratoire Le2i-UMR CNRS, University of Burgundy, Le Creusot, France 3 Department of Breast and Gynecological Radiology, UDIAT-Diagnostic Center, Parc Taul´ ı Corporation, Sabadell, Spain 4 Department of Radiology, Hospital Josep Trueta of Girona, Spain 5 Department of Computer Engineering and Mathematics, University Rovira i Virgili, Tarragona, Spain Abstract. Texture is a powerful cue for describing structures that show a high degree of similarity in their image intensity patterns. This paper describes the use of Self-Invariant Feature Transform (SIFT), both as low-level and high-level descriptors, applied to differentiate the tissues present in breast US images. For the low-level texture descriptors case, SIFT descriptors are extracted from a regular grid. The high-level tex- ture descriptor is build as a Bag-of-Features (BoF) of SIFT descriptors. Experimental results are provided showing the validity of the proposed approach for describing the tissues in breast US images. Keywords: breast cancer, ultrasound, texture, SIFT. 1 Introduction Breast cancer is the second most common cancer (1.4 million cases per year, 10.9% of diagnosed cancers) after lung cancer, followed by colorectal, stomach, prostate and liver cancers. In terms of mortality, breast cancer is the fifth most common cause of cancer death. However, it places as the leading cause of cancer death among females both in western countries and in economically developing countries [3]. Medical imaging plays an important role in breast cancer mortality reduction, contributing to its early detection through screening, diagnosis, image-guided biopsy, treatment follow-up and suchlike procedures [5]. Despite Digital Mam- mography (DM) still remains as the image modality of reference for diagnose purposes, Ultra-Sound (US) offers useful complementary diagnose information due to its capabilities for differentiating between solid lesions that are benign or This work was partially supported by the Spanish Science and Innovation grant nb. TIN2012-37171-C02-01 and TTIN2012-37171-C02-02 and the Regional Council of Burgundy. H. Fujita, T. Hara, and C. Muramatsu (Eds.): IWDM 2014, LNCS 8539, pp. 681–688, 2014. c Springer International Publishing Switzerland 2014
-
Upload
independent -
Category
Documents
-
view
4 -
download
0
Transcript of SIFT Texture Description for Understanding Breast Ultrasound Images
SIFT Texture Description for Understanding
Breast Ultrasound Images
Joan Massich12,�, Fabrice Meriaudeau2, Melcior Sentıs3, Sergi Ganau3,Elsa Perez4, Domenec Puig5, Robert Martı1, Arnau Oliver1, and Joan Martı1
1 Computer Vision and Robotics Group, University of Girona, [email protected]
2 Laboratoire Le2i-UMR CNRS, University of Burgundy, Le Creusot, France3 Department of Breast and Gynecological Radiology, UDIAT-Diagnostic Center,
Parc Taulı Corporation, Sabadell, Spain4 Department of Radiology, Hospital Josep Trueta of Girona, Spain
5 Department of Computer Engineering and Mathematics, University Rovira iVirgili, Tarragona, Spain
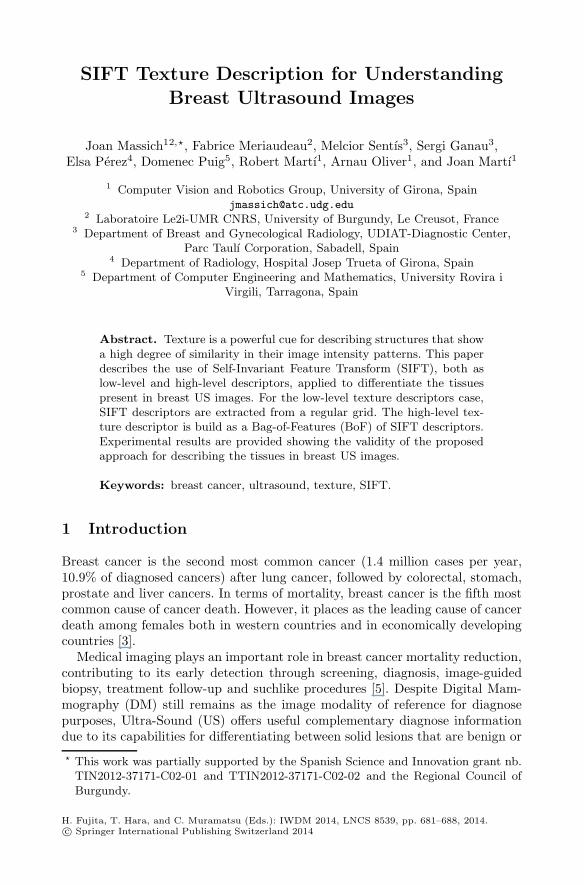
Abstract. Texture is a powerful cue for describing structures that showa high degree of similarity in their image intensity patterns. This paperdescribes the use of Self-Invariant Feature Transform (SIFT), both aslow-level and high-level descriptors, applied to differentiate the tissuespresent in breast US images. For the low-level texture descriptors case,SIFT descriptors are extracted from a regular grid. The high-level tex-ture descriptor is build as a Bag-of-Features (BoF) of SIFT descriptors.Experimental results are provided showing the validity of the proposedapproach for describing the tissues in breast US images.
Keywords: breast cancer, ultrasound, texture, SIFT.
1 Introduction
Breast cancer is the second most common cancer (1.4 million cases per year,10.9% of diagnosed cancers) after lung cancer, followed by colorectal, stomach,prostate and liver cancers. In terms of mortality, breast cancer is the fifth mostcommon cause of cancer death. However, it places as the leading cause of cancerdeath among females both in western countries and in economically developingcountries [3].
Medical imaging plays an important role in breast cancer mortality reduction,contributing to its early detection through screening, diagnosis, image-guidedbiopsy, treatment follow-up and suchlike procedures [5]. Despite Digital Mam-mography (DM) still remains as the image modality of reference for diagnosepurposes, Ultra-Sound (US) offers useful complementary diagnose informationdue to its capabilities for differentiating between solid lesions that are benign or
� This work was partially supported by the Spanish Science and Innovation grant nb.TIN2012-37171-C02-01 and TTIN2012-37171-C02-02 and the Regional Council ofBurgundy.
H. Fujita, T. Hara, and C. Muramatsu (Eds.): IWDM 2014, LNCS 8539, pp. 681–688, 2014.c© Springer International Publishing Switzerland 2014

682 J. Massich et al.
malignant [6]. It is estimated that between 65 ∼ 85% of the biopsies prescribedusing only mammography imaging could be avoided if US information had beentaken into account while issuing the diagnose [7].
In US images, texture is a major characteristic to distinguish between differentbreast tissues, which also allows assessing of the lesion’s pathology [6]. Thus,the importance of incorporating texture data from US images into ComputerAided Diagnosis (CAD) systems. A comprehensive list of texture descriptorsused for detection, segmentation or diagnose tasks applied to US breast imagesis given in Cheng et al. [1], where most of the descriptors are ad-hoc descriptors orbased on well-known texture descriptors such as co-occurrence matrices, waveletcoefficients or Gray-Level Difference Method (GLDM).
This article explores the usage of Self-Invariant Feature Transform (SIFT)descriptors for encoding the US characteristic texture produced by the specklenoise present within the images. Its performance is evaluated using a multi-labelannotated dataset.
2 Material and Methods
In order to develop segmentation methodologies applied to delineate breast le-sions in US data, a set of 700 US images was acquired at the UDIAT DiagnosticCentre of Parc Taulı in Sabadell (Catalunya), between 2010 and 2012. All theimages were provided with accompanying Ground Truth (GT) delineation of thelesions present in the image. From this image database, a reduced dataset of 16images corresponding to different patients was selected and complemented withmulti-label GT in order to evaluate the texture description of the observabletissues in the breast.
Figure 1 illustrates a breast image from the dataset with its associated GT.
3 Using SIFT as a Low-level Texture Descriptor in Orderto Differentiate the Tissues Present in Breast USImages
Self-Invariant Feature Transform (SIFT) [4] transforms key-points into scale androtation invariant coordinates relative to local features. The SIFT descriptor at
Chest wall
Rib
Skin layers
Lesion
Boundary
Air or lungs
Pectoral muscle
Fibro-glandular tissue
Adipose tissue
Background
Fig. 1. Dataset sample. From left to right: image sample, accompanying multi-labelGT, tissue label GT color-coding.
SIFT Texture Description for Understanding Breast Ultrasound Images 683
(a) (b) (c)
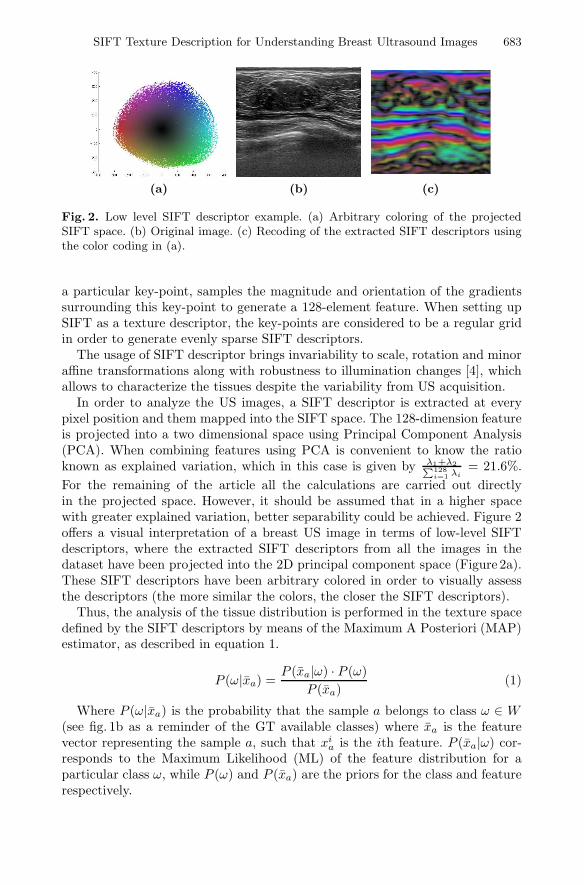
Fig. 2. Low level SIFT descriptor example. (a) Arbitrary coloring of the projectedSIFT space. (b) Original image. (c) Recoding of the extracted SIFT descriptors usingthe color coding in (a).
a particular key-point, samples the magnitude and orientation of the gradientssurrounding this key-point to generate a 128-element feature. When setting upSIFT as a texture descriptor, the key-points are considered to be a regular gridin order to generate evenly sparse SIFT descriptors.
The usage of SIFT descriptor brings invariability to scale, rotation and minoraffine transformations along with robustness to illumination changes [4], whichallows to characterize the tissues despite the variability from US acquisition.
In order to analyze the US images, a SIFT descriptor is extracted at everypixel position and them mapped into the SIFT space. The 128-dimension featureis projected into a two dimensional space using Principal Component Analysis(PCA). When combining features using PCA is convenient to know the ratioknown as explained variation, which in this case is given by λ1+λ2∑128
i=1 λi= 21.6%.
For the remaining of the article all the calculations are carried out directlyin the projected space. However, it should be assumed that in a higher spacewith greater explained variation, better separability could be achieved. Figure 2offers a visual interpretation of a breast US image in terms of low-level SIFTdescriptors, where the extracted SIFT descriptors from all the images in thedataset have been projected into the 2D principal component space (Figure 2a).These SIFT descriptors have been arbitrary colored in order to visually assessthe descriptors (the more similar the colors, the closer the SIFT descriptors).
Thus, the analysis of the tissue distribution is performed in the texture spacedefined by the SIFT descriptors by means of the Maximum A Posteriori (MAP)estimator, as described in equation 1.
P (ω|xa) =P (xa|ω) · P (ω)
P (xa)(1)
Where P (ω|xa) is the probability that the sample a belongs to class ω ∈ W(see fig. 1b as a reminder of the GT available classes) where xa is the featurevector representing the sample a, such that xi
a is the ith feature. P (xa|ω) cor-responds to the Maximum Likelihood (ML) of the feature distribution for aparticular class ω, while P (ω) and P (xa) are the priors for the class and featurerespectively.

684 J. Massich et al.
(a) (b) (c)
Fig. 3. SIFT space. (a) Projected space colored according to GT tissue labeling. (b)P (xa). (c) P (ω)
Background Air or lungs Chest wall Rib
Fibro-glandular Adipose tissue Skin layers Lesion
Fig. 4. Distribution of the SIFT descriptors for some classes in the GT
Figure 3 uses the entire dataset to illustrate the underlying problem and thepriors extracted from the same dataset. Fig. 3a shows a scatter plot where everysample has been colored according to its GT. Fig. 3b shows an occurrence studyof the samples carried out in a discretization of the SIFT space. Fig. 3c illustratesthe class prior P (ω) corresponding to the proportion of samples present in thedataset for each class.
Figure 4 shows the feature distribution study for every class, correspondingto the P (xa|ω) in eq. 1. Similarities and dissimilarities between classes can beobserved through the tendencies within the features representing each class. Toillustrate that, it can be observed in figure 1 that the adipose tissue class containsCooper’s ligaments which are highly dense fibers, and fibro-glandular tissue ismade of dense fibers and unstructured fat. Or, the difficulty to produce accurateGT delineations, which often happens for those regions where the structures arenot clear enough to the user (i.e. the background class in fig. 1).
SIFT Texture Description for Understanding Breast Ultrasound Images 685
−300 −200 −100 0 100 200 300
−200
−100
0
100
200
300
00.10.20.30.4P(ω
i|x2) 0
0.2
0.4
0.6
0.8
P(ω
i|x1 )
(a) SIFT
0
0.05
0.1
0.15
0.2
0.25
0.3
0.35
0.4
0.45
0.5
MAP
0 63 127 191 255
(b) Intensity
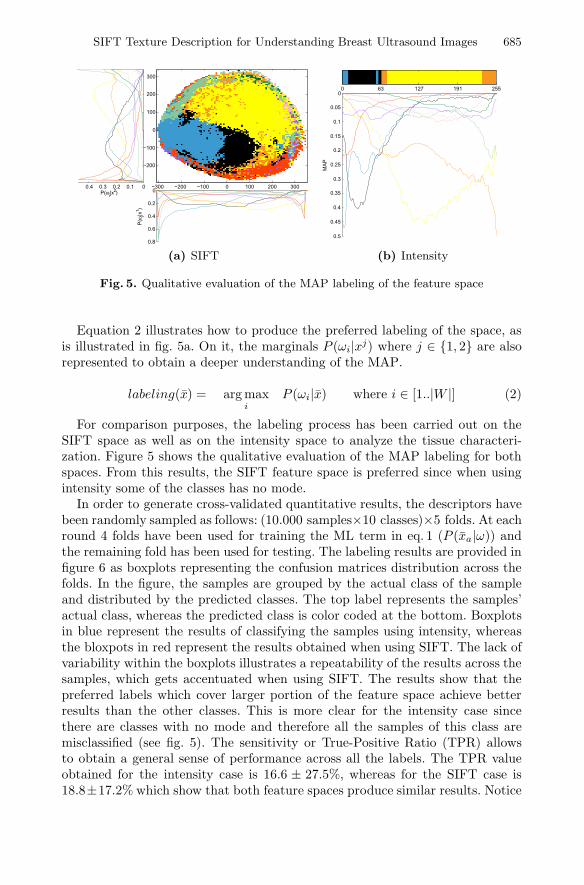
Fig. 5. Qualitative evaluation of the MAP labeling of the feature space
Equation 2 illustrates how to produce the preferred labeling of the space, asis illustrated in fig. 5a. On it, the marginals P (ωi|xj) where j ∈ {1, 2} are alsorepresented to obtain a deeper understanding of the MAP.
labeling(x) = argmaxi
P (ωi|x) where i ∈ [1..|W |] (2)
For comparison purposes, the labeling process has been carried out on theSIFT space as well as on the intensity space to analyze the tissue characteri-zation. Figure 5 shows the qualitative evaluation of the MAP labeling for bothspaces. From this results, the SIFT feature space is preferred since when usingintensity some of the classes has no mode.
In order to generate cross-validated quantitative results, the descriptors havebeen randomly sampled as follows: (10.000 samples×10 classes)×5 folds. At eachround 4 folds have been used for training the ML term in eq. 1 (P (xa|ω)) andthe remaining fold has been used for testing. The labeling results are provided infigure 6 as boxplots representing the confusion matrices distribution across thefolds. In the figure, the samples are grouped by the actual class of the sampleand distributed by the predicted classes. The top label represents the samples’actual class, whereas the predicted class is color coded at the bottom. Boxplotsin blue represent the results of classifying the samples using intensity, whereasthe bloxpots in red represent the results obtained when using SIFT. The lack ofvariability within the boxplots illustrates a repeatability of the results across thesamples, which gets accentuated when using SIFT. The results show that thepreferred labels which cover larger portion of the feature space achieve betterresults than the other classes. This is more clear for the intensity case sincethere are classes with no mode and therefore all the samples of this class aremisclassified (see fig. 5). The sensitivity or True-Positive Ratio (TPR) allowsto obtain a general sense of performance across all the labels. The TPR valueobtained for the intensity case is 16.6 ± 27.5%, whereas for the SIFT case is18.8±17.2% which show that both feature spaces produce similar results. Notice

686 J. Massich et al.
0
0.1
0.2
0.3
0.4
0.5
0.6
0.7
0.8
0.9
1Background Air or lungs Chest wall Rib Pectoral muscle
0
0.1
0.2
0.3
0.4
0.5
0.6
0.7
0.8
0.9
1Fibro-glandular Adipose tissue Skin layers lesion Boundary
Fig. 6. Confusion matrices results distribution represented as boxplots. The results aregrouped by actual class of the samples and distributed by the predicted label.
1
2
3
4
5
6
7
8
1
2
3
4
5
6
7
8
1
2
3
4
5
6
7
8
1
2
3
4
5
6
7
8
1
2
3
4
5
6
7
8
1
2
3
4
5
6
7
8
Codebook (1) (2)
(3) (4) (5)
(6) (7) (8)
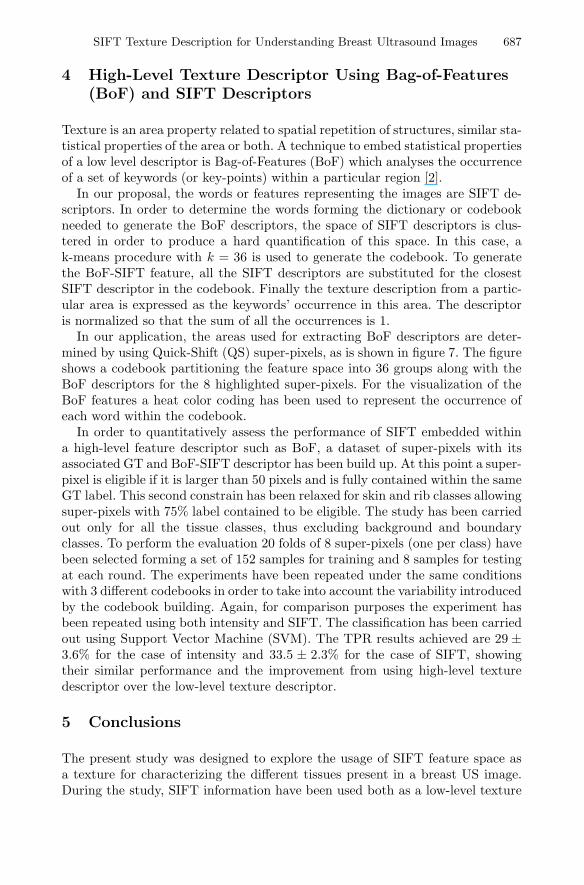
Fig. 7. SIFT-BoF descriptors qualitative analysis. (Left) image example. (Right) Dic-tionary representation colored using the location of the keypoint location in fig. 3aspace. (1-8) Occurrence of the dictionary’s key-points associated to each region high-lighted in the original image.
that the large variability reported is due to missclassification of the labels withno mode, as can be observed in figure 5.
SIFT Texture Description for Understanding Breast Ultrasound Images 687
4 High-Level Texture Descriptor Using Bag-of-Features(BoF) and SIFT Descriptors
Texture is an area property related to spatial repetition of structures, similar sta-tistical properties of the area or both. A technique to embed statistical propertiesof a low level descriptor is Bag-of-Features (BoF) which analyses the occurrenceof a set of keywords (or key-points) within a particular region [2].
In our proposal, the words or features representing the images are SIFT de-scriptors. In order to determine the words forming the dictionary or codebookneeded to generate the BoF descriptors, the space of SIFT descriptors is clus-tered in order to produce a hard quantification of this space. In this case, ak-means procedure with k = 36 is used to generate the codebook. To generatethe BoF-SIFT feature, all the SIFT descriptors are substituted for the closestSIFT descriptor in the codebook. Finally the texture description from a partic-ular area is expressed as the keywords’ occurrence in this area. The descriptoris normalized so that the sum of all the occurrences is 1.
In our application, the areas used for extracting BoF descriptors are deter-mined by using Quick-Shift (QS) super-pixels, as is shown in figure 7. The figureshows a codebook partitioning the feature space into 36 groups along with theBoF descriptors for the 8 highlighted super-pixels. For the visualization of theBoF features a heat color coding has been used to represent the occurrence ofeach word within the codebook.
In order to quantitatively assess the performance of SIFT embedded withina high-level feature descriptor such as BoF, a dataset of super-pixels with itsassociated GT and BoF-SIFT descriptor has been build up. At this point a super-pixel is eligible if it is larger than 50 pixels and is fully contained within the sameGT label. This second constrain has been relaxed for skin and rib classes allowingsuper-pixels with 75% label contained to be eligible. The study has been carriedout only for all the tissue classes, thus excluding background and boundaryclasses. To perform the evaluation 20 folds of 8 super-pixels (one per class) havebeen selected forming a set of 152 samples for training and 8 samples for testingat each round. The experiments have been repeated under the same conditionswith 3 different codebooks in order to take into account the variability introducedby the codebook building. Again, for comparison purposes the experiment hasbeen repeated using both intensity and SIFT. The classification has been carriedout using Support Vector Machine (SVM). The TPR results achieved are 29 ±3.6% for the case of intensity and 33.5 ± 2.3% for the case of SIFT, showingtheir similar performance and the improvement from using high-level texturedescriptor over the low-level texture descriptor.
5 Conclusions
The present study was designed to explore the usage of SIFT feature space asa texture for characterizing the different tissues present in a breast US image.During the study, SIFT information have been used both as a low-level texture
688 J. Massich et al.
descriptor and encoded within a high-level texture descriptor using BoF. Perfor-mance of using the SIFT space has been evaluated by comparison with intensity.The results show that both performances are equivalent.
One of the limitaitons of this work is that all the calculations have beenperformed using the 2D PCA projected space which does not include all thevariability of the data.
Despite these limitations, SIFT and intensity spaces produce similar results,which encourage further studies on using SIFT texture descriptors characterizingbreast tissues in US images.
References
1. Cheng, H.D., Shan, J., Ju, W., Guo, Y., Zhang, L.: Automated breast cancer detec-tion and classification using ultrasound images: A survey. Pattern Recognition 43(1),299–317 (2009)
2. Csurka, G., Dance, C., Fan, L., Willamowski, J., Bray, C.: Visual categorizationwith bags of keypoints. In: Workshop on Statistical Learning in Computer Vision,ECCV, vol. 1, p. 22 (2004)
3. Jemal, A., Bray, F., Center, M.M., Ferlay, J., Ward, E., Forman, D.: Global cancerstatistics. CA: A Cancer Journal for Clinicians 61(2), 69–90 (2011)
4. Lowe, D.G.: Distinctive image features from scale-invariant keypoints. InternationalJournal of Computer Vision 60(2), 91–110 (2004)
5. Smith, R.A., Saslow, D., Sawyer, K.A., Burke, W., Costanza, M.E., Evans, W.,Foster, R.S., Hendrick, E., Eyre, H.J., Sener, S.: American cancer society guidelinesfor breast cancer screening: Update 2003. CA: A Cancer Journal for Clinicians 53(3),141–169 (2003)
6. Thomas Stavros, A.: Breast ultrasound. Lippincott Williams & Wilkins (2004)7. Yuan, Y., Giger, M.L., Li, H., Bhooshan, N., Sennett, C.A.: Multimodality
computer-aided breast cancer diagnosis with ffdm and dcemri. Academic Radiol-ogy 17(9), 1158 (2010)