SIFT Texture Description for Understanding Breast Ultrasound Images
Upload
khangminh22Category
view
4download
0
Univerzita Karlova v Praze
P írodov decká fakulta
Studijní program: Fyzikální chemie
Mgr. Kristýna Sovová
Hmotnostní spektrometrie v proudové trubici s vybranými ionty, SIFT-MS
Selected ion flow tube mass spectrometry, SIFT-MS
Diserta ní práce
Školitel: prof. RNDr. Patrik Špan l, Dr. rer. nat.
Konzultant: prof. RNDr. Eva Tesa ová, CSc.
Praha 2013


Prohlášení:
Prohlašuji, že jsem záv re nou práci zpracovala samostatn a že jsem uvedla všechny
použité informa ní zdroje a literaturu. Tato práce ani její podstatná ást nebyla
p edložena k získání jiného nebo stejného akademického titulu.
V Praze, 12.9. 2013
Podpis


Pouhou mraven í prací, s obzorem nízko nad stolem, se nic chytrého vymyslet nedá,
i v dec musí mít jistou fantazii..........
Ji í Drahoš, p edseda AV R


Acknowledgments
I would like to express my gratitude to many people for their support during my
studies. Without them, this work would not have been possible.
The first person to whom I wish to thank is my supervisor professor Patrik
Špan l. In the last four years he was my mentor in understanding of the principles of
the selected ion flow tube mass spectrometry (SIFT-MS) method. He taught me physics,
physical chemistry, mathematics and helped me to improve skills in presentation of
results including scientific writing. None of my questions were too foolish for him and
he always answered them patiently. I hope that I have learned something from him. He
is the person who I respect enormously. I would also like to thank professor Eva
Tesa ová, my supervisor-consultant at Charles University, Faculty of Science for her
support starting from bachelor degree up to now. She was always ready to provide me
help and advice; her support has also allowed me to successfully obtain funding from
Grant Agency of Charles University and finally she has spent her time reading my thesis
and provided useful comments.
Furthermore, I would like to thank my two colleagues Ksenyia Dryahina and
Violetta Shestivska. I have spent good years in the lab in the company of these two
inspirational ladies, realizing several research projects. Kseniya helped me a lot with my
first experiments concerning kinetics of ion-molecule reactions and Violetta provided
expert insight into plant physiology and phytoremediation. They both became my
friends. I would also like to thank to my co-worker Ji í Kubišta I liked very much the
discussions with him about good laboratory practice. It was my honour, that I met
professor David Smith FRS from Keel University in England, who together with Patrik
Špan l developed SIFT-MS method. It was a pleasure to discuss with him my results
reached in the field of ion chemistry relevant for SIFT-MS. Last but not least, I really
appreciate his help in reading my thesis and correcting the English. My thanks go also
to professor Svatopluk Civiš from the department of laser spectroscopy, who supervised
me as bachelor student at Heyrovský institute in 2006. In 2007 he allowed me to
participate in the research project on explosives and which was an important
contribution to this thesis. I am grateful to all co-author of the publications included in
this theses for their contributions detailed on the next page.
Finally, I would like to thank Pavel Zim ík, all my friends and family members,
especially my parents for their kind support and encouragement.

Contributions to papers included in the thesis
A. Sovová K., Dryahina K., Špan l P.: Selected ion flow tube, SIFT, studies of the
reactions of H3O+, NO+ and O2+• with six volatile phytogenic esters Int. J. Mass
spectrom. 300, 31 (2011).
Conception and design of the study: all authors. Supervision of the study: KS.
Experimental set-up: KD, KS. Data collection/analysis: KS, interpretation of
results: all authors. Drafting the manuscript: PS, KS. Approval of intellectual
content: all authors.
B. Smith D., Sovová K. and Špan l P.: A selected ion flow tube study of the
reactions of H3O+‚ NO+ and O2+• with seven isomers of hexanol in support of
SIFT-MS Int. J. Mass spectrom. 319, 25 (2012).
Conception and design of the study: all authors. Supervision of the study: KS,
PS. Experimental set-up: KS. Data collection/analysis: KS, interpretation of
results: all authors. Drafting the manuscript: all authors. Approval of intellectual
content: all authors.
C. Dryahina K., Špan l P., Pospíšilová V., Sovová K., Hrdli ka L., Machková N.,
Lukáš M. and David Smith: Quantification of pentane in exhaled breath, a
potential biomarker of bowel disease, using selected ion flow tube mass
spectrometry Rapid Commun. Mass Spectrom. 27, 1983 (2013).
Conception and design of the study: KD, PS. Supervision of the study: KD, PS.
Research governance issues including ethics committee approval: LH, ML.
Recruitment of patients: LH, NM, ML. Data collection/analysis: KD, KS, VP,
interpretation of results including ion chemistry study of pentane: KD, PS, KS.
Drafting the manuscript: KS, PS, DS, LH. Approval of intellectual content: all
authors.
D. Shestivska V., Nemec A., D evínek P., Sovová K., Dryahina K. and Špan l P.:
Quantification of methyl thiocyanate in the headspace of Pseudomonas
aeruginosa cultures and in the breath of cystic fibrosis patients by selected ion
flow tube mass spectrometry Rapid Commun. Mass Spectrom. 25, 2459 (2011).
Conception and design of the study: VS, AN, KD, PS. Supervision of the study:
VS, KD, PS. Research governance issues including ethics committee approval:
PD. Recruitment of patients: PD. Data collection/analysis: VS, KD, KS,
interpretation of results including ion chemistry study of methylthiocyanate: VS,
KD, PS, KS. Drafting the manuscript: VS, AN, PS, KD, PD. Approval of
intellectual content: all authors.
E. Sovová K., epl J., Markoš A. and Špan l P.: Real time monitoring of
population dynamics in concurrent bacterial growth using SIFT-MS
quantification of volatile metabolites Analyst 138, 4795 (2013).
Conception and design of the study: all authors. Supervision of the study: KS,
J . Sample preparation: J . Data collection/analysis using SIFT-MS: KS.
Interpretation of results (SIFT-MS): KS, PS. Interpretation of results
(innoculation and counting of CFU): J . Drafting the manuscript: all authors.
Approval of intellectual content: all authors.
F. Sovová K., Shestivska V. and Špan l P.: Real-time quantification of traces of
biogenic volatile selenium compounds in humid air by selected ion flow tube
mass spectrometry Anal. Chem. 84, 4979 (2012).
Conception and design of the study: KS, VS. Supervision of the study: KS.
Sample preparation: KS. Data collection/analysis using SIFT-MS: KS.
Interpretation of results (SIFT-MS): KS. Interpretation of results (GC/MS): VS.
Drafting the manuscript: KS, PS. Approval of intellectual content: all authors.
G. Civiš M., Civiš S., Sovová K., Dryahina K., Špan l P., Kyncl M.: Laser
Ablation of FOX-7: Proposed Mechanism of Decomposition Anal. Chem. 83,
1069 (2011).
Conception and design of the study: MC, SC. Supervision of the study: MC.
Data collection/analysis using UV-Vis: MC. Data collection/analysis using
SIFT-MS: KS, KD. Interpretation of results (UV-Vis): MC. Interpretation of
results (SIFT-MS): KS Drafting the manuscript: MC, SC, KS, PS. Approval of
intellectual content: all authors.
Hereby I declare that the actual contribution of K. Sovová to these publications was as
detailed above. In the terms of percentage her contribution was in my estimation as
follows: A. 60%, B. 40%, C. 20%, D. 20%, E. 60%, F: 60%, G: 20%.
Prague 6.9.2013 prof. Dr. Patrik Špan l
List of Abbreviations
SIFT-MS Selected Ion Flow Tube Mass Spectrometry
VOCs Volatile Organic Compounds
ppbv parts per billion by volume
ppmv parts per million by volume
pptv parts per trillion by volume
SPME Solid Phase Micro Extraction
TD Thermal Desorption
GC/MS Gas Chromatography Mass Spectrometry
IMS Ion Mobility Spectrometry
MIMS Membrane Inlet Mass Spectrometry
APCI Atmospheric pressure chemical ionisation
TAGA Trace Atmospheric Gas Analyser
EESI Extractive Electrospray Ionisation
SESI-MS Secondary Electrospray Ionization-Mass Spectrometry
PTR-MS Proton Transfer Reaction Mass Spectrometry
FA Flowing Afterglow
SRI Switchable Reagent Ions
QMF Quadrupole Mass Filter
PEEK PolyEther Ether Ketone
FS Full Scan
MIM Multiple Ion Monitoring
IP Ionization Potential
RE Recombination Energy
DMS Dimethyl Sulphide
EI Electron Ionisation
MW Molecular Weight
PA Pseudomonas aeruginosa
MALDI Matrix Assisted Laser Desorption and Ionisation
GLVs Green Leaf Volatiles
MetB Methyl Benzoate
MeSA Methyl Salicylate
TBW Total body water

CF Cystic Fibrosis
IBD Inflammatory Bowel Disease
UC Ulcerative Colitis
CD Crohn’s Disease
CT Computed Tomography
MRI Magnetic Resonance Imaging
CFU Colony forming units
PCA Principal Component Analysis
PCR Principal Component Regression
MTBE Methyl Tertiary Butyl Ether
AAS Atomic Absorption Spectroscopy
HGAAS Hydride Generation Atomic Absorption Spectroscopy
DMSe Dimethyl Selenide
LIBS Laser Induced Breakdown Spectroscopy
NQR Nuclear Quadrupole Resonance
FOX-7 1,1-diamino-2,2-dinitroethylene
RDX 1,3,5-trinitro-2-oxo-1,3,5-triazacyclo-hexane
HMX 1,3,5,7-tetranitro-1,3,5,7-tetraazacyclo-octane
Abstract
This thesis describes research that has been carried out during the years
2009-2013 as a part of my PhD project related to the method of selected ion flow tube
mass spectrometry (SIFT-MS) and its application in interdisciplinary areas of research.
SIFT-MS is a method that allows accurate quantification of trace gases and vapours
presented in humid air with the focus on human breath; without any sample preparation
and in real time.
The thesis is divided into several parts. The first part reviews the history of mass
spectrometry as a background for the quantitative analytical methods as PTR-MS and
SIFT-MS. The second part discusses the detailed history of development of SIFT-MS,
starting from principles of selected ion flow tube (SIFT) technique that has been used
for study of ion-molecule reactions in the gas phase and forms the basis of SIFT-MS.
The next part discusses volatile organic compounds of different biological origin:
bacterial, plant and human breath metabolites that can be analyzed in real time using
SIFT-MS.
The main part “Results and Discussion” is divided into several subsections that
serve as commentaries to the enclosed research papers published in peer reviewed
journals. The first is a detailed step by step overview of the kinetics of ion molecule
reactions which is the basis of SIFT-MS including the determination of rate constants
and product branching ratio for several ion-molecule reactions of H3O+, NO+ and O2+•
precursor ions with six phytogenic esters and seven isomers of hexanol. Other two
sections concern the application of SIFT-MS in the discovery of biomarkers for clinical
diagnostic of inflammatory bowel disease and infections complicating cystic fibrosis.
Next section covers a study of population dynamics of three different bacterial species
based on their volatile signatures. The theme of plant physiology and the volatiles that
are released by plants in the process of phytovolatilization is discussed in the following
section. The final section discusses an application of SIFT-MS in the field of security
research for the study of decomposition of a highly energetic explosive FOX-7.

Contents
1 Aims ....................................................................................................................... 17
2 Introduction .......................................................................................................... 18
2.1 Mass spectrometry techniques in analysis of VOCs ...................................... 18
3 Selected ion flow tube mass spectrometry.......................................................... 21
3.1 Selected ion flow tube .................................................................................... 21
3.2 Selected ion flow tube mass spectrometry ..................................................... 23
3.2.1 Profile 3 instrument ................................................................................ 24
3.2.2 H3O+ reactions ........................................................................................ 28
3.2.3 NO+ reactions.......................................................................................... 31
3.2.4 O2+•
reactions .......................................................................................... 32
3.2.5 Absolute quantification .......................................................................... 34
3.2.6 Format of kinetics library entries used in Profile 3 instrument.............. 35
4 Volatile organic compounds ................................................................................ 38
4.1 Bacterial volatile organic compounds ............................................................ 38
4.1.1 Clinically relevant bacteria..................................................................... 39
4.1.2 Bacterial models of interactions ............................................................. 40
4.2 Plant volatiles ................................................................................................. 41
4.2.1 Hexyl acetate .......................................................................................... 42
4.2.2 Phenethyl acetate .................................................................................... 43
4.2.3 Benzyl acetate......................................................................................... 44
4.2.4 Methyl benzoate ..................................................................................... 44
4.2.5 Benzyl benzoate...................................................................................... 44
4.2.6 Methyl salicylate .................................................................................... 44
4.3 Metabolites in human breath .......................................................................... 45
4.3.1 Methane and hydrogen ........................................................................... 46
4.3.2 Ammonia ................................................................................................ 47
4.3.3 Acetone................................................................................................... 48
4.3.4 Hydrogen cyanide................................................................................... 49
4.3.5 Methanol................................................................................................. 49
4.3.6 Ethanol.................................................................................................... 50
4.3.7 Isoprene .................................................................................................. 51
4.3.8 Acetonitrile ............................................................................................. 51
5 Results and Discussion ......................................................................................... 53
5.1 Determination of rate constants and product ion branching ratios................. 53
5.2 Construction and optimization of kinetics library .......................................... 68
5.3 Breath analysis................................................................................................ 72
5.3.1 Inflammatory bowel disease................................................................... 72
5.3.2 Cystic fibrosis ......................................................................................... 75
5.4 Population dynamics ...................................................................................... 80
5.5 Phytogenic volatile compounds...................................................................... 86
5.5.1 Phytovolatilization of selenium.............................................................. 88
5.6 Explosives....................................................................................................... 97
6 Summary and concluding remarks................................................................... 102
References ................................................................................................................... 104
Appendix A, Sovová et al. Int. J. Mass. Spectrom. 300 (2011) 31 ..............................A
Appendix B, Smith et al. Int. J. Mass. Spectrom. 319-320 (2012) 25 .........................B
Appendix C, Dryahina et al. Rapid Commun. Mass Spectrom. 27 (2013) 1983...... C
Appendix D, Shestivska et al. Rapid Commun. Mass Spectrom. 25 (2011) 2459 .... D
Appendix E, Sovová et al. Analyst 138 (2013) 4795..................................................... E
Appendix F, Sovová et al. Anal. Chem. 84 (2012) 4979............................................... F
Appendix G, Civiš et al. Anal. Chem. 83 (2011) 1069................................................. G

1 Aims
The aim of my PhD project as formulated at the onset of my postgraduate study
was:
“To develop new reaction schemes and methodology for the use of Selected Ion
Flow Tube Mass Spectrometry in interdisciplinary areas of research, including
environmental science, microbiology, explosive detection and breath analysis for
clinical diagnostics and therapeutic monitoring.”
This dissertation shows that I have achieved this aim and obtained some interesting and
original results during the experimental work directed towards this goal.
17
2 Introduction
Immediate measurement of the concentrations of trace amounts of various gases
and vapours of volatile organic compounds (VOCs) presented in the matrix of humid
air, exemplified by the ambient atmosphere, air containing VOC emissions from
biological samples and exhaled human breath, represents a challenge that still has not
been fully addressed [1]. The fields of science [2] where interest in such measurements
is greatest include food science, environmental monitoring, occupational health and
safety and last, but not least, medicine. The medical interest in analysis of VOCs [3] and
other gaseous analytes is largely centred on non-invasive breath analysis. The
hypothesis is that some of these compounds can serve as biomarkers or indicators of
various diseases.
The methods widely used for the analysis of trace VOCs and inorganic gases are
chiefly based on principles of mass spectrometry and different forms of spectroscopy.
Spectroscopic techniques (such as optical spectroscopy) are not currently suitable for
larger molecules that are presented at concentrations in parts-per-billion by volume
(ppbv) in air. Analysis of the kind outlined above is traditionally carried out by
sampling the gases into bags, metal canisters or by collecting VOCs on solid adsorbents
[4, 5]. For sample preconcentration the methods of solid phase micro extraction (SPME)
and thermal desorption (TD) are often used in preparation for analyses using gas
chromatography mass spectrometry (GC/MS).
2.1 Mass spectrometry techniques in analysis of VOCs
Whilst optical methods have great advantages in absolute quantification and
speed of response, and some recently developed methods like ion mobility spectrometry
(IMS) [6, 7] and THz spectroscopy [8] have great potential for monitoring of trace
amounts of VOCs, they are not within the scope of this dissertation and thus it will
focus on a brief review of the history and the main principles of mass spectrometry
methods used for this purpose.
The origins of mass spectrometry can be traced back to the 19th century and
Lord Thompson’s early work on cathode rays – the “discovery” of electrons for which
he received in 1906 Nobel Prize in Physics. Later, in 1913 J.J. Thompson, with the help
18
of Francis Aston built the first mass spectrometer and resolved neon isotopes and thus
they are considered to be the founders of mass spectrometry [9]. These fundamental
developments helped towards a better understanding of the elements and their physical
properties.
An important step in the analytical use of mass spectrometry was the
combination of mass spectrometry with gas chromatography (GC). The modern GC
was invented by Martin and James in 1952 [10]. GC has become a standard analytical
method in many fields, especially petrochemical manufacture, environmental, biological
and food sciences, and also in drug residue and forensic analysis. The field of GC
rapidly expanded in the 1980s.
Currently GC is considered to be the gold standard method for analysis of
VOCs; however the method still has some weaknesses. Absolute quantification requires
comparison with standards and suffers from so-called matrix effects. The samples must
be prepared by some form of extraction or adsorbing the VOCs onto a suitable
adsorbent, as mentioned above [11]. The analyses typically take several minutes
(10-60 min.) and thus results are not immediately available. The primary objective of
chromatographic analysis is to achieve the desired separation of compounds in a
mixture in the shortest possible time. Reductions in analysis time have been achieved by
fast GC [12]. The principles and theory of fast GC were established in the 1960s, but
for routine analysis fast GC were used later in 1990s when the adequate commercial
instrumentation was available [13]. Currently, analyses of gaseous VOCs in air, gas
chromatography mass spectrometry (GC/MS) is usually combined with the extraction
methods of thermal desorption (TD) [14] and the above mentioned solid-phase micro-
extraction (SPME) [11].
In 1972 Membrane inlet mass spectrometry (MIMS) was described and
gradually became a relatively well established technique for monitoring gases and
VOCs directly from aqueous solutions [15]. But this technique can be considered to be
more qualitative than quantitative. For quantitative analysis, soft ionisation techniques,
like chemical ionisation, are preferred. One of the methods for direct sample analysis is
atmospheric pressure chemical ionisation (APCI) followed by mass spectrometry that
was originally developed for analysis of trace components in the gas phase [16]. In 1980
TAGA (trace atmospheric gas analyser) based on APCI was used in several
environmental applications, explosive detection and even breath analysis [17] and
monitoring of CO2 [18]. Today, APCI is widely used in analysis of trace gases released
19
by foods [19] and many other trace gas analyses down to the parts-per-trillion by
volume (pptv) levels [17]. In spite of their great sensitivity a weakness of APCI
methods is again in its lack of absolute quantification and also due to matrix effects that
compromise reproducibility. The state of the art methods stemming from this heritage
are extractive electrospray ionisation (EESI) [20] and secondary electrospray
ionization-mass spectrometry (SESI-MS) [21].
In the mid-1990s two techniques based on chemical ionization were introduced
capable of direct real time trace gas analysis: selected ion flow tube mass
spectrometry (SIFT-MS) and proton transfer reaction mass spectrometry
(PTR-MS). The SIFT-MS method was used as a basis for the research described in this
dissertation and will be covered in detail in the next Section 3. PTR-MS has been
developed mainly for the detection of both biogenic VOCs and anthropogenic VOCs in
atmospheric science, in environmental research, food and flavour analysis and also
breath analysis [22]. PTR-MS has similar origin as SIFT-MS, both can be traced back to
flowing afterglow method, FA [23]. The PTR-MS technique was developed in
Innsbruck by Lindinger and co-workers [24] and several reviews about this technique
and its application have been published [24-27]. PTR-MS is based on chemical
ionization by proton transfer from H3O+ to molecules present in a gas sample inside a
drift tube. Thus, only compounds with higher proton affinity than water could be
analysed. In 2009, the so-called “Switchable Reagent Ions“ (SRI) variant of PTR-MS
was introduced. Since then it is possible to switch between H3O+, NO+ or O2+• reagent
ions [28, 29], albeit the switch takes several seconds. PTR-MS has been also combined
with high resolution time-of-flight (TOF) mass spectrometers [30-32].
20
3 Selected ion flow tube mass spectrometry
3.1 Selected ion flow tube
The SIFT-MS technique is derived from the selected ion flow tube (SIFT),
method, developed in 1976 by N.G. Adams and D. Smith [33] . The SIFT is a flow tube
technique for the studies of kinetics of gas-phase reactions between ions and molecules.
The first application of a flow tube, specifically the flowing afterglow (FA) in this field
was described in 1963 by Ferguson, Fehsenfeld and Schmeltekopf [23, 34] at the
National Oceanic and Atmospheric Administration laboratories in Boulder, Colorado,
USA. The motivation of their research was to obtain quantitative understanding of the
ion chemistry that occurs in the terrestrial ionosphere. However, the flowing afterglow
method had its limitations, primarily in the form of production of multiplicity of
primary ions in the flowing afterglow plasma, which then complicates identification of
the product ions resulting from primary reactions. The complication of multiple reagent
ion production in the flowing afterglow technique was resolved by introduction of the
SIFT technique. Here, the reagent ion formed in an ion source was first selected
according to its mass to charge ratio (m/z) and then injected into fast flowing neutral
carrier gas. Thus the main difference between a SIFT instrument and a FA instrument is
the presence of a quadrupole mass filter after the ion source. The SIFT technique
became a standard tool for the study of the kinetics of the reactions between ions and
neutral molecules in the gas phase under truly thermalised conditions [35, 36]. Research
in this area was focused on the study of ion-molecule kinetics important to atmospheric
and interstellar ion chemistry [37]. This work has resulted in a large amount of
experimental kinetic data for ion-molecule reactions, including rate constants and
product ion distributions. These data now represent a foundation for the use of SIFT-MS
for analytical purposes, especially for determination of trace gas concentrations in air,
with a focus on quantitative analysis of gases in human breath [32, 38].
The principles of the SIFT technique are illustrated in Figure 3.1. Ions
(positively or negatively charged) are produced in an external ion source from an
appropriate source gas. From the mixture of ions formed by electron ionisation or
chemical ionisation a current of ions with a given mass-to-charge ratio is selected by a
21
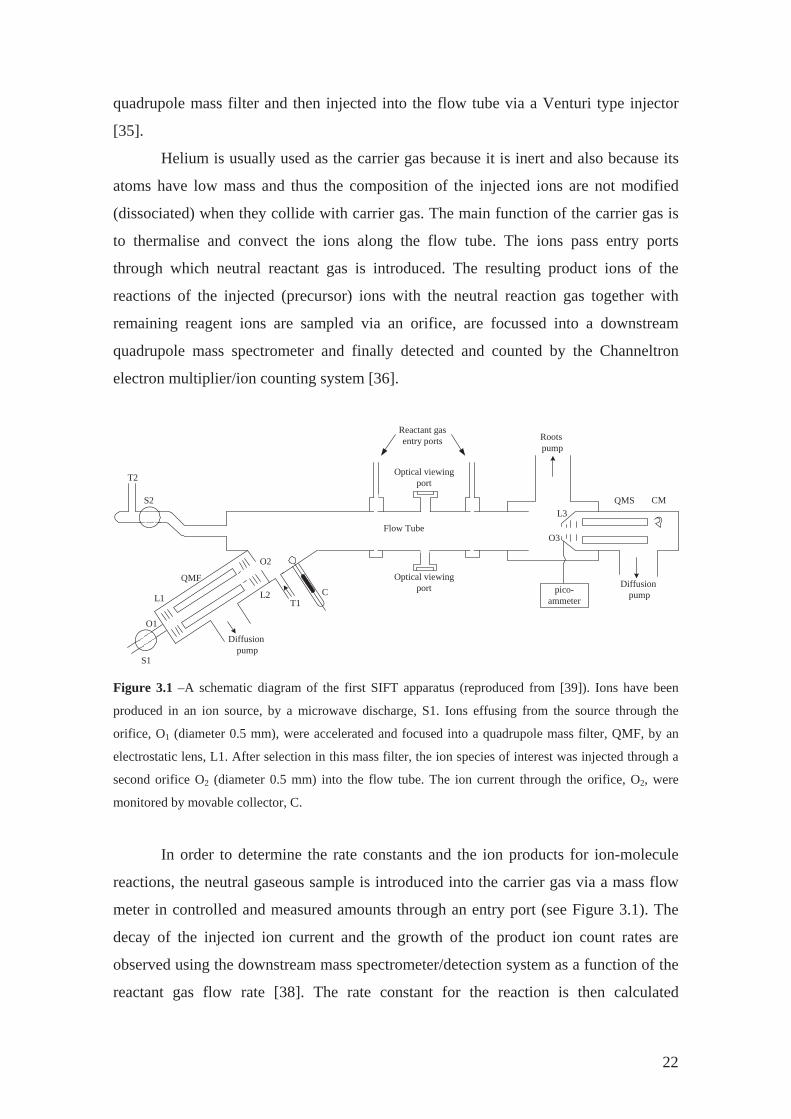
quadrupole mass filter and then injected into the flow tube via a Venturi type injector
[35].
Helium is usually used as the carrier gas because it is inert and also because its
atoms have low mass and thus the composition of the injected ions are not modified
(dissociated) when they collide with carrier gas. The main function of the carrier gas is
to thermalise and convect the ions along the flow tube. The ions pass entry ports
through which neutral reactant gas is introduced. The resulting product ions of the
reactions of the injected (precursor) ions with the neutral reaction gas together with
remaining reagent ions are sampled via an orifice, are focussed into a downstream
quadrupole mass spectrometer and finally detected and counted by the Channeltron
electron multiplier/ion counting system [36].
Optical viewingport
Flow Tube
T2
Reactant gasentry ports
Optical viewingport
S2
Diffusion pump
S1
O1
L1
QMF
L2T1
C
O3
pico-ammeter
Diffusion pump
QMS CML3
Roots pump
O2
Figure 3.1 –A schematic diagram of the first SIFT apparatus (reproduced from [39]). Ions have been
produced in an ion source, by a microwave discharge, S1. Ions effusing from the source through the
orifice, O1 (diameter 0.5 mm), were accelerated and focused into a quadrupole mass filter, QMF, by an
electrostatic lens, L1. After selection in this mass filter, the ion species of interest was injected through a
second orifice O2 (diameter 0.5 mm) into the flow tube. The ion current through the orifice, O2, were
monitored by movable collector, C.
In order to determine the rate constants and the ion products for ion-molecule
reactions, the neutral gaseous sample is introduced into the carrier gas via a mass flow
meter in controlled and measured amounts through an entry port (see Figure 3.1). The
decay of the injected ion current and the growth of the product ion count rates are
observed using the downstream mass spectrometer/detection system as a function of the
reactant gas flow rate [38]. The rate constant for the reaction is then calculated
22
according to the procedure described in Section 5.1. More than one product ion
sometimes results from an ion-molecule reaction, but it is a simple procedure to
determine the branching ratios of the true primary product ions as will be described in
detailed later.
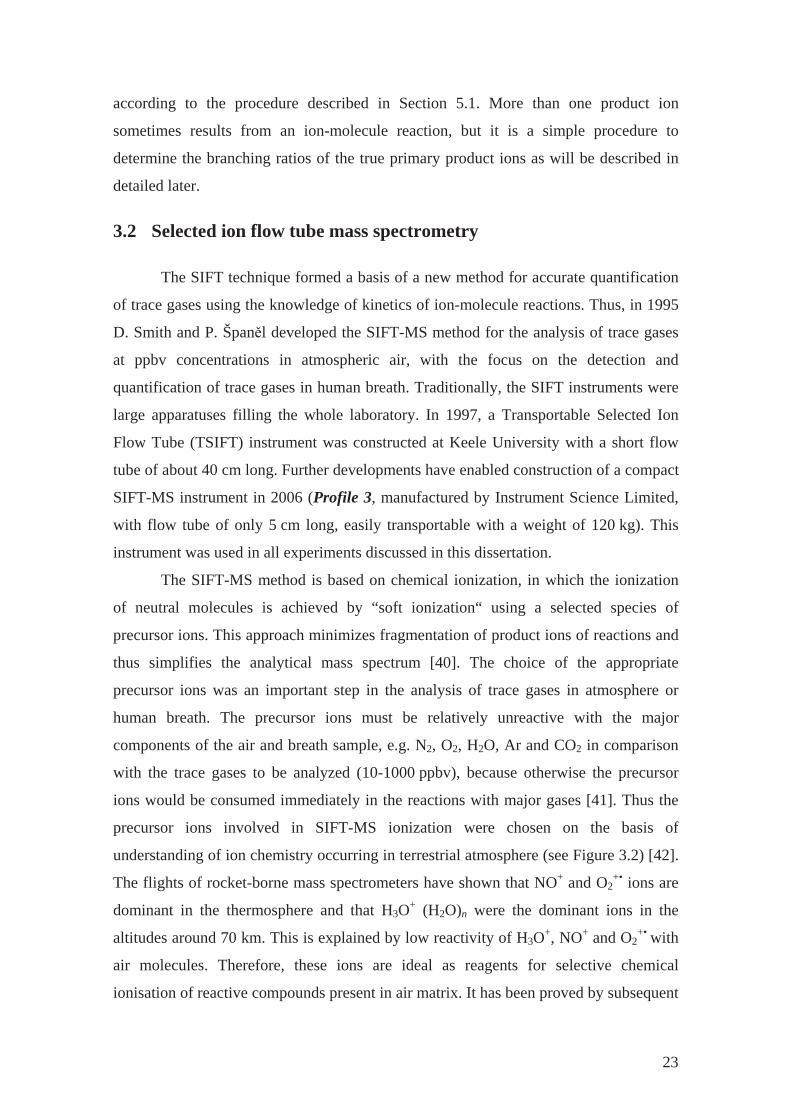
3.2 Selected ion flow tube mass spectrometry
The SIFT technique formed a basis of a new method for accurate quantification
of trace gases using the knowledge of kinetics of ion-molecule reactions. Thus, in 1995
D. Smith and P. Špan l developed the SIFT-MS method for the analysis of trace gases
at ppbv concentrations in atmospheric air, with the focus on the detection and
quantification of trace gases in human breath. Traditionally, the SIFT instruments were
large apparatuses filling the whole laboratory. In 1997, a Transportable Selected Ion
Flow Tube (TSIFT) instrument was constructed at Keele University with a short flow
tube of about 40 cm long. Further developments have enabled construction of a compact
SIFT-MS instrument in 2006 (Profile 3, manufactured by Instrument Science Limited,
with flow tube of only 5 cm long, easily transportable with a weight of 120 kg). This
instrument was used in all experiments discussed in this dissertation.
The SIFT-MS method is based on chemical ionization, in which the ionization
of neutral molecules is achieved by “soft ionization“ using a selected species of
precursor ions. This approach minimizes fragmentation of product ions of reactions and
thus simplifies the analytical mass spectrum [40]. The choice of the appropriate
precursor ions was an important step in the analysis of trace gases in atmosphere or
human breath. The precursor ions must be relatively unreactive with the major
components of the air and breath sample, e.g. N2, O2, H2O, Ar and CO2 in comparison
with the trace gases to be analyzed (10-1000 ppbv), because otherwise the precursor
ions would be consumed immediately in the reactions with major gases [41]. Thus the
precursor ions involved in SIFT-MS ionization were chosen on the basis of
understanding of ion chemistry occurring in terrestrial atmosphere (see Figure 3.2) [42].
The flights of rocket-borne mass spectrometers have shown that NO+ and O2+• ions are
dominant in the thermosphere and that H3O+ (H2O)n were the dominant ions in the
altitudes around 70 km. This is explained by low reactivity of H3O+, NO+ and O2+• with
air molecules. Therefore, these ions are ideal as reagents for selective chemical
ionisation of reactive compounds present in air matrix. It has been proved by subsequent
23
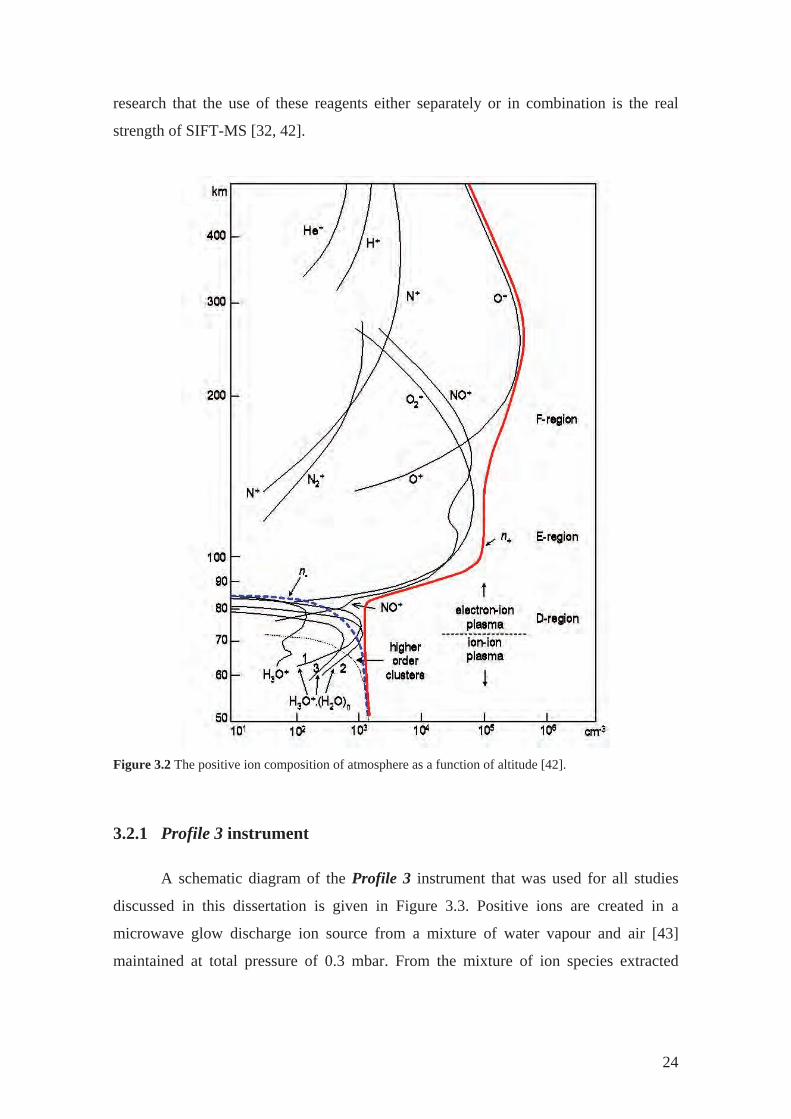
research that the use of these reagents either separately or in combination is the real
strength of SIFT-MS [32, 42].
Figure 3.2 The positive ion composition of atmosphere as a function of altitude [42].
3.2.1 Profile 3 instrument
A schematic diagram of the Profile 3 instrument that was used for all studies
discussed in this dissertation is given in Figure 3.3. Positive ions are created in a
microwave glow discharge ion source from a mixture of water vapour and air [43]
maintained at total pressure of 0.3 mbar. From the mixture of ion species extracted
24
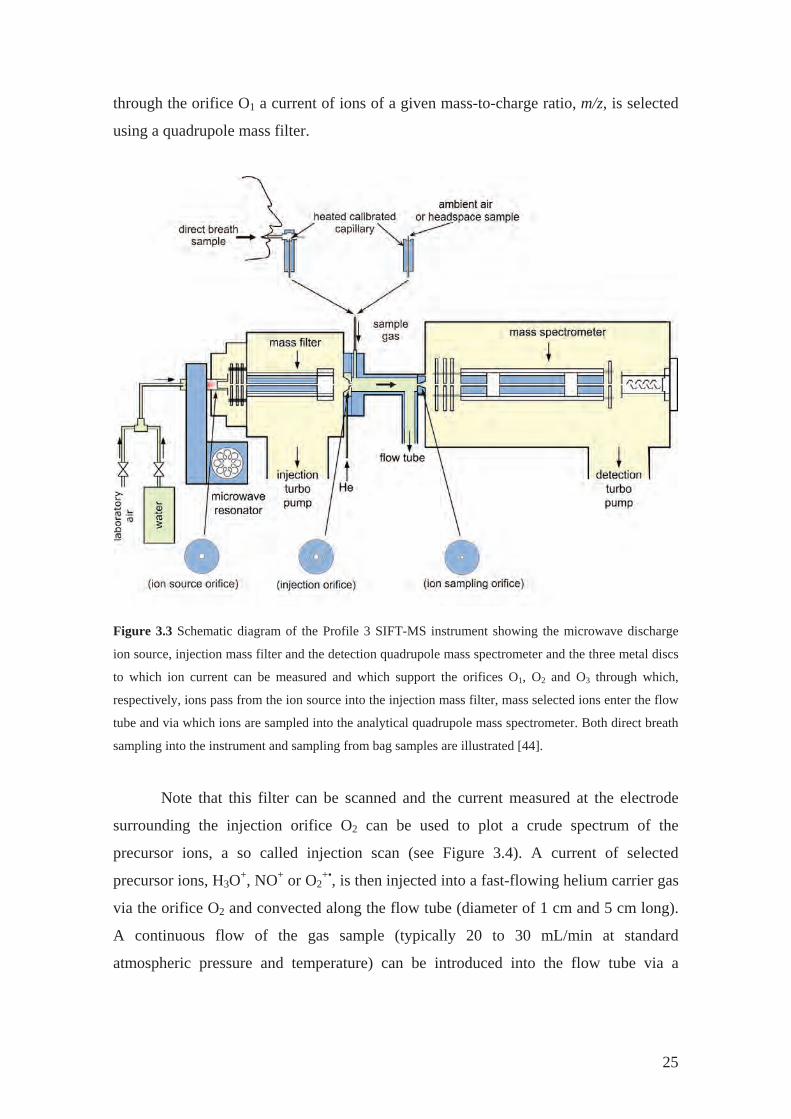
through the orifice O1 a current of ions of a given mass-to-charge ratio, m/z, is selected
using a quadrupole mass filter.
Figure 3.3 Schematic diagram of the Profile 3 SIFT-MS instrument showing the microwave discharge
ion source, injection mass filter and the detection quadrupole mass spectrometer and the three metal discs
to which ion current can be measured and which support the orifices O1, O2 and O through which,
respectively, ions pass from the ion source into the injection mass filter, mass selected3
ions enter the flow
be and via which ions are sampled into the analytical quadrupole mass spectrometer. Both direct breath
sampling
e via a
tu
into the instrument and sampling from bag samples are illustrated [44].
Note that this filter can be scanned and the current measured at the electrode
surrounding the injection orifice O2 can be used to plot a crude spectrum of the
precursor ions, a so called injection scan (see Figure 3.4). A current of selected
precursor ions, H3O+, NO+ or O2+•, is then injected into a fast-flowing helium carrier gas
via the orifice O2 and convected along the flow tube (diameter of 1 cm and 5 cm long).
A continuous flow of the gas sample (typically 20 to 30 mL/min at standard
atmospheric pressure and temperature) can be introduced into the flow tub
25
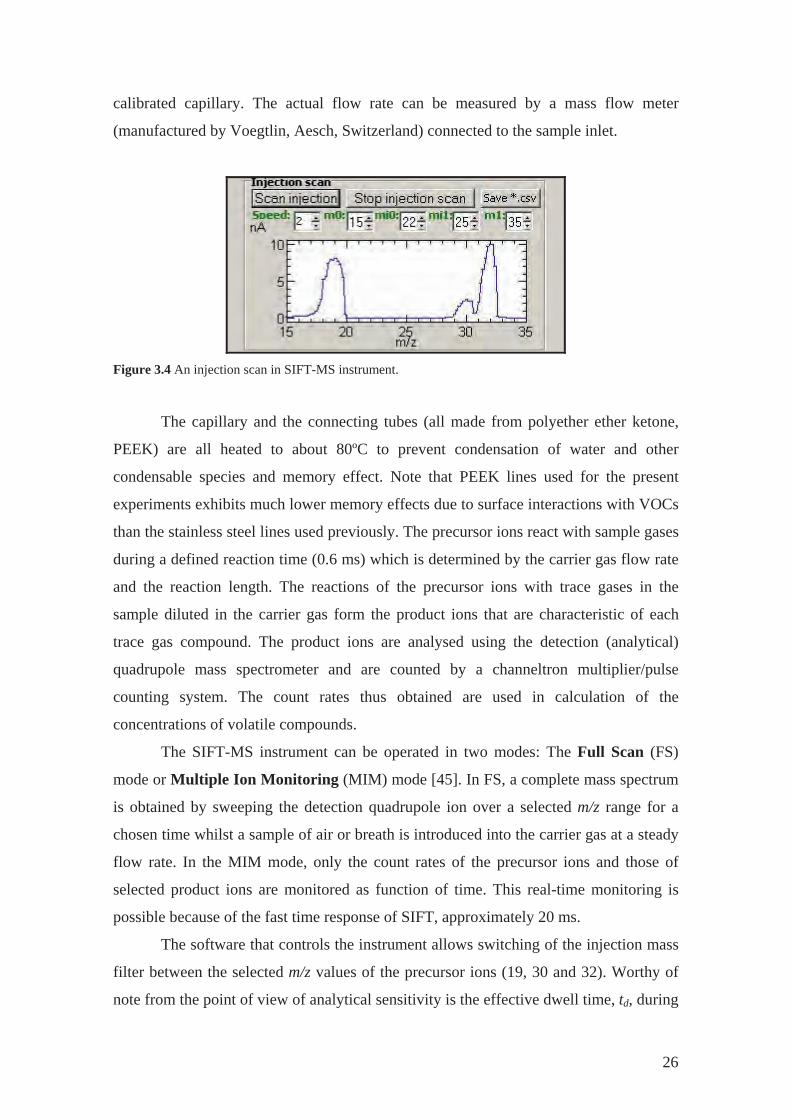
calibrated capillary. The actual flow rate can be measured by a mass flow meter
(manufactured by Voegtlin, Aesch, Switzerland) connected to the sample inlet.
Figure 3.4 An injection scan in SIFT-MS instrument.
The capillary and the connecting tubes (all made from polyether ether ketone,
PEEK) are all heated to about 80ºC to prevent condensation of water and other
condensable species and memory effect. Note that PEEK lines used for the present
experiments exhibits much lower memory effects due to surface interactions with VOCs
than the stainless steel lines used previously. The precursor ions react with sample gases
during a defined reaction time (0.6 ms) which is determined by the carrier gas flow rate
and the reaction length. The reactions of the precursor ions with trace gases in the
sample diluted in the carrier gas form the product ions that are characteristic of each
trace gas compound. The product ions are analysed using the detection (analytical)
quadru
as at a steady
flow ra
rsor ions (19, 30 and 32). Worthy of
note from the point of view of analytical sensitivity is the effective dwell time, td, during
pole mass spectrometer and are counted by a channeltron multiplier/pulse
counting system. The count rates thus obtained are used in calculation of the
concentrations of volatile compounds.
The SIFT-MS instrument can be operated in two modes: The Full Scan (FS)
mode or Multiple Ion Monitoring (MIM) mode [45]. In FS, a complete mass spectrum
is obtained by sweeping the detection quadrupole ion over a selected m/z range for a
chosen time whilst a sample of air or breath is introduced into the carrier g
te. In the MIM mode, only the count rates of the precursor ions and those of
selected product ions are monitored as function of time. This real-time monitoring is
possible because of the fast time response of SIFT, approximately 20 ms.
The software that controls the instrument allows switching of the injection mass
filter between the selected m/z values of the precu
26
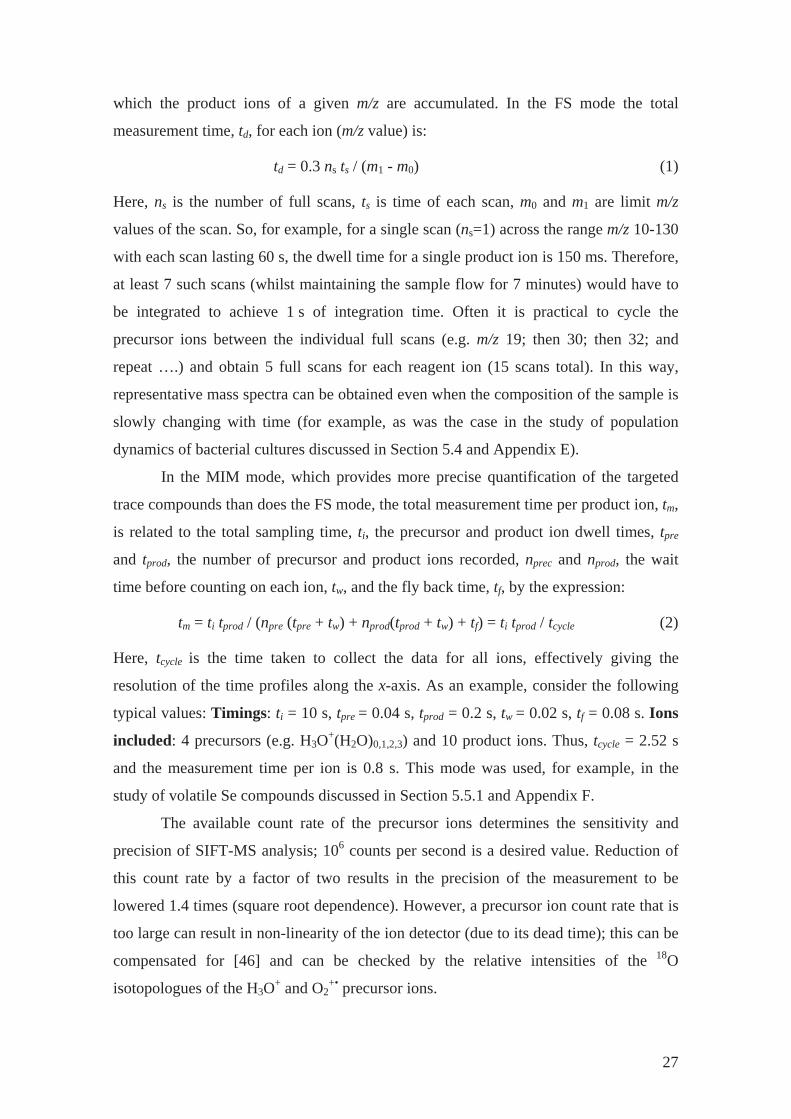
which the product ions ulated. In the FS mode the total
measurement time, t , for each ion (m/z value) is:
f the sample is
slowly
es, tpre
and tprod, the numb p u ro c n nprod, the wait
time before counting on each ion, t , and the fly back time, t , by the expression:
= 2.52 s
and the
or (due to its dead time); this can be
compensated for [46] and can be checked by the relative intensities of the 18O
isotopologues of the H3O+ and O2+• precursor ions.
of a given m/z are accum
d
td = 0.3 ns ts / (m1 - m0) (1)
Here, ns is the number of full scans, ts is time of each scan, m0 and m1 are limit m/z
values of the scan. So, for example, for a single scan (ns=1) across the range m/z 10-130
with each scan lasting 60 s, the dwell time for a single product ion is 150 ms. Therefore,
at least 7 such scans (whilst maintaining the sample flow for 7 minutes) would have to
be integrated to achieve 1 s of integration time. Often it is practical to cycle the
precursor ions between the individual full scans (e.g. m/z 19; then 30; then 32; and
repeat ….) and obtain 5 full scans for each reagent ion (15 scans total). In this way,
representative mass spectra can be obtained even when the composition o
changing with time (for example, as was the case in the study of population
dynamics of bacterial cultures discussed in Section 5.4 and Appendix E).
In the MIM mode, which provides more precise quantification of the targeted
trace compounds than does the FS mode, the total measurement time per product ion, tm,
is related to the total sampling time, ti, the precursor and product ion dwell tim
er of rec rsor and p du t ions recorded, prec and
w f
tm = ti tprod / (npre (tpre + tw) + nprod(tprod + tw) + tf) = ti tprod / tcycle (2)
Here, tcycle is the time taken to collect the data for all ions, effectively giving the
resolution of the time profiles along the x-axis. As an example, consider the following
typical values: Timings: ti = 10 s, tpre = 0.04 s, tprod = 0.2 s, tw = 0.02 s, tf = 0.08 s. Ions
included: 4 precursors (e.g. H3O+(H2O)0,1,2,3) and 10 product ions. Thus, tcycle
measurement time per ion is 0.8 s. This mode was used, for example, in the
study of volatile Se compounds discussed in Section 5.5.1 and Appendix F.
The available count rate of the precursor ions determines the sensitivity and
precision of SIFT-MS analysis; 106 counts per second is a desired value. Reduction of
this count rate by a factor of two results in the precision of the measurement to be
lowered 1.4 times (square root dependence). However, a precursor ion count rate that is
too large can result in non-linearity of the ion detect
27
3.2.2 H3O+ reactions
The reactions between H3O+ precursor ions and organic molecules (M) proceed
predominantly via proton transfer and usually result in only one (MH+) product ion.
However, these MH+ ions sometimes dissociate to M-OH. This fragmentation results
from elimination of water after protonation of some alcohols or larger aldehydes or
carboxylic acids. The important point is that the proton affinity of the molecules must
be greater than that of H2O for proton transfer to occur. The ion chemistry of the H3O+
precursor has been previously comprehensively described in the literature. Many studies
have been carried out in order to determine reactivity of all the three available precursor
ions (H3O+, NO+, O2+•) with several groups of organic or inorganic compounds
including alcohols [47], aldehydes and ketones [48, 49], esters and carboxylic acids
[50], hydrocarbons [51] or more complex molecules such terpenoids [52, 53]. Recent
studies summarize the ion chemistry of organosulphur molecules [54], a series of diols
[55] and nitrogen containing compounds [56] including amines [57].
In this section the ion chemistry involving the product ions of the proton transfer
reactions and the neutral water molecules is discussed. In the presence of water, the
H3O+ ions are partly converted to hydrated hydronium ions H3O+(H2O)1,2,3. These
cluster ions can act as precursors, and produce ion products like MH+(H2O)1,2,3 via
ligand switching reactions [58, 59]. The ion chemistry, which is important for real time
and accurate quantification, is influenced by the presence of water vapour and it is
necessary to account for this. The efficiency of water cluster formation for the
association reactions of MH+ ions with H2O molecules in helium (3) can be described
by the three-body rate constant, kMH+.
MH+ + H2O + He MH+(H2O) + He (3)
It is possible to obtain these rate constants by comparing the decay rate of H3O+ ions,
which are described by a three-body rate constant kH3O+ (4), and the decay rate of MH+
ions as they react simultaneously with the added H2O molecules.
H3O+ + H2O + He H3O+ (H2O) + He (4)
The three body-rate constant for reaction (4) was previously determined to be
kH3O+ = 6•10-28 cm6s-1.
H3O+(H2O) + M MH+(H2O) + H2O (5)
28
The contribution of the switching reaction (5) to the production of MH+ •(H2O)1,2,3 ions
can be quantified by a parameter (Seff) representing the contribution of switching
reactions to their formation taken relatively to the formation of hydrated hydronium
ions:
][][
ln
][])([][
ln
3
03
3,2,12
OHOH
MHOHMHMH
S
s
eff
(6)
The subscript 0 indicates the respective ion count rates in the absence of water as
obtained by the direct measurement before introducing water into the helium carrier gas.
Thus, the count rate corresponding to [MH+]0 can be acquired during analysis as the sum
of the [MH+] and [MH+.(H2O)n] count rates and similarly [H3O+]0 can be calculated as
the sum of [H3O+] and [H3O+.(H2O)n].
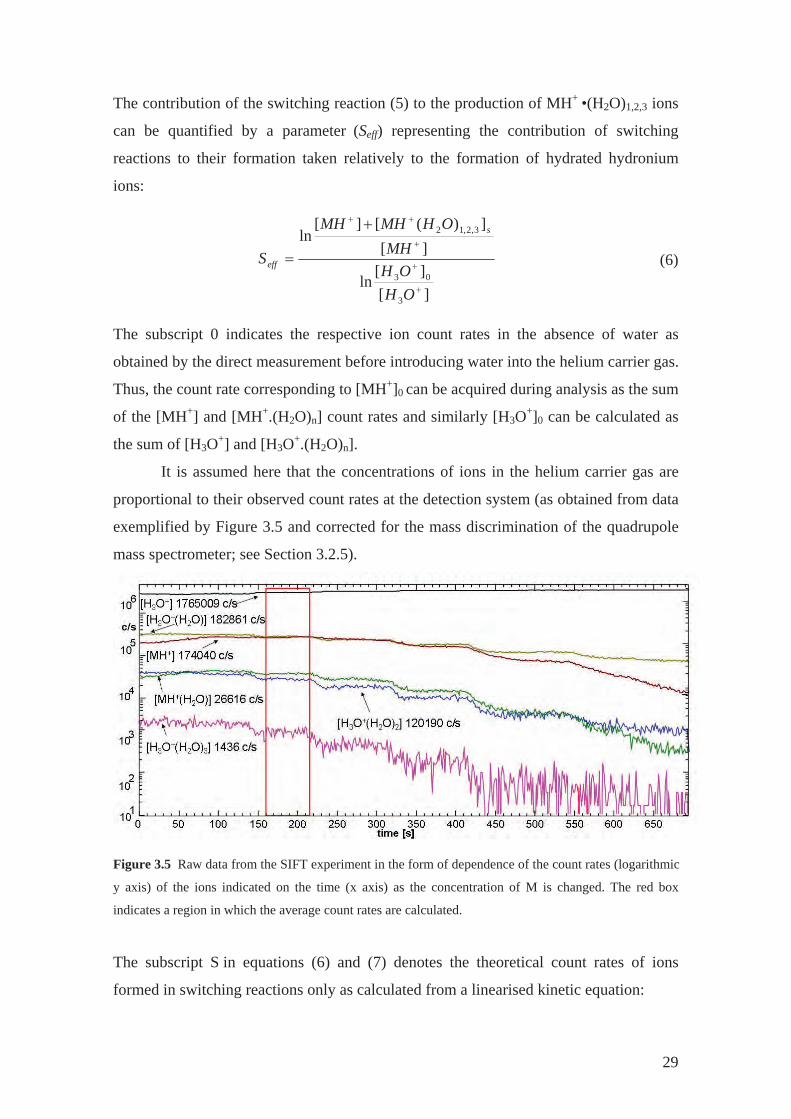
It is assumed here that the concentrations of ions in the helium carrier gas are
proportional to their observed count rates at the detection system (as obtained from data
exemplified by Figure 3.5 and corrected for the mass discrimination of the quadrupole
mass spectrometer; see Section 3.2.5).
Figure 3.5 Raw data from the SIFT experiment in the form of dependence of the count rates (logarithmic
y axis) of the ions indicated on the time (x axis) as the concentration of M is changed. The red box
indicates a region in which the average count rates are calculated.
The subscript S in equations (6) and (7) denotes the theoretical count rates of ions
formed in switching reactions only as calculated from a linearised kinetic equation:
29
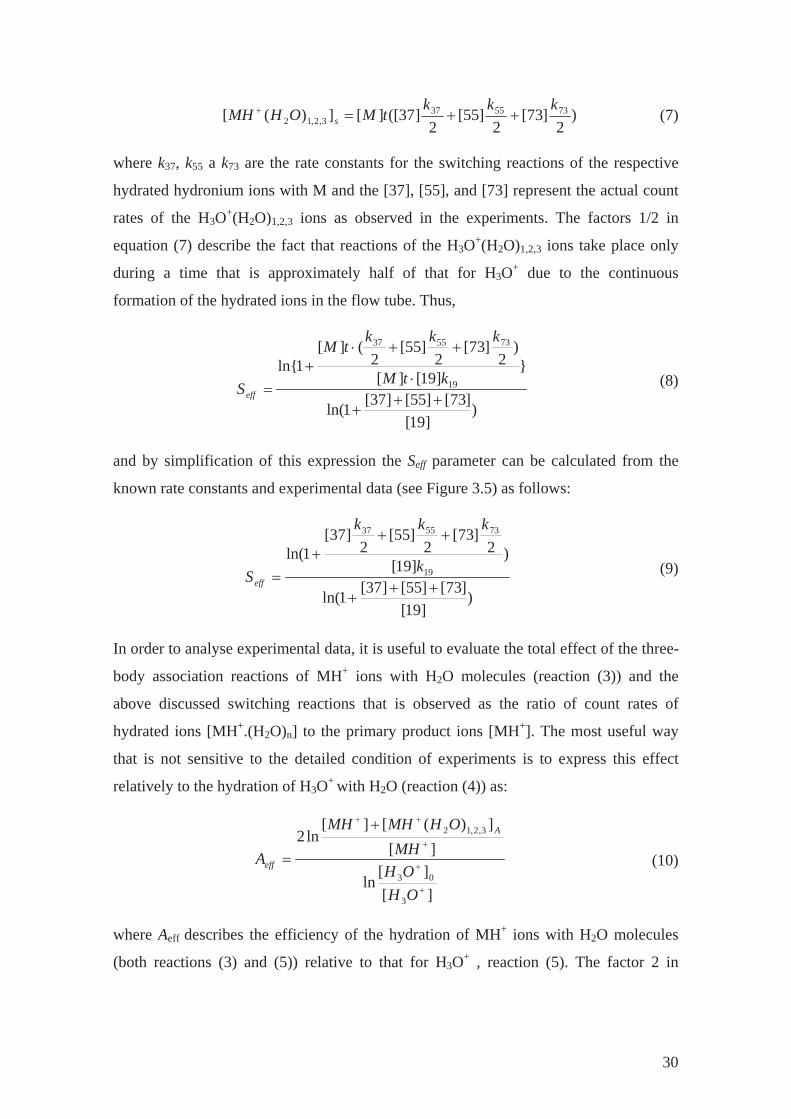
)
2]73[
2]55[
2]37([][])([ 735537
3,2,12kkk
tMOHMH s
(7)
where k37, k55 a k73 are the rate constants for the switching reactions of the respective
hydrated hydronium ions with M and the [37], [55], and [73] represent the actual count
rates of the H3O+(H2O)1,2,3 ions as observed in the experiments. The factors 1/2 in
equation (7) describe the fact that reactions of the H3O+(H2O)1,2,3 ions take place only
during a time that is approximately half of that for H3O+ due to the continuous
formation of the hydrated ions in the flow tube. Thus,
)
]19[]73[]55[]37[1ln(
}]19[][
)2
]73[2
]55[2
(][1ln{
19
735537
ktM
kkktM
Seff
(8)
and by simplification of this expression the Seff parameter can be calculated from the
known rate constants and experimental data (see Figure 3.5) as follows:
)
]19[]73[]55[]37[1ln(
)]19[
2]73[
2]55[
2]37[
1ln(19
735537
k
kkk
Seff
(9)
In order to analyse experimental data, it is useful to evaluate the total effect of the three-
body association reactions of MH+ ions with H2O molecules (reaction (3)) and the
above discussed switching reactions that is observed as the ratio of count rates of
hydrated ions [MH+.(H2O)n] to the primary product ions [MH+]. The most useful way
that is not sensitive to the detailed condition of experiments is to express this effect
relatively to the hydration of H3O+ with H2O (reaction (4)) as:
][][
ln
][])([][
ln2
3
03
3,2,12
OHOH
MHOHMHMH
A
A
eff (10)
where Aeff describes the efficiency of the hydration of MH+ ions with H2O molecules
(both reactions (3) and (5)) relative to that for H3O+ , reaction (5). The factor 2 in
30
equation (10) corresponds to the reaction time for continuously formed MH+ ions, which
is on average half of that for H3O+.
Because Aeff describes the total ion count rates, it can be directly obtained from
the experimental data. An important test is that the experimental value for Aeff is
invariant with [M] and also invariant with [H2O]. The true contribution of the three-
body association without switching is then simply calculated as Aeff – Seff and the value
of the three body association rate constant can be calculated as:
OHeffeffMH kSAk 3)( (11)
This method was used to calculate three-body rate constants of reactions of protonated
esters with H2O discussed in Appendix A.
3.2.3 NO+ reactions
The reactions of NO+ are more diverse in comparison to those of H3O+, but also
usually result in one or two primary product ions. Due to the low recombination energy
(RE) of NO+ ions (9.25 eV) they cannot ionize the major air components. Thus, only
molecules with ionization potential (IP) less than 9.25 eV can be ionized by charge
transfer. One example of charge transfer is the reaction (12) with toluene (IP =
8.82 eV) [60].
NO+ + C7H8 C7H8+ + NO (12)
Another reaction mechanism is hydride ion transfer producing (M-H)+ ions.
Hydride ion transfer occurs in reactions with aldehydes (see the equation (13)) and
esters where the hydrogen is removed from the alpha carbon and the neutral product
HNO is produced.
NO+ + CH3CHO CH2CHO+ + HNO (13)
NO+ reactions often proceed under the SIFT-MS conditions by association
producing NO+M ions. This is especially efficient when the IP of the reacting molecule
is close to the RE of NO+. This can be seen in reactions of NO+ with carboxylic acids or
ketones - a nice example is the acetone reaction:
NO+ + CH3COCH3 CH3COCH3NO+ (14)
31
32
NO+ is in practical SIFT-MS analyses mainly used to quantify aldehydes,
ketones and carboxylic acids. The use of NO+ can help when minimising the effects of
isobaric compounds. For example, acetaldehyde is monitored in the headspace of cell
cultures and it was commonly quantified using H3O+ precursor [48, 61], but recently
dimethyl sulphide, DMS, has also been detected in these samples having the same
characteristic product ions with H3O+ [62]. It has been shown that DMS can be
separately identified in a humid mixture using NO+ precursor ions.
As a part of my PhD programme, a study was carried out of the ion chemistry of
H3O+, NO+ and also O2+• with several isomers of hexanol in order to find out a method
for selective analysis of compounds in this group by SIFT-MS. This ion chemistry and
original experimental results are discussed in Section 5.1 and Appendix B.
3.2.4 O2+•
reactions
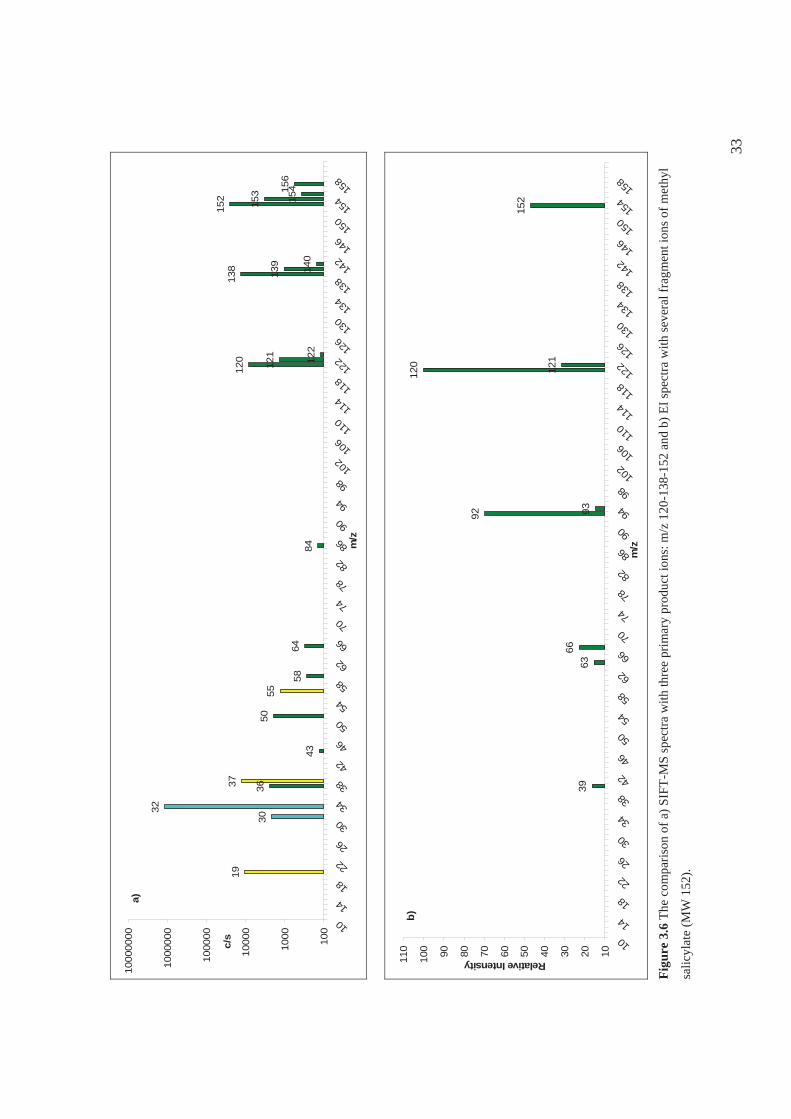
O2+• is a radical cation that reacts with VOCs mainly via dissociative charge
transfer [38]. The resulting primary product ion is radical cation. The charge transfer is
usually dissociative with the fragmentation patterns similar to electron ionisation, EI
(see Figure 3.6). Similar fragmentation follows, usually favouring a closed shell ion
product. Because the energy is well defined in the charge transfer (in contrast to the
wide energy distribution in EI) there are fewer types of fragments. For example, the
reaction of methyl salicylate (MW = 152) with O2+• produces three primary product ions
with different branching ratio (see the percentages in reactions 15-17 below). One is the
radical cation at m/z 152 and two are fragments (m/z 120 and m/z 138).
O2+• + C8H8O3 C8H8O3
+• + O2 (m/z152) 57% (15)
C7H6O3+• + CH2
+ O2 (m/z138) 38% (16)
C7H4O2+•+ CH3OH + O2 (m/z120) 5% (17)
However, the spectra of VOCs obtained using the O2+• precursor ions are
typically more complicated than those obtained using H3O+ or NO+. The choice of
precursor ion depends on the compounds to be analysed, in the case of O2+• this is the
precursor of choice for very small molecules including NH3 [63] and CH4 [64] or
hydrocarbons like isoprene [65] or pentane researched as a part of this PhD project (see
Section 5.3.1) . Different product ions are produced in the reactions with the different
precursor ions. Such can be used in identification of isobaric compounds [32].
19
30
32
3637
43
5055
5864
84
120 121 122
138 139 140
152 153 15415
6
100
1000
1000
0
1000
00
1000
000
1000
0000
10141822263034384246505458
6266707478828690949810
210
611
011
411
812
212
613
013
413
814
214
615
015
415
8
m/z
c/s
a)
3963
66
92 93
120 121
152
102030405060708090100
110 10
14
182226
30343842
46505458
62667074
78828690
949810
210
611
011
411
812
212
613
013
413
814
214
615
015
415
8
m/z
Relative Intensity
b)
Fi
gure
3.6
The
com
paris
on o
f a) S
IFT-
MS
spec
tra w
ith th
ree
prim
ary
prod
uct i
ons:
m/z
120
-138
-152
and
b) E
I spe
ctra
with
seve
ral f
ragm
ent i
ons o
f met
hyl
salic
ylat
e (M
W 1
52).
33
3.2.5 Absolute quantification
The theoretical background of absolute trace gas quantification in real time is
based on first order kinetics. The absolute concentrations are calculated from the known
rate constants, count rates of precursor ions and product ions and the known reaction
time. Note that the main original use of SIFT was to determine an unknown k for a
specific reaction. Once k has been measured for the reaction of a particular analyte gas,
this rate constant can then be used in the quantification of that gas using SIFT-MS.
The H3O+ reaction can be used as an illustrative example: when only one
compound, M, reacts through proton transfer with precursor ion producing one MH+
product ion.
H3O+ + M MH+ + H2O (18)
the reaction proceeds during a well-defined reaction time tr (being typically 0.6 ms)
with the rate constant k. MH+ is assumed to be the only product ion and if [H3O+] >>
[MH+], then the kinetics can be approximated by the following simple equation (note
the [ ] brackets represent count rates):
[MH+] = rtOHMk ]][[ 3 (19)
From this, [M] can be expressed as:
[M] = ][
][1
3OHkMH
tr
(20)
The measured ion signals are proportional to the ion concentrations and then the
measurement of the MH+/H3O+ signal ratio analysed by the mass spectrometer allow
the absolute quantification of M.
However, if the reaction scheme is more complicated and involves ion clusters
[46, 66] the general equation is used to calculate the concentration of the trace gas
molecule [M]:
.../2/)(
...//1
22122111
222111
eiiiii
epppeppp
r DkkIfkIfDIfDIf
tM (21)
where Ip1, Ip2 etc. are product ion signals (count rates are corrected for the detector dead
time and for mass discrimination in the downstream quadrupole mass spectrometer
[46]), Ii1, Ii2 etc. are precursor ions signals (e.g. H3O+, H3O+(H2O), again corrected for
34
mass discrimination and dead time), k1,2 are rate constants of ion-molecular reactions
between precursor ions and neutral molecule [M]. Dep1, Dep2, Dei2 etc. are differential
diffusion coefficients of ion products and precursor ions.
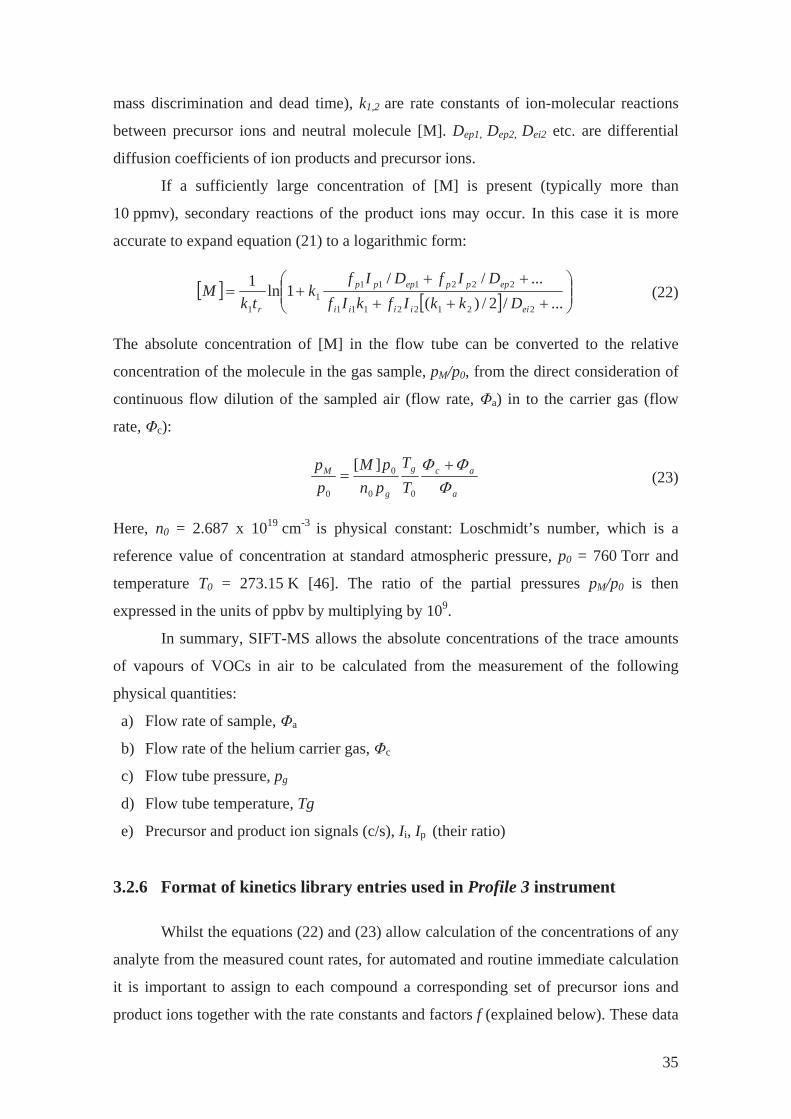
If a sufficiently large concentration of [M] is present (typically more than
10 ppmv), secondary reactions of the product ions may occur. In this case it is more
accurate to expand equation (21) to a logarithmic form:
.../2/)(...//
1ln1
22122111
2221111
1 eiiiii
epppeppp
r DkkIfkIfDIfDIf
ktk
M
(22)
The absolute concentration of [M] in the flow tube can be converted to the relative
concentration of the molecule in the gas sample, pM/p0, from the direct consideration of
continuous flow dilution of the sampled air (flow rate, a) in to the carrier gas (flow
rate, c):
a
acg
g
M
TT
pnpM
pp
00
0
0
][ (23)
Here, n0 = 2.687 x 1019 cm-3 is physical constant: Loschmidt’s number, which is a
reference value of concentration at standard atmospheric pressure, p0 = 760 Torr and
temperature T0 = 273.15 K [46]. The ratio of the partial pressures pM/p0 is then
expressed in the units of ppbv by multiplying by 109.
In summary, SIFT-MS allows the absolute concentrations of the trace amounts
of vapours of VOCs in air to be calculated from the measurement of the following
physical quantities:
a) Flow rate of sample, a
b) Flow rate of the helium carrier gas, c
c) Flow tube pressure, pg
d) Flow tube temperature, Tg
e) Precursor and product ion signals (c/s), Ii, Ip (their ratio)
3.2.6 Format of kinetics library entries used in Profile 3 instrument
Whilst the equations (22) and (23) allow calculation of the concentrations of any
analyte from the measured count rates, for automated and routine immediate calculation
it is important to assign to each compound a corresponding set of precursor ions and
product ions together with the rate constants and factors f (explained below). These data
35
(in the case of the Profile 3 SIFT-MS software) are stored in the so-called kinetics
library, a plain text file that consists of an arbitrary (in principle unlimited) number of
entries that are labelled by the name of the compound followed by a symbol indicating
the precursor ion in parentheses [45]. Examples of the kinetics library entries that are
used for the analysis of acetone by the three available precursor ions (H3O+, NO+ and
O2+ ) are given in Table 3.1.
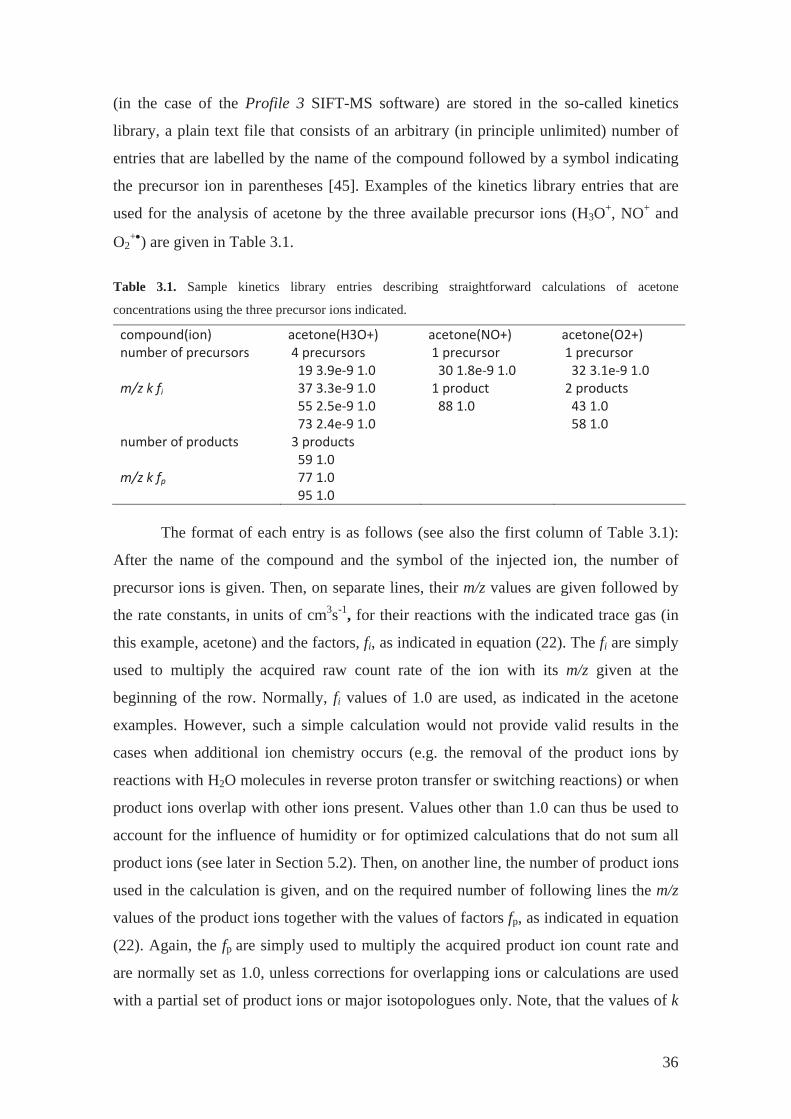
Table 3.1. Sample kinetics library entries describing straightforward calculations of acetone
concentrations using the three precursor ions indicated.
compound(ion)number of precursors
m/z k fi
number of products
m/z k fp
acetone(H3O+)4 precursors19 3.9e 9 1.037 3.3e 9 1.055 2.5e 9 1.073 2.4e 9 1.03 products59 1.077 1.095 1.0
acetone(NO+)1 precursor30 1.8e 9 1.01 product88 1.0
acetone(O2+)1 precursor32 3.1e 9 1.02 products43 1.058 1.0
The format of each entry is as follows (see also the first column of Table 3.1):
After the name of the compound and the symbol of the injected ion, the number of
precursor ions is given. Then, on separate lines, their m/z values are given followed by
the rate constants, in units of cm3s-1, for their reactions with the indicated trace gas (in
this example, acetone) and the factors, fi, as indicated in equation (22). The fi are simply
used to multiply the acquired raw count rate of the ion with its m/z given at the
beginning of the row. Normally, fi values of 1.0 are used, as indicated in the acetone
examples. However, such a simple calculation would not provide valid results in the
cases when additional ion chemistry occurs (e.g. the removal of the product ions by
reactions with H2O molecules in reverse proton transfer or switching reactions) or when
product ions overlap with other ions present. Values other than 1.0 can thus be used to
account for the influence of humidity or for optimized calculations that do not sum all
product ions (see later in Section 5.2). Then, on another line, the number of product ions
used in the calculation is given, and on the required number of following lines the m/z
values of the product ions together with the values of factors fp, as indicated in equation
(22). Again, the fp are simply used to multiply the acquired product ion count rate and
are normally set as 1.0, unless corrections for overlapping ions or calculations are used
with a partial set of product ions or major isotopologues only. Note, that the values of k
36

decrease with increasing m/z of the precursor ions. Thus, acetone can be analyzed using
all three available precursor ions, but this is an exception rather than the rule for most
other compounds, although both H3O+ and NO+ in tandem can be used for a number of
compounds [45].
37
4 Volatile organic compounds
Trace amounts of vapours of VOCs present in the matrix of humid air that are
the object of the studies discussed in this dissertation are of interest in several fields
including food science, environmental monitoring, occupational health and safety,
medical diagnostics and therapeutic monitoring. The medical interest in analysis of
VOCs [3] and other gaseous analytes is centred on non-invasive breath analysis. From
this wide area of possible interdisciplinary studies three chosen topics were subject of
the present experimental work: VOC’s emitted by bacterial cultures, by plants and those
present in human breath. The background knowledge and the current status of research
in these areas important for discussion of the original results reported in this thesis is
overviewed in the following sections 5.3 - 5.6 in much more detail, than was reported in
the published research articles that resulted from this thesis research work, which are
given in the Appendices.
4.1 Bacterial volatile organic compounds
VOCs are produced by bacteria as primary or secondary metabolites or as waste
products. The production of VOCs may differ qualitatively and quantitatively according
to bacterial type. They can serve a certain function important to the bacterial cell-
facilitate communication between cells, promote growth or act as inhibiting agents [67-
69]. A variety of bacterial volatile metabolites have been reported on the basis of
GC/MS analyses, including carboxylic acids, alcohols, aldehydes, ketones, esters,
hydrocarbons and organosulphur compounds [70, 71]. A few years ago, Schulz et al.
[72, 73] compiled a list of all known volatiles released by bacteria. They classified 75
fatty acid derivatives, 50 aromatic compounds, 74 nitrogen-containing compounds, 30
sulphur compounds, 96 terpenoids, 18 halogenated compounds, and selenium,
tellurium, and other metalloid compounds. Bacteria are very important in naturally
occurring bio systems, they are an integral part of the healthy human digestive system
and are also utilised in many technologies such as food industry. However, some
species of bacteria can be harmful and cause or complicate various diseases. As a
background to the original results presented in this dissertation, just two relevant areas,
viz. medicine and fundamentals of biology will be discussed.
38
4.1.1 Clinically relevant bacteria
The concentrations of VOCs are often considered to be used as biomarkers (for
the different definitions of the term see Table 4.1) of bacterial growth or infection [74-
76].
Table 4.1 Definitions of the term “biomarker”.
Medical Research Council [77]
“Objective measurement that acts as an indicator of normal biological processes,
pathogenic processes or pharmacologic responses to therapeutic intervention (eg
cholesterol, troponin T and I and FDG-PET) and qualification should be taken to
mean demonstrating the utility of the marker(s) for use in clinical or public health
studies.”
National Institutes of Health in [78]
“a characteristic that is objectively* measured and evaluated as an indicator of
normal biological processes, pathogenic processes, or pharmacologic responses to an
intervention.” Example: cholesterol level.
*The committee defines “objectively” to mean “reliably and accurately.”
Cell biology in [79]
“a biomarker is a molecule that allows the detection and isolation of a particular cell
type (for example, the protein Oct-4 is used as a biomarker to identify embryonic
stem cells).”
The knowledge of volatile biomarkers could allow non-invasive early detection
of bacterial infection [75, 80]. Zhu et al. [81] have very recently used SESI-MS for the
detection of bacterial lung infection based on volatile fingerprints. They demonstrated
that SESI-MS is capable of differentiating mice infected with Pseudomonas
aeruginosa or Staphylococcus aureus against uninfected animals, as well as
distinguishing between infections caused by different P. aeruginosa (PA) strains.
Bacteria belonging to the PA species are important pathogens causing lung infection in
cystic fibrosis and they are known to produce several volatiles that are proposed to act
as biomarkers of PA infection. Mann et al. [82] reported in 1966 that 2-
aminoacetophenone (2-AA) having a grape odour is released by certain strains of PA
39
and 2-AA is continuously researched as a possible biomarker of PA infection [70, 83-
85]. However, it was found that 2-AA is also present in breath of healthy subjects
immediately after eating certain types of food, e.g. corn flakes; however after 2 h the
level of 2-AA had decreased back to the baseline for each volunteer [86]. Hydrogen
cyanide is also related to the PA infection of patients suffering from cystic fibrosis [87-
89]. However, the experience with breath analysis had shown that the use of HCN as a
single biomarker might be negatively affected by several factors (e.g. diet, smoking,
oral cavity hygiene). Thus, a combination of several biomarkers, e.g. HCN and 2-AA or
the recently identified methyl thiocyanate by Shestivska et al. [74] would improve
diagnostic sensitivity and specificity of diagnosis. Filipiak et al. [90] has very recently
characterised VOCs released from Streptococcus pneumoniae and Haemophilus
influenzae, recognised as pathogens in the upper airways, by GC/MS. They found 34
volatiles in S. pneumoniae and 28 volatiles in H. influenzae, including alcohols,
aldehydes, esters, hydrocarbons, ketones and sulphur-containing compounds. Highly
elevated concentrations were observed of acetic acid, acetaldehyde, methyl
methacrylate, 2,3-butanedione and methanethiol. Allardyce et al. [91] used SIFT-MS to
detect metabolite gases in the headspaces of blood cultures of PA, S. pneumoniae,
Escherichia coli, S. aureus and Neisseria meningitides. Another interesting field of
research is motivated by the possibility that monitoring of VOCs might assist in the
early detection of bacterial infection in large scale bioreactors [76, 92].
4.1.2 Bacterial models of interactions
Identification of bacteria based on the composition of VOCs released by their
metabolism can be used to diagnose and monitor occurrence and progression of
bacterial infections. This ultimately can be used to screen groups of patients at risk of
early signs of infection and to choose optimal therapy for its eradication. The theme of
bacterial fingerprinting is currently at the forefront of research interest in mass
spectrometry [93]; however, most of the approaches require isolation and cultivation of
bacteria before the ionisation (usually by matrix assisted laser desorption and ionisation
MALDI) which is usually destructive. Thus, an analytical methodology that would
shorten time of diagnosis on the basis of immediate analyses of volatile metabolites
released in-vivo would be of great value. Such methodology could be also used in the
field of population dynamics in fundamental ecology and biodiversity [94], where
40
models consisting of several competing bacterial species are used to test theoretical
concepts.
The theoretical biologists are interested in the bacterial systems because of its
intricate communication capabilities that include quorum sensing [95], chemotactic
signalling and plasmid exchange. Jacob et al. [96] have proposed that bacterial
communication-based cooperation involves colony morphogenesis, which includes
coordinate gene expression. “Social intelligence” helps bacteria to gain information
from the environment and from other organisms; they process the information and
develop common knowledge and learn from past experience. Nice example of usage of
this concept in medicine has been demonstrated by Jacob and co-workers [97]. They
were motivated by the idea, that bacterial sociality can serve as a source of inspiration in
tumorigensis. They hypothesised that tumours may be smart society communities. The
understanding of the behaviour of these cancer systems could possibly lead to the
development of therapeutic approaches with minimised harmful side effects.
As reported in Section 5.4 of this dissertation, a model system of three
competing bacterial species: Serratia rubidaea (R), Serratia marcescens (F) and
Escherichia coli (Ec), growing in single (R, F and Ec) and binary populations (REc, RF
and FEc) in liquid media were studied using their volatile signatures. The ternary
system exhibits relationship similar to the children's game rock-paper-scissors [94].
Serratia are intensively studied by theoretical biologist [67, 98, 99]. They exhibit a
simple model of social interaction and self-organisation.
4.2 Plant volatiles
Since the time of ancient Greeks it has been known that plants and especially
flowers have ability to pleasantly perfume the atmosphere around them. Thus floral and
other vegetative parts have been used for centuries for the manufacture of perfumes and
other fragrant products. Plants produce hundreds of volatile compounds, a
comprehensive list of floral scent has been compiled by Knudsen et al. [100]. These
chemicals are stored in the leaf and plants maintain physiological concentrations of
these volatile metabolites, which typically include monoterpenes and sesquiterpenes.
Volatiles serve the plants in their developments and growth. The “smell” moves rapidly
and thus it is used by plants to attract pollinators or even influenced other plants and
animals [101]. These volatiles also attract parasitic and predatory insects that are natural
41
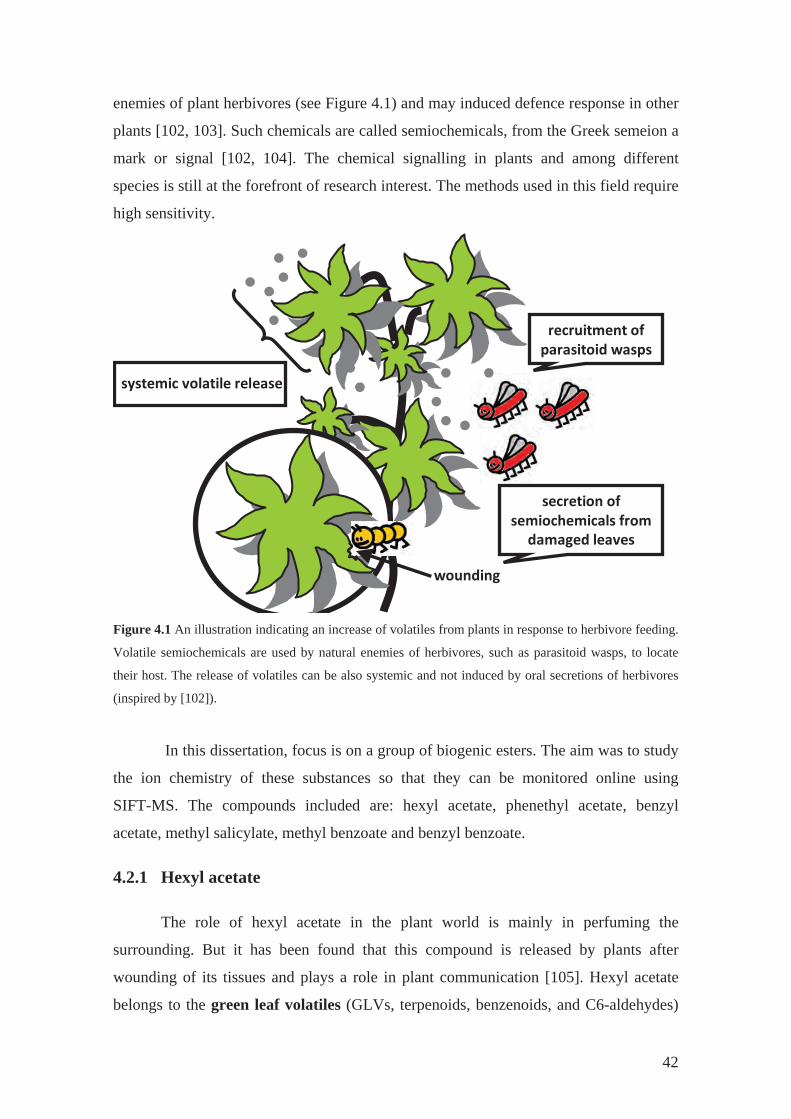
enemies of plant herbivores (see Figure 4.1) and may induced defence response in other
plants [102, 103]. Such chemicals are called semiochemicals, from the Greek semeion a
mark or signal [102, 104]. The chemical signalling in plants and among different
species is still at the forefront of research interest. The methods used in this field require
high sensitivity.
wounding
secretion ofsemiochemicals from
damaged leaves
systemic volatile release
recruitment ofparasitoid wasps
Figure 4.1 An illustration indicating an increase of volatiles from plants in response to herbivore feeding.
Volatile semiochemicals are used by natural enemies of herbivores, such as parasitoid wasps, to locate
their host. The release of volatiles can be also systemic and not induced by oral secretions of herbivores
(inspired by [102]).
In this dissertation, focus is on a group of biogenic esters. The aim was to study
the ion chemistry of these substances so that they can be monitored online using
SIFT-MS. The compounds included are: hexyl acetate, phenethyl acetate, benzyl
acetate, methyl salicylate, methyl benzoate and benzyl benzoate.
4.2.1 Hexyl acetate
The role of hexyl acetate in the plant world is mainly in perfuming the
surrounding. But it has been found that this compound is released by plants after
wounding of its tissues and plays a role in plant communication [105]. Hexyl acetate
belongs to the green leaf volatiles (GLVs, terpenoids, benzenoids, and C6-aldehydes)
42
family and it was found in the headspace of maize seedlings exposed to wound-induced
maize, hot pepper and tobacco volatiles [106]. Herbivore attack had also a significant
effect on the emission of hexyl acetate from lima beans. De Boer et al. [107] have
studied the difference between lima beans infected by multi-species herbivory of spider
mites (Tetranychus urticae) and caterpillars (Spodoptera exigua) in comparison to
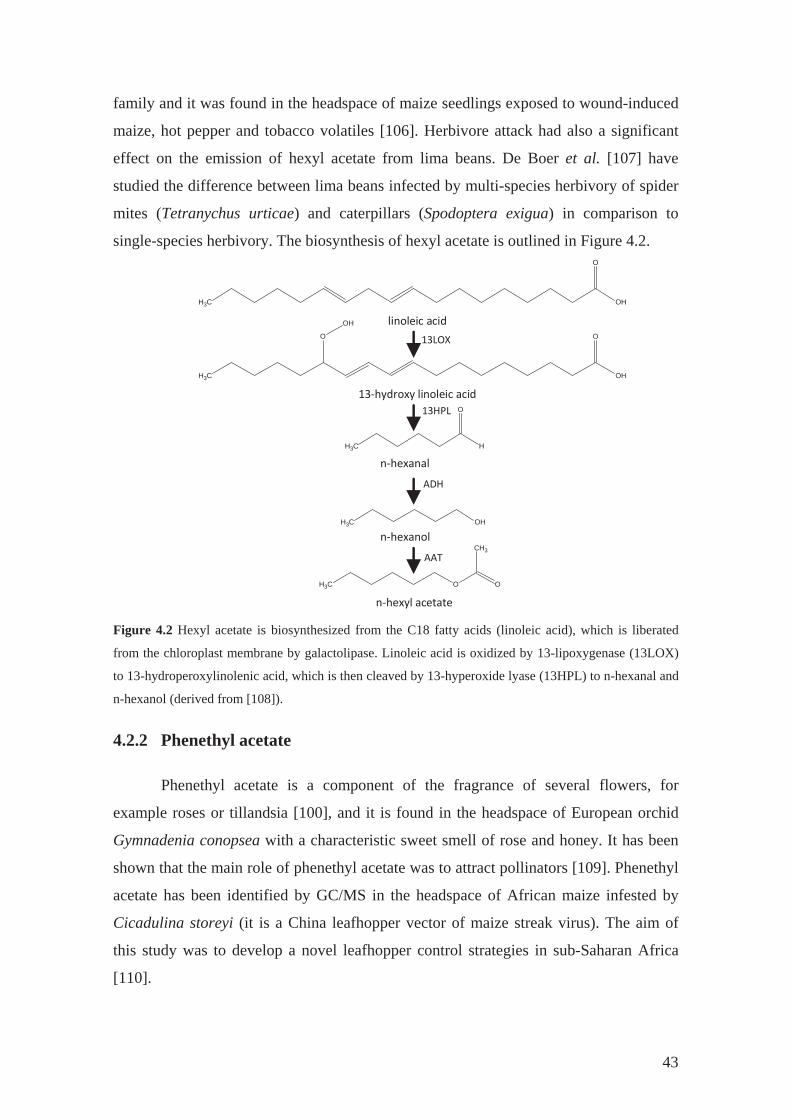
single-species herbivory. The biosynthesis of hexyl acetate is outlined in Figure 4.2.
CH3
O
OH
CH3
O
OH
O
OH
CH3
O
H
CH3 OH
CH3 O O
CH3
linoleic acid
13 hydroxy linoleic acid
n hexanal
n hexanol
n hexyl acetate
13LOX
13HPL
ADH
AAT
Figure 4.2 Hexyl acetate is biosynthesized from the C18 fatty acids (linoleic acid), which is liberated
from the chloroplast membrane by galactolipase. Linoleic acid is oxidized by 13-lipoxygenase (13LOX)
to 13-hydroperoxylinolenic acid, which is then cleaved by 13-hyperoxide lyase (13HPL) to n-hexanal and
n-hexanol (derived from [108]).
4.2.2 Phenethyl acetate
Phenethyl acetate is a component of the fragrance of several flowers, for
example roses or tillandsia [100], and it is found in the headspace of European orchid
Gymnadenia conopsea with a characteristic sweet smell of rose and honey. It has been
shown that the main role of phenethyl acetate was to attract pollinators [109]. Phenethyl
acetate has been identified by GC/MS in the headspace of African maize infested by
Cicadulina storeyi (it is a China leafhopper vector of maize streak virus). The aim of
this study was to develop a novel leafhopper control strategies in sub-Saharan Africa
[110].
43
4.2.3 Benzyl acetate
Benzyl acetate together with phenethyl acetate contributes to the aroma of
numerous flowers and fruits [111]. It has been found in the headspace of floral and
vegetative fragrances of Nyctaginaceae: Acleisanthes, Mirabilis and Selinocarpus as a
scent for pollinators [112]. Guterman et al. [113] studied petunia flowers of different
transgenic lines and both esters were elevated. Benzyl acetate was recently used as an
attractant of various longhorn beetles. The study [114] focused on the evaluation of
secondary forests as alternative habitats to primary forests for flower-visiting insects.
4.2.4 Methyl benzoate
Methyl benzoate (MetB) is one of the most common volatiles among the
benzenoids [100] and is present in floral scent of many plant species such as Jasminum,
Nicotiana, Hyacintus or Gardenia. Horruchi et al. [115, 116] found that MetB produced
by snapdragon (Antirrhinum majus) flowers inhibits root growth in neighbouring
Arabidopsis seedlings under laboratory conditions. It has also been found that
snapdragon flowers emit MetB at a much higher rate during the day than during the
night [117].
4.2.5 Benzyl benzoate
Benzyl benzoate is found in a floral blend of Jasminum or Hyacinthus [100]. It
plays a role in benzenoid metabolism in petunia petal tissue [118].
4.2.6 Methyl salicylate
The volatile phytohormon methyl salicylate (MeSA) is recognised to act as a
signalling molecule (in contrast with the previously mentioned esters) and together with
methyl jasmonate is involved in communication and interactions with other plants to
optimize plant defence response [105]. For example, the MeSA production in lima
beans is induced either by jasmonic acid or free MeSA (free blend)after infection of
lima beans by Tetranychus urticae – a prey species of the predatory mite. De Boer and
Dicke [119] have shown a significant increase of the mites after adding synthetic MeSA
to the MeSA free blend and thus suggested the important role of MeSA.
44
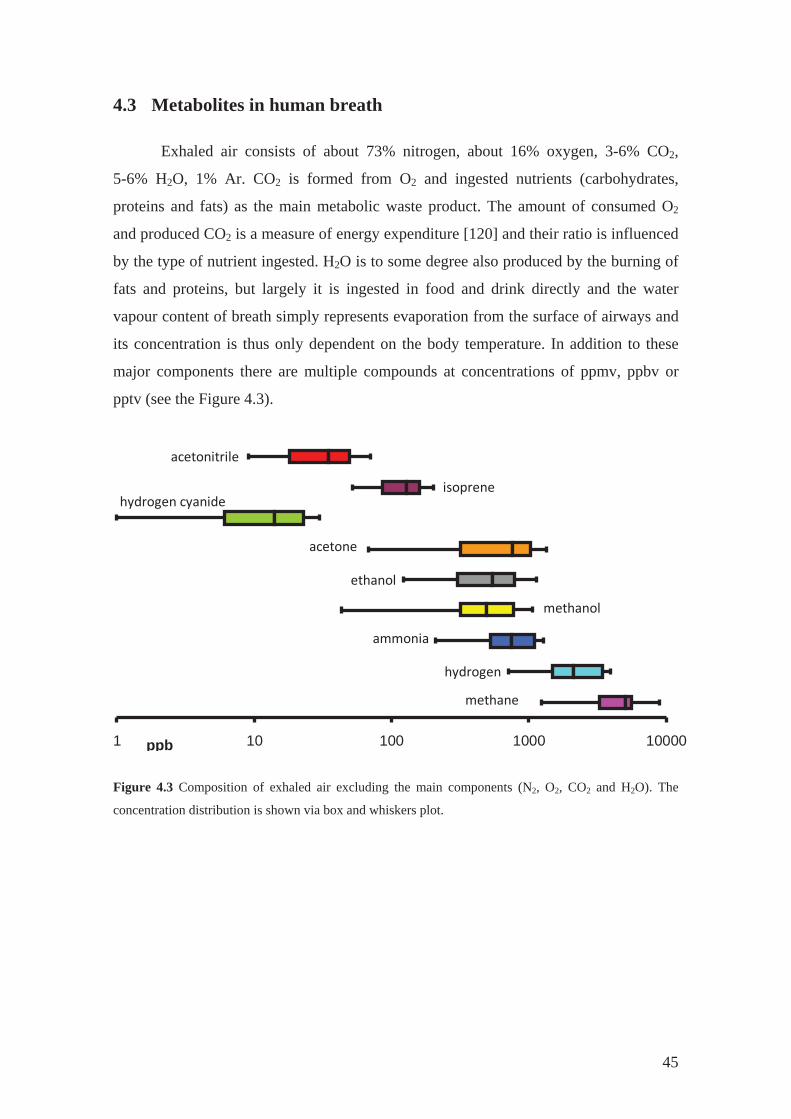
4.3 Metabolites in human breath
Exhaled air consists of about 73% nitrogen, about 16% oxygen, 3-6% CO2,
5-6% H2O, 1% Ar. CO2 is formed from O2 and ingested nutrients (carbohydrates,
proteins and fats) as the main metabolic waste product. The amount of consumed O2
and produced CO2 is a measure of energy expenditure [120] and their ratio is influenced
by the type of nutrient ingested. H2O is to some degree also produced by the burning of
fats and proteins, but largely it is ingested in food and drink directly and the water
vapour content of breath simply represents evaporation from the surface of airways and
its concentration is thus only dependent on the body temperature. In addition to these
major components there are multiple compounds at concentrations of ppmv, ppbv or
pptv (see the Figure 4.3).
1 10 100 1000 10000ppb
methane
hydrogen
ammonia
methanol
ethanol
acetone
hydrogen cyanideisoprene
acetonitrile
Figure 4.3 Composition of exhaled air excluding the main components (N2, O2, CO2 and H2O). The
concentration distribution is shown via box and whiskers plot.
45
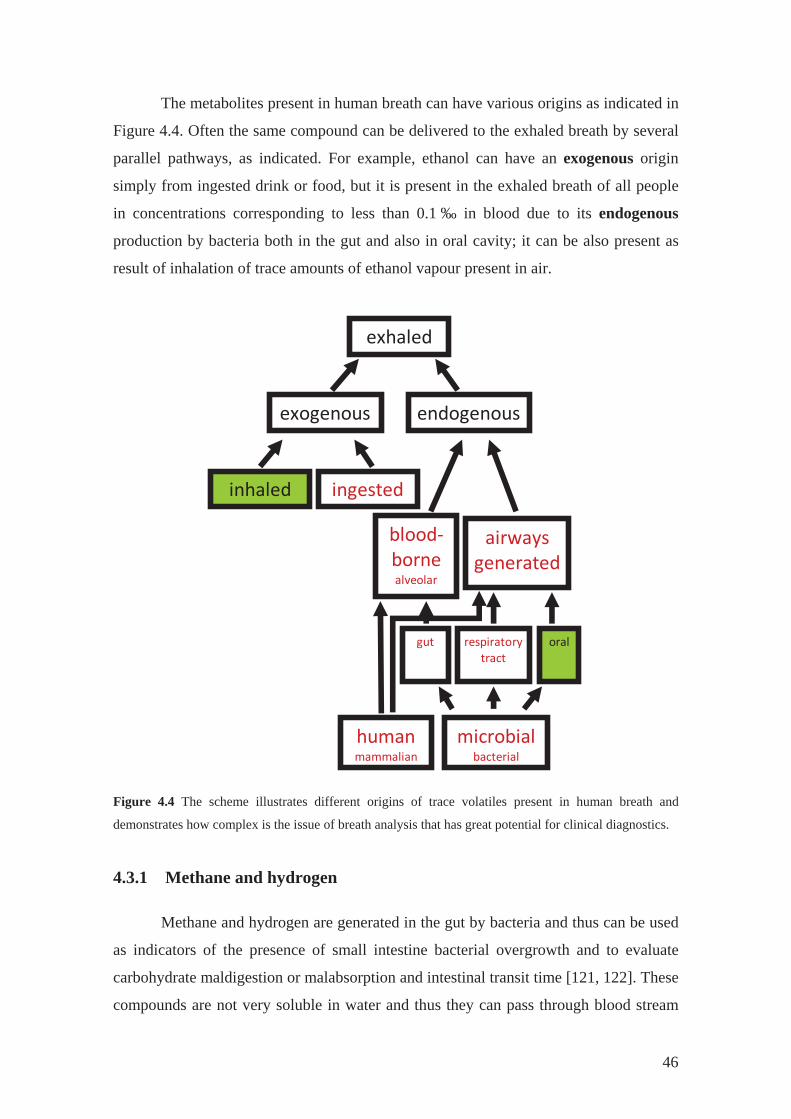
The metabolites present in human breath can have various origins as indicated in
Figure 4.4. Often the same compound can be delivered to the exhaled breath by several
parallel pathways, as indicated. For example, ethanol can have an exogenous origin
simply from ingested drink or food, but it is present in the exhaled breath of all people
in concentrations corresponding to less than 0.1 ‰ in blood due to its endogenous
production by bacteria both in the gut and also in oral cavity; it can be also present as
result of inhalation of trace amounts of ethanol vapour present in air.
exhaled
exogenous endogenous
inhaled
ingested
airwaysgenerated
bloodbornealveolar
humanmammalian
microbialbacterial
gut oralrespiratorytract
Figure 4.4 The scheme illustrates different origins of trace volatiles present in human breath and
demonstrates how complex is the issue of breath analysis that has great potential for clinical diagnostics.
4.3.1 Methane and hydrogen
Methane and hydrogen are generated in the gut by bacteria and thus can be used
as indicators of the presence of small intestine bacterial overgrowth and to evaluate
carbohydrate maldigestion or malabsorption and intestinal transit time [121, 122]. These
compounds are not very soluble in water and thus they can pass through blood stream
46
and be efficiently released into exhaled breath. The method for methane quantification
using SIFT-MS has been described by Dryahina et al. [64], the mean methane
concentration in exhaled breath is about 6 ppmv with insignificant variation with age
and gender.
4.3.2 Ammonia
Ammonia is one of the trace gases present in exhaled breath of all people at
concentrations between 100 ppbv and 2 ppmv [123]. It originates to some degree in
human metabolism as a breakdown product of protein catabolism [124]. The renal
ammonia synthesis is attributed to the renal extraction and catabolism of certain plasma
amino acids and other nitrogenous compounds catalyzed by enzymes such as glutamate
dehydrogenase. In humans ammonia is detoxified in the liver where is converted to urea
(which is less toxic) that is excreted by the kidneys in the urine [125]. A small amount
of ammonia is present in the blood and is excreted via the exhaled breath and through
the skin [126, 127].
Many previous SIFT-MS studies have shown that breath ammonia to a large
degree originates from enzymatic and bacterial activity in the oral cavity [128]. This
was well demonstrated by studies of Wang et al. [129] and Smith at al. [130] when
nose-exhaled breath ammonia concentration levels were several times lower than in
mouth-exhaled breath and in the static gas in the oral cavity. The study of Boshier et al.
[131] has shown that variability in repeated on-line breath analysis is lower for
metabolites of purely systemic origin (as for example acetone).
Ammonia is, from the perspective of clinical diagnosis, related to end-stage
renal failure and may be potentially used in therapeutic monitoring of dialysis [128,
132]. There is a growing interest in the development of dedicated ammonia sensors
[133-135] for breath analysis based on the evidence of the correlation of breath
ammonia with blood urea nitrogen [136, 137]. Longitudinal studies of ammonia in the
breath of several healthy volunteers have been carried out in order to determine the
concentration distribution [138, 139] in the healthy population. The median
concentration in a cohort of healthy adults has been found to be approximately
1000 ppbv. Špan l et al. [139] have shown that ammonia in exhaled breath is dependent
on age, the mean level increasing from about 200 ppbv in children to about 1300 ppbv
in 80 year old adults.
47
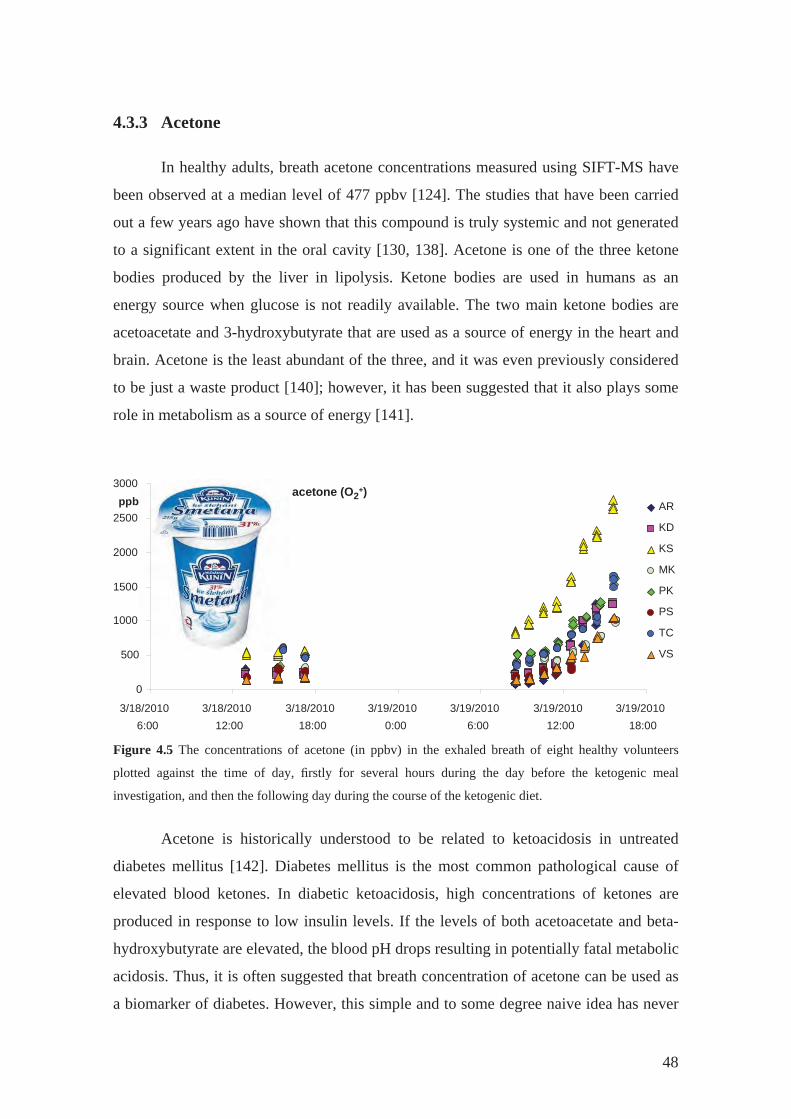
4.3.3 Acetone
In healthy adults, breath acetone concentrations measured using SIFT-MS have
been observed at a median level of 477 ppbv [124]. The studies that have been carried
out a few years ago have shown that this compound is truly systemic and not generated
to a significant extent in the oral cavity [130, 138]. Acetone is one of the three ketone
bodies produced by the liver in lipolysis. Ketone bodies are used in humans as an
energy source when glucose is not readily available. The two main ketone bodies are
acetoacetate and 3-hydroxybutyrate that are used as a source of energy in the heart and
brain. Acetone is the least abundant of the three, and it was even previously considered
to be just a waste product [140]; however, it has been suggested that it also plays some
role in metabolism as a source of energy [141].
acetone (O2+)
0
500
1000
1500
2000
2500
3000
3/18/20106:00
3/18/201012:00
3/18/201018:00
3/19/20100:00
3/19/20106:00
3/19/201012:00
3/19/201018:00
AR
KD
KS
MK
PK
PS
TC
VS
ppb
Figure 4.5 The concentrations of acetone (in ppbv) in the exhaled breath of eight healthy volunteers
plotted against the time of day, rstly for several hours during the day before the ketogenic meal
investigation, and then the following day during the course of the ketogenic diet.
Acetone is historically understood to be related to ketoacidosis in untreated
diabetes mellitus [142]. Diabetes mellitus is the most common pathological cause of
elevated blood ketones. In diabetic ketoacidosis, high concentrations of ketones are
produced in response to low insulin levels. If the levels of both acetoacetate and beta-
hydroxybutyrate are elevated, the blood pH drops resulting in potentially fatal metabolic
acidosis. Thus, it is often suggested that breath concentration of acetone can be used as
a biomarker of diabetes. However, this simple and to some degree naive idea has never
48
been substantiated because of the high variability of acetone in healthy people.
Nevertheless, substantial resources are being invested into development of dedicated
sensors for breath acetone measurement [143-147]. One important issue is that breath
acetone concentration grows during starvation and decreases after ingestion of
carbohydrate. Very recently, an experiment on to investigate the influence of ketogenic
diet on exhaled breath acetone has been carried out [148]. Eight healthy individuals took
a brief course of a ketogenic diet, which means they ate only dairy cream for 6 hours.
Their breath acetone concentrations increased up to five times during this period (see
Figure 4.5). These remarkable data forcefully show that diet can have a serious
influence, even a dominant influence, of some breath metabolite concentrations.
4.3.4 Hydrogen cyanide
Hydrogen cyanide has been proposed as a biomarker of bacterial infection in the
lungs. HCN is produced by PA the main pathogen that colonizes lungs of patients with
cystic fibrosis, CF (for more details see Section 5.3.2). Using SIFT-MS, HCN was
identified in the headspace of PA cultures [149] and in the breath of patients with cystic
fibrosis infected with PA by Enderby et al. [87], where the median concentration of
breath HCN in children with CF was 13.5 ppbv. Further research has shown that
different strains of PA produce HCN at varying concentrations [150]. Recently,
significant differences have been reported between HCN concentrations in the exhaled
breath of PA infected and uninfected CF patients [88, 151].
The use of SIFT-MS as a tool for early detection of PA infection of those with
CF may help in early treatment and thus help to decrease the morbidity and mortality.
However, the investigation of such biomarkers is often complicated by several factors
and interferences. Dummer et al. [152] has reported that HCN is not a reliable
biomarker of PA in chronic suppurative lung disease. They found out that HCN is
produced by salivary peroxidase in the oral cavity and this increases the orally exhaled
concentrations.
4.3.5 Methanol
Methanol has been previously monitored in the exhaled breath of 30 volunteers
by Turner et al. [153] using SIFT-MS. The median methanol level determined using
49
H3O+ precursor ions was 461 ppbv, the concentrations ranging from 32 to 1684 ppvb.
Methanol has several exogenous sources; it is used in manufacturing and is also present
in ripe fruits and fruit juices. It has been shown that ingestion of fruit increases the
concentration of methanol in exhaled breath [153] by as much as an order-of-magnitude
[154]. This is due to the degradation of natural pectin in the human colon by faecal
bacteria [155]. Methanol is also produced by the metabolism of the artificial sweetener
aspartame and converted to formaldehyde and then to formic acid [156]. The toxicity of
methanol derived from aspartame has been discussed many times and it is concluded
that it is not possible for a human to ever consume enough aspartame in food products
to raise the blood formate concentrations to levels that induce any toxic effect [157].
Very recently, Špan l et al. have studied the influence of ambient exhaled air on the
concentration of trace compounds in exhaled breath [158], and these studies have
revealed that the exhaled concentration of methanol is not significantly influenced by its
inhaled concentration. Breath methanol concentration has recently been monitored in
patients with esophago-gastric cancer and was found to be statistically significantly
different between a cancer cohort and a healthy control group [159].
4.3.6 Ethanol
Ethanol is produced in human both in the mouth and by gut bacteria [128].
Mouth-exhaled ethanol has previously been measured by Diskin et al. [160] in five
volunteers and the concentration ranged from 0-380 ppbv. The study that was carried
out in 2007 monitored the mouth-exhaled breath of volunteers from the different age
groups with the following results: young adults (median 317 ppbv), adults (median
638 ppbv) and over 60 (median 1080 ppbv) [124]. Breath analysis of ethanol resulting
from the ingestion of alcoholic beverages is routinely used in forensic practice. The
detailed kinetics of ethanol decay in mouth- and nose-exhaled breath has been studied
using SIFT-MS analyses of direct breath following varying doses of alcohol. It is seen
that the ethanol concentration in nose-exhaled breath is generally much lower than in
mouth-exhaled breath. The rate at which ethanol decreases in the exhaled breath
following the ingestion of a water/ethanol solution was described as the net result of a
several processes occurring in parallel:
50
a. The retention of the solution in the stomach for a time determined by the gastric
emptying rate. The current consensus is that ethanol is not absorbed into the blood
stream via the stomach wall.
b. Absorption of the ethanol from the intestine into the blood stream.
c. Removal of ethanol from the portal blood stream by metabolic processes in the
liver.
d. The dispersal rate of ethanol into the total body water (TBW) and its partial
retention.
e. Continuous metabolism by ethanol in the general circulation, chiefly in the liver.
4.3.7 Isoprene
The biochemical origin of isoprene in human breath is usually considered to be a
side product of cholesterol biosynthesis via the melavonic acid pathway [161-163]. A
longitudinal study of breath isoprene of 30 volunteers using SIFT-MS has shown that
the mean concentration is typically 100 ppbv [163]. King et al. [164] have used
PTR-MS to monitor isoprene and also acetone profile during exercise. They have
observed that isoprene reacts very sensitively to changes in pulmonary ventilation,
because of its lipophilic character and a low Henry’s Law constant, and thus the very
fast effect which is visible in the breath during exercise is caused by pulmonary
exchange rather than by fluctuations in endogenous synthesis. A recent study [158] of
the influence of exogenous concentrations of specific compounds, including isoprene,
on exhaled concentrations of the same compounds, revealed that the exhaled end-tidal
concentration of isoprene is about three times lower than the concentration
corresponding to the equilibrium with blood.
4.3.8 Acetonitrile
It is known that acetonitrile together with benzene and other toxic exogenous
compounds is elevated in the exhaled breath of smokers, as was previously studied by
PTR-MS [165]. The mean concentration in non-smokers has been found to be
5.6 ± 1.9 ppbv, while that of smokers was significantly higher 69.3 ± 33.3 ppbv.
Interestingly, the concentration of acetonitrile in the breath of smokers decreased after
one week of abstinence from smoking to values similar to non-smokers.
51

Using SIFT-MS, acetonitrile was quantified in exhaled breath and urinary headspace
from several smokers and also non-smokers [166]. The study confirmed that acetonitrile
is detectable in breath and the urine headspace of smokers, but is practically absent for
non-smokers. The mean value in the breath of smokers was 69 ppbv ranging from
17 -124 ppbv, which is in very close agreement with the PTR-MS study.
52
5 Results and Discussion
The section “Results and Discussion” is divided in six subsections that
summarize or complement published work that I have worked on during my PhD study.
Each subsection thus represents comments on peer reviewed journals included in my
dissertation, having the objectives, methods, results and discussion and conclusions
5.1 Determination of rate constants and product ion branching ratios
Objectives
In this section, the details of studies carried out during the PhD project
concerning the ion chemistry of a group of esters and a group of hexanol isomers will be
discussed. The ion chemistry of these compounds and a provide step by step overview
of the whole experimental process starting from observed mass spectra and leading to
determination of the rate constants will be described. Predominantly, the material that
was not discussed in the research articles published in impacted peer reviewed journals,
as included in the Appendices A [167] and B [168], will be discussed. This section is
complementing and extending the published work rather than just summarising it. At
the onset it is useful to outline the motivation for the choice of compounds:
Selected ion flow tube, SIFT, studies of the reactions of H3O+, NO+ and O2+• with six
volatile phytogenic esters (see Appendix A)
The ion chemistry study of six volatile phytogenic esters (hexyl acetate,
phenethyl acetate, benzyl acetate, methyl salicylate, methyl benzoate and benzyl
benzoate) was a prelude to the plant physiology studies, which focused on
phytovolatilization (discussed in Section 5.5.1). These esters, together with methanol,
isoprene and terpenes, are some of the most ubiquitous natural volatiles. Plants release
these VOCs and also some inorganic volatile compounds (e.g. ammonia) to the
atmosphere during their growth and development. Some of these compounds are called
semiochemicals and play a role in communication between and among species and also
as a defence against herbivore enemies of the plants [169, 170].
53
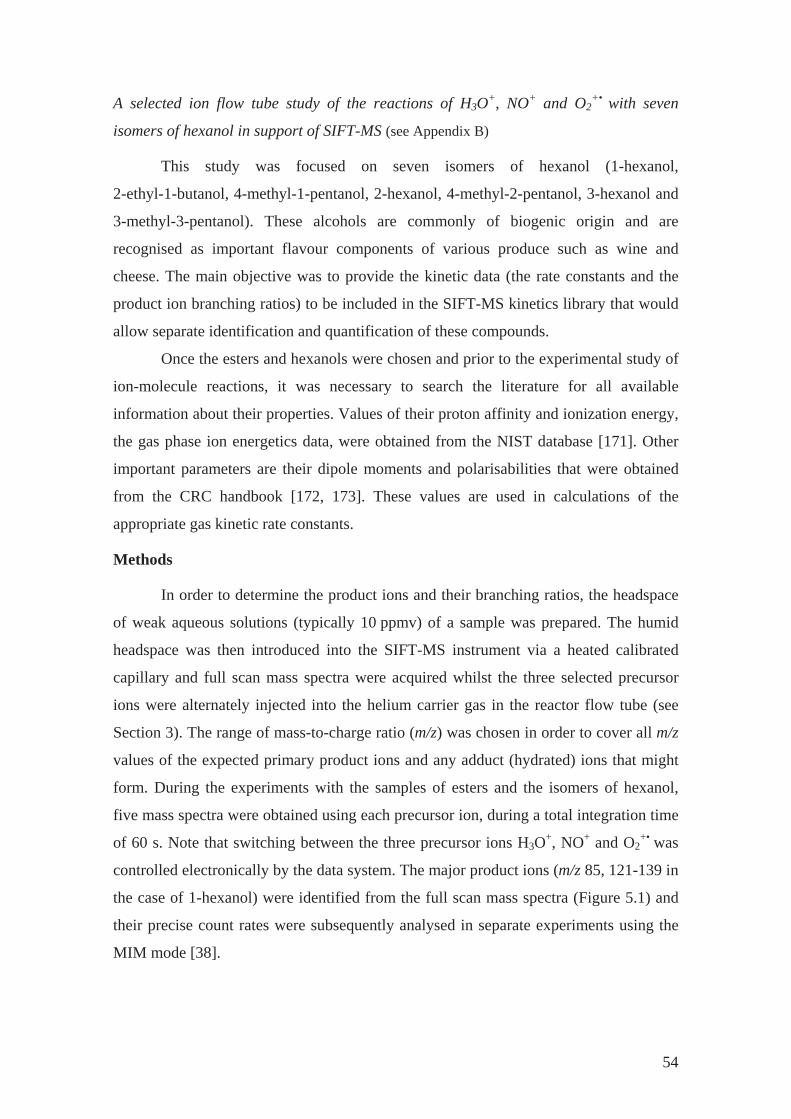
A selected ion flow tube study of the reactions of H3O+, NO+ and O2+• with seven
isomers of hexanol in support of SIFT-MS (see Appendix B)
This study was focused on seven isomers of hexanol (1-hexanol,
2-ethyl-1-butanol, 4-methyl-1-pentanol, 2-hexanol, 4-methyl-2-pentanol, 3-hexanol and
3-methyl-3-pentanol). These alcohols are commonly of biogenic origin and are
recognised as important flavour components of various produce such as wine and
cheese. The main objective was to provide the kinetic data (the rate constants and the
product ion branching ratios) to be included in the SIFT-MS kinetics library that would
allow separate identification and quantification of these compounds.
Once the esters and hexanols were chosen and prior to the experimental study of
ion-molecule reactions, it was necessary to search the literature for all available
information about their properties. Values of their proton affinity and ionization energy,
the gas phase ion energetics data, were obtained from the NIST database [171]. Other
important parameters are their dipole moments and polarisabilities that were obtained
from the CRC handbook [172, 173]. These values are used in calculations of the
appropriate gas kinetic rate constants.
Methods
In order to determine the product ions and their branching ratios, the headspace
of weak aqueous solutions (typically 10 ppmv) of a sample was prepared. The humid
headspace was then introduced into the SIFT-MS instrument via a heated calibrated
capillary and full scan mass spectra were acquired whilst the three selected precursor
ions were alternately injected into the helium carrier gas in the reactor flow tube (see
Section 3). The range of mass-to-charge ratio (m/z) was chosen in order to cover all m/z
values of the expected primary product ions and any adduct (hydrated) ions that might
form. During the experiments with the samples of esters and the isomers of hexanol,
five mass spectra were obtained using each precursor ion, during a total integration time
of 60 s. Note that switching between the three precursor ions H3O+, NO+ and O2+• was
controlled electronically by the data system. The major product ions (m/z 85, 121-139 in
the case of 1-hexanol) were identified from the full scan mass spectra (Figure 5.1) and
their precise count rates were subsequently analysed in separate experiments using the
MIM mode [38].
54
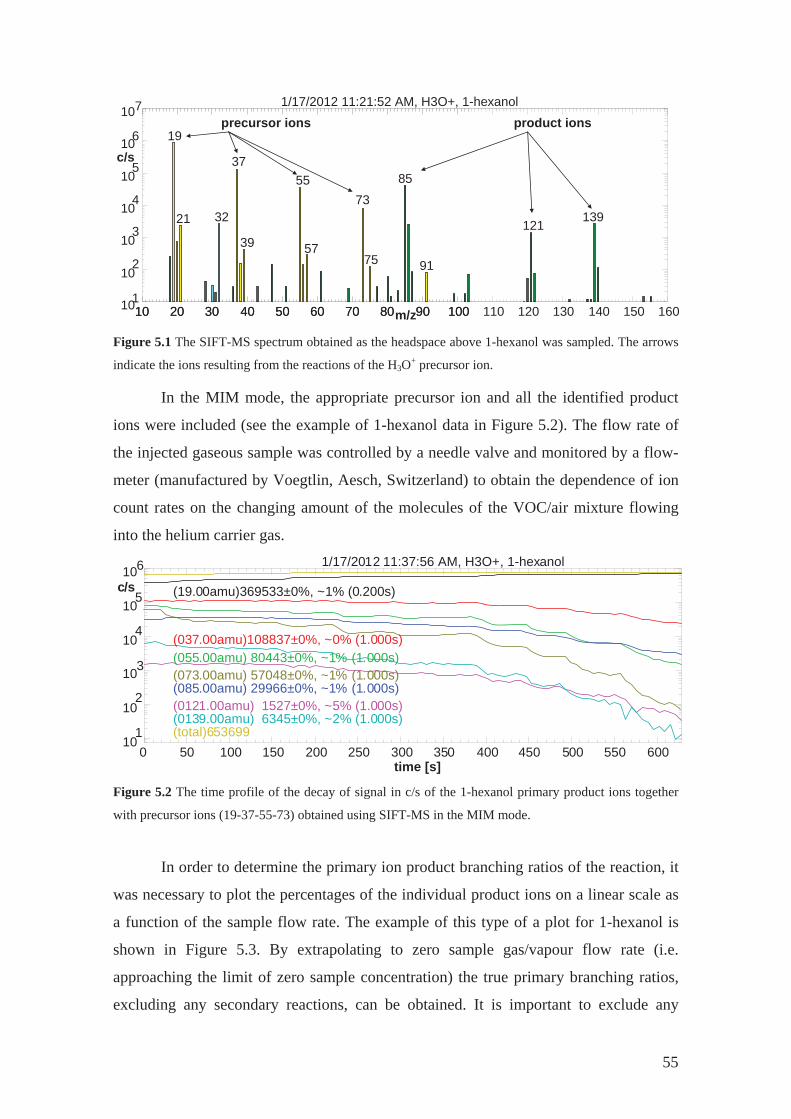
10 20 30 40 50 60 70 80 90 10010 20 30 40 50 60 70 80 90 100 110 120 130 140 150 160101
102
103
104
105
106
107
c/s
m/z
1/17/2012 11:21:52 AM, H3O+, 1-hexanol
19
21 32
37
39
55
57
73
75
85
91
121139
precursor ions product ions
Figure 5.1 The SIFT-MS spectrum obtained as the headspace above 1-hexanol was sampled. The arrows
indicate the ions resulting from the reactions of the H3O+ precursor ion.
In the MIM mode, the appropriate precursor ion and all the identified product
ions were included (see the example of 1-hexanol data in Figure 5.2). The flow rate of
the injected gaseous sample was controlled by a needle valve and monitored by a flow-
meter (manufactured by Voegtlin, Aesch, Switzerland) to obtain the dependence of ion
count rates on the changing amount of the molecules of the VOC/air mixture flowing
into the helium carrier gas.
0 50 100 150 200 250 300 350 400 450 500 550 60010
1
102
103
104
105
106c/s
time [s]
1/17/2012 11:37:56 AM, H3O+, 1-hexanol
(19.00amu)369533±0%, ~1% (0.200s)
(037.00amu)108837±0%, ~0% (1.000s)(055.00amu) 80443±0%, ~1% (1.000s)(073.00amu) 57048±0%, ~1% (1.000s)(085.00amu) 29966±0%, ~1% (1.000s)(0121.00amu) 1527±0%, ~5% (1.000s)(0139.00amu) 6345±0%, ~2% (1.000s)(total)653699
Figure 5.2 The time profile of the decay of signal in c/s of the 1-hexanol primary product ions together
with precursor ions (19-37-55-73) obtained using SIFT-MS in the MIM mode.
In order to determine the primary ion product branching ratios of the reaction, it
was necessary to plot the percentages of the individual product ions on a linear scale as
a function of the sample flow rate. The example of this type of a plot for 1-hexanol is
shown in Figure 5.3. By extrapolating to zero sample gas/vapour flow rate (i.e.
approaching the limit of zero sample concentration) the true primary branching ratios,
excluding any secondary reactions, can be obtained. It is important to exclude any
55
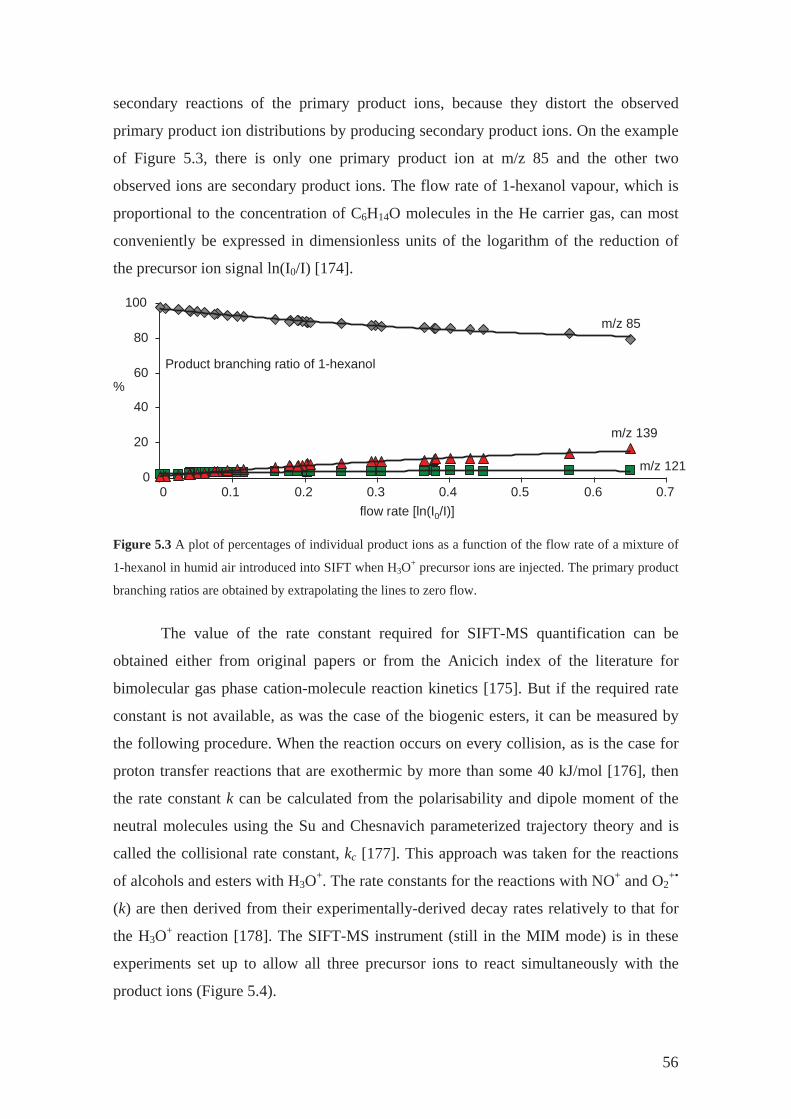
secondary reactions of the primary product ions, because they distort the observed
primary product ion distributions by producing secondary product ions. On the example
of Figure 5.3, there is only one primary product ion at m/z 85 and the other two
observed ions are secondary product ions. The flow rate of 1-hexanol vapour, which is
proportional to the concentration of C6H14O molecules in the He carrier gas, can most
conveniently be expressed in dimensionless units of the logarithm of the reduction of
the precursor ion signal ln(I0/I) [174].
Product branching ratio of 1-hexanol
0
20
40
60
80
100
0 0.1 0.2 0.3 0.4 0.5 0.6 0.7flow rate [ln(I0/I)]
m/z 85
m/z 121
m/z 139
%
Figure 5.3 A plot of percentages of individual product ions as a function of the flow rate of a mixture of
1-hexanol in humid air introduced into SIFT when H3O+ precursor ions are injected. The primary product
branching ratios are obtained by extrapolating the lines to zero flow.
The value of the rate constant required for SIFT-MS quantification can be
obtained either from original papers or from the Anicich index of the literature for
bimolecular gas phase cation-molecule reaction kinetics [175]. But if the required rate
constant is not available, as was the case of the biogenic esters, it can be measured by
the following procedure. When the reaction occurs on every collision, as is the case for
proton transfer reactions that are exothermic by more than some 40 kJ/mol [176], then
the rate constant k can be calculated from the polarisability and dipole moment of the
neutral molecules using the Su and Chesnavich parameterized trajectory theory and is
called the collisional rate constant, kc [177]. This approach was taken for the reactions
of alcohols and esters with H3O+. The rate constants for the reactions with NO+ and O2+•
(k) are then derived from their experimentally-derived decay rates relatively to that for
the H3O+ reaction [178]. The SIFT-MS instrument (still in the MIM mode) is in these
experiments set up to allow all three precursor ions to react simultaneously with the
product ions (Figure 5.4).
56
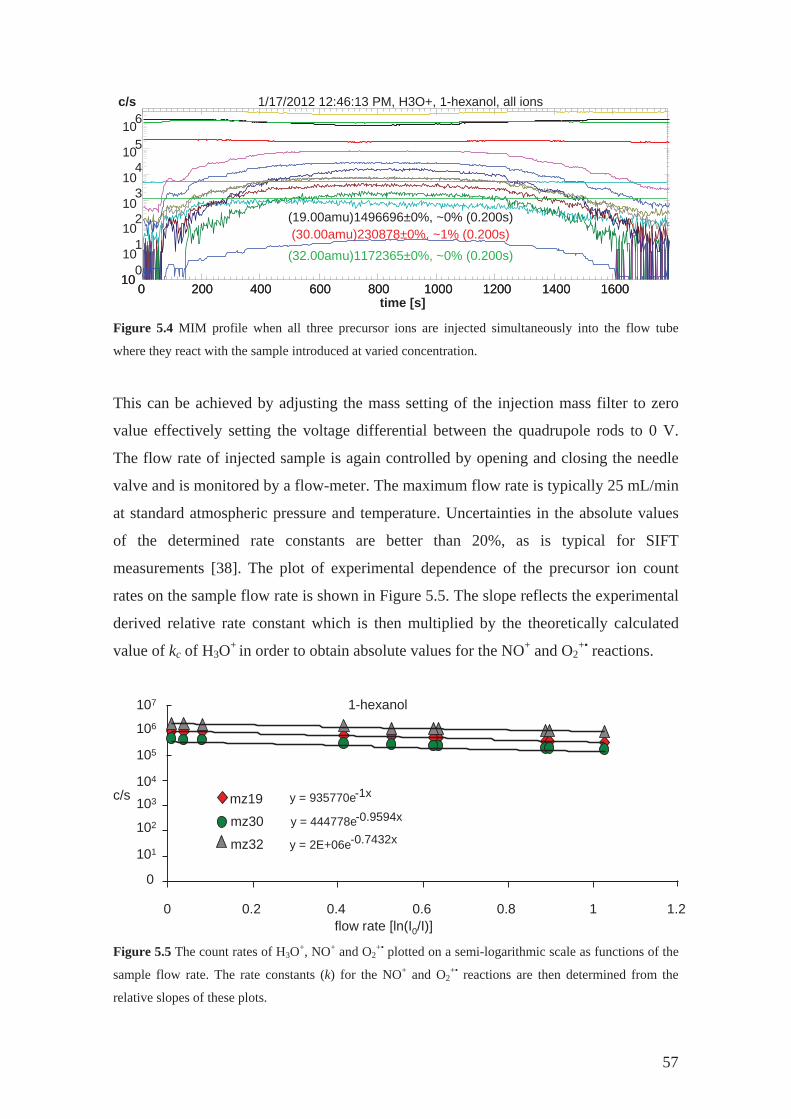
0 200 400 600 800 1000 1200 1400 160010
0 200 400 600 800 1000 1200 1400 160010
010
110
210
310
4105106
c/s
time [s]
1/17/2012 12:46:13 PM, H3O+, 1-hexanol, all ions
(19.00amu)1496696±0%, ~0% (0.200s)(30.00amu)230878±0%, ~1% (0.200s)
(32.00amu)1172365±0%, ~0% (0.200s)
Figure 5.4 MIM profile when all three precursor ions are injected simultaneously into the flow tube
where they react with the sample introduced at varied concentration.
This can be achieved by adjusting the mass setting of the injection mass filter to zero
value effectively setting the voltage differential between the quadrupole rods to 0 V.
The flow rate of injected sample is again controlled by opening and closing the needle
valve and is monitored by a flow-meter. The maximum flow rate is typically 25 mL/min
at standard atmospheric pressure and temperature. Uncertainties in the absolute values
of the determined rate constants are better than 20%, as is typical for SIFT
measurements [38]. The plot of experimental dependence of the precursor ion count
rates on the sample flow rate is shown in Figure 5.5. The slope reflects the experimental
derived relative rate constant which is then multiplied by the theoretically calculated
value of kc of H3O+ in order to obtain absolute values for the NO+ and O2+• reactions.
c/s
flow rate [ln(I0/I)]
1-hexanol
y = 444778e-0.9594x
y = 2E+06e-0.7432x
y = 935770e-1x
0
101
0 0.2 0.4 0.6 0.8 1 1.2
mz19
mz30
mz32102
103
104
105
106
107
Figure 5.5 The count rates of H3O+, NO+ and O2
+• plotted on a semi-logarithmic scale as functions of the
sample flow rate. The rate constants (k) for the NO+ and O2+• reactions are then determined from the
relative slopes of these plots.
57
Results and Discussion
This Section presents complementary results, which were not explicitly included
in the manuscripts in Appendices A and B. Predominantly, these are examples of mass
spectra of the six volatiles phytogenic esters reacting with all three precursors and O2+•
spectra of isomers of hexanol. Product ions resulting from the ion-molecule reactions
are described in the following text. Note that the detailed procedure and an example of
the three-body rate constant calculation is described in the Appendix A together with an
example of the optimization procedure of the kinetics library entry for the case of
overlapping product ions in the spectra.
1. Esters
The major ion products of the H3O+ reactions with esters are the protonated
molecules, MH+, but minor channels involving fragmentation are also evident (see
Figure 5.6a-f). These reactions are the results of water molecule elimination and alcohol
molecule elimination. The mass spectra were interpreted as follows:
Five ion products (three primary ions and two ions formed by secondary
association with H2O) are formed in the reaction of hexyl acetate (MW
144) with H3O+ (Figure 5.6a) with the different product branching ratio
(in parenthesis): the protonated molecule and its water cluster at m/z 145
and 163 (77%), an ion fragment C6H13+ ion at m/z 85 (7%), a fragment
and its hydrate at m/z 61 (acetic acid) and 79 (16%).
Benzyl acetate (MW 150) (Figure 5.6b) forms a major product ion at
m/z 91 (86%), being interpreted as the tropylium ion, and as a minor
channel the protonated molecule and its water cluster at m/z 151 and 169.
The H3O+ reaction with phenethyl acetate (MW 164) (Figure 5.6c)
produces the ion at m/z 105 (80%) and again, as in the case of hexyl
acetate, an acetic acid molecule and its hydrate (m/z 61 and 79) and the
protonated molecular ion and its hydrate at m/z 165 and 183. Note that
product ions at m/z 61-79 were not included in Table 3 in Appendix A,
because their product branching ratio was less than 5 % as was also
explained in the manuscript.
Methyl salicylate (MW 152) reacts with H3O+ forming the protonated
molecule as the only ion product m/z 153 and this ion surprisingly does
58
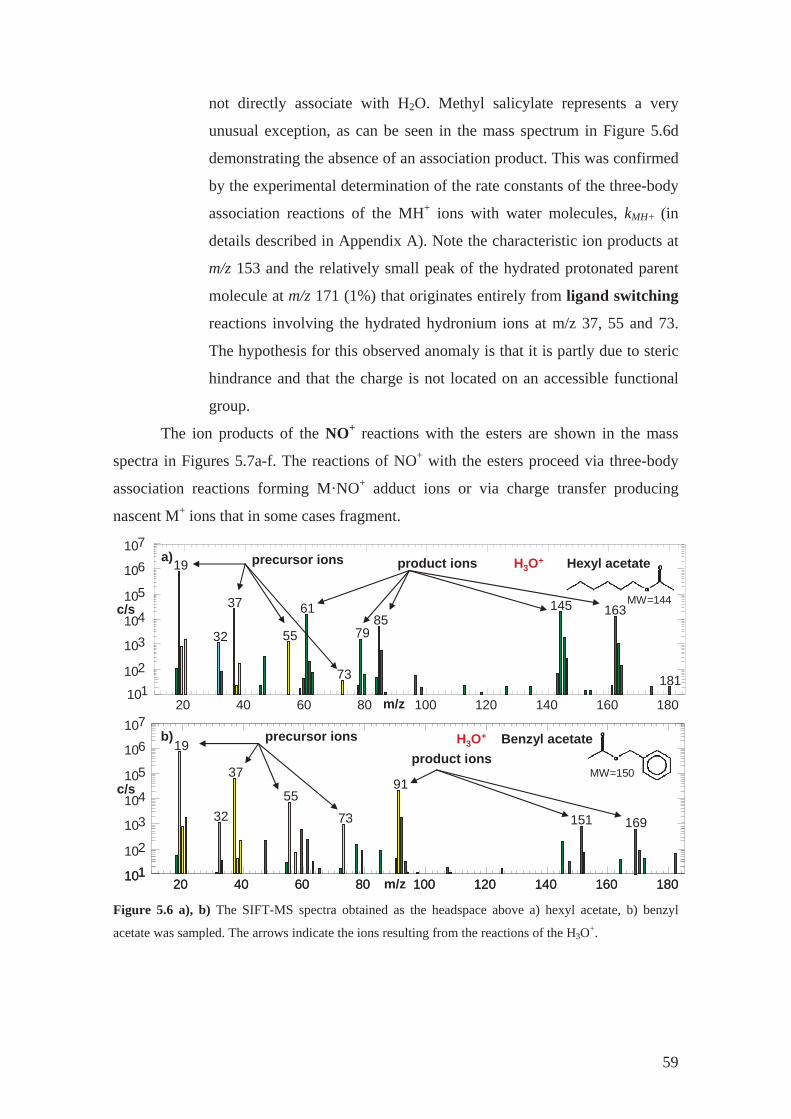
not directly associate with H2O. Methyl salicylate represents a very
unusual exception, as can be seen in the mass spectrum in Figure 5.6d
demonstrating the absence of an association product. This was confirmed
by the experimental determination of the rate constants of the three-body
association reactions of the MH+ ions with water molecules, kMH+ (in
details described in Appendix A). Note the characteristic ion products at
m/z 153 and the relatively small peak of the hydrated protonated parent
molecule at m/z 171 (1%) that originates entirely from ligand switching
reactions involving the hydrated hydronium ions at m/z 37, 55 and 73.
The hypothesis for this observed anomaly is that it is partly due to steric
hindrance and that the charge is not located on an accessible functional
group.
The ion products of the NO+ reactions with the esters are shown in the mass
spectra in Figures 5.7a-f. The reactions of NO+ with the esters proceed via three-body
association reactions forming M·NO+ adduct ions or via charge transfer producing
nascent M+ ions that in some cases fragment.
20 40 60 80 100 120 140 160 180101102
103104105
106107
c/s
m/z
H3O+ Hexyl acetate19
32
37
55
61
73
7985
145 163
181
precursor ions product ionsa)
MW=144
20 40 60 80 100 120 140 160 18010120 40 60 80 100 120 140 160 180101
102
103104105
106107
c/s
m/z
H3O+ Benzyl acetate19
32
37
55
73
91
151 169
precursor ionsproduct ions
b)
MW=150
Figure 5.6 a), b) The SIFT-MS spectra obtained as the headspace above a) hexyl acetate, b) benzyl
acetate was sampled. The arrows indicate the ions resulting from the reactions of the H3O+.
59
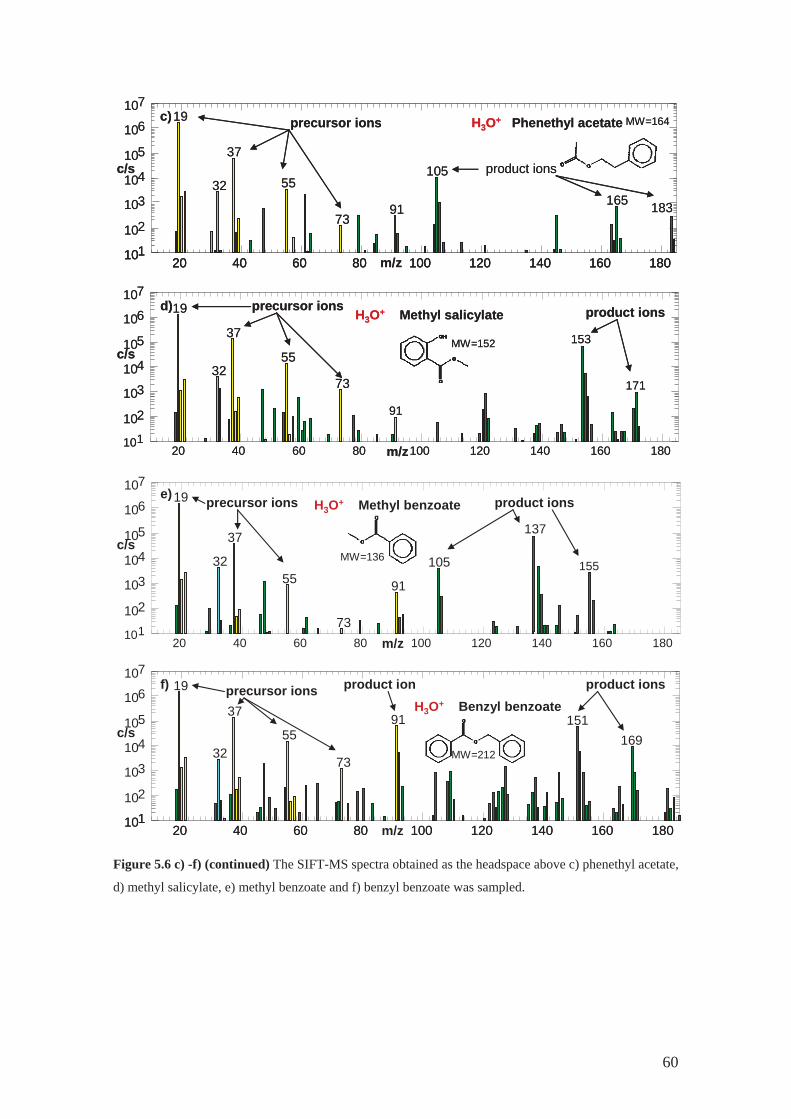
20 40 60 80 100 120 140 160 180101102
103104105
106107
c/s
m/z
H3O+ Phenethyl acetate19
32
37
55
7391
105
165 183
precursor ions
product ions
c) MW=164
20 40 60 80 100 120 140 160 18010120 40 60 80 100 120 140 160 180101
102
103104105
106107
c/s
m/z
Phenethyl acetateH3O+19
32
37
55
7391
105
165 183
precursor ions
product ions
c) MW=164
20 40 60 80 100 120 140 160 180101102
103104105
106107
c/s
m/z
H3O+ Methyl salicylate19
32
37
55
73
91
153
171
precursor ions product ionsd)
MW=152
20 40 60 80 100 120 140 160 180101102
103104105
106107
c/s
m/z
Methyl salicylateH3O+19
32
37
55
73
91
153
171
precursor ions product ionsd)
MW=152
20 40 60 80 100 120 140 160 180101102
103104105
106107
c/s
m/z
H3O+ Methyl benzoate19
32
37
55
73
91
105
137
155
precursor ions product ionse)
MW=136
20 40 60 80 100 120 140 160 18010120 40 60 80 100 120 140 160 180101
102
103104105
106107
c/s
m/z
H3O+ Benzyl benzoate19
32
37
55
73
91 151169
product ionprecursor ions product ionsf)
MW=212
Figure 5.6 c) -f) (continued) The SIFT-MS spectra obtained as the headspace above c) phenethyl acetate,
d) methyl salicylate, e) methyl benzoate and f) benzyl benzoate was sampled.
60
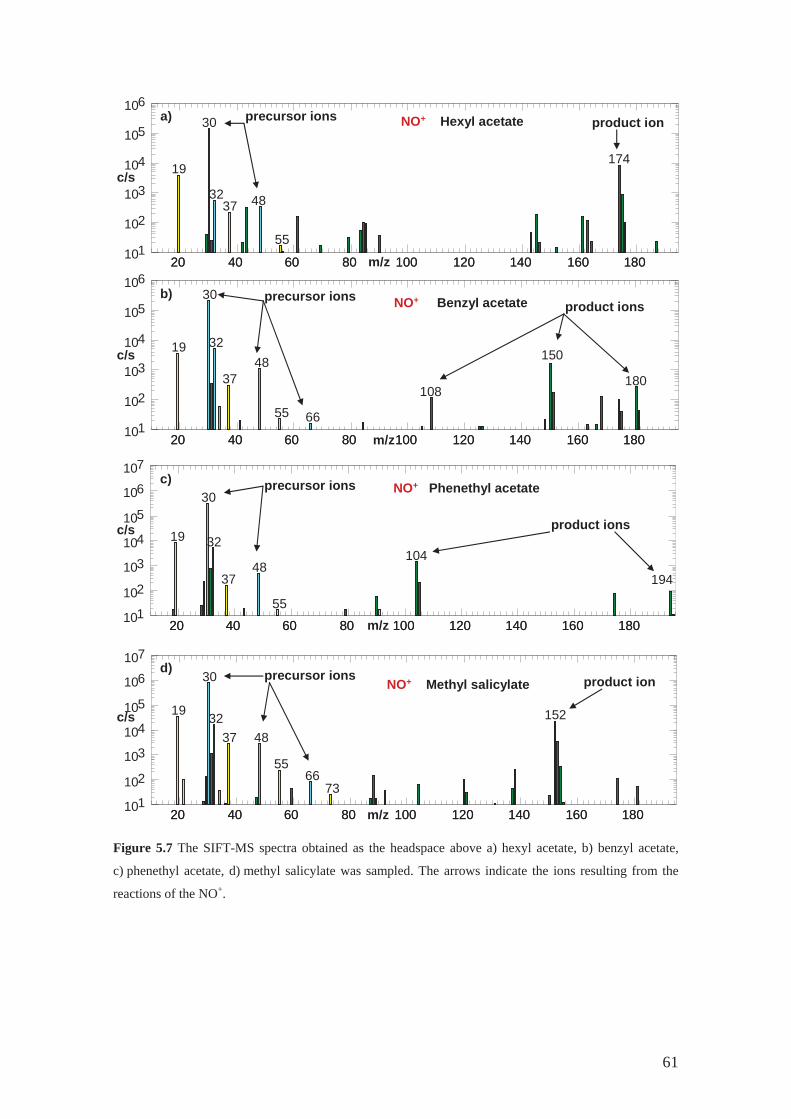
precursor ions
20 40 60 80 100 120 140 160 18020 40 60 80 100 120 140 160 180101
102
103
104
105
106
c/s
m/z
NO+ Hexyl acetate
19
30
3237
55
174
48
product iona)
20 40 60 80 100 120 140 160 18020 40 60 80 100 120 140 160 180101
102
103
104
105
106
c/s
m/z
NO+ Benzyl acetate
19
30
32
3748
55 66
108
150
180
precursor ionsproduct ions
b)
NO+ Phenethyl acetate
20 40 60 80 100 120 140 160 18020 40 60 80 100 120 140 160 180101102
103104105
106107
c/s
m/z
19
30
32
3748
55
104
194
precursor ions
product ions
c)
NO+ Methyl salicylate
20 40 60 80 100 120 140 160 18020 40 60 80 100 120 140 160 180101102
103104105
106107
c/s
m/z
19
30
3237 48
5566
73
152
precursor ions product iond)
Figure 5.7 The SIFT-MS spectra obtained as the headspace above a) hexyl acetate, b) benzyl acetate,
c) phenethyl acetate, d) methyl salicylate was sampled. The arrows indicate the ions resulting from the
reactions of the NO+.
61
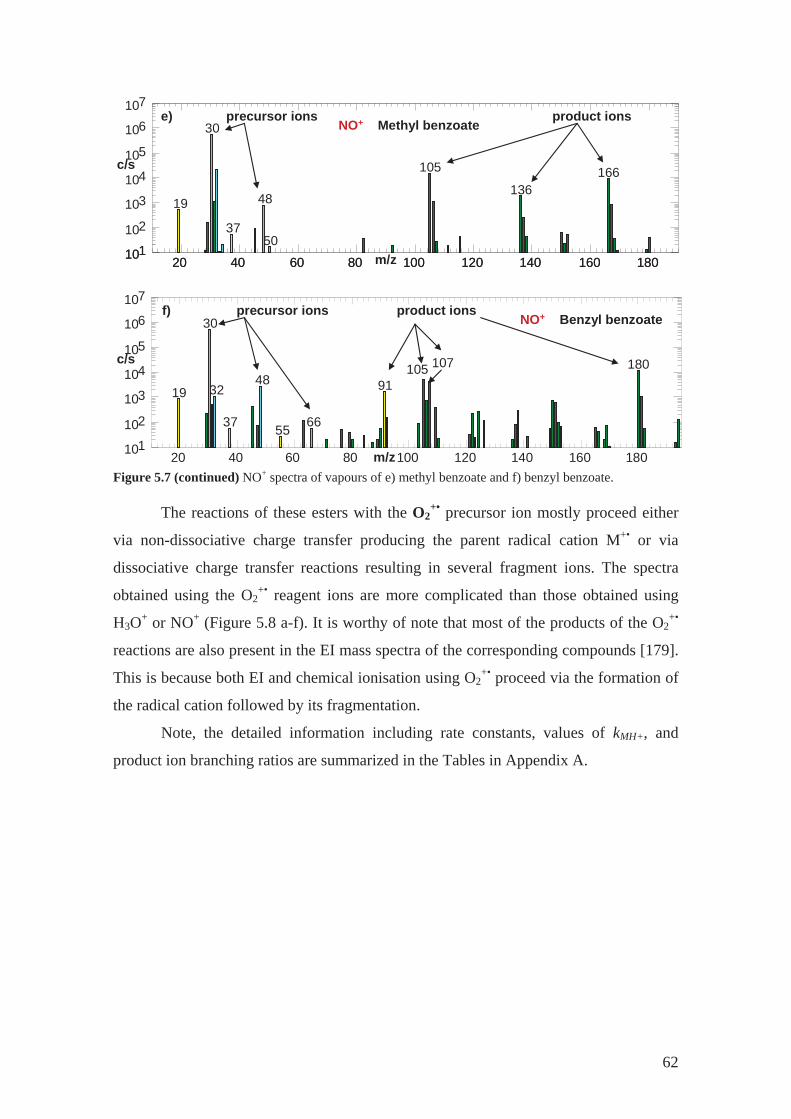
NO+ Methyl benzoateprecursor ions
20 40 60 80 100 120 140 160 18010120 40 60 80 100 120 140 160 180101
102
103104105
106107
c/s
m/z
19
30
37
48
50
105
136166
e) product ions
NO+ Benzyl benzoate
20 40 60 80 100 120 140 160 180101102
103104105
106107
c/s
m/z
19
30
32
37
48
55 66
91105 180
precursor ions product ions
107
f)
Figure 5.7 (continued) NO+ spectra of vapours of e) methyl benzoate and f) benzyl benzoate.
The reactions of these esters with the O2+• precursor ion mostly proceed either
via non-dissociative charge transfer producing the parent radical cation M+• or via
dissociative charge transfer reactions resulting in several fragment ions. The spectra
obtained using the O2+• reagent ions are more complicated than those obtained using
H3O+ or NO+ (Figure 5.8 a-f). It is worthy of note that most of the products of the O2+•
reactions are also present in the EI mass spectra of the corresponding compounds [179].
This is because both EI and chemical ionisation using O2+• proceed via the formation of
the radical cation followed by its fragmentation.
Note, the detailed information including rate constants, values of kMH+, and
product ion branching ratios are summarized in the Tables in Appendix A.
62
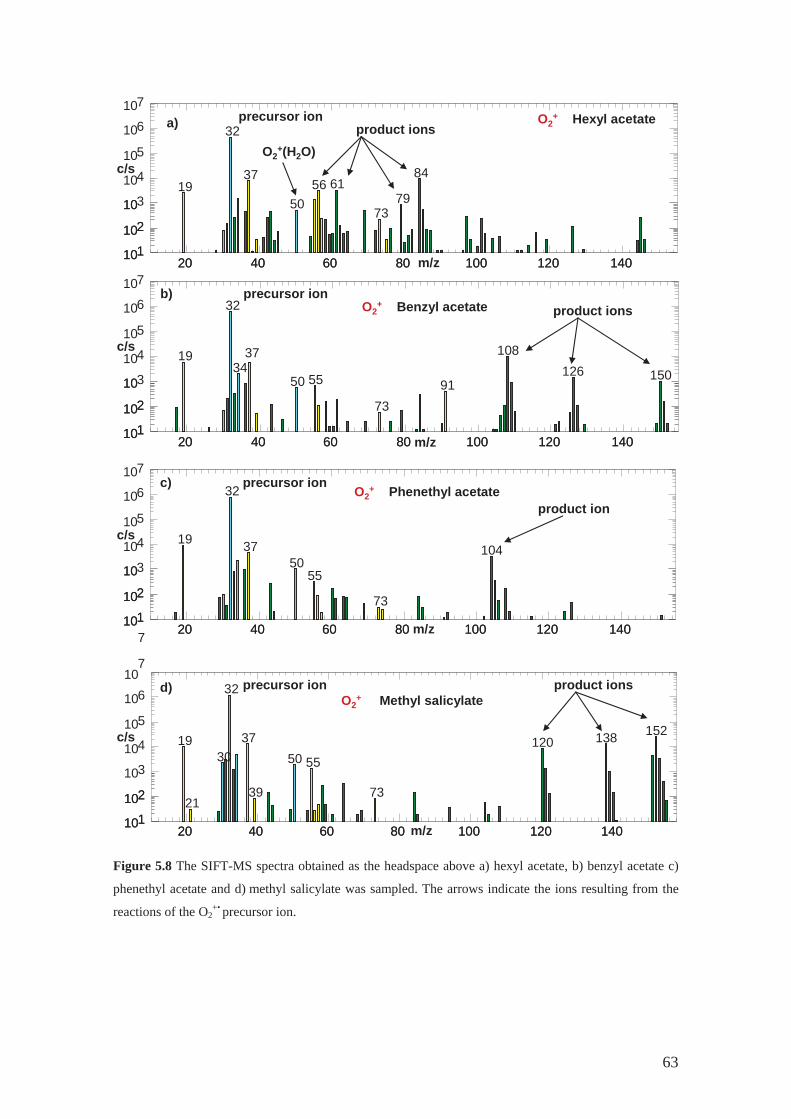
O2+ Hexyl acetateprecursor ion
product ionsa)
20 40 60 80 100 120 140101102
10
20 40 60 80 100 120 140101102
103104105
106107
c/s
m/z
19
32
37
5056 61
7379
84O2
+(H2O)
20 40 60 80 100 120 140101102
10
20 40 60 80 100 120 140101102
103104105
106107
c/s
m/z
19
32
3450 55
7391
108126 150
O2+ Benzyl acetate
precursor ionproduct ions
37
b)
20 40 60 80 100 120 140101102
10
20 40 60 80 100 120 140101102
103104105
106107
c/s
m/z
19
32
3750
55
73
104
c) precursor ionO2
+ Phenethyl acetateproduct ion
7
O2+ Methyl salicylate
20 40 60 80 100 120 140101102
20 40 60 80 100 120 140101102
103104105
10610
7
c/s
m/z
19
21
30
32
37
39
50 55
73
120 138 152
precursor ion product ionsd)
Figure 5.8 The SIFT-MS spectra obtained as the headspace above a) hexyl acetate, b) benzyl acetate c)
phenethyl acetate and d) methyl salicylate was sampled. The arrows indicate the ions resulting from the
reactions of the O2+• precursor ion.
63
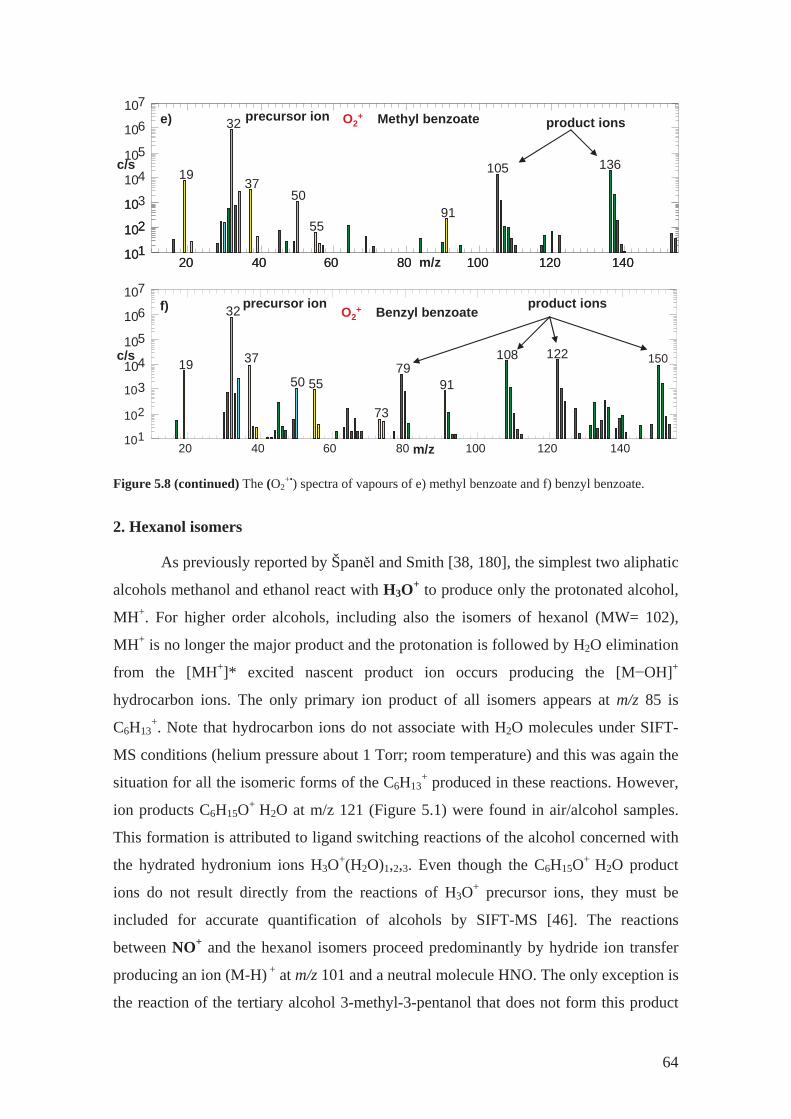
precursor ion product ionse) Methyl benzoateO2+
20 40 60 80 100 120 140101102
10
20 40 60 80 100 120 140101102
103104105
106107
c/s
m/z
19
32
3750
5591
105 136
O2+ Benzyl benzoate
20 40 60 80 100 120 140101
102
103104105
106107
c/s
m/z
19
32
37
50 55
73
7991
108 122 150
precursor ion product ionsf)
Figure 5.8 (continued) The (O2
+•) spectra of vapours of e) methyl benzoate and f) benzyl benzoate.
2. Hexanol isomers
As previously reported by Špan l and Smith [38, 180], the simplest two aliphatic
alcohols methanol and ethanol react with H3O+ to produce only the protonated alcohol,
MH+. For higher order alcohols, including also the isomers of hexanol (MW= 102),
MH+ is no longer the major product and the protonation is followed by H2O elimination
from the [MH+]* excited nascent product ion occurs producing the [M OH]+
hydrocarbon ions. The only primary ion product of all isomers appears at m/z 85 is
C6H13+. Note that hydrocarbon ions do not associate with H2O molecules under SIFT-
MS conditions (helium pressure about 1 Torr; room temperature) and this was again the
situation for all the isomeric forms of the C6H13+ produced in these reactions. However,
ion products C6H15O+ H2O at m/z 121 (Figure 5.1) were found in air/alcohol samples.
This formation is attributed to ligand switching reactions of the alcohol concerned with
the hydrated hydronium ions H3O+(H2O)1,2,3. Even though the C6H15O+ H2O product
ions do not result directly from the reactions of H3O+ precursor ions, they must be
included for accurate quantification of alcohols by SIFT-MS [46]. The reactions
between NO+ and the hexanol isomers proceed predominantly by hydride ion transfer
producing an ion (M-H) + at m/z 101 and a neutral molecule HNO. The only exception is
the reaction of the tertiary alcohol 3-methyl-3-pentanol that does not form this product
64
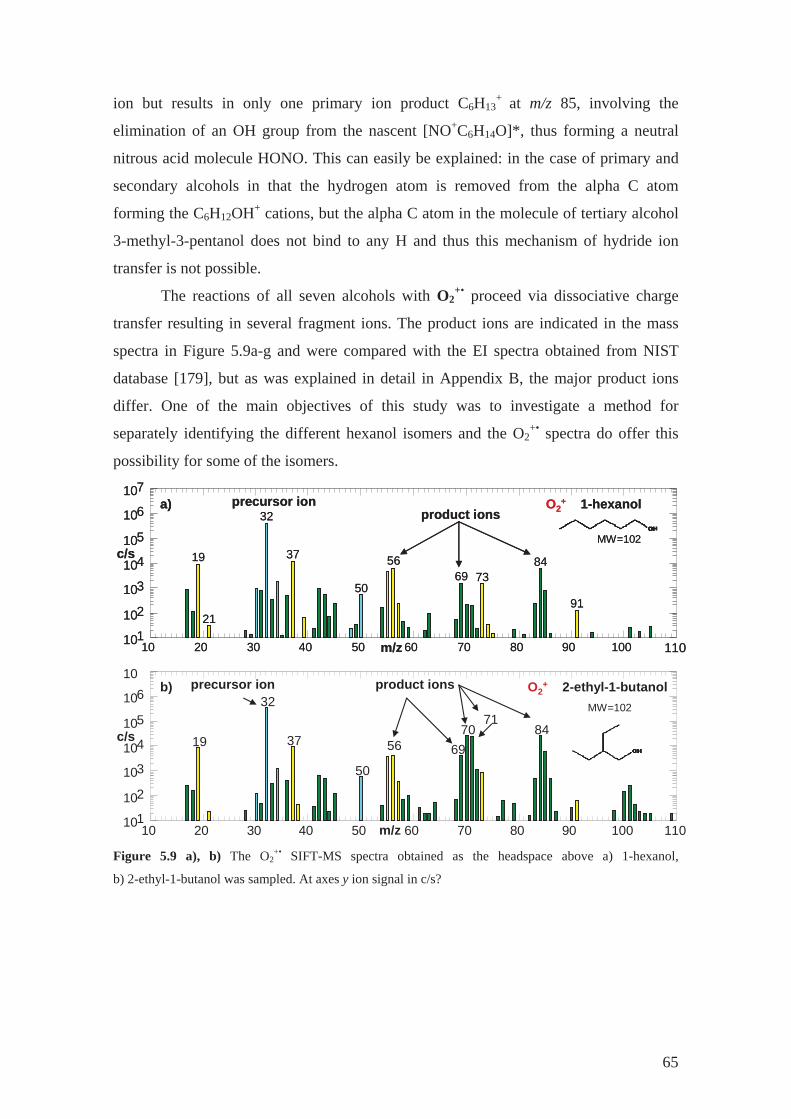
ion but results in only one primary ion product C6H13+ at m/z 85, involving the
elimination of an OH group from the nascent [NO+C6H14O]*, thus forming a neutral
nitrous acid molecule HONO. This can easily be explained: in the case of primary and
secondary alcohols in that the hydrogen atom is removed from the alpha C atom
forming the C6H12OH+ cations, but the alpha C atom in the molecule of tertiary alcohol
3-methyl-3-pentanol does not bind to any H and thus this mechanism of hydride ion
transfer is not possible.
The reactions of all seven alcohols with O2+• proceed via dissociative charge
transfer resulting in several fragment ions. The product ions are indicated in the mass
spectra in Figure 5.9a-g and were compared with the EI spectra obtained from NIST
database [179], but as was explained in detail in Appendix B, the major product ions
differ. One of the main objectives of this study was to investigate a method for
separately identifying the different hexanol isomers and the O2+• spectra do offer this
possibility for some of the isomers.
10 20 30 40 50 60 70 80 90 100 110101102
103104105
106107
c/s
m/z
19
21
32
37
50
5669 73
84
91
O2+ 1-hexanol
MW=102
product ionsprecursor iona)
10 20 30 40 50 60 70 80 90 100 110101102
103104105
106107
c/s
m/z
19
21
32
37
50
5669 73
84
91
1-hexanolO2+
MW=102
product ionsprecursor iona)
10 20 30 40 50 60 70 80 90 100 110101102
103104105
10610
c/s
m/z
19
32
37
50
56 6970 84
71
O2+ 2-ethyl-1-butanol
MW=102
precursor ion product ionsb)
Figure 5.9 a), b) The O2
+• SIFT-MS spectra obtained as the headspace above a) 1-hexanol,
b) 2-ethyl-1-butanol was sampled. At axes y ion signal in c/s?
65
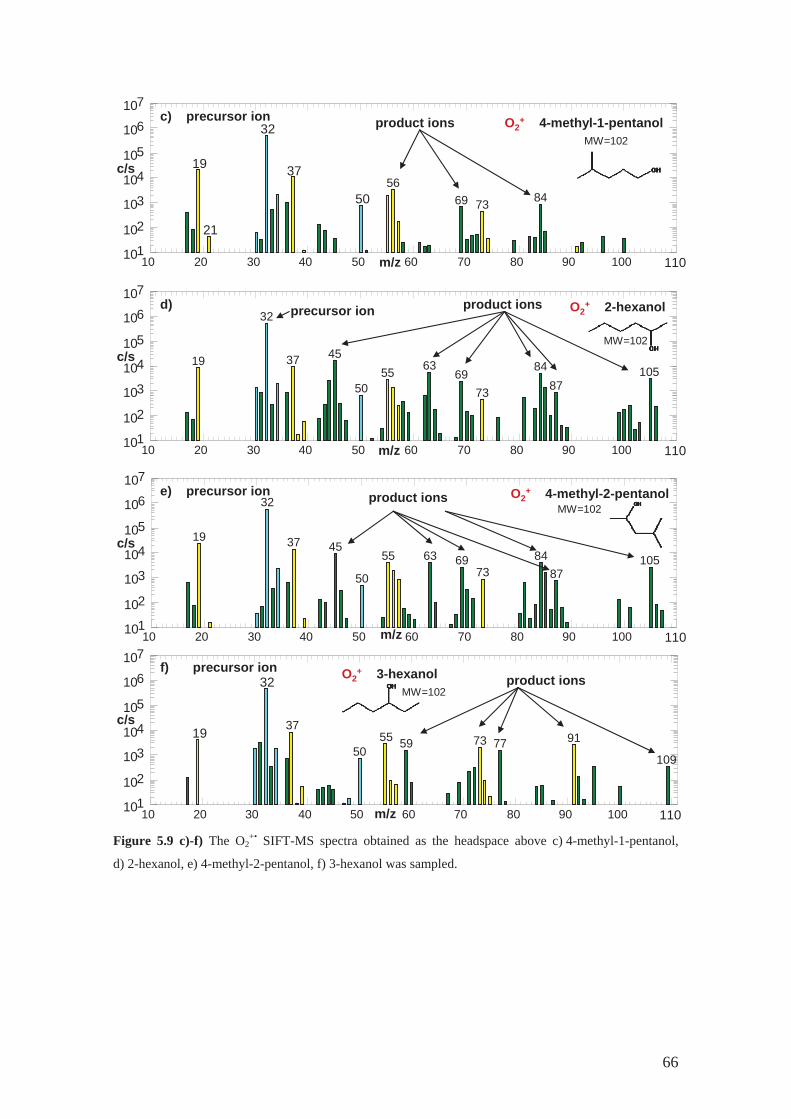
10 20 30 40 50 60 70 80 90 100 110101102
103104105
106107
c/s
m/z
19
21
32
37
5056
69 73 84
c) precursor ion product ions 4-methyl-1-pentanolMW=102
O2+
10 20 30 40 50 60 70 80 90 100 110101102
103104105
106107
c/s
m/z
19
32
37 45
5055 63
6973
8487
105
O2+ 2-hexanolproduct ionsd)
MW=102
precursor ion
10 20 30 40 50 60 70 80 90 100 110101102
103104105
106107
c/s
m/z
19
32
37 45
50
55 63 6973
8487
105
O2+ 4-methyl-2-pentanolproduct ionsprecursor ion
MW=102e)
10 20 30 40 50 60 70 80 90 100 110101102
103104105
106107
c/s
m/z
19
32
37
5055 59 73 77 91
109
O2+ 3-hexanol product ions
MW=102
precursor ionf)
Figure 5.9 c)-f) The O2
+• SIFT-MS spectra obtained as the headspace above c) 4-methyl-1-pentanol,
d) 2-hexanol, e) 4-methyl-2-pentanol, f) 3-hexanol was sampled.
66
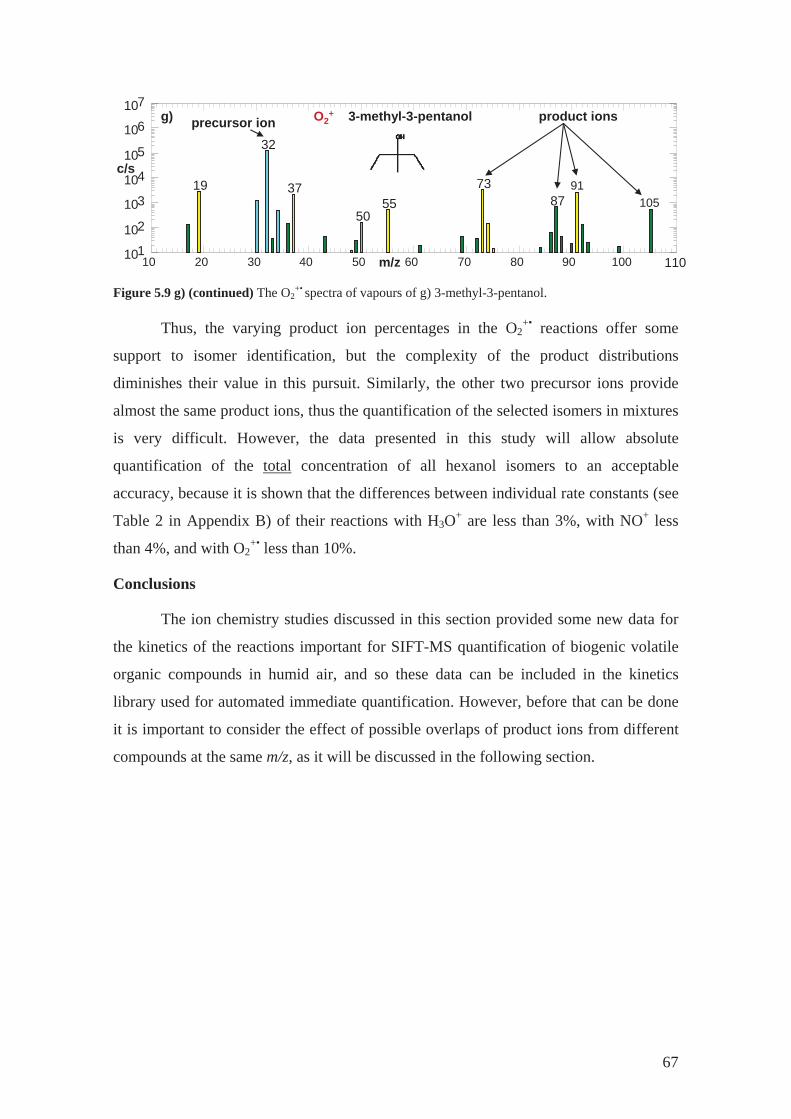
10 20 30 40 50 60 70 80 90 100 110101102
103104105
106107
c/s
m/z
19
32
37
5055
7387
91105
g) O2+ 3-methyl-3-pentanol product ionsprecursor ion
Figure 5.9 g) (continued) The O2+• spectra of vapours of g) 3-methyl-3-pentanol.
Thus, the varying product ion percentages in the O2
+• reactions offer some
support to isomer identification, but the complexity of the product distributions
diminishes their value in this pursuit. Similarly, the other two precursor ions provide
almost the same product ions, thus the quantification of the selected isomers in mixtures
is very difficult. However, the data presented in this study will allow absolute
quantification of the total concentration of all hexanol isomers to an acceptable
accuracy, because it is shown that the differences between individual rate constants (see
Table 2 in Appendix B) of their reactions with H3O+ are less than 3%, with NO+ less
than 4%, and with O2+• less than 10%.
Conclusions
The ion chemistry studies discussed in this section provided some new data for
the kinetics of the reactions important for SIFT-MS quantification of biogenic volatile
organic compounds in humid air, and so these data can be included in the kinetics
library used for automated immediate quantification. However, before that can be done
it is important to consider the effect of possible overlaps of product ions from different
compounds at the same m/z, as it will be discussed in the following section.
67
5.2 Construction and optimization of kinetics library
Concentrations of compounds in SIFT-MS analysis are calculated from the
ratios of count rates of characteristic product ions to the count rates of the precursor ion
using a library of kinetic data [46, 181]. The construction of such kinetics library entries
requires information about the appropriate precursor ions, the rate constants and the m/z
values of the characteristic product ions. An example of such kinetics data in the format
required for the SIFT-MS software was presented in Table 3.1. In the present section a
construction of more advanced entries accounting for overlaps of the product ions will
be shown for the six volatile phytogenic esters: hexyl acetate, phenethyl acetate, benzyl
acetate, methyl salicylate, methyl benzoate and benzyl benzoate. The fundamental
kinetics of the reactions of H3O+, NO+ and O2+• with these esters was discussed in the
previous Section 5.1. The results obtained can be used to construct an initial simple
version of the kinetics library entries as given in Table 5.1. For example, for hexyl
acetate the following details are given according to the format described in Section
3.2.6: appropriate precursor ion (H3O+), which means listing all four m/z values
including the H3O+ hydrates (19-37-55-73) together with the appropriate rate constant
obtained theoretically or derived experimentally; then the fp coefficient at the default
value of 1.0 (values other than 1.0 can be used to multiply the corresponding ion count
rates in order to optimize kinetics entries, as it will be shown below); then the number
of product ions (m/z 61, 79, 85, 145, 163) formed by primary and secondary ion-
molecular reactions with each m/z value followed by the default fi coefficient of 1.0.
It was then important to test the constructed kinetics library entries for the effect
of ion overlaps by analysing real samples. Thus, reference mixtures (at approximately
10 ppmv concentrations) of all six esters were analyzed subsequently in the MIM mode,
see Figure 5.10. As it can be seen, in this plot of concentrations calculated using the
kinetics library in Table 5.1, there is evidence of cross sensitivity between different
compounds. These validations of this initial library thus indicated m/z overlaps between
hexyl acetate and phenethyl acetate and also amongst the group of benzoates. Only
methyl salicylate was quantified without any signs of overlaps. The m/z overlaps
between hexyl acetate and phenethyl acetate related to the m/z 61 and 79 ions. To allow
selective measurements of the concentration of these esters, the kinetics library must be
optimised in order to minimise or avoid overlaps. To avoid this overlap problem, these
m/z values were excluded from the final kinetics library entry, because the product
68
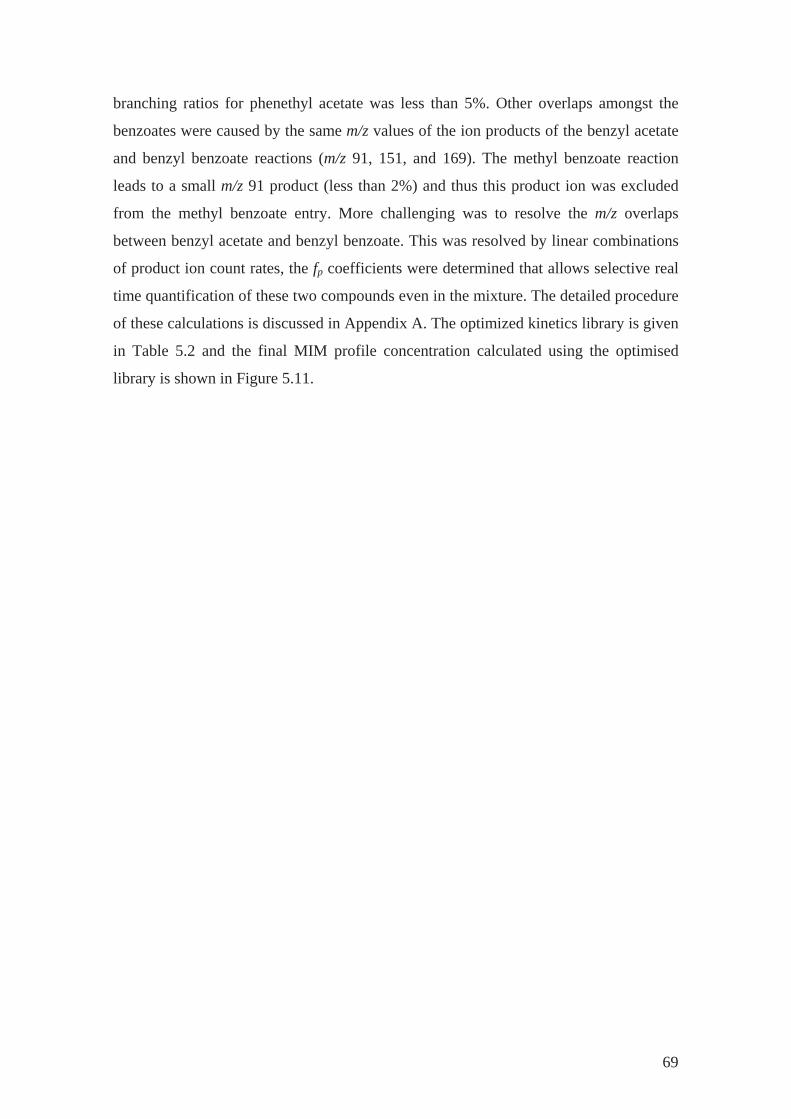
69
branching ratios for phenethyl acetate was less than 5%. Other overlaps amongst the
benzoates were caused by the same m/z values of the ion products of the benzyl acetate
and benzyl benzoate reactions (m/z 91, 151, and 169). The methyl benzoate reaction
leads to a small m/z 91 product (less than 2%) and thus this product ion was excluded
from the methyl benzoate entry. More challenging was to resolve the m/z overlaps
between benzyl acetate and benzyl benzoate. This was resolved by linear combinations
of product ion count rates, the fp coefficients were determined that allows selective real
time quantification of these two compounds even in the mixture. The detailed procedure
of these calculations is discussed in Appendix A. The optimized kinetics library is given
in Table 5.2 and the final MIM profile concentration calculated using the optimised
library is shown in Figure 5.11.
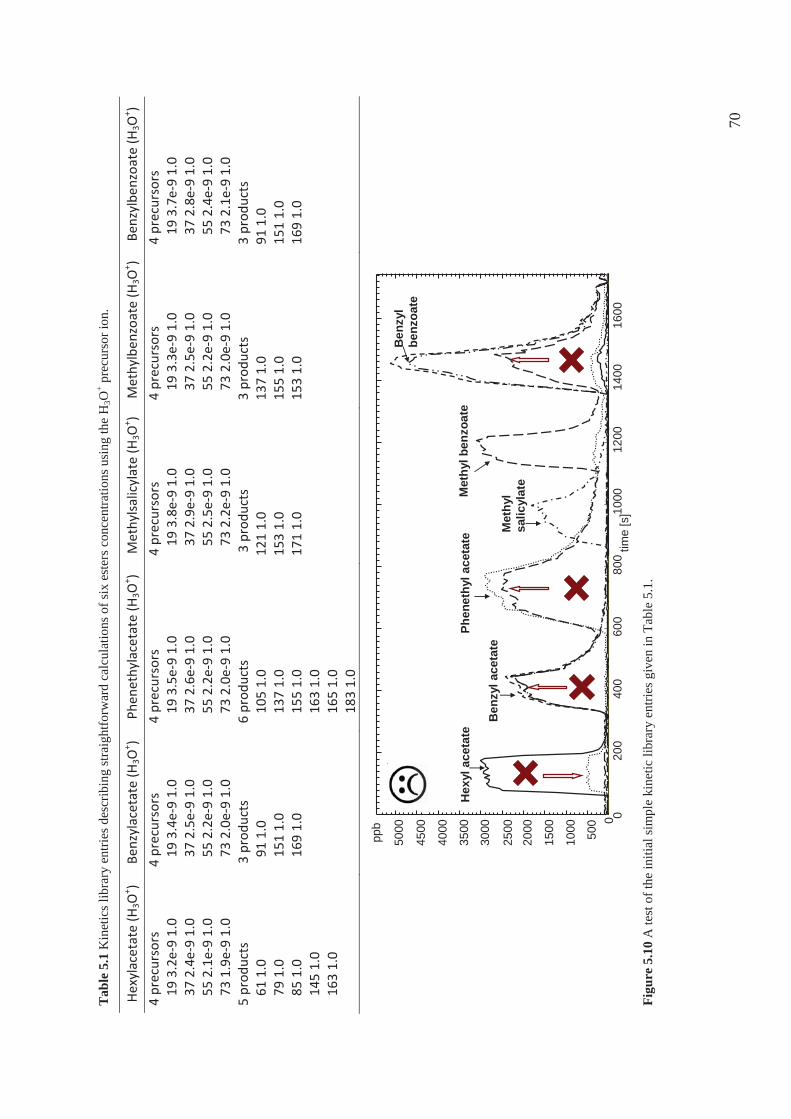
Tab
le 5
.1 K
inet
ics l
ibra
ry e
ntrie
s des
crib
ing
stra
ight
forw
ard
calc
ulat
ions
of s
ix e
ster
s con
cent
ratio
ns u
sing
the
H3O
+ pre
curs
or io
n.
Hexylacetate
(H3O
+ )Be
nzylacetate(H
3O+ )
Phen
ethylacetate
(H3O
+ )Methylsa
licylate(H
3O+ )
Methylben
zoate(H
3O+ )
Benzylbe
nzoa
te(H
3O+ )
4precursors
193.2e
91.0
372.4e
91.0
552.1e
91.0
731.9e
91.0
5prod
ucts
611.0
791.0
851.0
1451.0
1631.0
4precursors
193.4e
91.0
372.5e
91.0
552.2e
91.0
732.0e
91.0
3prod
ucts
911.0
1511.0
1691.0
4precursors
193.5e
91.0
372.6e
91.0
552.2e
91.0
732.0e
91.0
6prod
ucts
1051.0
1371.0
1551.0
1631.0
1651.0
1831.0
4precursors
193.8e
91.0
372.9e
91.0
552.5e
91.0
732.2e
91.0
3prod
ucts
1211.0
1531.0
1711.0
4precursors
193.3e
91.0
372.5e
91.0
552.2e
91.0
732.0e
91.0
3prod
ucts
1371.0
1551.0
1531.0
4precursors
193.7e
91.0
372.8e
91.0
552.4e
91.0
732.1e
91.0
3prod
ucts
911.0
1511.0
1691.0
020
040
060
080
010
0012
0014
0016
000
500
1000
1500
2000
2500
3000
3500
4000
4500
5000
time
[s]
Hex
yl a
ceta
te B
enzy
l ace
tate
Phen
ethy
l ace
tate
Met
hyl
salic
ylat
e
Met
hyl b
enzo
ate
Ben
zyl
benz
oate
ppb
Fi
gure
5.1
0 A
test
of t
he in
itial
sim
ple
kine
tic li
brar
y en
tries
giv
en in
Tab
le 5
.1.
70
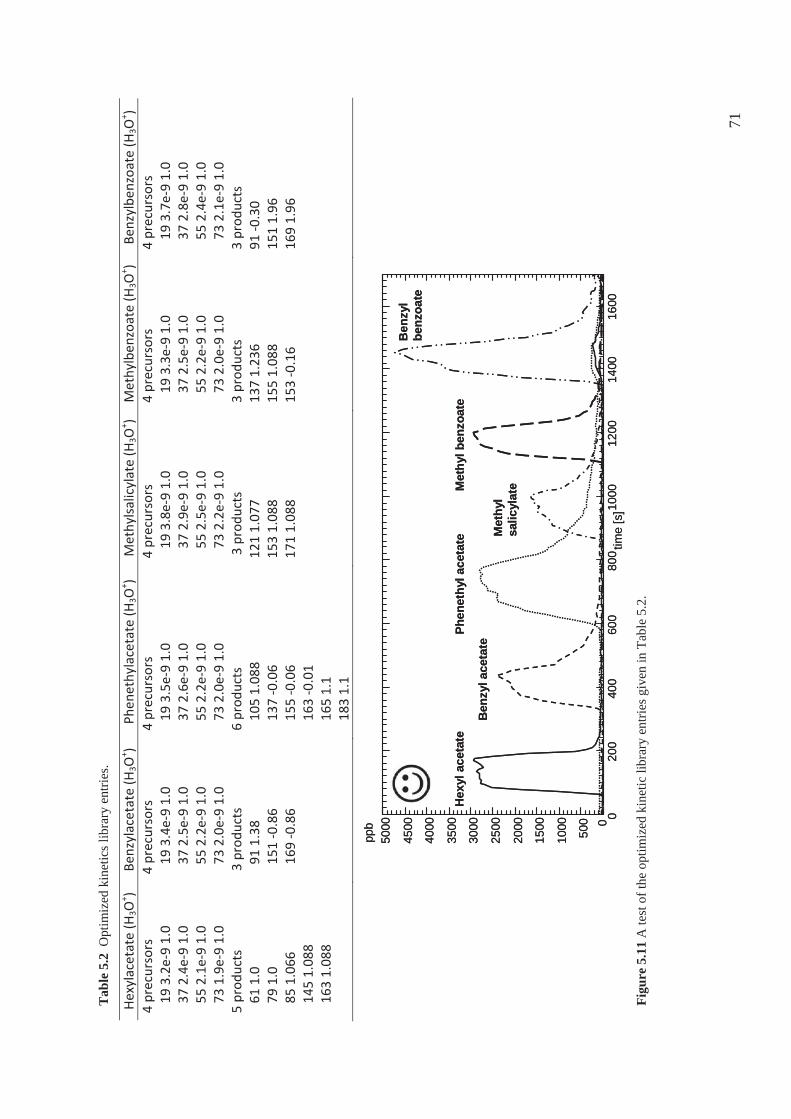
71
Hexylacetate
(H3O
+ )Be
nzylacetate(H
3O+ )
Phen
ethylacetate
(H3O
+ )Methylsa
licylate(H
3O+ )
Methylben
zoate(H
3O+ )
Benzylbe
nzoa
te(H
3O+ )
4precursors
193.2e
91.0
372.4e
91.0
552.1e
91.0
731.9e
91.0
5prod
ucts
611.0
791.0
851.06
614
51.08
816
31.08
8
4precursors
193.4e
91.0
372.5e
91.0
552.2e
91.0
732.0e
91.0
3prod
ucts
911.38
151
0.86
169
0.86
4precursors
193.5e
91.0
372.6e
91.0
552.2e
91.0
732.0e
91.0
6prod
ucts
1051.08
813
70.06
155
0.06
163
0.01
1651.1
1831.1
4precursors
193.8e
91.0
372.9e
91.0
552.5e
91.0
732.2e
91.0
3prod
ucts
1211.07
715
31.08
817
11.08
8
4precursors
193.3e
91.0
372.5e
91.0
552.2e
91.0
732.0e
91.0
3prod
ucts
1371.23
615
51.08
815
30.16
4precursors
193.7e
91.0
372.8e
91.0
552.4e
91.0
732.1e
91.0
3prod
ucts
910.30
1511.96
1691.96
020
040
060
080
010
0012
0014
0016
000
500
1000
1500
2000
2500
3000
3500
4000
4500
5000
ppb
Hex
yl a
ceta
te
Ben
zyl a
ceta
te
Phen
ethy
l ace
tate M
ethy
l sa
licyl
ateM
ethy
l ben
zoat
e
Ben
zyl
benz
oate
time
[s]
020
040
060
080
010
0012
0014
0016
000
500
1000
1500
2000
2500
3000
3500
4000
4500
5000
ppb
Hex
yl a
ceta
te
Ben
zyl a
ceta
te
Phen
ethy
l ace
tate M
ethy
l sa
licyl
ateM
ethy
l ben
zoat
e
Ben
zyl
benz
oate
time
[s]
Fi
gure
5.1
1 A
test
of t
he o
ptim
ized
kin
etic
libr
ary
entri
es g
iven
in T
able
5.2
.
Tab
le 5
.2 O
ptim
ized
kin
etic
s lib
rary
ent
ries.
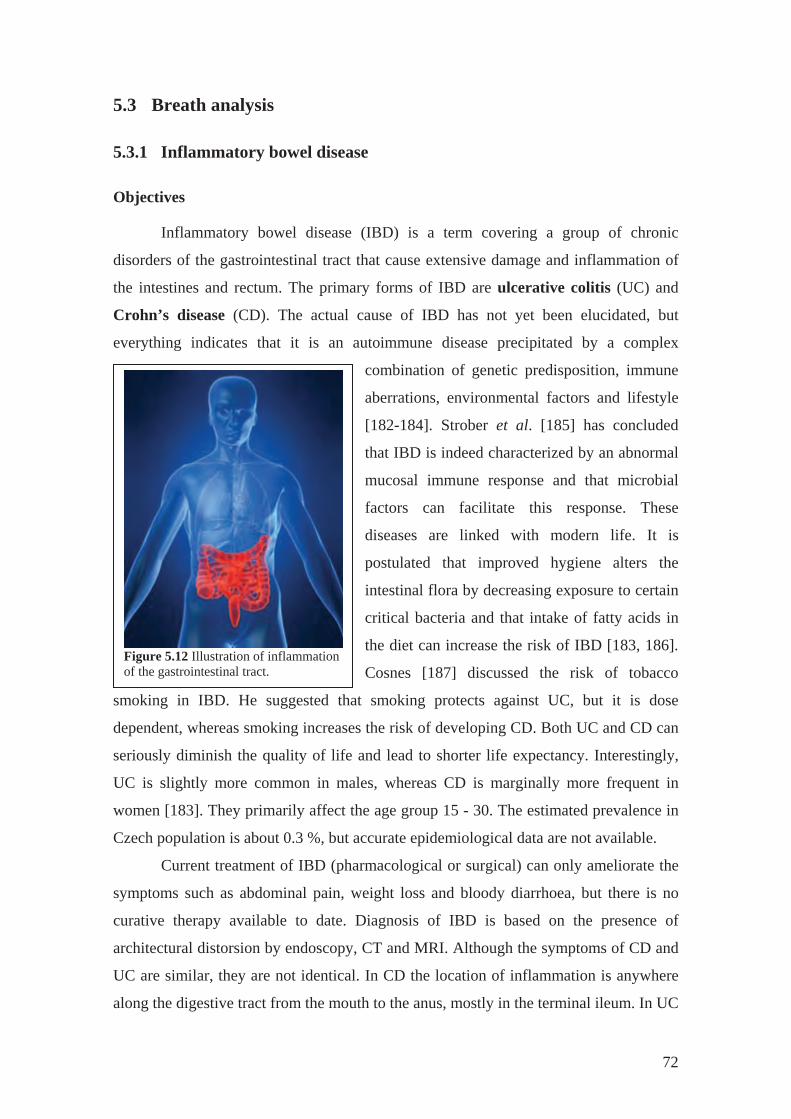
5.3 Breath analysis
5.3.1 Inflammatory bowel disease
Objectives
Inflammatory bowel disease (IBD) is a term covering a group of chronic
disorders of the gastrointestinal tract that cause extensive damage and inflammation of
the intestines and rectum. The primary forms of IBD are ulcerative colitis (UC) and
Crohn’s disease (CD). The actual cause of IBD has not yet been elucidated, but
everything indicates that it is an autoimmune disease precipitated by a complex
combination of genetic predisposition, immune
aberrations, environmental factors and lifestyle
[182-184]. Strober et al. [185] has concluded
that IBD is indeed characterized by an abnormal
mucosal immune response and that microbial
factors can facilitate this response. These
diseases are linked with modern life. It is
postulated that improved hygiene alters the
intestinal flora by decreasing exposure to certain
critical bacteria and that intake of fatty acids in
the diet can increase the risk of IBD [183, 186].
Cosnes [187] discussed the risk of tobacco
smoking in IBD. He suggested that smoking protects against UC, but it is dose
dependent, whereas smoking increases the risk of developing CD. Both UC and CD can
seriously diminish the quality of life and lead to shorter life expectancy. Interestingly,
UC is slightly more common in males, whereas CD is marginally more frequent in
women [183]. They primarily affect the age group 15 - 30. The estimated prevalence in
Czech population is about 0.3 %, but accurate epidemiological data are not available.
Figure 5.12 Illustration of inflammation of the gastrointestinal tract.
Current treatment of IBD (pharmacological or surgical) can only ameliorate the
symptoms such as abdominal pain, weight loss and bloody diarrhoea, but there is no
curative therapy available to date. Diagnosis of IBD is based on the presence of
architectural distorsion by endoscopy, CT and MRI. Although the symptoms of CD and
UC are similar, they are not identical. In CD the location of inflammation is anywhere
along the digestive tract from the mouth to the anus, mostly in the terminal ileum. In UC
72
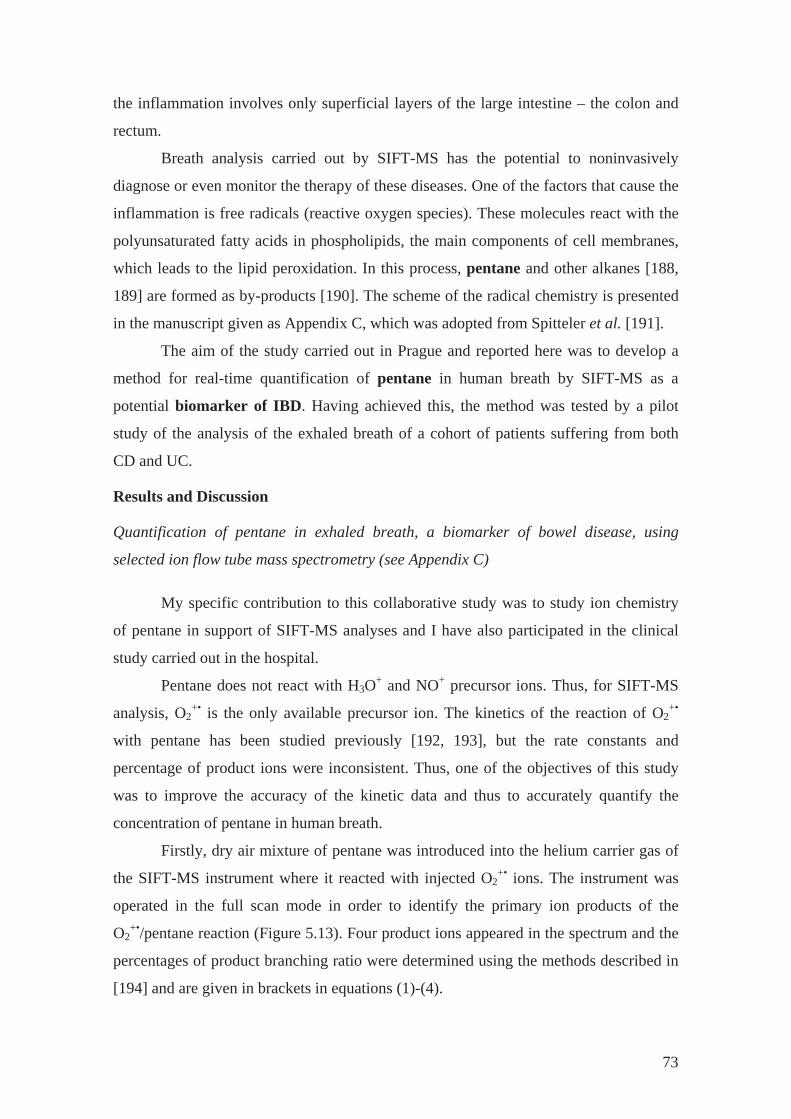
the inflammation involves only superficial layers of the large intestine – the colon and
rectum.
Breath analysis carried out by SIFT-MS has the potential to noninvasively
diagnose or even monitor the therapy of these diseases. One of the factors that cause the
inflammation is free radicals (reactive oxygen species). These molecules react with the
polyunsaturated fatty acids in phospholipids, the main components of cell membranes,
which leads to the lipid peroxidation. In this process, pentane and other alkanes [188,
189] are formed as by-products [190]. The scheme of the radical chemistry is presented
in the manuscript given as Appendix C, which was adopted from Spitteler et al. [191].
The aim of the study carried out in Prague and reported here was to develop a
method for real-time quantification of pentane in human breath by SIFT-MS as a
potential biomarker of IBD. Having achieved this, the method was tested by a pilot
study of the analysis of the exhaled breath of a cohort of patients suffering from both
CD and UC.
Results and Discussion
Quantification of pentane in exhaled breath, a biomarker of bowel disease, using
selected ion flow tube mass spectrometry (see Appendix C)
My specific contribution to this collaborative study was to study ion chemistry
of pentane in support of SIFT-MS analyses and I have also participated in the clinical
study carried out in the hospital.
Pentane does not react with H3O+ and NO+ precursor ions. Thus, for SIFT-MS
analysis, O2+• is the only available precursor ion. The kinetics of the reaction of O2
+•
with pentane has been studied previously [192, 193], but the rate constants and
percentage of product ions were inconsistent. Thus, one of the objectives of this study
was to improve the accuracy of the kinetic data and thus to accurately quantify the
concentration of pentane in human breath.
Firstly, dry air mixture of pentane was introduced into the helium carrier gas of
the SIFT-MS instrument where it reacted with injected O2+• ions. The instrument was
operated in the full scan mode in order to identify the primary ion products of the
O2+•/pentane reaction (Figure 5.13). Four product ions appeared in the spectrum and the
percentages of product branching ratio were determined using the methods described in
[194] and are given in brackets in equations (1)-(4).
73
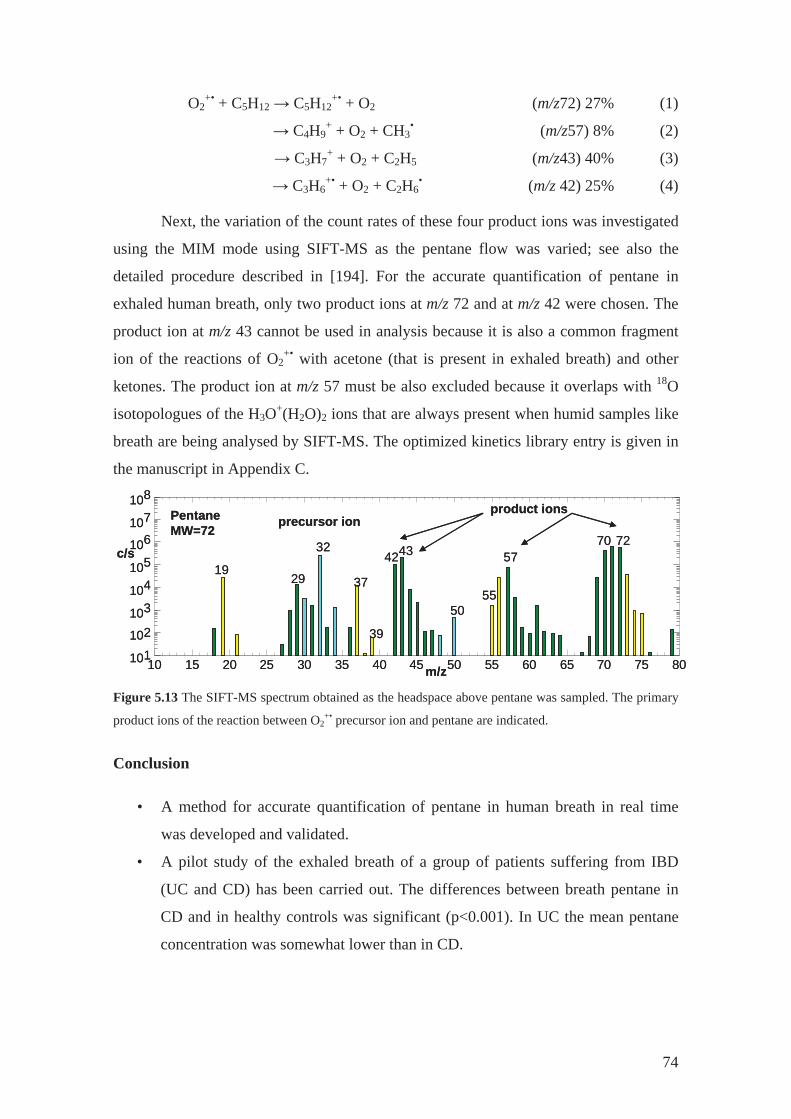
O2+• + C5H12 C5H12
+• + O2 (m/z72) 27% (1)
C4H9+ + O2 + CH3
• (m/z57) 8% (2)
C3H7+ + O2 + C2H5 (m/z43) 40% (3)
C3H6+• + O2 + C2H6
• (m/z 42) 25% (4)
Next, the variation of the count rates of these four product ions was investigated
using the MIM mode using SIFT-MS as the pentane flow was varied; see also the
detailed procedure described in [194]. For the accurate quantification of pentane in
exhaled human breath, only two product ions at m/z 72 and at m/z 42 were chosen. The
product ion at m/z 43 cannot be used in analysis because it is also a common fragment
ion of the reactions of O2+• with acetone (that is present in exhaled breath) and other
ketones. The product ion at m/z 57 must be also excluded because it overlaps with 18O
isotopologues of the H3O+(H2O)2 ions that are always present when humid samples like
breath are being analysed by SIFT-MS. The optimized kinetics library entry is given in
the manuscript in Appendix C.
10 15 20 25 30 35 40 45 50 55 60 65 70 75 80101102103104105106107108
c/s
m/z
1929
32
37
39
4243
5055
5770 72
PentaneMW=72
product ionsprecursor ion
10 15 20 25 30 35 40 45 50 55 60 65 70 75 80101102103104105106107108
c/s
m/z
1929
32
37
39
4243
5055
5770 72
PentaneMW=72
product ionsprecursor ion
Figure 5.13 The SIFT-MS spectrum obtained as the headspace above pentane was sampled. The primary
product ions of the reaction between O2+• precursor ion and pentane are indicated.
Conclusion
• A method for accurate quantification of pentane in human breath in real time
was developed and validated.
• A pilot study of the exhaled breath of a group of patients suffering from IBD
(UC and CD) has been carried out. The differences between breath pentane in
CD and in healthy controls was significant (p<0.001). In UC the mean pentane
concentration was somewhat lower than in CD.
74
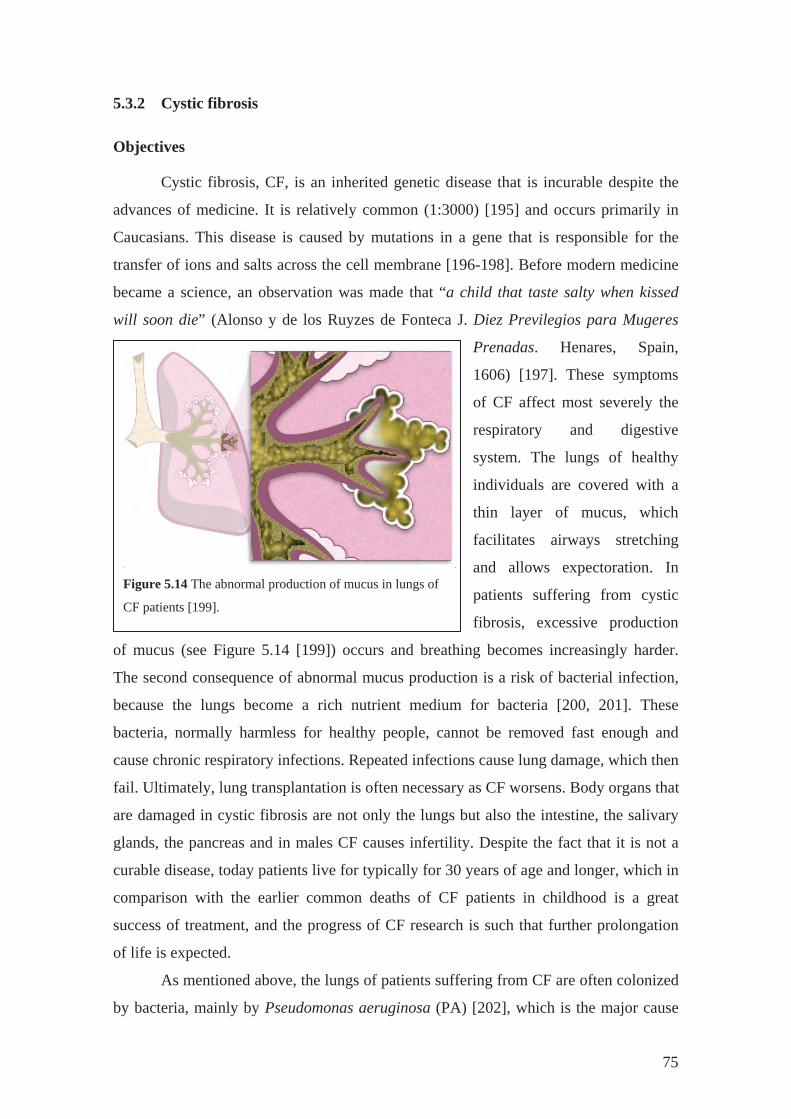
5.3.2 Cystic fibrosis
Objectives
Figure 5.14 The abnormal production of mucus in lungs of
CF patients [199].
Cystic fibrosis, CF, is an inherited genetic disease that is incurable despite the
advances of medicine. It is relatively common (1:3000) [195] and occurs primarily in
Caucasians. This disease is caused by mutations in a gene that is responsible for the
transfer of ions and salts across the cell membrane [196-198]. Before modern medicine
became a science, an observation was made that “a child that taste salty when kissed
will soon die” (Alonso y de los Ruyzes de Fonteca J. Diez Previlegios para Mugeres
Prenadas. Henares, Spain,
1606) [197]. These symptoms
of CF affect most severely the
respiratory and digestive
system. The lungs of healthy
individuals are covered with a
thin layer of mucus, which
facilitates airways stretching
and allows expectoration. In
patients suffering from cystic
fibrosis, excessive production
of mucus (see Figure 5.14 [199]) occurs and breathing becomes increasingly harder.
The second consequence of abnormal mucus production is a risk of bacterial infection,
because the lungs become a rich nutrient medium for bacteria [200, 201]. These
bacteria, normally harmless for healthy people, cannot be removed fast enough and
cause chronic respiratory infections. Repeated infections cause lung damage, which then
fail. Ultimately, lung transplantation is often necessary as CF worsens. Body organs that
are damaged in cystic fibrosis are not only the lungs but also the intestine, the salivary
glands, the pancreas and in males CF causes infertility. Despite the fact that it is not a
curable disease, today patients live for typically for 30 years of age and longer, which in
comparison with the earlier common deaths of CF patients in childhood is a great
success of treatment, and the progress of CF research is such that further prolongation
of life is expected.
As mentioned above, the lungs of patients suffering from CF are often colonized
by bacteria, mainly by Pseudomonas aeruginosa (PA) [202], which is the major cause
75
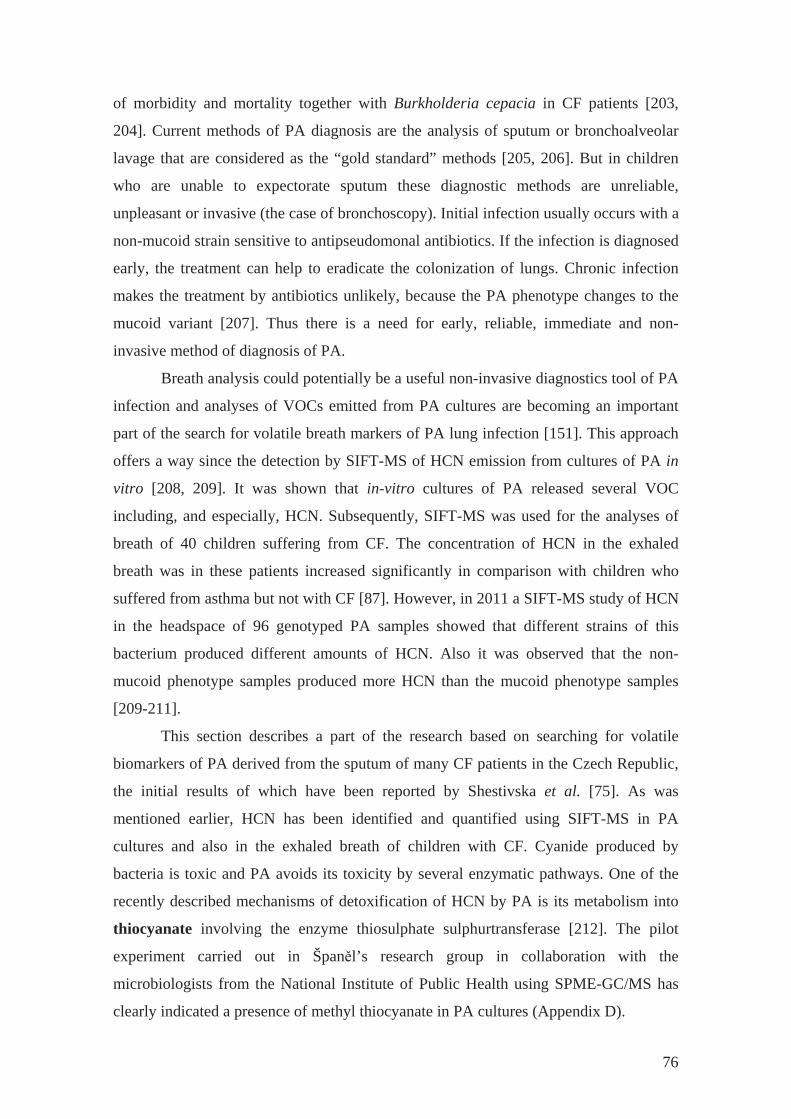
of morbidity and mortality together with Burkholderia cepacia in CF patients [203,
204]. Current methods of PA diagnosis are the analysis of sputum or bronchoalveolar
lavage that are considered as the “gold standard” methods [205, 206]. But in children
who are unable to expectorate sputum these diagnostic methods are unreliable,
unpleasant or invasive (the case of bronchoscopy). Initial infection usually occurs with a
non-mucoid strain sensitive to antipseudomonal antibiotics. If the infection is diagnosed
early, the treatment can help to eradicate the colonization of lungs. Chronic infection
makes the treatment by antibiotics unlikely, because the PA phenotype changes to the
mucoid variant [207]. Thus there is a need for early, reliable, immediate and non-
invasive method of diagnosis of PA.
Breath analysis could potentially be a useful non-invasive diagnostics tool of PA
infection and analyses of VOCs emitted from PA cultures are becoming an important
part of the search for volatile breath markers of PA lung infection [151]. This approach
offers a way since the detection by SIFT-MS of HCN emission from cultures of PA in
vitro [208, 209]. It was shown that in-vitro cultures of PA released several VOC
including, and especially, HCN. Subsequently, SIFT-MS was used for the analyses of
breath of 40 children suffering from CF. The concentration of HCN in the exhaled
breath was in these patients increased significantly in comparison with children who
suffered from asthma but not with CF [87]. However, in 2011 a SIFT-MS study of HCN
in the headspace of 96 genotyped PA samples showed that different strains of this
bacterium produced different amounts of HCN. Also it was observed that the non-
mucoid phenotype samples produced more HCN than the mucoid phenotype samples
[209-211].
This section describes a part of the research based on searching for volatile
biomarkers of PA derived from the sputum of many CF patients in the Czech Republic,
the initial results of which have been reported by Shestivska et al. [75]. As was
mentioned earlier, HCN has been identified and quantified using SIFT-MS in PA
cultures and also in the exhaled breath of children with CF. Cyanide produced by
bacteria is toxic and PA avoids its toxicity by several enzymatic pathways. One of the
recently described mechanisms of detoxification of HCN by PA is its metabolism into
thiocyanate involving the enzyme thiosulphate sulphurtransferase [212]. The pilot
experiment carried out in Špan l’s research group in collaboration with the
microbiologists from the National Institute of Public Health using SPME-GC/MS has
clearly indicated a presence of methyl thiocyanate in PA cultures (Appendix D).
76
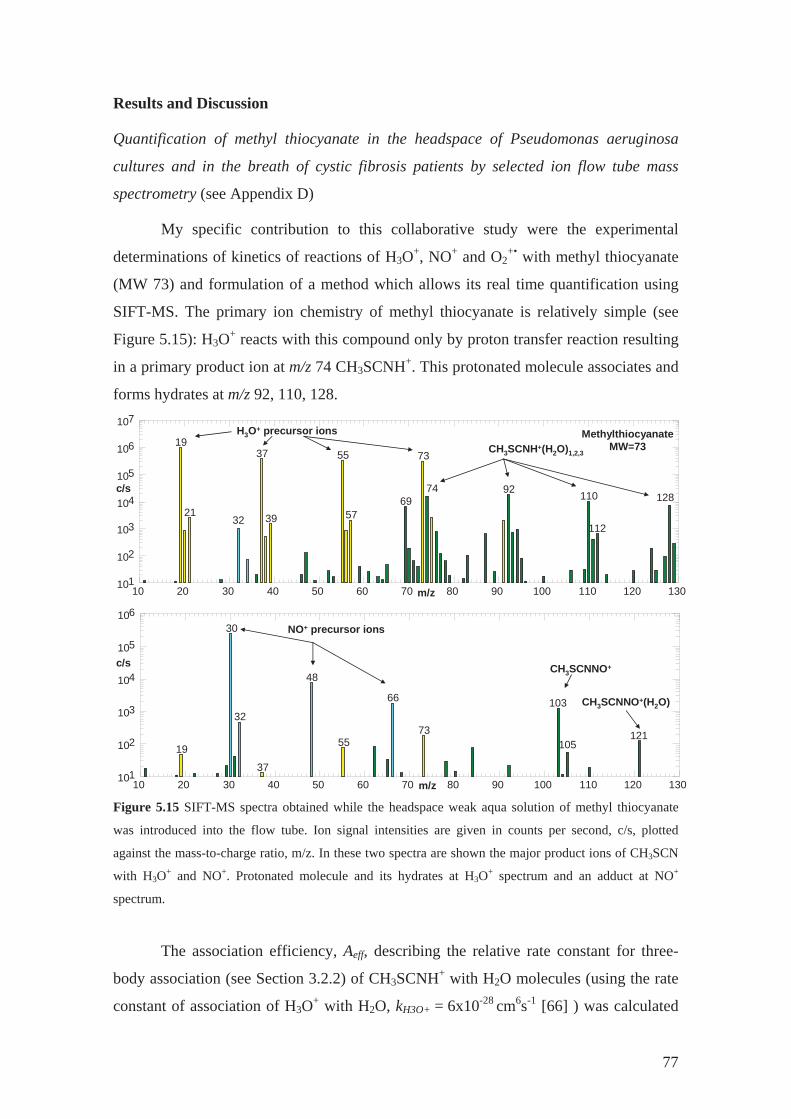
Results and Discussion
Quantification of methyl thiocyanate in the headspace of Pseudomonas aeruginosa
cultures and in the breath of cystic fibrosis patients by selected ion flow tube mass
spectrometry (see Appendix D)
My specific contribution to this collaborative study were the experimental
determinations of kinetics of reactions of H3O+, NO+ and O2+• with methyl thiocyanate
(MW 73) and formulation of a method which allows its real time quantification using
SIFT-MS. The primary ion chemistry of methyl thiocyanate is relatively simple (see
Figure 5.15): H3O+ reacts with this compound only by proton transfer reaction resulting
in a primary product ion at m/z 74 CH3SCNH+. This protonated molecule associates and
forms hydrates at m/z 92, 110, 128.
MethylthiocyanateMW=73
H3O+ precursor ions
10 20 30 40 50 60 70 80 90 100 110 120 130101
102
103
104
105
106
107
c/s
m/z
19
2132
37
39
55
5769
73
92 110
112
12874
CH3SCNH+(H2O)1,2,3
10 20 30 40 50 60 70 80 90 100 110 120 130101
102
103
104
105
106
c/s
m/z
19
30
32
37
48
55
66
73
103
105121
NO+ precursor ions
CH3SCNNO+
CH3SCNNO+(H2O)
Figure 5.15 SIFT-MS spectra obtained while the headspace weak aqua solution of methyl thiocyanate
was introduced into the flow tube. Ion signal intensities are given in counts per second, c/s, plotted
against the mass-to-charge ratio, m/z. In these two spectra are shown the major product ions of CH3SCN
with H3O+ and NO+. Protonated molecule and its hydrates at H3O+ spectrum and an adduct at NO+
spectrum.
The association efficiency, Aeff, describing the relative rate constant for three-
body association (see Section 3.2.2) of CH3SCNH+ with H2O molecules (using the rate
constant of association of H3O+ with H2O, kH3O+ = 6x10-28 cm6s-1 [66] ) was calculated
77
as 1.6 and thus the three-body rate constant for this reaction is 6.1 x 10⁻²⁸ cm6s–1. In
comparison with larger organic molecules like esters (Appendix A), this value is
relatively small. The collisional rate constant for the formation of the protonated
product CH3SCNH+ is 4.6x10⁻⁹cm3s–1 according to the calculation using the
parameterized trajectory theory [177] (Section 5.1) and the known polarisability and
dipole moment of CH3SCN (a=7.62 x 10⁻²⁴ cm3 and m=3.56 D, respectively). When
using H3O+ for SIFT-MS quantification of methyl thiocyanate, it is important to account
for the overlap of the product ions with the 17O and D isotopologues of the trihydrated
hydronium ions (m/z 74). This can be achieved by including negative fp coefficients in
the kinetics library as given in Table 5.3. Note that such subtraction at m/z 74 leads to a
decrease in the precision and thus the kinetics library entry was optimized using the
method described in Appendix A. As a result of this only the hydrated products at m/z
92, 110 and 128 are used in the analyses after multiplying the precursor and product ion
count rates by optimised coefficients, fp.
NO+ reacts with methyl thiocyanate by three-body association only forming the
adduct ion CH3SCNNO+ at m/z 103, the effective two-body rate constant for this
reaction (proceeding at 1.3mbar of He pressure) is 1.7 x 10⁻⁹cm3s–1, which is lower than
the collisional rate constant 4.4 x 10⁻⁹cm3s–1. The O2+• charge transfer reaction forms the
radical cation CH3SCN+• only, and proceeds rapidly with a rate constant equal to the
collisional rate constant of 4.3 x 10⁻⁹cm3s–1. The primary product ion unfortunately
overlaps with the H3O+(H2O)3 ion and thus cannot be used for analyses in humid air.
78
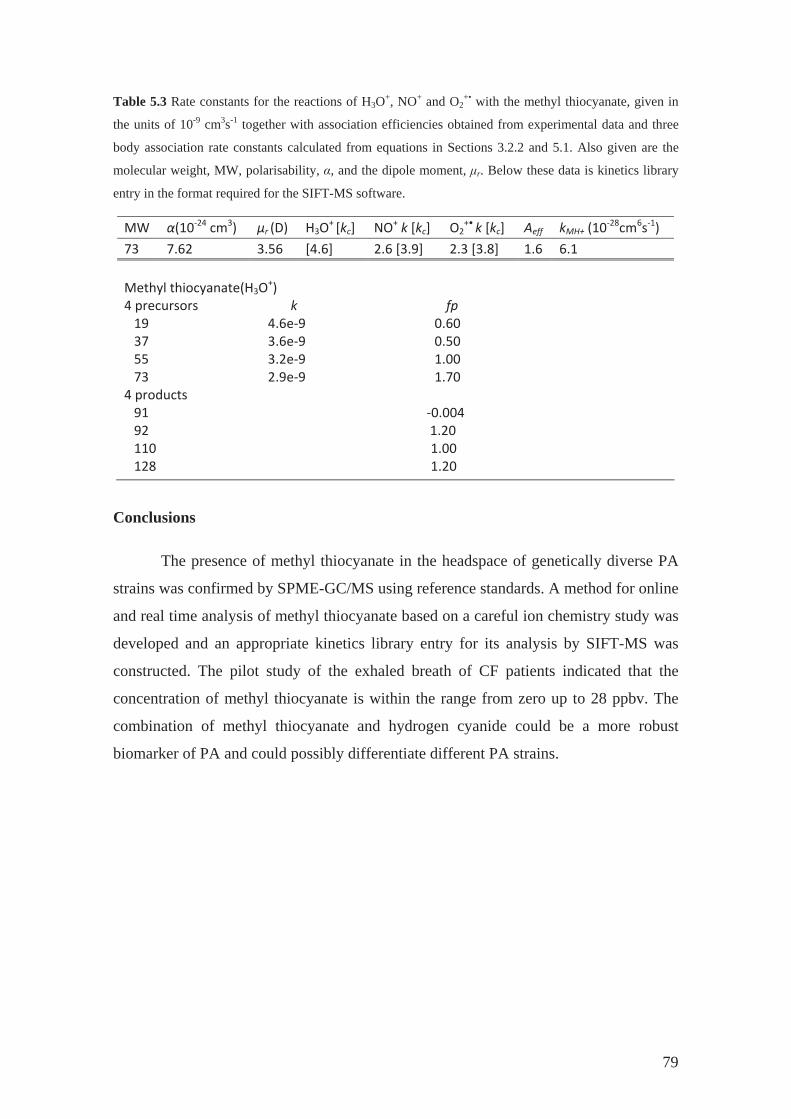
Table 5.3 Rate constants for the reactions of H3O+, NO+ and O2+• with the methyl thiocyanate, given in
the units of 10-9 cm3s-1 together with association efficiencies obtained from experimental data and three
body association rate constants calculated from equations in Sections 3.2.2 and 5.1. Also given are the
molecular weight, MW, polarisability, , and the dipole moment, r. Below these data is kinetics library
entry in the format required for the SIFT-MS software.
MW (10 24 cm3) r (D) H3O+ [kc] NO+ k [kc] O2+• k [kc] Aeff kMH+ (10 28cm6s 1)
73 7.62 3.56 [4.6] 2.6 [3.9] 2.3 [3.8] 1.6 6.1
Methyl thiocyanate(H3O+)4 precursors k fp19 4.6e 9 0.6037 3.6e 9 0.5055 3.2e 9 1.0073 2.9e 9 1.70
4 products91 0.00492 1.20110 1.00128 1.20
Conclusions
The presence of methyl thiocyanate in the headspace of genetically diverse PA
strains was confirmed by SPME-GC/MS using reference standards. A method for online
and real time analysis of methyl thiocyanate based on a careful ion chemistry study was
developed and an appropriate kinetics library entry for its analysis by SIFT-MS was
constructed. The pilot study of the exhaled breath of CF patients indicated that the
concentration of methyl thiocyanate is within the range from zero up to 28 ppbv. The
combination of methyl thiocyanate and hydrogen cyanide could be a more robust
biomarker of PA and could possibly differentiate different PA strains.
79
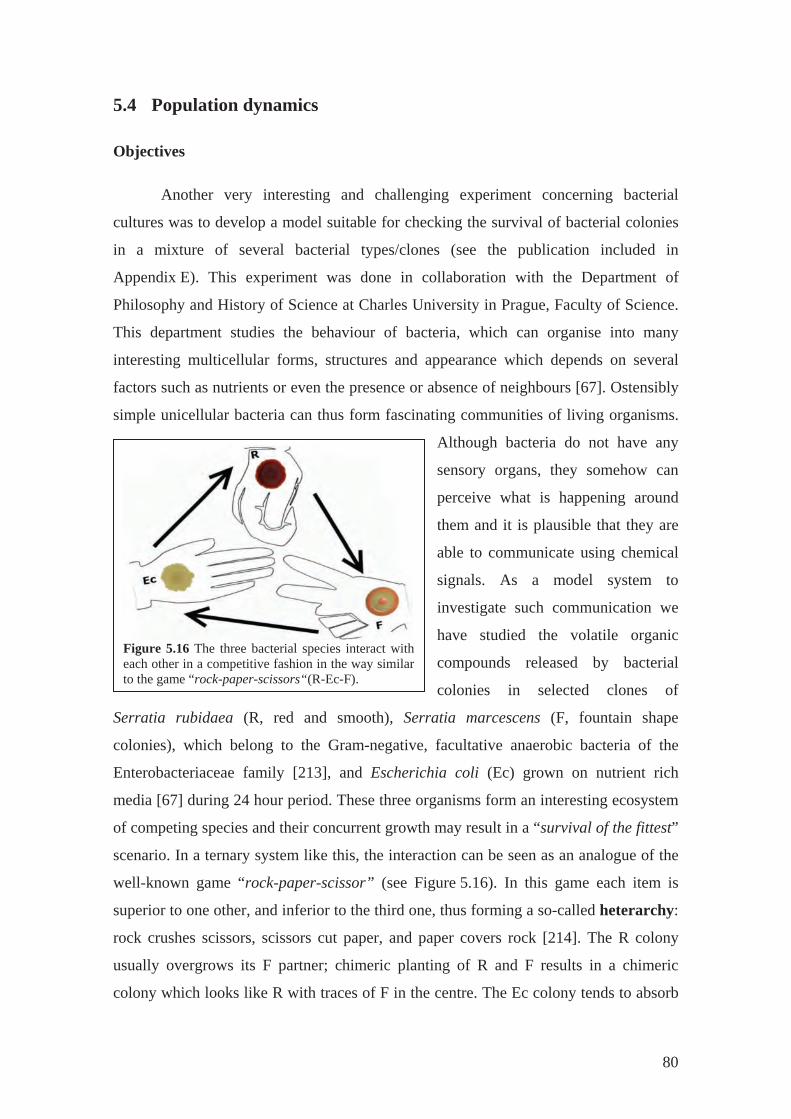
5.4 Population dynamics
Objectives
Figure 5.16 The three bacterial species interact with each other in a competitive fashion in the way similar to the game “rock-paper-scissors“(R-Ec-F).
Another very interesting and challenging experiment concerning bacterial
cultures was to develop a model suitable for checking the survival of bacterial colonies
in a mixture of several bacterial types/clones (see the publication included in
Appendix E). This experiment was done in collaboration with the Department of
Philosophy and History of Science at Charles University in Prague, Faculty of Science.
This department studies the behaviour of bacteria, which can organise into many
interesting multicellular forms, structures and appearance which depends on several
factors such as nutrients or even the presence or absence of neighbours [67]. Ostensibly
simple unicellular bacteria can thus form fascinating communities of living organisms.
Although bacteria do not have any
sensory organs, they somehow can
perceive what is happening around
them and it is plausible that they are
able to communicate using chemical
signals. As a model system to
investigate such communication we
have studied the volatile organic
compounds released by bacterial
colonies in selected clones of
Serratia rubidaea (R, red and smooth), Serratia marcescens (F, fountain shape
colonies), which belong to the Gram-negative, facultative anaerobic bacteria of the
Enterobacteriaceae family [213], and Escherichia coli (Ec) grown on nutrient rich
media [67] during 24 hour period. These three organisms form an interesting ecosystem
of competing species and their concurrent growth may result in a “survival of the fittest”
scenario. In a ternary system like this, the interaction can be seen as an analogue of the
well-known game “rock-paper-scissor” (see Figure 5.16). In this game each item is
superior to one other, and inferior to the third one, thus forming a so-called heterarchy:
rock crushes scissors, scissors cut paper, and paper covers rock [214]. The R colony
usually overgrows its F partner; chimeric planting of R and F results in a chimeric
colony which looks like R with traces of F in the centre. The Ec colony tends to absorb
80
the R colony (but it does not directly become overgrown with Ec, as in the previous
case) and the resulting chimera contains a mixture of R and Ec in the middle and solely
Ec around. In the last possible setting the F colony has a strong tendency to suppress the
growth of its Ec partner. The end point state of the FEc chimera consists of F cells only
and Ec seems to be driven to extinction. In the chimera consisting of all three clones, F
repeals Ec, subsequently to be overgrown by R Thus, there are many possibilities how
the bacteria play this game. For example, it is very nice to observe a chimeric colony of
R and Ec (it means that Ec absorbed R colony) and to put in its neighbourhood F
colonies. The F starts to repel Ec and so the R can escape from the prison of Ec.
Whilst the ultimate result of the population dynamics can be observed by
counting the surviving colony forming units, it would be much more instructive to
follow them in the real time using volatile signatures (VOCs) of the individual clones.
The objective of this study was to identify such VOCs and based on multivariate
techniques distinguish among these three bacterial species. It is well known in
microbiology that a bacterial colony is a dynamic system that develops in time going
through four phases of a so-called growth curve: the lag phase, the exponential or log
phase (characterised by the doubling time), the stationary phase (when depletion of
nutrients or increasing amounts of waste occur) and the final death phase. The growth
dynamics are also influenced by other concurrent organisms that may limit the growth
of their neighbours [67, 215, 216].
My specific role in this study was to plan and carry out the SIFT-MS analyses of
the VOCs emitted by the bacteria and to analyse the data using traditional and
multivariate methods.
Methods
Six different cultures were prepared: monocultures of R, Ec, F, and binary
systems of REc, FEc, RF. The SIFT-MS instrument was set in the full scan mode with
the scan duration of 120 s in the mass spectral range 10 – 100 m/z and all three
precursor ions were cycled. Using this experimental protocol the time evolution of the
headspace composition above each sample was monitored and analysed. One
experiment took 24 hours and typically 273 mass spectra were obtained for each
precursor ion in each case (for more detail see the published paper in Appendix E). The
data were evaluated using the statistical method of principal component analysis (PCA).
81
Principal component analysis (PCA)
There are several established methods of multivariate data analysis used in
chemometrics to enhance data interpretation when a collection of large number of
measurements is available. The most common methods are principal component
analysis (PCA) and principal component regression (PCR) [217], artificial neural
networks and partial least squares regression, PLS-R. Calculation of the principal
components, which are linear functions of the measured data, represents the most basic
and well understood approach [218]. This method notably forms the mathematical basis
of the electronic nose (e-nose) technology, which in the last few years has become an
objective tool for discriminating odours. The PCA methods have been previously used
for analysis of bacterial culture data obtained using SESI-MS, when it was seen that the
species were clearly separated based on their VOC data [21, 81]. Data interpretation
using PCA has previously been used in similar PTR-MS analyses [219]. The use of
multivariate methods for data analysis in SIFT-MS is still in its infancy and has not yet
been described in the published literature and thus this study also serves as a test case
for this purpose.
The aim of the principal component analysis is to reduce the dimension of data,
which means reducing the number of variables. PCA describes the relationship between
variables and observations/cases and also identifies the outliers. If two or more variables
in the data table correlate, they can be substituted by one new variable (or factor, or
component), PC1. Actually, PC1 becomes a new coordinate axis in the direction of the
greatest variability of the data set. Onto this axis the positions of the original data points
are projected in multidimensional space. It means that each data point on PC1 has a new
coordinate. PC1 is a linear combination of the variables in the original data table. PC2 is
then orthogonal coordinate axis to PC1 and has the second highest variance, etc. for
additional components. PCA thus rotates the multidimensional coordinate system and
projects the data points into fewer dimensions. PCA is very useful for two-dimensional
(and sometimes somewhat misleading and questionable three-dimensional) graphical
visualization of the multidimensional data, that can be used to reveal differences
between groups of data points [220].
For the purpose of PCA analyses the sets of the full scan SIFT-MS mass spectra
(combined peak tables of spectra obtained using all three precursors) for different
cultures were normalised to a constant total ion count rate. From the count rates of ions
82
at 90 different m/z values for 3 precursor ions (270 values in total), the precursor ions,
their hydrates, 13C isotopologues of the major product ions and all m/z where the mean
ion count rate observed was less than 100 c/s were excluded. Thus, 56 characteristic
combinations of precursor ion types and product ion m/z values were included in the
matrix (273 rows and 56 columns) to be processed by PCA (see Appendix E).
Results and Discussion
Real time monitoring of population dynamics in concurrent bacterial growth using
SIFT-MS quantification of volatile metabolites (Appendix E)
An example of PCA visualization which was not included in the published
article (Appendix E) is shown in Figure 5.17. From the full scan mass spectra several
compounds (ammonia, acetone, acetoin, acetaldehyde, acetic acid, ethanol and
propanol) were identified and quantified in the bacterial headspace. PCA was applied on
a subset of these data selected from the latter part of the log phases of the bacterial
growth curve before the stationary growth phase. As can be seen in Figure 5.17, the
PCA plot shows five clusters for the six monitored cultures, in the way that is usually
used for PCA visualisation and relatively common in the literature [21, 217, 219]. The
single cultures R (red spots) and Ec (grey spots) are clearly separated in the direction of
propanol and acetic acid for Ec and in the direction of acetaldehyde, acetoin and ethanol
for R. Propanol was, on average, 25 times higher in Ec, compared to the other two
monocultures F and R. Thus, propanol can be considered as a marker indicating the
presence of Ec in these systems. Acetoin (3-hydroxy butanone) is produced in largest
concentration by R and was also detected in the headspace of F in lower concentration,
but not in the headspace of Ec. Thus acetoin in the headspace indicates the presence of
R in these experiments. The single population F (green spots) and the binary mixture
FEc (green spots) overlap. This is caused by the concurrent growth of these two species
in one medium; F always overgrows its Ec partner. Thus, the binary mixture FEc has
identical headspace composition with the single F sample; actually FEc is not a binary
mixture. The RF population is located between the single F and R populations. The REc
binary system is located in the direction of acetone and ammonia. PCA is a certainly a
very nice tool for visualizing large data tables, but in this experiment, the clear
clustering of each sample is a result of the deliberate choice of data from the latter part
of the log phases of the bacterial growth curve.
83
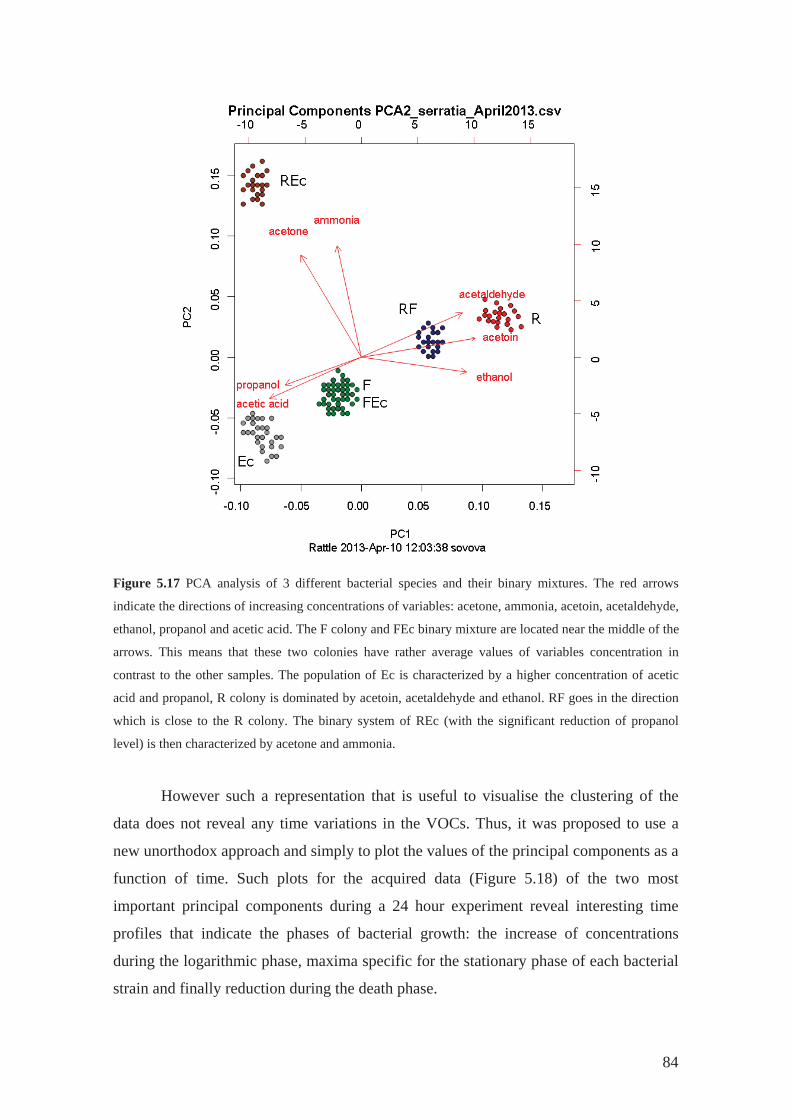
Figure 5.17 PCA analysis of 3 different bacterial species and their binary mixtures. The red arrows
indicate the directions of increasing concentrations of variables: acetone, ammonia, acetoin, acetaldehyde,
ethanol, propanol and acetic acid. The F colony and FEc binary mixture are located near the middle of the
arrows. This means that these two colonies have rather average values of variables concentration in
contrast to the other samples. The population of Ec is characterized by a higher concentration of acetic
acid and propanol, R colony is dominated by acetoin, acetaldehyde and ethanol. RF goes in the direction
which is close to the R colony. The binary system of REc (with the significant reduction of propanol
level) is then characterized by acetone and ammonia.
However such a representation that is useful to visualise the clustering of the
data does not reveal any time variations in the VOCs. Thus, it was proposed to use a
new unorthodox approach and simply to plot the values of the principal components as a
function of time. Such plots for the acquired data (Figure 5.18) of the two most
important principal components during a 24 hour experiment reveal interesting time
profiles that indicate the phases of bacterial growth: the increase of concentrations
during the logarithmic phase, maxima specific for the stationary phase of each bacterial
strain and finally reduction during the death phase.
84
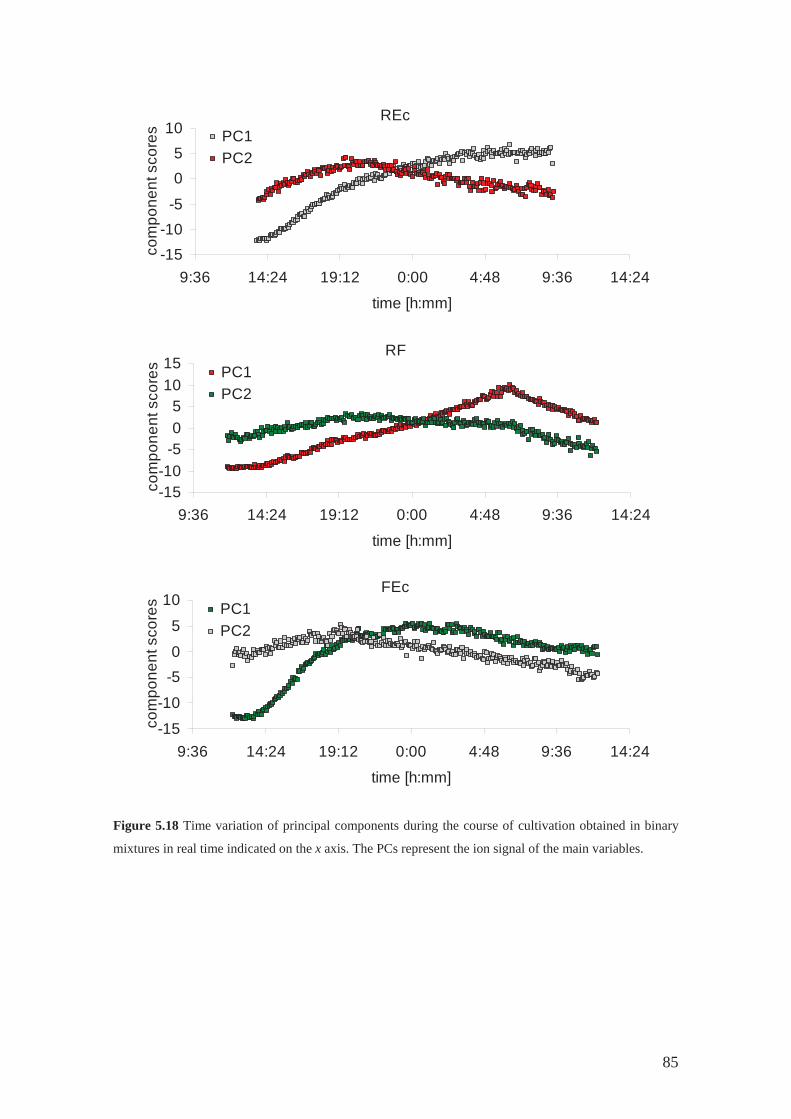
REc
-15-10
-5
05
10
9:36 14:24 19:12 0:00 4:48 9:36 14:24
time [h:mm]
com
pone
nt s
core
s PC1PC2
RF
-15-10
-505
1015
9:36 14:24 19:12 0:00 4:48 9:36 14:24
time [h:mm]
com
pone
nt s
core
s PC1PC2
FEc
-15
-10
-50
5
10
9:36 14:24 19:12 0:00 4:48 9:36 14:24
time [h:mm]
com
pone
nt s
core
s PC1PC2
Figure 5.18 Time variation of principal components during the course of cultivation obtained in binary
mixtures in real time indicated on the x axis. The PCs represent the ion signal of the main variables.
85
Conclusions
SIFT-MS analyses have been successfully used for non-destructive and
quantitative monitoring of the population dynamics of bacterial cultures in real time.
Another motivation for this research was that the identification of bacteria based on the
composition of VOCs released by their metabolism can be used also to diagnose and
monitor the occurrence and progression of bacterial infections. The theme of bacterial
fingerprinting is currently at the forefront of research interest in mass spectrometry;
however, most of the approaches require isolation and cultivation of bacteria before the
ionisation, which is usually destructive. SIFT-MS can potentially be used to screen
groups of patients at risk for early signs of infection and to choose optimal therapy for
its eradication. Thus, such methodology would be not only applied to the research in the
field of population dynamics in fundamental ecology and biodiversity, but also in
medicine.
5.5 Phytogenic volatile compounds
As was discussed in Section 4.2, plants emit volatile substances with different
odours in order to attract their pollinators or to defend themselves against herbivores.
But this is not the only reason to study these emissions from plants. The study described
in the published article in Appendix F was related to the possibility of using plants to
clean contaminated environment - phytoremediation.
Phytoremediation is a relatively new and promising technology. It represents a
set of methods that uses plants with associated soil microorganisms to remove toxic
substances from the environment or to prevent their further spread [221]. Currently,
phytoremediation is used to eliminate many classes of contaminants including
petroleum hydrocarbons [222], chlorinated solvents, pesticides, explosives [223-226],
heavy metals [227-230] and radionuclides. Now, new sources of contamination such as
various pharmaceuticals, perfumes, detergents and flame retardants are also being
considered. Plants have developed many mechanisms during their evolution to remove
the contamination of soil by inorganic and organic compounds completely naturally.
They can be used in highly contaminated areas as well as in the slightly contaminated
areas or as a further treatment after the use of other physicochemical methods. The
phytoremediation technology can be also considered for the prevention of wind or water
erosion and landfill recultivation [231].
86
Such plant activity (phytoremediation) includes degradation, adsorption,
accumulation and phytovolatilization of compounds or promoting the activity of soil
micro flora in the rhizosphere. This was demonstrated, for example, in the research on
poplar trees, where the process of phytovolatilization is an effective mechanism in
remediation of methyl tertiary butyl ether, MTBE [232]. However, the potential of
microbial degradation of MTBE in the rhizosphere is an additional relevant step in the
entire remediation process [233]. Note that the rhizosphere has a very close relationship
with the root system of plants. It is a key resource for the storage of organic and mineral
substances, which are collectively known as the root exudates. They promote the growth
of soil micro flora and affect the composition of the soil surrounding the plants. They
represent a diverse group of compounds including sugars, amino acids, organic acids,
fatty acids and enzymes. The first mention of plant root exudates appeared in the early
20th century [234-236]. Over time, however, the methodology used to investigate this
has improved and the individual components can now be identified [237-240]. The
diversity of these compounds found in root exudates is discussed in many publications
[241, 242].
Phytoremediation is a passive method of decontamination based on the natural
ability of vegetation to use nutrients that are transported from the soil and water through
the root system. It is faster than natural attenuation. It is an in situ method; the
decontamination can be performed at the site of the pollution; the soil stays in place and
the use of heavy machinery is not necessary. The method is not expensive and it is
effectively powered by solar energy. Application of plants in contaminated areas does
not harm the surroundings; it has an esthetical benefit, and thus is highly acceptable to
the public. The applicability of phytoremediation techniques is limited by the low
tolerance of plants; each plant is not able to tolerate high concentrations of some
contaminants. Also, the transport of contaminants from the roots to the parts of the
plants above ground is sometimes not efficient. Plants that are suitable for remediation
are often of small size. The optimal plant used for phytoremediation must have
characteristics including resistance to stressful environmental conditions; tolerance to
the climate of contaminated areas, rapid growth, large amount of biomass and high
absorption capacity for contaminants - to be a hyper-accumulator [243]. Thus, the
interest is currently focused on genetic engineering that allows translocation and
transfer of any of these genes into candidate plants for improved phytoremediation traits
[244].The contaminated plant waste must be further treated, either by controlled
87
incineration or composting. Phytoremediation is a long process that is slower than
conventional physical-chemical methods [245].
The present study was mainly focused on phytovolatilization, the process
where plants take up contaminants which are water soluble and release them into the
atmosphere in the same way as they transpire water [246]. As mentioned earlier, this
project began with the study of volatiles naturally released by plants during their
development or as a defence against predators (Appendix A). The phytovolatilization
project is concerned with the conversion of inorganic form of selenium into volatile
organic forms (e.g. dimethylselenide) by plants.
5.5.1 Phytovolatilization of selenium
Objectives
The aim of this study was to develop a method for the real time quantification of
volatile forms of selenium (Se) which are formed during the process of
phytovolatilization (Figure 5.19). Some plant species are known to be Se accumulators;
they are growing on seleniferous soils and are thus tolerant to high concentrations of Se;
on the other hand most plants are Se non-accumulators [247].
It has been shown previously that Se protects plants from herbivores [248-251].
The protection is based on the toxicity of selenium. Selenium is an essential nutrient in
physiology, but becomes toxic at elevated concentrations due to its chemical similarity
to sulphur. Se replaces sulphur in proteins and some other compounds important to all
living organisms. It has become an element of global environmental and health concern
because of its toxicity to organisms and the extensive use in industrial activities.
Removal of Se-containing toxins from contaminated water and soil using physical,
chemical, and engineering techniques is quite complicated and expensive [252], but it
can effectively be achieved by phytoremediation techniques that include the already
mentioned phytovolatilization [230, 253]. The main forms of Se in soils or water are
inorganic water soluble selenate (SeO42-) or selenite (SeO3
2-) ions. The ions are
assimilated using sulphur transporters and enzymes and transformed into volatile forms,
including dimethylselenide, (CH3)2Se, and dimethyldiselenide, (CH3)2Se2 [254]. Much
of the research in this area is not only related to bioremediation of selenium polluted
soil, but also to the importance of plants as a nutritional source of Se in the human diet
88
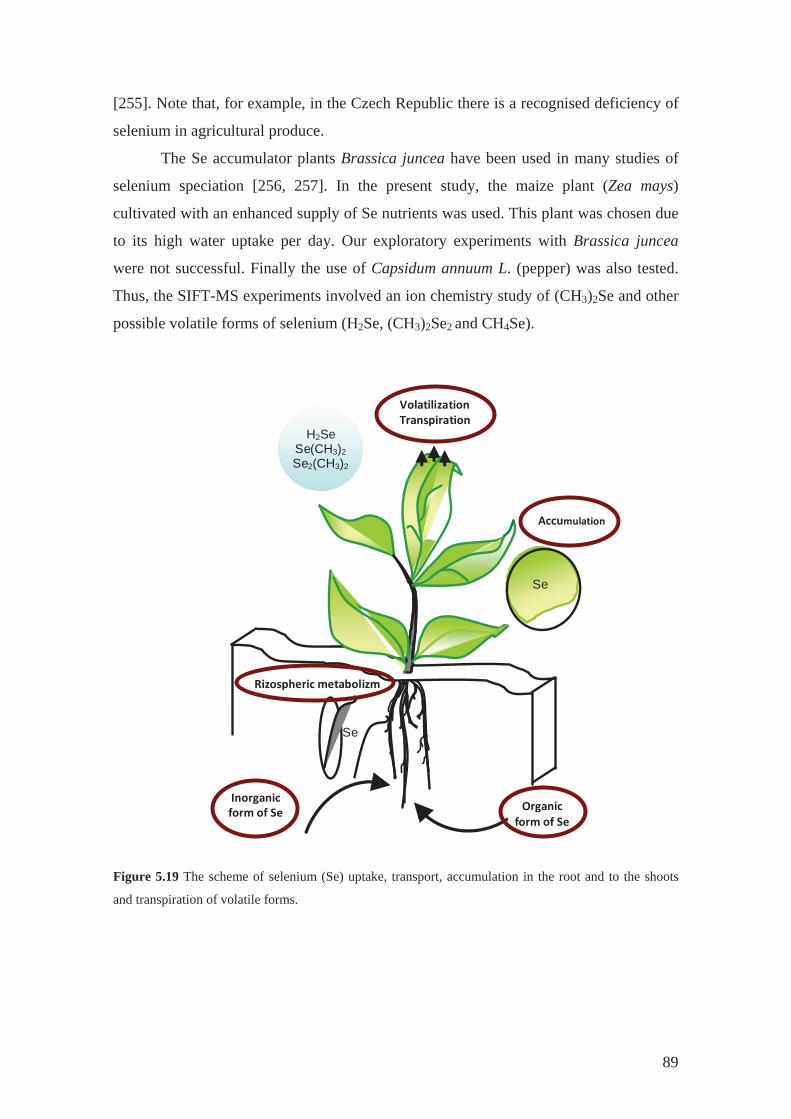
[255]. Note that, for example, in the Czech Republic there is a recognised deficiency of
selenium in agricultural produce.
The Se accumulator plants Brassica juncea have been used in many studies of
selenium speciation [256, 257]. In the present study, the maize plant (Zea mays)
cultivated with an enhanced supply of Se nutrients was used. This plant was chosen due
to its high water uptake per day. Our exploratory experiments with Brassica juncea
were not successful. Finally the use of Capsidum annuum L. (pepper) was also tested.
Thus, the SIFT-MS experiments involved an ion chemistry study of (CH3)2Se and other
possible volatile forms of selenium (H2Se, (CH3)2Se2 and CH4Se).
VolatilizationTranspiration
Organicform of Se
Accumulation
Rizospheric metabolizm
H2Se Se(CH3)2Se2(CH3)2
Inorganicform of Se
Se
Se
Figure 5.19 The scheme of selenium (Se) uptake, transport, accumulation in the root and to the shoots
and transpiration of volatile forms.
89
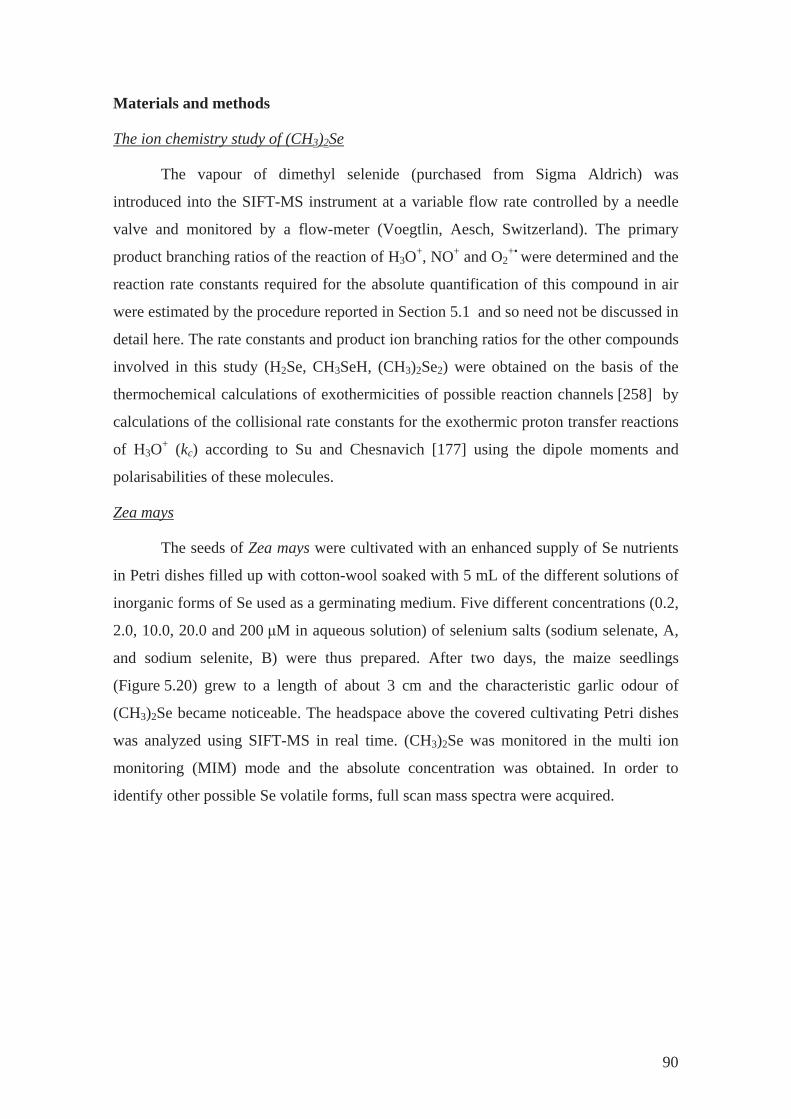
Materials and methods
The ion chemistry study of (CH3)2Se
The vapour of dimethyl selenide (purchased from Sigma Aldrich) was
introduced into the SIFT-MS instrument at a variable flow rate controlled by a needle
valve and monitored by a flow-meter (Voegtlin, Aesch, Switzerland). The primary
product branching ratios of the reaction of H3O+, NO+ and O2+• were determined and the
reaction rate constants required for the absolute quantification of this compound in air
were estimated by the procedure reported in Section 5.1 and so need not be discussed in
detail here. The rate constants and product ion branching ratios for the other compounds
involved in this study (H2Se, CH3SeH, (CH3)2Se2) were obtained on the basis of the
thermochemical calculations of exothermicities of possible reaction channels [258] by
calculations of the collisional rate constants for the exothermic proton transfer reactions
of H3O+ (kc) according to Su and Chesnavich [177] using the dipole moments and
polarisabilities of these molecules.
Zea mays
The seeds of Zea mays were cultivated with an enhanced supply of Se nutrients
in Petri dishes filled up with cotton-wool soaked with 5 mL of the different solutions of
inorganic forms of Se used as a germinating medium. Five different concentrations (0.2,
2.0, 10.0, 20.0 and 200 M in aqueous solution) of selenium salts (sodium selenate, A,
and sodium selenite, B) were thus prepared. After two days, the maize seedlings
(Figure 5.20) grew to a length of about 3 cm and the characteristic garlic odour of
(CH3)2Se became noticeable. The headspace above the covered cultivating Petri dishes
was analyzed using SIFT-MS in real time. (CH3)2Se was monitored in the multi ion
monitoring (MIM) mode and the absolute concentration was obtained. In order to
identify other possible Se volatile forms, full scan mass spectra were acquired.
90
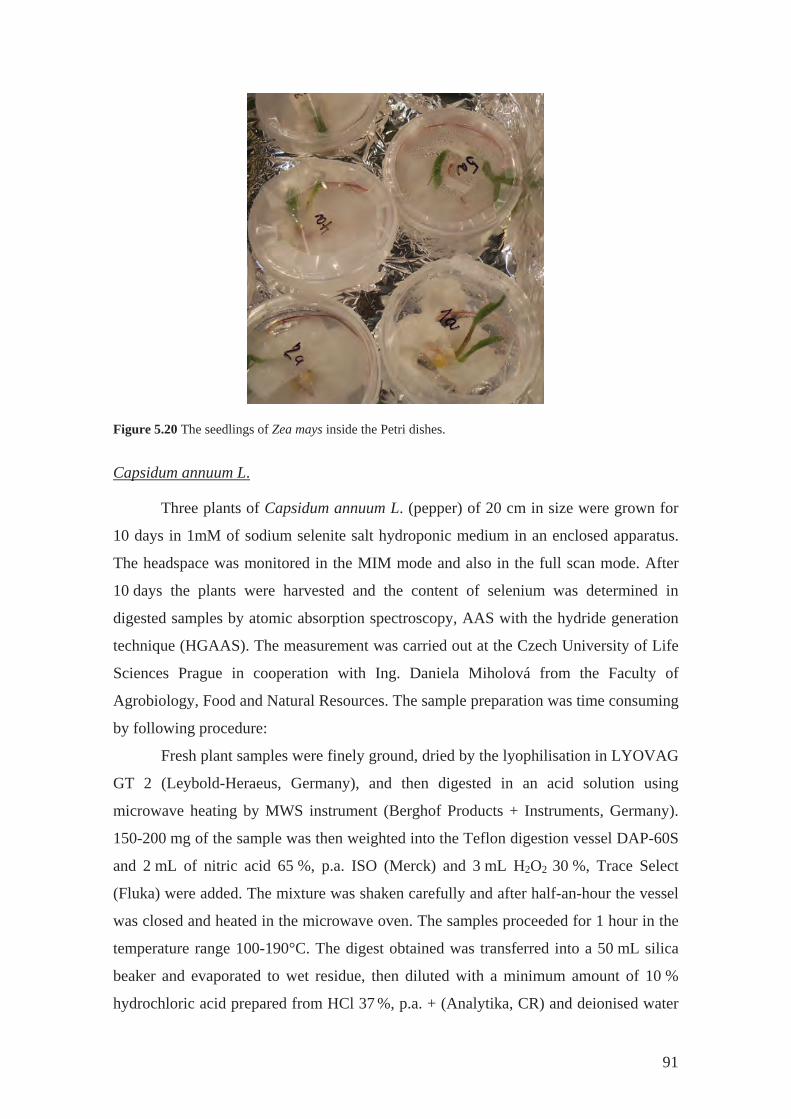
Figure 5.20 The seedlings of Zea mays inside the Petri dishes.
Capsidum annuum L.
Three plants of Capsidum annuum L. (pepper) of 20 cm in size were grown for
10 days in 1mM of sodium selenite salt hydroponic medium in an enclosed apparatus.
The headspace was monitored in the MIM mode and also in the full scan mode. After
10 days the plants were harvested and the content of selenium was determined in
digested samples by atomic absorption spectroscopy, AAS with the hydride generation
technique (HGAAS). The measurement was carried out at the Czech University of Life
Sciences Prague in cooperation with Ing. Daniela Miholová from the Faculty of
Agrobiology, Food and Natural Resources. The sample preparation was time consuming
by following procedure:
Fresh plant samples were finely ground, dried by the lyophilisation in LYOVAG
GT 2 (Leybold-Heraeus, Germany), and then digested in an acid solution using
microwave heating by MWS instrument (Berghof Products + Instruments, Germany).
150-200 mg of the sample was then weighted into the Teflon digestion vessel DAP-60S
and 2 mL of nitric acid 65 %, p.a. ISO (Merck) and 3 mL H2O2 30 %, Trace Select
(Fluka) were added. The mixture was shaken carefully and after half-an-hour the vessel
was closed and heated in the microwave oven. The samples proceeded for 1 hour in the
temperature range 100-190°C. The digest obtained was transferred into a 50 mL silica
beaker and evaporated to wet residue, then diluted with a minimum amount of 10 %
hydrochloric acid prepared from HCl 37 %, p.a. + (Analytika, CR) and deionised water
91
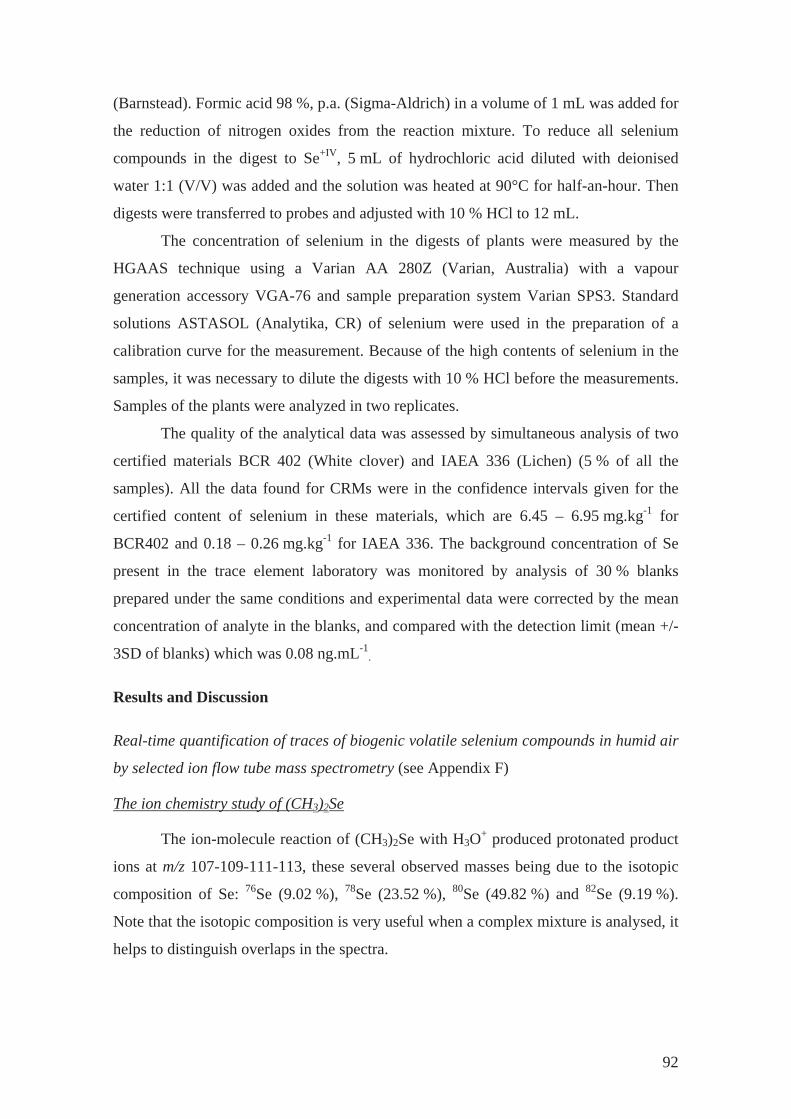
(Barnstead). Formic acid 98 %, p.a. (Sigma-Aldrich) in a volume of 1 mL was added for
the reduction of nitrogen oxides from the reaction mixture. To reduce all selenium
compounds in the digest to Se+IV, 5 mL of hydrochloric acid diluted with deionised
water 1:1 (V/V) was added and the solution was heated at 90°C for half-an-hour. Then
digests were transferred to probes and adjusted with 10 % HCl to 12 mL.
The concentration of selenium in the digests of plants were measured by the
HGAAS technique using a Varian AA 280Z (Varian, Australia) with a vapour
generation accessory VGA-76 and sample preparation system Varian SPS3. Standard
solutions ASTASOL (Analytika, CR) of selenium were used in the preparation of a
calibration curve for the measurement. Because of the high contents of selenium in the
samples, it was necessary to dilute the digests with 10 % HCl before the measurements.
Samples of the plants were analyzed in two replicates.
The quality of the analytical data was assessed by simultaneous analysis of two
certified materials BCR 402 (White clover) and IAEA 336 (Lichen) (5 % of all the
samples). All the data found for CRMs were in the confidence intervals given for the
certified content of selenium in these materials, which are 6.45 – 6.95 mg.kg-1 for
BCR402 and 0.18 – 0.26 mg.kg-1 for IAEA 336. The background concentration of Se
present in the trace element laboratory was monitored by analysis of 30 % blanks
prepared under the same conditions and experimental data were corrected by the mean
concentration of analyte in the blanks, and compared with the detection limit (mean +/-
3SD of blanks) which was 0.08 ng.mL-1.
Results and Discussion
Real-time quantification of traces of biogenic volatile selenium compounds in humid air
by selected ion flow tube mass spectrometry (see Appendix F)
The ion chemistry study of (CH3)2Se
The ion-molecule reaction of (CH3)2Se with H3O+ produced protonated product
ions at m/z 107-109-111-113, these several observed masses being due to the isotopic
composition of Se: 76Se (9.02 %), 78Se (23.52 %), 80Se (49.82 %) and 82Se (9.19 %).
Note that the isotopic composition is very useful when a complex mixture is analysed, it
helps to distinguish overlaps in the spectra.
92
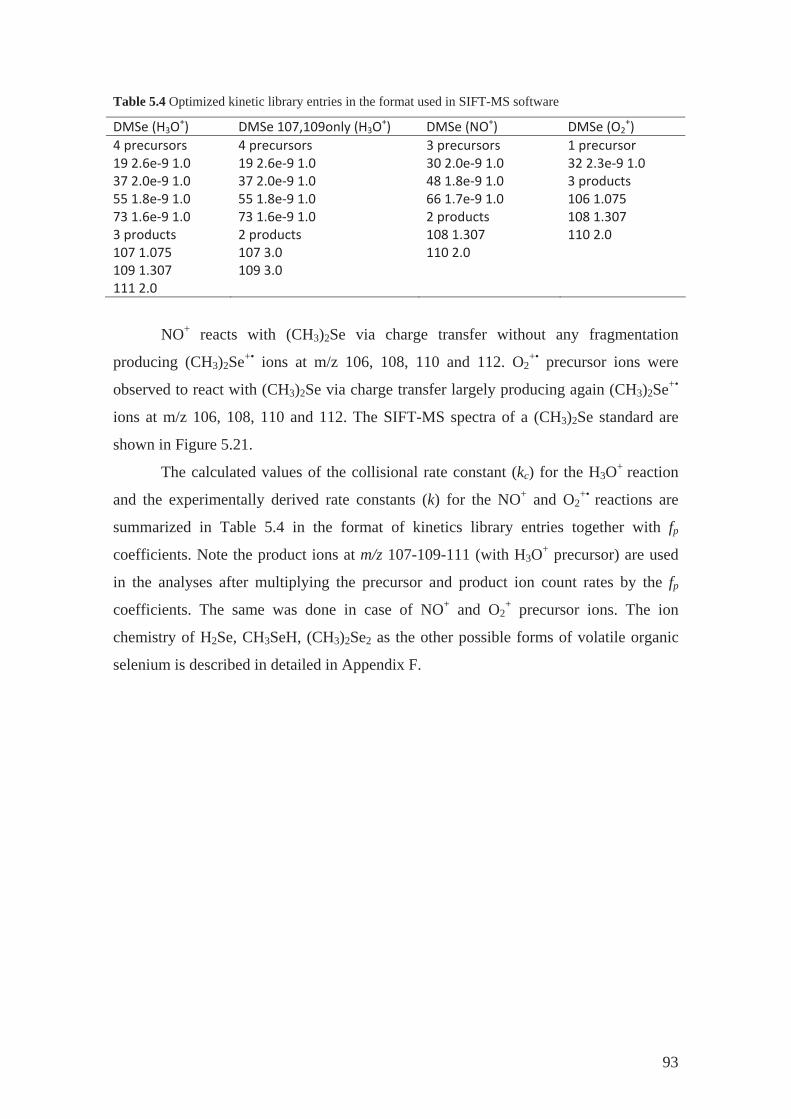
Table 5.4 Optimized kinetic library entries in the format used in SIFT-MS software
DMSe (H3O+) DMSe 107,109only (H3O+) DMSe (NO+) DMSe (O2+)
4 precursors 4 precursors 3 precursors 1 precursor19 2.6e 9 1.0 19 2.6e 9 1.0 30 2.0e 9 1.0 32 2.3e 9 1.037 2.0e 9 1.0 37 2.0e 9 1.0 48 1.8e 9 1.0 3 products55 1.8e 9 1.0 55 1.8e 9 1.0 66 1.7e 9 1.0 106 1.07573 1.6e 9 1.0 73 1.6e 9 1.0 2 products 108 1.3073 products 2 products 108 1.307 110 2.0107 1.075 107 3.0 110 2.0109 1.307 109 3.0111 2.0
NO+ reacts with (CH3)2Se via charge transfer without any fragmentation
producing (CH3)2Se+• ions at m/z 106, 108, 110 and 112. O2+• precursor ions were
observed to react with (CH3)2Se via charge transfer largely producing again (CH3)2Se+•
ions at m/z 106, 108, 110 and 112. The SIFT-MS spectra of a (CH3)2Se standard are
shown in Figure 5.21.
The calculated values of the collisional rate constant (kc) for the H3O+ reaction
and the experimentally derived rate constants (k) for the NO+ and O2+• reactions are
summarized in Table 5.4 in the format of kinetics library entries together with fp
coefficients. Note the product ions at m/z 107-109-111 (with H3O+ precursor) are used
in the analyses after multiplying the precursor and product ion count rates by the fp
coefficients. The same was done in case of NO+ and O2+ precursor ions. The ion
chemistry of H2Se, CH3SeH, (CH3)2Se2 as the other possible forms of volatile organic
selenium is described in detailed in Appendix F.
93
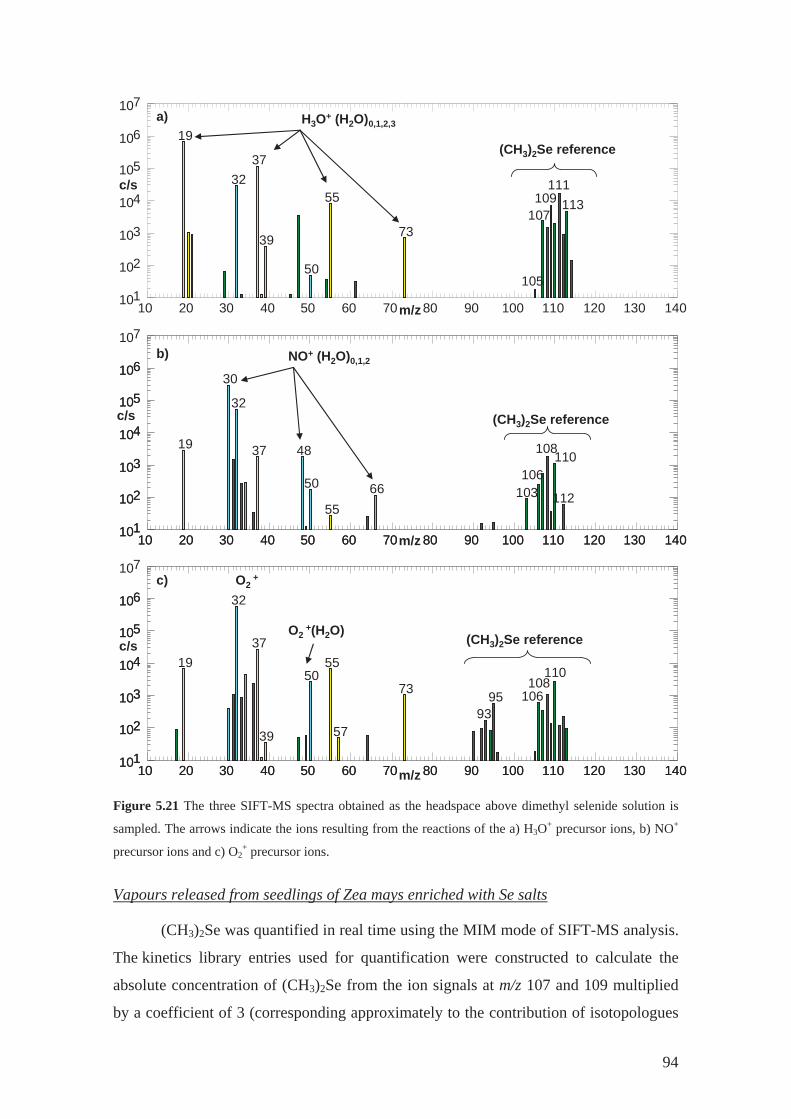
10 20 30 40 50 60 70 80 90 100 110 120 130 140101
102
103
104
105
106
107
c/s
m/z
19
3237
39
50
55
73
105
107109
111113
H3O+ (H2O)0,1,2,3
(CH3)2Se reference
10 20 30 40 50 60 70 80 90 10010 20 30 40 50 60 70 80 90 100 110 120 130 140101
102
103
104
105
106
110 120 130 140101
102
103
104
105
106
107
c/s
m/z
19
30
32
37 48
50
5566 103
106
108110
112
(CH3)2Se reference
NO+ (H2O)0,1,2
10 20 30 40 50 60 70 80 90 10010 20 30 40 50 60 70 80 90 100 110 120 130 140101
102
103
104
105
106
110 120 130 140101
102
103
104
105
106
107
c/s
m/z
19
32
37
39
5055
57
73
9395 106
108110
(CH3)2Se reference
O2+
O2+(H2O)
a)
b)
c)
Figure 5.21 The three SIFT-MS spectra obtained as the headspace above dimethyl selenide solution is
sampled. The arrows indicate the ions resulting from the reactions of the a) H3O+ precursor ions, b) NO+
precursor ions and c) O2+ precursor ions.
Vapours released from seedlings of Zea mays enriched with Se salts
(CH3)2Se was quantified in real time using the MIM mode of SIFT-MS analysis.
The kinetics library entries used for quantification were constructed to calculate the
absolute concentration of (CH3)2Se from the ion signals at m/z 107 and 109 multiplied
by a coefficient of 3 (corresponding approximately to the contribution of isotopologues
94
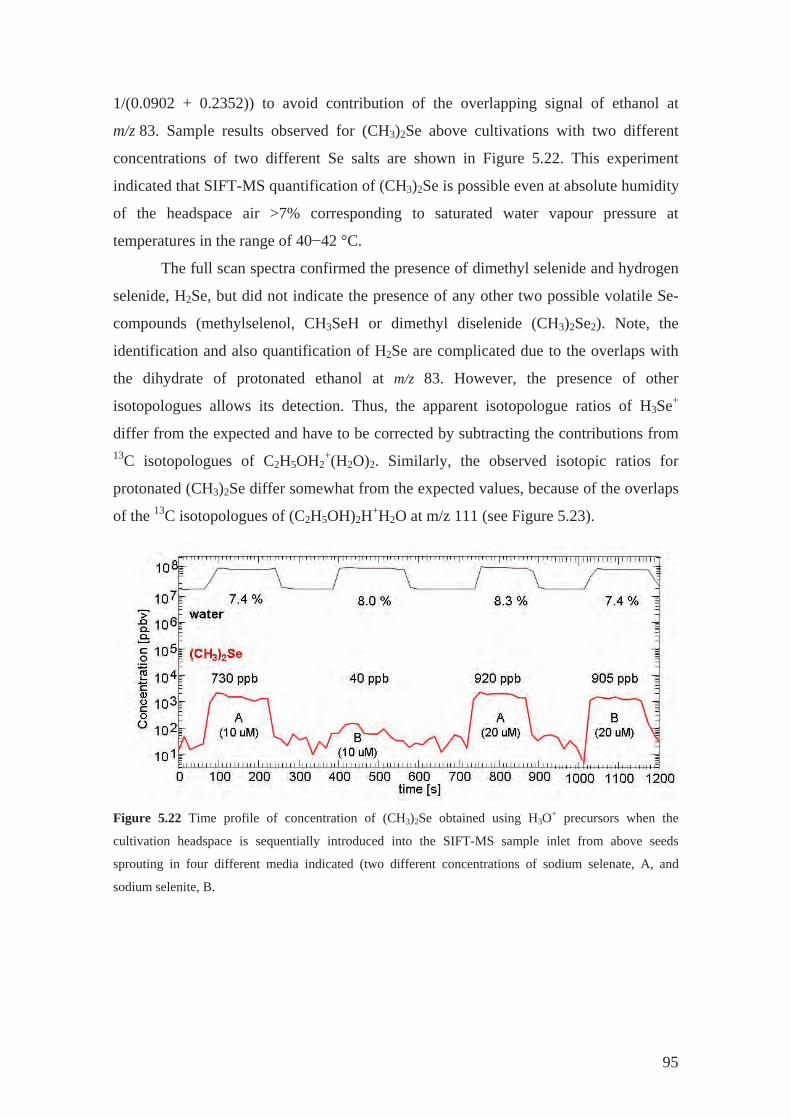
1/(0.0902 + 0.2352)) to avoid contribution of the overlapping signal of ethanol at
m/z 83. Sample results observed for (CH3)2Se above cultivations with two different
concentrations of two different Se salts are shown in Figure 5.22. This experiment
indicated that SIFT-MS quantification of (CH3)2Se is possible even at absolute humidity
of the headspace air >7% corresponding to saturated water vapour pressure at
temperatures in the range of 40 42 °C.
The full scan spectra confirmed the presence of dimethyl selenide and hydrogen
selenide, H2Se, but did not indicate the presence of any other two possible volatile Se-
compounds (methylselenol, CH3SeH or dimethyl diselenide (CH3)2Se2). Note, the
identification and also quantification of H2Se are complicated due to the overlaps with
the dihydrate of protonated ethanol at m/z 83. However, the presence of other
isotopologues allows its detection. Thus, the apparent isotopologue ratios of H3Se+
differ from the expected and have to be corrected by subtracting the contributions from 13C isotopologues of C2H5OH2
+(H2O)2. Similarly, the observed isotopic ratios for
protonated (CH3)2Se differ somewhat from the expected values, because of the overlaps
of the 13C isotopologues of (C2H5OH)2H+H2O at m/z 111 (see Figure 5.23).
Figure 5.22 Time profile of concentration of (CH3)2Se obtained using H3O+ precursors when the
cultivation headspace is sequentially introduced into the SIFT-MS sample inlet from above seeds
sprouting in four different media indicated (two different concentrations of sodium selenate, A, and
sodium selenite, B.
95
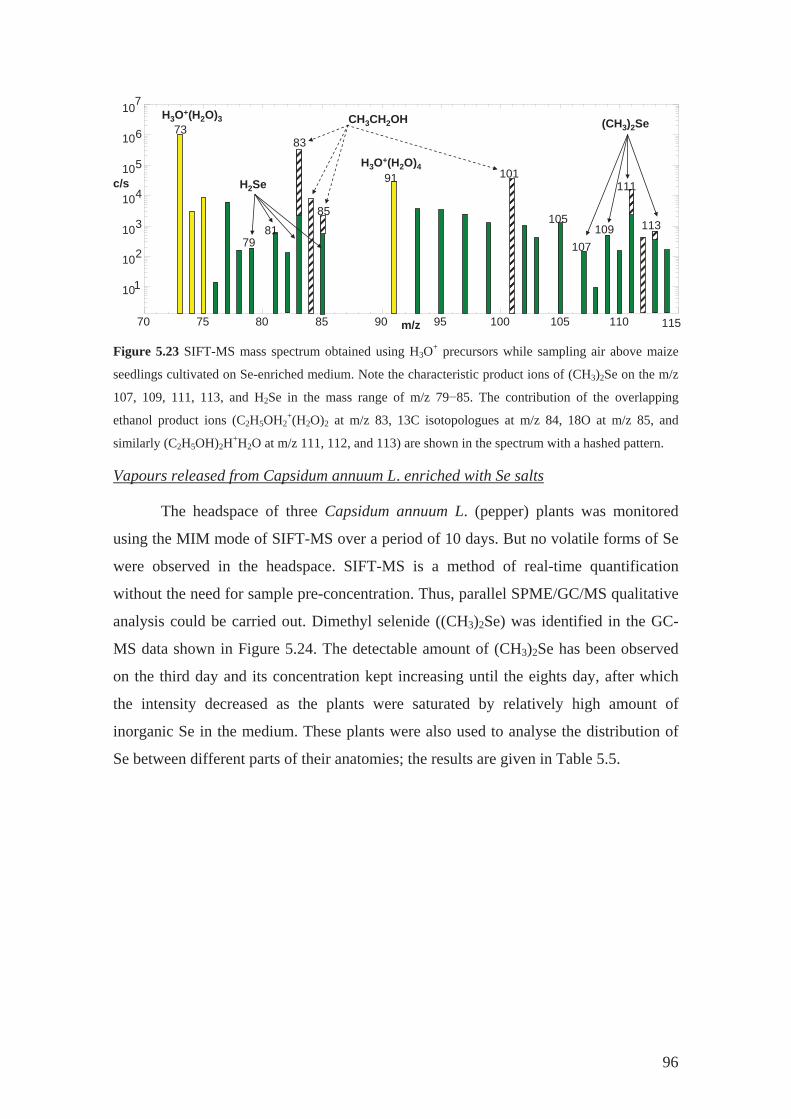
70 75 80 85 90 95 100 105 110 115
101
102
103
104
105
106
107
c/s
m/z
73
7981
83
85
91
113
107109
111101
(CH3)2Se
H2Se
CH3CH2OHH3O+(H2O)3
H3O+(H2O)4
105
Figure 5.23 SIFT-MS mass spectrum obtained using H3O+ precursors while sampling air above maize
seedlings cultivated on Se-enriched medium. Note the characteristic product ions of (CH3)2Se on the m/z
107, 109, 111, 113, and H2Se in the mass range of m/z 79 85. The contribution of the overlapping
ethanol product ions (C2H5OH2+(H2O)2 at m/z 83, 13C isotopologues at m/z 84, 18O at m/z 85, and
similarly (C2H5OH)2H+H2O at m/z 111, 112, and 113) are shown in the spectrum with a hashed pattern.
Vapours released from Capsidum annuum L. enriched with Se salts
The headspace of three Capsidum annuum L. (pepper) plants was monitored
using the MIM mode of SIFT-MS over a period of 10 days. But no volatile forms of Se
were observed in the headspace. SIFT-MS is a method of real-time quantification
without the need for sample pre-concentration. Thus, parallel SPME/GC/MS qualitative
analysis could be carried out. Dimethyl selenide ((CH3)2Se) was identified in the GC-
MS data shown in Figure 5.24. The detectable amount of (CH3)2Se has been observed
on the third day and its concentration kept increasing until the eights day, after which
the intensity decreased as the plants were saturated by relatively high amount of
inorganic Se in the medium. These plants were also used to analyse the distribution of
Se between different parts of their anatomies; the results are given in Table 5.5.
96
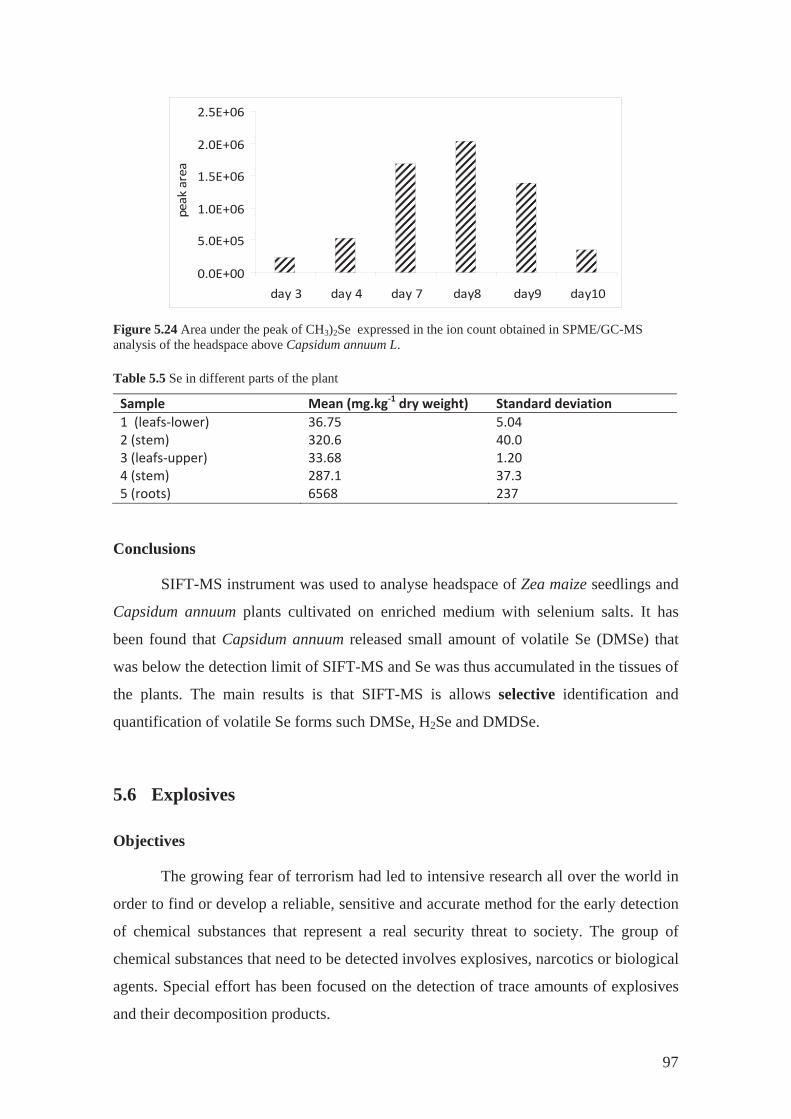
0.0E+00
5.0E+05
1.0E+06
1.5E+06
2.0E+06
2.5E+06
day 3 day 4 day 7 day8 day9 day10
peak
area
Figure 5.24 Area under the peak of CH3)2Se expressed in the ion count obtained in SPME/GC-MS analysis of the headspace above Capsidum annuum L. Table 5.5 Se in different parts of the plant
Sample Mean (mg.kg 1 dry weight) Standard deviation1 (leafs lower) 36.75 5.042 (stem) 320.6 40.03 (leafs upper) 33.68 1.204 (stem) 287.1 37.35 (roots) 6568 237
Conclusions
SIFT-MS instrument was used to analyse headspace of Zea maize seedlings and
Capsidum annuum plants cultivated on enriched medium with selenium salts. It has
been found that Capsidum annuum released small amount of volatile Se (DMSe) that
was below the detection limit of SIFT-MS and Se was thus accumulated in the tissues of
the plants. The main results is that SIFT-MS is allows selective identification and
quantification of volatile Se forms such DMSe, H2Se and DMDSe.
5.6 Explosives
Objectives
The growing fear of terrorism had led to intensive research all over the world in
order to find or develop a reliable, sensitive and accurate method for the early detection
of chemical substances that represent a real security threat to society. The group of
chemical substances that need to be detected involves explosives, narcotics or biological
agents. Special effort has been focused on the detection of trace amounts of explosives
and their decomposition products.
97
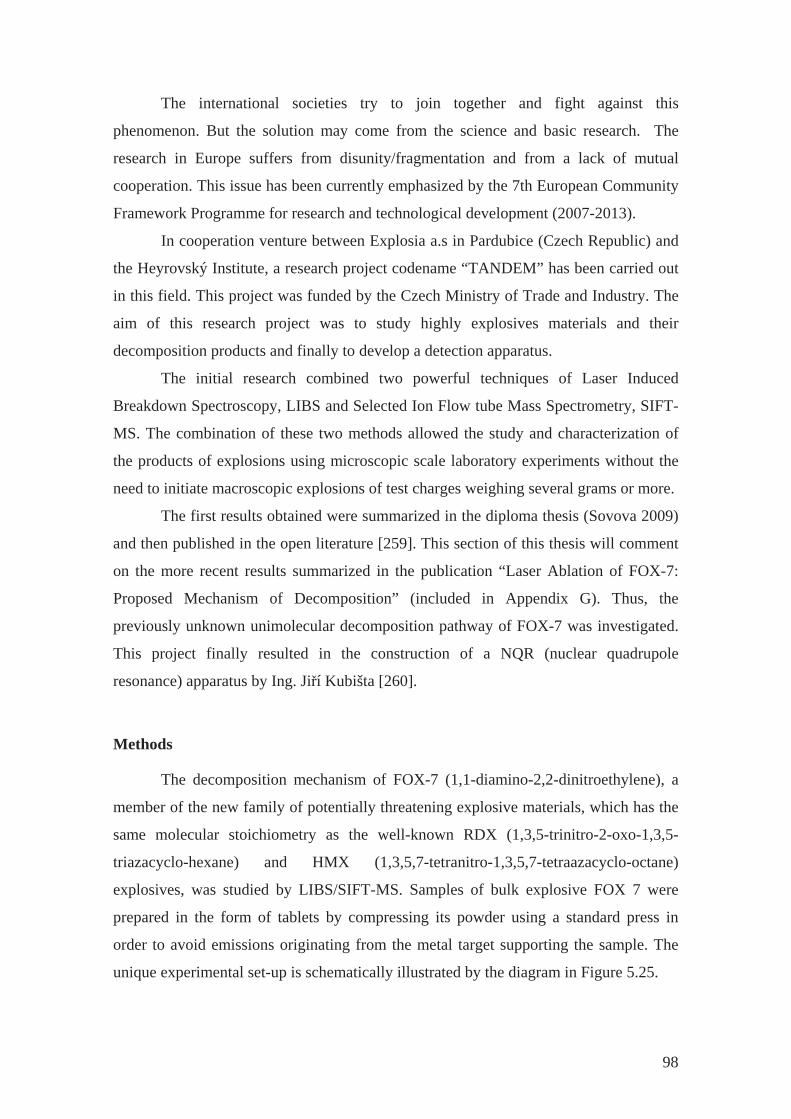
The international societies try to join together and fight against this
phenomenon. But the solution may come from the science and basic research. The
research in Europe suffers from disunity/fragmentation and from a lack of mutual
cooperation. This issue has been currently emphasized by the 7th European Community
Framework Programme for research and technological development (2007-2013).
In cooperation venture between Explosia a.s in Pardubice (Czech Republic) and
the Heyrovský Institute, a research project codename “TANDEM” has been carried out
in this field. This project was funded by the Czech Ministry of Trade and Industry. The
aim of this research project was to study highly explosives materials and their
decomposition products and finally to develop a detection apparatus.
The initial research combined two powerful techniques of Laser Induced
Breakdown Spectroscopy, LIBS and Selected Ion Flow tube Mass Spectrometry, SIFT-
MS. The combination of these two methods allowed the study and characterization of
the products of explosions using microscopic scale laboratory experiments without the
need to initiate macroscopic explosions of test charges weighing several grams or more.
The first results obtained were summarized in the diploma thesis (Sovova 2009)
and then published in the open literature [259]. This section of this thesis will comment
on the more recent results summarized in the publication “Laser Ablation of FOX-7:
Proposed Mechanism of Decomposition” (included in Appendix G). Thus, the
previously unknown unimolecular decomposition pathway of FOX-7 was investigated.
This project finally resulted in the construction of a NQR (nuclear quadrupole
resonance) apparatus by Ing. Ji í Kubišta [260].
Methods
The decomposition mechanism of FOX-7 (1,1-diamino-2,2-dinitroethylene), a
member of the new family of potentially threatening explosive materials, which has the
same molecular stoichiometry as the well-known RDX (1,3,5-trinitro-2-oxo-1,3,5-
triazacyclo-hexane) and HMX (1,3,5,7-tetranitro-1,3,5,7-tetraazacyclo-octane)
explosives, was studied by LIBS/SIFT-MS. Samples of bulk explosive FOX 7 were
prepared in the form of tablets by compressing its powder using a standard press in
order to avoid emissions originating from the metal target supporting the sample. The
unique experimental set-up is schematically illustrated by the diagram in Figure 5.25.
98
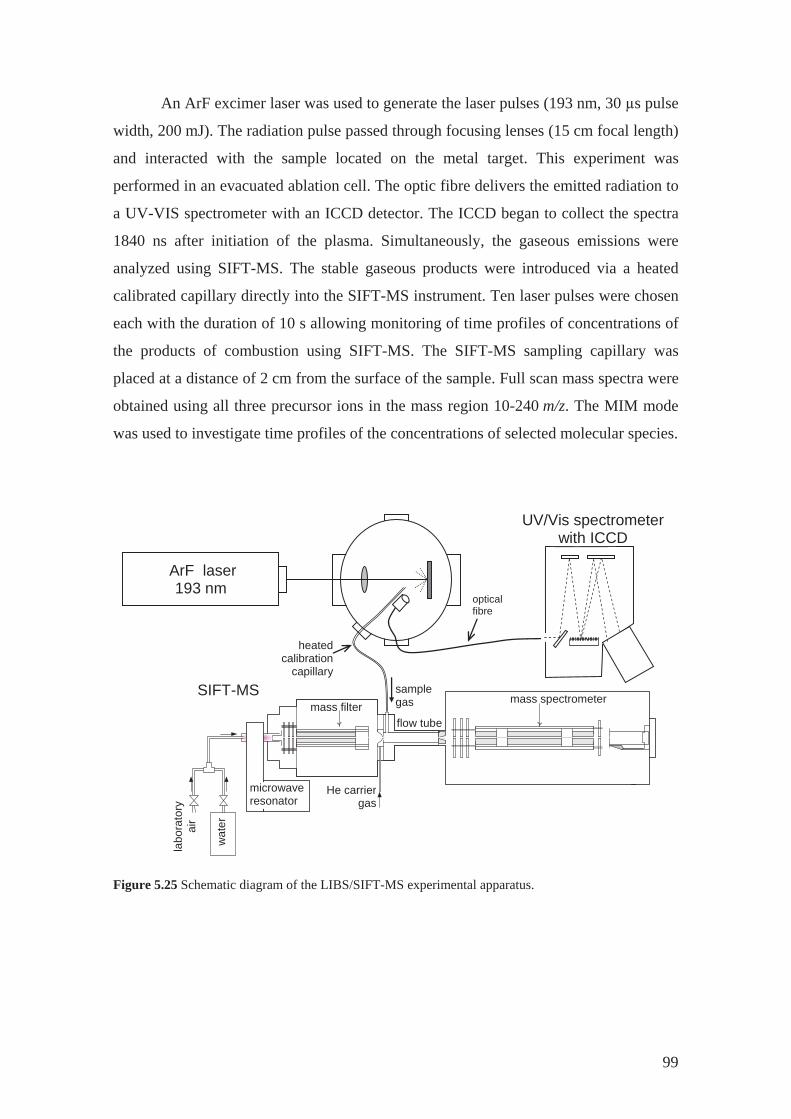
An ArF excimer laser was used to generate the laser pulses (193 nm, 30 μs pulse
width, 200 mJ). The radiation pulse passed through focusing lenses (15 cm focal length)
and interacted with the sample located on the metal target. This experiment was
performed in an evacuated ablation cell. The optic fibre delivers the emitted radiation to
a UV-VIS spectrometer with an ICCD detector. The ICCD began to collect the spectra
1840 ns after initiation of the plasma. Simultaneously, the gaseous emissions were
analyzed using SIFT-MS. The stable gaseous products were introduced via a heated
calibrated capillary directly into the SIFT-MS instrument. Ten laser pulses were chosen
each with the duration of 10 s allowing monitoring of time profiles of concentrations of
the products of combustion using SIFT-MS. The SIFT-MS sampling capillary was
placed at a distance of 2 cm from the surface of the sample. Full scan mass spectra were
obtained using all three precursor ions in the mass region 10-240 m/z. The MIM mode
was used to investigate time profiles of the concentrations of selected molecular species.
labo
rato
ry
air
wat
er
flow tube
He carriergas
mass filtermass spectrometer
samplegas
heatedcalibration
capillary
microwave resonator
ArF laser 193 nm
SIFT-MS
UV/Vis spectrometer with ICCD
optical fibre
Figure 5.25 Schematic diagram of the LIBS/SIFT-MS experimental apparatus.
99
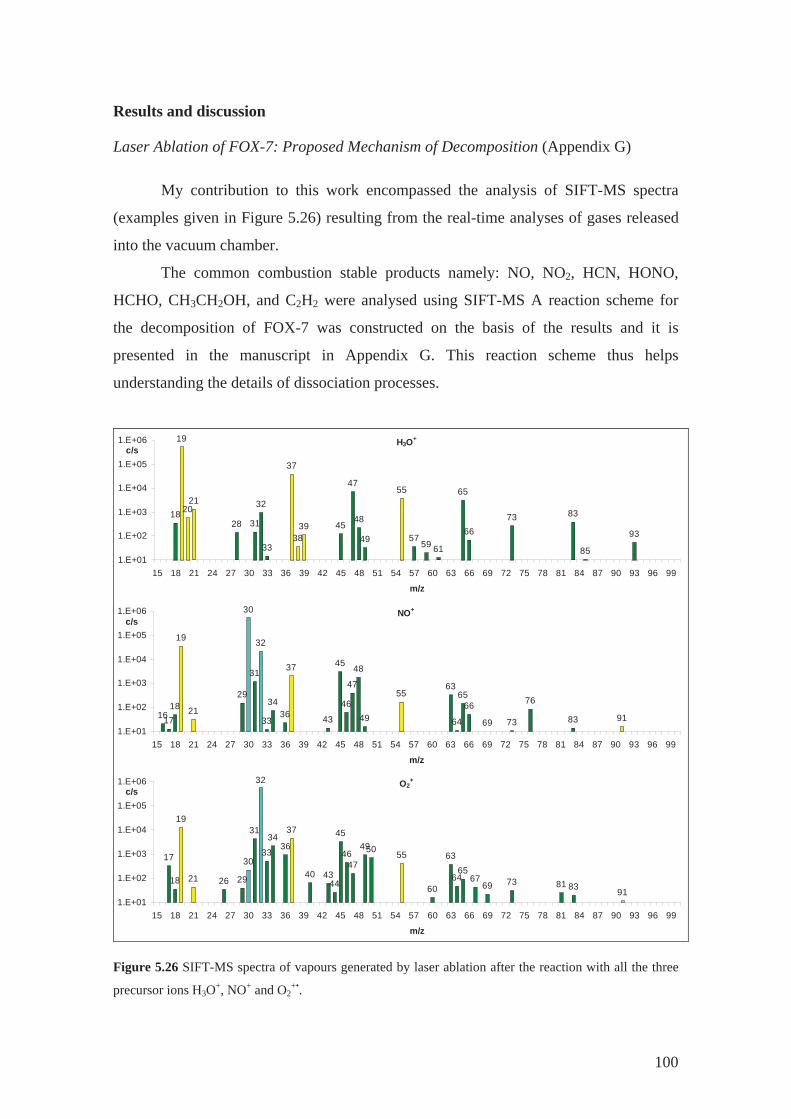
Results and discussion
Laser Ablation of FOX-7: Proposed Mechanism of Decomposition (Appendix G)
My contribution to this work encompassed the analysis of SIFT-MS spectra
(examples given in Figure 5.26) resulting from the real-time analyses of gases released
into the vacuum chamber.
The common combustion stable products namely: NO, NO2, HCN, HONO,
HCHO, CH3CH2OH, and C2H2 were analysed using SIFT-MS A reaction scheme for
the decomposition of FOX-7 was constructed on the basis of the results and it is
presented in the manuscript in Appendix G. This reaction scheme thus helps
understanding the details of dissociation processes.
H3O+
18
19
2021
28 31
32
33
37
3839 45
47
48
49
55
5759 61
65
6673 83
85
93
1.E+01
1.E+02
1.E+03
1.E+04
1.E+05
1.E+06
15 18 21 24 27 30 33 36 39 42 45 48 51 54 57 60 63 66 69 72 75 78 81 84 87 90 93 96 99
m/z
c/s
NO+
161718
19
21
29
30
31
32
33
3436
37
43
45
46
47
48
49
5563
64
6566
69 73
76
83 911.E+01
1.E+02
1.E+03
1.E+04
1.E+05
1.E+06
15 18 21 24 27 30 33 36 39 42 45 48 51 54 57 60 63 66 69 72 75 78 81 84 87 90 93 96 99
m/z
c/s
O2+
17
18
19
21 26 29
30
31
32
33
3436
37
40 4344
45
4647
4950 55
60
63
6465
6769 73 81 83 91
1.E+01
1.E+02
1.E+03
1.E+04
1.E+05
1.E+06
15 18 21 24 27 30 33 36 39 42 45 48 51 54 57 60 63 66 69 72 75 78 81 84 87 90 93 96 99
m/z
c/s
Figure 5.26 SIFT-MS spectra of vapours generated by laser ablation after the reaction with all the three
precursor ions H3O+, NO+ and O2+•.
100
Conclusions
An understanding of the decomposition mechanism is an important step in the
evaluation of the properties of a new type of explosive, FOX 7. The combination of
LIBS and SIFT-MS represents a powerful tool for the analysis of explosive
decomposition products. The relevance of the topic is obvious; the published paper has
already been cited four times according to the Web of Science (without self-citations).
These results were referred to by Gottfried et al. [261, 262], who used spectroscopic
techniques of laser induced breakdown spectroscopy (LIBS) to study explosive
residues, and by Cai at al. [263] who have very recently described the effect of an
ordered space structure on explosive properties of FOX-7 nanocrystals.
101
6 Summary and concluding remarks
This thesis summarises my research in a variety of subjects related to SIFT-MS
from fundamental ion chemistry, via development of analytical methods to their use in
interdisciplinary areas of research including microbiology, plant physiology, explosives
and medical diagnostics. In the population dynamics study I have also touched upon
advanced statistical analyses of data obtained using SIFT-MS.
There are several outcomes of my work:
1. I have obtained kinetic data for ion-molecule reaction of group of esters and
hexanol isomers. The rate constants and product ion branching ratio were
published in peer reviewed journals for almost 40 reactions (Appendices A and
B). The methodology for optimization of kinetics library entries avoiding cross
sensitivity was formulated and in detail described in Appendix A.
2. A new method for selective monitoring of volatile selenium forms such as
dimethylselenide, dimethyldiselenide, hydrogen selenide and methyl selenol was
described (Appendix F).
3. The ion chemistry of pentane and methyl thiocyanate relevant for the real time
monitoring of these two biomarkers of inflammatory bowel disease and cystic
fibrosis in human breath was investigated (Appendices C and D).
4. Results of a pilot study of population dynamics of three different bacterial
species that has been carried out non-destructively and quantitatively in real time
(Appendix E).
5. A reaction scheme for the decomposition of FOX-7 has been proposed on the
basis of SIFT-MS analyses of fumes (Appendix G).
These results will hopefully be useful for other researchers working in the individual
areas of science where SIFT-MS analyses of volatile compounds helps to understand
biological or chemical processes.
102

References
[1] K. Goodner, R. Rouseff, Practical analysis of flavor and fragrance materials, Wiley-Blackwell, 2011. [2] A. Herrmann, The chemistry and biology of volatiles, Wiley Online Library, 2010. [3] A. Amann, D. Smith, Volatile Biomarkers: Non-Invasive Diagnosis in Physiology and Medicine in, Elsevier, Oxford UK, 2013. [4] K. Demeestere, J. Dewulf, B. De Witte, H. Van Langenhove, Sample preparation for the analysis of volatile organic compounds in air and water matrices, J. Chromatogr. A, 1153 (2007) 130-144. [5] J. Koziel, M.Y. Jia, J. Pawliszyn, Air sampling with porous solid-phase microextraction fibers, Anal. Chem., 72 (2000) 5178-5186. [6] V. Ruzsanyi, J.I. Baumbach, S. Sielemann, P. Litterst, M. Westhoff, L. Freitag, Detection of human metabolites using multi-capillary columns coupled to ion mobility spectrometers, J. Chromatogr. A, 1084 (2005) 145-151. [7] M. Junger, W. Vautz, M. Kuhns, L. Hofmann, S. Ulbricht, J.I. Baumbach, M. Quintel, T. Perl, Ion mobility spectrometry for microbial volatile organic compounds: a new identification tool for human pathogenic bacteria, Appl. Microbiol. Biotechnol., 93 (2012) 2603-2614. [8] H.H. Mantsch, D. Naumann, Terahertz spectroscopy: The renaissance of far infrared spectroscopy, Journal of Molecular Structure, 964 (2010) 1-4. [9] J. Griffiths, A brief history of mass spectrometry, Anal. Chem., 80 (2008) 5678-5683. [10] K.D. Bartle, P. Myers, History of gas chromatography, TrAC Trends in Analytical Chemistry, 21 (2002) 547-557. [11] M. Ligor, T. Ligor, A. Bajtarevic, C. Ager, M. Pienz, M. Klieber, H. Denz, M. Fiegl, W. Hilbe, W. Weiss, P. Lukas, H. Jamnig, M. Hackl, B. Buszewski, W. Miekisch, J. Schubert, A. Amann, Determination of volatile organic compounds in exhaled breath of patients with lung cancer using solid phase microextraction and gas chromatography mass spectrometry, Clinical Chemistry and Laboratory Medicine, 47 (2009) 550-560. [12] E. Matisova, M. Dömötörová, Fast gas chromatography and its use in trace analysis, J. Chromatogr. A, 1000 (2003) 199-221. [13] M.S. Klee, L.M. Blumberg, Theoretical and practical aspects of fast gas chromatography and method translation, Journal of chromatographic science, 40 (2002) 234-247. [14] W. Filipiak, A. Sponring, A. Filipiak, C. Ager, J. Schubert, W. Miekisch, A. Amann, J. Troppmair, TD-GC-MS analysis of volatile metabolites of human lung cancer and normal cells in vitro, Cancer Epidemiology Biomarkers & Prevention, 19 (2010) 182-195. [15] V.T. Virkki, R.A. Ketola, M. Ojala, T. Kotiaho, V. Komppa, A. Grove, S. Facchetti, On-site environmental analysis by membrane inlet mass spectrometry, Anal. Chem., 67 (1995) 1421-1425. [16] A. Taylor, R. Linforth, B. Harvey, A. Blake, Atmospheric pressure chemical ionisation mass spectrometry for in vivo analysis of volatile flavour release, Food Chemistry, 71 (2000) 327-338. [17] F.M. Benoit, W. Davidson, A. Lovett, S. Nacson, A. Ngo, Breath analysis by atmospheric pressure ionization mass spectrometry, Anal. Chem., 55 (1983) 805-807.
104
[18] B. Thomson, W. Davidson, A. Lovett, Applications of a versatile technique for trace analysis: atmospheric pressure negative chemical ionization, Environ. Health Perspect., 36 (1980) 77. [19] I. Déléris, A. Saint Eve, E. Sémon, H. Guillemin, E. Guichard, I. Souchon, J.L. Le Quéré, Comparison of direct mass spectrometry methods for the on line analysis of volatile compounds in foods, J. Mass Spectrom., 48 (2013) 594-607. [20] L. Zhu, G. Gamez, H.W. Chen, H.X. Huang, K. Chingin, R. Zenobi, Real time, on line monitoring of organic chemical reactions using extractive electrospray ionization tandem mass spectrometry, Rapid Commun. Mass Spectrom., 22 (2008) 2993-2998. [21] J.J. Zhu, H.D. Bean, Y.M. Kuo, J.E. Hill, Fast Detection of Volatile Organic Compounds from Bacterial Cultures by Secondary Electrospray Ionization-Mass Spectrometry, Journal of Clinical Microbiology, 48 (2010) 4426-4431. [22] A. Amann, The State of Breath Analysis: Achievements and Challenges, Consequences for Applications, in: CONFERENCE SERIES, 2013, pp. 20. [23] E. Ferguson, F. Fehsenfeld, A. Schmeltekopf, Ion-molecule reaction rates measured in a discharge afterglow, Advances in Chemistry Series, (1969) 83-91. [24] W. Lindinger, A. Hansel, A. Jordan, On-line monitoring of volatile organic compounds at pptv levels by means of proton-transfer-reaction mass spectrometry (PTR-MS) medical applications, food control and environmental research, Int. J. Mass Spectrom. Ion Process., 173 (1998) 191-241. [25] W. Lindinger, A. Jordan, Proton-transfer-reaction mass spectrometry (PTR–MS): on-line monitoring of volatile organic compounds at pptv levels, Chem. Soc. Rev., 27 (1998) 347-375. [26] A. Hansel, A. Jordan, R. Holzinger, P. Prazeller, W. Vogel, W. Lindinger, Proton transfer reaction mass spectrometry: on-line trace gas analysis at the ppb level, Int. J. Mass Spectrom. Ion Process., 149 (1995) 609-619. [27] L. Cappellin, E. Aprea, P.M. GRANITTO, A. Romano, F. Gasperi, F. Biasioli, Chemometrics and direct injection analysis of volatile compounds by PTR-TOF-MS: a tool for metabolomic investigations, in: Pulkrabova, J.; Tomaniova, M.; Nielen, M.; Hajslova, J.(editors), Ist European workshop on ambient mass spectrometry and related mass spctrometry-based techniques in food/natural products control: safety, authenticity, forensics, metabolomics: June 18-20, 2012, Prague, Czech Republic, CZ, 2012. [28] A. Jordan, S. Haidacher, G. Hanel, E. Hartungen, J. Herbig, L. Märk, R. Schottkowsky, H. Seehauser, P. Sulzer, T. Märk, An online ultra-high sensitivity Proton-transfer-reaction mass-spectrometer combined with switchable reagent ion capability (PTR+ SRI MS), Int. J. Mass Spectrom., 286 (2009) 32-38. [29] A. Edtbauer, E. Hartungen, A. Jordan, P. Sulzer, S. Jürschik, S. Feil, G. Hanel, S. Jaksch, L. Märk, T.D. Märk, From Proton-Transfer-Reaction Mass Spectrometry (PTR-MS) to Universal Trace Gas Analysis with Selective-Reagent-Ionization Mass Spectrometry (SRI-MS) in Kr+ mode, in: CONFERENCE SERIES, 2013, pp. 76. [30] W. Lindinger, A. Hansel, A. Jordan, On-line monitoring of volatile organic compounds at pptv levels by means of proton-transfer-reaction mass spectrometry (PTR-MS) - Medical applications, food control and environmental research, Int. J. Mass Spectrom., 173 (1998) 191-241. [31] J. Herbig, M. Muller, S. Schallhart, T. Titzmann, M. Graus, A. Hansel, On-line breath analysis with PTR-TOF, J. Breath Res., 3 (2009). [32] P. Špan l, D. Smith, Progress in SIFT-MS: Breath analysis and other applications, Mass Spectrometry Reviews, 30 (2011) 236-267.
105
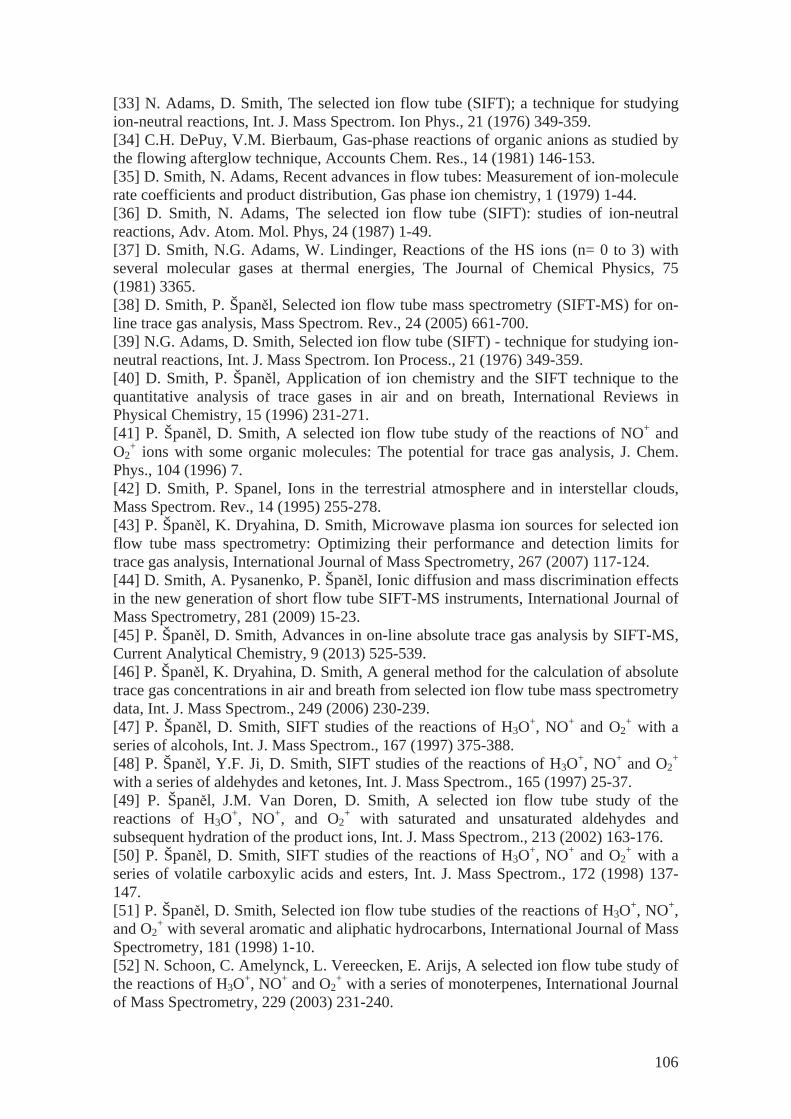
[33] N. Adams, D. Smith, The selected ion flow tube (SIFT); a technique for studying ion-neutral reactions, Int. J. Mass Spectrom. Ion Phys., 21 (1976) 349-359. [34] C.H. DePuy, V.M. Bierbaum, Gas-phase reactions of organic anions as studied by the flowing afterglow technique, Accounts Chem. Res., 14 (1981) 146-153. [35] D. Smith, N. Adams, Recent advances in flow tubes: Measurement of ion-molecule rate coefficients and product distribution, Gas phase ion chemistry, 1 (1979) 1-44. [36] D. Smith, N. Adams, The selected ion flow tube (SIFT): studies of ion-neutral reactions, Adv. Atom. Mol. Phys, 24 (1987) 1-49. [37] D. Smith, N.G. Adams, W. Lindinger, Reactions of the HS ions (n= 0 to 3) with several molecular gases at thermal energies, The Journal of Chemical Physics, 75 (1981) 3365. [38] D. Smith, P. Špan l, Selected ion flow tube mass spectrometry (SIFT-MS) for on-line trace gas analysis, Mass Spectrom. Rev., 24 (2005) 661-700. [39] N.G. Adams, D. Smith, Selected ion flow tube (SIFT) - technique for studying ion-neutral reactions, Int. J. Mass Spectrom. Ion Process., 21 (1976) 349-359. [40] D. Smith, P. Špan l, Application of ion chemistry and the SIFT technique to the quantitative analysis of trace gases in air and on breath, International Reviews in Physical Chemistry, 15 (1996) 231-271. [41] P. Špan l, D. Smith, A selected ion flow tube study of the reactions of NO+ and O2
+ ions with some organic molecules: The potential for trace gas analysis, J. Chem. Phys., 104 (1996) 7. [42] D. Smith, P. Spanel, Ions in the terrestrial atmosphere and in interstellar clouds, Mass Spectrom. Rev., 14 (1995) 255-278. [43] P. Špan l, K. Dryahina, D. Smith, Microwave plasma ion sources for selected ion flow tube mass spectrometry: Optimizing their performance and detection limits for trace gas analysis, International Journal of Mass Spectrometry, 267 (2007) 117-124. [44] D. Smith, A. Pysanenko, P. Špan l, Ionic diffusion and mass discrimination effects in the new generation of short flow tube SIFT-MS instruments, International Journal of Mass Spectrometry, 281 (2009) 15-23. [45] P. Špan l, D. Smith, Advances in on-line absolute trace gas analysis by SIFT-MS, Current Analytical Chemistry, 9 (2013) 525-539. [46] P. Špan l, K. Dryahina, D. Smith, A general method for the calculation of absolute trace gas concentrations in air and breath from selected ion flow tube mass spectrometry data, Int. J. Mass Spectrom., 249 (2006) 230-239. [47] P. Špan l, D. Smith, SIFT studies of the reactions of H3O+, NO+ and O2
+ with a series of alcohols, Int. J. Mass Spectrom., 167 (1997) 375-388. [48] P. Špan l, Y.F. Ji, D. Smith, SIFT studies of the reactions of H3O+, NO+ and O2
+ with a series of aldehydes and ketones, Int. J. Mass Spectrom., 165 (1997) 25-37. [49] P. Špan l, J.M. Van Doren, D. Smith, A selected ion flow tube study of the reactions of H3O+, NO+, and O2
+ with saturated and unsaturated aldehydes and subsequent hydration of the product ions, Int. J. Mass Spectrom., 213 (2002) 163-176. [50] P. Špan l, D. Smith, SIFT studies of the reactions of H3O+, NO+ and O2
+ with a series of volatile carboxylic acids and esters, Int. J. Mass Spectrom., 172 (1998) 137-147. [51] P. Špan l, D. Smith, Selected ion flow tube studies of the reactions of H3O+, NO+, and O2
+ with several aromatic and aliphatic hydrocarbons, International Journal of Mass Spectrometry, 181 (1998) 1-10. [52] N. Schoon, C. Amelynck, L. Vereecken, E. Arijs, A selected ion flow tube study of the reactions of H3O+, NO+ and O2
+ with a series of monoterpenes, International Journal of Mass Spectrometry, 229 (2003) 231-240.
106
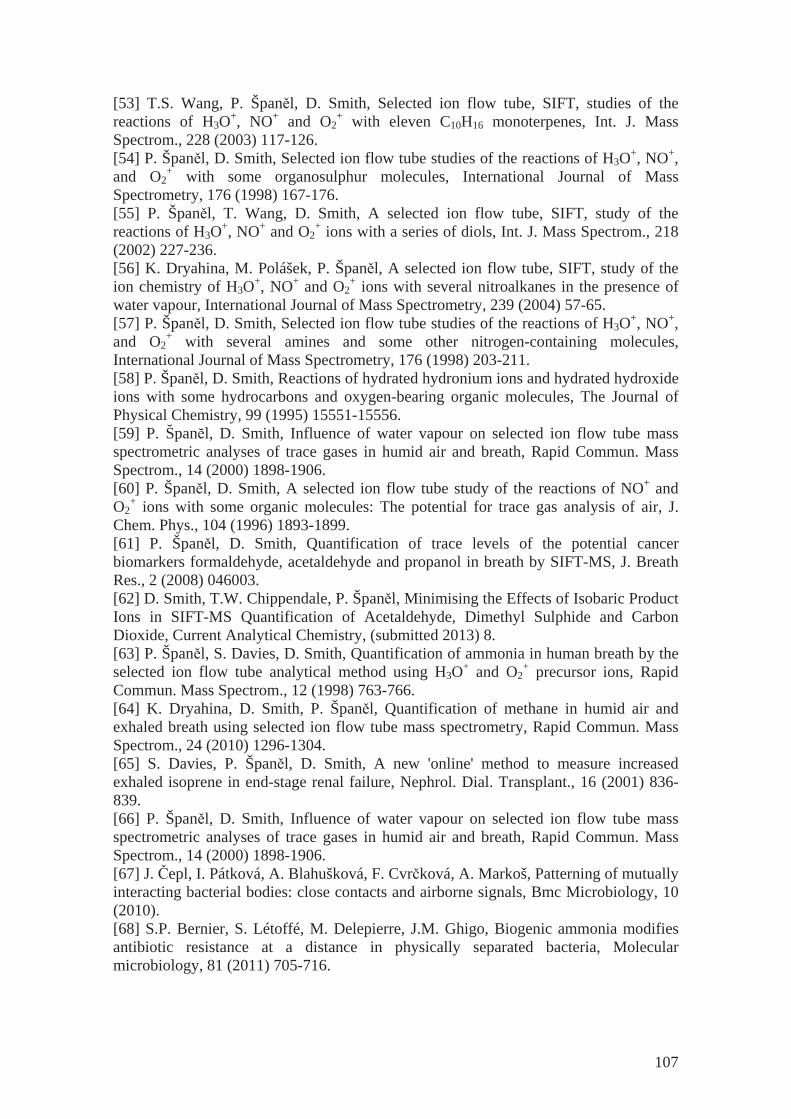
[53] T.S. Wang, P. Špan l, D. Smith, Selected ion flow tube, SIFT, studies of the reactions of H3O+, NO+ and O2
+ with eleven C10H16 monoterpenes, Int. J. Mass Spectrom., 228 (2003) 117-126. [54] P. Špan l, D. Smith, Selected ion flow tube studies of the reactions of H3O+, NO+, and O2
+ with some organosulphur molecules, International Journal of Mass Spectrometry, 176 (1998) 167-176. [55] P. Špan l, T. Wang, D. Smith, A selected ion flow tube, SIFT, study of the reactions of H3O+, NO+ and O2
+ ions with a series of diols, Int. J. Mass Spectrom., 218 (2002) 227-236. [56] K. Dryahina, M. Polášek, P. Špan l, A selected ion flow tube, SIFT, study of the ion chemistry of H3O+, NO+ and O2
+ ions with several nitroalkanes in the presence of water vapour, International Journal of Mass Spectrometry, 239 (2004) 57-65. [57] P. Špan l, D. Smith, Selected ion flow tube studies of the reactions of H3O+, NO+, and O2
+ with several amines and some other nitrogen-containing molecules, International Journal of Mass Spectrometry, 176 (1998) 203-211. [58] P. Špan l, D. Smith, Reactions of hydrated hydronium ions and hydrated hydroxide ions with some hydrocarbons and oxygen-bearing organic molecules, The Journal of Physical Chemistry, 99 (1995) 15551-15556. [59] P. Span l, D. Smith, Influence of water vapour on selected ion flow tube mass spectrometric analyses of trace gases in humid air and breath, Rapid Commun. Mass Spectrom., 14 (2000) 1898-1906. [60] P. Špan l, D. Smith, A selected ion flow tube study of the reactions of NO+ and O2
+ ions with some organic molecules: The potential for trace gas analysis of air, J. Chem. Phys., 104 (1996) 1893-1899. [61] P. Špan l, D. Smith, Quantification of trace levels of the potential cancer biomarkers formaldehyde, acetaldehyde and propanol in breath by SIFT-MS, J. Breath Res., 2 (2008) 046003. [62] D. Smith, T.W. Chippendale, P. Špan l, Minimising the Effects of Isobaric Product Ions in SIFT-MS Quantification of Acetaldehyde, Dimethyl Sulphide and Carbon Dioxide, Current Analytical Chemistry, (submitted 2013) 8. [63] P. Špan l, S. Davies, D. Smith, Quantification of ammonia in human breath by the selected ion flow tube analytical method using H3O+ and O2
+ precursor ions, Rapid Commun. Mass Spectrom., 12 (1998) 763-766. [64] K. Dryahina, D. Smith, P. Špan l, Quantification of methane in humid air and exhaled breath using selected ion flow tube mass spectrometry, Rapid Commun. Mass Spectrom., 24 (2010) 1296-1304. [65] S. Davies, P. Špan l, D. Smith, A new 'online' method to measure increased exhaled isoprene in end-stage renal failure, Nephrol. Dial. Transplant., 16 (2001) 836-839. [66] P. Špan l, D. Smith, Influence of water vapour on selected ion flow tube mass spectrometric analyses of trace gases in humid air and breath, Rapid Commun. Mass Spectrom., 14 (2000) 1898-1906. [67] J. epl, I. Pátková, A. Blahušková, F. Cvr ková, A. Markoš, Patterning of mutually interacting bacterial bodies: close contacts and airborne signals, Bmc Microbiology, 10 (2010). [68] S.P. Bernier, S. Létoffé, M. Delepierre, J.M. Ghigo, Biogenic ammonia modifies antibiotic resistance at a distance in physically separated bacteria, Molecular microbiology, 81 (2011) 705-716.
107
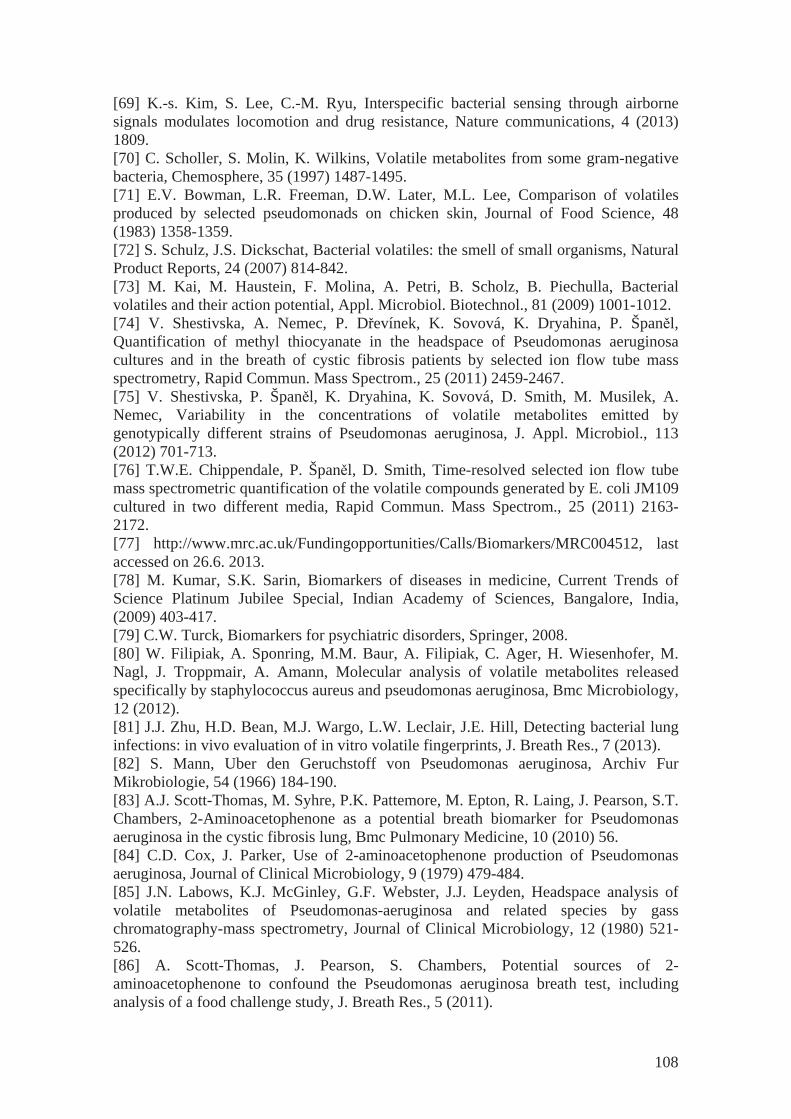
[69] K.-s. Kim, S. Lee, C.-M. Ryu, Interspecific bacterial sensing through airborne signals modulates locomotion and drug resistance, Nature communications, 4 (2013) 1809. [70] C. Scholler, S. Molin, K. Wilkins, Volatile metabolites from some gram-negative bacteria, Chemosphere, 35 (1997) 1487-1495. [71] E.V. Bowman, L.R. Freeman, D.W. Later, M.L. Lee, Comparison of volatiles produced by selected pseudomonads on chicken skin, Journal of Food Science, 48 (1983) 1358-1359. [72] S. Schulz, J.S. Dickschat, Bacterial volatiles: the smell of small organisms, Natural Product Reports, 24 (2007) 814-842. [73] M. Kai, M. Haustein, F. Molina, A. Petri, B. Scholz, B. Piechulla, Bacterial volatiles and their action potential, Appl. Microbiol. Biotechnol., 81 (2009) 1001-1012. [74] V. Shestivska, A. Nemec, P. D evínek, K. Sovová, K. Dryahina, P. Špan l, Quantification of methyl thiocyanate in the headspace of Pseudomonas aeruginosa cultures and in the breath of cystic fibrosis patients by selected ion flow tube mass spectrometry, Rapid Commun. Mass Spectrom., 25 (2011) 2459-2467. [75] V. Shestivska, P. Špan l, K. Dryahina, K. Sovová, D. Smith, M. Musilek, A. Nemec, Variability in the concentrations of volatile metabolites emitted by genotypically different strains of Pseudomonas aeruginosa, J. Appl. Microbiol., 113 (2012) 701-713. [76] T.W.E. Chippendale, P. Špan l, D. Smith, Time-resolved selected ion flow tube mass spectrometric quantification of the volatile compounds generated by E. coli JM109 cultured in two different media, Rapid Commun. Mass Spectrom., 25 (2011) 2163-2172. [77] http://www.mrc.ac.uk/Fundingopportunities/Calls/Biomarkers/MRC004512, last accessed on 26.6. 2013. [78] M. Kumar, S.K. Sarin, Biomarkers of diseases in medicine, Current Trends of Science Platinum Jubilee Special, Indian Academy of Sciences, Bangalore, India, (2009) 403-417. [79] C.W. Turck, Biomarkers for psychiatric disorders, Springer, 2008. [80] W. Filipiak, A. Sponring, M.M. Baur, A. Filipiak, C. Ager, H. Wiesenhofer, M. Nagl, J. Troppmair, A. Amann, Molecular analysis of volatile metabolites released specifically by staphylococcus aureus and pseudomonas aeruginosa, Bmc Microbiology, 12 (2012). [81] J.J. Zhu, H.D. Bean, M.J. Wargo, L.W. Leclair, J.E. Hill, Detecting bacterial lung infections: in vivo evaluation of in vitro volatile fingerprints, J. Breath Res., 7 (2013). [82] S. Mann, Uber den Geruchstoff von Pseudomonas aeruginosa, Archiv Fur Mikrobiologie, 54 (1966) 184-190. [83] A.J. Scott-Thomas, M. Syhre, P.K. Pattemore, M. Epton, R. Laing, J. Pearson, S.T. Chambers, 2-Aminoacetophenone as a potential breath biomarker for Pseudomonas aeruginosa in the cystic fibrosis lung, Bmc Pulmonary Medicine, 10 (2010) 56. [84] C.D. Cox, J. Parker, Use of 2-aminoacetophenone production of Pseudomonas aeruginosa, Journal of Clinical Microbiology, 9 (1979) 479-484. [85] J.N. Labows, K.J. McGinley, G.F. Webster, J.J. Leyden, Headspace analysis of volatile metabolites of Pseudomonas-aeruginosa and related species by gass chromatography-mass spectrometry, Journal of Clinical Microbiology, 12 (1980) 521-526. [86] A. Scott-Thomas, J. Pearson, S. Chambers, Potential sources of 2-aminoacetophenone to confound the Pseudomonas aeruginosa breath test, including analysis of a food challenge study, J. Breath Res., 5 (2011).
108
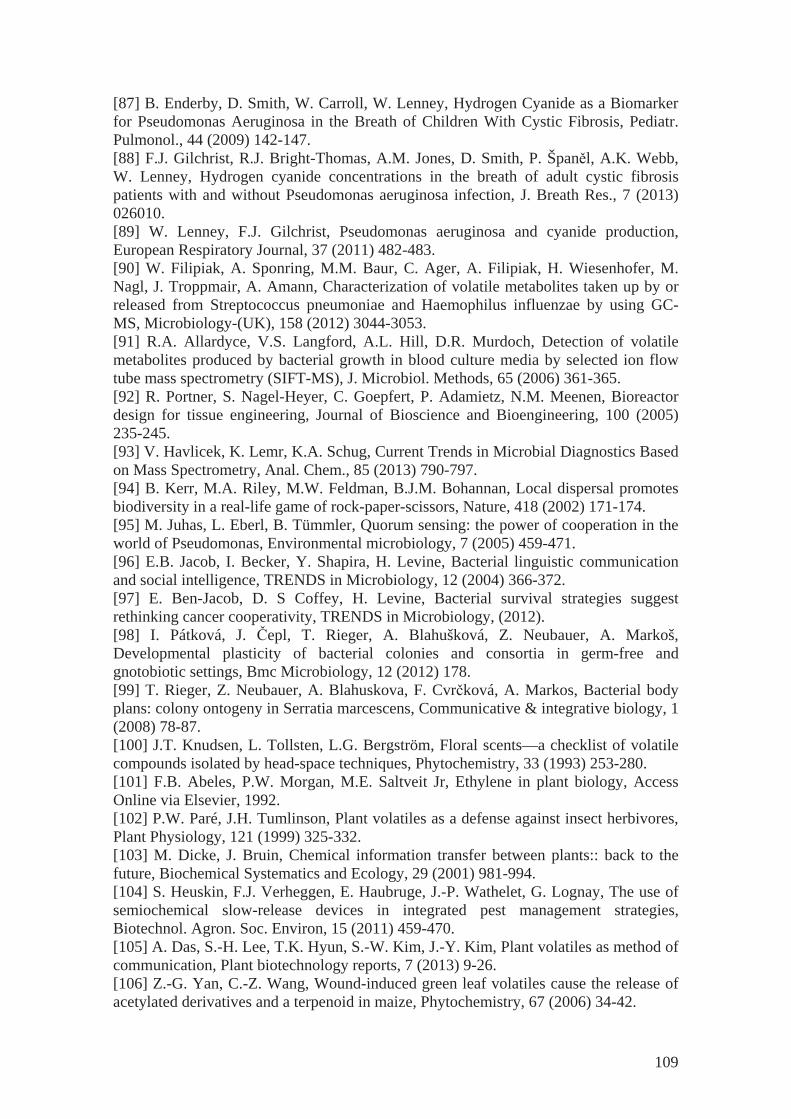
[87] B. Enderby, D. Smith, W. Carroll, W. Lenney, Hydrogen Cyanide as a Biomarker for Pseudomonas Aeruginosa in the Breath of Children With Cystic Fibrosis, Pediatr. Pulmonol., 44 (2009) 142-147. [88] F.J. Gilchrist, R.J. Bright-Thomas, A.M. Jones, D. Smith, P. Špan l, A.K. Webb, W. Lenney, Hydrogen cyanide concentrations in the breath of adult cystic fibrosis patients with and without Pseudomonas aeruginosa infection, J. Breath Res., 7 (2013) 026010. [89] W. Lenney, F.J. Gilchrist, Pseudomonas aeruginosa and cyanide production, European Respiratory Journal, 37 (2011) 482-483. [90] W. Filipiak, A. Sponring, M.M. Baur, C. Ager, A. Filipiak, H. Wiesenhofer, M. Nagl, J. Troppmair, A. Amann, Characterization of volatile metabolites taken up by or released from Streptococcus pneumoniae and Haemophilus influenzae by using GC-MS, Microbiology-(UK), 158 (2012) 3044-3053. [91] R.A. Allardyce, V.S. Langford, A.L. Hill, D.R. Murdoch, Detection of volatile metabolites produced by bacterial growth in blood culture media by selected ion flow tube mass spectrometry (SIFT-MS), J. Microbiol. Methods, 65 (2006) 361-365. [92] R. Portner, S. Nagel-Heyer, C. Goepfert, P. Adamietz, N.M. Meenen, Bioreactor design for tissue engineering, Journal of Bioscience and Bioengineering, 100 (2005) 235-245. [93] V. Havlicek, K. Lemr, K.A. Schug, Current Trends in Microbial Diagnostics Based on Mass Spectrometry, Anal. Chem., 85 (2013) 790-797. [94] B. Kerr, M.A. Riley, M.W. Feldman, B.J.M. Bohannan, Local dispersal promotes biodiversity in a real-life game of rock-paper-scissors, Nature, 418 (2002) 171-174. [95] M. Juhas, L. Eberl, B. Tümmler, Quorum sensing: the power of cooperation in the world of Pseudomonas, Environmental microbiology, 7 (2005) 459-471. [96] E.B. Jacob, I. Becker, Y. Shapira, H. Levine, Bacterial linguistic communication and social intelligence, TRENDS in Microbiology, 12 (2004) 366-372. [97] E. Ben-Jacob, D. S Coffey, H. Levine, Bacterial survival strategies suggest rethinking cancer cooperativity, TRENDS in Microbiology, (2012). [98] I. Pátková, J. epl, T. Rieger, A. Blahušková, Z. Neubauer, A. Markoš, Developmental plasticity of bacterial colonies and consortia in germ-free and gnotobiotic settings, Bmc Microbiology, 12 (2012) 178. [99] T. Rieger, Z. Neubauer, A. Blahuskova, F. Cvr ková, A. Markos, Bacterial body plans: colony ontogeny in Serratia marcescens, Communicative & integrative biology, 1 (2008) 78-87. [100] J.T. Knudsen, L. Tollsten, L.G. Bergström, Floral scents—a checklist of volatile compounds isolated by head-space techniques, Phytochemistry, 33 (1993) 253-280. [101] F.B. Abeles, P.W. Morgan, M.E. Saltveit Jr, Ethylene in plant biology, Access Online via Elsevier, 1992. [102] P.W. Paré, J.H. Tumlinson, Plant volatiles as a defense against insect herbivores, Plant Physiology, 121 (1999) 325-332. [103] M. Dicke, J. Bruin, Chemical information transfer between plants:: back to the future, Biochemical Systematics and Ecology, 29 (2001) 981-994. [104] S. Heuskin, F.J. Verheggen, E. Haubruge, J.-P. Wathelet, G. Lognay, The use of semiochemical slow-release devices in integrated pest management strategies, Biotechnol. Agron. Soc. Environ, 15 (2011) 459-470. [105] A. Das, S.-H. Lee, T.K. Hyun, S.-W. Kim, J.-Y. Kim, Plant volatiles as method of communication, Plant biotechnology reports, 7 (2013) 9-26. [106] Z.-G. Yan, C.-Z. Wang, Wound-induced green leaf volatiles cause the release of acetylated derivatives and a terpenoid in maize, Phytochemistry, 67 (2006) 34-42.
109
[107] J.G. de Boer, C.A. Hordijk, M.A. Posthumus, M. Dicke, Prey and non-prey arthropods sharing a host plant: effects on induced volatile emission and predator attraction, Journal of Chemical Ecology, 34 (2008) 281-290. [108] T. Hirao, A. Okazawa, K. Harada, A. Kobayashi, T. Muranaka, K. Hirata, Green leaf volatiles enhance methyl jasmonate response in Arabidopsis, Journal of Bioscience and Bioengineering, (2012). [109] E. Gallego Piñol, A. Gelabert, F.J. Roca Mussons, F. Perales, X. Guardino, Identification of volatile organic compounds (VOC) emitted from three European orchid species with different pollination strategies: two deceptive orchids (Himantoglossum robertianum and Ophrys apifera) and a rewarding (Gymnadenia conopsea), (2012). [110] S. Oluwafemi, M. Birkett, J. Caulfield, J. Pickett, Variability of volatile organic compounds emitted by seedlings of seven African maize varieties when infested by adult Cicadulina storeyi China leafhopper vectors of maize streak virus, African Crop Science Journal, 20 (2012) 117-124. [111] J. Linz, A. Baschwitz, A. Strutz, H.K. Dweck, S. Sachse, B.S. Hansson, M.C. Stensmyr, Host plant-driven sensory specialization in Drosophila erecta, Proceedings of the Royal Society B: Biological Sciences, 280 (2013). [112] R.A. Levin, R.A. Raguso, L.A. McDade, Fragrance chemistry and pollinator affinities in Nyctaginaceae, Phytochemistry, 58 (2001) 429-440. [113] I. Guterman, T. Masci, X. Chen, F. Negre, E. Pichersky, N. Dudareva, D. Weiss, A. Vainstein, Generation of phenylpropanoid pathway-derived volatiles in transgenic plants: rose alcohol acetyltransferase produces phenylethyl acetate and benzyl acetate in petunia flowers, Plant molecular biology, 60 (2006) 555-563. [114] H. Taki, H. Makihara, T. Matsumura, M. Hasegawa, T. Matsuura, H. Tanaka, S.i. Makino, K. Okabe, Evaluation of secondary forests as alternative habitats to primary forests for flower-visiting insects, Journal of Insect Conservation, (2013) 1-8. [115] J.-i. Horiuchi, D.V. Badri, B.A. Kimball, F. Negre, N. Dudareva, M.W. Paschke, J.M. Vivanco, The floral volatile, methyl benzoate, from snapdragon (Antirrhinum majus) triggers phytotoxic effects in Arabidopsis thaliana, Planta, 226 (2007) 1-10. [116] W. Kegge, R. Pierik, Biogenic volatile organic compounds and plant competition, Trends in plant science, 15 (2010) 126-132. [117] E. Pichersky, J. Gershenzon, The formation and function of plant volatiles: perfumes for pollinator attraction and defense, Current opinion in plant biology, 5 (2002) 237-243. [118] M.C. Wildermuth, Variations on a theme: synthesis and modification of plant benzoic acids, Current opinion in plant biology, 9 (2006) 288-296. [119] J.G. De Boer, M. Dicke, The role of methyl salicylate in prey searching behavior of the predatory mite Phytoseiulus persimilis, Journal of Chemical Ecology, 30 (2004) 255-271. [120] R.A. Robergs, D. Dwyer, T. Astorino, Recommendations for improved data processing from expired gas analysis indirect calorimetry, Sports Medicine, 40 (2010) 95-111. [121] D.A. Lindberg, Hydrogen Breath Testing in Adults: What Is It and Why Is It Performed?, Gastroenterology Nursing, 33 (2010) 8. [122] P. Španel, D. Smith, Volatile compounds in health and disease, Current Opinion in Clinical Nutrition & Metabolic Care, 14 (2011) 455-460. [123] S.F. Solga, M. Mudalel, L.A. Spacek, R. Lewicki, F. Tittel, C. Loccioni, A. Russo, T.H. Risby, Factors influencing breath ammonia determination, J. Breath Res., 7 (2013) 037101.
110
[124] P. Španel, K. Dryahina, D. Smith, The concentration distributions of some metabolites in the exhaled breath of young adults, J. Breath Res., 1 (2007) 026001. [125] E.E. Owen, R.R. Robinson, Amino acid extraction and ammonia metabolism by the human kidney during the prolonged administration of ammonium chloride, Journal of Clinical Investigation, 42 (1963) 263. [126] C. Turner, B. Parekh, C. Walton, P. Špan l, D. Smith, M. Evans, An exploratory comparative study of volatile compounds in exhaled breath and emitted by skin using selected ion flow tube mass spectrometry, Rapid communications in mass spectrometry, 22 (2008) 526-532. [127] F.M. Schmidt, O. Vaittinen, M. Metsala, M. Lehto, C. Forsblom, P.H. Groop, L. Halonen, Ammonia in breath and emitted from skin, J. Breath Res., 7 (2013). [128] P. Špan l, C. Turner, T.S. Wang, R. Bloor, D. Smith, Generation of volatile compounds on mouth exposure to urea and sucrose: implications for exhaled breath analysis, Physiol. Meas., 27 (2006) N7-N17. [129] T.S. Wang, A. Pysanenko, K. Dryahina, P. Spanel, D. Smith, Analysis of breath, exhaled via the mouth and nose, and the air in the oral cavity, J. Breath Res., 2 (2008). [130] D. Smith, T.S. Wang, A. Pysanenko, P. Špan l, A selected ion flow tube mass spectrometry study of ammonia in mouth- and nose-exhaled breath and in the oral cavity, Rapid Commun. Mass Spectrom., 22 (2008) 783-789. [131] P.R. Boshier, N. Marczin, G.B. Hanna, Repeatability of the Measurement of Exhaled Volatile Metabolites Using Selected Ion Flow Tube Mass Spectrometry, J. Am. Soc. Mass Spectrom., 21 (2010) 1070-1074. [132] D. Smith, P. Špan l, The challenge of breath analysis for clinical diagnosis and therapeutic monitoring, Analyst, 132 (2007) 390-396. [133] A. Kotani, Y. Wakabayashi, M. Kohama, F. Kusu, Determination of Ammonia in Exhaled Breath by Flow Injection Analysis with Electrochemical Detection, Electrochemistry, 80 (2012) 340-344. [134] F.K. Tittel, R.F. Curl, L. Dong, R. Lewicki, Infrared Semiconductor laser based trace gas sensor Technologies: Recent Advances and Applications, in: F. Baldini, J. Homola, R.A. Lieberman, K. Kalli (Eds.) Optical Sensors 2011 and Photonic Crystal Fibers V, 2011. [135] T. Hibbard, K. Crowley, A.J. Killard, Direct measurement of ammonia in simulated human breath using an inkjet-printed polyaniline nanoparticle sensor, Anal. Chim. Acta, 779 (2013) 56-63. [136] L.R. Narasimhan, W. Goodman, C.K.N. Patel, Correlation of breath ammonia with blood urea nitrogen and creatinine during hemodialysis, Proceedings of the National Academy of Sciences of the United States of America, 98 (2001) 4617-4621. [137] G. Neri, A. Lacquaniti, G. Rizzo, N. Donato, M. Latino, M. Buemi, Real-time monitoring of breath ammonia during haemodialysis: use of ion mobility spectrometry (IMS) and cavity ring-down spectroscopy (CRDS) techniques, Nephrol. Dial. Transplant., 27 (2012) 2945-2952. [138] C. Turner, P. Špan l, D. Smith, A longitudinal study of ammonia, acetone and propanol in the exhaled breath of 30 subjects using selected ion flow tube mass spectrometry, SIFT-MS, Physiol. Meas., 27 (2006) 321-337. [139] P. Špan l, K. Dryahina, D. Smith, Acetone, ammonia and hydrogen cyanide in exhaled breath of several volunteers aged 4-83 years, J. Breath Res., 1 (2007). [140] L. Laffel, Ketone bodies: a review of physiology, pathophysiology and application of monitoring to diabetes, Diabetes/metabolism research and reviews, 15 (1999) 412-426.
111
[141] M.P. Kalapos, On the mammalian acetone metabolism: from chemistry to clinical implications, Biochimica et Biophysica Acta (BBA)-General Subjects, 1621 (2003) 122-139. [142] A. Manolis, The Diagnostic Potential of Breath Analysis, Clinical Chemistry, 29 (1983) 5-15. [143] A.D. Worrall, J.A. Bernstein, A.P. Angelopoulos, Portable method of measuring gaseous acetone concentrations, Talanta, 112 (2013) 26-30. [144] J. Shin, S.J. Choi, I. Lee, D.Y. Youn, C.O. Park, J.H. Lee, H.L. Tuller, I.D. Kim, Thin-Wall Assembled SnO2 Fibers Functionalized by Catalytic Pt Nanoparticles and their Superior Exhaled-Breath-Sensing Properties for the Diagnosis of Diabetes, Advanced Functional Materials, 23 (2013) 2357-2367. [145] T.I. Nasution, I. Nainggolan, S.D. Hutagalung, K.R. Ahmad, Z.A. Ahmad, The sensing mechanism and detection of low concentration acetone using chitosan-based sensors, Sensors and Actuators B-Chemical, 177 (2013) 522-528. [146] M. Righettoni, A. Tricoli, S. Gass, A. Schmid, A. Amann, S.E. Pratsinis, Breath acetone monitoring by portable Si:WO3 gas sensors, Anal. Chim. Acta, 738 (2012) 69-75. [147] G.F. Meng, Q. Xiang, Q.Y. Pan, J.Q. Xu, The Selective Acetone Detection Based on Fe3O4 Doped WO3 Nanorods, Sensor Letters, 9 (2011) 128-131. [148] P. Špan l, K. Dryahina, A. Rejšková, T.W. Chippendale, D. Smith, Breath acetone concentration; biological variability and the influence of diet, Physiol. Meas., 32 (2011) N23. [149] W. Carroll, W. Lenney, T.S. Wang, P. Špan l, A. Alcock, D. Smith, Detection of volatile compounds emitted by Pseudomonas aeruginosa using selected ion flow tube mass spectrometry, Pediatr. Pulmonol., 39 (2005) 452-456. [150] F.J. Gilchrist, A. Alcock, J. Belcher, M. Brady, A. Jones, D. Smith, P. Špan l, K. Webb, W. Lenney, Variation in hydrogen cyanide production between different strains of Pseudomonas aeruginosa, European Respiratory Journal, 38 (2011) 409-414. [151] F.J. Gilchrist, C. Razavi, A.K. Webb, A.M. Jones, P. Špan l, D. Smith, W. Lenney, An investigation of suitable bag materials for the collection and storage of breath samples containing hydrogen cyanide, J. Breath Res., 6 (2012) 036004. [152] J. Dummer, M. Storer, S. Sturney, A. Scott-Thomas, S. Chambers, M. Swanney, M. Epton, Quantification of hydrogen cyanide (HCN) in breath using selected ion flow tube mass spectrometry-HCN is not a biomarker of Pseudomonas in chronic suppurative lung disease, J. Breath Res., 7 (2013). [153] C. Turner, P. Špan l, D. Smith, A longitudinal study of methanol in the exhaled breath of 30 healthy volunteers using selected ion flow tube mass spectrometry, SIFT-MS, Physiological Measurement, 27 (2006) 637. [154] W. Lindinger, J. Taucher, A. Jordan, A. Hansel, W. Vogel, Endogenous production of methanol after the consumption of fruit, Alcoholism: Clinical and Experimental Research, 21 (1997) 939-943. [155] R.J. Siragusa, J.J. Cerda, M. Baig, C. Burgin, F. Robbins, Methanol production from the degradation of pectin by human colonic bacteria, The American journal of clinical nutrition, 47 (1988) 848-851. [156] K. Rycerz, J.E. Jaworska-Adamu, Review paper Effects of aspartame metabolites on astrocytes and neurons, Folia Neuropathol, 51 (2013) 10-17. [157] H.H. Butchko, W.W. Stargel, C.P. Comer, D.A. Mayhew, C. Benninger, G.L. Blackburn, L.M.J. de Sonneville, R.S. Geha, Z. Hertelendy, A. Koestner, A.S. Leon, G.U. Liepa, K.E. McMartin, C.L. Mendenhall, I.C. Munro, E.J. Novotny, A.G. Renwick, S.S. Schiffman, D.L. Schomer, B.A. Shaywitz, P.A. Spiers, T.R. Tephly, J.A.
112
Thomas, F.K. Trefz, Aspartame: Review of safety, Regulatory Toxicology and Pharmacology, 35 (2002) S1-S93. [158] P. Špan l, K. Dryahina, D. Smith, A quantitative study of the influence of inhaled compounds on their concentrations in exhaled breath, J. Breath Res., 7 (2013) 017106. [159] J. Huang, S. Kumar, N. Abbassi-Ghadi, P. Špan l, D. Smith, G.B. Hanna, Selected Ion Flow Tube Mass Spectrometry Analysis of Volatile Metabolites in Urine Headspace for the Profiling of Gastro-Esophageal Cancer, Anal. Chem., 85 (2013) 3409-3416. [160] A.M. Diskin, P. Špan l, D. Smith, Time variation of ammonia, acetone, isoprene and ethanol in breath: a quantitative SIFT-MS study over 30 days, Physiological Measurement, 24 (2003) 107. [161] B.G. Stone, T.J. Besse, W.C. Duane, C.D. Evans, E.G. DeMaster, Effect of regulating cholesterol biosynthesis on breath isoprene excretion in men, Lipids, 28 (1993) 705-708. [162] D. Smith, P. Špan l, B. Enderby, W. Lenney, C. Turner, S.J. Davies, Isoprene levels in the exhaled breath of 200 healthy pupils within the age range 7–18 years studied using SIFT-MS, J. Breath Res., 4 (2010) 017101. [163] C. Turner, P. Špan l, D. Smith, A longitudinal study of breath isoprene in healthy volunteers using selected ion flow tube mass spectrometry (SIFT-MS), Physiological Measurement, 27 (2006) 13. [164] J. King, A. Kupferthaler, K. Unterkofler, H. Koc, S. Teschl, G. Teschl, W. Miekisch, J. Schubert, H. Hinterhuber, A. Amann, Isoprene and acetone concentration profiles during exercise on an ergometer, J. Breath Res., 3 (2009) 027006. [165] A. Jordan, A. Hansel, R. Holzinger, W. Lindinger, Acetonitrile and benzene in the breath of smokers and non-smokers investigated by proton transfer reaction mass spectrometry (PTR-MS), Int. J. Mass Spectrom. Ion Process., 148 (1995) L1-L3. [166] S.M. Abbott, J.B. Elder, P. Špan l, D. Smith, Quantification of acetonitrile in exhaled breath and urinary headspace using selected ion flow tube mass spectrometry, International Journal of Mass Spectrometry, 228 (2003) 655-665. [167] K. Sovová, K. Dryahina, P. Špan l, Selected ion flow tube (SIFT) studies of the reactions of H3O+, NO+ and O2
+• with six volatile phytogenic esters, Int. J. Mass Spectrom., 300 (2011) 31-38. [168] D. Smith, K. Sovová, P. Špan l, A selected ion flow tube study of the reactions of H3O+, NO+ and O2
+ with seven isomers of hexanol in support of SIFT-MS, Int. J. Mass Spectrom., 319 (2012) 25-30. [169] P.W. Pare, J.H. Tumlinson, Plant volatiles as a defense against insect herbivores, Plant Physiology, 121 (1999) 325-331. [170] R.N. Kigathi, W.W. Weisser, D. Veit, J. Gershenzon, S.B. Unsicker, Plants Suppress Their Emission of Volatiles When Growing with Conspecifics, Journal of Chemical Ecology, 39 (2013) 537-545. [171] W.G.M. P.J. Linstrom, NIST Chemistry WebBook, NIST Standard Reference Database Number 69, in: National Institute of Standards and Technology, Gaithersburg, 2011. [172] R. Weast, CRC Handbook of Chemistry & Physics. 66th, CRC, Boca Raton, Florida. [173] K.J. Miller, J.A. Savchik, New empirical-method to calculate average molecular polarisabilities, J. Am. Chem. Soc., 101 (1979) 7206-7213. [174] D. Smith, K. Sovova, P. Spanel, A selected ion flow tube study of the reactions of H3O+, NO+ and O2
+ with seven isomers of hexanol in support of SIFT-MS, International Journal of Mass Spectrometry, 319 (2012) 25-30.
113
[175] V. Anicich, An Index of the Literature for Bimolecular Gas Phase Cation-Molecule Reaction Kinetics, JPL Publication 03-19, National Aeronautics and Space Administration, Jet Propulsion Laboratory, California Institute of Technology, Pasadena, California, 2003. [176] G. Bouchoux, J.Y. Salpin, D. Leblanc, A relationship between the kinetics and thermochemistry of proton transfer reactions in the gas phase, Int. J. Mass Spectrom. Ion Process., 153 (1996) 37-48. [177] T. Su, W.J. Chesnavich, Parametization of the ion-polar molecule collision rate-constant by trajectory calculations, Journal of Chemical Physics, 76 (1982) 5183-5185. [178] D. Smith, A. Pysanenko, P. Špan l, Ionic diffusion and mass discrimination effects in the new generation of short flow tube SIFT-MS instruments, International Journal of Mass Spectrometry, 281 (2009) 15-23. [179] P.J. Linstrom, W.G. Mallard, NIST Chemistry WebBook, NIST Standard Reference Database Number 69, in, National Institute of Standards and Technology, Gaithersburg, 2010. [180] P. Špan l, D. Smith, SIFT studies of the reactions of H3O+, NO+ and O2
+ with a series of alcohols, International journal of mass spectrometry and ion processes, 167 (1997) 375-388. [181] D. Smith, P. Špan l, Ambient analysis of trace compounds in gaseous media by SIFT-MS, Analyst, 136 (2011) 2009-2032. [182] J.B. Kirsner, Inflammatory bowel disease Part I: Nature and pathogenesis, Disease-a-Month, 37 (1991) 610-666. [183] S.B. Hanauer, Inflammatory bowel disease: epidemiology, pathogenesis, and therapeutic opportunities, Inflammatory bowel diseases, 12 (2006) S3-S9. [184] R. Xavier, D. Podolsky, Unravelling the pathogenesis of inflammatory bowel disease, Nature, 448 (2007) 427-434. [185] W. Strober, I. Fuss, P. Mannon, The fundamental basis of inflammatory bowel disease, Journal of Clinical Investigation, 117 (2007) 514-521. [186] A. Krishnan, J.R. Korzenik, Inflammatory bowel disease and environmental influences, Gastroenterology Clinics of North America, 31 (2002) 21-39. [187] J. Cosnes, Tobacco and IBD: relevance in the understanding of disease mechanisms and clinical practice, Best practice & research Clinical gastroenterology, 18 (2004) 481-496. [188] J. Kokoszka, R.L. Nelson, W.I. Swedler, M. John Skosey, H. Abcarian, Determination of inflammatory bowel disease activity by breath pentane analysis, Dis. Colon Rectum, 36 (1993) 597-601. [189] M.A. Pelli, G. Trovarelli, E. Capodicasa, G.E. De Medio, M. Gabrio Bassotti, Breath alkanes determination in ulcerative colitis and Crohn's disease, Dis. Colon Rectum, 42 (1999) 71-76. [190] B.E. Wendland, E. Aghdassi, C. Tam, J. Carrrier, A.H. Steinhart, S.L. Wolman, D. Baron, J.P. Allard, Lipid peroxidation and plasma antioxidant micronutrients in Crohn disease, The American journal of clinical nutrition, 74 (2001) 259-264. [191] G. Spiteller, Peroxidation of linoleic acid and its relation to aging and age dependent diseases, Mechanisms of ageing and development, 122 (2001) 617-657. [192] P. Špan l, D. Smith, A selected ion flow tube study of the reactions of NO+ and O2
+ ions with some organic molecules: The potential for trace gas analysis of air, Journal of Chemical Physics, 104 (1996) 1893-1899. [193] P. Špan l, D. Smith, SIFT studies of the reactions of H3O+, NO+ and O2
+ with several aromatic and aliphatic hydrocarbons, Int. J. Mass Spectrom., 181 (1998) 1-10.
114
[194] K. Sovová, K. Dryahina, P. Špan l, Selected ion flow tube (SIFT) studies of the reactions of H3O+, NO+ and O2
+ with six volatile phytogenic esters, Int. J. Mass Spectrom., 300 (2011) 31-38. [195] http://www.who.int/genomics/public/geneticdiseases/en/index2.html#CF, last accessed on 17.7. 2012. [196] J.R. Riordan, J.M. Rommens, B. Kerem, N. Alon, R. Rozmahel, Z. Grzelczak, J. Zielenski, S. Lok, N. Plavsic, J.L. Chou, Identification of the cystic fibrosis gene: cloning and characterization of complementary DNA, Science, 245 (1989) 1066-1073. [197] P.M. Quinton, Cystic fibrosis: lessons from the sweat gland, Physiology, 22 (2007) 212-225. [198] B.W. Ramsey, S. Banks-Schlegel, F.J. Accurso, R.C. Boucher, G.R. Cutting, J.F. Engelhardt, W.B. Guggino, C.L. Karp, M.R. Knowles, J.K. Kolls, Future Directions in Early Cystic Fibrosis Lung Disease Research, Am. J. Respir. Crit. Care Med., (2012). [199] http://www.clinicians.co.nz/cystic-fibrosis/, last accessed on 9.9. 2013. [200] P.K. Singh, A.L. Schaefer, M.R. Parsek, T.O. Moninger, M.J. Welsh, E. Greenberg, Quorum-sensing signals indicate that cystic fibrosis lungs are infected with bacterial biofilms, Nature, 407 (2000) 762-764. [201] P.O.F.P. EXACERBATIONS, Cystic fibrosis pulmonary exacerbations, The Journal of pediatrics, 148 (2006) 259-264. [202] C. Stover, X. Pham, A. Erwin, S. Mizoguchi, P. Warrener, M. Hickey, F. Brinkman, W. Hufnagle, D. Kowalik, M. Lagrou, Complete genome sequence of Pseudomonas aeruginosa PAO1, an opportunistic pathogen, Nature, 406 (2000) 959-964. [203] J.R.W. Govan, V. Deretic, Microbial pathogenesis in cystic fibrosis: Mucoid Pseudomonas aeruginosa and Burkholderia cepacia, Microbiological Reviews, 60 (1996) 539-+. [204] D. Tubbs, W. Lenney, P. Alcock, C.A. Campbell, J. Gray, C. Pantin, Pseudomonas aeruginosa in cystic fibrosis: cross-infection and the need for segregation, Respiratory Medicine, 95 (2001) 147-152. [205] M. Rosenfeld, J. Emerson, F. Accurso, D. Armstrong, R. Castile, K. Grimwood, P. Hiatt, K. McCoy, S. McNamara, B. Ramsey, Diagnostic accuracy of oropharyngeal cultures in infants and young children with cystic fibrosis, Pediatr. Pulmonol., 28 (1999) 321-328. [206] S. Maiya, M. Desai, A. Baruah, P. Weller, J. Clarke, J. Gray, Cough plate versus cough swab in patients with cystic fibrosis; a pilot study, Archives of disease in childhood, 89 (2004) 577-579. [207] J. Govan, V. Deretic, Microbial pathogenesis in cystic fibrosis: mucoid Pseudomonas aeruginosa and Burkholderia cepacia, Microbiological Reviews, 60 (1996) 539-574. [208] W. Carroll, W. Lenney, T. Wang, P. Špan l, A. Alcock, D. Smith, Detection of volatile compounds emitted by Pseudomonas aeruginosa using selected ion flow tube mass spectrometry, Pediatr. Pulmonol., 39 (2005) 452-456. [209] F.J. Gilchrist, A. Alcock, J. Belcher, M. Brady, A. Jones, D. Smith, P. Špan l, K. Webb, W. Lenney, Variation in hydrogen cyanide production between different strains of Pseudomonas aeruginosa, European Respiratory Journal, 38 (2011) 409-414. [210] C.M. Robroeks, J.J.B.N. Van Berkel, J.W. Dallinga, Q. Jöbsis, L.J.I. Zimmermann, H.J.E. Hendriks, M.F.M. Wouters, C.P.M. Van Der Grinten, K.D.G. Van De Kant, F.J. Van Schooten, Metabolomics of volatile organic compounds in cystic fibrosis patients and controls, Pediatric Research, 68 (2010) 75-80.
115
[211] P. Španel, D. Smith, Volatile compounds in health and disease, Current Opinion in Clinical Nutrition & Metabolic Care, 14 (2011) 455. [212] R. Cipollone, M.G. Bigotti, E. Frangipani, P. Ascenzi, P. Visca, Characterization of a rhodanese from the cyanogenic bacterium Pseudomonas aeruginosa, Biochemical and Biophysical Research Communications, 325 (2004) 85-90. [213] W.H. Ewing, B.R. Davis, M.A. Fife, E.F. Lessel, Biochemical characterization of serratia-lique-faciens (Grimes and Hennerty) BASCOMB and AL (formerly Enterobacter-liquefaciens) and Serratia-Rubidaea (STAPP) COMB NOV and designation of type and neotype strains, International Journal of Systematic Bacteriology, 23 (1973) 217-225. [214] G. Szabo, G. Fath, Evolutionary games on graphs, Physics Reports-Review Section of Physics Letters, 446 (2007) 97-216. [215] S.A. West, A.S. Griffin, A. Gardner, S.P. Diggle, Social evolution theory for microorganisms, Nature Reviews Microbiology, 4 (2006) 597-607. [216] G.J. Velicer, Social strife in the microbial world, TRENDS in Microbiology, 11 (2003) 330-337. [217] J.W. Park, H. Min, Y.P. Kim, H.K. Shon, J. Kim, D.W. Moon, T.G. Lee, Multivariate analysis of ToF-SIMS data for biological applications, Surface and Interface Analysis, 41 (2009) 694-703. [218] I.T. Jolliffe, Principal component analysis, in, Springer-Verlag, New York, 1986. [219] M. Bunge, N. Araghipour, T. Mikoviny, J. Dunkl, R. Schnitzhofer, A. Hansel, F. Schinner, A. Wisthaler, R. Margesin, T.D. Mark, On-line monitoring of microbial volatile metabolites by proton transfer reaction-mass spectrometry, Appl. Environ. Microbiol., 74 (2008) 2179-2186. [220] J.W. Gardner, Detection of vapors and odors from a multisensor array using pattern-recognition.1.Principal Component and Cluster-Analysis, Sensors and Actuators B-Chemical, 4 (1991) 109-115. [221] T. Macek, J. Rezek, B. Vrchotova, K. Beranova, O. Uhlik, J. Najmanova, M. Novakova, Z. Chrastilova, P. Kotrba, K. Demnerova, M. Mackova, Phytoremediation, Listy Cukrovarnicke a Reparske, 123 (2007) 312-314. [222] C.W. Arnold, D.G. Parfitt, M. Kaltreider, Phytovolatilization of oxygenated gasoline-impacted groundwater at an underground storage tank site via conifers, International Journal of Phytoremediation, 9 (2007) 53-69. [223] O.V. Singh, R.K. Jain, Phytoremediation of toxic aromatic pollutants from soil, Appl. Microbiol. Biotechnol., 63 (2003) 128-135. [224] E.L. Rylott, A. Lorenz, N.C. Bruce, Biodegradation and biotransformation of explosives, Current Opinion in Biotechnology, 22 (2011) 434-440. [225] J.D. Rodgers, N.J. Bunce, Treatment methods for the remediation of nitroaromatic explosives, Water Research, 35 (2001) 2101-2111. [226] B. Zhu, R.H. Peng, X.Y. Fu, X.F. Jin, W. Zhao, J. Xu, H.J. Han, J.J. Gao, Z.S. Xu, L. Bian, Q.H. Yao, Enhanced Transformation of TNT by Arabidopsis Plants Expressing an Old Yellow Enzyme, Plos One, 7 (2012). [227] A.C.P. Heaton, C.L. Rugh, N.J. Wang, R.B. Meagher, Phytoremediation of mercury- and methylmercury-polluted soils using genetically engineered plants, Journal of Soil Contamination, 7 (1998) 497-509. [228] R.L. Chaney, M. Malik, Y.M. Li, S.L. Brown, E.P. Brewer, J.S. Angle, A.J.M. Baker, Phytoremediation of soil metals, Current Opinion in Biotechnology, 8 (1997) 279-284.
116
[229] S.P. Cheng, Heavy metals in plants and phytoremediation - A state-of-the-art report with special reference to literature published in Chinese journals, Environmental Science and Pollution Research, 10 (2003) 335-340. [230] D.L. LeDuc, N. Terry, Phytoremediation of toxic trace elements in soil and water, Journal of Industrial Microbiology & Biotechnology, 32 (2005) 514-520. [231] http://www.phytosanitary.org/projekty/2004/vvf-13-04.pdf, last accessed on 30.9. 2011. [232] E. Rubin, A. Ramaswami, The potential for phytoremediation of MTBE, Water Research, 35 (2001) 1348-1353. [233] A. Ramaswami, E. Rubin, S. Bonola, Non-significance of rhizosphere degradation during phytoremediation of MTBE, International Journal of Phytoremediation, 5 (2003) 315-331. [234] B.H. Cranner, Zur Biochemie and Physiologie der granzschichten lebender Pflanzenzellen, Meldinger Norg. Landbrukhoiskole, 5 (1922) 1-55. [235] S.J. Grayston, D. Vaughan, D. Jones, Rhizosphere carbon flow in trees, in comparison with annual plants: The importance of root exudation and its impact on microbial activity and nutrient availability, Applied Soil Ecology, 5 (1997) 29-56. [236] L. Knudson, The secretion of invertase by plant roots, American Journal of Botany, 7 (1920) 371-379. [237] N.C. Uren, H.M. Reisenaner, The role of root exudates in nutrient acquisition, in: P.B. Tinker, A. Lanchli (Eds.) Advances in Plant Nutrition, Praeger, New York, 1988, pp. 79-114. [238] D.L. Jones, P.R. Darrah, Amino-acid influx at the soil-root interface of Zea-mays L and its implications in the rhizosphere, Plant and Soil, 163 (1994) 1-12. [239] I. Kraffczyk, G. Trolldenier, H. Beringer, Soluble root exudates of maize - influence of potassium supply and rhizosphere microorganisms, Soil Biology & Biochemistry, 16 (1984) 315-322. [240] P. Sundin, A. Valeur, S. Olsson, G. Odham, Interactions between bacteria-feeding nematodes and bacteria in the rape rhizosphere - effects on root exudation and distribution of bacteria, Fems Microbiology Ecology, 73 (1990) 13-22. [241] J.M. Lynch, J.M. Whipps, Substrate flow in the rhizosphere, Plant and Soil, 129 (1990) 1-10. [242] A.D. Rovira, Plant root exudates, Botanical Review, 35 (1969) 35-57. [243] N. Verbruggen, C. Hermans, H. Schat, Molecular mechanisms of metal hyperaccumulation in plants, New Phytol., 181 (2009) 759-776. [244] S. Eapen, S.F. D'Souza, Prospects of genetic engineering of plants for phytoremediation of toxic metals, Biotechnol. Adv., 23 (2005) 97-114. [245] P. Ku erová, M. Macková, T. Macek, Perspektivy fytoremediace p i odstra ování organických polutant a xenobiotik z životního prost edí, Chemické listy, 93 (1999) 19-26. [246] A. Bhandari, Environmental, W.R.I.E. Council, W.R.I.R.T.f. Soils, G.T. Committee, Remediation Technologies for Soils and Groundwater, American Society of Civil Engineers, 2007. [247] N. Terry, A.M. Zayed, M.P. de Souza, A.S. Tarun, Selenium in higher plants, Annual Review of Plant Physiology and Plant Molecular Biology, 51 (2000) 401-432. [248] J.L. Freeman, S.D. Lindblom, C.F. Quinn, S. Fakra, M.A. Marcus, E.A.H. Pilon-Smits, Selenium accumulation protects plants from herbivory by Orthoptera via toxicity and deterrence, New Phytol., 175 (2007) 490-500. [249] B. Hanson, G.F. Garifullina, S.D. Lindblom, A. Wangeline, A. Ackley, K. Kramer, A.P. Norton, C.B. Lawrence, E.A.H. Pilon-Smits, Selenium accumulation
117
118
protects Brassica juncea from invertebrate herbivory and fungal infection, New Phytol., 159 (2003) 461-469. [250] C.F. Quinn, J.L. Freeman, M.L. Galeas, E.M. Klamper, E.A.H. Pilon-Smits, The role of selenium in protecting plants against prairie dog herbivory: implications for the evolution of selenium hyperaccumulation, Oecologia, 155 (2008) 267-275. [251] A.F. El Mehdawi, C.F. Quinn, E.A.H. Pilon-Smitst, Selenium Hyperaccumulators Facilitate Selenium-Tolerant Neighbors via Phytoenrichment and Reduced Herbivory, Current Biology, 21 (2011) 1440-1449. [252] X.Z. Yu, J.D. Gu, Differences in uptake and translocation of selenate and selenite by the weeping willow and hybrid willow, Environmental Science and Pollution Research, 15 (2008) 499-508. [253] Z.Q. Lin, R.S. Schemenauer, V. Cervinka, A. Zayed, A. Lee, N. Terry, Selenium volatilization from a soil-plant system for the remediation of contaminated water and soil in the San Joaquin Valley, Journal of Environmental Quality, 29 (2000) 1048-1056. [254] M.P. de Souza, C.M. Lytle, M.M. Mulholland, M.L. Otte, N. Terry, Selenium assimilation and volatilization from dimethylselenoniopropionate by Indian mustard, Plant Physiology, 122 (2000) 1281-1288. [255] M. Kieliszek, S. Blazejak, Selenium: Significance, and outlook for supplementation, Nutrition, 29 (2013) 713-718. [256] M. Montes-Bayon, M.J.D. Molet, E.B. Gonzalez, A. Sanz-Medel, Evaluation of different sample extraction strategies for selenium determination in selenium-enriched plants (Allium sativum and Brassica juncea) and Se speciation by HPLC-ICP-MS, Talanta, 68 (2006) 1287-1293. [257] M. Montes-Bayon, E.G. Yanes, C.P. de Leon, K. Jayasimhulu, A. Stalcup, J. Shann, J.A. Caruso, Initial studies of selenium speciation in Brassica juncea by LC with ICPMS and ES-MS detection: an approach for phytoremediation studies, Anal. Chem., 74 (2002) 107-113. [258] K.M. Ervin, Experimental techniques in gas-phase ion thermochemistry, Chem. Rev., 101 (2001) 391-444. [259] K. Sovová, K. Dryahina, P. Špan l, M. Kyncl, S. Civiš, A study of the composition of the products of laser-induced breakdown of hexogen, octogen, pentrite and trinitrotoluene using selected ion flow tube mass spectrometry and UV-Vis spectrometry, Analyst, 135 (2010) 1106-1114. [260] J. Kubišta, M. Civiš, P. Špan l, S. Civiš, Combining Fourier transform nuclear quadrupole resonance (FT-NQR) spectroscopy and mass spectrometry (MS) to study the electronic structure of titanocene dichlorides, Analyst, 137 (2012) 1338-1342. [261] J.L. Gottfried, Laser-induced plasma chemistry of the explosive RDX with various metallic nanoparticles, Applied Optics, 51 (2012) B13-B21. [262] J.L. Gottfried, Influence of metal substrates on the detection of explosive residues with laser-induced breakdown spectroscopy, Applied Optics, 52 (2013) B10-B19. [263] H. Cai, L. Tian, B. Huang, G. Yang, D. Guan, H. Huang, 1, 1-Diamino-2, 2-dintroethene (FOX-7) nanocrystals embedded in mesoporous carbon FDU-15, Microporous and Mesoporous Materials, (2012).
Appendix A, Sovová et al. Int. J. Mass. Spectrom. 300 (2011)
31
Selected ion flow tube, SIFT, studies of the reactions of H3O+, NO+ and
O2+• with six volatile phytogenic esters
Kristýna Sovováa,b, Kseniya Dryahinaa, Patrik Špan la,*
aJ. Heyrovský Institute of Physical Chemistry of Science, Academy of Science of the
Czech Republic Dolejškova 3, 18223 Prague 8, Czech Republic bDepartment of Physical and Macromolecular Chemistry, Faculty of Science, Charles
University, Albertov 2030, 128 40 Prague 2, Czech Republic

International Journal of Mass Spectrometry 300 (2011) 31–38
Contents lists available at ScienceDirect
International Journal of Mass Spectrometry
journa l homepage: www.e lsev ier .com/ locate / i jms
Selected ion flow tube (SIFT) studies of the reactions of H3O+, NO+ and O2+• with
six volatile phytogenic esters
Kristyna Sovováa,b, Kseniya Dryahinaa, Patrik Spanel a,∗
a J. Heyrovsky Institute of Physical Chemistry of Science, Academy of Science of the Czech Republic, Dolejskova 3, 18223 Prague 8, Czech Republicb Department of Physical and Macromolecular Chemistry, Faculty of Science, Charles University, Albertov 2030, 12840 Prague 2, Czech Republic
a r t i c l e i n f o
Article history:
Received 25 October 2010
Received in revised form
29 November 2010
Accepted 30 November 2010
Available online 7 December 2010
Keywords:
SIFT-MS
Ion-molecule reactions
Plant esters
Proton transfer
Charge transfer
Adduct ion formation
a b s t r a c t
The selected ion flow tube (SIFT) was used to study the reactions of the three SIFT-MS precursor ions
H3O+, NO+ and O2+• with six phytogenic esters: hexyl acetate, phenethyl acetate, benzyl acetate, methyl
salicylate, methyl benzoate and benzyl benzoate. These compounds are emitted into the atmosphere by
various species of plants and play a role in communication between individual plants and also amongst
different species. Thus, it is necessary to know the rate constants and branching ratios of the different
ion products of these reactions for identification and quantification by SIFT-MS. The results of this study
show that the reactions of H3O+ with the esters proceed via proton transfer, which is non-dissociative for
methyl salicylate, entirely dissociative for benzyl benzoate and partly dissociative for the remaining four
esters. All protonated esters readily associate with water molecules with the notable exception of methyl
salicylate. All six NO+ reactions result in formation of adduct ions in parallel with charge transfer or with
reactions leading to fragment ions. All six O2+• reactions proceed by charge transfer with the production
of one or two major fragment ions; the parent molecular radical cation is formed in three reactions only.
Kinetic library entries allowing unambiguous quantification of the six esters by SIFT-MS are presented
together with their experimental validation.
© 2010 Elsevier B.V. All rights reserved.
1. Introduction
The phytogenic volatile organic compounds (VOCs) are gener-
ally small molecules that play an important role in various aspects
of plant physiology including growth, development and commu-
nication between individual plants and also amongst different
species. Some VOCs are released by plants continuously under
normal physiological conditions, these include ethylene, isoprene,
terpenes, sesquiterpenes [1] methanol [2] and some esters includ-
ing benzyl acetate, phenethyl acetate, methyl benzoate and benzyl
benzoate [3]. However, plants may respond to damage or externally
induced stress by releasing specific types of molecules exempli-
fied by hexyl acetate [4], and methyl salicylate that is known to
be released by plants in response to damage caused by herbivores
[5] and actually acts as an elicitor of foraging predatory mites [6].
The objective of the present study is to obtain kinetic data on ion
molecule reactions of the six esters shown in Scheme I with the
three commonly used SIFT-MS precursor (reagent) ions H3O+, NO+
and O2+•.
∗ Corresponding author. Tel.: +420 2 6605 2112; fax: +420 2 8658 2307.
E-mail addresses: [email protected], [email protected] (P. Spanel).
The ion chemistry of these SIFT-MS precursor ions with these
esters has not been previously studied except for methyl salicylate
which has been studied by Iachetta et al. [8]. The earliest SIFT stud-
ies were concerned with a series of simpler esters [9]. SIFT-MS has
been successfully used for measurements of the concentrations of
some flavourant biogenic monoterpenes and sesquiterpenes emit-
ted by vegetation such as myrcene, ocimene, �- and �-pinene, �-
and �-terpinene, 2- and 3-carene, R- and S-limonene and camphene
[10,11]. In those studies it was observed that the H3O+ reactions
with the monoterpenes (M), proceeded via proton transfer and
result in formation of the protonated molecules MH+ at an m/z value
of 137 and partly of a fragment ion at an m/z of 81. The NO+ reac-
tions proceeded via charge transfer resulting mainly in the ionized
monoterpenes C10H16+ [10]. Thus, using H3O+ and NO+, SIFT-MS
can be used to measure the total collective concentration of these
terpenes in air. Their reactions with O2+• result in greater amount
of fragments.
VOC emissions from plants, after extraction, can be very effec-
tively studied using the well proven separation methods of gas
and liquid chromatography [12,13]. The main shortcoming of these
methods is that they cannot provide real time quantification, which
is the main practical advantage of the SIFT-MS method. Proton-
transfer reaction mass spectrometry, PTR-MS, which is in some
aspects similar to SIFT-MS, is also capable of quantification of VOCs
1387-3806/$ – see front matter © 2010 Elsevier B.V. All rights reserved.doi:10.1016/j.ijms.2010.11.021
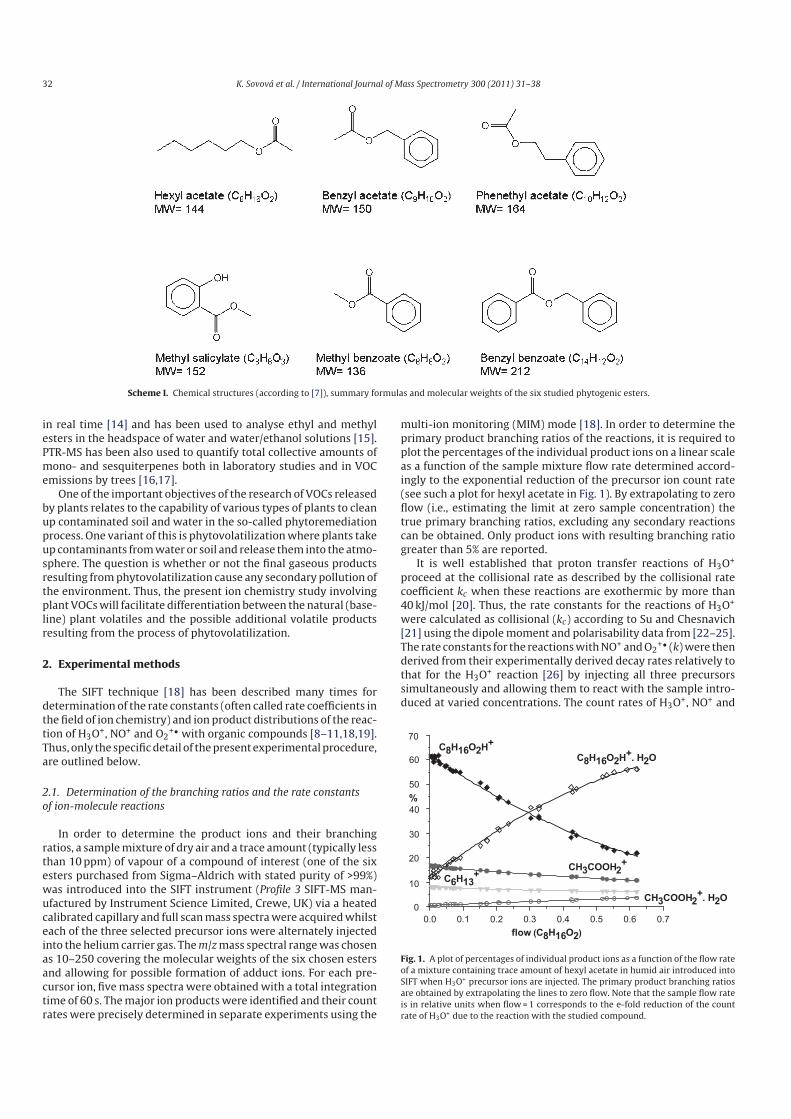
32 K. Sovová et al. / International Journal of Mass Spectrometry 300 (2011) 31–38
Scheme I. Chemical structures (according to [7]), summary formulas and molecular weights of the six studied phytogenic esters.
in real time [14] and has been used to analyse ethyl and methyl
esters in the headspace of water and water/ethanol solutions [15].
PTR-MS has been also used to quantify total collective amounts of
mono- and sesquiterpenes both in laboratory studies and in VOC
emissions by trees [16,17].
One of the important objectives of the research of VOCs released
by plants relates to the capability of various types of plants to clean
up contaminated soil and water in the so-called phytoremediation
process. One variant of this is phytovolatilization where plants take
up contaminants from water or soil and release them into the atmo-
sphere. The question is whether or not the final gaseous products
resulting from phytovolatilization cause any secondary pollution of
the environment. Thus, the present ion chemistry study involving
plant VOCs will facilitate differentiation between the natural (base-
line) plant volatiles and the possible additional volatile products
resulting from the process of phytovolatilization.
2. Experimental methods
The SIFT technique [18] has been described many times for
determination of the rate constants (often called rate coefficients in
the field of ion chemistry) and ion product distributions of the reac-
tion of H3O+, NO+ and O2+• with organic compounds [8–11,18,19].
Thus, only the specific detail of the present experimental procedure,
are outlined below.
2.1. Determination of the branching ratios and the rate constants
of ion-molecule reactions
In order to determine the product ions and their branching
ratios, a sample mixture of dry air and a trace amount (typically less
than 10 ppm) of vapour of a compound of interest (one of the six
esters purchased from Sigma–Aldrich with stated purity of >99%)
was introduced into the SIFT instrument (Profile 3 SIFT-MS man-
ufactured by Instrument Science Limited, Crewe, UK) via a heated
calibrated capillary and full scan mass spectra were acquired whilst
each of the three selected precursor ions were alternately injected
into the helium carrier gas. The m/z mass spectral range was chosen
as 10–250 covering the molecular weights of the six chosen esters
and allowing for possible formation of adduct ions. For each pre-
cursor ion, five mass spectra were obtained with a total integration
time of 60 s. The major ion products were identified and their count
rates were precisely determined in separate experiments using the
multi-ion monitoring (MIM) mode [18]. In order to determine the
primary product branching ratios of the reactions, it is required to
plot the percentages of the individual product ions on a linear scale
as a function of the sample mixture flow rate determined accord-
ingly to the exponential reduction of the precursor ion count rate
(see such a plot for hexyl acetate in Fig. 1). By extrapolating to zero
flow (i.e., estimating the limit at zero sample concentration) the
true primary branching ratios, excluding any secondary reactions
can be obtained. Only product ions with resulting branching ratio
greater than 5% are reported.
It is well established that proton transfer reactions of H3O+
proceed at the collisional rate as described by the collisional rate
coefficient kc when these reactions are exothermic by more than
40 kJ/mol [20]. Thus, the rate constants for the reactions of H3O+
were calculated as collisional (kc) according to Su and Chesnavich
[21] using the dipole moment and polarisability data from [22–25].
The rate constants for the reactions with NO+ and O2+• (k) were then
derived from their experimentally derived decay rates relatively to
that for the H3O+ reaction [26] by injecting all three precursors
simultaneously and allowing them to react with the sample intro-
duced at varied concentrations. The count rates of H3O+, NO+ and
0.70.60.50.40.30.20.10.0
70
60
50
20
30
40
10
%
flow (C8H16O2)
0
C8H16O2H+. H2OC8H16O2H+
CH3COOH2+
C6H13+
CH3COOH2+. H2O
Fig. 1. A plot of percentages of individual product ions as a function of the flow rate
of a mixture containing trace amount of hexyl acetate in humid air introduced into
SIFT when H3O+ precursor ions are injected. The primary product branching ratios
are obtained by extrapolating the lines to zero flow. Note that the sample flow rate
is in relative units when flow = 1 corresponds to the e-fold reduction of the count
rate of H3O+ due to the reaction with the studied compound.
K. Sovová et al. / International Journal of Mass Spectrometry 300 (2011) 31–38 33
O2+• were plotted on a semi-logarithmic scale as functions of the
sample flow rate and the rate constants (k) for the NO+ and O2+•
reactions were determined from the relative slopes of these plots.
2.2. Kinetics of the ion chemistry involving water molecules:
determination of three-body association rate constants
The reactions of most molecules M with H3O+ precursor ions
generally result in the formation of nascent MH+ ions. In the pres-
ence of water molecules, the H3O+ ions are partially converted to
hydrated hydronium ions H3O+(H2O)1,2,3. These cluster ions can
act as additional precursors and produce additional ion products
like MH+(H2O)1,2,3 via ligand switching reactions. The MH+ product
ions of proton transfer can also directly associate with H2O simi-
larly forming ions MH+(H2O)1,2,3. Thus, the ion chemistry, which is
important for real time and accurate quantification by SIFT-MS, is
influenced by the presence of water vapour and it is necessary to
account for this [27].
In SIFT-MS measurements using H3O+ precursor ions it is usually
the case that both MH+ and its hydrates MH+(H2O)1,2,3 are formed.
The ratio of the count rates of these ions change with the sample
flow rate and the sample humidity and by recording these relative
count rates the efficiency of clustering as a fundamental parameter,
related to elementary rate constants, can be obtained. The objective
of this section is to indicate the kinetic principles and the procedure
adopted to analyse the experimental data.
Three-body rate constants for the association reactions of MH+
ions with H2O molecules in helium, kMH+ describe the rate of hydra-
tion of the protonated molecules in the gas phase:
MH+ + H2O + He → MH+(H2O) + He (1)
In order to obtain these rate constants experimentally it is impor-
tant to consider the role of H3O+(H2O) ions formed in the following
three-body reaction described by the rate constant kH3O+
H3O+ + H2O + He → H3O+(H2O) + He (2)
The three body-rate constant for reaction (2) has been previously
determined to be kH3O+ = 6 × 10⁻²⁸ cm6 s−1 [27]. The cluster ions
formed in reaction (2) contribute to the formation of MH+(H2O)
ions via ligand switching with M:
H3O+(H2O) + M → MH+(H2O) + H2O (3)
So these hydrated protonated molecules MH+(H2O) can be pro-
duced by two parallel routes, viz reactions (1) and (3). The separate
contribution of reaction (3) can be quantified by a parameter Seff
representing the contribution of the switching reactions to their
formation taken relatively to the formation of hydrated hydronium
ions [27]:
Seff = ln ([MH+] + [MH+(H2O)1,2,3]s/[MH+])
ln ([H3O+]0/[H3O+])(4)
Here, [MH+] and [H3O+] (or [19]) are the count rates of MH+ and
H3O+ ions detected by the downstream mass spectrometer, tac-
itly assumed to be proportional to the concentrations of the ions
at the end of the flow tube. [H3O+]0 is the count rate observed in
the absence of water vapour, which is also equivalent to the sum
of count rates of H3O+(H2O)0,1,2,3. The subscript s denotes the the-
oretical count rates of the MH+(H2O)1,2,3 ions formed in switching
reactions only, as calculated from the linearised kinetic equation
(see [27]):
[MH+(H2O)1,2,3]s = [M]t(
[37]k37
2+ [55]
k55
2+ [73]
k73
2
)(5)
where t is reaction time, k37, k55 and k73 are the rate constants forthe switching reactions of the respective hydrated hydronium ionswith M and [37], [55], and [73] are the actual count rates of the
H3O+(H2O)1,2,3 ions as observed in the experiments. The divisors 2in Eq. (5) describe the fact that due to their continuous formationin the flow tube [27], reaction times of the H3O+(H2O)1,2,3 ions areapproximately half the reaction time of H3O+. Thus:
Seff = ln(1 + ([M]t([37](k37/2) + [55](k55/2) + [73](k73/2))/([M]t · [19] k19)))
ln(1 + (([37] + [55] + [73])/[19]))(6)
By simplification of this expression the Seff parameter can be
calculated from the known rate constants and the experimentaldata as follows:
Seff = ln(1 + (([37](k37/2) + [55](k55/2) + [73](k73/2))/([19]k19)))
ln(1 + (([37] + [55] + [73])/[19]))(7)
Similarly, the total contribution of both parallel routes of for-
mation of the protonated hydrated ions, i.e., via the association
reaction (1) and via the above switching reactions relative to that
for the reaction of H3O+ with H2O, can be described by a coefficient
Aeff:
Aeff = 2 ln (([MH+] + [MH+(H2O)1,2,3]A
)/([MH+]))
ln([H3O+]0/[H3O+])(8)
Again, the subscript 0 indicates the respective ion count rate in the
absence of water vapour in the helium carrier gas. Thus, the [MH+]0
can be acquired during analysis as the sum of the [MH+] and [MH+
(H2O)n] count rates (same as the procedure to determine [H3O+]0).
The factor 2 in Eq. (8) is again a compensation of the reaction time
for continuously formed MH+ ions, which is half of that for H3O+.
Because Aeff is expressed in the terms of ion count rates only, it
can be directly obtained from the experimental data such as mass
spectra. An important test is that the experimental value of Aeff is
invariant with [M] and also invariant with [H2O]. The value of Aeff
has a very simple interpretation as it describes how much faster
clustering of MH+ is compared to clustering of H3O+. Mathemat-
ically Aeff so defined and expressed by Eq. (8) agrees with Aeff as
used in [27] however the verbal definition of Aeff in the previous
paper [27] was not strictly speaking correct because it incorrectly
neglected the contribution of switching.
Now the true contribution of association without switching is
simply described as Aeff − Seff and the value of three-body associa-
tion rate constant can be calculated as:
kMH+ = (Aeff − Seff ) · kH3O+ . (9)
So kMH+ obtained from Eq. (9) is a fundamental three body associa-
tion rate constant anchored to the known value of kH3O+ . Numerical
examples of calculations of Aeff and Seff are given in Appendix A.
3. Results and discussion
3.1. Rate constants for the H3O+, NO+ and O2+• reactions
The calculated rate constants, kc, for the reactions of H3O+ with
the esters and the experimentally determined rate constants, k, for
the NO+ and O2+• are summarized in Table 1. As can be seen, all
experimental rate constants are within the experimental uncer-
tainty ±20% equivalent to the theoretical collisional kc values. The
only exceptions are benzyl acetate where the NO+ reaction pro-
ceeds only at 60% of kc and methyl benzoate for which O2+• reaction
apparently proceeds faster than kc. A possible explanation for this
is that the H3O+ rate constant is slower than kc by about 20% or
that the Su and Chesnavich theory is not precise for interactions of
ions with geometrically large molecules. Unfortunately the current
experimental method does not allow absolute determinations of
the concentrations of volatile compounds such as methyl benzoate
to accuracy better than 20%.
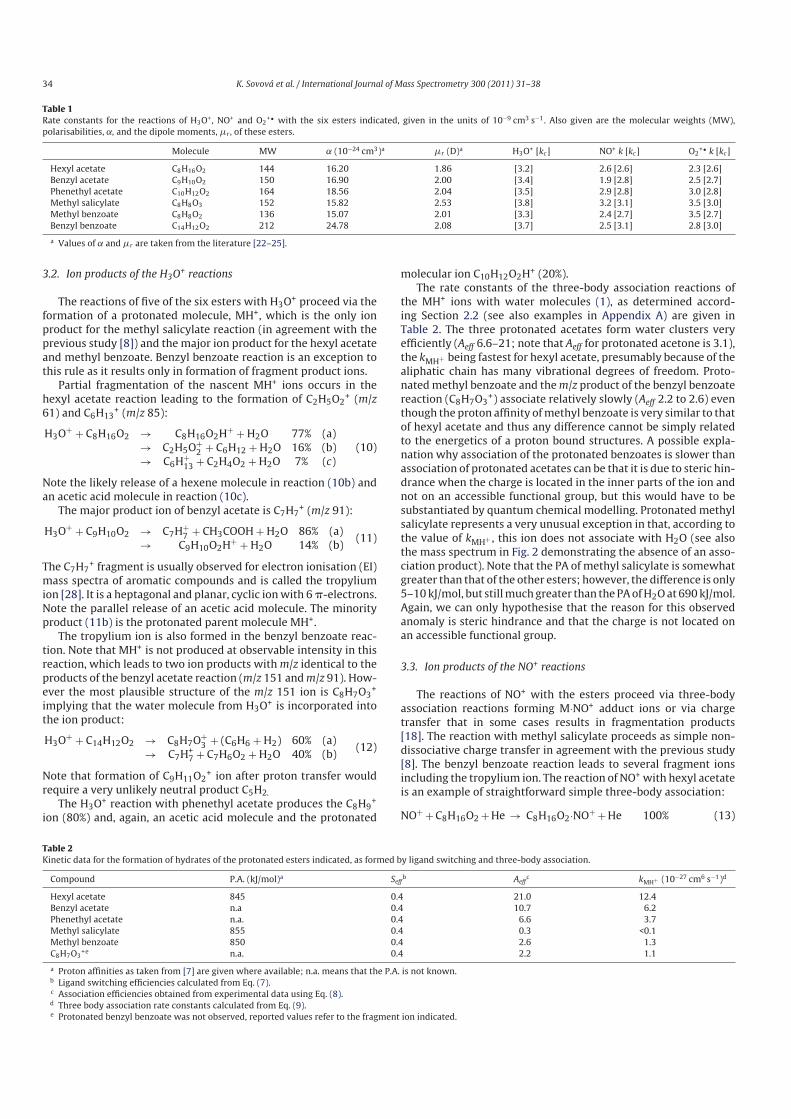
34 K. Sovová et al. / International Journal of Mass Spectrometry 300 (2011) 31–38
Table 1Rate constants for the reactions of H3O+, NO+ and O2
+• with the six esters indicated, given in the units of 10−9 cm3 s−1. Also given are the molecular weights (MW),
polarisabilities, ˛, and the dipole moments, �r , of these esters.
Molecule MW ˛ (10−24 cm3)a �r (D)a H3O+ [kc] NO+ k [kc] O2+• k [kc]
Hexyl acetate C8H16O2 144 16.20 1.86 [3.2] 2.6 [2.6] 2.3 [2.6]
Benzyl acetate C9H10O2 150 16.90 2.00 [3.4] 1.9 [2.8] 2.5 [2.7]
Phenethyl acetate C10H12O2 164 18.56 2.04 [3.5] 2.9 [2.8] 3.0 [2.8]
Methyl salicylate C8H8O3 152 15.82 2.53 [3.8] 3.2 [3.1] 3.5 [3.0]
Methyl benzoate C8H8O2 136 15.07 2.01 [3.3] 2.4 [2.7] 3.5 [2.7]
Benzyl benzoate C14H12O2 212 24.78 2.08 [3.7] 2.5 [3.1] 2.8 [3.0]
a Values of ˛ and �r are taken from the literature [22–25].
3.2. Ion products of the H3O+ reactions
The reactions of five of the six esters with H3O+ proceed via the
formation of a protonated molecule, MH+, which is the only ion
product for the methyl salicylate reaction (in agreement with the
previous study [8]) and the major ion product for the hexyl acetate
and methyl benzoate. Benzyl benzoate reaction is an exception to
this rule as it results only in formation of fragment product ions.
Partial fragmentation of the nascent MH+ ions occurs in the
hexyl acetate reaction leading to the formation of C2H5O2+ (m/z
61) and C6H13+ (m/z 85):
H3O+ + C8H16O2 → C8H16O2H+ + H2O 77% (a)
→ C2H5O+2 + C6H12 + H2O 16% (b)
→ C6H+13 + C2H4O2 + H2O 7% (c)
(10)
Note the likely release of a hexene molecule in reaction (10b) and
an acetic acid molecule in reaction (10c).
The major product ion of benzyl acetate is C7H7+ (m/z 91):
H3O+ + C9H10O2 → C7H+7 + CH3COOH + H2O 86% (a)
→ C9H10O2H+ + H2O 14% (b)(11)
The C7H7+ fragment is usually observed for electron ionisation (EI)
mass spectra of aromatic compounds and is called the tropylium
ion [28]. It is a heptagonal and planar, cyclic ion with 6 �-electrons.
Note the parallel release of an acetic acid molecule. The minority
product (11b) is the protonated parent molecule MH+.
The tropylium ion is also formed in the benzyl benzoate reac-
tion. Note that MH+ is not produced at observable intensity in this
reaction, which leads to two ion products with m/z identical to the
products of the benzyl acetate reaction (m/z 151 and m/z 91). How-
ever the most plausible structure of the m/z 151 ion is C8H7O3+
implying that the water molecule from H3O+ is incorporated into
the ion product:
H3O+ + C14H12O2 → C8H7O+3 + (C6H6 + H2) 60% (a)
→ C7H+7 + C7H6O2 + H2O 40% (b)
(12)
Note that formation of C9H11O2+ ion after proton transfer would
require a very unlikely neutral product C5H2.
The H3O+ reaction with phenethyl acetate produces the C8H9+
ion (80%) and, again, an acetic acid molecule and the protonated
molecular ion C10H12O2H+ (20%).
The rate constants of the three-body association reactions of
the MH+ ions with water molecules (1), as determined accord-
ing Section 2.2 (see also examples in Appendix A) are given in
Table 2. The three protonated acetates form water clusters very
efficiently (Aeff 6.6–21; note that Aeff for protonated acetone is 3.1),
the kMH+ being fastest for hexyl acetate, presumably because of the
aliphatic chain has many vibrational degrees of freedom. Proto-
nated methyl benzoate and the m/z product of the benzyl benzoate
reaction (C8H7O3+) associate relatively slowly (Aeff 2.2 to 2.6) even
though the proton affinity of methyl benzoate is very similar to that
of hexyl acetate and thus any difference cannot be simply related
to the energetics of a proton bound structures. A possible expla-
nation why association of the protonated benzoates is slower than
association of protonated acetates can be that it is due to steric hin-
drance when the charge is located in the inner parts of the ion and
not on an accessible functional group, but this would have to be
substantiated by quantum chemical modelling. Protonated methyl
salicylate represents a very unusual exception in that, according to
the value of kMH+ , this ion does not associate with H2O (see also
the mass spectrum in Fig. 2 demonstrating the absence of an asso-
ciation product). Note that the PA of methyl salicylate is somewhat
greater than that of the other esters; however, the difference is only
5–10 kJ/mol, but still much greater than the PA of H2O at 690 kJ/mol.
Again, we can only hypothesise that the reason for this observed
anomaly is steric hindrance and that the charge is not located on
an accessible functional group.
3.3. Ion products of the NO+ reactions
The reactions of NO+ with the esters proceed via three-body
association reactions forming M·NO+ adduct ions or via charge
transfer that in some cases results in fragmentation products
[18]. The reaction with methyl salicylate proceeds as simple non-
dissociative charge transfer in agreement with the previous study
[8]. The benzyl benzoate reaction leads to several fragment ions
including the tropylium ion. The reaction of NO+ with hexyl acetate
is an example of straightforward simple three-body association:
NO+ + C8H16O2 + He → C8H16O2·NO+ + He 100% (13)
Table 2Kinetic data for the formation of hydrates of the protonated esters indicated, as formed by ligand switching and three-body association.
Compound P.A. (kJ/mol)a Seffb Aeff
c kMH+ (10−27 cm6 s−1)d
Hexyl acetate 845 0.4 21.0 12.4
Benzyl acetate n.a 0.4 10.7 6.2
Phenethyl acetate n.a. 0.4 6.6 3.7
Methyl salicylate 855 0.4 0.3 <0.1
Methyl benzoate 850 0.4 2.6 1.3
C8H7O3+e n.a. 0.4 2.2 1.1
a Proton affinities as taken from [7] are given where available; n.a. means that the P.A. is not known.b Ligand switching efficiencies calculated from Eq. (7).c Association efficiencies obtained from experimental data using Eq. (8).d Three body association rate constants calculated from Eq. (9).e Protonated benzyl benzoate was not observed, reported values refer to the fragment ion indicated.
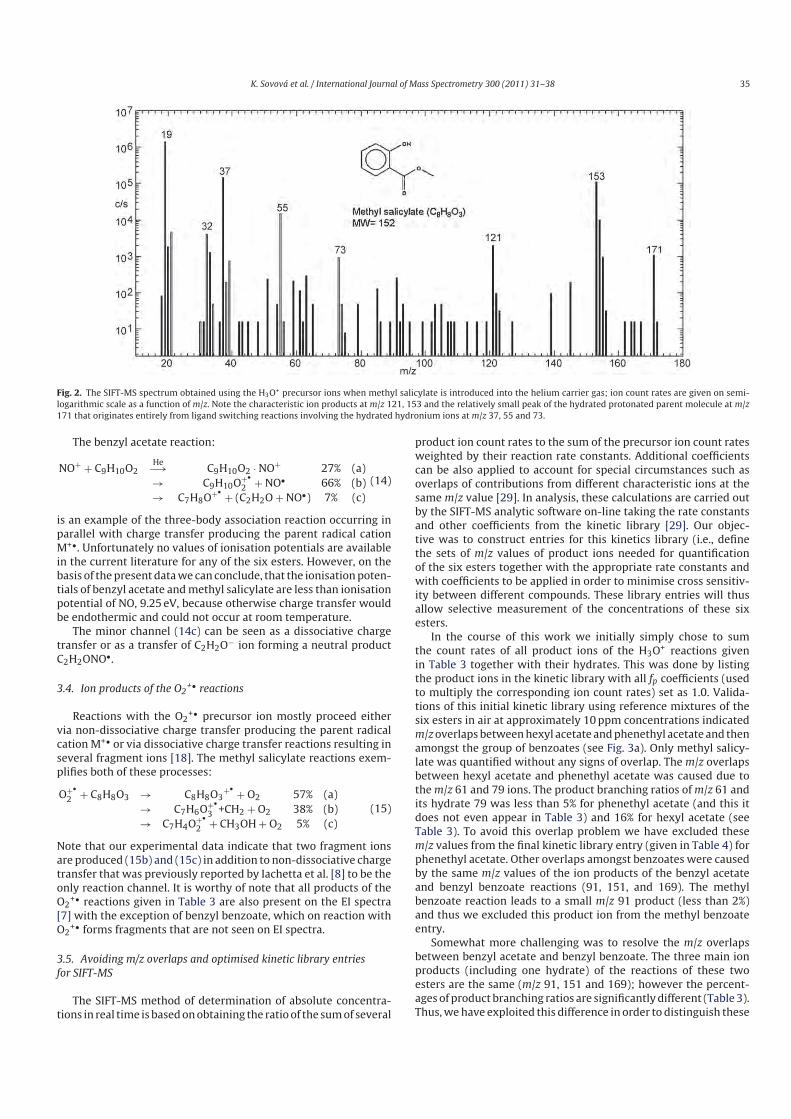
K. Sovová et al. / International Journal of Mass Spectrometry 300 (2011) 31–38 35
Fig. 2. The SIFT-MS spectrum obtained using the H3O+ precursor ions when methyl salicylate is introduced into the helium carrier gas; ion count rates are given on semi-
logarithmic scale as a function of m/z. Note the characteristic ion products at m/z 121, 153 and the relatively small peak of the hydrated protonated parent molecule at m/z
171 that originates entirely from ligand switching reactions involving the hydrated hydronium ions at m/z 37, 55 and 73.
The benzyl acetate reaction:
NO+ + C9H10O2He−→ C9H10O2 · NO+ 27% (a)
→ C9H10O+•2 + NO• 66% (b)
→ C7H8O+• + (C2H2O + NO•) 7% (c)
(14)
is an example of the three-body association reaction occurring in
parallel with charge transfer producing the parent radical cation
M+•. Unfortunately no values of ionisation potentials are available
in the current literature for any of the six esters. However, on the
basis of the present data we can conclude, that the ionisation poten-
tials of benzyl acetate and methyl salicylate are less than ionisation
potential of NO, 9.25 eV, because otherwise charge transfer would
be endothermic and could not occur at room temperature.
The minor channel (14c) can be seen as a dissociative charge
transfer or as a transfer of C2H2O− ion forming a neutral product
C2H2ONO•.
3.4. Ion products of the O2+• reactions
Reactions with the O2+• precursor ion mostly proceed either
via non-dissociative charge transfer producing the parent radical
cation M+• or via dissociative charge transfer reactions resulting in
several fragment ions [18]. The methyl salicylate reactions exem-
plifies both of these processes:
O+•2 + C8H8O3 → C8H8O3
+• + O2 57% (a)
→ C7H6O+•3 +CH2 + O2 38% (b)
→ C7H4O+•2 + CH3OH + O2 5% (c)
(15)
Note that our experimental data indicate that two fragment ions
are produced (15b) and (15c) in addition to non-dissociative charge
transfer that was previously reported by Iachetta et al. [8] to be the
only reaction channel. It is worthy of note that all products of the
O2+• reactions given in Table 3 are also present on the EI spectra
[7] with the exception of benzyl benzoate, which on reaction with
O2+• forms fragments that are not seen on EI spectra.
3.5. Avoiding m/z overlaps and optimised kinetic library entries
for SIFT-MS
The SIFT-MS method of determination of absolute concentra-
tions in real time is based on obtaining the ratio of the sum of several
product ion count rates to the sum of the precursor ion count rates
weighted by their reaction rate constants. Additional coefficients
can be also applied to account for special circumstances such as
overlaps of contributions from different characteristic ions at the
same m/z value [29]. In analysis, these calculations are carried out
by the SIFT-MS analytic software on-line taking the rate constants
and other coefficients from the kinetic library [29]. Our objec-
tive was to construct entries for this kinetics library (i.e., define
the sets of m/z values of product ions needed for quantification
of the six esters together with the appropriate rate constants and
with coefficients to be applied in order to minimise cross sensitiv-
ity between different compounds. These library entries will thus
allow selective measurement of the concentrations of these six
esters.
In the course of this work we initially simply chose to sum
the count rates of all product ions of the H3O+ reactions given
in Table 3 together with their hydrates. This was done by listing
the product ions in the kinetic library with all fp coefficients (used
to multiply the corresponding ion count rates) set as 1.0. Valida-
tions of this initial kinetic library using reference mixtures of the
six esters in air at approximately 10 ppm concentrations indicated
m/z overlaps between hexyl acetate and phenethyl acetate and then
amongst the group of benzoates (see Fig. 3a). Only methyl salicy-
late was quantified without any signs of overlap. The m/z overlaps
between hexyl acetate and phenethyl acetate was caused due to
the m/z 61 and 79 ions. The product branching ratios of m/z 61 and
its hydrate 79 was less than 5% for phenethyl acetate (and this it
does not even appear in Table 3) and 16% for hexyl acetate (see
Table 3). To avoid this overlap problem we have excluded these
m/z values from the final kinetic library entry (given in Table 4) for
phenethyl acetate. Other overlaps amongst benzoates were caused
by the same m/z values of the ion products of the benzyl acetate
and benzyl benzoate reactions (91, 151, and 169). The methyl
benzoate reaction leads to a small m/z 91 product (less than 2%)
and thus we excluded this product ion from the methyl benzoate
entry.
Somewhat more challenging was to resolve the m/z overlaps
between benzyl acetate and benzyl benzoate. The three main ion
products (including one hydrate) of the reactions of these two
esters are the same (m/z 91, 151 and 169); however the percent-
ages of product branching ratios are significantly different (Table 3).
Thus, we have exploited this difference in order to distinguish these
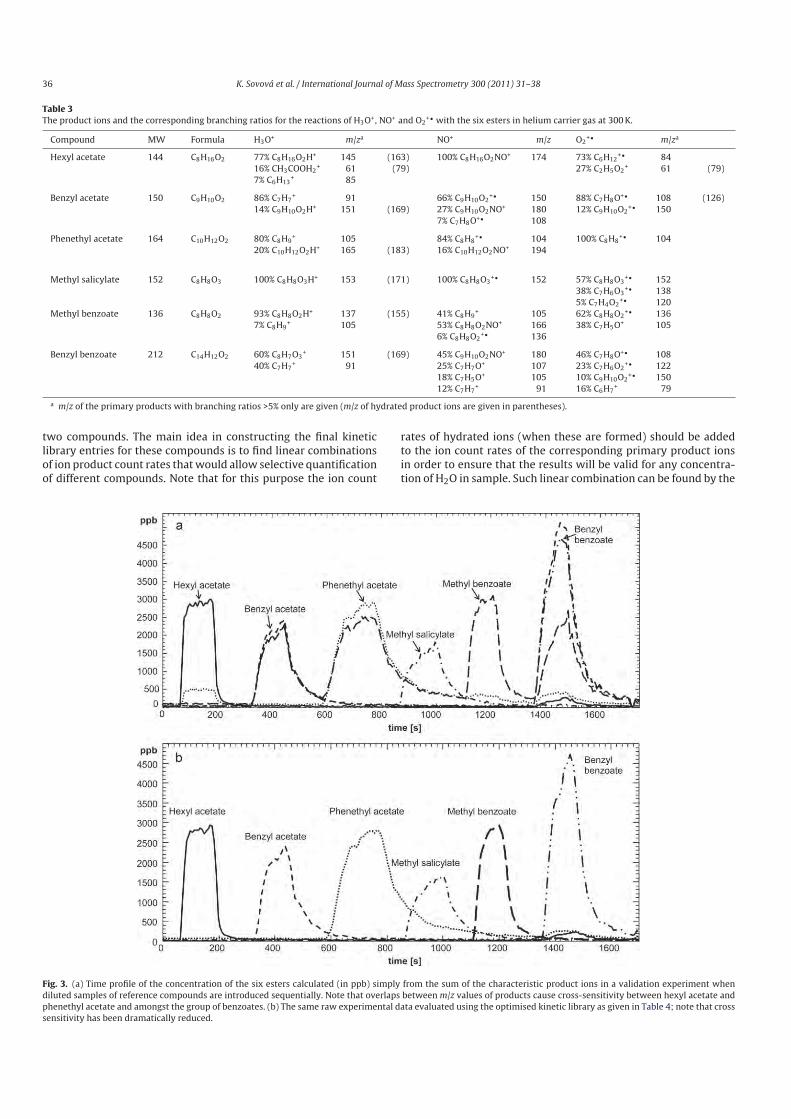
36 K. Sovová et al. / International Journal of Mass Spectrometry 300 (2011) 31–38
Table 3The product ions and the corresponding branching ratios for the reactions of H3O+, NO+ and O2
+• with the six esters in helium carrier gas at 300 K.
Compound MW Formula H3O+ m/za NO+ m/z O2+• m/za
Hexyl acetate 144 C8H16O2 77% C8H16O2H+ 145 (163) 100% C8H16O2NO+ 174 73% C6H12+• 84
16% CH3COOH2+ 61 (79) 27% C2H5O2
+ 61 (79)
7% C6H13+ 85
Benzyl acetate 150 C9H10O2 86% C7H7+ 91 66% C9H10O2
+• 150 88% C7H8O+• 108 (126)
14% C9H10O2H+ 151 (169) 27% C9H10O2NO+ 180 12% C9H10O2+• 150
7% C7H8O+• 108
Phenethyl acetate 164 C10H12O2 80% C8H9+ 105 84% C8H8
+• 104 100% C8H8+• 104
20% C10H12O2H+ 165 (183) 16% C10H12O2NO+ 194
Methyl salicylate 152 C8H8O3 100% C8H8O3H+ 153 (171) 100% C8H8O3+• 152 57% C8H8O3
+• 152
38% C7H6O3+• 138
5% C7H4O2+• 120
Methyl benzoate 136 C8H8O2 93% C8H8O2H+ 137 (155) 41% C8H9+ 105 62% C8H8O2
+• 136
7% C8H9+ 105 53% C8H8O2NO+ 166 38% C7H5O+ 105
6% C8H8O2+• 136
Benzyl benzoate 212 C14H12O2 60% C8H7O3+ 151 (169) 45% C9H10O2NO+ 180 46% C7H8O+• 108
40% C7H7+ 91 25% C7H7O+ 107 23% C7H6O2
+• 122
18% C7H5O+ 105 10% C9H10O2+• 150
12% C7H7+ 91 16% C6H7
+ 79
a m/z of the primary products with branching ratios >5% only are given (m/z of hydrated product ions are given in parentheses).
two compounds. The main idea in constructing the final kinetic
library entries for these compounds is to find linear combinations
of ion product count rates that would allow selective quantification
of different compounds. Note that for this purpose the ion count
rates of hydrated ions (when these are formed) should be added
to the ion count rates of the corresponding primary product ions
in order to ensure that the results will be valid for any concentra-
tion of H2O in sample. Such linear combination can be found by the
Fig. 3. (a) Time profile of the concentration of the six esters calculated (in ppb) simply from the sum of the characteristic product ions in a validation experiment when
diluted samples of reference compounds are introduced sequentially. Note that overlaps between m/z values of products cause cross-sensitivity between hexyl acetate and
phenethyl acetate and amongst the group of benzoates. (b) The same raw experimental data evaluated using the optimised kinetic library as given in Table 4; note that cross
sensitivity has been dramatically reduced.
K. Sovová et al. / International Journal of Mass Spectrometry 300 (2011) 31–38 37
Table 4SIFT-MS kinetics library in the format required by the SIFT-MS software for on-line calculations of the concentrations of the six esters, optimised for minimum cross sensitivity
(see the text for further discussion).
Hexyl acetate
(H3O+)
Phenethyl
acetate (H3O+)
Methyl salicylate
(H3O+)
Methyl benzoate
(H3O+)
Benzyl benzoate
(H3O+)
4 Precursors 4 Precursors 4 Precursors 4 Precursors 4 Precursors
19 3.2e−9 1.0 19 3.5e−9 1.0 19 3.8e−9 1.0 19 3.3e−9 1.0 19 3.7e−9 1.0
37 2.4e−9 1.0 37 2.6e−9 1.0 37 2.9e−9 1.0 37 2.5e−9 1.0 37 2.8e−9 1.0
55 2.1e−9 1.0 55 2.2e−9 1.0 55 2.5e−9 1.0 55 2.2e−9 1.0 55 2.4e−9 1.0
73 1.9e−9 1.0 73 2.0e−9 1.0 73 2.2e−9 1.0 73 2.0e−9 1.0 73 2.1e−9 1.0
Hexyl acetate
(H3O+)
Benzyl acetate
(H3O+)
Phenethyl
acetate (H3O+)
Methyl salicylate
(H3O+)
Methyl benzoate
(H3O+)
Benzyl benzoate
(H3O+)
5 Products 3 Products 6 Products 3 Products 3 Products 3 Products
61 1.0 91 1.38 105 1.088 121 1.077 137 1.236 91 −0.30
79 1.0 151 −0.86 137 −0.06 153 1.088 155 1.088 151 1.96
85 1.066 169 −0.86 155 −0.06 171 1.088 153 −0.16 169 1.96
145 1.088 163 −0.01
163 1.088 165 1.1
183 1.1
simple solution of a set of the linear equations:
A = fA [91]A + gA [151 + 169]A (a)
B = fB [91]B + gB [151 + 169]B (b)(16)
Here A represents the linear combination used to quantify benzyl
acetate and B represents the linear combination to quantify benzyl
benzoate. The square brackets indicate the product ion count rates
registered when the compound indicated by subscripts A (benzyl
acetate) and B (benzyl benzoate) is introduced into SIFT-MS. The
constraints on the coefficients f and g (treated as the unknowns in
the set of equations) are given by the requirement of calculating
zero concentration of A when only B is introduced and vice versa:
0 = fA [91]B + gA [151 + 169]B (a)
0 = fB [91]A + gB [151 + 169]A (b)(17)
Now it is possible to calculate f and g coefficients from the exper-
imental data of ion count rates using the pure compounds. For
the case of benzyl acetate and benzyl benzoate the results are:
fA = 1.38, gA = −0.86, fB = −0.30 and gB = 1.96. Details of calculation
for these two compounds are given in Appendix B. Similar exper-
iments and calculations were used to resolve other m/z overlaps.
The final kinetics library entries as given in Table 4 were then used
to calculate concentrations of all these six esters in the H3O+ vali-
dation experiment and, as can bee seen in Fig. 3b, cross sensitivity
has been successfully minimised using this kinetic library. Finally,
it is worthy of a note that the m/z 91 product of benzyl acetate over-
laps with the H3O+(H2O)4 water cluster and thus NO+ that leads to
m/z 150 and 180 characteristic product ions is a more suitable pre-
cursor ion for this compound, however m/z 180 is a main product
of benzyl benzoate and thus only m/z 150 should be used with an
appropriate coefficient.
4. Concluding remarks
The data obtained in this study allow SIFT-MS analyses of phy-
togenic esters in the presence of water vapour. On the basis of these
data it is now possible to use SIFT-MS to study ester emissions from
plants and possibly also from other organisms such as bacteria. The
combination of the three different precursor ions used for SIFT-MS
provides a tool to diminish ambiguity and to positive identify the
esters in mixtures of volatile compounds in air. Protonated esters
have a propensity to form cluster ions with water molecules and
the rate constants for such reactions have been also obtained in
this study. As a practical outcome, in addition to fundamental ion
kinetics data, SIFT-MS kinetic library entries have been constructed
that allow selective quantification of these esters in spite of some
overlaps between the m/z values of characteristic product ions.
Acknowledgements
We thank Violetta Shestivska for introducing us to the field of
phytoremediation and her help with some of the present exper-
iments, to Ondrej Zemek for providing reference samples of the
esters and to David Smith for his careful reading and editing of the
manuscript. We gratefully acknowledge financial support by the
Grant Agency of the Czech Republic (projects number 202/09/0800
and 203/09/0256) and by Grant Agency of Charles University
(project GAUK 32010).
Appendix A. Numerical examples of the calculations of theparameters Seff, Aeff and kMH+ for hexyl acetate and methylsalicylate
The experimental precursor and product ion count rates (cor-
rected for mass discrimination and differential diffusion) for H3O+
reactions of hexyl acetate and methyl salicylate are given in
Table A.1. The data were acquired in the MIM mode, as described
in Section 2.1. The symbols k19, k37, k55 and k73 indicate the rate
constants for the proton transfer reaction and for the switching
reactions of the respective hydrated hydronium ions with M and
are calculated according Su and Chesnavich [21]. Square brack-
ets [19], [37], [55], and [73] indicate the actual count rates of the
H3O+(H2O)1,2,3 ions and [MH+] and [MH+(H2O)] are the actual count
rates of the protonated molecule of a sample and its hydrate.Assigning these numerical values for hexyl acetate to Eq. (7)
gives the value Seff = 0.4. Using the values from Table A.1 in Eq. (8)
gives.
Aeff = 2 ln((([198802 + 337378]0)/[198802]))
ln(([1108200 + 96514 + 12455 + 1018]0)/[1108200])= 21.0 (A.1)
Finally combining these two numbers with the known rate con-
stant gives kMH+ = (21.0 − 0.4) · 6.0 · 10−28 = 12.4 · 10−27 cm6 s−1.Analogical calculation for methyl salicylate provides according
to Eq. (7) the same result for Seff = 0.4 however the value of Aeff
according to Eq. (8) is much smaller:
Aeff = 2 ln(([135510 + 2029]0)/[135510])
ln(([1856555 + 177350 + 14608 + 703]0/[1856555]))= 0.3 (A.2)
The fact that Aeff is very close to Seff (actually somewhat smaller
in this example) means that within the experimental error asso-
ciation does not measurably contribute to the formation of the
hydrated protonated ions.
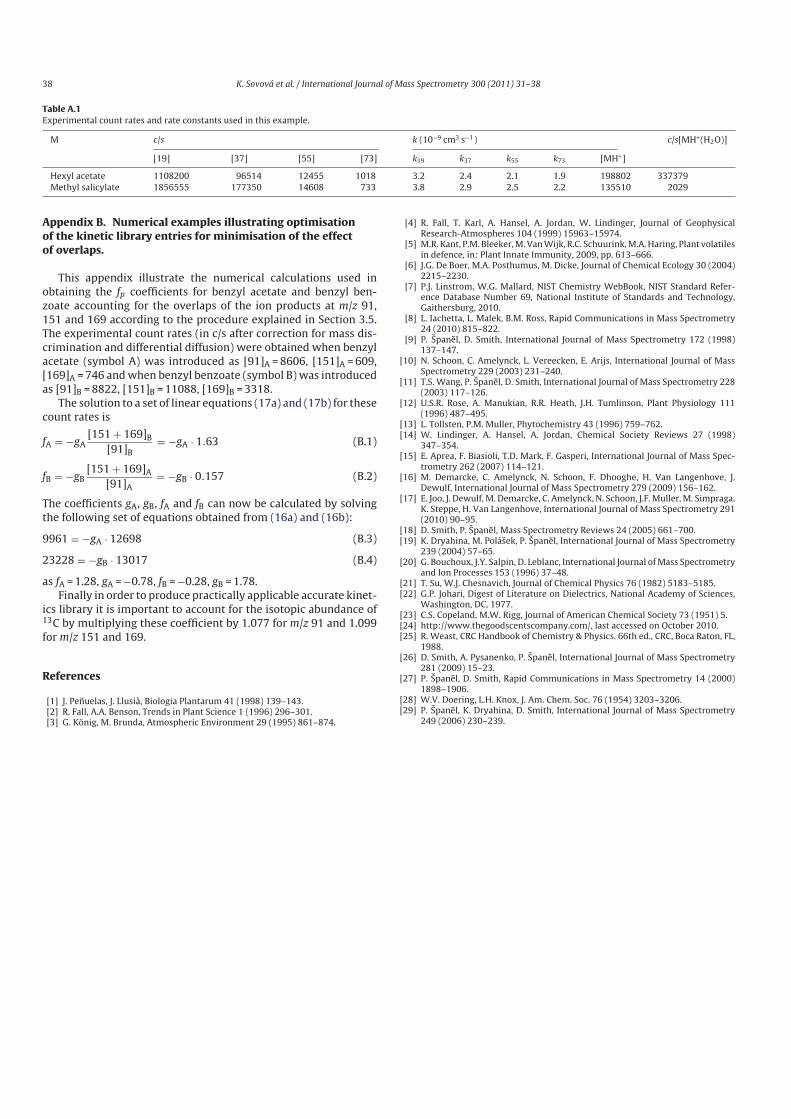
38 K. Sovová et al. / International Journal of Mass Spectrometry 300 (2011) 31–38
Table A.1Experimental count rates and rate constants used in this example.
M c/s k (10−9 cm3 s−1) c/s[MH+(H2O)]
[19] [37] [55] [73] k19 k37 k55 k73 [MH+]
Hexyl acetate 1108200 96514 12455 1018 3.2 2.4 2.1 1.9 198802 337379
Methyl salicylate 1856555 177350 14608 733 3.8 2.9 2.5 2.2 135510 2029
Appendix B. Numerical examples illustrating optimisationof the kinetic library entries for minimisation of the effectof overlaps.
This appendix illustrate the numerical calculations used in
obtaining the fp coefficients for benzyl acetate and benzyl ben-
zoate accounting for the overlaps of the ion products at m/z 91,
151 and 169 according to the procedure explained in Section 3.5.
The experimental count rates (in c/s after correction for mass dis-
crimination and differential diffusion) were obtained when benzyl
acetate (symbol A) was introduced as [91]A = 8606, [151]A = 609,
[169]A = 746 and when benzyl benzoate (symbol B) was introduced
as [91]B = 8822, [151]B = 11088, [169]B = 3318.
The solution to a set of linear equations (17a) and (17b) for these
count rates is
fA = −gA[151 + 169]B
[91]B
= −gA · 1.63 (B.1)
fB = −gB[151 + 169]A
[91]A
= −gB · 0.157 (B.2)
The coefficients gA, gB, fA and fB can now be calculated by solving
the following set of equations obtained from (16a) and (16b):
9961 = −gA · 12698 (B.3)
23228 = −gB · 13017 (B.4)
as fA = 1.28, gA = −0.78, fB = −0.28, gB = 1.78.
Finally in order to produce practically applicable accurate kinet-
ics library it is important to account for the isotopic abundance of13C by multiplying these coefficient by 1.077 for m/z 91 and 1.099
for m/z 151 and 169.
References
[1] J. Penuelas, J. Llusià, Biologia Plantarum 41 (1998) 139–143.[2] R. Fall, A.A. Benson, Trends in Plant Science 1 (1996) 296–301.[3] G. König, M. Brunda, Atmospheric Environment 29 (1995) 861–874.
[4] R. Fall, T. Karl, A. Hansel, A. Jordan, W. Lindinger, Journal of GeophysicalResearch-Atmospheres 104 (1999) 15963–15974.
[5] M.R. Kant, P.M. Bleeker, M. Van Wijk, R.C. Schuurink, M.A. Haring, Plant volatilesin defence, in: Plant Innate Immunity, 2009, pp. 613–666.
[6] J.G. De Boer, M.A. Posthumus, M. Dicke, Journal of Chemical Ecology 30 (2004)2215–2230.
[7] P.J. Linstrom, W.G. Mallard, NIST Chemistry WebBook, NIST Standard Refer-ence Database Number 69, National Institute of Standards and Technology,Gaithersburg, 2010.
[8] L. Iachetta, L. Malek, B.M. Ross, Rapid Communications in Mass Spectrometry24 (2010) 815–822.
[9] P. Spanel, D. Smith, International Journal of Mass Spectrometry 172 (1998)137–147.
[10] N. Schoon, C. Amelynck, L. Vereecken, E. Arijs, International Journal of MassSpectrometry 229 (2003) 231–240.
[11] T.S. Wang, P. Spanel, D. Smith, International Journal of Mass Spectrometry 228(2003) 117–126.
[12] U.S.R. Rose, A. Manukian, R.R. Heath, J.H. Tumlinson, Plant Physiology 111(1996) 487–495.
[13] L. Tollsten, P.M. Muller, Phytochemistry 43 (1996) 759–762.[14] W. Lindinger, A. Hansel, A. Jordan, Chemical Society Reviews 27 (1998)
347–354.[15] E. Aprea, F. Biasioli, T.D. Mark, F. Gasperi, International Journal of Mass Spec-
trometry 262 (2007) 114–121.[16] M. Demarcke, C. Amelynck, N. Schoon, F. Dhooghe, H. Van Langenhove, J.
Dewulf, International Journal of Mass Spectrometry 279 (2009) 156–162.[17] E. Joo, J. Dewulf, M. Demarcke, C. Amelynck, N. Schoon, J.F. Muller, M. Simpraga,
K. Steppe, H. Van Langenhove, International Journal of Mass Spectrometry 291(2010) 90–95.
[18] D. Smith, P. Spanel, Mass Spectrometry Reviews 24 (2005) 661–700.[19] K. Dryahina, M. Polásek, P. Spanel, International Journal of Mass Spectrometry
239 (2004) 57–65.[20] G. Bouchoux, J.Y. Salpin, D. Leblanc, International Journal of Mass Spectrometry
and Ion Processes 153 (1996) 37–48.[21] T. Su, W.J. Chesnavich, Journal of Chemical Physics 76 (1982) 5183–5185.[22] G.P. Johari, Digest of Literature on Dielectrics, National Academy of Sciences,
Washington, DC, 1977.[23] C.S. Copeland, M.W. Rigg, Journal of American Chemical Society 73 (1951) 5.[24] http://www.thegoodscentscompany.com/, last accessed on October 2010.[25] R. Weast, CRC Handbook of Chemistry & Physics. 66th ed., CRC, Boca Raton, FL,
1988.[26] D. Smith, A. Pysanenko, P. Spanel, International Journal of Mass Spectrometry
281 (2009) 15–23.[27] P. Spanel, D. Smith, Rapid Communications in Mass Spectrometry 14 (2000)
1898–1906.[28] W.V. Doering, L.H. Knox, J. Am. Chem. Soc. 76 (1954) 3203–3206.[29] P. Spanel, K. Dryahina, D. Smith, International Journal of Mass Spectrometry
249 (2006) 230–239.
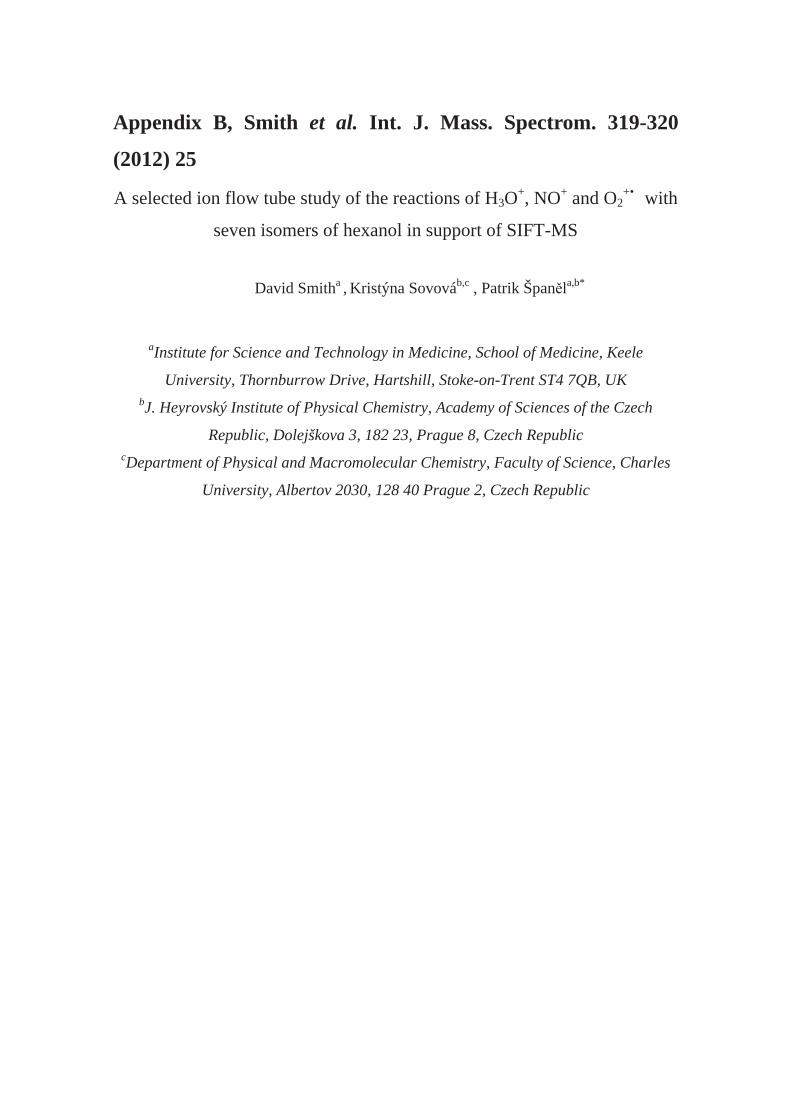
Appendix B, Smith et al. Int. J. Mass. Spectrom. 319-320
(2012) 25
A selected ion flow tube study of the reactions of H3O+, NO+ and O2+• with
seven isomers of hexanol in support of SIFT-MS
David Smitha , Kristýna Sovováb,c , Patrik Špan la,b*
aInstitute for Science and Technology in Medicine, School of Medicine, Keele
University, Thornburrow Drive, Hartshill, Stoke-on-Trent ST4 7QB, UK bJ. Heyrovský Institute of Physical Chemistry, Academy of Sciences of the Czech
Republic, Dolejškova 3, 182 23, Prague 8, Czech Republic cDepartment of Physical and Macromolecular Chemistry, Faculty of Science, Charles
University, Albertov 2030, 128 40 Prague 2, Czech Republic

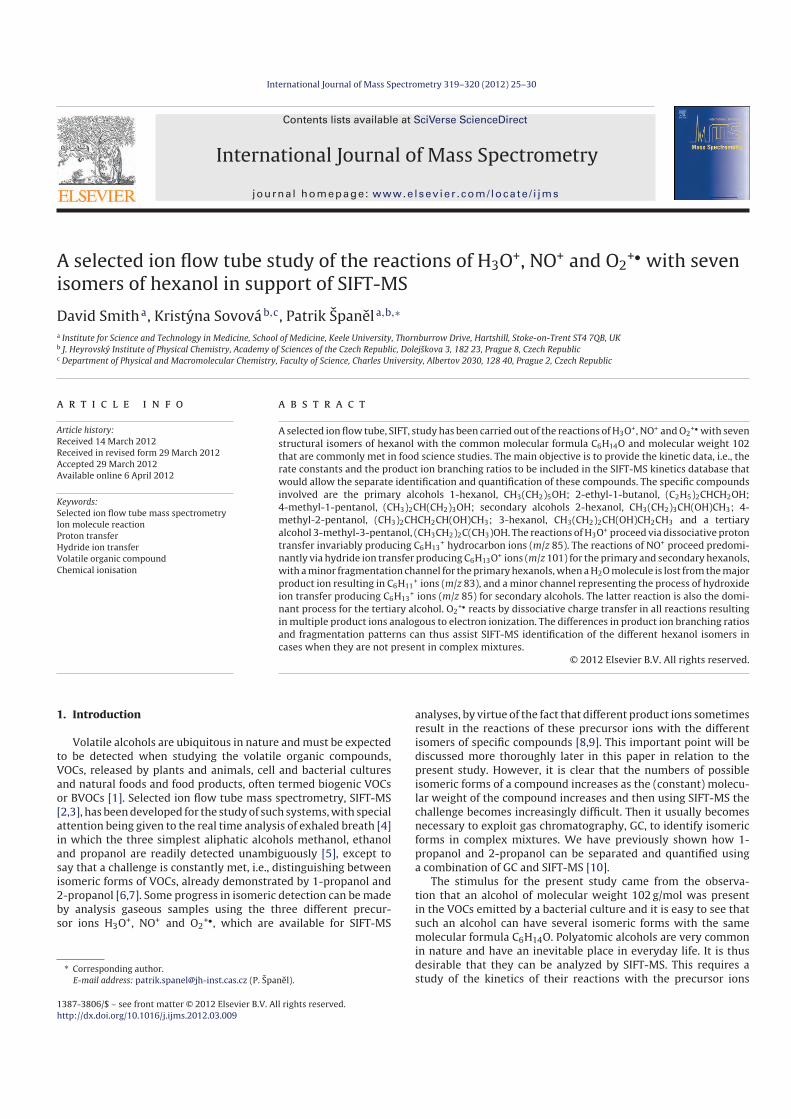
International Journal of Mass Spectrometry 319– 320 (2012) 25– 30
Contents lists available at SciVerse ScienceDirect
International Journal of Mass Spectrometry
j our na l ho me page: www.elsev ier .com/ locate / i jms
A selected ion flow tube study of the reactions of H3O+, NO+ and O2+• with seven
isomers of hexanol in support of SIFT-MS
David Smitha, Kristyna Sovováb,c, Patrik Spanel a,b,∗
a Institute for Science and Technology in Medicine, School of Medicine, Keele University, Thornburrow Drive, Hartshill, Stoke-on-Trent ST4 7QB, UKb J. Heyrovsky Institute of Physical Chemistry, Academy of Sciences of the Czech Republic, Dolejskova 3, 182 23, Prague 8, Czech Republicc Department of Physical and Macromolecular Chemistry, Faculty of Science, Charles University, Albertov 2030, 128 40, Prague 2, Czech Republic
a r t i c l e i n f o
Article history:
Received 14 March 2012
Received in revised form 29 March 2012
Accepted 29 March 2012
Available online 6 April 2012
Keywords:
Selected ion flow tube mass spectrometry
Ion molecule reaction
Proton transfer
Hydride ion transfer
Volatile organic compound
Chemical ionisation
a b s t r a c t
A selected ion flow tube, SIFT, study has been carried out of the reactions of H3O+, NO+ and O2+• with seven
structural isomers of hexanol with the common molecular formula C6H14O and molecular weight 102
that are commonly met in food science studies. The main objective is to provide the kinetic data, i.e., the
rate constants and the product ion branching ratios to be included in the SIFT-MS kinetics database that
would allow the separate identification and quantification of these compounds. The specific compounds
involved are the primary alcohols 1-hexanol, CH3(CH2)5OH; 2-ethyl-1-butanol, (C2H5)2CHCH2OH;
4-methyl-1-pentanol, (CH3)2CH(CH2)3OH; secondary alcohols 2-hexanol, CH3(CH2)3CH(OH)CH3; 4-
methyl-2-pentanol, (CH3)2CHCH2CH(OH)CH3; 3-hexanol, CH3(CH2)2CH(OH)CH2CH3 and a tertiary
alcohol 3-methyl-3-pentanol, (CH3CH2)2C(CH3)OH. The reactions of H3O+ proceed via dissociative proton
transfer invariably producing C6H13+ hydrocarbon ions (m/z 85). The reactions of NO+ proceed predomi-
nantly via hydride ion transfer producing C6H13O+ ions (m/z 101) for the primary and secondary hexanols,
with a minor fragmentation channel for the primary hexanols, when a H2O molecule is lost from the major
product ion resulting in C6H11+ ions (m/z 83), and a minor channel representing the process of hydroxide
ion transfer producing C6H13+ ions (m/z 85) for secondary alcohols. The latter reaction is also the domi-
nant process for the tertiary alcohol. O2+• reacts by dissociative charge transfer in all reactions resulting
in multiple product ions analogous to electron ionization. The differences in product ion branching ratios
and fragmentation patterns can thus assist SIFT-MS identification of the different hexanol isomers in
cases when they are not present in complex mixtures.
© 2012 Elsevier B.V. All rights reserved.
1. Introduction
Volatile alcohols are ubiquitous in nature and must be expected
to be detected when studying the volatile organic compounds,
VOCs, released by plants and animals, cell and bacterial cultures
and natural foods and food products, often termed biogenic VOCs
or BVOCs [1]. Selected ion flow tube mass spectrometry, SIFT-MS
[2,3], has been developed for the study of such systems, with special
attention being given to the real time analysis of exhaled breath [4]
in which the three simplest aliphatic alcohols methanol, ethanol
and propanol are readily detected unambiguously [5], except to
say that a challenge is constantly met, i.e., distinguishing between
isomeric forms of VOCs, already demonstrated by 1-propanol and
2-propanol [6,7]. Some progress in isomeric detection can be made
by analysis gaseous samples using the three different precur-
sor ions H3O+, NO+ and O2+•, which are available for SIFT-MS
∗ Corresponding author.
E-mail address: [email protected] (P. Spanel).
analyses, by virtue of the fact that different product ions sometimes
result in the reactions of these precursor ions with the different
isomers of specific compounds [8,9]. This important point will be
discussed more thoroughly later in this paper in relation to the
present study. However, it is clear that the numbers of possible
isomeric forms of a compound increases as the (constant) molecu-
lar weight of the compound increases and then using SIFT-MS the
challenge becomes increasingly difficult. Then it usually becomes
necessary to exploit gas chromatography, GC, to identify isomeric
forms in complex mixtures. We have previously shown how 1-
propanol and 2-propanol can be separated and quantified using
a combination of GC and SIFT-MS [10].
The stimulus for the present study came from the observa-
tion that an alcohol of molecular weight 102 g/mol was present
in the VOCs emitted by a bacterial culture and it is easy to see that
such an alcohol can have several isomeric forms with the same
molecular formula C6H14O. Polyatomic alcohols are very common
in nature and have an inevitable place in everyday life. It is thus
desirable that they can be analyzed by SIFT-MS. This requires a
study of the kinetics of their reactions with the precursor ions
1387-3806/$ – see front matter © 2012 Elsevier B.V. All rights reserved.http://dx.doi.org/10.1016/j.ijms.2012.03.009
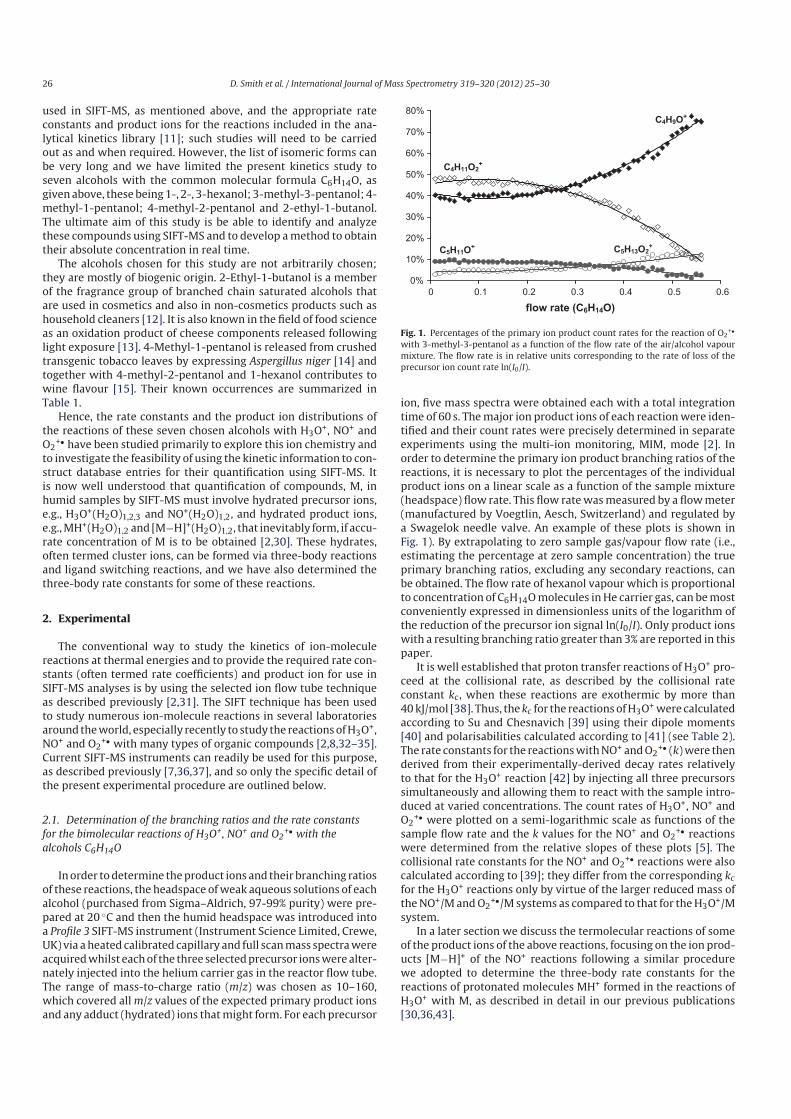
26 D. Smith et al. / International Journal of Mass Spectrometry 319– 320 (2012) 25– 30
used in SIFT-MS, as mentioned above, and the appropriate rate
constants and product ions for the reactions included in the ana-
lytical kinetics library [11]; such studies will need to be carried
out as and when required. However, the list of isomeric forms can
be very long and we have limited the present kinetics study to
seven alcohols with the common molecular formula C6H14O, as
given above, these being 1-, 2-, 3-hexanol; 3-methyl-3-pentanol; 4-
methyl-1-pentanol; 4-methyl-2-pentanol and 2-ethyl-1-butanol.
The ultimate aim of this study is be able to identify and analyze
these compounds using SIFT-MS and to develop a method to obtain
their absolute concentration in real time.
The alcohols chosen for this study are not arbitrarily chosen;
they are mostly of biogenic origin. 2-Ethyl-1-butanol is a member
of the fragrance group of branched chain saturated alcohols that
are used in cosmetics and also in non-cosmetics products such as
household cleaners [12]. It is also known in the field of food science
as an oxidation product of cheese components released following
light exposure [13]. 4-Methyl-1-pentanol is released from crushed
transgenic tobacco leaves by expressing Aspergillus niger [14] and
together with 4-methyl-2-pentanol and 1-hexanol contributes to
wine flavour [15]. Their known occurrences are summarized in
Table 1.
Hence, the rate constants and the product ion distributions of
the reactions of these seven chosen alcohols with H3O+, NO+ and
O2+• have been studied primarily to explore this ion chemistry and
to investigate the feasibility of using the kinetic information to con-
struct database entries for their quantification using SIFT-MS. It
is now well understood that quantification of compounds, M, in
humid samples by SIFT-MS must involve hydrated precursor ions,
e.g., H3O+(H2O)1,2,3 and NO+(H2O)1,2, and hydrated product ions,
e.g., MH+(H2O)1,2 and [M−H]+(H2O)1,2, that inevitably form, if accu-
rate concentration of M is to be obtained [2,30]. These hydrates,
often termed cluster ions, can be formed via three-body reactions
and ligand switching reactions, and we have also determined the
three-body rate constants for some of these reactions.
2. Experimental
The conventional way to study the kinetics of ion-molecule
reactions at thermal energies and to provide the required rate con-
stants (often termed rate coefficients) and product ion for use in
SIFT-MS analyses is by using the selected ion flow tube technique
as described previously [2,31]. The SIFT technique has been used
to study numerous ion-molecule reactions in several laboratories
around the world, especially recently to study the reactions of H3O+,
NO+ and O2+• with many types of organic compounds [2,8,32–35].
Current SIFT-MS instruments can readily be used for this purpose,
as described previously [7,36,37], and so only the specific detail of
the present experimental procedure are outlined below.
2.1. Determination of the branching ratios and the rate constants
for the bimolecular reactions of H3O+, NO+ and O2+• with the
alcohols C6H14O
In order to determine the product ions and their branching ratios
of these reactions, the headspace of weak aqueous solutions of each
alcohol (purchased from Sigma–Aldrich, 97-99% purity) were pre-
pared at 20 ◦C and then the humid headspace was introduced into
a Profile 3 SIFT-MS instrument (Instrument Science Limited, Crewe,
UK) via a heated calibrated capillary and full scan mass spectra were
acquired whilst each of the three selected precursor ions were alter-
nately injected into the helium carrier gas in the reactor flow tube.
The range of mass-to-charge ratio (m/z) was chosen as 10–160,
which covered all m/z values of the expected primary product ions
and any adduct (hydrated) ions that might form. For each precursor
0%
10%
20%
30%
40%
50%
60%
70%
80%
0.60.50.40.30.20.10
flow rate (C6H14 O)
C4H9O+
C4H11 O2+
C5H11 O+ C5H13 O2+
Fig. 1. Percentages of the primary ion product count rates for the reaction of O2+•
with 3-methyl-3-pentanol as a function of the flow rate of the air/alcohol vapour
mixture. The flow rate is in relative units corresponding to the rate of loss of the
precursor ion count rate ln(I0/I).
ion, five mass spectra were obtained each with a total integration
time of 60 s. The major ion product ions of each reaction were iden-
tified and their count rates were precisely determined in separate
experiments using the multi-ion monitoring, MIM, mode [2]. In
order to determine the primary ion product branching ratios of the
reactions, it is necessary to plot the percentages of the individual
product ions on a linear scale as a function of the sample mixture
(headspace) flow rate. This flow rate was measured by a flow meter
(manufactured by Voegtlin, Aesch, Switzerland) and regulated by
a Swagelok needle valve. An example of these plots is shown in
Fig. 1). By extrapolating to zero sample gas/vapour flow rate (i.e.,
estimating the percentage at zero sample concentration) the true
primary branching ratios, excluding any secondary reactions, can
be obtained. The flow rate of hexanol vapour which is proportional
to concentration of C6H14O molecules in He carrier gas, can be most
conveniently expressed in dimensionless units of the logarithm of
the reduction of the precursor ion signal ln(I0/I). Only product ions
with a resulting branching ratio greater than 3% are reported in this
paper.
It is well established that proton transfer reactions of H3O+ pro-
ceed at the collisional rate, as described by the collisional rate
constant kc, when these reactions are exothermic by more than
40 kJ/mol [38]. Thus, the kc for the reactions of H3O+ were calculated
according to Su and Chesnavich [39] using their dipole moments
[40] and polarisabilities calculated according to [41] (see Table 2).
The rate constants for the reactions with NO+ and O2+• (k) were then
derived from their experimentally-derived decay rates relatively
to that for the H3O+ reaction [42] by injecting all three precursors
simultaneously and allowing them to react with the sample intro-
duced at varied concentrations. The count rates of H3O+, NO+ and
O2+• were plotted on a semi-logarithmic scale as functions of the
sample flow rate and the k values for the NO+ and O2+• reactions
were determined from the relative slopes of these plots [5]. The
collisional rate constants for the NO+ and O2+• reactions were also
calculated according to [39]; they differ from the corresponding kc
for the H3O+ reactions only by virtue of the larger reduced mass of
the NO+/M and O2+•/M systems as compared to that for the H3O+/M
system.
In a later section we discuss the termolecular reactions of some
of the product ions of the above reactions, focusing on the ion prod-
ucts [M−H]+ of the NO+ reactions following a similar procedure
we adopted to determine the three-body rate constants for the
reactions of protonated molecules MH+ formed in the reactions of
H3O+ with M, as described in detail in our previous publications
[30,36,43].
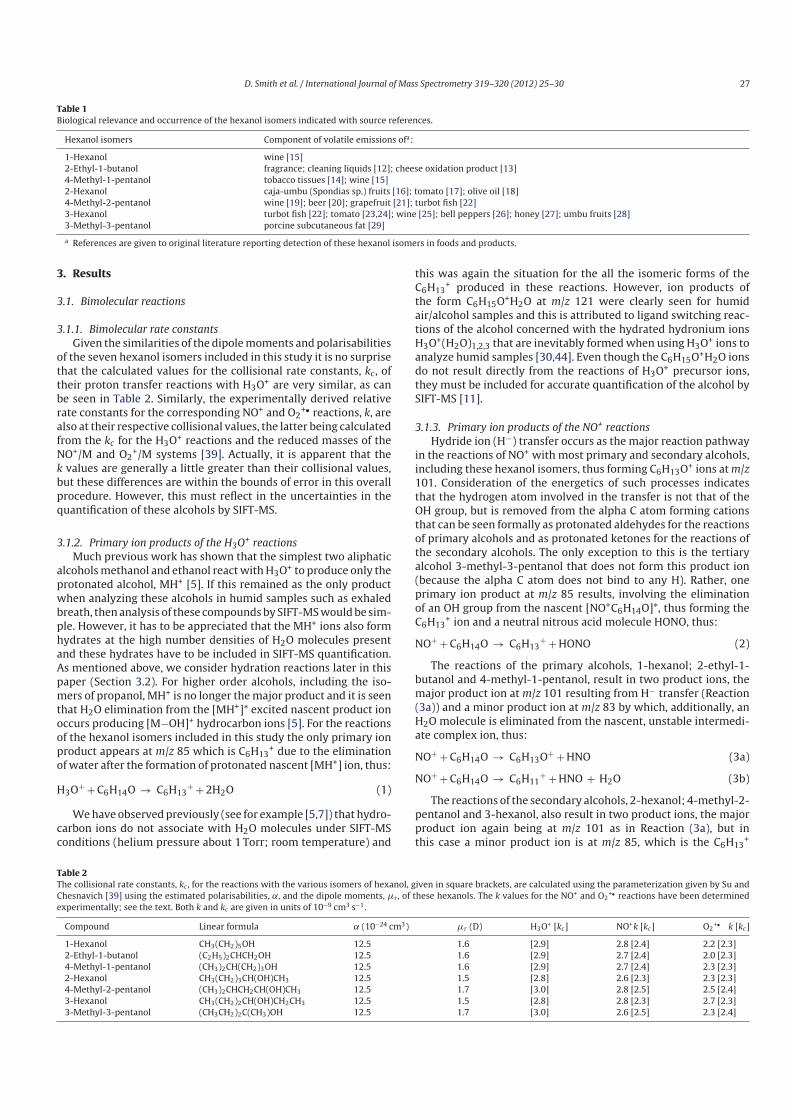
D. Smith et al. / International Journal of Mass Spectrometry 319– 320 (2012) 25– 30 27
Table 1Biological relevance and occurrence of the hexanol isomers indicated with source references.
Hexanol isomers Component of volatile emissions ofa:
1-Hexanol wine [15]
2-Ethyl-1-butanol fragrance; cleaning liquids [12]; cheese oxidation product [13]
4-Methyl-1-pentanol tobacco tissues [14]; wine [15]
2-Hexanol caja-umbu (Spondias sp.) fruits [16]; tomato [17]; olive oil [18]
4-Methyl-2-pentanol wine [19]; beer [20]; grapefruit [21]; turbot fish [22]
3-Hexanol turbot fish [22]; tomato [23,24]; wine [25]; bell peppers [26]; honey [27]; umbu fruits [28]
3-Methyl-3-pentanol porcine subcutaneous fat [29]
a References are given to original literature reporting detection of these hexanol isomers in foods and products.
3. Results
3.1. Bimolecular reactions
3.1.1. Bimolecular rate constants
Given the similarities of the dipole moments and polarisabilities
of the seven hexanol isomers included in this study it is no surprise
that the calculated values for the collisional rate constants, kc, of
their proton transfer reactions with H3O+ are very similar, as can
be seen in Table 2. Similarly, the experimentally derived relative
rate constants for the corresponding NO+ and O2+• reactions, k, are
also at their respective collisional values, the latter being calculated
from the kc for the H3O+ reactions and the reduced masses of the
NO+/M and O2+/M systems [39]. Actually, it is apparent that the
k values are generally a little greater than their collisional values,
but these differences are within the bounds of error in this overall
procedure. However, this must reflect in the uncertainties in the
quantification of these alcohols by SIFT-MS.
3.1.2. Primary ion products of the H3O+ reactions
Much previous work has shown that the simplest two aliphatic
alcohols methanol and ethanol react with H3O+ to produce only the
protonated alcohol, MH+ [5]. If this remained as the only product
when analyzing these alcohols in humid samples such as exhaled
breath, then analysis of these compounds by SIFT-MS would be sim-
ple. However, it has to be appreciated that the MH+ ions also form
hydrates at the high number densities of H2O molecules present
and these hydrates have to be included in SIFT-MS quantification.
As mentioned above, we consider hydration reactions later in this
paper (Section 3.2). For higher order alcohols, including the iso-
mers of propanol, MH+ is no longer the major product and it is seen
that H2O elimination from the [MH+]* excited nascent product ion
occurs producing [M−OH]+ hydrocarbon ions [5]. For the reactions
of the hexanol isomers included in this study the only primary ion
product appears at m/z 85 which is C6H13+ due to the elimination
of water after the formation of protonated nascent [MH+] ion, thus:
H3O+ + C6H14O → C6H13+ + 2H2O (1)
We have observed previously (see for example [5,7]) that hydro-
carbon ions do not associate with H2O molecules under SIFT-MS
conditions (helium pressure about 1 Torr; room temperature) and
this was again the situation for the all the isomeric forms of the
C6H13+ produced in these reactions. However, ion products of
the form C6H15O+H2O at m/z 121 were clearly seen for humid
air/alcohol samples and this is attributed to ligand switching reac-
tions of the alcohol concerned with the hydrated hydronium ions
H3O+(H2O)1,2,3 that are inevitably formed when using H3O+ ions to
analyze humid samples [30,44]. Even though the C6H15O+H2O ions
do not result directly from the reactions of H3O+ precursor ions,
they must be included for accurate quantification of the alcohol by
SIFT-MS [11].
3.1.3. Primary ion products of the NO+ reactions
Hydride ion (H−) transfer occurs as the major reaction pathway
in the reactions of NO+ with most primary and secondary alcohols,
including these hexanol isomers, thus forming C6H13O+ ions at m/z
101. Consideration of the energetics of such processes indicates
that the hydrogen atom involved in the transfer is not that of the
OH group, but is removed from the alpha C atom forming cations
that can be seen formally as protonated aldehydes for the reactions
of primary alcohols and as protonated ketones for the reactions of
the secondary alcohols. The only exception to this is the tertiary
alcohol 3-methyl-3-pentanol that does not form this product ion
(because the alpha C atom does not bind to any H). Rather, one
primary ion product at m/z 85 results, involving the elimination
of an OH group from the nascent [NO+C6H14O]*, thus forming the
C6H13+ ion and a neutral nitrous acid molecule HONO, thus:
NO+ + C6H14O → C6H13+ + HONO (2)
The reactions of the primary alcohols, 1-hexanol; 2-ethyl-1-
butanol and 4-methyl-1-pentanol, result in two product ions, the
major product ion at m/z 101 resulting from H− transfer (Reaction
(3a)) and a minor product ion at m/z 83 by which, additionally, an
H2O molecule is eliminated from the nascent, unstable intermedi-
ate complex ion, thus:
NO+ + C6H14O → C6H13O+ + HNO (3a)
NO+ + C6H14O → C6H11+ + HNO + H2O (3b)
The reactions of the secondary alcohols, 2-hexanol; 4-methyl-2-
pentanol and 3-hexanol, also result in two product ions, the major
product ion again being at m/z 101 as in Reaction (3a), but in
this case a minor product ion is at m/z 85, which is the C6H13+
Table 2The collisional rate constants, kc , for the reactions with the various isomers of hexanol, given in square brackets, are calculated using the parameterization given by Su and
Chesnavich [39] using the estimated polarisabilities, ˛, and the dipole moments, �r , of these hexanols. The k values for the NO+ and O2+• reactions have been determined
experimentally; see the text. Both k and kc are given in units of 10−9 cm3 s−1.
Compound Linear formula (10−24 cm3) �r (D) H3O+ [kc] NO+k [kc] O2+• k [kc]
1-Hexanol CH3(CH2)5OH 12.5 1.6 [2.9] 2.8 [2.4] 2.2 [2.3]
2-Ethyl-1-butanol (C2H5)2CHCH2OH 12.5 1.6 [2.9] 2.7 [2.4] 2.0 [2.3]
4-Methyl-1-pentanol (CH3)2CH(CH2)3OH 12.5 1.6 [2.9] 2.7 [2.4] 2.3 [2.3]
2-Hexanol CH3(CH2)3CH(OH)CH3 12.5 1.5 [2.8] 2.6 [2.3] 2.3 [2.3]
4-Methyl-2-pentanol (CH3)2CHCH2CH(OH)CH3 12.5 1.7 [3.0] 2.8 [2.5] 2.5 [2.4]
3-Hexanol CH3(CH2)2CH(OH)CH2CH3 12.5 1.5 [2.8] 2.8 [2.3] 2.7 [2.3]
3-Methyl-3-pentanol (CH3CH2)2C(CH3)OH 12.5 1.7 [3.0] 2.6 [2.5] 2.3 [2.4]
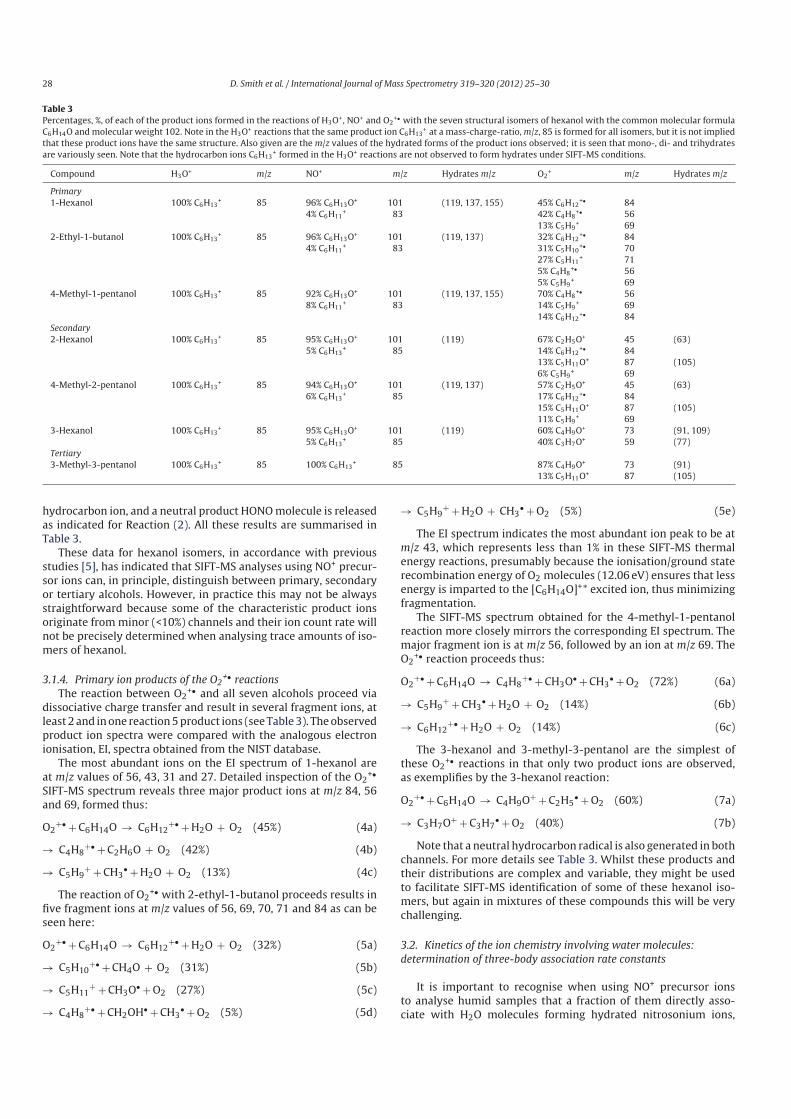
28 D. Smith et al. / International Journal of Mass Spectrometry 319– 320 (2012) 25– 30
Table 3Percentages, %, of each of the product ions formed in the reactions of H3O+, NO+ and O2
+• with the seven structural isomers of hexanol with the common molecular formula
C6H14O and molecular weight 102. Note in the H3O+ reactions that the same product ion C6H13+ at a mass-charge-ratio, m/z, 85 is formed for all isomers, but it is not implied
that these product ions have the same structure. Also given are the m/z values of the hydrated forms of the product ions observed; it is seen that mono-, di- and trihydrates
are variously seen. Note that the hydrocarbon ions C6H13+ formed in the H3O+ reactions are not observed to form hydrates under SIFT-MS conditions.
Compound H3O+ m/z NO+ m/z Hydrates m/z O2+ m/z Hydrates m/z
Primary
1-Hexanol 100% C6H13+ 85 96% C6H13O+ 101 (119, 137, 155) 45% C6H12
+• 84
4% C6H11+ 83 42% C4H8
+• 56
13% C5H9+ 69
2-Ethyl-1-butanol 100% C6H13+ 85 96% C6H13O+ 101 (119, 137) 32% C6H12
+• 84
4% C6H11+ 83 31% C5H10
+• 70
27% C5H11+ 71
5% C4H8+• 56
5% C5H9+ 69
4-Methyl-1-pentanol 100% C6H13+ 85 92% C6H13O+ 101 (119, 137, 155) 70% C4H8
+• 56
8% C6H11+ 83 14% C5H9
+ 69
14% C6H12+• 84
Secondary
2-Hexanol 100% C6H13+ 85 95% C6H13O+ 101 (119) 67% C2H5O+ 45 (63)
5% C6H13+ 85 14% C6H12
+• 84
13% C5H11O+ 87 (105)
6% C5H9+ 69
4-Methyl-2-pentanol 100% C6H13+ 85 94% C6H13O+ 101 (119, 137) 57% C2H5O+ 45 (63)
6% C6H13+ 85 17% C6H12
+• 84
15% C5H11O+ 87 (105)
11% C5H9+ 69
3-Hexanol 100% C6H13+ 85 95% C6H13O+ 101 (119) 60% C4H9O+ 73 (91, 109)
5% C6H13+ 85 40% C3H7O+ 59 (77)
Tertiary
3-Methyl-3-pentanol 100% C6H13+ 85 100% C6H13
+ 85 87% C4H9O+ 73 (91)
13% C5H11O+ 87 (105)
hydrocarbon ion, and a neutral product HONO molecule is released
as indicated for Reaction (2). All these results are summarised in
Table 3.
These data for hexanol isomers, in accordance with previous
studies [5], has indicated that SIFT-MS analyses using NO+ precur-
sor ions can, in principle, distinguish between primary, secondary
or tertiary alcohols. However, in practice this may not be always
straightforward because some of the characteristic product ions
originate from minor (<10%) channels and their ion count rate will
not be precisely determined when analysing trace amounts of iso-
mers of hexanol.
3.1.4. Primary ion products of the O2+• reactions
The reaction between O2+• and all seven alcohols proceed via
dissociative charge transfer and result in several fragment ions, at
least 2 and in one reaction 5 product ions (see Table 3). The observed
product ion spectra were compared with the analogous electron
ionisation, EI, spectra obtained from the NIST database.
The most abundant ions on the EI spectrum of 1-hexanol are
at m/z values of 56, 43, 31 and 27. Detailed inspection of the O2+•
SIFT-MS spectrum reveals three major product ions at m/z 84, 56
and 69, formed thus:
O2+• + C6H14O → C6H12
+• + H2O + O2 (45%) (4a)
→ C4H8+• + C2H6O + O2 (42%) (4b)
→ C5H9+ + CH3
• + H2O + O2 (13%) (4c)
The reaction of O2+• with 2-ethyl-1-butanol proceeds results in
five fragment ions at m/z values of 56, 69, 70, 71 and 84 as can be
seen here:
O2+• + C6H14O → C6H12
+• + H2O + O2 (32%) (5a)
→ C5H10+• + CH4O + O2 (31%) (5b)
→ C5H11+ + CH3O• + O2 (27%) (5c)
→ C4H8+• + CH2OH• + CH3
• + O2 (5%) (5d)
→ C5H9+ + H2O + CH3
• + O2 (5%) (5e)
The EI spectrum indicates the most abundant ion peak to be at
m/z 43, which represents less than 1% in these SIFT-MS thermal
energy reactions, presumably because the ionisation/ground state
recombination energy of O2 molecules (12.06 eV) ensures that less
energy is imparted to the [C6H14O]+* excited ion, thus minimizing
fragmentation.
The SIFT-MS spectrum obtained for the 4-methyl-1-pentanol
reaction more closely mirrors the corresponding EI spectrum. The
major fragment ion is at m/z 56, followed by an ion at m/z 69. The
O2+• reaction proceeds thus:
O2+• + C6H14O → C4H8
+• + CH3O• + CH3• + O2 (72%) (6a)
→ C5H9+ + CH3
• + H2O + O2 (14%) (6b)
→ C6H12+• + H2O + O2 (14%) (6c)
The 3-hexanol and 3-methyl-3-pentanol are the simplest of
these O2+• reactions in that only two product ions are observed,
as exemplifies by the 3-hexanol reaction:
O2+• + C6H14O → C4H9O+ + C2H5
• + O2 (60%) (7a)
→ C3H7O+ + C3H7• + O2 (40%) (7b)
Note that a neutral hydrocarbon radical is also generated in both
channels. For more details see Table 3. Whilst these products and
their distributions are complex and variable, they might be used
to facilitate SIFT-MS identification of some of these hexanol iso-
mers, but again in mixtures of these compounds this will be very
challenging.
3.2. Kinetics of the ion chemistry involving water molecules:
determination of three-body association rate constants
It is important to recognise when using NO+ precursor ions
to analyse humid samples that a fraction of them directly asso-
ciate with H2O molecules forming hydrated nitrosonium ions,
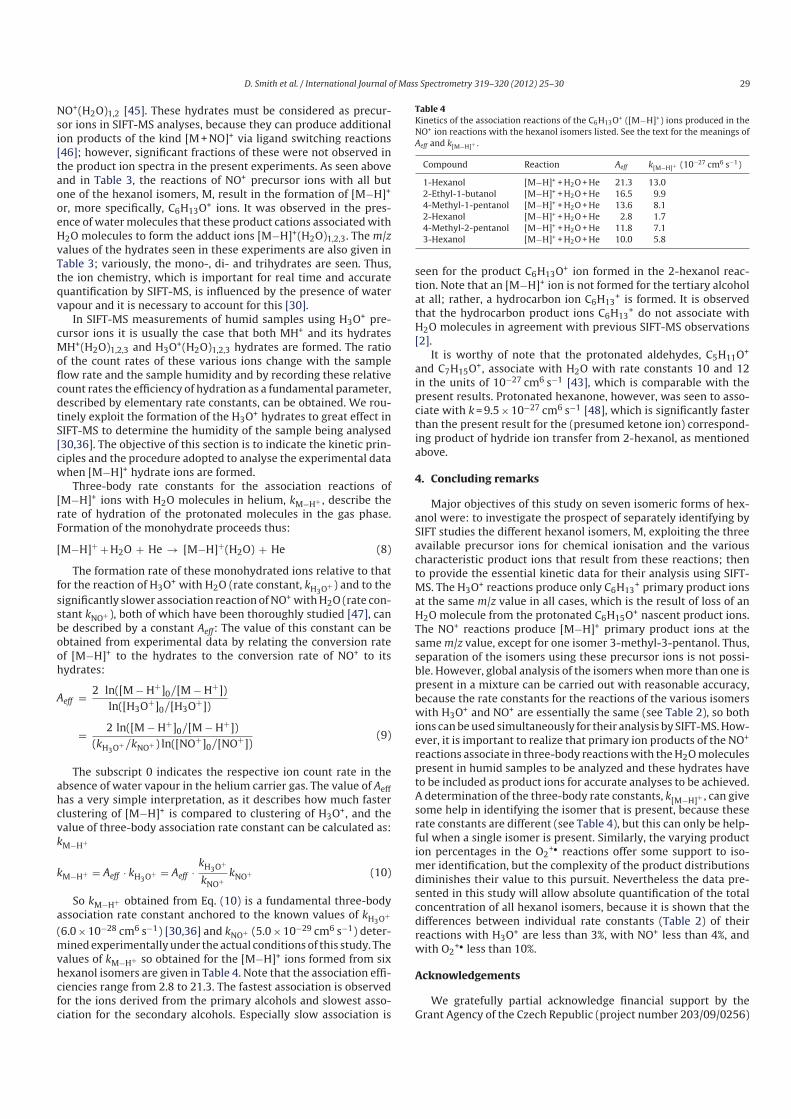
D. Smith et al. / International Journal of Mass Spectrometry 319– 320 (2012) 25– 30 29
NO+(H2O)1,2 [45]. These hydrates must be considered as precur-
sor ions in SIFT-MS analyses, because they can produce additional
ion products of the kind [M + NO]+ via ligand switching reactions
[46]; however, significant fractions of these were not observed in
the product ion spectra in the present experiments. As seen above
and in Table 3, the reactions of NO+ precursor ions with all but
one of the hexanol isomers, M, result in the formation of [M−H]+
or, more specifically, C6H13O+ ions. It was observed in the pres-
ence of water molecules that these product cations associated with
H2O molecules to form the adduct ions [M−H]+(H2O)1,2,3. The m/z
values of the hydrates seen in these experiments are also given in
Table 3; variously, the mono-, di- and trihydrates are seen. Thus,
the ion chemistry, which is important for real time and accurate
quantification by SIFT-MS, is influenced by the presence of water
vapour and it is necessary to account for this [30].
In SIFT-MS measurements of humid samples using H3O+ pre-
cursor ions it is usually the case that both MH+ and its hydrates
MH+(H2O)1,2,3 and H3O+(H2O)1,2,3 hydrates are formed. The ratio
of the count rates of these various ions change with the sample
flow rate and the sample humidity and by recording these relative
count rates the efficiency of hydration as a fundamental parameter,
described by elementary rate constants, can be obtained. We rou-
tinely exploit the formation of the H3O+ hydrates to great effect in
SIFT-MS to determine the humidity of the sample being analysed
[30,36]. The objective of this section is to indicate the kinetic prin-
ciples and the procedure adopted to analyse the experimental data
when [M−H]+ hydrate ions are formed.
Three-body rate constants for the association reactions of
[M−H]+ ions with H2O molecules in helium, kM−H+ , describe the
rate of hydration of the protonated molecules in the gas phase.
Formation of the monohydrate proceeds thus:
[M−H]+ + H2O + He → [M−H]+(H2O) + He (8)
The formation rate of these monohydrated ions relative to that
for the reaction of H3O+ with H2O (rate constant, kH3O+ ) and to the
significantly slower association reaction of NO+ with H2O (rate con-
stant kNO+ ), both of which have been thoroughly studied [47], can
be described by a constant Aeff: The value of this constant can be
obtained from experimental data by relating the conversion rate
of [M−H]+ to the hydrates to the conversion rate of NO+ to its
hydrates:
Aeff = 2 ln([M − H+]0/[M − H+])
ln([H3O+]0/[H3O+])
= 2 ln([M − H+]0/[M − H+])
(kH3O+ /kNO+ ) ln([NO+]0/[NO+])(9)
The subscript 0 indicates the respective ion count rate in the
absence of water vapour in the helium carrier gas. The value of Aeff
has a very simple interpretation, as it describes how much faster
clustering of [M−H]+ is compared to clustering of H3O+, and the
value of three-body association rate constant can be calculated as:
kM−H+
kM−H+ = Aeff · kH3O+ = Aeff ·kH3O+
kNO+kNO+ (10)
So kM−H+ obtained from Eq. (10) is a fundamental three-body
association rate constant anchored to the known values of kH3O+
(6.0 × 10⁻²⁸ cm6 s−1) [30,36] and kNO+ (5.0 × 10⁻²⁹ cm6 s−1) deter-
mined experimentally under the actual conditions of this study. The
values of kM−H+ so obtained for the [M−H]+ ions formed from six
hexanol isomers are given in Table 4. Note that the association effi-
ciencies range from 2.8 to 21.3. The fastest association is observed
for the ions derived from the primary alcohols and slowest asso-
ciation for the secondary alcohols. Especially slow association is
Table 4Kinetics of the association reactions of the C6H13O+ ([M−H]+) ions produced in the
NO+ ion reactions with the hexanol isomers listed. See the text for the meanings of
Aeff and k[M−H]+ .
Compound Reaction Aeff k[M−H]+ (10−27 cm6 s−1)
1-Hexanol [M−H]+ + H2O + He 21.3 13.0
2-Ethyl-1-butanol [M−H]+ + H2O + He 16.5 9.9
4-Methyl-1-pentanol [M−H]+ + H2O + He 13.6 8.1
2-Hexanol [M−H]+ + H2O + He 2.8 1.7
4-Methyl-2-pentanol [M−H]+ + H2O + He 11.8 7.1
3-Hexanol [M−H]+ + H2O + He 10.0 5.8
seen for the product C6H13O+ ion formed in the 2-hexanol reac-
tion. Note that an [M−H]+ ion is not formed for the tertiary alcohol
at all; rather, a hydrocarbon ion C6H13+ is formed. It is observed
that the hydrocarbon product ions C6H13+ do not associate with
H2O molecules in agreement with previous SIFT-MS observations
[2].
It is worthy of note that the protonated aldehydes, C5H11O+
and C7H15O+, associate with H2O with rate constants 10 and 12
in the units of 10−27 cm6 s−1 [43], which is comparable with the
present results. Protonated hexanone, however, was seen to asso-
ciate with k = 9.5 × 10⁻²⁷ cm6 s−1 [48], which is significantly faster
than the present result for the (presumed ketone ion) correspond-
ing product of hydride ion transfer from 2-hexanol, as mentioned
above.
4. Concluding remarks
Major objectives of this study on seven isomeric forms of hex-
anol were: to investigate the prospect of separately identifying by
SIFT studies the different hexanol isomers, M, exploiting the three
available precursor ions for chemical ionisation and the various
characteristic product ions that result from these reactions; then
to provide the essential kinetic data for their analysis using SIFT-
MS. The H3O+ reactions produce only C6H13+ primary product ions
at the same m/z value in all cases, which is the result of loss of an
H2O molecule from the protonated C6H15O+ nascent product ions.
The NO+ reactions produce [M−H]+ primary product ions at the
same m/z value, except for one isomer 3-methyl-3-pentanol. Thus,
separation of the isomers using these precursor ions is not possi-
ble. However, global analysis of the isomers when more than one is
present in a mixture can be carried out with reasonable accuracy,
because the rate constants for the reactions of the various isomers
with H3O+ and NO+ are essentially the same (see Table 2), so both
ions can be used simultaneously for their analysis by SIFT-MS. How-
ever, it is important to realize that primary ion products of the NO+
reactions associate in three-body reactions with the H2O molecules
present in humid samples to be analyzed and these hydrates have
to be included as product ions for accurate analyses to be achieved.
A determination of the three-body rate constants, k[M−H]+ , can give
some help in identifying the isomer that is present, because these
rate constants are different (see Table 4), but this can only be help-
ful when a single isomer is present. Similarly, the varying product
ion percentages in the O2+• reactions offer some support to iso-
mer identification, but the complexity of the product distributions
diminishes their value to this pursuit. Nevertheless the data pre-
sented in this study will allow absolute quantification of the total
concentration of all hexanol isomers, because it is shown that the
differences between individual rate constants (Table 2) of their
reactions with H3O+ are less than 3%, with NO+ less than 4%, and
with O2+• less than 10%.
Acknowledgements
We gratefully partial acknowledge financial support by the
Grant Agency of the Czech Republic (project number 203/09/0256)
30 D. Smith et al. / International Journal of Mass Spectrometry 319– 320 (2012) 25– 30
and by Grant Agency of Charles University (project GAUK 32010).
We are also grateful to the reviewers for their comments and sug-
gestions for revisions.
References
[1] D. Smith, P. Spanel, Direct, rapid quantitative analyses of BVOCs using SIFT-MSand PTR-MS obviating sample collection, Trends in Analytical Chemistry 30(2011) 945–959.
[2] D. Smith, P. Spanel, Selected ion flow tube mass spectrometry (SIFT-MS) foron-line trace gas analysis, Mass Spectrometry Reviews 24 (2005) 661–700.
[3] P. Spanel, D. Smith, Selected ion flow tube-mass spectrometry: detection andreal-time monitoring of flavours released by food products, Rapid Communi-cations in Mass Spectrometry 13 (1999) 585–596.
[4] P. Spanel, D. Smith, Progress in SIFT-MS: breath analysis and other applications,Mass Spectrometry Reviews 30 (2011) 236–267.
[5] P. Spanel, D. Smith, SIFT studies of the reactions of H3O+, NO+ and O2+ with
a series of alcohols, International Journal of Mass Spectrometry 167 (1997)375–388.
[6] T.S. Wang, W. Carroll, W. Lenny, P. Boit, D. Smith, The analysis of 1-propanoland 2-propanol in humid air samples using selected ion flow tube mass spec-trometry, Rapid Communications in Mass Spectrometry 20 (2006) 125–130.
[7] A. Pysanenko, P. Spanel, D. Smith, Analysis of the isobaric compounds propanol,acetic acid and methyl formate in humid air and breath by selected ion flowtube mass spectrometry, SIFT-MS, International Journal of Mass Spectrometry285 (2009) 42–48.
[8] T.S. Wang, P. Spanel, D. Smith, Selected ion flow tube, SIFT, studies of the reac-tions of H3O+, NO+ and O2
+ with eleven C10H16 monoterpenes, InternationalJournal of Mass Spectrometry 228 (2003) 117–126.
[9] P. Spanel, D. Smith, Selected ion flow tube studies of the reactions of H3O+, NO+,and O2
+ with eleven amine structural isomers of C5H13N, International Journalof Mass Spectrometry 187 (1999) 139–147.
[10] J. Kubista, P. Spanel, K. Dryahina, C. Workman, D. Smith, Combined use ofgas chromatography and selected ion flow tube mass spectrometry for abso-lute trace gas quantification, Rapid Communications in Mass Spectrometry 20(2006) 563–567.
[11] P. Spanel, K. Dryahina, D. Smith, A general method for the calculation of abso-lute trace gas concentrations in air and breath from selected ion flow tube massspectrometry data, International Journal of Mass Spectrometry 249 (2006)230–239.
[12] D. McGinty, C.S. Letizia, A.M. Api, Fragrance material review on 2-ethyl-1-butanol, Food and Chemical Toxicology 48 (2010) S85–S88.
[13] M. Juric, G. Bertelson, G. Mortenson, M.A. Petersen, Light-induced colour andaroma changes in sliced, modified atmosphere packaged semi-hard cheeses,International Dairy Journal 13 (2003) 239–249.
[14] S. Wei, I. Marton, M. Dekel, D. Shalitin, E. Lewinsohn, B.A. Bravdo, O. Shoseyov,Manipulating volatile emission in tobacco leaves by expressing Aspergillus nigerbeta-glucosidase in different subcellular compartments, Plant BiotechnologyJournal 2 (2004) 341–350.
[15] I. Moret, A. Gambaro, Trend analysis in selection of aroma components as vari-ables for chemometric studies of typical wines, Annali di Chimica 86 (1996)309–318.
[16] N. Narain, M.D. Galvao, M.S. Madruga, Volatile compounds captured throughpurge and trap technique in caja-umbu (Spondias sp.) fruits during maturation,Food Chemistry 102 (2007) 726–731.
[17] E.A. Baldwin, J.W. Scott, M.A. Einstein, T.M.M. Malundo, B.T. Carr, R.L. Shewfelt,K.S. Tandon, Relationship between sensory and instrumental analysis fortomato flavor, Journal of the American Society for Horticultural Science 123(1998) 906–915.
[18] A.K. Kiritsakis, Flavor components of olive oil – a review, Journal of the AmericanOil Chemists Society 75 (1998) 673–681.
[19] L. Rebiere, A.C. Clark, L.M. Schmidtke, P.D. Prenzler, G.R. Scollary, A robustmethod for quantification of volatile compounds within and between vintagesusing headspace-solid-phase micro-extraction coupled with GC-MS – applica-tion on Semillon wines, Analytica Chimica Acta 660 (2010) 149–157.
[20] M.M. Liu, Z.R. Zeng, B. Xiong, Preparation of novel solid-phase microextrac-tion fibers by sol-gel technology for headspace solid-phase microextraction-gaschromatographic analysis of aroma compounds in beer, Journal of Chromatog-raphy A 1065 (2005) 287–299.
[21] J.M. Lin, R.L. Rouseff, S. Barros, M. Haim, Aroma composition changes in earlyseason grapefruit juice produced from thermal concentration, Journal of Agri-cultural and Food Chemistry 50 (2002) 813–819.
[22] C. Prost, T. Serot, M. Demaimay, Identification of the most potent odorants inwild and farmed cooked turbot (Scophtalamus maximus L), Journal of Agricul-tural and Food Chemistry 46 (1998) 3214–3219.
[23] A. Alonso, L. Vazquez-Araujo, S. Garcia-Martinez, J.J. Ruiz, A.A. Carbonell-Barrachina, Volatile compounds of traditional and virus-resistant breeding
lines of Muchamiel tomatoes, European Food Research and Technology 230(2009) 315–323.
[24] H.Y. Gao, B.Z. Zhu, H.L. Zhu, Y.L. Zhang, Y.H. Xie, Y.C. Li, Y.B. Luo, Effect of sup-pression of ethylene biosynthesis on flavor products in tomato fruits, RussianJournal of Plant Physiology 54 (2007) 80–88.
[25] V. Ferreira, R. Lopez, J.F. Cacho, Quantitative determination of the odorants ofyoung red wines from different grape varieties, Journal of the Science of Foodand Agriculture 80 (2000) 1659–1667.
[26] P.A. Luning, D. Yuksel, R.V. deVries, J.P. Roozen, Aroma changes in fresh bellpeppers (Capsicum annuum) after hot-air drying, Journal of Food Science 60(1995) 1269–1276.
[27] A. Bouseta, V. Scheirman, S. Collin, Flavor and free amino acid composition oflavender and eucalyptus honeys, Journal of Food Science 61 (1996) 683–687.
[28] M.D. Galvao, N. Narain, M.D.P. dos Santos, M.L. Nunes, Volatile compounds anddescriptive odor attributes in umbu (Spondias tuberosa) fruits during matura-tion, Food Research International 44 (2011) 1919–1926.
[29] M. Narvaez-Rivas, F. Pablos, J.M. Jurado, M. Leon-Camacho, Authentication offattening diet of Iberian pigs according to their volatile compounds profilefrom raw subcutaneous fat, Analytical and Bioanalytical Chemistry 399 (2011)2115–2122.
[30] P. Spanel, D. Smith, Influence of water vapour on selected ion flow tube massspectrometric analyses of trace gases in humid air and breath, Rapid Commu-nications in Mass Spectrometry 14 (2000) 1898–1906.
[31] D. Smith, N. Adams, The selected ion flow tube (SIFT): studies of ion-neutralreactions, Advances in Atomic and Molecular Physics 24 (1988) 1–49.
[32] K. Dryahina, M. Polásek, P. Spanel, A selected ion flow tube, SIFT, study of theion chemistry of H3O+, NO+ and O2
+. ions with several nitroalkanes in the pres-ence of water vapour, International Journal of Mass Spectrometry 239 (2004)57–65.
[33] L. Iachetta, L. Malek, B.M. Ross, The reactions of H3O+, NO+ and O2+ with several
flavourant esters studied using selected ion flow tube mass spectrometry, RapidCommunications in Mass Spectrometry 24 (2010) 815–822.
[34] N. Schoon, C. Amelynck, L. Vereecken, E. Arijs, A selected ion flow tube study ofthe reactions of H3O+, NO+ and O2
+ with a series of monoterpenes, InternationalJournal of Mass Spectrometry 229 (2003) 231–240.
[35] P. Spanel, D. Smith, SIFT studies of the reactions of H3O+, NO+ and O2+ with
a series of volatile carboxylic acids and esters, International Journal of MassSpectrometry 172 (1998) 137–147.
[36] K. Sovová, K. Dryahina, P. Spanel, Selected ion flow tube (SIFT) studies of thereactions of H3O+, NO+ and O2
+ with six volatile phytogenic esters, InternationalJournal of Mass Spectrometry 300 (2011) 31–38.
[37] K. Dryahina, B.K.C. de Miranda, P. Spanel, J. Zabka, C. Alcaraz, Z. Herman,Selected ion flow tube study of ion molecule reactions of N+(3P) and Kr+ withC3 hydrocarbons propane, propene, and propyne, Journal of Physical ChemistryA 115 (2011) 7310–7315.
[38] G. Bouchoux, J.Y. Salpin, D. Leblanc, A relationship between the kinetics andthermochemistry of proton transfer reactions in the gas phase, InternationalJournal of Mass Spectrometry and Ion Processes 153 (1996) 37–48.
[39] T. Su, W.J. Chesnavich, Parametization of the ion-polar molecule collision rate-constant by trajectory calculations, Journal of Chemical Physics 76 (1982)5183–5185.
[40] C.L. Yaws, Thermophysical Properties of Chemicals and Hydrocarbons, WilliamAndrew Inc., New York, 2008.
[41] K.J. Miller, J.A. Savchik, New empirical-method to calculate average molec-ular polarisabilities, Journal of the American Chemical Society 101 (1979)7206–7213.
[42] D. Smith, A. Pysanenko, P. Spanel, Ionic diffusion and mass discriminationeffects in the new generation of short flow tube SIFT-MS instruments, Interna-tional Journal of Mass Spectrometry 281 (2009) 15–23.
[43] P. Spanel, J.M. Van Doren, D. Smith, A selected ion flow tube study of thereactions of H3O+, NO+, and O2
+ with saturated and unsaturated aldehydesand subsequent hydration of the product ions, International Journal of MassSpectrometry 123 (2002) 163–176.
[44] P. Spanel, D. Smith, Reactions of hydrated hydronium ions and hydratedhydroxide ions, with some hydrocarbons and oxygen-bearing organic-molecules, Journal of Physical Chemistry 99 (1995) 15551–15556.
[45] P. Spanel, D. Smith, Influence of weakly bound adduct ions on breath trace gasanalysis by selected ion flow tube mass spectrometry (SIFT-MS), InternationalJournal of Mass Spectrometry 280 (2009) 128–135.
[46] D. Smith, A.M. Diskin, Y.F. Ji, P. Spanel, Concurrent use of H3O+, NO+,and O2
+ precursor ions for the detection and quantification of diversetrace gases in the presence of air and breath by selected ion-flow tubemass spectrometry, International Journal of Mass Spectrometry 209 (2001)81–97.
[47] Y. Ikezoe, S. Matsuoka, M. Takebe, A. Viggiano, Gas Phase Ion-Molecule ReactionRate Constants Through 1986, Maruzen, Tokyo, 1987.
[48] D. Smith, T.S. Wang, P. Spanel, Analysis of ketones by selected ion flow tubemass spectrometry, Rapid Communications in Mass Spectrometry 17 (2003)2655–2660.
Appendix C, Dryahina et al. Rapid Commun. Mass Spectrom.
27 (2013) 1983
Quantification of pentane in exhaled breath, a biomarker of bowel disease,
using selected ion flow tube mass spectrometry
Kseniya Dryahinaa, Patrik Špan la,d, Veronika Pospíšilováa,b , Kristýna Sovováa,b, Lud k
Hrdli kac, Nad žda Machkovác, Milan Lukášc David Smithd
aJ. Heyrovský Institute of Physical Chemistry, Academy of Sciences of the Czech
Republic, Dolejškova 3, 182 23, Prague 8, Czech Republic bDepartment of Physical and Macromolecular Chemistry, Faculty of Science, Charles
University, Albertov 2030, 128 40 Prague 2, Czech Republic bClinical and Research Centre for Inflammatory Diseases, ISCARE Lighthouse,
Jankovcova 1569/2c, 170 04 Prague 7, Czech Republic
dInstitute for Science and Technology in Medicine, School of Medicine, Keele
University, Thornburrow Drive, Hartshill, Stoke-on-Trent ST4 7QB, UK

Quantification of pentane in exhaled breath, a potential biomarkerof bowel disease, using selected ion flow tube mass spectrometry
Kseniya Dryahina1, Patrik Španěl1*, Veronika Pospíšilová1,2, Kristýna Sovová1,2,Luděk Hrdlička3, Naděžda Machková3, Milan Lukáš3 and David Smith4
1J. Heyrovský Institute of Physical Chemistry, Academy of Sciences of the Czech Republic, Dolejškova 3, 182 23 Prague 8,Czech Republic2Faculty of Science, Charles University, Albertov 2030, 128 40 Prague 2, Czech Republic3IBD Clinical and Research Centre, ISCARE a.s., Jankovcova 1569/2c, 170 00 Prague 7, 1st Faculty of Medicine, CharlesUniversity in Prague, Czech Republic4Institute for Science and Technology in Medicine, School of Medicine, Keele University, Thornburrow Drive, Hartshill, Stoke-on-Trent ST4 7QB, UK
RATIONALE: Inflammatory bowel disease has a relatively large incidence in modern populations and the currentdiagnostic methods are either invasive or have limited sensitivity or specificity. Thus, there is a need for new non-invasive methods for its diagnosis and therapeutic monitoring, and breath analysis represents a promising direction inthis area of research. Specifically, a method is needed for the absolute quantification of pentane in human breath.METHODS: Selected ion flow tube mass spectrometry (SIFT-MS) has been used to study the kinetics of the O2
+ reactionwith pentane. Product ions at m/z 42 and 72 were chosen as characteristic ions useful for the quantification of pentaneand the reactivity of these ions with water vapour was characterized. A pilot study has been carried out of pentane inthe exhaled breath of patients with Crohn's disease (CD) and ulcerative colitis (UC) and of healthy volunteers.RESULTS: Accurate data on the kinetics of the gas phase reaction of the O2
+• ions with pentane have been obtained:rate coefficient 8 × 10⁻¹⁰ cm3 s–1 (±5%) and branching ratios into the following product ions C5H12
+• (m/z 72, 31%);C4H9
+ (m/z 57, 8%); C3H7+ (m/z 43, 40%), C3H6
+• (m/z 42, 21%). A method of calculation of absolute pentane concentrationin exhaled breath was formulated using the count rates of the ions at m/z 32, 42, 55 and 72. Pentane was found to besignificantly elevated in the breath of both the CD (mean 114 ppbv) and the UC patients (mean 84 ppbv) relative tothe healthy controls (mean 40 ppbv).CONCLUSIONS: SIFT-MS can be used to quantify pentane in human breath in real time avoiding sample storage. Thismethod of analysis can ultimately form the basis of non-invasive screening of inflammatory processes, includinginflammatory bowel disease. Copyright © 2013 John Wiley & Sons, Ltd.
The analysis of exhaled breath is potentially a non-invasivecontributor to clinical diagnosis and therapeuticmonitoring.[1–3] There have been remarkable advances inbreath analysis techniques, not least in the improvementsand developments of new analytical methodologies. Ofnote are the new techniques by which on-line, real-timeanalyses of exhaled breath can be realized obviating samplecollection; these include selected ion flow tube massspectrometry (SIFT-MS)[4,5] and proton transfer massspectrometry (PTR-MS),[6,7] the special features and advantagesof which for breath analysis have recently been comparedand contrasted.[8] By exploiting these methods, many tracecompounds have been quantified in exhaled breath,[3,9] andthe reference ranges for several of them have been established
for cohorts of healthy people, notably using SIFT-MS.[10–14]
The large majority of these compounds can be classified asvolatile organic compounds (VOCs) prevalent amongst whichare homologous series of alcohols, aldehydes, ketones andlong-chain and branched-chain hydrocarbons. Many studieshave been carried out that focus on associating thesecompounds with established disease conditions such ascancer[15] and diabetes.[1–3] However, a major challenge thathas to bemet is that most of the breath VOCs, so far recognisedto relate to disease, are present at very low concentrations,typically at the parts-per-billion by volume (ppbv), and lower.It is because of this that techniques that collect and concentratethe trace VOCs in breath samples prior to analysis, such as thegas chromatography/mass spectrometry methods associatedwith solid-state microextraction (SPME/GC/MS)[16] andautomated thermal desorption (TD/GC/MS),[17] have hadmost success in detecting disease biomarkers in breath.[2,15]
However, real-time, on-line analysis involving accuratequantification remains an important objective in breathanalysis, and the above collection techniques fall short in thisregard, whereas SIFT-MS fulfils these objectives even though
* Correspondence to: P. Španěl, J. Heyrovský Institute ofPhysical Chemistry, Academy of Sciences of the CzechRepublic, Dolejškova 3, 182 23 Prague 8, Czech Republic.E-mail: [email protected]
Copyright © 2013 John Wiley & Sons, Ltd.Rapid Commun. Mass Spectrom. 2013, 27, 1983–1992
Research Article
Received: 13 March 2013 Revised: 17 June 2013 Accepted: 18 June 2013 Published online in Wiley Online Library
Rapid Commun. Mass Spectrom. 2013, 27, 1983–1992(wileyonlinelibrary.com) DOI: 10.1002/rcm.6660
1983
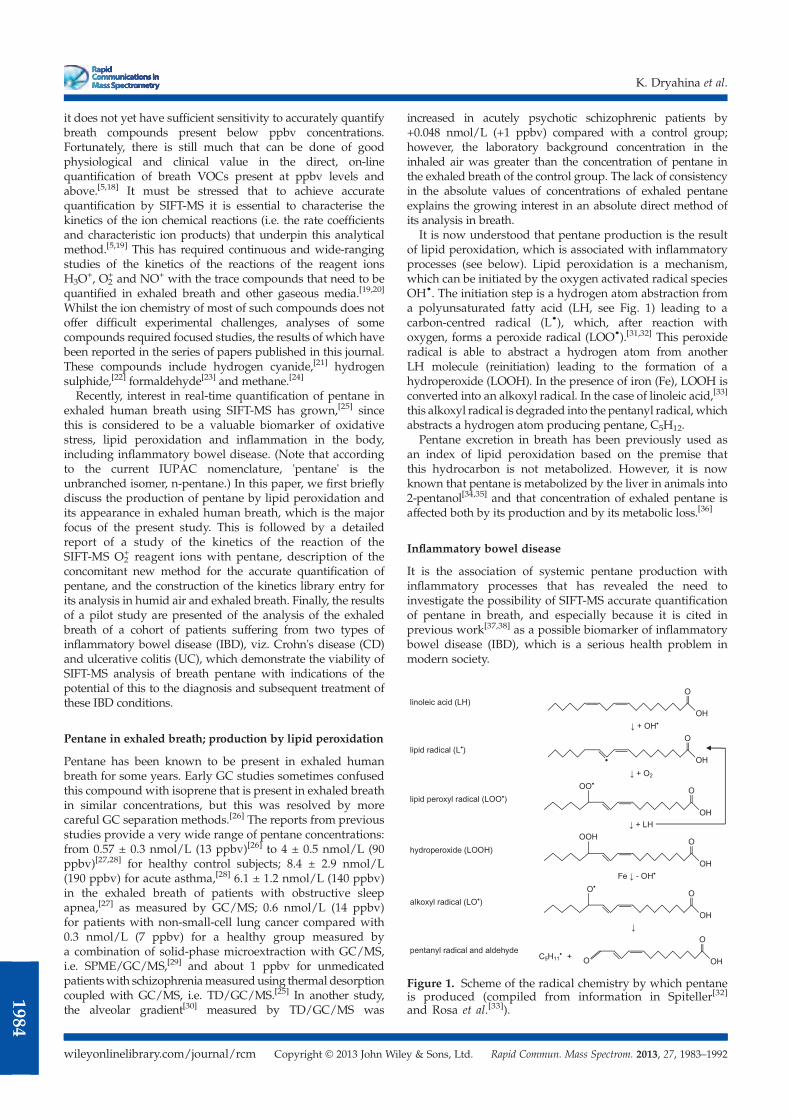
it does not yet have sufficient sensitivity to accurately quantifybreath compounds present below ppbv concentrations.Fortunately, there is still much that can be done of goodphysiological and clinical value in the direct, on-linequantification of breath VOCs present at ppbv levels andabove.[5,18] It must be stressed that to achieve accuratequantification by SIFT-MS it is essential to characterise thekinetics of the ion chemical reactions (i.e. the rate coefficientsand characteristic ion products) that underpin this analyticalmethod.[5,19] This has required continuous and wide-rangingstudies of the kinetics of the reactions of the reagent ionsH3O
+, O2+ and NO+ with the trace compounds that need to be
quantified in exhaled breath and other gaseous media.[19,20]
Whilst the ion chemistry of most of such compounds does notoffer difficult experimental challenges, analyses of somecompounds required focused studies, the results of which havebeen reported in the series of papers published in this journal.These compounds include hydrogen cyanide,[21] hydrogensulphide,[22] formaldehyde[23] and methane.[24]
Recently, interest in real-time quantification of pentane inexhaled human breath using SIFT-MS has grown,[25] sincethis is considered to be a valuable biomarker of oxidativestress, lipid peroxidation and inflammation in the body,including inflammatory bowel disease. (Note that accordingto the current IUPAC nomenclature, 'pentane' is theunbranched isomer, n-pentane.) In this paper, we first brieflydiscuss the production of pentane by lipid peroxidation andits appearance in exhaled human breath, which is the majorfocus of the present study. This is followed by a detailedreport of a study of the kinetics of the reaction of theSIFT-MS O2
+ reagent ions with pentane, description of theconcomitant new method for the accurate quantification ofpentane, and the construction of the kinetics library entry forits analysis in humid air and exhaled breath. Finally, the resultsof a pilot study are presented of the analysis of the exhaledbreath of a cohort of patients suffering from two types ofinflammatory bowel disease (IBD), viz. Crohn's disease (CD)and ulcerative colitis (UC), which demonstrate the viability ofSIFT-MS analysis of breath pentane with indications of thepotential of this to the diagnosis and subsequent treatment ofthese IBD conditions.
Pentane in exhaled breath; production by lipid peroxidation
Pentane has been known to be present in exhaled humanbreath for some years. Early GC studies sometimes confusedthis compound with isoprene that is present in exhaled breathin similar concentrations, but this was resolved by morecareful GC separation methods.[26] The reports from previousstudies provide a very wide range of pentane concentrations:from 0.57 ± 0.3 nmol/L (13 ppbv)[26] to 4 ± 0.5 nmol/L (90ppbv)[27,28] for healthy control subjects; 8.4 ± 2.9 nmol/L(190 ppbv) for acute asthma,[28] 6.1 ± 1.2 nmol/L (140 ppbv)in the exhaled breath of patients with obstructive sleepapnea,[27] as measured by GC/MS; 0.6 nmol/L (14 ppbv)for patients with non-small-cell lung cancer compared with0.3 nmol/L (7 ppbv) for a healthy group measured bya combination of solid-phase microextraction with GC/MS,i.e. SPME/GC/MS,[29] and about 1 ppbv for unmedicatedpatientswith schizophreniameasured using thermal desorptioncoupled with GC/MS, i.e. TD/GC/MS.[25] In another study,the alveolar gradient[30] measured by TD/GC/MS was
increased in acutely psychotic schizophrenic patients by+0.048 nmol/L (+1 ppbv) compared with a control group;however, the laboratory background concentration in theinhaled air was greater than the concentration of pentane inthe exhaled breath of the control group. The lack of consistencyin the absolute values of concentrations of exhaled pentaneexplains the growing interest in an absolute direct method ofits analysis in breath.
It is now understood that pentane production is the resultof lipid peroxidation, which is associated with inflammatoryprocesses (see below). Lipid peroxidation is a mechanism,which can be initiated by the oxygen activated radical speciesOH•. The initiation step is a hydrogen atom abstraction froma polyunsaturated fatty acid (LH, see Fig. 1) leading to acarbon-centred radical (L•), which, after reaction withoxygen, forms a peroxide radical (LOO•).[31,32] This peroxideradical is able to abstract a hydrogen atom from anotherLH molecule (reinitiation) leading to the formation of ahydroperoxide (LOOH). In the presence of iron (Fe), LOOH isconverted into an alkoxyl radical. In the case of linoleic acid,[33]
this alkoxyl radical is degraded into the pentanyl radical, whichabstracts a hydrogen atom producing pentane, C5H12.
Pentane excretion in breath has been previously used asan index of lipid peroxidation based on the premise thatthis hydrocarbon is not metabolized. However, it is nowknown that pentane is metabolized by the liver in animals into2-pentanol[34,35] and that concentration of exhaled pentane isaffected both by its production and by its metabolic loss.[36]
Inflammatory bowel disease
It is the association of systemic pentane production withinflammatory processes that has revealed the need toinvestigate the possibility of SIFT-MS accurate quantificationof pentane in breath, and especially because it is cited inprevious work[37,38] as a possible biomarker of inflammatorybowel disease (IBD), which is a serious health problem inmodern society.
Figure 1. Scheme of the radical chemistry by which pentaneis produced (compiled from information in Spiteller[32]
and Rosa et al.[33]).
K. Dryahina et al.
wileyonlinelibrary.com/journal/rcm Copyright © 2013 John Wiley & Sons, Ltd. Rapid Commun. Mass Spectrom. 2013, 27, 1983–1992
1984
Ulcerative colitis (UC) and Crohn's disease (CD) are typesof chronic inflammatory bowel disease affecting the intestinaltract. The aetiology and pathogenesis of these autoimmunediseases still have not been entirely elucidated, but the rolesof genetics, immune aberrations and bowel flora areunquestionable. Both UC and CD can seriously diminish thequality of life, lead to a shorter life expectancy and thus havesignificant negative socioeconomic consequences. They affectprimarily young patients aged from 20 to 30 years. Theestimated prevalence in the Czech population is about 0.3%,but accurate epidemiological data are not available.Although UC and CD are similar diseases, the differences
between them are crucial for correct diagnosis and optimalchoice of treatment. In CD the location of the inflammationmay occur anywhere along the digestive tract from the mouthto the anus, most usually in the last segment of the smallintestine – the terminal ileum. In UC the large intestine(colon) is typically the only site that is affected. Anotherdifference is in the depth of penetration of inflammationwithin an intestinal wall – UC is a disease of the mucosa only,whereas CD may affect the entire bowel wall. Manysymptoms of UC and CD are similar (abdominal pain,diarrhea, weight loss), but there are some subtle differences.UC patients tend to have pain in the lower left part of theabdomen, while CD patients commonly (but not always)experience pain in the lower right abdomen. With UC,bleeding from the rectum during bowel movements is verycommon, but such bleeding is less common in patients withCD.[39] In both diseases, severe extra-intestinal manifestations(arthritis, skin and ocular inflammation, thrombo-emboliccomplications or liver abnormalities) may occur.[40] It isworthy of note that fecal volatile organic metabolites wererecently identified, using SPME/GC/MS, that arecharacteristic of UC and CD.[41]
Current treatments for IBD (pharmacological and surgical)can ameliorate symptoms, but there is no curative therapyavailable to date. Endoscopy (ileocoloscopy, enteroscopyand gastroscopy) and CT and MRI imaging and sonographyare currently used to aid diagnosis of IBD and to differentiallydiagnose specific diseases. It is essential to monitor theactivity of IBD using specialised clinical indices (Mayoindex,[42] Crohn's disease activity index – CDAI[39]) orrepeated endoscopic and imaging examinations, or to usebiochemical analyses (serum C-reactive protein-CRP, faecalcalprotectin) to adjust therapy, and accordingly plan theclinical follow-up. All currently used tests have somelimitations, including low sensitivity (CRP, X-ray) and/orlow specificity (CRP, calprotectin, imaging), and someof them bring discomfort or risk to the patient (endoscopy,X-ray). Thus, there is a need for new non-invasive methodsfor the diagnosis and therapeutic monitoring of IBD.As outlined previously, IBD results in localised oxidative
stress in the intestinal wall that causes degradation of cellularmembranes by lipid peroxidation. Volatile organic compounds,including alkanes, produced by this process are transportedby the blood stream into the lungs and thus appear in theexhaled breath. A previous study in CD[43] indicated thatbreath pentane output in CD patients (7.5 ± 1 pmol/kg/min)was significantly (p <0.025) greater than in control subjects(5 ± 0.5 pmol/kg/min). Whilst breath analysis cannotreplace the conventional diagnostic methods (endoscopy withhistopathology, CT and MRI studies, blood and faecal
biomarkers), which provide the detailed pathology anddifferentiate between the different forms of IBD, it does havethe advantage that it is non-invasive and can, perhaps, be usedas a monitor of the exacerbation and the effectiveness oftreatment in diminishing the inflammation. This is the majormotivation for developing the SIFT-MS method of pentanequantification and for the subsequent preliminary studies ofpentane in the exhaled breath of healthy volunteers andpatients suffering from IBD, as described in this paper.
Background on pentane ion chemistry relevant to SIFT-MS
In SIFT-MS there are just three reagent ionic species availablefor trace gas analysis, viz. H3O
+ and NO+, which are thosemost commonly used, and O2
+•, which is only rarely usedwhen H3O
+ and NO+ do not react under SIFT-MS conditionswith the particular gas/VOC to be analysed, as is the case forpentane,[44] the focus of this paper. Since it has been reportedthat pentane reacts with H3O
+ only by slow three bodyassociation and the H3O
+M product ions undergo rapidligand switching with water molecules forming a watercluster,[44,45] and NO+ does not react with pentane at ameasurable rate, they are not suitable for pentane analysis.Thus, O2
+ reagent ions are the only option for pentane analysisin SIFT-MS, but this is not straightforward, because previouswork has indicated that multiple product ions result from theO2
+/pentane reaction[44,46] and no information has yet beenobtained concerning their secondary reactions with the watermolecules that are so abundant in exhaled breath samples.Whilst the basic kinetics of the reactions of O2
+ with pentanehave been studied previously using the SIFT technique,[44–46]
these data have not been utilized in SIFT-MS because of theuncertainties in the accurate value of the rate coefficient andthe overlaps of the characteristic product ions with otherisobaric product ions commonly present in the O2
+• SIFT-MSspectra.[47] It is imperative to establish accurate rate coefficientsand product ion branching ratio for the analytical O2
+•/pentanereaction, to fully understand any secondary ion chemistry andthus to choose appropriate characteristic ions if accuratequantification of pentane in exhaled breath is to be achieved.Thus, we have carried out a detailed study to provide thesedata, which is described below.
EXPERIMENTAL
There are two distinct experimental phases of this study. (i) Adetailed study of the kinetics of reaction of the SIFT-MS O2
+
reagent ions with pentane in order to establish the accuraterate coefficient for the reaction and the precise branching ratioof the product ions and to investigate their secondaryreactions with water vapour. Hence, a kinetics library entrythat formalizes pentane quantification using SIFT-MS wasobtained. (ii) Pilot breath analyses testing the use of thisSIFT-MS method to analyse pentane in the exhaled breath ofhealthy people and of patients suffering from CD and UC.
The kinetics of the reaction of O2+• with pentane and the
influence of water vapour
The previous work performed using the traditional SIFTmethod to determine the rate coefficients[48] involved indirect
Quantification of pentane in exhaled breath
wileyonlinelibrary.com/journal/rcmCopyright © 2013 John Wiley & Sons, Ltd.Rapid Commun. Mass Spectrom. 2013, 27, 1983–1992
1985
measurement of the flow rate of pentane gas[49] using an MKSflow meter and a 'gas correction factor'. In the present work,two independent absolute approaches to creating knowndilute concentrations of pentane in air were followed.First, sequential dilution of pentane gas in which 200 μL of
liquid pentane (cooled down to –4°C) was injected into a 2 Lglass vessel filled by synthetic air at atmospheric pressureand allowed to fully evaporate and equilibrate. Then 2 mLof this gas mixture was injected into a second 2 L vessel againfilled by synthetic air and the concentration of pentanevapour was calculated volumetrically.Secondly, known pentane mixtures were created using the
permeation tube method, as described for the previouslyreported SIFT-MS validations for several VOCs.[50] Thepermeation device was constructed in the form of a smallglass vial containing pentane closed by a Nalophan film(the permeation membrane) to provide a stable concentrationof pentane vapour in a continuous flow of 25 mL/min ofsynthetic air. The pentane permeation rate, qd, was calculatedfrom the change in weight of the vial pentane source over3 h of operation. The pentane concentration, C, was thencalculated as:
C ¼ qdQ
� 22:4 L=molM
(1)
where Q is the flow rate of air through the permeation deviceand M is the molar mass of pentane.The kinetics of the O2
+•/pentane reaction were studied usingthe Profile 3 SIFT-MS instrument (Instrument Science Ltd,Crewe, UK) in the SIFT mode, as described previously.[51–53]
O2+ reagent ions were prepared in a microwave discharge
through a mixture of air and water vapour, filtered using aninjectionmass filter, and injected into theflow tube (5 cm length,1 cm diameter) into helium carrier gas (1 Torr pressure, 300 Ktemperature). Known flow rates of the prepared pentane/airmixtures were introduced into the helium carrier gas via aheated calibrated capillary. Precise determination of the production branching ratios was carried out by sequentially decreasingthe pentane concentration using an in-line metering valve andextrapolating the product ion count rates obtained by thedownstreammass spectrometer to zero flow in order to excludethe influence of any secondary reactions.[48]
In order to investigate the influence of water vapour on theanalytical product ions, liquid water was injected into thepentane/air mixture in the glass bottle to elevate its humidityand the vessel was heated to 40°C to reach a humiditycorresponding to exhaled breath. The pentane concentration,as calculated from the ratio of the product ion count rates tothe O2
+ precursor ion count rates,[20] was recorded andcompared with the expected value as measured in theabsence of water vapour. The kinetics library entry was thenoptimized to suppress the effect of water vapour on the countrates of characteristic product ions using the approachdescribed in Dryahina et al.[24]
Breath analysis
Approval for the study was obtained from the EthicsCommittee of Iscare I.V.F. a.s (Prague, Czech Republic).Breath analysis studies involving the patients wereperformed at the IBD Centre of Iscare, which focuses on
diagnoses and treatment of patients with CD and UC. Thedata for the healthy control group were obtained at the J.Heyrovsky Institute of Physical Chemistry, Prague (JHI).The diagnosis of Crohn's disease and ulcerative colitis in theselected cohort of patients was established according to theECCO guidelines.[39] Patients and healthy volunteers providedinformed consent before providing the breath samples. Thebreath analyses were performed using a Profile 3 SIFT-MSinstrument, which was located in the clinic to directly analysepatients' breath and at the JHI to directly analyse the breath ofthe healthy volunteers. Real-time sampling of three successiveexhalations and inhalations via the mouth by each volunteerwas performed using a disposable mouthpiece.[4,54] A constantflow rate of sample (25 mL/min) was introduced via a heated(70°C) PEEK capillary into the SIFT-MS flow tube. The localambient air was analysed during the inhalation phases, asindicated in Fig. 2.
The numbers of healthy volunteers and patients with CDand UC (Male, M, and female, F), together with the ageranges and also the status of the diseases, are given in Table 1.Note the large number of healthy volunteers and that thesedata were obtained in a single day, which shows the veryrapid data acquisition allowed by on-line analyses of exhaledbreath by SIFT-MS (see also Dryahina et al.[55]).
RESULTS AND DISCUSSION
Ion chemistry of pentane
In agreement with previous work, it was observed thatpentane does not react at a significant rate with H3O
+ orNO+ under the thermalised conditions (300 K) of SIFT-MS,but it does react with O2
+•. The first SIFT study of this reactionwas carried out in 1996 as part of the early exploration of theusefulness of the NO+ and O2
+• reagent ions for trace gasanalysis.[46] Thus, the rate coefficient for the O2
+•/pentanereaction was measured as 8 × 10⁻¹⁰ cm3s-1 at 300 K comparedwith the collisional rate coefficient of 1.6 × 10⁻⁹ cm3 s–1. This300 K value is adopted in this study and, as we show later,it is confirmed by the present experimental validation usingstandard mixtures. This previous determination[42] wasachieved using a mass flow meter and a tabulated gascorrection factor to measure the flow rate of pentane vapourinto the helium carrier gas. In a subsequent 1998 SIFT study,the rate coefficient for this reaction was assumed to be equalto the calculated theoretical collisional rate coefficient.[44] Inboth these SIFT studies the ion product ratios were alsoreported and there are significant differences between thereported values from the two studies. Also, no attempt waspreviously made to investigate the influence of water vapouron the ion products. This is an unacceptable situation giventhe current desire to use accurate rate coefficients and production distributions that will provide accurate analyses ofexhaled breath pentane. Thus, the major objective of this partof the present study was to determine accurate product ionbranching ratios, to check the rate coefficient for the reaction,and to select suitable characteristic product ions for theaccurate analysis of breath pentane by SIFT-MS.
The first stage of this procedure was to introduce into thehelium carrier gas sufficient pentane to reduce the precursorO2
+ ion count rate only slightly (no more than a few %) and
K. Dryahina et al.
wileyonlinelibrary.com/journal/rcm Copyright © 2013 John Wiley & Sons, Ltd. Rapid Commun. Mass Spectrom. 2013, 27, 1983–1992
1986
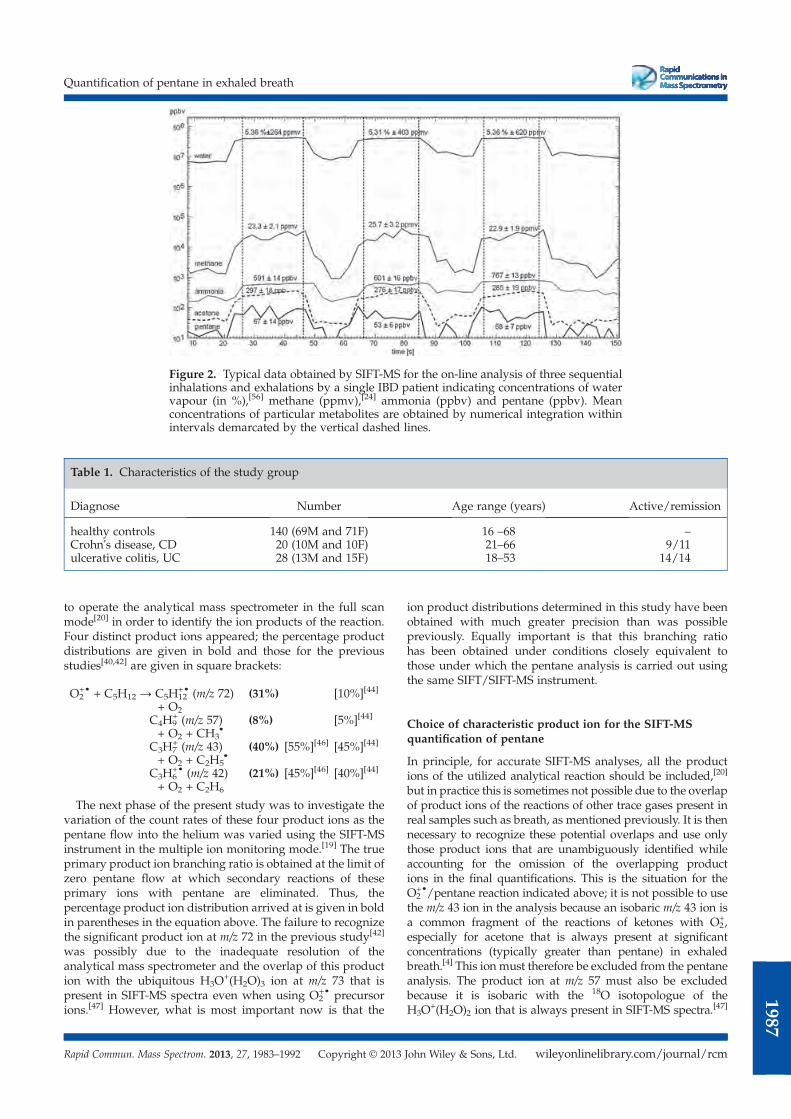
to operate the analytical mass spectrometer in the full scanmode[20] in order to identify the ion products of the reaction.Four distinct product ions appeared; the percentage productdistributions are given in bold and those for the previousstudies[40,42] are given in square brackets:
O2+• + C5H12 → C5H12
+• (m/z 72)+ O2
(31%) [10%][44]
C4H9+ (m/z 57)
+ O2 + CH3•
(8%) [5%][44]
C3H7+ (m/z 43)
+ O2 + C2H5•
(40%) [55%][46] [45%][44]
C3H6+• (m/z 42)
+ O2 + C2H6
(21%) [45%][46] [40%][44]
The next phase of the present study was to investigate thevariation of the count rates of these four product ions as thepentane flow into the helium was varied using the SIFT-MSinstrument in the multiple ion monitoring mode.[19] The trueprimary product ion branching ratio is obtained at the limit ofzero pentane flow at which secondary reactions of theseprimary ions with pentane are eliminated. Thus, thepercentage product ion distribution arrived at is given in boldin parentheses in the equation above. The failure to recognizethe significant product ion at m/z 72 in the previous study[42]
was possibly due to the inadequate resolution of theanalytical mass spectrometer and the overlap of this production with the ubiquitous H3O
+(H2O)3 ion at m/z 73 that ispresent in SIFT-MS spectra even when using O2
+• precursorions.[47] However, what is most important now is that the
ion product distributions determined in this study have beenobtained with much greater precision than was possiblepreviously. Equally important is that this branching ratiohas been obtained under conditions closely equivalent tothose under which the pentane analysis is carried out usingthe same SIFT/SIFT-MS instrument.
Choice of characteristic product ion for the SIFT-MSquantification of pentane
In principle, for accurate SIFT-MS analyses, all the productions of the utilized analytical reaction should be included,[20]
but in practice this is sometimes not possible due to the overlapof product ions of the reactions of other trace gases present inreal samples such as breath, as mentioned previously. It is thennecessary to recognize these potential overlaps and use onlythose product ions that are unambiguously identified whileaccounting for the omission of the overlapping productions in the final quantifications. This is the situation for theO2
+•/pentane reaction indicated above; it is not possible to usethe m/z 43 ion in the analysis because an isobaric m/z 43 ion isa common fragment of the reactions of ketones with O2
+,especially for acetone that is always present at significantconcentrations (typically greater than pentane) in exhaledbreath.[4] This ion must therefore be excluded from the pentaneanalysis. The product ion at m/z 57 must also be excludedbecause it is isobaric with the 18O isotopologue of theH3O
+(H2O)2 ion that is always present in SIFT-MS spectra.[47]
Table 1. Characteristics of the study group
Diagnose Number Age range (years) Active/remission
healthy controls 140 (69M and 71F) 16 –68 –Crohn's disease, CD 20 (10M and 10F) 21–66 9/11ulcerative colitis, UC 28 (13M and 15F) 18–53 14/14
Figure 2. Typical data obtained by SIFT-MS for the on-line analysis of three sequentialinhalations and exhalations by a single IBD patient indicating concentrations of watervapour (in %),[56] methane (ppmv),[24] ammonia (ppbv) and pentane (ppbv). Meanconcentrations of particular metabolites are obtained by numerical integration withinintervals demarcated by the vertical dashed lines.
Quantification of pentane in exhaled breath
wileyonlinelibrary.com/journal/rcmCopyright © 2013 John Wiley & Sons, Ltd.Rapid Commun. Mass Spectrom. 2013, 27, 1983–1992
1987
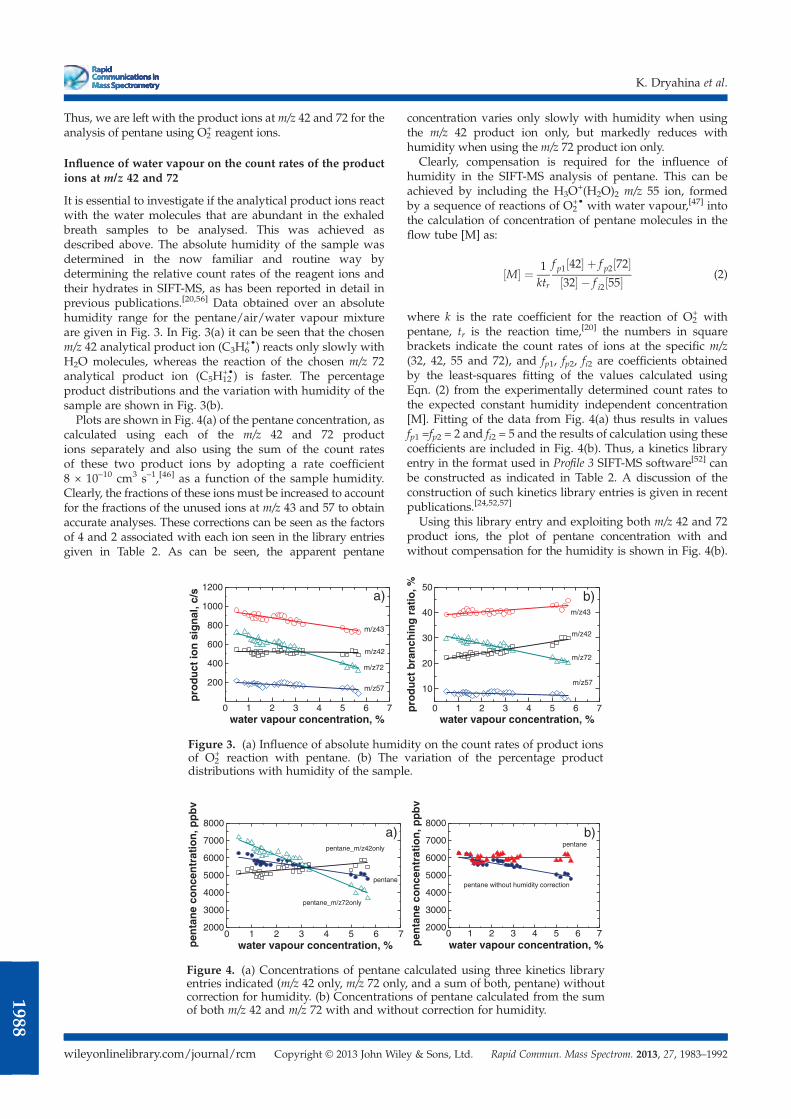
Thus, we are left with the product ions at m/z 42 and 72 for theanalysis of pentane using O2
+ reagent ions.
Influence of water vapour on the count rates of the productions at m/z 42 and 72
It is essential to investigate if the analytical product ions reactwith the water molecules that are abundant in the exhaledbreath samples to be analysed. This was achieved asdescribed above. The absolute humidity of the sample wasdetermined in the now familiar and routine way bydetermining the relative count rates of the reagent ions andtheir hydrates in SIFT-MS, as has been reported in detail inprevious publications.[20,56] Data obtained over an absolutehumidity range for the pentane/air/water vapour mixtureare given in Fig. 3. In Fig. 3(a) it can be seen that the chosenm/z 42 analytical product ion (C3H6
+•) reacts only slowly withH2O molecules, whereas the reaction of the chosen m/z 72analytical product ion (C5H12
+•) is faster. The percentageproduct distributions and the variation with humidity of thesample are shown in Fig. 3(b).Plots are shown in Fig. 4(a) of the pentane concentration, as
calculated using each of the m/z 42 and 72 productions separately and also using the sum of the count ratesof these two product ions by adopting a rate coefficient8 × 10–10 cm3 s–1,[46] as a function of the sample humidity.Clearly, the fractions of these ions must be increased to accountfor the fractions of the unused ions at m/z 43 and 57 to obtainaccurate analyses. These corrections can be seen as the factorsof 4 and 2 associated with each ion seen in the library entriesgiven in Table 2. As can be seen, the apparent pentane
concentration varies only slowly with humidity when usingthe m/z 42 product ion only, but markedly reduces withhumidity when using the m/z 72 product ion only.
Clearly, compensation is required for the influence ofhumidity in the SIFT-MS analysis of pentane. This can beachieved by including the H3O
+(H2O)2 m/z 55 ion, formedby a sequence of reactions of O2
+• with water vapour,[47] intothe calculation of concentration of pentane molecules in theflow tube [M] as:
Μ½ � ¼ 1ktr
f p1 42½ � þ f p2 72½ �32½ � � f i2 55½ � (2)
where k is the rate coefficient for the reaction of O2+ with
pentane, tr is the reaction time,[20] the numbers in squarebrackets indicate the count rates of ions at the specific m/z(32, 42, 55 and 72), and fp1, fp2, fi2 are coefficients obtainedby the least-squares fitting of the values calculated usingEqn. (2) from the experimentally determined count rates tothe expected constant humidity independent concentration[M]. Fitting of the data from Fig. 4(a) thus results in valuesfp1 =fp2 = 2 and fi2 = 5 and the results of calculation using thesecoefficients are included in Fig. 4(b). Thus, a kinetics libraryentry in the format used in Profile 3 SIFT-MS software[52] canbe constructed as indicated in Table 2. A discussion of theconstruction of such kinetics library entries is given in recentpublications.[24,52,57]
Using this library entry and exploiting both m/z 42 and 72product ions, the plot of pentane concentration with andwithout compensation for the humidity is shown in Fig. 4(b).
0 1 2 3 4 5 6 7
200
400
600
800
1000
1200
m/z57
m/z72
m/z42
pro
du
ct io
n s
ign
al, c
/s
water vapour concentration, %
m/z43
a)
0 1 2 3 4 5 6 7
10
20
30
40
50b)
m/z57
m/z72
m/z43
pro
du
ct b
ran
chin
g r
atio
, %
water vapour concentration, %
m/z42
Figure 3. (a) Influence of absolute humidity on the count rates of product ionsof O2
+ reaction with pentane. (b) The variation of the percentage productdistributions with humidity of the sample.
0 1 2 3 4 5 6 72000
3000
4000
5000
6000
7000
8000
pen
tan
e co
nce
ntr
atio
n, p
pb
v
water vapour concentration, %
pentane
pentane_m/z42only
pentane_m/z72only
a)
0 1 2 3 4 5 6 72000
3000
4000
5000
6000
7000
8000
pen
tan
e co
nce
ntr
atio
n, p
pb
v
water vapour concentration, %
pentane
pentane without humidity correction
b)
Figure 4. (a) Concentrations of pentane calculated using three kinetics libraryentries indicated (m/z 42 only, m/z 72 only, and a sum of both, pentane) withoutcorrection for humidity. (b) Concentrations of pentane calculated from the sumof both m/z 42 and m/z 72 with and without correction for humidity.
K. Dryahina et al.
wileyonlinelibrary.com/journal/rcm Copyright © 2013 John Wiley & Sons, Ltd. Rapid Commun. Mass Spectrom. 2013, 27, 1983–1992
1988
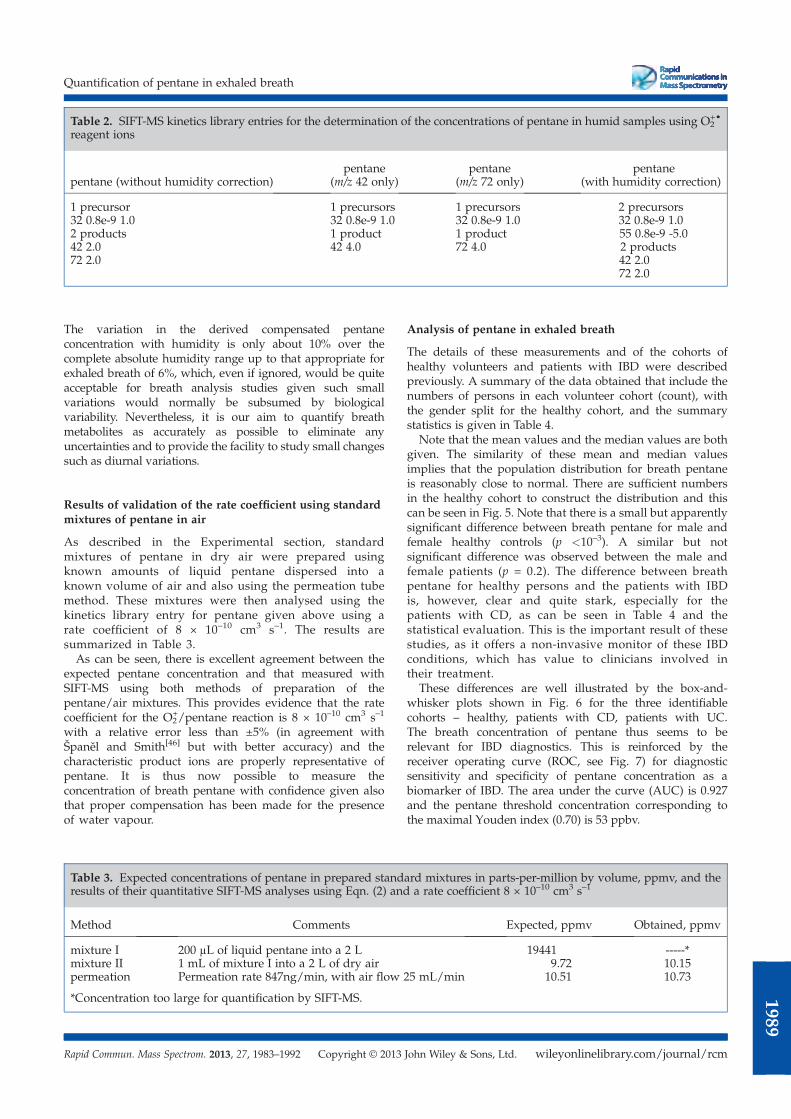
The variation in the derived compensated pentaneconcentration with humidity is only about 10% over thecomplete absolute humidity range up to that appropriate forexhaled breath of 6%, which, even if ignored, would be quiteacceptable for breath analysis studies given such smallvariations would normally be subsumed by biologicalvariability. Nevertheless, it is our aim to quantify breathmetabolites as accurately as possible to eliminate anyuncertainties and to provide the facility to study small changessuch as diurnal variations.
Results of validation of the rate coefficient using standardmixtures of pentane in air
As described in the Experimental section, standardmixtures of pentane in dry air were prepared usingknown amounts of liquid pentane dispersed into aknown volume of air and also using the permeation tubemethod. These mixtures were then analysed using thekinetics library entry for pentane given above using arate coefficient of 8 × 10⁻¹⁰ cm3 s–1. The results aresummarized in Table 3.As can be seen, there is excellent agreement between the
expected pentane concentration and that measured withSIFT-MS using both methods of preparation of thepentane/air mixtures. This provides evidence that the ratecoefficient for the O2
+/pentane reaction is 8 × 10⁻¹⁰ cm3 s–1
with a relative error less than ±5% (in agreement withŠpaněl and Smith[46] but with better accuracy) and thecharacteristic product ions are properly representative ofpentane. It is thus now possible to measure theconcentration of breath pentane with confidence given alsothat proper compensation has been made for the presenceof water vapour.
Analysis of pentane in exhaled breath
The details of these measurements and of the cohorts ofhealthy volunteers and patients with IBD were describedpreviously. A summary of the data obtained that include thenumbers of persons in each volunteer cohort (count), withthe gender split for the healthy cohort, and the summarystatistics is given in Table 4.
Note that the mean values and the median values are bothgiven. The similarity of these mean and median valuesimplies that the population distribution for breath pentaneis reasonably close to normal. There are sufficient numbersin the healthy cohort to construct the distribution and thiscan be seen in Fig. 5. Note that there is a small but apparentlysignificant difference between breath pentane for male andfemale healthy controls (p <10–3). A similar but notsignificant difference was observed between the male andfemale patients (p = 0.2). The difference between breathpentane for healthy persons and the patients with IBDis, however, clear and quite stark, especially for thepatients with CD, as can be seen in Table 4 and thestatistical evaluation. This is the important result of thesestudies, as it offers a non-invasive monitor of these IBDconditions, which has value to clinicians involved intheir treatment.
These differences are well illustrated by the box-and-whisker plots shown in Fig. 6 for the three identifiablecohorts – healthy, patients with CD, patients with UC.The breath concentration of pentane thus seems to berelevant for IBD diagnostics. This is reinforced by thereceiver operating curve (ROC, see Fig. 7) for diagnosticsensitivity and specificity of pentane concentration as abiomarker of IBD. The area under the curve (AUC) is 0.927and the pentane threshold concentration corresponding tothe maximal Youden index (0.70) is 53 ppbv.
Table 2. SIFT-MS kinetics library entries for the determination of the concentrations of pentane in humid samples using O2+•
reagent ions
pentane (without humidity correction)pentane
(m/z 42 only)pentane
(m/z 72 only)pentane
(with humidity correction)
1 precursor 1 precursors 1 precursors 2 precursors32 0.8e-9 1.0 32 0.8e-9 1.0 32 0.8e-9 1.0 32 0.8e-9 1.02 products 1 product 1 product 55 0.8e-9 -5.042 2.0 42 4.0 72 4.0 2 products72 2.0 42 2.0
72 2.0
Table 3. Expected concentrations of pentane in prepared standard mixtures in parts-per-million by volume, ppmv, and theresults of their quantitative SIFT-MS analyses using Eqn. (2) and a rate coefficient 8 × 10⁻¹⁰ cm3 s–1
Method Comments Expected, ppmv Obtained, ppmv
mixture I 200 μL of liquid pentane into a 2 L 19441 -----*mixture II 1 mL of mixture I into a 2 L of dry air 9.72 10.15permeation Permeation rate 847ng/min, with air flow 25 mL/min 10.51 10.73
*Concentration too large for quantification by SIFT-MS.
Quantification of pentane in exhaled breath
wileyonlinelibrary.com/journal/rcmCopyright © 2013 John Wiley & Sons, Ltd.Rapid Commun. Mass Spectrom. 2013, 27, 1983–1992
1989
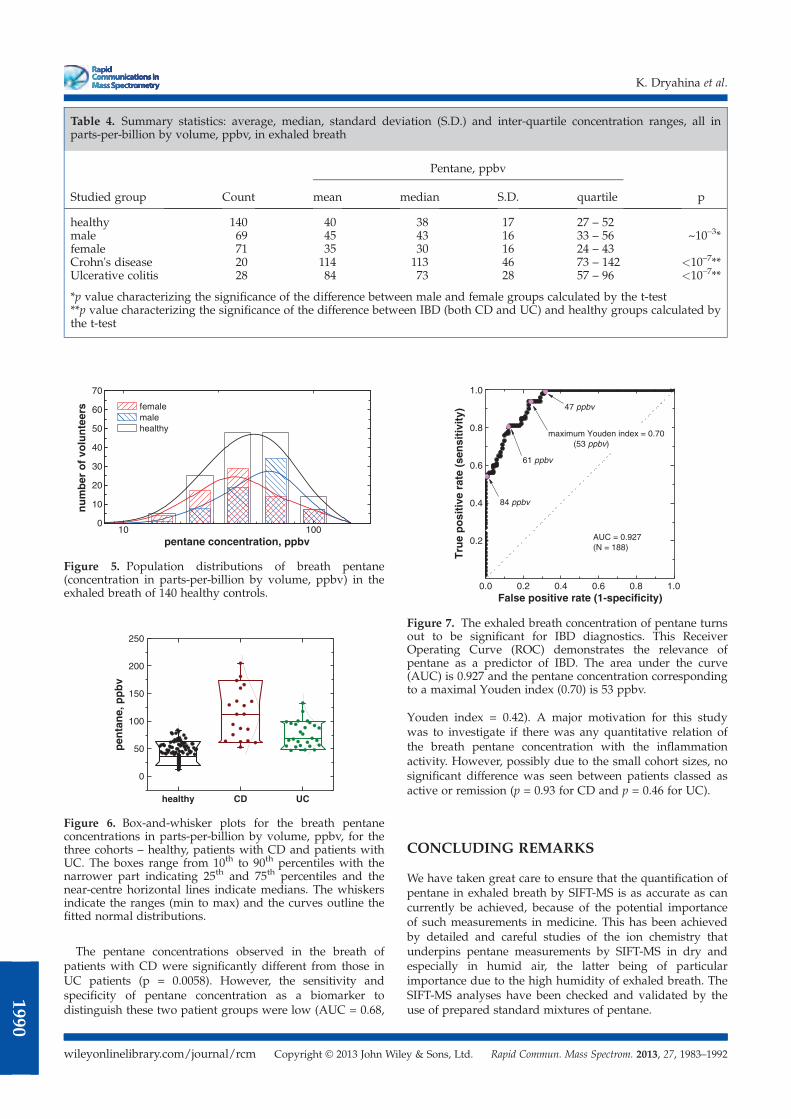
The pentane concentrations observed in the breath ofpatients with CD were significantly different from those inUC patients (p = 0.0058). However, the sensitivity andspecificity of pentane concentration as a biomarker todistinguish these two patient groups were low (AUC = 0.68,
Youden index = 0.42). A major motivation for this studywas to investigate if there was any quantitative relation ofthe breath pentane concentration with the inflammationactivity. However, possibly due to the small cohort sizes, nosignificant difference was seen between patients classed asactive or remission (p = 0.93 for CD and p = 0.46 for UC).
CONCLUDING REMARKS
We have taken great care to ensure that the quantification ofpentane in exhaled breath by SIFT-MS is as accurate as cancurrently be achieved, because of the potential importanceof such measurements in medicine. This has been achievedby detailed and careful studies of the ion chemistry thatunderpins pentane measurements by SIFT-MS in dry andespecially in humid air, the latter being of particularimportance due to the high humidity of exhaled breath. TheSIFT-MS analyses have been checked and validated by theuse of prepared standard mixtures of pentane.
Table 4. Summary statistics: average, median, standard deviation (S.D.) and inter-quartile concentration ranges, all inparts-per-billion by volume, ppbv, in exhaled breath
Studied group Count
Pentane, ppbv
pmean median S.D. quartile
healthy 140 40 38 17 27 – 52male 69 45 43 16 33 – 56 ~10–3*female 71 35 30 16 24 – 43Crohn's disease 20 114 113 46 73 – 142 <10–7**Ulcerative colitis 28 84 73 28 57 – 96 <10–7**
*p value characterizing the significance of the difference between male and female groups calculated by the t-test**p value characterizing the significance of the difference between IBD (both CD and UC) and healthy groups calculated bythe t-test
10 1000
10
20
30
40
50
60
70
pentane concentration, ppbv
nu
mb
er o
f vo
lun
teer
s femalemalehealthy
Figure 5. Population distributions of breath pentane(concentration in parts-per-billion by volume, ppbv) in theexhaled breath of 140 healthy controls.
healthy CD UC
0
50
100
150
200
250
pen
tan
e, p
pb
v
Figure 6. Box-and-whisker plots for the breath pentaneconcentrations in parts-per-billion by volume, ppbv, for thethree cohorts – healthy, patients with CD and patients withUC. The boxes range from 10th to 90th percentiles with thenarrower part indicating 25th and 75th percentiles and thenear-centre horizontal lines indicate medians. The whiskersindicate the ranges (min to max) and the curves outline thefitted normal distributions.
0.0 0.2 0.4 0.6 0.8 1.0
0.2
0.4
0.6
0.8
1.0
61 ppbv
47 ppbv
Tru
e p
osi
tive
rat
e (s
ensi
tivi
ty)
False positive rate (1-specificity)
AUC = 0.927(N = 188)
maximum Youden index = 0.70 (53 ppbv)
84 ppbv
Figure 7. The exhaled breath concentration of pentane turnsout to be significant for IBD diagnostics. This ReceiverOperating Curve (ROC) demonstrates the relevance ofpentane as a predictor of IBD. The area under the curve(AUC) is 0.927 and the pentane concentration correspondingto a maximal Youden index (0.70) is 53 ppbv.
K. Dryahina et al.
wileyonlinelibrary.com/journal/rcm Copyright © 2013 John Wiley & Sons, Ltd. Rapid Commun. Mass Spectrom. 2013, 27, 1983–1992
1990
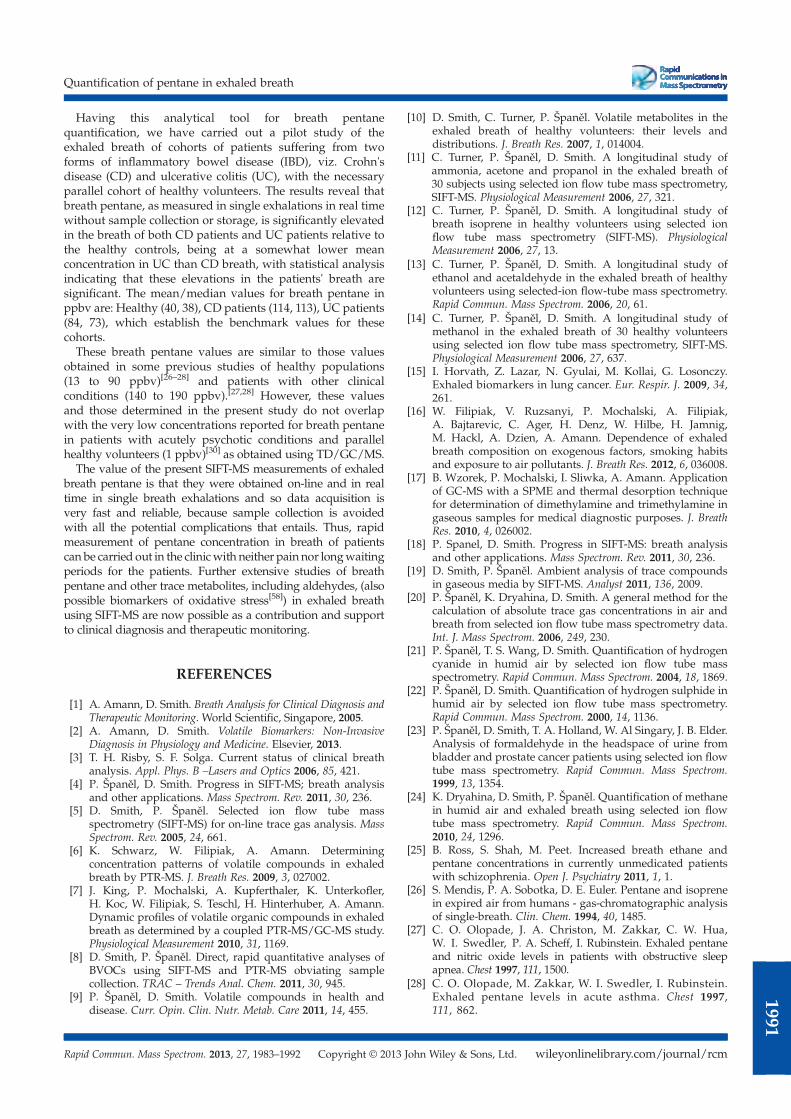
Having this analytical tool for breath pentanequantification, we have carried out a pilot study of theexhaled breath of cohorts of patients suffering from twoforms of inflammatory bowel disease (IBD), viz. Crohn'sdisease (CD) and ulcerative colitis (UC), with the necessaryparallel cohort of healthy volunteers. The results reveal thatbreath pentane, as measured in single exhalations in real timewithout sample collection or storage, is significantly elevatedin the breath of both CD patients and UC patients relative tothe healthy controls, being at a somewhat lower meanconcentration in UC than CD breath, with statistical analysisindicating that these elevations in the patients' breath aresignificant. The mean/median values for breath pentane inppbv are: Healthy (40, 38), CD patients (114, 113), UC patients(84, 73), which establish the benchmark values for thesecohorts.These breath pentane values are similar to those values
obtained in some previous studies of healthy populations(13 to 90 ppbv)[26–28] and patients with other clinicalconditions (140 to 190 ppbv).[27,28] However, these valuesand those determined in the present study do not overlapwith the very low concentrations reported for breath pentanein patients with acutely psychotic conditions and parallelhealthy volunteers (1 ppbv)[30] as obtained using TD/GC/MS.The value of the present SIFT-MS measurements of exhaled
breath pentane is that they were obtained on-line and in realtime in single breath exhalations and so data acquisition isvery fast and reliable, because sample collection is avoidedwith all the potential complications that entails. Thus, rapidmeasurement of pentane concentration in breath of patientscan be carried out in the clinicwith neither pain nor longwaitingperiods for the patients. Further extensive studies of breathpentane and other trace metabolites, including aldehydes, (alsopossible biomarkers of oxidative stress[58]) in exhaled breathusing SIFT-MS are now possible as a contribution and supportto clinical diagnosis and therapeutic monitoring.
REFERENCES
[1] A. Amann, D. Smith. Breath Analysis for Clinical Diagnosis andTherapeutic Monitoring. World Scientific, Singapore, 2005.
[2] A. Amann, D. Smith. Volatile Biomarkers: Non-InvasiveDiagnosis in Physiology and Medicine. Elsevier, 2013.
[3] T. H. Risby, S. F. Solga. Current status of clinical breathanalysis. Appl. Phys. B –Lasers and Optics 2006, 85, 421.
[4] P. Španěl, D. Smith. Progress in SIFT-MS; breath analysisand other applications. Mass Spectrom. Rev. 2011, 30, 236.
[5] D. Smith, P. Španěl. Selected ion flow tube massspectrometry (SIFT-MS) for on-line trace gas analysis. MassSpectrom. Rev. 2005, 24, 661.
[6] K. Schwarz, W. Filipiak, A. Amann. Determiningconcentration patterns of volatile compounds in exhaledbreath by PTR-MS. J. Breath Res. 2009, 3, 027002.
[7] J. King, P. Mochalski, A. Kupferthaler, K. Unterkofler,H. Koc, W. Filipiak, S. Teschl, H. Hinterhuber, A. Amann.Dynamic profiles of volatile organic compounds in exhaledbreath as determined by a coupled PTR-MS/GC-MS study.Physiological Measurement 2010, 31, 1169.
[8] D. Smith, P. Španěl. Direct, rapid quantitative analyses ofBVOCs using SIFT-MS and PTR-MS obviating samplecollection. TRAC – Trends Anal. Chem. 2011, 30, 945.
[9] P. Španěl, D. Smith. Volatile compounds in health anddisease. Curr. Opin. Clin. Nutr. Metab. Care 2011, 14, 455.
[10] D. Smith, C. Turner, P. Španěl. Volatile metabolites in theexhaled breath of healthy volunteers: their levels anddistributions. J. Breath Res. 2007, 1, 014004.
[11] C. Turner, P. Španěl, D. Smith. A longitudinal study ofammonia, acetone and propanol in the exhaled breath of30 subjects using selected ion flow tube mass spectrometry,SIFT-MS. Physiological Measurement 2006, 27, 321.
[12] C. Turner, P. Španěl, D. Smith. A longitudinal study ofbreath isoprene in healthy volunteers using selected ionflow tube mass spectrometry (SIFT-MS). PhysiologicalMeasurement 2006, 27, 13.
[13] C. Turner, P. Španěl, D. Smith. A longitudinal study ofethanol and acetaldehyde in the exhaled breath of healthyvolunteers using selected-ion flow-tube mass spectrometry.Rapid Commun. Mass Spectrom. 2006, 20, 61.
[14] C. Turner, P. Španěl, D. Smith. A longitudinal study ofmethanol in the exhaled breath of 30 healthy volunteersusing selected ion flow tube mass spectrometry, SIFT-MS.Physiological Measurement 2006, 27, 637.
[15] I. Horvath, Z. Lazar, N. Gyulai, M. Kollai, G. Losonczy.Exhaled biomarkers in lung cancer. Eur. Respir. J. 2009, 34,261.
[16] W. Filipiak, V. Ruzsanyi, P. Mochalski, A. Filipiak,A. Bajtarevic, C. Ager, H. Denz, W. Hilbe, H. Jamnig,M. Hackl, A. Dzien, A. Amann. Dependence of exhaledbreath composition on exogenous factors, smoking habitsand exposure to air pollutants. J. Breath Res. 2012, 6, 036008.
[17] B. Wzorek, P. Mochalski, I. Sliwka, A. Amann. Applicationof GC-MS with a SPME and thermal desorption techniquefor determination of dimethylamine and trimethylamine ingaseous samples for medical diagnostic purposes. J. BreathRes. 2010, 4, 026002.
[18] P. Spanel, D. Smith. Progress in SIFT-MS: breath analysisand other applications. Mass Spectrom. Rev. 2011, 30, 236.
[19] D. Smith, P. Španěl. Ambient analysis of trace compoundsin gaseous media by SIFT-MS. Analyst 2011, 136, 2009.
[20] P. Španěl, K. Dryahina, D. Smith. A general method for thecalculation of absolute trace gas concentrations in air andbreath from selected ion flow tube mass spectrometry data.Int. J. Mass Spectrom. 2006, 249, 230.
[21] P. Španěl, T. S. Wang, D. Smith. Quantification of hydrogencyanide in humid air by selected ion flow tube massspectrometry. Rapid Commun. Mass Spectrom. 2004, 18, 1869.
[22] P. Španěl, D. Smith. Quantification of hydrogen sulphide inhumid air by selected ion flow tube mass spectrometry.Rapid Commun. Mass Spectrom. 2000, 14, 1136.
[23] P. Španěl, D. Smith, T. A. Holland, W. Al Singary, J. B. Elder.Analysis of formaldehyde in the headspace of urine frombladder and prostate cancer patients using selected ion flowtube mass spectrometry. Rapid Commun. Mass Spectrom.1999, 13, 1354.
[24] K. Dryahina, D. Smith, P. Španěl. Quantification of methanein humid air and exhaled breath using selected ion flowtube mass spectrometry. Rapid Commun. Mass Spectrom.2010, 24, 1296.
[25] B. Ross, S. Shah, M. Peet. Increased breath ethane andpentane concentrations in currently unmedicated patientswith schizophrenia. Open J. Psychiatry 2011, 1, 1.
[26] S. Mendis, P. A. Sobotka, D. E. Euler. Pentane and isoprenein expired air from humans - gas-chromatographic analysisof single-breath. Clin. Chem. 1994, 40, 1485.
[27] C. O. Olopade, J. A. Christon, M. Zakkar, C. W. Hua,W. I. Swedler, P. A. Scheff, I. Rubinstein. Exhaled pentaneand nitric oxide levels in patients with obstructive sleepapnea. Chest 1997, 111, 1500.
[28] C. O. Olopade, M. Zakkar, W. I. Swedler, I. Rubinstein.Exhaled pentane levels in acute asthma. Chest 1997,111, 862.
Quantification of pentane in exhaled breath
wileyonlinelibrary.com/journal/rcmCopyright © 2013 John Wiley & Sons, Ltd.Rapid Commun. Mass Spectrom. 2013, 27, 1983–1992
1991
[29] D. Poli, P. Carbognani, M. Corradi, M. Goldoni, O. Acampa,B. Balbi, L. Bianchi, M. Rusca, A. Mutti. Exhaled volatileorganic compounds in patients with non-small cell lungcancer: cross sectional and nested short-term follow-upstudy. Respir. Res. 2005, 6, 71.
[30] M. Phillips, M. Sabas, J. Greenberg. Increased pentane andcarbon-disulfide in the breath of patients with schizophrenia.J. Clin. Pathol. 1993, 46, 861.
[31] A. Vangossum, J. Decuyper. Breath alkanes as an index oflipid-peroxidation. Eur. Respir. J. 1989, 2, 787.
[32] G. Spiteller. Peroxidation of linoleic acid and its relation toaging and age dependent diseases. Mechanisms AgeingDevelop. 2001, 122, 617.
[33] A. Rosa, G. Appendino, M. P. Melis, M. Deiana, A. Atzeri,I. Alessandra, A. Minassi, M. A. Dessi. Protective effect andrelation structure-activity of nonivamide and iododerivativesin several models of lipid oxidation. Chemico-BiologicalInteractions 2009, 180, 183.
[34] J.-K. Kim, H.-W. Cho, J.-H. Han, S.-B. Lee, Y.-H. Chung,K.-T. Rim, J.-S. Yang. Subchronic Inhalation ToxicityStudy of n-pentane in Rats. Saf. Health Work 2012, 3, 224.
[35] U. Frommer, V. Ullrich, H. Stauding. Hydroxylation ofaliphatic compounds by liver microsomes. 1. Distributionpattern of isomeric alcohols. Hoppe-Seylers Zeitschrift furPhysiologische Chemie 1970, 351, 903.
[36] S. R. B. Allerheiligen, T. M. Ludden, R. F. Burk. Thepharmacokinetics of pentane, a by-product of lipid-peroxidation. Drug Metabo. Dispos. 1987, 15, 794.
[37] J. Kokoszka, R. L. Nelson, W. I. Swedler, J. Skosey,H. Abcarian. Determination of inflammatory bowel-disease activity by breath pentane analysis. Diseases of theColon & Rectum 1993, 36, 597.
[38] S. Sedghi, A. Keshavarzian, M. Klamut, D. Eiznhamer,E. J. Zarling. Elevated breath ethane levels in activeulcerative-colitis – evidence fir excessive lipid-peroxidation.Am. J. Gastroenterol. 1994, 89, 2217.
[39] G. Van Assche, A. Dignass, J. Panes, L. Beaugerie,J. Karagiannis, M. Allez, T. Ochsenkuhn, T. Orchard,G. Rogler, E. Louis, L. Kupcinskas, G. Mantzaris, S. Travis,E. Stange, Ecco. The second European evidence-basedconsensus on the diagnosis and management of Crohn'sdisease: Definitions and diagnosis. J. Crohns&Colitis 2010, 4, 7.
[40] M. Lukas, M. Bortlik, Z. Maratka. What is the origin ofulcerative colitis? Still more questions than answers.Postgrad. Med. J. 2006, 82, 620.
[41] I. Ahmed, R. Greenwood, B. D. Costello, N. M. Ratcliffe,C. S. Probert. An investigation of fecal volatile organicmetabolites in irritable bowel syndrome. Plos One 2013, 8, 13.
[42] G. D'Haens, W. J. Sandborn, B. G. Feagan, K. Geboes,S. B. Hanauer, E. J. Irvine, M. Lemann, P. Marteau,P. Rutgeerts, J. Scholmerich, L. R. Sutherland. A reviewof activity indices and efficacy end points for clinical trialsof medical therapy in adults with ulcerative colitis.Gastroenterology 2007, 132, 763.
[43] B. E.Wendland, E.Aghdassi, C. Tam, J. Carrrier, A.H. Steinhart,S. L. Wolman, D. Baron, J. P. Allard. Lipid peroxidation andplasma antioxidant micronutrients in Crohn disease. Am. J.Clin. Nutr. 2001, 74, 259.
[44] P. Španěl, D. Smith. Selected ion flow tube studies of thereactions of H3O
+ NO+, and O2+ with several aromatic
and aliphatic hydrocarbons. Int. J. Mass Spectrom. 1998,181, 1.
[45] G. J. Francis, P. F. Wilson, D. B. Milligan, V. S. Langford,M. T. McEwan. GeoVOC: A SIFT-MS method for theanalysis of small linear hydrocarbons of relevance to oilexploration. Int. J. Mass Spectrom. 2007, 268, 38.
[46] P. Španěl, D. Smith. A selected ion flow tube study of thereactions of NO+ and O2
+ ions with some organic molecules:The potential for trace gas analysis of air. J. Chem. Phys.1996, 104, 1893.
[47] P. Španěl, D. Smith. Influence of weakly bound adduct ionson breath trace gas analysis by selected ion flow tube massspectrometry (SIFT-MS). Int. J. Mass Spectrom. 2009, 280, 128.
[48] N. G. Adams, D. Smith. Selected ion flow tube (SIFT) –technique for studying ion-neutral reactions. Int. J. MassSpectrom. Ion Processes 1976, 21, 349.
[49] P. Španěl, D. Smith. A selected ion flow tube study of thereactions of NO+ and O2
+ ions with some organic molecules:The potential for trace gas analysis of air. J. Chem. Phys.1996, 104, 1893.
[50] D. Smith, P. Španěl, J. M. Thompson, B. Rajan, J. Cocker,P. Rolfe. The selected ion flow tube method for workplaceanalyses of trace gases in air and breath: Its scope,validation, and applications. Appl. Occupational Environ.Hyg. 1998, 13, 817.
[51] K. Dryahina, B. K. C. de Miranda, P. Spanel, J. Zabka,C. Alcaraz, Z. Herman. Selected ion flow tube study of ionmolecule reactions of N+(P-3) and Kr+ with C-3 hydrocarbonspropane, propene, and propyne. J. Phys. Chem. A 2011,115, 7310.
[52] K. Sovova, K. Dryahina, P. Spanel. Selected ion flow tube(SIFT) studies of the reactions of H3O
+, NO+ and O2+ with
six volatile phytogenic esters. Int. J. Mass Spectrom. 2011,300, 31.
[53] D. Smith, K. Sovova, P. Spanel. A selected ion flow tubestudy of the reactions of H3O
+, NO+ and O2+ with seven
isomers of hexanol in support of SIFT-MS. Int. J. MassSpectrom. 2012, 319, 25.
[54] T. Wang, A. Pysanenko, K. Dryahina, P. Španěl, D. Smith.Analysis of breath, exhaled via the mouth and nose, andthe air in the oral cavity. J. Breath Res. 2008, 2, 037013.
[55] K. Dryahina, D. Smith, P. Spanel. Quantification of methanein humid air and exhaled breath using selected ion flowtube mass spectrometry. Rapid Commun. Mass Spectrom.2010, 24, 1296.
[56] P. Španěl, D. Smith. On-line measurement of the absolutehumidity of air, breath and liquid headspace samples byselected ion flow tube mass spectrometry. Rapid Commun.Mass Spectrom. 2001, 15, 563.
[57] P. Španěl, D. Smith. Advances in on-line absolute trace gasanalysis by SIFT-MS. Curr. Anal. Chem. 2013, 9, 525.
[58] M. Corradi, P. Pignatti, P. Manini, R. Andreoli, M. Goldoni,M. Poppa, G. Moscato, B. Balbi, A. Mutti. Comparisonbetween exhaled and sputum oxidative stressbiomarkers in chronic airway inflammation. Eur. Respir.J. 2004, 24, 1011.
K. Dryahina et al.
wileyonlinelibrary.com/journal/rcm Copyright © 2013 John Wiley & Sons, Ltd. Rapid Commun. Mass Spectrom. 2013, 27, 1983–1992
1992
Appendix D, Shestivska et al. Rapid Commun. Mass
Spectrom. 25 (2011) 2459
Quantification of methyl thiocyanate in the headspace of Pseudomonas
aeruginosa cultures and in the breath of cystic fibrosis patients by selected
ion flow tube mass spectrometry
V. Shestivskaa, P. Špan la,b, K. Dryahinaa, K. Sovováa,c, D. Smithb , M. Musílekd and
A. Nemecd
aJ. Heyrovský Institute of Physical Chemistry, Academy of Sciences of the Czech
Republic, Prague, Czech Republic bInstitute for Science and Technology in Medicine, School of Medicine, Keele
University, Stoke-on-Trent, UK
cDepartment of Physical and Macromolecular Chemistry, Faculty of Science, Charles
University, Prague, Czech Republic dCentre of Epidemiology and Microbiology, National Institute of Public Health, Prague,
Czech Republic

Quantification of methyl thiocyanate in the headspace ofPseudomonas aeruginosa cultures and in the breath of cysticfibrosis patients by selected ion flow tube mass spectrometry
Violetta Shestivska1, Alexandr Nemec2, Pavel Dřevínek3, Kristýna Sovová1,4,Kseniya Dryahina1 and Patrik Španěl1*1J. Heyrovsky Institute of Physical Chemistry, Academy of Science of the Czech Republic, Dolejškova 3, 18223 Prague 8,Czech Republic2Centre of Epidemiology and Microbiology, National Institute of Public Health, Srobárova 48, 10042 Prague, Czech Republic3Department of Paediatrics, 2nd Medical School, Charles University in Prague, V Uvalu 84, 15006 Prague 5, Czech Republic4Department of Physical Macromolecular Chemistry, Faculty of Science, Charles University, Albertov 2030, 12840 Prague 2,Czech Republic
Infection by Pseudomonas aeruginosa (PA) is a major cause of morbidity and mortality in patients with cystic fibrosis(CF). Breath analysis could potentially be a useful diagnostic of such infection, and analyses of volatile organic compounds(VOCs) emitted from PA cultures are an important part of the search for volatile breath markers of PA lung infection. Ourpilot experiments using solid-phase microextraction, SPME and gas chromatography/mass spectrometric (GC/MS)analyses of volatile compounds produced by PA strains indicated a clear presence of methyl thiocyanate. This pro-vided a motivation to develop a method for real-time online quantification of this compound by selected ionflow tube mass spectrometry, SIFT-MS. The kinetics of reactions of H3O
+, NO+ and O2+• with methyl thiocyanate at
300K were characterized and the characteristic product ions determined (proton transfer for H3O+, rate constant
4.6�10–9 cm3s–1; association for NO+, 1.7�10–9 cm3s–1 and nondissociative charge transfer for O2+•
, 4.3�10–9 cm3s–1).The kinetics library was extended by a new entry for methyl thiocyanate accounting for overlaps with isotopologuesof hydrated hydronium ions. Solubility of methyl thiocyanate in water (Henry’s law constant) was determinedusing standard reference solutions and the linearity and limits of detection of both SIFT-MS and SPME-GC/MSmethods were characterized. Thirty-six strains of PA with distinct genotype were cultivated under identical con-ditions and 28 of them (all also producing HCN) were found to release methyl thiocyanate in headspace concentra-tions greater than 6 parts per billion by volume (ppbv). SIFT-MS was also used to analyze the breath of 28 childrenwith CF and the concentrations of methyl thiocyanate were found to be in the range 2–21 ppbv (median 7 ppbv).Copyright © 2011 John Wiley & Sons, Ltd.
Breath analysis offers great potential as a non-invasivemethod for diagnosis of lower respiratory tract infectionswithout the need for bronchoscopy or alveolar lavage.[1] Sucha diagnostic tool would be of great value, especially in chil-dren with cystic fibrosis (CF), where early detection ofrespiratory pathogens such as Pseudomonas aeruginosa (PA)increases the chance of their eradication in both childrenand adults.[2] The reason why a non-invasive breath testwould be of a special benefit to children is that they are oftenunable to reliably expectorate sputum, cultivation of which isthe gold standard method for PA diagnosis. Analyses of vola-tile organic compounds (VOCs) emitted from PA bacterialcultures is a first step in the search for volatile breath markersof lungs infection which can ultimately be used for diagnosticsby breath analysis. This approach was evaluated previously by
a proof-of-concept study focusing on HCN.[3,4] Selected ionflow tube mass spectrometry (SIFT-MS) is primarily usedfor online quantification of trace gases in human breath[5,6]
and has great potential as a tool for non-invasive physiologi-cal monitoring of CF patients.[2] Recently, HCN was alsoquantified in human breath using near-infrared cavityring down spectroscopy (CRDS).[7] Gas chromatography/mass spectrometry (GC/MS) is a well-established standardtechnique for analyses of complex mixtures of volatile com-pounds and it can be used to identify many characteristiccompounds released by PA strains. The objective of the presentstudy was to identify biomarkers that would complementalready established HCN in the diagnosis of PA infection inCF. The PA population is highly diverse and contains lots ofgenetically distinct strains although epidemic clones, homo-geneous in genotypic and phenotypic properties, may alsooccur.[8] As shown previously, phenotypic profiles such asantibiotic resistance in PA strains depend on their geno-mic types[9] and it is thus possible that the composition ofVOCs may significantly differ in genetically (clonally) distinctPA strains.
* Correspondence to: P. Španěl, J. Heyrovsky Institute of PhysicalChemistry, Academy of Science of the Czech Republic,Dolejškova 3, 18223 Prague 8, Czech Republic.E-mail: [email protected]
Copyright © 2011 John Wiley & Sons, Ltd.Rapid Commun. Mass Spectrom. 2011, 25, 2459–2467
Research Article
Received: 28 April 2011 Revised: 13 June 2011 Accepted: 14 June 2011 Published online in Wiley Online Library
Rapid Commun. Mass Spectrom. 2011, 25, 2459–2467(wileyonlinelibrary.com) DOI: 10.1002/rcm.5146
2459
CURRENT KNOWLEDGE AND RESULTS OFPILOT EXPERIMENTS
Hydrogen cyanide in PA
As mentioned earlier, HCN has been previously identified andquantified using SIFT-MS in the headspace of PA cultures[3]
and also in the breath of children with CF.[2] HCN was alsodetected in a headspace of alveolar lavage from one PA-positive patient and was absent in samples from PA-negativepatients.[1] These results are in accordance with several otherstudies carried out using electrochemical methods for ana-lyses of liquid samples (cyanide electrodes), which identi-fied hydrogen cyanide and cyanide in the sputum andbronchoalveloar lavage of large numbers of patients,[10]
even though one recent study of cyanide concentrations inbronchoalveolar lavage suggested that it is not a very specificdiagnostic biomarker of PA infection, because it was alsoobserved in significant concentration in non-infected patients.[11]
The mechanism of biosynthesis of hydrogen cyanide (HCN)or cyanogenesis has been described in only a few bacterialgroups, including PA.[12] However, it is known that the mainfactors having an effect on cyanogenesis in PA are decreasedoxygen concentration and increased bacterial cell density inculture.[13] PA produces cyanide under microaerobic (<5%)conditions; cyanogenesis is inactivated under atmosphericoxygen concentration or under strict anaerobic conditions.[14]
This may reflect an evolutionary survival mechanism bywhich toxic cyanide mediates reduction of density in micro-bial population under stress conditions.[15] In relation tolaboratory studies of VOCs from bacterial cultures, thisimplies that microaerobic cultures of PA may produce moreHCN than cultures cultivated in aerobic conditions.
Methyl thiocyanate in PA
Cyanide is also toxic for the very bacteria that are producingit. PA avoids cyanide toxicity by a number of adaptive enzy-matic pathways. One of the recently described mechanisms ofdetoxification of HCN by PA is its metabolism into thiocya-nate involving the enzyme thiosulphate sulphurtransfer-ase.[16] Our pilot experiments using GC/MS analyses ofvolatile compounds produced by PA cultures indicated theprominent presence of methyl thiocyanate (CH3SCN) basedon a match with a mass spectral library[17] (see Fig. 1). Thisfinding provided the initial impetus for the present studydedicated to accurate quantification of methyl thiocyanateemitted by a range of PA strains and also to investigatingthe feasibility of its quantification in the exhaled breath ofpatients using SIFT-MS. Production of methyl thiocyanateby PA has not been described so far to our knowledge, theonly relevant mention in the literature being a study ofArabidopsis plants where thiocyanate is methylated intomethyl thiocyanate.[18] Previous studies of the headspaceof bacterial cultures using SIFT-MS[3,19,20] identified severalVOCs as being produced by PA, including several sulphurcompounds (hydrogen sulphide, methanethiol, dimethylsulphide). However, methyl thiocyanate was not specifi-cally identified. It is worthy of note that identification ofmethyl thiocyanate by the GC/MS method is readily possi-ble, as was previously demonstrated by the example of ciga-rette smoke.[21] However, GC/MS does not allow real-time
accurate quantification of volatile compounds and thus it isdesirable to develop a method for SIFT-MS quantification ofmethyl thiocyanate in the headspace of bacterial cultures oflarge number of PA strains, as it is reported below.
Henry’s law constant for methyl thiocyanate
Henry’s law constants related to volatility and solubility ofVOCs in water are widely used in chemical and environmentalstudies. Knowledge of these constants allows the concentra-tions of VOCs dissolved in water to be related to the concentra-tions of their vapours in the headspace. Henry’s law constantshave been determined and converted into a uniform formatfor more than 500 substances.[22] Unfortunately, the Henry’slaw constant for methyl thiocyanate is not known as far aswe know. Thus, as a part of the present study, we had toexperimentally obtain the Henry’s law constant for methylthiocyanate dissolved in water at two different temperatures.
EXPERIMENTAL
Bacterial strains
A total of 36 strains of PAwere included in the present study(see Results and Discussion section). Thirty-three strains(designated NIPH) were selected from a previous study onthe genetic diversity of PA strains in the Czech populationof CF patients.[9] These strains were isolated from sputumgiven by 33 different patients in 2004–2005 and represent dif-ferent genotypes as defined by AFLP, a high-resolutionwhole-genome fingerprinting method.[9] Three additionalstrains (ANC 3157, ANC 3209, ANC 3488) were selected fromanother study focused on the population structure of PA iso-lates from the blood of patients in intensive hospital care.[23]
These three strains represent, three multidrug-resistantepidemic clones widespread in Czech hospitals in 2007. StrainPAO1 was used as the PA reference strain. All strains werestored in glycerol broth at �80 �C.
Cultivation and quantification of bacteria
Shaken submersion culture of each strain was performed in7mL of Mueller-Hinton Broth (MHB) liquid medium (Oxoid)in a 100mL hermetically sealed flask. Each culture flask wasinoculated with a drop (~50 mL) of cell suspension of stan-dardized turbidity (~108 colony forming units [CFU] mL–1)prepared in saline from an overnight agar culture. The inoc-ulated flasks were cultivated at 37 �C for 20 h using a shak-ing, thermostatically controlled water bath (IKA HS-B20) atan impeller speed of 160 rpm. The quantity of bacterialgrowth was assessed both by CFU counting and by measure-ment of optical density (OD). CFU was assessed by platingserial ten-fold dilutions of the bacterial culture in duplicateon agar plates, which were incubated at 37 �C for 20 h.OD was measured in a spectrophotometer at 600 nm usinguninoculated MHB as a blank.
Standard solutions
In order to validate the GC/MS identification of methyl thio-cyanate and to determine its Henry’s law constant using SIFT-MS, an external reference solution was prepared by dissolving
V. Shestivska et al.
wileyonlinelibrary.com/journal/rcm Copyright © 2011 John Wiley & Sons, Ltd. Rapid Commun. Mass Spectrom. 2011, 25, 2459–2467
2460
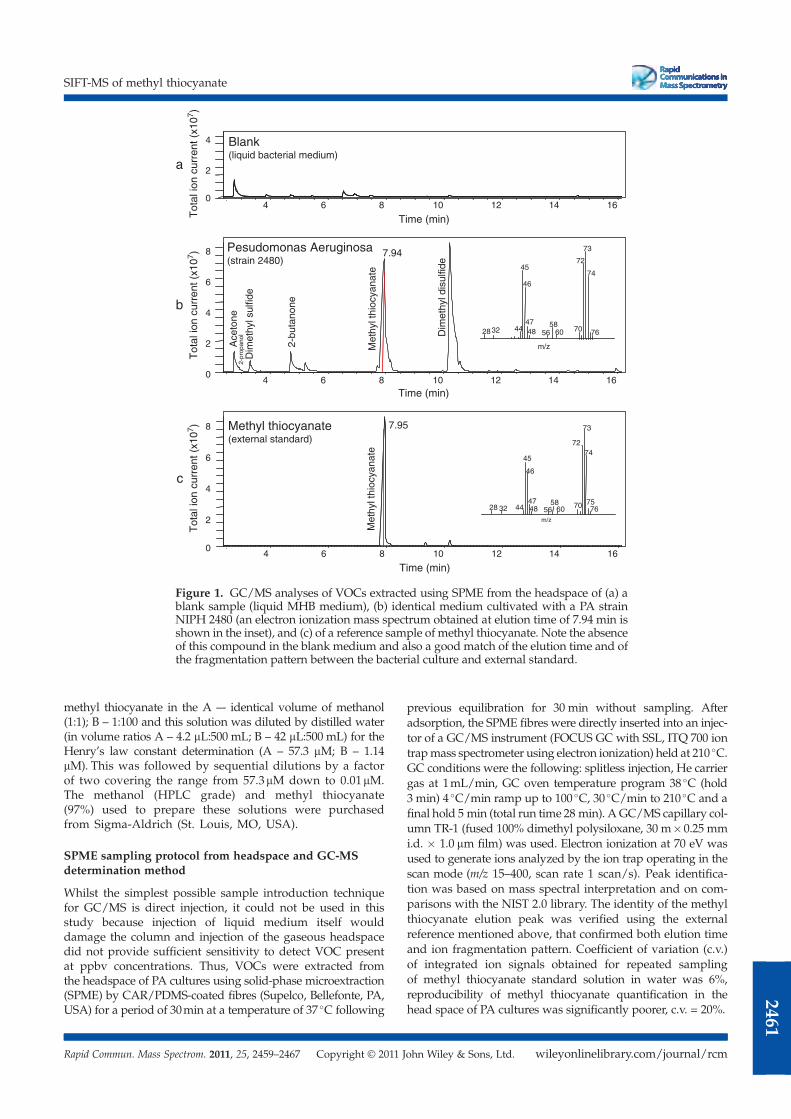
methyl thiocyanate in the A –- identical volume of methanol(1:1); B – 1:100 and this solution was diluted by distilled water(in volume ratios A – 4.2 mL:500 mL; B – 42 mL:500 mL) for theHenry’s law constant determination (A – 57.3 mM; B – 1.14mM). This was followed by sequential dilutions by a factorof two covering the range from 57.3mM down to 0.01mM.The methanol (HPLC grade) and methyl thiocyanate(97%) used to prepare these solutions were purchasedfrom Sigma-Aldrich (St. Louis, MO, USA).
SPME sampling protocol from headspace and GC-MSdetermination method
Whilst the simplest possible sample introduction techniquefor GC/MS is direct injection, it could not be used in thisstudy because injection of liquid medium itself woulddamage the column and injection of the gaseous headspacedid not provide sufficient sensitivity to detect VOC presentat ppbv concentrations. Thus, VOCs were extracted fromthe headspace of PA cultures using solid-phase microextraction(SPME) by CAR/PDMS-coated fibres (Supelco, Bellefonte, PA,USA) for a period of 30min at a temperature of 37 �C following
previous equilibration for 30 min without sampling. Afteradsorption, the SPME fibres were directly inserted into an injec-tor of a GC/MS instrument (FOCUS GC with SSL, ITQ 700 iontrapmass spectrometer using electron ionization) held at 210 �C.GC conditions were the following: splitless injection, He carriergas at 1mL/min, GC oven temperature program 38 �C (hold3 min) 4 �C/min ramp up to 100 �C, 30 �C/min to 210 �C and afinal hold 5 min (total run time 28 min). AGC/MS capillary col-umn TR-1 (fused 100% dimethyl polysiloxane, 30 m�0.25 mmi.d. � 1.0 mm film) was used. Electron ionization at 70 eV wasused to generate ions analyzed by the ion trap operating in thescan mode (m/z 15–400, scan rate 1 scan/s). Peak identifica-tion was based on mass spectral interpretation and on com-parisons with the NIST 2.0 library. The identity of the methylthiocyanate elution peak was verified using the externalreference mentioned above, that confirmed both elution timeand ion fragmentation pattern. Coefficient of variation (c.v.)of integrated ion signals obtained for repeated samplingof methyl thiocyanate standard solution in water was 6%,reproducibility of methyl thiocyanate quantification in thehead space of PA cultures was significantly poorer, c.v. = 20%.
4 6 8 10 12 14 16
Time (min)
0
2
4
Tot
al io
n cu
rren
t (x1
07 )T
otal
ion
curr
ent (
x107 )
Tot
al io
n cu
rren
t (x1
07 )
Blank(liquid bacterial medium)
4 6 8 10 12 14 16
Time (min)
7.95
0
2
4
6
8 Methyl thiocyanate(external standard)
Met
hyl t
hioc
yana
te
Dim
ethy
ldis
ulfid
e
4 6 8 10 12 14 16Time (min)
0
2
4
6
8 7.94Pesudomonas Aeruginosa(strain 2480)
Dim
ethy
lsul
fide
Ace
tone
2-bu
tano
ne
2-pr
opan
ol
Met
hyl t
hioc
yana
te
m/z
73
7245
7446
47 5844 702832 7648
m/z
73
7274
45
46
47 58 757044 7648 605628 32
6056
a
b
c
Figure 1. GC/MS analyses of VOCs extracted using SPME from the headspace of (a) ablank sample (liquid MHB medium), (b) identical medium cultivated with a PA strainNIPH 2480 (an electron ionization mass spectrum obtained at elution time of 7.94 min isshown in the inset), and (c) of a reference sample of methyl thiocyanate. Note the absenceof this compound in the blank medium and also a good match of the elution time and ofthe fragmentation pattern between the bacterial culture and external standard.
SIFT-MS of methyl thiocyanate
wileyonlinelibrary.com/journal/rcmCopyright © 2011 John Wiley & Sons, Ltd.Rapid Commun. Mass Spectrom. 2011, 25, 2459–2467
2461
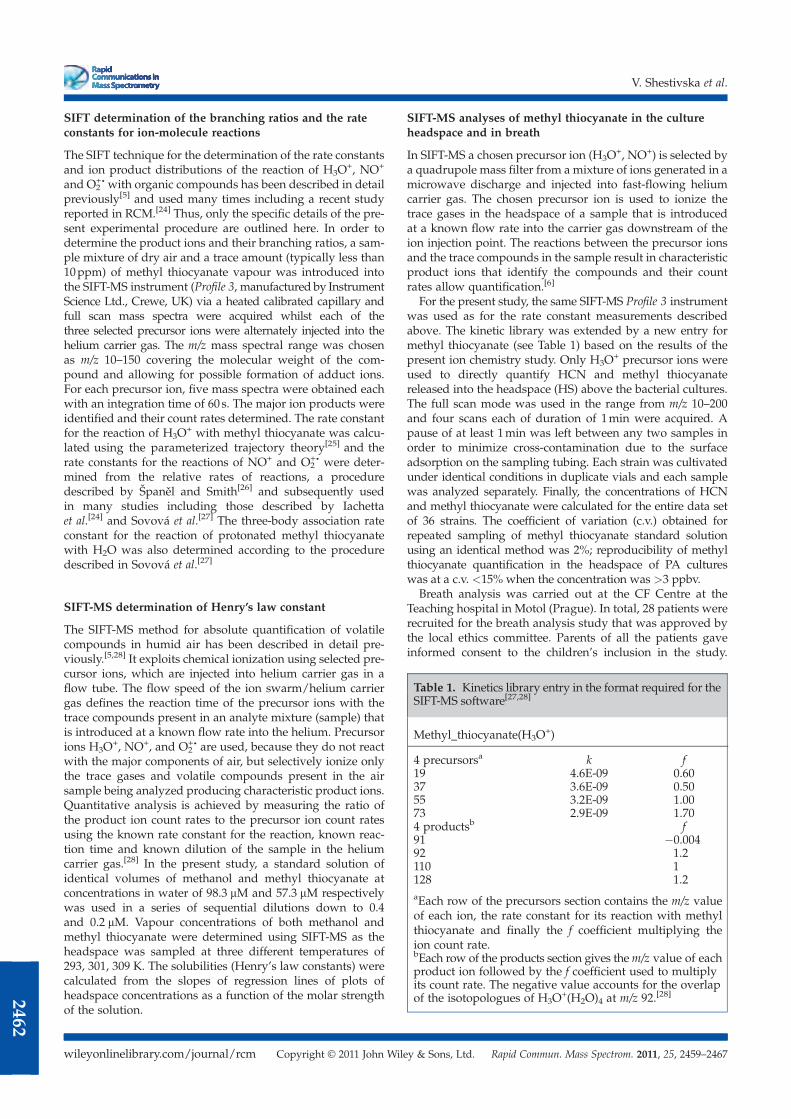
SIFT determination of the branching ratios and the rateconstants for ion-molecule reactions
The SIFT technique for the determination of the rate constantsand ion product distributions of the reaction of H3O
+, NO+
and O2+• with organic compounds has been described in detail
previously[5] and used many times including a recent studyreported in RCM.[24] Thus, only the specific details of the pre-sent experimental procedure are outlined here. In order todetermine the product ions and their branching ratios, a sam-ple mixture of dry air and a trace amount (typically less than10ppm) of methyl thiocyanate vapour was introduced intothe SIFT-MS instrument (Profile 3, manufactured by InstrumentScience Ltd., Crewe, UK) via a heated calibrated capillary andfull scan mass spectra were acquired whilst each of thethree selected precursor ions were alternately injected into thehelium carrier gas. The m/z mass spectral range was chosenas m/z 10–150 covering the molecular weight of the com-pound and allowing for possible formation of adduct ions.For each precursor ion, five mass spectra were obtained eachwith an integration time of 60 s. The major ion products wereidentified and their count rates determined. The rate constantfor the reaction of H3O
+ with methyl thiocyanate was calcu-lated using the parameterized trajectory theory[25] and therate constants for the reactions of NO+ and O2
+• were deter-mined from the relative rates of reactions, a proceduredescribed by Španěl and Smith[26] and subsequently usedin many studies including those described by Iachettaet al.[24] and Sovová et al.[27] The three-body association rateconstant for the reaction of protonated methyl thiocyanatewith H2O was also determined according to the proceduredescribed in Sovová et al.[27]
SIFT-MS determination of Henry’s law constant
The SIFT-MS method for absolute quantification of volatilecompounds in humid air has been described in detail pre-viously.[5,28] It exploits chemical ionization using selected pre-cursor ions, which are injected into helium carrier gas in aflow tube. The flow speed of the ion swarm/helium carriergas defines the reaction time of the precursor ions with thetrace compounds present in an analyte mixture (sample) thatis introduced at a known flow rate into the helium. Precursorions H3O
+, NO+, and O2+• are used, because they do not react
with the major components of air, but selectively ionize onlythe trace gases and volatile compounds present in the airsample being analyzed producing characteristic product ions.Quantitative analysis is achieved by measuring the ratio ofthe product ion count rates to the precursor ion count ratesusing the known rate constant for the reaction, known reac-tion time and known dilution of the sample in the heliumcarrier gas.[28] In the present study, a standard solution ofidentical volumes of methanol and methyl thiocyanate atconcentrations in water of 98.3 mM and 57.3 mM respectivelywas used in a series of sequential dilutions down to 0.4and 0.2 mM. Vapour concentrations of both methanol andmethyl thiocyanate were determined using SIFT-MS as theheadspace was sampled at three different temperatures of293, 301, 309 K. The solubilities (Henry’s law constants) werecalculated from the slopes of regression lines of plots ofheadspace concentrations as a function of the molar strengthof the solution.
SIFT-MS analyses of methyl thiocyanate in the cultureheadspace and in breath
In SIFT-MS a chosen precursor ion (H3O+, NO+) is selected by
a quadrupole mass filter from a mixture of ions generated in amicrowave discharge and injected into fast-flowing heliumcarrier gas. The chosen precursor ion is used to ionize thetrace gases in the headspace of a sample that is introducedat a known flow rate into the carrier gas downstream of theion injection point. The reactions between the precursor ionsand the trace compounds in the sample result in characteristicproduct ions that identify the compounds and their countrates allow quantification.[6]
For the present study, the same SIFT-MS Profile 3 instrumentwas used as for the rate constant measurements describedabove. The kinetic library was extended by a new entry formethyl thiocyanate (see Table 1) based on the results of thepresent ion chemistry study. Only H3O
+ precursor ions wereused to directly quantify HCN and methyl thiocyanatereleased into the headspace (HS) above the bacterial cultures.The full scan mode was used in the range from m/z 10–200and four scans each of duration of 1min were acquired. Apause of at least 1min was left between any two samples inorder to minimize cross-contamination due to the surfaceadsorption on the sampling tubing. Each strain was cultivatedunder identical conditions in duplicate vials and each samplewas analyzed separately. Finally, the concentrations of HCNand methyl thiocyanate were calculated for the entire data setof 36 strains. The coefficient of variation (c.v.) obtained forrepeated sampling of methyl thiocyanate standard solutionusing an identical method was 2%; reproducibility of methylthiocyanate quantification in the headspace of PA cultureswas at a c.v. <15% when the concentration was >3 ppbv.
Breath analysis was carried out at the CF Centre at theTeaching hospital in Motol (Prague). In total, 28 patients wererecruited for the breath analysis study that was approved bythe local ethics committee. Parents of all the patients gaveinformed consent to the children’s inclusion in the study.
Table 1. Kinetics library entry in the format required for theSIFT-MS software[27,28]
Methyl_thiocyanate(H3O+)
4 precursorsa k f19 4.6E-09 0.6037 3.6E-09 0.5055 3.2E-09 1.0073 2.9E-09 1.704 productsb f91 �0.00492 1.2110 1128 1.2aEach row of the precursors section contains the m/z valueof each ion, the rate constant for its reaction with methylthiocyanate and finally the f coefficient multiplying theion count rate.bEach row of the products section gives them/z value of eachproduct ion followed by the f coefficient used to multiplyits count rate. The negative value accounts for the overlapof the isotopologues of H3O
+(H2O)4 at m/z 92.[28]
V. Shestivska et al.
wileyonlinelibrary.com/journal/rcm Copyright © 2011 John Wiley & Sons, Ltd. Rapid Commun. Mass Spectrom. 2011, 25, 2459–2467
2462
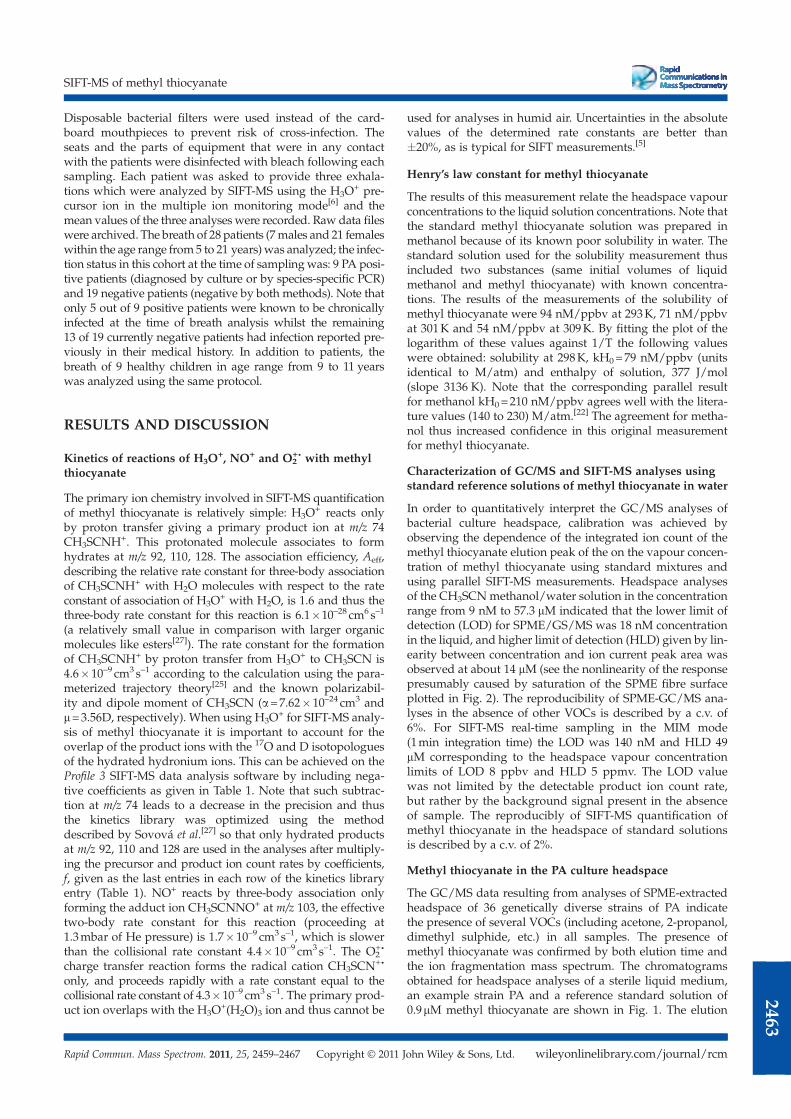
Disposable bacterial filters were used instead of the card-board mouthpieces to prevent risk of cross-infection. Theseats and the parts of equipment that were in any contactwith the patients were disinfected with bleach following eachsampling. Each patient was asked to provide three exhala-tions which were analyzed by SIFT-MS using the H3O
+ pre-cursor ion in the multiple ion monitoring mode[6] and themean values of the three analyses were recorded. Raw data fileswere archived. The breath of 28 patients (7males and 21 femaleswithin the age range from5 to 21 years) was analyzed; the infec-tion status in this cohort at the time of samplingwas: 9 PA posi-tive patients (diagnosed by culture or by species-specific PCR)and 19 negative patients (negative by both methods). Note thatonly 5 out of 9 positive patients were known to be chronicallyinfected at the time of breath analysis whilst the remaining13 of 19 currently negative patients had infection reported pre-viously in their medical history. In addition to patients, thebreath of 9 healthy children in age range from 9 to 11 yearswas analyzed using the same protocol.
RESULTS AND DISCUSSION
Kinetics of reactions of H3O+, NO+ and O2
+• with methylthiocyanate
The primary ion chemistry involved in SIFT-MS quantificationof methyl thiocyanate is relatively simple: H3O
+ reacts onlyby proton transfer giving a primary product ion at m/z 74CH3SCNH+. This protonated molecule associates to formhydrates at m/z 92, 110, 128. The association efficiency, Aeff,describing the relative rate constant for three-body associationof CH3SCNH+ with H2O molecules with respect to the rateconstant of association of H3O
+ with H2O, is 1.6 and thus thethree-body rate constant for this reaction is 6.1�10–28 cm6 s–1
(a relatively small value in comparison with larger organicmolecules like esters[27]). The rate constant for the formationof CH3SCNH+ by proton transfer from H3O
+ to CH3SCN is4.6�10–9 cm3 s–1 according to the calculation using the para-meterized trajectory theory[25] and the known polarizabil-ity and dipole moment of CH3SCN (a=7.62�10–24 cm3 andm=3.56D, respectively). When using H3O
+ for SIFT-MS analy-sis of methyl thiocyanate it is important to account for theoverlap of the product ions with the 17O and D isotopologuesof the hydrated hydronium ions. This can be achieved on theProfile 3 SIFT-MS data analysis software by including nega-tive coefficients as given in Table 1. Note that such subtrac-tion at m/z 74 leads to a decrease in the precision and thusthe kinetics library was optimized using the methoddescribed by Sovová et al.[27] so that only hydrated productsat m/z 92, 110 and 128 are used in the analyses after multiply-ing the precursor and product ion count rates by coefficients,f, given as the last entries in each row of the kinetics libraryentry (Table 1). NO+ reacts by three-body association onlyforming the adduct ion CH3SCNNO+ at m/z 103, the effectivetwo-body rate constant for this reaction (proceeding at1.3mbar of He pressure) is 1.7�10–9 cm3 s–1, which is slowerthan the collisional rate constant 4.4�10–9 cm3 s–1. The O2
+•
charge transfer reaction forms the radical cation CH3SCN+•
only, and proceeds rapidly with a rate constant equal to thecollisional rate constant of 4.3�10–9 cm3 s–1. The primary prod-uct ion overlaps with the H3O
+(H2O)3 ion and thus cannot be
used for analyses in humid air. Uncertainties in the absolutevalues of the determined rate constants are better than�20%, as is typical for SIFT measurements.[5]
Henry’s law constant for methyl thiocyanate
The results of this measurement relate the headspace vapourconcentrations to the liquid solution concentrations. Note thatthe standard methyl thiocyanate solution was prepared inmethanol because of its known poor solubility in water. Thestandard solution used for the solubility measurement thusincluded two substances (same initial volumes of liquidmethanol and methyl thiocyanate) with known concentra-tions. The results of the measurements of the solubility ofmethyl thiocyanate were 94 nM/ppbv at 293K, 71 nM/ppbvat 301K and 54 nM/ppbv at 309K. By fitting the plot of thelogarithm of these values against 1/T the following valueswere obtained: solubility at 298K, kH0=79 nM/ppbv (unitsidentical to M/atm) and enthalpy of solution, 377 J/mol(slope 3136 K). Note that the corresponding parallel resultfor methanol kH0=210 nM/ppbv agrees well with the litera-ture values (140 to 230) M/atm.[22] The agreement for metha-nol thus increased confidence in this original measurementfor methyl thiocyanate.
Characterization of GC/MS and SIFT-MS analyses usingstandard reference solutions of methyl thiocyanate in water
In order to quantitatively interpret the GC/MS analyses ofbacterial culture headspace, calibration was achieved byobserving the dependence of the integrated ion count of themethyl thiocyanate elution peak of the on the vapour concen-tration of methyl thiocyanate using standard mixtures andusing parallel SIFT-MS measurements. Headspace analysesof the CH3SCNmethanol/water solution in the concentrationrange from 9 nM to 57.3 mM indicated that the lower limit ofdetection (LOD) for SPME/GS/MS was 18 nM concentrationin the liquid, and higher limit of detection (HLD) given by lin-earity between concentration and ion current peak area wasobserved at about 14 mM (see the nonlinearity of the responsepresumably caused by saturation of the SPME fibre surfaceplotted in Fig. 2). The reproducibility of SPME-GC/MS ana-lyses in the absence of other VOCs is described by a c.v. of6%. For SIFT-MS real-time sampling in the MIM mode(1min integration time) the LOD was 140 nM and HLD 49mM corresponding to the headspace vapour concentrationlimits of LOD 8 ppbv and HLD 5 ppmv. The LOD valuewas not limited by the detectable product ion count rate,but rather by the background signal present in the absenceof sample. The reproducibly of SIFT-MS quantification ofmethyl thiocyanate in the headspace of standard solutionsis described by a c.v. of 2%.
Methyl thiocyanate in the PA culture headspace
The GC/MS data resulting from analyses of SPME-extractedheadspace of 36 genetically diverse strains of PA indicatethe presence of several VOCs (including acetone, 2-propanol,dimethyl sulphide, etc.) in all samples. The presence ofmethyl thiocyanate was confirmed by both elution time andthe ion fragmentation mass spectrum. The chromatogramsobtained for headspace analyses of a sterile liquid medium,an example strain PA and a reference standard solution of0.9mM methyl thiocyanate are shown in Fig. 1. The elution
SIFT-MS of methyl thiocyanate
wileyonlinelibrary.com/journal/rcmCopyright © 2011 John Wiley & Sons, Ltd.Rapid Commun. Mass Spectrom. 2011, 25, 2459–2467
2463
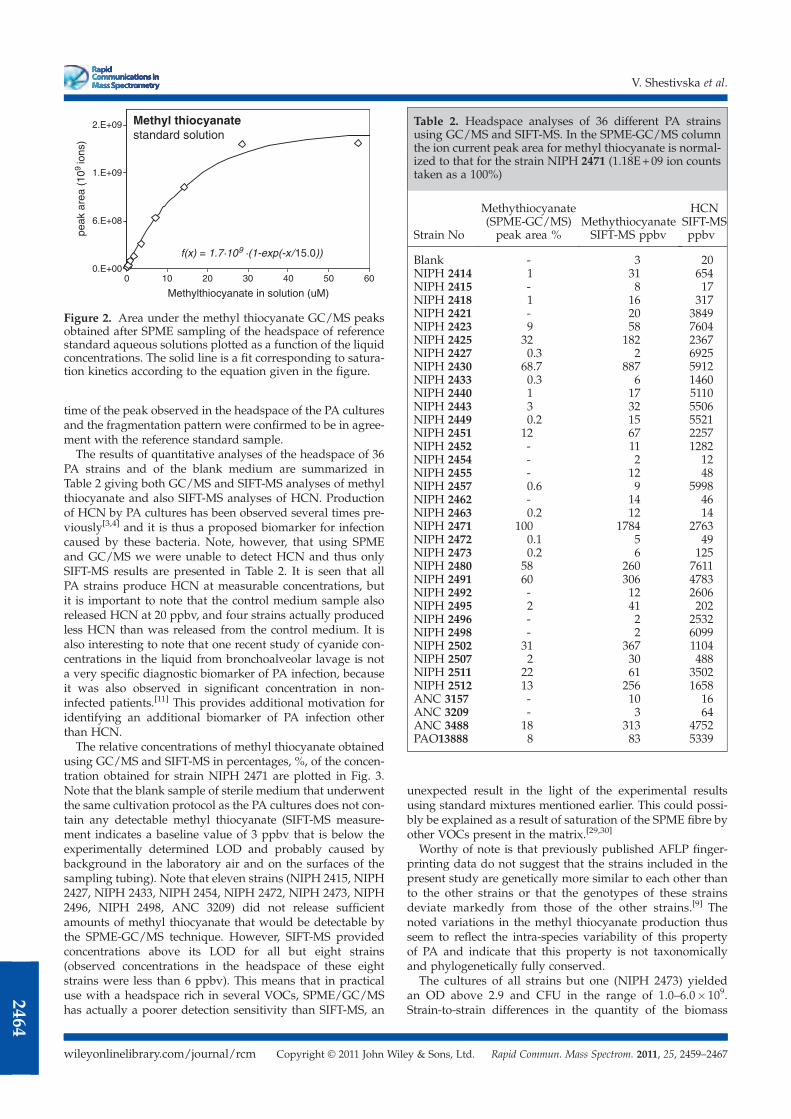
time of the peak observed in the headspace of the PA culturesand the fragmentation pattern were confirmed to be in agree-ment with the reference standard sample.The results of quantitative analyses of the headspace of 36
PA strains and of the blank medium are summarized inTable 2 giving both GC/MS and SIFT-MS analyses of methylthiocyanate and also SIFT-MS analyses of HCN. Productionof HCN by PA cultures has been observed several times pre-viously[3,4] and it is thus a proposed biomarker for infectioncaused by these bacteria. Note, however, that using SPMEand GC/MS we were unable to detect HCN and thus onlySIFT-MS results are presented in Table 2. It is seen that allPA strains produce HCN at measurable concentrations, butit is important to note that the control medium sample alsoreleased HCN at 20 ppbv, and four strains actually producedless HCN than was released from the control medium. It isalso interesting to note that one recent study of cyanide con-centrations in the liquid from bronchoalveolar lavage is nota very specific diagnostic biomarker of PA infection, becauseit was also observed in significant concentration in non-infected patients.[11] This provides additional motivation foridentifying an additional biomarker of PA infection otherthan HCN.The relative concentrations of methyl thiocyanate obtained
using GC/MS and SIFT-MS in percentages, %, of the concen-tration obtained for strain NIPH 2471 are plotted in Fig. 3.Note that the blank sample of sterile medium that underwentthe same cultivation protocol as the PA cultures does not con-tain any detectable methyl thiocyanate (SIFT-MS measure-ment indicates a baseline value of 3 ppbv that is below theexperimentally determined LOD and probably caused bybackground in the laboratory air and on the surfaces of thesampling tubing). Note that eleven strains (NIPH 2415, NIPH2427, NIPH 2433, NIPH 2454, NIPH 2472, NIPH 2473, NIPH2496, NIPH 2498, ANC 3209) did not release sufficientamounts of methyl thiocyanate that would be detectable bythe SPME-GC/MS technique. However, SIFT-MS providedconcentrations above its LOD for all but eight strains(observed concentrations in the headspace of these eightstrains were less than 6 ppbv). This means that in practicaluse with a headspace rich in several VOCs, SPME/GC/MShas actually a poorer detection sensitivity than SIFT-MS, an
unexpected result in the light of the experimental resultsusing standard mixtures mentioned earlier. This could possi-bly be explained as a result of saturation of the SPME fibre byother VOCs present in the matrix.[29,30]
Worthy of note is that previously published AFLP finger-printing data do not suggest that the strains included in thepresent study are genetically more similar to each other thanto the other strains or that the genotypes of these strainsdeviate markedly from those of the other strains.[9] Thenoted variations in the methyl thiocyanate production thusseem to reflect the intra-species variability of this propertyof PA and indicate that this property is not taxonomicallyand phylogenetically fully conserved.
The cultures of all strains but one (NIPH 2473) yieldedan OD above 2.9 and CFU in the range of 1.0–6.0�109.Strain-to-strain differences in the quantity of the biomass
Methylthiocyanate in solution (uM)
0.E+00
6.E+08
1.E+09
2.E+09
0 10 20 30 40 50 60
f(x
Methyl thiocyanatestandard solutionMethyl thiocyanate standard solution
peak
are
a (1
09 io
ns)
Figure 2. Area under the methyl thiocyanate GC/MS peaksobtained after SPME sampling of the headspace of referencestandard aqueous solutions plotted as a function of the liquidconcentrations. The solid line is a fit corresponding to satura-tion kinetics according to the equation given in the figure.
Table 2. Headspace analyses of 36 different PA strainsusing GC/MS and SIFT-MS. In the SPME-GC/MS columnthe ion current peak area for methyl thiocyanate is normal-ized to that for the strain NIPH 2471 (1.18E+09 ion countstaken as a 100%)
Strain No
Methythiocyanate(SPME-GC/MS)peak area %
MethythiocyanateSIFT-MS ppbv
HCNSIFT-MSppbv
Blank - 3 20NIPH 2414 1 31 654NIPH 2415 - 8 17NIPH 2418 1 16 317NIPH 2421 - 20 3849NIPH 2423 9 58 7604NIPH 2425 32 182 2367NIPH 2427 0.3 2 6925NIPH 2430 68.7 887 5912NIPH 2433 0.3 6 1460NIPH 2440 1 17 5110NIPH 2443 3 32 5506NIPH 2449 0.2 15 5521NIPH 2451 12 67 2257NIPH 2452 - 11 1282NIPH 2454 - 2 12NIPH 2455 - 12 48NIPH 2457 0.6 9 5998NIPH 2462 - 14 46NIPH 2463 0.2 12 14NIPH 2471 100 1784 2763NIPH 2472 0.1 5 49NIPH 2473 0.2 6 125NIPH 2480 58 260 7611NIPH 2491 60 306 4783NIPH 2492 - 12 2606NIPH 2495 2 41 202NIPH 2496 - 2 2532NIPH 2498 - 2 6099NIPH 2502 31 367 1104NIPH 2507 2 30 488NIPH 2511 22 61 3502NIPH 2512 13 256 1658ANC 3157 - 10 16ANC 3209 - 3 64ANC 3488 18 313 4752PAO13888 8 83 5339
V. Shestivska et al.
wileyonlinelibrary.com/journal/rcm Copyright © 2011 John Wiley & Sons, Ltd. Rapid Commun. Mass Spectrom. 2011, 25, 2459–2467
2464
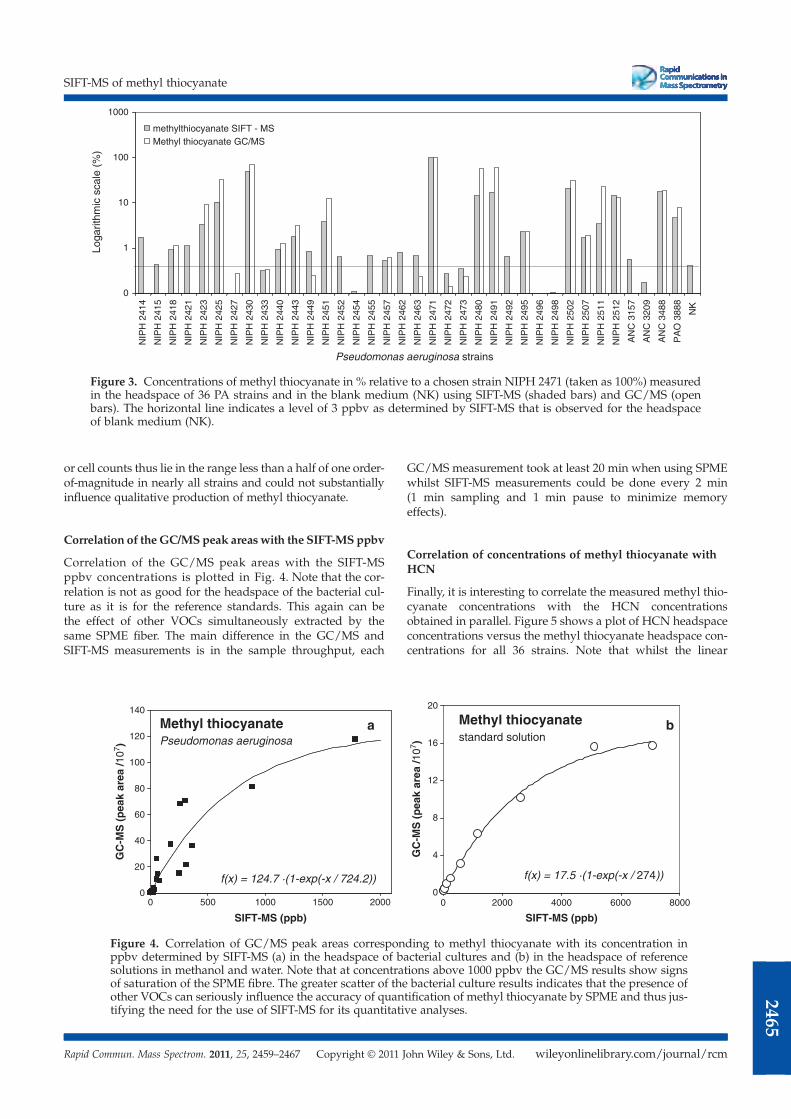
or cell counts thus lie in the range less than a half of one order-of-magnitude in nearly all strains and could not substantiallyinfluence qualitative production of methyl thiocyanate.
Correlation of the GC/MS peak areas with the SIFT-MS ppbv
Correlation of the GC/MS peak areas with the SIFT-MSppbv concentrations is plotted in Fig. 4. Note that the cor-relation is not as good for the headspace of the bacterial cul-ture as it is for the reference standards. This again can bethe effect of other VOCs simultaneously extracted by thesame SPME fiber. The main difference in the GC/MS andSIFT-MS measurements is in the sample throughput, each
GC/MS measurement took at least 20 min when using SPMEwhilst SIFT-MS measurements could be done every 2 min(1 min sampling and 1 min pause to minimize memoryeffects).
Correlation of concentrations of methyl thiocyanate withHCN
Finally, it is interesting to correlate the measured methyl thio-cyanate concentrations with the HCN concentrationsobtained in parallel. Figure 5 shows a plot of HCN headspaceconcentrations versus the methyl thiocyanate headspace con-centrations for all 36 strains. Note that whilst the linear
0
20
40
60
80
100
120
140
0 500 1000 1500 20000
4
8
12
16
20
0 2000 4000 6000 8000
Methyl thiocyanate Pseudomonas aeruginosa
Methyl thiocyanatestandard solution
a b
SIFT-MS (ppb)
GC
-MS
(p
eak
area
/107 )
SIFT-MS (ppb)
GC
-MS
(p
eak
area
/107 )
f(x) = 124.7 ·(1-exp(-x / 724.2)) f(x
Methyl thiocyanate standard solution
b
f(x) = 17.5 ·(1-exp(-x / 274))
Figure 4. Correlation of GC/MS peak areas corresponding to methyl thiocyanate with its concentration inppbv determined by SIFT-MS (a) in the headspace of bacterial cultures and (b) in the headspace of referencesolutions in methanol and water. Note that at concentrations above 1000 ppbv the GC/MS results show signsof saturation of the SPME fibre. The greater scatter of the bacterial culture results indicates that the presence ofother VOCs can seriously influence the accuracy of quantification of methyl thiocyanate by SPME and thus jus-tifying the need for the use of SIFT-MS for its quantitative analyses.
Pseudomonas aeruginosa strains
Loga
rithm
ic s
cale
(%
)
0
1
10
100
1000
NIP
H 2
414
NIP
H 2
415
NIP
H 2
418
NIP
H 2
421
NIP
H 2
423
NIP
H 2
425
NIP
H 2
427
NIP
H 2
430
NIP
H 2
433
NIP
H 2
440
NIP
H 2
443
NIP
H 2
449
NIP
H 2
451
NIP
H 2
452
NIP
H 2
454
NIP
H 2
455
NIP
H 2
457
NIP
H 2
462
NIP
H 2
463
NIP
H 2
471
NIP
H 2
472
NIP
H 2
473
NIP
H 2
480
NIP
H 2
491
NIP
H 2
492
NIP
H 2
495
NIP
H 2
496
NIP
H 2
498
NIP
H 2
502
NIP
H 2
507
NIP
H 2
511
NIP
H 2
512
AN
C 3
157
AN
C 3
209
AN
C 3
488
PA
O 3
888
NK
methylthiocyanate SIFT-MSMethyl thiocyanate GC/MS methylthiocyanate SIFT - MSMethyl thiocyanate GC/MS
Figure 3. Concentrations of methyl thiocyanate in % relative to a chosen strain NIPH 2471 (taken as 100%) measuredin the headspace of 36 PA strains and in the blank medium (NK) using SIFT-MS (shaded bars) and GC/MS (openbars). The horizontal line indicates a level of 3 ppbv as determined by SIFT-MS that is observed for the headspaceof blank medium (NK).
SIFT-MS of methyl thiocyanate
wileyonlinelibrary.com/journal/rcmCopyright © 2011 John Wiley & Sons, Ltd.Rapid Commun. Mass Spectrom. 2011, 25, 2459–2467
2465
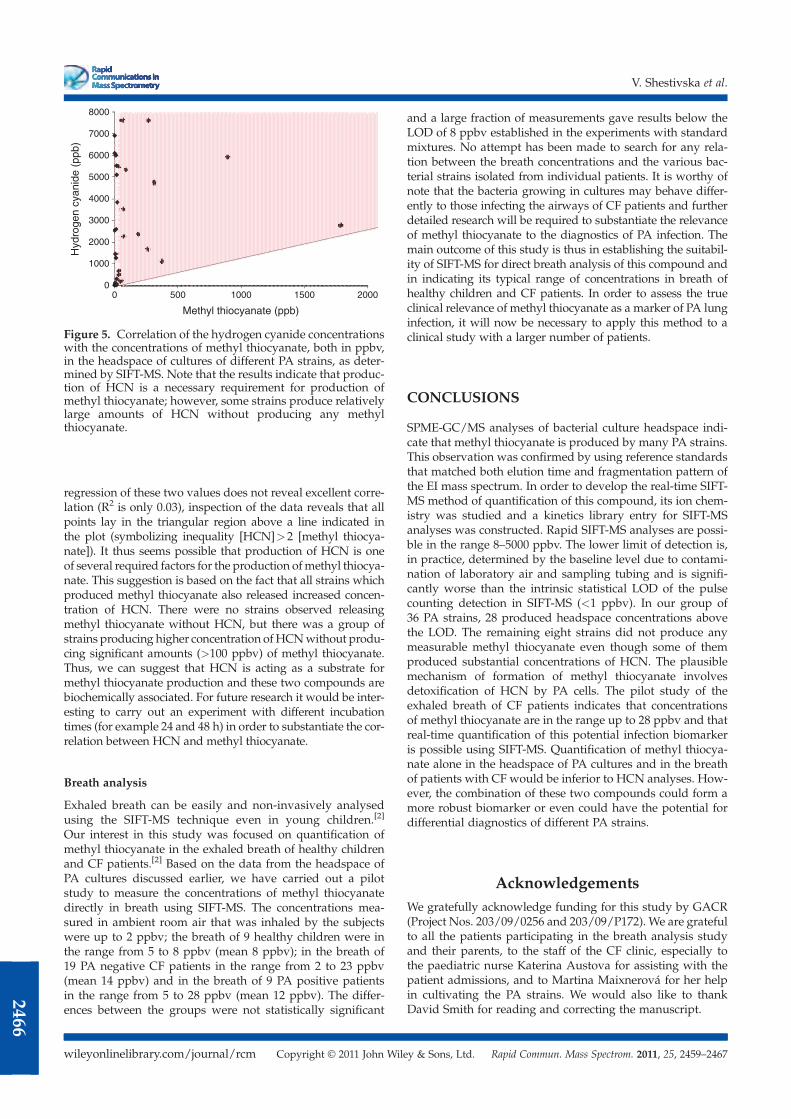
regression of these two values does not reveal excellent corre-lation (R2 is only 0.03), inspection of the data reveals that allpoints lay in the triangular region above a line indicated inthe plot (symbolizing inequality [HCN]>2 [methyl thiocya-nate]). It thus seems possible that production of HCN is oneof several required factors for the production ofmethyl thiocya-nate. This suggestion is based on the fact that all strains whichproduced methyl thiocyanate also released increased concen-tration of HCN. There were no strains observed releasingmethyl thiocyanate without HCN, but there was a group ofstrains producing higher concentration ofHCNwithout produ-cing significant amounts (>100 ppbv) of methyl thiocyanate.Thus, we can suggest that HCN is acting as a substrate formethyl thiocyanate production and these two compounds arebiochemically associated. For future research it would be inter-esting to carry out an experiment with different incubationtimes (for example 24 and 48 h) in order to substantiate the cor-relation between HCN and methyl thiocyanate.
Breath analysis
Exhaled breath can be easily and non-invasively analysedusing the SIFT-MS technique even in young children.[2]
Our interest in this study was focused on quantification ofmethyl thiocyanate in the exhaled breath of healthy childrenand CF patients.[2] Based on the data from the headspace ofPA cultures discussed earlier, we have carried out a pilotstudy to measure the concentrations of methyl thiocyanatedirectly in breath using SIFT-MS. The concentrations mea-sured in ambient room air that was inhaled by the subjectswere up to 2 ppbv; the breath of 9 healthy children were inthe range from 5 to 8 ppbv (mean 8 ppbv); in the breath of19 PA negative CF patients in the range from 2 to 23 ppbv(mean 14 ppbv) and in the breath of 9 PA positive patientsin the range from 5 to 28 ppbv (mean 12 ppbv). The differ-ences between the groups were not statistically significant
and a large fraction of measurements gave results below theLOD of 8 ppbv established in the experiments with standardmixtures. No attempt has been made to search for any rela-tion between the breath concentrations and the various bac-terial strains isolated from individual patients. It is worthy ofnote that the bacteria growing in cultures may behave differ-ently to those infecting the airways of CF patients and furtherdetailed research will be required to substantiate the relevanceof methyl thiocyanate to the diagnostics of PA infection. Themain outcome of this study is thus in establishing the suitabil-ity of SIFT-MS for direct breath analysis of this compound andin indicating its typical range of concentrations in breath ofhealthy children and CF patients. In order to assess the trueclinical relevance of methyl thiocyanate as a marker of PA lunginfection, it will now be necessary to apply this method to aclinical study with a larger number of patients.
CONCLUSIONS
SPME-GC/MS analyses of bacterial culture headspace indi-cate that methyl thiocyanate is produced by many PA strains.This observation was confirmed by using reference standardsthat matched both elution time and fragmentation pattern ofthe EI mass spectrum. In order to develop the real-time SIFT-MS method of quantification of this compound, its ion chem-istry was studied and a kinetics library entry for SIFT-MSanalyses was constructed. Rapid SIFT-MS analyses are possi-ble in the range 8–5000 ppbv. The lower limit of detection is,in practice, determined by the baseline level due to contami-nation of laboratory air and sampling tubing and is signifi-cantly worse than the intrinsic statistical LOD of the pulsecounting detection in SIFT-MS (<1 ppbv). In our group of36 PA strains, 28 produced headspace concentrations abovethe LOD. The remaining eight strains did not produce anymeasurable methyl thiocyanate even though some of themproduced substantial concentrations of HCN. The plausiblemechanism of formation of methyl thiocyanate involvesdetoxification of HCN by PA cells. The pilot study of theexhaled breath of CF patients indicates that concentrationsof methyl thiocyanate are in the range up to 28 ppbv and thatreal-time quantification of this potential infection biomarkeris possible using SIFT-MS. Quantification of methyl thiocya-nate alone in the headspace of PA cultures and in the breathof patients with CF would be inferior to HCN analyses. How-ever, the combination of these two compounds could form amore robust biomarker or even could have the potential fordifferential diagnostics of different PA strains.
AcknowledgementsWe gratefully acknowledge funding for this study by GACR(Project Nos. 203/09/0256 and 203/09/P172). We are gratefulto all the patients participating in the breath analysis studyand their parents, to the staff of the CF clinic, especially tothe paediatric nurse Katerina Austova for assisting with thepatient admissions, and to Martina Maixnerová for her helpin cultivating the PA strains. We would also like to thankDavid Smith for reading and correcting the manuscript.
0
1000
2000
3000
4000
5000
6000
7000
8000
0 500 1000 1500 2000
Methyl thiocyanate (ppb)
Hyd
roge
n cy
anid
e (p
pb)
Figure 5. Correlation of the hydrogen cyanide concentrationswith the concentrations of methyl thiocyanate, both in ppbv,in the headspace of cultures of different PA strains, as deter-mined by SIFT-MS. Note that the results indicate that produc-tion of HCN is a necessary requirement for production ofmethyl thiocyanate; however, some strains produce relativelylarge amounts of HCN without producing any methylthiocyanate.
V. Shestivska et al.
wileyonlinelibrary.com/journal/rcm Copyright © 2011 John Wiley & Sons, Ltd. Rapid Commun. Mass Spectrom. 2011, 25, 2459–2467
2466
REFERENCES
[1] J. Julak, E. Stranska, V. Rosova, H. Geppert, P. Španěl,D. Smith. J. Microbiol. Methods 2006, 65, 76.
[2] B. Enderby, D. Smith, W. Carroll, W. Lenney. Pediat. Pulmonol.2009, 44, 142.
[3] W. Carroll, W. Lenney, T. S. Wang, P. Španěl, A. Alcock,D. Smith. Pediat. Pulmonol. 2005, 39, 452.
[4] F. J. Gilchrist, A. Alcock, J. Belcher, M. Brady, A. Jones,D. Smith, P. Španel, K. Webb, W. Lenney. Eur. Respiratory J.2011, 37: E pub ahead of print.
[5] D. Smith, P. Španěl. Mass Spectrom. Rev. 2005, 24, 661.[6] P. Španěl, D. Smith. Mass Spectrom. Rev. 2011, 30, 236.[7] K. Stamyr, O. Vaittinen, J. Jaakola, J. Guss, M. Metsala,
G. Johanson, L. Halonen. Biomarkers 2009, 14, 285.[8] J. P. Pirnay, D.DeVos, C. Cochez, F. Bilocq, A. Vanderkelen, M.
Zizi, B. Ghysels, P. Cornelis. Environ. Microbiol. 2002, 4, 898.[9] S. Vosahlikova, P. Drevinek, O. Cinek, P. Pohunek,
M. Maixnerova, P. Urbaskova, T. J. K. van den Reijden,L. Dijkshoorn, A. Nemec. Res. Microbiol. 2007, 158, 324.
[10] B. Ryall, J. C. Davies, R. Wilson, A. Shoemark, H. D.Williams. Eur. Respiratory J. 2008, 32, 740.
[11] M. D. Stutz, C. L. Gangell, L. J. Berry, L. W. Garratt, B. Sheil,P. D. Sly, C. F. Arest. Eur. Respiratory J. 2011, 37, 553.
[12] C. Blumer, D. Haas. Arch. Microbiol. 2000, 173, 170.[13] G. Pessi, D. Haas. J. Bacteriol. 2000, 182, 6940.[14] D. Worlitzsch, R. Tarran, M. Ulrich, U. Schwab, A. Cekici,
K. C. Meyer, P. Birrer, G. Bellon, J. Berger, T. Weiss,K. Botzenhart, J. R. Yankaskas, S. Randell, R. C. Boucher,G. Doring. J. Clin. Invest. 2002, 109, 317.
[15] P. A. Castric. Can. J. Microbiol. 1983, 29, 1344.[16] R. Cipollone, M. G. Bigotti, E. Frangipani, P. Ascenzi,
P. Visca. Biochem. Biophys. Res. Commun. 2004, 325, 85.[17] S. E. Stein. Mass spectra, in NIST Chemistry WebBook, NIST
Standard Reference Database Number 69, (Eds: J. J. Linstrom,W. G. Mallard), National Institute of Standards andTechnology: Gaithersburg, 2010.
[18] Y. Nagatoshi, T. Nakamura. J. Biol. Chem. 2009, 284, 19301.[19] A. Pysanenko, P. Spanel, D. Smith. J. Breath Res. 2008, 2,
046004.[20] R. A. Allardyce, V. S. Langford, A. L. Hill, D. R. Murdoch. J.
Microbiol. Methods 2006, 65, 361.[21] J.-Z. Dong, S. DeBusk. Chromatographia 2010, 71, 259.[22] R. Sander. Compilation of Henry’s Law Constants for Inorganic
and Organic Species of Potential Importance in EnvironmentalChemistry. Max-Planck Institute of Chemistry, Air ChemistryDept, 1999.
[23] A. Nemec, L. Krizova, M. Maixnerova, M. Musilek. Res.Microbiol. 2010, 161, 234.
[24] L. Iachetta, L. Malek, B. M. Ross. Rapid Commun. Mass Spec-trom. 2010, 24, 815.
[25] T. Su, W. J. Chesnavich. J. Chem. Phys. 1982, 76, 5183.[26] P. Španěl, D. Smith. Int. J. Mass Spectrom. 1997, 167, 375.[27] K. Sovová, K. Dryahina, P. Španěl. Int. J. Mass Spectrom.
2011, 300, 31.[28] P. Španěl, K. Dryahina, D. Smith. Int. J. Mass Spectrom. 2006,
249, 230.[29] M. Chai, J. Pawliszyn. Environ. Sci. Technol. 1995, 29,
693.[30] P. A. Martos, J. Pawliszyn. Anal. Chem. 1997, 69, 206.
SIFT-MS of methyl thiocyanate
wileyonlinelibrary.com/journal/rcmCopyright © 2011 John Wiley & Sons, Ltd.Rapid Commun. Mass Spectrom. 2011, 25, 2459–2467
2467

Appendix E, Sovová et al. Analyst 138 (2013) 4795
Real time monitoring of population dynamics in concurrent bacterial
growth using SIFT-MS quantification of volatile metabolites
Kristýna Sovováa,b, Jaroslav eplc, Anton Markošc, Patrik Špan la,*
aJ. Heyrovský Institute of Physical Chemistry of Science, Academy of Science of the
Czech Republic Dolejškova 3, 18223 Prague 8, Czech Republic bDepartment of Physical and Macromolecular Chemistry, Faculty of Science, Charles
University, Albertov 2030, 128 40 Prague 2, Czech Republic cDepartment of philosophy and history of science, Faculty of Science, Charles
University in Prague, Vini ná 7, 128 44 Prague 2, Czech Republic

Real time monitoring of population dynamics inconcurrent bacterial growth using SIFT-MSquantification of volatile metabolites
Kristyna Sovova,ab Jaroslav Cepl,c Anton Markosc and Patrik Spanel*a
Population dynamics of three different bacterial species, Serratia rubidaea (R), Serratia marcescens (F) and
Escherichia coli (Ec), growing in single or mixed populations in liquid media, was monitored by real time
headspace quantification of volatile compounds using selected ion flow tube mass spectrometry,
SIFT-MS. The three bacterial species interact with each other in a competitive fashion in a way similar to
the game “rock-paper-scissors” (R-Ec-F). The concentrations of volatile metabolites (ammonia, ethanol,
acetaldehyde, propanol, acetoin, acetone and acetic acid) were measured in the headspace of the
individual species and of their mixtures continuously for 24 hour periods. The results demonstrate that
dynamics in bacterial cultures can be monitored using SIFT-MS in real time.
Introduction
Bacterial behaviour involves a complex of interactions that allowthe individual cells to sense and affect their abiotic and bioticsurroundings. This leads to different forms of interactionresembling social behaviour ranging from synergism (coopera-tion) to antagonism (competition).1–3 Interactions betweendifferent bacterial species can be studied on solid media,4,5
where the bacterial cells can build different types ofmulticellularstructures: monoclonal colonies or multicellular consortia –
“chimeras”.6 Alternatively, different species of bacteria can livetogether in a liquid medium and such a suspension representsyet another type of interacting system. The population dynamicsof competing/co-habiting species in liquid cultures can becurrently observed mainly by taking sample aliquots at selectedintervals, inoculating them on the agar plate, culturing for axed time and nally counting the individual surviving colonyforming units (CFUs). The aim of our present study is to inves-tigate how volatile metabolites could be used to monitor thegrowth of competing bacterial species in real time without aneed to interfere with sampling and culturing.
Bacterialmetabolism is known to lead to production of highlydiverse multiple volatile organic compounds (VOCs).7–9 It wasrecently suggested that bacteria use airborne volatile organiccompounds to sense other bacteria and to change master
regulatory gene activity to adapt.10 These metabolites arereleased most vigorously during the proliferation phase of theculture and vary according to the environmental conditions (e.g.composition of media)11 and are specic for bacterial species. Ofparticular interest is VOC production by pathogenic bacteria.The knowledge of such VOC biomarkers could allow earlydetection of bacterial infection by non-invasive methods forclinical diagnosis.8,11–17 In addition, microbial VOC emissionsmay also help in distinguishing between different microorgan-isms.18 Our hypothesis is that concentrations of VOCs provideinformation about temporal changes of cell numbers of differentclones inhabiting the same niche, like chimeric colonies, bio-lms ormixed suspensions. To test this hypothesis we have usedselected ion ow tubemass spectrometry, SIFT-MS,19 to study anin vitro model of population dynamics of mixed suspensions ofthree bacterial species belonging to the enterobacteria family,Serratia rubidaea (R – red smooth colonies), Serratia marcescens(F – fountain shaped colonies) and Escherichia coli (Ec). Thisbacterial system is well dened and was studied previously;4–6 itwas also shown that bacteria can display different multicellularforms and their structure and appearance depend on factors likenutrients or the presence/absence of neighbours.4 Theirconcurrent growth in a binary or even ternary system like thiscan be seen as an analogue of the well known game “rock-paper-scissors” previously studied in the example of three populationsof Escherichia coli, and provides mechanisms that maintainbiodiversity.20 In this game each item is superior to one other,and inferior to the third one, thus forming heterarchy: rockcrushes scissors, scissors cut paper, and paper covers rock.21 Theinteractions of our three species on agar plates were previouslyobserved as follows:6 The R colony usually overgrows its Fpartner, chimeric planting of R and F results in a chimeric colonywhich looks like R with traces of F in the centre. The Ec colony
aJ. Heyrovsky Institute of Physical Chemistry of Science, Academy of Science of the
Czech Republic Dolejskova 3, 18223 Prague 8, Czech Republic. E-mail: patrik.
[email protected] of Physical and Macromolecular Chemistry, Faculty of Science, Charles
University, Albertov 2030, 128 40 Prague 2, Czech RepubliccDepartment of philosophy and history of science, Faculty of Science, Charles
University in Prague, Vinicna 7, 128 44 Prague 2, Czech Republic
Cite this: Analyst, 2013, 138, 4795
Received 8th March 2013Accepted 24th May 2013
DOI: 10.1039/c3an00472d
www.rsc.org/analyst
This journal is ª The Royal Society of Chemistry 2013 Analyst, 2013, 138, 4795–4801 | 4795
Analyst
PAPER
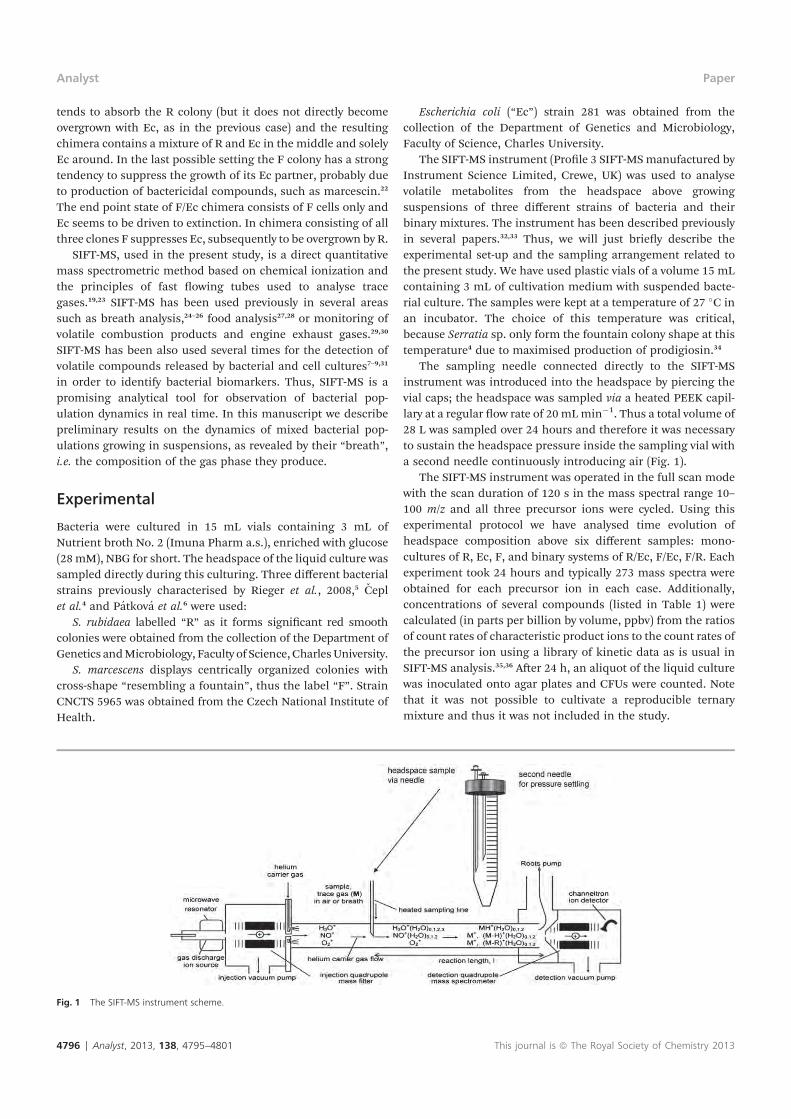
tends to absorb the R colony (but it does not directly becomeovergrown with Ec, as in the previous case) and the resultingchimera contains a mixture of R and Ec in the middle and solelyEc around. In the last possible setting the F colony has a strongtendency to suppress the growth of its Ec partner, probably dueto production of bactericidal compounds, such as marcescin.22
The end point state of F/Ec chimera consists of F cells only andEc seems to be driven to extinction. In chimera consisting of allthree clones F suppresses Ec, subsequently to be overgrown by R.
SIFT-MS, used in the present study, is a direct quantitativemass spectrometric method based on chemical ionization andthe principles of fast owing tubes used to analyse tracegases.19,23 SIFT-MS has been used previously in several areassuch as breath analysis,24–26 food analysis27,28 or monitoring ofvolatile combustion products and engine exhaust gases.29,30
SIFT-MS has been also used several times for the detection ofvolatile compounds released by bacterial and cell cultures7–9,31
in order to identify bacterial biomarkers. Thus, SIFT-MS is apromising analytical tool for observation of bacterial pop-ulation dynamics in real time. In this manuscript we describepreliminary results on the dynamics of mixed bacterial pop-ulations growing in suspensions, as revealed by their “breath”,i.e. the composition of the gas phase they produce.
Experimental
Bacteria were cultured in 15 mL vials containing 3 mL ofNutrient broth No. 2 (Imuna Pharm a.s.), enriched with glucose(28 mM), NBG for short. The headspace of the liquid culture wassampled directly during this culturing. Three different bacterialstrains previously characterised by Rieger et al., 2008,5 Ceplet al.4 and Patkova et al.6 were used:
S. rubidaea labelled “R” as it forms signicant red smoothcolonies were obtained from the collection of the Department ofGenetics andMicrobiology, Faculty of Science, CharlesUniversity.
S. marcescens displays centrically organized colonies withcross-shape “resembling a fountain”, thus the label “F”. StrainCNCTS 5965 was obtained from the Czech National Institute ofHealth.
Escherichia coli (“Ec”) strain 281 was obtained from thecollection of the Department of Genetics and Microbiology,Faculty of Science, Charles University.
The SIFT-MS instrument (Prole 3 SIFT-MSmanufactured byInstrument Science Limited, Crewe, UK) was used to analysevolatile metabolites from the headspace above growingsuspensions of three different strains of bacteria and theirbinary mixtures. The instrument has been described previouslyin several papers.32,33 Thus, we will just briey describe theexperimental set-up and the sampling arrangement related tothe present study. We have used plastic vials of a volume 15 mLcontaining 3 mL of cultivation medium with suspended bacte-rial culture. The samples were kept at a temperature of 27 �C inan incubator. The choice of this temperature was critical,because Serratia sp. only form the fountain colony shape at thistemperature4 due to maximised production of prodigiosin.34
The sampling needle connected directly to the SIFT-MSinstrument was introduced into the headspace by piercing thevial caps; the headspace was sampled via a heated PEEK capil-lary at a regular ow rate of 20 mLmin�1. Thus a total volume of28 L was sampled over 24 hours and therefore it was necessaryto sustain the headspace pressure inside the sampling vial witha second needle continuously introducing air (Fig. 1).
The SIFT-MS instrument was operated in the full scan modewith the scan duration of 120 s in the mass spectral range 10–100 m/z and all three precursor ions were cycled. Using thisexperimental protocol we have analysed time evolution ofheadspace composition above six different samples: mono-cultures of R, Ec, F, and binary systems of R/Ec, F/Ec, F/R. Eachexperiment took 24 hours and typically 273 mass spectra wereobtained for each precursor ion in each case. Additionally,concentrations of several compounds (listed in Table 1) werecalculated (in parts per billion by volume, ppbv) from the ratiosof count rates of characteristic product ions to the count rates ofthe precursor ion using a library of kinetic data as is usual inSIFT-MS analysis.35,36 Aer 24 h, an aliquot of the liquid culturewas inoculated onto agar plates and CFUs were counted. Notethat it was not possible to cultivate a reproducible ternarymixture and thus it was not included in the study.
Fig. 1 The SIFT-MS instrument scheme.
4796 | Analyst, 2013, 138, 4795–4801 This journal is ª The Royal Society of Chemistry 2013
Analyst Paper
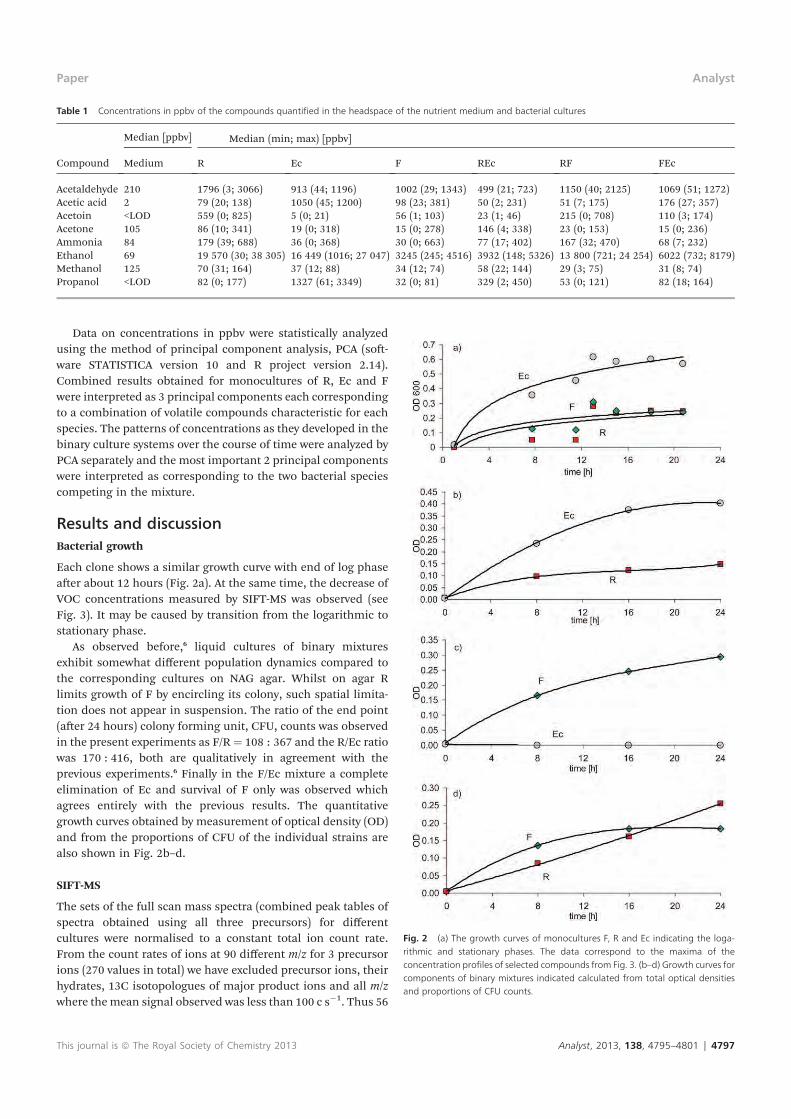
Data on concentrations in ppbv were statistically analyzedusing the method of principal component analysis, PCA (so-ware STATISTICA version 10 and R project version 2.14).Combined results obtained for monocultures of R, Ec and Fwere interpreted as 3 principal components each correspondingto a combination of volatile compounds characteristic for eachspecies. The patterns of concentrations as they developed in thebinary culture systems over the course of time were analyzed byPCA separately and the most important 2 principal componentswere interpreted as corresponding to the two bacterial speciescompeting in the mixture.
Results and discussionBacterial growth
Each clone shows a similar growth curve with end of log phaseaer about 12 hours (Fig. 2a). At the same time, the decrease ofVOC concentrations measured by SIFT-MS was observed (seeFig. 3). It may be caused by transition from the logarithmic tostationary phase.
As observed before,6 liquid cultures of binary mixturesexhibit somewhat different population dynamics compared tothe corresponding cultures on NAG agar. Whilst on agar Rlimits growth of F by encircling its colony, such spatial limita-tion does not appear in suspension. The ratio of the end point(aer 24 hours) colony forming unit, CFU, counts was observedin the present experiments as F/R¼ 108 : 367 and the R/Ec ratiowas 170 : 416, both are qualitatively in agreement with theprevious experiments.6 Finally in the F/Ec mixture a completeelimination of Ec and survival of F only was observed whichagrees entirely with the previous results. The quantitativegrowth curves obtained by measurement of optical density (OD)and from the proportions of CFU of the individual strains arealso shown in Fig. 2b–d.
SIFT-MS
The sets of the full scan mass spectra (combined peak tables ofspectra obtained using all three precursors) for differentcultures were normalised to a constant total ion count rate.From the count rates of ions at 90 different m/z for 3 precursorions (270 values in total) we have excluded precursor ions, theirhydrates, 13C isotopologues of major product ions and all m/zwhere themean signal observed was less than 100 c s�1. Thus 56
Table 1 Concentrations in ppbv of the compounds quantified in the headspace of the nutrient medium and bacterial cultures
Compound
Median [ppbv] Median (min; max) [ppbv]
Medium R Ec F REc RF FEc
Acetaldehyde 210 1796 (3; 3066) 913 (44; 1196) 1002 (29; 1343) 499 (21; 723) 1150 (40; 2125) 1069 (51; 1272)Acetic acid 2 79 (20; 138) 1050 (45; 1200) 98 (23; 381) 50 (2; 231) 51 (7; 175) 176 (27; 357)Acetoin <LOD 559 (0; 825) 5 (0; 21) 56 (1; 103) 23 (1; 46) 215 (0; 708) 110 (3; 174)Acetone 105 86 (10; 341) 19 (0; 318) 15 (0; 278) 146 (4; 338) 23 (0; 153) 15 (0; 236)Ammonia 84 179 (39; 688) 36 (0; 368) 30 (0; 663) 77 (17; 402) 167 (32; 470) 68 (7; 232)Ethanol 69 19 570 (30; 38 305) 16 449 (1016; 27 047) 3245 (245; 4516) 3932 (148; 5326) 13 800 (721; 24 254) 6022 (732; 8179)Methanol 125 70 (31; 164) 37 (12; 88) 34 (12; 74) 58 (22; 144) 29 (3; 75) 31 (8; 74)Propanol <LOD 82 (0; 177) 1327 (61; 3349) 32 (0; 81) 329 (2; 450) 53 (0; 121) 82 (18; 164)
Fig. 2 (a) The growth curves of monocultures F, R and Ec indicating the loga-rithmic and stationary phases. The data correspond to the maxima of theconcentration profiles of selected compounds from Fig. 3. (b–d) Growth curves forcomponents of binary mixtures indicated calculated from total optical densitiesand proportions of CFU counts.
This journal is ª The Royal Society of Chemistry 2013 Analyst, 2013, 138, 4795–4801 | 4797
Paper Analyst
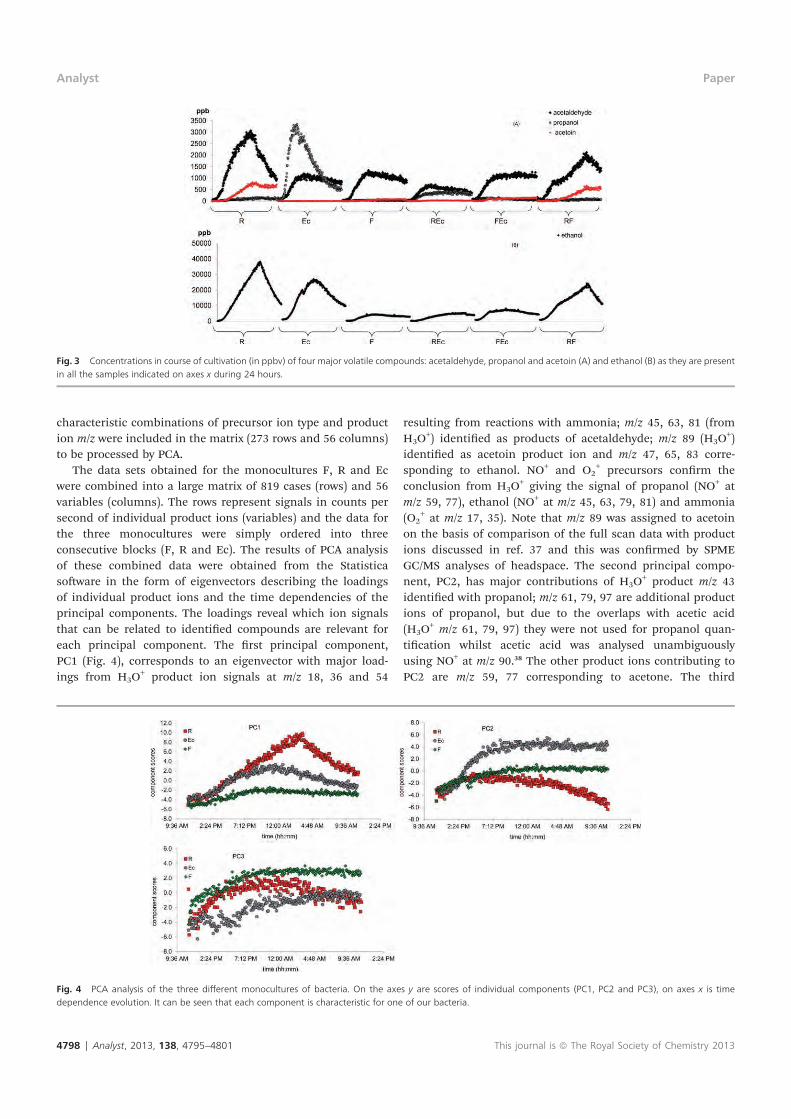
characteristic combinations of precursor ion type and production m/z were included in the matrix (273 rows and 56 columns)to be processed by PCA.
The data sets obtained for the monocultures F, R and Ecwere combined into a large matrix of 819 cases (rows) and 56variables (columns). The rows represent signals in counts persecond of individual product ions (variables) and the data forthe three monocultures were simply ordered into threeconsecutive blocks (F, R and Ec). The results of PCA analysisof these combined data were obtained from the Statisticasoware in the form of eigenvectors describing the loadingsof individual product ions and the time dependencies of theprincipal components. The loadings reveal which ion signalsthat can be related to identied compounds are relevant foreach principal component. The rst principal component,PC1 (Fig. 4), corresponds to an eigenvector with major load-ings from H3O
+ product ion signals at m/z 18, 36 and 54
resulting from reactions with ammonia; m/z 45, 63, 81 (fromH3O
+) identied as products of acetaldehyde; m/z 89 (H3O+)
identied as acetoin product ion and m/z 47, 65, 83 corre-sponding to ethanol. NO+ and O2
+ precursors conrm theconclusion from H3O
+ giving the signal of propanol (NO+ atm/z 59, 77), ethanol (NO+ at m/z 45, 63, 79, 81) and ammonia(O2
+ at m/z 17, 35). Note that m/z 89 was assigned to acetoinon the basis of comparison of the full scan data with productions discussed in ref. 37 and this was conrmed by SPMEGC/MS analyses of headspace. The second principal compo-nent, PC2, has major contributions of H3O
+ product m/z 43identied with propanol; m/z 61, 79, 97 are additional productions of propanol, but due to the overlaps with acetic acid(H3O
+ m/z 61, 79, 97) they were not used for propanol quan-tication whilst acetic acid was analysed unambiguouslyusing NO+ at m/z 90.38 The other product ions contributing toPC2 are m/z 59, 77 corresponding to acetone. The third
Fig. 3 Concentrations in course of cultivation (in ppbv) of four major volatile compounds: acetaldehyde, propanol and acetoin (A) and ethanol (B) as they are presentin all the samples indicated on axes x during 24 hours.
Fig. 4 PCA analysis of the three different monocultures of bacteria. On the axes y are scores of individual components (PC1, PC2 and PC3), on axes x is timedependence evolution. It can be seen that each component is characteristic for one of our bacteria.
4798 | Analyst, 2013, 138, 4795–4801 This journal is ª The Royal Society of Chemistry 2013
Analyst Paper
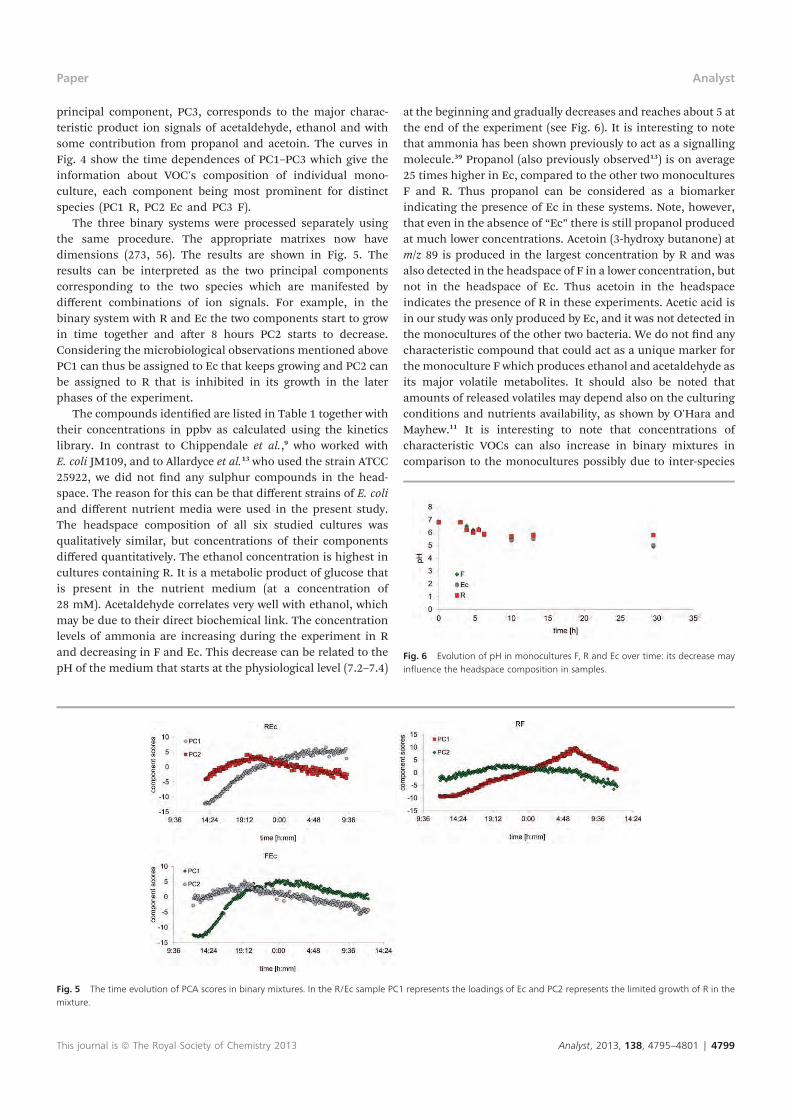
principal component, PC3, corresponds to the major charac-teristic product ion signals of acetaldehyde, ethanol and withsome contribution from propanol and acetoin. The curves inFig. 4 show the time dependences of PC1–PC3 which give theinformation about VOC's composition of individual mono-culture, each component being most prominent for distinctspecies (PC1 R, PC2 Ec and PC3 F).
The three binary systems were processed separately usingthe same procedure. The appropriate matrixes now havedimensions (273, 56). The results are shown in Fig. 5. Theresults can be interpreted as the two principal componentscorresponding to the two species which are manifested bydifferent combinations of ion signals. For example, in thebinary system with R and Ec the two components start to growin time together and aer 8 hours PC2 starts to decrease.Considering the microbiological observations mentioned abovePC1 can thus be assigned to Ec that keeps growing and PC2 canbe assigned to R that is inhibited in its growth in the laterphases of the experiment.
The compounds identied are listed in Table 1 together withtheir concentrations in ppbv as calculated using the kineticslibrary. In contrast to Chippendale et al.,9 who worked withE. coli JM109, and to Allardyce et al.13 who used the strain ATCC25922, we did not nd any sulphur compounds in the head-space. The reason for this can be that different strains of E. coliand different nutrient media were used in the present study.The headspace composition of all six studied cultures wasqualitatively similar, but concentrations of their componentsdiffered quantitatively. The ethanol concentration is highest incultures containing R. It is a metabolic product of glucose thatis present in the nutrient medium (at a concentration of28 mM). Acetaldehyde correlates very well with ethanol, whichmay be due to their direct biochemical link. The concentrationlevels of ammonia are increasing during the experiment in Rand decreasing in F and Ec. This decrease can be related to thepH of the medium that starts at the physiological level (7.2–7.4)
at the beginning and gradually decreases and reaches about 5 atthe end of the experiment (see Fig. 6). It is interesting to notethat ammonia has been shown previously to act as a signallingmolecule.39 Propanol (also previously observed13) is on average25 times higher in Ec, compared to the other two monoculturesF and R. Thus propanol can be considered as a biomarkerindicating the presence of Ec in these systems. Note, however,that even in the absence of “Ec” there is still propanol producedat much lower concentrations. Acetoin (3-hydroxy butanone) atm/z 89 is produced in the largest concentration by R and wasalso detected in the headspace of F in a lower concentration, butnot in the headspace of Ec. Thus acetoin in the headspaceindicates the presence of R in these experiments. Acetic acid isin our study was only produced by Ec, and it was not detected inthe monocultures of the other two bacteria. We do not nd anycharacteristic compound that could act as a unique marker forthe monoculture F which produces ethanol and acetaldehyde asits major volatile metabolites. It should also be noted thatamounts of released volatiles may depend also on the culturingconditions and nutrients availability, as shown by O'Hara andMayhew.11 It is interesting to note that concentrations ofcharacteristic VOCs can also increase in binary mixtures incomparison to the monocultures possibly due to inter-species
Fig. 5 The time evolution of PCA scores in binary mixtures. In the R/Ec sample PC1 represents the loadings of Ec and PC2 represents the limited growth of R in themixture.
Fig. 6 Evolution of pH in monocultures F, R and Ec over time: its decrease mayinfluence the headspace composition in samples.
This journal is ª The Royal Society of Chemistry 2013 Analyst, 2013, 138, 4795–4801 | 4799
Paper Analyst
synergic effects, for example the acetoin concentration in theF/Ec binary system (110 ppb) is higher compared to theirmonocultures (56 ppb, respectively 5 ppb).
Fig. 3 shows the time changes of concentrations of severalselected compounds (acetaldehyde, propanol, acetoin andethanol) during the 24 hour experiment. The time prole of thecurves shows an increase of concentration, as the bacterial cellnumber in the medium grows. It reaches a maximum, which isspecic for each bacterial strain and compound and then theconcentration is reduced. In accordance with the growth curves(Fig. 2) this corresponds to the switch from the logarithmic to astationary phase. The reduction in concentrations may becaused by the loss of volatile compounds due to the sampleow, or they may be consumed by secondary metabolism ofbacterial cultures. The binary system represented by R and Eccompared to the corresponding monocultures shows anapparent lack of acetoin, a maximum concentration of only 46ppbv in comparison with 500 ppbv typical for R aer 15 hours.Also the propanol characteristic for Ec (3000 ppbv in themonoculture) is present at a reduced concentration of 450 ppbv.This may indicate that the bacterial composition and the pop-ulation dynamics resulted in a ratio favouring Ec (in agreementwith the microbiologically determined ratio R/Ec ¼ 170 : 416)but in a lower absolute cell number. The OD of the R/Ec binarymixture was observed to be lower than that of the Ec mono-culture and higher than OD of the R monoculture. This indi-cates that the presence of R decreases the rate of growth of Ecand thus the reduction of propanol concentration observed inthis binary mixture can be caused by the initial inuence of Rresulting in a slower growth of Ec regardless of the ultimatevictory of Ec in this mixture.
The R/F binary mixture produced time proles of acetoin,ethanol and acetaldehyde similar to themonoculture of R but insomewhat lower absolute concentrations. Themicrobiologicallydetermined result for this system is R/F ¼ 108 : 367. Finally, inthe binary system of F with Ec, the winner is almost the sole F,Ec usually does not survive. The VOC's composition conrmedthe victory of F indicated by the absence of propanol that wouldbe characteristic of Ec.
Conclusions
This study demonstrates that the headspace composition ofbacterial samples can be used as a ngerprint typical for acertain species of bacteria and provides quantitative informa-tion even in mixtures of two species or strains. This articlepresents a new method for monitoring of growth dynamics on aspecic case of unmixed cultures at 27 �C. The results demon-strate that SIFT-MS can be utilized for monitoring of thebacterial proliferation in real time without interfering with theliving organisms. In a system of three different species, two ofthem can be characterised by unique biomarkers and thus thepopulation dynamics can be studied. Whilst the ultimate resultof the population dynamics can be observed by countingsurviving CFUs, it is much more instructive to follow them inreal time using volatile signatures of the individual clones andtherefore suggest a mathematical model of the calculation of
the CFU ratio in a mixture from the VOC's composition. Futurework can be extended to include other, more clinically relevant,bacteria growing at conditions closer to physiological.
Acknowledgements
We gratefully acknowledge partial nancial support by theGrant Agency of the Czech Republic, project numbers 13-24275S(AM).
Notes and references
1 S. A. West, A. S. Griffin, A. Gardner and S. P. Diggle, Nat. Rev.Microbiol., 2006, 4, 597–607.
2 G. J. Velicer, Trends Microbiol., 2003, 11, 330–337.3 M. R. Parsek and E. P. Greenberg, Trends Microbiol., 2005, 13,27–33.
4 J. Cepl, I. Patkova, A. Blahuskova, F. Cvrckova and A. Markos,BMC Microbiol., 2010, 10, 139.
5 T. Rieger, Z. Neubauer, A. Blahuskova, F. Cvrckova andA. Markos, Commun. Integr. Biol., 2008, 1, 78–87.
6 I. Patkova, J. Cepl, T. Rieger, A. Blahuskova, Z. Neubauer andA. Markos, BMC Microbiol., 2012, 12, 178.
7 V. Shestivska, A. Nemec, P. Drevınek, K. Sovova, K. Dryahinaand P. Spanel, Rapid Commun. Mass Spectrom., 2011, 25,2459–2467.
8 V. Shestivska, P. Spanel, K. Dryahina, K. Sovova, D. Smith,M. Musilek and A. Nemec, J. Appl. Microbiol., 2012, 113,701–713.
9 T. W. E. Chippendale, P. Spanel and D. Smith, RapidCommun. Mass Spectrom., 2011, 25, 2163–2172.
10 K.-s. Kim, S. Lee and C.-M. Ryu, Nat. Commun., 2013, 4, 1809.11 M. O'Hara and C. A. Mayhew, J. Breath Res., 2009, 3, 027001.12 W. Filipiak, A. Sponring, M. M. Baur, A. Filipiak, C. Ager,
H. Wiesenhofer, M. Nagl, J. Troppmair and A. Amann,BMC Microbiol., 2012, 12, 113.
13 R. A. Allardyce, V. S. Langford, A. L. Hill and D. R. Murdoch,J. Microbiol. Methods, 2006, 65, 361–365.
14 W. Filipiak, A. Sponring, M. M. Baur, C. Ager, A. Filipiak,H. Wiesenhofer, M. Nagl, J. Troppmair and A. Amann,Microbiology, 2012, 158, 3044–3053.
15 M. Junger, W. Vautz, M. Kuhns, L. Hofmann, S. Ulbricht,J. I. Baumbach, M. Quintel and T. Perl, Appl. Microbiol.Biotechnol., 2012, 93, 2603–2614.
16 S. Maddula, L. M. Blank, A. Schmid and J. I. Baumbach, Anal.Bioanal. Chem., 2009, 394, 791–800.
17 J. M. Scotter, R. A. Allardyce, V. Langford, A. Hill andD. R. Murdoch, J. Microbiol. Methods, 2006, 65, 628–631.
18 M. Bunge, N. Araghipour, T. Mikoviny, J. Dunkl,R. Schnitzhofer, A. Hansel, F. Schinner, A. Wisthaler,R. Margesin and T. D. Mark, Appl. Environ. Microbiol.,2008, 74, 2179–2186.
19 D. Smith and P. Spanel, Mass Spectrom. Rev., 2005, 24, 661–700.
20 B. Kerr, M. A. Riley, M. W. Feldman and B. J. M. Bohannan,Nature, 2002, 418, 171–174.
21 G. Szabo and G. Fath, Phys. Rep., 2007, 446, 97–216.
4800 | Analyst, 2013, 138, 4795–4801 This journal is ª The Royal Society of Chemistry 2013
Analyst Paper

22 A. T. Fuller and J. M. Horton, J. Gen. Microbiol., 1950, 4, 417–433.
23 D. Smith and N. Adams, Adv. At. Mol. Phys., 1988, 24, 1–49.24 P. Spanel and D. Smith, Mass Spectrom. Rev., 2011, 30, 236–
267.25 P. R. Boshier, J. R. Cushnir, V. Mistry, A. Knaggs, P. Spanel,
D. Smith and G. B. Hanna, Analyst, 2011, 136, 3233–3237.26 C. Turner, P. Spanel and D. Smith, Rapid Commun. Mass
Spectrom., 2006, 20, 61–68.27 A. Olivares, K. Dryahina, J. L. Navarro, D. Smith, P. Spanel
and M. Flores, J. Agric. Food Chem., 2011, 59, 1931–1938.28 A. Olivares, K. Dryahina, J. L. Navarro, M. Flores, D. Smith
and P. Spanel, Anal. Chem., 2010, 82, 5819–5829.29 K. Sovova, M. Ferus, I. Matulkova, P. Spanel, K. Dryahina,
O. Dvorak and S. Civis, Mol. Phys., 2008, 106, 1205–1214.30 D. Smith, P. Spanel, D. Dabill, J. Cocker and B. Rajan, Rapid
Commun. Mass Spectrom., 2004, 18, 2830–2838.
31 J. Sule-Suso, A. Pysanenko, P. Spanel and D. Smith, Analyst,2009, 134, 2419–2425.
32 P. Spanel and D. Smith, Mass Spectrom. Rev., 2011, 30, 236–267.
33 D. Smith, A. Pysanenko and P. Spanel, Int. J. Mass Spectrom.,2009, 281, 15–23.
34 R. P. Williams, C. L. Gott, S. M. H. Qadri and R. H. Scott,J. Bacteriol., 1971, 106, 438–443.
35 P. Spanel, K. Dryahina and D. Smith, Int. J. Mass Spectrom.,2006, 249, 230–239.
36 D. Smith and P. Spanel, Analyst, 2011, 136, 2009–2032.37 D. Smith, T. W. Chippendale and P. Spanel, Int. J. Mass
Spectrom., 2011, 303, 81–89.38 A. Pysanenko, P. Spanel and D. Smith, Int. J. Mass Spectrom.,
2009, 285, 42–48.39 S. P. Bernier, S. Letoffe, M. Delepierre and J. M. Ghigo, Mol.
Microbiol., 2011, 81, 705–716.
This journal is ª The Royal Society of Chemistry 2013 Analyst, 2013, 138, 4795–4801 | 4801
Paper Analyst

Appendix F, Sovová et al. Anal. Chem. 84 (2012) 4979
Real-time quantification of traces of biogenic volatile selenium compounds
in humid air by selected ion flow tube mass spectrometry
Kristýna Sovováa,b, Violetta Shestivskaa, Patrik Špan la,*.
aJ. Heyrovský Institute of Physical Chemistry, Academy of Sciences of the Czech
Republic Dolejškova 3, 18223 Prague 8, Czech Republic bDepartment of Physical and Macromolecular Chemistry, Faculty of Science, Charles
University, Albertov 2030, 128 40 Prague 2, Czech Republic

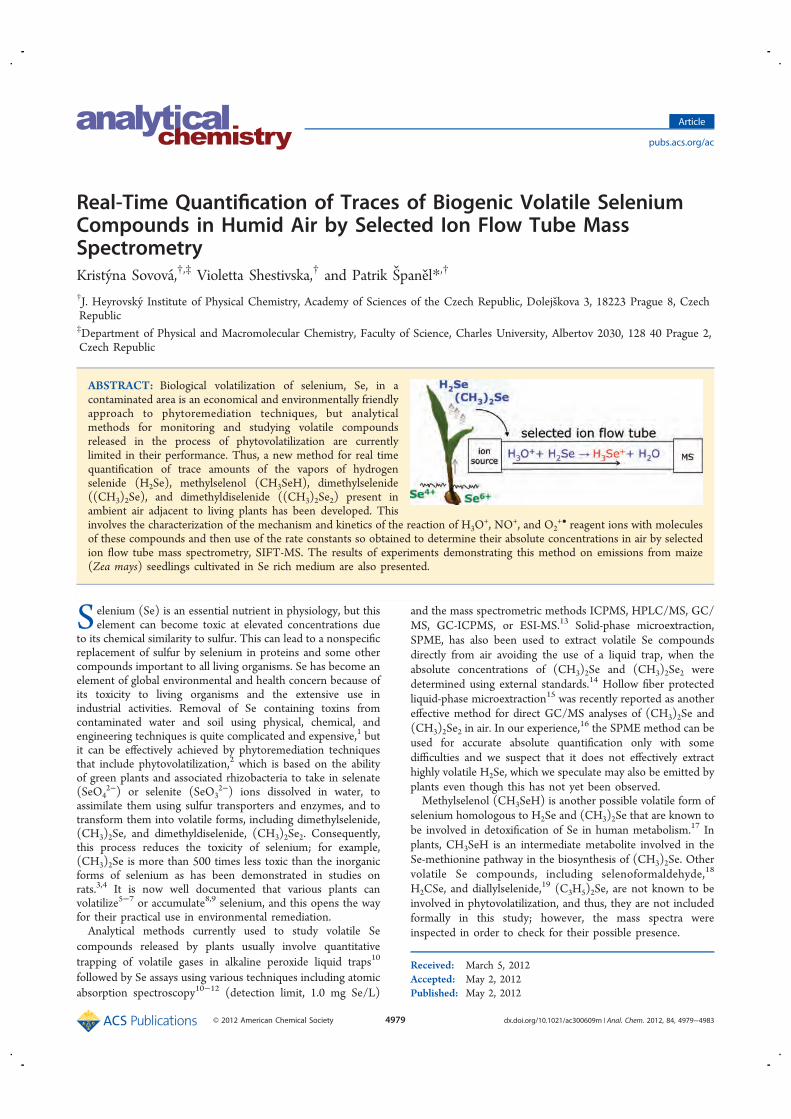
Real-Time Quantification of Traces of Biogenic Volatile SeleniumCompounds in Humid Air by Selected Ion Flow Tube MassSpectrometryKristyna Sovova,†,‡ Violetta Shestivska,† and Patrik Spanel*,†
†J. Heyrovsky Institute of Physical Chemistry, Academy of Sciences of the Czech Republic, Dolejskova 3, 18223 Prague 8, CzechRepublic‡Department of Physical and Macromolecular Chemistry, Faculty of Science, Charles University, Albertov 2030, 128 40 Prague 2,Czech Republic
ABSTRACT: Biological volatilization of selenium, Se, in acontaminated area is an economical and environmentally friendlyapproach to phytoremediation techniques, but analyticalmethods for monitoring and studying volatile compoundsreleased in the process of phytovolatilization are currentlylimited in their performance. Thus, a new method for real timequantification of trace amounts of the vapors of hydrogenselenide (H2Se), methylselenol (CH3SeH), dimethylselenide((CH3)2Se), and dimethyldiselenide ((CH3)2Se2) present inambient air adjacent to living plants has been developed. Thisinvolves the characterization of the mechanism and kinetics of the reaction of H3O
+, NO+, and O2+• reagent ions with molecules
of these compounds and then use of the rate constants so obtained to determine their absolute concentrations in air by selectedion flow tube mass spectrometry, SIFT-MS. The results of experiments demonstrating this method on emissions from maize(Zea mays) seedlings cultivated in Se rich medium are also presented.
Selenium (Se) is an essential nutrient in physiology, but thiselement can become toxic at elevated concentrations due
to its chemical similarity to sulfur. This can lead to a nonspecificreplacement of sulfur by selenium in proteins and some othercompounds important to all living organisms. Se has become anelement of global environmental and health concern because ofits toxicity to living organisms and the extensive use inindustrial activities. Removal of Se containing toxins fromcontaminated water and soil using physical, chemical, andengineering techniques is quite complicated and expensive,1 butit can be effectively achieved by phytoremediation techniquesthat include phytovolatilization,2 which is based on the abilityof green plants and associated rhizobacteria to take in selenate(SeO4
2−) or selenite (SeO32−) ions dissolved in water, to
assimilate them using sulfur transporters and enzymes, and totransform them into volatile forms, including dimethylselenide,(CH3)2Se, and dimethyldiselenide, (CH3)2Se2. Consequently,this process reduces the toxicity of selenium; for example,(CH3)2Se is more than 500 times less toxic than the inorganicforms of selenium as has been demonstrated in studies onrats.3,4 It is now well documented that various plants canvolatilize5−7 or accumulate8,9 selenium, and this opens the wayfor their practical use in environmental remediation.Analytical methods currently used to study volatile Se
compounds released by plants usually involve quantitativetrapping of volatile gases in alkaline peroxide liquid traps10
followed by Se assays using various techniques including atomicabsorption spectroscopy10−12 (detection limit, 1.0 mg Se/L)
and the mass spectrometric methods ICPMS, HPLC/MS, GC/MS, GC-ICPMS, or ESI-MS.13 Solid-phase microextraction,SPME, has also been used to extract volatile Se compoundsdirectly from air avoiding the use of a liquid trap, when theabsolute concentrations of (CH3)2Se and (CH3)2Se2 weredetermined using external standards.14 Hollow fiber protectedliquid-phase microextraction15 was recently reported as anothereffective method for direct GC/MS analyses of (CH3)2Se and(CH3)2Se2 in air. In our experience,
16 the SPME method can beused for accurate absolute quantification only with somedifficulties and we suspect that it does not effectively extracthighly volatile H2Se, which we speculate may also be emitted byplants even though this has not yet been observed.Methylselenol (CH3SeH) is another possible volatile form of
selenium homologous to H2Se and (CH3)2Se that are known tobe involved in detoxification of Se in human metabolism.17 Inplants, CH3SeH is an intermediate metabolite involved in theSe-methionine pathway in the biosynthesis of (CH3)2Se. Othervolatile Se compounds, including selenoformaldehyde,18
H2CSe, and diallylselenide,19 (C3H5)2Se, are not known to beinvolved in phytovolatilization, and thus, they are not includedformally in this study; however, the mass spectra wereinspected in order to check for their possible presence.
Received: March 5, 2012Accepted: May 2, 2012Published: May 2, 2012
Article
pubs.acs.org/ac
© 2012 American Chemical Society 4979 dx.doi.org/10.1021/ac300609m | Anal. Chem. 2012, 84, 4979−4983
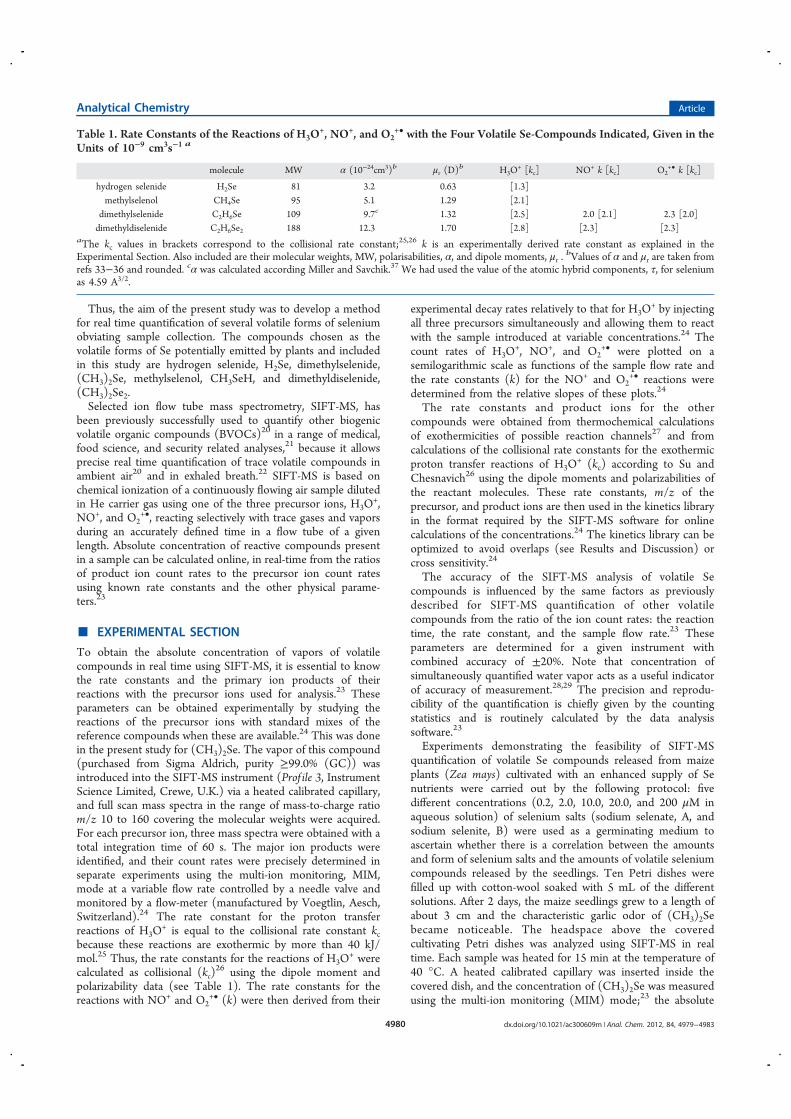
Thus, the aim of the present study was to develop a methodfor real time quantification of several volatile forms of seleniumobviating sample collection. The compounds chosen as thevolatile forms of Se potentially emitted by plants and includedin this study are hydrogen selenide, H2Se, dimethylselenide,(CH3)2Se, methylselenol, CH3SeH, and dimethyldiselenide,(CH3)2Se2.Selected ion flow tube mass spectrometry, SIFT-MS, has
been previously successfully used to quantify other biogenicvolatile organic compounds (BVOCs)20 in a range of medical,food science, and security related analyses,21 because it allowsprecise real time quantification of trace volatile compounds inambient air20 and in exhaled breath.22 SIFT-MS is based onchemical ionization of a continuously flowing air sample dilutedin He carrier gas using one of the three precursor ions, H3O
+,NO+, and O2
+•, reacting selectively with trace gases and vaporsduring an accurately defined time in a flow tube of a givenlength. Absolute concentration of reactive compounds presentin a sample can be calculated online, in real-time from the ratiosof product ion count rates to the precursor ion count ratesusing known rate constants and the other physical parame-ters.23
■ EXPERIMENTAL SECTION
To obtain the absolute concentration of vapors of volatilecompounds in real time using SIFT-MS, it is essential to knowthe rate constants and the primary ion products of theirreactions with the precursor ions used for analysis.23 Theseparameters can be obtained experimentally by studying thereactions of the precursor ions with standard mixes of thereference compounds when these are available.24 This was donein the present study for (CH3)2Se. The vapor of this compound(purchased from Sigma Aldrich, purity ≥99.0% (GC)) wasintroduced into the SIFT-MS instrument (Prof ile 3, InstrumentScience Limited, Crewe, U.K.) via a heated calibrated capillary,and full scan mass spectra in the range of mass-to-charge ratiom/z 10 to 160 covering the molecular weights were acquired.For each precursor ion, three mass spectra were obtained with atotal integration time of 60 s. The major ion products wereidentified, and their count rates were precisely determined inseparate experiments using the multi-ion monitoring, MIM,mode at a variable flow rate controlled by a needle valve andmonitored by a flow-meter (manufactured by Voegtlin, Aesch,Switzerland).24 The rate constant for the proton transferreactions of H3O
+ is equal to the collisional rate constant kcbecause these reactions are exothermic by more than 40 kJ/mol.25 Thus, the rate constants for the reactions of H3O
+ werecalculated as collisional (kc)
26 using the dipole moment andpolarizability data (see Table 1). The rate constants for thereactions with NO+ and O2
+• (k) were then derived from their
experimental decay rates relatively to that for H3O+ by injecting
all three precursors simultaneously and allowing them to reactwith the sample introduced at variable concentrations.24 Thecount rates of H3O
+, NO+, and O2+• were plotted on a
semilogarithmic scale as functions of the sample flow rate andthe rate constants (k) for the NO+ and O2
+• reactions weredetermined from the relative slopes of these plots.24
The rate constants and product ions for the othercompounds were obtained from thermochemical calculationsof exothermicities of possible reaction channels27 and fromcalculations of the collisional rate constants for the exothermicproton transfer reactions of H3O
+ (kc) according to Su andChesnavich26 using the dipole moments and polarizabilities ofthe reactant molecules. These rate constants, m/z of theprecursor, and product ions are then used in the kinetics libraryin the format required by the SIFT-MS software for onlinecalculations of the concentrations.24 The kinetics library can beoptimized to avoid overlaps (see Results and Discussion) orcross sensitivity.24
The accuracy of the SIFT-MS analysis of volatile Secompounds is influenced by the same factors as previouslydescribed for SIFT-MS quantification of other volatilecompounds from the ratio of the ion count rates: the reactiontime, the rate constant, and the sample flow rate.23 Theseparameters are determined for a given instrument withcombined accuracy of ±20%. Note that concentration ofsimultaneously quantified water vapor acts as a useful indicatorof accuracy of measurement.28,29 The precision and reprodu-cibility of the quantification is chiefly given by the countingstatistics and is routinely calculated by the data analysissoftware.23
Experiments demonstrating the feasibility of SIFT-MSquantification of volatile Se compounds released from maizeplants (Zea mays) cultivated with an enhanced supply of Senutrients were carried out by the following protocol: fivedifferent concentrations (0.2, 2.0, 10.0, 20.0, and 200 μM inaqueous solution) of selenium salts (sodium selenate, A, andsodium selenite, B) were used as a germinating medium toascertain whether there is a correlation between the amountsand form of selenium salts and the amounts of volatile seleniumcompounds released by the seedlings. Ten Petri dishes werefilled up with cotton-wool soaked with 5 mL of the differentsolutions. After 2 days, the maize seedlings grew to a length ofabout 3 cm and the characteristic garlic odor of (CH3)2Sebecame noticeable. The headspace above the coveredcultivating Petri dishes was analyzed using SIFT-MS in realtime. Each sample was heated for 15 min at the temperature of40 °C. A heated calibrated capillary was inserted inside thecovered dish, and the concentration of (CH3)2Se was measuredusing the multi-ion monitoring (MIM) mode;23 the absolute
Table 1. Rate Constants of the Reactions of H3O+, NO+, and O2
+• with the Four Volatile Se-Compounds Indicated, Given in theUnits of 10−9 cm3s−1 a
molecule MW α (10−24cm3)b μr (D)b H3O
+ [kc] NO+ k [kc] O2+• k [kc]
hydrogen selenide H2Se 81 3.2 0.63 [1.3]methylselenol CH4Se 95 5.1 1.29 [2.1]
dimethylselenide C2H6Se 109 9.7c 1.32 [2.5] 2.0 [2.1] 2.3 [2.0]dimethyldiselenide C2H6Se2 188 12.3 1.70 [2.8] [2.3] [2.3]
aThe kc values in brackets correspond to the collisional rate constant;25,26 k is an experimentally derived rate constant as explained in theExperimental Section. Also included are their molecular weights, MW, polarisabilities, α, and dipole moments, μr .
bValues of α and μr are taken fromrefs 33−36 and rounded. cα was calculated according Miller and Savchik.37 We had used the value of the atomic hybrid components, τ, for seleniumas 4.59 A3/2.
Analytical Chemistry Article
dx.doi.org/10.1021/ac300609m | Anal. Chem. 2012, 84, 4979−49834980

concentration was obtained. Thus, the headspace within thecovered dish was collected directly, and ambient air was allowedto replace the depleted volume. Background concentrations ofvolatile Se compounds in the laboratory air were monitoredbefore and after analysis of each sample and compared with theheadspace concentrations.Safety Considerations. The volatile reference reagent,
dimethylselenide ((CH3)2Se), is toxic by inhalation, is toxic ifswallowed, and causes danger of cumulative effects. Thisreagent must be handled with caution according to establishedlaboratory safety practices using safety glasses and gloves forpersonal protection while ensuring good ventilation. Hydrogenselenide (H2Se) was not used as a reagent, but it is one of thevolatile compounds released by plants. H2Se is also very toxicby inhalation, highly flammable, toxic in contact with skin, andpotentially fatal even at low ppm levels. However, in theexperiments described in this Article, the concentrations ofH2Se released by plants are seen to be much lower.
■ RESULTS AND DISCUSSIONIon Chemistry of (CH3)2Se. The ion chemistry of the three
precursor ions (H3O+, NO+, and O2
+•) with the standardmixture of (CH3)2Se was studied experimentally using the wellestablished SIFT method for the determination of ion−molecule kinetics.24 The reaction of H3O
+ with (CH3)2Se(Figure 1) produces the protonated ion (CH3)2SeH
+
exclusively, and its four major isotopologues appear at mass-to-charge ratios, m/z, of 107, 108, 109, 111, and 113. This isbecause selenium has five major stable isotopes: 76Se (9.02%),77Se (7.63%), 78Se (23.52%), 80Se (49.82%), and 82Se (9.19%)(the sixth isotope 74Se has natural abundance less than 1%).This characteristic isotopic composition is very useful, becauseit can confirm the presence of Se in volatile compoundsreleased by plants. Note that, unlike many protonated polarcompounds, (CH3)2SeH
+ ions do not associate with watermolecules forming hydrated ions. This means that theconcentration of (CH3)2Se in the sampled air can be calculateddirectly from the ratio of the product ion count rates to theprecursor ion count rates without the need to considerformation of hydrates.23
NO+ and O2+• precursor ions were both observed to react
with (CH3)2Se (IE = 8.40 eV) via charge transfer without anyfragmentation producing (CH3)2Se
+• at m/z 106, 107, 108,110, and 112. The calculated values of the collisional rateconstant (kc) for the H3O
+ reaction and the experimentally
derived rate constants (k) for the NO+ and O2+• reactions are
summarized in Table 1.Ion Chemistry of H2Se, CH3SeH, (CH3)2Se2. Following
our previous experience with hydrogen sulfide (H2S)30
reactions, we presume that H3O+ will transfer a proton to
H2Se (proton affinity, PA, 707.8 kJ/mol)31 because Se hassimilar chemical properties to sulfur. Fragmentation afterproton transfer cannot occur in this proton transfer reactionbecause the energy released (calculated as 16.8 kJ/mol from thePA of H2O of 691 kJ/mol)31 is substantially smaller than thestrength of the Se−H covalent bond. Thus, a nondissociativeproton transfer occurring at the collisional rate25 can be usedfor absolute quantification of H2Se. The product ions H3Se
+ atm/z 79, 81, 83, and 85 are used in the present study; however,there is a potential overlap with the second hydrate ofprotonated ethanol at m/z 83 and 85. NO+ cannot react withH2Se by an exothermic binary reaction because of the value ofits ionization energy (IE H2Se = 9.89 eV) that is larger thanrecombination energy of NO+ (RE NO+ = 9.2 eV). Thereaction of O2
+• is known from previous work32 to form theH2Se
+ ion product that cannot be used for SIFT-MS analysisbecause it disappears completely from the flow tube due to itsreaction with water to form H3O
+.Methylselenol, CH3SeH, is expected to have a higher PA
than water on the basis of its structure (by analogy with thevalue of PA of methanthiol, CH3SH, which is 773.4 kJ/mol),and thus, it will react with H3O
+ via proton transfer formingCH3SeH2
+ (m/z 93, 95, 97, and 99). The value of theionization energy of CH3SeH is not available in the literature,but again by analogy with CH3SH (IE = 9.44 eV), it is unlikelyto react with NO+. We can only speculate that methylselenolwill react with O2
+• precursor ion by charge transfer followedby fragmentation. However, as it will be shown later, Se-enriched plants did not produce any methylselenol anyway,because it was not observed on the H3O
+ SIFT-MS spectra.Similarly, dimethyldiselenide (C2H6Se2, IE 8.1 eV) is expectedto react with H3O
+ forming the protonated molecule thatwould be present at a wide range of isotopologues (significantpeaks ranging from m/z 185 to 193 with a characteristicdistribution corresponding to two Se atoms). NO+ and O2
+•
will react with C2H6Se2 by charge transfer producing ions in therange from m/z 184 to 192. Again, later it will be shown thatthese characteristic product ions were not observed in theexperiments with plants.
Figure 1. Mass spectrum obtained from the headspace of (CH3)2Se standard mixture by averaging 12 consequential scans. Signals at m/z 112 and114 are due to the lower resolution of quadrupole mass spectrometer and due to 13C isotopologues. Minor signal at m/z 50 is O2
+•H2O;29 m/z 54
and 61 are presumably noise.
Analytical Chemistry Article
dx.doi.org/10.1021/ac300609m | Anal. Chem. 2012, 84, 4979−49834981
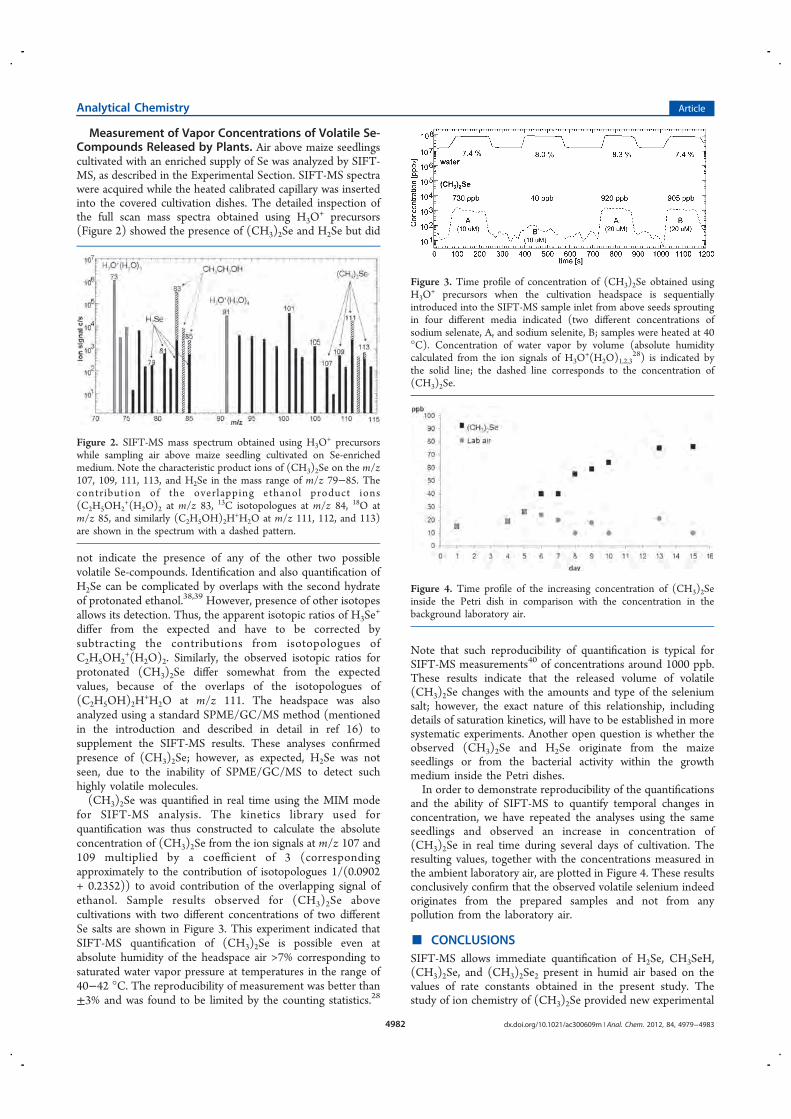
Measurement of Vapor Concentrations of Volatile Se-Compounds Released by Plants. Air above maize seedlingscultivated with an enriched supply of Se was analyzed by SIFT-MS, as described in the Experimental Section. SIFT-MS spectrawere acquired while the heated calibrated capillary was insertedinto the covered cultivation dishes. The detailed inspection ofthe full scan mass spectra obtained using H3O
+ precursors(Figure 2) showed the presence of (CH3)2Se and H2Se but did
not indicate the presence of any of the other two possiblevolatile Se-compounds. Identification and also quantification ofH2Se can be complicated by overlaps with the second hydrateof protonated ethanol.38,39 However, presence of other isotopesallows its detection. Thus, the apparent isotopic ratios of H3Se
+
differ from the expected and have to be corrected bysubtracting the contributions from isotopologues ofC2H5OH2
+(H2O)2. Similarly, the observed isotopic ratios forprotonated (CH3)2Se differ somewhat from the expectedvalues, because of the overlaps of the isotopologues of(C2H5OH)2H
+H2O at m/z 111. The headspace was alsoanalyzed using a standard SPME/GC/MS method (mentionedin the introduction and described in detail in ref 16) tosupplement the SIFT-MS results. These analyses confirmedpresence of (CH3)2Se; however, as expected, H2Se was notseen, due to the inability of SPME/GC/MS to detect suchhighly volatile molecules.(CH3)2Se was quantified in real time using the MIM mode
for SIFT-MS analysis. The kinetics library used forquantification was thus constructed to calculate the absoluteconcentration of (CH3)2Se from the ion signals at m/z 107 and109 multiplied by a coefficient of 3 (correspondingapproximately to the contribution of isotopologues 1/(0.0902+ 0.2352)) to avoid contribution of the overlapping signal ofethanol. Sample results observed for (CH3)2Se abovecultivations with two different concentrations of two differentSe salts are shown in Figure 3. This experiment indicated thatSIFT-MS quantification of (CH3)2Se is possible even atabsolute humidity of the headspace air >7% corresponding tosaturated water vapor pressure at temperatures in the range of40−42 °C. The reproducibility of measurement was better than±3% and was found to be limited by the counting statistics.28
Note that such reproducibility of quantification is typical forSIFT-MS measurements40 of concentrations around 1000 ppb.These results indicate that the released volume of volatile(CH3)2Se changes with the amounts and type of the seleniumsalt; however, the exact nature of this relationship, includingdetails of saturation kinetics, will have to be established in moresystematic experiments. Another open question is whether theobserved (CH3)2Se and H2Se originate from the maizeseedlings or from the bacterial activity within the growthmedium inside the Petri dishes.In order to demonstrate reproducibility of the quantifications
and the ability of SIFT-MS to quantify temporal changes inconcentration, we have repeated the analyses using the sameseedlings and observed an increase in concentration of(CH3)2Se in real time during several days of cultivation. Theresulting values, together with the concentrations measured inthe ambient laboratory air, are plotted in Figure 4. These resultsconclusively confirm that the observed volatile selenium indeedoriginates from the prepared samples and not from anypollution from the laboratory air.
■ CONCLUSIONSSIFT-MS allows immediate quantification of H2Se, CH3SeH,(CH3)2Se, and (CH3)2Se2 present in humid air based on thevalues of rate constants obtained in the present study. Thestudy of ion chemistry of (CH3)2Se provided new experimental
Figure 2. SIFT-MS mass spectrum obtained using H3O+ precursors
while sampling air above maize seedling cultivated on Se-enrichedmedium. Note the characteristic product ions of (CH3)2Se on the m/z107, 109, 111, 113, and H2Se in the mass range of m/z 79−85. Thecontribution of the overlapping ethanol product ions(C2H5OH2
+(H2O)2 at m/z 83, 13C isotopologues at m/z 84, 18O atm/z 85, and similarly (C2H5OH)2H
+H2O at m/z 111, 112, and 113)are shown in the spectrum with a dashed pattern.
Figure 3. Time profile of concentration of (CH3)2Se obtained usingH3O
+ precursors when the cultivation headspace is sequentiallyintroduced into the SIFT-MS sample inlet from above seeds sproutingin four different media indicated (two different concentrations ofsodium selenate, A, and sodium selenite, B; samples were heated at 40°C). Concentration of water vapor by volume (absolute humiditycalculated from the ion signals of H3O
+(H2O)1,2,328) is indicated by
the solid line; the dashed line corresponds to the concentration of(CH3)2Se.
Figure 4. Time profile of the increasing concentration of (CH3)2Seinside the Petri dish in comparison with the concentration in thebackground laboratory air.
Analytical Chemistry Article
dx.doi.org/10.1021/ac300609m | Anal. Chem. 2012, 84, 4979−49834982
data on the product ions of H3O+, NO+, and O2
+• reactions.The experiments using maize seedlings showed that, from thesefour compounds, only H2Se and (CH3)2Se are produced inmeasurable concentrations (>1 ppb) in the air adjacent toplants growing in Se-enriched medium. To our knowledge,these were the first online quantitative and selective measure-ments of concentrations of volatile Se compounds. There werealso no indications on the SIFT-MS mass spectra of thepresence of selenoformaldehyde, H2CSe, or diallyl selenide,(C3H5)2Se, that were not included formally in the presentstudy. Further experiments now can be done in order to fullyutilize the potential of the SIFT-MS analytical methoddescribed in this Article. The first questions that needanswering is how much volatilization of Se is realized bybacteria in soil or on the plant roots and how much conversionof inorganic Se to organic Se compounds occurs within theplants. In order to answer this question, we intend to performsimilar experiments using defined bacterial cultures and toanalyze emissions from the plant leaves separately from the soilin which the plants are growing.
■ AUTHOR INFORMATION
Corresponding Author*Phone: +420 266 052 112. E-mail: [email protected].
NotesThe authors declare no competing financial interest.
■ ACKNOWLEDGMENTSWe would like to thank Kseniya Dryahina for assistance withsome of the SIFT-MS experiments and David Smith for readingand correcting the manuscript. We gratefully acknowledgefinancial support by the Grant Agency of the Czech Republic(project 203/09/0256) and by Grant Agency of CharlesUniversity (project GAUK 32010).
■ REFERENCES(1) Yu, X. Z.; Gu, J. D. Environ. Sci. Pollut. Res. 2008, 15 (6), 499−508.(2) Lin, Z. Q.; Schemenauer, R. S.; Cervinka, V.; Zayed, A.; Lee, A.;Terry, N. J. Environ. Qual. 2000, 29 (4), 1048−1056.(3) McConnell, K. P.; Portman, O. W. Proc. Soc. Exp. Biol. Med. 1952,79 (2), 230−231.(4) Wilber, C. G. Clin. Toxicol. 1980, 17 (2), 171−230.(5) Zayed, A.; Lytle, C. M.; Terry, N. Planta 1998, 206 (2), 284−292.(6) Zayed, A. M.; Terry, N. J. Plant Physiol. 1992, 140 (6), 646−652.(7) Zayed, A. M.; Terry, N. J. Plant Physiol. 1994, 143 (1), 8−14.(8) Di Gregorio, S.; Lampis, S.; Malorgio, F.; Petruzzelli, G.;Pezzarossa, B.; Vallini, G. Plant Soil 2006, 285 (1−2), 233−244.(9) de Souza, M. P.; Lytle, C. M.; Mulholland, M. M.; Otte, M. L.;Terry, N. Plant Physiol. 2000, 122 (4), 1281−1288.(10) Terry, N.; Carlson, C.; Raab, T. K.; Zayed, A. M. J. Environ.Qual. 1992, 21 (3), 341−344.(11) de Souza, M. P.; Pilon-Smits, E. A. H.; Lytle, C. M.; Hwang, S.;Tai, J.; Honma, T. S. U.; Yeh, L.; Terry, N. Plant Physiol. 1998, 117(4), 1487−1494.(12) Pilon-Smits, E. A. H.; de Souza, M. P.; Lytle, C. M.; Shang, C.;Lugo, T.; Terry, N. J. Exp. Bot. 1998, 49 (328), 1889−1892.(13) Montes-Bayon, M.; Grant, T. D.; Meija, J.; Caruso, J. A. J. Anal.At. Spectrom. 2002, 17 (9), 1015−1023.(14) Meija, J.; Montes-Bayon, M.; Le Duc, D. L.; Terry, N.; Caruso,J. A. Anal. Chem. 2002, 74 (22), 5837−5844.(15) Ghasemi, E.; Sillanpaa, M.; Najafi, N. M. J. Chromatogr., A 2011,1218 (3), 380−386.
(16) Shestivska, V.; Nemec, A.; Drevínek, P.; Sovova, K.; Dryahina,K.; Spanel, P. Rapid Commun. Mass Spectrom. 2011, 25 (17), 2459−2467.(17) Rayman, M. P.; Infante, H. G.; Sargent, M. Br. J. Nutr. 2008, 100(2), 238−253.(18) Karpas, Z. Chem. Phys. Lett. 1985, 120 (1), 10.(19) Whanger, P. D.; Ip, C.; Polan, C. E.; Uden, P. C.; Welbaum, G.J. Agric. Food Chem. 2000, 48 (11), 5723−5730.(20) Smith, D.; Spanel, P. TrAC Trends Anal. Chem. 2011, 30 (7),945−959.(21) Spanel, P.; Smith, D. Mass Spectrom. Rev. 2011, 30 (2), 236−267.(22) Boshier, P. R.; Cushnir, J. R.; Mistry, V.; Knaggs, A.; Spanel, P.;Smith, D.; Hanna, G. B. Analyst 2011, 136 (16), 3233−3237.(23) Spanel, P.; Dryahina, K.; Smith, D. Int. J. Mass Spectrom. 2006,249, 230−239.(24) Sovova, K.; Dryahina, K.; Spanel, P. Int. J. Mass Spectrom. 2011,300 (1), 31−38.(25) Bouchoux, G.; Salpin, J. Y.; Leblanc, D. Int. J. Mass Spectrom. IonProcess 1996, 153 (1), 37−48.(26) Su, T.; Chesnavich, W. J. J. Chem. Phys. 1982, 76 (10), 5183−5185.(27) Ervin, K. M. Chem. Rev. 2001, 101 (2), 391−444.(28) Spanel, P.; Smith, D. Rapid Commun. Mass Spectrom. 2001, 15(8), 563−569.(29) Spanel, P.; Smith, D. Int. J. Mass Spectrom. 2009, 280 (1−3),128−135.(30) Spanel, P.; Smith, D. Rapid Commun. Mass Spectrom. 2000, 14(13), 1136−1140.(31) Linstrom, P. J.; Mallard, W. G. NIST Chemistry WebBook, NISTStandard Reference Database Number 69; National Institute ofStandards and Technology: Gaithersburg, 2011.(32) Anicich, V. An Index of the Literature for Bimolecular Gas PhaseCation-Molecule Reaction Kinetics, JPL Publication 03-19; NationalAeronautics and Space Administration, Jet Propulsion Laboratory,California Institute of Technology: Pasadena, CA, 2003; p 1−1172.(33) Mirri, A. M. C. C. P. J. Chem. Phys. 1969, 50.(34) Johari, G. P. National Research Council Digest of Literature onDielectrics; National Academy of Sciences: Washington, D.C., 1977.(35) Thoen, K. K.; Beasley, B. J.; Smith, R. L.; Kenttamaa, H. I. J. Am.Soc. Mass Spectrom. 1996, 7 (12), 1245−1250.(36) Thomas, C. H. J. Chem. Phys. 1973, 59, 70.(37) Miller, K. J.; Savchik, J. A. J. Am. Chem. Soc. 1979, 101 (24),7206−7213.(38) Dryahina, K.; Pehal, F.; Smith, D.; Spanel, P. Int. J. MassSpectrom. 2009, 286 (1), 1−6.(39) Turner, C.; Spanel, P.; Smith, D. Rapid Commun. Mass Spectrom.2006, 20 (1), 61−68.(40) Boshier, P. R.; Marczin, N.; Hanna, G. B. J. Am. Soc. MassSpectrom. 2010, 21 (6), 1070−1074.
Analytical Chemistry Article
dx.doi.org/10.1021/ac300609m | Anal. Chem. 2012, 84, 4979−49834983

Appendix G, Civiš et al. Anal. Chem. 83 (2011) 1069
Laser Ablation of FOX-7: Proposed Mechanism of Decomposition
Martin Civiš1, Svatopluk Civiš1,* , Kristýna Sovová1, Kseniya Dryahina1, Patrik Špan l1,
and Martin Kyncl2
1J. Heyrovský Institute of Physical Chemistry, Czech Academy of Sciences,
Dolejškova 3, 182 23 Prague 8, Czech Republic 2 Explosia a.s., Semtín 107, 530 50 Pardubice, Czech Republic

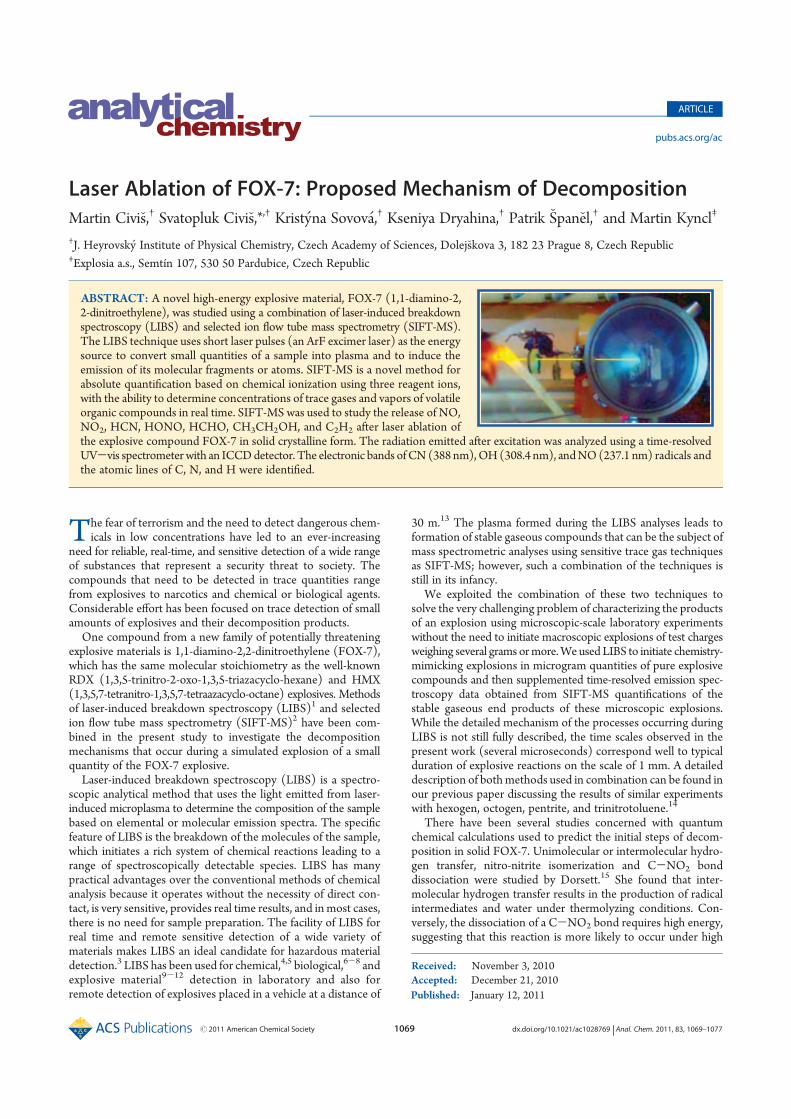
Published: January 12, 2011
r 2011 American Chemical Society 1069 dx.doi.org/10.1021/ac1028769 |Anal. Chem. 2011, 83, 1069–1077
ARTICLE
pubs.acs.org/ac
Laser Ablation of FOX-7: Proposed Mechanism of DecompositionMartin Civi�s,† Svatopluk Civi�s,*,† Krist�yna Sovov�a,† Kseniya Dryahina,† Patrik �Span�el,† and Martin Kyncl‡
†J. Heyrovsk�y Institute of Physical Chemistry, Czech Academy of Sciences, Dolej�skova 3, 182 23 Prague 8, Czech Republic‡Explosia a.s., Semtín 107, 530 50 Pardubice, Czech Republic
ABSTRACT: A novel high-energy explosive material, FOX-7 (1,1-diamino-2,2-dinitroethylene), was studied using a combination of laser-induced breakdownspectroscopy (LIBS) and selected ion flow tube mass spectrometry (SIFT-MS).The LIBS technique uses short laser pulses (an ArF excimer laser) as the energysource to convert small quantities of a sample into plasma and to induce theemission of its molecular fragments or atoms. SIFT-MS is a novel method forabsolute quantification based on chemical ionization using three reagent ions,with the ability to determine concentrations of trace gases and vapors of volatileorganic compounds in real time. SIFT-MS was used to study the release of NO,NO2, HCN, HONO, HCHO, CH3CH2OH, and C2H2 after laser ablation ofthe explosive compound FOX-7 in solid crystalline form. The radiation emitted after excitation was analyzed using a time-resolvedUV-vis spectrometer with an ICCDdetector. The electronic bands ofCN (388 nm),OH(308.4 nm), andNO(237.1 nm) radicals andthe atomic lines of C, N, and H were identified.
The fear of terrorism and the need to detect dangerous chem-icals in low concentrations have led to an ever-increasing
need for reliable, real-time, and sensitive detection of a wide rangeof substances that represent a security threat to society. Thecompounds that need to be detected in trace quantities rangefrom explosives to narcotics and chemical or biological agents.Considerable effort has been focused on trace detection of smallamounts of explosives and their decomposition products.
One compound from a new family of potentially threateningexplosive materials is 1,1-diamino-2,2-dinitroethylene (FOX-7),which has the same molecular stoichiometry as the well-knownRDX (1,3,5-trinitro-2-oxo-1,3,5-triazacyclo-hexane) and HMX(1,3,5,7-tetranitro-1,3,5,7-tetraazacyclo-octane) explosives. Methodsof laser-induced breakdown spectroscopy (LIBS)1 and selectedion flow tube mass spectrometry (SIFT-MS)2 have been com-bined in the present study to investigate the decompositionmechanisms that occur during a simulated explosion of a smallquantity of the FOX-7 explosive.
Laser-induced breakdown spectroscopy (LIBS) is a spectro-scopic analytical method that uses the light emitted from laser-induced microplasma to determine the composition of the samplebased on elemental or molecular emission spectra. The specificfeature of LIBS is the breakdown of the molecules of the sample,which initiates a rich system of chemical reactions leading to arange of spectroscopically detectable species. LIBS has manypractical advantages over the conventional methods of chemicalanalysis because it operates without the necessity of direct con-tact, is very sensitive, provides real time results, and in most cases,there is no need for sample preparation. The facility of LIBS forreal time and remote sensitive detection of a wide variety ofmaterials makes LIBS an ideal candidate for hazardous materialdetection.3 LIBS has been used for chemical,4,5 biological,6-8 andexplosive material9-12 detection in laboratory and also forremote detection of explosives placed in a vehicle at a distance of
30 m.13 The plasma formed during the LIBS analyses leads toformation of stable gaseous compounds that can be the subject ofmass spectrometric analyses using sensitive trace gas techniquesas SIFT-MS; however, such a combination of the techniques isstill in its infancy.
We exploited the combination of these two techniques tosolve the very challenging problem of characterizing the productsof an explosion using microscopic-scale laboratory experimentswithout the need to initiate macroscopic explosions of test chargesweighing several grams ormore.WeusedLIBS to initiate chemistry-mimicking explosions in microgram quantities of pure explosivecompounds and then supplemented time-resolved emission spec-troscopy data obtained from SIFT-MS quantifications of thestable gaseous end products of these microscopic explosions.While the detailed mechanism of the processes occurring duringLIBS is not still fully described, the time scales observed in thepresent work (several microseconds) correspond well to typicalduration of explosive reactions on the scale of 1 mm. A detaileddescription of bothmethods used in combination can be found inour previous paper discussing the results of similar experimentswith hexogen, octogen, pentrite, and trinitrotoluene.14
There have been several studies concerned with quantumchemical calculations used to predict the initial steps of decom-position in solid FOX-7. Unimolecular or intermolecular hydro-gen transfer, nitro-nitrite isomerization and C-NO2 bonddissociation were studied by Dorsett.15 She found that inter-molecular hydrogen transfer results in the production of radicalintermediates and water under thermolyzing conditions. Con-versely, the dissociation of a C-NO2 bond requires high energy,suggesting that this reaction is more likely to occur under high
Received: November 3, 2010Accepted: December 21, 2010
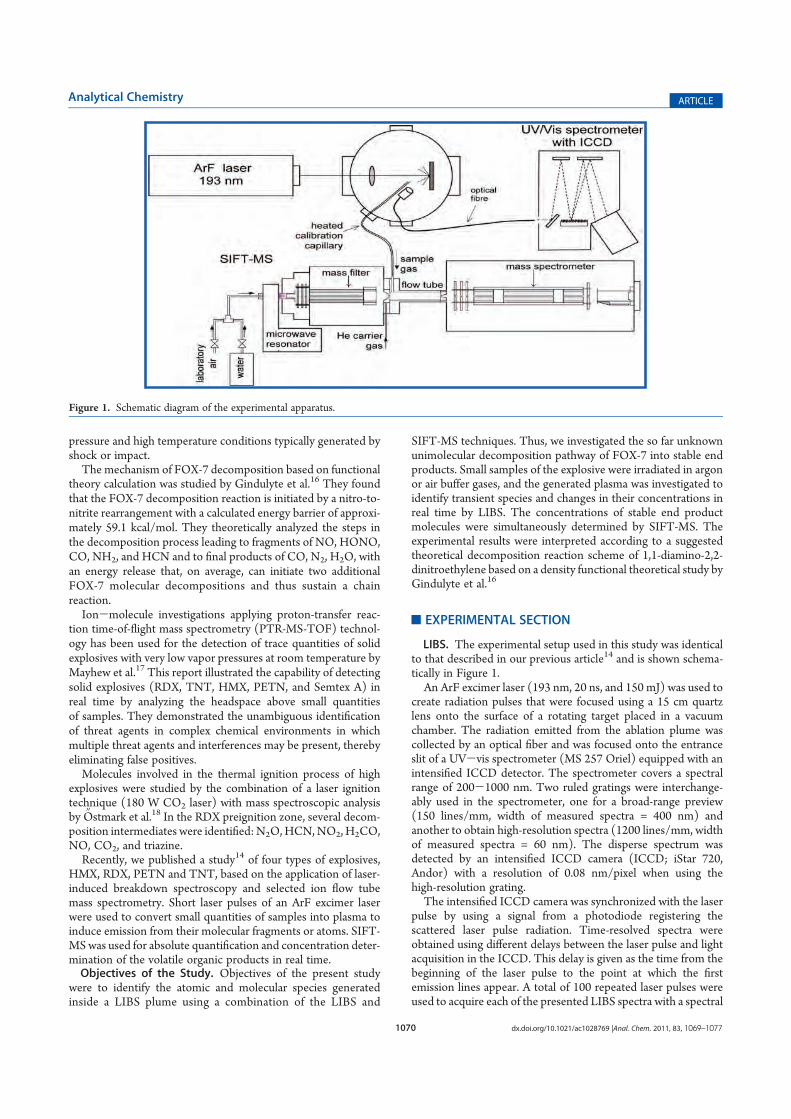
1070 dx.doi.org/10.1021/ac1028769 |Anal. Chem. 2011, 83, 1069–1077
Analytical Chemistry ARTICLE
pressure and high temperature conditions typically generated byshock or impact.
The mechanism of FOX-7 decomposition based on functionaltheory calculation was studied by Gindulyte et al.16 They foundthat the FOX-7 decomposition reaction is initiated by a nitro-to-nitrite rearrangement with a calculated energy barrier of approxi-mately 59.1 kcal/mol. They theoretically analyzed the steps inthe decomposition process leading to fragments of NO, HONO,CO, NH2, and HCN and to final products of CO, N2, H2O, withan energy release that, on average, can initiate two additionalFOX-7 molecular decompositions and thus sustain a chainreaction.
Ion-molecule investigations applying proton-transfer reac-tion time-of-flight mass spectrometry (PTR-MS-TOF) technol-ogy has been used for the detection of trace quantities of solidexplosives with very low vapor pressures at room temperature byMayhew et al.17 This report illustrated the capability of detectingsolid explosives (RDX, TNT, HMX, PETN, and Semtex A) inreal time by analyzing the headspace above small quantitiesof samples. They demonstrated the unambiguous identificationof threat agents in complex chemical environments in whichmultiple threat agents and interferences may be present, therebyeliminating false positives.
Molecules involved in the thermal ignition process of highexplosives were studied by the combination of a laser ignitiontechnique (180 W CO2 laser) with mass spectroscopic analysisby
00Ostmark et al.18 In the RDX preignition zone, several decom-
position intermediates were identified: N2O,HCN,NO2,H2CO,NO, CO2, and triazine.
Recently, we published a study14 of four types of explosives,HMX, RDX, PETN and TNT, based on the application of laser-induced breakdown spectroscopy and selected ion flow tubemass spectrometry. Short laser pulses of an ArF excimer laserwere used to convert small quantities of samples into plasma toinduce emission from their molecular fragments or atoms. SIFT-MSwas used for absolute quantification and concentration deter-mination of the volatile organic products in real time.Objectives of the Study. Objectives of the present study
were to identify the atomic and molecular species generatedinside a LIBS plume using a combination of the LIBS and
SIFT-MS techniques. Thus, we investigated the so far unknownunimolecular decomposition pathway of FOX-7 into stable endproducts. Small samples of the explosive were irradiated in argonor air buffer gases, and the generated plasma was investigated toidentify transient species and changes in their concentrations inreal time by LIBS. The concentrations of stable end productmolecules were simultaneously determined by SIFT-MS. Theexperimental results were interpreted according to a suggestedtheoretical decomposition reaction scheme of 1,1-diamino-2,2-dinitroethylene based on a density functional theoretical study byGindulyte et al.16
’EXPERIMENTAL SECTION
LIBS. The experimental setup used in this study was identicalto that described in our previous article14 and is shown schema-tically in Figure 1.An ArF excimer laser (193 nm, 20 ns, and 150 mJ) was used to
create radiation pulses that were focused using a 15 cm quartzlens onto the surface of a rotating target placed in a vacuumchamber. The radiation emitted from the ablation plume wascollected by an optical fiber and was focused onto the entranceslit of a UV-vis spectrometer (MS 257 Oriel) equipped with anintensified ICCD detector. The spectrometer covers a spectralrange of 200-1000 nm. Two ruled gratings were interchange-ably used in the spectrometer, one for a broad-range preview(150 lines/mm, width of measured spectra = 400 nm) andanother to obtain high-resolution spectra (1200 lines/mm, widthof measured spectra = 60 nm). The disperse spectrum wasdetected by an intensified ICCD camera (ICCD; iStar 720,Andor) with a resolution of 0.08 nm/pixel when using thehigh-resolution grating.The intensified ICCD camera was synchronized with the laser
pulse by using a signal from a photodiode registering thescattered laser pulse radiation. Time-resolved spectra wereobtained using different delays between the laser pulse and lightacquisition in the ICCD. This delay is given as the time from thebeginning of the laser pulse to the point at which the firstemission lines appear. A total of 100 repeated laser pulses wereused to acquire each of the presented LIBS spectra with a spectral
Figure 1. Schematic diagram of the experimental apparatus.
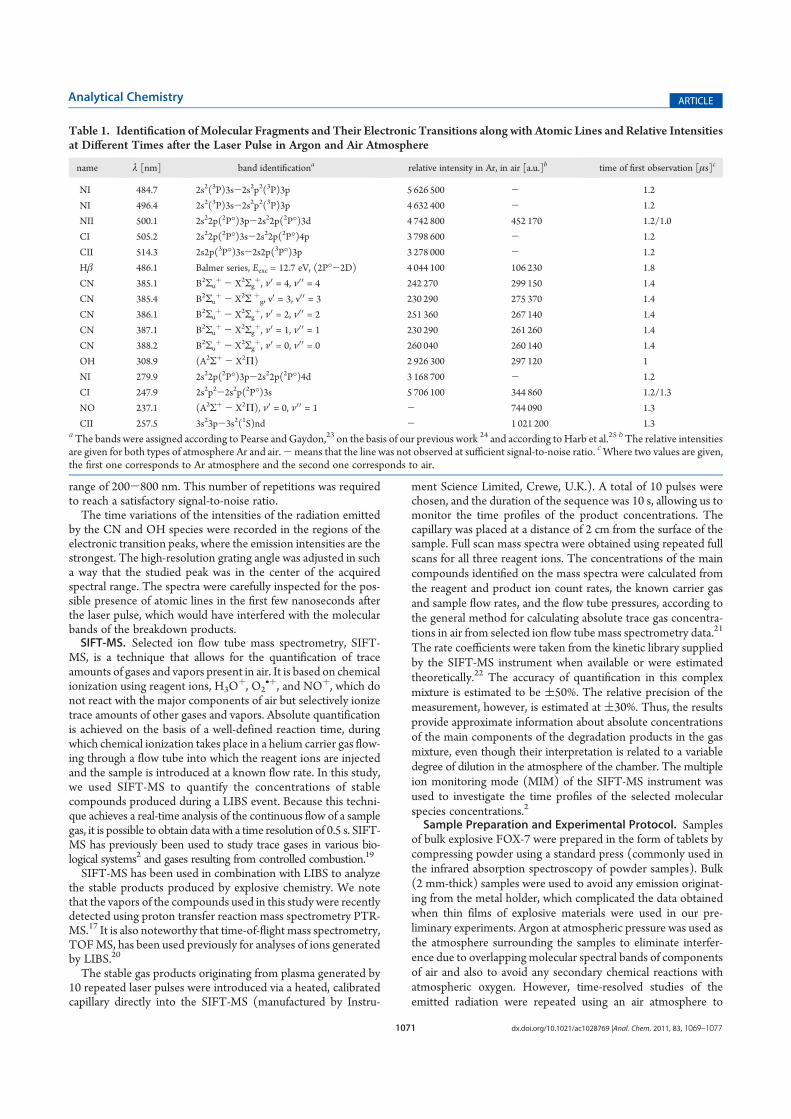
1071 dx.doi.org/10.1021/ac1028769 |Anal. Chem. 2011, 83, 1069–1077
Analytical Chemistry ARTICLE
range of 200-800 nm. This number of repetitions was requiredto reach a satisfactory signal-to-noise ratio.The time variations of the intensities of the radiation emitted
by the CN and OH species were recorded in the regions of theelectronic transition peaks, where the emission intensities are thestrongest. The high-resolution grating angle was adjusted in sucha way that the studied peak was in the center of the acquiredspectral range. The spectra were carefully inspected for the pos-sible presence of atomic lines in the first few nanoseconds afterthe laser pulse, which would have interfered with the molecularbands of the breakdown products.SIFT-MS. Selected ion flow tube mass spectrometry, SIFT-
MS, is a technique that allows for the quantification of traceamounts of gases and vapors present in air. It is based on chemicalionization using reagent ions, H3O
þ, O2•þ, and NOþ, which do
not react with the major components of air but selectively ionizetrace amounts of other gases and vapors. Absolute quantificationis achieved on the basis of a well-defined reaction time, duringwhich chemical ionization takes place in a helium carrier gas flow-ing through a flow tube into which the reagent ions are injectedand the sample is introduced at a known flow rate. In this study,we used SIFT-MS to quantify the concentrations of stablecompounds produced during a LIBS event. Because this techni-que achieves a real-time analysis of the continuous flow of a samplegas, it is possible to obtain data with a time resolution of 0.5 s. SIFT-MS has previously been used to study trace gases in various bio-logical systems2 and gases resulting from controlled combustion.19
SIFT-MS has been used in combination with LIBS to analyzethe stable products produced by explosive chemistry. We notethat the vapors of the compounds used in this study were recentlydetected using proton transfer reaction mass spectrometry PTR-MS.17 It is also noteworthy that time-of-flight mass spectrometry,TOFMS, has been used previously for analyses of ions generatedby LIBS.20
The stable gas products originating from plasma generated by10 repeated laser pulses were introduced via a heated, calibratedcapillary directly into the SIFT-MS (manufactured by Instru-
ment Science Limited, Crewe, U.K.). A total of 10 pulses werechosen, and the duration of the sequence was 10 s, allowing us tomonitor the time profiles of the product concentrations. Thecapillary was placed at a distance of 2 cm from the surface of thesample. Full scan mass spectra were obtained using repeated fullscans for all three reagent ions. The concentrations of the maincompounds identified on the mass spectra were calculated fromthe reagent and product ion count rates, the known carrier gasand sample flow rates, and the flow tube pressures, according tothe general method for calculating absolute trace gas concentra-tions in air from selected ion flow tube mass spectrometry data.21
The rate coefficients were taken from the kinetic library suppliedby the SIFT-MS instrument when available or were estimatedtheoretically.22 The accuracy of quantification in this complexmixture is estimated to be (50%. The relative precision of themeasurement, however, is estimated at (30%. Thus, the resultsprovide approximate information about absolute concentrationsof the main components of the degradation products in the gasmixture, even though their interpretation is related to a variabledegree of dilution in the atmosphere of the chamber. The multipleion monitoring mode (MIM) of the SIFT-MS instrument wasused to investigate the time profiles of the selected molecularspecies concentrations.2
Sample Preparation and Experimental Protocol. Samplesof bulk explosive FOX-7 were prepared in the form of tablets bycompressing powder using a standard press (commonly used inthe infrared absorption spectroscopy of powder samples). Bulk(2 mm-thick) samples were used to avoid any emission originat-ing from the metal holder, which complicated the data obtainedwhen thin films of explosive materials were used in our pre-liminary experiments. Argon at atmospheric pressure was used asthe atmosphere surrounding the samples to eliminate interfer-ence due to overlapping molecular spectral bands of componentsof air and also to avoid any secondary chemical reactions withatmospheric oxygen. However, time-resolved studies of theemitted radiation were repeated using an air atmosphere to
Table 1. Identification ofMolecular Fragments and Their Electronic Transitions along with Atomic Lines and Relative Intensitiesat Different Times after the Laser Pulse in Argon and Air Atmosphere
name λ [nm] band identificationa relative intensity in Ar, in air [a.u.]b time of first observation [μs]c
NI 484.7 2s2(3P)3s-2s2p2(3P)3p 5 626 500 - 1.2
NI 496.4 2s2(3P)3s-2s2p2(3P)3p 4 632 400 - 1.2
NII 500.1 2s22p(2P�)3p-2s22p(2P�)3d 4 742 800 452 170 1.2/1.0
CI 505.2 2s22p(2P�)3s-2s22p(2P�)4p 3 798 600 - 1.2
CII 514.3 2s2p(3P�)3s-2s2p(3P�)3p 3 278 000 - 1.2
Hβ 486.1 Balmer series, Eexc = 12.7 eV, (2P�-2D) 4 044 100 106 230 1.8
CN 385.1 B2Σuþ - X2Σg
þ, ν0 = 4, ν0 0 = 4 242 270 299 150 1.4
CN 385.4 B2Σuþ - X2Σ þ
g, v0 = 3, v0 0 = 3 230 290 275 370 1.4
CN 386.1 B2Σuþ - X2Σg
þ, ν0 = 2, ν0 0 = 2 251 360 267 140 1.4
CN 387.1 B2Σuþ - X2Σg
þ, ν0 = 1, ν0 0 = 1 230 290 261 260 1.4
CN 388.2 B2Σuþ - X2Σg
þ, ν0 = 0, ν0 0 = 0 260 040 260 140 1.4
OH 308.9 (A2Σþ - X2Π) 2 926 300 297 120 1
NI 279.9 2s22p(2P�)3p-2s22p(2P�)4d 3 168 700 - 1.2
CI 247.9 2s2p2-2s2p(2P�)3s 5 706 100 344 860 1.2/1.3
NO 237.1 (A2Σþ - X2Π), ν0 = 0, ν0 0 = 1 - 744 090 1.3
CII 257.5 3s23p-3s2(1S)nd - 1 021 200 1.3aThe bands were assigned according to Pearse andGaydon,23 on the basis of our previous work 24 and according toHarb et al.25 bThe relative intensitiesare given for both types of atmosphere Ar and air.-means that the line was not observed at sufficient signal-to-noise ratio. cWhere two values are given,the first one corresponds to Ar atmosphere and the second one corresponds to air.
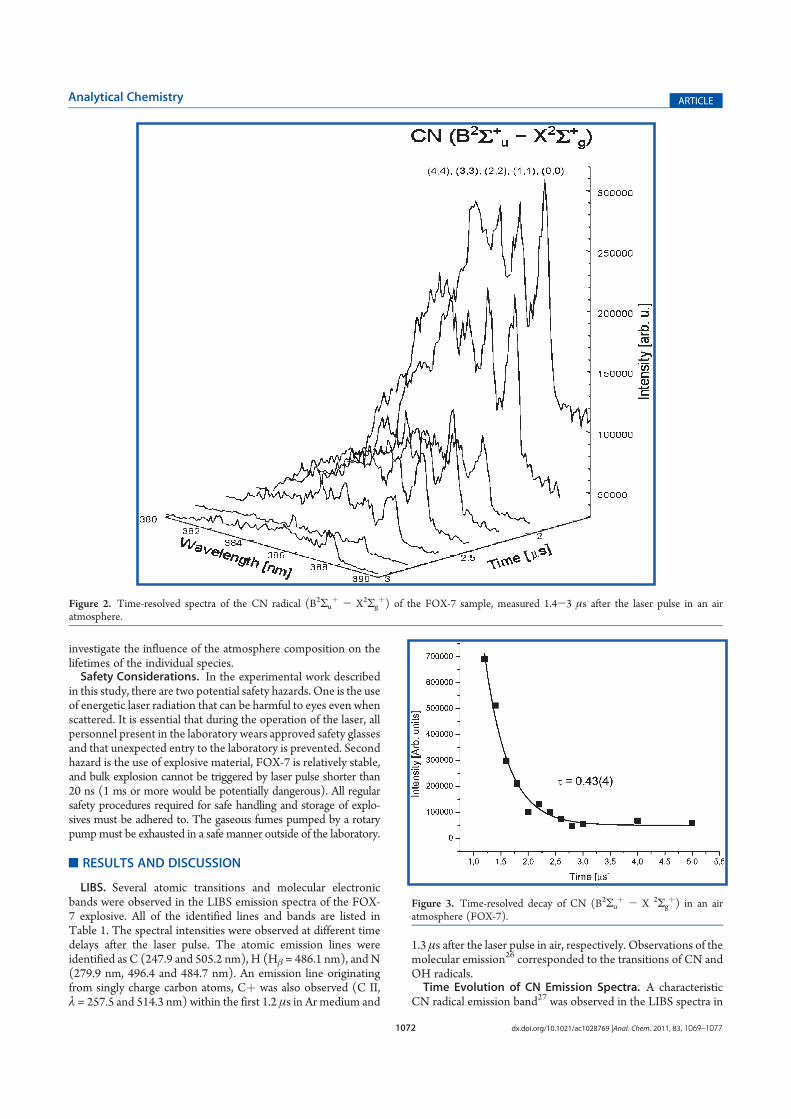
1072 dx.doi.org/10.1021/ac1028769 |Anal. Chem. 2011, 83, 1069–1077
Analytical Chemistry ARTICLE
investigate the influence of the atmosphere composition on thelifetimes of the individual species.Safety Considerations. In the experimental work described
in this study, there are two potential safety hazards. One is the useof energetic laser radiation that can be harmful to eyes even whenscattered. It is essential that during the operation of the laser, allpersonnel present in the laboratory wears approved safety glassesand that unexpected entry to the laboratory is prevented. Secondhazard is the use of explosive material, FOX-7 is relatively stable,and bulk explosion cannot be triggered by laser pulse shorter than20 ns (1 ms or more would be potentially dangerous). All regularsafety procedures required for safe handling and storage of explo-sives must be adhered to. The gaseous fumes pumped by a rotarypumpmust be exhausted in a safe manner outside of the laboratory.
’RESULTS AND DISCUSSION
LIBS. Several atomic transitions and molecular electronicbands were observed in the LIBS emission spectra of the FOX-7 explosive. All of the identified lines and bands are listed inTable 1. The spectral intensities were observed at different timedelays after the laser pulse. The atomic emission lines wereidentified as C (247.9 and 505.2 nm), H (Hβ = 486.1 nm), and N(279.9 nm, 496.4 and 484.7 nm). An emission line originatingfrom singly charge carbon atoms, Cþ was also observed (C II,λ = 257.5 and 514.3 nm) within the first 1.2 μs in Ar medium and
1.3 μs after the laser pulse in air, respectively. Observations of themolecular emission26 corresponded to the transitions of CN andOH radicals.Time Evolution of CN Emission Spectra. A characteristic
CN radical emission band27 was observed in the LIBS spectra in
Figure 2. Time-resolved spectra of the CN radical (B2Σuþ - X2Σg
þ) of the FOX-7 sample, measured 1.4-3 μs after the laser pulse in an airatmosphere.
Figure 3. Time-resolved decay of CN (B2Σuþ - X 2Σg
þ) in an airatmosphere (FOX-7).
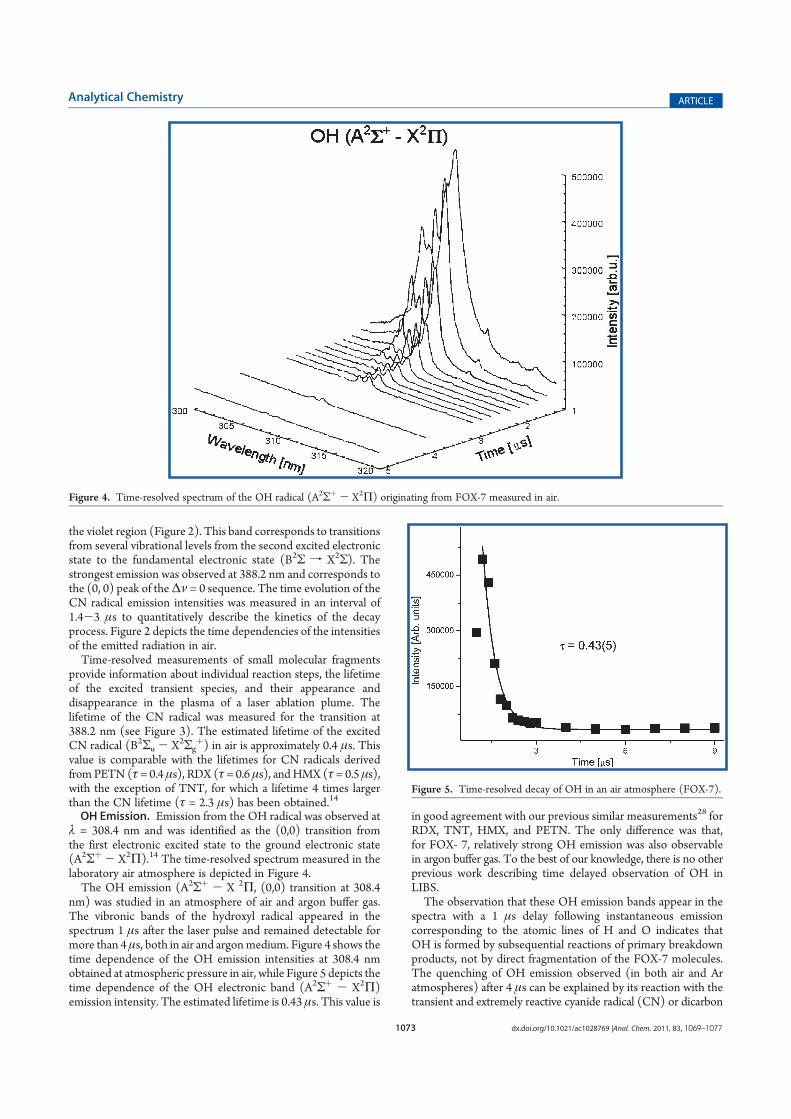
1073 dx.doi.org/10.1021/ac1028769 |Anal. Chem. 2011, 83, 1069–1077
Analytical Chemistry ARTICLE
the violet region (Figure 2). This band corresponds to transitionsfrom several vibrational levels from the second excited electronicstate to the fundamental electronic state (B2Σ f X2Σ). Thestrongest emission was observed at 388.2 nm and corresponds tothe (0, 0) peak of theΔν = 0 sequence. The time evolution of theCN radical emission intensities was measured in an interval of1.4-3 μs to quantitatively describe the kinetics of the decayprocess. Figure 2 depicts the time dependencies of the intensitiesof the emitted radiation in air.Time-resolved measurements of small molecular fragments
provide information about individual reaction steps, the lifetimeof the excited transient species, and their appearance anddisappearance in the plasma of a laser ablation plume. Thelifetime of the CN radical was measured for the transition at388.2 nm (see Figure 3). The estimated lifetime of the excitedCN radical (B2Σu - X2Σg
þ) in air is approximately 0.4 μs. Thisvalue is comparable with the lifetimes for CN radicals derivedfromPETN (τ = 0.4μs), RDX (τ = 0.6 μs), andHMX (τ = 0.5 μs),with the exception of TNT, for which a lifetime 4 times largerthan the CN lifetime (τ = 2.3 μs) has been obtained.14
OH Emission. Emission from the OH radical was observed atλ = 308.4 nm and was identified as the (0,0) transition fromthe first electronic excited state to the ground electronic state(A2Σþ - X2Π).14 The time-resolved spectrum measured in thelaboratory air atmosphere is depicted in Figure 4.The OH emission (A2Σþ - X 2Π, (0,0) transition at 308.4
nm) was studied in an atmosphere of air and argon buffer gas.The vibronic bands of the hydroxyl radical appeared in thespectrum 1 μs after the laser pulse and remained detectable formore than 4μs, both in air and argonmedium. Figure 4 shows thetime dependence of the OH emission intensities at 308.4 nmobtained at atmospheric pressure in air, while Figure 5 depicts thetime dependence of the OH electronic band (A2Σþ - X2Π)emission intensity. The estimated lifetime is 0.43 μs. This value is
in good agreement with our previous similar measurements28 forRDX, TNT, HMX, and PETN. The only difference was that,for FOX- 7, relatively strong OH emission was also observablein argon buffer gas. To the best of our knowledge, there is no otherprevious work describing time delayed observation of OH inLIBS.The observation that these OH emission bands appear in the
spectra with a 1 μs delay following instantaneous emissioncorresponding to the atomic lines of H and O indicates thatOH is formed by subsequential reactions of primary breakdownproducts, not by direct fragmentation of the FOX-7 molecules.The quenching of OH emission observed (in both air and Aratmospheres) after 4 μs can be explained by its reaction with thetransient and extremely reactive cyanide radical (CN) or dicarbon
Figure 4. Time-resolved spectrum of the OH radical (A2Σþ - X2Π) originating from FOX-7 measured in air.
Figure 5. Time-resolved decay of OH in an air atmosphere (FOX-7).
1074 dx.doi.org/10.1021/ac1028769 |Anal. Chem. 2011, 83, 1069–1077
Analytical Chemistry ARTICLE
monoxide (C2O).29The lifetimeof theOHradical was only 0.4μs;
however, its persistence for 4 μs corresponds to a continuousformation due to a sequence of reactions (including fragmentationof the HONO molecules, see the following sections). Theseobservations are substantially different from the results of ourprevious study of RDX, HMX, PETN, and TNT,28 in which theOH radical was only observed in air for a short interval of 1.5-2 μs following the laser pulse.Vibrational and Excitation Temperatures. The vibrational
temperature of the CN radicals produced by the FOX-7 explosivewas determined from the relative line intensities within theavailable vibrational band. This calculation used the electronictransition of B2Σg f X2Σu and the emission intensities corre-sponding to the most intense vibrational transitions (0-0, 1-1,2-2, 3-3). The vibrational temperature was calculated on thebasis of the Boltzmann population distribution using the energydependency of the intensities:
ln½Iν=λ3f � ¼ KEν þQ ð1Þwhere Iv is the intensity observed for the transition originatingfrom the vibrational state with the vibrational quantum numberν, λ is the corresponding wavelength, f is the value of theFranck-Condon factor for the vibronic transition, and Eν isthe vibrational energy of the state ν. Linear regression of theexperimental data, plotted as a Boltzmann plot, provides theslope K and the constant Q. The vibrational temperature can befinally calculated from the slope K using a simple equation:
Tvib ¼ - 1=kK ð2Þwhere k is the Boltzmann constant. The vibrational temperatureof the (FOX-7 explosive) CN radicals determined using thismethod was approximately 5200 ( 800 K. This corresponds tothe kinetic gas temperature typical for LIBS plumes.14
SIFT-MSData. SIFT-MS data obtained using the reagent ionsH3O
þ and O2•þ for the samples directly from the reaction zone
after the laser pulse (in an argon atmosphere) showed the pre-sence of nitrogen dioxide (NO2), nitrous acid (HONO), ammo-nia (NH3), hydrogen cyanide (HCN), formaldehyde (HCHO),acetonitrile (CH3CN), acetylene (C2H2), ethanol (CH3CH2OH),and dimethyldinitrobutane (DMNB). The mean absolute con-centrations of these stable products obtained by sampling from a
point separated by 2.5 cm from the sample surface during the first10 s after the LIBS event are given in Table 2 in units of parts perbillion (ppb).Over time, the concentrations of all of the products decreased
due to their diffusion into the volume of the chamber. Theconcentrations obtained using the same experimental apparatusin the absence of any explosive samples are also given. Note thatthe levels of ethanol, NO, NO2, HONO, and HCN were sig-nificantly elevated in all of the LIBS experiments.The SIFT experiments confirm that ethanol was produced at a
relatively higher concentration (one order of themagnitude higher)in comparison to the other reaction products (NO, NO2) of theFOX-7 laser decomposition (sample 1 in Table 1). Thus, newsample material was synthesized strictly without the use ofethanol as a solvent to demonstrate that the detected ethanolwas not present as an impurity in crystalline FOX-7 (sample 2 inTable 1). SIFT-MS analyses of the ablation plasma end productsagain confirmed the presence of relatively high concentrations ofC2H5OH, demonstrating that ethanol is indeed a major compo-nent of FOX-7 explosion fumes.Mechanism. An understanding of the decomposition me-
chanism plays a key role in the evaluation of properties of a newtype of explosive. Because of its unique features, the decomposi-tion mechanism of FOX-7 is expected to differ from that of RDXand HMX.30,31 However, the kinetics of elementary processes ofionization, excitation, and decomposition in the LIBS plasmaoccurs on the time scale of microseconds in qualitative agree-ment with previous work.14 A reaction scheme (Scheme 1) forthe decomposition of FOX-7 and for the formation of the finalstable products was constructed on the basis of the resultspresented in the previous sections and is discussed here.Laser radiation causes fragmentation, ionization, and atomiza-
tion of the molecules of the FOX-7 sample. The transientintermediate species H, CN, OH, NO, C, and N were observedon the basis of characteristic emission lines and bands in theoptical spectra, and the stable end products C2H5OH, HCHO,HCN, HONO, NH3, CH3CN, C2H4O, C2H2, NO2, NO, C3H6O,and H2O were observed via the occurrence of characteristicproduct ions on the SIFT-MS chemical ionization mass spectra.Note that the major stoichiometric explosion products N2 andCO2 generated in macroscopic quantities were not a subject ofthis investigation, as their production is well understood32 and as
Table 2. Concentrations in Parts Per Billion (ppb) of the Compounds Identified by SIFT-MS in an Ar Atmosphere Inside theExperimental Chamber after Initiation of the Explosive Sample Using 10 Laser Pulses
namea formula molecular weight ion products m/z background ppb (sample 1)a ppb (sample 2)
ammonia NH3 17 O2•þ 17, 35 79 5 123
water H2O 18 H3Oþ 19, 37, 55, 73, 91 0.29% 0.96% 0.13%
acetylene C2H2 26 O2•þ 26 0 7 25
hydrogen cyanide HCN 27 H3Oþ 28 4 121 105
formaldehyde HCHO 30 H3Oþ 31 19 187 67
nitric oxide NO 30 O2•þ 30 247 513 368
acetonitrile CH3CN 41 H3Oþ 42 0 0 6
acetaldehyde C2H4O 44 H3Oþ 45, 63, 81 0 18 74
ethanol C2H6O 46 H3Oþ 47, 65, 83 1378 4518 4194
nitrous acid HONO 47 H3Oþ 30, 48, 66 39 202 115
nitrogen dioxide NO2 48 O2•þ 46 345 246 696
acetone C3H6O 58 NOþ 88 4 57 5a Sample 1 is a regular FOX-7 sample provided by Explosia. Sample 2 has been synthesized specifically for this study avoiding any use of ethanol.
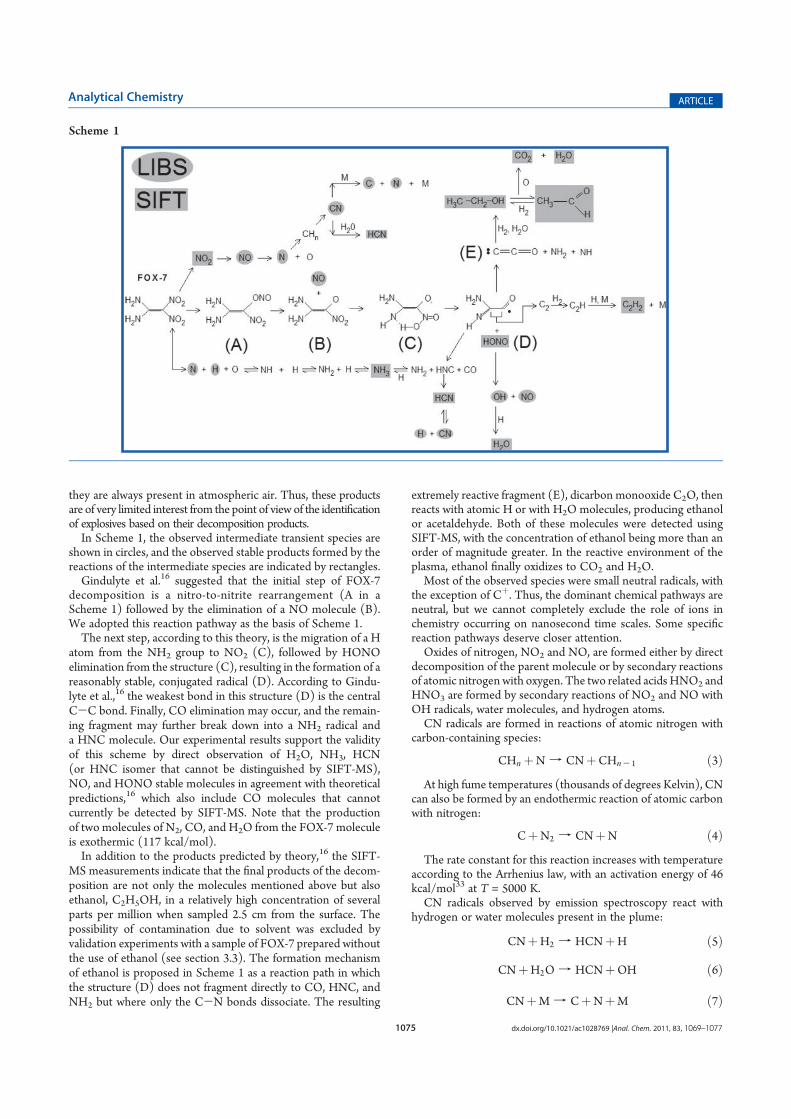
1075 dx.doi.org/10.1021/ac1028769 |Anal. Chem. 2011, 83, 1069–1077
Analytical Chemistry ARTICLE
they are always present in atmospheric air. Thus, these productsare of very limited interest from the point of view of the identificationof explosives based on their decomposition products.In Scheme 1, the observed intermediate transient species are
shown in circles, and the observed stable products formed by thereactions of the intermediate species are indicated by rectangles.Gindulyte et al.16 suggested that the initial step of FOX-7
decomposition is a nitro-to-nitrite rearrangement (A in aScheme 1) followed by the elimination of a NO molecule (B).We adopted this reaction pathway as the basis of Scheme 1.The next step, according to this theory, is the migration of a H
atom from the NH2 group to NO2 (C), followed by HONOelimination from the structure (C), resulting in the formation of areasonably stable, conjugated radical (D). According to Gindu-lyte et al.,16 the weakest bond in this structure (D) is the centralC-C bond. Finally, CO elimination may occur, and the remain-ing fragment may further break down into a NH2 radical anda HNC molecule. Our experimental results support the validityof this scheme by direct observation of H2O, NH3, HCN(or HNC isomer that cannot be distinguished by SIFT-MS),NO, and HONO stable molecules in agreement with theoreticalpredictions,16 which also include CO molecules that cannotcurrently be detected by SIFT-MS. Note that the productionof two molecules of N2, CO, and H2O from the FOX-7 moleculeis exothermic (117 kcal/mol).In addition to the products predicted by theory,16 the SIFT-
MS measurements indicate that the final products of the decom-position are not only the molecules mentioned above but alsoethanol, C2H5OH, in a relatively high concentration of severalparts per million when sampled 2.5 cm from the surface. Thepossibility of contamination due to solvent was excluded byvalidation experiments with a sample of FOX-7 prepared withoutthe use of ethanol (see section 3.3). The formation mechanismof ethanol is proposed in Scheme 1 as a reaction path in whichthe structure (D) does not fragment directly to CO, HNC, andNH2 but where only the C-N bonds dissociate. The resulting
extremely reactive fragment (E), dicarbon monooxide C2O, thenreacts with atomic H or with H2O molecules, producing ethanolor acetaldehyde. Both of these molecules were detected usingSIFT-MS, with the concentration of ethanol being more than anorder of magnitude greater. In the reactive environment of theplasma, ethanol finally oxidizes to CO2 and H2O.Most of the observed species were small neutral radicals, with
the exception of Cþ. Thus, the dominant chemical pathways areneutral, but we cannot completely exclude the role of ions inchemistry occurring on nanosecond time scales. Some specificreaction pathways deserve closer attention.Oxides of nitrogen, NO2 and NO, are formed either by direct
decomposition of the parent molecule or by secondary reactionsof atomic nitrogenwith oxygen. The two related acids HNO2 andHNO3 are formed by secondary reactions of NO2 and NO withOH radicals, water molecules, and hydrogen atoms.CN radicals are formed in reactions of atomic nitrogen with
carbon-containing species:
CHn þN f CNþCHn- 1 ð3ÞAt high fume temperatures (thousands of degrees Kelvin), CN
can also be formed by an endothermic reaction of atomic carbonwith nitrogen:
CþN2 f CNþN ð4ÞThe rate constant for this reaction increases with temperature
according to the Arrhenius law, with an activation energy of 46kcal/mol33 at T = 5000 K.CN radicals observed by emission spectroscopy react with
hydrogen or water molecules present in the plume:
CNþH2 f HCNþH ð5Þ
CNþH2O f HCNþOH ð6Þ
CNþM f CþNþM ð7Þ
Scheme 1
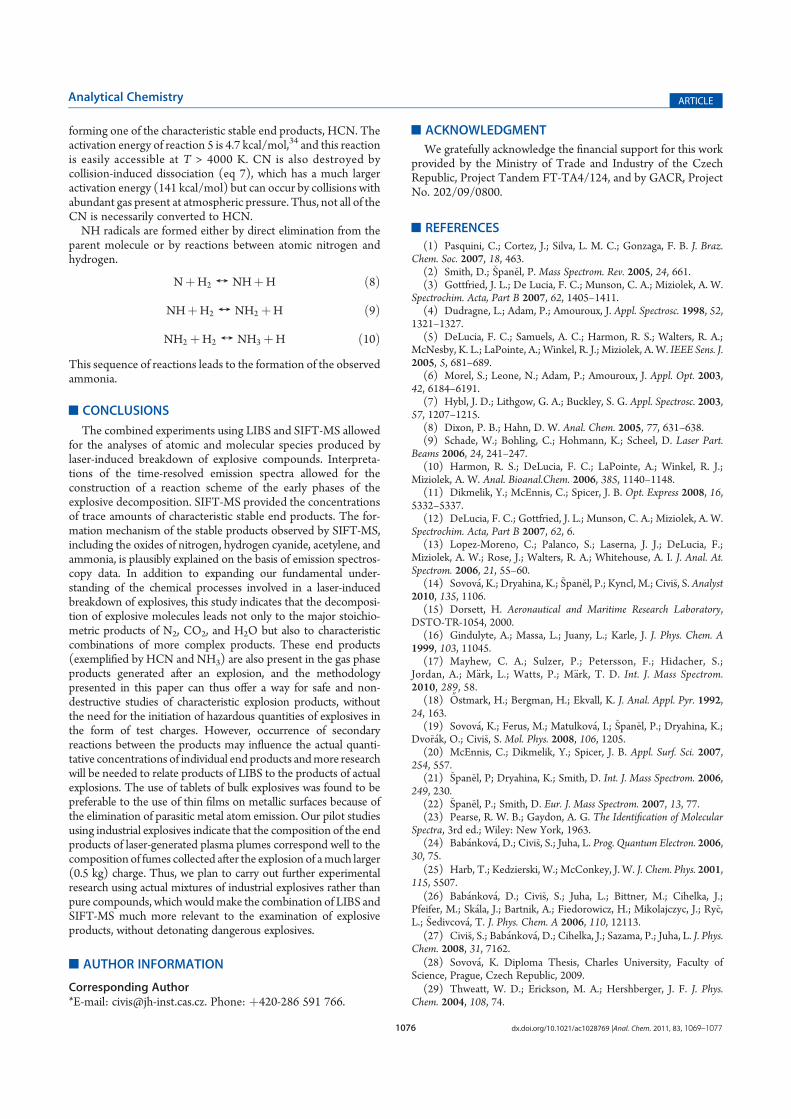
1076 dx.doi.org/10.1021/ac1028769 |Anal. Chem. 2011, 83, 1069–1077
Analytical Chemistry ARTICLE
forming one of the characteristic stable end products, HCN. Theactivation energy of reaction 5 is 4.7 kcal/mol,34 and this reactionis easily accessible at T > 4000 K. CN is also destroyed bycollision-induced dissociation (eq 7), which has a much largeractivation energy (141 kcal/mol) but can occur by collisions withabundant gas present at atmospheric pressure. Thus, not all of theCN is necessarily converted to HCN.NH radicals are formed either by direct elimination from the
parent molecule or by reactions between atomic nitrogen andhydrogen.
NþH2 T NHþH ð8Þ
NHþH2 T NH2 þH ð9Þ
NH2 þH2 T NH3 þH ð10ÞThis sequence of reactions leads to the formation of the observedammonia.
’CONCLUSIONS
The combined experiments using LIBS and SIFT-MS allowedfor the analyses of atomic and molecular species produced bylaser-induced breakdown of explosive compounds. Interpreta-tions of the time-resolved emission spectra allowed for theconstruction of a reaction scheme of the early phases of theexplosive decomposition. SIFT-MS provided the concentrationsof trace amounts of characteristic stable end products. The for-mation mechanism of the stable products observed by SIFT-MS,including the oxides of nitrogen, hydrogen cyanide, acetylene, andammonia, is plausibly explained on the basis of emission spectros-copy data. In addition to expanding our fundamental under-standing of the chemical processes involved in a laser-inducedbreakdown of explosives, this study indicates that the decomposi-tion of explosive molecules leads not only to the major stoichio-metric products of N2, CO2, and H2O but also to characteristiccombinations of more complex products. These end products(exemplified by HCN and NH3) are also present in the gas phaseproducts generated after an explosion, and the methodologypresented in this paper can thus offer a way for safe and non-destructive studies of characteristic explosion products, withoutthe need for the initiation of hazardous quantities of explosives inthe form of test charges. However, occurrence of secondaryreactions between the products may influence the actual quanti-tative concentrations of individual end products andmore researchwill be needed to relate products of LIBS to the products of actualexplosions. The use of tablets of bulk explosives was found to bepreferable to the use of thin films on metallic surfaces because ofthe elimination of parasitic metal atom emission. Our pilot studiesusing industrial explosives indicate that the composition of the endproducts of laser-generated plasma plumes correspond well to thecomposition of fumes collected after the explosion of amuch larger(0.5 kg) charge. Thus, we plan to carry out further experimentalresearch using actual mixtures of industrial explosives rather thanpure compounds, which wouldmake the combination of LIBS andSIFT-MS much more relevant to the examination of explosiveproducts, without detonating dangerous explosives.
’AUTHOR INFORMATION
Corresponding Author*E-mail: [email protected]. Phone: þ420-286 591 766.
’ACKNOWLEDGMENT
We gratefully acknowledge the financial support for this workprovided by the Ministry of Trade and Industry of the CzechRepublic, Project Tandem FT-TA4/124, and by GACR, ProjectNo. 202/09/0800.
’REFERENCES
(1) Pasquini, C.; Cortez, J.; Silva, L. M. C.; Gonzaga, F. B. J. Braz.Chem. Soc. 2007, 18, 463.
(2) Smith, D.; �Span�el, P. Mass Spectrom. Rev. 2005, 24, 661.(3) Gottfried, J. L.; De Lucia, F. C.; Munson, C. A.; Miziolek, A. W.
Spectrochim. Acta, Part B 2007, 62, 1405–1411.(4) Dudragne, L.; Adam, P.; Amouroux, J. Appl. Spectrosc. 1998, 52,
1321–1327.(5) DeLucia, F. C.; Samuels, A. C.; Harmon, R. S.; Walters, R. A.;
McNesby, K. L.; LaPointe, A.; Winkel, R. J.; Miziolek, A. W. IEEE Sens. J.2005, 5, 681–689.
(6) Morel, S.; Leone, N.; Adam, P.; Amouroux, J. Appl. Opt. 2003,42, 6184–6191.
(7) Hybl, J. D.; Lithgow, G. A.; Buckley, S. G. Appl. Spectrosc. 2003,57, 1207–1215.
(8) Dixon, P. B.; Hahn, D. W. Anal. Chem. 2005, 77, 631–638.(9) Schade, W.; Bohling, C.; Hohmann, K.; Scheel, D. Laser Part.
Beams 2006, 24, 241–247.(10) Harmon, R. S.; DeLucia, F. C.; LaPointe, A.; Winkel, R. J.;
Miziolek, A. W. Anal. Bioanal.Chem. 2006, 385, 1140–1148.(11) Dikmelik, Y.; McEnnis, C.; Spicer, J. B. Opt. Express 2008, 16,
5332–5337.(12) DeLucia, F. C.; Gottfried, J. L.; Munson, C. A.; Miziolek, A. W.
Spectrochim. Acta, Part B 2007, 62, 6.(13) Lopez-Moreno, C.; Palanco, S.; Laserna, J. J.; DeLucia, F.;
Miziolek, A. W.; Rose, J.; Walters, R. A.; Whitehouse, A. I. J. Anal. At.Spectrom. 2006, 21, 55–60.
(14) Sovov�a, K.; Dryahina, K.; �Span�el, P.; Kyncl, M.; Civi�s, S. Analyst2010, 135, 1106.
(15) Dorsett, H. Aeronautical and Maritime Research Laboratory,DSTO-TR-1054, 2000.
(16) Gindulyte, A.; Massa, L.; Juany, L.; Karle, J. J. Phys. Chem. A1999, 103, 11045.
(17) Mayhew, C. A.; Sulzer, P.; Petersson, F.; Hidacher, S.;Jordan, A.; M€ark, L.; Watts, P.; M€ark, T. D. Int. J. Mass Spectrom.2010, 289, 58.
(18)00Ostmark, H.; Bergman, H.; Ekvall, K. J. Anal. Appl. Pyr. 1992,
24, 163.(19) Sovov�a, K.; Ferus, M.; Matulkov�a, I.; �Span�el, P.; Dryahina, K.;
Dvo�r�ak, O.; Civi�s, S. Mol. Phys. 2008, 106, 1205.(20) McEnnis, C.; Dikmelik, Y.; Spicer, J. B. Appl. Surf. Sci. 2007,
254, 557.(21) �Span�el, P; Dryahina, K.; Smith, D. Int. J. Mass Spectrom. 2006,
249, 230.(22) �Span�el, P.; Smith, D. Eur. J. Mass Spectrom. 2007, 13, 77.(23) Pearse, R. W. B.; Gaydon, A. G. The Identification of Molecular
Spectra, 3rd ed.; Wiley: New York, 1963.(24) Bab�ankov�a, D.; Civi�s, S.; Juha, L. Prog. Quantum Electron. 2006,
30, 75.(25) Harb, T.; Kedzierski, W.; McConkey, J. W. J. Chem. Phys. 2001,
115, 5507.(26) Bab�ankov�a, D.; Civi�s, S.; Juha, L.; Bittner, M.; Cihelka, J.;
Pfeifer, M.; Sk�ala, J.; Bartnik, A.; Fiedorowicz, H.; Mikolajczyc, J.; Ry�c,L.; �Sedivcov�a, T. J. Phys. Chem. A 2006, 110, 12113.
(27) Civi�s, S.; Bab�ankov�a, D.; Cihelka, J.; Sazama, P.; Juha, L. J. Phys.Chem. 2008, 31, 7162.
(28) Sovov�a, K. Diploma Thesis, Charles University, Faculty ofScience, Prague, Czech Republic, 2009.
(29) Thweatt, W. D.; Erickson, M. A.; Hershberger, J. F. J. Phys.Chem. 2004, 108, 74.

1077 dx.doi.org/10.1021/ac1028769 |Anal. Chem. 2011, 83, 1069–1077
Analytical Chemistry ARTICLE
(30) Shalashilin, D. V.; Thomson, D. L. J. Phys. Chem. A 1997,101, 961.(31) Wu, C. J.; Fried, L. E. J. Phys. Chem. A 1997, 101, 8675.(32) �Span�el, P.; Dryahina, K.; Smith, D. Int. J. Mass Spectrom. 2006,
249, 230.(33) Babushok, V. I.; DeLucia, F. C.; Dagdigian, P. J.; Gottfried, J. L.;
Munson, C. A.; Nusea, M. J.; Miziolek, A. W. Spectrochim. Acta, Part B2007, 62, 1321.(34) Akhavan, J. The Chemistry of Explosives, 2nd ed.; The Royal
Society of Chemistry: Cambridge, U.K., 2004.


Curriculum vitae Personal
Born 28 December 1984, Mladá Boleslav
Higher eduction
2009 - present: PhD study: Physical chemistry Charles University in Prague Faculty of Science Passed exams including Cambridge English: Preliminary (PET), Physical chemistry, Mass spectrometry, Phytoremediation, Passed final PhD state examination in physical chemistry, 25 March 2013
2007 - 2009: MSc study: Environmental chemistry, Charles University in
Prague Faculty of Science MSc thesis title: Study of explosive materials using spectroscopic methods
2004 - 2007: BSc study: Environmental chemistry, Charles University in Prague Faculty of Science BSc thesis title: High resolution FTIR spectroscopy and gas chromatography study of decomposition products of PET material
Previous employment
2009 – present: J. Heyrovský Institute of physical chemistry, AVCR, v. v. i. Dolejškova 3, Prague Department of mass spectrometry
Postgraduate student 2008: Institute of Physics, AVCR, v. v. i.
Application of spectroscopic measurements in the plasma research 12 month part-time contract as laboratory assistant
2006 - 2009: J. Heyrovský Institute of physical chemistry, AVCR, v. v. i. Department of Fourier transform (FT) and laser spectroscopy Undergraduate student
Membership
Czech society for mass spectrometry Jan Marek Marci spectroscopic society Association of the Czech Chemical Societies
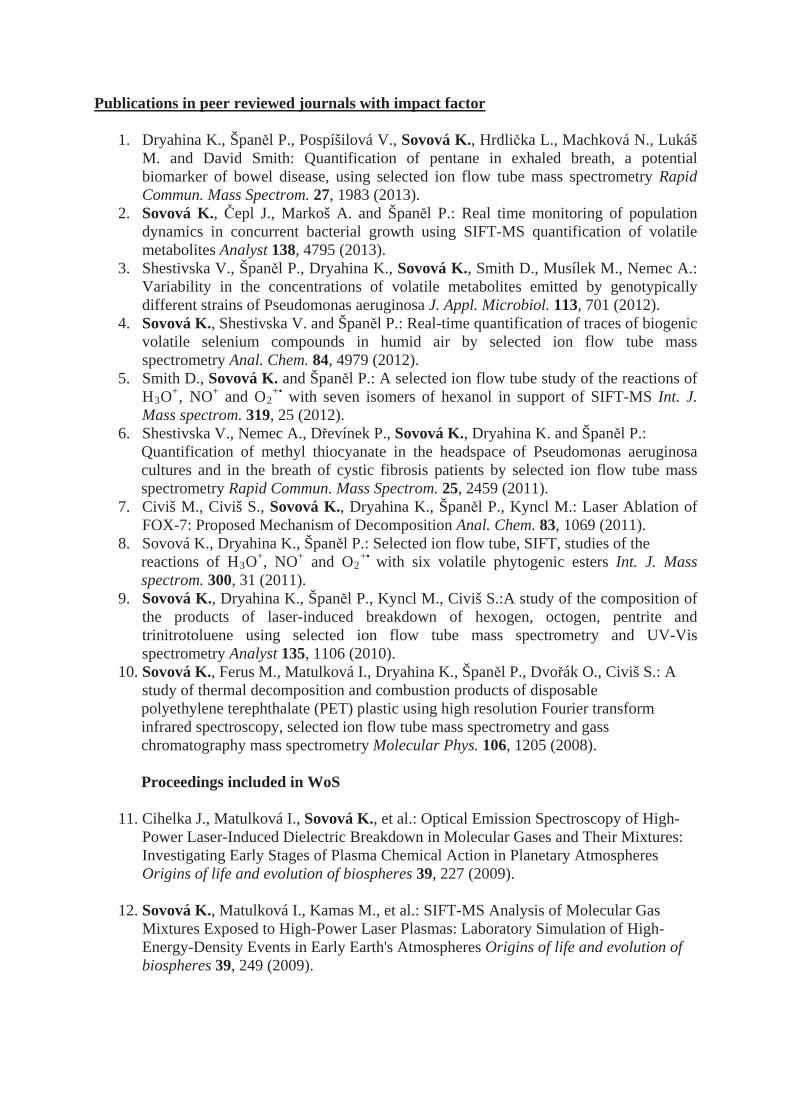
Publications in peer reviewed journals with impact factor
1. Dryahina K., Špan l P., Pospíšilová V., Sovová K., Hrdli ka L., Machková N., Lukáš M. and David Smith: Quantification of pentane in exhaled breath, a potential biomarker of bowel disease, using selected ion flow tube mass spectrometry Rapid Commun. Mass Spectrom. 27, 1983 (2013).
2. Sovová K., epl J., Markoš A. and Špan l P.: Real time monitoring of population dynamics in concurrent bacterial growth using SIFT-MS quantification of volatile metabolites Analyst 138, 4795 (2013).
3. Shestivska V., Špan l P., Dryahina K., Sovová K., Smith D., Musílek M., Nemec A.: Variability in the concentrations of volatile metabolites emitted by genotypically different strains of Pseudomonas aeruginosa J. Appl. Microbiol. 113, 701 (2012).
4. Sovová K., Shestivska V. and Špan l P.: Real-time quantification of traces of biogenic volatile selenium compounds in humid air by selected ion flow tube mass spectrometry Anal. Chem. 84, 4979 (2012).
5. Smith D., Sovová K. and Špan l P.: A selected ion flow tube study of the reactions of H3O+‚ NO+ and O2
+• with seven isomers of hexanol in support of SIFT-MS Int. J. Mass spectrom. 319, 25 (2012).
6. Shestivska V., Nemec A., D evínek P., Sovová K., Dryahina K. and Špan l P.: Quantification of methyl thiocyanate in the headspace of Pseudomonas aeruginosa cultures and in the breath of cystic fibrosis patients by selected ion flow tube mass spectrometry Rapid Commun. Mass Spectrom. 25, 2459 (2011).
7. Civiš M., Civiš S., Sovová K., Dryahina K., Špan l P., Kyncl M.: Laser Ablation of FOX-7: Proposed Mechanism of Decomposition Anal. Chem. 83, 1069 (2011).
8. Sovová K., Dryahina K., Špan l P.: Selected ion flow tube, SIFT, studies of the reactions of H3O+, NO+ and O2
+• with six volatile phytogenic esters Int. J. Mass spectrom. 300, 31 (2011).
9. Sovová K., Dryahina K., Špan l P., Kyncl M., Civiš S.:A study of the composition of the products of laser-induced breakdown of hexogen, octogen, pentrite and trinitrotoluene using selected ion flow tube mass spectrometry and UV-Vis spectrometry Analyst 135, 1106 (2010).
10. Sovová K., Ferus M., Matulková I., Dryahina K., Špan l P., Dvo ák O., Civiš S.: A study of thermal decomposition and combustion products of disposable polyethylene terephthalate (PET) plastic using high resolution Fourier transform infrared spectroscopy, selected ion flow tube mass spectrometry and gass chromatography mass spectrometry Molecular Phys. 106, 1205 (2008).
Proceedings included in WoS
11. Cihelka J., Matulková I., Sovová K., et al.: Optical Emission Spectroscopy of High-Power Laser-Induced Dielectric Breakdown in Molecular Gases and Their Mixtures: Investigating Early Stages of Plasma Chemical Action in Planetary Atmospheres Origins of life and evolution of biospheres 39, 227 (2009).
12. Sovová K., Matulková I., Kamas M., et al.: SIFT-MS Analysis of Molecular Gas Mixtures Exposed to High-Power Laser Plasmas: Laboratory Simulation of High-Energy-Density Events in Early Earth's Atmospheres Origins of life and evolution of biospheres 39, 249 (2009).

Lectures at scientific meetings
1. Summer school of mass spectrometry, Pec pod Sn žkou 20.9.-24.9. 2010: SIFT-MS: VOCs emitted by plants.
2. “SIFT-MS; current and proposed applications" ISTM, Medical School, Keele University, Thornburrow Drive, Stoke-on-Trent. Wednesday November 3rd 2010: SIFT-MS: VOC emissions from plants.
3. Second Ion Chemistry Meeting Dolní Malá Úpa, May 27 – 29. 2011: Real-time SIFT-MS detection of volatile forms of selenium released by plants.
4. Czech conference on mass spectrometry 19.-21.10. 2011, Hradec Králové: Selected Ion Flow Tube Mass Spectrometry.
5. 64. congress of the Association of Czech and Slovak Chemical Societies 25. - 27. June 2012 Olomouc: Selected Ion Flow Tube Mass Spectrometry.
Research projects
Co-ordinating & responsible person of “ Key Activity” number 7 (KA 7) (January 2013 – May 2014) in project: BIO-OPT-XUV (BOX) Research Team Advancement at the Faculty of Biomedical Engineering, Czech Technical University in Prague. Project duration: July 1, 2011 – May 30, 2014. Principal investigator of GAUK (Charles University Foundation) student project: Study of volatile compounds released by plants during phytoremediation of contaminated soil using selected ion flow tube mass spectrometry, SIFT-MS (2010-2013). Collaborator at: Selected ion flow tube mass spectrometry studies of volatile compounds emitted by bacterial cultures (PI Patrik Špan l, 2009-2012, Czech Science Foundation). Collaborator at: Research of new methods of detection of explosives (PI Svatopluk Civiš, 2007-2010, Czech ministry of trade and industry).
Short scientific visits in the UK and abroad
Keele University and Imperial College London (1 week in 2010) Open University (SIFT-MS laboratory, Dr. C. Turner) (1 week in 2010) Faculty of Bioscience Engineering - Organic Chemistry Environmental Organic Chemistry and Technology: EnVOC, Coupure links 653, 9000 Ghent – Belgium (1 week in 2012).

Copyright © 2022 FDOKUMEN