


Siew Fun Tang Swi Ee Cheah Editors - Taylor's University ...
388
Siew Fun Tang Swi Ee Cheah Editors Redesigning Learning for Greater Social Impact Taylor’s 9th Teaching and Learning Conference 2016 Proceedings
-
Upload
khangminh22 -
Category
Documents
-
view
1 -
download
0
Transcript of Siew Fun Tang Swi Ee Cheah Editors - Taylor's University ...

Siew Fun TangSwi Ee Cheah Editors
Redesigning Learning for Greater Social ImpactTaylor’s 9th Teaching and Learning Conference 2016 Proceedings

Siew Fun Tang • Swi Ee CheahEditors
Redesigning Learningfor Greater Social ImpactTaylor’s 9th Teaching and LearningConference 2016 Proceedings
123

EditorsSiew Fun TangTaylor’s UniversitySubang Jaya, SelangorMalaysia
Swi Ee CheahTaylor’s UniversitySubang Jaya, SelangorMalaysia
ISBN 978-981-10-4222-5 ISBN 978-981-10-4223-2 (eBook)DOI 10.1007/978-981-10-4223-2
Library of Congress Control Number: 2017945264
© Springer Nature Singapore Pte Ltd. 2018This work is subject to copyright. All rights are reserved by the Publisher, whether the whole or partof the material is concerned, specifically the rights of translation, reprinting, reuse of illustrations,recitation, broadcasting, reproduction on microfilms or in any other physical way, and transmissionor information storage and retrieval, electronic adaptation, computer software, or by similar or dissimilarmethodology now known or hereafter developed.The use of general descriptive names, registered names, trademarks, service marks, etc. in thispublication does not imply, even in the absence of a specific statement, that such names are exempt fromthe relevant protective laws and regulations and therefore free for general use.The publisher, the authors and the editors are safe to assume that the advice and information in thisbook are believed to be true and accurate at the date of publication. Neither the publisher nor theauthors or the editors give a warranty, express or implied, with respect to the material contained herein orfor any errors or omissions that may have been made. The publisher remains neutral with regard tojurisdictional claims in published maps and institutional affiliations.
Printed on acid-free paper
This Springer imprint is published by Springer NatureThe registered company is Springer Nature Singapore Pte Ltd.The registered company address is: 152 Beach Road, #21-01/04GatewayEast, Singapore 189721, Singapore

Foreword
With the evolving and fluid nature of the education field, there is a need foreducators to not only influence the discipline-specific knowledge of their studentsbut also incorporate social responsibility aspects into the pedagogy. It is time foreducation institutions to rethink, redesign learning, improve pedagogy, and buildacademic programmes to meet emerging social needs of a complex and changingworld. We need to deliver social impact education and prepare students to besocially responsible practitioners and advocators in their communities.
This year, the Taylor’s 9th Teaching and Learning Conference 2016(TTLC2016) has chosen to focus on “Redesigning Learning for Greater SocialImpact” to challenge attendees to create a more comprehensive understanding ofsocial and/or socio-emotional learning and how it relates to theories, research,practice, policy, technology, and success stories taking place in classroomsworldwide. TTLC2016 aims to explore in breadth, depth, and quality the bestmodels and practices, strategies, lessons learnt, and success stories from design ofpedagogical intervention and learning culture, to the inclusion of socio-emotionalsupport in teaching and policy to transforming technology to support the socialfabric of education institutions.
Additionally, the conference aims to provide fertile ground to stimulate andchallenge established beliefs about learning. The manuscripts focus on thesubthemes-related innovative learning processes for greater social impact, socialand emotional development, use of technology in learning, global student experi-ences, teaching and learning culture, policies and transformation on social learningculture, and other related topics on socio-emotional teaching and learning.
v

Contents
Part I Student Experiences and Social Emotional Development
1 Correlation Study Between CGPA and PO Attainments: A CaseStudy for Taylor’s University School of Engineering . . . . . . . . . . . . 3Reynato Andal Gamboa, Satesh Namasivayamand Ramesh Singh
2 Competency-Based Assessment of the Diploma in PhlebotomyGraduates: An Initial Evaluation . . . . . . . . . . . . . . . . . . . . . . . . . . . . 15John Patrick B. Tadiosa
3 Redesigning Massive Open Online Courses (MOOCs) Basedon Lecturers’ Perception. . . . . . . . . . . . . . . . . . . . . . . . . . . . . . . . . . . 29Sukhminder Kaur, Wei Wei Goh and Pei Gee Kng
4 Service Quality of Higher Education Institution AmongIts International Students: Inputs to CompetitiveUniversity Image . . . . . . . . . . . . . . . . . . . . . . . . . . . . . . . . . . . . . . . . . 39Reynalda B. Garcia, Norma L. Menez, Bella Luz Dinglasanand Bernardo Hornilla
5 An Exploratory Study of Sociocultural Adaptation AmongInternational Students in Malaysia . . . . . . . . . . . . . . . . . . . . . . . . . . 47Bessie Ong and K.C. Cheong
6 First-Year Experience (FYE) Curriculum Review for Academic,Social, and Emotional Connect. . . . . . . . . . . . . . . . . . . . . . . . . . . . . . 61Prema Ponnudurai and Rajalakshmi Ganesan
7 Social Media Dependency: The Implications of TechnologicalCommunication Use Among University Students . . . . . . . . . . . . . . . 71Malissa Maria Mahmud, Chandra Reka Ramachandiranand Othman Ismail
vii

8 The Mediating Role of Shadow Education (SE) Participation onGoal Orientation, Study Habits, Connectedness, and AcademicPerformance. . . . . . . . . . . . . . . . . . . . . . . . . . . . . . . . . . . . . . . . . . . . . 89Rosalina M. de Guzman, Socorro M. Rodriguezand Belinda V. de Castro
Part II Culture of Teaching and Learning
9 Blended Learning: Uncovering Challenges in ImplementingOnline Videos in Higher Education . . . . . . . . . . . . . . . . . . . . . . . . . . 113Karim Hajhashemi and Nerina Caltabiano
10 Conceptualising Humour to Enhance Learning AmongEngineering Undergraduates . . . . . . . . . . . . . . . . . . . . . . . . . . . . . . . 119Siow Chun Lim and Swi Ee Cheah
11 Scaffolding Social Support Amongst the Fresher StudentsThrough Mapping Activities . . . . . . . . . . . . . . . . . . . . . . . . . . . . . . . . 129Arniza Ghazali
12 The Effects of School Culture Impactingon the Process of Change . . . . . . . . . . . . . . . . . . . . . . . . . . . . . . . . . . 141Latha Ravindran
13 An Exploratory Study on the Role of Blended Learning Practicesto Achieve Twenty-First Century Skills Among CulinaryStudents at University in Malaysia. . . . . . . . . . . . . . . . . . . . . . . . . . . 149Dias Soeiro Joaquim and Balasubramanian Kandappan
14 Transforming Teaching-Learning Culture by Appropriate Useof Discrimination Index in Item Analysis . . . . . . . . . . . . . . . . . . . . . 159Benjamin Samraj Prakash Earnest, Prabal Bhargava,Anjan Kumar Das, Dato’ Md. Tahir Md. Azhar,Nurjahan Mohd. Ibrahim and Roland Gamini Sirisinghe
15 Item Difficulty and Discrimination Index in Single BestAnswer MCQ: End of Semester Examinations at Taylor’sClinical School . . . . . . . . . . . . . . . . . . . . . . . . . . . . . . . . . . . . . . . . . . . 167Keng Yin Loh, Ihab Elsayed, M.I. Nurjahan and G.S. Roland
16 Types of School, Medium of Instruction, and Students’ AcademicPerformance in Business Studies at Pre-university . . . . . . . . . . . . . . 173Chin Sok Fun
17 Rasch Model Approach to Analyze Quality of PreserviceTeachers’ Teaching Behavior to PedagogyContent Knowledge . . . . . . . . . . . . . . . . . . . . . . . . . . . . . . . . . . . . . . . 185Rayendra Wahyu Bachtiar
viii Contents

Part III Technology as Best Practices in Teaching and Learning
18 Interactive and Engaging Module Sites: The RASA Model . . . . . . . 197Wong Yau Hsiung
19 A Semantic-Based Document Checker . . . . . . . . . . . . . . . . . . . . . . . . 205Jer Lang Hong
20 Technology Innovation in Dairy Farm Management . . . . . . . . . . . . 215Devi Ponnu
21 Participation, Produsage, and Pedagogy: Social Media as a Toolto Enhance Teaching and Learning Experience . . . . . . . . . . . . . . . . 223Vandana Saxena
22 WikiDoc—Integrating Wikipedia Semantic for DocumentAssistance. . . . . . . . . . . . . . . . . . . . . . . . . . . . . . . . . . . . . . . . . . . . . . . 239Jer Lang Hong
23 Supervised Educational Data Mining to Discover Students’Learning Process to Improve Students’ Performance . . . . . . . . . . . . 249Ching Chieh Kiu
24 Effectiveness of the Integration of Tell Me More Coursewarein the TOEIC Performance of College Students . . . . . . . . . . . . . . . . 259Celia A. Tibayan
25 Appropriate Use of Technology: How Useful Are Calculationsof Discrimination Index by Optical Mark Readers in ItemAnalysis of Single Best Answer MCQ Tests with SmallStudent Numbers? . . . . . . . . . . . . . . . . . . . . . . . . . . . . . . . . . . . . . . . . 267Benjamin Samraj Prakash Earnest, Prabal Bhargava,Anitha Ponnupillai, Suresh Ponnusamy, Nurjahan Mohd. Ibrahimand Roland Gamini Sirisinghe
26 Undergraduate Students’ Perceptions as Producer of ScreencastVideos in Learning Mathematics . . . . . . . . . . . . . . . . . . . . . . . . . . . . 277Irene Yang and Bee Theng Lau
Part IV Innovative Practices in Teaching and Learning
27 Assessment of Media Literacy Campaign for Grade 4 Pupilsat a Public Elementary School in the Philippines . . . . . . . . . . . . . . . 289Gerby R. Muya and Ma. Anna Corina P. Kagaoan
28 Graduate Tracer Study for Industrial Engineering Programfrom Batch 2013 to 2015. . . . . . . . . . . . . . . . . . . . . . . . . . . . . . . . . . . 301Ryan Jeffrey P. Curbano and Ricky V. Bustamante
Contents ix

29 The Effectiveness of MOOC Among Learners Basedon Kirkpatrick’s Model . . . . . . . . . . . . . . . . . . . . . . . . . . . . . . . . . . . 313Wei Wei Goh, Seng Yue Wong and Enna Ayub
30 Changes in Students’ Level of Awareness of Social TopicsThrough Project-Based Learning in the Intensive EnglishProgram at Taylor’s Centre for Languages . . . . . . . . . . . . . . . . . . . 325Clarence Lim Kia Seng and Nur Ili Syazwani binti Mohd. Azhar
31 The Journey of TGCSP with Special Attention on ServiceLearning. . . . . . . . . . . . . . . . . . . . . . . . . . . . . . . . . . . . . . . . . . . . . . . . 337Siow Chun Lim, Satesh Namasivayamand Chockalingam Aravind Vaithilingam
32 Community Coworking Spaces: The Community New LearningSpace in Thailand . . . . . . . . . . . . . . . . . . . . . . . . . . . . . . . . . . . . . . . . 345Kamolrat Intaratat
33 The Effectiveness and Impact of Social Media Approachon Students’ Learning Performances . . . . . . . . . . . . . . . . . . . . . . . . . 355Seng Yue Wong and Wee Jing Tee
34 Formative Assessment via Group Video Assignment for BusinessSchool Students in Tertiary Education System . . . . . . . . . . . . . . . . . 365Seng Yue Wong, Wou Onn Choo, Wen Yeen Chueand Ching Chieh Kiu
35 Education as a Political Tool for Empowering Studentsand the Community. . . . . . . . . . . . . . . . . . . . . . . . . . . . . . . . . . . . . . . 375R. Ratneswary V. Rasiah
36 The Impact of Experiential Learning Programme TowardsGraduates’ Career Capabilities . . . . . . . . . . . . . . . . . . . . . . . . . . . . . 391Lee Kim Lian
x Contents

Chapter 1Correlation Study Between CGPA and POAttainments: A Case Study for Taylor’sUniversity School of Engineering
Reynato Andal Gamboa, Satesh Namasivayam and Ramesh Singh
Abstract Despite the decades-long implementation of outcome-based education(OBE) in engineering education, the cumulative grade point average (CGPA) is stillbeing used by many employers as the sole metric of the graduate’s performance.CGPA indicates the general abilities of a graduate but not specific enough toidentify whether the abilities he possessed is fit for the job. Generally, employerswant to see what the graduate can do. In the growing competitiveness in the jobmarket, employers are now looking for engineering graduates with the right hardand soft skills that could handle the complexity of the job. This is a major reasonwhy universities offering engineering programmes are employing OBE frameworkin its quest to prepare graduates to be job-ready upon graduation. In spite of this,recent literature revealed that many employers find it difficult to get the rightgraduate for a specific engineering job. This reflects the inability of CGPA to showwhat the graduate knows and is able to do upon graduation. The questions now are“Do graduates with high CGPA possess adequate skills to be job ready?” and “Dograduates with low CGPA possess inadequate skills to be job ready? This paperpresents a correlation study between CGPA and programme outcomes(PO) attainments to determine whether they are convergent or divergent. The resultof this study can serve as a basis whether CGPA can still be considered as a validmetric of job performance or should it be supplemented by a PO certificate tocomplement the CGPA.
Keywords Cumulative grade point average � Integrated grade point average �Programme outcomes
R.A. Gamboa (&) � S. NamasivayamTaylor’s University, Subang Jaya, Selangor, Malaysiae-mail: [email protected]
S. Namasivayame-mail: [email protected]
R. SinghUniversity of Malaya, Kuala Lumpur, Malaysiae-mail: [email protected]
© Springer Nature Singapore Pte Ltd. 2018S.F. Tang and S.E. Cheah (eds.), Redesigning Learning for GreaterSocial Impact, DOI 10.1007/978-981-10-4223-2_1
3

1.1 Introduction
Due to the complexity of engineering jobs brought about by increasing worldinterconnectedness and cultural exchanges (globalization), the Washington Accord(WA) was signed in 1989 to raise the bar of the engineers’ preparedness to face thechallenges of the twenty-first century (Karim, 2014; Sunthonkanokpong, 2011). Itaims to ensure equivalency among accredited programmes of signatory membercountries. Under the accord, an engineering graduate of an accredited programmehas the educational qualification for licensure, registration, and practice in anothersignatory member country (Milligan, 2011). The WA also mandates the Institutionof Higher Learning (IHL) to adopt outcome-based education (OBE) in engineeringprogrammes and undergo accreditation guided by the accrediting agency assess-ment criteria. Under this criteria, future engineers are expected to possess attributessuch as lifelong learners, critical thinkers, effective communicators, high ethicalstandards and professionalism, ingenuity and creativity, business and managementskills, leadership skills, and dynamic and resilient, among others (NationalAcademy of Engineering, 2004).
More than a decade ago since OBE implementation, employers are still strug-gling to find the right candidate for a specific engineering job. The survey con-ducted by ManpowerGroup (2015) revealed that in the Asia-Pacific region, thetalent shortages range from 28 to 48% from 2006 to 2015, respectively. JobStreet.Com (2015) in its 2015 Job Outlook Report posted that up to 69% of the employershad difficulty in getting candidates with the right skills and 29% were unable to findcandidates that match the job criteria. The Aspiring Minds (2014) of India in its2014 Employability Report stated that only 7.47% of engineering graduates areemployable. All these reports found out that the reasons for this difficulty are thatcandidates lack hard skills and soft skills, particularly communication skills. Thismeans that the IHLs are not doing enough to prepare the graduates according to theneeds of the industries. This could be a case of grade inflation in which Rojstaczerand Healy (2012) said that in a wide range of schools, A’s represent about 43% ofall letter grades for the last 70 years, an increase of 28% since 1960. Sadler (2015)noted that the student’s grade awarded and his level of achievement are not com-parable. Similarly, Roth (1996) found that reported grades in earlier decades of thetwentieth century are a significantly better predictor of job performance than thosegrades reported in the later decades. This theory of grade inflation is believed to bestill being practised by many IHLs to this date and had not done enough to assessthe students’ graduate attributes for him to be job ready. Assessment drives learning(Boud, 2010) and should show the extent to which the student achieved the neededskills. According to Lazlo Bock, a senior Vice-President of Google, “CGPAsdoesn’t matter”; instead, they are using “structured behavioural interviews” toassess candidates (Rice, 2013). Brown (2015) articulated that “CGPA isn’teverything” and employers are looking at skills, qualities, and experiences thatCGPA does not capture. A number of IHLs are currently doing some initiatives toaddress this concern by capturing the student’s activities including involvements in
4 R.A. Gamboa et al.
extracurricular activities that are not captured in the academic transcript. Amongthose initiatives are the “Shine Programme” (Taylor’s University, 2015) and inte-grated CGPA for selected universities in Malaysia (Irsyad, 2015). However, theseinitiatives are still in their infant stage and no outcomes yet had been generated.Another alternative or supplement to CGPA is the PO attainment. This is the focusof OBE implementation with the objective of assessing the PO attainment of eachstudent for the improvement of the teaching and learning activities in the pro-gramme. Figure 1.1 shows the OBE framework based on the EngineeringAccreditation Council (EAC) Manual 2012 of Malaysia (Gamboa & Namasivayam,2013).
As indicated in Fig. 1.1, the OBE framework adopts the top-down design andbottom-up implementation and assessment approach (Killen, 2000). It consists ofthree levels of outcomes assessment as follows:
Continual Quality Improvement (CQI)
Data AnalysisLO & PO
Attainments
Quantitative Assessments
Learning Outcomes
(LO)
Programme Outcomes
(PO)
Programme Educational Objectives
(PEO)
Continual Quality Improvement (CQI)
Quantitative & Qualitative
Assessments
Continual Quality Improvement (CQI)
Qualitative Assessments
Data AnalysisPEO Attainments
Module Loop(End of Semester)
Programme Loop(upon graduation)
External Loop(3-5 years after graduation)
Alumni Industrial Advisory Panel
(IAP)
ParentsExternal
ExaminersSTAKEHOLDERSStudents
Staff
Employers
Data AnalysisPO Attainments
Fig. 1.1 OBE process model based on EAC manual
1 Correlation Study Between CGPA and PO Attainments … 5

• Inner Loop—This is the LO assessment loop at the module level. The LO andPO attainments of the students in the module are conducted at the end of thesemester. The LO and PO results are then analysed to determine the effective-ness of the implementation of the previous CQI plan in proving the student’sperformance. A new CQI plan is then developed for the succeeding semester tofurther improve the teaching and learning activities in the module. A directassessment is usually employed.
• Middle Loop—This is the PO assessment loop at the programme level con-ducted for each cohort upon graduation. It also generates the PO attainment ofeach student and the PO attainment of the cohort. CQI plan is also developed toimprove the programme and hence improve student’s learning experiences tomaximize their learning potential. Both direct and indirect assessments can beconducted.
• Outer Loop—This is the PEO assessment loop at the school level. It is con-ducted 3–5 years after graduation and usually done through indirect assessment.
The manual also adopted the WA 12 generic POs that each student is expectedto achieve upon graduation:
1. Engineering Knowledge. Apply knowledge of mathematics, science, engi-neering fundamentals, and an engineering specialization to the solution ofcomplex engineering problems;
2. Problem Analysis. Identify, formulate, research literature, and analyse com-plex engineering problems reaching substantiated conclusions using firstprinciples of mathematics, natural sciences, and engineering sciences;
3. Design/Development of Solutions. Design solutions for complex engineeringproblems and design systems, components, or processes that meet specifiedneeds with appropriate consideration for public health and safety, cultural,societal, and environmental considerations;
4. Investigation. Conduct investigation into complex problems usingresearch-based knowledge and research methods including design of experi-ments, analysis and interpretation of data, and synthesis of information toprovide valid conclusions;
5. Modern Tool Usage. Create, select, and apply appropriate techniques;6. Resources, and modern engineering and IT tools, including prediction;7. Modelling, to complex engineering activities, with an understanding of the
limitations;8. The Engineer and Society. Apply reasoning informed by contextual knowl-
edge to assess societal, health, safety, legal, and cultural issues and the con-sequent responsibilities relevant to professional engineering practice;
9. Environment and Sustainability. Understand the impact of professional;10. Engineering solutions in societal and environmental contexts demonstrate
knowledge of and the need for sustainable development;11. Ethics. Apply ethical principles and commit to professional ethics;
6 R.A. Gamboa et al.

12. Responsibilities and norms of engineering practice;13. Communication. Communicate effectively on complex engineering activities
with the engineering community and with society at large, such as being able tocomprehend and write effective reports and design documentation, makeeffective presentations, and give and receive clear instructions;
14. Individual and Team Work. Function effectively as an individual, and as amember or leader in diverse teams and in multidisciplinary settings;
15. Lifelong Learning. Recognize the need for, and have the preparation andability to engage in independent and lifelong learning in the broadest context oftechnological change;
16. Project Management and Finance. Demonstrate knowledge; and17. Understanding of engineering and management principles and applying these to
one’s own work, as a member and leader of a team, to manage projects and inmultidisciplinary environments.
One of the objectives of OBE is to assess the level of students achievement ofthe POs—the graduate attributes and competencies. This paper would like to assessthe relationship between CGPA and PO attainments to answer the followingquestions:
• Do graduates with high CGPA possess adequate skills to be job ready?• Do graduates with low CGPA possess inadequate skills to be job ready?• How is PO attainment related to CGPA?
1.2 Methodology
The Taylor’s Mechanical Engineering programme was used to evaluate the rela-tionship between CGPA and PO attainments. The programme adopted the 12 POsof EAC which were reworded to support the PEOs and the niche of the school. Inparticular, data from two graduate cohorts (August 2015 and March 2016 seme-sters) of the programme were used in this study. In a number of conferences andOBE workshops attended by the authors, OBE experts emphasized the use ofculminating (modules taken in the final year) and significant modules in POassessment. This is supported by Killen (2000) who stressed that assessment shouldreflect the knowledge and skills that are most important for students to learn. TheUniversity of Hawaii (2015) also expressed that students performed best if they areintroduced to the PO and given more time and opportunities to reinforce theirlearning skills before being assessed. Similarly, the Engineering AccreditationCouncil (2012) manual listed the prescribed minimum significant modules that anOBE curriculum should offer. Thus, the PO model based on selected modules wasused to generate the students’ PO attainment for the above-mentioned cohorts. Thisis also endorsed by the Mechanical Engineering programme of the school. Inputs tothis study are the modules assessments marks of each student in the cohort as well
1 Correlation Study Between CGPA and PO Attainments … 7

as their respective CGPAs. The number of modules used in PO assessment is about50% of the entire curriculum modules. Table 1.1 shows the PO mapping of selectedmodules used for PO assessment.
It can be observed in Table 1.1 that the selected modules are distributed in thevarious years with more modules included towards year 3 and year 4. The students’PO attainment was calculated using the End of Semester Assessment Tool (ESAT)developed at the module-level and programme-level assessments. Each student’sPO scores were used to calculate the integrated CGPA (ICGPA) as illustrated inFig. 1.2. In line with the experts’ view on the importance of culminating andsignificant modules, the emphasis of these modules in PO assessment is deemednecessary for a more valid result. Due to the absence of literature on the quantifiableweight of each module, as they progressed over the years, the authors proposed theadoption of PO constants of 10, 20, 30, and 40% weight for year 1, year 2, year 3,
Table 1.1 Selected modules to PO mapping
Modules Programme outcomes (PO)
1 2 3 4 5 6 7 8 9 10 11 12
Year 1ENG1223 x x x
ENG1243 x x x
ENG1233 x x x
ENG1213 x x x
Year 2ENG2313 x x x
ENG2423 x x x
ENG2513 x x x x
MEC2213 x x
Year 3ENG3243 x
MEC3913 x x x x x x
ENG3723 x x
ENG3413 x x x
MEC3923 x x x x
MEC3313 x x x
Year 4ENG4213 x
MEC4713 x x
ENG4913 x x x x x x x x x x
ENG4623 x x x
ENG4926 x x x x x x x x x x
ENG4213 x
Snapshots 11 15 6 8 7 5 6 2 4 3 4 5
8 R.A. Gamboa et al.

and year 4 modules, respectively. The weights were distributed accordingly—say,5% each for semesters 1 and 2, 10% each for semesters 3 and 4, 15% each forsemesters 5 and 6, and 20% each for semesters 7 and 8, respectively. This is to givemore emphasis to the higher year modules since they were believed to be where thestudents are expected to demonstrate the intended learning outcomes.
In Fig. 1.2, for each student and for each semester, the accumulated POattainment was calculated (average of the 12 POs) and the corresponding ICGPA iscomputed according to Eqs. 1.1, 1.2 and 1.3.
For Sem 1,
ICGPA1 ¼ IGPA1 � 100% ð1:1Þ
For Sem 2,
ICGPA2 ¼ IGPA1 � 5%þ IGPA2 � 95% ð1:2Þ
…
For Sem n,
ICGPAn ¼ IGPAn�1 �Xn�1
j¼1
%Wtj þ IGPAn � 1�Xn�1
j¼1
%Wtj
!ð1:3Þ
From Eq. 1.2, the ICGPA at semester 2 is calculated based on 5% of IGPA forsemester 1 plus 95% of IGPA of semester 2. The IGPA is estimated based on theconventional grade table shown in Fig. 1.2. In general, for any semester n, theICGPA is calculated based on Eq. 1.3.
SEM. SEM 1 SEM 2 SEM 3 SEM 4 SEM 5 SEM 6 SEM 7 SEM 8 80 100 A 4.00 Excellent%Wt 5% 5% 10% 10% 15% 15% 20% 20% 75 79 A- 3.67 Very GoodAccu. PO 70 74 B+ 3.33 GoodIGPA 65 69 B 3.00ICGPA 60 64 B- 2.67GPA 55 59 C+ 2.33CGPA 50 54 C 2.00
47 49 D+ 1.6744 46 D 1.3340 43 D- 1.000 39 F 0.00 Fail
AcceptablePass
Marginal Pass
Fig. 1.2 ICGPA calculation of PO attainment
1 Correlation Study Between CGPA and PO Attainments … 9
1.3 Results and Discussion
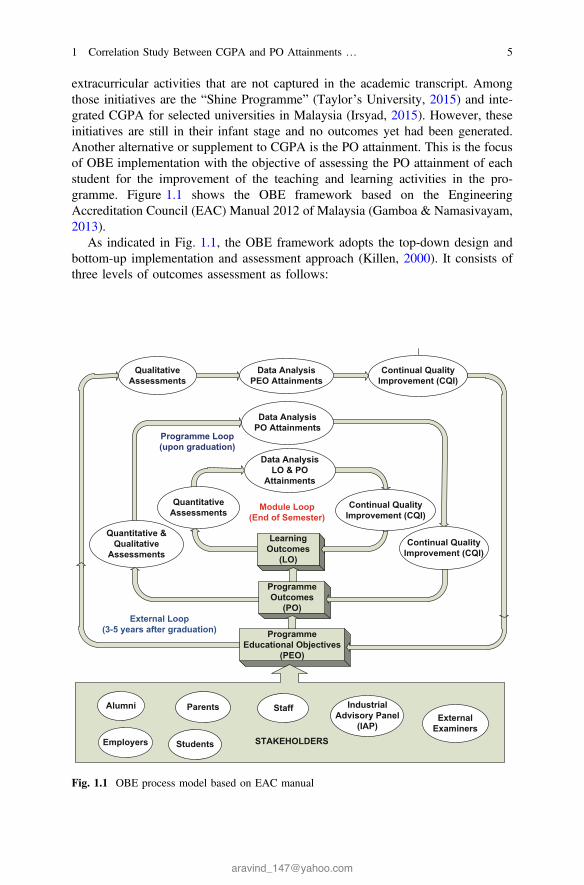
With the implementation of Eq. 1.3 into ESAT for the graduates of August 2015and March 2016 semesters, the 12 PO attainments were generated for each studentusing the selected modules listed in Table 1.1. From these results, the CGPA versusICGPA result was generated as shown in Figs. 1.3 and 1.4 with 17 and 29 students,respectively. The students’ name was made hidden to protect their identities. It canbe observed from Figs. 1.3 and 1.4 that generally good students have good CGPAand ICGPA result and low-performing students have low CGPA and low ICGPAresult.
Using the data in Fig. 1.3, a two-paired sample t test was conducted to determinethe correlation between CGPA and ICGPA. The p value of a two-tailed test at 5%level of significance is 0.262661. This result means that there is no significantdifference between CGPA and ICGPA which further concludes that there is nosignificant difference between CGPA ad PO attainments. The same test was con-ducted for the March 2016 semester graduates and yields a p value of 0.536293 at5% level of significance. Again, this result means that there is no significant dif-ference between CGPA and PO attainments. Figures 1.5, 1.6 and 1.7 show thesnapshots of the comparison of CGPA and ICGPA for a good, average, and belowaverage CGPA performance of a student in this study.
It can be observed from the web diagram of Figs. 1.5, 1.6 and 1.7 how theCGPA and ICGPA vary from semester 1 to semester 8. There are some spikes fromboth CGPA and ICGPA which might be due to some student’s uncertainties, butgenerally, the results go hand in hand in the majority of the semesters.
NO. STUD. ID NAME OF STUDENTS INTAKE CGPA ICGPA1 Feb-11 2.59 2.602 Feb-11 2.60 2.673 Feb-11 2.37 2.204 Feb-11 2.41 2.675 Feb-11 2.58 3.266 Sep-11 2.77 3.007 Mar-12 2.60 3.268 Mar-12 3.02 3.339 Mar-12 3.46 3.33
Mar-12 3.44 3.74Mar-12 3.27 3.26Mar-12 3.10 3.07Mar-12 2.71 2.74Mar-12 3.33 3.60Mar-12 3.55 3.74Mar-12 3.48 3.33
1011121314151617 Mar-12 2.85 2.00
MECHANICAL ENGINEERING MAY-16
Fig. 1.3 CGPA versus ICGPA result for August 2015 graduates
10 R.A. Gamboa et al.

NO. STUD. ID NAME OF STUDENTS INTAKE CGPA ICGPA1 Oct-10 2.49 2.742 Feb-11 2.47 2.203 Mar-12 2.76 3.204 Mar-12 2.92 2.405 Mar-12 2.75 2.136 Mar-12 2.61 2.467 Mar-12 2.88 3.008 Aug-12 2.66 2.269 Aug-12 2.69 2.74
Aug-12 2.49 2.871011 Aug-12 3.48 3.20
Aug-12 2.81 3.26Aug-12 3.33 3.26Aug-12 3.50 3.87Aug-12 2.90 3.13Aug-12 2.32 2.07
17 Aug-12 2.81 2.93Aug-12 2.99 3.26Aug-12 2.89 2.93Aug-12 3.31 3.00Aug-12 2.48 2.13Aug-12 3.42 3.54Aug-12 3.04 2.74Aug-12 3.07 3.07Aug-12 3.43 3.20Aug-12 3.35 3.60Aug-12 2.98 2.93
1213141516
1819202122232425262728 Aug-12 3.69 3.4729 Aug-12 2.80 2.74
MECHANICAL ENGINEERING NOV-16
Fig. 1.4 CGPA versus PO attainment for March 2016 graduates
2.0
2.67
3.0
3.67
4.0Sem 1
Sem 2
Sem 3
Sem 4
Sem 5
Sem 6
Sem 7
Sem 8
CGPA = 3.35ICGPA = 3.60
SEMESTER SEM 1 SEM 2 SEM 3 SEM 4 SEM 5 SEM 6 SEM 7 SEM 8PO1 70.79 62.75 72.73 69.23 70.21 66.67PO2 70.79 64.00 76.32 63.93 69.00 65.63 71.67PO3 82.61 80.77 84.44 81.13 75.00 72.73PO4 52.00 76.47 77.78 66.67PO5 72.73 75.00 75.00 66.67PO6 58.82 75.00 83.33 66.67PO7 77.78 87.50 76.19 70.97 66.67PO8 78.57PO9 80.00 73.68 71.43PO10 77.27 65.22 71.43PO11 87.50 72.73 70.00PO12 73.33 80.00 65.57 100.00 80.00AVE. PO 75 60 76 66 80 74 77 70IGPA 3.67 2.67 3.67 3.00 4.00 3.33 3.67 3.33ICGPA 3.67 2.72 3.57 3.13 3.70 3.63 3.47 3.60GPA 3.13 3.40 3.56 3.33 3.33 3.13 3.47 3.40CGPA 3.13 3.27 3.37 3.36 3.36 3.32 3.34 3.35
INTEGRATED CGPA CALCULATION FOR SELECTED MODULES
(a)
(b)
Fig. 1.5 Good student: a ICGPA calculation and b web diagram
1 Correlation Study Between CGPA and PO Attainments … 11

1.4 Conclusion
The relationship between CGPA and PO attainments was thoroughly studied usingthe PO model based on culminating and significant modules as suggested by OBEexperts and implemented through ESAT. Two cohorts were used to give more validresults which both showed that there is no significant difference between CGPA andPO attainments. This is the case for Taylor’s University; however, this result mightvary from one IHL to another depending on how explicit the PO assessment processis and the IHL’s practice of awarding student’s grade. Since CGPA showed only the
2.0
2.67
3.0
3.67
4.0Sem 1
Sem 2
Sem 3
Sem 4
Sem 5
Sem 6
Sem 7
Sem 8
CGPA = 3.04ICGPA = 2.74
SEMESTER SEM 1 SEM 2 SEM 3 SEM 4 SEM 5 SEM 6 SEM 7 SEM 8PO1 77.53 70.59 66.67 69.23 59.57 66.67PO2 77.53 80.00 72.37 62.30 69.00 65.63 59.17PO3 86.96 76.92 77.78 75.47 62.50 72.73PO4 68.00 76.47 66.67 66.67PO5 66.67 80.00 68.75 66.67PO6 70.59 71.43 64.58 66.67PO7 77.78 50.00 76.19 61.29 66.67PO8 64.29PO9 80.00 63.16 71.43PO10 72.73 56.52 61.90PO11 50.00 63.64 70.00PO12 66.67 80.00 75.41 66.67 80.00AVE. PO 81 73 72 65 70 73 64 69IGPA 4.00 3.33 3.33 3.00 3.33 3.33 2.67 3.00ICGPA 4.00 3.36 3.33 3.07 3.23 3.33 3.07 2.74GPA 3.42 3.17 3.19 2.93 2.33 2.87 2.89 3.07CGPA 3.42 3.29 3.29 3.16 2.99 2.96 3.04 3.04
INTEGRATED CGPA CALCULATION FOR SELECTED MODULES
(a)
(b)
Fig. 1.6 Average student: a ICGPA calculation and b web diagram
2.0
2.67
3.0
3.67
4.0Sem 1
Sem 2
Sem 3
Sem 4
Sem 5
Sem 6
Sem 7
Sem 8
CGPA = 2.48ICGPA = 2.07
SEMESTER SEM 1 SEM 2 SEM 3 SEM 4 SEM 5 SEM 6 SEM 7 SEM 8PO1 65.17 50.98 72.73 75.00 44.68 66.67PO2 65.17 48.00 69.74 57.14 48.00 40.63 55.83PO3 69.57 65.38 68.89 49.06 62.50 63.64PO4 44.00 61.76 58.82 44.44 66.67PO5 72.73 50.00 56.25 66.67PO6 52.94 78.57 60.42 66.67PO7 66.67 62.50 66.67 64.52 66.67PO8 57.14PO9 70.00 57.89 57.14PO10 68.18 60.87 57.14PO11 62.50 54.55 60.00PO12 58.33 70.00 73.77 33.33 60.00AVE. PO 67 48 69 61 62 64 52 63IGPA 3.00 1.67 3.00 2.67 2.67 2.67 2.00 2.67ICGPA 3.00 1.74 2.87 2.74 2.67 2.67 2.40 2.13GPA 2.67 2.84 2.52 1.67 2.33 2.50 2.27 2.33CGPA 2.67 2.75 2.66 2.39 2.38 2.54 2.50 2.48
INTEGRATED CGPA CALCULATION FOR SELECTED MODULES
(a)
(b)
Fig. 1.7 Below average student: a ICGPA calculation and b web diagram
12 R.A. Gamboa et al.

academic performance and no direct indication of the achievement of graduateattributes, a PO certificate showing the skills attainment of the graduate is a goodcomplement to CGPA.
Acknowledgements The authors would like to acknowledge the Division Office of Taylor’sUniversity School of Engineering for providing the students’ CGPA data. Similar acknowledge-ment is extended to lecturers of the School of Engineering for their submission of duly accom-plished ESAT files for March 2016 semester.
References
Aspiring Minds. (2014). National employability report: Engineers annual report 2014. RetrievedJuly 29, 2015, from http://www.aspiringminds.in/docs/national_employabilityReport_engineers_annual_report_2014.pdf
Boud, D. (2010). Assessment 2020: Seven Propositions for Assessment Reform in HigherEducation. Australia: Australian Learning and Teaching Council.
Brown, L. (2015, March 9). Does college GPA matter when looking for a job? RetrievedNovember 9, 2015, from https://www.noodle.com/articles/does-college-gpa-matter-when-looking-for-a-job
Engineering Accreditation Council. (2012). Engineering programme accreditation manual 2012.Retrieved September 29, 2012, from http://www.bem.org.my/v3/accreditation_manual.html
Gamboa, R. A., & Namasivayam, S. (2013). A blueprint of software enabled quantitativemeasurement of programme outcomes: A case study for TayLor’s University. Journal ofEngineering Science and Technology(Special Issue on Engineering Education), 67–79.
Irsyad, A. (2015). Implementing the new integrated CGPA: Are we finally getting it right?Retrieved August 20, 2016, from http://www.malaysiandigest.com/news/565544-implementing-the-new-integrated-cgpa-are-we-finally-getting-it-right.html
JobStreet.Com. (2015, April 22). Employers expect to hire less in Q2 2015. Retrieved July 29,2015, from http://www.jobstreet.com.my/career-resources/employers-expect-hire-less-q2-2015/#.VZL4oRuqqko
Karim, J. N. (2014). Towards a converged and global set of competencies for graduates ofengineering programs in a globalization-governed world. World Federation of EngineeringOrganizations, Journal IDEAS, 1(18), 15–32.
Killen, R. (2000). Outcome based education-principles and possibilities (pp. 1–24). Faculty ofEducation: University of New Castle.
ManpowerGroup. (2015). Talent Shortage Survey. Retrieved July 16, 2015, from http://www.manpowergroup.com/wps/wcm/connect/db23c560-08b6-485f-9bf6-f5f38a43c76a/2015_Talent_Shortage_Survey_US-lo_res.pdf?MOD=AJPERES
Milligan, M. (2011). Global economy requires global view on accreditation. Retrieved August 18,2016, from http://www.abet.org/wp-content/uploads/2015/05/ncees-licensure-exchange-feb-20111.pdf
National Academy of Engineering. (2004). The Engineer of 2020: Visions of Engineering in theNew Century: National Academy of Engineering.
Rice, Z. C. (2013). 3 simple reasons google doesn’t hire the top college grads. Retrieved fromhttps://mic.com/articles/83377/3-simple-reasons-google-doesn-t-hire-the-top-college-grads#.3whrNvoHN
Rojstaczer, S., & Healy, C. (2012). Where A Is Ordinary: The Evolution of American College andUniversity Grading, 1940–2009. Teachers College Record. Retrieved November 9, 2015, fromhttp://www.tcrecord.org/content.asp?contentid=16473
1 Correlation Study Between CGPA and PO Attainments … 13
https://mic.com/articles/83377/3-simple-reasons-google-doesn-t-hire-the-top-college-grads#.3whrNvoHN

Roth, P. L., BeVier, C. A., Switzer III, F. S., & Schippmann, J. S. (1996). Meta-analyzing therelationship between grades and job performance. Journal of Applied Psychology, 81(15),548–556.
Sadler, R. (2015). Explainer: What is a GPA and What Use Is It? Retrieved August 19, 2016, fromhttp://theconversation.com/explainer-what-is-a-gpa-and-what-use-is-it-36004
Sunthonkanokpong, W. (2011). Future global visions of engineering education. Paper presented atthe 2nd International Science, Social-Science, Engineering and Energy Conference 2010:Engineering Science and Management.
Taylor’s University. (2015). Multiple surveys have uncovered what employers really want.Retrieved July 29, 2015, from http://university.taylors.edu.my/teaching-learning/student-holistic-development-shine-award/shine-programme
University of Hawaii. (2015). Curriculum mapping/curriculum matrix. Retrieved April 12, 2016,from https://manoa.hawaii.edu/assessment/howto/mapping.htm
14 R.A. Gamboa et al.

Chapter 2Competency-Based Assessmentof the Diploma in Phlebotomy Graduates:An Initial Evaluation
John Patrick B. Tadiosa
Abstract Outcomes-based education (OBE) has been recently implemented in thePhilippine educational system which is aimed toward directing the focus of edu-cation into a more learner-centered approach through a set of competencies that astudent must achieve by the end of the teaching–learning process. This allows betterassessment of graduates and facilitates the process leading to better outcomes. Thispaper is designed to determine the level of achievement of the competencies of thediploma in Phlebotomy graduates as perceived by the graduates’ themselves and asperceived by their training officers. From the initial evaluation made, the compe-tencies expected from the graduates in terms of theoretical knowledge and technicalskills (WM = 4.00), interpersonal skills (WM = 4.19), critical thinking andproblem-solving skills (WM = 3.88), and the demonstration of professional andethical behavior (WM = 4.09) were all achieved in general. Therefore, the cur-riculum program is said to be effective. On the other hand, the results of theresponses of the graduates’ self-assessment and the assessment made by trainingofficers were found to be significantly different when computed statistically. Furtherstudies should be conducted to help improve the assessment process of the cur-riculum program.
Keywords Phlebotomy � Outcomes-based education � Competency-basedassessment
2.1 Introduction
Over the years, the Philippine educational system has adapted a variety of teachingand learning methodologies to equip graduates with the right amount of knowledge,skills, and attitudes to allow them to become productive members of the society.Recently, the country made a huge step in its educational system by adapting
J.P.B. Tadiosa (&)Lyceum of the Philippines University–Batangas, Batangas City, Philippinese-mail: [email protected]
© Springer Nature Singapore Pte Ltd. 2018S.F. Tang and S.E. Cheah (eds.), Redesigning Learning for GreaterSocial Impact, DOI 10.1007/978-981-10-4223-2_2
15

outcomes-based education (OBE), which is aimed toward directing the focus of theteaching–learning process into a more learner-centered approach (Inocian &Inocian, 2016). This output- and outcomes-driven approach has been proven tofacilitate the learning process and to empower students for creating a sustainablefuture (De Guzman, 2016). Furthermore, this approach emphasizes that the centerof the learning process is the learner itself and introduces strategic educationalplanning that is aimed at achieving results (Hejazi, 2011) and not simply a matter ofreplacing “objectives” with “outcomes” (Norman, 2006).
In the year 2013, the College of Allied Medical Professions (CAMP) at Lyceumof the Philippines University (LPU)—Batangas implemented a new curriculumprogram wherein the students who enrolled in the Medical Laboratory Scienceprogram should undergo a two (2)-year diploma in Phlebotomy program which is apreparatory program for the said Medical Laboratory Science program. However, astudent may opt to exit the program after the initial two (2) years and obtain adiploma which they can present to their prospective future employers in securingand applying for their jobs. LPU—Batangas is the only university in the wholePhilippines offering this framework of ladderized program of the MedicalLaboratory Science curriculum. This program is a product of a benchmarkingactivity conducted wherein it has been recommended that a competency-basedMedical Technology (Medical Laboratory Science) using the ladder concept maybe formalized in such a way that the first two years would lead to an associatedegree equivalent, hence, diploma in Phlebotomy (Valdez, 2012). A list of expectedoutcomes based from the curriculum map should be achieved by the graduates asthey finish the two (2)-year program. Furthermore, in each phase of the curriculum,these educational outcomes should be used as the framework for assessment(Harden, Crosby, & Davis, 1999). The level of achievement of these expectedoutcomes as perceived by the graduates and their previous training officers shouldbe established to determine whether the current instructional design for teachingPhlebotomy is sufficient to achieve the expected outcomes of the program.
This pilot study aims to initially establish the effectiveness of theoutcomes-based instructional design utilized in the Diploma in Phlebotomy pro-gram by assessing the level of achievement of the listed competencies in the cur-riculum map that are expected from the graduates of Diploma in Phlebotomy basedfrom their perception or self-assessment and from the assessment of their previoustraining officers. Likewise, the study aims to determine the differences in the per-ceptions of the graduates and training officers on the level of achievement of theexpected competencies to determine if there is a gap between the school instructionand the needs of the industry. Studies show that in dentistry, the different evalua-tions including self-assessment and external assessment which could be donethrough professors’ assessment may help students to improve their understanding ofcertain principles and improve the teaching effectiveness of education (Kirov,Kazakova, & Kirilova, 2014).
16 J.P.B. Tadiosa

2.2 Literature Review
2.2.1 Outcomes-Based Education
Outcomes-based education (OBE) involves a complex combination of restructuringthe curriculum, assessment, and reporting practices to emphasize the achievementof high-order learning and mastery. Thus, it is aimed at facilitating desired changesin the students, through the increase in knowledge, skill development, and/orpositively influencing attitudes, values and judgment within the context (Mamat,2014).
Aside from three of the most important determinants of quality educationnamely—effectiveness, efficiency, and sustainability, it is also important that therelevance of education is taken into consideration. This means that not only theneeds of the students are addressed in the education process, but also the needs ofthe employers and in the industry, for that matter, should also be addressed. Thiswill also provide the future graduates an educational experience that can beparalleled with the rest of the world (Commission on Higher Education, 2012).However, the full implementation of the said OBE curriculum remains to be achallenge since it offers fresh pedagogical approaches and therefore will alsorequire shifting to output-oriented teaching and learning environment (Limon,2016). As compared to conventional teaching methods, OBE provides highergrades in terms of academic performance especially when applied to sciences(Akir, Eng, & Malie, 2012) and English (Anh & Thanh, 2014).
In outcomes-based education, it is important that the competencies or perfor-mance indicators are well defined. This insures that the assessment made to studentsis coherent and consistent based on real-life criteria, providing opportunities todemonstrate proficiency in a specific competency and outcomes level, and thereforeimproving the quality of assessment (Boateng, Bass, Blaszak, & Farrar, 2009).Therefore, teachers applying OBE in their daily teaching should be well preparedwhich will allow them to provide students with appropriate and purposeful learningexperiences so that they can maximize the fruits of learning (Killen, 2000).
2.2.2 Phlebotomy
Phlebotomy is considered as the art of drawing blood, and for many centuries, it isstill considered one of the most common invasive procedures in the healthcaresetting (Lavery & Ingram, 2005). However, the practice varies considerablybetween and among healthcare workers and may also vary among countries(Shahangian et al., 2005). These differences may include variations in bloodsampling techniques, training, safety protocols and procedures, disposal system,and the availability of ample protection to healthcare workers. However, despitethese differences, the phlebotomy practices must all be geared toward providing
2 Competency-Based Assessment of the … 17

quality care to patients by performing proper collection techniques which has anoverall effect of the quality of sample being produced for laboratory testing.Therefore, it is imperative that blood collectors (phlebotomists) are well versed ofthe fundamentals of phlebotomy to avoid leading to inaccurate test results, leadingto misdiagnosis and mistreatment of the patient (Nayal et al., 2011). Furthermore, ifnot performed correctly, errors resulting from phlebotomy may cause serious harmto patients be it death or a major disability. Establishing and implementingquality-control mechanisms in the process which are composed of materials andmethods to promote better outcomes (Grable & Gill, 2005).
As stipulated in the writing made by Graham Ford, the fundamental principle inmedical practice was greatly based on the fact that there are four body fluids orhumors which are blood, phlegm, yellow bile, and black bile. It was believed thatan excess of these substances results to a disease so therefore, procedures such aspurging, starving, vomiting, and bloodletting (phlebotomy) are the reasonable andlogical form of treatment to reverse the disease process. Even before the time ofHippocrates in 460 B.C, the art of bloodletting was already a practice. Furthermore,there were people who already specialized in this art and were known as barbersurgeons during the middle ages. During the eighteenth and nineteenth centuries,the art of bloodletting became a very common practice but was declared quackeryby the end of nineteenth century after an incident involving George Washington,the first US President, who died after letting nine pints of blood within 24 h (ThePhlebotomy Pioneer, 2012).
According to the manual of Montgomery County Community College (2015), aphlebotomist is a member of the healthcare delivery team whose primary respon-sibility is collecting blood specimens from patients. These specimens are used forclinical laboratory analysis and thereby provide physicians with vital informationused in making diagnoses, following progress, and treating patients. Phlebotomistsare in great demand for employment in hospitals, physicians’ offices or clinics, orby commercial reference laboratories. Phlebotomists must be able to collect bloodcompetently, safely, and in a professional manner.
The art of Phlebotomy might sometimes be erroneously considered as a rel-atively easy task to perform, and it may bridge the gap between the patient andthe laboratory. In order to attain a good grasp of the phlebotomy practice, a yearof training may be necessary as this amount of training corresponds to anequivalent of close to 99% accuracy during the first attempt of blood collection.However, a phlebotomist’s success is not only depicted by the number of actualperformance of the procedure (Vuk, Cipek, & Jukic, 2015). With the continuousdevelopment of technology in the field of Phlebotomy, many useful devices arebeing developed to help in doing the process and therefore will reflect betterquality of specimens collected and improve the welfare and safety of the patients.However, there is no perfect protocol that can specifically contain the rightinformation and the right conditions in order to a phlebotomist to achieve aperfect blood draw. The efforts made in prioritizing the safety of the patients andthe quality of service provided are the primary instrument which will allow the
18 J.P.B. Tadiosa

practice of phlebotomy to serve as a link between the patients and the laboratory(Ialongo & Bernardini, 2015).
2.3 Methodology
2.3.1 Research Design
This research study utilized descriptive research design and quantitative method-ology in its analysis to initially establish the level of achievement of the compe-tencies that are expected from the graduates of Diploma in Phlebotomy based fromthe graduates’ perception or self-assessment and from the assessment of theirprevious training officers during the graduates’ Phlebotomy clinical practicum.
2.3.2 Respondents
The study involved 105 Diploma in Phlebotomy graduates batch 2015–2016 atLyceum of the Philippines University. There were a total of 121 graduates for batch2015–2016 constituting a retrieval rate of 86.78% or 105 out of 121 graduates.
2.3.3 Instrument
The study utilized the survey questionnaire method. The questionnaire was validatedand approved by the dean of the program. The graduates were given a list of theexpected competencies declared in the curriculum map through a survey question-naire and were asked to rate themselves using a five-point rating scale on the level ofachievement of the said competencies. Likewise, the same set of graduates was alsoassessed by their respective previous training officers during the graduates’Phlebotomy clinical practicum using the same list of expected competencies.
2.3.4 Statistical Analysis
The data were processed and analyzed to determine the means and were alsoexamined to determine the differences between the responses of the graduates’self-assessment and the assessment from the training officers using independentT-test analysis.
2 Competency-Based Assessment of the … 19
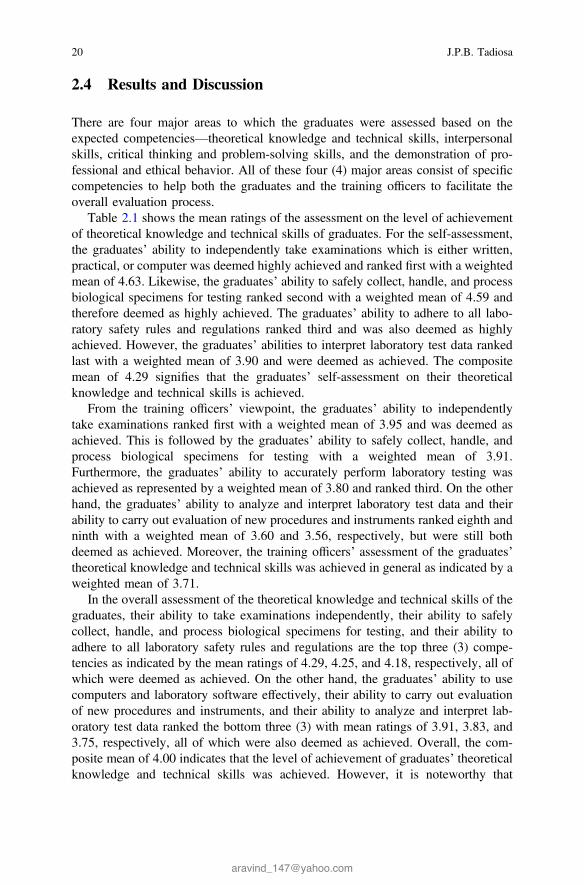
2.4 Results and Discussion
There are four major areas to which the graduates were assessed based on theexpected competencies—theoretical knowledge and technical skills, interpersonalskills, critical thinking and problem-solving skills, and the demonstration of pro-fessional and ethical behavior. All of these four (4) major areas consist of specificcompetencies to help both the graduates and the training officers to facilitate theoverall evaluation process.
Table 2.1 shows the mean ratings of the assessment on the level of achievementof theoretical knowledge and technical skills of graduates. For the self-assessment,the graduates’ ability to independently take examinations which is either written,practical, or computer was deemed highly achieved and ranked first with a weightedmean of 4.63. Likewise, the graduates’ ability to safely collect, handle, and processbiological specimens for testing ranked second with a weighted mean of 4.59 andtherefore deemed as highly achieved. The graduates’ ability to adhere to all labo-ratory safety rules and regulations ranked third and was also deemed as highlyachieved. However, the graduates’ abilities to interpret laboratory test data rankedlast with a weighted mean of 3.90 and were deemed as achieved. The compositemean of 4.29 signifies that the graduates’ self-assessment on their theoreticalknowledge and technical skills is achieved.
From the training officers’ viewpoint, the graduates’ ability to independentlytake examinations ranked first with a weighted mean of 3.95 and was deemed asachieved. This is followed by the graduates’ ability to safely collect, handle, andprocess biological specimens for testing with a weighted mean of 3.91.Furthermore, the graduates’ ability to accurately perform laboratory testing wasachieved as represented by a weighted mean of 3.80 and ranked third. On the otherhand, the graduates’ ability to analyze and interpret laboratory test data and theirability to carry out evaluation of new procedures and instruments ranked eighth andninth with a weighted mean of 3.60 and 3.56, respectively, but were still bothdeemed as achieved. Moreover, the training officers’ assessment of the graduates’theoretical knowledge and technical skills was achieved in general as indicated by aweighted mean of 3.71.
In the overall assessment of the theoretical knowledge and technical skills of thegraduates, their ability to take examinations independently, their ability to safelycollect, handle, and process biological specimens for testing, and their ability toadhere to all laboratory safety rules and regulations are the top three (3) compe-tencies as indicated by the mean ratings of 4.29, 4.25, and 4.18, respectively, all ofwhich were deemed as achieved. On the other hand, the graduates’ ability to usecomputers and laboratory software effectively, their ability to carry out evaluationof new procedures and instruments, and their ability to analyze and interpret lab-oratory test data ranked the bottom three (3) with mean ratings of 3.91, 3.83, and3.75, respectively, all of which were also deemed as achieved. Overall, the com-posite mean of 4.00 indicates that the level of achievement of graduates’ theoreticalknowledge and technical skills was achieved. However, it is noteworthy that
20 J.P.B. Tadiosa

evidence suggests that evaluating students’ knowledge through practice alone maynot provide an accurate assessment of their understanding and skills (Fordham,2005).
Table 2.2 shows the mean ratings of the assessment on the level of achievementof the expected interpersonal skills of graduates. From the graduates’self-assessment, their ability to instruct patients clearly prior to specimen collectionranked first with a weighted mean of 4.57 and was deemed as highly achieved. Thisis followed by graduates’ ability to follow verbal and written instructions with aweighted mean of 4.53 and was deemed as highly achieved. Furthermore, thegraduates’ ability to communicate with other professionals both verbally and inwriting with a weighted mean of 4. 37 ranked last and was deemed as achieved. The
Table 2.1 Mean ratings of the assessment on the level of achievement of theoretical knowledgeand technical skills of graduates
Competencies Self Training officer Overall
WM VI R WM VI R WM VI R
Independently takeexaminations (written,practical, computer)
4.63 HA 1 3.95 A 1 4.29 A 1
Safely collect, handle, andprocess biologicalspecimens for testing
4.59 HA 2 3.91 A 2 4.25 A 2
Accurately performlaboratory testing
4.29 A 4 3.80 A 4 4.04 A 4
Analyze and interpretlaboratory test data
3.90 A 9 3.60 A 8 3.75 A 9
Monitor testingprocedures, equipment andprofessional/technicalcompetency usingquality-assurancemethodologies
4.25 A 6 3.61 A 7 3.93 A 6
Operate instrumentationproperly and performappropriate preventive andcorrective maintenance
4.26 A 5 3.67 A 6 3.96 A 5
Adhere to all laboratorysafety rules and regulations
4.50 HA 3 3.86 A 3 4.18 A 3
Use computers andlaboratory softwareeffectively
4.10 A 7.5 3.72 A 5 3.91 A 7
Carry out the evaluation ofnew procedures andinstruments
4.10 A 7.5 3.56 A 9 3.83 A 8
Composite mean 4.29 A 3.71 A 4.00 A
Legend 4.50–5.00 = Highly Achieved (HA); 3.50–4.49 = Achieved (A); 2.50–3.49 = Moderatelyachieved (MA); 1.50–2.49 = Slightly achieved; and 1.00–1.49 = Not achieved
2 Competency-Based Assessment of the … 21

level of achievement of the interpersonal skills from the graduates’ own point ofview is achieved in general as represented by a weighted mean of 4.49.
On the other hand, according to the training officers, the graduates’ ability tofollow verbal and written instructions ranked first as represented by a weightedmean of 3.96 and was deemed as achieved. Both the graduates’ ability to com-municate with other professionals and the ability to instruct patients clearly prior tospecimen collection obtained a weighted mean of 3.84 and were both deemed asachieved. The composite mean of 3.90 indicates that the graduates’ interpersonalskills were achieved as perceived by the training officers.
In the summative assessment of the level of achievement of interpersonal skillsof graduates, their ability to follow verbal and written instructions ranked first witha mean rating of 4.25 and was deemed as achieved. The graduates’ ability toinstruct patients clearly prior to specimen collection ranked second with a meanrating of 4.20. Lastly, the graduates’ ability to communicate with other profes-sionals ranked last with a mean rating of 4.10. Overall, the level of achievement ofthe interpersonal skills of graduates, as indicated by a weighted composite mean of4.19, was achieved. Therefore, the graduates are able to communicate effectivelywith the hospital staff, their colleagues, and especially to their patients. Therefore,the graduates were able to recognize problems inside the laboratory and be able tosolve them efficiently while applying the basic principles and techniques used invarious laboratory processes.
The mean ratings of the assessment on the level of achievement of criticalthinking and problem-solving skills are shown in Table 2.3. For theself-assessment, the graduates’ ability to generate and evaluate the validity of thedata and assure its reliability in patient care ranked first with a weighted mean of4.28 and deemed as achieved. This is followed by the graduates’ ability to
Table 2.2 Mean ratings of the assessment on the level of achievement of interpersonal skills ofgraduates
Competencies Self Training officer Overall
WM VI R WM VI R WM VI R
Follow verbal and writteninstructions
4.53 HA 2 3.96 A 1 4.25 A 1
Communicate with facultymembers, fellow students,laboratory staff, and otherhealthcare professionalsboth verbally and inwriting
4.37 A 3 3.84 A 2.5 4.10 A 3
Instruct patients clearlyprior to specimencollection
4.57 HA 1 3.84 A 2.5 4.20 A 2
Composite mean 4.49 A 3.90 A 4.19 A
Legend 4.50–5.00 = Highly Achieved (HA); 3.50–4.49 = Achieved (A); 2.50–3.49 = Moderatelyachieved (MA); 1.50–2.49 = Slightly achieved; and 1.00–1.49 = Not achieved
22 J.P.B. Tadiosa

demonstrate administrative skills with a weighted mean of 4.18 and deemed asachieved. Moreover, the graduates’ ability to recognize errors and ability to inte-grate and interpret analytical data and establish a course of action to solve problemsranked last with a weighted mean of 4.13 but was still deemed as achieved.Furthermore, from their own perception, a composite mean of 4.18 indicates thatthe graduates’ critical thinking and problem-solving skills were achieved.
With regard to the training officers, the graduates’ ability to generate andevaluate the validity of the data and assure its reliability in patient care ranked firstwith a weighted mean of 3.57 and deemed as achieved. This is followed by thegraduates’ ability to recognize errors and the ability to integrate and interpretanalytical data and establish a course of action to solve problem as represented by aweighted mean of 3.56 and was also deemed as achieved. However, the graduates’ability to recognize and identify problems then take appropriate corrective actionand the demonstration of administrative skills were moderately achieved as rep-resented by the means 3.49 and 3.47, respectively. A composite mean of 3.57indicates that from the training officers’ point of view, the graduates’ criticalthinking and problem-solving skills were achieved.
Table 2.3 Mean ratings of the assessment on the level of achievement of critical thinking andproblem-solving skills of graduates
Competencies Self Training officer Overall
WM VI R WM VI R WM VI R
Generate and evaluate thevalidity of the data andassure its reliability inpatient care
4.28 A 1 3.57 A 1 3.92 A 1
Recognize errors and theability to integrate andinterpret analytical data andestablish a course of actionto solve problems
4.13 A 4 3.56 A 2 3.85 A 2
Recognize and identifyproblems then takeappropriate corrective action
4.14 A 3 3.49 MA 3 3.81 A 4
Demonstrate administrativeskills consistent withphilosophies of qualityassurance, continuousquality improvement,laboratory education, fiscalresource management, andappropriate composureunder stressful conditions
4.18 A 2 3.47 MA 4 3.82 A 3
Composite mean 4.18 A 3.57 A 3.88 A
Legend 4.50–5.00 = Highly Achieved (HA); 3.50–4.49 = Achieved (A); 2.50–3.49 = Moderatelyachieved (MA); 1.50–2.49 = Slightly achieved; and 1.00–1.49 = Not achieved
2 Competency-Based Assessment of the … 23

Overall, in terms of the level of achievement of the graduates’ critical thinkingand problem-solving skills, their ability to generate and evaluate the validity of thedata and assure its reliability in patient care ranked first with a weighted mean of3.92 and was deemed as achieved. This is followed by the graduates’ ability torecognize errors and the ability to integrate and interpret analytical data andestablish a course of action to solve problems with a weighted mean of 3.85 andwas also deemed as achieved. The graduates’ ability to recognize and identifyproblems then take appropriate corrective action ranked last with a weighted meanof 3.81. The resulting composite mean of 3.88 indicates that the graduates’ abilityto think critically and exhibit problem-solving skills was achieved.
Table 2.4 presents the mean ratings of the assessment on the level of achieve-ment of the demonstration of professional and ethical behavior of graduates. Thegraduates’ ability to maintain confidentiality of patient’s test results ranked firstwith a weighted mean of 4.60 which is followed by the graduates’ ability to applyprinciples of educational methodology with a weighted mean of 4.50, both of whichwere deemed as highly achieved. Finally, the ability of the graduates to applyprinciples of management ranked last with a weighted mean of 4.41 and wasdeemed as achieved. A composite mean of 4.50 indicates that the graduates’self-assessment on the demonstration of professional and ethical behavior washighly achieved in general.
From the training officers’ assessment, the maintenance of confidentiality ofpatients test results by graduates ranked first with a weighted mean of 3.78 and wasdeemed as achieved. This is followed by the graduates’ ability to apply principles ofmanagement and ability to apply principles of management with a weighted meanof 3.69 and 3.54, respectively, and both of which are deemed as achieved. Theresulting composite mean of 3.68 indicates that the training officers’ assessment onthe demonstration of professional and ethical behavior of graduates was achieved.
In the overall assessment of the graduates’ level of achievement of thedemonstration of professional and ethical behavior, their ability to maintain con-fidentiality of patients’ test results ranked first with a weighted mean 4.19 and
Table 2.4 Mean ratings of the assessment on the level of achievement of demonstration ofprofessional and ethical behavior of graduates
Competencies Self Training officer Overall
WM VI R WM VI R WM VI R
Maintain confidentiality ofpatients test results
4.60 HA 1 3.78 A 1 4.19 A 1
Apply principles ofeducational methodology
4.50 HA 2 3.69 A 2 4.10 A 2
Apply principles ofmanagement
4.41 A 3 3.54 A 3 3.98 A 3
Composite mean 4.50 HA 3.68 A 4.09 A
Legend 4.50–5.00 = Highly Achieved (HA); 3.50–4.49 = Achieved (A); 2.50–3.49 = Moderatelyachieved (MA); 1.50–2.49 = Slightly achieved; and 1.00–1.49 = Not achieved
24 J.P.B. Tadiosa

deemed as achieved. The graduates’ ability to apply principles of educationalmethodology ranked second with a weighted mean of 4.10 and deemed as achieved.Furthermore, the graduates’ ability to apply principles of management ranked lastwith a weighted mean of 3.98. The overall composite mean of 4.09 corresponds tothe fact that the overall demonstration of the graduates’ professional and ethicalbehavior was achieved.
The differences in the responses of the graduates’ self-assessment and thetraining officers’ assessment on the expected competencies are shown in Table 2.5.In terms of the theoretical knowledge and technical skills, interpersonal skills,critical thinking and problem-solving skills, and the demonstration of professionaland ethical behavior, there was a highly significant difference (as indicated by thep value of 0.000 which is less than the cutoff value of 0.05) observed in theresponses between the graduates’ self-assessment and the assessment made by thetraining officers among all the competencies.
There are many factors that can be attributed to the resulting difference in theresponses. The assessment process may at least partially be dependent on thereviewer’s expertise and familiarity with an individual’s work and role expectations(Gopee, 2001). It is important that the industry are well versed of the expectedcompetencies since competency-based education Training (CBET) aims to preparestudents more effectively for real workplaces, which means that the requirements ofcompanies and industry should be taken into account (Ayonmike, Okwelle, &Okeke, 2014).
There may be a need to do the actual assessment of the graduates after under-going a postgraduate training program since fresh graduates maybe given the notionof not having enough working experience and the industry has reasonably higherstandards than educational institutions although studies may need to be conductedto prove its truthfulness. However, the competency-based approach has stimulatedbeneficial changes in many postgraduate clinical training programs.Competency-based programs have a strong focus on outcomes and at the same timerecognize and emphasize the relevance of the workplace with respect to bothlearning and assessment. (Mook, Bion, Vleuten, & Schuwirth, 2010).
In a research study conducted on Master of Public Administration(MPA) graduates, based from the initial competency data, not all students aredemonstrating the needed competencies as public-service leaders as defined by theprogram. Therefore, while putting in mind that 100% of the competencies may not
Table 2.5 Difference in the mean ratings of the self-assessment of graduates and the assessmentby training officers on the expected competencies
Competencies F-value p value Interpretation
Theoretical knowledge and technical skills 7.837 0.000 Highly significant
Interpersonal skills 7.621 0.000 Highly significant
Critical thinking and problem-solving skills 8.009 0.000 Highly significant
Professional and ethical behavior 30.754 0.000 Highly significant
Legend Significant at p value <0.05
2 Competency-Based Assessment of the … 25

really become attainable, the initial competency data have raised concerns andexcitement among the faculty members to make considerable changes in the coursecontent in order to provide higher probability of attainment and become successfulin meeting the competencies. These natural tensions serve as guide to institution-alize competency-based learning (Rivenbark & Jacobson, 2015). Likewise, theseexisting essential tensions between the goals of the academic institutions and theservice providing sectors must be recognized and be taken into consideration increating, developing, and updating the curricula and the assessment criteria. If not,this will make the professional competencies be deemed as both unrecognizable andmeaningless (Jefferies, Chen, & Conway, 2012).
Therefore, the industry sector recognizes the need to collaborate with the edu-cational institutions to improve the development of man power. The industries wantthe academe to reach out and build partnerships with them to enhance the overallteaching and learning environment. They are interested to explore other mutuallybeneficial partnerships through faculty immersion, designing relevant curriculumand instruction, research projects, resource sharing, and other avenues that ulti-mately enhance acquired knowledge and skills of students, aside from simplecreating tie-ups for on-the-job training (OJT). Furthermore, industry–universityinteraction must be deemed a main stream activity by both partners. As in the caseof the engineering profession, the fast-paced technological development entailsengineering education paradigm shift that should capture the many intersectionsbetween the spheres of activity of industry and university. It is also emphasized thata structured and institutionalized relationship between the two entities is not onlydesirable, but is also essential for the overall success of the teaching–learningprocess (Roque, 2015).
2.5 Conclusions
The research aimed to determine the level of achievement of the competencies ofthe diploma in phlebotomy graduates as perceived by the graduates’ themselves andas perceived by their training officers. From the initial evaluation made, the com-petencies expected from the graduates in terms of theoretical knowledge andtechnical skills, interpersonal skills, critical thinking and problem-solving skills,and the demonstration of professional and ethical behavior were all achieved ingeneral. Therefore, the curriculum program was found to be effective. In a studyconducted in a Medical Laboratory Science program in the Philippines, theobjectives of the six-month training program embedded in the curriculum wererealized to a moderate extent only (Valdez et al., 2012).
On the other hand, the results of the responses of the graduates’ self-assessmentand the assessment made by training officers were found to be significantly differentwhen computed statistically. On the other hand, the results of the responses of thegraduates’ self-assessment and the assessment made by training officers were foundto be significantly different when computed statistically. These results are attributed
26 J.P.B. Tadiosa

to a variety of factors and may not necessarily reflect a gap in the school instructionsince the competencies across all four (4) major areas were verbally interpreted asachieved based from either the students or training officers’ perspective.
Further studies should be conducted which could be in the form of needsanalysis and training officer’s expectations from trainees to further narrow the gapbetween the school instructional design and the needs of the industry. Likewise,further studies should also be conducted on the literacy on assessment of trainingofficers to determine their suitability in providing assessments to graduates andemphasize the possibility of using industrial-based assessment tools aside fromtypical educational tools. It may be necessary to improve assessor performance byincreasing essential communication and training and develop multiple strategies forthe collection and recording of competency assessment rather than “one-time”assessments.
Likewise, it is also important to develop a variety of feedback mechanismsdesigned to measure the level of achievement of the program competencies thatmay exist in various forms and may also be used in different levels of competencyachievement and to greatly obtain a comprehensive evaluation of the graduates. Theresults from which may be analyzed to identify areas and sectors of the curriculumand instructional design that could be improved.
References
Akir, O., Eng, T., & Malie, S. (2012). Teaching and learning enhancement through outcome-basededucation structure and technology e-learning support. Procedia-Social and BehavioralSciences., 62, 87–92.
Anh, D., & Thanh, P. (2014). Competence based assessment of listening skill for ESL students.Journal of Science: Education Research, 30(4), 7–16.
Ayonmike, S., Okwelle, C., & Okeke, B. (2014). Competency based education and training intechnical vocational education: Implication for sustainable national security and development.Journal of Educational Policy and Entrepreneurial Research (JEPER), 1(2), 290–300.
Boateng, B., Bass, L., Blaszak, R., & Farra, H. (2009). The development of a competency basedassessment rubric to measure resident milestones. Journal of Graduate Medical Education, 1(1), 45–48. doi:10.4300/01.01.0008.
De Guzman, M. (2016). Preferred student-centered strategies in teacher education: Input tooutcomes-based instruction. Asia Pacific Journal of Education, Arts and Sciences, 3(1), 40–48.
Fordham, A. J. (2005). Using a competency based approach in nurse education. Nursing Standard,19(31), 41–48.
Gopee, N. (2001). The role of peer assessment and peer review in nursing. British Journal ofNursing., 10(2), 115–121.
Grable, H., & Gill, G. (2005). Preventing phlebotomy errors—Potential for harming your patients.LABMEDICINE, 36(7), 430–433.
Harden, R., Crosby, J., & Davis, M. (1999). AMEE Guide No. 14: Outcome-based education: Part1D An introduction to outcome-based education. Medical Teacher, 21(1), p7–14.
Hejazi, B. (2011). Outcomes-Based Education (OBE): A transformational perspective on qualityand mobility in higher education. In Community College Leadership Program.
Ialongo, C., & Bernardini, S. (2015). Phlebotomy, a bridge between laboratory and patient.Biochemia Medica, 26(1), 17–33.
2 Competency-Based Assessment of the … 27

Inocian, R., & Inocian, B. (2016). Outcomes-based teaching for brain-based learning vis-à-vispedagogical content knowledge. Asia Pacific Journal of Multidisciplinary Research, 4(2), 65–75.
Jefferies, M., Chen, S., & Conway, J. (2012). Assessment of professional competence in aconstruction management problem-based learning setting. The Australian Journal ofConstruction Economics and Building., 2(1), 47–56.
Killen, R. (2000). Outcomes-based education: Principles and possibilities. Unpublishedmanuscript, University of Newcastle, Faculty of Education.
Kirov, D., Kazakova, S., & Kirilova, J. (2014). Students’ self-assessment in preclinical and clinicaleducation of prosthetic dentistry. Journal of IMAB-Annual Proceeding (Scientific Papers)., 20(3), 575–577. doi:10.5272/jimab.2014203.575.
Lavery, I., & Ingram, P. (2005). Blood sampling: best practice. Nursing Standard, 19, 55–65.Limon, M. (2016). Outcomes-based education integration in home economics program: an
evaluative study. Journal of Educational Issues, 2(1). doi:10.5296/jei.v2i1.9262.Mamat, M., Rasul, M., & Mustapha, A. (2014). Outcome-based education implementation in
Malaysian polytechnic. International Journal of Education and Research, 2(11), 437–450.Mook, W., Bion, J., Vleuten, C., & Schuwrth, L. (2010). Integrating education, training and
assessment: competency-based intensive care medicine training. Netherlands Journal ofCritical Care, 15(4), 192–198.
Nayal, et al. (2011). General procedure of phlebotomy: A review. International Journal of AppliedBiology and Pharmaceutical Technology, 2(1), 334–341.
Norman, P. (2006). Outcomes-Based Education: A PNG Perspective. Contemporary PNG Studies:DWU Research Journal, 5, 45–57.
Rivenbark, W., & Jacobson, W. (2015). Three principles of competency-based learning: Mission,mission, mission. Journal of Public Affairs Education, 20(2), 181–192.
Roque, M. (2015). Towards evolving a model of an industry-academe linkage program and serviceunit for the college of engineering. Proceedings of the International Conference onEngineering Teaching and Learning Innovation (pp. 60–67). ISSN# 2467-7507.
Shahangian, S., et al. (2005). Results of a survey of hospital coagulation laboratories in the UnitedStates. Archives of Pathology and Laboratory Medicine, 129, 47–60.
Valdez, A. (2012). Curriculum model for medical technology: Lessons from internationalbenchmarking. International Association of Multidisciplinary Research Journal, 2, 292–301.
Valdez, A., et al. (2012). The six-month internship training program for medical laboratory scienceeducation: an initial evaluation. JPAIR Multidisciplinary Research, 9, 271–283.
Vuk, T., Cipek, V., & Jukic, I. (2015). Blood collection staff education in the prevention ofvenipuncture failures and donor adverse reactions: From inexperienced to skillful staff. BloodTransfuse, 13(2), 338–339.
28 J.P.B. Tadiosa

Chapter 3Redesigning Massive Open Online Courses(MOOCs) Based on Lecturers’ Perception
Sukhminder Kaur, Wei Wei Goh and Pei Gee Kng
Abstract The emergence of Massive Open Online Courses (MOOCs) has createda significant interest from the higher education institutions. The purpose of thisstudy is to explore the lecturers’ perceptions toward using MOOCs as their teachingmethod based on Technology Acceptance Model (TAM). This research exploreshow the perceived usefulness and perceived ease of use affect the actual use ofMOOCs for teaching. Qualitative research has been conducted to investigate theperception of lecturers in using MOOCs. Findings have revealed the main concernof lecturers toward using MOOCs as a teaching tool and how MOOCs can beredesigned to achieve greater social impact. The study has laid a valuable foun-dation of knowledge on the current state of MOOCs in higher education, especiallyin the MOOC design and implementation.
Keywords Technology Acceptance Model � MOOC
3.1 Introduction
Massive Open Online Courses (MOOCs) are a free Web-based distance learningprogram that is designed for the participation of large numbers of geographicallydispersed students (Barnes, 2013). The background of this research is on theperception of lecturers toward Massive Open Online Courses (MOOCs) in edu-cation nowadays. Today, blended learning is commonly adopted compared totraditional face-to-face methods. MOOCs present a new option for blended course
S. Kaur (&) � W.W. Goh � P.G. KngTaylor’s University, Subang Jaya, Malaysiae-mail: [email protected]
W.W. Gohe-mail: [email protected]
P.G. Knge-mail: [email protected]
© Springer Nature Singapore Pte Ltd. 2018S.F. Tang and S.E. Cheah (eds.), Redesigning Learning for GreaterSocial Impact, DOI 10.1007/978-981-10-4223-2_3
29
design. Instead of “flipping” one’s course by producing online lecture videos orleveraging textbooks, instructors can “wrap” their courses around existing MOOCs(Caulfield, 2012).
3.1.1 Background
There are a lot of challenges in MOOCs. Hence, this research will look into thelecturers’ perception in using MOOCs as the learning method by using TechnologyAcceptance Model. In this research, it will gather all the information aboutTechnology Acceptance Model (TAM) that will be used as the theoretical frame-work to investigate the response of the lecturers in using MOOCs as a teaching tool.
3.1.2 Objective
The main objective of this study is as follows:
1. Explore the lecturers’ perception toward Massive Online Open Courses(MOOCs) as a teaching tool.
2. Investigate issues faced by the lecturers when using MOOCs.3. Recommend how to improve the design and implementation of MOOCs.
The next section explains the literature review on MOOCs and TAM. This isfollowed by the explanation of data collection and data analysis in this study. Thepreliminary findings of this research are presented followed by discussion andrecommendation.
3.2 Literature Review
3.2.1 Massive Open Online Courses (MOOCs)
Massive Open Online Courses (MOOCs) are defined as taking a course anytimeand anywhere around the globe (Peterson, 2014). There is no limit in the number ofstudents in the course. The concept of openness in education has been evolvingrapidly since 2000, although it has its origins in the early twentieth century (Peters,2008). Two institutions represented in the ongoing development of the open edu-cation movement, namely Massachusetts Institute of Technology (MIT) and OpenUniversity. MIT established the OpenCourseWare in 2002 and the Open Universityset up OpenLearn in 2006. This online course was initially designed for a group of25 students but was opened up to be registered worldwide. The original aim of
30 S. Kaur et al.

MOOCs was to provide free access to many students as possible (Yuan & Powell,2013). There are two key features in MOOCs: (1) open access—anyone can par-ticipate in an online course for free; (2) scalability—courses are designed to supportan indefinite number of participants (DeSantis, 2012).
Commonly, MOOCs planned to achieve modest and measured forms in edu-cation. Students are required to have a computer or mobile device to access thecourse. There are no charges in fees and no entry requirements required. Studentsare learning from each other and grading each other’s work (Baggaley, 2013).
Massive Open Online Courses (MOOCs) have an open registration online coursewith a publicly shared curriculum. MOOCs integrate social networking, accessibleonline resources and is facilitated by a group of leading practitioners in the field ofstudy. Most significantly, the fundamental rule of MOOCs is the engagement oflearners who self-organize their participation according to learning goals, existingknowledge, skills, and common interest. MOOCs have attracted a diverse group oflearners from all age groups from over hundreds of countries around the world(Downes, 2012).
Different learning theories have driven MOOCs into two distinct pedagogicaldirections: the connectivity MOOCs (cMOOCs) which are based on a connectivestheory of learning with networks developed informally; and content-based MOOCs(xMOOCs), which follow a more behaviorist approach (Talbert, 2003). cMOOCsemphasize connected, collaborative learning, and the courses are built around agroup of like-minded “individuals” who are relatively free from institutional con-straints. cMOOCs provide a platform to explore new pedagogies beyond the tra-ditional classroom. On the other hand, the instructional model (xMOOCs) isessentially an extension of the pedagogical models practiced within the institutionsthemselves, which is arguably dominated by the “drill and grill” instructionalmethods with video presentations, short quizzes and testing. A further division ofxMOOCs into two models can be identified: profit and nonprofit to serve differentpurposes (edX, 2013).
In Malaysia, the higher education institutions and the government plans to attractmore international students to Malaysia in making it a regional educational hub.Several MOOCs have been introduced in Taylor’s University. More than hundredstudents have registered for the Entrepreneurship course offered to engineeringstudents in their second year of the undergraduate program. The program offered isover a 14-week semester and include a series of lectures. The course also features avariety of assessment. This module is offered as MOOC and started on March 27,2013 (Mushtak, 2014). According to Goh et al. (2015), students agree that MOOCsare useful in their learning and have helped them to improve their learning. Theyare satisfied with MOOCs.
OpenLearning platform is the MOOC platform used by the lecturers in thisstudy. OpenLearning provides many social-media-like features such as forums toenable students to comment and encourage interaction while learning (Vardi, 2012).OpenLearning has other interesting features such as karma points, which are gainedvia obtaining positive comments from peers and badges that can be issued eitherautomatically or when a certain learning goal is achieved.
3 Redesigning Massive Open Online Courses (MOOCs) … 31

3.2.2 Technology Acceptance Model (TAM)
TAM, acronym of Technology Acceptance Model, is a model introduced by Davis(1989) and its successors (Venkatesh, Morris, Davis, & Davis, 2003). It focuses onpsychological and attitudinal antecedents in the usage of technologies. TheTechnology Acceptance Model influences the behavioral outcome and individualchoice to use the technology. It focuses largely on the decision to adopt a tech-nology and subsequently use it. With growing technology needs and increasingfailures of system adoption in organizations, predicting system use became an areaof interest for many researchers. However, most of the studies carried out failed toproduce a reliable measure that could explain system acceptance or rejection(Davis, 1989). In 1985, Fred Davis proposed the Technology Acceptance Model(TAM) in his doctoral thesis at the MIT Sloan School of Management (Davis,1986). David suggested in his proposal that users’ motivation can be divided intothree factors: Perceived Ease of use, Perceived Usefulness, and Assertivenesstoward using the system. He hypothesized that the assertiveness was a majordeterminant whether to use or reject the system. The assertiveness is to be influ-enced by two major beliefs: perceived usefulness and perceived ease of use, withperceived ease of use having a direct incline by the system design characteristics.
In general, Perceived Usefulness (PU) has been defined as the degree to which aperson believes that using a particular system would enhance his or her job per-formance; while Perceived Ease of Use (PEOU) has been defined as the degree towhich a person believes that using a particular system would be free from effort(Davis, 1989).
David (1989) suggested the initial prediction, perceived usefulness could havedirect influence on the actual system use. At the same instance, found that systemcharacteristics could directly influence the attitude of a person toward using thesystem as shown in Fig. 3.1.
Fig. 3.1 Technology acceptance model
32 S. Kaur et al.

3.3 Research Methodology
3.3.1 Data Collection and Data Analysis
Qualitative approach was conducted to explore the perception of lecturers in usingMOOCs for teaching. Semi-structured interview questions were designed based onTechnology Acceptance Model (TAM). The benchmarks for choosing the partici-pants were based on their experience in using MOOCs for teaching.Semi-structured interview was conducted with five lecturers in this study. Before aninterview, an e-mail was being sent to the targeted lecturers to request for thepermission for interview and arrange the available time slot for them to be inter-viewed. When they reply indicating that they agree to participate in this interview,the time and venue will be agreed by both parties, the lecturers and the author toensure no issue of miscommunication. During the interview, permission wasobtained by letting the interviewees to sign the consent form. Besides the per-mission to conduct the interview, their permission to use a recorder was obtained.
The interview questions were broadly divided into two categories:
(1) identify the perception of lecturers in using MOOCs;(2) investigate the issues arising when lecturers use MOOCs.
Questions like years of teaching experience, teaching method used will be askedbefore the real in-depth question begins. If the lecturers answer yes, there will be asection of questions regarding MOOCs while if the lecturers answer no, questionlike why not will be asked to get the opinion of the lecturers. The interview lastsaround 20–30 min.
As for data analysis, the research data comprised transcripts of interviews withfive lecturers. The data were analyzed simultaneously during data collection andinterpretation. Thematic analysis was performed on all the transcripts to analyze theperception of lecturers in using MOOCs. Results of the interviews can be seenclearly and will be elaborated in the next section.
3.3.2 Results
A total of five lecturers were interviewed who are the users of OpenLearningplatform. Three lecturers have over 10 years of teaching experience. They usedMOOC for learning and are currently using MOOC as the teaching platform. Oneof the lecturers commented that he had used MOOC for learning when he was astudent two years ago. He spends 5–6 months to design his own course in MOOC.There were three lecturers who have just started using MOOC within this year.These lecturers design MOOC based on their module learning structure andlearning objectives. E-learning academic (eLA) of the university helps them withthe content design and recording.
3 Redesigning Massive Open Online Courses (MOOCs) … 33

3.3.2.1 Perceived Usefulness (PU)
The lecturers find that MOOC is a good teaching platform. When asked about theusefulness of MOOC, they think that MOOC provides a platform to upload lec-turer’s videos. Students can pause the videos and watch them repeatedly. Onelecturer mentioned that the quality of the videos and the interactive features of thevideos are very important. One lecturer says, “I plan the course, read the script andrecord it as an MP3 voice file. I use a software called Sparkol to do lecture videos,to record my own voice.” However, for some topics, the students still prefer toattend face-to-face class.
When the lecturers were asked about this question, “Do you think that theexplanation or solution given in MOOC is more useful than the explanation whichyou give in class?” One of the lecturers thinks that either the explanation in MOOCor the explanation in class can exist independently, he says, “Maybe hybrid learningis better. I will suggest a 12-week module and I will meet students for 5 weeks.”Some students are shy to ask in class, so they can ask in the MOOC, and for thosestudents who have not got full understanding of the explanation, they can ask inclass. Some lecturers think that the discussion in MOOC is more useful than theactual discussion group in class. One of the lecturers expressed that, “Yes, thediscussion in MOOC is useful. For certain MOOC which has hundreds of com-ments made by both lecturers and students, it seldom happens in class. The dis-cussion group has a very interactive comment session, so I think it is useful forstudents.” Furthermore, one lecturer mentioned that the discussion in MOOC isuseful because it has overcome the barriers of the time zone and not only thelecturer himself can provide answers to the questions. All people who are in theMOOC can learn from the answers. The quality of the answers in MOOC is evenbetter than the answers given in class. This is because MOOC has many studentsfrom all over the world, and there are many global students with different back-grounds, some of them are from Australia, some of them are professionals, sodiverse answers are actually better than what they have in class. When they wereasked about the reliability of the answers provided on MOOC, one of the lecturersindicated that, “We discuss on the discussion forum. We post the question, and thefacilitator will also give the answer, so as long as the facilitator is there, I think theanswer will be reliable.”
In terms of perceived usefulness, MOOC is useful for students as it is open toeveryone. MOOC can reach out to people who are not able to study because offinancial or time constraints. MOOC has overcome the barriers of time zone too.
The usefulness of MOOC was experienced by those students who had completedtheir course and have interest in MOOC. According to one of the lecturers, theremight be only 4% of students who had completed the course. The main reason isbecause MOOC has no attendance system, and it is completely open to anyone whohas interest in a certain course. As long as it is free, no one will take it seriously, andonly those who have interest in the course will complete the course. As such,MOOC is useful for students who have interest in studying on their own and engage
34 S. Kaur et al.

with the course content well. There are students who actually have 100% ofcompletion rate in the course, depending on the interest of students. If the sessionhas met with their expectations, the productivity will be consistent.
3.3.2.2 Perceived Ease of Use
The lecturers were asked about their perception on the ease of use of MOOC. Out ofthe five lecturers, one of the lecturers actually thinks that the OpenLearning plat-form is not user-friendly where his students were confused and did not know whereto start when using MOOC. The rest of the lecturers think that the OpenLearningplatform is user-friendly. One lecturer expressed that, “OpenLearning is the best; itallows you to build the community. Students can form groups in OpenLearning.”One of the lecturers stated that MOOC is very easy to use and he understood thewhole MOOC structure within 1 week.
The question then led to “Do you think MOOC requires a lot of mental effortfrom the students before engaging with it? One lecturer indicates that, “For theyounger generation, who have been exposed to social media for a long time, willfind it easy, but for those who never access to social media like this, they mightneed some guidance, but the most I see, the tools are very intuitive, so I think thestudents don’t really need that much of mental effort while using.”
Another lecturer said that he actually has students who felt very confused whenthey first approached this MOOC, and he would suggest them to chat online withhim after they have created the account and enrolled in his course. He will instructhis students on what to do. He indicates, “I think MOOC requires some mentaleffort from students before they start engaging with it but they still consider it veryeasy.” One lecturer responded that it actually depends on the designer of the course.They must give complete and clear instructions to students before they start to useit. One of the lecturers expressed that, “For the length of the videos, research hasshown that that people can only concentrate for 6–12 min, so I think the length ofthe videos in lecture should not exceed that.” Another lecturer commented that hisvideo is around 15–20 min which was actually the concise version of his one-hourlecture.
The last question asked to the interviewees is whether they think that the dis-cussion is more effective in MOOC rather than in class. One lecturer responded,“Yes, because students can share their ideas, especially when the MOOC hasstudents from different backgrounds, but in terms of effectiveness, face-to-face willbe better.” According to another lecturer, “My way is, my discussion is on mytwitter, I switch on my account from 9 pm to 10 pm for students to ask questions,and then I will go to YouTube streaming to answer the questions. It is almost likeface-to-face. But the only problem is the students must be available at that time.”Another lecturer expressed that his students prefer MOOC which has a chat roomsystem that can allow five or six students in the same group to discuss.
3 Redesigning Massive Open Online Courses (MOOCs) … 35

Students find MOOC easy to use, especially for those who are familiar with thesocial media or who have experience in using MOOC. Most of the lecturers do notrequire a lot of mental effort to understand how MOOC works. In conclusion, thelecturers’ perceptions show that MOOC shows a positive sign in terms of both theusefulness and the ease of use.
3.4 Discussions and Recommendations
In this study, the lecturers’ perception toward using MOOC as their teaching toolhas been discussed. The problem with MOOC now is there is no constant partic-ipation in MOOC. The attrition rate is high. Hence, students get terminated in theprogram if he/she does not fulfill the requirements to meet the due date, and he/shecannot participate anymore. But on the other hand, if the system does not terminatetheir account, once they stop for 5 weeks and come back at 6th week, they are notable to catch up with others’ work. It is recommended to have a collaborationbetween the university and MOOC. The facilitator should mark the assignments forthe students so that the participation can be consistent and students will take itseriously.
The design of MOOC should show a brief idea of the course content so that thestudents have some idea what is the course about before they enroll. Subscriptionand un-subscription function can be added for each course to allow students to quitthe course if the course does not meet their expectations. This will lower the failurerate of MOOC. Another suggestion is to have more social interactive activity forstudents. Chatroom feature can be created for students to have live chat and havetheir own discussion rather than discussing in public. The administrator canencourage more students to collaborate among their peers and work in groups.
3.5 Conclusion
Based on the results obtained, although there are some minor problems faced by thelecturers when using MOOC, the problems will not directly affect the teachingexperience of lecturers. Administrators may need to put some effort into theimprovements of the platform in order to provide a better learning environment forthe students.
Overall, the lecturers find that MOOC is useful for teaching. The limitation ofthis research was mainly time constraint. More lecturers from different coursescould have been interviewed to gather more comprehensive and detailed findings.The future research can also focus on the introduction of MOOC in primary schooland secondary school which may benefit the students in a good way too. Inaddition, MOOC not only can be used as the platform for education, but can also beused in different industries such as business, engineering, and so on.
36 S. Kaur et al.

In conclusion, the authors have successfully gathered the perceptions of thelecturers toward using MOOC for teaching through interviews. Furthermore, issuesarise and recommendations have been discussed in this study. The study has laid avaluable foundation of knowledge on the current state of MOOCs. This researchproject has fulfilled the objectives, and the authors think that the result of thisresearch may contribute to the future implementation of MOOC in higher educationinstitutions.
References
Aycock, D. M., & Uswatte, G. (2011–2013). Wrapping a MOOC: Student perceptions of anexperiments in blended learning. MERLOT Journal of Online Learning and Teaching,9(2), 187.
Baggaley, J. (2013). REFLECTION: MOOC rampant. tandfonline.com. Retrieved May 25, 2014,from 10.1080/01587919.2013.835768
Barnes, C. (2013). MOOCs: The challenges for academic librarians. Australian Academic &Research Libraries, 44(3), 163–175.
Caalfield, F. (2003). Wrapping MOOC: Students perception in blended learning. MERLOTJournal of Online Learning and Teaching, 9(2), 163–175.
Caulfield, M. (2012). How coursera could walk the talk about MOOC wrapping. Retrieved from:http://mikecaulfield.com/2012/11/09/how-coursera-could-walk-the-talk-about-mooc-wrapping/
Dakkak, N. (2013). What are MOOCs, and how can you benefit from them? Wamda. RetrievedMay 25, 2014, from http://www.wamda.com/2013/05/what-are-moocs-what-mean-for-middle-east
Davis, F. D. (1989). Perceived usefulness, perceived ease of use, and user acceptance ofinformation technology. MIS Quarterly, 13(3), 319–339.
Davis, F. D. (1986). A technology acceptance model for empirically testing new end-userinformation systems: Theory and results. Doctoral dissertation. Cambridge, MA: MIT SloanSchool of Management.
DeSantis, N. (2012). The chronicle of higher education. Retrieved from http://chronicle.com/blogs/wiredcampus/stanford-professor-gives-up-teaching-position-hopes-to-reach-500000-students-at-online-start-up/35135
Downes, S. (2012). Web log message. Retrieved from http://halfanhour.blogspot.com/2012/03/education-as-platform-moocexperience.html\
Durante, K. A. (2013). Exploring Students’ acceptance towards using MOOC by technologyacceptance model in Jordanian Universities. International Journal of Education andDevelopment using Information and Communication Technology, 9(2), 4–18.
edX. (2013). Creating better schools for the campus and the world. Retrieved from https://www.edx.org/schools
Enguah, A. (2012). Mobile learning in higher education: A marketing course design project inAustria. 3rd World Conference on Learning, Teaching and Educational Leadership, 93,2125–2129.
Goh, W. W., Kaur, S., & Chion, Z. H. (2015). The perceptions of MOOC among learners basedon activity theory. Taylor’s 7th Teaching and Learning Conference 2014 Proceedings,pp. 331–340.
Mazur, G. (2012). Flipping the classroom: Succeeding with reverse instruction. Flipping TheClassroom, 2–4.
Mushtak, A.-A. (2014). Entrepreneurship: The first MOOC in Malaysia.
3 Redesigning Massive Open Online Courses (MOOCs) … 37

Peterson, D. (2014). The Pros and Cons of MOOCS. Retrieved May 25, 2014, from http://adulted.about.com/od/Addydyult-Education-in-the-U.S./a/The-Pros-And-Cons-Of-Moocs.htm
Peters, M. (2008). Paper presented at Economic and Social Research Council (ERSC, UK) seminarseries on ‘education and the knowledge economy’, University of Bath, UK.
Saade, R. N. F. (2007). Exploring students acceptance of e-learning using technology acceptancemodel in Jordanian Universities. International Journal of Education and Development usingInformation and Communication Technology, 9, 176.
Shawar, B., & Al-Sadi, J. (2013). Exploring students acceptance of e-learning using technologyacceptance model in Jordan Universities. International Journal of Education and Developmentusing Information and Communication Technology, 9(2), 4–18.
Talbert, L. (2003). Wrapping a MOOC: Student perceptions of an experiment in blended learning.MERLOT Journal of Online Learning and Teaching, 9(2).
Vardi, M. (2012). Will MOOCs destroy academia? Communications of the ACM, 55(11), 5.Venkatesh, V., Morris, M. G., Davis, G. B., & Davis, F. D. (2003). User acceptance of information
technology: Toward a unified view. MIS Quarterly, 27, 425–478.Yuan, L., & Powell, S. (2013). MOOCs and open education: Implications for higher education.
Cetis White Paper.
38 S. Kaur et al.

Chapter 4Service Quality of Higher EducationInstitution Among Its InternationalStudents: Inputs to Competitive UniversityImage
Reynalda B. Garcia, Norma L. Menez, Bella Luz Dinglasanand Bernardo Hornilla
Abstract The Lyceum of the Philippines University—Batangas, an autonomousuniversity in the Philippines seeks to examine its competitive and strategicadvantage through evaluating its services to International students in order todetermine its university position in the competitive educational market. Using thedescriptive method of research employing both the qualitative and quantitativeapproaches, this study seeks to achieve the following objectives: To measure howsatisfied are the International students to the services provided by the university’sexecutive, finance, institutional division, student services, and outsourced services.Findings revealed that international students are generally very highly satisfied withmajority of the services offered. The researchers draw inputs based on the results ofthe study to strategically position the university in the academic business envi-ronment and continuously offer quality services toward optimum customer satis-faction of international students to insure sustainability and competitive advantage.
Keywords Service quality � Strategic position � Competitive advantage �Sustainability � Academic business environment
4.1 Introduction
Based on the records of the Bureau of Immigration Statistics, international studentsin the Philippines have doubled its number from 26,000 in 2011 to more than61,000 in 2012. Such remarkable growth could be partly credited to the number ofaccredited institutions authorized to admit foreign students thus from 104 schoolsand learning institutions in 2011 it became 2145 in 2012.
R.B. Garcia (&) � N.L. Menez � B.L. Dinglasan � B. HornillaSubang Jaya, Malaysia
© Springer Nature Singapore Pte Ltd. 2018S.F. Tang and S.E. Cheah (eds.), Redesigning Learning for GreaterSocial Impact, DOI 10.1007/978-981-10-4223-2_4
39

Higher education institutions (HEIs) sector is now considered as important asother sectors of the economy. Competition is now increasing within the educationalsector thus as researchers and academicians, there are new challenges set by thestakeholders emphasizing their attention toward a competitive university position-ing. Quality of service of educational institutions is a key determinant for customersbefore purchasing a product or availing any type of service that plays significantrole in measuring the performance of product/service and the organization which isparallel to education sectors (Archambault, 2008).
However, to achieve university position among other higher education institu-tions, they are required to focus on service quality specifically due to the ballooningnumber of international students. Therefore, universities to examine its competitiveand strategic advantage through evaluating its services to International students inorder to determine its position in the competitive educational market. In the wordsof Nadiri, Kandampully, and Hussain (2009, p. 525), “if service quality is to beimproved, it must be reliably assessed and measured”; therefore, a reliable and validinstrument for measuring service quality of higher education from the students’perspective is indispensable.
Lyceum of the Philippines University in Batangas City in its vision to be anacademically excellent provider of higher learning believes that quality of service isa parameter of student’s satisfaction. The service quality is not only essential andimportant, but it is also an important parameter of educational excellence.
4.1.1 Objectives of the Study
The purpose of the study was to draw inputs from the results of the study tostrategically position the university in the academic business environment andcontinuously offer quality services toward optimum customer satisfaction.
4.2 Methods
Descriptive method was used to determine the service quality provided by Lyceumof the Philippines University in Batangas. As an exploratory research, it has itsobjective of gathering preliminary information among 37 International studentsenrolled during second semester of 2015–2016. This represents 100% internationalstudents as British 2, Eritrean (East Africa) 5, US Citizen 2, Somalian 1, Indian 2,Nigerian 19, Angolan 3, Papua New Guinean 1, and Zimbabwean 2. Irrespective ofcourse and country of origin, they are all required to submit themselves to thisinstitutional survey.
Instead of using the generic SERVQUAL framework, the researchers used thehigher educational service quality (HESQUAL) dimensions patterned to the qualityattributes developed by Teeroovengadum, Kamalanabhan, and Seebaluck (2016)
40 R.B. Garcia et al.
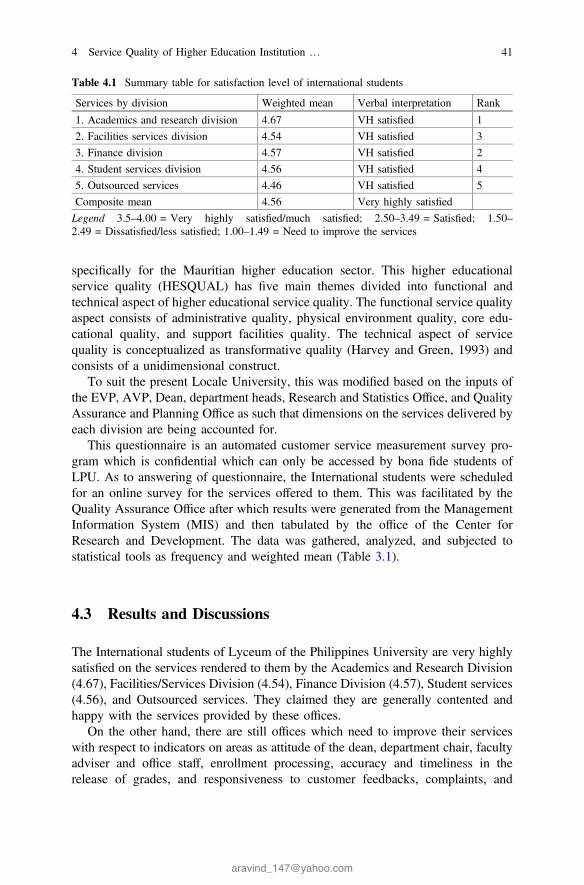
specifically for the Mauritian higher education sector. This higher educationalservice quality (HESQUAL) has five main themes divided into functional andtechnical aspect of higher educational service quality. The functional service qualityaspect consists of administrative quality, physical environment quality, core edu-cational quality, and support facilities quality. The technical aspect of servicequality is conceptualized as transformative quality (Harvey and Green, 1993) andconsists of a unidimensional construct.
To suit the present Locale University, this was modified based on the inputs ofthe EVP, AVP, Dean, department heads, Research and Statistics Office, and QualityAssurance and Planning Office as such that dimensions on the services delivered byeach division are being accounted for.
This questionnaire is an automated customer service measurement survey pro-gram which is confidential which can only be accessed by bona fide students ofLPU. As to answering of questionnaire, the International students were scheduledfor an online survey for the services offered to them. This was facilitated by theQuality Assurance Office after which results were generated from the ManagementInformation System (MIS) and then tabulated by the office of the Center forResearch and Development. The data was gathered, analyzed, and subjected tostatistical tools as frequency and weighted mean (Table 3.1).
4.3 Results and Discussions
The International students of Lyceum of the Philippines University are very highlysatisfied on the services rendered to them by the Academics and Research Division(4.67), Facilities/Services Division (4.54), Finance Division (4.57), Student services(4.56), and Outsourced services. They claimed they are generally contented andhappy with the services provided by these offices.
On the other hand, there are still offices which need to improve their serviceswith respect to indicators on areas as attitude of the dean, department chair, facultyadviser and office staff, enrollment processing, accuracy and timeliness in therelease of grades, and responsiveness to customer feedbacks, complaints, and
Table 4.1 Summary table for satisfaction level of international students
Services by division Weighted mean Verbal interpretation Rank
1. Academics and research division 4.67 VH satisfied 1
2. Facilities services division 4.54 VH satisfied 3
3. Finance division 4.57 VH satisfied 2
4. Student services division 4.56 VH satisfied 4
5. Outsourced services 4.46 VH satisfied 5
Composite mean 4.56 Very highly satisfied
Legend 3.5–4.00 = Very highly satisfied/much satisfied; 2.50–3.49 = Satisfied; 1.50–2.49 = Dissatisfied/less satisfied; 1.00–1.49 = Need to improve the services
4 Service Quality of Higher Education Institution … 41

concerns. There is a different results for Mauritian students that this core educa-tional quality theme, namely attitude and behavior of academics and competence ofacademics, are those obtaining the best rating from students (Teeroovengadumet al., 2016).
For Outsourced, there are still rooms for improvement on the rating for Canteen,Security Services—LIMA Campus and School Uniform services for the maincampus. Just the same with other researches conducted in three different countries,UK, Australia, and Sweden. In Lyceum of the Philippines University, internationalstudents just like customers of institutions are very much concerned with howservices are delivered and most importantly the impact on curriculum improvementinitiatives, subjects’ responsiveness to the needs of the industry, safe workingfacilities, information dissemination about formulation and implementation of rel-evant policies rules and regulations and on the efficiency and effectiveness ofservices producing desired results.
Being one of the Autonomous Universities in the Philippines, this result mayaffirm the claimed that positive perceptions of service quality has significant influ-ence on student satisfaction (Alves & Raposo, 2010). In the study conducted in threedifferent countries, UK, Australia, and Sweden, Lagrosen et al. (2004) identifiedfactors on service quality dimensions as corporate collaboration, information andresponsiveness, courses offered, campus facilities, teaching practices, internalevaluations, external evaluations, computer facilities, collaboration, andcomparisons.
The contended and satisfied international students served as an inspiration fromboth academic performance as well as the administrative efficiency of the univer-sity. As posted by Ahmed et al. (2010), service quality is a key performancemeasure in educational excellence and is a main strategic variable for universities tocreate a strong impact perception and university competitiveness. The efforts of theuniversity to meet the needs of international students even exceed social impact asthey claimed LPU as their second home. Positioning Lyceum as a university is alsopromoting its reputation of excellence in the academic community. As it providesand delivers the highest quality product and service among international students isindeed creating a position in which their academic products and services aredelivered to its excellent expectation of the customers.
While higher learning institutions like LPU needs to strategically position inacademic business environment; service quality toward satisfying internationalstudents require them to continuously improve their present services and ensure itssustainability in attracting more foreign enrollees and international tie-ups. Basedon the results of this research, it is an inspiration that quality services provided byhigher education institutions are paralleled with the kind of satisfaction level andthe learning experiences provided during their stay in the university.
For International students, their positive campus experiences to various officesreflect the institutional quality provided by their present university, Lyceum of thePhilippines in Batangas City. Therefore, this is the same thought of Elliot and Healy(2001) that higher education institutions must not only deal with students’ socialvalues, capabilities, and skills but also their campus life experiences which can be
42 R.B. Garcia et al.
best expressed from the kind of caring academic and nonacademic staff, comfort-able environment, adequate facilities, and resources that students whether interna-tional and local deserved in competitive university.
4.3.1 Inputs to Competitive University Image
• The contended and satisfied international students served as an inspiration fromboth academic performance as well as the administrative efficiency of the uni-versity. As posted by Ahmed et al. (2010) service quality is a key performancemeasure in educational excellence and is a main strategic variable for univer-sities to create a strong impact perception and university competitiveness.
• The efforts of the university to meet the needs of international students evenexceed social impact as International students claimed LPU as their secondhome.
• Positioning Lyceum as a university is also promoting its reputation of excellencein the academic community. As it provides and delivers the highest qualityproduct and service among international students is indeed creating a position inwhich their academic products and services are delivered to its excellentexpectation of the customers.
• LPU needs to strategically position in academic business environment; servicequality toward satisfying international students require them to continuouslyimprove their present services and ensure its sustainability in attracting moreforeign enrollees and international tie-ups.
4.4 Conclusions
• Based on the results of this research, it is an inspiration that quality education isparalleled with the level of satisfaction on the learning experiences providedduring International students stay in LPU.
• For International students, their positive campus experiences to various officesreflect the institutional quality provided by their present university, Lyceum ofthe Philippines in Batangas City. For Elliot and Healy (2001), higher educationinstitutions not only emphasize on students’ social values, capabilities, and skillsbut also their campus experience.
• The experiences of International students maybe be viewed from the perspec-tives of caring academic and nonacademic staff, comfortable environment,adequate facilities, and resources.
4 Service Quality of Higher Education Institution … 43

4.5 Recommendation
• The Office of the International Affairs and Linkages may provide an avenue tomeet the Deans of all colleges in order to address problems and concernsirrespective of International student’s courses.
• During departmental meetings, officers of International students society maybeinvited in order to have a feel of their presence in the university and discussissues on students learning and cultural and social adjustments.
• Reinstalling Feedback survey may also be done to continuously improve all theservices of LPU.
• Student services of the university may also provide exclusive programs forInternational students specific in an atmosphere of a customer-friendly envi-ronment and relationships among Filipino students.
References
Ahmed, I., Nawaz, M. M., Ahmad, Z., Ahmad, Z., Shaukat, M. Z., Usman, A., et al. (2010). Doesservice quality affect students’ performance? Evidence from institutes of higher learning.African Journal of Business Management, 4(12), 2527–2533.
Alves, H., & Raposo, M. (2010). The Influenceof University Image on Students’ Behavior.International Journal of Educational Management, 24(1), 73–85.
Andaleeb, S. (1998). Determinants of customer satisfaction with hospitals: a managerial model.International Journal of Health Care Quality Assurance, 11(6), 181–187.
Angur, M., Nataraajan, R., & Jahera, J., Jr. (1999). Service quality in the banking industry: anassessment in a developing economy. International Journal of Bank Marketing, 17(3), 116–123.
Anderson, G. (2006). Assuring quality/resisting quality assurance: Academics’ responses to“quality” in some Australian universities. Quality in Higher Education, 12(2), 161–173.
Archambault, L. Z. (2008). Measuring service performance, student satisfaction and its Impact onstudent retention in private, post-secondary institutions. Research Online, 3(3), 32–45.
Avkiran, N. (1999). Quality customer service demands human contact. The International Journalof Bank Marketing, 17(2), 35–68.
Babakus, E., & Mangold, G. (1992). Adapting the SERVQUAL scale to hospital services: anempirical investigation. Health Service Research, 26(6), 767–780.
Biggs, J. (2003). Teaching for quality learning at university. Buckingham: The Society forResearch into Higher Education & Open University Press.
Cheng, M. (2011). Transforming the learner versus passing the exam: Understanding the gapbetween academic and student definitions of quality. Quality in Higher Education, 17(1), 3–17.
Cheng, Y. C. (2003). Quality assurance in education: Internal, interface, and future. QualityAssurance in Education, 11(4), 202–213.
Douglas, J., Douglas, A., & Barnes, B. (2006). Measuring student satisfaction at a UK university.Quality Assurance in Education, 14(3), 251–267. doi:10.1108/09684880610678568
Dietenberger, G., Frick, R., Gomez, J., & Solak, K. (2016). Systematic management of laboratorysupplies. Accessed September 8, 2016 from http://www.medlabmag.com/
44 R.B. Garcia et al.

Elliot, K. M., & Healy, M. A. (2001). Key factors influencing student satisfaction related torecruitment and retention. Journal of Marketing for Higher Education, 24(2), 197–209.
Gallifa, J., & Batalle, P. (2010). Student perceptions of service quality in a multi-campus highereducation system in spain. Quality Assurance in Education, 18(2), 156–170.
Gatfield, T. (2000). A scale for measuring student perceptions of quality: an Australian Asianperspective. Journal of Marketing for Higher Education, 10(1), 27–41.
Green, D. (1994). What is quality in higher education? Buckingham: The Society for Researchinto Higher Education and Open University Press.
Hanaysha, J. R., Abdullah, H. H., & Warokka, A. (2011). Service quality and students’ satisfactionat higher learning institutions: The competing dimensions of Malaysian Universities’competitiveness. Journal of Southeast Asian Research, 4(1), 1–10.
Harvey, L., & Newton, J. (2004). Transforming quality evaluation. Quality in Higher Education,10(2), 149–165.
Hill, Y., Lomas, L., & MacGregor, J. (2003). Students’ perceptions of quality in higher education.Quality Assurance in Education, 11(1), 15–20.
Joseph, C. (2016). Customer service tips for a front desk. Accessed September 8, 2016 from http://smallbusiness.chron.com
Lacovidou, M., Gibbs, P., & Zopiatis, A. (2009). An exploratory use of the stakeholder approachto defining and measuring quality: The case of a cypriot higher education institution. Quality inHigher Education, 15(2), 147–165.
Malik, M. E., Danish, R. Q., & Usman, A. (2010). The impact of service quality on students’satisfaction in higher education institutes of Punjab. Journal of Management Research, 2(2), 1–11.
MacDonald, S. (2015). Why customer complaints are good for your business. Accessed September8, 2016 from http://www.superoffice.com/
Models and theories of customer satisfaction. (2015). Accessed September 8, 2016 from https://www.ukessays.com
Morley, L. (2003). Quality and power in higher education. Maidenhead, Berkshire: The Societyfor Research into Higher Education & Open University press
Nadiri, H., Kandampully, J., & Hussain, K. (2009). Students’ perceptions of service quality inhigher education. Total Quality Management & Business Excellence, 20(5), 523–535.
Newton, J. (2002). Views from below: Academics coping with quality. Quality in HigherEducation, 8(1), 39–61.
O’Neill, M. A., & Palmer, A. (2004). Importance-performance analysis: A useful tool for directingcontinuous quality improvement in higher education. Quality Assurance in Education, 12(1),39–52.
Parasuraman, A., Berry, L. L., & Zeithaml, V. A. (1988). SERVQUAL: A multiple-item scale formeasuring consumer perceptions of service quality. Journal of Retailing, 64(1), 12–40.
Parasuraman, A., Berry, L. L., & Zeithaml, V. A. (1991). Refinement and reassessment of theSERVQUAL scale. Journal of Retailing, 67(4), 420–450.
Public Relations Officer. (2016). Accessed September 6, 2016 from https://www.prospects.ac.ukSharrief, M. (2016). How to improve a company’s responsiveness to improve customer service.
Accessed September 8, 2016 from http://smallbusiness.chron.com/Teeroovengadum, V., Kamalanabhan, T. J. & Seebaluck, A. K. (2016). Measuring service quality
in higher education: Development of a hierarchical model (HESQUAL). Quality Assurance inEducation, 24 (2), 244–258.
The Difference Between Effectiveness and Efficiency Explained. (2016). http://www.insightsquared.com
Windemer, A. (2016). Skills & qualities to be a desk assistant. Accessed September 7, 2016 fromhttp://work.chron.com/skills-qualities-desk-assistant
4 Service Quality of Higher Education Institution … 45

Chapter 5An Exploratory Study of SocioculturalAdaptation Among International Studentsin Malaysia
Bessie Ong and K.C. Cheong
Abstract International students who come to Malaysia for higher educationencounter additional challenges compared to the domestic students. In particular,the internationals also experience acculturative stress, or culture shock, arising fromstudying abroad. This study aims to identify the adjustment challenges experiencedby international students in an American degree transfer program at a private ter-tiary institution in Malaysia. A cross-sectional quantitative research design isemployed. The results show that acculturation in the program is impacted by fivefactors. These are labeled as social skills, cultural empathy, interpersonal com-munication, survival, and involvement in campus activities. Most of the interna-tionals demonstrated moderate to low involvement in social and recreationalactivities on campus. Those from Pakistan and Bangladesh perceive more culturaldifficulties than those from other nations. They are also the least involved in campusactivities. The difficulties to “fit in” could have made students from these twocountries withdraw into their own ethnic groups, thus reducing opportunities forthem to make connections with the other campus communities.
Keywords Acculturation � International students � Sociocultural adaptation �Fitting in
5.1 Introduction
International students come from other countries to pursue higher education inMalaysian institutions (hereby known as college) on a student visa. Their sojourn istransient so they have to quickly adapt socially and culturally to these new situa-tions, as well as adapting to discourses in academic disciplines. Hence, internationalstudents encounter more challenges than the domestic students in their transition tocollege.
B. Ong (&) � K.C. CheongSchool of Liberal Arts and Science, Taylor’s University, Subang Jaya, Malaysia
© Springer Nature Singapore Pte Ltd. 2018S.F. Tang and S.E. Cheah (eds.), Redesigning Learning for GreaterSocial Impact, DOI 10.1007/978-981-10-4223-2_5
47

Culture shock is normally experienced by anyone relocating to a new country(Oberg, 1960). Such anxieties result from the loss of social support from one’s ownculture while establishing a new one in the host culture (Adler, 1975; Kenneth,1971). The culture shock theory has since been extensively researched and severalassociated concepts and models have emerged. A notable one by Berry (1970)proposed the concept of acculturative stress to refer to conflicts arising from livingabroad. He considers acculturation as a transitional process that can have bothpositive and negative experiences. Eventually these issues will disappear becausethe sojourner can adapt, albeit at different rates, depending on individualcharacteristics.
Cross-cultural adaptation is distinguished by Searle and Ward (1990) into twodomains—psychological and sociocultural adaptations. Psychological adaptationcomes about from employing coping strategies in order to achieve emotionalwell-being. Those who experienced psychological distress are more likely tobecome lonely, homesick, and depressed, or display some psychosomatic disorders(Ward & Rana-Deuba, 1999). Sociocultural adaptation, on the other hand, is abehavioral adjustment to “fit in” by acquiring appropriate cognitive skills to interactin the host environment.
Searle and Ward (1990) developed the Sociocultural Adaptation Scale (SCAS)to measure the outcome of sociocultural adaptation among international students.The earlier version assessed intercultural competence with emphasis on behavioraldomains. Later, Ward and Kennedy (1999) expanded the SCAS to consist of 40items with the addition of more cognitive domains. The instrument allowed theseitems to be modified and selected to suit the characteristics of the sample. Variousversions of the SCAS have been found to be reliable and psychometrically robustacross a wide range of culturally diverse sojourning groups, including students andadults (Ward & Kennedy, 1999).
This analysis is a preliminary case study of the sociocultural adaptation ofinternational students at an American degree transfer program (ADP) in a privateMalaysian university. Specifically we will be looking at the ability of these studentsto survive and adapt to the Malaysian culture and to interact effectively with thelocal and other ethnic students. The SCAS by Ward and Kennedy (1999) is selectedas the instrument of our survey due to its ease of use and flexibility as a preliminarysurvey. Our objectives are to determine (i) how well are international studentsinteracting and adapting socially and culturally in this program; (ii) how is socio-cultural adaptation affected by selected demographic characteristics, particularly,length of time in country, country of origin, and the type of residence.
The ADP enrolls students for a period of five semesters for credit transfer toNorth American four-year institutions to complete an undergraduate degree. Thestudent population is approximately 700 of which 12% are internationals. Being aprivate university, tuition fees are much higher than the national ones. Scholarshipsare limited, so students who enroll in this private university are from middle- andupper-middle-income groups. ADP serves as a bridging program to prepare stu-dents for the American tertiary curriculum and also as a cost-saving measure formany. Their stay in the program, and in Malaysia, is very transient, that is, not more
48 B. Ong and K.C. Cheong

than two years before they transfer their study credits to North American univer-sities. Hence, the acculturation process of this group of students in ADP has to beswift. Recognizing the issues that impact their adaptation would be the first step tofacilitate an easier “fitting in” for these international students.
5.2 Literature Review
Sociocultural adaptation is a process associated with how well an internationalstudent is able to “fit in” the new environment. It is dependent on his or her socialskills and competency in managing the day-to-day tasks required for surviving andintegrating in this new culture (Ward & Kennedy, 1999). Some of the many factorsthat have been identified to impact sociocultural adaptation include language flu-ency, length of time in the country and cultural distance.
The lack of comprehension of English and differences in accent can impact theunderstanding of the lectures (Nasirudeen, Koh, Lau, Lim, & How, 2014), besidesdifficulties in oral and written communication (Abraim-Yago, Yoder, &Kataoka-Yahiro, 1999). English language proficiency is especially a major barrierfor students from non-English-speaking countries who study in countries in whichEnglish is the first language such as the USA, Canada, UK, and Australia; or incountries where courses are conducted in English (Poyrazli, Thukral, & Duru,2010; Sandhu & Asrabadi, 1994). For instance, non-English-speaking Asian stu-dents in Singapore where courses are conducted in English experience a higherlevel of acculturative stress (Nasirudeen et al., 2014).
While English proficiency is important in the classroom, awareness of the lin-guistic diversity in which English is spoken in a multicultural country like Malaysiais equally important for cross-cultural interaction outside the classroom(Khojastehrad & Sattarova, 2015). Malaysians from different educational, ethnic,and geographical backgrounds speak English at different levels of proficiency. Aninternational student who just arrived in Malaysia often think that someone who isspeaking English actually sounds like speaking Chinese or Malay.
Length of stay in a new country is another predictor of acculturative difficulties.Normally, culture shock becomes diminished after a longer period in the country.Ward and Kennedy (1999) found Malaysian and Singaporean students encounteredthe greatest social difficulty during the first month of stay in New Zealand, but wereable to adapt and cope better after six to twelve months in the country. In the studyby Nasirudeen et al. (2014) international students who stayed longer in Singaporealso reported lower levels of homesickness.
Cultural distance refers to the similarities in cultural norms, language, andeconomy between the host and the home country. The more similar incultural/social norms and communication patterns, the less discrimination will beperceived by the internationals. They would feel more easily accepted and socially
5 An Exploratory Study of Sociocultural Adaptation … 49
connected instead of being isolated and lonely. Thus compared to Europeans, Asianstudents, whose culture is typically collectivistic, found it harder to adapt to theWestern type of culture in the USA which emphasizes individualism andassertiveness (Fritz, Chin, & DeMarinis, 2008; Yeh & Inose, 2003). But Malaysianstudents studying in Singapore experienced lower acculturative stress than thosefrom China and Myanmar since Malaysia and Singapore are regional neighbors andboth countries share the same multicultural norms and language (Nasirudeen et al.,2014).
5.3 Method
5.3.1 Instrument
The instrument that we used consisted of two sections. Section I gathers somedemographic data of the participants such as the country of origin, the time whenthey first arrived in Malaysia, and where they are staying while in Malaysia. Thesecond part is a modified version of the Sociocultural Adaptation Scale (SCAS)developed by Ward and Kennedy (1999). The original SCAS had 40 items and wasdesigned to measure the degree to which international students perceived difficultiesin understanding the local values and cultures, interacting with the hosts, meetingthe demands of daily life, and behaving in a culturally appropriate manner. Weselected 26 items that are relevant to our sample. Participants respond to all the 26items in the questionnaire using a 5-point Likert scale ranging from strongly dis-agree (1) to strongly agree (5). The statement for each item in the scale was in thefirst person (e.g., I have no problems in understanding the local jokes).
5.3.2 Participants
We distributed the questionnaire to all the 83 international students in the program.Sixty-four completed questionnaires were returned after two weeks, making asampling success of 77%. There were 61% male and 39% female, originating from18 different countries. The majority of them are from East Asia (e.g., Korea 31%,China 3%, Kazakhstan 3%, Japan 3%, Hong Kong 2%), the Indian continent (e.g.,Pakistan 11%, Bangladesh 8%, Sri Lanka 6%, India 2%), Southeast Asia (e.g.,Indonesia 11%, Singapore 3%, Myanmar 3%) while other countries are less rep-resented (e.g., 3% from Canada, Iran and Yemen; 2% each from France, Morocco,and Maldives). Since the students from Pakistan, Bangladesh, Korea, and Indonesiamake up the majority of the international student population in the ADP, our dataanalysis will focus on these nationals only.
50 B. Ong and K.C. Cheong

5.3.3 Data Analysis
Kaiser-Meyer-Olkin (KMO) test of sampling adequacy (KMO = 0.845) and theBartlett test of sphericity (p = 0.000) indicated that factor analysis can be appliedon the responses to produce reliable constructs or dimensions. In order to identifythe underlying constructs or dimensions, responses from participants were analyzedusing principal component factor analysis (SPSS version 21). Preliminary exami-nation of the emerging factors indicated low interfactor correlations. Therefore, thefactors were considered unrelated and an orthogonal (varimax) rotation wasemployed. Examinations of the Scree Plot of the variance associated with eachfactor and changes in eigenvalues across factors were used to determine the numberof factors to retain.
One-way analysis of variance (ANOVA) was run on the extracted factors todetermine whether there are any significant differences among the internationalstudents with respect to (i) length of stay which we categorized as being in Malaysiafor less than six months, from 7 to 12 months and exceeding 12 months;(ii) country of origin where we used only the countries that are more represented,i.e., Korea, Indonesia, and Pakistan and Bangladesh, the latter two are in one groupthat represented nationals from the Indian continent; and (iii) type of residence inMalaysia, which includes staying at the university dormitory, other residencesoutside the campus, and staying with their family in Malaysia.
After the ANOVA, a post hoc procedure using Scheffe’s subtest was done toverify mean differences among groups of equal variances and of different samplesize while Tamhane’s T2 subtest was used for groups of unequal variances and ofdifferent sample size. Levene’s test was used to verify homogeneity of variancesamong the groups.
5.4 Results
Descriptive statistics in Table 5.1 indicate that most students are staying off campuswith other students or with their family. Only about 28% of them are staying in thecampus dormitory of which the majority is staying alone instead of sharing theroom. These students are from Pakistan/Bangladesh and Korea. A large proportionof Indonesian and Korea are actually staying with their family who are working asexpatriates in Malaysia for more than 12 months. The Pakistani and Bangladesh,however, are mainly new arrivals commencing their sojourn to Malaysia in the firstsemester at this university.
Examination of the Scree Plot and eigenvalues indicated that five factors arereasonable and conceptually meaningful. These five factors accounted for 68.02%of the total variance. All factor loadings above 0.50 are presented in Table 5.2.
We labeled Factor 1 as social skills. This factor consists of seven items relatingto interaction with the local students, other ethnic groups, gender differences, and
5 An Exploratory Study of Sociocultural Adaptation … 51
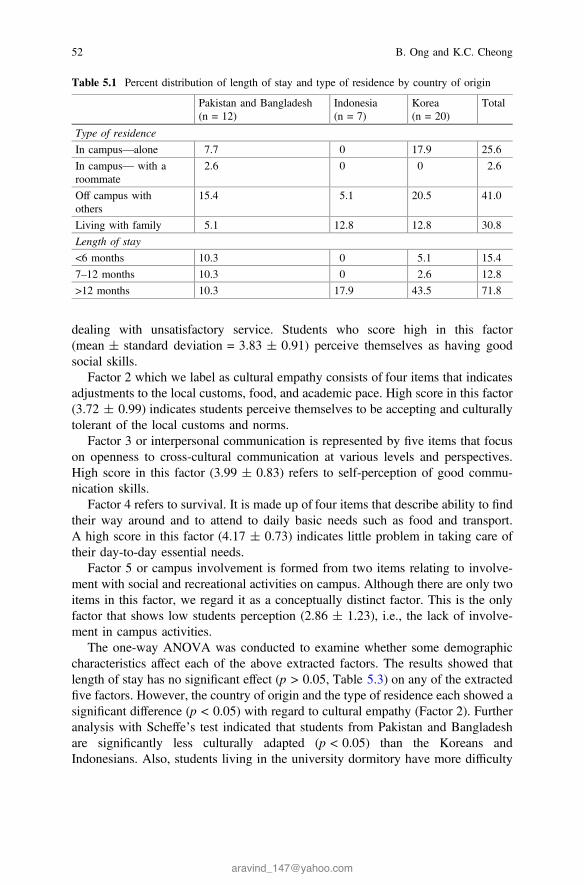
dealing with unsatisfactory service. Students who score high in this factor(mean ± standard deviation = 3.83 ± 0.91) perceive themselves as having goodsocial skills.
Factor 2 which we label as cultural empathy consists of four items that indicatesadjustments to the local customs, food, and academic pace. High score in this factor(3.72 ± 0.99) indicates students perceive themselves to be accepting and culturallytolerant of the local customs and norms.
Factor 3 or interpersonal communication is represented by five items that focuson openness to cross-cultural communication at various levels and perspectives.High score in this factor (3.99 ± 0.83) refers to self-perception of good commu-nication skills.
Factor 4 refers to survival. It is made up of four items that describe ability to findtheir way around and to attend to daily basic needs such as food and transport.A high score in this factor (4.17 ± 0.73) indicates little problem in taking care oftheir day-to-day essential needs.
Factor 5 or campus involvement is formed from two items relating to involve-ment with social and recreational activities on campus. Although there are only twoitems in this factor, we regard it as a conceptually distinct factor. This is the onlyfactor that shows low students perception (2.86 ± 1.23), i.e., the lack of involve-ment in campus activities.
The one-way ANOVA was conducted to examine whether some demographiccharacteristics affect each of the above extracted factors. The results showed thatlength of stay has no significant effect (p > 0.05, Table 5.3) on any of the extractedfive factors. However, the country of origin and the type of residence each showed asignificant difference (p < 0.05) with regard to cultural empathy (Factor 2). Furtheranalysis with Scheffe’s test indicated that students from Pakistan and Bangladeshare significantly less culturally adapted (p < 0.05) than the Koreans andIndonesians. Also, students living in the university dormitory have more difficulty
Table 5.1 Percent distribution of length of stay and type of residence by country of origin
Pakistan and Bangladesh(n = 12)
Indonesia(n = 7)
Korea(n = 20)
Total
Type of residence
In campus—alone 7.7 0 17.9 25.6
In campus— with aroommate
2.6 0 0 2.6
Off campus withothers
15.4 5.1 20.5 41.0
Living with family 5.1 12.8 12.8 30.8
Length of stay
<6 months 10.3 0 5.1 15.4
7–12 months 10.3 0 2.6 12.8
>12 months 10.3 17.9 43.5 71.8
52 B. Ong and K.C. Cheong
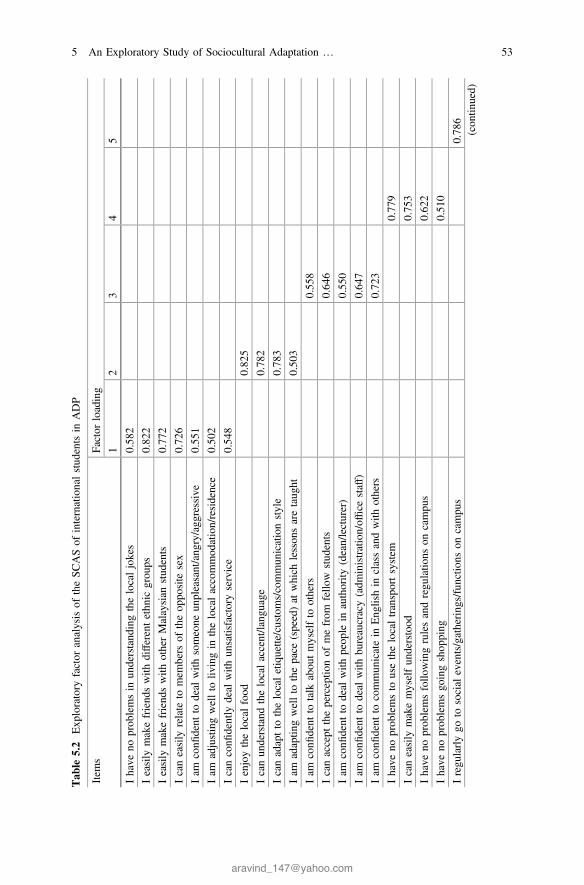
Tab
le5.2
Exp
loratory
factor
analysisof
theSC
ASof
internationalstud
entsin
ADP
Item
sFactor
loading
12
34
5
Ihave
noprob
lemsin
understand
ingthelocaljokes
0.58
2
Ieasily
makefriend
swith
differentethn
icgrou
ps0.82
2
Ieasily
makefriend
swith
otherMalaysian
stud
ents
0.77
2
Icaneasily
relate
tomem
bers
oftheop
posite
sex
0.72
6
Iam
confi
dent
todeal
with
someone
unpleasant/ang
ry/agg
ressive
0.55
1
Iam
adjustingwellto
livingin
thelocalaccommod
ation/residence
0.50
2
Icanconfi
dently
deal
with
unsatisfactoryservice
0.54
8
Ienjoythelocalfood
0.82
5
Icanun
derstand
thelocalaccent/lang
uage
0.78
2
Icanadaptto
thelocaletiquette/customs/commun
icationstyle
0.78
3
Iam
adaptin
gwellto
thepace
(speed)at
which
lesson
saretaug
ht0.50
3
Iam
confi
dent
totalk
abou
tmyselfto
others
0.55
8
Icanaccept
theperceptio
nof
mefrom
fello
wstud
ents
0.64
6
Iam
confi
dent
todeal
with
peop
lein
authority
(dean/lecturer)
0.55
0
Iam
confi
dent
todeal
with
bureaucracy(adm
inistration/office
staff)
0.64
7
Iam
confi
dent
tocommun
icatein
Eng
lishin
classandwith
others
0.72
3
Ihave
noprob
lemsto
usethelocaltransportsystem
0.77
9
Icaneasily
makemyselfun
derstood
0.75
3
Ihave
noprob
lemsfollo
wingrulesandregu
latio
nson
campu
s0.62
2
Ihave
noprob
lemsgo
ingshop
ping
0.51
0
Iregu
larlygo
tosocial
events/gathering
s/functio
nson
campu
s0.78
6(con
tinued)
5 An Exploratory Study of Sociocultural Adaptation … 53
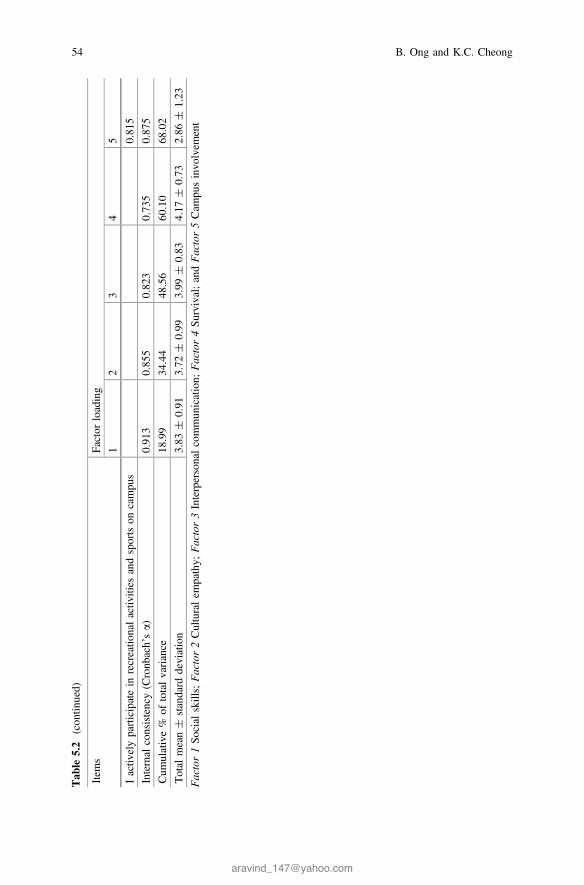
Tab
le5.2
(con
tinued)
Item
sFactor
loading
12
34
5
Iactiv
elyparticipatein
recreatio
nalactiv
ities
andsportson
campu
s0.81
5
Internal
consistency(Cronb
ach’sa)
0.91
30.85
50.82
30.73
50.87
5
Cum
ulative%
oftotalvariance
18.99
34.44
48.56
60.10
68.02
Total
mean±
standard
deviation
3.83
±0.91
3.72
±0.99
3.99
±0.83
4.17
±0.73
2.86
±1.23
Factor1So
cial
skills;Factor2Culturalem
pathy;
Factor3Interpersonalcommun
ication;
Factor4Su
rvival;andFactor5Cam
pusinvo
lvem
ent
54 B. Ong and K.C. Cheong

to adapt to the local culture and customs than those living outside the campus andthose staying with their family.
Table 5.3 also showed that students are most active in campus activities duringtheir first six months in Malaysia, but their involvement waned as the length of stayincreases. Those from Pakistan and Bangladesh are the least involved among all thenationalities. Surprisingly those staying in the campus dormitories are less engagedin campus activities than those living outside or with their family despite livingwithin the vicinity of the campus.
Since the country of origin and the type of residence are found to significantlyaffect cultural empathy (Factor 2), we calculated the mean values for each of thevariables in this factor to examine for specific item that has been impacted by thementioned demographic variables. As shown in Table 5.4, students from Pakistanand Bangladesh, unlike the others, did not quite like the food in Malaysia. Neitherdo they find it easy to understand the local language, accent, communication style,and the customs. Likewise, those living in the campus dormitory are less acceptingof the local food, language, accent, communication style, and the customs com-pared to those living in other types of residence (Table 5.5).
5.5 Discussion
This study has enabled us to understand some of the sociocultural challengesencountered by international students in their acculturative process at ADP inMalaysia. Five factors are found to impact the acculturation process, namely socialskills, cultural empathy, interpersonal communication, survival, and involvement incampus activities. We consider these factors as subscales that split off from theoriginal two main factors extracted by Ward and Kennedy (1999), i.e., culturalempathy and relations, and impersonal endeavors and perils. These differences areprobably due to the differences in the sociocultural context of our study and theirs.Nonetheless, the instrument has illustrated some adjustment issues encountered byour international students.
Students from Pakistan and Bangladesh stand out as a group that is the leastengaged with campus activities and also less culturally adjusted compared to theIndonesians and Koreans. With regard to the latter, their perception toward the localfood, custom, language, and communication style is less favorable. Both thesecountries are from the North Indian continent which is culturally more differentfrom Malaysia in many aspects. For instance, the Pakistani Urdu and the Bengalilanguages have different communication patterns, signs, and symbols from theMalay and Mandarin languages that are commonly used among Malaysian studentsfor communication outside the classroom other than English. These differences incommunication variables, especially linguistic variety of spoken English and pro-ficiency in the host cultural language, have been found to be an important mediatingfactor for making contact with the host culture in Malaysia (Khojastehrad &Sattarova, 2015; Mustaffa & Ilias, 2013). A large proportion of the local student
5 An Exploratory Study of Sociocultural Adaptation … 55

Tab
le5.3
ANOVA
betweenleng
thof
stay,coun
tryof
origin,type
ofresidence,
andtheextractedsocioculturalfactors
Mean±
SD
Social
skills
Cultural
empathy
Interpersonal
comm.
Survival
Cam
pus
invo
lvem
ent
Lengthof
stay
�6mon
ths(n
=12
)3.76
±1.18
3.46
±1.09
4.25
±0.83
3.98
±0.71
3.04
±1.18
7–12
mon
ths(n
=10
)3.81
±0.54
3.45
±0.78
4.20
±0.54
4.10
±0.52
3.00
±0.78
�12
mon
ths(n
=42
)3.86
±0.92
3.88
±0.99
3.88
±0.87
4.24
±0.78
2.77
±1.34
Cou
ntry
oforigin
Pakistan
andBangladesh#
(n=12
)3.55
±1.07
3.13
±1.04
a4.33
±0.51
4.04
±0.63
2.50
±1.11
Indo
nesia(n
=7)
4.43
±0.58
4.46
±0.51
a4.20
±0.58
4.32
±0.70
2.71
±0.91
Korea
(n=20
)3.92
±0.84
4.09
±0.74
a3.72
±0.94
4.23
±0.67
2.83
±1.44
Residence
In-Cam
pus**
(n=17
)3.56
±0.94
3.34
±0.89
b3.82
±0.84
4.07
±0.69
2.71
±1.12
Off-cam
pus(n
=33
)3.81
±0.91
3.70
±1.01
b4.00
±0.89
4.14
±0.79
2.97
±1.21
Family
(n=14
)4.22
±0.83
4.30
±0.83
b4.20
±0.61
4.34
±0.68
2.79
±1.46
One-w
ayANOVA
(sig.at
the0.05
level);Meandifference
issig.
atthe0.05
level(Scheffe’s
subtest:pvalue)
a ANOVA:p=0.00
2<0.05
;# B
etweenPakistan/BangladeshandIndo
nesia:
p=0.00
6;andBetweenPakistan/BangladeshandKorea:p=0.01
0b A
NOVA:p=0.02
2<0.05
**Betweenin-cam
pusandfamily
:p=0.02
3
56 B. Ong and K.C. Cheong

population in this private university is Chinese by race. The Chinese are culturallyand religiously different from the Pakistani and Bangladeshi, but are more culturalsimilar to the Koreans. Indonesian students generally feel at home in Malaysia sincewe are regional neighbors. Besides, Malaysia and Indonesia have nearly similarcultural norms and language. Also, the Korean and Indonesian students have beenin Malaysia for more than a year and many are staying with their family. Thus, boththe Koreans and Indonesians can blend more easily into the Malaysian society,while those from Pakistan and Bangladesh are more awkward in their socialinteractions. This finding is similar to other studies in which adaptation is found tobe negatively associated with cultural distance (Demes & Geeraert, 2013; Fritzet al., 2008; Yeh & Inose, 2003; Ward & Kennedy, 1999).
Because students from Pakistan and Bangladesh face difficulties to fit in, theywould more likely form cliques among their own ethnic group for social supportand emotional comfort. Retreat into the same ethnic group can make internationalstudents less eager to make contact with the host community and to enlarge theirsocial circle (O’Reilly, Ryan, & Hickey, 2010). Similar observations are made byEe (2013) and Kusek (2015) in which cultural differences led international studentsto gather with those from similar cultural backgrounds, and resulting in low level of
Table 5.4 Mean values for items in cultural empathy (Factor 2) according to country of origin
Mean ± SD
Pakistan andBangladesh
Indonesia Korea
I like the local food (q14) 2.83 ± 1.467 4.71 ± 0.49 4.40 ± 0.82
I can understand the local accent/language(q21)
2.67 ± 1.435 4.14 ± 1.1 3.85 ± 0.88
I can adapt to the localetiquette/customs/communication style (q22)
3.25 ± 1.435 4.57 ± 0.54 3.90 ± 1.02
I am adapting well to the pace at whichlessons are taught (q26)
3.75 ± 1.055 4.43 ± 0.79 4.20 ± 0.89
Table 5.5 Mean values for items in cultural empathy (Factor 2) according to type of residence
Mean ± SD
Staying incampusdormitory
Staying with otherstudents outsidecampus
Stayingwith family
I like the local food (q14) 3.29 ± 1.40 3.91 ± 1.40 4.29 ± 1.14
I can understand the localaccent/language (q21)
3.18 ± 1.02 3.18 ± 1.31 4.07 ± 1.14
I can adapt to the localetiquette/customs/communicationstyle (q22)
3.41 ± 1.00 3.55 ± 1.18 4.43 ± 0.85
I am adapting well to the pace atwhich lessons are taught (q26)
3.47 ± 1.07 4.15 ± 0.87 4.43 ± 0.76
5 An Exploratory Study of Sociocultural Adaptation … 57

engagement with the local community. However, a study by Wu, Garza, andGuzman (2015) showed that international students studying in the USA experi-enced social isolation in class and social event because their American peers do notunderstand their background and tend to exclude them from their activities. Sincethe scope of our study is exploratory, we are unable to ascertain whether the lack ofengagement in campus activities by students from Pakistan and Bangladesh is dueto their reluctance to broaden their social networking or because they feltmarginalized.
The next issue relates to the low cultural empathy of students living in thecampus dormitory. The place of residence can be considered as a container inAneshensel’s (2010) “person–environment fit” model and it can affect an individ-ual’s social interactions leading to acculturative distress depending on individualcharacteristics. This observation is affirmed by Nair (2014) who shows students inSingapore who are staying in international student hostel experienced moreacculturative stress because they are living in an enclave that reduces contact withthe host community. Living within campus dormitory, and especially if they are notsharing the room with other nationals, can reduce opportunities to connect andinteract with others in order to promote cross-cultural interaction. Hence, the dis-interest gets to involve with the campus social and recreational activities becausethey have no friends to relate to. We would like to suggest that internationals whoare allocated residence in the campus hostel must share the room with either thehost national or other ethnic groups, instead of living alone. The social supportarising from this arrangement can also help reduce feelings of loneliness andhomesickness (O’Reilly et al., 2010), thus improving not only their psychologicalbut also sociocultural adaptation, as both are interrelated. Pairing of an internationalfreshman with a senior buddy could be another way to improve their adaptation.
Overall engagement in campus activities was found to be most active during thesojourners’ first six months in the program. This can be attributed to the variousfirst-year experience (FYE) activities that are organized as part of the orientationendeavor in ADP. In the subsequent semesters, the international students becomeless involved as the orientation activities are focused on freshmen in the firstsemester. The reduced engagement after six months in the program could alsoimply that they have found their own social groups and they are associating withthem on a private basis.
The findings of the present study should be carefully interpreted because wefocused on a small group of international students at a specific program. Thus,generalizability of the findings beyond this group of international students as wellas to the institution at large is limited. Also, the flexibility of the SCAS acrosscultural contexts may in itself be a limitation as applications across different con-texts and acculturating individuals may not be comparable.
Acculturation is a complex process. Each culture has its own peculiarity andneeds. This study has revealed only certain engagement behaviors and perceptionsexhibited by international students at ADP. Their social networking pattern is worthfurther exploration since community interactions are essential for buildingcross-cultural relations (Rienties, Johan, & Jindal-Snape, 2015). So establishment
58 B. Ong and K.C. Cheong

of specific efforts aimed at making international students to be moreinvolved/engaged in the campus throughout their stay here could encourage moreintercultural friendships.
References
Abraim-yago, K., Yoder, M., & Kataoka-Yahiro, M. (1999). The cummins model: A frameworkfor teaching nursing students for whom English is a second language. Journal of TransculturalNursing, 10, 143–149.
Adler, P. S. (1975). The transitional experience: An alternative view of culture shock. J HumanistPsychol, 15, 13–23.
Aneshensel, C. S. (2010). The neighborhood as a social context of the stress process. InW. R. Avison, C. S. Aneshensel, S. Schieman, & B. Wheaton (Eds.), Advances in theconceptualization of the stress process, essays in honor of Leonard I. Perlin (pp. 35–50). NewYork: Springer Publishing.
Berry, J. W. (1970). Marginality, stress and ethnic identification in an acculturated aboriginalcommunity. Journal of Cross-Cultural Psychology, 1, 239–252.
Demes, K. A., & Geeraert, N. (2013). Measures matter: Scales for adaptation, cultural distance andacculturation orientation revisited. Journal of Cross-Cultural Psychology, XX(X), 1–19.
Ee, J. (2013). “Is he an idiot!” Experiences of international students in the United Stat es. Journalof International Students, 3(1), 72–75.
Fritz,M.V., Chin,D., &DeMarinis,V. (2008). Stressors, anxiety, acculturation and adjustment amonginternational and North American students. International Journal of Intercultural Relations, 32,244–259.
Kenneth, H. D. (1971). Culture shock and development of self-awareness. Journal ofContemporary Psychotherapy, 4(1), 44–48.
Khojastehrad, S., & Sattarova, M. (2015). International students’ linguistic awareness of malaysianEnglish and its impact on intercultural communication effectiveness. Advances in Languageand Literary Studies, 6(5), 250–260.
Kusek, W. A. (2015). Evaluating the struggles with international students and local communityparticipation. Journal of International Students, 5(2), 121–13.
Mustaffa, C. S., & Ilias, M. (2013). Relationship between students adjustment factors and crosscultural adjustment: a survey at the Northern University of Malaysia. InterculturalCommunication Studies XXII, 1, 279–300.
Nair, J. (2014) Acculturative stress in multi-cultural Singapore: Examining impact of place ofresidence and other predictors. UB No: 11030261. A research project submitted to theUniversity of Bradford in partial fulfillment of the requirements for the degree o f (Psychologywith Counselling) SY-6007W_2013-4_SEP_B University of Bradford, May 2014.
Nasirudeen, A. M. A., Koh, W. N. J., Lau, L. C. A., Lim, L. S., & How, A. L. (2014).Acculturative stress among Asian international students in Singapore. Journal of InternationalStudents, 4(4), 363–373.
Oberg, K. (1960). Cultural shock: Adjustment to new cultural environments. PracticalAnthropology, 7, 177–182.
O’Reilly, A., Ryan, D., & Hickey, T. (2010). The psychological well-being and socioculturaladaptation of short-term international students in Ireland. Journal of College StudentDevelopment, 51(5), 584–598.
Poyrazli, S., Thukral, R. K., & Duru, E. (2010). Interantional students’ race ethnicity, personalityand acculturative stress. Journal of Psychology and Counselling, 2, 25–32.
Rienties, B., Johan, N., & Jindal-Snape, D. (2015). Bridge building potential in cross-culturallearning: A mixed method study. Asia Pacific Educ, Rev., 16, 37–48.
5 An Exploratory Study of Sociocultural Adaptation … 59

Sadhu, D., & Asrabadi, B. (1994). Development of an acculturative stress scale for internationalstudents: Preliminary findings. Psychological Reports, 75, 435–448.
Searle, W., & Ward, C. (1990). The prediction of psychological and sociocultural adjustmentduring cross-cultural transitions. International Journal of Intercultural Relations, 14, 449–464.
Ward, C., & Kennedy, A. (1999). The measurement of sociocultural adaptation. InternationalJournal of Intercultural Relations, 23(4), 659–677.
Ward, C., & Rana-Deuba, A. (1999). Acculturation and adaptation revisited. Journal ofCross-Cultural Psychology, 30, 372–392.
Wu, H.P., Garza, E., & Guzman, N. (2015). International students’ challenges and adjustment tocollege. Education Research International, (vol 2015). Article ID 202753, 9 page. doi:10.1155/2015/202753
Yeh, C. J., & Inose, M. (2003). International students reported English fluency, social supportsatisfaction and social connectedness as predictors of acculturative stress. CounsellingPsychology Quarterly, 2003, 15–28.
60 B. Ong and K.C. Cheong

Chapter 6First-Year Experience (FYE) CurriculumReview for Academic, Social,and Emotional Connect
Prema Ponnudurai and Rajalakshmi Ganesan
Abstract As Asia focuses on becoming a global educational hub, first-yearexperience (FYE) is commanding center stage. Studies have indicated that successin HE lies in its curriculum being academically, socially, and emotionally engaging.Therefore, a curricular review of the American Degree Transfer Program (ADTP)was conducted focusing on FYE practices in addressing the needs of first semester,transitioning students. This paper synthesizes two governing FYE theories, Kift(The next, great first year challenge: Sustaining, coordinating and embeddingcoherent institution-wide approaches to enact the FYE as ‘everybody’s business’.Keynote. 11th Pacific Rim first year in higher education conference: an apple forthe lecturer, 2008) and Tinto (Int J First Year High Educ 3(1):1–8, 2012) in ana-lyzing and reviewing the curricula. The key components of transitional skills,academic, and social initiatives were analyzed in a quantitative and qualitativemode. A t test analysis indicated that the current practice was significantly different(t = −7.31, p < 0.05) from the ideal practice with a large effect size (Cohen’sd = 1.3). The qualitative evaluation of the current practice revealed that thestrengths of the program were in its academic and social initiatives, however, weakin its transitional skills support. Simplified, it is imperative that efforts are contin-uous in refining the curriculum to meet students’ needs, engage students academ-ically, socially, and emotionally for first-year student’s success.
Keywords First-year experience � Curriculum review � Academic � Social andemotional connect
P. Ponnudurai (&) � R. GanesanTaylor’s University, Subang Jaya, Malaysiae-mail: [email protected]
R. Ganesane-mail: [email protected]
© Springer Nature Singapore Pte Ltd. 2018S.F. Tang and S.E. Cheah (eds.), Redesigning Learning for GreaterSocial Impact, DOI 10.1007/978-981-10-4223-2_6
61

6.1 Introduction
Higher Education (HE) is becoming a dominant component of many economiesglobally. With the main initiative to establish a knowledge-driven economy,Malaysia has also placed the education sector in the forefront of its development.With these new developments alongside other initiatives to promote Malaysia as aneducational center, there has been an escalation of students entering higher edu-cation. By 2025, the Malaysian Educational Ministry aims to increase access tohigher education by increasing tertiary enrollment rates from 36 to 53% (Chapman,Rebecca, Ann-Marie, & Stephanie, 2015).
Nevertheless, with all these initiatives although there seem to be an increase ofstudents, keeping the students for 3–4 year undergraduate courses and postgraduateis easily becoming a challenge. The scenario faced by public and private univer-sities is similar whereby, it is the general trend that every year the attrition rateincreases, due to high competition between colleges and institutions and escalatingcost of student recruitment (Govindarajo & Kumar, 2012).
Concurrently, there are extensive studies which support the notion that first-yearstudent experience (FYE) and regard it as a critical transition period for new stu-dents in helping them settle into university life and emphasize its importance inrelation to successful learning and retention (Tinto, 2002; Thomas, 2012; Morgan,2012). Additionally, Hughes (2002) elaborates that attrition rates are a reflection ofproblems with the course, mainly in areas of the delivery mode, content, or design.
This study is reviewing the American Degree Transfer Program (ADTP) con-ducted by a private university which is a 2 + 2 year program, whereby studentsenrolling into the program are mainly school leavers having either completed theMalaysian High School Certificate (SPM), the International General Certificate ofSecondary Education (IGCSE), or O-levels. The student will complete the freshmanand sophomore years in Malaysia, spending approximately 3–6 semesters (� 2years) while accumulating 40–60 credits, before transferring their credits toAmerican, Australian, or Canadian universities to continue their final two years andgraduating. Therefore, all first-year initiatives are implemented in the first semesterdue to the constraints and nature of this program; since some students transfer toUSA within a year, the first-year experience and first semester terms are usedinterchangeably throughout the paper. Therefore, this issue is very much in thevanguard of problems faced by local institution as well as worldwide.
As a result, this investigative study is focused on evaluating the subscribed FYEinitiatives in the current ADTP curriculum, while identifying the strengths andweakness in the curriculum in the effort to reduce attrition rates among its students,which will ultimately provide some direction in identifying effective transitionalpedagogies to be incorporated for student retention.
62 P. Ponnudurai and R. Ganesan

6.1.1 Contributing Causes of Attrition in HE
From the empirical studies on the area of FYE and Student Success, manyresearches have indicated a host of attributes of student attrition. In general, thesecontributing factors are the main causes of attrition faced by the universities:
1. Transition from secondary school to universityThe learning outcomes of secondary school are not similar to the focuses of auniversity, as both have vastly different intentions. Draper (2008) argues thebusiness of schools is to make the lessons interesting and useful for the studentsand not to prepare them for higher education. As such, due to this disconnect,the student becomes the victim of this transition process, as there are vastchanges from teaching to learning pedagogies, environments, quantity ofknowledge, from the two stages of their educational process (Krause, Hartley,James & McInnis, 2005; Yorke & Longden, 2007).
2. External university factorsDraper (2008) who adapted Tinto’s (1975) model indicated that external factorsinclude family background and attributes, financial stability, social standing,individual attributes, and prior qualification. Universities have very little powerover the influence of these external factors.
3. Lack of knowledge of student’s needsBovill, Bulley, and Morss (2011) point out that students were consulted lessoften than employers and other stakeholders with regards to designing thecurriculum to meet student’s needs and wants. As such, the focus of mostuniversity-level courses is to develop individuals to contribute to the workforceof the country (Dathan, 2013). Further, the latest Malaysian Education Blueprintfor higher education (HE) 2015–2025 launched by the Malaysian prime ministerclearly indicates the focal point of HE is in molding the future workforce of thecountry and to change the mindset of graduates from being ‘job seekers’ to ‘jobcreators’ (Chapman et al., 2015). This societal need is put far above the stu-dent’s individual need and contributes to student attrition, as it furthers the gapbetween high school and university and causes the transition process to be evenmore daunting.
6.1.2 Importance of Examining the Curriculum
On a basic level, curriculum can simply be defined as ‘an interactive processdeveloped among learners, teachers, materials and the environment’ (Chen, 2007,p. 120). Nevertheless, in today’s educational climate the term curriculum extendsfar beyond teachers, classrooms, and content, but needs to place students/learners inthe center thus broadening this term. Kift (2004) has coined the term ‘transitionalpedagogy’ when relating to the review of curriculum and should be primarily used
6 First-Year Experience (FYE) Curriculum Review … 63

to scaffold and mediate the first-year learning experience for existing cohorts. Whenreviewing the curriculum, it is also imperative that there is a ‘focus on articulating,implementing, and sustaining first-year curriculum design that is engaging, sup-portive, intentional, relevant, and social’ (STAR, 2005). The first step in combattingthe issue of attrition is by reexamining the curriculum in accordance to the threemain thrust areas identified: transitional skills, academic initiatives, and socialaspects.
The term ‘Transitional skills’ or ‘Induction to Study’ is also commonly used andrefers to the ‘activity of learning how to study at university’ (Morgan, 2013,p. 1449). These skills are imperative to student’s success at university.
Frankola (2001) and Potter and Bye (2014) list the main reasons for studentdropout rates were due to weak time management skills, specific learning styles,lack of motivation, lack of preparedness for university, poor study strategies, andinefficient technological knowledge. Additionally, Morgan (2013) states that it isthis ‘element that is lacking and which can create problems when settling intouniversity and study’ (p. 1147). Therefore, it is important that the curriculumreflects components that include course-specific skills and general academic skillsfor students such as time management, ICT skills, language skills in the areas ofproficiency, and academic writing, in order to ease the transition from secondaryschool to university.
6.2 Methodology
Studies on curriculum design focus on the two main components of the curriculum:lecturers and students (Bovill et al., 2011). However, this study will be focused onreviewing the systems and practices embedded in the current curriculum of thisprogram and fulfilling the syllabus and simultaneously addressing first-year expe-rience and elements in the program which address student integration. Therefore, toachieve these objectives, data were collected from various sources; analyses ofcourse syllabus, informal interview with academic leaders and Associate Dean ofClubs and Associate Dean of Teaching and Learning, Academic Success mentors(ASM), and informal ICT usage data which were all ethically obtained.
Collected data were analyzed using the qualitative and quantitative methods.A content analysis was first conducted to align and evaluate the current practice tothe ideal practice. The ideal practice that the current curriculum was evaluatedagainst incorporates two main theories which govern first-year experiences, namelyTinto’s model of student retention (1975) adapted by Draper (2008) and Kift’s(2008) first-year curriculum model, focusing on the three main pinnacles offirst-year experience: academic skill, academic integration, and social integration.Table 6.1 shows the conceptual framework used for the FYE curriculum review. Asthere has been an amalgamation of two main FYE frameworks, in order to inves-tigate and evaluate the program curriculum, the theoretical framework which aptlyguides this study is of Vygotsky’s (1978) social constructivist theory. This study
64 P. Ponnudurai and R. Ganesan

Table 6.1 Conceptual framework for FYE curriculum review
First-year framework Recommended FYEpractices
Current practices
Traditional soft skillsintegration (Developmentalprograms—Soft skills to helpbridge high schools touniversity preparation)
Tinto (2012):
– Basic academic writingcourse
Not offered
Freshman seminars Keup (2005); Potter and Swing (2006):
– Freshman seminarfocusing on skills
Not offered
Pre-enrollment programs Kift (2008), six principles of curriculum design:
– Time management Not offered
– Academic skills Not offered
– Test taking skills Not offered
– Library literacy skills Provided to freshman
– College level- readingskills
Not offered
– Working in groups Not offered
– Decision-making skills Not offered
Raab and Adam (2005):
– Remedial core course-prior to enrollment
Not offered
Academic integration Kift (2008) and Keup (2005) first-year curriculum design:
Diversity
– Blended teaching andlearning approaches
Highly practiced—all classesinclude blended learningpedagogies at various degrees
– Peer-Assisted StudentSupport (PASS)
Averagely practiced—PASSprograms are available for 12 outof the 48 subjects offered in total
– Self-reflection activities Averagely practiced
Design
– E-portfolio Not practiced
– Career andemployabilityprograms
Not practiced
– Industry and alumnilinkages
Not practiced
Engagement
– Active learningpedagogies—Team/group work
Highly practiced across allcourses
– Small class sizes Highly practiced
– Cumulativeassessments
Averagely practiced
(continued)
6 First-Year Experience (FYE) Curriculum Review … 65

aligns with the constructivist theory as it places the student in the center, focusingon the students’ needs to transition into a different educational setting and given theopportunity to be actively engaged in their new environments both academically,socially and eventually emotionally. A one-sample t test was also performed toidentify if the current curriculum at the ADTP differs significantly from the idealpractice.
6.3 Results
As this study sets out to review the current practices of the ADTP and the rec-ommended practices of first-year experience initiative, both of these elements arelisted in Table 6.1 and matched toward each other for alignment and to identify thestrengths and areas of weakness with the program and to identify the areas whichwould require improvements.
Table 6.1 (continued)
First-year framework Recommended FYEpractices
Current practices
– Academic mentors Highly practiced
Assessment
– Early feedback Averagely practiced
– Provide samples of‘poor,’ ‘average,’ and‘good’ pieces of work
Not practiced
– Develop individualstudy
Averagely practiced
Evaluation and monitoring
– Early alert systems Highly practiced
– Attendance andparticipation
Highly practiced
Social and emotionalintegration
Closson and Nelson (2009); Draper (2008)
– Incorporation ofexperiential learningopportunities—community service
Averagely practiced
– Peer/buddy program,mentor/menteeprograms
Highly practiced
– Extracurricularactivities (ECA)
Highly practiced
– Orientation programs Highly practiced
66 P. Ponnudurai and R. Ganesan

To sum up, from the comprehensive and in-depth review of the program cur-riculum, it is clear that there are certain strengths in the programs and areas ofweakness which need to be addressed, as depicted in Table 6.2. Overall, it wasfound that there is serious weakness when analyzed quantitatively in the area ofacademic support for transitional soft skills integration which has only 11% of thesuggested practices being accomplished. There lacks any form of transitional softskills programs to help high school students transition smoothly into university, asit is assumed that they will learn these skills along the way. Academic initiativesand teaching learning strategies are the strengths of the program, where 100% of therecommended FYE practices is implemented and monitored consistently. All of theabove, done in a collaborative manner is seen to the backbone for engagingfirst-year students, providing experiential learning and creating a meaningfullearning experience (Tsang, 2011).
From Tables 6.3 and 6.4, the one-sample t test revealed that there is a significantdifference between current practices and the ideal practice, as t = −7.31 hadp = 0.00 (p < 0.05). The average difference between the current practice(M = 1.83, standard deviation = 0.87) and the ideal practice (M = 3) is −1.17. Thisdifference is considered quite large as the effect size (Cohen’s d) is 1.3. This clearlyand empirically shows that the current practice at the ADTP still needs to work onimproving the FYE initiatives to facilitate optimal experience and performancefrom students. Although the ADTP’s academic integration, social, and emotionalintegration practices have come out as strengths, on the whole the current practicedoes not measure up to the ideal FYE practices.
Table 6.2 Overall review findings
FYE framework Implemented FYE practices (%) Evaluation
Traditional soft skills integration 11 Weakness
Academic integration 73 Strength
Social and emotional integration 100 Strength
Table 6.3 One-sample statistic
N Mean Std. deviation
Current practice 30 1.83 0.87
Table 6.4 One-sample test
Test value = 3
t df Sig. (2-tailed) Mean difference
Current practice −7.31 29 0.000 −1.17
6 First-Year Experience (FYE) Curriculum Review … 67

6.4 Discussion
The goal of many first-year experience programs is to enable a smooth transition forhigh school leavers into university in the hope that this would provide students witha strong foundation year to support them throughout their university days and inturn reduce university attrition rates. Although past studies have been carried out byuniversities on a large scale, first-year curricular reviews need to be conducted on amicro-level within each program in the university, to include or exclude first-yearinitiatives specific to that particular program structure, in order to wield positiveresults on the whole. Despite the limitations of this study, the curricular strengthsand weakness have been identified. Nevertheless, more comprehensive quantitativeand qualitative studies need to be undertaken to further improve the areas ofshortcomings in the program. Academics too need to be sensitive to their currentstudent’s needs, whereby they demonstrate and value individual student’s strengths(Zepke, 2013) and importantly the right type of trainings need to be identified toequip academics with the skills and know-how to conduct and monitor FYE ini-tiatives effectively.
As with the success of building learning communities, academics should furtherdevelop “teaching communities’’ to enhance and share success teaching strategiesto increase student success. With the first-year concept still lagging in Asia, theprogram needs to further progress in stage 3 and 4 of first-year experience, whichshould be pursued purposefully in a multilayered, partnership approach thatencourages and is supported at a variety of levels of organizational engagement(Kift, 2008). It is undeniable that an institution-wide framework would be beneficialand is the ‘essential structure for sustainability’ (Kinniburgh, 2013). Once there aresignificant opportunities or students to experience sound transition skills programs,efficient and wholesome academic, social and emotional environments from alllevels, will they truly experience a holistic education system with clear interdisci-plinary outcomes, will we have an impactful first-year experience program.
References
Bovill, C., Bulley, C. J., & Morss, K. (2011). Engaging and empowering first-year student throughcurriculum design: perspectives from the literature. Teaching in Higher Education, 16(2),197–209.
Chapman, K., Rebecca, R., Ann-Marie, K., & Stephanie, A. (2015, April 12). Charting a new pathfor tertiary learning. The Star. Retrieved from http://www.thestar.com.my
Chen, Y.-U. H. (2007). The role of culture in an EFL curriculum of the 21st century. SelectedPapers from the Sixteenth International Symposium on English Teaching (pp. 119–129).Taipei, Taiwan: Crane.
Closson, R., & Nelson, B. M. (2009). Teaching social justice through community engagement.International Journal for the Scholarship of Teaching and Learning, 3(1). Retrieved fromhttp://academics.georgiasouthern.edu/ijsotl/v3n1.html
68 P. Ponnudurai and R. Ganesan

Dathan, M. (2013, September 13). How can we equip graduates with the workplace skills theyneed?. The Guardian. Retrieved from http://www.theguardian.com
Draper, S.W. (2008). Tinto’s Model of Student Retention. Retrieved: April 20, 2016, http://www.psy.gla.ac.uk
Frankola, K. (2001). March. Why online learners drop out. Work Force. Retrieved from http://www.workforce.com/archive/feature/22/26/22/index.php
Govindarajo, S. M., & Kumar, D. M. (2012). How to combat attrition? Case study on a malaysianeducational institution. International Journal of Business and Behavioral Sciences, 2(8),24–33.
Hughes, D. J. (2002). A comparison of student learning styles and retention in on-line andon-campus courses at a community college. (Unpublished doctoral dissertation). University ofSouth California.
Keup, J. R. (2005). The impact of curricular interventions on intended second year re-enrollment.Journal of College Student Retention, 7(1–2), 61–89.
Kift, S. (2004). Organising first year engagement around learning: Formal and informalcurriculum intervention. Keynote. In 8th international first year in higher education conference:Dealing with diversity. Melbourne. Retrieved from http://www.fyhe.qut.edu.au/past_papers/Papers04/Sally%20Kift_paper.doc
Kift, S. (2008). The next, great first year challenge: Sustaining, coordinating and embeddingcoherent institution-wide approaches to enact the FYE as ‘everybody’s business’. Keynote. In11th Pacific Rim first year in higher education conference: An apple for the lecturer. Retrievedfrom http://eprints.qut.edu.au/14401/1/14401.pdf
Kinniburgh, J. (2013). A culture of success: building depth into institution-wide approaches to firstyear transition. The international first year in higher education conference. Retrieved fromhttp://fyhe.com.au/past_papers/papers13/9B.pdf
Krause, K., Hartley, R., James, R., & McInnis, C. (2005). The first year experience in Australianuniversities: Findings from a decade of national studies. Retrieved from http://www.griffith.edu.au/centre/gihe/aboutus/klk_publications/FYEReport05.pdf
Morgan, M. (2012). The context of learning in higher education. In M. Morgan (ed) Improving theStudent Experience- A practical Guide for Universities and Colleges, Oxon: Routledge.
Morgan, M. (2013). Re-framing The First-year Undergraduate Student Experience. All IrelandJournal of Teaching and Learning in Higher Education (AISHE-J), 5(2), 1441–14418.
Porter, S., & Swing, R. (2006). Understanding how first-year seminars affect persistence. Researchin Higher Education, 47(1), 89–109. Retrieved June 12, 2013, from Academic Search Premierdatabase.
Potter, A., & Bye, L. (2014). “It might have worked for you but …” Evaluating the efficacy of afirst year support strategy in multiple units and disciplines. The International Journal of theFirst Year in Higher Education, 5(2), 57–68. doi:10.5204/intjfyhe.v5i2.232
Raab, L., & Adam, A. (2005). The university college model: A learning-centered approach toretention and remediation. New Directions for Institutional Research, Retrieved, May 16, 2007,from Academic Search Premier database.
STAR (Student Transition and Retention) Project. (2005). Guidelines for the Management ofStudent Transition. University of Ulser. Retrieved March 15, 2009, from www.ukster.ac.uk/star
Thomas, L. (2012). Building student engagement and belonging in Higher Education at a time ofchange: A summary of findings and recommendations from the What Works? Student Retentionand Success programme. London: Paul Hamlyn Foundation and HEFCE.
Tinto, V. (2002). Establishing Conditions for Student Success, Paper presented at the 11th AnnualConference of the European Access Network, Monash University, Prato, Italy, 20 June.
Tinto, V. (2012). Enhancing student success: Taking the classroom success seriously. TheInternational Journal of the First Year in Higher Education, 3(1), 1–8. doi:10.5204/intjfyhe.v2i1.119
6 First-Year Experience (FYE) Curriculum Review … 69

Tsang, Annetta K. L. (2011). Online reflective group discussion—connecting first yearundergraduate students with their third year peers. Journal of the Scholarship of Teachingand Learning., 11(3), 58–74.
Vygotsky, L. S. (1978). Mind in Society. Cambridge, MA: Harvard University Press.Yorke, M., & Longden, B. (2007). The first year experience in higher education in the UK.
Heslingon, UK: The Higher Education Academy.Zepke, N. (2013). Student engagement: A complex business supporting the first year experience in
tertiary education. The International Journal of the First Year in Higher Education, 4(2), 1–14.doi:10.5204/intjfyhe.v4i2.183
70 P. Ponnudurai and R. Ganesan

Chapter 7Social Media Dependency: TheImplications of TechnologicalCommunication Use Among UniversityStudents
Malissa Maria Mahmud, Chandra Reka Ramachandiranand Othman Ismail
Abstract With the prevalent technological advancements, social media are ubiq-uitous. Such phenomenon has notably shifted and redefined the paradigms ofcommunication. In the last decades, numerous studies have documented anincreased number of social detachment attributed to the uprising utilization of socialmedia and have linked it to the deterioration and mitigation of face to face inter-actions. In this paper, we postulated that computer-mediated communications,predominantly social media, are the widely preferred means of communicationamong students in which they have become too reliant on social media; thus, itinfluences and compromises the quality of face to face interactions. The data wascollected via an administered online survey to probe on the postulated variables.Besides the survey, a field observation was conducted to facilitate the validation ofthe collected data through different means of sources. Findings from the onlinesurvey suggest that students prefer face to face interaction. However, students relyon social media because they can be portrayed differently and be less shy. When itcomes to distant relationships, social media increases the quality of face to faceinteractions. As for the observation, the findings show that students were inclined toresort to social media when situated in social contexts.
Keywords Social media � Reliance � Deterioration � Face to face interactions
M.M. Mahmud (&)Centre for American Education, Sunway University, Bandar Sunway, Malaysiae-mail: [email protected]
C.R. RamachandiranSchool of Liberal Arts and Sciences, Taylor’s University, Subang Jaya, Malaysiae-mail: [email protected]
O. IsmailAPB, MARA University of Technology, Shah Alam, Malaysiae-mail: [email protected]
© Springer Nature Singapore Pte Ltd. 2018S.F. Tang and S.E. Cheah (eds.), Redesigning Learning for GreaterSocial Impact, DOI 10.1007/978-981-10-4223-2_7
71
7.1 Introduction
In the recent decade, many individuals tend to rely more on technology to the pointwhere if it ceased to exist, the efficacy of many tasks which are highly dependent ontechnology would be compromised. Today’s teenagers, or more known as themillennials, are exposed to different types of technology in many aspects of theirlives (Browning, Gerlich, & Westermann, 2011). In this context, the pervasiveroutine to always be connected has fashioned social media to be an essentialrelational context for the young adults. Evidently, they actively engage in socialnetworking, text messaging, blogging, content sharing, online learning, and manymore on a daily basis (Cassidy, Britsch, Griffin, Manolovitz, Shen, & Turney,2011). This is largely due to the widespread employment of social media amonguniversity students. In a study conducted by Pempek, Yermolayeva and Calvert(2009), 92 college students used Facebook for about 30 min a day, frequentlyposting content to a wide audience. They not only update their Facebook status, butmore often note the posted content by others rather than producing it. Furthermore,Lenhart mentioned in her article that:
Aided by the convenience and constant access of mobile devices, especially smartphones,92% of teens report going online daily—including 24% who say they go online “almostconstantly,” according to a new study from Pew Research Center. More than half (56%) ofteens—defined in this report as those ages 13 to 17—go online several times a day, and12% report once-a-day use. Just 6% of teens report going online weekly, and 2% go onlineless often. (2015a, p. 1)
At a glance, the ramification and corollary of social media would seeminnocuous, since the features offered by social media promote utilitarian commu-nication, all of which have been extensively deliberated and discussed across avariety of different researches; however, the potential pitfall of social media couldpossibly lead to the deterioration of face to face communication. Thus, this researchexamines preferred means of communication among students, and how students arebecoming too reliant on social media, in turn influencing and compromising thequality of face to face interactions. The first research question focused on thestudents’ preference of interaction. The second research question probed on thecauses that contributed to why they tend to depend on social media. Lastly, the thirdresearch question examined how social media contributes to the quality of face toface interactions.
7.2 Literature Review
The following section provides a brief overview of the literature review done forthis paper. Firstly, the literature review studies the preferences of social media orface to face interactions among teenagers, whether teenagers today are avid users ofsocial media or advocates of good old fashioned face to face interactions. Besides
72 M.M. Mahmud et al.

that, the many reasons as to why teenagers tend to rely on social media over face toface interactions were also examined. Lastly, the literature review covers how socialmedia contributes to the deterioration of face to face interaction for the currentgeneration.
7.2.1 The Preference of Interacting Through Social Mediaor Face to Face Among Students
The pervasiveness of social media such as Twitter, Instagram, and Snapchat offersremarkable opportunities for individuals to communicate through social networks(Junco, 2013; Nadkarni & Hofmann, 2012). Given the ubiquity of smartphonesamong society nowadays, accessing social media has become that much easier. Thisis supported by the results obtained from the Adobe 2013 Mobile Consumer Survey(2013), stating that accessing social media is the number one mobile activity today.According to an article by Suliveres (2014), human face to face interactions arebecoming less important following the emergence of social media among societynowadays. Even so, the preference of interacting through social media or face toface still varies among every student. Based on the research done by Kujath in2011, social media have become a more common method for interpersonal com-munications to occur among college students. This is corroborated by anotherresearch that stated how social media have attracted a large amount of users,especially from teenagers and university students alike. As suggested by thisresearch, the amount of time spent on SM is more toward socializing rather thanlearning (Hamat, Embi, & Hassan, 2012). Instead of socializing through physicalmeans, students are instead resorting to social media as the platform for interactionsto occur. This obviously indicates the dying art of face to face interaction, which is aserious concern for the future generation.
Another research done by Ahn in (2011) shows that teenagers are among themost prolific users of social media (SM). A number of other researches also statethat social media is, in fact, the most popular form of technology and the mostcommon activity among teenagers today (O’Keeffe & Clarke-Pearson, 2011; Reich,Subrahmanyam, & Espinoza, 2012). As the research propounds, since the arrival ofthe Internet and various social media, students spend large amounts of time onlinewith peers. It also suggested that teenagers use social media to strengthen theiroff-line relationships with others (Reich et al., 2012). This is well in accordancewith a research conducted by Sheldon in (2013) which also states that social mediaare becoming another platform to initiate and maintain interpersonal relationships.Another research done by Newham in (2012) mentioned that even when face toface communications are happening, Facebook interrupts the communicationbecause people tend to check for updates on Facebook during those interactions.This is consistent with survey results stating that 38% of respondents admitted tosometimes checking Facebook for updates even when they were with friends.
7 Social Media Dependency: The Implications … 73

Moreover, 51.3% of the respondents agreed that they would spend more timeinteracting face to face with others if social media never came to existence. Despiteso, most teenagers still insist face to face interaction is still their preferred way tocommunicate with others (Haris, 2015). In 2012, Common Sense Media report thatabout half of teenagers concur that their favorite method of communicating withfriends is in person, the reason being face to face conversations is more fun, andthey can understand what people really mean better in person.
7.2.2 The Causes of Students’ Reliance on Social MediaOver Face to Face Interaction
The use of social media has seen a significant increase in the past decade (Johnson,2014). This can be illustrated by the amount of monthly active users on Facebook,the most popular social network worldwide. A huge number of 1.55 billion monthlyactive users on Facebook were recorded as of the third-quarter of 2015, which ismore than 20% of the current-world population (Statista, 2016). Recently, socialmedia has become an increasingly popular method for teenagers to communicatewith each other (Hamat et al., 2012). Based on the research of Kujath in 2011, socialmedia is a platform that helps in maintaining close interpersonal relationships, butnot in creating new relationships. Many researches also show that social media isused as a way to connect with people of similar interests: classmates, peers, or peopleknown from off-line contexts (O’Keeffe & Clarke-Pearson, 2011; Reich et al., 2012).As suggested by Kujath, prior face to face relationships are maintained through theusage of Facebook and MySpace. Apart from that, Kujath also suggests that it is anuncommon thing for a friendship to just happen on social media.
Moreover, another research by Lenhart in (2012) suggests that the easy Internetaccessibility provided by mobile phones allows teenagers to be constantly online. Inthe same vein, another study suggests that social media is used as a filler during freetime (Jacobsen & Forste, 2011). In a survey conducted by Pew Research Center,teenagers are frequent users of social media applications on mobile phones, backedby the fact that three-quarters (76%) of teenagers use social media. When askedabout the usage of seven popular social media platforms, Facebook, Twitter,Instagram, Snapchat, Tumblr, Google+, and Vine, respectively, 89% of teenagersreported the usage of at least one of the sites, while 71% reported the usage of twoor more sites. The social media platforms stated are all available on mobile phonesin the form of applications and convenient for teenagers to access at any timesespecially during free time. With reference to a study by Drago in (2015), 18% ofstudents reported always using their mobile phones or tablets when spending timewith friends or family, 74% of students use their mobile phones sometimes whenthey are with family or friends, and only 8% of students rarely use their phoneswhen with friends and family. The fact that zero respondents said that they never
74 M.M. Mahmud et al.

use their mobile phones when spending time with family and friends indicates howsocial media is affecting social face to face interactions.
According to a recent study, social media platforms such as Facebook are mainlyused as a “social glue” to help new students to settle in their university life (Hamatet al., 2012). This study can be related to another study that suggests about thetendency of teenagers to rely on their peer support more than family support; socialmedia allows them to widen and strengthen their relationships with peers (Smahel,Brown, & Blinka, 2012). In the beginning of university life, things can get toughwith assignments piling up and many other issues as well. However, if peer rela-tionships are strong enough, teenagers who are facing problems can always seektheir peers for mental support and such. On the other hand, Newham suggested in(2012) that social media usage is affected by an individual’s self-esteem. The studyshows that a person with high self-esteem tends to spend more time on socialmedia, but communicate with others less through it when compared to a personwith low self-esteem. Besides that, the study also shows that it is much more likelyfor people with low self-esteem to check for social media updates when they arewith friends as compared to people with high self-esteem (Newham, 2012). Bothfindings relate closely due to the fact that a person with low self-esteem may feelmore shy when it comes to face to face interactions, hence resorting to social mediato avoid any form of awkwardness.
7.2.3 The Contributions of Social Media on the Qualityof Face to Face Interaction
Social media has been constantly linked with the deterioration of face to faceinteraction among teenagers. In a study conducted by Strickland (2014), it wasconcluded that teenagers or young adults are the most active users of social media.Teenagers would then easily receive both the positive and negative repercussionsfrom the usage of social media. Among the negative effects, one of them would bethe deterioration of face to face interactions. For teenagers who already have poorsocial skills, this could result in them being unable to communicate face to facewith anyone, which is a serious issue. Kujath (2011) proposes that whenever socialmedia is used excessively, communication among family members within ahousehold will decrease, and the size of one’s social circle reduced. As teenagersconstantly indulge in excessive use of social media, the chances of them beingoverly dependent on the platform are fairly high. Thus, teenagers would use theirsocial media accounts wherever or whenever they can. A recent study by Newham(2012) has stated that plenty of individuals spend more time communicating onsocial media (SM), primarily on Facebook. Therefore, Newham (2012) concludedthat Facebook has replaced face to face communication for many individuals.Therefore, plenty of individuals would find it hard to keep a conversation goingwhen having a face to face conversation due to their dependency on social media,causing them to have poor social skills.
7 Social Media Dependency: The Implications … 75

One research conducted by Hamat et al. (2012) states that Facebook is notmainly used for formal teaching purposes. Outside-the-classroom or afterschoolprograms are where Facebook or other SM are needed to act as a medium forlecturers to advise or educate their students. Unfortunately, some students use SMas a way to avoid face to face interactions with their peers and even their lecturers.These students would prefer to seek help from their lecturers through SM ratherthan communicating with them face to face, which indicates the deterioration offace to face communication. On the other hand, some students who are allowed touse social media in class become easily distracted (Jacobsen & Forste, 2011). Notonly would students be distracted from whatever their lecturers are teaching, theytend to check their social media accounts even when there is no notificationwhatsoever. Furthermore, they will check their SM every few minutes or so just tokeep themselves updated, potentially isolating them from most of the people aroundthem. Based on a research by Smahel et al. (2012), teenagers frequently commu-nicate with friends and strangers through SM. Although teenagers generally dependmore on SM to communicate, there is still a minority which still prefers to com-municate face to face. This was presented in a research by Sheldon in (2013) thatsuggests the existence of the SM exclusive type of relationship where communi-cation is only done through SM. Nevertheless, there is also the face to face kind ofrelationship where only face to face communication took place. Teenagers whodepend more on SM to communicate are more prone to speak less to anyone face toface; they use online contexts to strengthen off-line relationships (Reich et al.,2012).
7.3 Research Method
7.3.1 Participants
This study involved the Sunway University’s American Degree Transfer Program(ADTP) students during the fall semester of 2015, with ages ranging from 16 to23 years old. For the online survey, the number of students participated were 94; forthe observation, 12 students were involved.
7.3.2 Procedure and Instruments
7.3.2.1 Online Survey
An online survey consisting of demographic section and 18 Likert scale statementsconstructed on the investigated variables were made using Google Forms. The linkwas subsequently posted on the Sunway University’s American Degree Transfer
76 M.M. Mahmud et al.

Program (ADTP) Facebook page. The online survey consisted of statements thatwere created for the purpose of this study and was validated through the relevant,existing studies. The statements were published on Google Forms in a form of asurvey questionnaire to make it easier for the participants to access and rate thestatements. The survey was separated into four sections: Section A, B, C, and D.Section A consisted of the respondent’s demographic information such as gender,course, and age. Section B investigated on the students’ preference: social media orface to face interaction. Meanwhile, Section C probed on the causes that contributedto why students tend to depend on social media, whereas Section D examined howsocial media contributes to the quality of face to face interactions.
7.3.2.2 Observation
The observation was conducted to obtain a cogent understanding of the students’behavior as well as gather evidence to validate the assertions made. In this research,the observation involved a group of 12 students, with 6 males and 6 females.During Stage 1 of the observation, the 12 participants were instructed to remaininside a designated classroom for 30 min. They were briefed on the aim of the studyand requested to behave naturally in the given context. Throughout Stage 1, we kepttrack of the participants’ behavioral changes, whether they engaged in face to faceconversations or started using their mobile devices to access social media.Subsequently, during Stage 2 of the observation, the 12 participants were instructedto interact face to face, and then via social media. Throughout the process, theirbehaviors were noted to determine whether they deviated from the intendedinteraction activity. For instance, when the intended interaction was verbal inter-action, we observed and recorded the number of participants who accessed socialmedia through their handheld devices.
7.4 Results
7.4.1 Online Survey
This section discusses the results obtained from the survey by analyzing theresponses of all the 94 participants. The survey was divided into 4 sections toinvestigate and probe the intended variables.
7.4.1.1 Section A: Demographic Information
See Tables 7.1 and 7.2.
7 Social Media Dependency: The Implications … 77

7.4.1.2 Section B: Preference of Interacting Through Social Mediaor Face to Face Among Students
The statements in this section of the survey required the participants to state theirpreference of interaction between social media or face to face. The statement “I feelmore confident talking to people through social media” shows that a majority of theparticipants feel that they are more confident talking to people through social media,with 55% of them selecting “Strongly Agree” and “Agree” for the statement.However, 63.7% of the participants disagreed when they were asked if they pre-ferred to stay at home and chat online rather than having a face to face conversation.This indicates that face to face interaction is a more preferable method among theparticipants. The notion is supported by the statement “talking to someone face toface is much better than talking to someone through social media,” as 81.4% of theparticipants showed agreement. At the same time, many participants also respondedthat they do not prefer to talk more on social media than in person, with 48.9% ofthe participants agreeing with the statement while only 16.3% of the participantsdisagreed. A majority of the participants, 46.2%, disagreed with the statement thatthey have more friends to talk to on social media than in person, which is 24.2%more than those who agree to the statement. When it came to the statement, “face toface interaction allows me to have a better relationship with people,” an over-whelming 88.8% of participants agreed. To summarize this section, most of theparticipants felt more confident talking to people through social media, but stillappreciate and prefer face to face interactions more (Tables 7.3 and 7.4).
Table 7.1 Gender Male Female
51.6% 48.4%
Table 7.2 Age Age Frequency
16 2
17 5
18 22
19 12
20 39
21 6
22 5
23 2
Others 1
78 M.M. Mahmud et al.

7.4.1.3 Section C: Causes of Students’ Reliance on Social Media OverFace to Face Interaction
The statements in this section were devised to examine what causes students to relyon social media over face to face interactions. Firstly, 47.8% of the participants feltthat social media allows them to portray themselves differently, whereas 19.5% feltotherwise. Despite that many participants do not feel that social media is moreinteresting than reality, with only 28.7% of the participants agreeing to the state-ment. Moreover, the percentage of participants who felt that they have morefreedom of speech is only 8.8% more than those who do not, but 38.5% of themwere indifferent, or “Neutral,” to the notion. For the statement “social media makesme less shy,” more than half the participants, 51.6%, agreed to it. However, whenthe participants were asked whether it is difficult for them to keep a conversation
Table 7.3 Preference of interaction: social media or face to face
Preference of interactingthrough social media or faceto face among students
Stronglyagree(%)
Agree(%)
Neutral(%)
Disagree(%)
Stronglydisagree(%)
I am more confident talking topeople through social media
15.4 39.6 28.6 15.4 1.1
I prefer to stay home and chatonline than having a face toface conversation
2.2 6.6 27.5 50.5 13.2
Talking to someone in personis much better than talking tosomeone through social media
41.8 39.6 15.4 3.3 0.0
I prefer to talk more on socialmedia than in person
1.1 15.2 34.8 39.1 9.8
I have more friends to talk toon social media than in person
4.4 17.6 31.9 34.1 12.1
Face to face interactions allowme to have a betterrelationship with people
52.8 36.0 7.9 2.2 1.1
Table 7.4 Statistics of response for Section B
Percentage (%) Mean Standard deviation
Strongly agree 117.7 19.6 20.4
Agree 154.6 25.8 13.1
Neutral 146.1 24.4 9.5
Disagree 144.6 24.1 18.3
Strongly disagree 37.3 6.2 5.6
7 Social Media Dependency: The Implications … 79

going face to face, 43% of the participants disagreed to the statement as comparedto only 28% who agreed. As for last statement, most of the participants, 42.4%,expressed neutrality to the statement that social media helps improve self-esteem. Itcan be summarized that most of the participants rely on social media because itallows them to portray themselves differently and makes them feel less shy(Tables 7.5 and 7.6).
7.4.1.4 Section D: The Contributions of Social Media on the Qualityof Face to Face Interaction
The statements in this section target the contributions of social media on the qualityof face to face interactions among students. First of all, participants were asked ifthey became more sociable during face to face after starting to use social media, towhich most of the participants, 40.4%, were indifferent to the statement. Secondly,an astonishing 79.8% of the participants felt that their relationship with distant
Table 7.5 Causes of students’ reliance on social media over face to face interaction
Causes of students’ relianceon social media over face toface interaction
Stronglyagree(%)
Agree(%)
Neutral(%)
Disagree(%)
Stronglydisagree(%)
Social media allows me toportray myself differently
13.0 34.8 32.6 15.2 4.3
I feel that social media ismore interesting than reality
0.0 28.7 27.7 33.0 10.6
I have more freedom ofspeech on social media
6.6 28.6 38.5 20.9 5.5
Social media makes me lessshy
9.7 41.9 29.0 16.1 3.2
It is difficult for me to keep aconversation going face toface
9.7 18.3 29.0 35.5 7.5
I feel like social media helpsmy self-esteem to be better
3.3 20.7 42.4 28.3 5.4
Table 7.6 Statistics of response for Section C
Percentage (%) Mean Standard deviation
Strongly agree 42.3 7.1 4.4
Agree 173.0 28.8 8.0
Neutral 199.2 33.2 5.5
Disagree 149.0 24.8 7.9
Strongly disagree 36.5 6.2 2.6
80 M.M. Mahmud et al.

friends becomes better after using social media. Furthermore, 33.3% of the par-ticipants disagreed that the usage of social media gave them more confidence intalking to strangers face to face as compared to a mere 19.3% that thought other-wise. As for the next statement, 76.6% of the participants felt disconnected whenfriends use their mobile phones around them. A statement which a majority of theparticipants were against was “I rarely go out to meet my friends because I can talkto them at home through social media,” yielding a total of 69.9% which disagreed.Finally, 77.1% of the participants, which is more than half, did not start avoidingmore face to face interactions with people ever since creating a social media profile.To summarize the section, social media contributes on the quality of face to faceinteraction by which the quality of relationship with distant friends among studentsis improved. However, students still feel disconnected with people that use mobilephones when being physically close. Nevertheless, students do not use social mediaas a means to avoid face to face interaction (Tables 7.7 and 7.8).
Table 7.7 Contributions of social media on the quality of face to face interaction
The contributions of socialmedia on the quality of face toface interaction
Stronglyagree(%)
Agree(%)
Neutral(%)
Disagree(%)
Stronglydisagree(%)
I have become more sociableduring face to face afterstarting to use social media
2.1 25.5 40.4 26.6 5.3
My relationship with mydistant friends becomes betterafter using social media
30.9 48.9 17.0 3.2 0.0
I have more confidencetalking to strangers face toface ever since I have startedusing social media
3.2 16.1 45.2 30.1 3.2
When I see my friends ontheir phones and I am aroundthem, I feel disconnected eventhough we are only two feetapart
34.0 42.6 17.0 5.3 1.1
I rarely go out to meet myfriends because I can talk tothem at home through socialmedia
0.0 11.8 18.3 46.2 23.7
I have started to avoid moreface to face interaction withpeople ever since I’ve made asocial media profile
1.1 7.6 14.1 47.8 29.3
7 Social Media Dependency: The Implications … 81

7.4.2 Observation
The observation was carried out with a group of 12 students (6 males and 6females) with the aim of better understanding the students’ behavior and validatingthe assertions made in the study. These volunteers were selected randomly fromADTP of Sunway University to participate in the 30-min observations. Throughoutthe process, observations were recorded at 5-min intervals.
7.4.2.1 Stage 1
During Stage 1 of the observation, the group of participants were instructed toperform their normal daily activities. Subsequently, we observed the number ofpeople who were verbally interacting and the number of people who were usingtheir handheld devices to access social media.
Table 7.9 shows the results of our observation on the group of 12 participantsduring Stage 1 where they were instructed to engage in usual daily activities.Readings were taken at 5-min intervals. During the first 5 min, students weremostly interacting with each other verbally, with 8 out of 12 students doing so,while only 1 student was using social media. For the following 5 min, the numberof students accessing social media increased to 2. After 15 min of observation, thenumber of students that engaged in verbal interaction increased to 10, whereas thenumber of students on social media remained at 2. By the 20th minute, the numberof students engaged in verbal interaction reduced to 8, while the number of studentson social media increased by 1. Then, 25 min into the observation, we found an
Table 7.8 Statistics ofresponse for Section D
Percentage(%)
Mean Standarddeviation
Strongly agree 71.3 11.9 14.6
Agree 152.5 25.4 15.5
Neutral 152.0 25.3 12.5
Disagree 159.2 26.5 17.6
Stronglydisagree
62.6 10.4 11.6
Table 7.9 Number ofstudents (out of 12) engagingin interaction activity
Duration Social media Verbal interaction
0–5 min 1 8
6–10 min 2 8
11–15 min 2 10
16–20 min 3 8
21–25 min 6 6
26–30 min 10 2
82 M.M. Mahmud et al.

increase in number of students using social media to 6, whereas the number ofstudents on verbal interaction further reduced to 6. By the end of the observation,10 students were using social media, and only 2 remaining who were having verbalinteraction. Thus, it should be noted that 83% of students were accessing socialmedia by the 30th minute.
7.4.2.2 Stage 2
As for Stage 2 of the observation, we first instructed the 12 participants to interactverbally, then via social media, for 30 min, respectively. We observed the group todetermine the number of people who deviated from the intended choice byengaging in the opposite activity.
Table 7.10 shows the results for Stage 2 of the observation where the intendedinteraction was verbal interaction. The observation was initiated with no studentusing social media. During the first 5 min, only 1 student stopped engaging inverbal interaction and spent time on social media. After 10 min, the number ofstudents that switched from the intended interaction to social media increased to 2.The following 5 min, the number of students that stopped engaging verballyincreased to 4. By the 20th minute, the number decreased to 2 as they startedinteracting verbally again. After 25 min, the number of students that deviated fromintended interaction saw a slight increase of 1. At the end of the observation, 6students were engaging on social media. It is noteworthy that at this point of theobservation, 50% of students deviated from the intended verbal interaction to usesocial media.
Table 7.11 illustrates the results for Stage 2 of the observation where theintended interaction was social media. During the first 5 min, 1 student stoppedusing the intended means of interaction which was social media, and interactedverbally with others. The subsequent 5 min, 2 students deviated from social mediato interact face to face. After 15 min, no student was interacting verbally. By the20th minute, the number of students on verbal interaction increased to 3. After25 min, the number decreased to 2 as 1 student stopped interacting verbally andresumed to using social media. At the end of the observation, no student wasinteracting verbally, making all 12 students engaging on social media. Herein, itshould be noted that 100% of students were using social media after theobservation.
Table 7.10 Number ofstudents (out of 12) deviatingfrom verbal interaction
Duration Social media
0–5 min 1
6–10 min 2
11–15 min 4
16–20 min 2
21–25 min 3
26–30 min 6
7 Social Media Dependency: The Implications … 83

Thus, it can be summarized that the findings from both Stage 1 and Stage 2 ofthe observation show that students inevitably resort to social media when situated insocial contexts.
7.5 Discussion
The findings yielded from both the survey and the observation indicate that thestudents prefer face to face interaction over social media to some extent. Forinstance, the statement “I feel more confident talking to people through socialmedia” tells us that teenagers spend a lot of time interacting through a screen ratherthan real life. Therefore, it affects their concentration and self-esteem and, in manycases, significantly impacts their personal relationship. Often times, they may losethe ability to be sympathetic and empathetic (Johnson, 2014). However, it isnoteworthy to mention that the previous statement given contradicts the fact thatteenagers prefer face to face interaction, as evident by the statement “face to faceinteractions allow me to have better relationships with people.” Nevertheless, insome cases, teenagers actually prefer social media because it helps them to havebetter relationships with peers, and consequently encouraging more face to faceinteractions (Lenhart, 2015b).
Based on the findings, it can be deduced that teenagers tend to rely on socialmedia due to a couple of reasons. For example, the statement “social media allowsme to portray myself differently” indicates that teenagers project themselves dif-ferently from how they are in reality. In this context, teenagers manage differentidentities both online and off-line. According to Green (2013), an individual’sidentity online eliminates a part of an individual’s real-life component.Furthermore, the statement “social media makes me less shy” suggests that socialmedia has the ability to inhibit shyness among teenagers. For instance, social mediawould provide a platform for them to be socially comfortable before they beginengaging in real-life conversations. In addition, social media allow teenagers toobserve and learn without contributing to the exchange of ideas happening online(Carducci & Kaiser, 2015). Henceforth, the findings clearly show that teenagersrely on social media due to these reasons.
Apart from the tendency to rely on social media, another variable probed in thestudy was how social media affects the quality of face to face interaction. The
Table 7.11 Number ofstudents (out of 12) deviatingfrom social media
Duration Verbal interaction
0–5 min 1
6–10 min 2
11–15 min 0
16–20 min 3
21–25 min 2
26–30 min 0
84 M.M. Mahmud et al.

statement “my relationship with my distant friends becomes better after using socialmedia” indicates that social media actually improve the quality of face to faceinteraction. Moreover, one study stated that the more you communicate with peoplethrough social media on your devices, the more likely you are to communicate withthem face to face (Adler, Proctor II, & Proctor, 2015). Therefore, this explains whymost of the respondents disagreed to the statement “I have started to avoid moreface to face interaction with people ever since I’ve made a social media profile.”
Lastly, based on the results obtained from the observation, it can be concludedthat teenagers have no problem engaging in face to face interactions. However, itcan be postulated that as the duration of the observation progresses, the teenagersperhaps experience boredom or lack of mutual interest in conversation and thereforeresorted to the use of social media. Leung (Leung 2006) remarks that bored indi-viduals will seek out for entertainment or stimulation from Internet use, typicallysocial media. At this juncture, the findings suggest that when placed in unfamiliarsocial contexts, teenagers invariably engage on social media rather than face to faceinteraction.
7.6 Recommendation
After conducting the study, we realized there are ways that we can improve theresults. Firstly, having a larger number of respondents for the survey conductedwould give us more accurate results. Our study was limited to only students ofSunway University’s American Degree Transfer Program (ADTP), which is not thefull representation of all students or teenagers alike. Therefore, conducting thesurvey on a greater population of students outside of Sunway University can pro-vide us with better insights for the study. Secondly, briefing the participants therules before conducting the observation would have prevented them from leavingthe room during the period. This would have produced more reliable results as wecannot be certain what the participants are doing when they were not physically inthe room. Thirdly, a longer period of observation would have provided a cogentunderstanding of the participants’ behaviors and thus better results.
7.7 Conclusion
Beginning of the study, we hypothesized that social media contributes to thedeterioration of face to face communication among students of Sunway University’sAmerican Degree Transfer Program (ADTP). Students typically have at least onesocial media account as technology progressively becomes easier to access. Westarted the study with three research questions in mind. The first research questionfocused on the students’ preference when it comes to interacting. The secondresearch question probed on the causes behind the students’ dependency on social
7 Social Media Dependency: The Implications … 85
media. Lastly, the third research question examined how social media contributes tothe quality of face to face interaction. The results obtained indicate that the studentsprefer having face to face interaction over social media. Furthermore, we examinedthe causes as to why students rely on social media. A majority of survey respon-dents agreed that social media allow them to portray themselves differently and beless shy. On top of that, we examined how social media contributes to the quality offace to face interaction. The findings acquired indicate that social media contributesto the quality of face to face interaction especially in distant relationships. Finally,the findings yielded from the observation contradict with the overall notionobtained from the survey. This suggests that the students are more inclined to usingsocial media when situated in social contexts.
References
Adler, R. B., Proctor, R. F., II, & Proctor, R. F. (2015). Looking out, looking in. Toronto: NelsonEducation.
Adobe 2013 Mobile Consumer Survey. (2013). Using mobile sites, apps, and emergingtechnologies to build loyalty. Retrieved from https://empoweryou.ca/wp-content/uploads/2013/12/Adobe-2013-Mobile-Consumer-Survey-Result.pdf
Ahn, J. (2011). The effect of social network sites on adolescents’ social and academicdevelopment: Current theories and controversies. Journal of the American Society forInformation Science and Technology, 62(8), 1435–1445.
Browning, L., Gerlich, R. N., & Westermann, L. (2011). The new HD Classroom: A “HyperDiverse”approach to engaging with students. Journal of Instructional Pedagogies, 5, 1.
Carducci, B., & Kaiser, L. (2015). Shyness.Cassidy, E. D., Britsch, J., Griffin, G., Manolovitz, T., Shen, L., & Turney, L. (2011). Higher
education and emerging technologies: Student usage, preferences, and lessons for libraryservices. Reference & User Services Quarterly, 50(4), 380–391.
Common Sense Media. (2012). Social Media, Social Life: How Teens View Their Digital Lives.Retrieved from https://www.commonsensemedia.org/research/social-media-social-life-how-teens-view-their-digital-lives/key-finding-3%3A-most-teens-prefer-face%20to%20face-communication
Drago, E. (2015). The effect of technology on face-to-face communication. The Elon Journal ofUndergraduate Research in Communications, 6(1), 13–19.
Hamat, A., Embi, M. A., & Hassan, H. A. (2012). The use of social networking sites amongMalaysian university students. International Education Studies, 5(3), 56.
Haris, N. (2015). Face-to-Face Communication in Teens. Retrieved from http://everydaylife.globalpost.com/facetoface-communication-teens-18260.html
Jacobsen, W. C., & Forste, R. (2011). The wired generation: Academic and social outcomes ofelectronic media use among university students. Cyberpsychology, Behavior, and SocialNetworking, 14(5), 275–280.
Johnson, C. (2014). Face time vs. screen time: The technological impact on communication.Retrieved from http://national.deseretnews.com/article/2235/face-time-vs-screen-time-the-technological-impact-on-communication.html
Junco, R. (2013). Comparing actual and self-reported measures of Facebook use. Computers inHuman Behavior, 29(3), 626–631. doi:10.1016/j.chb.2012.11.007.
86 M.M. Mahmud et al.

Green, R. K. (2013). The Social Media Effect: Are You Really Who You Portray Online?Retrieved from http://www.huffingtonpost.com/r-kay-green/the-social-media-effect-a_b_3721029.html
Lenhart, A. (2012). Teens, Smartphones & Texting. Retrieved from http://www.pewinternet.org/2012/03/19/teens-smartphones-texting/
Lenhart, A. (2015a). Teens, Social Media & Technology Overview 2015. Retrieved from http://www.pewinternet.org/2015/04/09/teens-social-media-technology-2015/
Lenhart, A. (2015b). Chapter 4: Social Media and Friendships. Retrieved from http://www.pewinternet.org/2015/08/06/chapter-4-social-media-and-friendships/
Leung, L. (2006). Stressful life events, motives for Internet use, and social support among digitalkids. CyberPsychology & Behavior, 10(2), 204–214.
Nadkarni, A., & Hofmann, S. G. (2012). Why do people use Facebook. Personality and IndividualDifferences, 52(3), 243–249. doi:10.1016/j.paid.2011.11.007.
Newham, M. (2012). Is social networking affecting social interaction between users?O’Keeffe, G. S., & Clarke-Pearson, K. (2011). The impact of social media on children,
adolescents, and families. Pediatrics, 127(4), 800–804.Pempek, T. A., Yermolayeva, Y. A., & Calvert, S. L. (2009). College students’ social networking
experiences on Facebook. Journal of applied developmental psychology, 30(3), 227–238.Reich, S. M., Subrahmanyam, K., & Espinoza, G. (2012). Friending, IMing, and hanging out
face-to-face: Overlap in adolescents’ online and offline social networks. DevelopmentalPsychology, 48(2), 356.
Sheldon, P. (2013). Voices that cannot be heard: Can shyness explain how we communicate onFacebook versus face-to-face? Computers in Human Behavior, 29(4), 1402–1407.
Smahel, D., Brown, B. B., & Blinka, L. (2012). Associations between online friendship andInternet addiction among adolescents and emerging adults. Developmental Psychology, 48(2),381.
Statista (2016). Number of monthly active Facebook users worldwide as of 2nd quarter 2016 (inmillions). Retrieved from http://www.statista.com/statistics/264810/number-of-monthly-active-facebook-users-worldwide/
Strickland, A. (2014). Exploring the Effects of Social Media Use on the Mental Health of YoungAdults (Doctoral dissertation, University of Central Florida Orlando, Florida).
Suliveres, M. (2014). Social Media: The Death of Real World Interaction? Retrieved from https://medium.com/musings-of-a-writer/social-media-the-death-of-real-world-interaction-5e2f33cfd8ee
7 Social Media Dependency: The Implications … 87
https://medium.com/musings-of-a-writer/social-media-the-death-of-real-world-interaction-5e2f33cfd8ee
Chapter 8The Mediating Role of Shadow Education(SE) Participation on Goal Orientation,Study Habits, Connectedness,and Academic Performance
Rosalina M. de Guzman, Socorro M. Rodriguezand Belinda V. de Castro
Abstract This study purports to determine the mediating role of SE participationon four variables, namely goal orientation, study habits, connectedness, and aca-demic performance involving 267 elementary and high school student respondents,and simultaneous relationships between and among these variables were examinedthrough structural equation modeling. Results revealed that the higher the studentdesire to improve his study habits and the less he is connected to his family andfriends the more likely he will participate. However, the more he is connected to hisfamily and friends and the higher his goal orientation the more likely his academicperformance will improve Academic achievement in this study is not supported byparticipation in shadow education or private tutorial, but a more connected envi-ronment and a more positive goal orientation will lead to improvement in academicperformance.
Keywords Tutoring � Academic performance � Study habits
8.1 Introduction
Shadow education (SE) is a global phenomenon wherein pervasiveness varies from10 to over 80% (Southgate, 2009). In Turkey, SE is a widespread practice that hasspawned a multibillion dollar industry helping students to pass highly competitiveentrance examinations. About 1.3 million children in Turkey are enrolled in morethan 3,800 tutorial colleges (Finkel, 2013). Asian Development Bank (ADB, 2012)
R.M. de Guzman � S.M. Rodriguez (&)Saint Michael’s College of Laguna, Biñan, Laguna 4024, Philippinese-mail: [email protected]
B.V. de CastroUniversity of Santo Tomas, Manila, Philippinese-mail: [email protected]
© Springer Nature Singapore Pte Ltd. 2018S.F. Tang and S.E. Cheah (eds.), Redesigning Learning for GreaterSocial Impact, DOI 10.1007/978-981-10-4223-2_8
89

noted that Japanese families spend an estimate of $12 billion on private tutoringannually while in Pakistan, expenditures on tutoring per child averaged an equiv-alent of $3.40 a month, a significant amount considering 60% of Pakistan’s pop-ulation reportedly lives on less than $2 per day. Notably, it was reported that around58.8% of Grade 10 students in India and 32% of primary students in Vietnam wasreceiving tutoring. In Malaysia, a survey revealed around 20.1% of the householdsindicated expenditures on private tutoring. The same is true in the Philippines,Cambodia, and Myanmar.
Shadow education (SE) refers to “supplemental, privately funded academiclessons outside of school” (Southgate, 2009), the preparation for a forthcomingexam in a more rigid manner (Chou & Yuan, 2011; Bray, 2009). Shadow educationalso known as cram schools is specialized social institutes that prepare student fortests in a more efficient and marketable manner (Huang, 2004). It is not justremedial help, it is about “competition and creation of differentials” (ADB, 2012).In Istanbul, “shadow education is an academic jargon for the way ordinary peoplebypass the failings of the formal school system by enlisting their children in specialprograms” (Finkel, 2013).
While there had not been a plethora of studies that directly measure the effects ofshadow education (SE) on its clientele, a number of completed studies on its impactsuggest that private tutoring has positive effects on the academic achievement of thestudents. Sawada & Kobayashi (1986) posited that students attending juku(Japanese cram schools) incurred higher scores on problems that involved arith-metic calculations and algebra, but not in arithmetic applications and geometry. InTaiwan, SE participation tends to raise students’ academic performance and testscores which created an enormous amount of pressure on parents to have theirchildren avail of such services (Chou & Ching, 2012). It is considered as aneducational investment as a way to attain upward social mobility, since it helpsaccumulate cultural and psychological capital for the student. Consequently, parentsand students find legitimate reasons to spend money for SE participation (Ho NgaHon, 2010).
There is no doubt that SE has made considerable contribution to supplementaryeducation but its negative impact cannot be set aside. This may be brought about bythe negative perceptions of traditional schooling and the belief that private tutoringis essential for academic success. However, some studies show that it is not alwayseffective. In some schools, students commonly skip classes or sleep through theirlessons because they are tired after tutorial sessions. This shows that the shadowsystem can make regular schooling less efficient (The Express Tribune, July 5,2012). The growth of private tutoring in the formerly socialist countries, Lithuania,Mongolia, Poland, Slovakia, and Ukraine, may indicate inadequacies in the edu-cation systems. While in Asia, private tutoring seems to dominate the lives of youngpeople and their families, creating inefficiencies in education systems and socialinequalities, diverting needed household income into an unregulated industry.
Cambodia and Singapore may have different cultures and economic structures,but both of these countries are facing the SE phenomenon. On the one hand,Cambodia is a less-developed country in which teachers have low levels of
90 R.M. de Guzman et al.

professional development where SE has become a common way for regularteachers to supplement their income. As in other low-income countries such asAzerbaijan and Bangladesh, it has become acceptable for teachers to demandpayment for extra tutoring of pupils for whom those teachers already haveresponsibility in the mainstream classes. This raises “major challenges, includingthe possibility of a form of blackmail wherein teachers withhold parts of theirregular lessons in order to increase the market for private tutoring” (Bray, 1999b,p. 61; Dawson, 2009, p. 65). On the other hand, teachers in Singapore are wellremunerated, are more closely supervised, and have much higher standards ofprofessionalism. Teachers are forbidden to tutor pupils from the schools in whichthose teachers are already employed, yet tutoring is still common in Singapore(Tan, 2009). The nature and providers of tutoring differ considerably from thedominant form in Cambodia. Singapore has many more commercial agencies whichspecialize in tutoring and makes use of the Internet and other technologies for thispurpose to a much greater extent than in Cambodia. Similarly, proliferation andpervasiveness of SE in countries such as Hong Kong, Taiwan, Korea, and Japan,where diverse cultural norms and economic structures thrive, may be due to theinfluence of the Confucian culture which value learning, effort, and competition(Bray, 2012).
8.1.1 Shadow Education in the Philippines
To avail of tutorial services, particularly in the basic education level, for the purposeof improving academic performance is not a new phenomenon in the Philippines(de Castro & de Guzman, 2010). This scenario reflects the Filipinos’ high regard foreducation as the primary means for social and economic mobility (NSO FIES,2007). Pervasiveness and continued patronage of Filipinos of this service industrywas apparently evident in three syndromes depicting its metamorphosis in thecountry: the lean on, the pass on, and the ride on syndromes of private tutoring (deCastro & de Guzman, 2012). Initially, it was intended to serve slow and lowachieving students. Similar to other countries where this service industry isprevalent. (Baker and LeTendre, 2005; Ventura, 2008b) noted that SE is used toaugment the students’ capacities and satisfy the requirements of the formal school.Parents make use of this service industry to delegate their responsibility to theprivate tutors. “Parents may not be fully aware of the benefits their children getfrom availing SE, still they patronize private tutoring due to the social influenceimbedded in the Filipino culture that plays a critical part in their decision” (deCastro & de Guzman, 2010).
This study intends to determine the status of SE in the Philippine setting. Sinceparticipation is more prevalent in basic education, it seeks to specifically determinethe mediating role of SE participation on goal orientation, study habits, connect-edness, and academic performance in a basic education institution in the country.Additionally, it seeks to identify the nature, reasons, and extent of participation of
8 The Mediating Role of Shadow Education (SE) Participation … 91

the students during their turning points, in the Grades 5 and 6 levels for theelementary years and the third and fourth year high school levels.
8.1.2 Theoretical Framework
The study is anchored on Guttman’s (1982) means-end chain theory. The theoryexplains how consumers make decisions in the selection of services and explain theultimate goal by which they base their decisions. Its main assumption is thatconsumers do not avail of services only for the sake of the service but for thebenefits that they can get out of it. This means that the consumer is more concernedon the functionality and psychological consequences of the service availed ratherthan its features. Consequently, the consumer will consider availing of the serviceas long as it will provide greater opportunity of realizing his goals.
In the context of shadow education, student clientele seems to be goal-orienteddecision makers who will choose to avail of shadow education that will eventuallylead to their desired outcomes, that is, to perform better academically. However,their goals vary depending on their socioeconomic status. The higher the social andeconomic status of the family, the higher the education expectations (Chou & Yuan,2011). Families with high levels of cultural capital and high levels of social capitalare more likely to purchase shadow education compared to families with lowerlevels of capital (Southgate, 2009). “Tutoring is a way of attaining upward socialmobility, while the middle class families wish to remain as social elites” (Bray &Kwok’s, 2003:616). Confucian traditions emphasize effort as a key to success,“more studying means more success” (Bray, 1999). Most students who avail ofservices of shadow education want to pass examinations in a more intensive way, orstudying a subject hastily (Chou & Yuan, 2011).
8.1.3 Research Problem and Hypotheses
Shadow education clienteles’ problems with academic performance and their per-ceived quality of education received from secondary school caused theefficacy-orientation attitude of its clientele (de Castro, 2014). The current studyfocuses on the mediating role of SE participation on goal orientation, study habits,connectedness, and academic performance. Specifically, the study tested the con-ceptual model that considers three factors, the study habits and goal as the personalfactor and the connectedness as environmental factor for successful academicperformance, and the SE participation as dependent variables (Fig. 8.1).
92 R.M. de Guzman et al.

8.1.3.1 Goal Orientation
The reasons for private tutoring vary from students/parents and private tutors. Forstudents/parents, private tutoring is a way of competing to become social elites. It isan educational investment for future success, since it helps accumulate cultural andpsychological capital for students. Students/parents in every family can, therefore,find legitimate reasons to spend money on private tutoring. As for private tutors, itis economic consideration (Southgate, 2009).
H1: The higher the goal orientation of the student, the more he will participate inshadow education.
8.1.3.2 Study Habits
The study of Southgate (2009) revealed that shadow education is used for strug-gling students and not for high-performing students, and all nations employ aremediation strategy when considering tutoring apart from formal learning centers.It can be observed that while most tutoring is delivered by the private sector, thereis also some public sector involvement through extracurricular activities offered byschools and community organizations (Ireson, 2004). Many schools provideextracurricular activities, some of which have a curriculum focus, such as mathclub. These activities are included in the government definition of “Study Support”(DfEE, 1997) together with other activities, such as sports, arts, and drama thatsupport academic development indirectly.
Tutoring reduced test anxiety and increased learner motivation (Mischo & Haag,2002). Additionally, it improved the students’ attitudes in school and betterattendance (MacBeath et al., 2001). In Year 11, drop-in sessions andsubject-focused study support were associated with better attendance andachievement (Ireson et al., 2004). Extracurricular activities helped students to havea sense of belonging to school (Gerber, 1996).
H2: The better the study habits of the student, the lesser is his participation inshadow education.
Academic Performance
Study Habits Shadow Education Participation
Goal Orientation
Connectedness
Fig. 8.1 Mediating role of shadow education participation in the academic performance of basiceducation students
8 The Mediating Role of Shadow Education (SE) Participation … 93

8.1.3.3 Connectedness
In West Indian supplementary schools, parents are also involved in their children’seducation, helping them with their homework and participate in educationalactivities both in school and in the community. They listen to their children readingschoolbooks at home and help with mathematics and spelling (West et al., 1998).Some parents interact in ways similar to the teachers “when listening to theirchildren read (Greenhough & Hughes, 1998). In effect, many parents are able totutor their children themselves and may not feel the need to employ tutors fromoutside the family. Parents who are teachers are likely be able to tutor, and the othermembers of the family or friends may also be able to tutor for free (Ireson, 2004).
H3: The more the student is connected to his family, relatives, and peers, the lesserhe will participate in the shadow education activities.
8.1.3.4 Academic Performance
The pervasiveness and proliferation of private tutoring can be attributed to itspotential impact on the academic performance of the students. Lee et al.(2010) surmised its positive impact on the duration of SE participation. This pro-fessionally customized service characterized by coverage and repetition of subjectmatter learned in school (Kim, 2004) has prompted the students to make use of theirtime wisely. However, it does not necessarily imply that private tutoring con-tributed to the development of the critical thinking and self-directed learningcapabilities of the students (Lee, 2005; Kim, 2003). Thus, it could be hypothesizedthatH4: The more a student participates in shadow education, the better is his academicperformance.
8.2 Method
8.2.1 Subjects and Study Site
Out of 267 elementary and high school students who responded in the study, 28.4%is 12 years old and below and 54.8% is 13–14 years old. The respondents areenrolled during the school year 2014–2015 in Saint Michael’s College of Laguna, aprivate higher education institution with a population of about 1,900 elementaryand high school students.
94 R.M. de Guzman et al.

8.2.2 Instrumentation and Data Collection
A three-part questionnaire was fielded to the respondents. The first part is about thedemographic profile of the students, while the second part deals with the availing ofprivate tutoring in terms of duration, frequency, mode of availing, type of serviceprovider, amount spent for tutorial services, reasons, and improvement in terms ofacademic performance. The third part consisted of the four variables investigatedwhich are study habits, goal orientation, connectedness, and academic achievement.After the questionnaire had been tested for reliability and validity, it was fieldedduring the months of February and March. A total of 300 questionnaires werefielded regardless of whether they availed of tutorial services or not.
8.2.3 Data Analysis
Data were analyzed using frequency, percentage, and factor analysis using theStatistical Package for Social Sciences (SPSS v 17) to determine the underlyingdimensions of stress, goal orientation, and connectedness. Simultaneous relation-ships between and among latent and manifest variables were examined throughstructural equation modeling using AMOS 19 which combines confirmatory factoranalysis and multinomial regression analysis. Maximum likelihood estimation wasemployed to determine parameters and fit indices that adjudge model fit and par-simony. Decision rule used to determine the acceptability of the model includesCMIN/df between 2 and 3, RMSEA � 0.08, and NFI, CFI and GFI � 0.80(Ferron & Hess, 2007).
8.3 Results
Table 8.1 shows the demographic profile of the respondents. More than half of therespondents are 13–14 years of age (55.06%), female (51.69%) and belong to smallfamily of 1–3 siblings (67.42%). A greater percentage of them is the eldest in thefamily (40.82%) whose parents are college graduates (father = 62.55%, mother =56.18%) and working in the country (father = 72.66%, mother = 73.41%). Morethan half of the student respondents perceived to have a good (50.56%) to verygood (22.47%) economic welfare of the family.
Table 8.2 shows details of the student respondents’ participation in privatetutoring. Only 26% is availing tutorial services during their first years in the ele-mentary (8.6%) and secondary levels (10.1%) and as needed (16.4%) for themathematics subject (9.3%) provided by teachers from their school (12.5%). Mostof those who avail of tutorial services pay Php 100–Php 200 per hour or Php 1000–Php 2000 per month. The main reason for availment of tutorial services is for
8 The Mediating Role of Shadow Education (SE) Participation … 95

Tab
le8.1
Dem
ograph
icprofi
leof
stud
entrespon
dents(N
=26
7)
Profi
leN
%Profi
leN
%
Age
Econo
mic
welfare
ofthefamily
12andbelow
7628
.46
Verygo
od60
22.47
13–14
147
55.06
Goo
d13
550
.56
Gender
Medium
6423
.97
Male
128
47.94
Bad
20.75
Female
138
51.69
Verybad
00.00
Num
berof
siblings
Family
mon
thly
income
Onlychild
2910
.86
Php10
,000
andbelow
8230
.71
1–3
180
67.42
>Php
10,000
toPh
p20
,000
7226
.97
4–6
6524
.34
>Php
20,00to
Php30
,000
4617
.23
7andabov
e7
2.62
>Php
30,000
toPh
p40
,000
248.99
Ordinal
positio
n>P
hp40
,000
toPh
p50,00
013
4.87
Eldest
109
40.82
>Php
50,000
toPh
p60
,000
62.25
You
ngest
5119
.10
>Php
60,000
toPh
p70
,000
51.87
Middle
7728
.84
>Php
70,000
toPh
p80
,000
31.12
Father’s
educationalattainment
>Php
80,000
toPh
p90
,000
20.75
Elementary
62.25
>Php
90,000
toPh
p10
0,00
02
0.75
Second
ary
8029
.96
>Php
100,00
00
0.00
College
167
62.55
Mother’seducationalattainment
MA/M
S/Ph
D10
3.75
Elementary
114.12
Father’s
profession
aloccupatio
nSecond
ary
9234
.46
Non
-academicianprofession
als
5922
.10
College
150
56.18
Academicians
62.25
MA/M
S/Ph
D12
4.49
Clericalworkers
4717
.60
Mother’sprofession
aloccupatio
n(con
tinued)
96 R.M. de Guzman et al.

Tab
le8.1
(con
tinued)
Profi
leN
%Profi
leN
%
Skilled/unskilledworkers
105
39.33
Non
-academicianprofession
als
3513
.11
Unemploy
ed27
10.11
Academicians
186.74
Retired
155.62
Clericalworkers
3814
.23
Father’s
placeof
work
Skilled/unskilledworkers
4014
.98
InthePh
ilipp
ines
194
72.66
Unemploy
ed11
141
.57
Abroad
5821
.72
Mother’splaceof
work
InthePh
ilipp
ines
196
73.41
Abroad
269.74
8 The Mediating Role of Shadow Education (SE) Participation … 97

assignments/reports/projects (9%) and for the improvement of their academic per-formance (23.1%).
Underlying dimension of social and economic factors offered by private tutoring.Exploratory factor analysis using the principal component method with varimax
rotation was applied to the 39 study habit indicators (Table 8.3) and 29 connect-edness indicators (Table 8.4) to identify their underlying dimensions for the
Table 8.2 Descriptive statistics of the respondents’ availment of tutorial services
Response N % Response N %
Avail of tutorial services Tutorial service provider
Yes 170 26.1 Teacher in school 33 12.3
No 187 69.8 Teacher outside 16 6
Grade or year ofavailment
Teacher in tutorial center 4 1.5
Grade 1 23 8.6 College 3 1.1
Grade 2 16 6 High school 4 1.5
Grade 3 11 4.1 Amount spent for tutorialservices
Grade 4 6 2.2 Php 100 to Php 200 per hour 22 8.2
Grade 5 6 2.2 Php 200 to Php 300 per hour 8 3
Grade 6 11 4.1 Php 400 to Php 500 per hour 7 2.6
Year 1 27 10.1 Php 1000 to Php 2000 permonth
16 6.7
Mode of availment Php 2000 to Php3000 permonth
3 1.1
Continuous 21 7.8 Php 4000 to Php 5000 permonth
1 0.4
As need arises 44 16.4 Reasons for availment
Frequency (per week) Assignment, projects, reports 24 9
Daily 17 6.3 Prepare for examinations 21 7.8
Twice 9 3.4 Do not understand whatteacher
2 0.7
Four 16 6 teach
Once 9 3.4 To have friends outside school 2 0.7
Others 4 1.5 Limited knowledge of familymembers
1 0.4
Subject for tutoring
Elementary Improvement in academic performance
Math 25 9.3 Yes 62 23.1
Science 5 1.9 No 8 3
English 5 1,9
Secondary
Math 17 6.3
Science 5 1.9
English 4 1.5
98 R.M. de Guzman et al.

Table 8.3 Factor analysis results of study habits
Study habits factor dimensions Factorloading
Eigenvalues %Variance
Reliability
Factor 1: goal-oriented 5.13 12.87 0.924
I memorize key words to remind ofimportant concept in this class
0.738
I try to understand the material in thisclass by making connections betweenthe readings and the concepts from thelectures
0.716
I try to identify students in this classwhom I can ask for help if necessary
0.688
When I cannot understand the materialin a subject, I ask another student inthis class for help
0.688
When reading for this class, I try torelate the material to what I alreadyknow
0.678
Even when lessons are dull anduninteresting, I manage to keepworking until I finish
0.657
I ask the instructor to clarify concepts Ido not understand well
0.639
When I become confused aboutsomething I’m reading for a subject, Igo back and try to figure it out
0.597
Whenever I read or hear an assertion orconclusion in this class, I think aboutpossible alternatives
0.563
I try to think through a topic and decidewhat I am supposed to learn from itrather than just reading it over whenstudying for a subject
0.553
I memorize key words to remind ofimportant concept in this class
0.540
I make lists of important items for thiscourse and memorize the lists
0.478
I try to change the way I study in orderto fit the subject requirements and theinstructor’s teaching style
0.408
I often find that I do not spend verymuch time on my studies because ofother activities
0.404
Factor 2: organization-oriented 2.75 12.62 0.878
I make simple charts, diagrams, ortables to help me organize coursematerial
0.789
(continued)
8 The Mediating Role of Shadow Education (SE) Participation … 99

Table 8.3 (continued)
Study habits factor dimensions Factorloading
Eigenvalues %Variance
Reliability
When reading a lesson, I make upquestions to help locus my reading
0.688
Before I study new lesson thoroughly, Ioften skim it to see how it is organized
0.651
I ask myself questions to make sure Iunderstand the material I have beenstudying in this class
0.627
I treat the subject material as a startingpoint and try to develop my own ideasabout it
0.575
If I get confused taking notes in class, Imake sure I sort it out afterward
0.544
When studying for a subject, I often setaside time to discuss the topic with agroup of students from the class
0.94
Factor 3: assistance-oriented 1.73 11.14 0.809
I have a regular place set aside forstudying where I can concentrate onmy course work
0.647
I rarely find time to review my notes orreadings before an exam
0.545
When a theory, interpretation, orconclusion is presented in class or inthe readings, I try to decide if there isgood supporting evidence
0.529
When I study the readings for a subjectI write brief summaries of the mainideas from the readings and my classnotes, to help me organize my thoughts
0.515
When studying for a subject, I often tryto explain the material to a classmate ora friend
0.513
I often find myself questioning things Ihear or read in a subject to decide if Ifind them convincing
0.457
Factor 4: dfficulty-oriented 2.06 10.90 0.772
When course work is difficult, I eithergive up or only study the easy parts.
0.733
When studying for a subject, I try todetermine which concepts I do notunderstand well
0.696
I often find that I have been reading forthis class but do not know what it wasall about
0.617
(continued)
100 R.M. de Guzman et al.

purpose of data reduction. Prior to factor analysis, the Kasier Meyer Olkin(KMO) measure of sampling adequacy and Bartlett’s test of sphericity were appliedto test fitness of data. KMO values (0.931 and 0.881, respectively) proved adequacyof the sample and Bartlett’s test of sphericity (4275.825 and 3241.339, respec-tively), with a significance level of 0.001 likewise supported the use of factoranalysis.
Reliability coefficient (Cronbach Alpha) was computed for each factor dimen-sion to determine the internal consistency of the items in each scale. All factors with60% and above reliability coefficients were considered acceptable in the study.Final reduction in the number of items was done by discarding all items the factorloadings and communalities of which are less than 0.40.
Study habits indicators (Table 8.3). Factor 1 labeled as goal-oriented habitsrefers to the students use of specific goals/objectives as motivations to learn lessonswell. Factor 2, organization-oriented habits, refers to student’s ability to employ amore organized and systematic approach effective system in their studies. Factor 3,assistance-oriented habits, describes a student’s dependence to external help com-ing from people around him or from certain study techniques which can make himlearn better. Factor 4, difficulty-oriented, describes a laissez-faire orientation in theirstudies, that is, their attitude of choosing an easier way for them to study no matterwhat the result is.
For the connectedness dimension (Table 8.4), Factor 1, trust-oriented dimension,refers to judgment or faith of students on their parents, family members, and otherpeople close to them. Factor 2, family-oriented dimension, refers to fun with thefamily. Factor 3, friendship-oriented dimension, refers to close friends. Factor 4,value-oriented dimension, refers to importance given to certain people, things, andaction. Factor 5, distraction-oriented dimension, refers to things that divert yourattention.
Goal orientation revealed two dimensions. Factor 1, the competitivenessdimension, refers to the student respondents desire to be at par with the otherstudents since they do not want to be left behind. Factor 2, the success dimension, ismore focused on improving one’s self as part of their self-actualization (Fig. 8.2;Table 8.5).
The hypothesized model consists of four hypotheses involving three latentvariables: study habits (H1), goal orientation (H2), and connectedness (H3) as
Table 8.3 (continued)
Study habits factor dimensions Factorloading
Eigenvalues %Variance
Reliability
I find it hard to stick to a studyschedule
0.587
I often feel so lazy or bored when Istudy for a subject that I quit before Ifinish what I planned to do
0.562
Kasier Meyer Olkin measure of sampling adequacy = .931; Bartlett’s test ofsphericity = 4275.825
8 The Mediating Role of Shadow Education (SE) Participation … 101

Table 8.4 Factor analysis results of connectedness
Connectedness factor dimensions Factorloading
Eigenvalues %Variance
Reliability
Factor 1: trust-oriented 2.52 12.87 0.928
My parents and I get along well 0.800
My family has fun together 0.707
It is important that my parents trust me 0.705
Always try hard to earn my teachers’trust
0.592
My parents and I disagree about manythings
0.514
I try to get along with my teachers 0.514
Factor 2: fun withfamily/family-oriented
2.89 12.62 0.909
I have a lot of fun with my brother(s)or sister(s)
0.880
Feel close to my brother(s) or sister(s) 0.870
I care about my parents very much 0.840
I enjoy spending time with mybrothers/sisters
0.808
Factor 3: friendship-oriented 2.14 11.14 0.864
My friends and I talk openly with eachother about personal things
0.796
Spending time with my friends is a bigpart of my life
0.769
I spend as much time as I can with myfriends
0.760
I rarely fight or argue with the otherkids at school
0.580
Factor 4: value-oriented 2.77 10.90 0.676
I care what my teachers think of me 0.744
I try to spend time with mybrothers/sisters when I can
0.739
I usually like my teachers 0.711
I enjoy spending time with my parents 0.706
I am liked by my classmates 0.581
My friends and I spend a lot of timetalking about things
0.566
Factor 5: distraction 1.83 9.87 0.843
My classmates often bother me 0.708
I try to avoid being around mybrother/sister(s)
0.636
Spending time with friends is not soimportant to me
0.586
(continued)
102 R.M. de Guzman et al.

exogenous variables, representing the factors that shape students’ decision to availof tutorial services. Additionally, the latter variable, which serves as the mediatingvariable is assumed to have a positive effect on the students’ academic performance(H4) (Fig. 8.3).
8.3.1 The Emerging Model
The use of structural equation modeling supported two out of the four hypothesesand emerged two causal and three noncausal relationships. Among the latentexogenous variables, study habits (H1) proved to have a positive effect (b = 0.196),while connectedness (H2) proved to have a negative effect (−0.203) on the stu-dents’ decision to avail of tutorial services. This indicates that the more the studentswant to improve his study habits and the less he is connected to his family, school,and friends, then the more likely he will avail of tutorial services. Students goalorientation did not prove to be mediated by private tutoring (H3) but proved to be
Table 8.4 (continued)
Connectedness factor dimensions Factorloading
Eigenvalues %Variance
Reliability
I like pretty much all of the other kidsin my grade
0.548
I do not get along with some of myteachers
0.526
Kasier Meyer Olkin measure of sampling adequacy = .881; Bartlett’s test ofsphericity = 3241.339
0,
STUDY_HABITS
SHF4
0,
e1
1
1
SHF3
0,
e21
SHF2
0,
e31
SHF1
0,
e41
0,
GOAL_ORIENTATION
GOF2
0,
e51
1
GOF1
0,
e61
0,
CONNECTEDNESS
FRNDS
0,
e7
1
1
SCH
0,
e81
FAM
0,
e91
Tutorial
0
ACAD_PERFORMANCE
AA7
0,
e10
1
1
AA6
0,
e11
1
AA5
0,
e12
1
AA4
0,
e13
1
AA3
0,
e14
1
AA2
0,
e15
1
AA1
0,
e16
1
0,
e17
1
0,
e18
1
Fig. 8.2 Hypothesized model
8 The Mediating Role of Shadow Education (SE) Participation … 103

Table 8.5 Factor analysis results of goal orientation
Goal orientation factor dimensions Factorloading
Eigenvalues %Variance
Reliability
Component 1: competitiveness 5.13 35.09 0.928
I would feel really good if I were theonly one who could answer theteacher’s questions in class
0.814
It is important to me that other studentsin my class think I am good at my classwork
0.787
I’d like to show my teacher that I’msmarter than the other students in myclass
0.776
I do my class work because I’minterested in it
0.740
One of my goals is to show others thatclass work is easy for me
0.711
I would feel successful in class if I didbetter than most of the other students
0.704
An important reason why I do my classwork is because I enjoy it
0.694
An important reason why I do my classwork is because I like to learn newthings
0.662
It is important to me that I thoroughlyunderstand my class work
0.639
It is important to me that I look smartcompared to others in my class
0.607
Component 2: success 3.76 31.45 0.909
It is important to me that I improve myskills
0.898
An important reason why I do my workin class is because I want to get betterat it
0.847
It is important to me that I learn a lot ofnew concepts
0.806
One of my goals is to show others thatI’m good at my class work
0.800
One of my goals in class is to learn asmuch as I can
0.731
I like class work best when it reallymakes me think
0.703
Kasier Meyer Olkin measure of sampling adequacy = 0.938; Bartlett’s test ofsphericity = 2705.796
104 R.M. de Guzman et al.

directly affecting academic performance (0.426). In the same manner, connected-ness likewise affected academic performance positively (0.311). Notably, these newcausal relationships proved further that students’ academic performance did notimprove through their availing of tutorial services, as H4 is not supported, but amore connected environment and a more positive goal orientation will lead toimprovement in academic performance. Additionally, positive noncausal relation-ships emerged among the three latent exogenous variables(SH ←! CON = 0.674, GO ←! CON = 0.794), with goal orientation andstudy habits having the strongest relationship (r = 0.905).
Among the dimensions of study habits, SH1 (0.903) proved to be most mani-fested and SH4 (0.477) the least manifested by the student respondents. Bothdimensions of goal orientation showed strong positive manifestations (GO1 = 0.89,GO2 = 0.75). Similarly, all dimensions of connectedness indicated strong positivemanifestations, with friends having the strongest connection (0.80). Notably, allindicators of academic performance were positively evident among the students,with AA2 (0.88) as the most evident and AA7 (0.58) as the least evident.
The emerging model proved to have acceptable model fit statistics as shown inthe table (Table 8.6).
0,
STUDY_HABITS
SHF4
0,
e11
SHF3
0,
e21
SHF2
0,
e3 11
SHF1
0,
e41
0,
GOAL_ORIENTATION
GOF2
0,
e51
GOF1
0,
e6 11
0,
CONNECTEDNESS
FRNDS
0,
e71
SCH
0,
e811
FAM
0,
e91
Tutorial
0
ACAD_PERFORMANCE
AA7
0,
e10
1
AA6
0,
e11
1
AA5
0,
e12
1
AA4
0,
e13
1
1
AA3
0,
e14
1
AA2
0,
e15
1
AA1
0,
e16
1
0,
e17
1
0,
e18
1
Fig. 8.3 Emerging model
Table 8.6 Model fit statisticsof emerging model
Statistics Model
CMIN/df 2.93
RMSEA 0.08
Parsimony 0.84
Comparative fit index (CFI) 0.91
Normed fit index (NFI) 0.87
Incremental fit index (IFI) 0.91
8 The Mediating Role of Shadow Education (SE) Participation … 105

8.4 Discussion
The study intends to determine the nature of shadow education and its effect on theacademic and social profile of basic education students. The study shows thatamong those who availed tutorial services majority are eldest and come from smallfamilies of 1–3 siblings having good economic welfare whose parents are collegegraduates working in the Philippines. Noticeably, they availed tutorial servicesduring early years in elementary and secondary levels usually to help them do theirassignments, reports, and projects in mathematics and only as need arises for a feeof Php 100–Php 200 per hour or Php 1000–Php 2000 per month. Most of themexperienced improvement in their academic.
The prevalent study habits among the students in the study concerns goals,organization, assistance, and difficulty, while for the connectedness dimension thedominant factors are family, school, and friends.
The hypothesized model consists of the following four hypotheses involvingthree latent variables: study habits (H1), goal orientation (H2), and connectedness(H3) as exogenous variables, representing the factors that shape students’ decisionto avail of tutorial services. Additionally, the latter variable, which serves as themediating variable is assumed to have a positive effect on the students’ academicperformance (H4).
H1: The more positive the goal orientation of the student the more he will partic-ipate in shadow education.H2: The better the study habits of the student the lesser is his participation in theshadow education.H3: The more the student is connected to his family, relatives, and peers the lesserhe will participate in the shadow education activities.H4: The more the student participates in the shadow education the better is hisacademic performance.
The emerging model in the study shows that among the latent exogenousvariables, study habits (H1) proved to have a positive effect while connectedness(H3) proved to have a negative effect on the students’ decision to avail of tutorialservices. This indicates that the more the students want to improve his study habitsand the less he is connected to his family, school, and friends, then the more likelyhe will avail of tutorial services. Students goal orientation did not prove to bemediated by private tutoring (H3) but proved to be directly affecting academicperformance. In the same manner, connectedness likewise affected academic per-formance positively De Castro, Torres, Alarcon (2015) has similar finding thatconnectedness has positive effect on achievement; however, continuity and durationhave an indirect impact on the academic achievement and goal orientation of thestudents. Additionally, the continuous participation in private tutoring enhancesgood study habits, better goal orientation, and higher achievement level. Chad(2012) likewise reported shadow education affects competitiveness and academicachievement.
106 R.M. de Guzman et al.

In summary, the higher the student desire to improve his study habits and theless he is connected to his family and friends the more likely he will participate.However, the more he is connected to his family and friends and the higher his goalorientation the more likely his academic performance will improve. Academicachievement in this study is not supported by participation in shadow education orprivate tutorial, but a more connected environment and a more positive goal ori-entation will lead to improvement in academic performance. Additionally, positivenoncausal relationships emerged among the three latent exogenous variables.
Among the items in the study habits, dimension “organizing thoughts/ideas fromreadings proved to be most manifested, while “regular place for studying “is leastmanifested. Similarly, all components of connectedness dimension indicated strongpositive manifestations, with friends having the strongest connection. Notably, allindicators of academic performance were positively evident among the students,with” answering assignment correctly” as the most evident and representing schoolduring competitions “as the least evident.
8.5 Conclusion
The objective of this study is to determine the effect of shadow education on theacademic and social profile of basic education students. The study found that thehigher the student desire to improve his study habits and the less he is connected tohis family and friends the more likely he will participate. However, the more he isconnected to his family and friends and the higher his goal orientation the morelikely to improve his academic performance. Academic achievement in this study isnot supported by participation in shadow education or private tutorial, but a moreconnected environment and a more positive goal orientation will lead toimprovement in academic performance.
References
Acosta, M. M. (2014). Emerging concepts of the family in media: Perspectives from typical and atypical Filipino family. Miriam College Faculty Research Journal, 38, 30–51.
Adejuwon, G. (2007). Changes in the traditional family system, poverty, and associated parentingchallenges on adolescent behavioral outcomes. Union for African Popular Studies FifthAfrican Population Conference. Retrieved on April 11, 2016, from http://uaps2007.princeton.edu/abstracts/70074
ADB Study Highlights “Dark Side of ‘Shadow Education’”. News Release, July 4, 2012, http://www.adb.org/news/adb-study-highlights-dark-side-shadow-education
Bray, M. (2007). UNESCO shadow education system: Private tutoring and its implications forplanners (2nd ed.). International Institute for Educational Planning.
Bray, M. (2010). Researching shadow education: Methodological challenges and directions. AsiaPacific Education Review, 11, 3–13. doi:10.1007/s12564-009-9056-6. https://aa-mg5.mail.yahoo.com/neo/launch?.rand=5832uo8lgl38d#9615957168
8 The Mediating Role of Shadow Education (SE) Participation … 107

Bray, M. (2012). Confronting the shadow education system—What government policies for whatprivate tutoring. Journal of International and Comparative Education, 1(2). ISSN 2232. http://www.hku.hk/research/video/9888/
Choi, J. (2012). Unequal access to shadow education and its impacts on academic outcomes:Evidence from Korea. University of Pennsylvania. file:///C:/Users/Yong/Downloads/Shadow_Education_Choi_0215.pdf
Chou, C. P. (2012). A matter of trust: Shadow education in Taiwan. https://aa-mg5.mail.yahoo.com/neo/launch?.rand=4o4ktvq79hv45#9243597324
Clarke, L & Barry,M. M. (2006). The link between social and emotional learning and academicachievement. http://www.partnershipforchildren.org.uk/uploads/AcademicAchievement.pdf.pdf
Confronting the growth of shadow education. Policy Forum April 2013, CERC website RamyaVivekananda [r. vivekanandan(at)unesco.org] at the Education Policy and Reform Unit.
de Castro, B. V. (2014). Structural equation model of the factors affecting Filipino universitystudents’ shadow education satisfaction and behavioral intentions. Asia Pacific Journal ofEducation, 34(4), 417–435. doi:10.1080/02188791.2014.9607
de Castro, B. V. & de Guzman, A. B. (2010). Push and pull factors affecting Filipino students’Shadow Education (SE) participation. University of Santo Tomas, Philippines KEDI Journalof Educational Policy—ISSN 1739-4341. ⓒ Korean Educational Development Institute 2010,Electronic version: http://eng.kedi.re
de Castro, B. V. & de Guzman, A. B. (2012). From scratch to notch: Understanding privatetutoring metamorphosis in the Philippines from the perspectives of cram school and formalschool administrators. Education and Urban Society, 46(3), 287–311. doi:10.1177/0013124512439888eus.sagepub.com
de Castro, B. V. & de Guzman, A. B. (2013). Proliferation of Shadow Education Institutions(SEI’s) in the Philippines: A time series analysis. The Asia-Pacific education researcher. ISSN0119-5646. doi:10.1007/s40299-013-0069-x
Education in a Hidden Marketplace: Monitoring of Private Tutoring Overview and CountryReport.
Education Support Program of the Open Society Institute Network of Education Policy Centersfinalli.356: Shadow Education—U-M Weblogin, Is shadow education effective? http://sitemaker.umich.edu/finalli.356/shadow_education
Finkel, A. (2013). The shadow politics of shadow education. http://latitude.blogs.nytimes.com/2013/11/27/the-shadow-politics-of-shadow-education/?_r=0
Goode, W. J. (2010). The theoretical importance of the family. Retrieved on April 11, 2016, fromhttps://www.netessays.net/viewpaper/131442.html
Gutman, J. (1982). A means-end chain model based on consumer categorization processes.Journal of Marketing, 46, 60–72.
Ho Nga Hon, H. K. (2010). Hong Kong’s shadow education. Private tutoring in Hong Kong. TheHong Kong Anthropologist, vol 4. https://aa-mg5.mail.yahoo.com/neo/launch?.rand=4o4ktvq79hv45#9243597324
Ireson, J. (2004). Private tutoring: How prevalent and effective is it? London Review of Education,2(2).
Kim, T. (2004). Shadow education: School quality and demand for private tutoring in Korea.Korea: KDI School of Public Policy and Management.
Kim, Y., Bray, M. & Lykins, C. (2012). Shadow education: Private supplementary tutoring and itsimplications for policy makers in Asia. Philippines: Asian Development Bank. Journal foreducational research online, 6(1), pp. 169–172urn: nbn:de:0111-opus-88499.
Margaret, B. Roberts, J. E, Zeisel, S. A, Hennon, E. A, & Hooper, S. (2006). Synopsis parenting:Science and practice. Copyright © 2006, Lawrence Erlbaum Associates, 6(1)
McGrew, K. S. (2007). Beyond IQ: A model of academic competence and motivation. Institute forApplied Psychometrics. Retrieved January 3, 2008, from http://www.iapsych.com/acmcewok/map.htm
108 R.M. de Guzman et al.
Parag, K., & Ayesha K. The Shadow Education Economy Ayesha and Parag Khanna explorehuman-technology co-evolution and its implications for society, business and politics at TheHybrid Reality Institute. http://bigthink.com/hybrid-reality/the-shadow-education-economy
Penn, H. (2005). Understanding early childhood education. Issues and controversies. Glasgow:Bell & Bain Ltd. Retrieved on April 11, 2016, from http://www.idealessaywriters.com/ecological-systems-theory/
Shadow Education. (2012). Does private tutoring really help? A new report published by theAsian Development Bank (ADB) and the Comparative Education Research Centre (CERC) atthe University of Hongng http://enterpriseinnovation.net/article/shadow-education-does-private-tutoring-really-help/page/0/1
Southgate, D. E. (2009). Determinants of shadow education: A cross-national analysis. GraduateProgram in Sociology, The Ohio State University 2009 https://aamg5.mail.yahoo.com/neo/launch?.rand=4o4ktvq79hv45#9243597324. Copyright by Darby Elizabeth Southgate 2009
The Express Tribune. (2012). Shadow education: Private tutoring is more commercial thanschooling, July 5, 2012. http://tribune.com.pk/story/403717/shadow-education-private-tutoring-is-more-commercial-than-schooling/
Tok, T. N. (2013). The shadow education system: Private courses. Pamukkale University,Educational Faculty, Denizli, Turkey. International Journal of Social and Science &Education, 3(3), ISSN: 2223-4934 E and 2227-393X Print.
Viet, T. (2012). Shadow education: Private supplementary tutoring and its implications for policymakers in Asia. http://www.adb.org/publications/shadow-education-private-supplementary-tutoring-and-its-implications-policy-makers-asia
Who benefits most from shadow education? The heterogeneous effects of SAT preparationactivities on SAT scores Yool Choi. University of California—Los Angeles https://aa-mg5.mail.yahoo.com/neo/launch?.rand=45rilcv5g0ss2#7154595308
Zhang, W. [w. zhang(at)unesco.org] (2015). Facing the shadow education system in Hong Kong.http://www.unescobkk.org/education/news/article/confronting-the-growth-of-shadow-education
8 The Mediating Role of Shadow Education (SE) Participation … 109

Chapter 9Blended Learning: Uncovering Challengesin Implementing Online Videos in HigherEducation
Karim Hajhashemi and Nerina Caltabiano
Abstract Integrating different types of media to deliver subject materials to stu-dents is becoming ubiquitous in higher education due to the explosion of Web 2.0tools and digital technologies that are now available. Among these computer andInternet-based innovations, educational digital video clips have become prominentdue to their capabilities for providing stimulus for deeper thought processes,communication and interaction among users. These benefits occur when digitalvideos are combined with effective pedagogy. Traditional delivery of videosthrough television and analogue recorders has long been part of higher education,but the rise of cloud-based digital video has made a significant impact on theblended learning landscape. This paper reports on interview data involving lecturerparticipants at a rural and tropical university in Australia. The results provideevidence of the challenges that they face in implementing online videos in theirteaching.
Keywords Blended learning � ICT � Online videos � Web 2.0
9.1 Introduction
With increasingly rapid and continued growth and advancement, Web 2.0 tech-nologies have become one of the most important means in learning environmentsand higher education institutes in particular. Web 2.0 technologies are gainingintense interest in all educational sectors as they are supporting students’ demandsand are facilitating the changes of learning through extending learner-centeredexperiences (Dabbagh & Kitsantas, 2012; Rahimi, van den Berg, & Veen, 2015).For instance, specific features and benefits of Web 2.0 tools, particularly, collab-
K. Hajhashemi (&) � N. CaltabianoJames Cook University, Cairns, Australiae-mail: [email protected]
N. Caltabianoe-mail: [email protected]
© Springer Nature Singapore Pte Ltd. 2018S.F. Tang and S.E. Cheah (eds.), Redesigning Learning for GreaterSocial Impact, DOI 10.1007/978-981-10-4223-2_9
113

orative and interactive aspects of knowledge and information acquisition, are fos-tering teaching and the learning process (Soomro, Zai, & Jafri, 2015). According tosome researchers (e.g., Yeen-Ju, Mai, & Selvaretnam, 2015), Web 2.0 technologyhas opened the doors to a wide repository of information fostering communicationand collaboration practices among learners. According to Soomro et al. (2015),teaching-friendly characteristics of Web 2.0 technologies have brought someadvantages such as “easy accessibility, usability, and flexibility”, supporting vari-ous pedagogical and instructional approaches (p. 285). Moreover, Nazatul Aini(2014) addresses more advantages for higher education institutes including “easierand faster access to information, when and where it is needed; sharing accumulatedexperiences and resources; and compatibility with the elements of the educationalfield and the existing contextual dynamics” (p. 88).
The emergence of the Web 2.0 social networking technologies has provided newopportunities for education, such as facilitating collaboration, creativity and inno-vation for students in groups or individually (Lee & Markey, 2014; Moyle, 2010).For instance, Lee and Markey (2014) appoint that Web 2.0 technologies allowstudents to create and share content with their peers through social networking “in adynamic and instantaneous manner” that enhances interaction, collaboration andnetworking among students (p. 284). Web 2.0 technologies have allowed for anexpansion of activities and user contributions. Newland and Byles (2014) addressthe capability of Web 2.0 technologies by providing a different pedagogicalapproach through collaborative knowledge construction.
As a response to the call for a technology-enhanced approach fostering a morestudent-centered experience and to actively engage students, many universities areencouraging their educators to rethink and reframe their teaching approaches anddelivery method in conjunction with the arrival of Web 2.0 technologies. However,as Moyle (2010) states, the advantages of implementing Web 2.0 networkingtechnologies in the learning environment “depend upon the teaching and learningapproaches used, and this shifts the emphasis to the skills and the role of theteacher” (p. 39). As such, some researchers (Harris & Rea, 2009; Karvounidis,Chimos, Bersimis, & Douligeris, 2014) recommend incorporating such technolo-gies so as to not obstruct pedagogy. Also recommended is the use of these tech-nologies in a way to create a balance between the needs and demands of bothstudents and educators (Cole, 2009). Further, the rapidly increasing number andtype of Web 2.0 technologies and tools provide a barrier for educators “to keep paceand understand the opportunities for their use in teaching and learning” (Cain &Fox, 2009, p. 1). Consequently, Cole (2009) argues that the outcomes of integratingtechnology into the classroom should be clear by the higher education institutes.They must not confuse technological interactivity with interactive learning.
There are many different types of online tools that can be categorized as Web2.0. These include social networks (e.g., Facebook, LinkedIn, MySpace), Wikis(e.g., Wikipedia), blogs (e.g., Wordpress, Academia), microblogs (e.g., Twitter,
114 K. Hajhashemi and N. Caltabiano

Blogger), media sharing (e.g., YouTube, Flickr), and social bookmarking services(CiteULike, Delicious, iKeepBookmarks), and creative works (e.g., podcasts,videocasts). All these share the same core idea of constructing knowledge andenhancing users’ interactivity (Bower, 2015; Morgan, 2014b; Rahimi et al., 2015;Soomro et al., 2015). In a like manner, Rahimi et al. (2015) state that Web 2.0 toolsprovide students “with ‘just-in-time’ and ‘at-your-fingertips’ learning opportunities,and can support a wide range of teaching and learning activities” (p. 781). Amongthe above-mentioned Web 2.0 technologies, videos and media sharing has becomemore ubiquitous. Although the introduction of this technology started in 1960s withthe arrival of analogue videos, it has played an important role in education and hasproven its effective role as a learning medium in providing more user accessopportunities to a wide audience worldwide and enhancing their understanding(June, Yaacob, & Kheng, 2014; Ritzhaupt, Pastore, & Davis, 2015). In other words,the integration of technology into the classroom and its advances has enhanced theway of creating videos to facilitate and improve learning and teaching. For thisreason, technology integration has become a vital part of lecturers’ professionallearning and teaching toolbox to actively engage and motivate students in variousmodes of learning. This study focuses on the lecturers’ perceptions of the obstaclesthat they have experienced while utilizing videos in their teaching. For this reason,the following interview question was formulated: What are the different challengesand obstacles for online videos?
9.2 Method
9.2.1 Participants
The qualitative study involved 10 lecturers in a rural and tropical university inAustralia. All participants were from the discipline of Education and they were aged35 and over.
9.2.2 Procedure
After obtaining ethical clearance for the study, the willing lecturers were invited toparticipate in interviews to share their experiences about challenges of online videosthrough their teaching. The interviews were held at a mutually agreed time andplace. All sessions were recorded and transcribed by the first author. The study usespseudonyms to keep the participants’ identity confidential.
9 Blended Learning: Uncovering Challenges in Implementing Online … 115

9.3 Results and Discussion
The findings of the study revealed distinctive similarities between lecturers’tech-literacy and the extent of video integration and types of videos that they use.The most visible similarity between lecturers was in terms of incorporating differentkinds of short YouTube videos. Besides the short YouTube videos and other onlineresources, all lecturers reported that they could create their own videos by usingCamtasia, and not having a reliance on the available online sources. Camtasia is ascreen capture tool implemented into the classroom to capture lectures, activitiesand PowerPoint presentations. It provides lecturers the opportunity to record avideo via Webcam while they are orally presenting or reading an article, or aPowerPoint on a computer screen. Thus, the video can capture and record move-ment on the screen, and both the voice and the lecturers’ presentation. Whilecreating Camtasia videos can be time-consuming and costly, the findings revealedthat it has been embraced by the academic participants and several researchers(Bull, 2013; Ng’ambi, 2013; Silva, 2012; Thiele, Mai, & Post, 2014) have rec-ommended its use.
As a variant of blended learning and an innovative pedagogical approach, someparticipants (n = 5) have also made their own flipped videos that is a video forstudents to be watched at home, and it has garnered a lot of attention amongacademics and the media. As such, they could use Camtasia Studio as a tool forcreating flipped videos and content reviews. According to Bull (2013), “Camtasiadigital interactive files promote flipping the classroom through use of video filesthat students watch as homework and apply concepts in the classroom” (p. 614).Thus, videos can support teaching and developing the curriculum in a flippedclassroom model (Dong & Goh, 2015).
Considering the aim of the question, the study revealed some challenges thatlecturers have found in their teaching. According to the data gathered from inter-views, it seems that the challenges are around the use of Camtasia, rigidity (clunkyplatforms), technology access and funding, technology mastery, upskilling in latesttechnological change and innovation, the structure and the pedagogy and the typesof activities that they implement. Being aware of the university’s attention andfunding in this current climate taps into what is happening culturally. For instance,Brian asserts that a lecturer just gets used to one operating platform or one softwaresystem and then it is updated and outmoded and overloaded by something else.Therefore, he thinks that in a lot of the software and hardware development, there isa lot of planned obsolescence. To Julia, another educator, the challenges are aroundthe structure. It is communicating the structure to the students and being explicitabout what the demands are of the student.
In fact, digital technologies can only be effective in combination with soundpedagogical approaches. For instance, some researchers complain that the flippedmethod has neglected the important aspects of good teaching (Morgan, 2014a).Some other highlighted issues are around creating a big gap between high- andlow-income students, Internet access problem especially in the rural areas, limited
116 K. Hajhashemi and N. Caltabiano

budget of educational institutes and the costly required software access, the requiredtraining sessions for teachers on how to use the software and to structure a flippedclassroom, and the required self-learning reliance and motivation from students inthis non-traditional method (Findlay-Thompson & Mombourquette, 2014). Asstated by Ash (2012) and Raths (2014), the principle of this method may looksimple, but there are a multitude of ways of flipping the classroom based on thesubject and educational philosophy differences. Moreover, the classroom environ-ment has become as generational challenge for both students and lecturers based ontheir various levels of proficiency and reliance on technology. For this reason,Berrett (2012) states, “content is not going to be the thing we do. We’re going tohelp unpack that content” (p. 38).
In addition to the above-mentioned challenges, lecturers need to find out whetherstudents are engaged with the material. Indeed, students must have the motivationto follow the educational material provided through the videos. Obviously studentshave the reading materials and the lecture notes, but giving them a flipped video, forinstance, to watch before coming to class, might give them a sense of what thecontent of the discussion in the class will be. In short, as Kleber (2015) states,today’s students’ diverse needs have provided a continuous challenge to moderneducators as they need to meet their students’ diversity in the fast-paced world ofthe technology learning environment. Such challenges may seem endless due to thelack of time, money and staff. Blended learning may not be the only solution.However, as Kleber (2015) appoints, blended learning and its variants (e.g., flippedclassroom approach) provide “a dynamic, evolving tool that can unite students,teachers and administrators through technology with the goal of increasing learningand engagement” (p. 24). These increases in learning and engagement empowerstudents with measurable growth in the required skills they need to compete in theongoing challenges in higher education.
References
Ash, K. (2012). Educators evaluate flipped classrooms. Education Week, 32(2), s6–s8.Berrett, D. (2012). How ‘flipping’ the classroom can improve the traditional lecture. The
Education Digest, 78(1), 36–41.Bower, M. (2015). Deriving a typology of Web 2.0 learning technologies. British Journal of
Educational Technology. doi:10.1111/bjet.12344Bull, P. H. (2013). Cognitive constructivist theory of multimedia: Designing teacher-made
interactive digital. Creative Education, 4(9), 614–619.Cain, J., & Fox, B. I. (2009). Web 2.0 and pharmacy education. American Journal of
Pharmaceutical Education, 73(7), 120.Cole, M. (2009). Using wiki technology to support student engagement: Lessons from the
trenches. Computers & Education, 52(1), 141–146. doi:10.1016/j.compedu.2008.07.003Dabbagh, N., & Kitsantas, A. (2012). Personal learning environments, social media, and
self-regulated learning: A natural formula for connecting formal and informal learning. TheInternet and Higher Education, 15(1), 3–8. doi:10.1016/j.iheduc.2011.06.002
9 Blended Learning: Uncovering Challenges in Implementing Online … 117

Dong, C., & Goh, P. S. (2015). Twelve tips for the effective use of videos in medical education.Medical Teacher, 37(2), 140–145. doi:10.3109/0142159X.2014.943709
Findlay-Thompson, S., & Mombourquette, P. (2014). Evaluation of a flipped classroom in anundergraduate business course. Business Education & Accreditation, 6(1), 63–71.
Harris, A. L., & Rea, A. (2009). Web 2.0 and Virtual World Technologies: A Growing Impact onIS Education. Journal of Information Systems Education, 20(2), 137–144.
June, S., Yaacob, A., & Kheng, Y. K. (2014). Assessing the use of YouTube Videos andinteractive activities as a critical thinking stimulator for tertiary students: An action research.International Education Studies, 7(8), 56–67.
Karvounidis, T., Chimos, K., Bersimis, S., & Douligeris, C. (2014). Evaluating Web 2.0technologies in higher education using students’ perceptions and performance. Journal ofComputer Assisted learning, 30(6), 577–596. doi:10.1111/jcal.12069
Kleber, J. (2015). Differentiation through blended learning. Leadership, 44(3), 20–24.Lee, L., & Markey, A. (2014). A study of learners’ perceptions of online intercultural exchange
through Web 2.0 technologies. ReCALL: The Journal of EUROCALL, 26(3), 281–297. doi:10.1017/S0958344014000111
Morgan, H. (2014a). Flip your classroom to increase academic achievement. ChildhoodEducation, 90(3), 239–241.
Morgan, H. (2014b). Taking advantage of Web 2.0 technologies: Classroom blogging basics.Childhood Education, 90(5), 379–381.
Moyle, K. (2010). Building innovation: Learning with technologies. Camberwell, Victoria:Australian Council for Educational Research (ACER).
Nazatul Aini, A. M. (2014). Integration of Web 2.0 tools in learning a programming course.TOJET: The Turkish online Journal of Educational Technology, 13(4). doi:10.1016/j.sbspro.2009.01.087
Newland, B., & Byles, L. (2014). Changing academic teaching with Web 2.0 technologies.Innovations in Education and Teaching International, 51(3), 315–325. doi:10.1080/14703297.2013.796727
Ng’ambi, D. (2013). Effective and ineffective uses of emerging technologies: Towards atransformative pedagogical model. British Journal of Educational Technology, 44(4),652–661. doi:10.1111/bjet.12053
Rahimi, E., van den Berg, J., & Veen, W. (2015). A learning model for enhancing the student’scontrol in educational process using Web 2.0 personal learning environments. British Journalof Educational Technology, 46(4), 780–792. doi:10.1111/bjet.12170
Raths, D. (2014). Nine video tips for a better flipped classroom. The Education Digest, 79(6),15–21.
Ritzhaupt, A. D., Pastore, R., & Davis, R. (2015). Effects of captions and time-compressed videoon learner performance and satisfaction. Computers in Human Behavior, 45, 222–227. doi:10.1016/j.chb.2014.12.020
Silva, M. L. (2012). Camtasia in the classroom: Student attitudes and preferences for videocommentary or microsoft word comments during the revision process. Computers andComposition, 29(1), 1–22. doi:10.1016/j.compcom.2011.12.001
Soomro, K. A., Zai, S. Y., & Jafri, I. H. (2015). Competence and usage of Web 2.0 technologiesby higher education faculty. Educational Media International, 52(4), 284–295. doi:10.1080/09523987.2015.1095522
Thiele, A. K., Mai, J. A., & Post, S. (2014). The student-centered classroom of the 21st century:Integrating Web 2.0 applications and other technology to actively engage students. Journal ofPhysical Therapy Education, 28(1), 80–93.
Yeen-Ju, H. T., Mai, N., & Selvaretnam, B. (2015). Enhancing problem-solving skills in anauthentic blended learning environment: A Malaysian context. International Journal ofInformation and Education Technology, 5(11), 841–846. doi:10.7763/IJIET.2015.V5.623
118 K. Hajhashemi and N. Caltabiano

Chapter 10Conceptualising Humour to EnhanceLearning Among EngineeringUndergraduates
Siow Chun Lim and Swi Ee Cheah
Abstract One of the challenges faced by engineering educators in the twenty-firstcentury is delivering content heavy and discipline-specific modules to students withever-shortening attention span. This paper argues that incorporating humour inteaching may be more effective than the traditionally didactic nature of teaching andlearning in the engineering discipline. Yet, instructional humour in engineeringeducation is a field that is still relatively unexplored compared to other fields ofeducation. In this study, a review on the theories supporting the foundationof humour will be outlined. Types of humour deemed applicable in the context ofdelivery for engineering courses are then identified and discussed in relation toissues concerning humour in teaching. This paper will also discuss the preliminaryfindings from a study conducted to understand engineering lecturers’ perceptionstowards application of humour in their instructional delivery. It is concluded that abasic humour engagement scale could be adopted to enable lecturers in conductingself-assessments on the incorporation of humour in their instructional delivery.
Keywords Humour � Engineering education � Instructional humour
10.1 Introduction
Engineering is traditionally known as a didactic subject with a strong emphasis ontransmitting discipline-specific concepts and principles (Becher, 1994). Whileengineering may seem a didactic subject, it also requires that students are able toapply the knowledge they learn to solve practical problems and create something
S.C. Lim (&)Multimedia University, Cyberjaya, Malaysiae-mail: [email protected]
S.E. CheahTaylor’s University, Subang Jaya, Malaysiae-mail: [email protected]
© Springer Nature Singapore Pte Ltd. 2018S.F. Tang and S.E. Cheah (eds.), Redesigning Learning for GreaterSocial Impact, DOI 10.1007/978-981-10-4223-2_10
119

new (Sharp, 1991). As advocated by the Engineering Accreditation Council and theBoard of Engineers Malaysia, the engineering curriculum must be tailored towardsthe concept of outcome-based education. An accredited engineering curriculum inMalaysia typically comprises of 12 programme outcomes, which the graduatesshould attain upon graduation. Unsurprisingly, the problem-solving component iscaptured in at least one of the 12 programme outcomes. Hence, the challenge lies inhow problem-solving skill can be taught holistically to students. Problem solvingrequires students to master the ability to evaluate and create solution, which occupythe two highest cognitive levels in Bloom’s Taxonomy. Moreover, problem-solvingskill is more than the mastery of cognitive skill at the individual level. The processof problem solving often requires collaborative and social skills and as emphasisedin the work of practising engineers, teamwork and communication are crucial.Problem solving in engineering education should ideally cover the aspects of(i) cognition where the abilities to evaluate and create are valued, and (ii) social andemotion where the process involves collaboration, teamwork and communication.Humour used or teaching or instructional humour is therefore considered to beessential in promoting problem-solving skill as well as elevating the efficiency ofdelivery of engineering knowledge.
Humour is generally associated with being sociable. It is not wrong to assumethat with humour in instructions, there will be increased teamwork and commu-nication that facilitate problem solving. Research done on schools, colleges anduniversity also concur that appropriate use of instructional humour tends to result inenhancement of students’ creativity (Boyle & Stack, 2014; Katrina & Paivi, 2011).However, there has not been a systematic study done on how instructional humourcan be used to enhance the teaching and learning process for engineering pro-grammes at the university level. The study is motivated to explore instructionalhumour for engineering education by conceptualising humour through an extensiveliterature towards a perception study among the academics involved in teachingengineering undergraduates.
10.1.1 Statement of Problem
Research on humour covers a multidisciplinary field such as psychology, philos-ophy and linguistics, sociology and literature. Studies that attempt to relate humourto learning have found that humour increases motivation and learning in general(Banas, Rodriguez, & Liu, 2011) as well as controls problematic behaviour andfacilitates foreign language acquisition (Cornet, 1986). Some researchers arguedthat there is an increasing need for delivery of engineering courses to be done inpedagogy which involves humour and empathy to promote engagement with stu-dents (Katrina & Paivi, 2011).
120 S.C. Lim and S.E. Cheah
As can be seen, there is a dearth of research on how humour works in facilitatinglearning in the field of engineering, particularly on what may qualify as instruc-tional humour while others are not. Hence, the motivation of this study is to attemptto classify the types of instructional humour deemed applicable in engineeringcourses and to gauge the perception of engineering lecturers in Malaysia towardsinstructional humour.
10.2 Theoretical Perspectives
Three seminal theories have traditionally been used to explain what contributes as keyelements of humour: superiority, relief and incongruity theories. These theories arediscussed to provide a fundamental understanding on humour in its different forms.
Superiority theory views humour as an element that results in having a winnerand a loser (Gruner, 1997). The person that manages to make fun of the othersuccessfully is deemed the winner. A sense of superiority emerges from playfulcompetitions and/or disparagement of others thus resulting in laughter or a funnysituation. In the context of teacher–student relationship and where the primary focusof teaching is now aimed to be student-oriented, this theory may be inappropriate.
Relief theory defines humour as a pleasant feeling or sensation that replaces aperson’s negative feelings such as sadness, fear and tension. Freud explains thathumorous laughter could result in a sudden release of tension due to entertainmentof taboo or nonsensical thoughts (Rutter, 1997). Minsky (1981) builds uponFreudian theory in suggesting that jokes can also be understood as puns, words thatconnote double meanings and challenges one to make a “sense-shift” (Mulder &Nijholt, 2002) of the words between the conventional and less-obvious meanings.
Incongruity theory, popularised by Kant, expands on relief theory to concep-tualise humour elicits laughter as the sudden incongruity between object perceivedand the reality such as telling of jokes (Kant, 1911). In other words, humour mustcontain elements of surprise or contradiction. According to Mulder and Nijholt(2002), the incongruity-resolution theory further sheds light on how jokes arestructured linguistically and that they are not under influence of the surroundingfactors. It is, thus, hard to explain why the same jokes can keep eliciting laughterwhile others may not be found funny at all.
In order to apply these theories in the attempts to understand and explain humourin teaching, it is crucial to make a distinction between comedic humour forentertainment and purposeful humour for learning. Humour used in teaching shouldbe planned carefully to ensure its alignment with instructional objectives, otherwiseit will be “reduced to a means of amusement for students with no learning out-comes” (Mafakheri & Nasiri, 2015). This supports Jones (2015, p.19) who arguesthat purposeful humour is a form playful learning or “edutainment” as opposed toteachers being comedians who provide entertainment. Playful learning engageslearners actively in thinking and questioning, while comedic entertainment involvesstudents being passively entertained to produce laughter (Jones, 2015). One of the
10 Conceptualising Humour to Enhance Learning Among Engineering … 121

biggest challenges in using humour is in ensuring that humour is used purposefullyto enhance or engage learning, lest it becomes meaningless comedic entertainment(Baid & Lambert, 2010).
10.3 Types of Humour
There is an array of forms or types of humour available from extant literature.Wanzer, Booth-Butterfield, and Booth-Butterfield (2005), for example, suggestsnine types of humour namely low humour, nonverbal humour, impersonation ofspecific characters, language/wordplay, using humour to reduce negative affect,expressiveness/general humour, laughing, using funny props and seeking otherswho are known to be funny. A year later, Wanzer further simplified into four typesnamely humour related to class material, humour unrelated to class material,self-disparaging humour and unplanned humour (Wanzer, Frymer, Wojtaszczyk, &Smith, 2006). Martin (2007), on the hand, summarises humour in terms of jokes,spontaneous conversational humour (intentional) and unintentional humour.Drawing from the literature and then contextualising them into its appropriatenessof application in teaching of engineering courses, five types of humour have beenidentified as jokes, anecdote, props, self-deprecation and spontaneity. The follow-ing section discusses each type of the identified humour followed by some itemsthat can be used for self-assessment by the engineering lecturer.
10.3.1 Jokes
Jokes can be referred as consisting of puns or words with double meanings,wordplay and punchlines among others (Minsky, 1981). Puns exploit multiplemeaning of words or similar-sounding words for an intended humorous orrhetorical effect, while wordplay is a technique of using words in an innovative wayto reinforce a certain meaning behind a message. The reinforcement happens due toamusement created among the intended audience. Jokes can also include humorous,amusing or informative “pulses” which end in punchlines (Hetzron, 1991).Punchlines, as understood from Raskin’s Theory of Verbal Humor (Atardo &Raskin, 1991), are different from the usually unambiguous jokes. Punchlinesintroduce ambiguity in jokes by triggering a switch that makes the hearer realisethat more interpretations of the jokes are possible from the beginning (Mulder &Nijholt, 2002).
In the engineering context, this humour type is applicable as certain engineeringtheories or concepts may be long-winded and difficult for students to grasp. Cleveruse of wordplay and conversion of the key points to punchlines may be able toassist students to better understand the concept.
122 S.C. Lim and S.E. Cheah

Below is a list of suggested items that can be used for self-assessment on the useof jokes:
(a) I am a good speaker(b) I am good with wordplay(c) I use puns when interacting with people(d) People usually laugh at my puns(e) I use puns in my class(f) I find my students to be receptive to my puns(g) I find that my students are able to grasp a concept taught using puns better.
10.3.2 Short Story/Anecdote
In the context of humour, telling short story or conveying anecdote is acontext-driven method in which the speaker leverages on his or her life experienceand relates it to the lecture or course material to be delivered. Unlike spontaneity,this method requires careful planning before its execution in the class. For instance,the lecturer may explain how he or she has applied a certain engineering principle tosolve the day-to-day problems that he or she is facing.
A list of suggested items that can be used for self-assessment on the use of shortstory and anecdote is as follows:
(a) I am a good speaker(b) I am good in telling anecdote(c) I tell short stories when interacting with people(d) People usually are amused with my story(e) I tell anecdote related to the topic in my class(f) I find my students to be receptive to my anecdotes(g) I find that my students are able to grasp a concept taught using anecdotes better.
10.3.3 Props
Props is another type of humour which is heavily context-dependent. Lecturers mayuse funny props such as cartoons to pictorialise an otherwise dry course material.This method is effective especially in capturing the attention of the students and isparticularly useful for visual learners. Two suggested items that can be used forself-assessment on the use of props are as follows:
(a) I use props to explain certain concepts in my class(b) I find it easy to find suitable props to be used in my class
10 Conceptualising Humour to Enhance Learning Among Engineering … 123
10.3.4 Self-Disparaging/Self-Deprecation
Self-disparagement can be understood as a technique of reprimanding oneself eitherby intentionally belittling oneself or by being excessively modest. In the context ofthis discussion, it could mean that the lecturer intentionally commits mistakes,which could be in the form of miswritten equations, tongue-slips or purposelysolving a question in the wrongful manner to elicit attention of students. Studies onpsychology, however, many have a different perspective towardsself-disparagement as a sense of humour. For example, Murphy et al. (2002) foundthat self-disparagement is related to feelings caused by personal inadequacy andcould indicate an onset of depression (Murphy et al., 2002). Others have found thatdisparagement, whether on others or self, is considered as offensive and not relatedto learning (Wanzer & Frymer, 1999; Wanzer et al., 2006).
Two suggested items that can be used for self-assessment on the use of props areas follows:
(a) I belittle myself to humour people around me(b) I intentionally make mistakes in my lecture to emphasise a point to my
students.
10.3.5 Spontaneity
This technique is unintended and highly random in nature whereby the lecturersreact towards stimulus which can be in any form in a humorous way. For instance,when a student asks a question, the lecturer can answer it in a humorous way whichwill prompt the student to think further.
A list of suggested items that can be used for self-assessment on being spon-taneous is as follows:
(a) Being humorous is a natural communication orientation for me(b) I can be amusing or humorous without having to tell a joke(c) I can easily relate funny or humorous ideas to the class(d) I relate amusing stories, jokes and funny things very well to others(e) I use humour to communicate in a variety of situations.
10.4 Preliminary Perception Study
A preliminary study was carried out to further explore humour from the academics’perspectives. This was a small-scale preliminary study to establish the relevance ofhumour in context. An online survey was conducted to gauge the perception of
124 S.C. Lim and S.E. Cheah

engineering academics on their self-perceived utilisation of humour in their peda-gogical approach. Twenty respondents who were academics in the EngineeringFaculty consented to participate in the preliminary study. Figure 10.1 presents theproportion of the years of teaching experiences among these respondents.
Out of the 20 respondents, more than half have more than 10 years of teachingexperience as shown in Fig. 10.1. All except for the two respondents with morethan 10 years of teaching experience thought that they were naturally humorous.This resulted in 60% of the total having perceived themselves as being humorous intheir teaching. However, it is also interesting to note that all the respondents thoughtthat humour helps to enhance the teaching and learning process in class except forone who responded otherwise. The results showed that the huge majority, includingthose who perceived themselves as not naturally humorous, agreed that pedagogicalapproach with the infusion of humour would be beneficial and hence humour isrelevant to their context of teaching and learning.
A total of 65% of the respondents found implementing humour in their teachingtasks to be challenging. More than half of the most senior lecturers in terms ofteaching experience came to the agreement that delivering their lessons by inter-jecting humour is an arduous task. This seems to suggest that even engineeringlecturers with many years of teaching under their belts find such a task to bedaunting. Only 30% of the surveyed lecturers thought that sense of humour is anatural talent and can never be nurtured.
Table 10.1 summarises the percentage of respondents who applied the afore-mentioned types of humour as well as their perceptions on how receptive theirstudents are towards implementation of such type of humour. It can be clearly seenthat the result concurs with the observation that 95% of the respondents thought that
Fig. 10.1 Classification by teaching experience
10 Conceptualising Humour to Enhance Learning Among Engineering … 125

humour and pedagogy is a good mix that would result in an improvement ofteaching and learning. Almost all of them have used humour in their lessondelivery, but the majority of them are of the opinion that it should be practised onlywhen appropriate. The mean scores of how well received are their sense of humouramong students also tell that the lecturers are generally high in confidence with theirability to engage with the students.
The remaining survey results are as follows:
1. 70% of the respondents have intentionally committed mistakes during the oraldelivery of an engineering course to emphasise a point to the students
2. 55% of the respondents perceive that they can spontaneously create humorousideas to deliver a lecture to the class
3. 85% of the respondents answer their students’ questions in a humorous manner.
10.5 Conclusion
This paper sets out to conceptualise humour and contextualise it for application inengineering pedagogy. A brief review on humour theories was presented followedby identification of humour with suggested items to measure each of it. The sug-gested items were then compiled into a humour engagement scale forself-assessment purpose to enable engineering lecturers to gauge their own ability inimplementing humour in their teaching and learning routines. This preliminarystudy on the perception of engineering lecturers on interjection of humour into theirinstructional activities seemed to conclude with positive results suggesting thathumour is relevant in engineering education. It is therefore recommended thatfuture studies should involve a bigger size of participant. Future studies could alsofocus on comparing students’ perceptions with lecturers’ self-assessment to furtherunderstand if humour used serves the purpose of enhancing teaching and learningprocess.
Table 10.1 Types of humour, frequency of use and mean receptive score
Type of humour Regularlyused (%)
Sometimesused (%)
Neverused (%)
Mean receptivescore (out of 5)
Jokes(puns/wordplay/punchline)
20 70 10 3.7
Short story/anecdote 15 85 0 3.9
Props 20 70 10 4.0
126 S.C. Lim and S.E. Cheah
References
Attardo, S., & Raskin, V. (1991). Script theory revisited: joke similarity and joke representationmodel. International Journal of Humor Research, 4(3/4), 293–348.
Baid, H., & Lambert, N. (2010). Enjoyable learning: The role of humor, games, and fun activitiesin nursing and midwifery education. Nurse Education Today, 30, 548–552.
Banas, J. A., Dunbar, N., Rodriguez, D., & Liu, S.-J. (2011). A review of humor in educationalsettings: Four decades of research. Communication in Education, 60(1), 115–144.
Becher, T. (1994). The significance of disciplinary differences. Studies in Higher Education, 19(2),151–161.
Boyle, F., & Stack, N. (2014). An explorative study into the possible benefits of using humor increative tasks with a class of primary five pupils. Humor, 27(2), 287–306.
Gruner, C. (1997). The game of humor: A comprehensive theory of why we laugh. NewBrunswick, NJ: Transaction Publishers.
Hetzron, R. (1991). On the structure of punchlines. International Journal of Humor Research, 4(1), 61–108.
Jones, V. R. (2015). Habits of mind: Humor. Children’s Technology and Engineering, 19(4),19–21.
Kant, I. (1911, 1790). Critique of judgment. James Creed Meredith (tr.), Oxford: Clarendon Press.Katrina, N., & Paivi, K. (2011). Creativity and inspiration for problem solving in engineering
education. Teaching in Higher Education, 16(4), 439–450.Mafakheri, F., & Nasiri, F. (2015). Higher education lecturing and humor: from perspectives to
strategies. Higher Education Studies, 5(5), 26–31.Minsky, M. (1981). Jokes and their relation to the cognitive unconscious. In L. M. Vaina &
J. Hintikka (Eds.) Cognitive Constraints on Communication. Dordrecht, Netherlands: Reidel.Mulder, M. P., & Nijholt, A. (2002). Humour Research: State of the Art. University of Twente,
Center of Telematics and Information Technology, Technical Report CTIT-02-34. 24, pp. 3–4.Murphy, J. M., Nierenberg, A. A., Monson, R. R., Laird, N. M., Sobol, A. M., & Leighton, A. H.
(2002). Self-disparagement as feature and forerunner of depression: findings from the stirlingcounty study. Comprehensive Psychiatry, 43(1), 13–21.
Rutter, S. (1997). Stand-up as interaction: Performance and audience in comedy venues. UK:University of Salford.
Sharp, J. J. (1991). Methodologies for problem solving: An engineering approach. The VocationalAspect of Education, 42(114), 147–157.
Wanzer, M. B., Booth-Butterfield, M., & Booth-Butterfield, S. (2005). ‘‘If we didn’t use humor,we’d die’’: Humorous coping in health care settings. Journal of Health Communication, 10,105–125.
Wanzer, M. B., & Frymer, A. B. (1999). The relationship between student perceptions of instructorhumor and students’ reports of learning. Commuication Education, 48(1), 48–62.
Wanzer, M. B., Frymer, A. B., Wojtaszczyk, A. M., & Smith, T. (2006). Appropriate andinappropriate uses of humor by teachers. Commuication Education, 55(2), 178–196.
10 Conceptualising Humour to Enhance Learning Among Engineering … 127
Chapter 11Scaffolding Social Support Amongstthe Fresher Students Through MappingActivities
Arniza Ghazali
Abstract Mapping activities (coded as PIT2 and PIT3) as means of transferringlearning autonomy to students were implemented and evaluated to understand theway learning of the fresher students in the second semester of their first year in theBachelor of Technology in BPC (Bioresource, Paper and Coatings) programme wasaffected. The observed initial tendency of clicking only with classmates of the sameethinicity was severe and the group of learners is thus, hereby addressed as ‘stiffcommunity’. To rectify the situation, the performed PIT3 mapping activities allo-cating an equal opportunity for students to participate by filling up numbered blankovals, witnessed intensive interaction across the ethnic groups. Instructor’s delib-eration suggests the effectiveness of PIT3 as an indirect instruction to rapport andimprovement in the social support. The findings, which are in 100% agreement withstudents’ self report (SSR), moreover demonstrate the function of mapping activ-ities in reinforcing students’ cognitive engagement through selection of keywordsrepresenting the principal idea that learners use in their own exploration of thelearning materials. Besides acting as points triggering curiosity, keywords allowtransfer of greater learning autonomy to students. The un-stiffening phenomenonfrom PIT3, which better prepared students for PIT2—verbal description ofco-constructed map, in turn, supports learning via good relationship, teamwork andsustainability of performance throughout the academic year. Moving from thedesirable scaffold social impact, the applied modes of mapping activity arepotentially the seed initiative to inculcate the attributes for global citizenship in anyother learning setting.
Keywords Social � Cognitive-engagement � Thinking-classroom � Mapping
A. Ghazali (&)Universiti Sains Malaysia, George Town, Penang, Malaysiae-mail: [email protected]
© Springer Nature Singapore Pte Ltd. 2018S.F. Tang and S.E. Cheah (eds.), Redesigning Learning for GreaterSocial Impact, DOI 10.1007/978-981-10-4223-2_11
129

11.1 Introduction
“Everyone has a story, everyone has a struggle and need help along the way”, Arredando(2013), Founder, Los Angeles Unified School District.
Behind Arredando’s fondest empathy for diverse learners and their uniquelearning experiences, she drew the needs for learners to have a coach or a teacher tosupport learning in challenging times. The human factor underlying diversity,according to observant experts, is humans’ creativity and it is creativity thatamplifies the capacity of coping by cherishing the rich possibilities of choices inthriving difficult situations. Because of learners’ package of diversity and creativity,a teaching system requires proper design to serve beyond just a knowledge deliverysystem but to creatively awaken the push element in any learning—curiosity(Robinson, 2013). Gruber, Gelman, and Raganath (2014), in this regard, recordedan in situ effect of curiosity in preparing the brain for learning, justifying alltogether, the must-have element in vibrant teaching and learning.
To add longevity to students’ love for learning, relationship amongst learners isas equally significant as the relationship learners forge with teachers, the coach.Without readiness to communicate, the climate of learning would be stiff and forfresher students, adaptation to the new learning setting and with pupils from diversebackgrounds needs to happen fast. If stiffness prolongs, the climate of learning mayeventually be hampered, resulting in an onset of withdrawal from the studyprogramme.
Although bizarre, the incident was apparent with the 2015/2016 fresher studentsof Bachelor of Technology (BPC) programme, last semester. The class of 19 pupils,hereby addressed as ‘stiff community’ consists of learners from two ethnic groups,X and Y. The minimum interaction and tendency of clicking with only the next fewneighbouring friends of the same ethnicity was the factor featuring the group as‘stiff’. Even communication level 1, commonly described as surface ‘social talk’(Fig. 11.1) was absent. Consequently, the class was divided into two regions of X’sand Y’s. Amongst the stiff community are reserved students who seemed aimlesslypresent in the classroom.
Fig. 11.1 Communication levels (CL), translated from literature
130 A. Ghazali

For an instructor who grew in a huge family with cross-ethnic marriages, theobserved strain was the first challenge to overcome in order to transform thestiffness into vibrant learning climate. Classroom rapport was thus planned throughmapping activities for 2-in-1 job of engendering powerful learning as previouslydemonstrated (Ghazali, 2016) and indirectly instruct intense communication(level-2, at the minimum, Fig. 11.1) amongst students. Hypothetically for thefresher students in focus, with advancement of communication level, learners wouldbecome more comfortable, happy to attend class, able to get along with peers andmore functional in teamwork.
In fact, happiness as the motivating factor to pursue learning has long beendemonstrated essential (Achor, 2011; Talebzadeh & Samkan, 2011). An interven-tion was therefore designed and evaluated by seeking understanding into two fociinquiry stated in the subsequent section.
11.1.1 Research Questions
How would (the designed PIT2 and PIT3, in specific) mapping activities, which hasa long-standing regard for its powerful cognitive engagement, overcome the stiffcommunity phenomenon without diluting learning? In what ways can this powerfultool be designed for achieving the 2-in-1 meaningful learning and the desired socialsupport and impact in a tight 7-week schedule?
11.1.2 Objectives
The main objective of this study is to look at how mapping transforms the stiffcommunity into a vibrant team of learners without sacrificing learning. As mapsonly place principal ideas in the transcription (PIT), each idea represented byminimum keywords provides support for students’ literacy process. With thisaccepted feature, this study also aims to estimate the degree of support PIT offers inthe transfer of learning autonomy and leverage the different learning needs analo-gous to personalised learning approach.
11.2 Methodology
11.2.1 PIT in Thinking Classroom
To a batch of 19 students registered to study the core subject, IWK103, “ThinkingClassroom”, featured by 3:2 lecture-to-PIT activity time allocation, was designed
11 Scaffolding Social Support Amongst … 131

with PIT3 (mapping activities that requires students to fill up empty pits or ovalblanks on the maps drawn by the instructor) as the transformational instruction.Having involved in several PIT3 weekly activities, PIT2 was introduced. In PIT2,students were coached in the way to construct topical maps based upon identifi-cation of principal ideas and radially arranging them with the breeding or sup-porting ideas. Subsequently, students were to verbally present the co-constructedmap before the class. The numbers coded to PIT (PIT1, PIT2, PIT3, etc.) werebased upon the chronology of the various designs of mapping activities developedfor the Thinking Classroom since 2014. The birth of PIT2 and PIT3 was based onthe needs to design mapping activities that are relatively more manageable incomparison to course map construction (PIT1), which was unanimously regarded astough and time consuming. As thinking was entirely driven by keywords that serveas ‘Principal Ideas for Thoughts’, mapping activities in Thinking Classroom areabbreviated PIT, which may alternately be referred to as ‘Principal Ideas inTranscription’. Regardless of form, PITs were previously witnessed as giving moresenior learners greater learning autonomy (Ghazali, 2017). The choice of PIT,however, would depend upon the students’ learning needs diagnosed by theinstructor. To improve interaction amongst learners of focus in this study, PIT3 andPIT2 were chosen.
Two of the most reserved participants from each of the ethnic group wereappointed leaders and liaison for the class. These were students who were at higherrisk of disengagement and seemed to need extra dose of attention to support theirlearning throughout the semester. Their notes are checked for accuracy by theinstructor and they were then made as referral points for the class for PIT activities.For PIT2, the two participants merge as a team to present the course map con-structed by the instructor, before the class.
11.2.2 Qualitative Contents Analysis
Students’ self reports (SSR) were gathered from their voluntary responses in socialmedia as well as questionnaires consisting of six parts. The first part, Part A,assesses if the gist of the course materials are comprehended. Part B surveys formapping experience, Part C examines if mapping has transferred learning autonomyto students by supporting literacy process, Part D inquires for affective engagementto ensure the applied intervention positively affects learners in affective ways,Part E scans if new approaches have been adopted by students to study the course infocus while Part F is on students’ state-of-being or lifestyle, to check if students hadadopted healthy lifestyle, such balanced diet, fitness, whether or not they areaffected by negative circumstances and the likes. This study analyses participants’responses for Part A, B and C while the rest are to help understand their situation.Part A was used as teacher rating of students (TRS) in accordance to the guidelineby Fredericks and McColskey (2012), to assess the degree of achievement of the setCLO for IWK103 Part 1.
132 A. Ghazali
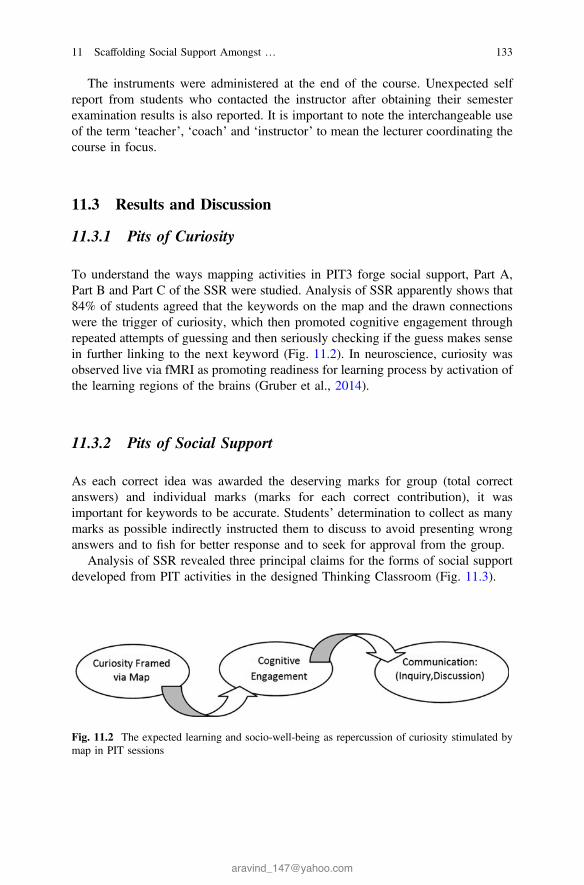
The instruments were administered at the end of the course. Unexpected selfreport from students who contacted the instructor after obtaining their semesterexamination results is also reported. It is important to note the interchangeable useof the term ‘teacher’, ‘coach’ and ‘instructor’ to mean the lecturer coordinating thecourse in focus.
11.3 Results and Discussion
11.3.1 Pits of Curiosity
To understand the ways mapping activities in PIT3 forge social support, Part A,Part B and Part C of the SSR were studied. Analysis of SSR apparently shows that84% of students agreed that the keywords on the map and the drawn connectionswere the trigger of curiosity, which then promoted cognitive engagement throughrepeated attempts of guessing and then seriously checking if the guess makes sensein further linking to the next keyword (Fig. 11.2). In neuroscience, curiosity wasobserved live via fMRI as promoting readiness for learning process by activation ofthe learning regions of the brains (Gruber et al., 2014).
11.3.2 Pits of Social Support
As each correct idea was awarded the deserving marks for group (total correctanswers) and individual marks (marks for each correct contribution), it wasimportant for keywords to be accurate. Students’ determination to collect as manymarks as possible indirectly instructed them to discuss to avoid presenting wronganswers and to fish for better response and to seek for approval from the group.
Analysis of SSR revealed three principal claims for the forms of social supportdeveloped from PIT activities in the designed Thinking Classroom (Fig. 11.3).
Fig. 11.2 The expected learning and socio-well-being as repercussion of curiosity stimulated bymap in PIT sessions
11 Scaffolding Social Support Amongst … 133

While most students claimed the positive effects of PIT on relationship withclassmates, a percentage who penned down similar remarks also claimed that theyhave learnt teamwork. The most reserved who was appointed leader found himselfimproved in the aspect of leadership, which to the instructor, is beyond the scope ofthe course expectation. However, the improved wants for learning shared by P15was the principal aim of PIT as this shows a form of provocation of curiosity thatpushes determination for learning and undertaking the learning process withexcitement (affective learning domain). This also implies the development of anintrinsic leadership for learning that is likely to mould learning desires in othercourses to come.
11.3.3 Mechanisms of Social Support
With keywords as guide for exploring the borderless information, students wereable to take charge of their own learning within the scope defined by the coach. Thekeywords that aided students’ literacy process as agreed by 73% of students,allowed for greater learning and better comprehension of the course materials. This,in turn, allowed for better function as team member in the subsequent small groupassignment, PIT2, involving presentation of topical maps that students co-constructwith the instructor and elaborated by the understanding they developed from theirindependent literacy process. As an outcome to the literacy effort, in the preparationfor presentation type of mapping activity coded as PIT2, students become thepositively contributing team member. This enhances peer acceptance and in return,invites more support from the learning community (Fig. 11.4).
Fig. 11.3 Forms of social support developed from PIT activities in Thinking Classroom
134 A. Ghazali

11.3.4 Serious Learning for Mutual Benefit—Predictorfor Sense of Responsibility
Besides P17 who stated clearly that a great deal of effort was invested in theknowledge acquisition process, reflected in the her self-report that she “Put lots ofresponsibility to make sure classmates understand”, TRS shows that a majority ofparticipants performed high quality literacy process beyond the instructor’sexpectation. During the course of their preparation, students embraced a great senseof sharing, which was described by Bryson and Hand (2007) as the trait of goodteachers. The act of managing learning responsibly ‘to make sure others under-stand’ was the sign for caring competence (Davies, 2012) that pushes for greatlearning autonomy and cognitive engagement with serious effort focusing onunderstanding. The responsible action is also the reciprocal act of recognition toothers who were once regarded as strangers. Being predictor for respect fordiversity and differences, the reciprocity act of recognition is also the predictor forsense of community (Bryson & Hand, 2007) that supports the longevity and lovefor learning.
The vibrant spirit of learning depicted on the high correlation between TRS andSSR was a pleasant discovery. The learners were special in many unbelievableways, one of which being, in conquering their selves and putting aside wishes forthe more relaxing ‘spoon-feeding’ (wished by 74%) and the classical ‘drill’ learningapproach that was posited by Cromley (2000) as leading to memorisation (con-fession by 63%) they used to embrace. Despite complains about exhaustion fromintensive brain works as typically documented with other cohorts (Ghazali, 2015),previous record shows that student revisited the topics as focus of assignment in thesubsequent semester. These are signs of the course materials being highly usable,commensurate with the previous report claiming that mapping process enhances theusability of knowledge (Davies, 2010) due to the logical links that are more
Fig. 11.4 Flow of learningand social acceptance
11 Scaffolding Social Support Amongst … 135

preferred by the brains. It is also noteworthy that the links presented on each mapnot only helps students appreciate the relevance of the knowledge to other coursesbut also its relevance to the real world.
11.3.5 Rowing, Swimming and Diving to the Finishing Line
The sticky learning process via PIT intervention is an effective mechanism thattriggers the brain to work and understand concept and this was reflected by the100% score for correct students’ responses in Part A that checked for the degree ofCLO achievement. This is confessed by P7 who asserted in writing that his brain‘melt’ and that, “Left brain and right brain had been fully used”.
If grit, defined as passion and sticking with future (Ducksworth, 2013), could betaught, PIT series of mapping has witnessed P2 as a model of success in developinggrit in students. P2 did unbelievably well despite having undergone extreme per-sonal circumstances, pain, being deprived of good sleep and good food, in additionto loss of loved one. The good in her was contagious enough to impact P6, one ofthe leaders of the small group assignment, who summoned effort to acknowledgethe instructor personally for guiding her through the learning journey “from zero tomastery of the subject”.
11.3.6 Beyond the Finishing Line
Having mentioned literacy, sense of responsibility, communication and autonomyas impacts of PIT2 and PIT3, analysis suggests that the adopted learning instruc-tions could act as seed initiatives to support the development of attributes for globalcitizenship described in the works of Thanosawan and Laws (2014) as well asUNESCO (2015). While the oral presentation in PIT2 trained students to com-municate their logical understanding with the topical map as guide, PIT3 seeded theexperience by scores as bait, which drove learners’ determination to speak out andseek answers that can make their contribution significant to the group scores. Byperforming the literacy process for personal and group understanding of the topicunder their charge, students experienced ethical and responsible acts and theundertaken literacy process also fulfils a useful fraction of the personal and intel-lectual autonomy, apart from literacy in the attributes of global citizenship.
136 A. Ghazali

11.4 Conclusion
The varying modes of mapping activity hereby coded as PIT2 and PIT3 are ways tomake learning resonate with the minds of diverse learners to help them interact andsupport each other’s learning as the result of curiosity and determination to posi-tively contribute to the mutual good of each other. As learners proceeded throughthe semester of Thinking Classroom, the once stiff community showed its truevibrant colours that were indeed there all the time, but dormant. Through PIT2 andPIT3, outstanding learners were witnessed as acting responsibly towards theirindividual learning for the sake of the bigger team. Beginning with curiosity andfurther enhanced by the developed significant relationship, the designed mappingactivities had effectively scaffold social support for sustained learning process withseed traits of global citizenship initiated along the process.
Appendix
See Table 11.1.
Table 11.1 Measured outcome and students’ vote
Outcome Students’ votes and marks on unique experience
1. Attainment of CLO 100% Teacher Rating of Students (TRS),based on their understanding of coursecontents (Part A)
2. Keywords (map) facilitate learning byfacilitating literacy process and thus,transfer of learning autonomy
73% “Did a lot of internet search. no morespoon-feed” P16“Search detail(s) about the keywords”P2“I learn to be a research on my topicstrongly” P9 “Use a lot of personalresearch on internet” P17 “Put lots ofresponsibility to make sure classmatesunderstand” P17
3. Map facilitates learning 83%
4. Map provokes mind/curiosity 84%
5. Wholesome/balance (extra remarksfrom student)
– “Left brain and right brain had beenfully used” P7
The instructor/Thinking classroom design
6. Students’ happiness7. Elements: gentleness, support, sharp
definition of scope, coaching
100%100%
(continued)
11 Scaffolding Social Support Amongst … 137

References
Achor, S. (2011). The happiness advantage: The seven principles of positive psychology that fuelsuccess and performance at work. New York: Crown Publishing Group.
Arredando, P. (2013, April). TED talk education. [YouTube] TED Talk Education Forum.Retrieved August 15, 2016, from https://m.youtube.com/watch?v=dilnw_dP3xk
Bryson, C., & Hand, L. (2007). The role of engagement in inspiring teaching and learning.Innovations in Education and Teaching International, 44(4), 349–362.
Davies, M. (2010). Concept mapping, mind mapping and argument mapping: what are thedifferences and do they matter? High Educ. Retrieved from doi:10.1007/s10734-010-9387-6
Davies, M. (2012). Chapter 1: What does it mean for students to be engaged? An interpersonalapproach to classroom management. Retrieved from http://www.sagepub.com/…/50258_Davis
Ducksworth, A. L. (2013, April). TED Talk Education. [YouTube] TED talk education forum.Retrieved August 15, 2016, from https://m.youtube.com/watch?v=dilnw_dP3xk
Fredericks, J. A., & McColskey, W. (2012). The measurement of student engagement: acomparative analysis of various methods and student self-report. In S. L. Christenson (Ed.),Handbook of Research on Students Engagement (pp. 763–782). New York, NY: Springer.
Ghazali, A. (2015). Bridging of performance gap between learners in the science and technologyclassroom, In Proc. International Language and Education Conference 2015, Palm Hotel,Negeri Sembilan, 7–8 October 2015.
Ghazali, A. (2016). Chapter 23—Map interpretation: Tool for rapid learning and assessment toolfor cognitive engagement. In F. S. Tang & L. Logonathan (Eds.), Assessment for learningwithin and beyond classroom. Chennai: Springer.
Ghazali, A. (2017). Chapter (in press) rapid grasp of concepts in materials analysis—Localknowledge in the design of thinking classroom. In N. Esa & S. Che Lah (Eds.), Localknowledge transfer mechanisms. USM: Penerbit Universiti Sains Malaysia.
Gruber, M. J., Gelman, B. D., & Raganath, C. (2014). States of curiosity modulatehippocampus-dependent learning via the dopaminergic circuit. Neuron, 84(2), 486–496.
Miller-Young, J., & Yeo, M. (2015). Conceptualizing and communicating SoTL: a framework forthe field. Teaching and Learning Inquiry, 3(2), 37–53.
Robinson, K. (2013, April). TED Talk Education. [YouTube] TED Talk Education Forum.Retrieved August 15, 2016, from https://m.youtube.com/watch?v=dilnw_dP3xk
Schuman, S. (2010) The handbook for working with difficult groups: How they are difficult, Whythey are difficult and What you can do about it. In S. Schuman (Ed.), International Associationof Facilitators, California: Jossey-Bass A Wiley Imprint.
Table 11.1 (continued)
Outcome Students’ votes and marks on unique experience
Students’ wishes
8. Favours memorisation 63% 3 Confessed love for memorising;1 indicates remembering understoodpoints.
9. Wish for being spoonfed 74%
Voluntary response via social media
10. Mastery “Thank you for teaching me from zeroto mastery” P6. Translated from BahasaMelayu to English.
138 A. Ghazali

Talebzadeh, F., & Samkan, M. (2011). Happiness for our kids in school: a conceptual model.Procedia—Social and Behavioural Sciences, 29:1462–1471.
Thanosawan, P., & Laws, K. (2014). Global citizenship: differing perceptions within two Thaihigher education institutions. Journal of Higher Education Policy and Management, 35(3),293–304.
UNESCO. (2015). Global citizenship education—Topics and Learning Objectives Paris:UNESCO.
11 Scaffolding Social Support Amongst … 139
Chapter 12The Effects of School Culture Impactingon the Process of Change
Latha Ravindran
Abstract This paper is an account of the effects of school culture on the process ofchange. Each school has an individualistic school culture, and attitudes are shapedby the social context. This paper using a qualitative approach addresses the questionof how the governance of the school and the school’s learning environment andcultural context shaped the ESL policy implementation impacting the changeprocess. The extent of the involvement the principals and teachers played in theadministration of the school had a profound impact in the implementation of theESL policy. The paper underscores the importance of understanding the schoolculture and change processes which are important to bring about effective changes.
Keywords School culture � Change process � ESL policy implementation
12.1 Introduction
Irrespective of their individual objectives for curriculum policy, all countries needto ensure that children in primary schools must meet sufficient levels of achieve-ment to promote their prospects for development and poverty alleviation. Thespecific policy change is related to the adoption of the activity-based learning(ABL) curriculum which replaced the earlier use of textbook in the place ofTeaching Learning Materials (TLM) in an integrated class system. The newapproach focused on communicative aspect as opposed to the earlier grammartranslation method. The rationale of such an approach was to give equal educationalopportunities to students from rural schools and also to cater to the growingdemands of English as it gained importance in all sectors. Historical, racial,political, religious, geographical, economic, and various other factors constantlyinfluence the growth of a nation. Hargreaves (1997) asserts that the emotionalclimate of a building is directly tied to the school’s culture. In adapting the cur-riculum to suit the particular context in which teaching takes place, the teacher is
L. Ravindran (&)Taylor’s University, Subang Jaya, Malaysia
© Springer Nature Singapore Pte Ltd. 2018S.F. Tang and S.E. Cheah (eds.), Redesigning Learning for GreaterSocial Impact, DOI 10.1007/978-981-10-4223-2_12
141

confronted with several issues. The intended audience, the way students learn, theschool as a context, the best ways to teach, and the extent to which the curriculumshould be adapted require the teacher to make decisions which have implicationsfor practice. The context of curriculum implementation is vital as it will illuminatethe educational problems it was attempting to respond to.
12.1.1 Education Policies and the Curriculum in India
India is a union comprised of twenty-seven states and nine territories. AchievingUniversal Elementary Education (UEE) has proved an elusive goal for India. Thedeliberations and recommendations of the several committees have formed the basisfor the 1968 National Policy on Education (NPE) and the National Policy onEducation Resolution of 1986. The National Curriculum Framework envisages thestudy of three languages at the upper primary and secondary stages: first, the mothertongue/regional language; second, Hindi or English (in the case ofnon-Hindi-speaking states); and third, one of the modern Indian languages (Englishin Hindi-speaking states; Hindi or English in non-Hindi-speaking states). There isno explicit statement in the Indian constitution regarding the languages to be taught.This is viewed as omission by the constitution to avoid linguistic complexity facedby the nation (Mallikarjun, 2002). Nevertheless, the constitution recognizes Hindias the official English of India and English as the associate official language.
12.1.2 Rationale of the Study
The realization of policy in practice actually depends on the fit between capabilitiesthat support the implementation and aims. Different schools and teachers did dif-ferent things with the same resources, which resulted in different effects on learning.Hargreaves (1997) postulates successful school cultures with characteristics such asopenness, informality, care, attentiveness, lateral working relationships, reciprocalcollaboration, candid and vibrant dialogue, and a willingness to face uncertaintytogether. The purpose of this study is to question how the governance of the schooland the school’s learning environment and cultural context shaped the ESL policyimplementation impacting the change process.
12.2 Literature Review
The review examines the governance of school, the school’s learning environment,and the school’s cultural context that shaped the ESL policy implementation andhow it impacted the change process. As Holiday (1994) puts it: ‘English language
142 L. Ravindran

education [in school] is supported by decisions already taking place elsewhere,which place the classroom as a culture, within a wider complex of cultures betweenwhich there are many complex channels of influence’ (p. 15). The theoreticalunderpinning for the present study can be found in Fullan’s theory of educationalchange (2001) in which he expounds the meaning of educational change. The beliefthat underpins this approach is that change is complex and there are various factorsto be taken into consideration in order to effect successful change.
12.2.1 School as Context of Change
The school as a context of change process is very crucial in affecting the teachers’ability and inclination to change. Fullan (2001) cites the organization of the schoolwith the self-contained classroom with no room for teacher interaction as onereason for the teachers to succumb to the daily routine. The teaching culture thatexists in the school promotes this self-isolation of the teachers with no opportunityfor interaction. Sarason (1990) held a similar view when he commented on theisolation of the school organization which has a negative impact on schools. Theculture of the school which has cultivated a feeling of isolation among teachers hasimpacted them in a negative way. Teachers feel isolated and responsible for theirown actions, and they approach a change program with this view of change as anindividual activity. As Sarason noted, the context within which the curriculumreform takes place need to be changed.
In identifying the key problem of implementing a new curriculum, Sarasonpointed out that individuals view schools and environments as all the same. Sarason(1990) wrote: ‘… for our schools to do better than they do we have to give up thebelief that it is possible to create the conditions for productive learning when thoseconditions do not exist for educational personnel’ (p. 145).
Schools must provide the conducive environment to encourage teachers’ questfor improvement and change. Teachers on the other hand must be sensitive to thecontext of teaching. Capability to adapt to innovations varies from one school toanother, and this sensitivity to context is vital when teachers attempt to improveteaching. Realism and practicality of innovation should be taken into considerationin the pursuit of classroom excellence. Prescribed curriculum encourages teacherdependency. As Rosenholtz (1989) observes, in effective schools, collaboration islinked with norms and opportunities for improvement and career-long learning.Educational research attests to the fact that teachers become better teachers in someschools while in some other schools teachers fail to grow. The schools mustencourage teachers to collaborate and seek ideas from colleagues which in turn willincrease their confidence and commitment to improvement. Collaborative culturesin schools will facilitate commitment to change and improvement.
12 The Effects of School Culture Impacting on the Process of Change 143

12.2.2 Social Context of Language Teaching
Language teaching needs to be seen including knowledge about culture as well aslanguage. Good language teaching then relates to being able to achievelanguage-teaching goals in a particular program, with a particular group of students,and in a particular social and cultural context. There is room for a certain amount offlexibility rather than imposing a model of professional practice because there is arange of variation in what constitutes a good practice as far as language teaching isconcerned. Hence Shulman (1987) argues that assigning a uniform standard fordetermining teacher quality ignores the highly contextual nature of teaching since alanguage teachers’ knowledge base is more than a set of basic skills.
12.3 Methodology
The aim of this study is to examine how the governance of the school and thecontext and culture shaped the implementation of the ESL policy. The proposedstudy is a qualitative study. Fifteen teachers and three principals were selected fromthree schools in Madurai district, India, and face-to-face interviews were conductedto glean their responses. Classroom observations were done to understand teacher’smotives which provided as a stimulus for further interviews. The research questionthat guides this study was as follows: How did the school’s cultural context as wellas the learning environment impacted the implementation of ESL Policy?
Analysis of data was through constant comparative method and development ofthemes.
12.4 Findings
The following themes emerged after the data from several sources were analyzedand triangulated.
12.4.1 Social Conditions Impacting ESL ClassroomPractice
The classroom environment is not conducive for the teachers to carry out theirlessons. Teachers are not trained to teach multi-grade classes. The teachers aregiven training based on the guidelines of the NCERT which advocates a ‘split up’model in which 6- to 8-day training is provided and 2 days of training consists ofactual class observation so that teachers could emulate those methodologies in their
144 L. Ravindran

classrooms. As McLaughlin (1990) posits with efforts to ‘implement’ plannedchanges in curriculum practice, local factors are critical, often resulting in mutualadaptations. The realities of the classroom are far from the ideal setting. There is alack of coordination among teachers who implement the curriculum as per theirown beliefs. The students were expected to work in groups, and the teacher wasexpected to play the facilitator role. However, the teachers opined that this isinappropriate for young learners who have always relied on the teacher for theirlearning.
As teacher Saraswathy says,
Although the objective is to promote independent learning it is not possible most of thetime since the students are young learners who always turn to the teacher for guidance andassistance.
Adapting to the new activity-based teaching was unsettling for teachers as itchallenged their long-held beliefs about teaching and learning in the traditionalclassrooms.
12.4.2 The Context of ESL Change
The context of operation varied from one school to the other. All the three schoolsvisited were situated within the same district yet differed in terms of student pop-ulation. The socioeconomic environment of the school shapes the attitude of theteacher which has an impact on the educational effectiveness of the policy imple-mented. All the three schools had students from different backgrounds whichresulted in the teachers’ talking a different approach in their teaching. Given thediverse background of the students, the culture of the schools was different, andthey also differed in terms of the facilities, the operationalization, and the planningwhich varied from one school to another. Apart from that the external factors likeaccess to learning materials, access to audiovisual resources, the class size, theteacher workload and the internal factors like teachers’ working experience, theirlanguage teaching, the teaching conditions, their understanding of the syllabus, allhad an impact in defining the context and the culture of the particular school. Theopportunities and chances for policy implementation varied from one context toanother which resulted in uneven implementation. As one teacher says,
having to translate the English words to Tamil is a disadvantage but I am obliged to do so asit is the ‘norm’ here and teachers are expected to do that to facilitate learners’ under-standing. She adds:
these students are never exposed to English. Very often I have to explain first in Tamil andthen in English. For example: when they go back home they don’t have the opportunity topractice these words. Therefore chances are that when they come back for class the next daysome or most of them might have forgotten the word and I have to repeat the procedureagain.
12 The Effects of School Culture Impacting on the Process of Change 145

12.4.3 Working Culture in Schools
The location of the schools and the role of the principals in the governance of theschool had an influence in the working culture of the staff. Principals whodemonstrated strong leadership qualities and who seemed to be in control had betterrelationships with the staff and the students. Though the intention of the change inpolicy was to get weaker students to grasp the basic aspects of communication,most of the time the task is either half completed or sometimes skipped due to lackof supervision and sometimes because the classrooms are overcrowded. One schoolprincipal describes her school culture as ‘positive.’ School Principal B opines:
I would say our culture is not so dynamic. I try not to be bureaucratic where possible andinculcate my teachers’ ideas. There is no scope for extracurricular activities in my schoolgiven the location and the space.
The need for teamwork and collegiality was not viewed as urgent, and theteachers highlighted the teaching conditions which were not conducive as a reasonfor the difficulty in adopting the learner-centered approach. It is important forteachers to use multiple strategies as the students will benefit from some of thestrategies that best suits their learning style. A similar view is expressed by Faltisand Hudelson (1998) that the more linguistically and culturally diverse the studentsare in the school community the greater the variety of teaching and learning strategyshould be, with multiple opportunities to learn from peers as well as the teacher andthe other adult staff. In this case, only the teachers in school C were inclined to learnprovided they were given the opportunity to do so. Hollins (1996) argues that‘schools are shaped by cultural practices and values and reflect the norms of thesociety for which they have been developed.’ In the case of the three schools, thereforms did not materialize positively as the expectations among the staff weredifferent. Another culture among the teachers in terms of decision making related totheir beliefs that directives should come from the principal, while the principalsopined that teachers are given freedom to do what they like. Moreover, the teachersstrongly believed that activity-based learning should be assisted mostly by theteachers thus leaving no space for creativity on the student’s part. The teachers wereentrenched in their own culture and had difficulty accepting that the learning culturehas changed.
Though all the schools had experienced teachers, none of them experienced newways to motivate students. As Hollins (1996), stated the governance of schoolsshape culture. In this study, all the principals asserted that they could not initiatereforms as the system did not empower the principals to be involved in the oper-ations and planning of the school. The social norms were strongly prevalent.Observations as well as interviews with principals and teachers revealed that regularmeetings were not the norm in their schools, and information was shared verbally inan informal manner. The teachers were not in favor of collaborative practices anddid not like to change the strongly established rituals and procedures. The
146 L. Ravindran

perceptions of the community the students came from placed minimum expecta-tions on students, and the schools did not have steps to monitor, evaluate, andimprove their performance.
12.5 Conclusion
The capacity to implement change and maintain the momentum of change clearlydiffered from one school to another. There needs to be a greater articulation of themission and the vision of the schools so that the teachers and the students couldestablish a better working culture toward a common goal. In effect, if teachers donot share the same essential perspectives on what constitutes desirable educationalpractice and do not maintain a common commitment to shared goals, they areunlikely to consistently work toward collective purposes. The individualistic schoolcultures, the capacity of the school to implement the change, and the context of theschool in which change was attempted had an impact on the way ESL curriculumwas implemented. The working culture in schools had an impact on the teachers’perceptions of their professional roles and objectives. Hence, culture and contextwere seen as interrelated, and teachers’ view on culture in relation to adapting to thechanges underscores the complexity of educational change.
References
Faltis, C., & Hudelson, S. (1998). Bilingual education in elementary and secondary schoolcommunities: Toward understanding and caring. Boston: Allyn & Bacon.
Fullan, M. (1993). Change forces: Probing the depths of educational reform. London, UK: FalmerPress.
Fullan, M. (2001). Leading in a culture of change. San Francisco, CA: Jossey-Bass.Hargreaves, A. (1997). Cultures of teaching and educational change. In M. Fullan (Ed.), The
challenge of school change (pp. 57–88). Arlington Heights, IL: Skylight.Holliday, A. (1994). Appropriate methodology and social context. Cambridge: Cambridge
University Press.Hollins, E. (1996). Culture in school learning: Revealing the deep meaning. Mahwah, NJ:
Erlbaum.Mallikarjun, M. (2002). Intra regional disparities in economic development—A study of Andhra
Pradesh. Indian Journal of Regional Sciences, 34(1), 1–11.McLaughlin, M. W. (1990). The rand change agent study revisited: Macro perspectives and micro
realities. Educational Researcher, 19, 11–16.Rosenholtz, S. J. (1989). Teachers’ workplace. The social organization of schools. New York,
NY: Longman.Sarason, S. (1990). The predictable failure of educational reform: Can we change course before it
is too late?. San Francisco, CA: Jossey-Bass.Shulman, L. S. (1987). Knowledge and teaching: Foundations of the new reform. Harvard
Educational Review, 57, 1–22.
12 The Effects of School Culture Impacting on the Process of Change 147
Chapter 13An Exploratory Study on the Roleof Blended Learning Practices to AchieveTwenty-First Century Skills AmongCulinary Students at Universityin Malaysia
Dias Soeiro Joaquim and Balasubramanian Kandappan
Abstract The lecturer has a predominant place in the learning experience of thestudent, and one of the main roles is to generate creativity and critical thinking dueto today’s competitive working environment. As the usage of technology can beconsidered as common for the youngest generation of learner; blended learning, apedagogic strategy, incorporates e-learning into the learning experience of thestudents. This study helps to explore the skills development of culinary studentsthrough blended learning practices during the class. The study also examines thereadiness of the learners and their development of skills toward the twenty-firstCentury Skills.
Keywords Blended learning � RASE model � Asian culinary students’ capabili-ties � P21 Framework
13.1 Introduction
Higher education requires quality of the learning experience and also mustaddress changes related to the technological innovations. The improvement ofICT and today’s involvement of technology in people’s life has tremendouslyaffected the way of living and changed new generations’ behaviors and expec-
D.S. Joaquim (&) � B. KandappanTaylor’s University, Subang Jaya, Malaysiae-mail: [email protected]
B. Kandappane-mail: [email protected]
© Springer Nature Singapore Pte Ltd. 2018S.F. Tang and S.E. Cheah (eds.), Redesigning Learning for GreaterSocial Impact, DOI 10.1007/978-981-10-4223-2_13
149

tations (Garrison & Vaughan, 2008). Kuh and Associate (cited in Garrison &Vaughan, 2008) highlight that engaging active learners is essential and mostlyprimordial to achieve a deep and significant learning experience. Bonk andGraham (2006) acknowledged the increase usage of blended learning in manyuniversities due to the democratization and diversification of tools used toenhance the learning online. Therefore, blended learning could be proven to beefficient and effective for the student learning experience (Bonk & Graham, 2006;Garrison & Kanuka, 2004; Garrison & Vaughan, 2008). The present study doesnot only look at the integration of technology in the curriculum but investigate thecultural and professional dimensions involved in the learning experience throughblended learning. It has to be clear that the study takes place in theoretical classesand not in practical or laboratory classes where it is required hands-on, technical,and psychomotor skills. More authentic and not enough student-centered theoryclasses require different attitudes and also behaviors from the students. Also, itcan be observed that culinary students tend to be attracted by the activities donein the kitchen or pastry more than what they do in their theory classes. Theintegration of technology in the curriculum may be a way to interest the studentand generate a more enthusiastic experience. However, didactic supports shouldbe well planned to achieve a proper learning to develop skills and capabilities; inthis study, the RASE model has been used to represent and reveal the studentexperience. The achievement of the eight Taylor’s Graduate Capabilities (TGCs)and the 5C’s is required for any students studying in this private institution inorder to the development of key competencies. The usage of blended learning is amethod to enhance interaction and interest in class, and the main focus of thisstudy is to assess the achievement of international competitive key skillsdescribed in the P21 Framework. This study does not aim to generalize thefindings but to explore the achievement of culinary students’ capabilities throughblended leaning. Researches can be found regarding the cultural or educationalaspect of the learner, but it is rarer to find studies related to emerging paradigmsuch as the twenty-first Century Skills (DiasSoeiro & Kandappan, 2016).Balasubramanian, Jaykumar, and Fukey (2014) showed the interest from culinarystudents to use Web platform such as Edmodo. Can blended learning reallyenhance the skills and capability development of culinary students? Can blendedlearning contribute to the development of the twenty-first Century Skills? Theobjectives of this study are (1) to assess the achievement of the twenty-firstCentury Skills through blended learning, (2) to analyze the effectiveness of theusage of blended learning in the skill development, and (3) to investigate whichkey capabilities are mostly developed by culinary students. The following paperwill be divided into four parts including a review of the existing literature, adescription of the methodology, an analysis of the finding, and a conclusion ofthe research.
150 D.S. Joaquim and B. Kandappan

13.2 Literature Review
13.2.1 Asian Learning Style
In their recent study among culinary students from a private institution in Malaysia,DiasSoeiro and Balasubramanian (2016) revealed that the students tend to showe-learning preferences by sharing information and accessing resources rather thandoing activities and evaluations. This study matches the empirical work of Hall andAmes (1987), and the studies from Kim (2003), Wong (2004), and Elliot and Tsai(2008) focused on the learning style of Asian students. Interestingly, they managedto show that Asian students would prefer more autonomy, collaboration, criticalthinking, meta-cognition, and less “spoon feeding,” heavy memorization,teacher-centered, or “rote learning.” The lecturer has an essential role in the studentlearning experience to generate capabilities and abilities development such ascreativity or critical thinking (Hall & Ames, 1987, Chap. 1). Also, it can be notedthat similarities with western learning theories can be observed; Corcoran (2004)revealed that Behaviorism, Liberalism, Connectivism, and Humanism can beobserved in the Confucian concept, a concept adopted in most Asian countries.
13.2.2 Blended Learning
A clear definition could be stated as informed by Bonk and Graham (2006, p. 5)“blended learning systems combine face-to-face instruction withcomputer-mediated instruction.” Also known as hybrid, blended learning is part ofthe multiple pedagogic strategies available, containing between 30 and 79% ofonline learning (Allen & Seaman, 2003). Lecturers should be able to adapt andadopt various methods to ensure and enhance the learning experience of the learners(Bonk & Graham, Chaps. 1 and 3). Many researches exist regarding the concep-tualization of blended learning. For instance, Singh (2003) enforces the usage ofKhan’s octagonal framework while Bonk and Graham (2006) or Garrison andVaughan (2008) focuses on the effectiveness of this hybrid method. Garrison andKanuka (2004) showed that competencies such as leadership could also be devel-oped via blended learning and e-learning can help to enhance abilities. Furthermore,besides encouraging asynchronous learning (Bonk & Graham, 2006, Chap. 1;Singh, 2003), blended learning also could help to develop various set of skills suchas creativity, collaboration, critical think, communication (Balasubramanian et al.,2014; Bonk & Graham, 2006) but also a sense of community (Rovai & Jordan,2004). It is also important to emphasis on the pedagogic methods and tools used forboth face-to-face and online learning. Garrison and Vaughan (2008, p. 57) defendthat the teaching innovation to support blended learning should combine strategic
13 An Exploratory Study on the Role of Blended … 151

curriculum design, teaching strategies, and technology integration. In the case ofmany institutions, public or private, curriculum was already created; therefore,clashes may occur between the curriculum and the technology innovation. Despitethe need for lecturer, thus face-to-face, to explain, draw, define, and certify infor-mation, the students tend to have a very important preference for online commu-nication and interaction (Allen & Seaman, 2003; DiasSoeiro and Balasubramanian,2016; Rovai & Jordan, 2004). Bonk and Graham (2006) denote flexibility, par-ticipation, and depth of reflection as the strengths of online learning but highlightalso spontaneity, procrastination and human connection as weaknesses. Hence, therole of the lecturer is primordial in the choice of pedagogic strategies to ensure aproper learning.
13.2.3 Taylor’s University Teaching and LearningStrategies
Taylor’s Graduate Capabilities (TGCs) are capabilities integrated in the teachingand learning framework. Part of the philosophy of the University, the studentshould not acquire knowledge only but should also be able to apply and behave in apurposeful way (Taylor’s TLF, 2016). The TGCs aim to help to create intentionallearners holistically, and lecturers should encompass student-centered learning intheir strategies. As part of the strategies of the University, blended learning is alsoadopted by the lecturers and should also aim to develop the eight TGCs which arediscipline-specific knowledge, lifelong learning, thinking and problem solvingskills, communication skills, interpersonal skills, intrapersonal skills, citizenshipand global perspectives, and digital literacy.
13.2.4 Emergence of Capabilities Development
As per Jenkins (2009), cultural and social competencies are as important as digitaland media literacies; however, those competencies will be developed in harmonywith other key skills such as collaborative problem solving, adaptation, multi-tasking, distributed cognition, collective intelligence, networking, and negotiation.The P21 Framework has been developed in 2007 and aimed to showcase a newlearning paradigm to enhance the competitive edge of all American students(Partnership for the twenty-first century learning, 2016). This new learning para-digm, shown in Fig. 13.1, focuses on key skills required in today’s workingenvironment necessary for the student’s future career (Glossary of educationreform, 2016; Jenkins, 2009; Learning-therories.com, 2016; Wagner, 2008).However, the term “Twenty-First Century Skills” does not only reflect set of skillsor knowledge but also behavioral and attitudinal traits that one must have. As
152 D.S. Joaquim and B. Kandappan

knowledge can be found anytime anywhere, the role of the lecturer is transfor-mational. P21 classify the above list of skill into few categories: learning andinnovation skills, life and career skills, information, and media and technologyskills. Another important notion, the evaluation methods, summative or formative,include also technologies in order to assess but also to let the learner experience andlearn at the same time. The use of technologies also makes the learning experiencemore efficient and productive (Partnership for the twenty-first century learning,2016).
13.2.5 RASE Pedagogical Model
RASE Pedagogic Model has been developed to support lecturer to use Learningmanagement System such as Edmodo, Moodle, or Blackboard for instance. Themodel emphasizes on four areas, respectively, named Resources, Activities,Support, and Evaluation. These four dimensions ensure a proper learning experi-ence and achievement of the learning outcomes by assuring (1) sufficient contentavailable, (2) engagement, (3) collaboration, (4) back up, tools, documentations tohelp independent learning, and (5) assessing the learning.
Fig. 13.1 P21 framework
13 An Exploratory Study on the Role of Blended … 153

13.3 Methodology and Proposed Conceptual Framework
This study applied a quantitative research approach using purposive samplingtechnique to address the objectives through a sample size of 285 students studyingdiploma, degree, and master’s program in the culinary discipline from a privateuniversity in Selangor district, Malaysia. The study was analyzed with a clean datainformation from 249 respondents as final samples size. The questionnaire willcover the students profile, use of RASE pedagogical model-based blended learningpractices to identify the twenty-first century skills. The online questionnaire wasemployed to investigate the student skills development by using blended learningplatforms in alignment with TGC, and the results were mapped with the twenty-firstCentury skills. The data recorded automatically by Google drive for further analysisand findings Fig. 13.2.
H1: There is a significant relationship between TGC-based blended learning skillsand the twenty-first century skills.
13.4 Data Analysis
It is a quantitative analysis using statistical analysis program (SPSS) to measurefrequency, mean, and standard deviation (SD). The student learning skills throughblended learning were analyzed by using a Likert-scale questionnaire by using arating guide as follows: 4.01–5 = Strongly Agree, 3.71–4.00 = Agree, 2.71–3.70 = Neutral, 1.71–2.70 = Disagree, 1–1.7 = Strongly Disagree. Finally, the datacollected were analyzed and grouped in terms of Resources, Activity, Support, andEvaluation (RASE) pedagogical model to understand which TGC the students areacquiring more.
Fig. 13.2 Proposed conceptual framework
154 D.S. Joaquim and B. Kandappan

13.5 Findings and Discussion
The demographic of the 249 survey respondents was 111 male (38.4%) and 138female (47.8%) with an age group of above 20 years was 164 respondents, 82 under18–20 years, and in between 15 and 17 years was 3 respondents.
Table 13.1 gives the descriptive statistics of constructs related to TGC andtwenty-first Century Skills (average mean score—AMS). Among all TGC, it isobserved that the culinary students through RASE model-based blended learningapproach have developed high communication skills (TGC4) and low criticalthinking skills (TGC3) as the average mean score is 3.96 and 3.85, respectively.
The correlation involves measuring the closeness of relationship between two ormore variables; it considered the joint variation of two measures (Churchill, 1995).The above Table 13.2 evidences the relationship between the independent variableand dependent variable in this study, i.e., there is a significant relationship betweenTaylor’s Graduate Capabilities outcome and twenty-first Century Skill learningoutcomes among the culinary students (result of correlation analysis is significant atthe 0.01 level). Therefore, the proposed hypothesis (H1) was accepted, and the nullhypothesis is rejected.
The result in Table 13.3 validates that there was a significant correlation with aR2 of 0.998 at a significant level of p < 0.000. Taylors Graduate Capabilities haspositive significant relationship on twenty-first Century skill through the blendedlearning practices among the culinary student (b = 0.998).
The below table results of Independence sample t-test for TGC and P21 centuryskills outcome among male and female is not significant as Leven’s statisticsp = 0.597 and 0.609 and also the t-statistics for equality of mean is 0.776 and 0.782(2-tailed), respectively. Therefore, it indicates that there is no significant differenceamong gender in TGC and P21 learning skills as shown in Table 13.4.
Table 13.5 indicates that there is a significant relation of TGC1, TGC2 with allthe twenty-first Century skills components whereby TGC3, TGC4, and TGC6 is notsignificant (coefficient p-values is higher than threshold value 0.05) with all
Table 13.1 Frequency analysis of TGC and twenty-first century skills
Item AMS Item AMS Item AMS Item AMS
TGC1 3.93 TGC3 3.85 TGC5 3.94 TGC7 3.95
TGC2 3.93 TGC4 3.96 TGC6 3.88 TGC8 3.93
Table 13.2 Correlation of the study
Scale TGC 21CS
TGC 1 0.998
21CS 0.998 1
Note **Correlation is significant at the 0.01 level (2-tailed)
13 An Exploratory Study on the Role of Blended … 155

twenty-first Century skills. The results direct to have transformation in the blendedlearning practices to achieve and improve the TGC3, TGC4, and TGC6 in align-ment with the twenty-first Century Skills.
13.6 Conclusion
As first objective, this study shows that the culinary students have the potential toachieve the skill development of the P21 Framework. The study informs that thereis a strong need to enforce on key capabilities such as critical think and problemsolving as well as financial, economic, business, and entrepreneurial literacy. Thisgoes in line, with additional findings, with the results from Dias Soeiro andKandappan (2016) where activities and evaluations involve less interest andabilities.
Table 13.3 Regression analysis
Dependent variable: Twenty-first century skills
Independent variable b t-value pb Hypothesis
H1: TGC-based blended learning have a closerelationship with the twenty-first century skills
0.998 253.6 0.000 Accepted
Note R2 = 0.998, P < 0.000b
Table 13.4 Independent t-test
Variable N Mean S.D. Leven’s test forequality ofvariance
T-test for equality of mean
F Sig t df Sig. (2-tailed)
TGC M: 111F: 138
221.3219.6
45.743.8
0.280 0.597 0.285 247 0.776
P21 M: 111F: 138
272.3270.4
56.954.9
0.263 0.609 0.277 247 0.782
Table 13.5 Regression analysis of TGC and P21 Century Skills
TGC1 TGC2 TGC3 TGC4 TGC5 TGC6 TGC7 TGC8
THEMES 0.000** 0.000** 0.259 0.674 0.000** 0.207 0.173 0.001**
P21LIS 0.000** 0.003** 0.394 0.856 0.000** 0.853 0.000** 0.000**
P21IMTS 0.000** 0.003** 0.000** 0.481 0.229 0.000** 0.000** 0.000**
P21LCS 0.000** 0.000** 0.133 0.045** 0.000** 0.070 0.000** 0.489
**Significant as coefficient of p-value <0.05
156 D.S. Joaquim and B. Kandappan

The second objective deals with the effectiveness of the usage of blendedlearning. As studied by Bonk and Grahams (2006), it is agreed that blendedlearning increase the interest and participation in class. All the series of capabilitiesand skills from the TGC or P21 Framework are more or less developed by thestudents. Also, the study tends to indicate that no difference can be noted amonggenders; therefore, there is positive impression of developing skills from anyculinary students.
The last objective informs the most developed capabilities by the students. Whilethe TGC developed focuses more communication skills, citizenship, and interper-sonal skills, the capabilities developed under the P21 Framework are informationliteracy, media literacy, health literacy, environmental literacy, initiative andself-direction, and productivity and accountability.
As financial, economic, business, and entrepreneurial literacy as well as criticalthinking and problem solving skills are the least developed skills by culinary stu-dent, there are potential gaps to be fulfilled. This is also aligned to the findings forTGC3 and 5, respectively, thinking and problem solving skills and intrapersonalskills. It is important to highlight that there is lack of creative and interpersonalskills among the culinary students which are considered as necessity for their careerpath.
The survey to only 249 students cannot be generalized, and similar studies couldbe done to investigate each TGC and each dimension in the P21 Framework. TheEdmodo platform used was designed by one lecturer; therefore, the direction andstrategies used and implemented could be involved in the analysis as qualitativeinput. Finally, the sample surveyed contents students from differentculturo-educational backgrounds; consequently, the level of understanding of thequestion by the students may be questioned.
To conclude, the lecturers must have clear strategies to enhance the students’capabilities development. The usage of blended learning should not only be ludicand create interest but also enhance and develop key competitive skills.
References
Allen, I. E., & Seaman, J. (2003). Sizing the opportunity: The quality and extent of onlineeducation in the United States, 2002 and 2003. USA: Sloan-C.
Balasubramanian, K., Jaykumar, V., & Fukey, L. N. (2014). A study on student preferencetowards the use of Edmodo as a learning platform to create responsible learning environment.Procedia—Social and Behavioral Sciences, 144, 416–422.
Bonk, C. J., & Graham, C. R. (2006). The handbook of blended learning. San Francisco: Willey.Corcoran, C. (2014). Chinese learning styles: Blending Confucian and western theories. Journal of
Instructional Pedagogies, 13, 1–10.DiasSoeiro, J., & Balasubramanian, K. (2016). Confucians in the twenty-first century skill: An
educational study of the readiness of the learners in today’s pedagogic trends. Journal ofEducation and Social Sciences, 4(2), 140–144.
Elliott, J., & Tsai, C. T. (2008). What might Confucius have to say about action research?Educational Action Research, 16(4), 569–578. doi:10.1080/09650790802445759
13 An Exploratory Study on the Role of Blended … 157

Garrison, D. R., & Vaughan, N. D. (2008). Blended learning in higher education. San Francisco:Jossey Bass.
Garrison, D. R., & Kanuka, H. (2004). Blended learning: Uncovering its transformative potentialin higher education. The Internet and Higher Education, 7(2), 95–105.
Glossary of education reform. (2016). Twenty-first century skills. Retrieved September 4, 2016from http://edglossary.org/21st-century-skills/
Hall, D., & Ames, R. (1987). Thinking through Confucius. SUNY Series in systematic philosophy.New York: State University of New York Press.
Jenkins, H. (2009). Confronting the challenges of participatory culture: Media education for thetwenty-first century (the John D. and Catherine T. Macarthur foundation reports on digitalmedia and learning). Cambridge, MA: MIT press.
Kim, H. K. (2003). Critical thinking, learning and Confucius: A positive assessment. Journal ofPhilosophy of Education, 37(1), 71–87.
Learning-Therories.com. (2016). Knowledge base and webliography. Retrieved September 4,2016 from http://www.learning-theories.com/
Partnership for the twenty-first century learning. (2016). Twenty-first Century Student outcomeand support system. P21 Framework for Twenty-First Century Learning.
RASE pedagogical Model. (2016). Retrieved September 4, 2016 from https://sites.google.com/site/hkumoodle/pedagogical-model
Rovai, A.P., & Jordan, H.M. (2004). Blended learning and sense of community: A comparativeanalysis with traditional and fully online graduate courses. The international review of researchin open and distributed learning, 5 (2)
Singh, H. (2003). Building effective blended learning programs. Issue of Educational Technology,43(6), 51–54.
TGC. (2016). Taylor’s Graduate Capabilities. Retrieved September 4, 2016 from http://university.taylors.edu.my/about-taylors/future-proof-learning/taylors-graduate-capabilities
Taylor’s TLF. (2016). Taylor’s teaching and learning framework. Retrieved September 4, 2016from https://portals.taylors.edu.my/portal/login.do
Wagner, T. (2008). Transforming education even our “best” schools are failing to preparestudents for twenty-first-century careers and citizenship. Retrieved September 4, 2016 fromhttp://www.tonywagner.com/244
Wong, J. K. K. (2004). Are the learning styles of Asian international students culturally orcontextually based? International Education Journal, 4(4), 154–166.
158 D.S. Joaquim and B. Kandappan

Chapter 14Transforming Teaching-Learning Cultureby Appropriate Use of DiscriminationIndex in Item Analysis
Benjamin Samraj Prakash Earnest, Prabal Bhargava,Anjan Kumar Das, Dato’ Md. Tahir Md. Azhar,Nurjahan Mohd. Ibrahim and Roland Gamini Sirisinghe
Abstract The current policies on use of discriminative index (DsI) hinge on theteaching-learning culture of stratifying the class based on academic performance.Such a distinction may be acceptable to norm-referenced tests (NRTs) where theexaminees are unselected and selection of the good from the bad students occurs byinternal comparison of students’ score. In criterion-referenced tests (CRTs) wherestudents are examined for mastery of core competencies against an external crite-rion, poor DsI does not necessarily indicate poor question quality. Redesigningsuch use of DsI is necessary for transformation of teaching-learning culture.
Keywords Criterion-referenced test � Norm-referenced test � Discriminationindex � Item analysis
B.S.P. Earnest (&) � P. Bhargava � A.K. Das � D.Md.T.Md. AzharN.Mohd. Ibrahim � R.G. SirisingheTaylor’s University School of Medicine, 47000 Sungai Buloh, Selangor, Malaysiae-mail: [email protected]
P. Bhargavae-mail: [email protected]
A.K. Dase-mail: [email protected]
D.Md.T.Md. Azhare-mail: [email protected]
N.Mohd. Ibrahime-mail: [email protected]
R.G. Sirisinghee-mail: [email protected]
© Springer Nature Singapore Pte Ltd. 2018S.F. Tang and S.E. Cheah (eds.), Redesigning Learning for GreaterSocial Impact, DOI 10.1007/978-981-10-4223-2_14
159

14.1 Introduction
Norm-referenced test (NST) defines the performance of test takers in relation to oneanother. In NRT, we can use the frequency distribution and can rank students.Success in NRT is being able to achieve scores in the top percentile.Criterion-referenced test (CRT) defines the performance of each test taker withoutregard to the performance of others. Success in CRT is being able to pass the test byscoring above the mark determined by standard setting.
14.2 Two Types of Tests
CRT and NRT differ in several additional important ways, particularly their com-parison targets (the criterion which is external in CRT and internal in NRT), theaverage item difficulty (usually more difficult in NRT than CRT) of the examina-tions, the resulting examinee score distributions (which is normally but broadlydistributed in NRT and in CRT and shows clustering of marks around the highervalues), and the types of scores typically reported. For CRTs, a simple classificationdecision is most commonly reported. This may be a classification of the examineeas pass/fail. For NRTs, a score, rather than a classification, is more often reported;percentile ranks or scale scores are frequently used. But it is still consideredagreeable to give grades of performance in CRT like a norm-referenced test.A normal distribution is not typical for CRT programmes. If the score distributionfor a CRT did look like the normal distribution, depending on the location of thepassing score, it would probably suggest that only a small proportion of theexaminees displayed mastery.
There is nothing basically different between a criterion-referenced ornorm-referenced test in the type of questions used or the way the tests are con-ducted. For example, if you conduct a test to select students for a course with 20seats but has 40 applicants, it is a NRT. Having selected the 20 best applicants forthe course and having trained them all equally in core competencies required toqualify, if you conduct a test to assess their mastery of the subject, it is a CRT.
14.3 Item Analysis
Item analysis is often done to improve quality of the questions using difficulty index(which is the proportion or percentage of students who answer an item correctly),discrimination index (see below), and point biserial (which is a comparison of themean score of students who chose the correct answer to the mean score of studentswho chose the wrong answer). Distractor analysis may also add to the informationon quality of the questions.
160 B.S.P. Earnest et al.

14.4 Discrimination Index
Discrimination index (DsI) is often widely used to assess the quality of tests con-ducted using multiple-choice questions. DsI is calculated as the ratio of the dif-ference between the correct answers scored by the top scoring group and the lowscoring group to the total number of students in each group.
DsI ¼ UNU
� LNL
where
U no. of students in the top group getting the item correctL no. of students in the bottom group getting the item correctNU total number of students in the top groupNL total number of students in the bottom group.
DsI values range from −1 to +1. DsI is classified as follows for grading thequality of the questions. For examinations with a normal distribution (NRT), adiscrimination index of 0.3 and above is good; 0.6 and above is very good. Valuesclose to 0 mean that most students performed the same on an item irrespective oftheir test score. The index should never be negative (Table 14.1).
14.5 A Caution in Interpreting Item Analysis Results
However, such statistics must always be interpreted in the context of the type of testgiven and the individuals being tested. More than 40 years ago, Mehrens andLehmann, (1973) provided a set of cautions in using item analysis results:
1. Item analysis data are not synonymous with item validity. An external criterionis required to accurately judge the validity of test items. By using the internalcriterion of total test score, item analyses reflect internal consistency of itemsrather than validity.
2. The discrimination index is not always a measure of item quality. There is avariety of reasons an item may have low discriminating power: (a) extremely
Table 14.1 Discrimination index interpretation
>0.30 Good
0.10–0.30
Fair
Equal to0
No discrimination. Students got the item right or wrong irrespective of their testscore
Negative Poor. The item was flawed or miskeyed
14 Transforming Teaching-Learning Culture by Appropriate 161

difficult or easy items will have low ability to discriminate, but such items areoften needed to adequately sample course content and objectives and (b) an itemmay show low discrimination if the test measures many different content areasand cognitive skills. For example, if the majority of the test measures“knowledge of facts”, then an item assessing “ability to apply principles” mayhave a low correlation with total test score, yet both types of items are needed tomeasure attainment of course objectives.
3. Item analysis data are tentative. Such data are influenced by the type and numberof students being tested, instructional procedures employed, and chance errors.If repeated use of items is possible, statistics should be recorded for eachadministration of each item.
14.6 Item Characteristic Curve (ICC)
If we plot the test score in the x-axis and the probability of getting a correct answerto an item in the y-axis, we get a curve as in Fig. 14.1a. The greater the slope withwhich the mid-section of the curve rises, the better the discrimination index. Whenthe slope of the mid-section of the curve does not rise rapidly, as in Fig. 14.1b, thediscrimination index is poor. Students have almost equal chance of arriving at thecorrect response irrespective of their test score. This curve is therefore nearly astraight line. When the DsI is negative, the curve is reversed (as in Fig. 14.1c). Thisis considered undesirable for an item.
If we aim for good DsI for all questions, what we really aim for is low proba-bility of the “low scoring group” getting the answer correct for all questions (andhigh probability of the “high scoring group” getting the answer correct in allquestions) giving a distribution of marks as shown in Fig. 14.2. This is desirable ina NRT (where the aim of the test is to stratify students), but not so in a CRT. Hence,it is generally considered that the DsI is a good index of question quality in NRTbut not in CRT. But one can argue that using questions with good DsI in a CRTmay help distinguish the best from the mediocre.
Let us presume a test with 20 items. If we are to achieve high or perfect DsI foreach item from 1 to 20, then the probability that the low scoring group answerscorrectly (for each item from 1 to 20) is low and the probability that the highscoring group answers correctly (for each item from 1 to 20) is high. If the prob-ability of answering correctly is low for each and every question, the low scoringgroup should score poorly in the examination. This means a low scoring groupanswering incorrectly for all/most questions is a sine qua non for such a high DsI tobe achieved for all questions. Similarly, the high scoring group will have nearperfect scores as their probability of answering every question correctly is high.
The implication of this is that we will need a mark distribution where the lowscoring group scores very low and the high scoring group very high. Indeed, forachieving the perfect DsI for every question, the low scoring group must fail the
162 B.S.P. Earnest et al.

examination scoring “0%” each and the high scoring should score “100%” each.But such a mark distribution would be very unrealistic (Fig. 14.2) either in a NRT(where we expect a normal distribution) or a CRT (where we expect clustering ofmarks around higher values).
Fig. 14.1 Item characteristic curves (ICCs) for different values of discrimination index (DsI)
Fig. 14.2 Mark distribution for perfect DsI for all questions
14 Transforming Teaching-Learning Culture by Appropriate 163

14.7 Discrimination Index in NRT
A broad distribution of marks would be acceptable to NRT. The maximum per-centage of students that can score well with a “perfect” DsI is 67 or 73% (dependingon whether 33% or 27% students are used to form top/bottom groups and studentnumbers). The corresponding mark distribution (Fig. 14.3) is still unrealistic. Theloss of a “perfect” top and bottom groups (as would happen with a realistic markdistribution) tends to lower the value of DsI in a test (Fig. 14.4). So the perfect DsIcannot be an ideal to strive towards and most questions in a NRT will have DsIvalues from 0.4 to 0.6.
14.8 Discrimination Index in CRT
The lack of a “perfect” top and bottom groups tends to lower the value of DsI in aCRT too. Further, in a CRT, students typically score well. Students’ good perfor-mance rates higher than 67–73% are only possible with a trade-off in the value ofdiscrimination index (Fig. 14.4). Hence, most questions in a CRT will have DsIvalues from 0.0 to 0.3. So some factors (other than question quality) tend toinfluence the DsI in a test. It is important to recognize that an item which half of thestudents answer correctly has the highest possible discriminating potential.
Fig. 14.3 Mark distribution for perfect DsI for all questions and maximum possible passpercentage
164 B.S.P. Earnest et al.

14.9 Method
This study was set in Taylor’s University, Clinical School, Sungai Buloh, Malaysia.The student population was 4 groups of 3rd- and 4th-year medical students inInternal Medicine, Ophthalmology and Obstetrics & Gynaecology postings. Thestudent groups ranged from 11 to 16 students each. Each group underwent aSBA-MCQ test with 20–30 items each at the end of their respective postings.Optical mark reader (OMR) was used to score the test results. The OMR also usessoftware to produce DfI and DsI of each question in the SBA-MCQ test. We alsoused a spreadsheet (MS Excel) to further analyse the results to group the achievedDsI into 3 groups, i.e. <0, 0–0.3, and >0.3.
14.10 Results
A total of 110 SBA MCQs were analysed from 4 different tests. We found that theDsI was mostly in the range from 0 to 0.3 as expected in a CRT with a smallerpercentage of question in the other groups (<0 or >0.3). 53.33–66.67% questionsscored DsI in the range from 0 to 0.3. DsI of >0.3 was seen for about 23.33–40% ofquestions, and DsI of <0 was seen for 3.33–16.67% of questions in different tests.Overall (Fig. 14.5) DsI of 59.1% of items was in the range of 0–0.3, 10.9% < 0,and 30% > 0.3. Of the 10.9% (12/110) items with DsI < 0, about 4.55% (5/110)items had difficulty index in the range of 0.3–0.7, while others had either too highor low difficulty index. Since an item which half of the students answer correctly(hence difficulty index will be close to 0.5) has the highest possible discriminatingpotential, these are the items which may require scrutiny.
Fig. 14.4 A failure rate of <27–33% is possible only with a trade-off in the value of DsI
14 Transforming Teaching-Learning Culture by Appropriate 165

14.11 Conclusion
It is generally agreed that discriminative index is a good measure of questionquality in item analysis of single best answer MCQ tests in norm-referenced but notin criterion-referenced tests. In a CRT, a low DsI does not necessarily indicate thatthe question is of low quality. It is important to have good DsI value for questionswith DfI in the middle range. But if the difficulty index is very high or very low,indicating that most candidates were or were not able to answer questions correctly,the DsI has little role in determining item quality.
References
“Criterion-referenced tests (CRTs) and norm-referenced tests (NRTs)” in test topics. ProfessionalTesting Inc. 2006. Available at: http://www.proftesting.com/test_topics/test_types_CRT.phpAccessed: 30th May 2016.
Fulcher G., “Excel spreadsheets for classical test analysis”. Available at: http://languagetesting.info/statistics/excel.html Accessed: 11th June 2016.
“Interpreting test results” test scanning services, University of Texas at Austin. Available at:https://learningsciences.utexas.edu/services/test_scanning/results Accessed: 30th May 2016.
Mehrens, W. A., & Lehmann, I. J. (1973) Measurement and evaluation in education andpsychology. New York: Holt, Rinehart and Winston, pp. 333–334.
“Understanding item analyses” Office of Educational Assessment, University of Washington.Available at: http://www.washington.edu/assessment/scanning-scoring/scoring/reports/item-analysis/. Accessed: 30th May 2016.
Fig. 14.5 Distribution ofdiscrimination index values
166 B.S.P. Earnest et al.

Chapter 15Item Difficulty and Discrimination Indexin Single Best Answer MCQ: Endof Semester Examinations at Taylor’sClinical School
Keng Yin Loh, Ihab Elsayed, M.I. Nurjahan and G.S. Roland
Abstract Single best answer (SBA) multiple choice question (MCQ) is a reliableassessment tool used in many medical schools in both undergraduate and post-graduate examinations. However, in order to know the quality of the paper it isrecommended to perform item analysis on the difficulty index and discriminationindex of the SBA MCQ paper. In the Taylor’s Clinical School, SBA MCQs areused as the major tool of assessment for the theory component in the clinical phaseof the medical program. The objective of this paper is to answer two questions:(1) What is the level of difficulty and (2) What is the discrimination index of end ofsemester (EOS) 9 SBA MCQs summative assessment in Taylor’s Clinical School?The EOS 9 papers and their scores were retrieved and analysed using Smart Scancomputer software. The total score of SBA MCQ was 100, and the pass mark was50. In this cohort, the scores of the candidate ranged from lowest being 40 tohighest at 83.3 with the mean score of 66.4. Analysis of difficulty index showed36.7% of the SBA questions had difficulty index (p) above 0.8 which were cate-gorised as easy, 55.5% being optimal (p-value 0.3–0.8) and remaining 8.3% weredifficult (p-value below 0.3). However, for the discrimination index (d), majority(51.7%) of the questions had poor discrimination index (d < 0.2) and negativediscrimination index (10%). This pilot study on item analysis for the EOS 9SBA MCQ papers has demonstrated it is crucial to review the SBA MCQ papersespecially those questions which are shown to have a negative discrimination index.This pilot study enables the clinical teachers to understand better the level ofdifficulty in writing SBA MCQs and identifying factors leading to poor discrimi-nation index as part of the teaching and learning culture.
Keywords Item � Difficulty � Discrimination � Index
K.Y. Loh (&) � I. Elsayed � M.I. Nurjahan � G.S. RolandTaylor’s Clinical School, 19 & 21, Dataran Villa Putra JalanVilla Putra 1, 47000 Sungai Buloh, Selangor, Malaysiae-mail: [email protected]
© Springer Nature Singapore Pte Ltd. 2018S.F. Tang and S.E. Cheah (eds.), Redesigning Learning for GreaterSocial Impact, DOI 10.1007/978-981-10-4223-2_15
167

15.1 Introduction
SBA MCQ is an important assessment tool used in many medical school forundergraduate and postgraduate medical examinations. SBA has been proven tohave high reliability per hour of testing, and broad domains can be tested at highercognitive levels of learning. It is commonly used in many summative examinations,exit examination and recertification examination in the medical field (Schuwirth &Vleutan, 2003).
In Taylor’s Clinical School, SBA is the main tool of assessment for end ofsemester (EOS) summative assessment for the theory component throughout theclinical phase of training in undergraduate medical program. The EOS theory paperis an integrated paper which comprises all the subjects taught within the semester.There are sixty SBA questions in the EOS theory paper. Each SBA comes with ashort clinical scenario and four options of probable answer. One of the options ismost accurate answer, while the other three are the distractors. The candidate isrequired to select only one answer which they consider as the best answer from thefour options provided. Each question correctly answered will be awarded one mark.The marks will be totalled up to produce the final score for the SBA paper. There isno negative marking for SBA paper. Total score is 100, and pass mark is set at 50.
The aim of this paper is to evaluate the level of difficulty and discriminationindex at the end of the semester 9 assessment at Taylor’s Clinical School. EOS 9 ischosen because it has a total of 58 students which is the largest cohort in the clinicalschool. This study focused on the following two research questions: (1) What is thelevel difficulty of EOS 9 SBA questions across various clinical discipline? (2) Arethe SBA questions having acceptable level of discrimination index?
Study approval was granted by the dean and the clinical school program director.The results of this study will not affect the candidates’ performance in any way.
15.2 Methods
The EOS 9 SBA paper and the scores of the candidates were retrieved from theclinical school academic office. The difficulty index is defined as proportion ofcandidates who attempted the questions and answer correctly, commonly denotedas “p”-value. The p-value can range from 0.0 to 1.0; hence, the higher the p-valueindicate the question is easier. On the other hand, the difficult the questions willhave a low p-value.
The discrimination index (d) measures how well an item is able to distinguishcandidates who are upper performers (good) and those lower performers. The upperand lower performers are defined by the upper 27% and the lower 27% of the totalcandidates’ scores arranged according from the highest score to the lowest score inthe overall marks in this examination (Sim & Rasiah, 2006). The range of dis-crimination index is from −1 to 1.0; a value of 0.2 and above is regarded as
168 K.Y. Loh et al.

satisfactory, while a negative value indicates the lower performers did better thanthe upper performers. Item with negative discrimination values is recommended tobe reviewed (Aggarwal, 1986).
The formula to compute item difficulty index (p) and discrimination index (d) isas follows: (Ebal, 1972).
Itemdifficulty index
p ¼ Np
NNp total number of candidates answer correctlyN total number of candidates who take the test
Itemdiscriminatingindex
d ¼ Up�LpU
Up number of candidates in the upper group (27%) whoanswer correctlyLp number of candidates in the lower group (27%) whoanswer correctlyU total number of candidates who take the test
The results of the EOS 9 were tabulated, and both the difficulty index anddiscrimination index were generated by the Smart Scan version 3.1a software.
15.3 Results
There were 58 candidates who sat for the EOS 9 SBA MCQ paper. The total scoreof SBA MCQ was 100, and the pass mark was 50. In this cohort, the scores of thecandidate ranged from lowest 40 to highest of 83.3 with the mean score of 66.4(Table 15.1). Analysis of difficulty index showed 36.7% of the SBA questions haddifficulty index (p) above 0.8 which were categorised as easy, 55.5% being optimal(p-value 0.3–0.8) and remaining 8.3% were difficult (p < 0.3). Comparison acrossall the different subjects tested showed almost similar range of difficulty index(Table 15.2).
The discrimination index of EOS 9 showed only 15% of the SBA questions werein the category of good discrimination index (d > 0.4). More than half of thequestions were in the category of poor discrimination index (d < 0.2). There were10% of the questions with negative discrimination index which need to be reviewed(Table 15.3).
Table 15.1 Central tendencyof EOS 9 SBA MCQ scores
Total number of candidates 58
Mean 66.4
Median 68.3
Mode 70.0
Standard deviation 8.9
Minimum 40.0
Maximum 83.3
15 Item Difficulty and Discrimination Index … 169

15.4 Discussion
The undergraduate medical program (MBBS) at Taylor’s University, Malaysia, isnew, and the first cohort was enrolled in 2010 with only 17 students. The secondcohort being the largest with 58 students is currently in their final year. SBA MCQsremain the major tool of assessment for the theory component in summativeassessment in clinical years; it is therefore crucial to perform item analysis todetermine the difficulty index and discrimination index of these SBA MCQ ques-tions. The analysis will be able to identify the possible weakness in these papers andassist the clinical teacher to review and improve further in the quality of assessmentin clinical phase.
The results of this study had demonstrated 55.5% of the questions had accepteddifficulty index of 0.3–0.8 and only 8.3% were difficult. However, the percentage ofeasy questions was rather high 36.7%. One possible reason for this is because inTaylor’s Clinical School used outcome-based curriculum and the criterion-referenced assessment system is applied. In criterion-referenced assessment, theemphasis is on achieving specific outcome at the end of the learning; therefore,many item tested may give a difficulty index (p-value) above 0.9 or even higher.
Table 15.2 Difficulty index across different clinical subjects in EOS 9 SBA MCQ paper
Difficulty index (p) Number(n)
<0.30 (difficult) 0.30–0.80 (optimal) >0.8 (easy)
Family medicine 11 1 5 5
Ophthalmology 11 1 5 5
Otorhinolaryngology 11 0 7 4
Psychiatry 11 1 5 5
Anaesthesiology 11 2 6 3
Integrated session 5 0 5 0
Total paper 60 5 33 22
Percentage 100% 8.3 55.0 36.7
Table 15.3 Discrimination index across different clinical subjects in EOS 9 SBA MCQ paper
Discrimination index (d) Number(n)
Negative <0.2(poor)
0.2–0.39(marginal)
>0.4(good)
Family medicine 11 3 5 2 1
Ophthalmology 11 0 7 3 1
Otorhinolaryngology 11 0 4 3 4
Psychiatry 11 1 7 3
Anaesthesiology 11 1 7 2 1
Integrated session 5 1 1 1 2
Total paper 60 6 31 14 9
Percentage 100% 10.0 51.7 23.3 15.0
170 K.Y. Loh et al.

The other reason could be the question was set at a level which was appropriate forlower semester. On the other hand, if the difficulty index is very low (<0.3), thisindicates the question is difficult in which the questions may have been constructedat a level higher than the semester’s learning outcome.
The analysis on discrimination index in EOS 9 showed more than half of thequestions belong to poor discrimination. Only 15% were in the category of gooddiscrimination and 23.3% were marginal. The category of marginal and poor dis-crimination index needs to be revised. There were 10% of questions had negativediscrimination index. These questions need to be thoroughly reviewed as possiblereasons reported for negative discrimination were data entry error, ambiguous ormisleading questions. It is usually recommended that questions with negative dis-crimination should be rejected.
15.5 Conclusion
Item analysis for SBA MCQ is crucial to ascertain the level of difficulty at the endof semester summative assessments at Taylor’s Clinical School. In this studyinvolving EOS 9, the SBA MCQ paper was set at the appropriate accepted level ofdifficulty. However, the majority of the questions had poor discrimination index andnegative discrimination index. Further analysis of these questions is necessary inorder to improve the quality of the SBA MCQ paper. This pilot study on itemanalysis of SBA MCQ paper enables the clinical teacher to understand better thelevel of difficulty in writing SBA MCQs and identifying factors leading to poordiscrimination. It is recommended that similar item analysis should be conductedfor all SBA papers in summative assessments at clinical school.
References
Agarwal, Y. P. (1986). Statistical methods, concepts, application and computation. New Delhi:Sterling Publication.
Ebel, R. L. (1972). Essentials of educational measurement (1st ed.). New Jersey: Prentice Hall.Schuwirth, L. W. T., & Van der Vleutan, C. P. M. (2003). ABC of learning and teaching in
medicine: written assessment. BMJ, 326, 643–645.Sim, S. M., & Rasiah, R. I. (2006). Relationship between Item difficulty and discrimination indices
in true false type multiple choice questions of a para-clinical multidisciplinary paper. Annals ofthe Academy of Medicine, Singapore, 35, 67–71.
15 Item Difficulty and Discrimination Index … 171

Chapter 16Types of School, Medium of Instruction,and Students’ Academic Performancein Business Studies at Pre-university
Chin Sok Fun
Abstract Entering different types of schools, each with its own teaching andlearning culture and exposure to a different medium of instruction, may have aneffect on students’ learning experience and, hence, impact their academic success.This study aims to establish the relationship between the types of schools, mediumof instruction, and academic achievements at Pre-university. The data show thatstudents from non-international schools perform better than those who attendedinternational schools at Pre-university. In addition, the results found that studentswhose medium of instruction in school was Malay did not perform as well as thosewho used other languages at Pre-university.
Keywords Background � Pre-university � Business studies
16.1 Introduction
In Malaysia, the government-funded schools offer free education to children of itscitizens, while private schools charge fees for their preschool, primary, and sec-ondary education. In the last few decades, private schools in Malaysia haveemerged as an important source of education at all levels. Dronkers and Avram(2010) suggested that the greatest advantage of private schools is that they are moreindependent and self-sustaining. The Malay Mail online (2014) reported that anincreasing number of middle-class parents are willing to spend up to RM 100,000 ayear to enroll their children in international school to ensure their children areexposed to a rounded educational environment equipped with top-notch facilities;as a result, fees in international schools are expected to rise from 8 to 15% everyyear. Hence, the central question is whether the children who graduate from privateinstitutions outperform those from national schools in their future studies? In viewof the increasing demands of employers, business courses are in demand, and
C.S. Fun (&)Taylor’s College Subang Jaya, Subang Jaya, Malaysiae-mail: [email protected]
© Springer Nature Singapore Pte Ltd. 2018S.F. Tang and S.E. Cheah (eds.), Redesigning Learning for GreaterSocial Impact, DOI 10.1007/978-981-10-4223-2_16
173

Pre-university studies are a popular pathway for post-secondary school students,thus, leading to the main research question this study:
• Is there any relationship between type of schools attended by students and theiracademic performance in business studies at Pre-university level?
One of the main differences between schools in Malaysia is the medium ofinstruction used (Lim, 2013). The Malay language (Bahasa Malaysia) is used as thelanguage of instruction in all national schools, except for Sekolah JenisKebangsaan Cina (national Chinese type) and Sekolah Jenis Kebangsaan Tamil(national Tamil type) schools. In the national Chinese-type schools, MandarinChinese is the main language of instruction while Tamil is used in nationalTamil-type schools. All national secondary schools need to adhere to thenational-level curricula set by the Ministry of Education where the main medium ofinstruction is the Malay language. In international schools, English is the mainlanguage of instruction while in Chinese independent high schools, Mandarin isused as the main medium of instruction. This study attempts to understand whetherthe differences in the language of instruction used in different schools will producedifferent levels of academic performance, and this leads to the secondary researchquestion:
• Is there any relationship between medium of instruction used in different schoolsand the students’ academic performance in business studies at Pre-universitylevel?
16.1.1 Significance of This Study
The school’s social environment has broad influences on students’ learning andgrowth, including major aspects of their social, emotional, and ethical development(Schaps, 2005). Learning environment plays an essential role in shaping the innatepotentials of an individual, and school has always been regarded as an importantfactor (Lawrence & Vimala, 2012). The results of this study, if found significant,will provide useful insights to aid parents in their selection of schools and help tounderstand the impact of the school environment factor on academic achievement.
16.1.2 Literature Review and Hypothesis Testing
According to the Ministry of Education, Malaysian children are required to attendprimary school when they reach seven, and they will take a national exam inPrimary Six before moving on to lower secondary school. Most Malaysian studentswill go to national school except for some upper-class elite, or parents who had
174 C.S. Fun

their education abroad who may choose to send their children to private schools orhome school (Lim, 2013). This means children spend most of their time in school,and hence, the school environment exerts a different influence on performancethrough curricula, teaching techniques and relationships. A conducive learningenvironment is crucial for fruitful learning of the children (Lawrence & Vimala,2012).
Schools may differ in terms of educational facilities which also relate to theacademic success of a student (Hussain et al., 2012). Suleman, Aslam, and Hussain,(2014) examined secondary school students in Pakistan, and they suggest thatsufficient school facilities stimulate academic achievement while unattractive andold school buildings, insufficient teaching staff, overcrowded classrooms etc., willhave negative effects on the academic achievement of the institutions. In Kenya,Korir and Kipkemboi (2014) found that adequate learning facilities alongsidehelpful teachers who provide regular consultation are able to arouse interest in thestudents and encourage them to study hard. In Malaysia, Usaini and Abu Bakar(2015) found that school supported by modern technology such as computers andthe Internet-enriched laboratory and library learning experiences. Crosnoe, Monica,and Glen (2004) found that national or private schools have very different classsizes and sources of funding; private schools tend to have both better funding andsmaller class sizes than national schools. The additional funding for private schoolsleads to better academic performances and more access to resources which help toenhance academic achievement (Eamon, 2005). In Malaysia, most internationalschools which comprise up to 20 students have small class sizes which are ideal foreffective group work and ensure the teacher is able to provide individual attention toevery student (Malaysian Digest, 2015). In the case of national schools with a classsize of up to 50 students, the teacher faces problems in terms of providing personalattention, student acquiring reading skills, and being unable to effectively carry outremedial and enrichment activities (Hashim, 1999). Though previous researchacknowledges conducive learning in private school may enhance student’s aca-demic achievement (Eamon, 2005; Crosnoe et al., 2004), there is no study done tounderstand whether the students who attend private school will also excel atpost-secondary education, which prompts the first hypothesis:
H1: There is a significant relationship between the types of school attended bythe students and their academic performance in business studies at Pre-universitylevel.
Language acquisition correlates with higher academic performance on stan-dardized test measures (Turnbill, Hart, & Lapkin, 2003). Language proficiencyhelps in participating effectively in class discussions, performance, and note-taking,and these facilitate academic development (Chin & Lim, 2014). Malaysia has beenrunning a bilingual system of education since its independence in 1957. English isan important second language alongside the national language, Malay. This systemintends to achieve a balance between national and international needs, throughlanguage educational policies (Gill & Kirkpatrick, 2013). Malaysian children areexposed to six years of primary education and learn the English language as acompulsory subject. When they enter secondary school, English is taught again as a
16 Types of School, Medium of Instruction … 175

core subject before they enroll in a tertiary program. Abe, Ilogu, and Madueke(2014) discovered that, in Nigeria, it is while in the process of learning English thatstudents developed interest, self-motivation, hard work, persistence, and focus, thequalities leading to better academic results. His study is supported by Chin and Lim(2014) who found that in Malaysia, those who achieve better results in their SPMEnglish forecast grades attained better academic results at Pre-university level.However, apart from international schools, most other secondary schools inMalaysia do not use English as the medium of instruction. It would be interesting tounderstand whether using English as a medium of instruction in secondary schoolwill lead to better academic achievement in further studies as there has been a lackof research done in this area, thus, forming the second hypothesis:
H2a: There is a significant positive relationship between practicing English as amedium of instruction in secondary school and academic performance in businessstudies at Pre-university level.
The national language of Malaysia, Bahasa Malaysia, was first officiallyendorsed by the Education Committee Malaysia in 1956; at the same time,Malay-medium schools were endorsed as the national schools and vernacularschools as national-type schools (Malakolunthu & Rengasamy, 2012). According toPuteh (2012), the achievements of Malay-medium of instruction universities(UKM, UTM, and UPM) at post-graduate level are outstanding. Since 1990,thousands of such students have produced Malay language theses in science. TheseMalay scholars have coined much of the terminology used in biology, especially inthe areas of animal and tree research (Puteh, 2013). Nevertheless, there has beenlack of study to understand the impact of adopting this national language asmedium of instruction at secondary school level on the post-secondary academicresults, hence, the results of this study, if found significant, will provide feedback topolicy makers, thus, prompting this hypothesis:
H2b: There is a significant relationship between implementing Malay as amedium of instruction in secondary school and academic performance in businessstudies at Pre-university level.
In Malaysia, the Chinese community has formed a comprehensive system ofeducation with Chinese as a major medium of instruction (Peow, 2013). The cur-riculum for the Chinese language taught in Malaysia suits the local educationpolicy, yet, the pupils’ moral self-cultivation has always stressed that teachingshould be in the Chinese language (Peow, 2013). The learning of the Chineselanguage is very different from other languages like English and Malay as itdemands a deep understanding of characters and phrases that express a full range ofnuances of meaning (Ku, 1998). The different Chinese characters are capableof forming a large number of creative combinations to develop tens of thousands ofexpressive phrases and sayings. Peow (2013) analyzed that Chinese linguisticknowledge is also being focused on in the curriculum and made examinable. TheChinese language learner needs to employ a great deal of effort to keep up with thedemands of their lesson, and this may have a significant positive impact onimproving their ability to learn other subjects which are, presumably, much easierto learn and pick up, hence, forming the hypothesis:
176 C.S. Fun
H2c: There is a significant positive relationship between practicing Chinese as amedium of instruction in secondary school and academic performance in businessstudies at Pre-university level.
16.2 Methodology
There were 127 respondents involved in this study. These were business studentswho enrolled in the 2014 class of a Pre-university program at a private institution.Business students are those enrolled for either Accounting or Economics or both.The respondents who joined the program on the first day of the semester were askedto complete, under supervision, a survey form to record their background, whichincluded type of primary and secondary school(s) attended, and medium ofinstruction used in the school. The results achieved in the Accounting andEconomics subjects in the first semester of the program were collected. The datawere analyzed using the Statistical Package for the Social Sciences (SPSS) since, inthis nonparametric tests, the test of normality is not required (Chin & Lim, 2014).The data are examined using ordered logit regression, a regression model firstconsidered by McCullah (1980) for ordinal dependent variables. In this study, thebusiness students’ academic performance was measured in ordinal data scales(A, B, C or, fail), so the model is very suitable for this study.
16.3 Results and Discussion
At secondary school level, most of the respondents went to national schools (madeup 69% of the sample), followed by international schools (10%) and Chineseindependent schools (5%). In terms of medium of instruction, Chinese Mandarin isthe choice of the largest number at primary school level, comprising 67% ofrespondents, followed by English at 20% and, then, Malay at 13%. However, asthey moved up to secondary school level, English becomes the main medium ofinstruction (47%), followed by Malay (35%) and, lastly, Chinese (18%).
The model fitting information shows sign at 0.015, this means that the data aresignificant as P < 0.05. The Pseudo R-Square shows Nagelkerke at 0.137, indicatedthat the independent variables explained 13.7% of the variation of the dependentvariable. The model fitting information shows that the independent variables,medium of instruction used at secondary school and types of school attended, arefitted in the regression. The results of the regression are reported in Table 16.1.
The ordered regression model indicates that implementing Malay as a medium ofinstruction in secondary school has a significant negative relationship withPre-university-level Accounting or Economics or both, significant at 0.021, hence,H2b is accepted. This study suggests that the Malay language, the main language inteaching and learning in national school, does not help students achieve in
16 Types of School, Medium of Instruction … 177

post-secondary school business studies, thus, rejecting findings by Puteh (2012,2013). Mostafa (2002) explained that bilingualism among Malay students has betterreceptive ability in both the English and Malay languages as compared to theirexpressive ability in the same languages. With respect to second language learning,this indicates that the students’ bilingual ability is more inclined toward “receptivebilingualism”; this means they are able to understand two (i.e., Malay and English)languages but able to express themselves in only one (i.e., Malay) language. In thecase of non-Malay students who need to learn multiple languages (Chinese, Tamil,Malay, and English), the learners may be able to understand a few languages butable to master only one. For example, Ting (2013) found that most Chinese studentswho completed Chinese primary school before proceeding to study in Malay sec-ondary school which uses Malay as its medium of instruction still regard ChineseMandarin as their best spoken language, followed by family dialect and thenEnglish. At Pre-university level, English language proficiency will give anadvantage to students who pursue further studies in courses conducted in English(Abe et al., 2014). Lack of linguistic knowledge can, thus, lead to deficits in theircomprehension performance and, hence, academic performance (Mohd Zin &Rafik-Galea, 2010).
With a significance of 0.439, there is not enough evidence to conclude whetherpracticing Chinese as a medium of instruction in secondary school has an effect onPre-university-level Accounting or Economics or both and therefore, H2c isrejected. The respondents whose medium of instruction is Chinese are mostlyChinese students. In the national secondary or primary school system, students can
Table 16.1 Results of the regression
Estimate Std.error
Wald df Sig. 95%Confidenceinterval
Lowerbound
Threshold:pre-U grade
Fail −3.849 1.316 8.551 1 0.003 −6.428
C −2.494 1.292 3.727 1 0.054 −5.027
B −1.197 1.282 0.872 1 0.35 −3.709
Medium ofinstruction:secondaryschool
Malay −0.897 0.389 5.32 1 0.021 −1.659
Chinese 0.394 0.508 0.6 1 0.439 −0.602
English 0a – – 0 – –
Type ofschools
Nationalschool
0.313 0.492 0.404 1 0.525 −0.652
Internationalschool
−1.938 0.753 6.623 1 0.01 −3.413
Chineseindependenthigh school
−1.158 0.957 1.464 1 0.226 −3.034
178 C.S. Fun

do well by being guided by the teachers and practices in examination questionsbefore the assessment so not much independent learning is needed. As they moveup to Pre-university level, students need to demonstrate perceptive, logical, andcritical interpretation of information to achieve good academic performance in theAccounting and Economics subjects. Li, Chen, and Duanmu (2010) explained thatsome Chinese students tend to be very passive in group discussions or debates inclass and do not like to raise or answer questions. In addition, the deficiencies in theEnglish language become an obstacle when they need to comprehend learningmaterials written in English at Pre-university level. Even though previous research(Ku, 1998; Peow, 2013) reports that Chinese students first need to endure thehardship of learning Chinese (see Ku, 1998), nevertheless, this painful experiencemay not have helped them to perform well at Pre-university level.
Besides, there being no conclusive evidence that using English as a medium ofinstruction in secondary school has an effect on Pre-university-level Accounting orEconomics or both, thus, rejecting H2a, it does not support Chin and Lim (2014),Abe et al. (2014). Most Malaysians learn English as their second or third language,and language anxiety is a feature associated with learning this foreign language(Tran, 2012). Darmi and Albion (2014) have explained that learners who feelpositive throughout the language learning process will participate actively in theclassroom and be engaged in the learning activities. This, as a result, leads to betterachievement in language learning and successful language acquisition. In contrast,learners who have a negative attitude toward learning the target language are proneto be uneasy, suffer from self-doubt, frustration, and worry, resulting in poor per-formance in language learning. Kamarulzaman, Ibrahim, Yunus, and Mohd Ishak(2013) found that, in Malaysia, even the gifted learners have a certain level oflanguage anxiety in an English language setting; this language anxiety negativelycorrelates with gifted learners’ English language performance. Inappropriate ped-agogical approach or unsuitable English language environment in Malaysia canhave a devastating effect on anxiety in their achievement (Kamarulzaman et al.,2013). The lack of language proficiency means students do not have the funda-mental skills needed to participate effectively in class discussions and performnote-taking two important skills that facilitate academic development (Chin & Lim,2014).
Students who graduate from international schools show significant negativerelationship with Pre-university-level Accounting or Economics or both, thus,resulting in an acceptance of H1. However, there is insufficient evidence to provethat graduating from national schools (significance of 0.525) or graduating fromChinese independent schools (significance of 0.226) has any impact onPre-university-level Accounting or Economics or both. Hence, the results supportfindings by Usaini and Abu Bakar (2015) and Hussain et al. (2012) but do notcorroborate findings by Eamon (2005) and Crosnoe et al. (2004).
The Malay Mail Online (2014) reported that many parents are paying up to RM100,000 each year (or RM 8333 each month) to send their children to internationalschools. The Department of Statistics, Malaysia, has calculated that the Malaysianhouseholds’ mean income is RM 6141 in 2014. Those parents who can afford to
16 Types of School, Medium of Instruction … 179
send their children to international schools are presumed to be from high-incomegroup. These parents feel that their children who have been to international schoolstend to have more well-rounded personalities and exposure to the world, although achild’s personality may have been shaped not only within the school’s environmentbut through friends, their home surroundings, and other external factors (MalaysianDigest, 2015). For example, as much as it is believed that the excellent cognitivedevelopment of children can be formed by a stimulating home environment (Fucci& Cavaletto, 2012; Gibbons, 2009), family culture is also able to influence chil-dren’s academic achievement (Fucci & Cavaletto, 2012; Wang & Degol, 2013).
Compared to those from rich and affluent family background, Williams (2010)explained, middle-class parents tend to be more involved in their children’s edu-cation, for example, by way of reading to their children or attending meetings withteachers. Such parents’ attitude helps middle-class children achieve good academicresults. Parent involvement is important for children’s learning, attitudes aboutschool, and future goals (Timkey, 2015). Kim (2009) found that the provision ofliteracy experiences within the home (i.e., home reading and parent teaching) byparents was related to children’s achievement in literacy skills at the end of thestudy. Okado, Bierman, and Welsh (2014) found that even students fromlow-income families with low literacy skills are more ready to learn if their parentshave a positive attitude and behavior related to learning activities, and the frequencyof parent–child conversation at home is high. This study suggests that withoutparents’ positive beliefs, attitudes, involvement in literacy learning and other fac-tors, sending the children to international schools with good physical environmentmay not guarantee good academic performance.
Students graduating from national schools exhibit no significant effects onacademic performance at Pre-university-level Accounting or Economics or both.Thien and Ong (2015) explained that Malaysian students who study in nationalschools undergo higher levels of anxiety compared to their peers in neighboringcountries like Singapore. For example, since 2002, Malaysian governance hasrequired national schools to use the English language in the teaching of mathe-matics and science, but the medium of instruction was changed back to the Malaylanguage in 2012. This language change caused mathematics anxiety among thestudents, as shown in the declining performance in both subjects in the Trends inInternational Mathematics and Science Study (TIMSS) 2011. In addition, Malaysiaalso experiences low achievement in international assessments. The Programme forInternational Student Assessment (PISA 2012) which measures 15-year-old stu-dents’ mathematics, science and reading literacy reported that Malaysian studentsscored below the Organisation for Economic Co-operation and Development(OECD) average. Among the 65 countries who participated, Malaysian studentsranked 52. Besides, Malaysian students were found to have lower levels of math-ematics self-efficacy and have higher levels of mathematics anxiety than the OECDaverage. The theoretical complexity and problem-solving demands of mathematicsrequire rational, interpretative, and strategic skills of students (Schaap & Luwes,2013), but Malaysian students from national schools with low achievement inmathematics may not have acquired the requisite rational, interpretative, and
180 C.S. Fun

strategic skills to help them achieve high academic performance at Pre-universitylevel.
At significance value of 0.226, there is inadequate evidence to show thatgraduating from Chinese independent high schools has had an impact on theirperformance at Pre-university-level Accounting or Economics or both. Accordingto the United Chinese School Committees Association of Malaysia (UCSCAM), inMalaysia, such high schools provide secondary education in the Chinese languageas a continuation of the primary education in Chinese national-type primaryschools. The medium of instruction in these schools is Mandarin with simplifiedChinese—character writing. Students need to sit for Unified ExaminationCertificate (UEC) which is available at three levels: Junior Middle, Vocational, andSenior Middle. Examinations for non-language subjects in the UEC Junior Middleand Vocational are in Chinese. Since the UEC is not recognized by the Malaysiangovernment for entry into tertiary courses, in order to provide opportunities for thestudents to get government-recognized certificates, some Chinese independent highschools also teach the national secondary school curriculum (in Malay) togetherwith the independent school curriculum (in Chinese) and require students to sit forthe government standardized tests (PMR, SPM, or even STPM) as private schoolcandidates. To complete that syllabus and prepare for the UEC and governmentstandardized tests, students are burdened with a lot of homework and also the needto attend lesson for extra-long hours. In Malaysia, homework assigned to students isconcerned more with assessing their knowledge and understanding, rather thanhigher-order thinking skills and creativity (Chew, Teong, & Ishak, 2012). Excessivehomework can have a detrimental effect on students as they devote less time to playand relax (Entin, 2011), resulting in frustration and exhaustion (Kohn, 2007),possible loss of interest in learning (Kohn, 2007), and even a negative impact on therelationship between students and their parents at home (Kohn, 2007). As a result,the students from Chinese schools do not necessarily outperform all others inexaminations. This is proven in a study by Chew (2012) who compared the overallliteracy rate among Malaysian secondary school students. The researcher found thatthe mean scores of Malay students at the basic and critical levels were higher thanthe mean scores of Chinese students. Chinese students are burdened with excessivehomework, long lesson time, and being passive in class discussions (Li et al.,2010), and thus, they may not possess perceptive, logical, and critical interpretativeskills to cope well at Pre-university-level Accounting or Economics.
16.4 Conclusion
The purpose of this study is to establish the relationship between types of school,medium of instruction, and academic performance of business studies students atPre-university. From the analysis, students who use Malay as the medium ofinstruction perform worse than their peers in Pre-university Accounting orEconomics or both. Since Pre-university-level Accounting or Economics students
16 Types of School, Medium of Instruction … 181

need to communicate effectively in the English language, most Malay languagelearners in Malaysia are either learning English as their second or third language,and lacking in linguistics knowledge, hence, they are weak in comprehensionperformance and overall academic performance (Mohd Zin & Rafik-Galea, 2010).This prompts the need for researchers, policy makers, educators, and languageteachers to look into ways to design effective syllabi and assessment criteria toimprove students’ linguistic knowledge. Also, this study shows that studentsattending international schools do not necessarily achieve good results atPre-university Accounting or Economics or both. Parents sending the children tointernational schools may need to consider other factors such as positive self-belief,attitude, and their involvement in literacy learning to contribute to their children’sgood academic performance.
References
Abe, I., Ilogu, G., & Madueke, I. (2014). Effects of goal-setting skills on students’ academicperformance in English language in Enugu Nigeria. Journal of New Approaches inEducational Research (July), 3(2), 93–99, 7p. doi:10.7821/naer.3.2.93-99
Chew, F. P., Teong, M. H., & Ishak, Z. (2012). School homework and its relationship with studentacademic achievement in Malaysia. World Academy of Science. Engineering and TechnologyInternational Journal of Social, Behavioral, Educational, Economic, Business and IndustrialEngineering, 6(5).
Chew, F. P. (2012). Literacy among the secondary schools students in Malaysia. InternationalJournal of Social Science and Humanity, 2(6).
Chin, S. F., & Lim, O. W. (2014). The relationship between students’ Malaysian certificate ofeducation forecast results and academic performance in business studies at pre-university. InTaylor’s 7th Teaching and Learning Conference 2014 Proceedings (pp. 565–574). Springer.
Crosnoe, R., Monica, K., & Glen, H. (2004). School size and the interpersonal side of education:an examination of race/ethnicity and organizational context. Social sciences Quarterly, 85(5),1259–1274.
Darmi, R., & Albion, P. (2014). Assessing the language anxiety of Malaysian undergraduateEnglish language learners. In Proceeding of the Global Conference On Language Practice &Information Technology (GLIT 2014) (e-ISBN 978-967-11768-6-3) (9–10 June),WorldConferences.net.
Dronkers, J., & Avram, S. (2010). Social class dimensions in the selection of a private school: Across-national analysis using PISA. Educational Research and Evaluation, pp. 4–5.
Eamon, M. K. (2005). Socio-demographic, school, neighbourhood, and parenting influence onacademic achievement of Latino young adolescent. Journal of youth and adolescents, 34(20),163–175.
Entin, E. (2011). All work and no play: Why your kids are more anxious, depressed. The Atlantic.Fucci, S., & Cavaletto, G. M. (2012). Educational choices of the elites. autonomy and
responsibility of italian and foreign children between family and school. Procedia—Social andBehavioral Sciences, 46, 4990–4994. doi:10.1016/j.sbspro.2012.06.373
Gibbons, S. (2009). CEE DP 101 access, choice and participation in higher education annavignoles (January).
Gill, S. K., & Kirkpatrick, A. (2013). English in Asian and European higher education. In C.A. Chapelle (Eds.), The encyclopedian of applied linguistics. Blackwell Publishing Ltd.
182 C.S. Fun

Hussain, I., Ahmad, M., Ahmad, S., Suleman, Q., Din, M. Q., & Khalid, N. (2012). A study toinvestigate the availability of educational facilities at secondary school level in District Karak.Language in India, Strength for Today and Bright Hope for Tomorrow, India, 12(10), 234–250.
Hashim, N. (1999). Teachers’ responses to class size at the primary level in Malaysia. Journal ofEducators and Education, 16, 1998/1999.
Kamarulzaman, M. H., Ibrahim, N., Yunus,M. M., & Mohd Ishak, N. (2013). Language anxietyamong gifted learners in Malaysia. English Language Teaching, 6(3), ISSN 1916-4742 E-ISSN1916-4750. Canadian Center of Science and Education.
Kim, Y. (2009). The relationship between home literacy practices and developmental trajectoriesof emergent literacy and conventional literacy skills for Korean children. Reading and Writing,22(1), 57–84.
Kohn, A. (2007). Rethinking homework. Rethinking Homework. Retrieved February 8, 2014, fromhttp://www.alfiekohn.org/teaching/rethink
Korir, D. K., & Kipkemboi, F. (2014). The impact of school environment and peer influences onstudents’ academic performance in vihiga county, Kenya. International Journal of Humanitiesand Social Science, 4(1), March.
Ku, H. M. (1998). The spirit of the Chinese people. Beijing: Foreign Language Teaching andResearch Press.
Lawrence, A., & Vimala, A. (2012). School environment and academic achievement of standardsix students. Journal of Educational and Instructional Studies in the World (August), 2(3),Article: 22 ISSN: 2146-7463.
Lim, T. D. (2013). Analyzing Malaysian English classrooms: Reading, writing, speaking andlistening teaching strategies (Master thesis). University of Washington. Retrieved 1/4/2016from https://digital.lib.washington.edu/researchworks/bitstream/handle/1773/25020/Lim_washington_0250O_12452.pdf
Li, G., Chen, W., & Duanmu, J. (2010). Determinants of international students’ academicperformance: A comparison between Chinese and other international students. Journal ofStudies in International Education, 14(4), 389–405. doi:10.1177/1028315309331490
Malakolunthu, S., & Rengasamy, N. (2012). Education policies and practices to address culturaldiversity in Malaysia: Issues and challenges. Prospects, 42(2), 147–159. doi:10.1007/s11125-012-9227-9
Malaysian Digest. (2015). Malaysian parents choose international schools over national schoolsthese days—What are the advantages? Retrieved 9/4/2016 from http://www.malaysiandigest.com/opinion/554189-malaysian-parents-choose-international-schools-over-national-schools-these-days-what-are-the-advantages.html
McCullagh, P. (1980). Regression models for ordinal data. Journal of the Royal Statistical Society.Series B (Methodological) 42(2), 109–142. JSTOR 2984952.
Mohd Zin, Z., & Rafik-Galea, S. (2010). Anxiety and academic reading performance amongMalay ESL learners. Journal of PanPacific Association of Applied Linguistics, 14(2), 41–58.
Mostafa, M. A. (2002). Bilingualism and the academic achievement of Malay students.International Conference IPBA 24–26 (September). Retrieved from http://citeseerx.ist.psu.edu/viewdoc/download?doi=10.1.1.581.132&rep=rep1&type=pdf
Okado, Y., Bierman, K., & Welsh, J. (2014). Promoting school readiness in the context ofsocioeconomic adversity: associations with parental demoralization and support for learning.Child & Youth Care Forum, 43(3), 353–371.
Peow, S. H. (2013). The teaching of Chinese language in Malaysian Chinese primaryschools”subtle changes in content and objectives (December 27). Malaysian Journal ofChinese Studies, 2.
Puteh, A. (2012). Medium of instruction policy in Malaysia: the fishman’s model. EuropeanJournal of Business and Social Sciences, 1(1), 11–22 (April 2012). URL: http://www.ejbss.com/recent.aspx. ISSN: 2235-767X.
16 Types of School, Medium of Instruction … 183

Puteh, A. (2013). Maintaining the medium of instruction policy in Malaysia: The case for bahasaMalaysia. Global Journal of Human Social Science Linguistics & Education. 13(11), Version1.0. Online ISSN: 2249-460x & Print ISSN: 0975-587X.
Schaap, P., & Luwes, M. (2013). Learning potential and academic literacy tests as predictors ofacademic performance for engineering students. Acta Academica, 45(3), 181–214.
Schaps, E. (2005). The role of supportive school environments in promoting academic success.Getting Results, Developing Safe and Healthy Kids Update 5: Student Health, SupportiveSchools, and Academic Success, Chapter 3.
Suleman, Q., Aslam, H. D., & Hussain, I. (2014). Effects of classroom physical environment onthe academic achievement scores of secondary school students in kohat division, Pakistan.International Journal of Learning & Development, 4(1), ISSN 2164-4063 2014.
Thien, L. M., & Ong, M. Y. (2015). Malaysian and Singaporean students’ affective characteristicsand mathematics performance: evidence from PISA 2012. SpringerPlus, 4, 563. doi:10.1186/s40064-015-1358-z
Timkey, S. (2015). The influence of parent attitudes and involvement on children’s literacyachievement. Education and Human Development (Master’s Theses). Paper 562. The Collegeat Brockport: State University of New York.
Ting, M. H. (2013). Language, identity and mobility: Perspective of Malaysian Chinese youth.Malaysian Journal of Chinese Studies, 2(1), 83–102.
Tran, T. T. T. (2012). A review of horwitz, horwitz and cope’s theory of foreign language anxietyand the challenges to the theory. English Language Teaching, 5(1), 69–75.
Turnbill, M., Hart, D., & Lapkin, S. (2003). Grade 6 French immersion students’ performance onlarge-scale reading, writing, and mathematics tests: Building explanations. Alberta Journal ofEducational Research, 49(1), 6–23.
Usaini, M. I., & Abu Bakar, N. (2015). The influence of school environment on academicperformance or secondary school students in Kuala Terengganu, Malaysia. In Proceedings ofICIC2015—International Conference on Empowering Islamic Civilization in the 21st Centurye-ISBN: 978-967-13705-0-6.6-7 September—Universiti Sultan Zainal Abidin, Malaysia.
Wang, M. T., & Degol, J. (2013). Motivational pathways to STEM career choices: Usingexpectancy-value perspective to understand individual and gender differences in STEM fields.Developmental Review: DR, 33(4), 304–340. doi:10.1016/j.dr.2013.08.001
Williams, R. (2010). Middle-class children do better at school because of parents. The guardian,Retrieved 29/4/2016 from http://www.theguardian.com/education/2010/oct/29/middle-class-children-better-school
184 C.S. Fun
Chapter 17Rasch Model Approach to Analyze Qualityof Preservice Teachers’ Teaching Behaviorto Pedagogy Content Knowledge
Rayendra Wahyu Bachtiar
Abstract Pedagogy content knowledge (PCK) skills of preservice teacher play amajor role in academic career. To date, commonly an institution program forenhancing PCK of preservice teachers is conducted as the course program calledTeaching Practice Learning (PPL). Academic achievement of its program showsthat preservice teachers got a good value. Nevertheless, few studies are able to showhow PCK skills can be constructed by teaching behavior. The present study pur-poses to analyze how teaching behavior of the preservice teachers conductingteaching practice can construct their PCK ability. Rasch approach was used topredict the construction. The theoretical framework of PCK is based on Shulmantheory and empirical studies of effective teaching. Besides, teaching behavior wasadopted from previous research (Grift, 2007; Maulana & Helms-Lorenz, 2016). Theresult revealed that teaching behavior in the authentic environment can affect forPCK skills. Furthermore, there was a different issue of the pedagogy skills con-structed by the behavior of stimulating environment among others. So, the futureresearch suggestion in educational issues was discussed.
Keywords Pedagogic Content Knowledge � Preservice teacher � Teachingbehavior � Rasch model
17.1 Introduction
Developing teacher competence quality has been the primary focus of educationalpolicy across many parts of the world in the last decade (Birenbaum et al., 2015;DeLuca, LaPointe-McEwan, & Luhanga, 2015). The educational policy of teacherscompetency was made to accommodate the legality of the work program. At thesame time, the researchers focusing educational research have shown the results oftheir study which can describe the condition of the ability of teachers (Cheng, 2014;
R.W. Bachtiar (&)Jember University, Jember, Indonesiae-mail: [email protected]
© Springer Nature Singapore Pte Ltd. 2018S.F. Tang and S.E. Cheah (eds.), Redesigning Learning for GreaterSocial Impact, DOI 10.1007/978-981-10-4223-2_17
185

Jiang, Ma, & Gao, 2016; Nevgi & Löfström, 2015; Tang, Wong, & Cheng, 2016).However, very few researchers were able to reveal that the quality of teacher skillsis caused by the sustainability educational policy.
The focus of researchers in the field of education was on the study of learningdesign proposals considered in accordance with the conditions of students (Daniels,Poth, Papile, & Hutchison, 2014; Tang et al., 2016; Taşoğlu & Bakaç, 2014).Results of these study showed that a few instructional designs were appropriatewith the content of teaching materials. Moreover, there have been yet study donein-depth study analyses to the quality of teaching teachers on implementing thelearning in the classroom, which is why the improvement of curriculum policy onlyfocuses on modification in the administrative structure.
Behavior of teachers in teaching is the main indicator that can be used as apicture of the quality of learning in the classroom. The study showed that theteaching behavior is the main predictor of the student’s learning outcomes includingmotivation, learning outcomes, and the involvement of student learning(Nemeržitski, Loogma, Heinla, & Eisenschmidt, 2013; Vries, Jansen, Helms-Lorenz, & Grift, 2015). An activity of teachers’ teaching is known as an effectivefactor in improving the quality of teaching (Arsal, 2014; Nivalainen, Asikainen, &Hirvonen, 2013). Thus, the behavior of teachers in teaching plays an important rolein deciding upon the success of students’ learning.
Pedagogical competence can be used to indicate the quality of teachers in thelearning activity (Alonzo, Kobarg, & Seidel, 2012; Aydeniz & Kirbulut, 2014); inthis case, it is the quality of teachers’ teaching behavior. Pedagogic skills are amajor component needed by teachers implementing the learning in the classroom.The indication of teachers having its abilities was ability of teacher constructinglearning materials in line with the characteristics of students (Aydeniz & Kirbulut,2014). In consequence, if the teacher is able to design learning strategies appro-priate to the content of teaching materials, then the teaching behavior are qualifiedteachers.
The study on the teachers pedagogical competence has still focused on the studyhow teachers’ design learning is (Aydeniz & Kirbulut, 2014; Khakbaz, 2016;Leader-Janssen & Rankin-Erickson, 2013; Oh & Kim, 2013). In fact, besides itscompetence, one of the important skills required for teachers is the teaching abilityto reflect their learning that has been done. The finding of self-evaluation will beable to observe the successful or unsuccessful learning (Alonzo et al., 2012;Aydeniz & Kirbulut, 2014). Thus, the sustainability of the improvement learningprocess can keep up based on own observation. Consequently, the teachers’teaching behavior must be measured in order to be necessary to reflect the quality ofteachers’ pedagogical skills of teachers in terms of designing, implementing, andreflecting learning.
A number of studies identifying the teachers’ abilities were performed with theclassical analytical approach or classical test theory (CTT) (Hegde & Meera, 2012;Mandeville & Stoner, 2015; Ryu & Sandoval, 2015). Although CTT can provideinformation about the abilities of teachers, the approach has some drawbacks.Moreover, if the results of the analysis of the approach are used for the assessment
186 R.W. Bachtiar

for learning, it will be problematic in certain circumstances. A number of studiesprovide the CTT critics about the limitations of validity and reliability (Jong, Royal,Hodges, & Welder, 2015; Kubinger, Rasch, & Yanagida, 2011; Scott &Schumayer, 2015). So that the analysis in this study using item response theoryapproach is Rasch model.
17.2 Research Methodology
This study was employed as mixed method design. Qualitative data is obtained todetermine teachers’ activities. Then, this data was analyzed by Countenance Stake[Stake, 1977 in (Wood, 2001)] to show the construction of the pedagogy skill ofteachers. Rasch model is used to examine teachers’ teaching behavior. The result ofRasch model analysis will be able to capture pedagogical content knowledge ofteacher.
The participants in this study were 10 teachers conducting to practice teachingcourse in school. Five teachers firstly practiced in junior high school, and otherswere on senior high school. The present study was conducted for 3 months. Everyend of the week, the data was obtained such as lesson plan, activity of learning, andresult of reflection. The end of every week on every month, teaching behavior isacquired.
The teachers’ teaching behavior was measured using the observation instrumentdeveloped by the International Comparative Analysis of Learning and Teaching(ICALT) (Grift, 2007; Maulana & Helms-Lorenz, 2016). The instrument consists of29 items, such as (1) safe and stimulating learning (SL), (2) classroom management(CM), (3) clear instruction (CI), (4) activating learning (AL), (5) adaptation ofteaching (AT), and (6) learning strategies (LS).
17.3 Result and Discussion
Table 17.1 states that item reliability is very high (0.97), adequate high reliability ofperson (0.87), and Cronbach’s alpha (0.89). Overall, that data appropriates theRasch model. According to Table 17.1, we concluded that the item task appro-priates with person (student) who has medium ability.
Figure 17.1 states the summary of person and item. There are 4 teachers whohave the best ability of teaching behavior (i.e., F01, F08, F10, and F12). It indicates
Table 17.1 Summarystatistic
No Description of reliability Score of Rasch analysis
1 Person 0.87
2 Item 0.97
3 Cronbach’s alpha 0.89
17 Rasch Model Approach to Analyze Quality of Preservice … 187

that teachers have strong pedagogy content knowledge skill. In contrast, there are 2teachers who have lowest teaching behavior ability. That teacher had good contentknowledge, but pedagogical knowledge was very low. They were not able toconstruct the comfortably learning environment for their students.
Figure 17.2 states that there are many teachers having the same ability.Nevertheless, there are few students having negative ability. Finding of misfit-orderperson stated that 7 teachers were not fit. The large outfit can be caused by carelessmistakes or lucky guessing of a small number of participants. Only 3 teachers werefit of measured Fig. 17.3.
Countenance analysis is used for the teaching behavior of teachers. Table 17.2presents the matrix congruence analysis.
Based on the data, Table 17.2 reveals that the teaching behavior of teacher is stilllow. It means that the teacher had minimum skill of pedagogic knowledge. Itappears when the teacher prepared the lesson plan. The result of analyzing thelesson plan states that the aims of learning did not appropriate with learningactivity. Furthermore, the process of learning had been disorganized. Some researchalso showed similar results, and the quality of learning process is caused by thelesson plan which is well prepared (Alonzo et al., 2012). Although teacher has agood knowledge mastering content, he still needs to know about knowledge ofteaching (Aydeniz & Kirbulut, 2014).
The results of the transactions analysis showed that most teachers have theability to manage learning in the classroom. This is shown in Table 17.2 that theteacher is able to manage time (CI), invites students to engage actively in class
Fig. 17.1 Information function of the item (CPS)
188 R.W. Bachtiar

(AL), and is able to explain clearly the learning materials. This suggests that thepedagogical skills of teachers can be formed when the teacher can manage learningmaterials in accordance with the state of the class (Alonzo et al., 2012;Leader-Janssen & Rankin-Erickson, 2013). Nonetheless, there is still little lowerability of teachers in terms of the ability to stimulate students to solve complexproblems (LS). Teachers still often provided the solution directly when students arenot able to solve their complex problems. Previous research suggests that thedeveloping students’ problem-solving skills required teachers’ guiding (Aydeniz &Kirbulut, 2014; Khakbaz, 2016). Furthermore, the students will be used to solve theproblem by their ability when he faced with another problem situation (Stadler,Becker, Greiff, & Spinath, 2016; Toplak, West, & Stanovich, 2014).
Transaction analysis results show that most teachers did not have the ability toself-evaluation. The learning process, teachers had not been able to stimulate thestudents to use the ability initiation in troubleshooting solutions (CI). Likewise,when the students discovered a complex issue, students is always reliance by theproblem solution from teacher. At the final stage of the learning cycle, researchersand participants (teachers) conducted a self-evaluation about cause of weakness ofproblem-solving abilities. Teachers had trouble to explain cause of the problem. Inthe process of learning, the teacher was able to see why it could be happen. Thisindicates that the ability of the teacher’s pedagogical aspects in metacognition islow. The past studies showed that teachers must have pedagogical metacognitionability to make qualified learning planning (Jiang et al., 2016). In addition, theability of the teachers to analyze the ongoing problems in the classroom is requiredto be owned (Davidowitz & Potgieter, 2016; Karal & Alev, 2016; Oh & Kim,2013). It is often found that teachers do not have the awareness of students having aproblem actually. Consequently, It is necessary to conduct further research inseeing how the teachers’ consciousness responds the problems of students, andfurther research will be termed as a pedagogical awareness.
Fig. 17.2 CPS student histogram
17 Rasch Model Approach to Analyze Quality of Preservice … 189

17.4 Conclusion and Future Study
Based on the findings, it can be concluded that the teachers’ teaching behavior hasbeen able to demonstrate the quality of pedagogical content knowledge skill sig-nificantly. Nevertheless, increasing skills in terms of constructing students’ ownproblem solving need to study anymore. In addition, further research needs to bedone about the awareness of teachers in response to the problems faced by studentsduring the learning process. Likewise, the development of skills is necessary tostudy of pedagogical awareness.
Table 17.2 Congruence analysis
Description matrix Judgment Matrix
Items Observation Standard Judgment
AntecedentTeacher in groupsplanning to resolvethe problems thathave been granted
Observation resultsshow there are 4teachers having theability average inSL CM, CI, and LS.In addition, 6 teachersof CI, AL, and AT gotthe average value of 3
Teaching behavioron pedagogic contentknowledge
Most of the teachershave the skills ofteaching behavior onelements of clearinstruction. However,an element of CMand AI was still low.It showed that theteachers still need toimprove theirlearning activity
TransactionTeacher in groupsimplements to adaptto theproblem-solvingprocess that has beenplanned
Observations showthat there are 6teachers havingenough ability of CI.While the average ALhas an average valueof 3
Teaching behavioron pedagogic contentknowledge
Most of the teachersstill reached theteaching behavior onbelow of average. Inaddition, theobservation showedthat most of theteachers having ALare below average
OutcomesTeachers can solvethe problems given inthe learning
Only 3 teachers aresuccessfully solvedthe problem, while theresults of theobservation on LS gotthe average value of 4
The whole group cansolve the problemsaccording to theindicator results forall teaching behaviorof 3
Most of the teachersstill have lowteaching behavior,especially LS so thatthe results ofstudents’achievement cannotbe optimal and mostof them cannot becompleted on timealthough theobservation revealedgenerally positivemotivation of teacheron SL
17 Rasch Model Approach to Analyze Quality of Preservice … 191

Acknowledgements I thank Department of Preservice Teacher Training, FKIP, JemberUniversity for facilitating my study in school. I am also thankful to teacher as observer.
References
Alonzo, A. C., Kobarg, M., & Seidel, T. (2012). Pedagogical content knowledge as reflected inteacher–student interactions: analysis of two video cases. Journal of Research in ScienceTeaching, 49(10), 1211–1239. doi:10.1002/tea.21055
Arsal, Z. (2014). Microteaching and pre-service teachers’ sense of self-efficacy in teaching.European Journal of Teacher Education, 37(4), 453–464. doi:10.1080/02619768.2014.912627
Aydeniz, M., & Kirbulut, Z. D. (2014). Exploring challenges of assessing pre-service scienceteachers’ pedagogical content knowledge (PCK). Asia-Pacific Journal of Teacher Education,42(2), 147–166. doi:10.1080/1359866X.2014.890696
Birenbaum, M., DeLuca, C., Earl, L., Heritage, M., Klenowski, V., Looney, A., … Wyatt-Smith,C. (2015). International trends in the implementation of assessment for learning: implicationsfor policy and practice. Policy Futures in Education, 13(1), 117–140.
Cheng, E. C. K. (2014). Learning study: nurturing the instructional design and teachingcompetency of pre-service teachers. Asia-Pacific Journal of Teacher Education, 42(1), 51–66.doi:10.1080/1359866X.2013.869546
Daniels, L. M., Poth, C., Papile, C., & Hutchison, M. (2014). Validating the conceptions ofassessment-III scale in Canadian preservice teachers. Educational Assessment, 19(2), 139–158.doi:10.1080/10627197.2014.903654
Davidowitz, B., & Potgieter, M. (2016). Use of the Rasch measurement model to explore therelationship between content knowledge and topic-specific pedagogical content knowledge fororganic chemistry. International Journal of Science Education, 38(9), 1483–1503. doi:10.1080/09500693.2016.1196843
DeLuca, C., LaPointe-McEwan, D., & Luhanga, U. (2015). Teacher assessment literacy: a reviewof international standards and measures. Educational Assessment, Evaluation andAccountability, 1–22. doi:10.1007/s11092-015-9233-6
de Vries, S., Jansen, E. P. W. A., Helms-Lorenz, M., & van de Grift, W. J. C. M. (2015). Studentteachers’ participation in learning activities and effective teaching behaviours. EuropeanJournal of Teacher Education, 38(4), 460–483. doi:10.1080/02619768.2015.1061990
Hegde, B., & Meera, B. N. (2012). How do they solve it? An insight into the learner’s approach tothe mechanism of physics problem solving. Physical Review Special Topics—PhysicsEducation Research, 8(1). doi:10.1103/PhysRevSTPER.8.010109
Jiang, Y., Ma, L., & Gao, L. (2016). Assessing teachers’ metacognition in teaching: the teachermetacognition inventory. Teaching and Teacher Education, 59, 403–413. doi:10.1016/j.tate.2016.07.014
Jong, C., Royal, K. D., Hodges, T. E., & Welder, R. M. (2015). Instruments to measure elementarypreservice teachers’ conceptions: an application of the Rasch rating scale model. EducationalResearch Quarterly, 39(1), 21–48.
Karal, I. S., & Alev, N. (2016). Development of pre-service physics teachers’ pedagogical contentknowledge (PCK) throughout their initial training. Teacher Development, 20(2), 162–180.doi:10.1080/13664530.2015.1124138
Khakbaz, A. (2016). Mathematics university teachers’ perception of pedagogical contentknowledge (PCK). International Journal of Mathematical Education in Science andTechnology, 47(2), 185–196. doi:10.1080/0020739X.2015.1065453
Kubinger, K. D., Rasch, D., & Yanagida, T. (2011). A new approach for testing the Rasch model.Educational Research and Evaluation, 17(5), 321–333. doi:10.1080/13803611.2011.630529
192 R.W. Bachtiar

Leader-Janssen, E. M., & Rankin-Erickson, J. L. (2013). Preservice teachers’ content knowledgeand self-efficacy for teaching reading. Literacy Research and Instruction, 52(3), 204–229.doi:10.1080/19388071.2013.781253
Mandeville, D., & Stoner, M. (2015). Assessing the effect of problem-based learning onundergraduate student learning in biomechanics. Journal of College Science Teaching, 45(1),66–75.
Maulana, R., & Helms-Lorenz, M. (2016). Observations and student perceptions of the quality ofpreservice teachers’ teaching behaviour: construct representation and predictive quality.Learning Environments Research, 1–23. doi:10.1007/s10984-016-9215-8
Nemeržitski, S., Loogma, K., Heinla, E., & Eisenschmidt, E. (2013). Constructing model ofteachers’ innovative behaviour in school environment. Teachers and Teaching, 19(4), 398–418. doi:10.1080/13540602.2013.770230
Nevgi, A., & Löfström, E. (2015). The development of academics’ teacher identity: enhancingreflection and task perception through a university teacher development programme. Studies inEducational Evaluation, 46, 53–60. doi:10.1016/j.stueduc.2015.01.003
Nivalainen, V., Asikainen, M. A., & Hirvonen, P. E. (2013). Preservice teachers’ objectives andtheir experience of practical work. Physical Review Special Topics—Physics EducationResearch, 9(1), 10102. doi:10.1103/PhysRevSTPER.9.010102
Oh, P. S., & Kim, K. S. (2013). Pedagogical transformations of science content knowledge inkorean elementary classrooms. International Journal of Science Education, 35(9), 1590–1624.doi:10.1080/09500693.2012.719246
Ryu, S., & Sandoval, W. (2015). The influence of group dynamics on collaborative scientificargumentation. doi:10.12973/eurasia.2015.1338a
Scott, T. F., & Schumayer, D. (2015). Students’ proficiency scores within multitrait item responsetheory. Physical Review Special Topics—Physics Education Research, 11(2), 20134. doi:10.1103/PhysRevSTPER.11.020134
Stadler, M. J., Becker, N., Greiff, S., & Spinath, F. M. (2016). The complex route to success:complex problem-solving skills in the prediction of university success. Higher EducationResearch & Development, 35(2), 365–379. doi:10.1080/07294360.2015.1087387
Tang, S. Y. F., Wong, A. K. Y., & Cheng, M. M. H. (2016). Examining professional learning andthe preparation of professionally competent teachers in initial teacher education. Teachers andTeaching, 22(1), 54–69. doi:10.1080/13540602.2015.1023028
Taşoğlu, A. K., & Bakaç, M. (2014). The effect of problem based learning approach on conceptualunderstanding in teaching of magnetism topics. Eurasian Journal of Physics and ChemistryEducation, 6(2). Retrieved from http://eurasianjournals.com/index.php/ejpce/article/view/936
Toplak, M. E., West, R. F., & Stanovich, K. E. (2014). Assessing miserly information processing:an expansion of the cognitive reflection test. Thinking & Reasoning, 20(2), 147–168. doi:10.1080/13546783.2013.844729
van de Grift, W. (2007). Quality of teaching in four European countries: a review of the literatureand application of an assessment instrument. Educational Research, 49(2), 127–152. doi:10.1080/00131880701369651
Wood, B. B. (2001). Stake’s countenance model: evaluating an environmental educationprofessional development course. The Journal of Environmental Education, 32(2), 18–27.doi:10.1080/00958960109599134
17 Rasch Model Approach to Analyze Quality of Preservice … 193

Chapter 18Interactive and Engaging Module Sites:The RASA Model
Wong Yau Hsiung
Abstract E-learning has emerged as one of the fastest moving trends in today’seducation. In Taylor’s University, Taylor’s Integrated Moodle e-Learning System(TIMeS) is the learning management system (LMS) that instructor uses to deliverand manage learning course content. In this platform, an innovative model knownas R.A.S.A model was introduced. The content in TIMeS is framed into four partsfor easy navigation: R.A.S.A. (Resources, Activities, Supports, and Assessments).The resources part provides the students with multiple learning resources. Theseresources are visually engaging and contain high level of interactivity. This moti-vates the students and promotes learning. The e-Learning is designed in bothfacilitated and self-paced activities. This means that the students can learn it atanytime and anywhere. The simulation and scenario-based activities create alearning environment that “simulates” the real world. This engages the student’sintellect and imagination, allowing them to learn by doing. The game-basedactivities create a fun and motivating experience and enable students to constructknowledge by playing. The e-Learning activities are supported by synchronous andasynchronous communication tools. Students can use discussion forum, onlinediscussion board, and social apps such as Facebook to comment, reflect, socialize,and exchange ideas. This facilitates collaboration and knowledge-sharing amongstudents. For assessment, a variety of student response systems (SRS) are used toprovide real-time feedback. A student survey was conducted to investigate theeffectiveness of this model. Results showed high level of student engagement andimprovement in learning after implementation of R.A.S.A model in module site.The module site won the “Oscars” for TIMeS Awards in 2015 as the most activemodule site in Taylor’s University. In summary, the design of RASA and theintegration of technologies in this module site could serve as a target for futuremassive open online course (MOOC).
Keywords Moodle � Interactive � Module site
W.Y. Hsiung (&)Taylor’s University Lakeside Campus, Subang Jaya, Malaysiae-mail: [email protected]
© Springer Nature Singapore Pte Ltd. 2018S.F. Tang and S.E. Cheah (eds.), Redesigning Learning for GreaterSocial Impact, DOI 10.1007/978-981-10-4223-2_18
197

18.1 Introduction
In recent years, many studies have shown that e-Learning enhances learning amongstudents. As e-Learning starts to gain popularity, consideration needs to be given tothe delivery system to be used and the instructors. All institutions of higher edu-cation in Malaysia are using one form of e-Learning tool or another. The mostcommon tool that all major institutions have is a learning management system(LMS), namely Moodle or Blackboard. LMS is used to disseminate learningcontent, assessment, and communication via posting and announcements. InTaylor’s University, Taylor’s Integrated Moodle e-Learning System (TIMeS) isadopted by all lecturers for these purposes. Nowadays, students are often charac-terized as digitally literate, socially connected, experiential, independent, andvaluing collaboration. They learn on things that are meaningful for them, they learnby doing and experience it, and they like to share and collaborate with others.Instructor must effectively tap on students’ existing familiarity with technology toengage them in learning to become a lifelong learner. To do this, innovative andengaging module site is important to facilitate the students in achieving academicexcellence. This shifts the paradigm from teacher-centered to learner-centered.Besides traditional roles as lecturer and advisor, instructor must now able to utilizeinnovative technologies.
18.2 Methodology
The R.A.S.A. model is implemented in Taylor’s Integrated Moodle e-LearningSystem (TIMeS). Two module sites, General Chemistry I (CHEM 105) andPrecalculus (MATH150), are developed according to the R.A.S.A. model. R.A.S.A.stands for Resources, Activities, Supports, and Assessments. This model was ini-tiated and integrated into the two module sites. These two courses are offered tofirst-year undergraduate students in American Degree Program (ADP), School ofLiberal Art and Sciences, Taylor’s University. These modules are implementedusing blended-learning approach. Therefore, students are required to bring theirown device (BYOD) to class (laptop, tablet, or smartphone). Besides face-to-faceteacher–student experiences, online e-Learning practices are used to amplify thepedagogy (Fig. 18.1).
TIMeS is a mobile-learning platform. It is easily accessed anywhere and anytimeon a laptop, tablet, or mobile phone that connected to Internet. This means thatstudents can access all the materials in this module easily and learn at their ownpace (self-directed learning). The module site is organized into chapters for easynavigation. Each chapter is spilt into four parts: Resources, Activities, Supports,and Assessments. Students will be assessed at the end of chapter by multipleassessments. This bite-sized learning enables students to reflect more quickly on thelearning process and hence enhance their learning effectiveness. This model aims to
198 W.Y. Hsiung

Fig. 18.1 Module sites: General chemistry I (CHEM 105) and precalculus (MATH150)
18 Interactive and Engaging Module Sites: The RASA Model 199
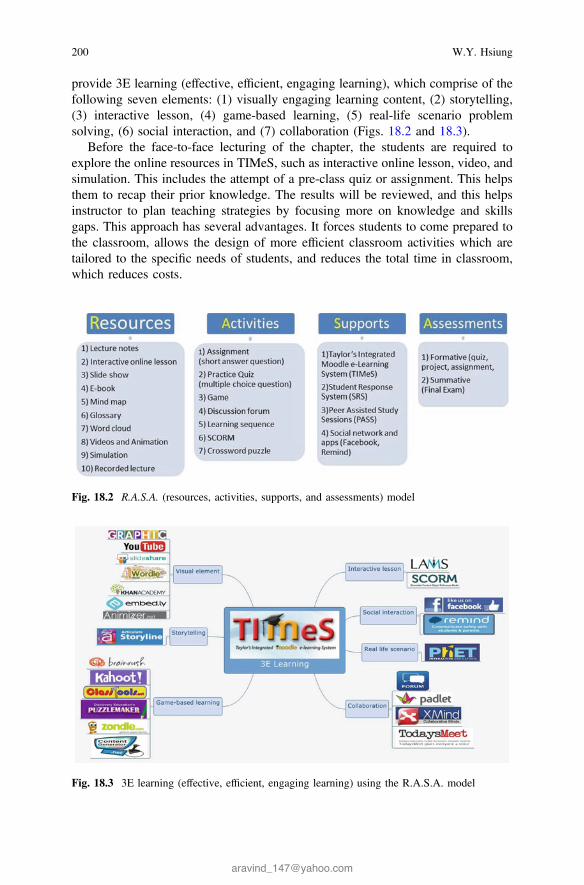
provide 3E learning (effective, efficient, engaging learning), which comprise of thefollowing seven elements: (1) visually engaging learning content, (2) storytelling,(3) interactive lesson, (4) game-based learning, (5) real-life scenario problemsolving, (6) social interaction, and (7) collaboration (Figs. 18.2 and 18.3).
Before the face-to-face lecturing of the chapter, the students are required toexplore the online resources in TIMeS, such as interactive online lesson, video, andsimulation. This includes the attempt of a pre-class quiz or assignment. This helpsthem to recap their prior knowledge. The results will be reviewed, and this helpsinstructor to plan teaching strategies by focusing more on knowledge and skillsgaps. This approach has several advantages. It forces students to come prepared tothe classroom, allows the design of more efficient classroom activities which aretailored to the specific needs of students, and reduces the total time in classroom,which reduces costs.
Fig. 18.2 R.A.S.A. (resources, activities, supports, and assessments) model
Fig. 18.3 3E learning (effective, efficient, engaging learning) using the R.A.S.A. model
200 W.Y. Hsiung
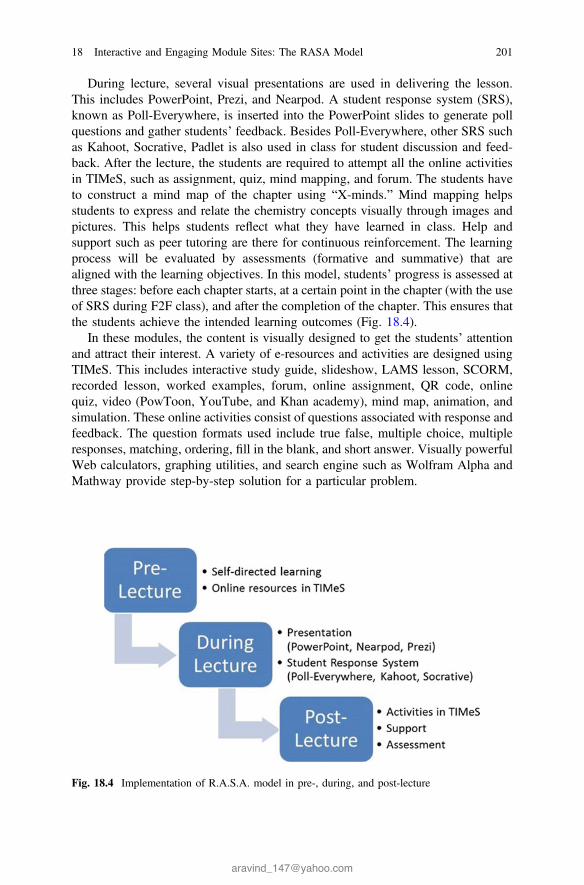
During lecture, several visual presentations are used in delivering the lesson.This includes PowerPoint, Prezi, and Nearpod. A student response system (SRS),known as Poll-Everywhere, is inserted into the PowerPoint slides to generate pollquestions and gather students’ feedback. Besides Poll-Everywhere, other SRS suchas Kahoot, Socrative, Padlet is also used in class for student discussion and feed-back. After the lecture, the students are required to attempt all the online activitiesin TIMeS, such as assignment, quiz, mind mapping, and forum. The students haveto construct a mind map of the chapter using “X-minds.” Mind mapping helpsstudents to express and relate the chemistry concepts visually through images andpictures. This helps students reflect what they have learned in class. Help andsupport such as peer tutoring are there for continuous reinforcement. The learningprocess will be evaluated by assessments (formative and summative) that arealigned with the learning objectives. In this model, students’ progress is assessed atthree stages: before each chapter starts, at a certain point in the chapter (with the useof SRS during F2F class), and after the completion of the chapter. This ensures thatthe students achieve the intended learning outcomes (Fig. 18.4).
In these modules, the content is visually designed to get the students’ attentionand attract their interest. A variety of e-resources and activities are designed usingTIMeS. This includes interactive study guide, slideshow, LAMS lesson, SCORM,recorded lesson, worked examples, forum, online assignment, QR code, onlinequiz, video (PowToon, YouTube, and Khan academy), mind map, animation, andsimulation. These online activities consist of questions associated with response andfeedback. The question formats used include true false, multiple choice, multipleresponses, matching, ordering, fill in the blank, and short answer. Visually powerfulWeb calculators, graphing utilities, and search engine such as Wolfram Alpha andMathway provide step-by-step solution for a particular problem.
Fig. 18.4 Implementation of R.A.S.A. model in pre-, during, and post-lecture
18 Interactive and Engaging Module Sites: The RASA Model 201

Experiential learning such as interaction lesson, simulation, virtual lab, scenario,and game-based activities engages student’s intellect and imagination to foster deepunderstanding. The simulation creates a scenario where the students have to use theinformation that they have just learned in order to solve a problem. This will helpthem to adapt the information to real-life scenarios, while also reinforcing what theyhave already learned.
For formative assessment, a variety of student response systems (SRS) areused to check the level of understanding among the students. These technologiesare easy to use and the users only need to download the apps on mobile device andconnect to Wi-fi. They engage the students and provide real-time assessment.Forum, Padlet, and Todays Meet are used to promote collaborative discussionamong students. These tools encourage the student to discuss and share ideas tosolve the problem. Teacher–student communication is possible with the use ofRemind apps and the message function in TIMeS and Facebook. Technology suchas augmented reality (AR) is also used to illustrate the 3D structure of molecule byusing the ipad apps known as “Aurasma.”
18.3 Result and Discussion
A survey was carried out on the students. These figures show some of the researchfindings conducted on the use of various student response system (SRS) in thesemodules. Figure 18.5 showed that Kahoot is the students most favorite SRS(Fig. 18.6).
The use of Kahoot showed significant improvement in student learning as furtherstudies shown that Kahoot is fun, engaging, and competitive. It enables activelearning, helps students to identify problem areas, and provides feedback to stu-dents. Figure 18.7 showed that student scored better after implementation of the R.A.S.A model in the module sites.
The design of RASA (Resource, Activities, Support, and Assessment) and theintegration of technologies in this module site could serve as a target for futuremassive open online course (MOOC). This module also demonstrates how toleverage cutting-edge technologies to create innovative learning environment in a
Fig. 18.5 Impact of different student response system (SRS) on your learning
202 W.Y. Hsiung

Fig. 18.6 Effects of Kahoot on students
Fig. 18.7 Impact of different student response system (SRS) on your learning
18 Interactive and Engaging Module Sites: The RASA Model 203

“dry” Chemistry subject. For example, the use of interactive game-based learningand engaging student response system (SRS) could transform traditional teachingmethods in subject such as Chemistry. Other practices that used in the module, suchas flipped classrooms and blended learning, also serve as potential bench marker foreffective and creative e-Learning.
In line with the Taylor’s Graduate Capabilities, this module helps the students toachieve the capabilities of lifelong learning, thinking and problem-solving skills,and digital literacy. Furthermore, this module also in line with the e-Learningmission of Taylor’s University, which is by 2016, every student at Taylor’sUniversity will learn in a collaborative, self-directed and personalized manneranytime anywhere.
References
Brunsell, E., & Horejsi, M. (2013). Flipping your classroom in one “take”. The Science Teacher,80(3), 8.
Fallon, C., & Brown, S. (2016). E-learning standards: A guide to purchasing, developing, anddeploying standards-conformant e-learning. USA: CRC Press.
Harasim, L. (2000). Shift happens: Online education as a new paradigm in learning. The Internetand Higher Education, 3(1), 41–61.
Machado, M., & Tao, E. (2007, October). Blackboard vs. Moodle: Comparing user experience oflearning management systems. In 2007 37th annual frontiers in education conference-globalengineering: Knowledge without borders, opportunities without passports (pp. S4J-7). USA:IEEE.
Morrison, D. (2003). E-learning strategies: How to get implementation and delivery right firsttime. USA: Wiley.
Negash, S., & Wilcox, M. V. (2008). E-learning classifications: Differences and similarities. InHandbook of distance learning for real-time and asynchronous information technologyeducation (pp. 1–23).
204 W.Y. Hsiung

Chapter 19A Semantic-Based Document Checker
Jer Lang Hong
Abstract Current document checker tools rely on the keywords statistics as well asits neighboring words for document similarity. It also assumed that the database ofthe documents to compare to is large enough for sufficient checking. However,these tools failed to detect words which are nearly similar in content, even they aresynonymous. In this paper, we developed a tool to detect document similarity basedon its semantic contents, not word matching. Experimental results show that ourtool is highly effective for document detection on a pool of documents.
Keywords Social networking � Twitter � E-Learning
19.1 Introduction
A paper publication goes through a series of reviews which use peer review systemwhereby the paper is vetted and undergoes revision where necessary. If the paper isdeemed suitable for publication in the said publication venue, the paper will then betypeset and converted accordingly to the format prepared by the publisher.However, a paper which is well written may be a result of duplicative work ofanother work published elsewhere. With the advancement of Internet technologiesand the wide access of digital document and tools, it is certainly feasible and in facteasy to reproduce a person’s work without much effort. Fortunately, current onlineplagiarism tools are able to check plagiarism using state-of-the-art detection algo-
J.L. Hong (&)Evault Technologies, San Francisco, USAe-mail: [email protected]
© Springer Nature Singapore Pte Ltd. 2018S.F. Tang and S.E. Cheah (eds.), Redesigning Learning for GreaterSocial Impact, DOI 10.1007/978-981-10-4223-2_19
205

rithms and the powerful processing of parallel servers as well as the wide avail-ability of online databases.1,2,3,4,5,6
These tools are efficient and with high accuracy, but they are not withoutproblems and defects. One of the major limitations of these tools is their unability todetect words which are similar in meaning. Most of these tools detect the words bymatching the individual words as well as their neighboring words. Fortunately, withthe advancement in research and the recent development of semantic technologies,it is now possible to detect and match words which are similar in meaning(Figs. 19.1, 19.2, 19.3 and 19.4).
In this paper, we propose a novel semantic-based plagiarism checker whichutilizes semantic keyword matching using lexical database WordNet. WordNet is afree lexical database available online with terms for over 110 million of wordsavailable in English language. We use a plug-into connect to the vast wordsavailable in WordNet and then perform keyword matching using semantic check-ing. Once the words are matched semantically, we further match their neighboringwords to increase the matching accuracy further.
Fig. 19.1 Turnitin plagiarism checker
1http://turnitin.com/2http://www.ithenticate.com/3https://www.grammarly.com/plagiarism?q=plagiarism&utm_source=google&utm_medium=cpc&utm_campaign=Search&utm_content=56705347446&utm_term=plagiarism%20checker&matchtype=e&placement=&network=g&gclid=COL98qP_0c4CFdeFaAodvrYFAg4https://www.plagramme.com/?gclid=CIKJhqv_0c4CFRUeaAodAZ0N6w5http://en.writecheck.com/6http://smallseotools.com/plagiarism-checker/
206 J.L. Hong

The paper is divided into several sections. The next section describes researchrelated to ours, while the subsequent section explains the methodology in detail.Then, we present our experimental results and finally we conclude our work.
Fig. 19.2 Ithenticate plagiarism checker
Fig. 19.3 Small SEO
19 A Semantic-Based Document Checker 207

19.2 Related Work
19.2.1 Overview
In this chapter, we present an overview of semantic-based tools and provide acomprehensive review on these tools. The literature survey in this section is takenfrom the paper published in (Hong, 2013).
19.2.2 WordNet
WordNet (Fellbaum, 1998) was developed in 1998 as a lexical database for Englishfor the semantic matching of words in Information Retrieval research. Its databaseconsists of 150,000 words organized in over 115,000 synsets for a total of 207,000word-sense pairs. WordNet is able to represent nouns, adverbs, verbs, and adjec-tives as a group of cognitive synonyms (synsets) with their own distinct concepts.Synsets are linked by means of conceptual semantic and lexical relations. WordNetprovides an intuitive interface for the users to use and navigate the functionalitiesprovided. It categorizes English words into several groups, such as hypernyms,synonyms, and antonyms.
Fig. 19.4 Free plagiarism checker
208 J.L. Hong

19.2.3 CYC
Lenat developed CYC for MCC Corporation. CYC provides a larger ontologydomain for the users with higher level ontology. There are more than hundredsthousands of terms, and millions of assertions related to the terms in CYC. Theontology in CYC knowledge has 47,000 concepts and 306,000 facts browsable byCYC Web interface. A mapping to define the concepts of each term is utilized,where every concept mapped to the terms will return either a true or false statement.Based on this return value, users can then decide the appropriate actions for futureprocessing.
19.2.4 BabelNet
BabelNet (Navigli & Ponzetto, 2010) is an extension of WordNet, where it over-comes several deficiencies in WordNet. WordNet is designed to be a lightweightontological technique with limiting ontology domain and capability to providesufficient information to the users. Combining WordNet and Wikipedia, BabelNetintegrates the domain and knowledge base of these two systems which could suf-ficiently provide the users with higher level ontology domain. In addition, BabelNetis also able to distinguish word-sense disambiguation accurately using the infor-mation provided by Wikipedia domain knowledge.
19.2.5 YAGO
Yet Another Great Ontology (YAGO) is developed by Fabian, and it is a lightweightontologywithextensible functionalities for highdata coverage and accuracy (Suchanek,Kasneci, & Weikum, 2007). An accuracy of 95% is attainable in YAGO for its testcases. Data is extracted fromWikipedia, where it is unifiedwithWordNet, which couldprovide the users with 1 million entities and 5 million facts. YAGO also includesfunctionalities such as IsA as well as non-taxonomical relations between entities.
19.2.6 WordNet++
An extension of WordNet (WordNet++) is developed to solve word disambiguationproblems. It extends the existing WordNet by providing extra high-quality infor-mation from Wikipedia. High-quality semantic information to the users is attain-able, with support for word disambiguation using the interface of supervised toolword-sense disambiguation (WSD).
19 A Semantic-Based Document Checker 209

19.2.7 Wikitology
Wikitology is an ontology tool developed based on the Wikipedia. It is used as atool for many NLP problems. Each article is a concept in the ontology. The terms inthe article are linked to each other, and they may also interlink to other documents.Wikitology is currently in its content, and consistently maintains the quality of itscontents and has broad coverage for its users.
19.3 Proposed Methodology
19.3.1 Overview
Our semantic-based plagiarism checker is divided into two sections (see Fig. 19.5).The first section involves the keyword detection and matching, where the docu-ments are screened through and tokenized into individual keywords for exactmatching. The second section uses a novel semantic check, where the words in thedocuments are parsed through and checked semantically. Once the semantic checkis carried out, further checking is performed to solve the word disambiguation. Forexample, the word “Interest” in the sentences “Interest in book” and “Interest inbank” is having dissimilar meaning though they are identical.
19.3.2 Similarity Detection
To parse through the documents and tokenize them into words, we need documentanalyzer tool. We use Apache Lucene available at https://lucene.apache.org/core/corenews.html to parse through our documents. It is assumed that the documentsare either in Word or PDF format. Once the document is parsed, we tokenize theminto individual words. Then, we conduct a thorough search of those documents withrespect to the available online databases. Online databases include those publishedworks available, and also the unpublished texts and articles. We use Apache Luceneto parse through the online databases, where similar tokenization process is carriedout. We then match the words in the first document to those of the target document.If a match is found, we calculate the similarity index and update it accordingly.Once the first document is fully matched, the final updated similarity is calculated.Then, we perform the matching process with the second document until the lastavailable documents with the same matching process.
210 J.L. Hong

19.3.3 Semantic Checking
To match the word semantically, we use a lexical database for English WordNet,which consists of 110,000 synsets. Several algorithms exist for semantic wordmatching. We use the algorithm of Jiang and Conrath (1997) as studies in(Budanitsky & Hirst, 2001) show that this algorithm is the most effective among allthe existing techniques (Leacock & Martin, 1998). We consider two words asmatched if their similarity score exceeds 0.7. We perform the semantic matching
Fig. 19.5 Flowchart of oursystem
19 A Semantic-Based Document Checker 211

using the same technique as the exact matching mentioned previously. We removeall the irrelevant words such as punctuation, and stop words before the wordmatching is carried out. Word stemmer is used to stem every word to their base. Insome cases, there is word disambiguation for sentences in the word document. Toremove word disambiguation, we use Adapted Lesk algorithm (Banerjee, 2003),where neighboring words in the sentences are matched and compared to determinethe semantic similarity of the sentences. Once the semantic checking is carried out,we calculate the similarity score for the document analyzed.
19.4 Experiments
We conduct our experiment by taking 50 samples from student’s coursework andstaff publications (25 samples each). Samples are chosen randomly and taken fromdifferent faculties and schools. For each documents analyzed, we calculate thesimilarity score and compare it with state-of-the-art plagiarism tool (see Footnote 6).
Table 19.1 shows the results’ comparison between our tool and Small SEO (seeFootnote 6). As shown in the table, our tool is able to detect a higher level ofplagiarism in the students and staff works. Most of the additional level of accuracyof the tool lies in the detection of word paraphrasing, where sentences are rephrasedinto another sentence by the author. However, for some cases, our toolover-analyzes the detection, where it incorrectly identifies the matching.
19.5 Conclusion
We propose and develop a novel semantic-based checker, where words are iden-tified and matched semantically. Experimental results show that our proposedmethod is more accurate than conventional plagiarism detection tools which useexact word matching. We believe that this tool is crucial in the development offuture plagiarism detection tools utilizing ontologies and parallel processing power.
Table 19.1 Results’ comparison
Our tool (%) Small SEOa (%)
Student samples 41.5 35.6
Staff samples 31.5 24.9asee Footnote 6
212 J.L. Hong

References
Banerjee, S. (2003). Extended gloss overlaps as a measure of semantic relatedness. In IJCAI.ACM.
Budanitsky, A., & Hirst, G. (2001). Semantic distance in wordnet: An experimental,application-oriented evaluation of five measures. In Proceedings of the NAACL.
Fellbaum, C. (1998). WordNet: An electronic lexical database. Cambridge, MA: The MIT Press.Hong J. L. (2013). OntoExtract—Automated extraction of records using multiple ontologies. In
FSKD.Jiang, J. J., & Conrath, D. W. (1997). Semantic similarity based on corpus statistics and lexical
taxonomy. In Proceedings of international conference on research in computationallinguistics.
Leacock, C., & Martin, C. (1998). Combining local context and WordNet similarity for word senseidentification. Cambridge, MA: The MIT Press.
Navigli. R. & Ponzetto S. P. (2010 July). BabelNet: Building a very large multilingual semanticnetwork. In Proceedings of the 48th Annual Meeting of the Association for ComputationalLinguistics (pp. 216–225). Uppsala, Sweden.
Suchanek, F. M., Kasneci, G., & Weikum, G. (2007). Yago—A core of semantic knowledge. In16th International world wide web conference, WWW 2007.
19 A Semantic-Based Document Checker 213

Chapter 20Technology Innovation in Dairy FarmManagement
Devi Ponnu
Abstract The Farm Tourism Event project is based on a larger CSR projectentitled, “Scaling-up Dairy Farmers of Malaysia from Low Yield to High YieldIncome via Capacity Building: Proposed Dairy Farm Tourism & Application ofTechnology Innovations”. The task involving Taylor’s University for this project isdivided between two schools. The School of Computing & IT is responsible fordeveloping apps and Web portal for farm management. The School of Hospitality,Tourism and Culinary Arts is responsible for developing the dairy food products aswell as developing dairy farm tourism product. From our discussions and inter-views with the farmers, there were a couple pain points which they have highlightedto us with regard to knowledge and improved process of services as listed below.
1. Knowledge Base—The farming industry is a booming industry, and it has muchpotential in Malaysia. There is a need for new methods and ways in farmingindustry, and there is also much research done by local and foreign universitieswith respect to the farming industry. How these information and knowledge areto be shared with the rural folks who actually need such information forimprovement.
2. Supply Availability—Today, the way the farmers get orders and very manualand there is much pain from not just the farmer side but also retailers looking forsupply. There is no way to check which farmer has the supply and as such theretailers would have to make many calls just to get supply.
3. Retailers Inventory—It is important for farmers to have an inventory list thatcould indicate daily supply information and also provide reports for futurereference. The list can be used as a gauge for cases, whereby there is anoversupply or less supply of their farming products.
Keywords Mobile application � Farm management � Mobile knowledgebase
D. Ponnu (&)Taylors University, Subang Jaya, Malaysiae-mail: [email protected]
© Springer Nature Singapore Pte Ltd. 2018S.F. Tang and S.E. Cheah (eds.), Redesigning Learning for GreaterSocial Impact, DOI 10.1007/978-981-10-4223-2_20
215

20.1 Introduction
As what I have mentioned above, the main objective of this project is to increase theyield income of our target audience. In this case, we are focusing on the farmers inMalaysia. How do we improve their yield by using technology? A few questionsarise when we look into using technology in rural areas. The first question thatcomes to my mind is the rural folks ready for technology ad would they usetechnology for their daily work routine.
The answers to these questions were found in research done by the MalaysianCommunications and Multimedia Commission in 2014, whereby there is a sig-nificant change from the results found in 2012 which indicates improvement of theInternet use in rural area (Fig. 20.1).
From the research by MCMC, it was clear that there is huge potential in tech-nology being the mode of how these farmers could reach high yield. Not only withthe increase of Internet accessibility but also the use of smart devices improves theInternet penetration in rural areas. From the various researches, I also noted that theuse of smart devices such as smartphones is the key to the success of any tech-nology that is to be implemented in the rural areas.
Based on the above problem statements and technology penetration statistics, weneed to find a solution that best helps the farmers and increases their yield as awhole. The outcome of this project should address the issues faced by the farmersand also retailers to ensure smooth operations.
20.2 Research Analysis
As mentioned above, the project was collaboration in which Taylors School ofComputing (SOCIT) played a role in the technical section on the project.Nevertheless, in order to ensure that the end products produced are based on theneeds and requirement, a research was conducted by Pearson Malaysia andIGAUPM. The research was mostly based on interviews conducted with the farmmanagement. As mention above the project was collaboration in which TaylorsSchool of Computing (SOCIT) played a role in the technical section on the project.
Fig. 20.1 Urban–ruralinternet penetration
216 D. Ponnu

Nevertheless, in order to ensure that the end products produced are based on theneeds and requirement, a research was conducted by Pearson Malaysia andIGAUPM. The research was mostly based on interviews conducted with the FarmManagement, MARDI and the farmers themselves. Out of all the objectives out-lined for this project by Pearson, SOCIT would focus on the objective, MARDI andthe farmers themselves. Out of all the objectives outlined for this project byPearson, SOCIT would focus on the objective:
1. To educate, train and promote good farm management and best dairy practicesand raise alternative income (i.e. incorporating agro-tourism).
2. To exchange information among dairy farmers, civil society and grass rootorganizations, veterinary officers, extension personnel, scientists and policymakers concerning issues and challenges concerning dairy farms in PeninsularMalaysia.
3. To discuss the strengths and weaknesses of current dairy farm management andpractices.
4. To allow transfer of knowledge and skills gained to other dairy farmers.5. To innovate new literacy solutions for dairy farmers using Pearson’s products
and services.
20.2.1 Scope of the Project
Based on the chart above, SOCIT would be involved in pillar 1 which is training.As such, the development of the project would focus on how knowledge and farmmanagement is done using technology (Figs. 20.2 and 20.3).
Fig. 20.2 Scope of the project chart
20 Technology Innovation in Dairy Farm Management 217

This analysis was based on seven states selected for this project, and there are111 farmers in total from these 11 states. The seven states are Perlis, Penang,Kedah, Perak, Johor, Terengganu and Pahang.
Based on MARDI research on the classification of farmers in Malaysia, 89% aresmall-scale farmers, 7% commercial-scale farmers and 4% semi-commercial-scalefarmers.
20.2.2 Milk Production Data
Milk production is one of the core output from these farmers. The production ofmilk must always be adhered to some standards and ensure cleanliness as the outputwhich is milk is consumed by consumers nationwide. Nevertheless, there seems tobe lack of system or a coordinated effort in transporting the milk to consumers. Thebest way to illustrate the end-to-end process of the product distribution is by using aSIPOC diagram (Fig. 20.4).
Fig. 20.3 Dairy farmersclassification
Fig. 20.4 Dairy product distribution SIPOC diagram
218 D. Ponnu

The milk production is a focus in this article as much of the issues are inhandling or better management of the milk produced by these farmers. The milkproduction data are depicted in Table 20.1.
From the research report, there was also findings which relate to the currentissues and difficulties faced by the farmers. The issues range from production of theproduct to marketing it to the end customer. Cause and effect diagram depicts theoverall issues raised by the farmers (Fig. 20.5).
From the finding, we need to zoom into aspects of the issues raised which wecould address via technology as to the scope of this article. It is clear that thelack of knowledge and farm management are the key issues which can beaddressed with the help of technology, and the idea of developing a mobileapplication is ideal for such scenarios. Why mobile application and not Webapplication? As the trend has changed the world of technology which is nowmoving from Web base desktop access, people are now more prune towardsusing mobile phone to get their source of information. Based on a research byPew Research Center,
68% of U.S. adults have a smartphone, up from 35% in 2011, and tablet computer own-ership has edged up to 45% among adults, according to newly released survey data from the
Table 20.1 Milk production table by zone
Zone States Milk production per day (l)
North Perlis, Kedah, Perak and Penang 3784
South Johor 7005
East Terengganu and Pahang 7112
Fig. 20.5 Cause and effect diagram
20 Technology Innovation in Dairy Farm Management 219

Pew Research Center.1 Smartphone ownership is nearing the saturation point with somegroups: 86% of those ages 18–29 have a smartphone, as do 83% of those ages 30–49 and87% of those living in households earning $75,000 and up annually.
(PewResearchCenter, 2015)
Even in Malaysia the trend is the same as per the US. Based on an article in theMalay Mail Online authored by Yiswaree Palansamy entitled “Smartphone use topsPCs in Malaysia, three Asian nations, Google survey shows”,
it was reported that 51% of local respondents relied on smartphones for web access versus39% who used computers.
(Malay Mail Online, 2016)
Based on the trends of mobile usage around the world, it was an ideal solutionfor the farmers and we could be able to address the concerns below by developing amobile application which can give the information and knowledge required directlyto the farmers in a much easy and fast manner.
20.3 Solution Development
Based on the analysis and trends, it was clear that mobile application would be thebest fit for these farmers as they each own a smartphone and carry it around withthem in every tack that they perform at the farm. This section describes the mobileapplication focus in resolving the issues which we have described above. Thesection details the structure and building blocks of the mobile application. Theapplication development is divided into two main categories: the information dis-semination and milk order and inventory system.
1. Knowledge DisseminationThe knowledge section is divided into two. One is farm management and theother hygiene milk practice. The farm management application would covertopics such as biosecurity, vaccine management, environment management, staffmanagement, livestock management, farm and equipment management. Thehygiene milk practice would cover topics such as management of milk pro-duction, important definitions in the milk industry, milk production process,milk production guidelines and others (Fig. 20.6).
2. Milk Order and Inventory SystemBased on the findings, it was also known that the supply of milk-relatedproducts to the various consumers lack certain process or mismanagement. Thisresults in the oversupply and wastage of milk products. As the current process ismanual, there is a challenge in synchronizing the various milk suppliers anddemand from consumers (Fig. 20.7).
1http://www.pewinternet.org/2015/10/29/technology-device-ownership-2015/#fn-14935-1
220 D. Ponnu

The diagram above depicts the high-level process flow of the intended system.As this is only the first phase, a simple and effective process is needed. The processstarts with the consumer selecting the state in which they want the milk product tobe purchased from and then selecting the supplier based on the list provided tothem. Once selected the desired supplier, the consumer would be able to view theamount of stock available from the supplier.
At the back end, the quantity of milk products, i.e. the inventory would bemanaged by the system in which the supply would decrease or increase based onthe demand from consumers. By this the supplier would always have sufficientstock and based on the purchase trend. The farmers could avoid oversupply of milkproducts.
Fig. 20.6 User interface for mobile application
Fig. 20.7 Proposed distribution process flow
20 Technology Innovation in Dairy Farm Management 221

The consumer would also have a choice of paying the farmers directly, or theycould opt for paying upon receiving their milk products. The application wouldresolve in much competitive and efficient farm product management and at thesame time look into the inventory management.
The application would be built for the Android operating system as it is alsoknown that the Android smartphones are relative cheaper and affordableownership. This would mean that the population of the lower-income group wouldhave an Android smartphone OS when compared to owning an Apple iPhone IOSsystem. Based on data from Demystify Asia article entitled “Android vs. iOSMarket share in Asia”,
Android OS has 82% market share and IOS has 18% market share in Malaysia inthe year 2015 (Demystify Asia, 2016).
20.4 Summary
The focus of this project is to have three separate functionally different applications.Many applications that have been developed by Android and IOS developers oftenmerge many functionalities into one single application. Such application createsmany layers of navigation which in return creates unfriendly usability, wherebyconsumers have to click many layers in order to obtain the information that theyrequire. This may be applicable to a Web base application using a desktop but maynot be the same for a mobile application.
Bearing in mind that the mobile application has a much smaller resolution andscreen size, one has to develop the application with lesser number of layers. Theinformation much be obtained faster and ideally within less than three touches.
References
Anderson, M. (2015). Technology Device Ownership: 2015. Retrieved October 24, 2016 fromhttp://www.pewinternet.org/2015/10/29/technology-device-ownership-2015/
Demystify Asia. (2016). Android vs. iOS Market share in Asia. Retrieved October 24, 2016, fromhttp://www.demystifyasia.com/android-vs-ios-asia/
Malaysian Communications and Multimedia Commission. (2015). Internet Users Survey 2014.Retrieved September 1, 2016 from http://www.skmm.gov.my/skmmgovmy/media/General/pdf/Internet-Users-Survey-2014.pdf
Palansamy, Y. (2016). Smartphone use tops PCs in Malaysia, three Asian nations, Google surveyshows. Retrieved October 27, 2016 from http://www.themalaymailonline.com/tech-gadgets/article/smartphone-use-tops-pcs-in-malaysia-three-asian-nations-google-survey-shows
222 D. Ponnu

Chapter 21Participation, Produsage, and Pedagogy:Social Media as a Tool to EnhanceTeaching and Learning Experience
Vandana Saxena
Abstract The rise of the Internet and social media has brought about dynamicchanges in reading and writing. Reading in the digital age is a communal, col-laborative, and participatory activity. Axel Bruns conceptualizes such activities bythe term ‘produsage,’ a combination of production and usage. The reader not onlyreads a text but also assumes the mantle of a producer by creating content onvarious digital platforms. This paper reflects on the impact of these changes within aliterature classroom. Through ‘Wheels within Wheels: The Crucible on Twitter’ acollaborative project in which the students of literature reenacted Arthur Miller’splay The Crucible on Twitter, this paper explores the ways in which the new ageparticipatory and collaborative reading can be harnessed as a pedagogical tool toenhance teaching and learning experience.
Keywords Participatory cultures � Produsage � Pedagogy � Literature � Twitter �Arthur Miller
…this discovery of yours will create forgetfulness in the learners’ souls because they willnot use their memories; they will trust to the external written characters and not rememberof themselves. The specific which you have discovered is an aid not to memory, but toreminiscence, and you give your disciples not truth, but only the semblance of truth; theywill be hearers of many things and will have learned nothing; they will appear to beomniscient and will generally know nothing; they will be tiresome company, having theshow of wisdom without the reality. (Plato, Phaedrus)
With these words, Plato cautioned the Greeks against the science of writing. Hesaw writing and reading as activities that would debilitate memory, cultivatedependency on external devices, and replace real knowledge with a mere show ofwisdom.
V. Saxena (&)Taylor’s University, Subang Jaya, Malaysiae-mail: [email protected]
© Springer Nature Singapore Pte Ltd. 2018S.F. Tang and S.E. Cheah (eds.), Redesigning Learning for GreaterSocial Impact, DOI 10.1007/978-981-10-4223-2_21
223

On a close examination, these charges echo our own anxieties and admonitionswhen we see a youngster bent over a computer, browsing away into the vastdomains of the World Wide Web. Maryanne Wolf (2007) seems to be repeatingPlato when she fears that ‘many of our children are in danger of becoming […] asociety of decoders of information, whose false sense of knowing distracts themfrom a deeper development of their intellectual potential’ (p. 26). And in an ironictwist of ideas, this time the anxiety over the Internet taking over that youngster’slife is coupled with the anxiety over the fading habit of reading and writing—concerns which are echoed by surveys and statistics. For instance, according toNational Literacy Survey, 2005, Malaysians, on an average, read only two books ayear. Over 80 percent of the university students are reluctant readers of Englishlanguage material, that is, they read only because they have to (Inderjit, 2014).
But if one looks closely at the Internet, there is another side to this story, and it isnot so disheartening. The recent years have shown a rise in the sales of e-books vis-à-vis the traditional print (Campbell, 2016). There are categories like audiobooks.There is further evidence of dynamic reading and writing available on numeroussocial media networks. Wattapad, for example, is a mobile reading app launched in2006. Nearly 45 million people use it every month. There are over 100,000 uploadsin a day and over a 2 million writers, and an overwhelming majority of these are theteens (‘Wattapad Pressroom’). Its rival, Figment boasts of 300,000 young userswho upload 30,000 pieces of fiction and nonfiction a month. Each of these storiesgarners likes, the most popular going about 20,000 likes per update (Tarbox, 2014,55).
These digital playgrounds are the breeding ground for new genres. For instance,the first cell phone novel published in Japan in 2003. Written in chapters of 70–100characters, the work is disseminated via short messaging service or SMS. It is aninteractive genre where the readers review, comment, and applaud as the writersproduce the stories. The massively popular ‘The Lizzy Bennet Diaries’ by a20-year-old grad student is an adaptation of Jane Austen classic Pride andPrejudice into a groundbreaking multiplatform series. It reimagined Austen’s storyaround a fictional vlog filmed in a single room in front of computer screen. ‘TheLizzy Bennet Diaries’ became the first YouTube series to win a Primetime Emmyin 2013 for Outstanding Creative Achievement in Media-Original InteractiveProgram.
There is enough evidence to show that young readers today not only read butengage with the texts deeply. They critique and comment on the online discussionforums. They create and share reading lists on Amazon and Goodreads. They oftengo further to create their own version of the stories in the form of fan fictions andvideos. The online fandom of popular texts like the Harry Potter is colossal withover 600 million Internet archives, more than 2500 discussion forums, and 500,000stories on a single fan site like fanfiction.net, a number of blogs and Web sitesdiscussing every aspect of the series (Saxena, 2012).
So instead of a decline, these engagements signal a new kind of reading thatwhich is no longer solitary where the text talks to the reader in a one-way rela-tionship mediated by publishers, libraries, teachers, or parents. This reading has its
224 V. Saxena
own dynamics of reader–writer interaction, instant feedback, serialization andvisualization of stories, and so on. The stories move across the mediums and timeframes always evolving and making way for newer versions. It is a collective,collaborative, and interactive activity, mediated by technology and embedded in adigitally connected network. The rise of new genres such as Twitter drama or cellphone novel is a testimony to the dynamic evolution of digital storytelling or e-litover the recent years.
Bruns (2007a, b) conceptualizes such collaborative and participatory activity asprodusage, a portmanteau word that combines production and usage. It stands forthe activities like that of a reader in the digital times. The barrier between theproducer and the users collapses as the users’ appropriate tools and skills of pro-duction. The readers of the digital age are embedded in this environment of pro-dusage which proliferates with them as they invent and reinvent the texts, givingnew meanings and interpretations and producing multiple versions of the sourcetext.
What are the implications of this paradigm shift in reading for a literatureclassroom? Could the activity of produsage be employed as a pedagogical tool? Howcan it complement and enrich the process of teaching and learning literature? Theproject ‘The Crucible on Twitter’ implemented in a university literature classroomaligned the idea of Web-enabled participatory reading and writing with the con-structivist approaches to learning in a literature classroom. Students used Twitter, asocial media microblogging platform, to write an adaptation of Arthur Miller’s1950s play ‘The Crucible.’ The goal was to enable classroom engagement with aliterary text through activities that felt meaningful and important to our networkedstudents; activities that offered opportunities to reflect on the text and reinvent it inthe contemporary context using a range of writing activities that students are familiarwith outside the classroom such as tweeting, online commentaries.
Twitter was particularly suited for the project since its real-time microbloggingcan imitate a dramatic text. It invites critical, collaborative participation suitable fora close-knit online writing community. The model of fan fiction, wherein thereaders and writers use their favorite texts to develop alternate story lines and plots,was used to develop an understanding of the text and gain insights about the keyelements of the literature.
Through means of this project, this study is an attempt to understand:
1. A new technology-enabled pedagogy which is productive, participatory, andcollaborative;
2. Produsage as a medium to foster deeper engagement with literature;3. Produsage as a tool for student empowerment.
This paper draws its theoretical tools from the theories of digital reading, par-ticipatory cultures, and active pedagogy. Subsequently, it lays out the methodology,the details of the project, the associated learning outcomes, and the justifications fora case study. This leads to the final discussion on the digital platform as a tool forcollaborative learning and a space for creative expression.
21 Participation, Produsage, and Pedagogy … 225

21.1 Participatory Cultures, Produsage, and Pedagogy
Many of the current, and certainly most of the next, generation of learners areremarkably immersed in technology. Prensky (2001) designates them in metaphoricterms as ‘digital natives’ referring to the ‘native speakers’ of the digital language ofcomputers, video games, and the Internet who have grown-up with these newtechnologies. On the other hand are the older generations of ‘digital immigrants’who have adapted these technologies over the period of time. In ‘digital natives,digital immigrants,’ Prensky points out the remarkable gap between traditionalforms of teaching and learning systems and the world of students which haschanged dramatically with the advent of technology: ‘as a result of this ubiquitousenvironment and the sheer volume of their interaction with it, today’s students thinkand process information fundamentally differently from their predecessors.’ In hisbook Language and learning in a Digital Age (2011), John Paul Gee has empha-sized learning environments embedded within the sites of popular youth culture likethe Internet which competes and complements our traditional education in severalaspects.
One of the major markers of this digital environment is its participatorypotential. Jenkins (2006) calls it a milieu of participatory culture which has theability to transform personal reaction into social interaction and spectatorial cultureinto the participatory culture. Fan fiction is a manifestation of such appropriation ofa text. Elsewhere, citing the case of the Harry Potter series, I have discussedInternet as a site of adolescent writer’s appropriation of authorship which results inan ‘endless play of narratives’: In these adolescent narratives, ‘the source text isconstantly deconstructed, its apparatus taken apart and reassembled with newmeanings’ (Saxena, 2012). There are innumerable spaces on the Internet wherereaders not only discuss and comment about a text but go a step further by writingtheir own versions.
Hence, Trendwatching.com recently identified ‘Generation C’ (for ‘content’)—the generation responsible for the development of open source software, legal andillegal music file sharing, creative content sites such as YouTube or Flickr, citizenjournalism, and so on (2004). One of the key features of Generation C is its strongpreference for replacing the proprietary hoarding and dissemination of informationwith the establishment of a common knowledge base. Hence, the reader no longerfollows the existing production chain developed during the mass media age with itstraditional author ! publisher ! reader or one-to-many flow of information.
Roles in the digital environment are fluid. According to Bruns (2007a, b),‘networked media levels the playing field by offering an opportunity for audiencesto become content creators in their own right, and by eroding the ability of thedistribution stage to act as an impassable bottleneck for user-created content.’ Thustexts are written and disseminated freely online. Networked content is inherentlycollaborative as the readers comment and offer suggestions which the writers use toshape the stories which are never complete because there is next version perpetually
226 V. Saxena

lurking on the margins. Such technology-enabled produsage collapses the distinc-tions of production, consumption, and creation at once.
Digital reading imbibes what Bruns and Humphrey (2005) have highlighted asthe key characteristics of produsage:
1. It is user led and collaborative. Produsage occurs in a collaborative communalenvironment in a shared project that is incremental, iterative, and evolutionary.This is an important shift from traditional production which relies on theexistence of dedicated and specialized team to a community of amateurs. Thewriters on the Web have a network of beta readers or editors, readers whocomment and shape the narratives or simply those who ‘like’ and encouragewriter.
2. Participants occupy fluid roles. The writers not only write but also edit, developart, or simply read the stories of the fellow writers.
3. Produsage is palimpsestic or evolutionary development of the existing content.In the online world of storytelling, stories are forever unfinished. Narrativesbuild on existing narratives, exploring its nuances long time after the source texthas concluded. Hence, on the Web, a story is always a work in progress. Eachstory is one of the several versions floating around in the domains of Internet.
4. The content in the produsage economy is a common property, althoughrecognition of the individual merit of contributors and contributions is a stan-dard feature. It is a recognition of the collaborative nature of the work processand the evolutionary nature of the content itself which builds on preexistingnarratives. The notion of singular authorship is taken over by multiple producersand collaborators.
Produsage, then, can be roughly defined as collaborative content creation led byusers or at least crucially involves users as producers. And the digital natives oftoday are inextricably integrated with this produsage environment.
In such a scenario, there is an urgent need to review the traditional pedagogicmodels, especially in a literature classroom to keep up with the changing reader–author dynamics. The task of education in the digital times is twofold: firstly, toensure that the graduates leave the university equipped for successful participationin produsage environments. Secondly, in order to develop such capacities, it isnecessary that universities integrate produsage in their learning and teachingenvironments. Though several theorists have foregrounded the use of produsage inforeign language acquisition (Mora & Leeming, 2013; MacKinnon &Pasfield-Neofitou, 2016), its potential for role-playing in literature classroom is yetto be explored in depth. Furthermore, as a mode of digital produsage whereinstudents can create and write their own texts, Twitter is largely an uncharteredterritory. Studies exploring fan fiction phenomenon mostly as cultural studies offandom, fannish behavior and rituals, and so on mostly turn to fan fiction sites andblogs; Twitter is rarely taken into account as a medium for such activities. Thispaper unpacks the potential of Twitter as a platform for online collaborativelearning—through production and usage—in a literature classroom.
21 Participation, Produsage, and Pedagogy … 227

21.2 Preparing to Write
i. Laying down the rules
Written in 1953 by famous American playwright and Hollywood scriptwriter,Arthur Miller, The Crucible tells the story of Salem witch hunts in 1692. Thecentral themes are religious intolerance, injustice, and mass hysteria. Conceivedduring the height of McCarthyism, The Crucible was also a political intervention inturbulent times. Religious persecution and hysteria in the Miller’s portrayal ofSalem were a thinly veiled comment on political persecution and intolerance of theMcCarthy era. Though its themes are still relevant, the text is fairly dated in termsof its setting and characters. However, it is an important text in America’s literaryhistory tracing race relations, religion, and early colonial society.
The students were assigned the task to adapt this 80-year-old text to the settingof Twitter 2016. The task was undertaken by the students of literature—mostlyfrom the second year of the university. Students were generally familiar with theidea of tweeting though only a few had a Twitter account. Each student adopted acharacter from the play and studied its development, its relationships, and itspositioning vis-à-vis the plot and the setting of Miller’s play. Students also referredto the historical incidents like Salem witch hunts and documents pertaining to theircharacters. In the case of the minor characters and gaps in their narrative, studentswere encouraged to give them a life history and story, quite like the fan fictionpractices.
At the beginning of the project, the teacher set out guidelines. The premise wasto retain the themes of mass hysteria and persecution but relocate them in thecontemporary context. The play was reframed and rewritten on shared documentsbefore being tweeted on online. Each act was tweeted within a day, and the classagreed on a gap of a fortnight between each act.
Apart from the product—the adaption of the play—various other techniquessuch as participation, observation, and journal writing was used to gather additionalinsights.
ii. Taming the Twitter
Twitter was chosen as a social media platform to write the play. Twitter is a socialinformation media network that connects the users to information that they findinteresting. Tweets are short bursts of information, opinions, and messages, up to140 characters in length—a limitation that imitates the mobile phone’s shortmessage service. This feature sets Twitter apart from other writing platforms likeWattapad or the blogs. A tight formal constraint shapes the content and the form ofwriting demanding acute precision and clarity. What is more surprising is the way itis reshaping the rules of composition and performance of twenty-first-century lit-erature. Responding to the extreme word constraint of the platform, writers havecomposed Twitter poems, Twitter microfictions, Twitter novels, and a growing
228 V. Saxena

number of Twitter plays. These genres respond to the dynamics of the Twitteruniverse.
Decentralization lies at the heart of literary experiments on Twitter. A work ofart and freedom of expression moves beyond the purview of authors and publishersto percolate down to the readers and learners. Fan fiction communities exploringtheir favorite texts have already created noncommercial decentralized online plat-forms that are gathering points for collective creativity and expression. Like the fanfiction writers, the students used the characters and the text of Miller’s original playand placed them in the Twitter environment. This change of setting referred to asalternative universe in fiction parlance is common in the fan fiction community.
Another distinctive user-centered feature of Twitter is the idea of following, thatis, users may subscribe to other user’s tweets and subscribers are known as fol-lowers. ‘Following’ means engagement in a real-time communal dialogue, publicand community debates, exchanging suggestions and opinions. For the purpose ofthis task, following each other created a small closed community that imitated asmall village community where rumors float and hysteria is whipped up with a fewutterances. In the Twitter world, ‘following’ might indicate similarity of thoughtsand opinions or interest. It is often an indicator of social popularity. However, theliteral description of ‘following’ as verb suggesting continuous pursuit imitates thecontinuous pursuit of the scapegoats in a rumor-driven community within the play.
While the individual tweets are bound by structural constraint designed inTwitter (like the character limit or the sequential display of tweets), on their ownthey are not sufficient to produce communicational order. Every second, on aver-age, around 6000 feeds are tweeted on Twitter which corresponds to 500 milliontweets per day. Honeycutt and Herring (2009) discuss how Twitter may be expe-rienced as a ‘noisy’ environment, with a constant flood of overheard non sequiturs,with little relevance to the reader, or messages may appear as interwovenconversations.
Twitter literature overcomes the barrier by the use of the @ prefix to refer to aTwitter user, and hashtags (#) are used to categorize tweets by topic or event. Theuse of hashtag #thecrucibletuadp became a means to set the narrative apart fromother random utterances on the platform creating a sequential flow of a narrative.Every character has the extension _TUADP to make them stand out as a part of thisexercise. These tools enabled us to put the feeds together as a part of a singlenarrative.
Apart from these, the tools like memes became handy to express emotion,especially in a virtual drama where the stage asides and emotional reactions arelimited. These remained a key characteristic where the virtual performance differedfrom the theatrical one.
21 Participation, Produsage, and Pedagogy … 229

21.3 Results
The study revealed that student-led digital adaptation of the text helped in achievinglearning outcomes, generating positive perceptions about reading and writing, andempowering the students as creators and writers.
i. Achieving learning outcomes
The novelty of the Twitter as a platform for writing a play made it an ideal tool forreflecting on the elements of the literature. After the preliminary discussions oncharacterization, plot, and setting, the project offered an opportunity to explorethese elements through a reader-response approach. A literary approach focuses onthe reader’s role in creating meaning and her experience of a text, and reader’sresponse recognizes the reader as an active participant in the textual universe (Fish,1982; Iser, 1978).
The project required the students to inhabit the textual universe of Miller’s play,deliberate on its characters, their motivations, their desires, and weaknesses beforethey could place them in the new setting. The students were assigned one or morecharacters from the play, and they had to tweet as their assigned characters. Theydeveloped Twitter usernames and profile photographs and were encouraged toretain the character traits of Miller’s characters. Several students who were assignedminor characters moved beyond the text to conduct research on the characters andhistorical events of Salem 1692 to gain insights. These were then adapted to theTwitter parlance, where the students retained the original character traits like theweak paranoid nature of Reverend Williams, the hot-headedness of Giles Corey andexcessive piety of Elizabeth Proctor. According to one of the students, ‘we reflectedon our characters, think of how they would react in a situation like this, in a worldlike this. And it we started from that point.’
Similarly, the themes of mass hysteria were retained as the text moved Salem1692 to Twitter 2016 though the religious devotion of the puritan colony trans-formed into an obsession with social media and Internet, the closed onlinecommunity.
While the students actively retained these elements from the original text, thestyle and tone underwent a major change. The social tragedy of Miller’s TheCrucible was replaced by tragicomedy in the world of Twitter. Like the religiouscommunity of Salem which is a creator and victim of its rules, the protagonists ofthe new play are immersed in the networked world; they are the creators as well asthe victims of its oppressive conventions which have taken over their real lives.
230 V. Saxena

ii. A cultural and social expression
At any given time, a text is a product of the social and cultural forces of the era fromwhich it emerges. Though it concentrates on Salem witch trials of 1692, Miller’splay a direct attack on McCarthyism. Hence, The Crucible is grounded in itshistorical and cultural context.
The adaptation revealed several themes grounded in the social and culturalmilieu of the students. Here are some snippets from the Twitter play reflectingconcerns that are contemporary and global on issues such as copyrights, spamming,abuse of social media, parental control. The project made the students feelempowered to intervene and voice their concerns.
21 Participation, Produsage, and Pedagogy … 231

Thus with its reflections and commentary on the online world—its addictivenature, cybercrimes like hacking, and issues of parental concern—the adaptationoften turned out to be a metacommentary on its own format and platform.
iii. Assessment
The project integrated conventional classroom assessment with the integratedperformance-based assessment. The three modes of communication in an integratedperformance-based assessment—interpersonal, interpretive, and presentational—were integrated as students applied the knowledge and skills they developed duringthe classroom discussions into the writing of the new play. The students read anddiscussed Miller’s play before adapting it to the new paradigm in a way that thethemes of the adaptation resonated with that of the original play. This interpersonal,interpretive stage was then followed by a presentational stage, wherein the studentstweeted the drama as the characters of the play.
This raises the question broached by many assessment researchers of how toassess individual student’s participation. In this case, the collaborative adaptationwas used as a tool for the students to articulate their developing understanding ofthe literary elements and the key themes of the text. Journals were used to assessstudent’s reflection on the original play, their understanding of literary elementssuch as characterization, setting and conflict, authorship, and the experience ofwriting a play in a new format.
For instance, commenting on the limitations of their new play in his journal, oneof the students felt that though the intention and tone had changed completely, theadaptation retained the subtext of paranoia and suspicion that marked Miller’s play.Another journal commented on the lack of single unifying authorial point of viewwhich is one of the main drawbacks of their adaptation. Reflecting on the dramaticelements of the performance in her journal, one of the students commented on theinability to integrate stage asides and murmurs and the inadequacy of the memes asa physical expression of the emotions.
Thus, the process of writing a digital adaption encouraged a deep level ofreflections and engagement with the given text. Performance-based methodalongside the conventional assessment consisting of literary analysis and essaywriting ensured that digital activities and the reflections were indeed leaving everystudent with enduring understanding of both the text and the targeted literaryconcepts.
21.4 Discussion
Interest-driven close-knit communities in an informal learning environment lead tohighly motivated and active participation (Ito et al. 2009). They create a partici-patory culture where members believe their contributions matter (Jenkins, 2006).Similar perceptions were built within the classroom during the task: Students
21 Participation, Produsage, and Pedagogy … 233

steadily increased in their ability to reflect on the character and how he/she wouldreact to a situation. There were discussions on style and tone suited to the character.Different tools offered by Twitter became tools for digital enactment. For example,one of the students came up with the idea of retweets to imitate rumor mongering.
The ease with which the students embraced the idea and the excitement duringthe process of creating the digital adaptation drove the project toward its comple-tion. In the process of student-led content creation, several traditional dichotomies—author–reader, producer–consumer, teacher–learner—are collapsed. The learningduring the process was collaborative, peer-led, and reflexive. Each collaborator–creator recognized her role as one among a number of others. Like the collaborativerelationships of produsage, these relationships were heterarchical; that is, themembers existed in unranked position and remained fluid as they took over differentroles and capacities during the process.
Instead of hierarchy that marks conventional pedagogy (driven by the text andthe teacher), collaborative pedagogy engaged critical and communicative capacitiesof the students. One of the students in his journal reflected on the ways to write adrama on other digital platforms like Instagram. Another is more vocal in herjournal:
I have always enjoyed literature but some part of me have always associated it withold-fashioned plays, poetry and novels Since then, l feel like my eyes have opened to awhole new world of language. It is at once the same prim and proper art I remember andrenewed slang of the current generation. I have heard that some people study better byapplication. I have recently discovered that I am one of these active learners and this projecthas definitely helped me better understand literature. I think it is actually pretty cool that wemanaged to turn an old play into this modern Twitter version. The best thing about this wasthat it didn’t even feel much like work because I enjoyed the process so much.
Thus, peer-led content creation enabled the students to develop informed,self-reflexive, and critical perspectives on their curriculum as well as their ownonline activities.
It led to the reconsideration of the nature of a literary text. Miller’s play TheCrucible no longer confined to being a masterpiece tied to a historic era. TheTwitter adaptation broke the barrier of intimidation that classical works of literatureevoke. The text became approachable, readable, and rewriteable.
This decentralization opened the text to a multiplicity of meanings which is acharacteristic of online storytelling: ‘Hypertextual environment of storytelling onthe Net turns from linear, structured and hierarchical forms of storytelling towards adecentralized and changeable media where the narratives constantly shift along withthe hyperlinks. Constantly in flux, and renewing itself with each narrative, theInternet offers a world where stories are never complete. There are possibilities forendless versions’ (Saxena, 2012).
In a project like this, the teacher plays an essential role not in terms of impartinginformation but of providing thematic support and enabling the organization of thetask. Addressing the role of a teacher in empowering adolescent literacy, Bean andHarper (2004) insist that recent technological shifts have brought about a funda-mental shift in what it looks like to be a reader and writer and what literacy skills
234 V. Saxena

look like in these changing times. It has raised the need to reassess the role of ateacher in the contemporary scenario. According to Bruns, the teacher’s role in thetwenty-first-century classroom is that of facilitating systematic development ofknowledge and creating a space for a more user-led and learner-centered experi-ence. During the task, when student expressed their reservations about usingTwitter, the teacher’s ability to explain the pedagogical outcomes had a significantimpact. As a participant observer, the teacher was able to observe the developmentof the script, suggest changes, and encourage reflections on the text—the original aswell as the adaptation. The aim of the teacher during the task was to strike aneffective balance between creative freedom and appropriate guidance.
21.5 Limitations and Recommendations
This research involved a group of 15 students pursuing literature in a tertiaryeducational environment. Though most of the students were new to Twitter, theywere familiar with the dynamics of social media and its usage. Since all of them hadbeen using platforms such as Facebook, Instagram, and others, the stylistics ofcommunication, the interactional undercurrents within a virtual community werenot a novelty. From the initial stages, memes, emoticons, and other Twitter ele-ments such as ‘retweet’ and ‘like’ became tools of expressions. Hence, for studentswell versed with social media, adapting to a new platform like Twitter was only amatter of adapting to a different interface.
Similar strategies like adaptations and role-playing wherein a text, or a particularsituation or a debate is analyzed as students assume different personas and presentdifferent perspectives. Then, there is a reader-response blogging which is particu-larly effective given the instantaneous nature of response. The exercise wouldencourage an open-minded approach. The public nature of Twitter provides aplatform that is truly global, and sharing their views, ideas, and texts here couldhelp in the development of worldliness and responsibility that goes along with thefreedom that social media offers and youngsters love.
One of the greatest limitations in the integration of social media in an educa-tional setup is the accessibility of the new media technologies and the opportunitiesfor participation they present. Running a similar project in institutions with limitedtechnical support and connectivity would require a different kind of preparation andmanipulation of resources.
Student’s safety and security in the online environment, and monitoring infor-mation and material accessed during the online sessions bring to fore the ethicalissues concerning the use of technology in education. The exercise encouraged thestudents to reflect on these issues as evident from the reference to cybercrimes inthe student adaptation of the play. The role of the instructor is especially importantin a developing the rules, regulations, and an acceptable use policy.
21 Participation, Produsage, and Pedagogy … 235

21.6 Conclusion
In Phaedrus, Plato’s anxiety overwritten word as a threat to memory captures theduality that underscores media and technological innovation. Just as the emergenceof written word affected the oral traditions, and the emergence of print had afar-reaching impact on the written word, the rise of new media has changed ourrelationship to the printed text. Every new form of media reframes the existingpattern of collective life, its patterns of production, and dissemination of infor-mation. The current form of interactive reading upsets several traditional equations.Unlike the academic and scholarly modes of critique and analysis, digital adaptationenabled the students to engage with Miller’s text on its own turf. The drama wasunderstood and interpreted through the process of writing another drama thatanalyzed, read, and at times misread the source. It also empowered the students toinsert the concerns and issues of their world into the text as they talked about theirown online activities and dangers lurking in that unguarded world.
The activity required a careful reconsideration of the role of the teacher. Bruns(2007a, b) insists that ‘educators must learn to become guides through a wealth ofalways already available information, rather than hanging on in any way tolong-outdated notions of the teacher as controlling what information and knowledgestudents do or do not encounter.’
In an article written in 1999 considering the rapid evolution of technology and itsimpact on education, Cynthia Selfe insists that we must not only teach with tech-nology but closely examine the implications of such technologies. Selfe posits thatstudents must be encouraged to view technology from a critical stance. This projectwas initiated with the aim of encouraging student participation in a literatureclassroom by placing a literary text within the social and cultural milieu of thestudents. Instead of traditional reading, discussion, analysis, and essay writing, theproject aimed at a deeper engagement with the curriculum text, much like the waythe students engage with their favorite texts in the online environments. Embeddingthese dynamics of participatory culture in the classroom was successful in gener-ating high motivation and collaboration. At the same time, the students grasped theliterary concepts and themes in the play through discussions within and outside theclassroom.
A reconfiguration of teaching practice that places the student/reader as a passivereceiver of information from the teacher/author into a more democratic process inline with the principles of produsage can be viewed as a challenge. It undoes thetraditional models of pedagogy which centers on the text and the teacher andenables an exploration of a new model of participatory, collaborative pedagogywhich aligns with and values student interest.
236 V. Saxena

References
Bean, T. W., & Harper, H. J. (2004). Teacher education and adolescent literacy. In T. L. Jetton &J. A. Dole (Eds.), Adolescent literacy research and practice (pp. 392–411). New York:Guilford Press.
Bruns, A. (2007a, June). Produsage: Towards a broader framework for user-led content creation.In Proceedings of Creativity & Cognition, Washington DC. http://eprints.qut.edu.au
Bruns, A. (2007b). Produsage, generation C, and their effects on the democratic process. InProceedings of Media in Transition, MIT, Boston. http://eprints.qut.edu.au
Bruns, A., & Humphreys, S. (2005, October). Wikis in teaching and assessment: TheM/Cyclopedia project. In Paper in International Wiki Symposium, San Diego.
Campbell, L. (2016, March). Self-published titles ‘22% of UK e-book market.’ The Bookseller.Retrieved from http://www.thebookseller.com/news/self-published-titles-22-e-book-market-325152
Fish, Stanley. (1982). Is There a Text in This Class? The Authority of Interpretive Communities.Cambridge, Ma: Harvard University Press.
Gee, J. P., & Hayes, E. R. (2011). Language and learning in the digital age. London: Taylor &Francis.
Inderjit, S. (2014). Reading trends and improving reading skills among students in Malaysia.International Journal for Research in Social Science, 3(5). http://www.ijsk.org/uploads/3/1/1/7/3117743/6_reading_skills.pdf
Iser, W. (1978). The Act of Reading: a theory of aesthetic response. London and Henley:Routledge and Kegan Paul.
Ito, M., Baumer, S., Bittani, M., Boyd, D., Cody, R., & Herr-Stephenson, B. (2009). Hanging out,messing around, and geeking out: Kids living and learning with new media. Cambridge: MITPress. http://www.mwsmediapodcasts.com/media/documents/digitalyouth/hangingoutmessingaroundgeekingout.pdf
Jenkins, H. (2006). Convergence culture: Where old and new media collide. London/New York:New York University Press.
MacKinnon, T., Pasfield-Neofitou, S., Manns, H., & Grant, S. (2016). A meta-analysis of openeducational communities of practice and sustainability in higher educational policy.Apprentissage des langues et systèmes d’information et de communication (Alsic), 19:1.http://alsic.revues.org/2908
Mora, M. D. I., & Leeming, D. E. (2013). A case study into learner engagement in the productionof OERs within an online language environment. In A. Beaven, A. ComasQuinn, & B. Sawhill(Eds.), Case studies of openness in the language classroom (pp. 149–161). Retrieved fromhttp://research-publishing.net/publications/2013-beaven-comas-quinnsawhill/
Prensky, M. (2001). Digital natives, digital immigrants. In On the Horizon, October 2001, 9 (5).Lincoln: NCB University Press.
Plato. 360 BCE. Phaedrus. Translated by Benjamin Jowett. Retrieved from http://classics.mit.edu/Plato/phaedrus.html
Saxena, V. (2012). And the story goes on…. Harry Potter and Online Fan Fiction. Technoculture:An online Journal of Technology in Society. Vol. 2. https://tcjournal.org/drupal/vol2/saxena
Selfe, C. L. (1999). Technology and literacy in the twenty-first century: The importance of payingattention. Carbondale, IL: Southern Illinois University Press.
Tarbox, Gwen Athene. (2014). Just a figment? Online participatory communities and the future ofthe young adult novel. In B. Carrington & J. Harding (Eds.), Beyond the book: Transformingchildren’s literature (pp. 54–61). New Castle: Cambridge Scholars Publishing.
Trendwatching.com. (2005). Generation C. http://www.trendwatching.com/trends/GENERATION_C.htm
Wattapad Pressroom retrieved on October 15, 2016. https://www.wattpad.com/press/Wolf, M. (2007). Proust and the Squid. Cambridge: Icon Books.
21 Participation, Produsage, and Pedagogy … 237

Chapter 22WikiDoc—Integrating WikipediaSemantic for Document Assistance
Jer Lang Hong
Abstract Most conventional readable documents are written in plain text. Theauthor of these documents assumed that the audience have sufficient knowledge inorder to understand it. However, this assumption may not necessary be true. In thispaper, we develop a word tagging technique where those highly technical words aretagged with pop-up boxes containing specific explanation of the word. The taggingis done using semantic in Wikipedia, where the meaning of the word can be fullyexploited based on their semantic. Study shows that our method is highly effectivein helping the users to learn the technical details on the documents.
Keywords Web semantic � Wikipedia � E-Learning
22.1 Introduction
With the advent of Internet technologies, content has been made easily accessibleand users can conveniently obtain information anywhere in any location of theirchoice. The development of smart mobile devices and the wide availability of largeand fast Internet coverage have made it possible to access a high bandwidth Website. However, the navigation and user-friendliness of browsing a Web page remainthe same. To improve on the usability of a Web site, developers introduce Web 2.0technologies to ease the users for navigating a Web site. Web 2.0 includesstate-of-the-art technologies where dynamic server-side scripts are used to displayhighly responsive Web contents. In addition to that, Web 2.0 introduces person-alization where a Web site could adapt to user’s behavior and browsing patterns.
Recently, Web Semantic has been introduced where the contents of the Web areindexed and labelled with meta-data tagging. Unlike previous Web page wherecontents are generated in a static manner, Web Semantic categorized data into theirlogical unit identities, where they are grouped according to their semantics.
J.L. Hong (&)Taylor’s University, Subang Jaya, Kuala Lumpur, Malaysiae-mail: [email protected]
© Springer Nature Singapore Pte Ltd. 2018S.F. Tang and S.E. Cheah (eds.), Redesigning Learning for GreaterSocial Impact, DOI 10.1007/978-981-10-4223-2_22
239
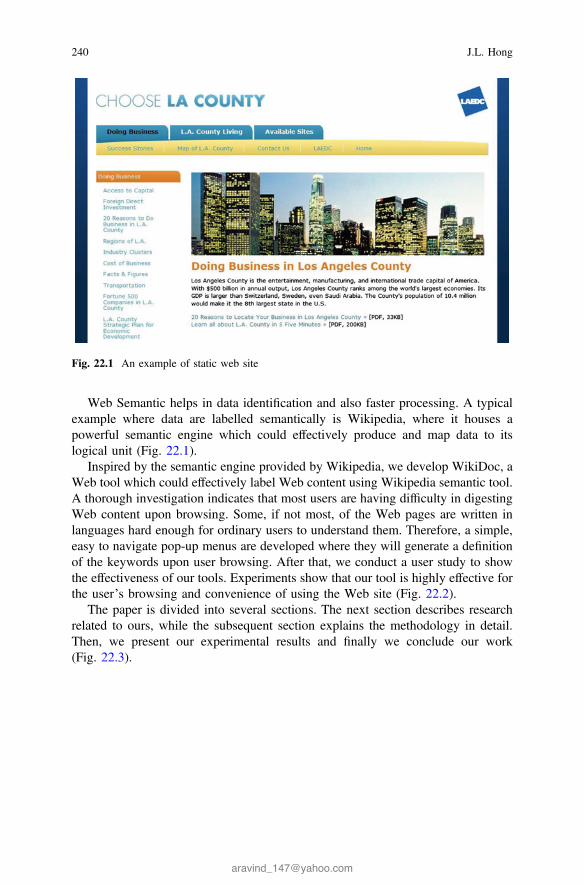
Web Semantic helps in data identification and also faster processing. A typicalexample where data are labelled semantically is Wikipedia, where it houses apowerful semantic engine which could effectively produce and map data to itslogical unit (Fig. 22.1).
Inspired by the semantic engine provided by Wikipedia, we develop WikiDoc, aWeb tool which could effectively label Web content using Wikipedia semantic tool.A thorough investigation indicates that most users are having difficulty in digestingWeb content upon browsing. Some, if not most, of the Web pages are written inlanguages hard enough for ordinary users to understand them. Therefore, a simple,easy to navigate pop-up menus are developed where they will generate a definitionof the keywords upon user browsing. After that, we conduct a user study to showthe effectiveness of our tools. Experiments show that our tool is highly effective forthe user’s browsing and convenience of using the Web site (Fig. 22.2).
The paper is divided into several sections. The next section describes researchrelated to ours, while the subsequent section explains the methodology in detail.Then, we present our experimental results and finally we conclude our work(Fig. 22.3).
Fig. 22.1 An example of static web site
240 J.L. Hong
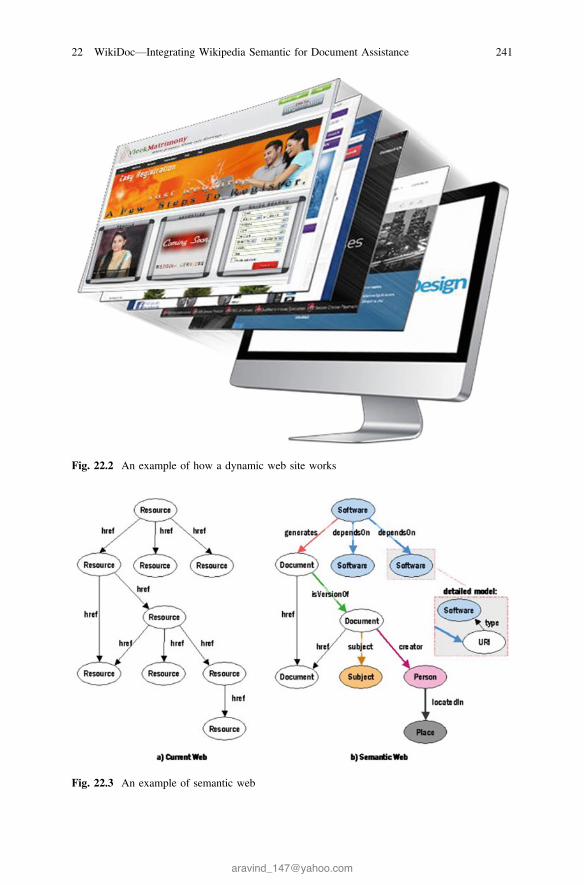
Fig. 22.2 An example of how a dynamic web site works
Fig. 22.3 An example of semantic web
22 WikiDoc—Integrating Wikipedia Semantic for Document Assistance 241

22.2 Related Work
Research in semantic has grown rapidly since 1990s. With the state-of-the-artsemantic tool in Wikipedia, users can now easily format and process their data byconnecting and accessing the API provided by Wiki. To check the semantic ofwords, word similarity matching is used to check whether two words are matched.For example, the words dog and cat should match to 70% similar as both cat anddog share certain similarities (e.g., four legs, mammal, tail, pet).
Several state-of-the-art word similarities techniques have been developed. Theyare all efficient methods but with differences in implementation. In general,semantic matching of words is categorized into four categories. The first categorymeasures the similarity of words using two terms (concepts) which serves asfunction of the length of the path between the terms and the position of the terms inthe taxonomy (Rada, Mili, Bicknell, & Blettner, 1989), (Wu & Palmer, 1994). Inthe second category, the similarity checking is carried out by checking the differ-ence in information content of the two terms using a probabilistic function (Leacock& Martin, 1998), (Lord, Stevens, Brass, & CA, 2003). For this group, they uselexical database for English WordNet (Fellbaum, 1998) (several other ontologytools exist such as CYC1, DO LCE2, YAGO3, Euro WordNet4) to calculate theprobabilistic function. For the third category, similarity of words is measured usingthe two terms as a function of their properties (e.g., gloss overlap) or based on theirrelationship with other similar terms in the taxonomy. Finally, the last category usesthe combination of the methods mentioned earlier (hybrid) (Rodriguez &Egenhofer, 2003) for similarity checking. Some of the state-of-the-art algorithmsare developed by Jiang and Conrath (1997), Hirst and St-Onge (1998), and Leacockand Chodorow (Leacock & Martin, 1998). A survey (Budanitsky & Hirst, 2001)was carried out to evaluate the effectiveness of these algorithms. This survey showsthat the algorithm of Jiang and Conrath performs better than other existing algo-rithms for matching two words.
22.3 Proposed Methodology
22.3.1 Overview
First, we develop a parser to parse through the HTML Web pages generated by theserver side scripts. The parser detects the HTML file and divides the content intotwo types: the tag and the text tokens. The parser then constructs a tree structure
1(2010). [Online]. Available: http://www.cyc.com2(2010). [Online]. Available: http://www.loa-cnr.it/DOLCE.html3(2010). [Online]. Available: http://www.ontologyportal.org/4(2010). [Online]. Available: http://www.illc.uva.nl/EuroWordNet/
242 J.L. Hong
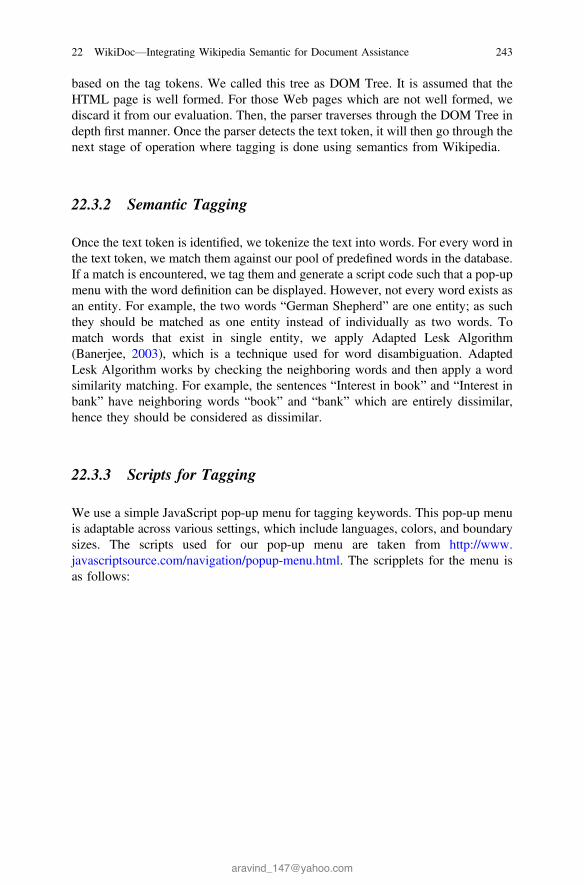
based on the tag tokens. We called this tree as DOM Tree. It is assumed that theHTML page is well formed. For those Web pages which are not well formed, wediscard it from our evaluation. Then, the parser traverses through the DOM Tree indepth first manner. Once the parser detects the text token, it will then go through thenext stage of operation where tagging is done using semantics from Wikipedia.
22.3.2 Semantic Tagging
Once the text token is identified, we tokenize the text into words. For every word inthe text token, we match them against our pool of predefined words in the database.If a match is encountered, we tag them and generate a script code such that a pop-upmenu with the word definition can be displayed. However, not every word exists asan entity. For example, the two words “German Shepherd” are one entity; as suchthey should be matched as one entity instead of individually as two words. Tomatch words that exist in single entity, we apply Adapted Lesk Algorithm(Banerjee, 2003), which is a technique used for word disambiguation. AdaptedLesk Algorithm works by checking the neighboring words and then apply a wordsimilarity matching. For example, the sentences “Interest in book” and “Interest inbank” have neighboring words “book” and “bank” which are entirely dissimilar,hence they should be considered as dissimilar.
22.3.3 Scripts for Tagging
We use a simple JavaScript pop-up menu for tagging keywords. This pop-up menuis adaptable across various settings, which include languages, colors, and boundarysizes. The scripts used for our pop-up menu are taken from http://www.javascriptsource.com/navigation/popup-menu.html. The scripplets for the menu isas follows:
22 WikiDoc—Integrating Wikipedia Semantic for Document Assistance 243

<HEAD>
<script type="text/javascript"> <!--var ie = document.allvar ns6 = document.getElementById&&!document.all var isMenu = false ; var menuSelObj = null ; var overpopupmenu = false;function mouseSelect(e){
var obj = ns6 ? e.target.parentNode : event.srcElement.parentElement; if( isMenu ) {
if( overpopupmenu == false ) {
isMenu = false ; overpopupmenu = false; document.getElementById('menudiv').style.display = "none" ; return true ;
}return true ;
}return false;
}// POP UP MENUfunction ItemSelMenu(e){
var obj = ns6 ? e.target.parentNode : event.srcElement.parentElement;menuSelObj = obj ;
if (ns6) {
document.getElementById('menudiv').style.left e.clientX+document.body.scrollLeft;
document.getElementById('menudiv').style.top e.clientY+document.body.scrollTop;
} else{
document.getElementById('menudiv').style.pixelLeft event.clientX+document.body.scrollLeft;
document.getElementById('menudiv').style.pixelTop event.clientY+document.body.scrollTop;
} document.getElementById('menudiv').style.display = "";
244 J.L. Hong

document.getElementById('item1').style.backgroundColor='#FFFFFF';document.getElementById('item2').style.backgroundColor='#FFFFFF'; document.getElementById('item3').style.backgroundColor='#FFFFFF'; document.getElementById('item4').style.backgroundColor='#FFFFFF'; isMenu = true;return false ;
} document.onmousedown = mouseSelect; document.oncontextmenu = ItemSelMenu; //--> </script></HEAD>
<BODY>
<div id="menudiv" style="position:absolute; display:none; top:0px; left:0px;z- index:10000;" onmouseover="javascript:overpopupmenu=true;" onmouseout="javascript:overpopupmenu=false;"> <table width=82 cellspacing=1 cellpadding=0 bgcolor=lightgray>
<tr><td><table width=80 cellspacing=0 cellpadding=0>
<tr><td id="item1" bgcolor="#FFFFFF" width="80" height="16"
onMouseOver="this.style.backgroundColor='#EFEFEF'"onMouseOut="this.style.backgroundColor='#FFFFFF'"> <a href="#">Item1</a></td>
</tr><tr><td id="item2" bgcolor="#FFFFFF" width="80" height="16"
onMouseOver="this.style.backgroundColor='#EFEFEF'"onMouseOut="this.style.backgroundColor='#FFFFFF'"> <a href="#">Item2</a></td>
</tr><tr><td id="item3" bgcolor="#FFFFFF" width="80" height="16"
onMouseOver="this.style.backgroundColor='#EFEFEF'"onMouseOut="this.style.backgroundColor='#FFFFFF'"> <a href="#">Item3</a></td>
</tr><tr><td id="item4" bgcolor="#ffffff" width="80" height="16"
onMouseOver="this.style.backgroundColor='#EFEFEF'"onMouseOut="this.style.backgroundColor='#FFFFFF'"> <a href="#">Item
22 WikiDoc—Integrating Wikipedia Semantic for Document Assistance 245

4</a></td></tr>
</table></td></tr>
</table></div>
<p><center> <font face="arial, helvetica" size"-2">Free JavaScripts provided<br> by <a href="http://javascriptsource.com">The JavaScript Source</a></font></center><p>
22.4 Experiments
We conduct a user study to evaluate the effectiveness of our system. A randomusers size of 20 are taken to evaluate our system on the user-friendliness andusability of our system. The demographic of our users are given in Tables 1 and 2.
As can be seen from (Tables 22.1 and 22.2), we choose users from diversebackground with different skills and mindset. Preference was taken to select userswho are IT savvy and in the age group of 20–30. Users are briefed on the onlinesystem and its functionalities. They are given a grace period of 2 h to use thesystem and give feedback on it. A survey form is given to them where an evaluationscore of 1–5 is given for each particular features they evaluated.
Table 22.1 Users age group Age range Number
15–20 1
20–25 8
25–30 6
30–35 4
>35 1
Table 22.2 Skills set ofusers
Skills Number
Engineering 4
Computing 8
Business 6
Others 2
246 J.L. Hong
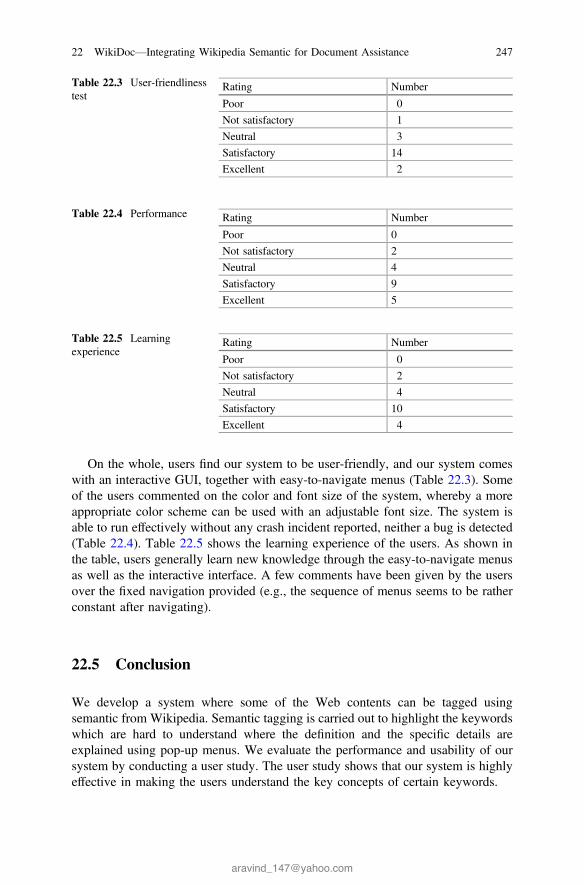
On the whole, users find our system to be user-friendly, and our system comeswith an interactive GUI, together with easy-to-navigate menus (Table 22.3). Someof the users commented on the color and font size of the system, whereby a moreappropriate color scheme can be used with an adjustable font size. The system isable to run effectively without any crash incident reported, neither a bug is detected(Table 22.4). Table 22.5 shows the learning experience of the users. As shown inthe table, users generally learn new knowledge through the easy-to-navigate menusas well as the interactive interface. A few comments have been given by the usersover the fixed navigation provided (e.g., the sequence of menus seems to be ratherconstant after navigating).
22.5 Conclusion
We develop a system where some of the Web contents can be tagged usingsemantic from Wikipedia. Semantic tagging is carried out to highlight the keywordswhich are hard to understand where the definition and the specific details areexplained using pop-up menus. We evaluate the performance and usability of oursystem by conducting a user study. The user study shows that our system is highlyeffective in making the users understand the key concepts of certain keywords.
Table 22.3 User-friendlinesstest
Rating Number
Poor 0
Not satisfactory 1
Neutral 3
Satisfactory 14
Excellent 2
Table 22.4 Performance Rating Number
Poor 0
Not satisfactory 2
Neutral 4
Satisfactory 9
Excellent 5
Table 22.5 Learningexperience
Rating Number
Poor 0
Not satisfactory 2
Neutral 4
Satisfactory 10
Excellent 4
22 WikiDoc—Integrating Wikipedia Semantic for Document Assistance 247

References
Banerjee, S. (2003). Extended gloss overlaps as a measure of semantic relatedness. In Proceedingsof the ACM IJCAI, pp. 805–810.
Budanitsky, A., & Hirst G. (2001). Semantic distance in wordnet: An experimental,application-oriented evaluation of five measures. In Proceedings of the NAACL, This articlehas been accepted for inclusion in a future issue of this journal, (pp. 29–34). Content is final aspresented, with the exception of pagination.
Fellbaum, C. (1998). WordNet: An electronic lexical database. Cambridge, MA: MIT Press.Hirst, G., & St-Onge, D. (1998). Lexical chains as representations of context for the detection and
correction of malapropisms. Cambridge, MA: MIT Press.Jiang, J. J., & Conrath, D. W. (1997). Semantic similarity based on corpus statistics and lexical
taxonomy. In Proceedings of International Conference Research on Computational Linguistics(pp. 19–33).
Leacock, C., & Martin, C. (1998). Combining Local Context and WordNet Similarity for WordSense Identification. Cambridge, MA: MIT Press.
Lord, P. W., Stevens, R. D., Brass, A., & Goble, C. A. (2003). Investigating semantic similaritymeasures across the gene ontology: the relationship between sequence and annotation”.Bioinformatics, 19, 1275–1283.
Rada, R., Mili, H., Bicknell, E., & Blettner, M. (1989). Development and application of a metricon semantic nets. IEEE Transaction Systems, Man, and Cybernetics, 19(1), 17–30.
Rodriguez, M., & Egenhofer, M. (2003). Determining semantic similarity among entity classesfrom different ontologies. IEEE Transaction Knowledge and Data Engineering, 15(2), 442–456.
Wu, Z., & Palmer, M. (1994). Verb semantics and lexical selection. In Proceeding of the AnnualMeeting Association Computational Linguistics, pp. 133–138.
248 J.L. Hong

Chapter 23Supervised Educational Data Miningto Discover Students’ Learning Processto Improve Students’ Performance
Ching Chieh Kiu
Abstract Online learning has social impact on students. Some students mightexperience impoverished learning due to high social isolation, less face-to-faceinteraction, difficulty in performing teamwork activities, low understanding, andlack of concentration on learning activities. However, some students can thrive ononline learning. Knowledge discovery from students’ event logs generated fromtheir online learning can help to understand their level of understanding and con-centration on the learning subject. Subsequently, this knowledge can be used topredict students’ academic performance on their final grade. This paper presentssupervised educational data mining, namely J48 decision tree approach to classifystudents based on their learning process and activities extracted from event logs inonline learning system to predict their final grade. The generated model can be usedto offer helpful recommendations to improve students’ learning process and aca-demic performance, especially to students that experience impoverished learning,and it also allows instructors to provide appropriate feedbacks and advice to thestudents in a timely manner.
Keywords Online learning � Social impact � Educational data mining � Learningprocess
23.1 Introduction
The emergent of Web-based educational technologies changes the process ofteaching and learning in higher learning institute. Web-based systems provide amaterials-based educational experience to simulate online learning. Online learninghas social impact on students, whereas it can impact and affect their learning processon learning activities. Because different students have a different learning style andprocess, some students can thrive on online learning environment, while other stu-
C.C. Kiu (&)School of Computing & IT, Taylors University, Subang Jaya, Malaysiae-mail: [email protected]
© Springer Nature Singapore Pte Ltd. 2018S.F. Tang and S.E. Cheah (eds.), Redesigning Learning for GreaterSocial Impact, DOI 10.1007/978-981-10-4223-2_23
249

dents might experience impoverished learning due to the difficulty in understanding,lack of concentration on the learning activities, high social isolation, less face-to-faceinteraction, and difficulty in performing teamwork activities in online learningenvironment (Aragon, Johnson, & Shaik, 2002; Lynch, 1999; Wosnitza & Volet,2005; Zhang, Zhou, Briggs, & Nunamaker, 2006). The social impact of onlinelearning is summarized in Table 23.1.
Through Web-based education systems, a vast educational data that describestudents’ learning pattern, process, and activities (click stream, taking tests, reading,etc.) are collected. The discovered knowledge from educational data using educa-tional data mining (EDM) can be used to understand social impact in students’learning process, such as their understanding and concentration level on thelearning topics. It also provides helpful recommendations to improve students’academic performance.
According to Scheuer and McLaren (2012), EDM is applied on educational datato identify variety of problems in educational research and technology developmentas summarized below:
1. Scientific inquiry and system evaluation2. Determining student model parameters3. Informing domain models4. Creating diagnosis models5. Creating reports and alerts for instructors, students, and other stakeholders6. Recommending resources and activities.
23.2 Related Works
EDM is the application of data mining for exploring educational data in order tounderstand how student responds to educational system and how their responsesimpact their learning (Kashyap & Chauhan, 2015). Zaiane and Luo (2001)exploited advanced data mining techniques to extract useful patterns from Webaccess logs. The discovered knowledge is used by instructors to evaluate andinterpret online course activities of their students in order to assess the learningprocess and to measure effectiveness of Web course structure.
Table 23.1 Comparison of social impact of online learning and traditional learning
Social impact Online learning Traditional learning
Social isolation High Low
Face-to-face interaction Less High
Teamwork activities Difficult to perform Easy to perform
Concentration Low High
Understanding High Medium
250 C.C. Kiu

Mukala, Buijs, Leemans, and van der Aalst (2015) applied fuzzy miner to dis-cover students’ learning behavior to understand their performance. Their analysisindicated that students always watch videos in the recommended sequence and inbatch performed better than students skipped videos or procrastinate in watchingvideos.
Al-Radaideh, Al-Shawakfa, and Al-Najjar (2006) used decision tree to generateclassification rule to predict students’ final grade in a course. Three differentclassification methods, namely ID3, C4.5, and the Naive Bayes, were applied toclassify the data set collected from C++ course in Yarmouk University, Jordan, inthe year 2005. The outcome indicated that ID3 decision tree model had betterprediction than the C4.5 model and the Naive Bayes models.
Bhardwaj and Pal (2012) conducted Bayesian classification method on data setwhich consisted of 300 students from 5 different degree colleges conducting BCA(Bachelor of Computer Application) to predict students’ performance. The studyshowed that academic performances of the students are not always depending ontheir own effort. The result discovered the factors such as students’ grade in a seniorsecondary examination, living location, medium of teaching, mother’s qualification,students’ other habit, family annual income, and student’s family status, which werehighly correlated with the students’ academic performance.
Other than fuzzy algorithm, decision tree approach, and Bayesian classificationapplied in educational data mining, k-mean clustering (Ayesha, Mustafa, Sattar, &Khan, 2010), and association rules (Merceron & Yacef, 2005; Minaei-Bidgoli,Kashy, Kortemeyer, & Punch, 2003; Wang, 2006) are also used to performknowledge discovery on students’ performance.
Comprised of the related works described above, we presented supervised EDM,namely J48 decision tree approach, to discover students’ learning process fromevent logs. The event logs used in this demonstration is discussed in Sect. 23.3.Subsequently, Sect. 23.4 explains knowledge discovery from students’ learningprocess, and Sect. 23.5 concludes the paper with future works.
23.3 Event Logs from Online Learning Activities
The event logs used as an example in this demonstration is a data set that containsthe students’ time series of activities during six sessions of laboratory sessions ofthe course of digital electronics (Siemens & Baker, 2012). The data set is collectedby recording 115 subjects’ activities through a logging application while learningwith an educational simulator. The details of event logs are summarized inTable 23.2, and the exemplar of event logs is depicted in Table 23.3.
23 Supervised Educational Data Mining to Discover Students’ … 251

Table 23.2 Summary details of event logs
Number of instances 230,318
Number of students 115
Number of students attended final examination 62
Session 1 (4 topics) 77
Session 2 (6 topics) 82
Session 3 (4 topics) 87
Session 4 (5 topics) 99
Session 5 (4 topics) 91
Session 6 (6 topics) 66
Table 23.3 Sample of event logs data
Session StudentID
Exercise Activity Start time End time … Mousemovement
Keystroke
Student
1 1 Es Other 2.10.201411:25:33
2.10.201411:25:34
… 84 0
1 1 Es Aulaweb 2.10.201411:25:35
2.10.201411:25:42
… 397 0
1 1 Es Blank 2.10.201411:25:43
2.10.201411:25:43
… 59 0
… … … … … … … … …
… … … … … … … … …
Student ID Session 2 Session 3 Session 4 Session 5 Session 6
Intermediate grade
1 5.0 0.0 4.5 4.0 2.25
2 4.0 3.5 4.5 4.0 1.00
3 3.5 3.5 4.5 4.0 0.00
… … … … … …
… … … … … …
StudentID
ES 1.1 (2points)
ES 1.2 (3points)
ES 2.1 (2points)
… ES 6.2 (15points)
Total (100points)
Final grade
1 2.00 3.00 1.00 … 13.00 94.5
2 2.00 3.00 2.00 … 0.00 44.0
4 2.00 3.00 1.00 … 5.00 30.0
… … … … … … …
… … … … … … …
252 C.C. Kiu

23.4 Knowledge Discovery from Students’ LearningProcess
Weka (Hall, Frank, Holmes, Pfahringer, Reutemann, & Witten, 2009) data miningtool is used to mining the event logs: (1) to discover students’ learning process and(2) to generate classification model using J48 decision tree algorithm to predictstudents’ final grade performance. Data preprocessing and attribute selecting orfiltering are applied before data visualization and data mining step.
23.4.1 Discover Students’ Learning Process
Using Weka visualization panes, a student learning process can be summarized andaggregated as shown in Figs. 23.1 and 23.2. Through the process of data prepro-cessing and attribute selecting or filtering, the data set of students’ learning processoccurred in 6 sessions which consisted of 13 attributes (session, student_Id, exer-cise, activity, start_time, end_time, idle_time, mouse_wheel, mouse_wheel_click,mouse_click_left, mouse_click_right, mouse_movement, and keystroke) is elimi-nated to 3 attributes (session, exercise, and activity). Session attribute is convertedfrom numeric to nominal category.
From Figs. 23.1 and 23.2, we can discover that the student only attended 5sessions of the learning activities and absented in session 3. It also discovers thestudent only studied 3 topics out of 6 topics in session 6, meanwhile studied alltopics in other sessions. The frequency of the student engagement in each session,exercise, and activity can be directly illustrated in Fig. 23.1; meanwhile, the detailinformation of each attribute can be illustrated in Fig. 23.2. The student frequency
Fig. 23.1 Visualization of a student learning process
23 Supervised Educational Data Mining to Discover Students’ … 253

can be used to analyze and predict his level of understanding and concentration onhis learning process. This discovered knowledge allows instructors to provideappropriate feedbacks and advice to the students in a timely manner during hislearning process on the subject.
23.4.2 Classification Model to Predict Students’Performance
Supervised data mining, J48 decision tree algorithm (Drazin & Montag, 2012), isapplied to mining the event logs to generate classification models to predict
Fig. 23.2 Detail summarization of a session, b exercise, and c activity attributes
254 C.C. Kiu

students’ final grade. In Weka, J48 decision tree is implemented using C4.5 deci-sion tree algorithm. The algorithm used a divide and conquer approach to developdecision tree. Data preprocessing is applied before implementing J48 decision treeto classify the data. In the data preprocessing process, final grades are manuallydiscretized into nominal attributes. Using training set is selected as a test option togenerate classification models.
In this experiment, two classification models are generated as shown inFigs. 23.3 and 23.4, and their classification rules are, respectively, presented inTables 23.4 and 23.5. From the classifier accuracy presented in Table 23.6, it isindicated that Model 2 is more precise to be used for predicting students’ perfor-mance as it has higher precision value. However, as depicted in Table 23.6, theclassifier accuracy of both models are useful for identifying students who are likelyto fail based on students’ learning activities in each learning session or based onstudents’ achievement on their intermediate grades. Hence, proper feedbacks andadvice are to be consulted to these students as to improve their result and academicperformance. Overall, the generated models can offer helpful recommendations toimprove students’ learning process and academic performance.
Fig. 23.3 Model 1: decision tree generated based on intermediate grades
23 Supervised Educational Data Mining to Discover Students’ … 255

Fig. 23.4 Model 2: decision tree generated based on total activities of each session
Table 23.4 Generated classification rules of Model 1
Session 4 <= 4: F (21.0/2.0)Session 4 > 4| Session 2 <= 4.5| | Session 6 <= 1.25: F (6.0)| | Session 6 > 1.25| | | Session 5 <= 3.5| | | | Session 2 <= 1: F (3.0/1.0)| | | | Session 2 > 1| | | | | Session 2 <= 3.5: A (5.0/2.0)| | | | | Session 2 > 3.5: F (3.0/2.0)| | | Session 5 > 3.5| | | | Session 3 <= 3: D (6.0/1.0)| | | | Session 3 > 3: F (4.0/2.0)| Session 2 > 4.5: A (14.0/7.0)
256 C.C. Kiu

23.5 Conclusion and Future Work
In this paper, we have demonstrated that educational data mining tool, namelyWeka, provides simple and effective visualization panes to discover students’learning process. Unsupervised educational data mining, J48 decision tree, pro-duces classifier models and classification rules that are easy to interpret andunderstand. The experimental results also proved classifier models and classifica-tion rules generated by J48 decision tree are viable to predict students’ performance.This has concluded that supervised education mining can be used to mining eventlogs and it provides a prediction model to predict students’ learning process whichcan help to improve students’ performance.
For future work, more experiments could be studied using different supervisededucational data mining techniques and unsupervised data mining techniques.Finally, we will discover the most effective educational data mining technique inmining event logs to discover students’ learning process for improving students’performance.
Table 23.5 Generated classification rules of Model 2
ES 6 <= 491: F (24.0/4.0)ES 6 > 491| ES 1 <= 325| | ES 4 <= 374| | | ES 2 <= 0: A (2.0/1.0)| | | ES 2 > 0: B (4.0/1.0)| | ES 4 > 374| | | ES 4 <= 442: D (6.0)| | | ES 4 > 442: F (2.0/1.0)| ES 1 > 325| | ES 4 <= 510| | | ES 3 <= 462| | | | ES 5 <= 373| | | | | ES 2 <= 510| | | | | | ES 2 <= 411: F (3.0)| | | | | | ES 2 > 411: C (3.0)| | | | | ES 2 > 510: F (5.0)| | | | ES 5 > 373: C (2.0/1.0)| | | ES 3 > 462| | | | ES 3 <= 496: A (2.0)| | | | ES 3 > 496: F (2.0)| | ES 4 > 510| | | ES 4 <= 572: A (4.0)| | | ES 4 > 572: F (3.0/1.0)
Table 23.6 Accuracy of classification models
Model Precision Recall F-measure
1 0.632 0.726 0.669
2 0.858 0.855 0.850
23 Supervised Educational Data Mining to Discover Students’ … 257

References
Al-Radaideh, Q. A., Al-Shawakfa, E. M., & Al-Najjar, M. I. (2006, December). Mining studentdata using decision trees. In International Arab Conference on Information Technology (ACIT′2006), Yarmouk University, Jordan.
Aragon, S. R., Johnson, S. D., & Shaik, N. (2002). The influence of learning style preferences onstudent success in online versus face-to-face environments. The American Journal of DistanceEducation, 16(4), 227–243.
Ayesha, S., Mustafa, T., Sattar, A. R., & Khan, M. I. (2010). Data mining model for highereducation system. Europen Journal of Scientific Research, 43(1), 24–29.
Bhardwaj, B. K., & Pal, S. (2012). Data mining: A prediction for performance improvement usingclassification. arXiv preprint arXiv:1201.3418.
Drazin, S., & Montag, M. (2012). Decision tree analysis using weka (pp. 1–3). MachineLearning-Project II: University of Miami.
Hall, M., Frank, E., Holmes, G., Pfahringer, B., Reutemann, P., & Witten, I. H. (2009).The WEKA data mining software: An update. ACM SIGKDD Explorations Newsletter, 11(1),10–18.
Kashyap, G., & Chauhan, E. (2015). Review on educational data mining techniques. InternationalJournal of Advanced Technology in Engineering and Science, 3(11), 308–316.
Lynch, K. (1999). The social impact of online learning. In Proceedings of the Australian Societyfor Computers in Learning In Tertiary Education (ASCILITE)’99 Conference, QueenslandUniversity of Technology, Brisbane, Australia (pp. 199–206).
Merceron, A., & Yacef, K. (2005, May). Educational data mining: A case study. In AIED(pp. 467–474).
Minaei-Bidgoli, B., Kashy, D. A., Kortemeyer, G., & Punch, W. F. (2003, November). Predictingstudent performance: An application of data mining methods with an educational web-basedsystem. In Frontiers in education, 2003. FIE 2003 33rd annual (Vol. 1, pp. T2A-13). IEEE.
Mukala, P., Buijs, J., Leemans, M., & van der Aalst, W. (2015). Learning analytics on courseraevent data: A process mining approach.
Scheuer, O., & McLaren, B. M. (2012). Educational data mining. In Encyclopedia of the sciencesof learning (pp. 1075–1079). US: Springer.
Siemens, G., & d Baker, R. S. (2012). Learning analytics and educational data mining: Towardscommunication and collaboration. In Proceedings of the 2nd international conference onlearning analytics and knowledge (pp. 252–254). ACM.
Wang, F. (2006). On using data mining for browsing log analysis in learning environments. DataMining in E-Learning (Advances in Management Information), 4, 57–73.
Wosnitza, M., & Volet, S. (2005). Origin, direction and impact of emotions in social onlinelearning. Learning and Instruction, 15(5), 449–464.
Zaiane, O. R., & Luo, J. (2001). Towards evaluating learners’ behaviour in a web-based distancelearning environment. In Advanced Learning Technologies, 2001. Proceedings. IEEEInternational Conference on (pp. 357–360). IEEE.
Zhang, D., Zhou, L., Briggs, R. O., & Nunamaker, J. F. (2006). Instructional video in e-learning:Assessing the impact of interactive video on learning effectiveness. Information &Management, 43(1), 15–27.
258 C.C. Kiu

Chapter 24Effectiveness of the Integration of Tell MeMore Courseware in the TOEICPerformance of College Students
Celia A. Tibayan
Abstract This study aimed at investigating the effectiveness of the integration ofTell Me More courseware in the Test of English for International Communication(TOEIC) performance of college students. A sample of 62 students from theCollege of Arts and Sciences (CAS) was chosen wherein their TOEIC pre-testscores during their second year in college and their TOEIC post-test scores duringtheir fourth year were compared in relation with their final grade in the Englishcourse where Tell Me More courseware was integrated. Results show that majorityof the students have Limited Working Proficiency with the score that ranges from605 to 780 in their TOEIC pre- and post-tests. However, with the integration of TellMe More courseware, there is a significant relationship among the TOEIC pre- andpost-test scores and final grade in English. Results also reveal that Bachelor of Artsin Communication students have significantly higher reading scores in theirpost-test than the Bachelor of Arts in Multimedia Arts and Bachelor of Science inPsychology students. To conclude, Tell Me More courseware has a positive effecton the TOEIC performance of college students.
Keywords Tell me more courseware � TOEIC � Integration
24.1 Introduction
Much has been said about the benefits of integrating and using technology inteaching and learning. Šafranj (2013) in her study found out that information andcommunication technology (ICT) provided relevant improvements in languageteaching; demonstrated positive effect on students’ performance (Al-Mansour &Al-Shorman, 2011); contributed positive impact to the students (Hashim andYunus, 2012); helped students in improving their proficiency in the English lan-guage (Yunus, Hashim, Embi, & Aqsha Lubis, 2010); helped students in achieving
C.A. Tibayan (&)Lyceum of the Philippines University-Laguna, 4027 Calamba City, Philippinese-mail: [email protected]
© Springer Nature Singapore Pte Ltd. 2018S.F. Tang and S.E. Cheah (eds.), Redesigning Learning for GreaterSocial Impact, DOI 10.1007/978-981-10-4223-2_24
259

better learning (Kagaoan Tibayan, Muya, & Tenorio, 2012); and brought positiveeffect on the achievements of students in science and technology course (Byarak &Bayram, 2010). Furthermore, Dunkel (1990) in Ahmad (2012) stressed thepotentials of ICT in increasing learners’ self-confidence, language proficiency, andoverall academic skills. Technology also increased learners’ enthusiasm makinglearning exciting.
The use of technology in teaching is called Computer-Assisted LanguageLearning (CALL). Al-Mansour and Al-Shorman (2011) defines CALL as an “ap-proach to teaching and learning foreign language where the computer andcomputer-based resources such as the Internet are used to present, reinforce, andassess material to be learned.” CALL is meant to enhance traditional languageinstruction. Ghasemi, Hashemi, and Bardine (2011) classified CALL as eithercommunicative or integrative. Communicative CALL provides a non-drill skillpractice wherein computers are used as tools while the target language is fully used.Integrative CALL, on the other hand, refers to the use of multimedia computers andthe Internet. These can be in the form of text, graphics, sound, animation, and videoto be accessed on a computer which can be either multimedia CALL (CD-ROMS)or Web-based CALL (on the Internet).
One of the examples of CALL is Tell Me More. Tell Me More courseware,according to a Web site, is language software which concentrates on fourmacro-skills: reading, writing, listening, and speaking with over 750 h of material.It has major features such as videos, recordings, and speech recognition. Theobjective of Tell Me More is “to provide language learners with a wide range oftools to address speaking, listening, vocabulary, grammar, sentence-level writing,and cultural awareness.”
A study of Hashim and Yunus (2012) found out that the activities provided inTell Me More courseware are “quite fun and suitable for the culture and back-ground knowledge of the students.” The same study also revealed that the Englishlanguage lecturer believed that the students “got enough practice in the coursewarebecause there were a lot of activities provided such as communication practices,pronunciation, and crossword puzzle.” The courseware also meets the level of thestudents’ proficiency because the levels of difficulty range from “beginner” to“advanced.” Hence, the courseware matches students’ level of proficiency andmotivation in learning the language.
Many studies indicate that CALL provides an advanced and effective support forlanguage teachers (Warshauer & Healey, 1998; cited in Al-Mansour andAl-Shorman, 2011). Many studies also affirm that there was an increase in the useof technology and its integration in teaching (Stepp-Greany, 2002). Hence, theresearcher aims at investigating the effect of the integration of Tell Me More to theEnglish proficiency scores of college students specifically in the Test of English inInternational Communication (TOEIC).
Specifically, this study aimed to achieve the following:
1. What is the TOEIC performance of students in their pre-test and post-test?
260 C.A. Tibayan

2. Is there a significant difference between the pre-test and post-test scores in termsof reading and listening?
3. Is there a significant relationship among the pre-test, post-test, and final grade inEnglish with Tell Me More integration?
4. Is there a significant difference in the TOEIC performance among the programsin terms of their listening and reading scores and final grade in the Englishcourse?
24.2 Methodology
Using descriptive design, this study surveyed a total of 62 students from the Collegeof Arts and Sciences (CAS) of Lyceum of the Philippines University-Laguna assamples of the study. CAS offers Bachelor of Arts in Communication (ABComm),Bachelor of Arts in Multimedia Arts (ABMMA), and Bachelor of Science inPsychology (BS Psychology). AB Communication students are trained to gainknowledge and skills for media practice in journalism, broadcasting, corporatecommunication, advertising, and development communication. ABMMA students,on the other hand, are trained to gain knowledge and skills in the use of multimediathrough creative and innovative imagination. Lastly, BS Psychology students weretrained to develop practical skills in predicting and influencing human behavior.
Nineteen (19) of the respondents were male, while 43 were female. A total of 26respondents were students of ABComm, 25 from ABMMA, and 11 from BSPsychology.
Lyceum of the Philippines-Laguna, in response to the demands of the industry,has its English program wherein students in their second year in college will takethe TOEIC test, as a pre-test of their English proficiency, then on the next semester,after taking the pre-test, they will take English 3, Speech and Oral Communicationcourse, wherein Tell Me More courseware was integrated. The integration serves asthe intervention program to further increase the students’ TOEIC scores in theirfourth year and to further improve their English proficiency in preparation for futureemployment after graduation. The integration of the courseware was tailored withthe course syllabus wherein topics are matched with the Tell Me More activities. Ina laboratory setup, each unit of personal computer (PC) has its own softwareinstalled where students are interacting using headsets and microphones. Thisserves as an enhancement of classroom lecture.
In this study, TOEIC pre- and post-test scores of students were gathered as wellas their final grade in English 3. Statistical tools such as weighted mean, standarddeviation, Pearson correlation, and analysis of variance (ANOVA) were used tointerpret the gathered data.
24 Effectiveness of the Integration of Tell Me More Courseware… 261

24.3 Results and Discussion
Findings revealed that most of the respondents in their TOEIC pre-test and post-testare in the level of Limited Working Proficiency. In this level, students were “able tosatisfy most social demands and limited work requirements” (Table 24.1).
Results show that there is no significant difference between the TOEIC listeningscores of students in the pre-test and post-test. Results reveal that the integration ofTell Me More courseware with the English course did not contribute much indeveloping the listening skills of students. However, results show that the meanscore in the post-test increased by 10.64 (Table 24.2).
Table 24.3 shows that there is a significant difference between TOEIC readingscores of students in the pre-test and post-test. This suggests that the integration ofTell Me More courseware with the English course helped enhance the readingcomprehension skills of students. Results show that the mean score increased by18.47 in reading post-test.
Results reveal that there is a significant relationship among the TOEIC listeningand reading pre-test and post-test scores and the final grade in the English coursewith Tell Me More integration. This shows that TOEIC post-test scores are sig-nificantly related to the final grade in the English course. It means that the inte-gration of courseware, as revealed in the final grade in ENG3, contributed for theimprovement of the post-test scores in TOEIC (Table 24.4).
Table 24.5 shows the comparative analysis of scores in listening and reading inthe pre-test and post-test and the English final grade of students. Results show that
Table 24.1 Performance of students in the TOEIC pre-test and post-test
Score level General description Pre-test Post-test
905–990 International professional proficiencyAble to communicate effectively in any situation
6 10
785–900 Working proficiency plusAble to satisfy most work requirements with languagethat is often, but not always, acceptable and effective
16 17
605–780 Limited working proficiencyAble to satisfy most social demands and limited workrequirements
30 26
405–600 Elementary proficiency plusCan initiate and maintain predictable face-to-faceconversations and satisfy limited social demands
9 9
255–400 Elementary proficiencySpeaker has functional, but limited proficiency. Ableto maintain very simple face-to-face conversations onfamiliar topics
1 0
10–250 Basic proficiencyAble to satisfy immediate survival needs
0 0
*Score Level and General Description based on TOEIC® Scores and Conversion Table
262 C.A. Tibayan

in terms of listening pre- and post-tests, BS Psychology students scored higheramong all programs while in terms of the reading pre- and post-tests, ABCommunication students scored higher. This indicates that BS Psychology studentsmarked a significant improvement in their TOEIC listening post-test while AB
Table 24.2 Comparative analysis of TOEIC listening scores in the pre-test and post-test
Listening test Mean Std. deviation Sig. (2-tailed) Interpretation
Pre-test 384.76 61.55 0.056 Not significant
Post-test 395.40 64.50
Table 24.3 Comparative analysis of TOEIC reading scores in the pre-test and post-test
Reading test Mean Std. deviation Sig. (2-tailed) Interpretation
Reading pre-test 344.92 79.86 0.000 Significant
Reading post-test 363.39 78.46
Table 24.4 Relationship between the TOEIC pre-test and post-test and English final grade
English finalgrade
Listeningpre-test
Readingpre-test
Listeningpost-test
Listeningpost-test
PearsonCorrelation
0.385** 0.768** 0.754**
Sig. (2-tailed) 0.002 0 0
Readingpost-test
PearsonCorrelation
0.527** 0.724** 0.890** 0.726**
Sig. (2-tailed) 0 0 0 0
**Significant
Table 24.5 Comparative analysis of scores in listening and reading in the pre-test and post-testand the English final grade
Program Listeningpre-test
Readingpre-test
Listeningpost-test
Readingpost-test
Englishfinal grade
ABComm Mean 392.31 361.92 393.46 391.92 90.37
SD 40.06 59.26 60.15 62.13 4.09
ABMMA Mean 371.40 324.40 386.40 331.00 89.58
SD 75.28 84.49 64.28 75.35 3.11
PSYCH Mean 397.27 351.36 420.45 369.55 92.54
SD 68.75 105.57 74.24 97.45 4.37
t-value 1.012 1.473 1.088 4.304 2.358
Sig 0.370 0.238 0.343 0.018* 0.104
Legend *Significant at 5%
24 Effectiveness of the Integration of Tell Me More Courseware… 263

Communication students obtained significant improvement in their TOEIC readingpost-tests.
In terms of the final grade in the English course, BS Psychology students scoredhigher among all programs. Moreover, results reveal that among the three pro-grams, AB Communication students have significantly higher reading score in thepost-test test with a p value of 0.018. This shows that AB Communication studentsobtained the highest improvement in their TOEIC reading scores.
24.4 Conclusion
This study aimed at investigating the effectiveness of the integration of Tell MeMore courseware in the TOEIC performance of students. Specifically, it looked intothe TOEIC performance of students in their pre-test and post-test and the rela-tionship of the final grade in the English course with their TOEIC performance.Based on the results, most of the respondents, in their TOEIC pre-test and post-test,are in the level of Limited Working Proficiency. It was also found that there is nosignificant difference between the TOEIC listening scores of students in the pre-testand post-test while in terms of the TOEIC reading score, there is a significantdifference. Moreover, results reveal that there is a significant relationship among theTOEIC listening and reading pre-test and post-test scores and the final grade in theEnglish course with Tell Me More integration. This suggests that TOEIC scores aresignificantly related to the final grade in the English course. Lastly, results showthat in terms of listening in the pre- and post-test, BS Psychology students scoredhigher among all programs while in terms of reading in the pre- and post-test, ABCommunication students scored higher. Results of final grade in the English coursereveal that BS Psychology students scored higher among all programs. Moreover,results reveal AB Communication students have significantly higher reading scorein the post-test among the three programs.
References
Ahmad, J. (2012). English language teaching (ELT) and integration of media technology.Retrieved July 23, 2016 from www.sciencedirect.com
Ahmadi, S., Keshavarzi, A., & Foroutan, M. (2011). The Application of information andcommunication technologies (ICT) and its relationship with improvement in teaching andlearning. Procedia-Social and Behavioral Sciences, 28(2011), 475–480. Retrieved July 23,2016 from www.sciencedirect.com
Al-Mansour, N.S., & Al-Shorman, R.A. (2012). The effect of computer-assisted instruction onSaudi University students’ learning of English. Journal of King Saud University—Languagesand Translation, 24, 51–56. Retrieved July 23, 2016 from www.sciencedirect.com
Al-Mansour, N. S., & Al-Shorman, R. A. (2012). The effect of computer-assisted instruction onSaudi University students’ learning of English, 24, 51–56. Retrieved July 30, 2016 from www.sciencedirect.com
264 C.A. Tibayan

Bayraka, B. K., & Bayram, H. (2010). The effect of computer aided teaching method on thestudents’ academic achievement in the science and technology course. Procedia Social andBehavioral Sciences, 9(2010), 235–238. Retrieved July 23, 2016 from www.sciencedirect.com
College of Arts and Sciences. Retrieved September 28, 2016 from http://lpulaguna.edu.ph/Dettori, G., & Lupi, V. (2010). ICT and new methodologies in language learning. Procedia Social
and Behavioral Sciences, 2(2010), 2712–2716. Retrieved July 23, 2016 from www.sciencedirect.com
Ghasemia, B., & Hashemi, M. (2011). ICT: Newwave in English language learning/teaching.Procedia—Social and Behavioral Sciences, 47(2012), 924–929. Retrieved July 23, 2016 fromwww.sciencedirect.com
Ghasemi, B., Hashemi, M., & Bardine, S. H. (2011). The capabilities of computers for languagelearning. Procedia—Social and Behavioral Sciences, 28(2011), 58–62 1877–0428 © 2011Published by Elsevier Ltd. doi:10.1016/j.sbspro.2011.11.012. WCETR 2011. Retrieved July23, 2016 from www.sciencedirect.com
Hashim, H., & Yunus, M. (2012). Tell Me More: Issues and Challenges. Advances in Languageand Literary Studies, 3(2), 2012. Retrieved July 20, 2016 from http://www.journals.aiac.org.au/index.php/alls/article/view/60
Hismanoglu, M. (2011). The integration of information and communication technology intocurrent ELT coursebooks: A critical analysis. Procedia Social and Behavioral Sciences, 15(2011), 37–45 WCES-2011. Retrieved July 23, 2016 from www.sciencedirect.com
Kagaoan, A., Tibayan, C., Muya, G., & Tenorio, N. (2012). The Effect of the Dynamic EducationIntervention Program in the Fundamentals of English Course. Lyceum of the Philippines–Laguna Research Journal, 2(1), (2012). Retrieved July 23, 2016 from http://ejournals.ph/article.php?id=6691
Klimova, B. F. (2012). ICT versus traditional approaches to teaching. Procedia—Social andBehavioral Sciences, 47(2012), 196–200. Retrieved July 30, 2016 from www.sciencedirect.com
Liu, A. An Exploratory Study on Application of Multimedia Technology in College EnglishTeaching and Learning. Physics Procedia, 24(2012), 2334–2338. Retrieved July 23, 2016 fromwww.sciencedirect.com
Mohammadi, N., Ghorbani, V., & Farideh, H. (2011). Effects of e-learning on language learning.Procedia Computer Science, 3(2011), 464–468. Retrieved July 30, 2016 from www.sciencedirect.com
Šafranj, J. (2013). Using information technology in English language learning procedure: Blendedlearning. Procedia—Social and Behavioral Sciences, 83(2013), 514–521. Retrieved July 30,2016 from www.sciencedirect.com
Stearns, S. (2012). Integration of technology into the classroom: Effects on reading comprehen-sion. Retrieved July 20, 2016 from http://opensiuc.lib.siu.edu/gs_rp/248
Tell Me More language learning software. Retrieved September 28, 2016 from http://www.esl.net/tell_me_more_english.html
Tell me more software program. Retrieved September 28, 2106 from http://www.teslej.org/wordpress/issues/volume8/ej29/ej29m3/
TOEIC scores and conversion tables. Retrieved July 25, 2016 from http://wie.ac.nz/TOEICconversion.htm
Yunus, M., Hashim, H., Embi, M.A., & Aqsha Lubis, M. (2010). The utilization of ICT in theteaching and learning of English: Tell Me More. Procedia Social and Behavioral Sciences, 9(2010), 685–691. WCLTA 2010.
24 Effectiveness of the Integration of Tell Me More Courseware… 265

Chapter 25Appropriate Use of Technology:How Useful Are Calculationsof Discrimination Index by OpticalMark Readers in Item Analysis of SingleBest Answer MCQ Tests with SmallStudent Numbers?
Benjamin Samraj Prakash Earnest, Prabal Bhargava,Anitha Ponnupillai, Suresh Ponnusamy, Nurjahan Mohd. Ibrahimand Roland Gamini Sirisinghe
Abstract Recent advances in computer-related technology and the availability oftechnology to everyone at affordable cost have made it possible to use such tech-nology in every aspect of teaching-learning. Educational institutions are increas-ingly using optical mark readers (OMRs) which also feature software that calculatesdifficulty index and discrimination index in addition to correcting hundreds of OMRmark sheets in a matter of seconds to minutes which would otherwise take manyman-hours. We explore how useful the calculations of discrimination index byoptical mark readers are in item analysis of single best answer MCQ tests withsmall student numbers.
Keywords Optical mark reader � Discrimination index � Item analysis
B.S.P. Earnest (&) � P. Bhargava � A. Ponnupillai � S. Ponnusamy � N.M. Ibrahim �R.G. SirisingheTaylor’s University School of Medicine, 47000 Sungai Buloh, Selangor, Malaysiae-mail: [email protected]
P. Bhargavae-mail: [email protected]
A. Ponnupillaie-mail: [email protected]
S. Ponnusamye-mail: [email protected]
N.M. Ibrahime-mail: [email protected]
R.G. Sirisinghee-mail: [email protected]
© Springer Nature Singapore Pte Ltd. 2018S.F. Tang and S.E. Cheah (eds.), Redesigning Learning for GreaterSocial Impact, DOI 10.1007/978-981-10-4223-2_25
267

25.1 Introduction
The single best answer multiple-choice questions (SBA-MCQ) is found to be bettersuited to the assessment of the higher levels of knowledge essential for clinicalpractice such as analysis, data interpretation, problem-solving and decision-makingthan other forms of testing like traditional true/false MCQ. Optical mark reading(or optical mark recognition, OMR) has drastically changed the way SBA-MCQsare corrected. OMR has relieved teachers from the drudgery of correctingSBA-MCQs by using scanning technology and a built-in software for efficientlycorrecting hundreds of MCQs within minutes. What is more? The built-in softwarealso analyses the SBA-MCQs corrected and provides us with values for difficultyindex (DI) and discrimination index (DsI) along with the students’ test marks.
25.2 History
Modern optical mark recognition (OMR) is the scanning of a mark sheet to detectthe presence or absence of a mark (made by the examinee) in a predeterminedposition and scoring the mark sheet (often called OMR sheet) using computersoftware. Apart from evaluation and assessment, the same technology is also usedfor data compilation, product evaluation, time sheets and inventory counts. The firstsuccessful optical mark-sense scanner was developed in 1962 by Everett FranklinLindquist in the USA.
Benjamin D. Wood, an American educator, researcher and pioneer in learningtechnologies, is credited with the introduction of multiple-choice questions early intwentieth century. He also collaborated with IBM as early as 1929 to develop amechanical device to score multiple-choice questions developing various devicesfor the purpose.
Discrimination index (Matlock-Hetzel, 1997) is an important component of itemanalysis, the basis for which the classical test theory originally put forth by Novic(1966).
25.3 Context
Single best answer MCQ tests (SBA-MCQ tests) are commonly used to examinestudents’ knowledge of the subject taught (cognitive domain). In medical schools,case scenario-based SBA-MCQ tests are widely used to evaluate complex cognitiveprocesses such as analysis, synthesis and evaluation. Item analysis using difficultyindex (DfI, proportion of total number of students selecting the correct answer tothe total number of students taking the test) and discrimination index (DsI, pro-portion of the difference between the total number of students selecting the correct
268 B.S.P. Earnest et al.

answer in the top and bottom 27% to the number of students in either group) is doneto assess question validity.
25.4 Objective
To explore the suitability of using discriminative index as a measure of questionvalidity in item analysis of single best answer MCQ tests with small studentnumbers.
25.5 Methods
This study was set in Taylor’s University, Clinical School, Sungai Buloh, Malaysia.The student population was 4 groups of 3rd- and 4th-year medical students inInternal Medicine, Ophthalmology and Obstetrics & Gynaecology postings. Thestudent groups ranged from 11 to 16 students each. Each group underwent aSBA-MCQ test with 20–30 items each at the end of their respective postings.Optical mark reader (OMR) was used to score the test results. The OMR also usessoftware to produce DfI and DsI of each question in the SBA-MCQ test. We alsoused a spreadsheet (MS Excel) to further analyse the results using DsI calculated by4–6 different methods described in the literature.
In computing, the discrimination index, DsI, first order by rank the students’ testscores. From this the top, 27% of the students and the bottom 27% are compared inDsI (Method 1). The 27% is used because it has been shown that this value willmaximize differences in normal distributions while providing enough cases foranalysis (Wiersma & Jurs, 1990). There need to be as many students as possible ineach group to promote stability; at the same time, it is desirable to have the twogroups be as different as possible to make the discriminations clearer. Most edu-cationists agree with this grouping (Popham, 1981). However, others have sug-gested using 25% (Beuchert & Mendoza, 1979; Englehart, 1965; Nunnally, 1972;Zaiontz, 2016). Still others have indicated that top and bottom 33% (Method 2) oreven 50% (Method 3) could be used (Beuchert & Mendoza, 1979; Englehart, 1965;Liu, 2008; Pareek 2007; Zaiontz, 2016). But increasing the percentage will only addmore number of “average” students to either group. So they may not really berepresentative of “top” and “bottom” groups.
The discrimination index, DsI, is the number of people in the upper group whoanswered the item correctly minus the number of people in the lower group whoanswered the item correctly, divided by the number of people in the larger of thetwo groups. The groups may be unequal when the students’ number may notexactly make up 27% or 33% of the top/bottom groups. For example, in a class of50 students 27% is 13.5 students. So, we can add 14 students to one group and13 students to another group to balance out and divide by 14 which is the larger of
25 Appropriate Use of Technology: How Useful Are Calculations … 269
the 2 groups. Some have argued that in such situations we should divide by 13.5and not 14 as this would greatly reduce the impact of the smaller group to the finalvalue of DsI (Shannon & Cliver, 1987). We can add an additional student to eitherthe top group (Method A) or the bottom group (Method B). Alternatively, we canround it off to the nearest whole number and keep the groups the same (Method C).It may be better to use Method C if the decimal is too high (say >0.7) or too low(say <0.3).
Another situation where the groups could be unequal is when students at thefringe of the groups score the same marks. For example, in the above group of 50students, let us say the 13th student in the top group has the same score as the 14th,15th and 16th students, then we have an unequal grouping with 16 students in thetop group and 14 students in the bottom group. In such instances, dividing bothgroups with 16 would greatly reduce the impact of the smaller group to the DsIvalue. So there are at least 2 other ways to resolve this issue. Firstly, we canproportionately reduce the number of correct answers (n) out of 16 to 14 by 14n/16(Method i). Secondly, we can proportionately reduce the number of correctanswers (n) out of 4 (13th–16th students = 4 students) to 2 (to make up for the 13thand 14th student) by 2n/4 (Method ii). The latter option would be better since if weuse the first method we would be diluting the impact of the top students (1–12thstudents) by adding 13th–16th students. In the first method, correct responses of top12 students are reduced to 12/16th of its value, while 13–16th students who aremore likely to be average than “top” students get 4/16th of its value. In the secondmethod, correct responses of top 12 students are reduced to 12/14th of its value,while 13–16th students who are more likely to be “average” than “top” students get2/14th of its value. Methods i and ii are applicable only when students at the fringeof the groups score the same marks.
25.6 Results
A total of 110 SBA-MCQs were analysed (Figs. 25.1, 25.2, 25.3 and 25.4). DsIcalculated by different methods described above (Methods 1–6) were tabulated, andthe maximum DsI (DsI max) and minimum DsI (DsI min) values were identified.The difference between the maximum DsI and minimum DsI was calculated andfound to be >0.3 for many questions (63/110, 57.3%) and >0.5 in some (30/110,27.3%).
These variations in DsI calculated by different methods were found to be relatedto the small student numbers particularly when many students score the same marksin the test. We found that the OMR used 33% of top and bottom students (Method2) to calculate DsI and resolved multiplicity of fringe marks by Method ii describedabove. OMR with operator selectable options to change such settings would bemore useful in this regard.
270 B.S.P. Earnest et al.

Fig.25
.1Item
analysisin
test1
25 Appropriate Use of Technology: How Useful Are Calculations … 271

Fig.25
.3Item
analysisin
test3
25 Appropriate Use of Technology: How Useful Are Calculations … 273

25.7 Conclusion
The variation in the DsI calculated by different methods often placed the samequestion in different categories from “to be discarded” to “good”. DsI should beused with caution in tests with small numbers. DsI values calculated by the OMRshould be interpreted with caution in item analysis of single best answer MCQ testswith small student numbers as it represents only one way of calculating this value.
References
Amo-Salas, M., Arroyo-Jimenez, MDM., Bustos-Escribano, D., Fairén-Jiménez, E.,López-Fidalgo, J. (2014). New Indices for Refining Multiple Choice Questions. Journal ofProbability and Statistics 2014, 8 (Article ID 240263). doi:10.1155/2014/240263. Available athttp://www.hindawi.com/journals/jps/2014/240263/ Accessed May 30, 2016.
Beuchert, A. K., & Mendoza, J. L. (1979). A Monte Carlo comparison of ten item discriminationindices. Journal of Educational Measurement, 16, 109–117.
Englehart, M. D. (1965). A comparison of several item discrimination indices. Educational andPsychological Measurement, 2, 69–76.
Hassan, S., Amin, R. M., Rebuan, H. M. A., & Aung, M. M. T. (2016). Item analysis, reliabilitystatistics and standard error of measurement to improve the quality and impact of multiplechoice questions in undergraduate medical education in faculty of medicine at UNISZA.Malaysian Journal of Public Health Medicine, 16(3), 7–15.
Kelley, T. L. (1939). The selection of upper and lower groups for the validation of test items.Journal of Educational Psychology, 30, 17–24.
Liu F, (under supervision of Kim S-H, Olejnik S, Templin J). (2008). Comparison of severalpopular discrimination indices based on different criteria and their application in itemanalysis. Thesis for Master of Arts, University of Georgia. Available at: https://getd.libs.uga.edu/pdfs/liu_fu_200808_ma.pdf Accessed June 15, 2016.
Matlock-Hetzel S. (1997). Basic concepts in test and item analysis. Texas A&M University,January 1997. Available at: http://ericae.net/ft/tamu/Espy.htm Accessed June 15, 2016.
Novick, M.R. (1966). The axioms and principal results of classical test theory. Journal ofMathematical Psychology 3(1), 1–18.
Nunnally, J. C. (1972). Educational measurement and evaluation (2nd ed.). New York:McGraw-Hill.
Pareek, U. (2007). Item analysis. In Training instruments in HRD and OD (2nd ed., pp. 34–35).New Delhi: Tata-McGraw-Hill.
Popham, W. J. (1981). Modern educational measurement. Englewood Cliff, NJ: Prentice-Hall.Professional Testing Inc. (2006). Criterion-referenced tests (CRTs) and Norm-referenced tests
(NRTs) in Test Topics. Available at: http://www.proftesting.com/test_topics/test_types_CRT.php. Accessed May 30, 2016.
Shannon, G. A., & Cliver, B. A. (1987). An application of item response theory in the comparisonof four conventional item discrimination indices for criterion-referenced tests. Journal ofEducational Measurement, 24(4), 347–356. doi:10.1111/j.1745-3984.1987.tb00285.x
Wiersma, W., & Jurs, S. G. (1990). Educational measurement and testing (2nd ed.). Boston, MA:Allyn and Bacon.
Zaiontz, C. (2016). Item analysis basic concepts. Available at: http://www.real-statistics.com/reliability/item-analysis/item-analysis-basic-concepts/ Accessed June 15, 2016.
25 Appropriate Use of Technology: How Useful Are Calculations … 275

Chapter 26Undergraduate Students’ Perceptionsas Producer of Screencast Videosin Learning Mathematics
Irene Yang and Bee Theng Lau
Abstract In this digital age, universities shift their teaching and learning fromconventional to blended learning utilizing various state-of-the-art digital technolo-gies. Thus, online video-based teaching and learning have also gained its popularityamong educators to facilitate the students’ learning. However, little research has beenconducted on learner-produced-videos-based approach. Therefore, this researchinvestigates and designs an innovative student-centered learning approach throughcollaborative production of mathematics screencast videos. A survey was also con-ducted to understand the learners’ perceptions in terms of benefits, challenges,motivation, sharing platform, and effectiveness of learning. This paper discusses thedesign, methodology, evaluation, and findings of the study conducted.
Keywords Screencast videos � Student-centered learning � Motivation �Undergraduate � Mathematics
26.1 Introduction
Learning paradigm nowadays has begun to transform from traditional to digitalresources in higher education to prepare learners for twenty-first-century chal-lenges. However, the potential of emerging technology to support learning remainsa controversial issue. There are still some unclear issues such as benefits andchallenges of digital-enhanced learning approach. Furthermore, it is also crucial tounderstand the impact of technology on students’ interest in learning, collaborativelearning with peers, and effectiveness of learning such as retention of knowledge.Therefore, educators need to develop and evaluate new strategies of
I. Yang (&) � B.T. LauSwinburne University of Technology Sarawak Campus, Kuching, Malaysiae-mail: [email protected]
B.T. Laue-mail: [email protected]
© Springer Nature Singapore Pte Ltd. 2018S.F. Tang and S.E. Cheah (eds.), Redesigning Learning for GreaterSocial Impact, DOI 10.1007/978-981-10-4223-2_26
277

technology-based learning to achieve learning outcomes as well as to address theneeds of learners with diverse background and content knowledge.
Watching screencast videos has recently become a promising alternative toface-to-face learning. Screencast video is a powerful tool to deliver learning contentas learners could do self-directed learning by viewing videos at their own time,place, and pace (Falconer, Nicodemus, deGrazia, & Will Medlin 2012; MullamphyHiggins, Belward, & Ward, 2010). The uploaded learning videos are availableonline, thus providing flexibility for learners to enjoy personalized learning viaInternet connectivity. In addition, majority of the undergraduate students found thescreencast videos helpful in their acquisition of deeper mathematical concepts andincrease their achievement in the grades obtained for the course eventually(Green, Pinder-Grover, & Millunchick, 2012).
Despite prior studies revealed that student’s favor the use of screencasts inlearning, research on learners’ perceptions in producing screencast videos as part oflearning seems to be lacking and not been well investigated. Hence, this paperdescribes an approach to assess students’ perceptions toward engaging learners asproducer of screencast videos.
26.2 Literature Review
It is crucial to engage learners actively in the learning process. According toconstructivist theory (Piaget, 1985), effective learning requires learners to build newunderstanding by applying their existing knowledge. When learners encounterinconsistency with their prior knowledge, they will need to modify their existingunderstanding to accommodate new learning experience. In this way, studentscould obtain knowledge by discovering concepts by themselves, and the learningwill be more meaningful to them. Nowadays, educators face the challenge oftransforming their role from teacher to facilitator, integrating technological learningenvironment to better engage students in constructivist learning approach.
In fact, appropriate level of interaction with peers plays an important role inlearning. This interaction could be fostered through a social constructivist class-room setting that can stimulate collaboration among peers in knowledge con-struction. According to Vygotsky (1980), the More Knowledgeable Other(MKO) could scaffold learner to reach the zone of proximal development (ZPD).When guided, MKO or someone who has higher level of knowledge could leadother learners into achieving higher level of performance. For instance, peerssolving a problem together in collaborative learning may offer the opportunities forsharing of ideas and learning experience thus building knowledge and under-standing (Roehler & Cantlon, 1997). In addition, learners may benefit from peers’learning when they present their knowledge, produce and receive feedbacks frompeers while evaluating and monitoring their own learning consistently. Moreover,peers’ feedback and interaction during collaborative learning may also foster stu-dent’s satisfaction in learning (Richardson & Swan, 2003).
278 I. Yang and B.T. Lau

Motivation is an essential element in learning that has direct impact on learners.Motivated learners enjoy and find satisfaction in their learning, thus leading tobetter performance in return. Nowadays, educators are careful in choosing theinstruction methods to cope with learners’ learning styles with the hope to engageand motivate learners. Generally, learners feel motivated when they are interested ina task. Subsequently, the learners perceive the task to be important, engage with thetask with the belief that they can accomplish, and find satisfaction in doing it(Linnenbrink & Pintrich, 2003).
Basically, there are two classifications of motivation: extrinsic motivation isfocusing on rewards while intrinsic motivation is deriving from self-desire inwardlysuch as interest, excitement, and self-satisfaction (Ryan & Deci, 2000). As a result,there is a need to design and implement learning approach that may enhancelearners’ engagement and intrinsic motivation. One of the best ways is to adoptcollaborative working group in solving a task since the learning environment allowslearners to connect with their peers. Furthermore, learning facilitated with appro-priate technology tools may increase learners’ motivation via interaction betweenlearners and interaction between learners with their learning materials.
26.3 Research Questions
With the literature review on previous research related to collaborative learningwith screencast videos, there is a lack of studies in examining the effectiveness oflearners-produced videos. As a result, this study aims to investigate constructsrelated to the mentioned approach in terms of perceived benefits, challenges,motivation, sharing platform, and effective learning tool. This study examines howstudents’ perceptions toward the constructs are related. It also identifies the factorswhich contribute to the effectiveness of using screencast videos as a learning tool.The research questions for the study are stated below:
1. What are students’ perceptions in producing screencast videos from the per-spectives of benefits, challenge, motivation, sharing platform, and effectiveness?
2. What are the relationships among students’ perceived benefits, challenges,motivation, sharing platform, and effectiveness?
3. What are the factors contributing to students’ perceived effectiveness oflearner-produced screencast videos?
26.4 Methodology
This study was conducted in a university where 71 undergraduate students wererandomly selected from the class of a first-year subject, namely EngineeringMathematics 1. Ethic clearance was approved by the university, and each participant
26 Undergraduate Students’ Perceptions … 279

gave his/her consent to their participation. The participants developed screencastvideos as part of their formative assessments in a semester. Each participant wasprovided access to computer equipped with WACOM tablet, headphone, andscreencast software in the computer laboratory. They worked in a collaborative groupof two to three students to produce screencast videos for one of the assessments inEngineering Mathematics 1 (Fig. 26.1). At the end of the semester, an anonymoussurvey was administered to the participants in this study. The survey intended tounderstand the learner’s perceptions toward learning by learner-produced screencastvideos and specify factors which could potentially promote the approach oflearner-produced screencast videos as an effective learning tool.
The data were gathered by getting each participant to fill in a survey form.Participants were asked to rate their perceptions toward producing learner-producedscreencast videos with a five-point Likert scale (from ‘strongly disagree’ to‘strongly agree’) in the self-assessment survey. The last question in the survey formrequired the participants to rate their overall satisfaction with the learning approach.The survey was designed based on five constructs to measure participants’ per-ceptions in terms of (a) benefits, (b) challenges, (c) motivation, (d) sharing platform,and (e) effective learning tool.
26.5 Results and Discussions
Tables 26.1, 26.2, 26.3, 26.4, and 26.5 show the descriptive statistics with thecorresponding items of the five constructs in the survey. The highest mean score forthe item in each construct was emphasized with bold texts. The highest averagemean score is 3.89 which obtained from the variable ‘benefits’ (Table 26.1), whilethe variable ‘challenges’ has the lowest overall mean score of 3.40 (Table 26.2).This could possibly due to the items in the variable ‘challenges’ were written usingnegative statements.
Table 26.1 summarizes the benefits of learner-produced screencast videos wheremajority of the participants agreed that the learning approach could foster reflectionon their level of understanding (M = 4.04; SD = 0.74). Moreover, they were able to
Fig. 26.1 A sample oflearner-produced screencastvideo
280 I. Yang and B.T. Lau

Table 26.1 Descriptive statistics for the benefits
Items Mean (SD)
1. I have more opportunities to construct my own understanding 3.94 (0.71)
2. I am more motivated to learn 3.72 (0.70)
3. I could self-reflect on my level of understanding 4.04 (0.74)
4. I am challenged to be responsible in my learning 3.85 (0.74)
5. I could apply creative ideas in working out the solution 3.81 (0.87)
6. I could express my understanding visually and verbally 3.96 (0.80)
The overall average score 3.89 (0.76)
Table 26.2 Descriptive statistics for the challenges
Items Mean (SD)
1. I am not familiar with the screencast software 3.67 (1.07)
2. I spent too much time in video editing and time conversion 3.32 (1.27)
3. I am not used to write with a stylus 4.03 (1.16)
4. I have to perform multitasking such as explaining while writing 3.26 (1.22)
5. I lack confidence in explaining the concept verbally via video recording 2.55 (1.25)
6. I need to invest more effort and time to produce the videos compare to writtenassignment
3.56 (1.03)
The overall average score 3.40 (1.17)
Table 26.3 Descriptive statistics for the motivation
Items Mean (SD)
1. I am motivated when my instructor provides essential technical supports 3.83 (0.82)
2. I am motivated when I have a cooperative group working together to producethe videos
3.88 (0.99)
3. I am motivated when my instructor assists the creation of videos 3.68 (0.80)
4. I am motivated when the solutions are corrected by my instructor prior tovideo recording
3.68 (0.87)
5. I am motivated when I know the completed videos will be viewed by peers 3.31 (0.85)
6. I am motivated to achieve my self-satisfaction on my project contribution 4.00 (0.79)
The overall average score 3.73 (0.85)
Table 26.4 Descriptive statistics for sharing platform
Items Mean (SD)
1. I have more opportunities to share and learn from each other 3.90 (0.72)
2. I can develop better understanding through peers’ feedbacks 3.82 (0.78)
3. I build self-confidence throughout the learning process 3.79 (0.87)
4. I am actively engaged in the learning process 3.81 (0.72)
The overall average score 3.83 (0.77)
26 Undergraduate Students’ Perceptions … 281

express their understanding through multiple learning styles (M = 3.96; SD = 0.80)and engage actively in construction of knowledge (M = 3.94; SD = 0.71). Besides,participants also agreed that this learning approach could encourage them to takegreater responsibility for their learning (M = 3.85; SD = 0.74).
Table 26.2 shows the summary of challenges in accessing the technologythrough video production. Participants indicated their ability to cope withexplaining the concepts confidently during the production of videos (indicated bythe lowest mean of 2.55). However, it was evidenced that most of the challengesparticipants faced were due to technical proficiency in using technology tools. Forinstance, the key challenge was ‘not used to write with a stylus’ (indicated with thehighest mean of 4.03). Furthermore, participants revealed that they had littleexperience in using the screencast software (M = 3.67; SD = 1.07).
Most of the participants expressed high level of motivation as they accomplishedthe task of video production with self-satisfaction (M = 4.00; SD = 0.79) indicatedin Table 26.3. Moreover, participants felt more motivated when working cooper-atively in the video production. Most likely, when students shared the task together,it made them feel less anxious, and they could learn from each individual who haddifferent level of knowledge, learning skills, personalities, and background. Incontrast, there was slightly lesser motivation when they knew the completed videoswould be viewed by peers, with the mean of 3.31.
In general, participants appeared to favor the learner-produced screencast videosapproach from the perspective of ‘sharing platform’ as shown in Table 26.4. Mostof the participants rated highly on the item ‘opportunities to share and learn frompeers’ (M = 3.90; SD = 0.72). Besides, they also agreed that they could learn atdeeper level with the feedback given by their peers (M = 3.82; SD = 0.78). Thiswas likely contributed by peers giving constructive feedback and sharing theirpoints of view which improve their level of understanding.
Generally, most students perceived learner-produced video as an effectivelearning tool (Table 26.5). Most of the participants agreed that they couldremember more about the content through this learning approach (M = 4.00;SD = 0.79). This could be related to the students’ active mental engagementthrough verbal and visual learning, thus they could retain the knowledge in theirmind for an extended period.
Table 26.5 Descriptive statistics for effectiveness
Items Mean (SD)
1. I expand my critical thinking via the process of constructing screencast videos 3.67 (0.73)
2. The construction of screencast videos increases my conceptual learning 3.69 (0.88)
3. I feel developing greater ownership in my learning as I discover theconnections about the concepts
3.75 (0.78)
4. I can remember better about the topics as I explore the concepts moreprecisely via construction of screencast videos
4.00 (0.79)
The overall average score 3.78 (0.80)
282 I. Yang and B.T. Lau

In general, participants have positive perceptions toward the learning approachof learner-produced screencast videos. The responses in the survey revealed thatthey could self-reflect on their level of understanding, achieve self-satisfaction ontheir contribution, share and learn from peers, and remember better about the topicsthey solved. Meanwhile, learners also encountered some challenges such as unfa-miliar with the technology tools and software as a result of the lack of technologycompetency.
Finally, the question asking students’ overall satisfaction with the learningmethod received positive response. Most participants rated the approach as ‘good’(51%). This followed by the same average score for ‘excellent’ and ‘fair’ which is22%, and only a minority (4%) of the participants felt that the approach needsimprovement.
The Cronbach’s alpha reliability coefficient value was 0.853 for the variable‘benefits,’ 0.678 for the variable ‘challenges,’ 0.702 for the variable ‘motivation,’0.764 for the variable ‘sharing platform,’ and 0.766 for the variable ‘effectiveness.’Most of the Cronbach’s coefficient alpha for the self-developed items showed areliability coefficient of 0.70 or higher which is considered acceptable reliability,except for the variable ‘challenges’ which has 0.678. None of the individualvariable achieved Cronbach’s alpha reliability coefficient of greater than 0.90,which demonstrated the internal consistency of items and variables in the survey.
Pearson’s correlation coefficient analyses were calculated to find the correlationsbetween learners’ perceptions in terms of benefits, challenges, motivation, sharingplatform, and effectiveness (Table 26.6). The correlation analyses indicated apositive correlation between sharing platform and effectiveness with the highestcorrelation score (0.65). Learners who agreed that learner-produced screencastvideo approach was a sharing platform also perceived the learning approach as aneffective approach. This finding is consistent with the study of Richardson andSwan (2003) that learners’ perceptions of social presence were highly associatedwith their perceived learning.
In addition, most of the variables exhibited significant positive correlations withone another such as correlations between benefits and sharing platform (0.64),benefits and effectiveness (0.61), motivation and effectiveness (0.55), and benefitsand motivation (0.51). When learners perceived learner-produced screencast videosas highly beneficial to their learning, they would also feel motivated, and beingpositive toward sharing and learning with peers. Thus, it is well aligned with thestudy of Linnenbrink and Pintrich (2003) that positive emotions such as task-related
Table 26.6 Correlation analysis between the variables
Variables Challenges Motivation Sharing platform Effectiveness
1. Benefits −0.35 0.51* 0.64* 0.61*
2. Challenges −0.17 −0.11 −0.20
3. Motivation 0.60* 0.55*
4. Sharing platform 0.65*
*Correlations are significant at the p < 0.001
26 Undergraduate Students’ Perceptions … 283

enjoyment and pride relate positively to learners’ motivation. As a result, this willpotentially enhance learner’s achievement since knowledge is more likely to retainlonger in learner’s memory.
On the other hand, the findings revealed non-statistically significant negativecorrelation between challenges and other variables. This could probably due to theirbarriers to technology adoption decreased as the learners gradually adapted totechnology with sufficient time given as well as the technical support.Subsequently, learners’ perceived satisfaction and effectiveness with learningimproved slightly despite the challenges they faced (Sun, Tasi, Finger, Chen, &Yen, 2008).
Multiple regression analyses were performed to further examine the relationshipsamong the five variables in the survey. Specifically, the analyses aim to determinewhether learners’ perception of effectiveness learning through producing screencastvideos could be predicted with the independent variables.
From Table 26.7, the most significant predictor of the effectiveness oflearner-produced screencast videos as a learning approach was the variable ‘sharingplatform’ (F(1, 70) = 52.97, p < 0.0001, R2 = 0.43). It means 43% of the variationin ‘effectiveness’ was predicted by the variable ‘sharing platform.’ Additionally, thevariables ‘benefits’ (F(1, 70) = 41.80, p < 0.0001, R2 = 0.37) and ‘motivation’(F(1, 70) = 31.07, p < 0.0001, R2 = 0.31) were also the key factors which con-tributed to the effectiveness of screencast videos as a learning tool. In contrast, thevariable ‘challenges’ was not statistically significant or associated with the variable‘effectiveness’ of learner-produced screencast videos as a learning approach. Insummary, variables like ‘benefits,’ ‘motivation,’ and ‘sharing platform’ play a vitalrole to promote the effectiveness of the learning approach through learner-producedscreencast videos.
With respect to benefits, the study revealed that the learning approach couldengage students to evaluate their level of understanding and construct newknowledge by activating prior knowledge. In addition, learning could also beenhanced by expressing the concept through multiple representations such as visualand verbal learning. This may increase the chance of learners to retain theknowledge for a longer period in their memory. If a learning approach is alignedwith a learner’s preferred learning method, he/she will benefit more from theapproach (Butler & Mautz, 1996). Hence, this learning approach which required thelearners to generate explanation in both verbal and visual multimedia presentationmay enhance the learning of learners who preferred this approach.
Table 26.7 Regressionresults of predictedrelationships among variables
Dependentvariable
Independentvariables
R2 p
Effectiveness Benefits 0.3739 <0.0001
Challenges 0.0415 0.0862
Motivation 0.3074 <0.0001
Sharing platform 0.4308 <0.0001
284 I. Yang and B.T. Lau

With respect to motivation, the study revealed that participants were motivatedby self-satisfaction with sense of achievement by producing the screencast videosand also working cooperatively in group. These findings were consistent with thestudy of Pekrun, Goetz, Titz, and Perry (2002) which indicated students’ emotion inlearning depends heavily on the sense of being able to control and value thelearning process. For example, learners in this study enjoyed the learning processbecause they appreciated the satisfaction and the feeling of control toward the taskssince they could interact and share responsibilities with peers. Suggestions on otherways to motivate students in learning include giving constructive feedback, providechallenging tasks but attainable learning outcomes within effort, and foster learners’belief that they could grasp the content successfully (Linnenbrink & Pintrich 2003).
It was discovered that the effectiveness of the learning approach was mainly dueto the factor of ‘sharing platform.’ Learners seemed to favor the sharing, learning,and also the valuable feedback from peers. Educators should consider the impor-tance of social presence as the impact is not only the influence on learning out-comes but also on student satisfaction toward instructor and course (Richardson &Swan 2003). On the other hand, if the screencast videos production is to be doneindividually, learners may experience high levels of anxiety due to lack of controlover the challenging task and may lead to impaired learning.
The findings from the study also revealed that although implementation of neweducational technology approach may stimulate learners’ interest, ensuring ade-quate technology support to students is the key to facilitate effective learning.Besides, educators need to have technology, pedagogy, and content knowledge foreffective technology integration in their instruction.
26.6 Conclusions
The findings of this study revealed that effectiveness of the learning approachmainly depends on three critical factors which are benefits, motivation, and sharingplatform. The study also implies that social collaboration with peers significantlyenhance learners’ motivation and engagement toward learning. Suggestions of waysto improve technology-enhanced collaborative learning include group projectswhich emphasized authentic learning, provide adequate technical support tolearners with training, and design activities which stimulate learners’ motivationand social interaction. Future research may extent to examine the perceptions andeffects of using peer-produced videos as part of learning.
Acknowledgements This work is part of a research project funded by the Swinburne SarawakResearch Grant (SSRG 2-5522).
26 Undergraduate Students’ Perceptions … 285
References
Butler, J. B., & Mautz, R. D., Jr. (1996). Multimedia presentations and learning: A laboratoryexperiment. Issues in Accounting Education, 11(2), 259.
Falconer, J. L., Nicodemus, G. D., deGrazia, J., & Will Medlin, J. (2012). Chemical engineeringscreencasts. Chemical Engineering Education, 46(1), 58.
Green, K. R., Pinder-Grover, T., & Millunchick, J. M. (2012). Impact of screencast technology:Connecting the perception of usefulness and the reality of performance. Journal of EngineeringEducation, 101(4), 717.
Linnenbrink, E. A., & Pintrich, P. R. (2003). The role of self-efficacy beliefs in studentengagement and learning in the classroom. Reading and Writing Quarterly, 19(2), 119–137.
Mullamphy, D. F., Higgins, P. J., Belward, S. R., & Ward, L. M. (2010). To screencast or not toscreencast. Anziam Journal, 51, C446–C460.
Pekrun, R., Goetz, T., Titz, W., & Perry, R. P. (2002). Academic emotions in students’self-regulated learning and achievement: A program of qualitative and quantitative research.Educational psychologist, 37(2), 91–105.
Piaget, J. (1985). The equilibration of cognitive structures: The central problem of intellectualdevelopment. Chicago: University of Chicago Press.
Richardson, J., & Swan, K. (2003). Examining social presence in online courses in relation tostudents’ perceived learning and satisfaction. Piaget, J. (1985). The equilibration of cognitivestructures: The central problem of intellectual development. Chicago: University of ChicagoPress.
Roehler, L. R., & Cantlon, D. J. (1997). Scaffolding: A powerful tool in social constructivistclassrooms (p. 1). Scaffolding student learning: Instructional approaches and issues.
Ryan, R. M., & Deci, E. L. (2000). Intrinsic and extrinsic motivations: Classic definitions and newdirections. Contemporary Educational Psychology, 25(1), 54–67.
Sun, P. C., Tsai, R. J., Finger, G., Chen, Y. Y., & Yeh, D. (2008). What drives a successfule-Learning? An empirical investigation of the critical factors influencing learner satisfaction.Computers and Education, 50(4), 1183–1202.
Vygotsky, L. S. (1980). Mind in society: The development of higher psychological processes.Cambridge, MA: Harvard University Press.
286 I. Yang and B.T. Lau

Chapter 27Assessment of Media Literacy Campaignfor Grade 4 Pupils at a Public ElementarySchool in the Philippines
Gerby R. Muya and Ma. Anna Corina P. Kagaoan
Abstract The dynamics and complexity of media environment becomes animportant concern among media researchers, as many people are bombarded withcomplex media messages in their everyday life. In general, this study aims to assessthe media literacy campaign for Grade 4 pupils at a public elementary school inCalamba City, Province of Laguna, Philippines. Specifically, it aims to (1) describethe pretest and posttest scores of the respondents in media literacy test; (2) analyzeif there is significant change in posttest scores among respondents; and (3) describesatisfaction of pupil respondents to the media literacy campaign. Using thedescriptive survey design to assess the effectiveness of media literacy campaign forGrade 4 pupils, this study employed a self-made instrument containing multiplechoice type of test measuring knowledge on the types of media and how to usethem properly. The instrument was administered before and after the campaignamong 126 pupils to determine if there is significant difference in the knowledgescores. The study also assessed how satisfied the respondents were to the campaign.Data were analyzed using frequency counts, percentage, and t test. Comparingbetween pretest and posttest scores, the study found that there was significantdifference in the scores. Results indicate that there was a significant change in thescore of the pupils in the knowledge test. This finding was corroborated with thehigh level of satisfaction to the campaign evidenced in the results of the customersatisfaction measurement. Therefore, the campaign may be a means for the pupils tounderstand the role media plays and how they can use the media to serve itspurpose.
Keywords Media � Literacy � Children � Campaign
G.R. Muya (&) � Ma.A.C.P. KagaoanLyceum of the Philippines University Laguna, Calamba City, Philippinese-mail: [email protected]
Ma.A.C.P. Kagaoane-mail: [email protected]
© Springer Nature Singapore Pte Ltd. 2018S.F. Tang and S.E. Cheah (eds.), Redesigning Learning for GreaterSocial Impact, DOI 10.1007/978-981-10-4223-2_27
289

27.1 Introduction
Media, from traditional television to the “new media” (including mobile phones andsocial media), are ubiquitous and as the global village continues to be wired upelectronically, and as individuals move their daily lives online, mass media play atremendous and increasing role in society, providing information as well asentertainment (Hanson, 2015; Schramm, 1964). Today, many people accessinformation through multifaceted mix of images, text, and sounds. The dynamicsand complexity of media environment becomes an important concern among mediaresearchers, as many people are bombarded with complex media messages in theireveryday life. How people, particularly the younger generation, make sense of thesemedia messages and how they express themselves using a variety of media toolsand technologies thus become a point of study.
Young people today are exposed to media for more than eight hours a day andthey live media-saturated lives, typically using media for an average of more thansix hours a day (Roberts, Foehr, & Rideout, 2011). Given the prevalence of media,Strasburger, Wilson, and Jordan (2009) claimed that media has the ability to affectthe trajectory of the development and even the morality of a nation. Given thepotential of media to influence attitudes and behavior of audience, media literacy orknowing how to use the media toward one’s advantage is essential.
In a technological society, literacy extends beyond the skills of reading, writing,speaking, and listening to include multiple literacy, such as visual, media, andinformation literacy. Media literacy is defined as the ability to access, analyze,evaluate, and create media in a variety of forms (Aufderheide, 1993). Media literacyis the ability of individuals to access and understand information through differentmeans of media.
According to United Nations Educational, Scientific and Cultural Organization(UNESCO), information and media literacy make it possible for people to interpret,evaluate, and produce information messages. UNESCO’s main mission in this areais to acquire and systematically transform and produce fostering information andmedia literate societies through application of encouragement promoting thedevelopment of national information and media literacy policies in an educationalaspect (UNESCO, 2011).
The importance of developing media literacy among children who are consid-ered more vulnerable to media influence prompted the researcher to initiate a medialiteracy campaign, which serves as community project of the College of Arts andSciences. According to Tyner (2003), if students are to maximize the benefits ofmedia, they should learn how to be creative and critical media users. Thus, thisstudy aims to determine how the said campaign has been effective in meeting itsobjectives. Results of this study will provide basis for enhancing succeedingcampaigns of the same nature under College of Arts and Sciences.
290 G.R. Muya and Ma.A.C.P. Kagaoan

27.1.1 Review of Literature
Media has been a great help to us since the day it was discovered. It is widely usedby people nowadays. Media offers the opportunity to improve our way of life; itprovides information we can use to perform a course of action or basis to make animportant decision. Media also provides the entertainment that oftentimes serves asrelief from hustle and bustle of everyday life.
However, many studies have shown that the media do affect adolescents’aggressive and sexual behavior, body satisfaction, and eating disorders, as well asalcohol use and cigarette smoking (Brown, 2006). Thus, helping young people thatthe media are also in the business of selling products and ideas which may not bebeneficial to them and developing critical thinking among them are crucial.Moreover, while media provides opportunity for social engagement, studies ondigital divide shows ICT provision undermines equality in education, participation,and culture. Thus, media literacy studies become paramount. Brown (2006) evenstressed that media literacy education must involve analysis of the authors andaudiences, messages and meanings, and reality and representation.
Among children, media is pervasive. At a young age, students must not just beentertained from what they get from the media; they must also be well-informed ofthe role and function of media and of how to properly use the media. Eco (1991)emphasizes the importance of teaching how to use the media before using the mediafor teaching. In other words, the media is not simply a learning tool but also anobject of study that students must be able to understand and critique.
Along with the proliferation of media, issues arise on how children make senseof the media messages that are bombarded to them every day and the role of mediatools and technologies to them. According to the survey, in just five years, mediause has increased from 6.5 to nearly 7.5 h a day in children between the ages of8 and 18. Even more alarming, children have become master multitaskers, oftenusing two or more media devices at the same time (Roberts et al., 2011). Recentestimates of exposure to media starts early and rises quickly. Roberts and Foehr(2008) further argue that children six years and younger are exposed to daily tomedia content for almost 2.5 h, implying that this age group uses two or moremedia platforms at once approximately 25% of their time. Given this medialandscape, literature bounds with media literacy studies. There has been similarityon the notion of “media literacy” for at least a quarter of a century, although there isstill some confusion and disagreement about how it is to be defined (Buckingham,Burn, & Cranmer, 2005).
For Hobbs (1998), media literacy takes many different forms as evidenced by theissues emerging from debates: protection of children, student media productionexperiences, popular culture, ideological agenda, media literacy reach, support frommedia organization, and media literacy as a means to an end. According to Hobbs,response to this debate will shape the future of media literacy movement. Hobbsemphasizes though that media literacy is a tool for educational or social change.
27 Assessment of Media Literacy Campaign for Grade 4 Pupils … 291

The complexities of media literacy as a concept have spawned new questionsand methodological implications. New forms of media literacy have taken shapesuch as computer literacy or Internet literacy, cyber literacy, network literacy,digital literacy, information literacy, print literacy, audiovisual literacy, criticalliteracy, visual literacy, oral literacy, cultural literacy, and social literacy(Livingstone, 2004).
As previously mentioned, media literacy has four components: access, analysis,evaluation, and content creation (Aufderheide, 1993). Media literacy entails anal-ysis on how media audiences understand barriers to access analyze engagementwith media content and decode and interpret the media, evaluate and select fromamong the information and services from the media and create content. Thesecomponents emphasize the skills-based approach to media literacy. Beyond skills-based approach, media literacy studies should also focus on the relationship/interaction between text and reader (Livingstone, 2004). Taking this definition intoaccount, a media literate youth must be able to interpret the complex messages theyreceive from varied forms of media, can understand how these media messages areconstructed, can discover how they create meaning, can also create their ownmedia, and can become active participants in media culture (Montana Office ofPublic Instruction, 2014).
The prevalence and influence of the media make it a necessary part of twenty-firstcentury education. Billions of people are bombarded daily with information andentertainment through radio, television, print, film, and Internet. By buildingknowledge and competencies in using media and technology, media literacy educa-tion may provide a type of protection to children and young people by helping themmake good choices in their media consumption habits, and patterns of usage.
In light of the foregoing discussion, the College of Arts and Sciences through theCommunication Theory class on the second semester of academic year 2014–2015conducted its first media literacy campaign for its adopted school, MakilingElementary School, a public school located in Makiling, Calamba City, Laguna.The media literacy campaign aims to educate Grade 4 pupils on the forms of media,its importance, and how to use the media. It consisted of four modules: radio,television, print and Internet lessons. The campaign, conducted by second year ABCommunication students, involved lectures, interactive discussions and games andmultimedia presentations. The campaign period ran during the whole month ofSeptember 2014. In this study, the researcher sought to determine the extent ofeffectiveness of this campaign based on the posttest and the satisfaction surveyadministered at the end of the campaign.
27.1.2 Objectives
In general, this study aimed to assess the media literacy campaign for Grade 4pupils at a public elementary school in Calamba City, Province of Laguna,Philippines.
292 G.R. Muya and Ma.A.C.P. Kagaoan

Specifically, it aimed to (1) describe the pretest and posttest scores of therespondents in media literacy test; (2) analyze if there is significant change inposttest scores among respondents; and (3) describe satisfaction of pupil respon-dents to the media literacy campaign.
27.1.3 Conceptual Framework
Figure 27.1 illustrates that effectiveness of the media literacy campaign was mea-sured in terms of the difference in the pretest and posttest scores of the respondents.Moreover, the level of satisfaction to the campaign was also assessed to furthersupport how effective the media literacy campaign was.
27.2 Methodology
This research used the descriptive survey design to assess the effectiveness of medialiteracy campaign for Grade 4 pupils at Makiling Elementary School, a publicelementary school in Calamba City, Province of Laguna, Philippines. A multiplechoice type of test (Cronbach’s alpha = 0.74) measuring knowledge on the types ofmedia and how to use them properly was administered before and after the cam-paign among 126 pupils to determine if there is significant difference in theknowledge scores. The study also assessed how satisfied the respondents were tothe campaign. Data were analyzed using frequency counts, percentage, and t test.
27.3 Results and Discussion
27.3.1 Profile of Pupils
As shown in Fig. 27.2, there were more male (64 or 51%) than female (62 or 49%)pupils who participated in and completed the campaign, although there is an almostequal number of male and female pupils.
Effectiveness of Media Literacy Campaign
Pretest Scores Posttest Scores
Level of Satisfaction to campaign
Fig. 27.1 Conceptual framework of the study
27 Assessment of Media Literacy Campaign for Grade 4 Pupils … 293

Four sections of Grade 4 pupils participated in the media literacy campaign.Section 27.2 had the highest number of participants (42 or 33%). Section 27.4 hadonly 23 participants (18%) at the end of the campaign. When the campaign started,there were 190 students; however, some students started to absent from class. Only126 students were able to take both pretest and posttest. See Fig. 27.3.
27.3.2 Pretest and Posttest Scores of the Pupils
There were 40 items in the self-made knowledge test administered to the partici-pants. In the pretest, the mean score of the pupils was 29. The highest score thepupils got in the pretest was 38, while the lowest was 11 (Table 27.1).
Likewise, as shown in Table 27.2, only 3% of the students got the highest score.The table further illustrates that scores were highly dispersed. There were only 33pupils who did fairly well as they received a score of 35, 33, and 32 in the pretest.The results suggest that the pupils got a relatively fair score in media literacy test,
Female49% Male
51%
Fig. 27.2 Gender of respondents
32
42
29 23
0
10
20
30
40
50
1 2 3 4
Freq
uecy
Section
Fig. 27.3 Class size
Table 27.1 Mean score of the pupils
N Minimum Maximum Mean Std. deviation
Pretest 126 11 38 29.04 5.89
Posttest 126 19 40 32.88 4.76
294 G.R. Muya and Ma.A.C.P. Kagaoan

since most of them were able to answer more than 50% of the questions correctly.This pretest results then served as baseline data on the priority areas in thecampaign.
On the other hand, Table 27.3 shows posttest scores of the pupils were highercompared to their pretest. The highest posttest score was 40, while the lowest was19. The mean score also increased to 32.88, although scores were still dispersed asthe standard deviation (4.76) indicates. It can be gleaned though that the standarddeviation has slightly decreased in the posttest.
Comparing between pretest and posttest scores, the study found that there wassignificant difference in the scores (see Table 27.4). Results indicate that there wasa significant change in the score of the pupils in the knowledge test. The change inscores may be attributed to the media literacy campaign which served as inter-vention after the pupils took the pretest.
Table 27.2 Pretest scores Score Frequency Percent
35 12 10
33 11 9
32 10 8
25 9 7
28 9 7
31 9 7
26 8 6
30 8 6
29 6 5
34 6 5
27 4 3
36 4 3
37 4 3
38 4 3
18 3 2
23 3 2
24 3 2
17 2 2
20 2 2
22 2 2
11 1 1
13 1 1
14 1 1
15 1 1
16 1 1
19 1 1
21 1 1
Total 126 100
27 Assessment of Media Literacy Campaign for Grade 4 Pupils … 295

Table 27.3 Posttest scores
Score Frequency Percent
37 15 12
35 13 10
31 11 9
33 10 8
36 10 8
38 10 8
34 8 6
32 7 6
29 6 5
30 6 5
39 6 5
25 5 4
28 4 3
27 3 2
40 3 2
20 2 2
22 2 2
26 2 2
21 1 1
24 1 1
19 1 1
Total 126 100
Table 27.4 Difference between pretest and posttest
Mean Std. deviation t Sig. (two-tailed)
Pretest–Posttest −3.84 4.19 −10.28 0.000
Table 27.7 Mean rating of pupil’s satisfaction to campaign
Statement Mean
The time allotted for the event was adequate 4.90
The time and date of the event were convenient 4.53
The venue was spacious and appropriate 4.73
The sound system, lighting, room temperature, and other facilities were adequate 4.90
The teacher showed mastery of the subject and presented the topics clearly 4.84
Level of learning 4.54
The implementers have properly organized and coordinated the program/activity withconcerned personnel
4.76
Applicability to life 4.67
Overall, the program was successful 4.74
Composite mean 4.74
Legend 5—Excellent, 4—very good, 3—good, 2—needs improvement, 1—poor
296 G.R. Muya and Ma.A.C.P. Kagaoan

Results of this study support previous studies pointing out that media literacycampaigns are effective in promoting knowledge and understanding among theyouth on effects of media on health (Hindin, Contento, & Gussow, 2004; McLean,Paxton, & Wertheim, 2013), political participation (Nijboer & Hammelburg, 2010),critical thinking (Kellner & Share, 2007; Renee Hobbs, 2011), language skills(De Jong & Leseman, 2001, Goodrich et al., 2013; Martens, 2010), among others.
27.3.3 Satisfaction to Media Literacy Campaign
To further assess the campaign, the researcher determined the satisfaction of thepupils to the media literacy campaign through a customer satisfaction measurementbeing used at Lyceum of the Philippines University Laguna. Table 27.7 reveals afavorable reaction from the Grade 4 pupils to the campaign with an overall mean of4.74 interpreted as Very Good. Most statements received a rating of more than 4.5which is Very Good.
The table further shows that students were highly satisfied with the time allottedfor the event (4.90) and with the facilities used in the campaign. Although the studydid not cover pupils’ perception on what contributed best to their satisfaction to thecampaign, the campaign facilitators’ use of multimedia presentation and equipmentmay have contributed to the pupils’ rating of the campaign. Hartley (2000) men-tioned that when people see images at the same time as they hear or read infor-mation, understanding and retention go up. A global language, visual language is ameans to facilitate more effective communication and learning not only in the fieldof education, but also in business, science, and technology (Hartley, 2000).
27.4 Conclusion and Recommendation
The media literacy campaign was generally effective based on the increase in thescores between pretest and posttest and on the significant change in posttest scoresamong Grade 4 pupils. This finding was corroborated with the high level of sat-isfaction to the campaign evidenced in the results of the customer satisfactionmeasurement. Therefore, the campaign may be a means for the pupils to understandthe role media plays and how they can use the media to serve its purpose.
As technologies are becoming more sophisticated and advanced, campaigns mayhelp educational institutions develop media literacy in varied forms among childrenand young learners. As media literacy is a highly contested phenomenon, medialiteracy campaigns of the same nature that may be conducted in the future mayfocus on a specific area (e.g., media message) and specific medium (e.g., TVcommercial) so that outcomes become more observable and measurable. Theduration should be considered vis-à-vis the objectives, scope, and strategies of thecampaign. Since the campaign lasted for a short period of time, media literacy
27 Assessment of Media Literacy Campaign for Grade 4 Pupils … 297

cannot be measured effectively. In addition, interviews with participants mayprovide depth to the results of the study. Overall, the campaign may be sustainedand enhanced to promote media literacy not only for the pupils in Makiling but alsofor students of Lyceum of the Philippines University Laguna and its other adoptedschools.
References
Aufderheide, P. (1993). Media Literacy. A Report of the National Leadership Conference onMedia Literacy. Retrieved from http://eric.ed.gov/?id=ED365294
Brown, J. D. (2006). Media literacy has potential to improve Adolescents’ health. Journal ofAdolescent Health. doi:10.1016/j.jadohealth.2006.07.014
Buckingham, D., Burn, A., & Cranmer, S. (2005). the media literacy of children and young people.Ofcom, 1–75.
De Jong, P. F., & Leseman, P. P. M. (2001). Lasting effects on home literacy on readingachievement in school. Journal of School Psychology, 39(5), 341–389. doi:10.1016/S0022-4405(01)00080-2
Eco, U. (1991). COMO SE HACE UNA Umberto Eco. Técnicas Y Procedimientos De EstudioInvestigación Y Escritura, 29(4), 253. http://doi.org/web.usal.es/*mom/tesis_eco.pdf
Goodrich, J. M., Lonigan, C. J., & Farver, J. M. (2013). Do early literacy skills in children’s firstlanguage promote development of skills in their second language? An experimental evaluationof transfer. Journal of Educational Psychology, 105(2), 414–426. doi:10.1037/a0031780
Hanson, R. (2015). Mass communication: Living in a media world. Retrieved from https://scholar.google.com.ph/scholar?q=functions+of+mass+media+2015&btnG=&hl=en&as_sdt=0%2C5#2
Hartley, J. R. (2000). Visual language: Global communication for the 21st century. Journal ofComputer Assisted Learning, 16(4), 378. doi:10.1046/j.1365-2729.2000.00151.x
Hindin, T. J., Contento, I. R., & Gussow, J. D. (2004). A media literacy nutrition educationcurriculum for head start parents about the effects of television advertising on their children’sfood requests. Journal of the American Dietetic Association, 104(2), 192–198. doi:10.1016/j.jada.2003.11.006.
Hobbs, R. (1998). The seven great debates in the media literacy movement. Journal ofCommunication. Retrieved from http://onlinelibrary.wiley.com/doi/10.1111/j.1460-2466.1998.tb02734.x/abstract
Hobbs, R. (2011). Empowering and Media Literacy. Knowledge Quest, 39(5), 12–17.Kellner, D., & Share, J. (2007). Critical media literacy is not an option. Learning Inquiry, 1(1),
59–69. doi:10.1007/s11519-007-0004-2Livingstone, S. (2004). Media literacy and the challenge of new information and communication
technologies. The Communication Review. Retrieved from http://www.tandfonline.com/doi/abs/10.1080/10714420490280152
Martens, H. (2010). Evaluating media literacy education: Concepts, theories and future directions.Journal of Media Literacy Education, 2, 1–22.
McLean, S. A., Paxton, S. J., & Wertheim, E. H. (2013). Mediators of the relationship betweenmedia literacy and body dissatisfaction in early adolescent girls: Implications for prevention.Body Image, 10(3), 282–289. doi:10.1016/j.bodyim.2013.01.009
Nijboer, J., & Hammelburg, E. (2010). Extending media literacy: A new direction for libraries.New Library World. doi:10.1108/03074801011015676
Roberts, D., & Foehr, U. (2008). Trends in media use. The Future of Children. Retrieved fromhttp://muse.jhu.edu/journals/future_of_children/v018/18.1.roberts.html
298 G.R. Muya and Ma.A.C.P. Kagaoan

Roberts, D., Foehr, U., & Rideout, V. (2011). Generation M: Media in the lives of 8–18Year-Olds. Menlo Park, CA: Henry J. Kaiser Family Foundation; 2005. Retrieved from https://scholar.google.com.ph/scholar?q=%28Roberts%2C+Foehr%2C+%26+Rideout%2C+2005&btnG=&hl=en&as_sdt=0%2C5#3
Schramm,W. (1964).Mass media and national development: The role of information in the developingcountries. Retrieved from https://www.google.com/books?hl=en&lr=&id=z16jAAAAIAAJ&oi=fnd&pg=PA1&dq=mass+media+plays++increasing+role+in+society,+providing+information+as+well+as+entertainment&ots=3GkaZGU3mk&sig=z5099SdfG1BDzrGuFIqRTeX-B-s
Strasburger, V., Wilson, B., & Jordan, A. (2009). Children, adolescents, and the media. Retrievedfrom https://scholar.google.com.ph/scholar?q=wilson+2008+media&btnG=&hl=en&as_sdt=0%2C5#8
UNESCO. (2011). Media and information literacy Retrieved from http://portal.unesco.org/ci/en/ev.php-URL_ID=27056&URL_DO=DO_TOPIC&URL_SECTION=201.html
27 Assessment of Media Literacy Campaign for Grade 4 Pupils … 299

Chapter 28Graduate Tracer Study for IndustrialEngineering Program from Batch2013 to 2015
Ryan Jeffrey P. Curbano and Ricky V. Bustamante
Abstract This graduate tracer study aims to survey and trace the graduates fromtheir school of origin to their employment. The researcher used the survey ques-tionnaire developed by the Commission on Higher Education (CHED) to obtain theneeded information in the study. The subjects of the study were the IndustrialEngineering graduates from batch 2013 to 2015. Findings of the study revealed thatmajority of the respondents were female, and have monthly income of P15,000 toless than P20,000 in their first job. Majority of the respondents were regular orpermanent with their employment status in their jobs and below to a position that isclassified as professional/technical or supervisory level of work. The assessment ofprogram and learning were rated moderately agree while the attainment of studentoutcome was rate above the target of 60%. It was also found out that there was nosignificant relationship between assessment of learning and program in theemployment status and current position. Lastly, the study revealed that Lyceum ofthe Philippines Laguna provides quality education to the students in the field ofIndustrial Engineering.
Keywords Tracer study � Industrial engineering � Program � Learning � Studentoutcome
28.1 Introduction
A tracer study/follow-up study is a graduate or alumni survey that attempts to tracethe activities of the graduates or former students of an educational institution.Mercado (2010) explains that tracer studies enable the contextualization of grad-
R.J.P. Curbano (&) � R.V. BustamanteIndustrial Engineering Department, Lyceum of the Philippines University,Laguna, Calamba, Philippinese-mail: [email protected]
R.V. Bustamantee-mail: [email protected]
© Springer Nature Singapore Pte Ltd. 2018S.F. Tang and S.E. Cheah (eds.), Redesigning Learning for GreaterSocial Impact, DOI 10.1007/978-981-10-4223-2_28
301

uates of a particular university through a system that is dynamic and reliable inorder to determine their life path or movement. According to CHED (Commissionon Higher Education), graduate tracer study constitutes an important tool foreducational planners; as they can provide valuable information for evaluating theproductivity of the higher education and training institutions. It is an effort to surveythe performance of graduates in the job market upon completion of their chosenfield of interest. Graduate tracer studies are increasing and are higher educationinstitution all over the world. A tracer study was perceived as useful to improve thelearning process, gauge the market (satisfaction, demand), and building alumninetwork.
According to Othman, Buntat, Sulaiman, Salleh, and Herawan (2010), Graduateshad that much opportunity to develop their employability skills such as commu-nication, leadership, and problem-solving. According to Rivera et al. (2012), theconcept of employability requires focusing on four main dimensions: The dimen-sion relating to the skills and competencies that make an individual potentiallyemployable that focused on the motivation to find a job; the one related to social,economic, and cultural determining factors; and the last dimension comprising thediverse effects on work-related, personal, economic, health-related, and unem-ployment effects. In addition, Ahmad, Zainal, Idris, and Rahmat (2011) find out thatcompetitive graduates in the job market often depend on strong curriculum of theprogram.
In the Philippines, graduate tracer studies are initiated by the CHED and fol-lowed by different colleges and universities. Locally, there are few schools anduniversities conducting it. But is growing and more are adapting to it in order toimprove their effectivity in producing employable graduates.
The study aims to track the graduates of Industrial Engineering in Lyceum of thePhilippines Laguna as a way of gauging their capability of securing employment. Itis also a means of determining the graduate’s satisfaction level during their stay inthe university and a means of obtaining basic information on the status of graduatesupon graduation.
Lyceum of the Philippines Laguna is calling on all graduates of IndustrialEngineering from 2013 to 2015 to participate in the study. It is the institution visionto produce graduates who are well equipped with necessary skills, knowledge, andattitudes. The tracer study wants to know the satisfaction level of the graduates interms of curriculum, career guidance, quality of lectures, and facilities of theinstitution. It also seeks to determine the attainment of the student outcomes of theIndustrial Engineering graduates. The output of the study will help the universitymanagement in planning and determining factors related to the continuous qualityimprovement of curriculum and services of the institution.
302 R.J.P. Curbano and R.V. Bustamante

28.1.1 Objectives of Study
The study aimed to trace the Industrial Engineering graduates of Lyceum of thePhilippines Laguna from batch 2013 to 2015. Specifically, it sought to answer thefollowing objectives.
1. To describe the demographic profile of the Lyceum of the Philippines IndustrialEngineering graduates in terms of gender, monthly income, and length ofservice.
2. To evaluate Industrial Engineering program in terms assessment of program andassessment of learning.
3. To assess the extent of attainment of student outcomes based on target.4. To determine the current status of employment and position of the graduates.5. To find out if there is significant relationship between the assessment of the
program and status of employment and the current position.6. To find out if there is significant relationship between the assessment of learning
and status of employment and current position.
28.1.2 Scope and Limitation of the Study
The study is limited to the preparation and evaluation of graduates that seek toimprove the quality education at Lyceum of the Philippines Laguna and to be ableto identify graduates employment status. This study only includes graduates ofIndustrial Engineering of Lyceum of the Philippines Laguna from batches 2013 to2015. This was conducted via online survey that ran from January 2016 to August2016. The respondents who answered on the given period are the ones that will onlybe considered and used in the study. The conduct of the study was online throughthe use of Google Docs, a Google application.
28.1.3 Conceptual Framework
The framework is an intermediate theory that attempts to connect to all aspects ofinquiry. It shows how the program and learning acquired from the institution affectthe employment status and position of the students after graduation. It also showshow the attainment of student outcomes affects the employment status and positionof graduates (Fig. 28.1).
28 Graduate Tracer Study for Industrial Engineering Program … 303

28.2 Methodology
28.2.1 Research Design
The researcher used descriptive research in the study because it involved collectionsof quantitative information such as profile of respondents, assessment of learningand program, and attainment of student outcomes.
28.2.2 Respondents of the Study
The researchers selected all the graduates of Industrial Engineering of LPU-L frombatch 2013 to 2015. There were total of 82 graduates from batch 2013 to 2015. Theresearcher only used the survey answers that ran from the survey period providedby the researchers. This was due to unexpected slow retrieval of survey answerfrom the period January 2016–August 2016. Retrieval rate was 53.65% or 44 out of82 respondents.
28.2.3 Research Instruments
The researcher used a questionnaire as instrument of the study. The questionnairewas adapted in the CHED instrument, and it was modified to include the attainmentof student outcomes based on the CHED Memorandum Order 15 series of 2008.The questionnaire is currently being used for graduate tracer study of the institutionunder Research and Statistics Center. It is an online survey questionnaire throughGoogle Docs, a Google application. The questionnaires were divided into threeparts. The first part was about profile of respondents. The second part was about
Assessment of Learning
Assessment of Program
Attainment of Student Outcome
Employment Status
Position
Fig. 28.1 Conceptual framework
304 R.J.P. Curbano and R.V. Bustamante

assessment of learning and program and the last part was about assessment ofattainment of student outcomes. Each item of questionnaire will have options 5—strongly agree, 4—moderately agree, 3—agree, 2—disagree, and 1—stronglydisagree.
28.2.4 Statistical Treatment
The statistical treatments to be used in the interpretation of the data and testing thenull hypothesis of the study will include the percentage formula, weighted mean,and Pearson correlation coefficient. The percentage formula was used to describeand present the profile of respondents and attainment of student outcome. Theweighted mean was used to determine to what extent the graduates of IndustrialEngineering students evaluate the program and learning. The Pearson correlationcoefficient was used to find out the relationship of assessment of program andlearning in the employment status and position.
28.3 Results and Discussion
This chapter contains all the results of the survey that was given to all of therespondents of the research.
Table 28.1 shows the distribution of respondents in terms of gender. There 24out of 44 or 54.55% were female, and 20 out of 44 or 45.45% were male. Thisshowed that majority respondents who answer the questionnaire were female.
Table 28.2 shows the distribution of the respondents in terms of length of ser-vice. Most of the graduates (31.82%) have stayed in their jobs for 2 years to lessthan three years. This is followed by one year to less than two years with (22.72%),then by seven to eleven months with (18.18%), one to six months with (15.90%),less than a month with (4.55%) and (6.81%) with no service because they ownfamily business.
Table 28.3 shows the distribution of the respondents in terms of income.Majority of the graduates (54.55%) have earned an initial gross monthly income ofP15,000 to less than P20,000 in their first job. The minority (25%) on the otherhand have monthly income of P10,000 to less than P15,000. 6.82% have monthlyincome of P5,000–P10,000 and P20,000 to less than P25,000. 4.54% have monthly
Table 28.1 Distribution ofrespondents in terms gender
Gender Frequency Percent
Male 20 45.45
Female 24 54.55
Total 44 100.00
28 Graduate Tracer Study for Industrial Engineering Program … 305

income of P30,000 to less than P40,000 and (2.27%) have monthly income ofP40,000 to less than P50,000.
Table 28.4 shows that the assessment of Industrial Engineering programobtained a composite mean of 3.93 with verbal interpretation of “ModeratelyAgree.” It was noted that “On-the-job training/internship is enough to equip thestudents with hands-on training experienced related to the job” with mean of 4.13verbally interpreted as “Moderately Agree” and “The program components arerelevant to the job” with a mean of 4.13 verbally interpreted as “ModeratelyAgree.” It shows that internship program of the institution helps the students to beprepared for their actual job. On the other hand, “The program length is sufficient toproduce graduates with the required entry-level knowledge and/or skill in thefield/workplace” had lowest mean of 3.38 verbally interpreted as “Agree.” Thismeans that the knowledge and skills of the programs should be checked and alignedwith the needs of the industry.
Table 28.5 shows that the assessment of learning of Industrial Engineeringprogram obtained a composite mean of 3.91 verbally interpreted as “ModeratelyAgree.” All of the measures in the assessment of learning obtained a verbalinterpretation of “Moderately Agree.” This shows that Industrial Engineering stu-dents developed an attitude as team player, better in time management skills,become more enthusiastic in further learning and open to ideas of others, becomemore responsible and independent in their work, and become analytical andproblem solver (Table 28.6).
The table shows the results of the survey to the graduates of BSIE. Based on theresult of the survey, all students’ outcomes were rated above satisfactory level ofattainment of 60%. Students outcomes (2) “ability to design and conduct
Table 28.2 Distribution ofthe respondents in terms oflength of service
Length service Frequency Percent
No service 3 6.81
Less than a month 2 4.55
1–6 months 7 15.90
7–11 months 8 18.18
1 year to less 2 years 10 22.72
2 years to less 3 years 14 31.82
Total 44 100
Table 28.3 Distribution ofthe respondents in terms ofincome
Income Frequency Percent
P5000 less than P10,000 3 6.82
P10,000 to less than P15,000 11 25
P15,000 to less than P20,000 24 54.55
P20,000 to less than P25,000 3 6.82
P30, 000 to less than P40,000 2 4.54
P40,000 to less than P50,000 1 2.27
Total 44 100
306 R.J.P. Curbano and R.V. Bustamante

experiments as well as analyze and interpret data” with mean percentage of 89.09%,(3) “ability to work effectively in multidisciplinary and multicultural teams” with86.67%, (7) “Recognition of professional and ethical responsibility” with 86.67%,(11) “ability to perform services in the form of analysis, design, preparation ofplans, specifications, estimates, and implementation of work standards, statisticalprocess control systems, production planning and materials control systems, man-ufacturing and service facilities, operations research models for production andoperations, information systems” with 86.67%, and (12) “knowledge and under-standing of engineering and management principles as a member and leader in ateam, to manage projects and in multidisciplinary environment” with 86.67% hadthe highest mean percentage. It also manifests in the students verbatim commentsthat professors and their teaching strategies are the strongest points of college.
Table 28.7 shows the distribution of the respondents in terms of employmentstatus. Majority of the graduates are regular or permanent (70.45%) with theiremployment status in their jobs, while minority (15.91%) is probationary, (6.82%)are temporary or contractual, and (6.82%) are own business.
Table 28.4 Assessment of the program
Assessment of program Weightedmean
Verbalinterpretation
Rank
1. The course content is very comprehensive andrelevant to the job
4.08 Moderately agree 3
2. The program components are relevant to the job 4.13 Moderately agree 1.5
3. The objectives of the program had been achieved 4.09 Moderately agree 2
4. The objectives of the program are similar to theobjectives of the workplace
4.04 Moderately agree 4.5
5. The program length is sufficient to producegraduates with the required entry-level knowledgeand/or skill in the field/workplace
3.38 Agree 11
6. The program description captures the types ofduties a graduate can expect to perform in the workenvironment
3.91 Moderately agree 7
7. The courses are relevant to the intended career 3.91 Moderately agree 7
8. Quality of instruction is sufficient and providedwhat is required in the workplace
3.74 Moderately agree 10
9. Quantity of instruction is sufficient for therequirement of the workplace
3.78 Moderately agree 9
10. Quality of guidance services is sufficient for therequirement of the workplace
3.91 Moderately agree 7
11. Interpersonal relationships had been developedin school
4.04 Moderately agree 4.5
12. On-the-job training/internship is enough toequip the students with hands-on experiencesrelated to the job
4.13 Moderately agree 1.5
Composite mean 3.93 Moderately agree
28 Graduate Tracer Study for Industrial Engineering Program … 307

Table 28.8 shows the distribution of respondents in terms of position. Majorityof the graduates (68.18%) belong to a position that was classified as professional ortechnical/supervisory level of work, while minority (13.63%) were classified asmanagerial, (11.36%) no response, (4.55%) were classified as rank and file(Table 28.9).
The assessment of the program and status of employment obtained a Pearsoncorrelation of −0.265 with probability value of 0.221 verbally interpreted as notsignificant. While the assessment of the program and current position obtained aPearson correlation of −0.369 with probability value of 0.084 verbally interpretedas not significant. Aquino et al. (2013) find out that assessment of program hasinverse relationship in status of employment and current position. This means thatthe status of employment and current position does not depend on the programassessment (Table 28.10).
The assessment of learning and the status of employment obtained Pearsoncorrelation coefficient of 0.107 and probability of 0.627 verbally interpreted “notsignificant”; however, there was direct relationship between assessment of learning
Table 28.5 Assessment of learning
Assessment of learning Weightedmean
Verbalinterpretation
Rank
1. Developed knowledge and skillsapplicable to a career
3.65 Moderately agree 16
2. Developed my ability to work as a team 4.13 Moderately agree 2
3. Motivated me to do my best work 4.17 Moderately agree 1
4. Provided me with a broad overview ofmy course/major
3.7 Moderately agree 14.5
5. Developed my time management skills 3.83 Moderately agree 11
6. Developed my initiative 4.04 Moderately agree 3.5
7. Sharpened my analytical skills 3.78 Moderately agree 12
8. Developed my creativity 4.04 Moderately agree 3.5
9. Developed my confidence to investigatenew ideas
4.00 Moderately agree 4
10. Developed my problem-solving skills 4.00 Moderately agree 4
11. Stimulated my enthusiasm for furtherlearning
4.00 Moderately agree 4
12. Improved my skills in writtencommunication
3.87 Moderately agree 10
13. Helped developed my ability to plan myown work
3.96 Moderately agree 8
14. Helped me make informed judgment 3.91 Moderately agree 9
15. Developed my computer skills 3.70 Moderately agree 14.5
16. Developed my oral communicationskills
3.74 Moderately agree 13
Composite mean 3.91 Moderately agree
308 R.J.P. Curbano and R.V. Bustamante

and status of employment. While assessment of learning and current positionobtained −0.108 and probability of 0.624 verbally interpreted as “not significant.”This means that there is no significant relationship between assessment of learning
Table 28.6 Extent of attainment of student outcomes
Extent of achieving student outcomes Percentage ofattainment (%)
Target meanrating (%)
1. Your education manifests ability to apply knowledgeof mathematics, physical and information sciences, andengineering sciences to the practice of IndustrialEngineering
86.06 60
2. Your education promotes the ability to design andconduct experiments as well as to analyze and interpretdata
89.09 60
3. Your education develops the ability to design, build,improve, and install systems or processes which areefficient, effective, as well as robust to meet desiredneeds within identified constraints
84.84 60
3. Your education develops the ability to workeffectively in multidisciplinary and multicultural teams
86.67 60
4. Your education promotes the ability to identify,formulate, and solve engineering problems
84.85 60
5. Your education teaches the ability to effectivelycommunicate orally and in writing using the Englishlanguage
83.63 60
7. Your education provides recognition of professionaland ethical responsibility
86.67 60
8. Your education provides understanding of the effectsof engineering solutions in a comprehensive context
84.24 60
9. Your education paves the way the ability to engage inlife-long learning and an understanding of the need tokeep current of the developments in the specific field ofspecialization
84.85 60
10. Your education makes extensive use of thetechniques, skills, and engineering tools necessary forengineering and business practice
85.45 60
11 Your education develops ability to perform servicesin the form of analysis, design, preparation of plans,specifications, estimates, and implementation of workstandards, statistical process control systems, productionplanning and materials control systems, manufacturingand service facilities, operations research models forproduction and operations, information systems
86.67 60
12. Your education provides extensive knowledge andunderstanding of engineering and managementprinciples as a member and leader in a team, to manageprojects and in multidisciplinary environment
86.67 60
Source Policies and Guidelines for BS Industrial Engineering CMO 15 series of 2008
28 Graduate Tracer Study for Industrial Engineering Program … 309

and status of employment and current position. Aquino et al. (2013) revealed thatthere are companies provide intensive training to relate to the need of the industry.
28.4 Conclusion
Majority of the respondents were female. Most of the graduates stay in their first jobthat ranges from 2 years or less than 3 years. The initial monthly income of theIndustrial Engineering graduate ranges from P15,000 to less than P20,000 andmajority of the IE graduates are regular or permanent with their employment statusand are working in a professional/technical or supervisory level of work. Thegraduates evaluate the Industrial Engineering program as “Moderately Agree” with
Table 28.7 Distribution ofrespondents in termsemployment status
Employment status Frequency Percent
Regular/permanent 31 70.45
Temporary/contractual 3 6.82
Probationary 7 15.91
Own business 3 6.82
Total 44 100
Table 28.8 Distribution ofrespondents in terms ofposition
Position Frequency Percent
Rank and file 2 4.55
Professional/technical 30 68.18
Managerial 6 13.63
Self-employed 1 2.27
No response 5 11.36
Total 44 100
Table 28.9 Relationship of assessment of program and status of employment and current position
Correlation coefficient, r Probability Verbal interpretation
Status of employment −0.265 0.221 Not significant
Current position −0.369 0.084 Not significant
Legend P value � 0.05—Not significant, P value < 0.05—Significant
Table 28.10 Relationship of assessment of learning and status of employment and currentposition
Correlation coefficient, r Probability Verbal interpretation
Status of employment 0.107 0.627 Not significant
Current position −0.108 0.624 Not significant
Legend P value � 0.05—Not significant, P value < 0.05—Significant
310 R.J.P. Curbano and R.V. Bustamante

composite mean of 3.93. Similarly, in the assessment of learning for IndustrialEngineering course it obtained a composite mean of 3.91, verbally interpreted as“Moderately Agree.” The assessment of the respondents in terms of attainmentstudent outcomes obtained overall percentage 85.31% against the target of 60%.The evaluation tells that LPU-L has provided quality education to the graduates. Itwas found out that there is no significant relationship between the assessment ofprogram and employment status and current position and similarly in the assess-ment of learning and employment status and current position. This also proves inthe study that the status of employment within one’s job does not depend so muchon lack of education.
28.5 Recommendation
The researcher would like to recommend that the course syllabus should be givenimportance by the institution since review of curriculum done yearly by eachdepartment through Industry Board of Advisers meeting. Quality of instructionshould emphasized well, the outcome-based instruction are encourage practicingmore inside the classroom. On-the-job training should have a training plan priordeployment on the job to ensure the knowledge learned inside the classroom isapplied in the actual work. More updated industry software tools should be inte-grated in the lecture.
References
Ahmad, K., Zainal, N. F. A., Idris, S., & Rahmat, M. (2011). Relationship between employabilityand program outcomes achievement. Procedia—Social and Behavioral Sciences, 59, 254–263.doi:10.1016/j.sbspro.2012.09.273
Aquino F. R. et.al., (2013). Graduate tracer study for industrial engineering program from batch2010–2012. LPU-L Research Journal College of Engineering, 2(2). ISSN 2350-7640.
Chavez, N. H., De Castro, E. L., Camello, N. C., Dolot, J. A., & Laguador, J. M. Relevance ofschool related factors to the job placement of engineering graduates. EPH-InternationalJournal of Science And Engineering, 1(6).
Dotong, C. I. (2014). School-related factors in the development of graduates’ competenciestowards employability. Journal of Education and Literature, 2(1), 28–36.
Mercado, F. (2010). A tracer Study of MSEUF graduates. MSEUF Research Studies, 12(1),Retrieved June 27, 2016, from http://ejournal.ph
Othman, H., Buntat, Y., Sulaiman, A., Salleh, B. M., & Herawan, T. (2010). Applied mathematicscans enhance employability skills through PBL. Procedia Social and Behavioral Sciences, 8,332–337.
Rivera, M. D. A., Gallego, L. V., Álvarez, M. A., Inchaurtieta, A. M., Albizuri, I. E., & de Eulate,C. Y. Á. (2012). Perceived Employability and Competence Development. Procedia—Socialand Behavioral Sciences, 69(24), 1191–1197.
28 Graduate Tracer Study for Industrial Engineering Program … 311

Chapter 29The Effectiveness of MOOC AmongLearners Based on Kirkpatrick’s Model
Wei Wei Goh, Seng Yue Wong and Enna Ayub
Abstract Massive open online course (MOOCs) are transforming the era of dis-tance learning education in a groundbreaking way that it has attracted a hugeamount of attention from the media, education institutions, and education profes-sionals. The purpose of this study is to measure the effectiveness of coursesdelivered using MOOCs in Taylor’s University. The Kirkpatrick’s four levels ofevaluation learning model were adapted to measure the effectiveness of MOOCs.A descriptive survey of 250 learners was conducted. The study indicated thatcomprehensive study materials in MOOCs are useful for the learners as futurereference. MOOCs are effective in the sense that it helps learners to understand acertain topic and apply it in real life. The program has met the learners’ expecta-tions, and they will strongly recommend the course to other people. Nevertheless,learners think that the study materials are sufficient for beginners, but advancedcourse is needed to meet their future job expectation. This study focuses onMOOCs in OpenLearning platform only. In the future, research can be expanded tofocus on different MOOC platforms besides OpenLearning. Lastly, with the resultobtained in this research, it will be able to contribute to the community of MOOCand institutions that plan to introduce MOOCs.
Keywords Kirkpatrick evaluation model � MOOCs � Effectiveness
W.W. Goh (&) � S.Y. Wong � E. AyubTaylor’s University, Subang Jaya, Malaysiae-mail: [email protected]
S.Y. Wonge-mail: [email protected]
E. Ayube-mail: [email protected]
© Springer Nature Singapore Pte Ltd. 2018S.F. Tang and S.E. Cheah (eds.), Redesigning Learning for GreaterSocial Impact, DOI 10.1007/978-981-10-4223-2_29
313

29.1 Introduction
Today’s online learning has offered rich educational resources in multiple media,including social media and the capability to support synchronous and asynchronouscommunication between instructors and learners as well as different types oflearners, with the advent of Internet and World Wide Web (WWW). Hence, thepotential for approaching to learners from the worldwide has been risen progres-sively, and the adoption of online learning or electronic learning (e-learning) fromthe higher education institution (HEI) and corporate training institution alsoincreased rapidly. Globalized online learning is the ninth shift of MalaysianEducation Blueprint, which has highlighted by Ministry of Education, Malaysia, forthe transformation of Malaysian higher education system (Ministry of Education,2015). Massive open online course (MOOC) is one of the main strategies that wereinitiated by Malaysian Government, with the Malaysian Education Blueprint forhigher education, National Economic Model, and Economic TransformationProgram (Mansor, Latifah, & Tengku Amina, 2015; Nor Fadzleen, Rose, & Naoki,2015). MOOC has emerged as a significant environment for online learning, yetlittle is known about how user actually learns in a MOOC (Malligan, Littlejohn, &Hood, 2016).
MOOC is an online course which consists of recorded online video lectures onany given topic by one or more university professors and educators that is theneasily accessed online by anyone around the world (Goh, Kaur, & Chion, 2015).Cloud system is hosted all learning materials, and the learning contents are deliv-ered online so that it can be accessible from anywhere on the Web. The firstMalaysian MOOC is launched by a private higher education, named Taylor’sUniversity, which offered entrepreneurship by the Dean of School of Engineeringvia OpenLearning platform (Mansor et al., 2015; Nor Fadzleen et al., 2015;Muhstak, 2014). The pilot MOOC has initially created with the goal to promotehigher education institution’s presence online learning and designed to attractstudents to further their studies.
Moreover, Malaysia also became the first country in the world to implementMOOC initiative for public universities (Nor Fadzleen et al., 2015; Ratnaria,Azizudin, Bakri, Muhammad, & Khaliza, 2015). The objective of this initiative is toboost the ranking of Malaysian higher education on global scale, by providingglobalized, opened online learning experience without the limitation of time andaccessibility (Nor Fadzleen et al., 2015). In Malaysia, the MOOC movement is stillnew and most of the HEI has just begun to catch on its wave and making MOOC tofit into their e-learning or blended learning system and platforms. The adoption ofMOOC is also a strategy to bolster the international visibility and the university’sreputation (Ayub & Lim, 2016). With the emergence and implementation ofMOOC in HEI, there are same issues regarding the concept of MOOC, questioningabout pedagogical elements in MOOC (Gene, Nunez, & Blanco, 2014), assessmentsystem and interaction between instructors and learners, and low completion rate(Chen & Chen, 2015; Gene et al., 2014).
314 W.W. Goh et al.

Thus, the purpose of this study is to measure the effectiveness of coursesdelivered using MOOCs in Taylor’s University. The Kirkpatrick’s four levels ofevaluation model have been adopted to evaluate the effectiveness of the MOOCs.The results presented in the following section relate to the identified researchquestions. The research questions are as follows: (1) How effective are the coursesdelivered using MOOCs and (2) what are the issues faced when using MOOCs?Although MOOC is the peak of the hype cycle of the education system in year2013, it will be gone down, at the midst of the “trough of disillusionment.” Hence,this study has yet to represent MOOCs’ effectiveness in all higher education sys-tem; however, this survey study has explored on how effective the MOOCs thatconducted in a selected higher education institution. The researchers hope thefindings from this study will be able to contribute to the community of MOOC andother HEI that plan to implement MOOCs.
29.2 Literature Review
As a disruptive innovation, massive open online course (MOOC) has brought torevolution in education and made potential changes in the existing higher educationlandscape. Availability, affordability, and opportunity are three features of MOOC,which provides high quality of learning contents to the worldwide students. MOOCis used to promote lifelong learning which is crucial to increase students’ knowl-edge, deepened thinking skills, improve attitudes, and achieve learning goals infuture life. Thus, MOOC provides free and open education to students from theworld and is currently leading to new learning scenarios (Munoz-Merino,Ruiperez-Valiente, Alario-Hoyos, Perez-Sanagustin, & Kloos, 2015).
MOOC has shown a convergence of interests in social, economic, and tech-nology developments in education in a global context. Five changes have beenexplored in higher education landscape (Yuan & Powell, 2013): (1) the expandedmomentum of globalized learning; (2) the increased demand for accessibility tohigher education; (3) the changing of learners’ demographics, experiences, and thegrowing numbers of lifelong learners; (4) the increased accessibility of social mediaand promote personalized learning (Grosseck, Holotescu, Bran, & Ivanova, 2015;Yuan & Powell, 2013); and (5) the changing model for higher education cost andaffordability. Moreover, MOOCs also provide HEI with a platform to think cre-atively and innovatively and to explore new pedagogical practices, businessmodels, and flexible learning paths in their provision. Hence, openness, a vitalfeature in driving educational innovation and transforming higher education systemin the world (Yuan & Powell, 2013).
The great deal of MOOC is they will provide free access and cutting-edgecourses which can drive down the cost of university-level education and potentiallydisrupt the existing models in higher education. Many platforms are used to provideMOOCs in HEI, such as edX, Coursera, FutureLearn, and Audacity (Yuan &Powell, 2013). Some studies of the MOOC believe that MOOC can benefit the HEI,
29 The Effectiveness of MOOC 315

lecturers, and students. For instance, MOOCs represent the ultimate democratiza-tion of education, by offering the easy accessibility to all. In most cases, participantssubscribe MOOCs for free of charge and in some cases for a small or minimal fee toobtain a completion certificate (Hew & Cheung, 2014).
Nevertheless, the effectiveness issues of MOOC need to be explored to ensureMOOC really can be implemented in Malaysia in future. Strategic discussionconcerning the disruptive potential of MOOC in higher education institutions needsto be conducted. Thus, higher education institutions need to make decisions abouthow to serve their specific mission and how to react to the different needs ofstudents in a rapidly changing educational market.
29.3 Methodology of the Study
Each of the four levels of the Kirkpatrick model was applied in this survey. Thispaper will objectively discuss the effectiveness of Taylor’s MOOCs based on theKirkpatrick’s model adopting quantitative and qualitative approach. This modelhelps to objectively analyze the effectiveness and impact of training, and thismethod was also used to analyze the MOOCs as it is important for the coursecreators and instructors to get feedback on how the MOOCs have impacted thelearners and how they may improve the courses in the future.
The measures in Kirkpatrick’s model are recommended to preliminarily evaluateTaylor’s pilot MOOCs to get an all-encompassing evaluation of learning usingMOOC as pedagogy. The following are the measures adopted into the survey givento the students after they have completed their MOOCs:
• Level 1: Learner’s reaction—what they thought and felt about the MOOCs andwhether the learning experience met their expectations (the LearningEnvironment)
• Level 2: Learner’s learning—what they thought and felt about the learningenvironment that is OpenLearning in MOOCs and whether they thought theMOOCs met their expectation and increased their ease of obtaining knowledgeor capability (Overall)
• Level 3: Learner’s behavior—in what they think the MOOC is relevant andhelpful for their future success also the extent of behavior and capabilityimprovement and the application is also looked for (Relevance)
• Level 4: Effectiveness results—the effects of MOOC on student’s learning andtheir confidence on applying what they have learned as a result from taking upthe MOOC and the engagement from facilitators and their peers were alsoobserved qualitatively (Energy for Change)
This study is a descriptive study. This study is used to collect different types ofinformation and description from different perspectives to determine the effec-tiveness of MOOC in Taylor’s University via a survey research method. Data were
316 W.W. Goh et al.

collected via a questionnaire when the participants had completed their MOOCs.Taylor’s University is estimated having 4000 students in population. As mentionedabove, there are 250 students be the respondents for this study. Thus, the sampleproportion of the population with the population size = 4000 are equal to 0.0625.Since the sample proportion value is more than 0.05 (5%), therefore, the number ofsubjects is sufficient for the study (Chua, 2012).
29.4 Findings and Discussion
The findings of the survey will be presented and discussed based on two researchquestions as mentioned in the introduction, the effectiveness of MOOCs and theissues of using MOOCs from the learners’ perceptions.
29.4.1 The Effectiveness of MOOCs
(a) Helpful study materials and suitable program
One of the major findings for the effectiveness of MOOCs is that the learners findthe program is suitable to a wide range of learners. The curriculum in MOOCsfeatured a publicly shared curriculum with open-ended learning outcomes.According to the learners, the content-based MOOCs are anchored in content. It isfree access to all learning materials such as lecture, small videos clips, text-basedreadings, slides, practical exercises, audio files, URL to other resources, onlinearticles, discussion forums, case study, self-reflection, and peer feedback.
The learners expressed that all the contents in MOOCs appeared in a structuredform with video and appropriate assessment timeline. It makes study more acces-sible, affordable, and attainable. The lecture slides and learning materials arehelpful. The use of short videos is interconnected with formative quizzes that arebased on lecture slides. The exercise instructions are clear and easy to understand. Ithelps the learners in their quizzes and assessment.
The finding shows that the learners like the downloaded lecture slides. Thelearners do not have to spend time on compiling study materials. All the finishedworks are saved automatically. The learners attempt to model a real-life projectafter completed the MOOC. Hence, effective materials can encourage and sustainengagement and thereby assisting learning. Curriculum activities, course activities,assignments, and assessment need to be considered in order to design an effectiveMOOCs. Assessments are encouraged to be built around a mapping betweenintended learning outcomes and objectives of the topic (Terras & Ramsay, 2015).
29 The Effectiveness of MOOC 317
(b) MOOC is useful for future reference
The learners think that MOOCs can greatly improve their knowledge for theirfuture working environment. According to the learners, learning using MOOCs hasgiven them the opportunities to improve and update their portfolio. The certificationof the course is valuable to be added into the learner’s CV. One of the learnersexpressed that videos and activities in MOOCs related to field trip and analysis havecreated the inspiration and ideas for them especially in their studio design.
When the learners read the articles posted in MOOCs, the learning materialshave created their curiosity and they start to research further for more knowledge.They have a clearer idea on what they are learning and how it works. The learnersadmit that the knowledge that they have learned in MOOCs is benefit to them in thefuture as they have a better understanding on the topics. This provides them theopportunity for better income and continues learning throughout life.
Gomez-Zermeno and Garza (2016) also agreed that MOOC is an alternativeeducational method for professionals who look for complimentary training andeducation. MOOC is suitable for people with professional education and experienceto expand their knowledge (Ari, 2013). Furthermore, the learners highlighted thatthey started to apply what they have learned in MOOCs to their real life. They agreethat the course allows the acquisition of new knowledge and skills in their field. Ithas widened their knowledge after completed the course. They mentioned therelevance of MOOCs to the subject area they are studying. The learners are able tomodel a real-life project after the tutorial in MOOCs. They started to apply whatthey have learned in MOOCs to their real life. Table 29.1 has presented thelearners’ thoughts about the MOOCs for future reference.
Table 29.1 Learners’ thinkthat MOOCs are useful forfuture reference
“Yes, the relevance of content is beneficial for future reference”
“This subject has thought me many aspects of architecture thatis relevant to my studio such as poetics, material, and vernacularcomponents”
“The program material will be helpful for my success in thefuture”
“I will be using it as part of my civil career”
“I am not quite sure how to apply this knowledge in real-lifeexperience, but I believe that the information will come inhandy and will surely benefit me in the future, as I now have astronger understanding of Malaysian architecture”
“Yes. There are also good videos in which students may refer toback in the future”
“The information gave us more exposure on Malaysianarchitecture that I think will help us in designing in the future”
“I have successfully model a real-life project after Revit 101tutorial”
318 W.W. Goh et al.

(c) Help learners to understand a certain topic better
We can see from the result that the majority of the learners engaged in the col-laborative group discussion. Learners think that MOOCs are good platform to voiceout and share opinions. All the learners have the chance to answer the questions andshare opinions because there might not be enough time for everyone to answer thequestions in class. With the flexible and adaptable means of delivering content,learners are able to learn and share knowledge with their peers through discussionforum. In MOOCs, each topic is related to an issue and the learners are required toexpress their opinions and complete the activities after reading each topic. Thestep-by-step course helps the learners to grasp the topics. This way helps them tounderstand the topics better.
(d) Strongly recommend the course to other people
By analyzing the data, we can see that learners are quite satisfied with the coursesprovided using MOOCs. They generally feel that MOOCs can raise their interest inlearning and learning efficiency. This is mainly because students in information agehave a great sense of curiosity and the ability to adapt to the MOOC environment(Ji, 2016). From the survey, the learners share their opinion that they will stronglyrecommend the course to people that they know because it is interesting andwell-organized. They agreed that MOOCs have enhanced their knowledge.Table 29.2 also presented the recommendations from the learners’ perceptions.
(e) The program has met the learner’s expectation
The program has met the learner’s expectation. They think that it is fun besidesgaining extra knowledge and experiences. The program is well-organized withprecise and clear instructions. Furthermore, it is simple, comprehensive, and free.The learners like the way where all the information can be shared among thelearners. The learners can do some research before responding to the questions.There is a two-way communication in MOOCs. They can discuss and share theiropinions with their peers in the discussion forum. MOOCs have provided com-prehensive insights to the learners on certain topics. MOOC teaching platformgained certain effects and inspired students’ interest in learning and improved theirlearning efficiency. The findings from (Garza, Sancho-Vinuesa, & Gomez Zermeno,2015) also mentioned that 43.3% of the participants have met their expectationwhere MOOC helped them to acquire enriched learning. 23.6% of the participantshave experienced higher learning proficiency compared to a classroomenvironment.
(f) Information is sufficient for learners to apply in the future as a basiccourse, but more detailed information is needed for advanced course
According to the learners, the learning materials are sufficient for beginners in orderfor them to utilize in the future. It is useful for those learners who have lessexperience in the topic. The learners have received various resources from themodule. It works as a starting point for them to further reading and learning about it.
29 The Effectiveness of MOOC 319

Nevertheless, the information may not be sufficient for those seeking for anadvanced course. More details are needed for those who would like to learn more.Practices and activities are still required to make the learners more familiar with thetopics. Current MOOCs help to spark the interest of those who are curious about thetopics. They can learn some topics which they cannot learn in the classrooms.The learning process helps the learners to know when and where they can apply theknowledge. It also provides revision for some basic topics. Table 29.3 has shownthe learners’ perceptions regarding the sufficiency of information in MOOCs.
29.4.2 The Issues of Using MOOCs
Some issues are identified from the survey, which are including lack of knowledgein using MOOCs for novice learners and lack of support and guidance from thefacilitators. Most of the learners are fresh and new to MOOCs. It takes some timefor them to know how to start using MOOCs because some of the learners have
Table 29.2 Recommendations from the learners’ perceptions
“I would strongly recommend to the people. I know because it is not only an interesting side, butit is also very well-organized”
“Overall, it was a fun and enjoyable course that I would recommend to others”
“I have already recommended it to a friend who thinks he might take this course in the future”
“Totally loved this course and have persuaded three other colleagues to join too. They should befinishing soon too!”
“I gain much more than I’d expected from this program. I’m already starting to recommend myfriends to take this program”
“I will definitely promote this course”
Table 29.3 Learners’ perceptions regard to the sufficiency of information in MOOCs
“Yes, it gives good basic knowledge and motivates to learn more”
“Yes it is sufficient as most of us as a student in Malaysia are not exposed to Malaysianarchitecture. Throughout the course, there are sufficient info about Malaysian architecture andhow and what to consider in designing for the future with the climate condition and the culturewithin Malaysia”
“I think all the information provided is a baseline and starter kits for us to look for Malaysianarchitectural identity. It still needs a lot of further research to make it applicable in the future”
“Yes. There were various resources I got from this module. The informative text and reader arevery helpful in developing my understanding toward architecture, and also, I have learnt how toread a building in terms of function, structure, and aesthetic. Thus, these are very sufficient for mein architecture practice now and future”
“Yes, the information provided and delivered in this module is more than sufficient for me toapply it in my upcoming semesters and in my everyday life”
“Yes, I am sure that everything I learned from this course will help me in my future”
320 W.W. Goh et al.
limited IT knowledge. Some of them do not know how to begin to use MOOCs as alearning tool. They have difficulties with the structures of the course and lack oftutorial to guide them.
They would like to have some technical support and time management to planfor their course activities and assessment. Digital literacy skill of MOOCs is one ofthe factors to engage learners successfully. It is crucial to have an insight into howlearners interact with technology in MOOCs in order to provide necessary trainingand guidance to the learners. Support for diverse MOOC users is essential for thisnew learning paradigm to enable learners to adapt to this new learning method.Workshop can be conducted to educate the learners on how to use MOOC. Helpand support are important for the learners especially those who use it for the firsttime. Good support from various teams will help the learners to use the MOOCseasily. This includes welcome tutorial to guide the novice learners on the functionand structure of MOOC.
Besides having the necessary knowledge and skills on how to use MOOCs, thelearners would like to have a better understanding on the requirement from theirfacilitators. Some of them do not sure whether the answer that they have providedhas fulfilled the requirement of the assessment criteria. They were afraid that theanswer that they provided is wrong. (Terras & Ramsay, 2015) Hence, individual-ized feedback is one of the most important ways of keeping students engaged intheir studies.
Furthermore, most of the learners are working adults. Level of involvement inMOOC may vary. There is a time constraint for them to do the activities inMOOCs. The workload in their career is high. They have less time to do theassessment and submit on time. Hence, it is important for the learners to define theirown learning paths and not navigate the content and assessment tasks in a linearmanner (Rolfe, 2015).
29.5 Conclusion
In conclusion, the learners have perceived that MOOC is an effective course withhelpful study materials. It is useful for their future reference and allows them toapply what they have learned in real-life experience. The program has met thelearners’ expectation, and they will strongly recommend the course to other people.The findings have shown that participating learners’ perceived level of MOOCsatisfaction was generally at a high level. MOOCs make the teaching more effectiveby reforming the traditional learning methods. Nevertheless, the learning materialsare sufficient for learners to apply in the future as a basic course, but more detailedlearning materials are needed for advanced course. Issues such as the structure ofMOOCs, support, guidance, and motivation are crucial for successful learning. Thelack of skills, motivation, and support is the contributory factor for lack ofengagement in MOOC (Garza et al., 2015). Terras and Ramsay (2015) also agreedthat digital literacy skills, individual motivation, and self-regulation are the key
29 The Effectiveness of MOOC 321

learner attributes to maximize the learning potentials of MOOC. This study pro-vides some insights into the effectiveness of MOOC and issues faced. Coursedesigners should take the issues into consideration when designing MOOCs.
References
Ari, M.B. (2013). MOOCs on introductory programming, ACM Inroads, 4(2).Ayub, E., & Lim, C.L. (2016). Developing a pedagogy framework for institution-wide
implementation of MOOC: A case study from a Malaysian Private University. Manuscriptsubmitted for publication.
Chen, Y.-H., & Chen, P.-J. (2015). MOOC study group: facilitation strategies, influential factorsand student perceived gains. Computers & Education, 86, 55–70.
Chua, Y. P. (2012). Mastering research methods. Kuala Lumpur: McGrawHill Education.Garza, L. Y., Sancho-Vinuesa, T., & Gomez Zermeno M. G. (2015). Indicators of pedagogical
quality for the design of a massive open online course for teacher training. RUSC. Universitiesand Knowledge Society Journal, 12(1), 104–118.
Gene, O.B., Nunez, M.M., & Blanco, A.F. (2014). Gamification in MOOC: Challenges,opportunities and proposals for advancing MOOC model. In TEEM 2014, Salamanca, Spain(pp. 215–220), October 01–03, 2014
Goh, W. W., Kaur, S., & Chion, Z. H. (2015). The Perceptions of MOOC Among learners basedon activity theory. In Taylor’s 7th Teaching and Learning Conference 2014 Proceedings,(pp. 331–340).
Gomez-Zermeno, M. G., & Garza, L. A. (2016). Research analysis on MOOC course dropout andretention rates. Turkish Online Journal of Distance Education, 17(2), 3–14.
Grosseck, G., Holotescu, C., Bran, R., & Ivanova, M. (2015). A checklist for a MOOC activist. InThe 11th International Scientific Conference eLearning and Software for Education, April,23-24, Bucharest, 538-543.
Hew, K. F., & Cheung, W. S. (2014). Students’ and instructors’ use of massive open onlinecourses (MOOCs): motivations and challenges. Educational Research Review, 12, 45–58.
Ji, Z. (2016). Application and empirical investigation of new MOOC teaching system in computerapplication course. International Journal of Emerging Technologies in Learning, 11(5), 62–67.
Malligan, C., Littlejohn, A., & Hood, N. (2016). Learning in MOOCs: A comparison study. InProceedings of the European Stakeholder Summit on experiences and best practices in andaround MOOCs (EMOOCS), Austria (pp. 15–26), February 22–24, 2016.
Mansor, F., Latifah, A. L., & Tengku Amina, M. (2015). MOOCs in Malaysia: A preliminary casestudy. In E-ASEM Forum: Renewing the lifelong learning agenda for the future, Bali,Indonesia (pp. 1–17), March 10-11, 2015.
Ministry of Education Malaysia (2015). Malaysian education blueprint on higher education—shift10: Globalized Online Learning.
Muhstak, A-A. (2014). Entrepreneurship: The first MOOC in Malaysia.Munoz-Merino, P. J., Ruiperez-Valiente, J. A., Alario-Hoyos, C., Perez-Sanagustin, M., & Kloos,
C. D. (2015). Precise effectiveness strategy for analyzing the effectiveness of students witheducational resources and activities in MOOCs. Computers in Human Behavior, 47, 108–118.
Nor Fadzleen, S. D., Rose, A. A., & Naoki, O. (2015). Stakeholders’ view on MOOCssustainability in Malaysian higher education: A preliminary study. ARPN Journal ofEngineering and Applied Sciences, 10(23), 18104–18112.
Nunez, M. M., Gene, O. B., & Blanco, A. F. (2014). Social community in MOOCs: Practicalimplication and outcomes. In TEEM 2014, Salamanca, Spain (pp. 147–154), October 01–03,2014.
322 W.W. Goh et al.

Ratnaria, W., Azizudin, M. S., Bakri, M., Muhammad, S., & Khaliza, S. (2015). Sharing worksand copyright issues in Massive Open Online Courseware (MOOC). International Journal forResearch in emerging science and technology, 2(10), 20–29.
Rolfe, V. (2015). A systematic review of the socio-ethical aspects of massive online open courses.European Journal of Open, Distance and e-Learning, 18(1), 52–72.
Terras, M. M., & Ramsay, J. (2015). Massive Open Online Courses (MOOCs): Insights andchallenges from a psychological perspective. British Journal of Educational Technology,46(3), 472–487.
Yuan, L., & Potwell, S. (2013). MOOCs and open education: Implications for higher education.UK: JISC Cetis.
29 The Effectiveness of MOOC 323

Chapter 30Changes in Students’ Level of Awarenessof Social Topics Through Project-BasedLearning in the Intensive English Programat Taylor’s Centre for Languages
Clarence Lim Kia Seng and Nur Ili Syazwani binti Mohd. Azhar
Abstract The purpose of this research is to investigate the impact of topics that areintroduced in Taylor’s Centre for Languages Intensive English Programs on stu-dents’ mindsets. Each semester, a topic related to the well-being of the environmentwill be introduced in class and students are required to complete a project based onthe topic provided. Upon their return from the excursion, the students will thenconduct a research on it. In order to investigate whether there are any changes instudents’ level of awareness of a particular topic, a two-pronged approach is used toconduct this research. The first step is by issuing two sets of questionnaires to thestudents. The first questionnaire is given before the introduction of the topic and theother after the completion of the project. Through the questionnaires, it helps toidentify students’ views and level of awareness on the topic before and after theintervention of classroom teachings and the project. The study was conducted forthe duration of 6 weeks, as the first questionnaire was distributed before the stu-dents begin work on their project and the second questionnaire was distributed afterthey completed their project in week 10 in order to compare their awareness ofenvironmental topics before and after the project. The data gathered were tabulatedusing Statistical Package for the Social Sciences (SPSS) software.
Keywords Environment � Awareness � Project-based learning � ESL
C.L. Kia Seng (&) � N.I.S. binti Mohd. AzharCentre for Languages, Taylor’s University, Lakeside Campus.No. 1, Jalan Taylor’s, 47500 Subang Jaya, Selangor, Malaysiae-mail: [email protected]
N.I.S. binti Mohd. Azhare-mail: [email protected]
© Springer Nature Singapore Pte Ltd. 2018S.F. Tang and S.E. Cheah (eds.), Redesigning Learning for GreaterSocial Impact, DOI 10.1007/978-981-10-4223-2_30
325
30.1 Introduction
ESL learning in higher education context brings about a myriad of challenges ineducating the youth. There are many social issues that need to be addressed withinthe classroom in order to ensure that the students are equipped with knowledge notonly for their respective fields and the workplace but also to prepare them withknowledge regarding the world that we live in. The kind of education we needbegins with the recognition that the crisis of global ecology is first and foremost acrisis of values, ideas, perspectives, and knowledge, which makes it a crisis ofeducation, not one in education (Orr, 1994). Higher learning institutions have someof the responsibilities in increasing not only knowledge and abilities but alsoconsciousness and the values that are needed to create a sustainable future. Theywill understand the ecological services that are critical for human existence and howto make the ecological and social footprint of human activity visible and as benignas possible (Chambers, Simmons, & Wackernagel, 2000; Ryan & Durning, 1997).Also by bearing this responsibility, the institutions are not only producing productsthat can work, but also responsible for their environment.
This study aims to find out whether participants experienced any change in theirlevel of awareness pertaining to social issues, specifically environmental issues.According to the Tbilisi conference declaration (1978), awareness can be defined as:
Awareness—to help social groups and individuals acquire an awareness sensitivity to thetotal environment and its allied problems (and/or issues)
To find out whether or not there is a change in terms of what the students knowabout the environment, a project that specifically focuses on environmental issueswas carried out. For this study, the hypothesis that will be tested is that a learner’sawareness regarding social issues will increase after the completion of aproblem-based project.
The research seeks to address the following questions:
1. Does a project-based task affect students’ awareness level about social issues?2. Are there any marked differences in their level of awareness before and after the
project?
30.2 Literature Review
30.2.1 ESL Learning in Higher Education
As globalization begins to make its mark around the world creating opportunitiesand expansion for businesses worldwide, higher education is also expected tofollow suit (Marginson, 2006; Luke, 2011; Hou, Montgomery, & McDowell,2014). In fact, internationalization of higher education is not only happening in
326 C.L. Kia Seng and N.I.S. binti Mohd. Azhar

developed countries, but some developing countries are also dedicating theirresources to such initiatives (Peking University, 2014; Tianjin Foreign StudiesUniversity, 2014). Due to this, the ESL classrooms are seeing a more diverse groupand this poses various challenges. As mentioned in the introduction, apart fromEnglish language acquisition, one other function of ESL classrooms is to equipstudents with knowledge beyond classroom application.
With students from such diverse background and culture, many ESL learnerscome with different knowledge and experience. For many of them, expressing theirideas and thoughts in an ESL classroom becomes a problem, and it has been provenby many that the most obvious problems in their studies stem from the lack ofEnglish proficiency which will in turn affect their academic performance (Lee,1997; Mori, 2000).
30.2.2 Project-Based Learning
Project-based learning (PBL) is a method that is designed to allow students learn byperforming a given task. This method encourages student-centred learning(Mergendoller, 2006). According to Holm (2011), PBL is a type of student-centredinstruction where students take charge in choosing and creating a certain product orpresentation that helps address realistic problems that the world is facing today.In PBL, students work within a stipulated time frame on a given project and willhave full autonomy in deciding what they want to do. Teachers will act as afacilitator and guide students in their work in order to meet the learning objectives.
PBL as a teaching method is recognized by many academicians as the bestmethodology that engages students in their learning and, at the same time, developsstudents’ critical thinking skill, teamwork as well as problem-solving skills(Berends, Boersma, & Weggemann, 2003; Holm, 2011; Scarbrough, Bresnen,Edelmann, & Laurent, 2004; Tsang, 2007). Compared to traditional methodologiesthat are more teacher-centric, PBL had proven that it enhances content knowledgeand practical skills such as creative thinking and critical thinking skills (Holm,2011). According to Helle et al. (2006), PBL also resulted in better acquisition ofprocess and skill development as well as information literacy skills compared totraditional classroom learning. This is due to the fact that students get hands-onexperience in the process of completing their project. The opportunities that stemfrom social interactions with people in and out of the class led to steeper learningcurve as one gains knowledge and experience from not only the teacher in class butalso experts in the field of their project. This is touted by Vygotsky’s (1978) socialinteraction theory whereby students’ learning is largely influenced by their envi-ronment and also guidance from their peer. Many supporters of PBL believe thatcollaborative skills such as critical thinking, teamwork, and problem-solving skillswhich are necessary in the workplace can be developed through PBL (David, 2008;Hart Research Associates, 2015).
30 Changes in Students’ Level of Awareness of Social Topics … 327

Holm (2011) wrote about PBL having five distinctive features. In developingPBL, the first thing to do is to align it to a given curriculum (e.g. Intensive EnglishProgram). From then on, most of the learning material will revolve around theproject that students will be completing. This is done in order to provide studentswith the required background knowledge. The second feature will be to createquestions of importance for the project to be based on “driving questions”(Blumfield et al., 1991) so that students are engaged in a logical pursuit ofknowledge in order to complete the project. It is highly important to note that thequestions must be relevant to the content so that students will be able to engagewith the main issue. The third feature that Holm (2011) noted is that the assignmentmust require students first to identify the problem, then develop solutions to it, andlater on present their findings through a presentation or in a written report format.To further encourage students’ participation, students can be encouraged to orga-nize an event to present their work. Fourthly, as PBL is a student-centred method,students need to be given total autonomy in the process of the creation of theirwork. Instructors’ or teachers’ role is merely that of a facilitator that guide studentsin their work. Last of all, projects are meant to reflect a realistic problem that theworld is facing and students work to identify and provide solutions to it.
Although PBL is useful in developing skill sets, one of the main challenges ofPBL is that it requires students to take control of their learning. Many ESLinstructors will find this difficult in an ESL classroom given that, first, it needsstudents to have a certain level of English proficiency in order to communicate.Besides that, some critics complained that student-centred learning that reduces thefunction of teachers to mere facilitators failed to encourage students to take charge oftheir own learning. Furthermore, there is no concrete evidence that PBL improvedproblem-solving skills (Holm, 2011). This might be true given that the Internetprovides answers to numerous problems and all students need to do is just to spend alittle bit of time to search for their answers online and they will be able to completetheir PBL assignments. Nevertheless, critics missed out on the point that whilestudents might not show immediate signs of problem-solving skills development, asstudents grow in age and maturity, the numerous experiences that they had gained incompleting PBL task will lead to improvement in their ability to solve problems.
30.2.3 Environmental Awareness
As mentioned in introduction, ESL classrooms serve to provide not only languageeducation but also content knowledge. Environmental issues topic is one that isquite prevalent in many ESL textbooks, but what remains unknown is the impact ofincorporating environmental issues into ESL classrooms. According to Sinatra et al.(2012), having the driving force to act on one’s beliefs is crucial for enforcingchanges.
On the issue of environmental awareness, despite having numerous classes thatteach about the various pollutions on earth, actions are still lacking. Therefore, it is
328 C.L. Kia Seng and N.I.S. binti Mohd. Azhar

important to highlight the danger of this issue to students. Creating responsibleadults will require educating students about climate change and the impact ofhumans on the environment (Christensen & Knezk, 2015). A research on utilizingpersuasive text materials with college students to alter their behaviour and toinfluence their willingness to change found that students who are more inclined tothe idea of climate change are prone to take action on the issue of climate change(Sinatra et al., 2012).
On the other hand, Bradley, Waliczek, and Zajicek (1999), McMillan, Wright,and Beazley (2004) found that exposure towards environment content knowledgeled to a more positive outcome and increased responsibility towards the environ-ment in individuals. Despite that, a multinational study failed to prove the con-nection between having knowledge of climate change will lead to a change inbehaviour towards the environment (Dijkstra & Goedhart, 2012).
30.3 Methodology
30.3.1 Methods of Data Analysis: Quantitative
For this study, the researchers took the questionnaire and did a quantitative analysisof it. Due to the low sample size, paired t-test was used to analyse the data. A totalof 71 participants were administered two sets of questionnaires. The first set ofquestionnaire was distributed to the students early in the semester to determine theirawareness of the project that they would be doing in week 7 of their semester.Another questionnaire was administered after the students got back from their fieldtrip. The reason the two sets of questionnaire are the same is due to the fact that thequestionnaires basically were looking for changes in students’ attitude towardsMother Nature both before and after having completed a project which was relatedto the environment. The other reason for using the same set of questions wasbecause of fairness. By using a different set of questions, a fair comparison will notbe achievable as the items may vary. Therefore, in order to procure fair comparison,both sets of questionnaires would have to be the same. Furthermore, with bothquestionnaires being administered at least 6 weeks apart, participants’ memory ofthe first questionnaire would have less influences on the second set of questionnaire.
30.3.2 Reliability and Validity
A “pilot study” was conducted beforehand to evaluate the validity and reliability ofthe questionnaire and the responses. The questionnaire was set up in order to assessthe relevancy and the understanding of questions and modified based on reliabilityscores. In the final revision, some questions were omitted due to redundancies, andsome were rephrased for easy understanding of questionnaire. The reliability of
30 Changes in Students’ Level of Awareness of Social Topics … 329

questions was tested by Cronbach’s alpha. The value of Cronbach’s alpha for allitems exceeded the allowable cut value of 0.60 (Farrell, 2009), ranged from 0.613 to0.698 which is greater than 0.60, and therefore, the reliability of questionnaire issupported. An overall result of “Cronbach’s alpha” is 0.675, which exceeded 0.60(Tables 30.1 and 30.2).
30.3.3 Ethics
All the students who took part in this project were informed about the studybeforehand. All the participants voluntarily answered two questionnaires: onebefore the trip and another upon the completion of the project. All questionnaireswere answered anonymously.
30.3.4 Instrument
A new questionnaire was developed for the purpose of this study. The questionnaireconsists of 15 items with each being rated with a 5-part Likert scale. The ques-tionnaire was piloted with a selected number of students to test the language
Table 30.2 Item–totalstatistics
Cronbach’s alpha of item deleted
q1 0.613
q2 0.643
q3 0.646
q4 0.622
q5 0.646
q6 0.638
q7 0.691
q8 0.676
q9 0.666
q10 0.640
q11 0.679
q12 0.665
q13 0.673
q14 0.676
q15 0.698
Table 30.1 Reliabilitystatistics
Cronbach’s alpha No. of items
0.675 15
330 C.L. Kia Seng and N.I.S. binti Mohd. Azhar

difficulty of each item as the participants have English language proficiency at thelevel of lower intermediate to upper Intermediate. The purpose of piloting it is toensure that participants were fully able to understand each of the questions asked tothem. The questionnaires’ focus is on environmental issues as it will be used in theirPBL task and it was administered formally in week 3 and week 9, respectively.
30.3.5 Sample
Seventy-one students took part in the project and completed the questionnaire.Their ages ranged from 18 to 31. The students are from various countries: Malaysia,Indonesia, Kazakhstan, Japan, Korea, and the Middle East. About 50.7% of thesamples are females, while the remaining 49.3% are males.
30.3.6 Location
This project was conducted at Taylor’s University Lakeside Campus. The studentswho attended the English course did so in order to improve their English levelbefore entering into the main university courses to study courses such as business,hospitality, law, and design.
30.3.7 Duration
The students were enrolled in a 12-week intensive English course. The course wascommenced in April 2016 and completed in July 2016. The project itself wascarried out in week 7 when the students embark on a field trip; they began theirproject the following week which was week 8; they completed the project in week10. The first questionnaire was given out in week 4, and the second questionnairewas distributed in week 10.
30.4 Data Analysis
In this section, the demographic data and the paired t-test score of both the ques-tionnaires will be presented. As the distribution of the samples is greater than 30,the distribution of the data is approximately normal (Fig. 30.1; Tables 30.3, 30.4and 30.5).
According to the result of paired sample t-test, there is a significant differencebetween before and after the completion of the project (t = 4.385,
30 Changes in Students’ Level of Awareness of Social Topics … 331

p value = 0.000 < 0.05). This means that PBL had substantial impact on students’awareness towards the environment. The result shows that students become moreaware of the numerous environmental issues around them. This awareness may thenpossibly be transferred into action that will have positive impact on the society as awhole.
30.5 Discussion
The study was conducted on Taylor’s University Intensive English Program stu-dents. The purpose was to look at the students’ perception towards social issues thatthey are surrounded with. The purpose of choosing conservation theme was becauseit was easily accessible within Taylor’s University. In the first questionnaire that
Table 30.4 Paired sample correlations
N Correlation Sig.
Pair 1 Before and after 71 0.994 0.000
Table 30.5 Paired sample test
Paired differences t df Sig.(2-tailed)Mean Std.
deviationStd.errormean
95% confidenceinterval of thedifference
Lower Upper
Pair1
Beforeandafter
0.02479 0.04763 0.00565 0.01351 0.03606 4.385 70 0.000
48.0
49.0
50.0
51.0
Male Female
49.3
50.7 Gender Fig. 30.1 Demographic
characteristics
Table 30.3 Paired sample statistics
Mean N Std. deviation Std. error mean
Pair 1 Before 2.2427 71 0.41188 0.04888
After 2.2179 71 0.41977 0.04982
332 C.L. Kia Seng and N.I.S. binti Mohd. Azhar

was administered, students showed concern about the environment. Despite that,there were groups of students who were not concerned about the current issues inrelation to the climate or environment. Out of the 71 students surveyed, 13 studentshave never been exposed to stories related to environmental problems, while 20students have never done any research on environmental issues. There are 11students who do not think that climate change is an issue at all. It is also quitealarming that many students had neutral stance on the condition of the environmentand do not feel the need to be concern about the changes in the environment.
After 6 weeks of classes and when the students had completed their PBL task,there were some changes in their opinion with regard to their previous stance onenvironment. This could be due to the fact that they have now been exposed tonews and problems that stem from environmental issues. They are now able torelate to the cause and effect of environmental pollution as well as climate change.
These changes could also be seen in their behaviour within the classroom.Rubbish used to be scattered around the classrooms, now it is left in trash cans.There were also instances of students sorting out the rubbish and putting them intothe relevant recycling bins. From the changes in behaviour, it can be concluded thatPBL tasks do have impact on students.
Although the impact can be seen in the behavioural changes of students, oneconcern will be the sustainability of the changes. The reason that made studentschange their behaviour can be tied to their learning, but at the same time, it can alsobe caused by the role of the teachers in the class which at times function to enforcestudents to clean up after themselves. Therefore, a longitude study on the long-termeffect of the behaviour will be able to reveal the real effect of PBL.
30.6 Conclusion
This study begins with the identification of two research questions: (1) Does aproject-based task affect students’ awareness level about social issues? (2) Are thereany marked differences in their level of awareness before and after the project? Asthis is a quantitative study, answers to both questions were captured in the ques-tionnaires that were distributed to the participants. The study found that getting thestudents to do a project-based task related to environmental issues increased theirlevel of awareness about it. Therefore, it is safe to say that having a PBL task inESL classroom will definitely impact students’ perception on social issues that areprevalent in the society. There is also a stark contrast in students’ awareness beforeand after the project. Data revealed that students are more conscious of environ-mental problems after the completion of project, and many of them showed signs ofimproved behaviour towards Mother Nature.
Although the data that were captured showed positive signs in students’ cog-nizance towards ecological issues, it remains to be seen whether this awareness will
30 Changes in Students’ Level of Awareness of Social Topics … 333

be transferred into action that protects the environment. It is also important to notethat as habits are hard to change, students might still revert back to their old ways ofnot being concerned about the environment.
30.7 Future Research
Through the execution of this project, it can be seen that there is an increase instudents’ level of awareness regarding environmental topics. Through theirresearch, the students were able to learn more about topics that otherwise be of nointerest to them. When the learners are motivated to complete a task, their attitudesand affective states influence the degree of effort that the learners are going topractise English language (Ellis, 2006). Through this project, the students were ableto conduct their own research on various topics pertaining to the environment.Students have opportunities to use several skills such as problem-solving, cre-ativity, teamwork, and language at different work stages, so the work and languageskills are developed (Brunetti, Petrell, & Sawada, 2003; Solomon, 2003). In doingso, they had to find information, analyse the information, and share their findingswith their classmates. This gave them a chance to also use the language and allowedthem to overcome language barriers that they may have faced while completing theproject. For future research, there is an opportunity to explore not only the increasein their level of awareness but also how their language skills improve before,during, and after the project takes place.
Apart from looking at language skills, further research can also look atexpanding the study that observes the students’ ability to understand the subjectmatter. Gallagher, Stepien, Sher, and Workman (1995) reported the successful useof the model with fifth-grade students on problems relating to 13 the ecosystem. Bydoing so, students not only will gain awareness regarding the environment but mayalso understand in complexity the issues that they researched on for their project.Furthermore, Shepherd (1998) reported that problem-based learning can have apositive effect on students’ acquisition of critical thinking skills. This will in turnprovide an insight into students’ ability to think critically in completing theirprojects and tasks in the future.
References
Berends, H., Boersma, K., & Weggeman, M. (2003). The structuration of organizational learning.Human Relations, 56(9), 1035–1056.
Bradley, J. C., Waliczek, R. M., & Zajicek, J. M. (1999). Relationship between environmentalknowledge and environmental attitude of high school students. Journal of EnvironmentalEducation, 30(3), 17–21.
Brown, H. D. (2000). Principles of language learning and teaching (4th ed.). New York: PearsonEducation.
334 C.L. Kia Seng and N.I.S. binti Mohd. Azhar

Brunetti, A. J., Petrell, R. J., & Sawada, B. (2003). Team project-based learning enhancesawareness of sustainability at the University of British Columbia, Canada. InternationalJournal of Sustainability in Higher Education, 4, 210.
Christensen, R., & Gerald, K. (2015). The climate change attitude survey: measuring middleschool student beliefs and intentions to enact positive environmental change. InternationalJournal of Environmental & Science Education, 10(5), 773–788.
Cortese, A., & Benner, J. (2001). Education for sustainability: Content, context, and process oflearning and research. Retrieved July 30, 2016, from the World Wide Web: www.secondnature.org/history/history_writings.html
David, J. L. (2008). What research says about project-based learning. Teaching Students to Think,65(5), 80–82.
Dijkstra, E. M., & Goedhart, M. J. (2012). Development and validation of the ACSI: measuringstudents’ science attitudes, pro-environmental behaviour, climate change attitudes andknowledge. Environmental Education Research, 18(6), 733–749.
Ellis, R. (2006). Second language acquisition. In Oxford introductions to language study. HongKong: Oxford University Press.
Farrell, A. M. (2009). Insufficient discriminant validity: A comment on Bove, Pervan, Beatty andShiu. Journal of Business Research, 63(3), 324–327.
Gallagher, S. A., Stepien, W. J., Sher, B. J., & Workman, D. (1995). Implementing problem basedlearning in science classrooms. School Science and Mathematics, 95, 136–146.
Hart Research Associates. (2015). Falling short? College learning and career success. Retrievedfrom http://www.aacu.org/sites/default/files/files/LEAP/2015employerstudentsurvey.pdf
Holm, M. (2011). Project-based instruction: A review of the literature on effectiveness inprekindergarten through 12th grade classrooms. InSight: Rivier Academic Journal, 7(2), 1–13.
Hou, J., Montgomery, C., & McDowell, L. (2014). Exploring the diverse motivations oftransnational higher education in China: complexities and contradictions. Journal of Educationfor Teaching, 40(3), 300–318.
Lee, D. S. (1997). What teachers can do to relieve problems identified by international students.New Directions for Teaching and Learning, 1997(70), 93–100.
Luke, A. (2011). Generalizing across borders: Policy and the limits of educational science.Educational Researcher, 40(8), 367–377.
Marginson, S. (2006). Dynamics of national and global competition in higher education. HigherEducation, 52(1), 1–39.
Mergendoller, J. R., Maxwell, N. L., & Bellisimo, Y. (2000). Comparing problem-based learningand traditional instruction in high-school economics. Journal of Educational Research, 93,374–382.
Mori, S. C. (2000). Addressing the mental health concems of intemational students. Journal ofCounseling & Development, 78(2), 137–144.
Peking University. (2014). Available at: http://english.pku.edu.cn/Admission/InternationalStudents/. Retrieved July 28, 2016.
Scarbrough, H., Bresnen, M., Edelman, L., Laurent, S., Newell, S., & Swan, J. A. (2004) Theprocesses of project-based learning: An exploratory study. Management Learning, 35,491–506.
Shepherd, H. G. (1998). The probe method: A problem-based learning model’s effect on criticalthinking skills of fourth- and fifth-grade social studies students. Dissertation AbstractsInternational, Section A: Humanities and Social Sciences, September 1988, 59 (3-A), p. 0779.
Sinatra, G. M., Kardash, C. M., Taasoobshirazi, G., & Lombardi, D. (2012). Promoting attitudechange and expressed willingness to take action toward climate change in college students.Instructional Science, 40(1), 1–17.
Tsang, E. (2007). Organizational learning and the learning organization: A dichotomy betweendescriptive and prescriptive research. Human Relations, 50, 73–89.
Vygotsky, L. S. (1978). Mind in society: The development of higher psychological processes.Cambridge, MA: Harvard University Press.
30 Changes in Students’ Level of Awareness of Social Topics … 335

Chapter 31The Journey of TGCSP with SpecialAttention on Service Learning
Siow Chun Lim, Satesh Namasivayamand Chockalingam Aravind Vaithilingam
Abstract Service learning has picked up momentum in the engineering educationfield over the past decade due to its two pronged benefits to the students’ learningexperience as well as to the community. While it is usually embedded within thecurriculum in terms of execution, the Taylor’s Grand Challenge ScholarsProgramme (TGCSP) runs it in parallel with formal curriculum. TGCSP wasdeveloped to nurture holistic engineers capable of addressing the grand challengesdefined by the National Academy of Engineering (NAE), USA, which stand in theway for humankind’s survival of the next century. Service learning is the fifthprogramme outcome (GCPO5) of TGCSP which scholars must attain in order forthem to be able to graduate with TGCSP certification which is endorsed by NAE.This paper outlines the structure of implementation and assessment of GCPO5. Inaddition, the scholars’ perception on how their journey towards attainment ofGCPO5 has impacted their learning experience will also be discoursed.
Keywords Service learning � Grand challenges � Holistic education � Engineeringeducation
31.1 Introduction
In 2008, the National Academy of Engineering (NAE) has identified 14 GrandChallenges for Engineering in the twenty-first-century engineers globally mustovercome in order for humankind to survive the next century. In line with this,
S.C. Lim (&)Multimedia University, Cyberjaya, Malaysiae-mail: [email protected]
S. Namasivayam � C.A. VaithilingamTaylor’s University, Subang Jaya, Malaysiae-mail: [email protected]
C.A. Vaithilingame-mail: [email protected]
© Springer Nature Singapore Pte Ltd. 2018S.F. Tang and S.E. Cheah (eds.), Redesigning Learning for GreaterSocial Impact, DOI 10.1007/978-981-10-4223-2_31
337

several academic institutions in the North America have established the GrandChallenges Scholars’ Programme with the primary aim of producing students whoare capable of addressing the 14 Grand Challenges. In March 2015, Taylor’sUniversity School of Engineering has gained formal approval and recognition bythe NAE to run Taylor’s Grand Challenge Scholars Programme (TGCSP).
There are 5 grand challenge programme outcomes (GCPOs) which studentsmust attain in order to graduate as a TGCSP scholar with certification by the NAE.They are as follows:
GCPO 1: Grand Challenge Project: scholars have to undertake and complete pro-jects related to their grand challenge (GC) of choiceGCPO 2: Interdisciplinary Knowledge: scholars have to undertake and completecourses in other non-engineering fields which complement with their engineeringknowledge to enable them to address their GC of choiceGCPO 3: Entrepreneurial Experience: scholars have to complete an activity closelyrelated to an entrepreneurial experienceGCPO 4: International Exposure: scholars have to develop global perspectivenecessary to address their GCGCPO 5: Service Learning: scholars have to assume leadership roles in undertakingservice-oriented activity which benefits the underprivileged community.
The pedagogy in engineering education has been gradually transforming glob-ally for the past decade. There has been a paradigm shift towards student-centredlearning with increasing emphasis on the development of soft skills. Branching outof this realm of soft skill development, project-based service learning (PBSL) hasgained increasing practice intensity worldwide especially in undergraduate engi-neering courses (Coyle, Jamieson, & Oakes, 2005). PBSL is a form of active andexperiential learning which encourages students to work on projects by applyingknowledge and skills learned academically and the projects undertaken shouldbenefit a community while also enriching their learning experience (James, Burke,Jean Newman, & Sandy, 2001). It is actually learner-centred as the leadership andexecution are all done by the learners. Service learning was also found to bepositively or at the very least neutrally influences academic achievement (Gallini &Moely, 2003).
Many programmes embedded PBSL into their formal curriculum (Alexander,Lori Vogelgesang, Elaine Ikeda, & Jennifer Yee, 2000). In other words, PBSL tagsalong some of the modules and students gain credits upon passing such modules.However, TGCSP is a unique programme in the sense that it runs in parallel withthe formal engineering curriculum with participation of engineering student takingplace on a purely voluntary basis. Upon graduation, TGCSP scholars will obtain anadditional certification by NAE provided that they fulfil the 5 GCPOs.
In this paper, the programme structure and the assessment mechanism of theservice learning component (GCPO5) of TGCSP will be outlined. Perception of thescholars on how service learning has impacted their learning experience will also beevaluated.
338 S.C. Lim et al.

31.2 Programme Structure and Assessment Mechanism
The TGCSP structure consists of the scholars and several academic mentors. Eachacademic mentor would be assigned to mentor on the average three to five scholars.At the beginning of each semester, students who are interested to join TGCSP willtender in their application forms. Then, they will be interviewed by theirprospective mentors. Once accepted into the programme, the scholars will have tofirst identify their grand challenge of choice and then engage in regular meetingwith their mentors to plan out how they intend to close the five GCPOs whilekeeping the alignment with their grand challenge of choice intact. At first glance,the role of a mentor seems minimal as the planning and execution of learningactivities were all done by the scholars. However, the academic mentors play a vitalpart especially in assisting mentees to see and concretize the learning outcomes thatthey may acquire unknowingly.
Implementing such form of learning as a formalized programme faces hugechallenge in the assessment stage as unlike conventional engineering curriculum,there is higher degree of subjectivity and uncertainty to decide whether a scholarhas done enough to close a GCPO. Hence, the assessment mechanism being cur-rently practised in TGCSP with respect to closing GCPO5 is now outlined.
Firstly, scholars have to compile the service learning activities in the logbookand meet their mentors regularly to discuss their progress and ensure that they stayaligned towards addressing their GC of choice. When the mentor and the scholarreached a consensus whereby the latter has done enough work to attain GCPO5, thescholars will then have to produce a comprehensive portfolio detailing the extent,breadth and depth of their work with regard to closing GCPO5. Scholars will thenhave to verbally present the portfolio at a town hall meeting with the rest of thescholars and all mentors. A panel of mentors which comprise of the academiclecturers will be judging and assessing the scholars based on a rubric as shown inTable 31.1. Scholars are also required to perform a self-assessment based on therubric shown in Table 31.2 at the end of every system. This self-assessment isimportant for the scholars to reflect on their current progress as well as for theirmentors to keep track of their progress.
For the record, only one such town hall with the aim of assessing the closure ofGCPOs of scholars has been held thus far in July 2016. In addition to the academicmentors, the Global Chair and Director of the National Academy of EngineeringGrand Challenges Scholars and K12 Partners Programme were also present to addrigour and significance to the assessment. The town hall concluded with fivescholars is being recognized to be successfully closing GCPO5. Three of the fivescholars have in fact managed to successfully close all five GCPOs and will be thefirst graduating cohort to be accorded with the certification by NAE. The nextsection briefly describes the service learning activities completed by the scholarsthus far.
31 The Journey of TGCSP with Special Attention on Service Learning 339

Table 31.1 Presentation and portfolio rubric (for relevant closure of GCPOs)
Area Column (1)—outstanding: 5/5marks
Column (2)—meetsexpectations:3/5 marks
Column (3)—needsimprovement:1/5 marks
Strengths andopportunitiesforimprovement
Presentationcontent andstructure—weightage 15%
• Well-structuredpresentation with clearand logical flow
• Presentation material isclearly organized, and allcontent relates to therelevant areas
• Presentation material isrelevant and provides aconclusion by highlightingrelevant evidences
• Slides are clear andcreatively designed
• Thepresentationhas amajority ofthe aspectsdescribedundercolumn
• Thepresentationhas none ofthe aspectsdescribedundercolumn
<to be filledin by assessor(s)>
Presentationskills—weightage 15%
• Presenter is fluent andarticulate as well as hasgood grammar
• Varies tone of voice and thepresentation is well pace
• Maintains eye contact andgood presentation gesture
• Has a good level ofconfidence and is motivated
• Good time management—within 30 min
• Thepresenterhas amajority ofthe aspectsdescribedundercolumn
• Thepresenter hasnone of theaspectsdescribedundercolumn
<to be filledin by assessor(s)>
Depth andbreadth ofanalysis (whichmust be detailedin the portfolioand substantiatedwith evidence)—weightage 70%
• The scholar executed alogical and consistent planto meet the relevant PO
• The scholar activelyengaged himself or herselfwith all stakeholders for anyactivities related to therelevant PO. This involveslearning from each other
• The scholar producesthought, sharing andreflections individually andas part of a group
• Reflections show affectivegrowth regarding self incommunity
• The scholar has shown theapplication and evaluationof relevant knowledge,skills and attitude gained inhis/her degree in attemptingto close the relevant PO(s)
The portfoliocaptures amajority ofthe aspectsdescribedunder column
The portfoliohas none ofthe aspectsdescribedunder column
<to be filledin by assessor(s)>
340 S.C. Lim et al.

31.3 Service Learning Activities
Having only started in the year 2015, the scholars of TGCSP have completed aconsiderable amount of activities related to GCPO5 and aligned to their GC ofchoice. The service learning activities are conducted with the aim of benefiting theunderprivileged communities. Scholars are expected to assume leadership inorganizing such activities in order to be qualified to attain GCPO5. Examples ofactivities completed by scholars to address service learning component include thefollowing:
• The EPIC Homes programme: scholars have successfully crowd fundedRM40, 000 via a collaborative effort with students from the University ofBirmingham to then build a house for an indigenous family in Perak,Malaysia. The scholars have also presented simple engineering solutionsaligned to their respective GC of choice such as a simple water filtrationsystem to the family.
• Engineering My Future community service initiatives: scholars have success-fully organized “Engineering My Future (EMF 1.0) and (EMF 2.0)” inDecember 2015 and July 2016, respectively. EMF is a community serviceinitiative aimed at exposing underprivileged children to engineering and the 14Grand Challenges. EMF 1.0 has served a group of orphans, while EMF 2.0 hasbenefited a group of youth from broken families.
• Project “Chasing Light”: Scholars created a platform for young minds or morespecifically a group of underprivileged children from a welfare association toexplore the unorthodox but practical methods to learn and understand thejourney of education.
• Community service activity organized by SPEED at Bangalore, India: scholarsengaged and presented simple engineering solutions to common everyday issuesto a group of local primary school students.
• Voluntary work in Cambodia: scholars helped to install the lightning system forthe refurbishment of a school in.
Table 31.2 Self-assessment surveys (taken at the end of every semester)
Question Notconfident
Veryconfident
1 2 3 4 5
I am confident that I will address the relevant PO(s)
I am confident that I will address a grand challenge
The activities I have accomplished thus far haveallowed me to enhance my knowledge, skills andattitude relating to the grand challenges
I am confident that I work better as an individualand in a team after becoming a scholar
I am confident that I will graduate on time as ascholar
31 The Journey of TGCSP with Special Attention on Service Learning 341
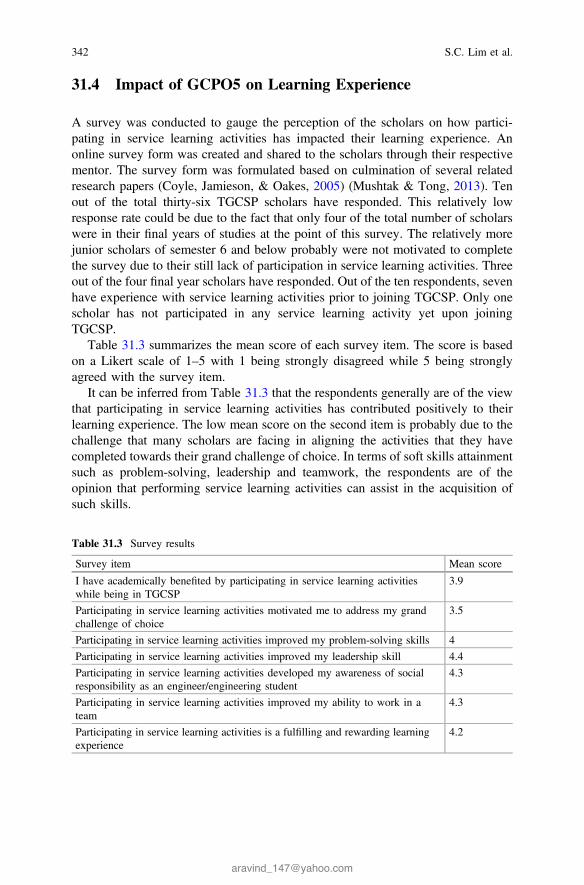
31.4 Impact of GCPO5 on Learning Experience
A survey was conducted to gauge the perception of the scholars on how partici-pating in service learning activities has impacted their learning experience. Anonline survey form was created and shared to the scholars through their respectivementor. The survey form was formulated based on culmination of several relatedresearch papers (Coyle, Jamieson, & Oakes, 2005) (Mushtak & Tong, 2013). Tenout of the total thirty-six TGCSP scholars have responded. This relatively lowresponse rate could be due to the fact that only four of the total number of scholarswere in their final years of studies at the point of this survey. The relatively morejunior scholars of semester 6 and below probably were not motivated to completethe survey due to their still lack of participation in service learning activities. Threeout of the four final year scholars have responded. Out of the ten respondents, sevenhave experience with service learning activities prior to joining TGCSP. Only onescholar has not participated in any service learning activity yet upon joiningTGCSP.
Table 31.3 summarizes the mean score of each survey item. The score is basedon a Likert scale of 1–5 with 1 being strongly disagreed while 5 being stronglyagreed with the survey item.
It can be inferred from Table 31.3 that the respondents generally are of the viewthat participating in service learning activities has contributed positively to theirlearning experience. The low mean score on the second item is probably due to thechallenge that many scholars are facing in aligning the activities that they havecompleted towards their grand challenge of choice. In terms of soft skills attainmentsuch as problem-solving, leadership and teamwork, the respondents are of theopinion that performing service learning activities can assist in the acquisition ofsuch skills.
Table 31.3 Survey results
Survey item Mean score
I have academically benefited by participating in service learning activitieswhile being in TGCSP
3.9
Participating in service learning activities motivated me to address my grandchallenge of choice
3.5
Participating in service learning activities improved my problem-solving skills 4
Participating in service learning activities improved my leadership skill 4.4
Participating in service learning activities developed my awareness of socialresponsibility as an engineer/engineering student
4.3
Participating in service learning activities improved my ability to work in ateam
4.3
Participating in service learning activities is a fulfilling and rewarding learningexperience
4.2
342 S.C. Lim et al.

Table 31.4 illustrates the qualitative responses of the scholars who took part inthe survey. Scholars were tasked to elaborate on how participating in servicelearning activities has impacted their learning experience. Nine of the ten responsesare positive in nature in the sense that they imply that service learning activities canactually benefit both the doers in terms of learning soft skills as well as benefitingthe underprivileged communities.
31.5 Conclusion
The assessment mechanism in TGCSP with respect to the closure of GCPO5 hasbeen outlined. This may serve as a reference for engineering schools worldwidewhich intend to run GCSP as a formal programme with a structured assessmentprocess. In addition, scholars generally agreed that participating in service learningactivities has positively impacted their learning experience. As TGCSP is stillrelatively new with less than 5% of the total population of engineering studentsbeing scholars, similar study should be replicated in future once the programmematures with more scholars being the members.
Table 31.4 Scholar’s perception on service learning activities
Responsenumber
Response
1 Service learning activities made me realize that leadership skills are not justleading a group of people to work for you, but to lead to empower ourselvesand others to be better
2 I have learned things that normally would not and could not be taught in aclassroom. I have learned how to apply the engineering knowledge I’veacquired to solve real-life challenges
3 I’ve learn to actually manage events and connect with people. Things that Icannot do in a classroom
4 I learnt not to take things for granted, and we need to serve the community ifwe have the capability
5 Remind me that as an engineer we are also responsible to solve problemsregarding human welfare and also it is our obligation to contribute back to thesociety with the knowledge gained
6 I learn that we should be grateful for what we have because some children donot even have the privilege to be educated
7 The living style of other people makes impact on my life and makes merealize the important of learning towards the successful road
8 I cannot really tell because I did not really have much
9 Seeing the impact of empowering less fortunate kids in activities whichwould benefit them in the future is very fulfilling
10 Service learning activities allow me to identify the needs and demands of thecurrent society
31 The Journey of TGCSP with Special Attention on Service Learning 343

References
Alexander, A. W., Lori Vogelgesang, J., Elaine Ikeda, K., & Jennifer Yee, A. (2000). How servicelearning affects students. Calfornia: Higher Education Learning Institute.
Coyle, E., Jamieson, L., & Oakes, W. (2005). Engineering projects in community service.International Journal of Engineering Education, pp. 1–12.
Edmund, T., James, V., Burke, J., Jean Newman, E., & Sandy, V. (2001). A report onservice-learning and engineering design: service learning effect’s on students learningengineering design in “Introduction to Mechanical Engineering”. International Journal ofEngineering Education, pp. 30–39.
Gallini, S., & Moely, B. (2003). Service learning and engagement, academic challenge, andretention. Michigan Journal of Community Service Learning, pp. 5–14.
Mushtak, A.-A., & Tong, D. (2013). A blueprint for implementing grand challenge scholars’programme: A case study of Taylor’s University. Journal of Engineering Science andTechnology, pp. 80–86.
344 S.C. Lim et al.

Chapter 32Community Coworking Spaces:The Community New LearningSpace in Thailand
Kamolrat Intaratat
Abstract Thai society has applied computer innovation into government agenciessince 1963. Reforming public sector in 2002, the Thai government establishedMinistry of Information and Communication to take account for promoting,developing, and operating any activities of information technology and commu-nication, including all kinds of development projects. ICT has been transforming allkinds of development including the community learning spaces all over thecountries. Since 2006, MICT (Ministry of Information Communication andTechnology) has trained both off-line and online 348,820 Thai marginalized peopleespecially in the communities from all over the country along with its widelypopular in mobile technology. This reflects demands of transformation in publicservice from government centric to citizen centric affected to the demands of newparadigm shift of Thai telecenter to be the community-centric center where its keyfindings of successful transformation are the Partnership strategy among allstakeholders; the Integrated strategy to serve all kinds of contextualized demands ofthe community; and its simplified applications to fit serve the real demands of thecommunity participatory conveyed by all kinds of online social media. This wouldmake possible by leveraging the network of over 2000++ telecenters,600++ Community Digital Services Centers, and the ongoing 70,000 Smart VillageHubs as being the community new learning space.
Keywords ∎∎∎
32.1 Background
For over a decade, Thailand has been internationally recognized as a regional centerfor ICT growth and development, and its ICT Policy Framework has been anexemplary model for the development of effective telecommunications and ICTregulatory environment (ITU, 2015).
K. Intaratat (&)CCDKM, Sukhothai Thammathirat Open University, Pak Kret, Thailand
© Springer Nature Singapore Pte Ltd. 2018S.F. Tang and S.E. Cheah (eds.), Redesigning Learning for GreaterSocial Impact, DOI 10.1007/978-981-10-4223-2_32
345

In 1995, the country launched an ambitious project to address the goal ofensuring access to education for all through technology. In 2002, the National ICTMaster Plan, a comprehensive policy framework for ICT development, was createdand the Ministry of Information and Communication Technology (MICT) wasestablished. Since the policies were enacted, there has been a tremendous boost forthe ICT sector. In recent years, both the Ministry of Information andCommunication Technology (MICT) and the Ministry of Education (MOE) haveset development plans to build both infrastructure and people’s ICT literacy withthe mission to “create a labor force of adequate ICT professionals that areknowledgeable, skilled, and information literate, in order to develop Thailand in asustainable and stable knowledge-and-innovation-based society” (CCDKM, 2009).
A new policy framework called Smart Thailand 2020 was introduced in 2014.The principal objective of the new plan is to boost accessibility, making ICTs abasic commodity for the entire country through ongoing improvements in infras-tructure and increased mobile broadband penetration. Thailand recognizes that ICTliteracy provides opportunities for the public including all the marginalized peoplefrom all over the country to fully and equally participate in the digital economy andsociety, and exercise their right to speak, share ideas, access information, and buildknowledge. The existing 2000++ telecenters scattered across the country and set upat sub-district administrative offices, community centers, healthcare centers,schools, and the USO NET Community Centers, and provided access to ICTs andthe Internet in rural and remote areas with a focus on digital literacy. Furthermore,thus far, Smart Thailand has also resulted in the establishment of some 400,000public Wi-fi access points (ITU, 2015). These developments are expected to con-tinue as the country becomes a leader in ICT development in ASEAN.
The MICT (Ministry of Information Communication and Technology) is thecore organization whom aware that there is a growing demand, especially fromyouths and small medium entrepreneurs, for scaling up the existing telecenters andoffering more friendly innovation and coworking spaces or SMART hubs. These areplaces where people can come together, generate ideas and solutions, learn newknowledge and skills, get assistance on how to set up their local businesses,establish strong networks and have access to skilled personnel, and e-learningresources (MOOCs), among others. Along with its core policy of Thailand 4.0, ICTgot its tangible roles to serve all the growing up demands with high expectationsconcerning the improvement of the socioeconomic conditions in the currentknowledge economy. The Ministry of Digital Economy and Society, Thailand(previously is the Ministry of ICT), has put all supports in this growing demand,especially among all kinds of small medium entrepreneurs to survive under eitherthe knowledge economy, the digital economy, or the creative economy (Intaratat,2016).
E-services play a significant role in development by accelerating public servicedelivery, improving government accountability, encouraging civil participation indecision-making processes, boosting the digital economy, among others. However,unless rural people are empowered with digital literacy and entrepreneurial skills,they will remain digitally excluded and marginalized in terms of access and use of
346 K. Intaratat

ICT. CCDKM has developed culture- and context-sensitive curricula onentrepreneurship skills for rural communities, using simple and effective strategiesto help them join global market places and link with buyers to sell their productsnationally and internationally through mobile technology. Throughmulti-stakeholders’ partnerships, training of the trainers’ courses has been con-ducted nationwide and rural communities are increasingly using ICT to reach outand collaborate with national, regional, and international organizations to imple-ment their local sustainable development projects and initiatives. Their Englishlanguage is also improving! An essential added value when working in the ASEANEconomic Community.
However, with its evidence base, there are several challenges when it comes totelecenters in Thailand; for instance, how to ensure their sufficient sustainability,organizational stability, and programmatic flexibility to allow these spaces to sur-vive once the immediate round of funding allocated for their setup runs out. In fact,many telecenters in Thailand have shut down and there is growing awareness thatthe first generation of telecenters which provided a basis for introducing the Internetand basic ICT literacy (particularly in rural areas and among marginalized anddisadvantaged groups) has now become obsolete while ICT has been growing up inits high expectations concerning the improvement of the socioeconomic conditionsin the current knowledge economy. How can telecenter or the ICT learning centerscould be a place where people can come together, generate ideas and solutions,learn new knowledge and skills, get assistance on how to set up their local busi-nesses, establish strong networks, and have access to all demanded skills.
So, this Participatory Action Development study has been synthesized from allsuccess and ongoing telecenters in Thailand and in the region aims to transform theexisting telecenter to serve as its next-generation telecenter: the community smarthubs which could be benefited to all, not only in Thailand but also in other ASEANmember countries. Showcases or case base studies have been synthesized from alllevels of stakeholders.
32.2 Success Stories of Community Co-working Spaces
Some of the various cases of telecenter or the smart learning centers were picked upto be as case studies as follows:
1. Thai Telecenter
Since 2006, MICT has supported CCDKM to train both off-line and online348,820 Thai marginalized people, ensuring gender equality. This was made pos-sible by leveraging the network of over 2000 telecenters scattered all over thecountry.
From 2013 to 2015, 80,000++ people have been trained on digital literacy andentrepreneurship skills. The Ministry of Information and Communication
32 Community Coworking Spaces: The Community … 347

Technology of Thailand (MICT) is the main supporter of these projects under thepriorities of the Digital Economy Policy Plan Pillar 4, namely digital e-commerce,digital entrepreneurs, digital innovation, and digital contents. These developmentsare expected to continue as Thailand is one among the countries to become a leaderin ICT development in this ASEAN region because its current concrete policy ofThailand 4.0 aims to transforming Thailand into the digital country. So, the scalingup of all existing telecenters to offer more friendly and applicable innovation as acommunity SMART hub where people can come together, generate ideas andsolutions, learn new knowledge and skills, get assistance on how to set up theirlocal businesses, establish strong networks and have access to skilled personnel,and all kinds of e-Learning resources such as MOOCs, among each other and othersboth in Thailand itself and also among the other ASEAN member countries(Picture 32.1).
2. SAFSeN
SAFSeN (Southeast Asian Council for Food Security & Fair Trade) is an ICTlearning-based platform designed to provide agricultural tips on appropriate tech-nology to rural small-scale farmers in ASEAN; bridge gaps in educational andliteracy levels; narrow the digital divide (gender and geographic); link and networkASEAN farmers; and enhance food security through sustainable agriculture tech-nologies. The SAFSeN training course created by CCDKM is available in English,Thai, Bahasa, Malay, and Vietnamese. It teaches farmers how to use the ICTplatform; write content; and report stories from the field; shoot, edit, and uploadphotographs on the Web; use Facebook and Line to share and communicateinformation on sustainable agriculture technologies. CCDKM has trained bothonline and off-line 5000 farmers in Thailand and Laos. For most farmers, it wastheir first time to use social media to raise awareness about their work. Furthermore,
Picture 32.1 Farm community learning among themselves via their mobile devices (CCDKM,2016)
348 K. Intaratat

their English literacy skills also improved. After the successful outcomes of thisproject, Thailand’s SMART Farmers model was taken as an example in the ASEANregion. SMART Farmers from northern Thailand trained 37 Cambodian farmersand in partnership with CCDKM and Oxfam, launched the first two communityinnovation centers (CCICs), in Pursat and Takeo provinces. The project aims toimprove the digital literacy capacity of Cambodian farmers; empower them withaccess to important information sources, including crop choice, weed control,environment and climate change, weather information, markets; and promotenationally and regionally their own stories, products, and services.
3. Cambodia Community Innovation Center (CCIC)
In 2015, CCDKM and OXFAM US in Cambodia launched and piloted a projectto set up the first two community innovation centers (CICs), in Pursat and Takeoprovinces. The project aims to improve the capacity of farmers on how to useinformation and communication technology (ICT) to voice out their concerns andpromote their agricultural work and methods.
The CCICs have been equipped with computers, LCD projectors, and Internetby Oxfam and its partners—RACHANA and SREI Khmer, and are being managedby a farmers’ committee that will ensure their sustainability. “We are learning howto type in Khmer to accept registrations for the training and the small fees willensure the smooth running of our Center, paying for electricity and maintenancecosts,” said Noun, a member of the service team.
While sitting in plastic chairs and happily waiting for the opening of theCambodia Community Innovation Center (CCIC) in the remote village of Sareng,Pursat province, students and farmers, especially women, are excited to register forthe first time in their life to computer and Internet courses. For women farmers, thecenter offers unprecedented opportunities since they have never received basiceducation and training on technology skills. “While growing up and then havingchildren, I never had the time and opportunity to explore and experiment withtechnologies. CCIC, which is conveniently located near my house, is my first stepinto the modern world,” said Oun Korn, a 35-year-old woman farmer, who hasnever put her hands on a computer before.
Many women farmers who attended the opening also recognized the businessand educational opportunities brought by new technologies, not only for them-selves, but also for their children. “My parents are farmers and since it is expensiveto commute to provincial towns to attend computer classes, having the InnovationCenter right next to my house is a dream come true!” said Hay Sokchea, a16-year-old student.
CCIC offers villagers access to Internet and relevant information on agriculturemarket prices, knowledge, research, and new technologies. Trainers also teachfarmers about Facebook and how to upload their stories, photographs, and videos topromote their community products online. “The Center has arrived at the right time!I want to use Facebook to advertise my products, and those of my community; inparticular, our original rice seeds from Sareng village,” said Noun (Picture 32.2).
32 Community Coworking Spaces: The Community … 349

Oun Noun, 31-year-old farmer and a member of the service team, tried to use thecomputer for the first time at the opening of Cambodia Community InnovationCenter (CCIC) in Pursat province.
Chei Eth, a 27-year-old farmer and a member of the service team, wants to learnhow to use the Internet to search for news and information from Cambodia and theworld and share her stories with others. “I want to promote the work of my serviceteam and our products to other farmers outside the village. Until now, it was verydifficult to share our stories and sell our products to people outside the villagebecause we didn’t have the technology and the skills to do so. We had to walk fromvillage to village. This center will not only benefit my generation; it will alsoempower my children’s generation.”
4. Community-Based Tourism: Community Smart Tourism
The Local Tourism-based Learning and socializing Center: the Very Local TripCommunity-based Tourism project integrates the social, economic, and environ-mental dimensions of development by enhancing the capacities of local artisans andfarmers to use ICT and media, to promote and conserve cultural and environmentalheritage, including arts and crafts and sustainable Thai agriculture and organicfarming methods. The project also contributes to the promotion of Thailand’sdigital economy, in particular ICT, Tourism and Sustainable Development byfacilitating the involvement of Thai local people and communities in tourismdevelopment around natural and cultural heritage sites; establishing business link-ages (online and off-line) between local communities, tourism enterprises, andvisitors; providing communication and marketing e-services on local tourism inThailand; improving the quality of tourism experiences at the local level; andstrengthening the capacities of local guides on how to use ICT to promote theirlocal experiences on Very Local Trip Web platform (Picture 32.3).
Picture 32.2 Cambodian small farmers learning to use computer to seek their farm information(CCDKM, 2016)
350 K. Intaratat

5. Crafts: The Community Smart Learning Crafts
The Community Crafts Learning and socializing Center occurs to meet thedemands of the marginalized home-based workers who widespread in all regions ofThailand. Out of 249,290 households, there are 440,251 people earning theirlivelihood through homeworking. Of this number, 337,526 are women; more thanhalf are uneducated or just attended primary schooling and have been victims ofabuses and marginalization. Most homeworkers use their houses as the workplacefor producing textiles and garments, wood products, basketry, artificial flowermaking, food processing, leather goods and plastics, jewelry, and then deliver themto the employers or business mediators. This is not the same as production for directsale. Through the WE. STYLE. FOR A CAUSE initiative, CCDKM has met thedemand of thousands of women homeworkers to upgrade through ICT, theirentrepreneurial, design, and styling skills to fit the trends and requirements ofinternational and regional markets. For the first time in Thailand, local and inter-national trainers, fashion and lifestyle experts, have joined forces to deliver aninnovative, practical and community friendly pedagogy based on hands-on expe-rience and collaborative learning. Over 200 women have already benefited from thefree simplified trainings on how to build a brand, business communication, socialmedia for business, smartphone photography, product pictures and retouching forcommercial use, landscape and tourism photography, financial literacy, and onlinebusiness solutions to sell products directly to customers (Picture 32.4).
6. SAB—Safety Agri Buriram
The Community Smart Farm Learning and socializing Center occurs to meet thedemands of the small farmers as well as the policy demands of the Thai government
Picture 32.3 Local community share their local wisdom to others with pride (CCDKM, 2016)
32 Community Coworking Spaces: The Community … 351
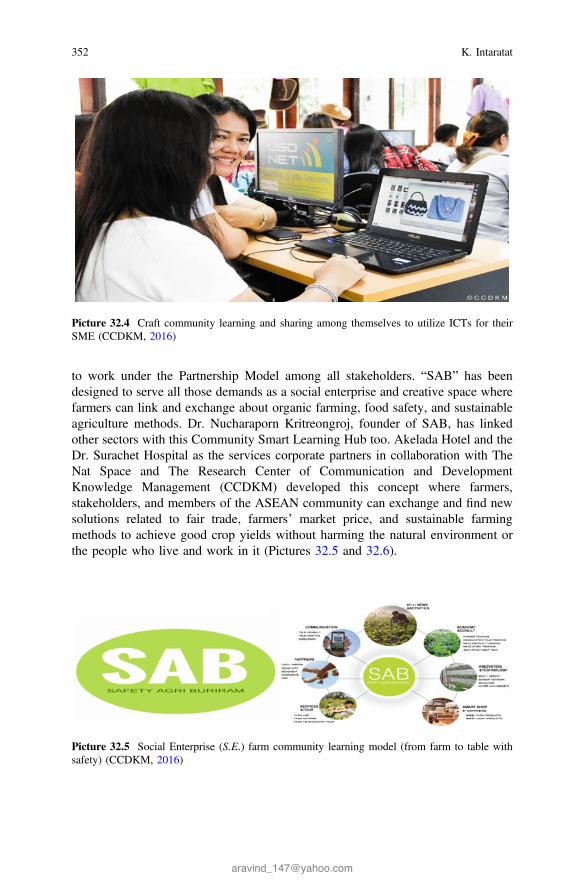
to work under the Partnership Model among all stakeholders. “SAB” has beendesigned to serve all those demands as a social enterprise and creative space wherefarmers can link and exchange about organic farming, food safety, and sustainableagriculture methods. Dr. Nucharaporn Kritreongroj, founder of SAB, has linkedother sectors with this Community Smart Learning Hub too. Akelada Hotel and theDr. Surachet Hospital as the services corporate partners in collaboration with TheNat Space and The Research Center of Communication and DevelopmentKnowledge Management (CCDKM) developed this concept where farmers,stakeholders, and members of the ASEAN community can exchange and find newsolutions related to fair trade, farmers’ market price, and sustainable farmingmethods to achieve good crop yields without harming the natural environment orthe people who live and work in it (Pictures 32.5 and 32.6).
Picture 32.4 Craft community learning and sharing among themselves to utilize ICTs for theirSME (CCDKM, 2016)
Picture 32.5 Social Enterprise (S.E.) farm community learning model (from farm to table withsafety) (CCDKM, 2016)
352 K. Intaratat
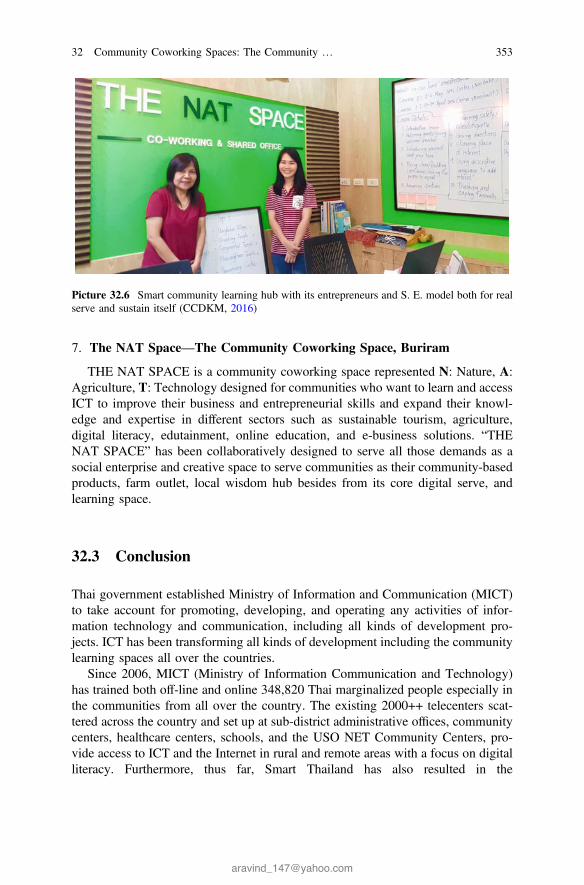
7. The NAT Space—The Community Coworking Space, Buriram
THE NAT SPACE is a community coworking space represented N: Nature, A:Agriculture, T: Technology designed for communities who want to learn and accessICT to improve their business and entrepreneurial skills and expand their knowl-edge and expertise in different sectors such as sustainable tourism, agriculture,digital literacy, edutainment, online education, and e-business solutions. “THENAT SPACE” has been collaboratively designed to serve all those demands as asocial enterprise and creative space to serve communities as their community-basedproducts, farm outlet, local wisdom hub besides from its core digital serve, andlearning space.
32.3 Conclusion
Thai government established Ministry of Information and Communication (MICT)to take account for promoting, developing, and operating any activities of infor-mation technology and communication, including all kinds of development pro-jects. ICT has been transforming all kinds of development including the communitylearning spaces all over the countries.
Since 2006, MICT (Ministry of Information Communication and Technology)has trained both off-line and online 348,820 Thai marginalized people especially inthe communities from all over the country. The existing 2000++ telecenters scat-tered across the country and set up at sub-district administrative offices, communitycenters, healthcare centers, schools, and the USO NET Community Centers, pro-vide access to ICT and the Internet in rural and remote areas with a focus on digitalliteracy. Furthermore, thus far, Smart Thailand has also resulted in the
Picture 32.6 Smart community learning hub with its entrepreneurs and S. E. model both for realserve and sustain itself (CCDKM, 2016)
32 Community Coworking Spaces: The Community … 353

establishment of some 400,000 public Wi-fi access points (ITU, 2015) as well as itsongoing 70,000 Smart Net Village Hub. This was made possible by its tangiblestrategies of Partnership and Integration among all stakeholders and community realdemands to leveraging the network of all community learning centers to be the realand sustainable smart coworking space: the community new learning space.
References
CCDKM and Team. (2009). Telecentre: Under the Policy of SMART Thailand.CCDKM and Team. (2015–2016). ICT and Work-Life Balance among Marginal groups
inThailand.Intaratat, K. (2016). Women homeworkers in Thailand’s digital economy. Journal of International
Women’s Studies, 18, 87.ITU. (2015). ICT regional growths and development. http://www.itu.int/en/ict-sdg-award/2015/
Pages/thailand.aspx Retrieved February 8, 2016.MICT. (2009). The Second Thailand Information and Communication Technology (ICT) Master
Plan (2009–2013). Bangkok: Office of the Permanent Secretary of MICT.National Economic and Social Development Board. (2012). The eleventh national economic and
social development plan (2012–2016). Retrieved February 8, 2016 from http://eng.nesdb.go.th/Portals/0/news/plan/eng/THE%20ELEVENTH%20NATIONAL%20ECONOMIC%20AND%20SOCIAL%20DEVELOPMENT%20PLAN(2012-2016).pdf.
Village Net Hub. (2017). Partnership model for digital economy, Thailand. http://www.manager.co.th/Cyberbiz/viewNews.aspx?NewsID=9600000017289. Retrieved February 8, 2017.
354 K. Intaratat

Chapter 33The Effectiveness and Impact of SocialMedia Approach on Students’ LearningPerformances
Seng Yue Wong and Wee Jing Tee
Abstract Learning approaches that utilize social media and social networking canpromote pedagogical innovation by encouraging teaching and learning processeswhich are based on personalization and collaboration. The aim of this study is touncover the impact of social media approach in terms of students’ learning per-formance in a foundation course, ascertain which social media that students preferand what satisfaction of student from social media. Hence, a descriptive study isselected for this study and 53 students have participated in this study. Resultssuggest that social media significantly impact on students’ learning performance.The value of this study may contribute alternative learning pathway for effectiveblended learning in higher education institutions.
Keywords Social media � Social networking � Learning performance
33.1 Introduction
In this new twenty-first century, technology-based learning becomes the trend andtheme of learning nowadays. Recently, intensive and extensive demands of trans-forming a print-based learning environment to a digital-based learning environmentcontinued massiveness of education in general and focusing the need for globalcompetitiveness in a post-industrial, knowledge-based economy (Jensen, Taylor, &Fisher, 2010). Hence, some study reports also showed the broad range of utilizationof information and communication technology (ICT), such as communication,social networking and surveillance in our daily life. Computer-based devices arebecame a critical part of contemporary life, and the knowledge of them is the key toeducation and employment (Jensen et al., 2010).
S.Y. Wong (&) � W.J. TeeTaylor’s University, Subang Jaya, Malaysiae-mail: [email protected]
W.J. Teee-mail: [email protected]
© Springer Nature Singapore Pte Ltd. 2018S.F. Tang and S.E. Cheah (eds.), Redesigning Learning for GreaterSocial Impact, DOI 10.1007/978-981-10-4223-2_33
355

In the last ten years, the online world or Internet has changed the world culturedramatically. Social media is an invention that offers youngsters exchange ideas,feeling, personal information, knowledge, news, pictures and videos at a surpris-ingly impressive rate (Laing, 2013; Owusu-Acheaw &Larson, 2015).
People can create content, share it, bookmark it via social media, due to the easeof use, speed accessibility. Surprisingly, social media has changed the public dis-course in society and creating the new trend in topics, ranging from the environ-ment and politics to technology and the entertainment industry.
Facebook, Blogs, Twitter, Myspace and LinkedIn are the examples of socialmedia that are used for the aim of communication, sharing photographs and videos.Social media has become a way to communicate between people, without theboundaries of places (Laing, 2013). In other words, social media is a form ofelectronic communication which facilitates interactively based on relative interest,including web and mobile technology (Ndaku, 2013). Social networking alsomeans the use of Internet to deliver or send information to other people, especiallypeople who share the interest with to send messages to them (Ndaku, 2013).
The rapid growth of social media has a great impact on the way of people tocommunicate each other on a daily basis. Besides campus, students also can makeconnection with others or among friends outside of the school, such as restaurant,café and even in a transport, car, bus or light train. Since the social media have beenincreased its usage, the academic performance of students are facing a lot ofchallenges and neglect (Ndaku, 2013). A number of educators questioning thegrades of the students will be affected by the time students spent on these socialnetworking sites and social media (Owusu-Acheaw & Larson, 2015). In addition,they believe that the utilization of technology has a great impact in educationalperformance either positively or in contrast. Thus, this study is to answer that howsocial media affect the academic performance of the students from the students’perceptions in a selected higher education institution (HEI).
The objective of this study is to uncover the impact of social media approach interms of students’ learning performance in foundation courses, ascertain whichsocial media that students prefer and what satisfaction of student from social media.This paper will present some literature reviews on the trends of using social media.Next, the findings and discussion of the study will be presented. The study findingswill help to explore more information on the impact of social media on the students’learning performance, and it helps to understand the students’ preferences of socialmedia.
33.2 Literature Review
With the widespread use of Internet and the availability of smartphones, teenagersor youngsters nowadays go online constantly, and it becomes a part of their dailylife. Generation Y are known as the new generation who always armed with newtechnologies and gadgets, where they are grown up with the exploration of digital
356 S.Y. Wong and W.J. Tee

environment and rely on information technology (Sharifah, Nurul, Rozarina, &Intan, 2016). A report stated that 92% of teenagers (aged 13–17 years old) go toonline daily and 52% of them go online several times per day from the study of PewResearch Center (Lenhart, 2015).
According to Lenhart (2015) report, Facebook remains the top used social mediaamong American teenagers who are aged from 13 to 17 with 71% of them usingFacebook, even as half of them use Instagram and 41% use Snapchat in the year2015. Figure 33.1 shows the graph bar to indicate the top social media platform thatis used by the teenagers in percentage. The majority of teenagers, 71%, are reportedto use more than one social network site out of the seven platform options in thesurvey. Instead of Facebook, teenagers also used Google+, Instagram, Snapchat,Twitter and so on.
The research regarding the effect of spending time with internet is still on aformative stage (Ndaku, 2013). This study also claimed that studies have beenconducted to prove that Internet and social networking integration have beencontradictory. Most of the teenagers and students use social media to interact withtheir peers, share information and update latest status and news (Sharifah et al.,2016). Nevertheless, some studies also revealed that teenagers spent less time totalk to their family members felt more loneliness and depression and fewerfriendship (Ndaku, 2013). Heavy Internet users also seemed to be more sociallyisolated than others. In contrast, Pew Research Center reported that people are notas isolated as has been reported previously (Hampton, Sessions, Eun, & Lee, 2009).
The emergence of social network platforms has impacted the way studentsengage with technology. Social networking and their educational uses attractattention from many researchers (Mehmood & Taswir, 2013; Ndaku, 2013;Owusu-Acheaw & Larson, 2015; Sharifah et al., 2016). Social networks areincreasingly obtaining momentum in the world of ICT. Social media enables peopleto communicate with people that they know, find new people to communicate with,find people that lost touch with, find or set up a group via social media and keep intouch with what is going on (Laing, 2013). Setting up a group can promote tocollaborative learning. With the advantages of social networking site, openness is a
Fig. 33.1 Top social media platforms used by teens in 2015 (Lenhart, 2015)
33 The Effectiveness and Impact of Social Media Approach … 357

vital element to provide open learning opportunities to the worldwide students. Inthis scenario, social media can work as open source technology which enables openonline learning among students.
33.3 Methodology
Taylor’s University offers courses that are ranged from foundation and diploma todegree, postgraduate and professional courses in multiple fields, such as medicine,pharmacy, engineering, business, biosciences, law, architecture, education, quantitysurveying, communication, computing and information technology. Thus, it isestimated that the population of Taylor’s University are approximately 4000students. The School of Computing and Information Technology (SOCIT) is esti-mated having 400 students in population. As mentioned above, foundation coursestudents are selected to be the respondents for this study. Fifty-three students fromthe foundation course are participated in this study. The sample proportion of thepopulation with the population size, 400, is equal to 0.1325 (above the margin error0.05 = 5%). Hence, the number of the respondents for this study is sufficient andacceptable (Chua, 2012).
Descriptive study, a non-experimental design, is selected for this study and isused to collect various types of data and descriptions from the different perspectivesto examine the impact of social media on students’ learning performance inTaylor’s University. Data was collected via a questionnaire which was modifiedfrom the previous studies (Ndaku, 2013; Owusu-Acheaw & Larson, 2015). Thirteenquestions are asked in the questionnaire, which are regarding to the usage ofInternet and perceptions on social media and its impact on learning performance.
33.4 Results and Findings
The purpose of this study is to determine the impact of social media approach onstudents’ learning performance, a descriptive study at SOCIT, Taylor’s University.The analysis of the data is presented after collected via questionnaire that dis-tributed to the respondents. This study answers the following research questions:
(1) What social media do the students have access to?(2) How often do the students go online?(3) How many hours do the students spend on social networking sites?(4) How has the use of social media affected the students’ learning performance?
From the demographic data of the respondents, there are 53 respondents as thesample for this study: forty-four (83%) of them are male, and nine (17%) of themare female. They are aged in the range from 16 to 24 years old, who are categorized
358 S.Y. Wong and W.J. Tee

in Generation Y. All of them (100%) do access to the Internet, and 94.3% of themare aware of social media. From the seven social media options in the questionnaire,Facebook (98.1%) and YouTube (96.2%) are the top two famous among the stu-dents (refer to Table 33.1). They have been explored to different types of socialmedia and know quite numbers of social media besides the seven options(Facebook, Twitter, LinkedIn, Google+, YouTube, Yahoo Messenger andWhatsApp) given in the questionnaire. Of the seven options, only 54.7% of thestudents know about LinkedIn. Instagram and Snapchat are another two options ofsocial media known by students, which achieve at 28.3% (Instagram) and 11.3%(Snapchat), respectively. Skype, Reddit and WeChat also are well known amongthe foundation students. Table 33.1 shows the social media be aware or know aboutby the foundation students in percentage. All of them have an account with thesocial media that list in Table 33.1.
Figure 33.2 illustrates the students’ favourite social media. Surprisingly,WhatsApp represents 90.6%, became the most favourite social media by the stu-dents. Facebook and YouTube are the second favourite social media by the stu-dents, which are representing 83% for both. LinkedIn represents 7.5% and YahooMessenger has 11.3%, respectively. This analysis has shown that WhatsApp,Facebook and YouTube are the top three social media sites that preferred by thefoundation students.
Subsequently, the reason, which made students prefer to use social media, isgiven in Table 33.2. Most of the students prefer to use social media because of thespeedy, which represents 62.3%. Next, 41.5% of the students prefer social mediabecause they are cheaper and reliable whereas 30.2% of the students prefer socialmedia due to the good reception. The other reasons given by the respondents areease of use, convenient, fun and its stylish features or newsfeed. On the other hand,some of the students also do not prefer to use social media because of the addictivenature, which having 26.4% of them.
Table 33.1 Social media beaware by the foundationstudents in percentage
Social media Frequency Percentage (%)
Facebook 52 98.1
Twitter 45 84.9
LinkedIn 29 54.7
Google+ 43 81.1
YouTube 51 96.2
Yahoo Messenger 32 60.4
WhatsApp 50 94.3
Others (Instagram) 15 28.3
Others (Snapchat) 6 11.3
Others (Skype) 1 1.9
Others (WeChat) 4 7.5
Others (Reddit) 1 1.9
33 The Effectiveness and Impact of Social Media Approach … 359

The frequency of the students who go online is shown in Table 33.3. Obviously,majority of the students go online very often, which achieving 69.8%. A total of24.5% of the students also go online often, which is equal to 13 of 53 students intotal. Of 53 students, 42 students (79.2%) spend 6 h online per day and 13.2% ofthe students spend 4 h online per day. None of them spend 1 h online per day. Theresults totally showed that the foundation students have the features of GenerationY, who spend a lot of time to online, go online very frequent, ubiquitously. Another
Fig. 33.2 Preference social media by the foundation students
Table 33.2 Reasons why students prefer social media
Reasons Frequency Percentage (%)
It is faster 33 62.3
It is cheaper and reliable 22 41.5
It opens multiple pages at the same time 7 13.2
It has good reception 16 30.2
Others 7 13.2
Table 33.3 Frequency of the students go online
Response Frequency Percentage (%)
Very often 37 69.8
Often 13 24.5
Not very often 2 3.8
Not often 1 1.9
360 S.Y. Wong and W.J. Tee

question is about the places that are used by the students for browsing Internet.Most of them (96.2%) use online at home. Sixty-six percentage of the students useonline at school, and 47.2% of the students browse Internet at café. This alsoconfirms that students go online without the boundaries of time and places.
If study further, the purpose of the student browse Internet has been investigated.Figure 33.3 represents the graph bar to show what students browse for. A total of84.9% of the students browse Internet for entertainment, 58.5% of the students foreducation and 54.7% for sports and news, respectively. Besides that, this study alsoinvestigates what is the satisfaction do the students derive from browse Internet. Itis same as the results in Fig. 33.3. Majority of the students (79.2%) are satisfied forentertainment. There are 66% of the students satisfied for information, whereas47.2% of the students satisfied for chatting.
Although most of the students use online for entertainment purposes, educationalso achieves at a higher percentage, and 79.2% of the students believe that socialmedia can affect their learning performance. Thus, this result also confirms that theuse of social media has affected and influenced students’ learning performance(Owusu-Acheaw & Larson, 2015). From the perspective of students, 60.4% of thestudents have positive views on the use of social media influenced on their learningperformance. However, 30.2% of the students have no response on the use of socialmedia influence on their learning performance. Only four students show negativeresponses for the use of social media affected their learning performance. Thispercentage is shown in Fig. 33.4. Hence, this can conclude that the use of socialmedia has a positive impact on their academic performance.
Fig. 33.3 Percentage of students for the purposes why they browse for
33 The Effectiveness and Impact of Social Media Approach … 361

33.5 Conclusion
The researchers tried to investigate the impact of using social media approach onstudents’ learning performance among the students who study foundation incomputing. The foundation course students are Generation Y, who use Internet veryoften and could not seem to live a single day without technology (Sharifah et al.,2016). The findings have uncovered that all foundation course students are aware ofthe social media, have an account with social media and have accessed to varioussocial media sites; a great number of foundation course students are very oftengoing online on various social media sites; the foundation course students havespent a lot of time to browse Internet; majority of them browse Internet forentertainment and they are satisfied for entertainment that derived from browsingInternet; 79.2% of the students believe that social media can affect their learningperformance, and 60.4% of the students has shown positive response on the use ofsocial media influence on their learning performance. This study only conducted adescriptive study on how social media impacts on students’ academic performancefrom the students’ perceptions. Due to the time and sampling limitation, a furtherstudy is suggested by using experimental study with a large amount of respondentsto provide more significant findings and empirical analysis to show the positiveimpacts of social media on students’ academic performances. Although some of thestudy has shown social media has negative impact on academic performance andattitude (Ndaku, 2013; Owusu-Acheaw & Larson, 2015; Sharifah et al., 2016),however, the beneficial features of social media, sharing knowledge and commu-nicating others can promote collaborative learning and thus support the findings that
Fig. 33.4 Responses ofstudents on how the use ofsocial media influences theirlearning performance
362 S.Y. Wong and W.J. Tee

the use of social media have positive influence on students’ learning performance.The value of this study may contribute alternative learning pathway for effectiveblended learning in higher education institutions.
References
Chua, Y. P. (2012). Mastering research methods. Kuala Lumpur: McGrawHill Education.Hampton, K. N., Sessions, L. F., Eun, J. H., Lee, R. (2009). Social isolation and new technology:
How the internet and mobile phones impact American’s social networks. Pew research CenterReport. Retrieved September 1, 2016 from http://www.pewinternet.org/2009/11/04/social-isolation-and-new-technology/
Jenson, J., Taylor, N., Fisher, S. (2010). Critical review and analysis of the issue of “skills,technology and learning”. Final report. Retrieved September 1, 2016 from http://www.edu.gov.on.ca/eng/research/jenson_reporteng.pdf
Laing, R. (2013). Social media made easy. United Kingdom: Flame Tree Publishing.Lenhart, A. (2015). Teens, social media and technology overview 2015. Pew Research Center
Report. Retrieved September 1, 2016 from http://www.pewinternet.org/2015/04/09/teens-social-media-technology-2015/
Mehmood, S., & Taswir, T. (2013). The effects of social networking sites on the academicperformance of students in college of applied sciences, Nizwa, Oman. International Journal ofArts and Commerce, 2(1), 111–125.
Ndaku, A. J. (2013). Impact of social media on the students academic performance (A study ofstudents of University of Abuja). Degree Thesis. Caritas University, Enugu.
Owusu-Acheaw, M., & Larson, A. G. (2015). Use of social media and its impact on academicperformance of tertiary institution students: A study of students of Koforidua PolytechnicGhana. Journal of Education and Practice, 6(6), 94–101.
Sharifah, R. S. M., Nurul, N. J., Rozarina, J., Intan, N. F. M. F. (2016). The impact of social mediaamong undergraduate students: Attitude. Procedia—Social and Behavioral Sciences 219,472–479.
33 The Effectiveness and Impact of Social Media Approach … 363
Chapter 34Formative Assessment via Group VideoAssignment for Business School Studentsin Tertiary Education System
Seng Yue Wong, Wou Onn Choo, Wen Yeen Chueand Ching Chieh Kiu
Abstract Technology is part of our daily life. With the introduction of tablets andsmartphones around the world since 2008, the acceptance level is much higher thanwe thought. Today, it is slowly replacing the use of personal computer with morepowerful hardware and richer apps features being introduced for tablets andsmartphones everyday. The effects have somehow changing the way of teachingand learning in tertiary education system as well. The use of learning managementsystem is a must for every college/university, and some of the formative andsummative assessments are driven by technology such as group video assignment.The objectives of the paper are to identify the factors to be considered before settingthe group video assignment, to identify the challenges of the students, and topropose the solutions for creating the group video assignment. The study is basedon the focus group for both lecturers and students from business school in tertiaryeducation system in Malaysia. The main contributions of the paper are to obtain theimportant factors and challenges from both lecturers and students and subsequentlyintroducing the propose solutions for beginners and experts as a reference point forcreating the group video assignment. The findings show that the creating of groupvideo assignment is fun and challenging for the students as they need to constructthe idea and solution into a 10-min video while the lecturers able to enrich theknowledge of discipline areas and creative problem-solving and scientific skills ofthe students more holistically.
S.Y. Wong (&) � C.C. KiuTaylor’s University, Subang Jaya, Malaysiae-mail: [email protected]
C.C. Kiue-mail: [email protected]
W.O. Choo � W.Y. ChueUCSI University, Kuala Lumpur, Malaysiae-mail: [email protected]
W.Y. Chuee-mail: [email protected]
© Springer Nature Singapore Pte Ltd. 2018S.F. Tang and S.E. Cheah (eds.), Redesigning Learning for GreaterSocial Impact, DOI 10.1007/978-981-10-4223-2_34
365

Keywords Video assignment � Summative assessment � Marking rubrics �Tertiary education
34.1 Introduction
In this advanced technology era, mobile technology gives a great opportunity tostrengthen the quality of our life, including education field in many ways. The rapidprogression of information communication technology (ICT) and embeddedlearning technology has affecting the way to teach and learn in school, includingtertiary education. Many social media, social networking sites, and tools have beenused as teaching tools to improve the learning quality and achieve educationalgoals. Thus, the technology has created opportunities for interaction, situatedlearning, and support for learning outside formal context (Aksel & Gurman-Kahraman, 2014). Video project assignment that prepared by learners has con-tributed to the emergence of new literacy practices.
Online learning is one of the fastest growing trends in education. There areestimated many students will undertake the online course or technology-baseddistance education with the emergence of mobile devices. The earlier studies ofdistance learning also reviewed that video conferencing and educational televisionwere not significantly different from the conventional classroom learning in termsof effectiveness (Means, Toyama, Murphy, Bakia, & Jones, 2010). However, manyresearchers have contributed to the development of the research—computer-supported collaborative learning (Inaba & Mizoguchi, 2004). As mentioned pre-viously, group video project can be used as one of the practices in summativeassessment for the teaching and learning process currently. Students are engaged intheir assignment to prepare their video while they are learning the new knowledge.
Video projects provide a social context where the learners able to interact andcollaborate with others and experiment with a wide range of digital video tech-nologies to create their personal meaningful multimodal artifacts (Aksel &Gurman-Kahraman, 2014). There are many benefits of using video assignment ascurrent students’ learning tool with the current technologies and the advantages ofInternet and online services. The video project enables teachers and learners tocreate more dynamic and interactive classroom learning by fostering learners’autonomy and accountability.
Hence, the aim of this study is to identify the factors to be considered beforesetting the group video assignment, to identify the challenges of the students, and topropose the solutions for creating the group video assignment. The implementationof group video project among business school students is to engage students inthese group projects in which they can search for the great opportunities to improvetheir learning skills, learn collaboratively, reflect their own learning as well asmixing the technology with their learning in business matters. This paper willpresent introduction on the benefits of video project assignment in students’learning. Next, literature reviews on video assignment and video assignment setting
366 S.Y. Wong et al.

will be presented. The interview results and findings from the students’ andteachers’ perceptions will be analyzed and discussed. Lastly, recommendations ongroup video assignment marking rubrics and video editing software are presented.
34.2 Literature Review
Group assignment generally can be found virtually in any learning environment.Group video assignment is one of the group assignments where the students areassigned to cooperate with each other on a joint assignment as a team and goals canbe achieved by a solution to a problem, an idea of a product, or a plan for a solutionvia collective cognitive exercise into a video format. Nevertheless, group projectsare often created without thought given to factors that provide for successful groupeffort. The teams need to work together to develop a basis of work together, whichis difficult to see in the classroom (Adwan, 2016).
On the other hand, video assignment has increased its popularity since videoproviders, such as YouTube, Netflix, and Hulu, and video contents are requested anunprecedented level. Video assignment has its own benefits and distinctive char-acteristics (Yue, Yang, Chen, Guan, & Zhang, 2014). Firstly, people can access tothe same video due to its contents can be reused. Secondly, lots of resources have tobe allocated for video traffic due to the file size always large especially high density(HD) become popular recently. Thirdly, mobile users expected the video can beplayed smoothly, without too much buffering time. Lastly, different video has itsdifferent popularity. Thus, how these characteristic increased its popularity amongstudents and be a part of learning task and used as assessment tool for them.
In this scenario, there are some benefits to use video assignment in the teachingand learning that are extract from the related previous studies (Harrison, 2003):
• To illustrate conditions: It is vital that learners become familiar with theprinciples and concepts of their study. All these can be made much morememorable if they are illustrated by video clips. Videos are always available andcan be used in lectures, and these will save time too.
• To show complex sequences of events: Animated diagrammatic representa-tions of complex events can be used and produced. The complicated businessevents that are shown in video can be illustrated via video assignment.
• To show marketing skills: Teaching in marketing skills is discussed, and thecorrect procedure for basic skills can be shown on video before the studentsattempt the procedures for themselves.
• To stimulate student discussion: A good designed and structured video can actas a starting point for initiating student discussion for important issues inbusiness practice. A cross-cultural collaboration between students can triggerdiscussion to increase their thinking and problem-solving skills and addressbusiness problems.
34 Formative Assessment via Group Video … 367

• As a tool for affective skills: Students need to prepare themselves withknowledge, skills, and attitude after they completed their course. Of these,attitude is commonly challenged lecturers, which is hard to innumerate andexplain to the students. To address this, video assignment enables students to puttheir technical skills into the context of appropriate professional behavior withrespect to attitude. Students may ask to identify the correct attitude when theyare doing their business meeting or marketing their products.
• To provide students with feedback on their performance: The videoassignment which is created by the students afterward will be reviewed by theteacher for assessment. The strengths and weaknesses can be identified withview to improving students’ skills. For example, the interview between cus-tomers or clients and student can be replayed and can discuss particular aspectsto learn their communication skills. Lecturer and student feedback can beviewed to evaluate their performance.
Furthermore, a successful video assignment needs to gather evidence forlearning outcomes. Students should gain meaningful practices and think criticallyby expressing themselves in the video assignment instead of know how to create ordevelop video (Baepler & Reynolds, 2014). Eventually, students feel more confi-dent in their technological abilities, increase their ability in video composing, andfeel engaged by the video assignment.
34.3 Methodology
The use of technology in the teaching and learning is a must to enrich and enhancethe understanding and creating new knowledge from the existing one. In order tocreate a video group assignment, it involves several major aspects such as subjectmatter (topic, sub-topics, area, learning outcomes), person involvement (both lec-turers and students), and technology use. The authors have decided to use thequalitative method and focus group to conduct the research via information andfeedback from the interview. There are 10 open-ended questions used in the focusgroup interview.
The target of this survey is mainly on lecturers and students who are involved inthe video group assignment process. The reason is to understand better from theprimary resources pertaining to their usage and experience throughout the entireprocess from creating the assignment to the submission and marking of the videoassignment. The focus group size for a study varies, ranging between 3 and 14respondents, which is based on the study field (Ary, Jacobs, Sorensen, & Walker,2014). For this study, there are 4 lecturers and 8 students involved in the focusgroup interview. All the lecturers and students have at least one-time experience increating the video group assignment and one-time experience in preparing andcompleted the video group assignment, respectively.
368 S.Y. Wong et al.

After the focus group interview sessions with lecturers and students as statedabove, the summary from the interview will be analyzed and summary based onfew keys elements such as factors to be considered while using the technologicaltools for setting video assignment and the challenges of the students whileanswering the assignment.
34.4 Findings and Recommendations
34.4.1 Findings: Focus Group Interview
As per the earlier discussion, the focus group interview will be based on 2 groups:(1) lecturers and (2) students. The findings will be discussed as follows:
1. Focus Group Interview: Lecturers
The interview sessions with the lecturers are focusing on 2 parts, and the out-comes of the interview will be summarized in this section.
(a) Factors to be considered when creating the video assignment
Findings from the interview with the lecturers pertaining to the factors to beconsidered when planning and creating the video assignment as follows:
• Selection of topic areas to be used in video assignment: There are many topicsbeing covered in the module. The lecturers found out that it is not easy to selecta particular topic to be used for video assignment creation. The reason given isfocusing on the worry of students not able to construct the ideas and describe theinformation by presenting in a single video.
• Mapping with the module learning outcomes: Every single assignment givenmust be in line with the module learning outcomes. The traditional writtenassignment is easier to be mapped with the module learning outcomes as eachwritten assignment can be broken into few sections which may easily presentingthe components which map according to the learning outcomes. Due to thenature of video assignment which is constructed into one component, thelearning outcome can be achieved, but it is not clearly divided into each section.
• Student’s video creation literacy: The students in the class are with differentcomputer literacy generally and video creation literacy specifically. Majority ofthe students are without the knowledge of creating the video assignment. Hence,it is a challenge for students to produce the video assignment. The major worriesare not able to submit the assignment on time and not able to produce the videothat can fulfill the module learning outcomes.
(b) Challenges of video assignment
• Acceptance of video assignment: Students are used to the conventional writtenassignment; hence, it is a challenge to request the students to produce a good
34 Formative Assessment via Group Video … 369

video assignment which can fulfill the module learning outcomes fully. Thestudents tend to be very worry when they know the assignment is given in thevideo mode. Several discussions in the class and during consultation hours ofguidance will be able to make the students understand better the requirements ofthe assignment.
• Contributions among group members: Traditional written assignment can bebroken into several sections and can distribute the works among the groupmembers easily and equally. The situation for producing a video assignment isdifferent. The distribution of works for video assignment is depending on theindividual roles on planning, gathering information, finding suitable graphics,video, text and animation, capturing the video, compilation, and editing thevideo. The tasks need to be discussed and distributed between members as someof them are not so good in computer skills.
• Software usage coaching and assistance: There are many video editing soft-ware available via Internet. All the software is equipped with the basis featuresof editing and producing a video, but some with extra features may require somefees. Because the student numbers in the module exceeded 100, the softwarecouching and guidance to the students are limited. Students are required to learnand explore the software by themselves, and the lecturers will only focus oncoaching the students how the video content should be in line with therequirement of the assignment.
• Awarding of marks for the assignment: The marks of video assignment givenwere between 30 and 50%. It is clearly known that it is a major component ofthe module, and all of the assignments are in group assignment format. Due tothe nature of video assignment which is not separated into component, themarks awarded in each assignment might be very different among groups inthe module. The lecturers tend to watching the video as a whole and awardingthe marks in the marking scheme given.
2. Focus Group Interview: Students
The interview sessions with the students are focusing on 2 parts, and the out-comes of the interview will be summarized in this section.
(a) Challenges of video assignment
• Constructing and planning the ideas: Students found it very difficult to planand coordinate the creation of the video from few aspects such as they are notfamiliar with the software, not able to compile the idea from words into videoelement, not able to express the content via the video mode and distributing theworks among the group members compare to the written assignment.
• Familiarity of video creation software: Majority of the students are notfamiliar with the video editing software. They found it difficult to learn, edit, andproduce the video. They are more familiar with the preparation of PowerPointpresentation which may be later converted into video file.
370 S.Y. Wong et al.

• Completion of video creation between the time frame: Video planning,editing, and creation are very time consuming. It is not as easy as searching theinformation over the Internet, analyze, compile, and summarize the informationin required format. The time spending on searching for the suitable information,graphics, sound, text and animations, planning the flow of the video, and cap-turing and editing video is tremendous. In order to finalize the complete video(between 8 and 10 min), the video needs to be played and edited in order tosmoothen the animation and transition of the video.
(b) Reflective thinking from the video assignment
• Fun but challenging: Students found that it is very fun in capturing and editingthe video. They seem to acting like the film producer to produce a video whichcan be traded as a commercial advertisement or small movie. The challengingpart lies in the use of the video editing software and also to complete theassignment between the specific time frame.
• Preferable of written assignment: Majority of the students mentioned that theystill preferred the written assignment rather than video assignment as they ableto construct and produce the report according to the format given, and usuallythey are able to get a high mark for the assignment. Also, students are notrequired to learn new software in order to complete the assignment which is verytime consuming.
• Amaze with the advancement of video creation technology: The studentsused the photoshooting and editing apps in the mobile phone but not the videoediting software. Students are new to the video editing software and are amazedwith the easy-to-use and easy-to-learn features such as drag and drop and visualtools which are easily being used and navigated.
34.4.2 Recommendations
In this section, some recommendations for beginners and experts will be introducedto serve as a purpose of reference points.
1. Marking Rubrics
Some important elements to be considered when creating the marking rubrics arestated as follows:
• Time frame: The time frame given to complete the assignment should beminimum of 6 weeks and up to maximum of 8 weeks.
• Total marks awarded: The marks awarded in the assignment should bebetween 25 and 50% as the marking rubrics is covering many components.
34 Formative Assessment via Group Video … 371

• Mapping with module learning outcomes: Lecturer should take note of thevideo assignment topic given should be able to cover the module learningoutcomes.
• Multimedia elements: The multimedia elements and effects should only beawarded with a maximum of 20% of the total marks of the assignment.
• Focus points of the video: The major components of the video should befocusing on the content and delivery of the message. The marks awarded shouldbe with a minimum of 60% of the total marks of the assignment.
2. Video Editing Software
The summary of some of the popular and easy-to-use video editing softwareavailable over Internet is depicted in Table 34.1.
Table 34.1 Summary of video editing software with the features
Onlinevideo
Feature
PowToon • Uses animation to capture your audience’s attention• A library of tutorial videos to help get new users up and running• Video can export directly to YouTube• A user can create 45 s of free video
Kizao • A user need to more time to get used to working with the tool• Provide video templates• Can edit images, create collages, apply filters, add effects, and others
Animato • Can add pictures, text, and video clips• Easily post and track videos on the web, social media, and email, or downloadto DVD
WeVideo • A user can use either storyboard mode (novice users) or a timeline mode(advanced) to pull their clips, images, and sounds together
• The editor includes a variety of higher end features such as white labeling,animation, and color keying (like a green screen) all from within an Internetbrowser
• Collaborative environment that enables several people in a group to work on aproject at any given time
• The WeVideo Google drive lets a user save all his projects, complete orincomplete directly to his Google drive account
• Its Android app also allows a user to capture raw footage directly from the userphone
Biteable • It provides hundreds of animated live action or photograph scenes in lots ofdifferent styles, or just use a stylish and pre-made template
• Easily add text, photos, colors, and sound to customize a video and edit it all ona simple drag-and-drop timeline
• Easily to share a video on YouTube, Twitter, or Facebook just by pressing abutton
Stupeflix • Unlimited free videos• Each video is limited to 20 min• Add photos, video, text, music, theme, maps, transitions
(continued)
372 S.Y. Wong et al.

34.5 Conclusion
As a summary, both the lecturers and students have interest on video assignment.The focus is not on the video as a medium but the construction of content whichrequire the constructive, cognitive and teamwork in order to produce a good video.
The findings from the interview that outline some factors to be considered whencreating the video assignment such as selection of top cares to be used in videoassignment, mapping with the module learning outcomes and student’s videocreation literacy; some challenges of video assignment from the lecturer’s per-spective such as acceptance of video assignment, contributions among groupmembers, software usage coaching and assistance and awarding of marks for theassignment. Some challenges of video assignment from the student’s perspectiveare constructing and planning the ideas, familiarity of video creation software, andcompletion of video creation between the time frames; some of the reflectivethinking from the video assignment from the student’s perception is fun but chal-lenging, preferable of written assignment and amazed with the advancement ofvideo creation technology.
Some recommendations for setting up the marking rubrics such as time framesetting, total marks awarded, mapping with the module learning outcomes, multi-media elements and focus points of the video; together with the recommendation ofsome video editing software serve as a reference points for both beginners andexperts.
References
Adwan, J. (2016). Dynamic online peer evaluations to improve group assignments in nursinge-learning environment. Nurse Education Today, 41, 67–72.
Aksel, A., & Gurman-Kahraman, F. (2014). Video project assignments and their effectiveness onforeign language learning. Procedia—Social and Behavioral Sciences, 141, 319–324.
Table 34.1 (continued)
Onlinevideo
Feature
• Set movie pace, individual durations, and volumes• Trim video, reverse, or slow motion
Flixpress • Using personally uploaded audio on multi-layout templates• Music or audio recording need to be saved on a user computer as an mp3 filebefore the user can use it in your video
Moovly • Make videos or make presentations using library objects and free templates• Can add images, sounds, and video clips• Can share videos with team members, download them for offline use, or publishthem to YouTube, Facebook, or the free Moovly Gallery
34 Formative Assessment via Group Video … 373

Ary, D., Jacobs, L. C., Sorensen, C. K., & Walker, D. A. (2014). Introduction to Research inEducation (9th ed.). Australia: Wadsworth Publishing.
Baepler, P., & Reynolds, T. (2014). The digital manifesto: Engaging student writers with digitalvideo assignments. Computers and Composition, 34, 122–136.
Harrison, F. (2003). Using learning resources to enhance teaching and learning. RetrievedSeptember 10, 2016, from http://www.faculty.londondeanery.ac.uk/e-learning/small-group-teaching/Using_learning_resources_to_enhance_teaching_-_learning.pdf
Inaba, A., & Mizoguchi, R. (2004). Learners’ role and predictable educational benefits incollaborative learning: An ontological approach to support design and analysis of CSCL. InChapter: Intelligent Tutoring Systems, Lecture Notes in Computer Science, 3220, 285–294.
Means, B., Toyama, Y., Murphy, R., Bakia, M. and Jones, K. (2010). Evaluation ofevidence-based practices in online learning: A meta-analysis and review of online learningstudies. US Department of Education Report.
Yue, J., Yang, B., Chen, C., Guan, X., & Zhang, W. (2014). Femtocaching in video contentdelivery: Assignment of video clips to serve dynamic mobile users. ComputerCommunications, 51, 60–69.
374 S.Y. Wong et al.

Chapter 35Education as a Political Toolfor Empowering Studentsand the Community
R. Ratneswary V. Rasiah
Abstract It is becoming increasingly evident that there is a need to continuouslyinnovate teaching and learning practices to effectively educate, develop andempower students, in the ever-changing landscape of higher education. A large andgrowing body of literature highlights the need for institutions of higher education todevelop innovative teaching and learning practices to effectively meet the academicand social needs of a diverse set of students, and prepare them to take their pro-ductive place as leaders in the global community. While extensive literature hasfocused on first-year learning experience, the literature is scarce on the final-yearstudents’ learning experience, which is equally important as they need to beempowered for a successful transition into the workplace, increasing their adapt-ability to the rapid changes in the global community, preparing them for aknowledge-based society. This study fills the gap in the literature by investigatingthe impact of innovative teaching and learning practices on the learning experienceof final-year business students taking a course on International Economics Theoryand Policy.
Keywords Innovative teaching and learning practices � Students’ learning expe-rience � Graduate capabilities
35.1 Introduction
35.1.1 Innovative Teaching and Learning Practices
Innovation is a term that seems to be loosely used by many, especially in the face ofnumerous recurring problems. It is often used to present a solution to the varioustrials and tribulations that society faces in today’s world. As Winslett (2014) aptlypoints out that the term innovation “appears in federal policy, in role titles, indepartmental names and in mission statements”. What exactly does innovation
R. Ratneswary V. Rasiah (&)Subang Jaya, Malaysia
© Springer Nature Singapore Pte Ltd. 2018S.F. Tang and S.E. Cheah (eds.), Redesigning Learning for GreaterSocial Impact, DOI 10.1007/978-981-10-4223-2_35
375

mean? This is a grey area, as far as higher education is concerned. While there areso many loosely termed definitions, the idea of innovation generally resides on thetransformative process that either a product, service, organization, or individualgoes through to enhance well-being.
With the enormous challenges and crises faced by communities in thetwenty-first century, it is little wonder why higher education policy makers havepushed forward the innovation agenda. This is in line with the Malaysian EducationBlue Print (2015–2025) that seeks to promote continued excellence in the highereducation system in Malaysia by increasing the use of innovative learning andteaching practices, with the aim of developing students’ competencies so that theyeventually become holistic, entrepreneurial and balanced graduates (MalaysiaEducation Blue Print, 2015). A large and growing body of literature (Christensen &Eyring, 2011; Rasiah, 2014; Soares, 2012; Yong-qin, 2002) highlights the need forinstitutions of higher education to develop innovative teaching and learning prac-tices to effectively meet the academic and social needs of a diverse set of students,and prepare them to face the challenges of the twenty-first century.
Over the last two decades, the focus has been on first-year learning experience.There is scarce literature on the final-year or students’ learning experience, which isas important, as the graduating cohort need to be empowered for a successfultransition into the workplace, increasing their adaptability to the rapid changes inthe global community, preparing them for a knowledge-based society. This studyfills the gap in the literature by investigating the impact of innovative teaching andlearning practices on the learning experiences of final-year business students takinga course on International Economics Theory and Policy. The use of Google docs,in particular Google Slides, a Web 2.0 technology tool, as the main innovative tool,paved the way for a higher level of collaboration, teamwork, communication andempowerment. Students were also exposed to other innovative forms of learning,and these included Padlet, Socrative, YouTube educational videos and the use ofgroup discussions and presentations which were all conducted in the X-Spacecollaborative classrooms. Web 2.0 teaching tools have been found to positivelytransform learning and teaching in higher education. It is of utmost importance thateducators reflect and critically plan their lessons and the pedagogical tools they aimto use, if their intention is to maximize students’ effective learning. Planning alesson is by no means an easy task, as it entails thinking critically about thelearning outcomes that the students must attain, not only in terms of knowledge,but also in enhancing or developing their skills. The educators play a huge role ineffectively educating, developing and empowering their students, employinginnovative teaching and learning practices to enable effective learning to take place,in this ever-changing and highly fluid landscape of twenty-first-century highereducation.
376 R. Ratneswary V. Rasiah

35.1.2 Problem Statement
The landscape of the twenty-first-century job market is filled with uncertainty aboutthe types of jobs that will be available in the next ten years, let alone for the rest ofthe twenty-first century. With the advent of technology, many traditionalpeople-based jobs are now taken over by robots and machines, making the humanworker redundant. How then, does one teach the students of today to ensure theyare capable of doing the jobs of the future? How can higher education institutionsprovide meaningful lifelong experiences that will ensure that their graduates survivethe uncertain job markets of the future? How can we ensure that our graduates areempowered to be the change agents who will transform communities? What do weneed to do in class to empower our students to “take over” the instruments ofsocietal power and influence, to transform their communities? As it stands, highereducation institutions have been transformed “from a system designed to educate anelite, to one of mass education that aims to educate the whole of the youth of ourcountries” (Esteve, 2000). Mass higher education brings with it many challengesand confounding problems not only to the educators, but also to the job market.Graduate employability is a key performance indicator for a majority of universi-ties, and if educators do not transform their pedagogy to suit the needs of the futurejob markets, they are then doing gross injustice to their students. There is therefore,a need to continuously innovate teaching and learning practices to develop andempower students, for a successful transition into the workplace, increasing theiradaptability to the rapid changes in the global community and preparing them for aknowledge-based society. Students must “increasingly participate in the assess-ment of their work, through constructive dialogue with other students and theirteachers” to make learning and teaching a more integrated activity, thereby cre-ating collaborative learning environments (Ashwin, 2006).
35.2 Literature Review
With the advent of the Internet era, there has been a proliferation of new andsophisticated technologies that have brought about some very promising prospectsto educators of higher education. While some may see it as promising, others areconvinced that it imposes many new challenges that they never faced before. Thestudents of today grew up with technology and are so depended on their computers,mobile devices and the Internet for learning, communicating and leisure activities.As a result, traditional methods of teaching and learning have had to undergotransformations beyond recognition in some cases, where innovative technologiesand practices are being utilized, and students are exposed to learning anytime,anywhere. As Slavich and Zimbardo (2012, p. 569) noted “Transformationalteaching involves creating dynamic relationships between teachers, students, and ashared body of knowledge to promote student learning and personal growth. From
35 Education as a Political Tool for … 377

this perspective, instructors are intellectual coaches who create teams of studentswho collaborate with each other and with their teacher to master bodies of infor-mation”. In most cases, the students are far more tech-savvy compared to thefaculty, hence encouraging collaborative student-faculty, student-peer andstudent-community learning. To understand how powerful these innovativetechnologies and practices can be to an educator, and to the students, this studyexplores the impact of innovative teaching and learning practices on the learningexperience of final-year business students. Although there have been an increasein the number of studies done on innovative teaching and learning technologies,Meyer (2010) highlights the lack of empirical studies into the impact of Web 2.0tools in higher education. This study is therefore in the right direction as itaddresses the lack of existing literature on the educational benefits of innovativetechnologies.
This study is based on the social cognitive theory (Bandura, 1986) and the theoryof constructivism, which argues that learning is an active process that is unique toevery individual and requires students to mentally construct their own knowledge.Learning strongly correlates to experience and does not matter how or wherelearning takes place, as noted by Bransford, Brown, and Cocking (2000). Usinginnovative teaching and learning technologies such as Google Slides, Padlet andSocrative in the X-Space classrooms involves social constructivism, as studentscollaborate and construct knowledge based on their prior experience and buildingon their previous and current knowledge. Active learner-centred environments aretherefore created, to enhance students’ overall learning experience. When a studentlearns well, he or she becomes empowered to bring the much needed change to hisor her community, making education a political tool of sorts. Vygotsky (1978) aptlyargues that learning is a social activity that involves a trilemma of connectionbetween communication, collaborative activities and interactions with others, andthis learning trilemma has been proven to enhance cognitive and critical thinkingskills.
35.2.1 Pedagogical Strategy
This study focused on the learning experience of final-year undergraduates of theMarch 2016 semester who undertook the International Economics Theory andPolicy module. Prior to the semester, a lot of thought was put into making themodule more engaging by introducing several innovative practices and assessmentsthat were hoped to enhance the students’ learning experience. It was decided that alltutorials would be conducted in the X-Space collaborative classrooms, as theseclassrooms provided a collaborative learning environment that allowed the use ofinteractive classroom technologies and conducive learning environment to promotecollaboration and student engagement that enhanced the quality of learning.However, it must be stated that the X-Space classroom by itself cannot enhancelearning, without the important role played by the academics, who are required to
378 R. Ratneswary V. Rasiah

reflect and critically plan their lessons and the pedagogical tools and technologiesthey intend to use way in advance, for effective learning to take place in theX-Space classrooms. A thoroughly planned lesson requires investment of time andenergy, as it entails thinking critically about the learning activities, curriculum,innovative teaching and learning techniques to be employed, and the learningoutcomes that the students must attain, not just in terms of knowledge, but also interms of enhancing or developing their skills.
In order to effectively use the X-Space classroom, it was imperative that a varietyof innovative teaching and learning tools were utilized by the academic. After muchreflection, one of the innovative tools chosen was the Google Slides, which wasused in every tutorial class. Google Slides was used as it is a Web 2.0 technologicaltool that promotes collaboration and communication. The Google Slides was cre-ated for each tutorial group with different preset tutorial questions for differentweeks. The Google Slides was named after the tutorial groups and tutorial week andwas opened only to students from the respective tutorial groups who were givenpermission to edit the slides during the tutorial. Since the X-Space classrooms hadfive tables with six students each, the tutor would assign tutorial questions to eachgroup during the tutorial lesson, giving the groups enough time to collaborate,discuss and present their findings to the class. Students found the collaboration to bebeneficial in terms of the academic discourse that took place and the social con-nections they fostered with their fellow course mates.
The students were required to research and discuss each week’s tutorial ques-tions and provide meaningful solutions to the questions. They would then berequired to present their answers. Since Google Slides is an interactive learningtool, all answers could be seen by others, thereby truly supporting collaborativelearning. Students were encouraged to take their tasks seriously as their solutionswould be shared with their fellow course mates in the same tutorial group. Once thegroups presented, the academic would provide feedback and if there were errors oramendments to be made, the groups would then amend their answers accordingly.The opportunity to share ideas and knowledge and to post up articles, video links,charts and figures through Google Slides was seen as an effective means oflearning, as the students began taking responsibility for their own learning in astudent-centred learning environment. The academic facilitated the discussions andspent time providing the much needed feedback after each group had presented.The use of Google Slides was perceived to be beneficial, as it was a real-timeplatform that provided a non-threatening, collaborative environment for effectivelearning to take place.
Aside from the Google Slides (as the main technological tool), the academic alsobrought in YouTube education videos (how to download secondary data from theWorld Bank website, how to use EViews to run data analysis and how to interpretand analyse statistical results, among others) to enhance the self-directed learningcapabilities of the students in completing their individual assignment, whichrequired them to write a term paper (in the form of a journal article) on issuesrelated to international economics. Some of these students’ term papers have beensent for publication in academic journals, as these papers are of a good quality.
35 Education as a Political Tool for … 379

The students were also exposed to other innovative teaching and learning toolssuch as the Web 2.0 education tools comprising of Padlet and Socrative, to furtherenhance their learning experience. Padlet was used to allow students to upload theirEViews results once they had learned to use the software in a self-directed mannerby watching the selected YouTube educational videos and following the steps. Thestudents who could not follow the YouTube videos were provided face-to-faceconsultations on using EViews. This allowed diverse sets of students to learnmeaningfully. Most students were able to learn in a self-directed manner, indicatinghow empowered they were in their own learning. Socrative, on the other hand, wasa perfect online, real-time platform to conduct short quizzes after tutorial lessons, toreinforce learning.
Aside from an individual assignment, the students were also exposed to a groupassignment that required them to review a book related to international economicsissues. Most students decided to use e-books in this book review assignment,showing their competencies in the virtual realm, much to the delight of the lecturer.
35.3 Research Methodology
This study employs the mixed-method research methodology, where both quali-tative and quantitative data analysis techniques are utilized. The mixed-methodstrategy is relevant as it allows the researcher to gain a rich understanding of thecontext of the research and the processes being enacted, allowing triangulation totake place to ensure the reliability of the findings.
The data analysed in this study were collected from the online TeachingEngagement Scale (TES) survey completed by approximately 60 students from atotal of 68 students who took the International Economics Theory and Policymodule. The TES is a system that collates teaching and learning feedback from 4key stakeholders (students, peer, self and superior) via a set of validated onlinequestionnaires, to generate evaluations of the overall teaching experience a lecturerprovides. For this study, the teaching engagement feedback was provided by thestudents, while the feedback on impact of the module impact on the students’learning experience were provided by the 4 stakeholders (students, peer, self andsuperior), with the highest weight coming from the students. We not only examinedthe survey results, but also analysed the qualitative feedback provided by the stu-dents, who reflected on their overall learning experience of undertaking thismodule. The students’ qualitative feedback captured the students’ perceptions of theeffectiveness of the innovative teaching and learning practices, in enhancing theirlearning experience and competences. The study employed the qualitative tech-niques of content analysis or textual analysis to analyse the qualitative feedbackgiven by the students. Kimberly Neuendorf (p. 10, 2002) defines content analysis asfollows:
380 R. Ratneswary V. Rasiah

Content analysis is a summarising, quantitative analysis of messages that relies on thescientific method (including attention to objectivity, intersubjectivity, a priori design,reliability, validity, generalisability, replicability, and hypothesis testing) and is not limitedas to the types of variables that may be measured or the context in which the messages arecreated or presented (Neuendorf, p. 10, 2002).
The content analysis technique was able to make inferences by objectively andsystematically identifying emerging constructs and specific characteristics of thelearning experiences that these students expressed in their qualitative feedback.
To complement the qualitative feedback, the students also filled in the onlinequestionnaire that was able to elicit further information of their perceptions on theeffectiveness of the innovative teaching and learning tools and practices utilized bythe academic in the X-Space collaborative classroom, on their learning experienceand acquisition of various competencies or skills. This survey was carried out tocomplement the findings of the content analysis. The TES survey instrument was apurposefully designed and validated structured questionnaire, “primarily developedto provide lecturers and schools with reliable information with which to makeinformed decisions about continuous professional development and improvingstudent learning outcomes” (TES, 2016), where the 4 stakeholders are required toevaluate the module and the lecturer’s teaching engagement. The responses arecaptured on a 5-point Likert scale with an option for a qualitative response by thestudents.
35.4 Discussions of Findings
This study is a two-pronged study that employs a mixed-method approach (bothquantitative and qualitative) to examine students’ learning experience. We will firstexamine the quantitative aspect of the survey results based on the students’ per-ception of the overall teaching experience a lecturer provides, and the four stake-holders’ perceptions of the seven dimensions of the teaching engagementassessment scale of students’ overall learning experience. The questionnaire for thestudents contains several items measuring two different constructs. The first sectioncontains a set of 14 items focusing on the teaching engagement construct, using a5-point Likert scale, which is answered by the students. The second section containsa set of 6 items assessing the module effectiveness and this section is only answeredby the students. As for the other stakeholders (self, peer and superior), they arerequired to answer the same 14 items that focuses on the teaching engagementconstruct, which is then clustered into 7 dimensions of the teaching engagementassessment. The results of the survey taken by the students are shown in Figs. 35.1and 35.2, while the triangulated results taken from all 4 stakeholders are shown intheir 7 dimensions in Fig. 35.3.
Figure 35.1 provides clear evidence that the students appreciated the innovativeteaching and learning techniques employed by the academic in conducting thelessons. The highest mean score (4.8) was for the item “T1: My lecturer related the
35 Education as a Political Tool for … 381

subject to real-world examples” revealing how important it is for the academics tocontinuously update themselves on the real-world issues and connect the curricu-lum to the real world. This reveals how students are motivated to learn a particularsubject matter which is connected to the real world of business, concurring with thefindings of Ehiyazaryan and Barraclough (2009) and Tompkins and Schlesinger(2010).
The evidence shown in Fig. 35.1 also demonstrates the students’ perception(mean score of 4.7) of how effective innovative teaching and learning techniques
Fig. 35.1 Teaching Engagement Scale Mean Scores (Likert scale of 1–5)
Fig. 35.2 Module Questions’ Mean Scores (students’ feedback)
382 R. Ratneswary V. Rasiah

are to enhance their learning experience. These innovative practices include the useof e-Learning tools and the active use of technology to help students understand thelessons well; the use of learning activities (Google Slides, discussions) that promoteteamwork and group performance; the use of research to make the subject inter-esting and up-to-date; the use of research findings or updated industry knowledge toenhance the lessons; and the active use of technology in the class to enhance thestudents’ learning experience. Wu, Tennyson, and Hsia (2010) and Lin, Chung,Yeh, and Chen (2016) concurred with our findings that e-learning and the use oftechnology enhanced students’ learning experience.
The results also revealed that students were motivated with the use of research tomake the subject interesting and up-to-date (mean score of 4.7), agreeing with thefindings of Jenkins, Healey and Zetter (2007) and Jiang, Fuming, Roberts, andPamela (2011). It was also found that the students perceived the module to beeffectively prepared and organized, with clearly stated objectives. The students alsoperceived that they had achieved the learning outcomes of the module andenhanced their communication skills, as demonstrated in Fig. 35.2. The modulecontents and how it is delivered can motivate the students to learn; their enhancedlearning experience will empower them to take charge of their lives and transformtheir communities.
Figure 35.3 shows evidence that stakeholders perceived the most importantteaching engagement assessment dimensions were the use of research to informteaching, use of relevant technology and subject/knowledge contextualization (allwith mean scores of 4.8). This was followed by the second most importantdimension, which is the supportive learning environment provided. Once again, theevidence strongly points to the use of innovative teaching and learning practices(research-informed teaching, use of relevant technology and contextualizingknowledge) to enhance students’ learning experience.
Fig. 35.3 TEA Dimensions’ Mean Scores (feedback by the four stakeholders)
35 Education as a Political Tool for … 383

The second part of this study utilizes content analysis to analyse the qualitativefeedback provided by the students. This broad-based, thematic analysis found apattern of commonalities which were coded into seven emerging constructs. The sixconstructs represented the students’ most identifiable or most frequent feedback,comprising of positive learning experience, lecturer’s characteristics/capabilities,real-world curriculum connections/subject/knowledge contextualization, classroommanagement and skills/competencies/graduate capabilities. Content analysis wasused to categorize the students’ qualitative feedback into the six emerging con-structs as shown in Table 1.1.
35.4.1 Construct I—Positive Learning Experience
Based on the evidence in Table 1.1, the most important construct that emerged fromthe content analysis of the students’ qualitative feedback was the positive learningexperience, which reveals how innovative teaching and learning methods such asthe use of Google Slides to promote collaborative learning, disrupt classes andprovide the necessary tools to inspire students and enhance their learning experi-ence. The findings concur with a wide selection of well-documented literature onthe role of technological innovations in teaching and learning to support meaningfuleducational experiences (Christensen, Horn, & Johnson, 2008; Irwin, Ball,Desbrow, & Leveritt, 2012; Koh, Herring, & Hew, 2010; Rasiah, 2014; Stephen,2014; and Srinivasan, 2014). Christensen, Horn, and Johnson (2008) advocated thecreative use “of information technology to deliver customized education tailored tothe needs of different students”. The following excerpts were written by two dif-ferent students, capturing the essence of the overall learning experience theyenjoyed:
“Dr ratnes gave me a fantastic wholesome learning experience here in taylorsthis semester i feel blessed to be under her tutelage for 2 consecutive semesters. herpassion in teaching truly leaves an impact which lasts beyond the classroom”(Student 15).
“I believe that more students from ibm should take this course as i think itprovides students with an awesome opportunity to learn about the world aroundthem. the module is compact and concise, which is good for those who want tolearn economics” (Student 22).
“Ms ratnes has always been among my best lecturer in taylors and she inspiresus to study more and more …” (Student 27).
“Very efficient and entertaining in learning in the class, make me feel energizeespecially on Friday” (Student 28).
The feedback given augurs well with Brown’s (2008) notion of engaging stu-dents in an innovative, active and collaborative manner, which makes students’responsible for their own learning and allows them to shape their learningexperience.
384 R. Ratneswary V. Rasiah

35.4.2 Construct II—Lecturer’s Characteristics/Capability
The overall feedback was succinctly captured in the following excerpts of Student11 and Student 12, respectively:
“The way she conducted the class was just so amazing and unique as comparedto the other lecturers, she makes us think and discuss, and share with us inter-national economics issue in every tutorial class” (Student 11).
“Best lecturer ever she is charismatic and extremely knowledgeable about whatshe teaches, and is willing to impart additional knowledge beyond that of theclassroom and relate real life, current economic examples to further clarityunderstanding” (Student 12).
“An incredibly awesome lecturer, always sharing positive vibes and taking careof everyone. definitely one of the best lecturer one could get in taylors universityand may more students learn and be inspired by dr ratnes” (Student 20).
“Overall, dr. ratnes is a all rounder lecturer with high knowledge and a lot offun in class. its never boring with her lectures or tutorials” (Student 16).
“Every tutorial questions was clearly explained in proper way, every day wasinteresting learning from dr ratnes” (Student 19).
“Dr Ratneswary is someone who is wellversed with the world economy and withregards to this module, international economics theory and policy, it is essential tohave the knowledge” (Student 23).
“Ms ratnes is a really great tutor, she always has time for us and answers allour questions and teaches us until shes sure we understand the course material.thank you so much, ms ratnes if given a choice, i would vote her lecturer of theyear” (Student 33).
“Lecturer has a good sense of humor, and she pay attention to academicallyweak students and teaches them with patience. never to forget to treat otherstudents fairly too” (Student 38).
The feedback on the role of the lecturer’s characteristics/capabilities isendorsed by the literature on learning (Daniels, 2010; Harden & Crosby, 2000;Kaendler, Wiedmann, Rummel, & Spada, 2015; Opdenakker & Van Damme,2006). In implementing innovative technologies and practices in the X-Spacecollaborative learning settings, the lecture is perceived to have played a crucialrole in fostering student interaction and enhancing their learning experience. CarlGustav Jung (1875–1961; p. 144) hit the nail on the head when he reflected that“One looks back with appreciation to the brilliant teachers, but with gratitude tothose who touched our human feelings. The curriculum is so much necessary rawmaterial, but warmth is the vital element for the growing plant and for the soul ofthe child”.
35 Education as a Political Tool for … 385

35.4.3 Construct III—Real-World CurriculumConnections/Subject or Knowledge Contextualization
The importance of connecting curriculum to real-world issues and the lecturer’sability to contextualize knowledge received several encouraging feedback from thestudents:
“This module provides me clear insights about the economics which relatedwith the real world examples. clear explanation is provided” (Student 1).
“Perfect i have experienced many funny and interesting lecture and tutorial forthis module. the lecturer answer my question clearly with real world example,really useful to me” (Student 3).
“This module is particularly interesting where it develop the students tounderstand how countries communicates the lecturer gave us a lot of real worldexample of the theories throughout the learning progress to understand the sub-ject” (Student 24).
“A lecturer that is patient, understanding, funny, kind and full of knowledge.always relates what is learnt in economics to real life situations occuringthroughout the world that makes economics much more easier to understand andnot boring” (Student 25).
The lecturer’s ability to contextualize knowledge or subject matter by identifyingand applying various manifestations of the concepts and theories to real-worldissues is clearly of value to the students as revealed by their feedback. Curriculumconnections to real-world issues and the ability to contextualize knowledge draw onthe social cognitive theory and the theory of constructivism, in which students learnbetter by reflecting about their academic concepts and theories and applying them inreal-world settings, in a constructivist learning environment. This concurs with thefindings of (Forrester-Jones & Hatzidimitriadou, 2006; Brundiers, Wiek, &Redman, 2010).
35.4.4 Construct IV—Classroom Management
In order to maximize learning, students learn best in a non-threatening and com-fortable learning environment. The academic is ultimately responsible, for ensuringa conducive learning environment is created, by effectively managing the classroomto ensure students do not feel isolated or lack a sense of belonging.
“I learned a lot through dr.Ratneswary class, and the class is very interactive,makes every student in the class have a good relationship and help each otherwhen in needs” (Student 7).
Our findings share the sentiments of others (Hattie, 2002; Mansor, Wong, Rasul,Mohd Hamzah, & Hamid, 2012) that effective classroom management resultingfrom the implementation of innovative teaching and learning practices has animpact in enhancing a positive learning experience among students.
386 R. Ratneswary V. Rasiah

35.4.5 Construct V—Skills/Competencies/GraduateCapabilities
In terms of skills/competences, the students perceived that the innovative manner,in which the lessons were conducted, enhanced their teamwork, critical thinkingand communication skills as illustrated in some of their qualitative feedback:
“This lecturer has provided me a good insight of the subject. she uses xspacevery well which made me realize the importance of the classroom. Working ingroups has helped me in brainstorming and improving my communication skill”(Student 2).
“I learned a lot through dr.Ratneswary class, and the class is very interactive,makes every student in the class have a good relationship and help each otherwhen in needs” (Student 7).
The way she conducted the class was just so amazing and unique as comparedto the other lecturers, she makes us think and discuss, and share with us inter-national economics issue in every tutorial class (Student 11).
The findings of this study reveal that innovative teaching and learning practices,when effectively implemented, will endow students with new or more enhancedskills/competences, consistent with the findings by Garrison and Anderson (2003);Lin and Jou (2012); and Ventura and Quero (2013).
35.5 Conclusions and Implications
Based on all the qualitative feedback given by students, and the quantitative resultsin Figs. 35.1, 35.2, and 35.3, it is evident that the students had an effective learningexperience, which motivated them to be active learners, collaborating with thematerials, the lecturer and their fellow peers. The students were appreciative of theinnovative teaching and learning technologies and practices utilized in their classes;the real-world connections to the curriculum; the lecturer’s knowledge, skills andpleasant disposition that created a positive, non-threatening, well-managed andcollaborative environment which encouraged learning; and the variousstudent-centred activities that encouraged teamwork and enhanced their criticalthinking and problem-solving skills. Active learning can only be effective if thestudents take responsibility in their own intellectual and personal development byreading, writing, taking part in discussions and engaging in higher-order cognitivecompetencies such as problem-solving, critical thinking and analysis, synthesis andevaluation (Smith et al., 2009; Svinivki & McKeachie, 2011).
The results of this study pave the way for institutions of higher learning to takethe necessary steps to develop the innovative capabilities of their faculty membersto transform and innovate their teaching and learning practices to cate for the needsof their current tech-savvy students. In an effort to provide students with a moreholistic learning experience, institutions of higher learning must continue allocating
35 Education as a Political Tool for … 387

resources for student-centred learning mechanisms and innovative technologies andpractices. Education is, after all, a political tool that empowers students, increasingtheir capability and adaptability to face rapid changes, preparing them as changeagents who will go on to become our future leaders and “take over” the instrumentsof societal power and influence, to uplift the community at large.
It would be beneficial to undertake future research that will focus on the impactof innovative practices and technologies on student attrition and retention, and whatis it about innovative practices that make it relevant at different points in thestudents’ academic journey, and in ensuring students’ successful progression andgraduation.
References
Ashwin, P. (2006). Interpreting the developments: Possible futures for learning and teaching inhigher education. In P. Ashwin (Ed.), Changing Higher Education: The Development ofLearning & Teaching (1st ed.). Routledge.
Bandura, A. (1986). Social foundations of thought and action: A social cognitive theory.Englewood Cliffs: Prentice-Hall.
Bransford, J. D., Brown, A. L., & Cocking, R. R. (2000). How People Learn: Brain, Mind,Experience, and School. Washington, DC: National Academy Press.
Brown, J. K. (2008). Student-centered instruction: Involving students in their own education.Music Educators Journal, 94, 30–35.
Christensen, C., Horn, M. B., & Johnson, C. W. (2008). Disrupting Class: How disruptiveinnovation will change the way the world learns. Mc Graw Hill.
Christensen, C. M., & Eyring, H. J. (2011). The innovative university: Changing the DNA ofhigher education from the inside out. Wiley.
Daniels, E. (2010). Creating motivating learning environments: What we can learn fromresearchers and students. English Journal, 1, 25–29.
Ehiyazaryan, E., & Barraclough, N. (2009). Enhancing employability: Integrating real worldexperience in the curriculum. Education + Training, 51(4), 292–308. doi:10.1108/00400910910964575
Forrester-Jones, R., & Hatzidimitriadou, E. (2006). Learning in the real world? Exploringwidening participation student views concerning the ‘fit’ between knowledge learnt and workpractices. Assessment & Evaluation in Higher Education, 31(6), 611–624.
Harden, R. M., & Crosby, J. (2000). AMEE guide No. 20. The good teacher is more than a lecturer—The twelve roles of the teacher. Medical Teacher, 22, 47–334.
Hattie, J. (2002). Classroom composition and peer effects. School of Education, University ofAuckland. http://dx.doi.org/-10.1016/S0883-0355(03)00015-6
Irwin, C., Ball, L., Desbrow, B., & Leveritt, M. (2012). Students’ perceptions of using facebook asan interactive learning resource at university. Australasian Journal of Educational Technology,28(7), 1221–1232.
Jiang, F., & Roberts, P. J. (2011). An investigation of the impact of research-led education onstudent learning and understandings of research. Journal of University Teaching & LearningPractice, 8(2). Available at: http://ro.uow.edu.au/jutlp/vol8/iss2/4
Jung, C. G. (1981). The development of personality (Collected Works of C.G. Jung Vol.17).Princeton University Press (October 1, 1981).
Kaendler, C., Wiedmann, M., Rummel, N., & Spada, H. (2015). Teacher competencies for theimplementation of collaborative learning in the classroom: A framework and research review.Educational Psychology Review, 27(3), 505–536. doi:10.1007/s10648-014-9288-9
388 R. Ratneswary V. Rasiah

Katja Brundiers, K., Wiek, A., & Redman, C. L. (2010). Real-world learning opportunities insustainability: From classroom into the real world. International Journal of Sustainability inHigher Education, 11(4), 308–324.
Koh, J. H. L., Herring, S. C., & Hew, K. F. (2010). Project-based learning and student knowledgeconstruction during asynchronous online discussion. The Internet and Higher Education, 13(4), 284–291.
Lin, Y. X., Chung, P., Yeh, R. C., & Chen, Y. Y. (2016). An empirical study of college students’learning satisfaction and continuance intention to stick with a blended e-learning environment.International Journal Of Emerging Technologies In Learning, 11(2), 63–66. doi:10.3991/ijet.v11i2.5078
Malaysia Education Blueprint 2015–2025 (Higher Education) Executive Summary. (2015).Ministry of Education. Available at: https://www.um.edu.my/docs/default-source/about-um_document/media-centre/um-magazine/4-executive-summary-pppm-2015-2025.pdf?sfvrsn=4Accessed on August 10, 2016.
Mansor, A. N., Wong, K. E., Rasul, M. S., Mohd Hamzah, M. I., & Hamid, A. H. (2012). Effectiveclassroom management. International Education Studies, 5(5), 35–42.
Meyer, K. A. (2010). Web 2.0 research: Introduction to the special issue. Internet and HigherEducation, 13(4), 177–178.
Opdenakker, M., & Van Damme, J. (2006). Teacher characteristics and teaching styles aseffectiveness enhancing factors of classroom practice. Teaching & Teacher Education, 22(1),1–21. doi:10.1016/j.tate.2005.07.008
Rasiah, R. (2014). Transformative higher education teaching and learning: Using social media in ateam-based learning environment. Procedia-Social and Behavioral Sciences, 123, 369–379.
Slavich, G. M., & Zimbardo, P. G. (2012). Transformational teaching: Theoretical underpinnings,basic principles, and core methods. Educational Psychology Review, 24(4), 569–608.
Smith, M. K., Wood, W. B., Adams, W. K., Wieman, C., Knight, J. K., & Guild, N. (2009). Whypeer discussion improves student performance on in-class concept questions. Science, 323,122–124.
Soares, L. (2012). A ‘disruptive’ look at competency-based education: How the innovative use oftechnology will transform the college experience. Center for American Progress.
Srinivasan, D. (2014). Incorporating e-learning features in a foundation engineering course toenhance learning experience. Annual International Conference On Education & E-Learning(p. 97). doi:10.5176/2251-1814_EeL14.58
Stephen, S. K. (2014). Like it! using facebook groups to enhance learning in finance. Journal ofLearning in Higher Education, 10(2), 55.
Svinicki, M., & McKeachie, W. J. (2011). McKeachie’s teaching tips: Strategies, research, andtheory for college and university teachers (13th ed.). Belmont, CA: Wadsworth. TES, (2016).Accessed from https://tes.taylors.edu.my/pages/9/page_tab?ann_scope=staffs
Tompkins, T., & Schlesinger, M. (2010). Integrating real-world entities into an academiccurriculum. Journal of Instructional Pedagogies, 4, 1–16.
Vygotsky, L. S. (1978). Mind in Society. Cambridge, MA: Harvard University Press.Winslett, G. (2014). Resisting innovation talk in higher education teaching and learning.
Discourse: Studies In The Cultural Politics Of Education., 35(2), 163–176. doi:10.1080/01596306.2012.745728
Wu, J. H., Tennyson, R. D., & Hsia, T. L. (2010). A study of student satisfaction in a blendede-learning system environment. Computers & Education, 55(2010), 155–164.
Yong-qin, Q. I. (2002). Innovative education and teaching experiment of higher institute,Laboratory Research and Exploration, 3(002).
35 Education as a Political Tool for … 389

Chapter 36The Impact of Experiential LearningProgramme Towards Graduates’ CareerCapabilities
Lee Kim Lian
Abstract The purpose of this paper was to examine an experiential learningtechnique (industry immersion module—IIM) and its impact on graduates’ careercapabilities. In IIM, a team of four students would work with a sponsoring client ona business project. It promotes high level of engagement, learning and developmentand provides students with an extended opportunity to apply academic and theo-retical perspectives to a “real-world” setting. As more graduates flood theemployment market, there is an ever-growing pressure on higher education industryto better prepare graduates for employment. Literatures indicate that experientiallearning can positively affect student’s absorption and understanding of knowledge.In order to find out the effectiveness of experiential learning, feedback surveydesigned to measure graduate career capabilities as well as to gather employers’responses/comments was carried out. Graduates reported that experiential learningvia IIM enhanced their preparation for careers and helped them in transitioningfrom the role of being an undergraduate to an employee. In a practical sense,graduates are better prepared for employment. Hence, this will be an addedadvantage to fresh graduates in confronting the challenging market. In addition,feedbacks from industrial employers are being shared with the students forself-improvement and development.
Keywords Experiential learning � Higher education � Immersion project
36.1 Introduction
Experiential learning is a term used to describe the process of learning fromexperience. Experiential learning theory was first introduced in twentieth century.Since then, researchers had coined various terms to label it. Dewey (1938) first calls
L.K. Lian (&)Subang Jaya, Malaysia
© Springer Nature Singapore Pte Ltd. 2018S.F. Tang and S.E. Cheah (eds.), Redesigning Learning for GreaterSocial Impact, DOI 10.1007/978-981-10-4223-2_36
391
the learning from experience as “learning by doing”, while Wolfe and Byrne (1975)define it as “experienced-based learning”. Other researchers such as Hoover (1974)suggested the key point of experiential learning involves more than just the cog-nitive learning capability that basically emphasized by management education. Assuch, Hooever and Whitehead (1975) propose the following definition of experi-ential learning as “Experiential learning exists when a personally responsible par-ticipant cognitively, affectively and behaviourally processes knowledge, skillsand/or attitudes in a learning situation characterized by a high level of activeinvolvement”. From the early research on experiential learning, we found thatexperiential learning had been adopted as a learning pedagogy that closely links toacademic knowledge and practical skills.
Ever since then, more efforts have been made to improve the learning processfrom what has been called “the new science of learning” (Bransford, Brown, &Cocking, 2000). Research in experiential learning and other kinds of “active”pedagogies are gaining greater influence in higher education, in the form ofout-of-classroom instruction, service learning projects and first-year student pro-grammes through experience-based courses (Densmore, 2000; Gaumer, Cotleur, &Arnone, 2014; Kahne, Westheimer, & Rogers, 2000; Sommers, 1997; Varlotta,1996).
There is a move towards greater experiential learning on education highlightedexperiential education as a best practice in higher education spanning multipledisciplines and contexts including technology (Ames, 2006; Chilton, 2012;Gaumer, Cotleur, & Arnone, 2014), business (Devasagayam, Johns-Mastern, &McCollum, 2012), social work (Thompson, Bender, Cardoso, & Flynn, 2011) andrecreation (Andrew, Fleming, Ferkins, Wierma, & Coll, 2010; Robinson, Barron, &Solnet, 2008).
Experiential learning technique (ELT) provides a complete model for thelearning process. It is called ELT because there is an emphasis on experience whichplays an important and crucial part to the learning process which distinguishes itselffrom other learning techniques such as cognitive learning. Cognitive learningemphasizes on cognition over affect. ELT is based on the term “experiential”.Conley (2008) argued that experiential learning is the process of discovering,processing, applying information and reflection while others such as Ruhaneu(2005), Hawkins and Weiss (2004) have suggested experiential education as amethod of linking “academic knowledge and practical skills” and “it stressespractical application of knowledge to real-world situations”.
36.2 Research Question
This study looks at immersion as a form or methodology in experiential learningand how it contributes to the experiential learning as a whole. Thus, the followingresearch question is put forwards.
392 L.K. Lian

“How the industry immersion project can maximize student learning experienceand make them job ready by providing them with a real-business environment andexperience in real time?”
36.3 Literature Review
Experiential learning is broadly defined as “the process by which a learner createsmeaning from direct experience” (Bohn & Schmidt, 2008, p. 5). Experientiallearning includes a variety of strategies that engross students in learning opportu-nities that go beyond traditional lectures and reading and writing assignments(Shapiro & Levine, 1999) and when implemented in a classroom setting, studentsparticipate in real-life activities, reflect on those activities and incorporate their newunderstanding of that activity into their lives (Bohn & Schmidt, 2008).
Experiential learning theory offers a dynamic theory based on a learning cycledriven by the resolution of the dual dialectics of action or reflection and experienceor abstraction. It is defined as a holistic learning space wherein learning transactionstake place. It is a useful framework to design and implement management educationprogrammes in higher education, management and training and development (Kolb& Kolb, 2011). Experiential learning is a method used in transformational teachingthat involves creating dynamic relationships between teachers, students and ashared body of knowledge to promote student learning and personal growth(Slavich & Zimbardo, 2012).
Review from literatures indicated that experiential learning has gained popularityin higher education in the form of outside classroom activities, service learningprojects and students’ final-year projects through experience-based courses. Manyeducators employed the use of experiential education as a teaching pedagogy.Experiential learning can have significant benefits to educators and students in theircapacity of teaching and learning. For example, study by Benander (2009) reportedhow experiential learning is not just for students but can be a valuable tool to reflecton teaching and learning. The implication of experiential learning as a form ofcritical reflection for the scholarship of teaching and learning is that it adds anothermode of inquiry. As for students, experiential learning has significantly benefitedundergraduate students especially in key areas such as (i) personal, (ii) interper-sonal, (iii) civic and (iv) professional development (Aldas et al., 2010; Simonset al., 2012; Sweitzer & King, 2009).
Hence, there is a rapid adoption of experiential learning strategies in universityeducation with the idea that such constructivist method to teaching and learningpractice will further improve students’ learning in various approaches. Either calledit “constructivist” or “experiential”, these pedagogies depend on its fundamentalstrategy of learning through interconnected cycles of experience, reflection,experimentation and evaluation (Dorsey, 2001). The utility of constructivistlearning in assisting students to connect conceptual and applied learning has beennoted by numerous researchers (Kolb, 1984; Sommers, 1997; Walcott, 1999).
36 The Impact of Experiential Learning Programme … 393

While some other researchers have identified the potential for certain kinds ofexperiential learning to promote social justice by fostering students’ criticalreflection upon their conceptual and applied learning about social, political andeconomic inequity (Cone & Harris, 1996; Densmore, 2000; Flint, 2002).
Kolb, Kolb, and Sharma (2014), studied on educator role profile, indicate that tosome extent educators do tend to teach the way they learn. Findings indicated thosewith concrete learning styles are more learner-centred and preferred the facilitatorrole while those with abstract learning styles are more subject-centred and preferredthe expert and evaluator roles. The researchers suggested a model for the practice ofdynamic matching of educator roles, learner style and subject matter that can aid inthe planning and implementation of educational experiences. With practice, bothlearners and educators can develop the flexibility to use all educator roles andlearning styles to create a more powerful and effective process of experientiallearning.
Clements and Cord (2012) explore an innovative experiential learning pro-gramme built on the principles of work-related learning that develops students toattain graduate qualities for competitiveness in the business sector. If such pro-grammes continue to focus assessment and design around student learning, studentswill not only have the opportunity to apply their knowledge in a practical context,they will also be maximizing their personal learning outcomes with the addedadvantage of being better equipped to compete in an increasingly competitivemarketplace.
Many educators have initiated to employ the use of experiential education as ateaching methodology because the technique stimulates a deeper approach tolearning. Students are encouraged to make connections between theory and practicethrough lecture, discussion, learning activities, practical experience and reflection(Bethell & Morgam, 2011; Bower, 2013; Judge et al., 2011). Study by Bower(2014) reported experiential learning in relation to physical education and sportpedagogy emphasizes the value of experiential learning in the planning, organizing,leading and implementing a road race. The study highlighted the achievement of thelearning outcomes as the experience allowed students to develop a strong owner-ship in their learning due to their active role and learning in developing theexperience. Students learned in a meaningful and productive way to obtain vitalskills in managing an event.
Aldas et al. (2010), Sweitzer and King (2009) in their study conclude thatstudents’ experiential learning has enhanced their understanding of contentknowledge, ability to contribute to the welfare of the community and capacity toachieve their career goals. In addition to that, experiential learning promotes highercommunication skills. The reason being is that students are forced to communicateand engage with their instructor and peers. Also reported in a study conducted byKoponen, Pyörälä and Isotalus (2012) stated that students’ positive attitudes tolearning communication skills increased significantly and their negative attitudesdecreased significantly between the beginning and end of the course.
Yardley, Teunissen and Dornan (2012) in their study emphasize the importanceof experiential learning in curriculum development. They found the ideas (theories)
394 L.K. Lian

are relevant to educators ranging from those with responsibilities for curriculumdesign to “hands-on” teachers and workplace supervisors. The various experientiallearning theories provide a conceptual grounding for promoting favourable learningconditions throughout the spectrum of medical education.
In the nutshell, these findings suggest that experiential learning is transformativein nature. Undergraduate students are put into a position that encourages them touse their discipline-related knowledge to practise and formulate new attitudes,knowledge and skills that lead to potential changes in their civic values, consistentwith service learning research on personal, civic and professional development(Eyler & Giles, 1999).
Unlike more traditional teaching techniques such as lecturing or tutoring,experiential learning involves the students and the lecturer in actively shaping thelearning process (Ramsey & Fitzgibbons, 2005). When teachers are beginning toadopt an experiential learning technique within the classroom, there needs to be aclose relationship between lecturer and student and between the students themselvesso as to create a learning environment that is conducive, open and honest. Mosteducators are used to being in charge in the classroom and represent the expert whoknows anything and everything about that particular subject or field. This can bedetrimental to the learning process because it creates an environment where thegood ideas can only come from the educator as he or she is the expert and the lessgood or wrong ideas are those that are different. Emerson (1996) comments that it isimportant for educators to step back when implementing the experiential learningfrom their role as experts and adopt an attitude of humility. As such, the instructor’srole is redefined that in the experiential classroom the relationship is seen more ofas an alliance (Kisfalvi & Oliver, 2015), “fellow traveller” (Welker, 1991) orco-creators of teaching and learning (Ramsey & Fitzgibbons, 2005).
However, as noted by researchers the building of such an alliance betweeninstructor and student can be difficult in teaching (Ramsey& Fitzgibbons, 2005). Thisstems from the fact that genuine conversations in the traditional classroom setting isextremely restricted or non-existent. It is important that the teacher creates a space forgood conversations as part of the educational process to enhance the studentsexperiential learning (Keeton, Sheckley & Grigges, 2002). Significant learningthrough conversation can happen between the teacher and student although it may notbe the learning the teacher intended. Baker (2010) explains that when an environmentpromotes conversational learning, students can transform their collective experiencesand differences into new knowledge through the sense they make together.
36.4 Industry Immersion Module (IIM)
The module is designed to equip students with essential management skills andcompetences. It provides a capstone experience to students in integrating andapplying everything they have learned in the bachelor’s programme in analysing,researching, planning and devising business plan for the company.
36 The Impact of Experiential Learning Programme … 395

The module is based on experiential learning, i.e. learning by doing. The modulecomprises of two stages: (i) preparation stage and (ii) experience stage. The firststage consists of series of workshops that address specific skills including com-munication skills, interpersonal skills, problem analysis and problem-solving skills,critical thinking skills, project management and leadership skills. During the secondstage (14 weeks), the students would work in teams (3–4 students) to understandthe real-world, live business case. Client from the industry provides the project briefwith relevant background along with the project assignment and criteria. Academicmentor and industry mentor are assigned to assist students during the experiencestage.
The task is to develop and provide the following deliverables:
1. A comprehensive business plan for the sponsoring client.2. Research insights, findings and other analysis in understanding the business
issue/phenomenon.3. Make a strategic and tactical recommendation and create an appropriate
implementation plan.4. A presentation to the sponsoring client, communicating in a convincing way the
insights, strategies and recommended plan of action.
36.5 Methodology
Students who have completed and passed a minimum of 60 credits with minimum2.67 CGPA are eligible to register for industry immersion module (IIM). Themodule was first introduced in 2014 and to date 2 batches of students have com-pleted the module. For the August 2015 intake, thirty-three (33) students wereselected and assigned to eight (8) companies. Table 36.1 below is the list ofcompanies involved in the project:
In order to gauge the success of the module as well as students’ learningexperience, students were asked to fill up feedback survey questionnaire prior tocompletion of the module. The questionnaire design is as follows (Table 36.2):
Table 36.1 List ofcompanies
1 Maybank
2 TEG
3 Price water coopers
4 Deloitte
5 Zuellig pharma
6 BDO (BizDO)
7 Shell
8 Schlumberger
396 L.K. Lian

36.6 Discussion and Conclusion
For the purpose of this study, the analysis and conclusion focused only on thefollowing sections of the survey:
Section B: Nature of the project,Section E: Skills Acquired,Section F: Learning Experience.
In addition, for Section H: students’ overall evaluation and comments(open-ended), codes were assigned according to the themes from the survey(Table 36.3).
At least 70% of the students agreed that the project is appropriate and relevant totheir studies. However, a few of these students indicated that the nature of theproject is not suited to their field of study. They mentioned in their comments thatthey were not allowed to choose the company hence they were assigned to com-panies that are not related to their majors. A few of the accounting and finance
Table 36.2 Questionnaire design
Section Variables Items
A General information: student profile 5
B Nature of the project 3
C Support from industry supervisor 8
D Working environment 5
E Skills acquired 4
F Learning experience 7
G Support from industry supervisor 5
H Overall evaluation and comments Open-ended
4-point Likert scale1 = Strongly agree to 4 = Strongly disagree
Table 36.3 Nature of the project
Stronglyagree 1
Agree 2 Disagree 3 Stronglydisagree 4
Mean Rank
No. % No. % No. % No. %
The scope of theproject isappropriate
10 30.30 15 45.45 7 21.21 1 3.03 1.97 1
The context of theproject is relevant tomy studies
8 24.24 17 51.52 5 15.15 3 9.09 2.09 2
The topic of theproject is relevant tomy studies
9 27.27 14 42.42 6 18.18 4 12.12 2.13 3
36 The Impact of Experiential Learning Programme … 397

students voiced out that they were being placed in companies that are more suitedfor students majoring in marketing and management.
Result from Table 36.4 indicates that more than 90% of the students agreed thatthey have developed first-hand experience; communication and collaborative skills;and problem-solving and critical analysis abilities during their fourteen (14)-weekgroup assignment with the companies. In addition, 79% of the students claimed thatthey have developed leadership skills through professional engagement.
This result strongly indicates that the experiential learning via the case studyproject has trained students with the necessary skills and competences to understandthe real-world business issues/situations according to the case studies that wereassigned to them. Students commented that working in a team from diverse aca-demic background gives them the opportunity to learn from each other and sharedifferent ideas/views. They highlighted that working together in solving the “real”business case studies involves a lot of discussion, cooperation and communication.And since differences in opinions do exist among team members, they are requiredto think and evaluate the case studies critically and at the same time they have tofulfil the clients’ requirement/demand. They also mentioned that they are able to
Table 36.4 Skills acquired
Stronglyagree1
Agree2
Disagree3
Stronglydisagree4
Mean Rank
No. % No. % No. % No. %
I have developedfirst-hand experienceof different aspects ofthe businessoperations
21 63.63 9 27.27 3 9.09 0 0 1.41 1
I have developedcommunication andcollaborative skillsthrough interpersonalinteractions andgroup discussions
18 54.55 14 42.42 1 3.030 0 0 1.5 2
I have developedproblem-solving andcritical analysisabilities throughexamination andevaluation of thebusiness issue
14 42.42 19 57.58 0 0 0 0 1.56 3
I have developedleadership skillsthroughself-reflection andprofessionalengagement
9 27.27 17 51.51 6 18.18 1 3.03 1.97 4
398 L.K. Lian
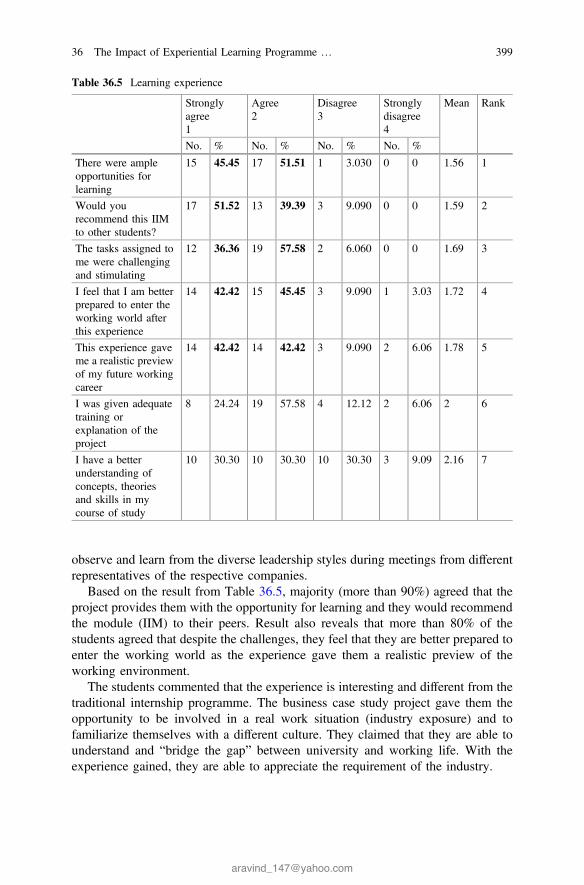
observe and learn from the diverse leadership styles during meetings from differentrepresentatives of the respective companies.
Based on the result from Table 36.5, majority (more than 90%) agreed that theproject provides them with the opportunity for learning and they would recommendthe module (IIM) to their peers. Result also reveals that more than 80% of thestudents agreed that despite the challenges, they feel that they are better prepared toenter the working world as the experience gave them a realistic preview of theworking environment.
The students commented that the experience is interesting and different from thetraditional internship programme. The business case study project gave them theopportunity to be involved in a real work situation (industry exposure) and tofamiliarize themselves with a different culture. They claimed that they are able tounderstand and “bridge the gap” between university and working life. With theexperience gained, they are able to appreciate the requirement of the industry.
Table 36.5 Learning experience
Stronglyagree1
Agree2
Disagree3
Stronglydisagree4
Mean Rank
No. % No. % No. % No. %
There were ampleopportunities forlearning
15 45.45 17 51.51 1 3.030 0 0 1.56 1
Would yourecommend this IIMto other students?
17 51.52 13 39.39 3 9.090 0 0 1.59 2
The tasks assigned tome were challengingand stimulating
12 36.36 19 57.58 2 6.060 0 0 1.69 3
I feel that I am betterprepared to enter theworking world afterthis experience
14 42.42 15 45.45 3 9.090 1 3.03 1.72 4
This experience gaveme a realistic previewof my future workingcareer
14 42.42 14 42.42 3 9.090 2 6.06 1.78 5
I was given adequatetraining orexplanation of theproject
8 24.24 19 57.58 4 12.12 2 6.06 2 6
I have a betterunderstanding ofconcepts, theoriesand skills in mycourse of study
10 30.30 10 30.30 10 30.30 3 9.09 2.16 7
36 The Impact of Experiential Learning Programme … 399

References
Ames, M. D. (2006). AACSB International’s advocacy of experiential learning and assurance oflearning. In Proceedings of the USABE/SBI 2006 Joint Conference. CD-ROM.
Andrew, M., Fleming, J., Ferkins, L., Wierma, C., & Coll, R. (2010). Facilitating and integratinglearning with sport studies cooperative education: Exploring the pedagogies employed bystudents, academics, and workplace. Journal of Hospitality, Leisure, Sport & Tourism, 9(1),24–38.
Benander, R. (2009). Experiential learning in the scholarship of teaching and learning. Journal ofthe Scholarship of Teaching and Learning, 9(2), 36–41.
Bohn, D., & Schmidt, S. (2008). Implementing experiential learning activities in a large enrollmentintroductory food science and human nutrition course. Journal of Food Science Education, 7,5–13.
Bower, G. G. (2014). Theory and practice: Utilizing Dewey’s experiential learning theory toimplement a 5 k road race. Journal of Hospitality, Leisure, Sport & Tourism Education, 15(2014), 61–67.
Bransford, J. D., Brown, A. L., & Cocking, R. R. (2000). How people learn: Brain, mindexperience, and school. Washington DC: National Academy Press.
Carter, R. M., Carter, L., & Johnson, D. P. (1986). Submergent shorelines in the SW Pacific:evidence for an episodic post-glacial transgression. Sedimentology, 33, 629–649.
Chilton, M. A. (2012). Technology in the classroom: Using video links to enable long distanceexperiential learning. Journal of Information Systems Education, 23(1), 51–62.
Cone, D., & Harris, S. (1996). Service learning practice: Developing a theoretical framework.Michigan Journal of Community Service Learning, 3, 31–43.
Conley, W. J. (2008). Play to learn. In R. L. Badget (Ed.) Ideas that work in college teaching.Albany, NY: State University of New York Press.
Densmore, K. (2000). Service learning and multicultural education: Suspect or transformative?In C. O’Grady (Ed.), integrating service learning and multicultural education in colleges anduniversities (pp. 45–58). Mahwah, NJ: Lawrence Erlbaum and Associates.
Devasagayam, R., Johns-Mastern, K., Mc Collum, J. (2012). Linking information literacy,experiential learning, and student characteristics: Pedagogical possibilities in businesseducation. Academy of Educational Leadership Journal, 16(4), 1–18.
Dewey, J. (1938). Experience and education. New York: Collier Books.Dorsey, B. (2001). Linking theories of service-learning and undergraduate geography education.
Journal of Geography, 100(3), 124–132.Flint, C. (2002). Introduction: For a pervasive political geography in the curriculum. Journal of
Geography, 101(2), 61–62.Gaumer, C. J., Cotleur, C. A., & Arnone, C. (2014). Use of client-based projects in business
education: A comparison of undergraduate and graduate pedagogy. The Coastal BusinessJournal, 11(1), 70–82.
Hawkins, D. E., & Weiss, B. L. (2004). Experiential education in graduate tourism studies: Aninternational consulting practicum. Journal of Teaching in Travel and Tourism, 4(3), 1–29.
Hoover, J. D. (1974). Experiential learning: Conceptualization and definition. In J. Kenderdine, B.Keys (Eds.), Simulation, games and experiential techniques: On the road to a new frontier(pp. 31–35).
Hoover, J. D., & Whitehead, C. J. (1975). An experiential cognitive methodology in the firstcourse in management: Some preliminary results. Simulation Games and ExperientialLearning in Action, 2 (Reprinted from B. Keys, Library 11th Ed.).
Hunter-Jones, P. (2012). The continuum of learner disengagement: ethnographic insights intoexperiential learning in marketing education. Journal of Marketing Education, 34(1), 19–29.
Kahne, J., Westheimer, J., & Rogers, B. (2000). Service learning and citizenship: Directions forresearch. Michigan Journal of Community Service Learning, 7, 42–51.
400 L.K. Lian

Kolb, A. Y. & Kolb, D. A. (2011). Experiential learning theory: A dynamic, holistic approach tomanagement learning, education and development. The Sage Handbook of ManagementLearning, Education and Development.
Kolb, D. & Fry, R. (1975). Towards an applied theory of experiential learning. In C. L. Copper(Ed.), Theories of group processes (pp. 33–58). London: Wiley.
Kolb, D. A. (1984). Experiential learning: Experience as the source of learning and development.New Jersey: Prentice-Hall.
Kolb, Y., Kolb, D. A., & Sharma, A. P. G. (2014). On becoming an experiential educator: Theeducator role profile. Simulation & Gamin, 45(2), 204–234.
Koponen, J., Pyörälä, E., & Isotalus, P. (2012). Comparing three experiential learning methods andtheir effect on medical students’ attitudes to learning communication skills Medical. Teacher,34(3), 198–207.
Robinson, R., Barron, P., & Solnet, D. (2008). Innovative approaches to event managementeducation in career development: A study of student experience. Journal of Hospitality,Leisure, Sport, & Tourism, 7(1), 4–17.
Ruhaneu, L. (2005). Bridging the divide between theory and practice. Experiential learningapproaches for tourism and hospitality management education. Journal of Teaching in Traveland Tourism, 5(4), 33–51.
Shapiro, N. S., & Levine, J. H. (1999). Creating learning communities: A practical guide towinning support, organizing for change and implementing programs. San Francisco, CA:Jossey-Bass.
Sharlanova, V. (2004). Experiential learning. Trakia Journal of Science, 2(4), 36–39.Simons, L., Fehr, L., Blank, N., Connell, H., Georganas, D., Fernandez, D., et al. (2012). Lessons
learned from experiential learning: What do students learn from a practicum/internship?International Journal of Teaching and Learning in Higher Education, 24(3), 325–334.
Slavich, G. M., & Zimbardo, P. G. (2012). Transformational teaching: Theoretical underpinnings,basic principles, and core methods. Educational Psychology Review, 24, 569–608.
Sommers, B. (1997). The freshman year experience and geography: Linking student retention andthe introductory geography curriculum. Journal of Geography, 96(3), 243–249.
Thompson, S., Bender, K., Cardoso, J., & Flynn, P. (2011). Experiential activities in familytherapy: Perceptions of care givers and youth. Journal of Child and Family Studies, 20(5),560–568.
Varlotta, L. (1996). Service-learning: A catalyst for constructing democratic progressivecommunities. Michigan Journal of Community Service Learning, 3, 22–30.
Walcott, S. (1999). Fieldwork in an urban setting: Structuring a human geography learningexercise. Journal of Geography, 98, 221–228.
Wolfe, D. E., & Byrne, E. T. (1975). Research on experiential learning: Enhancing the process.Business Games and Experiential Learning in Action, 2, 325–336.
Yardley, S., Teunissen, P. W., & Dornant, T. (2012). Experiential learning: Transforming theoryinto practice. Medical Teacher, 34, 161–164.
36 The Impact of Experiential Learning Programme … 401