Tang, Theresa Li-Na TITLE Pay Differentials Revisited: CEOs a
32
DOCUMENT RESUME ED 396 645 HE 029 275 AUTHOR Tang, Thomas Li-Ping; Tang, Theresa Li-Na TITLE Pay Differentials Revisited: CEOs and the Five Highest-Paid Employees at Private Colleges and Universities. PUB DATE Mar 96 NOTE 32p.; Paper presented at the Annual Meeting of the Southeastern Psychological Association (Norfolk, VA, March 1996). PUB TYPE Reports Research/Technical (143) Speeches/Conference Papers (150) EDRS PRICE MFOI/PCO2 Plus Postage. DESCRIPTORS *Administrators; *College Administration; College Faculty; *College Presidents; Comparative Analysis; Higher Education; Institutional Characteristics; Liberal Arts; *Private Colleges; Research Universities; *Salary Wage Differentials; *Teacher Salaries; Universities ABSTRACT This study compared the salary differentials of college chief executive officers (CEOs), college presidents, and the five highest-paid employees at 190 private colleges and universities. The pay differential in total compensation for CEOs and the highest-paid professor at liberal arts institution was significantly higher than that at doctorate-granting institutions, which in turn was higher than that at research institutions. The pattern of pay differentials was reversed for the highest-paid and second highest-paid employee at research institutions and at liberal arts institutions. Other differentials failed to reach significance across institutions. Implications concerning institutions' internal consistency and external competitiveness are discussed. (Contains 34 references.) (Author/MSE) *********************************************************************** Reproductions supplied by EDRS are the best that can be made from the original document. ***********************************************************************
-
Upload
khangminh22 -
Category
Documents
-
view
2 -
download
0
Transcript of Tang, Theresa Li-Na TITLE Pay Differentials Revisited: CEOs a

DOCUMENT RESUME
ED 396 645 HE 029 275
AUTHOR Tang, Thomas Li-Ping; Tang, Theresa Li-NaTITLE Pay Differentials Revisited: CEOs and the Five
Highest-Paid Employees at Private Colleges andUniversities.
PUB DATE Mar 96NOTE 32p.; Paper presented at the Annual Meeting of the
Southeastern Psychological Association (Norfolk, VA,March 1996).
PUB TYPE Reports Research/Technical (143)Speeches/Conference Papers (150)
EDRS PRICE MFOI/PCO2 Plus Postage.DESCRIPTORS *Administrators; *College Administration; College
Faculty; *College Presidents; Comparative Analysis;Higher Education; Institutional Characteristics;Liberal Arts; *Private Colleges; ResearchUniversities; *Salary Wage Differentials; *TeacherSalaries; Universities
ABSTRACTThis study compared the salary differentials of
college chief executive officers (CEOs), college presidents, and thefive highest-paid employees at 190 private colleges and universities.The pay differential in total compensation for CEOs and thehighest-paid professor at liberal arts institution was significantlyhigher than that at doctorate-granting institutions, which in turnwas higher than that at research institutions. The pattern of paydifferentials was reversed for the highest-paid and secondhighest-paid employee at research institutions and at liberal artsinstitutions. Other differentials failed to reach significance acrossinstitutions. Implications concerning institutions' internalconsistency and external competitiveness are discussed. (Contains 34references.) (Author/MSE)
***********************************************************************
Reproductions supplied by EDRS are the best that can be madefrom the original document.
***********************************************************************

Pay Differentials 1
Running head: PAY DIFFERENTIALS
Pay Differentials Revisited: CEOs and the Five Highest-Paid
Employees at Private Colleges and Universities
Thomas Li-Ping Tang
Middle Tennessee State University
Theresa Li-Na Tang
Tang International
Thomas Li-Ping Tang, Department of Management and Marketing,
College of Business, Middle Tennessee State University; Theresa Li-
Na Tang, Tang International.
We would like to thank Barbara Haskew, Dean, College of
Business, Middle Tennessee State University for her support and
Janet Chamblee, Melissa Hunsicker, and Kenneth R. Tillery for their
assistance.
Correspondence concerning thi:r. article should be addressed to
Thomas Li-Ping Tang, Box 516, Department of Management and
Marketing, College of Business, Middle Tennessee State University,
Murfreesboro, TN 37132.
BEST COPY AVAILABLE
Electronic mail may be sent via Internet
U S DEPARTMENT OF EDUCATION
EDUCATIONAL RESOURCES INFORMATIONCENTER (ERIC/his document has been reproduced as
received from the person or organizationOriginating it
Minor change:, have been made hiimpiove reproduction quality
Points of view or opinions staled in thisdocument d not necessarily representofficial OEFII position or
PERMISSION TO REPRODUCE ANDDISSEMINATE THIS MATERIAL
HAS BEEN GRANTED BY
Thomas Li-Ping Tang
TO THE EDUCATIONAL RESOURCESINFORMATION CENTER (ERIC)

Pay Differentials 2
Abstract
In this paper, we examined pay differentials of CEOs and the five
highest-paid employees at 190 private colleges and universities.
The pay differential of the total compensation for CEOs and the
highest-paid professor at Liberal-Arts Institutions (1.35) was
significantly higher than that at Doctorate-Granting I Institutions
(.92) which, in turn, was higher than that at Research Institutions
(.75). The pattern of pay differentials was reversed for the
highest-paid and the second highest-paid employee at Research
Institutions (1.23) and those at Liberal-Arts Institutions (1.13).
Other differentials failed to reach significance across different
institutions. Implications related to internal consistency and
external competitiveness were discussed.

Pay Differentials 3
Pay Differentials Revisited: CEOs and the Five Highest-Paid
Employees at Private Colleges and Universities
Pay and benefit figures related to athletes, entertainers, and
corporate executives have been widely publicized and available to
the public (e.g., Gomez-Mejia & Balkin, 1992a, 1992b; Howard &
Miller, 1993; Tosi & Gomez-Mejia, 1994). American people have
been fascinated and obsessed with other people's pay, chief
executive officers' (CEOs') pay in particular.
Recently, CEO pay at U.S. corporations and non-profit
organizations has created a round of headlines and has caught many
people's attention (Bongiorno & Hof, 1994; Business WeeX, 1993).
American CEOs are making more than ever (Crystal, 1990). Human
resource managers in our society are increasingly aware of the
importance of distributive and procedural justice, the pay-
performance link, and pay differentials (Cropanzano & Folger, 1991;
Greenberg, 1987; Milkovich & Newman, 1993; Tang, in press; Tang,
Tang, & Tang, 1996; Tang, Dozier, Tang, & Tang, 1996).
On the one hand, CEO pay has received more coverage than it
deserves because there are very few CEOs in the society and their
pay accounts for only a small share of corporations' total labor
costs. On the other hand, CEOs' pay is significantly higher than
that of an average worker. CEOs have a disproportionate ability to
influence organization performance (Haleblian & Finkelstein, 1993).
Moreover, CEOs pay can help set the tone or culture of the
organization (Lawler, 1981; Noe, Hollenbeck, Gerhart, & Wright,
1994).

Pay Differentials 4
Pay Differential
The present paper examines the pay differentials of CEOs and
the five highest-paid employees at 190 private colleges and
universities. Irrespective of job content or fqnction, the pay
differential is defined as the salary at one level divided by the
salary at the next lower level. In theory, pay differential, a
very important aspect of job evaluation, is a reflection of the
relative worth of these positions to the organization (Mahoney,
1979; Simon, 1957).
Pay differential is related to the different "jobs" within the
pay structure and should not be related to employees or "job
incumbents". That is, the focus is on the relative pay of these
positions. However, top-level executives' jobs are very unique in
an organization. Their special contributions to the organization
depend on their special knowledge, skills, and abilities.
Therefore, the pay of top-level jobs will be somewhat related to
these jobs and the job incumbents as individuals.
For people in the general public, it is also very common to
compare the pay of the CEO and that of an average worker in an
organization and examine a different pay differential (Tang,
Dozier, et al., 1996). We will discuss examples of pay
differentials later in this paper.
The compensation of the CEO, C, can be expressed as C = A b
where A is the salary for management trainees, b is the pay
differential between hierarchical levels, and L is the number of
levels in the organization (Mahoney, 1979). It has been r(- :Irted

Pay Differentials 5
that the ratios for the chief executives and the second highest
paid position were 1.37 to 1.41, whereas the ratios for the second
and the third position were 1.21 to 1.23 (Fox, 1974; Patton,
1951). Similar ratios have been reported by Mahoney (1979) using
Kuethe and Levenson's (1964) data (1.71 and 1.47), Mahoney (1979)
(1.56 and 1.37 for business students and 1.53 and 1.31 for
compensation administrators), Finkin (1979) (1.39 and 1.38), and
Jaques (1965) (1.33 for management and 1.25 for entry level).
Mahoney (1979) stated that these pay differential ratios vary
somewhat from one industry to another, but are reported to be
reasonably . consistent over time, indicative of customary
relationship which persist and which are reflective of industry
characteristics. In the present paper, pay differentials will be
examined.
The Matthew Effect. Gabris and Mitchell (1988) borrow a quote
from the Apostle Matthew in the Bible (Matthew 13: 12) and
suggested the Matthew Effect in compensation: "For to him who has
shall be given, and he shall have abundance; but from him who does
not have, even that which he has shall be taken away". According
to the Matthew Effect, merit increases are frequent and plentiful
for good performers. But, poor to average performers suffer
because money is taken from them to pay large merit increases to
the good performers" (Heneman, 1992, p. 55).
Recently, Tang (in press) examined pay differentials and
tested the Matthew Effect using Mahoney's (1979) hypothetical
organization chart with six positions. These six positions were
Pay Differentials 6
arranged with three echelons (levels). Further, people's attitudes
toward money as measured by the Money Ethic Scale (MES) (Tang,
1992, 1993, 1995; Tang & Gilbert, 1995; Tang & Kim, 1995) were
also examined. Tang (in press) found that men with high Money
Ethic endorsement allocated significantly more money to the highest
position and significantly less money to the lowest positions than
did those with low Money Ethic endorsement.
More specifically, the pay differential for the highest and
the lowest (third level) positions is 2.96 for men with high Money
Ethic and is 2.04 for men with low Money Ethic. Further, the pay
differential for the highest and the second level positions is 1.99
for the former group and is 1.64 for the latter group. However,
women's allocations of money were not affected by their endorsement
of the Money Ethic. Thus, men's allocation of position worth
supports the Matthew Effect.
CEO Pay at Private Colleges and Universities
Recently, salaries of the university CEOs (university
presidents) and the five highest-paid employees (professors) at 190
private colleges have been revealed in Chronicle of Higher
Education (Lederman, 1993a, 1993b; The Chronicle of Higher
EdUccatign, 1993b). Colleges and universities are non-profit
organizations. However, presidents are running universities that
are becoming more complex and increasingly business-oriented.
The Hiahest-Paid University CEOs and Professors
In 1991, Daniel L. Ritchie, Chancellor at the University of
Denver, was paid $1, whereas Joe B. Wyatt, chief executive of

Pay Differentials 7
Vanderbilt University was paid $395,725 (The Chronicle of Higher
Education, 1993b). These two people were the lowest and highest
paid CEOs in the survey. When benefits were combined in the data
analysis, John Silber, president of Boston University, topped the
list. John Silber's total compensation was $414,715, while Joe B.
Wyatt's was $410,916.
Average Professor's Pay. According to The Chronicle of Higher
Education (1993, April 14), the 1992-93 average nine-month pay for
full professor, associate professor, assistant professor, and
instructor at 1,900 .nstitutions in the U.S., excluding those in
medical schools (The Chronicle of Higher Education, 1993a). On the
basis of salary data related to full-time instructional staff at
Doctoral, Comprehensive, and Baccalaureate Institutions, we
"estimated" that the average nine-month salary for all professors
in the United States was about $43,182 a year (about $39,347, if we
include instructors).
CEOs' Pay in Business. According to Business Week (1993), the
pay for average workers, teachers, and engineers was $24,411,
$34,098, and $58,240, respectively. In 1992, the highest-paid CEO
was Thomas F. First, Jr., chairman and CEO of HCA-Hospital Corp. of
America who earned $127 million (Business Week, 1993). Using these
aforementioned average pay figures as the reference points, Mr.
First's total compensation was roughly 5,203 times the salary of
the average worker, 3.725 times the salary of the average teacher,
2,181 times the salary of the average engineer, and 2,779 time the
salary of the average professor.
Pay Differentials 8
Further, the highest-paid CEO in 1993 was Michael D. Eisner,
chairman of Walt Disney Co. He made $203,010,590. "It adds up to
more than a half-million dollars a day, everyday, for an entire
year. Or $78,081 an hour" (Bongiorno & Hof, 1994, P. 52).
On the basis of these data, if we use the average pay of
workers, teachers, engineers, and professors as reference points,
then, John Silber's pay is only 17 times that of the average
American worker,
of the average
12 times that of the average teacher, 7 times that
engineer, and 9.6 times that of the average
professor. These ratios are significant2y lower than that in
industry, 5,203 to 1. The ratio for the highest-paid CEO in a
Corporation (Thomas F. First, $127 million) and the highest-paid
CEO in a private university (John Silber, $414,715) is about 306 to
1. The ratio between Michael D. Eisner ($203,010,590) and John
Silber is about 490 to 1. The ratio between Michael D. Eisner and
the average professor is about 4,701 to 1.
The highest-paid individual, not a university CEO, in the
whole survey was Wayne Isom, a professor of cardiothoracic surgery
at Cornell University. Dr. Wayne Isom made $1,770,730 in pay and
benefits in the 1990-1991 academic year. It appears that Dr.
Isom's pay was 2,2 times the pay of the average worker, times the
pay of the average teacher, 2D. times the pay of the average
engineer, and Al times the pay of the average professor. In fact,
there were six professors, all in the medical profession, who made
more than $1 million in 1991. Further, for the highest-paid CEO in
ilk Corporation (Thomas F. First) and the highest-paid professor in

Pay Differentials 9
private university (Dr. Wayne Isom), the pay ratio is about 71 to
1. The ratio between Michael D. Eisner and Dr. Wayne Isom is about
115 to 1. (Please notice that some of comparisons may not be fair
because the salary data were collected in different years.)
The Present Study
The present study will examine more closely the pay, benefits,
and the total compensation (pay and benefits combined) of
university presidents and the five highest-paid professors at 190
private colleges. The pay differentials of the university CEO and
the five highest-paid employees will be examined also.
It should be pointed out that the pay differentials examined
in the present study are different from those examined in the
literature. That is, the CEOs and the five highest-paid employees
investigated in this study do not have the identical supervisor-
subordinate relationship across all different universities. The
highest-paid employee can be a vice president of academic affairs
who works under the supervision of the university president, or a
professor of cardiothoracic surgery who do not work directly under
the university CEO. We will try to answer the following questions:
How much is CEOs' pay at private colleges and universities? Are
there differences among Research, Doctorate-Granting I, and
Liberal-Nrts Institutions? How is CEO pay related to the highest-
paid professors (pay differential) in these institutions?
Types of Institutions
In industry, the size of the organization, ability to pay, and
type of adustry are associated with CEO pay. It has been shown in

Pay Differentials 10
the literature that "labor-intensive industries, such as education
and services, tend to be lower paying than are industries whose
technologies are less labor-intensive, such as petroleum and
pharmaceuticals" (Milkovich & Newman, 1993, P. 207). Further,
large organizations tend to pay more than small ones (Milkovich &
Newman, 1993).
In this investigation, three types of educational institutions
will be examined according to the Carnegie Foundation for the
Advancement of Teaching: Research Institutions, Doctorate-Granting
I Institutions, and Liberal-Arts Institutions. Tang et al. (1996)
found that university expenditures (one of the many proxies to
measure the "size" of the university operations) at Research
Institutions ($716.5 million) are significantly higher than that at
Doctorate-Granting I Institutions ($190.1 million) which, in turn,
are significantly higher than that at Liberal-Arts Institutions
($35.2 million). Research Institutions tend to have higher SAT
scores for incoming freshman students than other types of
universities (Tang et al., 1996). Thus, they may have higher
abilities to attract and retain star professors and students than
other universities.
Moreover, those with larger expenditures will be able to pay
more than those with smaller ones (i.e., ability to pay). Market
factors probably are the driving force for the possible
compensation differences among these different types of
institutions. Very high salaries have been paid to highly skilled
.11

Pay Differentials 11
cardiologists and CEOs in major research institutions (The
Chronicle of _Higher Education, 1993b; Lederman, 1993a, 1993b).
Faculty of Liberal-Arts Institutions may come from fields
which have a much higher supply than the demand for their services.
Therefore, without large science and professional programs such as
medical school, law school, business school, etc., Liberal-Arts
Institutions are staffed by more professors of English, history,
and social sciences than is the case in large Research
Institutions.
Thus, Research Institutions, Doctorate-Granting
Institutions, and Liberal-Arts Institutions may be considered
different "industries" within the educational systems of higher
education. Due to these differences, Research Institutions will be
able to attract and retain star performers, whereas Liberal-Arts
Institution will not. Due to star performers at major researdh
institutions, it is expected that the pay differentials at Research
Institutions will be different from that at Liberal-Arts
Institutions (e.g., industry differences). This will be true only
when the "highest-paid employee" (Level 2) is involved in the
calculation of two pay differentials: Level 1/Level 2 and Level
2/Level 3 (i.e., L1/L2 and L2/L3).
Hypothesis 1: The pay differentials (L1/L2 and L2/L3) at
Research Institutions will be different from that at Liberal-
Arts Institutions.
12

Pay Differentials 12
Method
Compensation Data
Research data of the present study were obtained from The
Chronicle of Higher Education (1993b) which collected information
from a tax document known as Form 990, submitted to the Internal
Revenue Service each year by all private non-profit institutions,
i.e., every private institution classified as Research I and II,
Doctorate-Granting I, and Liberal-Arts I by the Carnegie Foundation
for the Advancement of Teaching. This tax document does not always
provide a complete accounting of what university president and
officials earn, but it is the best measure available to the public.
Pay Data. The following data were presented in that report:
1991-92 expenditures, pay and benefits of CEO (labeled es Ll, Level
1, in the present study) and five highest-paid employees (labeled
as L2, L3, L4, L5, and L6). In this study, "pay" is defined as all
salaries, fees, bonuses, and severance payments that each person
received, whereas "benefits" include all welfare benefit programs,
such as health and pension plans. Total compensation consists of
pay and benefits.
pay Differentialg. Further, the pay differentials of pay,
benefits, and the total compensation were examined. In order to
present the calculations clearly, the following symbols were used:
the pay differential Ll/L2 represented that CEOls pay (L1) was
divided by that of the highest-paid employee (L2). Similar
calculations were done concerning their benefits and total
compensation.

Pay Differentials 13
Types of Institutions. There were 33 Research Institutions,
20 Doctorate-Granting I Institutions, and 137 Liberal-Arts
Institutions in this study. The three types of institutions were
used as the major classification variable in separate one-way
analyses of variance (ANOVAs).
Results
Pay Data Among Types of Institutions
University CEOs. University CEOs' pay differences among
Research Institutions, Doctorate-Granting I Institutions, and
Liberal-Arts Institutions were examined using one-way analysis of
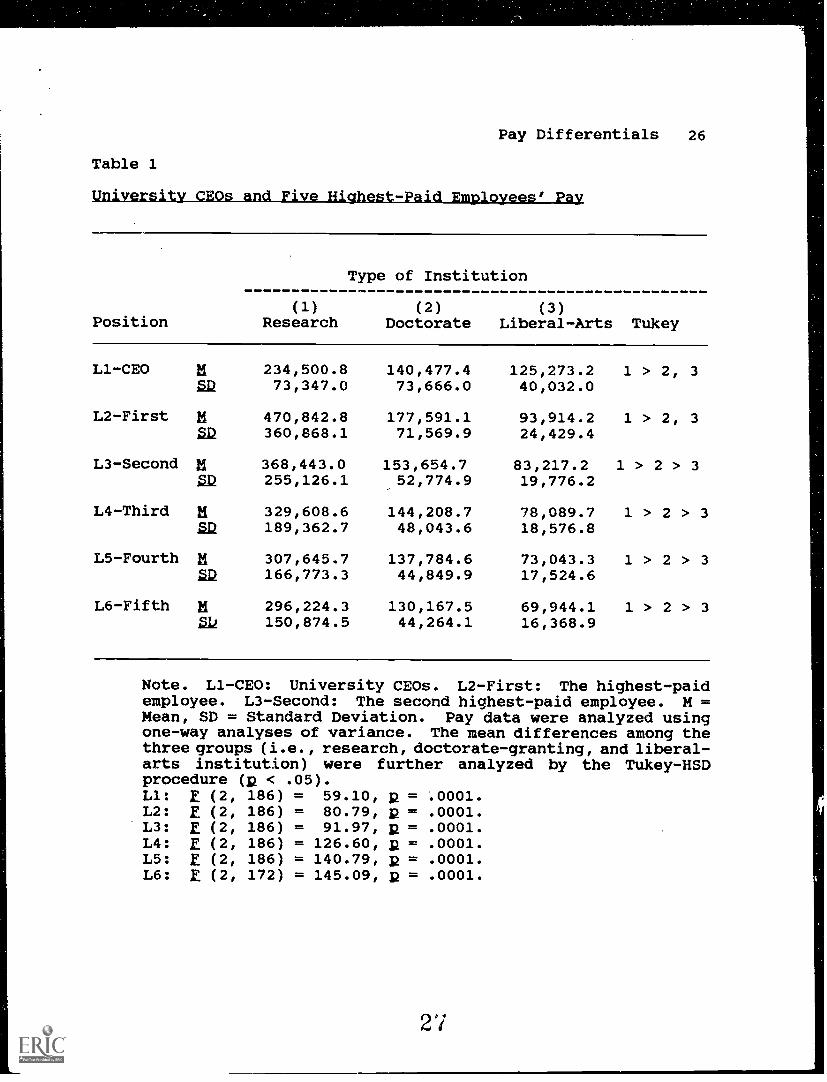
variance (ANOVA). Table 1 shows that the differences among
Research, Doctorate-Granting I, and Liberal-Arts Institutions were
significant (E (2, 186) = 59.10, 11 = .0002). According to the
Tukey-HSD procedure, the average pay of university CEOs at Research
Institutions ($234,500.8) was significantly higher than those at
Doctorate-Granting I Institutions ($140,477.4) and Liberal-Arts
Institutions ($125,273.2) (ps < .05). No significant difference
was found between the Doctorate and Liberal-Arts Institutions.
Insert Tables 1, 2, and 3 about here
Table 2 shows the results concerning the differences on
benefits. University CEOs at Research Institutions were paid
significantly more ($42,553.6) than those at Doctorate-Granting I
Institutions ($14,854.2) and Liberal-Arts Institutions ($19,994.8).
When pay.and benefits were combined (Table 3), again the same
14

Pay Differentials 14
pattern of results was found: CEOs at Research Institutions were
paid more ($277,054.4) than those at Doctorate-Granting I
Institutions ($162,725.1) and Liberal-Arts Institutions
($144,911.3).
The Highest-Paid Employees. When the five highest-paid
employees at these 190 private colleges were examined, basically
the same pattern of results was found. Thus, CEOs and the five
highest-paid employees at Research Institutions have earned more
money than their counterparts.
Fay Differentials
The main purpose of %Ile present study was to examine the pay
differentials between two adjacent job levels. Pay, benefits, and
the total compensation of university CEOs were compared with those
of the highest-paid employees at these 190 colleges. Results are
presented in Tables 4, 5, and 6.
CEO and the Highest-Paid Employee (L1/L2)
Pay. The results of one-way ANOVAs show that the pay
differential for CEOs and the highest-paid employee across three
types of institutions reached significance (E (2, 185) = 53.87, p
= .0001). Due to the star performers at major Research
Institutions, the average CEOs' pay was only 73 percent of the
highest-paid employees (Ll/L2 = .73). That is, the university
presidents made a lot less than the star performers in their own
organizations. At Doctorate-Granting I Institutions, the pay
differential of these two positions was .88 which was similar to
that of Research Institutions (.73). However, at Liberal-Arts
lb

Pay Differentials 15
Institutions the average CEO's pay was much higher than the
highest-paid employees. The pay differential was 1.35. Thus, pay
differential at Liberal-Arts Institutions was significantly better
than that at Research Institutions and Doctorate-Granting I
Institutions (Tukey-HSD procedure, Rs < .05). Hypothesis 1 was
supported.
Denefits. For benefits, no significant differences among
Research, Doctorate, and Liberal-Arts Institutions were found
(Table 5). Thus, Hypothesis 1 was not supported.
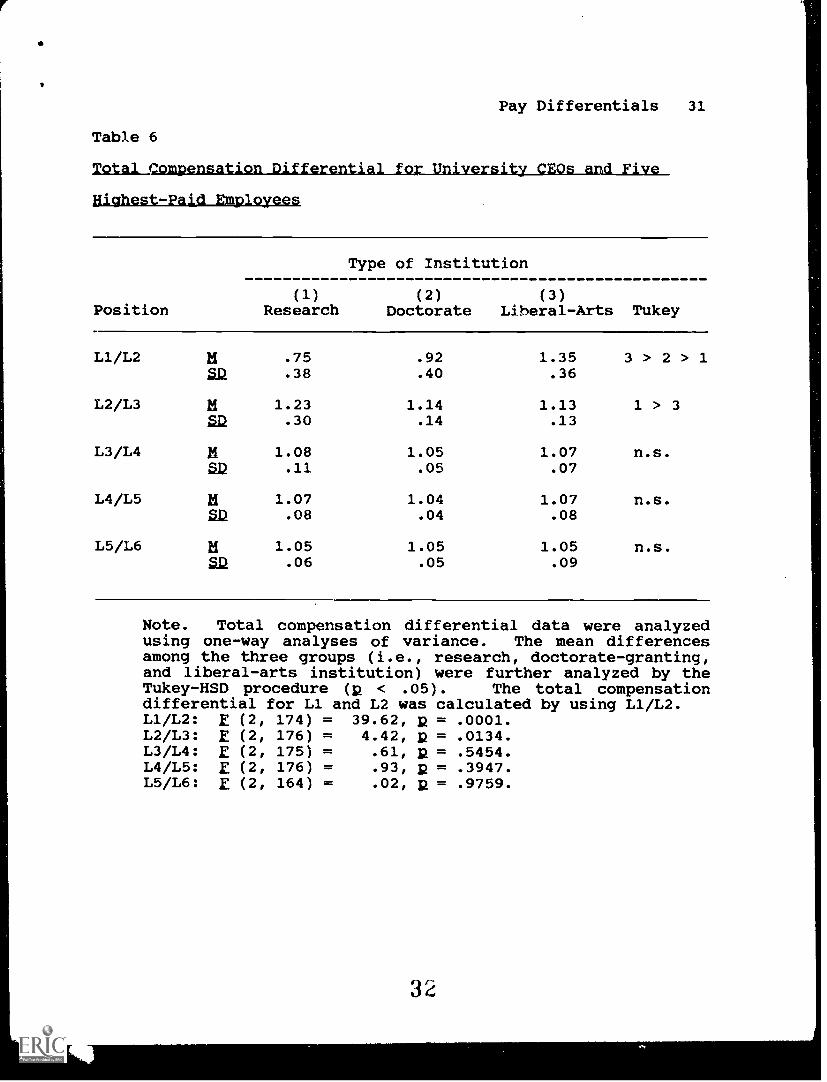
Total Compensation. When pay and benefits were combined, the
total compensation differential for CEOs and the highest-paid
professor at Liberal-Arts Institutions (1.35) was much higher than
that at Doctorate-Granting I Institutions (.92) which, in turn, was
higher than that at Research Institutions (.75) (please see Table
6). Hypothesis 1 was supported.
Insert Tables 4, 5, and 6 about here
*. f 3to --
The pay differentials of pay (Table 4) and total compensation
(i.e., pay and benefits combined) (Table 6) between the highest-
paid professor (L2) and the second highest-paid professor (L3)
showed that the ratio at Research Institutions was significantly
higher than that at Liberal-Arts Institutions. The pattern of our
results for L2/L3 was the opposite of that for L1/L2. Hypothesis
1 was supported. No differences among the three types of
16

Pay Differentials 16
institutions were found for benefits. Hypothesis 1 was not
supported for benefits data.
Other Pay Differentials
Further, three additional differentials (i.e., L3/L4, L4/L5,
and L5/L6) were calculated for pay, benefits, and total
compensation. The pay differentials among Research, Doctorate-
Granting, and Liberal-Arts Institutions failed to reach
significance (see Tables 4, 5, and 6).
Discussion
The present paper examines the pay differentials of pay,
benefits, and total compensation of CEOs and the five highest-paid
employees in 190 private colleges and universities. The results
show that the pay differentials of pay and total compensation for
the university CEOs and the highest-paid employees (Ll/L2) and for
the highest-paid and the second highest-paid employees (L2/L3) were
different among Research, Doctorate-Granting I, and Liberal-Arts
Institutions. CEOs at Liberal-Arts Institutions are paid less than
their counterparts in terms of their "absolute" amount cf pay,
benefits, and overall compensation. However, for these CEOs, their
pay and total compensation are higher than the highest-paid
professors in their own institutions. On the other hand, at major
Research Institutions, university presidents actually make less
money than their star professors.
When the highest-paid professors and the second highest-paid
professors are examined, it is clear that the pay and total
compensation differentials (L2/L3) at Research Institutions are

Pay Differentials 17
higher than that at Liberal-Arts Institutions. When differentials
for lower pay levels are examined (L3/L4, L4/L5, and L5/L6), these
differentials fail to reach significance. Therefore, pay
differentials are about the same across different universities.
It is also interesting to know that the benefit differentials
across these institutions are all about the same. Therefore, our
data seem to support the common belief that compensation
administrators and employees tend to pay more attention to "actual
pay" and less to "benefits" in an organization. It should be
pointed out that the different levels examined in the present paper
do not represent the same direct supervisor-subordinate
relationship across all different universities and colleges.
The pay differentials presented in the present study are
similar to those presented in the literature (e.g., Fox, 1974;
Kuethe & Levenson, 1964; Mahoney, 1979). Therefore, it appears
that there is some consistency over time. It has been suggested
that these pay differential ratios vary somewhat from one industry
to another, but are reported to be reasonably consistent over time,
indicative of customary relationship which persist and which are
reflective of industry characteristics (Mahoney, 1979).
In this study, we examined only 190 selected private colleges.
Future research may focus on the consistency of these pay
differentials across different types of institutions over time and
on the possible differences in pay differentials between private
colleges and public colleges.
18

Pay Differentials 18
At Liberal-Arts Institutions, CEOs may feel that their pay is
not as competitive as those at Research and Doctorate-Granting I
Institutions. The pay differences are related to external
competitiveness and are due to different industry that they are in.
However, "relatively" speaking, CEOs in Liberal-Arts
Institutions have made more money than the highest-paid employees
in their own organizations. From CEOs' perspectives, those at
Liberal-Arts Institutions may find fair "internal consistency" or
"equity" in their organizations than their counterparts at Research
and Doctorate-Granting I Institutions. In a sense, CEOs at
Liberal-Arts Institutions are the biggest fish in a small pond.
It is reasonable to expect that CEOs at Research and
Doctorate-Granting I Institutions may feel that they are underpaid
due to the lack of "internal consistency" in their organizations.
They are "not" the biggest fish in a large pond. On the other
hand, CEOs at Liberal-Arts Institutions may also feel that they are
underpaid because their absolute pay is lower than CEOs at Research
and Doctorate-Granting I Institutions. Their focus may be on
"external competitiveness" of pay.
University expenditures and type of institution are somewhat
related to each other. Major Research Institutions have higher
expenditures and better reputation rankings than other institutions
(Tang et al., 1996). Large Research Institutions probably will be
able to attract scarce resources, such as research grants, private
donations, research talents, and probably excellent students.
9

Pay Differentials 19
With great expenditures, universities may expand and acquire
research space, support, and talents which may further enhance the
reputation of the university in the academic and scientific market
and the community. University expenditures, reputation, and type
of institution are signs of power, control, and authority.
Obviously, for those university CEOs who possess power, control,
and authority, they will be able to demand a higher level of
compensaticl than those who do not.
American university CE0s1 pay is relatively reasonable
compared to those in large corporations. It has been pointed out
that for many nonprofit officials, such as university CEOs, big
paychecks are not only deserved but necessary in order to compete
for talent with private employers in recent years.
We strongly agree with Stephen Joel Trachtenberg, CEO of
George Washington University who made $304,988 in the survey, that
university CEOs are underpaid. Their pay is far less than they
could earn in the private business sector. However, considering
the overall picture of pay in higher education, we think that CEO
pay at private universities is appropriate and fair.
Many CEOs, trustees, and academic consultants agree that
university CEOs spend more time than most corporate CEOs in
contending with such tough issues as shared governance and
competing constituencies. The operations are becoming increasingly
business-oriented and complex, yet still non-profit.
Recently, many organizations have been involved in downsizing
which creates an egalitarian structure with fewer organizational

Pay Differentials 20
levels and smaller pay differentials between adjacent levels and
between the highest CEO and lowest paid workers. For universities
and colleges in the United States, downsizing has already affected
many campuses. Employees' perception of pay fairness may be better
in a flat organizational structure (few levels) than that in a tall
structure (many hierarchical levels). However, egalitarian
structures .are more susceptible to pay compression which may lead
to low morale and high turnover.
On the other hand, healthy pay differentials within an
organization will motivate employees to stay with the organization,
increase their experience and training, and seek greater
responsibility. For many managers and employees who value money,
the big payoff at the top of the organization may serve as a goal
or motivator. Therefore, we need to find a balance concerning pay
differentials.
Gomez-Mejia and Balkin (1992b) pointed out using agency
theory, that by far, number of "job moves" produces the largest
monetary gains. Moreover, the financial returns yielded by job
moves tend to be greater for professors with exceptional scholarly
records, i.e., top-tier publications. However, it pays for faculty
members to move regardless of the quality of their publications.
It appears that only those with the best credentials will be
able to have good job moves in order to increase their pay and to
become CEOs. Moreover, only CEOs who move to the top Research
Institutions will reach their top pay in private universities and
colleges. However, it is realized that moving from one type of
21

Pay Differentials 21
institution to another is sometimes very difficult. Different
types of credentials are required at major Research Institutions.
It is also interesting to know in the field of higher
education, the star professors in Research Institutions are making
more money than the university president. Therefore, it is not
necessary to become the CEO of the institution in order to make the
most money in an academic setting. A big fish that changes from a
small pond to a large pond may enjoy its growth and become the
biggest one.
Tang (1992) stated that our own attitudes toward money can be
perceived as our "frame of reference" in which we examine our
everyday life. Our perception of pay equity and pay fairness
depends on our "frame of reference" and the type of comparisons.
The meaning of money is in the eye of the beholder. There is no
exception when we consider the fairness of CEO pay.
2 2

Pay Differentials 22
References
Bongiorno, L., & Hof, R. D. (1994). That eye-popping
executive pay. business Week, April 25, 52-54.
business Week. (1993). Executive pay: The party ain't over
yet. April, 26, 56-79.
The Chronicle of Higher Education. (1993a). Average faculty
salaries at 1,900 institutions. April 14, A23.
The Chronicle of Higher Education. (1993b). Pay and benefits
of leaders at 190 private colleges and universities: A survey.
May 5, A17-A24.
Cropanzano, R., & Folger, R. (1991). Procedural justice and
worker motivation. In R. M. Steers, & L. W. Porter (Eds.).
Motivation and work behavior, New York: McGraw-Hill.
Crystal, G. S. (1990). The great CEO pay sweepstakes.
Fortune, June 18, 94-96.
Finkin, E. F. (1978, July). How to figure our executive
compensation. personnel Journal, 52, 371-375.
Fox, H. (1974). Top executive compensation. New York:
National Industrial Conference Board.
Gabris, G. T., & Mitchell, K. (1988). The impact of merit
raise scores on employee attitudes: The Matthew Effect of
performance appraisal. public Personnel Manaaement, 12, 369-382.
Gerhart, B., & Milkovich, G. T. (1992). Employee
compensation: Research and practice. In Handbook of Industrial
and Organizational Psycholoav, vol. 3, (2nd ed.). M. D. Dunnette
23
Pay Differentials 23
& L. M. Hough (Eds.). Palo Alto, CA: Consulting Psychologists
Press.
Gomez-Mejia, L. R., & Balkin, D. B. (1992a). Compensation,
organizational strategy, and firm performance. Cincinnati, OH:
South-Western Publishing Co.
Gomez-Mejia, L. R., & Balkin, D. B. (1992b). Determinants of
faculty pay: An agency theory perspective. Academy of Management
Journal, 25, 921-955.
Greenberg, J. (1987). Reactions to procedural injustice in
payment distributions: Do the means justify the ends? Journal of
Applied Psycholoay, 72., 55-61.
Haleblian, J., & Finkelstein, S. (1993). Top management team
size, CEO dominance, and firm performance: The moderating roles of
environmental turbulence and discretion. Academy of Management
Journal, 11, 844-863.
Heneman, R. L. (1992). Merit pay: Linking pay increases to
performance ratings. Reading, MA: Addison-Wesley.
Howard, L. W., & Miller, J. L. (1993). Fair pay for fair
play: Estimating pay equity in professional baseball with data
envelopment analysis. Academy of Management Journal, 882-894.
Jaques, E. (1965). Preliminary sketch of a general structure
of executive strata. In W. Brown & E. Jaques (Eds.). Glacier
project papers. London: Heinemann.
Kuethe, J. L., & Levenson, B. (1964). Conceptions of
organizational worth. ZSNerican Journal of Sociology, 22, 342-348.
2 4

Pay Differentials 24
Lawler, E. E. (1981). pay and organizational development.
Reading, MA: Addison-Wesley.
Lederman, D. (1993a). Survey reveals salaries of executives
and highest-paid staff members at 190 colleges. The Chronicle of
Higher Education, May 5, A13-A15.
Lederman, D. (1993b). What's fair compensation for a
university chief? Opinions differ. The Chronicle of Higher
Education, May 5, A13-A16.
Mahoney, T. A. (1979). Organizational hierarchy and position
worth. In T. A. Mahoney (Ed.). Compensation and reward
perspectives. Homewood, IL: Irwin.
Milkovich, G., T., & Newman, J. M. (1993).
(4th ed.). Homewood, IL: Irwin.
Noe, R. A., Hollenbeck, J. R., Gerhart, B., &
(1994). Human resource management: Gaining
advantage. Burr Ridge, IL: Irwin.
Patton, A. (1951). Current practices
compensation. Harvard Business Review, 22, 56-64.
Tang, T. L. P. (1992). The meaning of money revisited.
journal of Organizational Behavior, la, 197-202.
Tang, T. L. P. (1993). The meaning of money: Extension and
exploration of the Money Ethic Scale in a sample of university
students in Taiwan. asaarIaLsaf_Qmaniziktignalliehamisar 14, 93-99
Tang, T. L. P. (1995). The development of a short Money
Ethic Scale: Attitudes toward money and pay satisfaction
rev.lited. personality and Indlvidual pifference0, 12, 809-817.
Compensation
Wright, P. M.
a competitive
in executive
2b

Pay Differentials 25
Tang, T. L. P. (in press). Pay differentials as a function
of rater's sex, money ethic, and job incumbent's sex: A test of
the Matthew Effect. Journal of Economic Psvcholoay.
Tang, T. L. P., & Gilbert, P. R. (1995). Attitudes toward
money as related to intrinsic and extrinsic job satisfaction,
stress, and work-related attitudes. personality and Individual
Differences, 12, 327-332.
Tang, T. L. P., & Kim, J. K. (1995, November). Thg
geasurement and dimensionality of the Money Ethic Scale. Paper
presented at the 26th Annual Meeting of the Decision Sciences
Institute, Boston, MA.
Tang, T. L. P., Dozier, T. S., Tang, C. S. Y., & Tang, D. S.
H. (1996). CEO pay, pay differentials, and pay-performance
/inkage. Paper submitted for publication.
Tang, T. L. P., Tang, C. S. Y., & Tang, D. S. H. (1996). Mg
fill - f f -
related to reputation ranking? Paper submitted for publication.
Tosi, H. L., & Gomez-Mejia, L. R. (1994). CEO compensation
monitoring and firm performance. Academy of Management Journal,
22, 1002-1016.
26
Pay Differentials 26
Table 1
University CEOs and Five Highest-Paid Employees' Pay
Position
Type of Institution
(1) (2) (3)Research Doctorate Liberal-Arts Tukey
Ll-CEO M 234,500.8 140,477.4 125,273.2 1 > 2, 3
ZD 73,347.0 73,666.0 40,032.0
L2-First M 470,842.8 177,591.1 93,914.2 1 > 2, 3
Z.12 360,868.1 71,569.9 24,429.4
L3-Second M 368,443.0 153,654.7 83,217.2 1 > 2 > 3
2.12 255,126.1 52,774.9 19,776.2
L4-Third M 329,608.6 144,208.7 78,089.7 1 > 2 > 35.12 189,362.7 48,043.6 18,576.8
L5-Fourth M 307,645.7 137,784.6 73,043.3 1 > 2 > 3212 166,773.3 44,849.9 17,524.6
L6-Fifth M 296,224.3 130,167.5 69,944.1 1 > 2 > 35.12 150,874.5 44,264.1 16,368.9
Note. Ll-CEO: University CEOs. L2-First: The highest-paidemployee. L3-Second: The second highest-paid employee. M =Mean, SD = Standard Deviation. Pay data were analyzed usingone-way analyses of variance. The mean differences among thethree groups (i.e., research, doctorate-granting, and liberal-arts institution) were further analyzed by the Tukey-HSDprocedure (p < .05).Ll: E (2, 186) = 59.10, R = .0001.L2: f (2, 186) = 80.79, R = .0001.L3: E (2, 186) = 91.97, 12 = .0001.L4: E (2, 186) = 126.60, p = .0001.L5: E (2, 186) = 140.79, R = .0001.L6: E (2, 172) = 145.09, R = .0001.
27

Pay Differentials 27
Table 2
University CEOs and Five Highest-Paid Employees' Benefits
Position
Type of Institution
(1) (2) (3)Research Doctorate Liberal-Arts Tukey
Ll-CEO if 42,553.6 14,854.2 19,004.8 1 > 2, 3
BD 33,972.6 11,249.7 16,616.4
L2-First M 33,205.7 17,677.0 13,383.9 1 > 2, 3
Z.L2 24,350.4 9,949.6 7,592.1
L3-Second M 31,279.4 15,461.8 12,017.7 1 > 2, 3
.512 17,239.1 7,963.5 6,732.5
L4-Third M 32,349.0 16,431.3 11,593.1 1 > 2, 3
ZD 18,901.4 8,835.3 6,409.4
L5-Fourth M 28,931.3 14,637.9 11,038.0 1 > 2, 3
16,812.0 9,723.5 6,261.3
L6-Fifth M 28,262.8 13,723.2 11,715.1 1 > 2, 3
alq 15,161.0 7,731.9 14,670.3
Note. Benefits data were analyzed using one-way analyses ofvariance. The mean differences among the three groups (i.e.,research, doctorate-granting, and liberal-arts institution)were further analyzed by the Tukey-HSD procedure (2 < .05).Ll: E (2, 177) = 18.74, la = .0001.L2: E (2, 177) = 32.40, p = .0001.L3: E (2, 176) = 52.15, R = .0001.L4: E (2, 176) = 55.15, p = .0001.L5: E (2, 177) = 47.03, R = .0001.L6: f (2, 166) = 17.24, p = .0001.
2 8

Pay Differentials 28
Table 3
University CEOs and Five Highest-Paid Employees' Total Compensation
Position
Type of Institution
(1) (2) (3)Research Doctorate Liberal-Arts Tukey
Ll-CEO M 277,054.4 162,725.1 144,911.3 1 > 2, 3.0 81,621.0 76,017.1 49,452.6
L2-First M 504,048.4 195,268.1 108,432.0 1 > 2, 3aD 363,242.1 76,625.8 28,914.3
L3-Second M 399,722.4 169,116.5 96,531.6 1 > 2 > 3.0 251,268.9 57,041.3 23,532.6
L4-Third M 361,957.6 164,282.6 90,858.1 1 > 2 > 3Zig 186,347.0 50,535.7 22,254.0
L5-Fourth M 336,577.0 152,422.5 85,098.1 1 > 2 > 3ZD 165,450.4 48,000.3 21,280.7
L6-Fifth M 324,487.1 143,890.6 82,320.7 1 > 2 > 3aD 149,826.1 48,661.2 24,231.8
Note. Total compensation data were analyzed using one-wayanalyses of variance. The mean differences among the threegroups (i.e., research, doctorate-granting, and liberal-artsinstitution) were further analyzed by the Tukey-HSD procedure
< .05).Ll: E (2, 177) = 63.71, p = .0001.L2: E (2, 177) = 81.74, R = .0001.L3: 21 (2, 176) = 98.40, p = .0001.L4: f (2, 176) = 139.28, R = .0001.L5: E (2, 177) = 150.47, p = .0001.L6: E (2, 166) = 151.99, R = .0001.
29

Pay Differentials 29
Table 4
pay Differential for University CEOs and Five Highest-Paid
=RIM=
Position
Type of Institution
(1)Research
(2)Doctorate
(3)Liberal-Arts Tukey
Ll/L2 .73 .88 1.35 3 > 1, 2
.38 .45 .31
L2/L3 1.25 1.14 1.13 1 > 35.12 .34 .15 .13
L3/L4 M 1.09 1.06 1.07 n.s.512 .11 .06 .06
L4/L5 M 1.06 1.05 1.07 n.s.SD .08 .04 .07
L5/L6 M 1.05 1.05 1.05 n.s.5.D .05 .05 .06
Note. Pay differential data were analyzed using one-wayanalyses of variance. The mean differences among the threegroups (i.e., research, doctorate-granting, and liberal-artsinstitution) were further analyzed by the Tukey-HSD procedure(R < .05). The pay differential for Ll and L2 was calculatedby using L1/L2.L1/L2: E (2, 185) = 53.87, R = .0001.L2/L3: E (2, 186) = 5.76, 2 = .0037.L3/L4: f (2, 186) = 1.15, = .3181.L4/L5: f (2, 186) = 1.31, R = .2725.L5/L6: E (2, 172) = .02, p = .9799.

Pay Differentials 30.
Table 5
Benefits Differential for University CEOs and Five Highest-Paid_
Bmployees
Position
Type of Institution
(1)Research
(2)Doctorate
(3)Liberal-Arts Tukey
Ll/L2 1.95 .91 1.50 n.s.Z.12 3.26 .57 1.56
L2/L3 1.01 1.14 1.12 n.s.ZD .35 .31 .29
L3/L4 .99 1.04 1.04 n.s.Z2 .17 .31 .24
L4/L5 1.50 1.09 1.10 n.s.5.12 2.41 .35 .47
L5/L6 1.16 1.04 1.10 ns.ED .80 .33 .38
Note. Benefits differential data were analyzed using one-wayanalyses of variance. The mean differences among the threegroups (i.e., research, doctorate-granting, and liberal-artsinstitution) were further analyzed by the Tukey-HSD procedure(2 < .05). The benefits differential for Ll and L2 wascalculated by using Ll/L2.Ll/L2: E (2, 172) = 1.76, p = .1749.L2/L3: E (2, 174) = 2.09, p = .1273.L3/L4: E (2, 172) = .67, p = .5135.L4/L5: E (2, 174) = 1.75, 2 = .1777.L5/L6: E (2, 164) = .39, p = .6770.
31
Pay Differentials 31
Table 6
Total Q2mpensation Differential for University CEOs and Five
Highest-Paid Employees
Position
Type of Institution
(1) (2) (3)Research Doctorate Liberal-Arts Tukey
L1/L2 M .75 .92 1.35 3 > 2 > 152 .38 .40 .36
L2/L3 M 1.23 1.14 1.13 1 > 3512 .30 .14 .13
L3/L4 M 1.08 1.05 1.07 n.s.512 .11 .05 .07
L4/L5 M 1.07 1.04 1.07 n.s.Zi2 .08 .04 .08
L5/L6 M 1.05 1.05 1.05 n.s..12 .06 .05 .09
Note. Total compensation differential data were analyzedusing one-way analyses of variance. The mean differencesamong the three groups (i.e., research, doctorate-granting,and liberal-arts institution) were further analyzed by theTukey-HSD procedure (R < .05). The total compensationdifferential for Ll and L2 was calculated by using L1/L2.L1/L2: E (2, 174) = 39.62, R = .0001.L2/L3: E (2, 176) = 4.42, R = .0134.L3/L4: E (2, 175) = .61, R = .5454.L4/L5: f (2, 176) = .93, p = .3947.L5/L6: E (2, 164) = .02, R = .9759.
32