Shrinking of Cluster Ellipticals: a Tidal Stripping explanation and Implications for the...
15
arXiv:astro-ph/0602019v1 1 Feb 2006 Shrinking of Cluster Ellipticals: a Tidal Stripping explanation and Implications for the Intra-Cluster Light. Shrinking of Cluster Ellipticals Eduardo S. Cypriano Southern Astrophysics Research Telescope, Casilla 603, La Serena, Chile and Laborat´ orio Nacional de Astrof´ ısica, CP 21, 37500-000 Itajub´ a - MG, Brazil [email protected] Laerte Sodr´ e Jr. Departamento de Astronomia, Instituto de Astronomia, Geof´ ısica e Ciˆ encias Atmosf´ ericas da USP, Rua do Mat˜ ao 1226, Cidade Universit´ aria, 05508-090, S˜ ao Paulo, Brazil [email protected] Luis E. Campusano 1 Observatorio Astron´ omico Cerro Cal´ an, Departamento de Astronom´ ıa, Universidad de Chile, Casilla 36-D, Santiago, Chile [email protected] Daniel A. Dale 1 Department of Physics and Astronomy, University of Wyoming, Laramie, WY 82071 [email protected] and Eduardo Hardy 1,2 National Radio Astronomy Observatory, Casilla El Golf 16-10, Chile [email protected] ABSTRACT We look for evidence of tidal stripping in elliptical galaxies through the analysis of homoge- neous CCD data corresponding to a sample of 228 elliptical galaxies belonging to 24 clusters of galaxies at 0.015 <z< 0.080. We investigate departures from the standard magnitude-isophotal size relation, as a function of environmental (cluster-centric distance, local galaxy density) and structural (cluster velocity dispersion, Bautz-Morgan type) properties. We find that, for any particular galaxy luminosity, the ellipticals in the inner and denser regions of the clusters are about 5% smaller than those in the outer regions, which is in good agreement with the finding of Strom & Strom (1978d) based on photographic photometry. The null hypothesis (ie., galaxy sizes are independent of the cluster-centric distance or density) is rejected at a significance level of better than 99.7%. Numericals models of Aguilar & White (1986) predict that tidal stripping can lead to changes in the whole structure of ellipticals producing shrinkage and brightening of the galaxy, qualitatively consistent with our measurements and also with the findings of Trujillo et al. (2002), that more centrally concentrated ellipticals populate denser regions. Our observational results can be interpreted as evidence for stripping of stars from ellipticals in the central/denser regions of clusters, contributing to the intra-cluster light observed in these structures. Subject headings: galaxies: clusters: general- galaxies: clusters: individual: (A3558)- galaxies: interaction- galaxies: photometry- 1
Transcript of Shrinking of Cluster Ellipticals: a Tidal Stripping explanation and Implications for the...

arX
iv:a
stro
-ph/
0602
019v
1 1
Feb
200
6
Shrinking of Cluster Ellipticals: a Tidal Stripping explanation and
Implications for the Intra-Cluster Light.
Shrinking of Cluster Ellipticals
Eduardo S. CyprianoSouthern Astrophysics Research Telescope, Casilla 603, La Serena, Chile and Laboratorio Nacional de
Astrofısica, CP 21, 37500-000 Itajuba - MG, Brazil
Laerte Sodre Jr.Departamento de Astronomia, Instituto de Astronomia, Geofısica e Ciencias Atmosfericas da USP, Rua do
Matao 1226, Cidade Universitaria, 05508-090, Sao Paulo, Brazil
Luis E. Campusano 1
Observatorio Astronomico Cerro Calan, Departamento de Astronomıa, Universidad de Chile, Casilla 36-D,Santiago, Chile
Daniel A. Dale 1
Department of Physics and Astronomy, University of Wyoming, Laramie, WY 82071
and
Eduardo Hardy 1,2
National Radio Astronomy Observatory, Casilla El Golf 16-10, Chile
ABSTRACT
We look for evidence of tidal stripping in elliptical galaxies through the analysis of homoge-neous CCD data corresponding to a sample of 228 elliptical galaxies belonging to 24 clusters ofgalaxies at 0.015 < z < 0.080. We investigate departures from the standard magnitude-isophotalsize relation, as a function of environmental (cluster-centric distance, local galaxy density) andstructural (cluster velocity dispersion, Bautz-Morgan type) properties. We find that, for anyparticular galaxy luminosity, the ellipticals in the inner and denser regions of the clusters areabout 5% smaller than those in the outer regions, which is in good agreement with the finding ofStrom & Strom (1978d) based on photographic photometry. The null hypothesis (ie., galaxy sizesare independent of the cluster-centric distance or density) is rejected at a significance level ofbetter than 99.7%. Numericals models of Aguilar & White (1986) predict that tidal stripping canlead to changes in the whole structure of ellipticals producing shrinkage and brightening of thegalaxy, qualitatively consistent with our measurements and also with the findings of Trujillo et al.(2002), that more centrally concentrated ellipticals populate denser regions. Our observationalresults can be interpreted as evidence for stripping of stars from ellipticals in the central/denserregions of clusters, contributing to the intra-cluster light observed in these structures.
Subject headings: galaxies: clusters: general- galaxies: clusters: individual: (A3558)- galaxies:interaction- galaxies: photometry-
1

1. Introduction
The existence of diffuse optical light in the cen-tral region of galaxy clusters is well known (Zwicky1951; de Vaucouleurs 1960), but its very low sur-face brightness precluded quantitative analysis.
More recently, due to advances in observationaland data reduction techniques, accurate measure-ments of the total amount of this light and itscolor and spatial distribution became feasible forrich clusters (Uson, Bough & Kuhn 1991; Scheick& Kuhn 1994; Gonzalez et al. 2000, 2005; Feld-meier, Ciardullo & Jacoby 2002; Feldmeier et al.2004a). Moreover, single objects, like planetarynebulae, red-giant stars or supernovae have beendetected in the intra-cluster medium (ICM) (The-uns & Warren 1996; Arnaboldi et al. 1996, 2002,2003; Feldmeier, Ciardullo & Jacoby 1998; Fergu-son et al. 1998; Feldmeier et al. 2004b).
These studies indicate that between ∼10% to20% (or higher) of the total stellar light of theclusters comes from stars in the ICM. These starshave, probably, been stripped from cluster galax-ies after galaxy-galaxy (Gallagher & Ostriker1972; Richstone 1976) or galaxy-cluster interac-tions (Merritt 1984). As a galaxy moves throughthe cluster, it is subject to the gravitational forcesof their neighbors, as well as of the cluster asa whole. As a result of the action of these tidalforces, some galaxy stars may be accelerated to ve-locities larger than the local escape velocity, beingremoved from the parent galaxy. This process iscalled tidal stripping. In some cases the tidal forcesmay be so strong that the galaxy as a whole isdisrupted. Indeed, a significant fraction of galaxystars may be dispersed in the ICM after disrup-tion of dwarf spheroidals or low surface brightnessdisk galaxies (e.g. Lopez-Cruz et al. 1997), as sug-gested by the light plumes observed in clusterslike Centaurus and Coma (Calcaneo-Roldan et al.2000; Korchagin, Tsuchiya & Miyama 2001).
In the present work we investigate whether stars
1Visiting Astronomer at the Cerro Tololo Inter-American Observatory, National Optical Astronomy Ob-servatories, which is operated by the Association of Univer-sities for Research in Astronomy, Inc., under a cooperativeagreement with the National Science Foundation.
2The National Radio Astronomy Observatory is a fa-cility of the National Science Foundation operated undercooperative agreement by Associated Universities, Inc.
stripped of ellipticals can make a significant con-tribution to the intra-cluster light (ICL). Thereare some hints that point towards this direction.Firstly, ellipticals are basically found in the cen-tral, denser, cluster regions, where close encoun-ters between galaxies are very common. Their al-most radial orbits (Ramirez & de Souza 1998) leadthem to several close approximations to the clustercenter, where tidal forces are very strong. The dif-fuse light is often distributed like a halo around thebrightest cluster galaxy (BCG), extending some-times beyond ∼ 500 kpc. Gonzalez et al. (2005)in their study of the surface brightness distribu-tion of BCGs in 24 clusters identify a component,independent of the BCG, that is possibly due tointracluster stars and dynamically linked to thecluster as a whole.
The effects of galaxy-galaxy tidal collisions werestudied by Aguilar & White (1985, 1986) throughthe use of the impulsive approximation and N-body numerical simulations of close collisions be-tween galaxies with roughly the same mass andwith mass distributions consistent with de Vau-couleurs and King profiles. They quantified themass and energy changes during such collisionsand studied the changes of the mass profiles. Theyfound that the r1/4 profile is robust, since it is re-covered after a collision, but with different param-eters. After strong encounters the central surfacebrightness becomes brighter and the effective andisophotal radius decrease as mass is stripped out.More recently, the high-resolution N-body+SPHnumerical simulations of rich clusters by Willmanet al. (2004) and Murante et al. (2004) indicatethat the accumulation of ICL is an ongoing pro-cess, linked to infall and stripping events, and thatthe stars composing the ICL are on average olderthan the stars in cluster galaxies.
Other works have considered the effects of asmooth cluster potential on a galaxy. Using theimpulsive approximation (Merritt 1984; Mamon2000), or high resolution numerical simulations(Ghigna et al. 1998), it can be shown that clus-ter galaxies are truncated at the tidal radius:
rtid = C
(
σg
σcl
)
rp, (1)
where σg and σcl are the velocity dispersions ofthe galaxy and the cluster, respectively, rp isthe radius of maximum approximation between a
2

galaxy and the cluster center, and C is a non-dimensional constant that depends of several fac-tors, like galaxy orbits, and is close to unity. Thisprocess is often called tidal truncation.
It is not clear yet what process is more effec-tive in removing stars from cluster galaxies. Tidaltruncation is indeed more efficient in removinghalo stars, since rtid is larger than the optical ra-dius for the majority of the galaxies. Anyway,as pointed out by Gnedin (1999), mass is notonly lost by instantaneous stripping after cluster-galaxy shocks, but also by secular tidal heating.
The first observational detection of tidal strip-ping of stars from elliptical galaxies came fromStrom & Strom (1978a,b,c,d), with a sample of 400ellipticals and S0’s located in 6 different clusters,deeply imaged with photographic plates. Theseauthors found that ellipticals in the center of richclusters have isophotal radii 10-30% smaller at agiven magnitude than ellipticals in poor clustersor in the outskirts of rich ones, estimating that upto ∼ 37% of the luminous mass of the strippedellipticals have been lost to the ICM.
Despite of the great impact of this work, ithas been severely criticized, mainly because it wasbased on photographic photometry (e.g. Dressler1984). Giuricin et al. (1989) questioned the sta-tistical analysis done by the Strom & Strom,and using photo-electric and CCD data of ∼ 160elliptical galaxies from the sample of Bursteinet al. (1987), did not find any dependence ofthe magnitude-size relation properties of ellipti-cal galaxies with the environment. In this paperwe will revisit this topic, using CCD data homo-geneously collected and reduced.
The layout of the paper is as follows. In Section2 we describe the observational material and thecluster sample, we present our method for the ex-traction of galaxy photometric parameters, as wellas the selection criteria of the final galaxy sam-ple. In Section 3 we present our results on galaxysizes, that are discussed in Section 4. In Section 5we summarize the main conclusions of this work.Throughout this paper, we adopt, when necessary,a ΛCDM cosmology with H0 = 70 h70 km s−1
Mpc−1, ΩM = 0.3 and ΩΛ = 0.7.
2. The data
2.1. The cluster sample and the observa-
tions
The galaxy sample discussed in this work wasextracted from the set originally obtained as partof the Ph.D. thesis of Daniel A. Dale on pecu-liar motions of clusters with z < 0.1 (Dale et al.1997, 1998, 1999a,b; Dale et al. 1999c). Theoriginal cluster sample was selected from nearby(cz < 18000 km s−1) objects of the Abell, Cor-win & Olowin (1989) cluster catalogue, in orderto cover as much and uniformly the whole skyarea as possible. Although the cluster selectioncriteria and imaging characteristics were chosento optimize the peculiar motion study, the result-ing database is useful for many other studies, sinceit was homogeneously observed and reduced, hashigh photometric accuracy, and the cluster sampleis representative of the low redshift cluster popula-tion (Cypriano et al. 2001). For the present study,only the Southern part of this sample has beenused. The clusters, and some of their propertiesthat are relevant for this work, are presented inTable 1.
The observational material consists of severalKron-Cousins I band images obtained with the0.9m CTIO telescope. The details of the obser-vations are discussed elsewhere (Dale et al. 1997,1998) and here we only summarize them. The de-tector used was the 2k×2k Tek2k No.3 CCD, witha scale of 0.4 arcsec per pixel, resulting in a fieldof 13.5′ × 13.5′ per image. The exposure time was600 seconds in all cases. The images reach 23.0 to23.8 I mag arcsec−2 at the 1 σ level over the back-ground, with a median of 23.6 I mag arcsec−2. Themedian seeing of the images is 1.52′′ and rangesfrom 1.16′′ to 2.80′′.
These images, consisting of several pointingsper cluster, in general do not uniformly cover acluster, since they were taken in regions near spiralgalaxies, although the central region of the clustersis always covered. For each cluster, the fraction ofthe projected area inside the R200 radius (see sec-tion 2.4) covered by the imaging is also shown inTable 1. The actual distribution of pointings ispresented in Dale et al. (1997, 1998, 1999b)
3

Table 1
Cluster sample
Name z a σcla B-M Type Total area Fraction of area N
(km s−1) (square degree) (%)(1) (2) (3) (4) (5) (6) (7)
A85 0.0555 941 I 0.05 4.8 12A114 0.0582 911 II 0.39 44.8 15A119 0.0449 685 II-III 0.05 5.3 6A496 0.0326 686 I 0.28 16.6 19A2670 0.0766 873 I-II 0.05 11.4 7A2806 0.0265 433 I-II 0.26 34.0 4A2877 0.0251 1026 I 0.45 10.2 7A2911 0.0800 546 I-II 0.32 12.8 2A3193 0.0346 638 I 0.23 21.3 5A3266 0.0586 1131 I-II 0.18 15.0 17A3376 0.0456 641 I 0.10 14.2 8A3381 0.0372 414 I 0.09 39.3 2A3389 0.0259 511 II-III 0.10 5.8 1A3395 0.0496 823 II 0.10 9.9 10A3407 0.0415 504 I 0.13 29.3 3A3408 0.0405 900 I-II 0.20 12.4 4A3528 0.0538 955 II 0.31 26.7 16A3558 0.0473 935 I 0.56 41.4 35A3571 0.0384 969 I 0.05 2.1 6A3574 0.0152 447 I 0.09 2.2 1A3656 0.0195 366 I-II 0.19 15.5 5A3667 0.0549 987 I-II 0.44 33.9 19A3716 0.0454 842 I-II 0.40 33.4 13A3744 0.0386 624 II-III 0.31 37.9 7A4038 0.0302 826 III 0.33 11.3 4
aWe got redshifts and velocity dispertions form Abell cluster redshift compilation ofAndernach & Tago (2005, in prep.), see Andernach, Tago (1998) for a description.
Note.—(1) name of the cluster in the Abell catalog (Abell, Corwin & Olowin 1989); (2)redshift; (3) radial velocity dispersion; (4) Bautz-Morgan Type (Bautz & Morgan 1970);(5) total imaged area; (6) The ratio of the area covered by the imaging over the wholearea inside the R200 radius ; (7) number of ellipticals in the sample.
4

2.2. Determination of photometric param-
eters
Most of the images used here were obtainedunder good photometric conditions. The abso-lute calibration of the magnitudes was done by us-ing standard photometric stars of Landolt (1992).The photometric zero-point calibration could bedetermined with a median accuracy of 0.018 mag,never larger than 0.031 mag.
In this work we have used an isophotal radiusas an estimator of the galaxy size because its log-arithm is very well correlated with the magni-tudes (Spearman rank correlation coefficient rs =−0.99). On the other hand, the log of the radiusthat encloses half of a galaxy light (the effectiveradius re) shows a significantly poorer correlationwith magnitudes (rs = −0.86). The Petrosian ra-dius (Petrosian 1976) is also less well-correlatedwith magnitudes (rs = −0.84), which is is not un-expected, since elliptical galaxies spanning a rangeof 5 absolute magnitudes have different profiles(Caon, Capaccioli & D’Onofrio 1993).
The isophotal quantities are defined at the sameisophotal limit in the galaxy rest frame (µlim).The corresponding isophotal threshold (µt), in theobserver rest frame, is given by the following ex-pression:
µt = µlim + AI + 10 log (1 + z) + k(z) (2)
where AI is the Galactic absorption in the I band,10 log(1 + z) is the correction due to the cosmo-logical dimming, and k(z) is the k-correction.
The values for Galactic absorption adopted hereare those given by Schlegel, Finkbeiner & Davis(1998), and range from 0.032 to 0.363 for the clus-ters in the sample. The k-corrections are fromPoggianti (1997), assuming her model for ellipti-cal galaxies, and range from 0.006 for the near-est cluster (A3574, z=0.014) to 0.035 mag for thefarthest one (A2670, z=0.076). The cosmologicaldimming factor ranges from 0.140 to 0.318 mag.The median value of µt − µlim is 0.32 mag.
The surface photometry was performed withthe task ellipse, of IRAF/STSDAS 1. The outputof this program is a list of several parameters, such
1IRAF is distributed by the National Optical AstronomyObservatories, which is operated by the Association of Uni-
as ellipticities, local intensities, magnitudes, etc.,as a function of the semi-major axis value. Usingas a radius the geometrical average of the semi-major and semi-minor axis, the so-called equiva-lent radius, the isophotal radius (riso) is estimatedfrom the galaxy isophotal brightness profile as theradius corresponding to µt, and then the isophotalmagnitude (miso) inside riso is determined. Usingthe equivalent radius instead of the semi-majoraxis we remove possible bias due to different el-lipticities between galaxies.
A de Vaucouleurs (1948) and an exponentialprofile were also fitted to the isophotal bright-ness profiles. Following the procedure describedin Scodeggio, Giovanelli & Haynes (1998), we re-moved from the fitting an inner region, with radiusequal to two times the FWHM of stellar sources.These fittings were used as part of the selection ofelliptical galaxies (see Section 3.3).
The median of the formal errors are 0.02 inmagnitudes and 3.3% in riso, where errors in riso
have been calculated as:
σ(riso) = σµdr
dµ. (3)
with σµ being the error of the corresponding sur-face brightness.
A check of the internal consistency of these er-rors can be obtained from a sample of 16 galax-ies that are present in two different images. Therms differences between isophotal magnitudes andisophotal radii measured in different images are0.02 and 2.7%, respectively, both in agreementwith the formal errors.
2.3. Sky subtraction
Since the sky subtraction is critical in the kindof study presented here, the procedure of sky de-termination is now explained in detail.
Firstly, the software SExtractor (Bertin &Arnouts 1996) is used to determine the averagesky value for the entire field. Then the galaxyimage is modeled using the IRAF task ellipse andremoved from a sky subtracted image. After, weestimate the residuals in the local sky, by examin-ing the residuals in a square region centered in the
versities for Research in Astronomy, Inc. (AURA) undercooperative agreement with the National Science Founda-tion.
5

subtracted galaxy, with a side size equal to at leasttwo times the galaxy major-axis at µt. The sizeof this region was determined after several testsand proved to be convenient for the estimationof the local background. The new local sky levelis obtained by removing the mean value of theresiduals from the previously adopted backgroundlevel.
After, the procedure of surface photometry andimage subtraction is done again, using this newvalue for the value of the local sky. The whole pro-cess is repeated until no significant local sky vari-ations are found. Generally, two iterations wereenough.
This process starts with the brightest galaxyin the field and continues in order of increasingmagnitude, to avoid luminosity contamination ofthe galaxy by the envelope of the BCG and otherbright galaxies in the cluster field.
2.4. Selection of the galaxy sample
The selection of elliptical galaxies for the anal-ysis was done following several steps.
A first selection was done based on the galaxymorphology and the form of its light profile. Ini-tially, all galaxies that are obvious spirals wereremoved from the sample. Then, by comparinggalaxy light profiles with exponential and de Vau-couleurs (1948) profiles, it was possible to removefrom the sample of elliptical galaxies some appar-ently featureless disk-like galaxies.
After, the morphological classification waschecked with previous classifications using NED2. Nearly half of the galaxies in the sample hadprevious classifications. About 30% of them areclassified as S0 and were removed from the sam-ple. Only a few cases of early-type spirals classifiedas ellipticals were found. Galaxies with redshiftinconsistent with those of the clusters were alsoremoved.
Due to the presence of a disk component, S0galaxies tend to have larger sizes, at a given mag-nitude, than ellipticals. However, since the radialdistribution of S0s and ellipticals in clusters does
2This research has made use of the NASA/IPAC Extragalac-tic Database (NED) which is operated by the Jet Propul-sion Laboratory, California Institute of Technology, undercontract with the National Aeronautics and Space Admin-istration.
not strictly match each other, there is the possi-bility that misclassification of lenticulars in ellip-ticals might produce a radial trend that could biasour results, because the radial distribution of theformer is slightly more extended than the latter(Whitmore, Gilmore & Jones 1993). This is diffi-cult to evaluate because we do not know, a priori,neither the number of misclassifications nor theirradial distribution. However, we expect that theywould be more common in the inner than in theouter parts of the clusters, due to the difficultyintroduced by the cluster diffuse light in the de-tection of faint disks. If this is indeed the case,the bias introduced would only dilute the radialtrends discussed here.
To ensure a high photometric quality of thedata, only galaxies with isophotal radius largerthan two times the FWHM of point sources plus0.8′′ (2 pixels) were included in the sample. Addi-tionally, images where the chosen isophotal limit iswithin 1σ of the sky brightness were excluded fromthe analysis. The faintest galaxies of the samplehave 17.5 I mag.
Objects with signs of contamination by anearby object, which could be easily recognizedon the light profiles and in the residuals that re-main after the subtraction of the galaxy, were alsoremoved from the sample. Objects with stronggradients in the local background, precluding anaccurate sky subtraction, were also removed.
As a final criterion, only galaxies with cluster-centric distances lower than R200 were included inthe analysis. This is the radius where the massdensity is ∼200 times larger than the critical den-sity and is a good approximation to the virial ra-dius. This radius R200 is estimated using the ex-pression
R200 =
√3σcl
10H(z)(4)
(Carlberg et al. 1996) where σcl is the one-dimensional velocity dispersion of the cluster andH(z), that is a function of the cosmological param-eters, is the Hubble factor at the cluster redshift.
The size of the sample depends of the isophotallimit chosen. Using a fiducial isophotal limit in thegalaxy rest frame of µlim = 22.75 I mag arcsec−2
, which avoids significant incompleteness, the fullsample contains 228 elliptical galaxies, 172 (75%)
6

of them with spectroscopic confirmation of clustermembership. The number of ellipticals per clusterin the final sample is presented in Table 1.
At this point it is important to warn the readerthat the galaxy sample selected for this work is notcomplete in any sense, due to the way the fieldsof the clusters were imaged and also because wehave rejected a number of objects for which wewere not able to perform the surface photometryproperly, mainly because of light contaminationby a neighbor. This problem is more severe inthe central parts of the clusters, since there thesurface density of objects is large. Both factors ofincompleteness can change the number of objectsas a function of the radius, but it is not expectedthat they can lead to any bias that can explain thetrends identified in this work (see next section),because they are completely independent of thephotometric parameters of the galaxies.
3. Results
3.1. The magnitude-size relation for clus-
ter ellipticals
In Figure 1 we plot the observed relationshipbetween the absolute isophotal magnitude and theisophotal radius (at the fiducial isophotal limitin the galaxy rest frame of µlim = 22.75 I magarcsec−2), as well as standard least-square fits oflinear and quadratic models.
It can be appreciated in this plot that the linearmodel (dashed line) fits well the data, but withsome systematic residuals in both the faint andbright extremes. However, these residual are min-imized by the use of a quadratic model (continu-ous line). Actually, a likelihood ratio test indicatesthat a quadratic model is significantly more reli-able than a linear model. Higher order models donot improve statistically the likelihood of the fit.
Hereafter, <riso>(M) will be used to denotethe isophotal radius of a galaxy that, given its Imagnitude, obeys the magnitude-size relation rep-resented by the continuos line in Figure 1. Wedefine
η ≡ riso
< riso > (M), (5)
where riso is the actual isophotal radius, as aconvenient way of measuring the deviation of theisophotal radius of a galaxy from the value that isexpected given its luminosity. Note that η < 1 rep-
Fig. 1.— Size-Magnitude relation in the I bandfor cluster ellipticals. The isophotal limit whereradii and magnitudes are measured, in the galaxyrest frame, is µlim = 22.75 I mag arcsec−2. Thestraight dashed line and thr continuous line areleast-squares fit to the data using a linear and aquadratic models respectively.
resents an effective “shrinkage” of a galaxy. Themean uncertainty in η is 0.037, taking into accountthe error in the measured isophotal radius and inthe fitted radius-magnitude relation.
We present in Figure 2 the distribution of η forall galaxies in our sample. Its average value is1.005 with a standard deviation of 0.10 (or 10%).
The observational errors in riso can account forone third of this scatter and the errors on the mag-nitudes are negligible (formal errors in MI are typ-ically 0.02 mag). Indeed, most of the variance inη is due to cosmic scatter in the magnitude-sizerelation.
We verified that the image quality is not affect-ing η measurements. The Spearman rank correla-tion coefficient between η and the seeing (FWHM)of the images is 0.1, indicating an inexistent orvery low dependence between these two quanti-ties.
7

Fig. 2.— Distribution of values of the ratio be-tween the measured isophotal radius of a galaxyand that expected for a galaxy with the same mag-nitude, η, for the galaxies of the sample.
3.2. Galaxy sizes as a function of cluster-
centric distances
In the seventies, Strom & Strom claimed thatthey had found evidence for tidal stripping ingalaxy clusters based on an analysis of the isopho-tal radius of cluster galaxies and a function ofits cluster-centric radial position (Strom & Strom1978d). We carry out a similar analysis in thissection using the cluster galaxies of our sample.
Since the number of data points per cluster isgenerally low, we have decided to use an ensembletechnique, where the data of all clusters are ana-lyzed together. For that, the cluster-centric dis-tances of the galaxies, R, were normalized by thevalue of the R200 of the cluster. Figure 3 presentsthe ratio η as a function of the normalized cluster-centric distance R/R200 for our sample.
To investigate radial trends in the optical ex-tent of elliptical galaxies, we examine whether ηvaries with R/R200. Indeed, by dividing the sam-ple with respect to the median of R/R200 (0.202),we find that galaxies in the group near the center(〈R/R200〉 = 0.11) have η = 0.980±0.009, whereasthose in the outer group (〈R/R200〉 = 0.43) have
Fig. 3.— Mean value of η as a function of thenormalized projected radial distance R/R200. Themain plot shows bins with approximately the samenumber of data points. The horizontal error barsare the 1-sigma dispersion of the data and the ver-tical ones the error of the mean (σ/
√N). The
small panel shows the individual data points. Onthe upper right corner of the small panel is shownan average η error bar.
η = 1.030 ± 0.009. The mean difference in η be-tween the two groups is (5.0±1.3)%, ruling out ata 3.8σ (99.99%) confidence level (C.L.) the null hy-pothesis that sizes are independent of the cluster-centric distance.
Comparing the medians, which are more robustestimators of location than the means, galaxies ofa given luminosity in the outer group are 5.1%larger than those in the inner regions of the clus-ters.
It is interesting to verify how this result changesas a function of µlim. In Table 2 we show the dif-ference in η (for medians and means as estimators)of galaxies in these two groups of projected radialdistances, for different isophotal limits. For bothestimators, this difference tends to increase towardfainter values of µlim, although this gradient is wellinside the errors.
The results of a Student’s t-test for the statisti-
8

cal significance of the difference of the mean valueof η for the two radial groups are also shown inTable 2 and indicates that this difference is signif-icant for all values of µlim. Note that the differencebetween the medians is almost always larger thanthat between the means.
The trend suggested by the data in Table 2 isthat the differences between η of the radial groupsincreases for fainter isophotal limits. This is par-ticularly clear for the difference between medians.A word of caution here is that the significance ofthis gradient is low due to the errors in these dif-ferences. We show in Figure 3 mean values of ηfor four radial bins with approximately the samenumber of data points in each one. The figure sug-gests that η increases monotonically with radius,possibly reaching a plateau at R/R200 ∼ 0.4.
Unfortunately, most of the clusters do nothave a sufficiently large number of galaxies inour sample to allow separate analyses. How-ever, Abell 3558 is an exception. This cluster,in the center of the Shapley super-cluster, is veryrich and has 36 galaxies in our sample, allowinga statistical analysis. The η-radius relation forAbell 3558 is very significant, as shown in Figure4. The difference between mean values of η be-low and above R/R200 = 0.202 (0.68 h−1
50Mpc) is
(9.8 ± 3.6)%.
In Table 3 we show the difference of η betweenthe inner and the outer radial groups of galaxiesfor the 5 clusters which have at least 15 galax-ies in our sample. These clusters are among therichest in Table 1. In four out of the five clustersthe galaxies in the outer group tend to be largerthan those in the inner group, although for one ofthem (A3266), the difference is not really signifi-cant. For A3528 the difference is in the oppositedirection but, again, the significance is low.
3.3. Galaxy sizes as a function of the local
galaxy density
We are also interested on verifying whetherη varies with the local galaxy density. Sinceour imaging covers the clusters only partially, toavoid incompleteness in the spatial sampling wehave used Super COSMOS data (Hambly, Irwin& MacGillivray et al. 2001) to obtain a catalog ofthe galaxies projected on to the cluster fields. Wehave selected only galaxies brighter than R = 16.5.
Fig. 4.— Distribution η as a function of thenormalized projected radial distance R/R200 forgalaxies in Abell 3558.
The local surface density associated to eachgalaxy in our sample has been computed from theprojected distance to its sixth closest Super COS-MOS neighbor (R6), using the estimator of Caser-tano & Hut (1985)
Σ =5
πR26
(6)
This quantity should be corrected by contamina-tion of foreground and background galaxies.
This field contamination was estimated as themedian surface density of galaxies in a ring at4.5±0.2 R200 of the cluster center. However, thiscorrection is quite sensitive to the variance of thefield galaxy counts, often produced by large scalestructures near the cluster or in its line of sight.The cluster A3558, in the center of the Shapleysuper-cluster, illustrates well this problem. De-spite its richness (Abell richness class 4), the den-sities estimated here are among the lowest of thewhole sample because the background counts arestrongly enhanced due to the presence of severalclusters in the region. For this reason, we alsoanalyzed the data without any background sub-traction.
9

Table 2
Variation of differences of η for galaxies in the outer and inner radial groups, as a
function of the limiting isophote
µlim Number Difference between Student’s t-test(mag arcsec−2) of galaxies medians (%) means (%) t Prob.
(1) (2) (3) (4) (5) (6)
21.50 151 5.4 4.7 ± 1.1 4.4 100.00%21.75 167 4.9 5.0 ± 1.1 4.5 100.00%22.00 179 6.1 4.8 ± 1.2 4.2 100.00%22.25 191 5.4 4.6 ± 1.3 3.7 99.97%22.50 210 4.8 5.0 ± 1.2 4.0 99.99%22.75 228 5.1 5.0 ± 1.3 3.8 99.98%23.00 200 8.2 7.0 ± 1.6 4.5 100.00%
Note.—(1) Isophotal limit in the I-band in the galaxy rest frame; (2) Numberof galaxies; (3) Differences between the medians; (4) Differences between themeans and their errors; (5) Value of t from the Student’s t-test; (6) Probabilitythat the observed difference between the two radial groups will not be caused bystatistical fluctuations.
Table 3
Variation of differences of η for galaxies in the outer and inner radial groups for
individual clusters
Cluster Number Difference between Student’s t-testof galaxies medians (%) means (%) t Prob.
(1) (2) (3) (4) (5) (6)
A3558 35 13.6 9.8 ± 3.6 2.5 98.3%A3667 19 11.1 10.2 ± 3.8 3.0 99.3%A496 19 14.4 15.7 ± 4.6 3.5 99.7%A3266 17 1.9 1.6 ± 2.9 0.5 36.0%A3528 16 -9.7 -6.9 ± 6.3 -1.2 -75.2%
Note.—Only clusters with more than 15 galaxies on the sample
10

Figure 5 shows the relation between η and thelogarithm of the corrected projected number den-sity. The figure suggests that there is a tendencyfor η to decrease with increasing surface density.
The difference of η between galaxies in envi-ronments with densities larger and smaller thanthe median for the background subtracted sampleis 3.1% (median) and 3.3 ± 1.3% (mean; 98.6%C.L.). The values for the non-background sub-tracted densities are similar: 3.3% (median) and4.0±1.3% (mean; 99.7% C.L.). The median valueof Σ for the background subtracted sample is 51.3Mpc−2 and 84.3 Mpc−2 for the non-backgroundsubtracted one.
Fig. 5.— Distribution of η as a function of the log-arithm of the projected number density of galax-ies, Σ. The solid circles shows averages of binswith similar number of data points for the back-ground subtracted values of the density. Theopen circles correspond to the non background-subtracted densities. The horizontal error bars arethe 1-sigma dispersion of the densities in each binand the vertical ones the error of the means. Inthis plot negative densities are represented as thelogarithm of the absolute density value times -1.
3.4. Galaxy sizes as a function of cluster
properties
In order to understand the origin of the strip-ping mechanism it is important to verify whetherand how the isophotal diameters of the galaxiesdepend on cluster properties. Here we will ana-lyze two of them: velocity dispersion and Bautz-Morgan type that, in principle, are approximatelyrelated to mass and evolutionary phase, respec-tively. In Figures 6 and 7 we show the dependenceof η as a function of these parameters.
Fig. 6.— Distribution of η as a function of thedispersion of velocity of the cluster. The circlesrepresents the mean value of η with its error ofthe mean; the horizontal bars represent the inter-val of σcl associated with each bin. Filled circlesrepresent mean values for all galaxies in the bin,whereas the open ones contain only galaxies withcluster-centric distances less than 0.202 R200. Forclarity, we shifted horizontally the open circles by20 km s−1.
At a first glance neither of these figures dis-plays a clear correlation, as those found for thecluster-centric distance and the local density. InFigure 6 it can be seen that galaxies in clusters inthe smallest velocity dispersion bin, present valuesof η significantly smaller than those in the otherclusters.
11
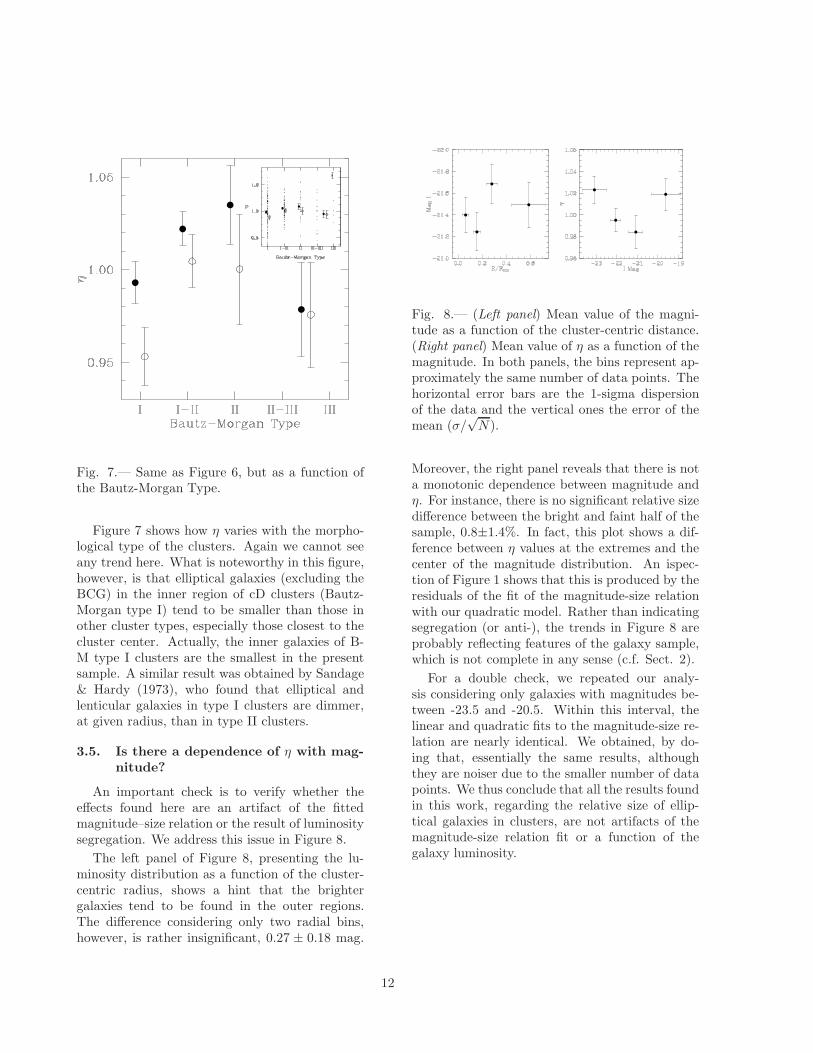
Fig. 7.— Same as Figure 6, but as a function ofthe Bautz-Morgan Type.
Figure 7 shows how η varies with the morpho-logical type of the clusters. Again we cannot seeany trend here. What is noteworthy in this figure,however, is that elliptical galaxies (excluding theBCG) in the inner region of cD clusters (Bautz-Morgan type I) tend to be smaller than those inother cluster types, especially those closest to thecluster center. Actually, the inner galaxies of B-M type I clusters are the smallest in the presentsample. A similar result was obtained by Sandage& Hardy (1973), who found that elliptical andlenticular galaxies in type I clusters are dimmer,at given radius, than in type II clusters.
3.5. Is there a dependence of η with mag-
nitude?
An important check is to verify whether theeffects found here are an artifact of the fittedmagnitude–size relation or the result of luminositysegregation. We address this issue in Figure 8.
The left panel of Figure 8, presenting the lu-minosity distribution as a function of the cluster-centric radius, shows a hint that the brightergalaxies tend to be found in the outer regions.The difference considering only two radial bins,however, is rather insignificant, 0.27 ± 0.18 mag.
Fig. 8.— (Left panel) Mean value of the magni-tude as a function of the cluster-centric distance.(Right panel) Mean value of η as a function of themagnitude. In both panels, the bins represent ap-proximately the same number of data points. Thehorizontal error bars are the 1-sigma dispersionof the data and the vertical ones the error of themean (σ/
√N).
Moreover, the right panel reveals that there is nota monotonic dependence between magnitude andη. For instance, there is no significant relative sizedifference between the bright and faint half of thesample, 0.8±1.4%. In fact, this plot shows a dif-ference between η values at the extremes and thecenter of the magnitude distribution. An ispec-tion of Figure 1 shows that this is produced by theresiduals of the fit of the magnitude-size relationwith our quadratic model. Rather than indicatingsegregation (or anti-), the trends in Figure 8 areprobably reflecting features of the galaxy sample,which is not complete in any sense (c.f. Sect. 2).
For a double check, we repeated our analy-sis considering only galaxies with magnitudes be-tween -23.5 and -20.5. Within this interval, thelinear and quadratic fits to the magnitude-size re-lation are nearly identical. We obtained, by do-ing that, essentially the same results, althoughthey are noiser due to the smaller number of datapoints. We thus conclude that all the results foundin this work, regarding the relative size of ellip-tical galaxies in clusters, are not artifacts of themagnitude-size relation fit or a function of thegalaxy luminosity.
12

4. Discussion
4.1. Comparison with previous work.
Our main result, the shrinkage of galaxies in-habiting the inner parts of the clusters, is in qual-itative agreement with the results of Strom &Strom (1978d). These authors found shrinkagefactors of 10-30% in images reaching isophotal lev-els as faint as 26 R mag arcsec−2, or ∼25.3 Imag arcsec−2, assuming (R-I) = 0.7, which is typ-ical of ellipticals at z∼0 (Fukugita, Shimasaku &Ichikawa 1995). This is nearly 2.5 mag arcsec−2
fainter than our fiducial isophotal limit, 22.75 Imag arcsec−2, precluding a quantitative compar-ison between our results in Table 2 with those ofStrom & Strom (1978d), because the reduction ofthe isophotal radius may depend on the isophotallevel.
Giuricin et al. (1989) have not found any en-vironmental dependency on the sizes of ellipti-cal galaxies in their sample. Their photometryreaches 25.0 B mag arcsec−2, which is roughly asdeep as our fiducial value for µlim (assuming (B-I) ≈ 2.27 for ellipticals; Fukugita, Shimasaku &Ichikawa 1995). However, they warned in theirconclusions that a shrinkage of the isophotal radiiof a few percent is consistent with their results,given their observational uncertainties. Actually,Giuricin et al. (1989) report that their typical rmserrors in log riso are around 0.04 (or 9.6%), and, inthe best cases (CCD data) they are between 0.02to 0.03 (4.7% to 7.2%), well above the rms er-ror of the log of the isophotal radius in this work,which is 0.015 (3.5%), as explained in Section 2.Additionally, the present work uses the ensembletechnique, that allows putting together data fromdifferent clusters, while Giuricin et al. (1989) di-vided their sample in sub-samples with small num-ber of data points, leading to results with smallerstatistical significance.
Trujillo et al. (2002) have found a related re-sult through the analysis of light concentration forthe Virgo and Coma clusters, indicating that morecentrally concentrated elliptical galaxies tend toinhabit the denser regions of galaxy clusters, whichis in agreement with the results presented here.When interpreting their results, these authors sug-gest that the origin of such effect would be galaxymergers, rather than tidal encounters because,quoting Strom & Strom (1978d), the latter would
affect only the stars in the outer halo, leaving thecores untouched. However, the numerical simu-lations of Aguilar & White (1986) convincinglydemonstrate (c.f. Figure 2 of this paper) thattidal shocks do lead to changes in the whole galaxystructure, not just in the outer parts: “...strongcollisions produce a shrinkage in re and a bright-ening of µe, whereas weak collisions have the op-posite effect”. Here re and µe are the parametersof the de Vaucouleurs profile: the effective radiusand the surface brightness inside re.
Although tidal stripping may not be the onlymechanism originating the observed shrinkage ofellipticals, this same mechanism has been vali-dated through numerical simulations (Willman etal. 2004; Richstone 1976) to explain the observedintracluster light in clusters of galaxies. One of thefindings of our work, that, for cD clusters (B–Mtype I), the shrinkage of the central ellipticals ismore pronounced than in the other cluster types,is consistent with the early Richstone (1976) claimthat cD halos can be formed by stars stripped outfrom cluster galaxies by tidal shocks, also in agree-ment with the very recent work of (Gonzalez et al.2005).
4.2. Tidal stripping mechanism
Finally, we discuss how can it be decided ob-servationally whether tidal truncation (cluster–galaxy collisions) or collisional stripping (galaxy–galaxy encounters) is the dominant mechanism forthe shrinkage of the ellipticals. A way to distin-guish between these alternatives , is by examininghow the stripping efficiency (and thus the shrink-ing of a galactic radius) depends on the clustervelocity dispersion. In the first case, as shown inequation 1, the efficiency should be proportionalto σcl, because the tidal radius depends on σ−1
cl ;while, in the second case, the dependency shouldbe the opposite, since lower velocity dispersionsleaves room for longer lived, and hence stronger,galaxy–galaxy shocks. Such test applied to ourpresent data (Section 3.4), unfortunately does notshow a clear correlation between galactic sizes andσcl. An analysis of a much larger sample, andpreferably deeper, is necessary to determine whichis the dominant mechanism producing the tidalstripping of ellipticals in clusters of galaxies.
13

5. Conclusions
We have analyzed a sample of 228 ellipticalgalaxies belonging to 24 clusters to look for ev-idence of tidal stripping and to put constraintson the mechanisms behind star removal in clustergalaxies. The stripping was quantified by examin-ing departures of the magnitude-isophotal radiusrelation for cluster ellipticals, measured by the pa-rameter η- the ratio between the measured isopho-tal radius of a galaxy (at 22.75 I mag arcsec−2 inthe galaxy rest frame) and the isophotal radiusexpected for a galaxy with the same magnitude.
Our main conclusion is that cluster ellipticals ofa given magnitude in inner/denser cluster regionsare smaller than those in the outer regions by afactor of the order of 5%. The shrinkage factortend to decrease with increasing distance from thecenter of the cluster and with decreasing galaxynumber density. Although the amount of galaxystellar mass lost to the ICM remains unknown, it isprobably of the order of a few percent of the parentgalaxy mass within the optical radius. Thus, it ishighly probable that the stars lost by the centralcluster ellipticals are a significant contributor tothe diffuse light observed in clusters of galaxies.
We would like acknowledge Gastao Lima Neto,Gary Mamon, and Claudia Mendes de Oliveirafor useful discussions and Nick Suntzeff for theencouragement. ESC acknowledges the hospi-tality of the Department of Astronomy of theIAG/USP, where most of this work has been done.The outstanding support at Cerro Tololo Inter-American Observatory is gratefully recognized.ESC (CNPq/Brazil–fellow) and LS acknowl-edges support by Brazilian agencies FAPESP andCNPq. LEC was partially funded by Fondecyt(Chile) grant No. 1040499.
REFERENCES
Abell, G. O., Corwin, H. G., JR., Olowin, R. P.1989, ApJS, 70, 1
Aguilar, L. A., White, S. D. M. 1985, ApJ, 295,37
Aguilar, L. A., White, S. D. M. 1986, ApJ, 307,97
Andernach H., Tago E. 1998, “Current Statusof the ACO Cluster Redshift Compilation”,Proc. “Large Scale Structure: Tracks andTraces”, Potsdam, Germany, Sept. 15–19, 1997;eds. V. Muller, S. Gottlober, J.P.Mucket, &J.Wambsganss, World Scientific, Singapore, p.147–150 (astro-ph/9710265)
Arnaboldi, M., Freeman, K. C., Mendez, R. H.,Capaccioli, M., Ciardullo, R., Ford, H., Ger-hard, O., Hui, X., Jacoby, G. H., Kudritzki, R.P., Quinn, P. J. 1996, ApJ, 472, 145
Arnaboldi, M. et al., 2002, AJ, 123, 760
Arnaboldi, M. et al., 2003, AJ, 125, 514
Bautz, L. P., Morgan, W. W. 1970, ApJ, 162, 149
Bertin, E., Arnouts, S. 1996, A&AS, 117, 393
Burstein, D., Davies, R. L., Dressler, A., Faber, S.M., Stone, R. P. S., Lynden-Bell, D., Terlevich,R. J., Wegner, Gary, ApJS, 64, 601
Calcaneo-Roldan, C., Moore, B., Bland-Hawthorn, J., Malin, D., Sadler, E. M.2000, MNRAS, 314, 324
Caon N., Capaccioli M., D’Onofrio M., 1993, MN-RAS, 265, 1013
Casertano, S., Hut, P. 1985, ApJ, 289, 80
Carlberg, R., Yee, H. K. C., Ellingson, E., Abra-ham, R., Gravel, P., Morris, S., Prichet, C.J.ApJ, 462, 32
Cypriano, E. S., Sodre Jr., L., Campusano L. E.,Kneib, J.-P., Giovanelli R., Haynes M. P., DaleD. A., Hardy, E. 2001, AJ, 121, 10
Dale D. A., Giovanelli R., Haynes M. P., ScodeggioM., Hardy E., Campusano L. E. 1997, AJ, 114,455
Dale D. A., Giovanelli R., Haynes M. P., ScodeggioM., Hardy E., 1998, AJ, 115, 418
Dale D. A., Giovanelli R., Haynes M. P., HardyE., Campusano L. E. 1999a, ApJ, 510, 11
Dale D. A., Giovanelli R., Haynes M. P., HardyE., Campusano L. E. 1999b, AJ, 118, 1468
Dale D. A., Giovanelli R., Haynes M. P., Campu-sano L. E., Hardy E. 1999c, AJ, 118, 1489
14
Dressler, A. 1984, ARAA, 22 ,185
Feldmeir, J. J., Ciardullo, R., Jacoby, G. 1998,ApJ, 503, 109
Feldmeier, J. J., Mihos, J. C.; Morrison, H. L.,Rodney, S. A., Harding, P. 2002, ApJ, 575, 779
Feldmeier, J. J., Mihos, J. C., Morrison, H. L.,Harding, P., Kaib, N., Dubinski, J. 2004 ApJ,609, 617F
Feldmeier, J. J., Ciardullo, R., Jacoby, G. H., Dur-rell, P. R. 2004, ApJ, 615, 196F
Ferguson, H. C., Tanvir, N. R., Von Hippel, T.1998, Nature, 391, 461
Fukugita, M., Shimasaku, K., Ichikawa, T. 1995,PASP, 107, 945
Gallagher, J. S., Ostriker, J. P. 1972, AJ, 77 288
Gal-Yam, A., Maoz, D., Guhathakurta, P., Filip-penko, Alexei V. 2003, AJ, 125, 1087
Ghigna, S., Moore, B., Governato, F., George. L.,Quinn, T., Stadel J. 1998, MNRAS, 300, 146
Giuricin, G. ,Mardirossian, M., Mezzetti, M,Pisani, A. 1989, ApJ,345, 101
Gonzalez, A. H., Zabludoff, A. I., Zaritsky, D.,Dalcanton, J. J. 2000, ApJ, 536, 561
Gonzalez, A, H., Zabludoff, A. I., Zaritsky, D.2005, ApJ, 618, 195
Gnedin, O. Y. 1999, PhD thesis, Princeton Uni-versity
Hambly, N. C., Irwin, M. J., MacGillivray, H. T.2001, MNRAS, 326, 1295
Korchagin, V., Tsuchiya, T., Miyama, S. M. 2001,ApJ, 549, 224
Landolt, A. U. 1992, AJ, 104, 340
Lopez-Cruz, O., Yee, H. K. C., Brown, J. P.,Jones, C.,, Forman, W. 1997, ApJ, 475, 97
Mamon, G. A. 2000, Dynamics of Galaxies: fromthe Early Universe to the Present, 15th IAPmeeting held in Paris, France, July 9-13, 1999,Eds.: Francoise Combes, Gary A. Mamon, andVassilis Charmandaris ASP Conference Series,Vol. 197
Merritt, D. 1984, ApJ, 276, 26
Moore, B., Katz, N., Lake, G. 1996, ApJ, 457, 455
Moore, B., Katz, N., Lake, G., Dressler, A., Oem-ler, A. 1996, Nature, 379, 613
Murante, G.,Arnaboldi, M., Gerhard, O., Bor-gani, S., Cheng, L. M., Diaferio, A., Dolag,K., Moscardini, L., Tormen, G., Tornatore, L.,Tozzi, P. 2004, ApJ, 607, L83
Petrosian, V. 1976, ApJ, 209, 1
Poggianti, B. M. 1997, A&AS, 122, 399
Ramirez, A., de Souza, R. 1998, ApJ, 496, 693
Richstone, D. O. 1976, ApJ, 204, 642
Sandage, A., Hardy, E. 1973, ApJ, 183, 743
Scheick, X., Kuhn, J. R. 1994, ApJ, 423, 566
Schlegel, S., Finkbeiner, D. P., Davies, M. 1998,ApJ, 500, 525
Scodeggio, M., Giovanelli, R., Haynes, M. P. 1998,AJ, 116, 2728
Strom, S. E., Strom, K. M. 1978, AJ, 83,73
Strom, S. E., Strom, K. M. 1978, AJ, 83, 732
Strom, S. E., Strom, K. M. 1978, AJ, 83, 1293
Strom, S. E., Strom, K. M. 1978, ApJ, 225, L93
Theuns, T., Warren, S. J. 1996, MNRAS, 284, L11
Trujillo, I., Aguerri, J. A. L., Gutierrez, C. M.,Caon, N., Cepa, J. 2002, ApJ, 573, L9
Uson, J. M., Bough, S. P., Kuhn, J. R. 1991 ApJ,369, 46
de Vaucouleurs, 1948 G. Annales d’Astrophysique,11, 247
de Vaucouleurs, G. 1960, ApJ, 131, 585
Willman, B., Governato, F., Wadsley, J., Quinn,T. 2004, MNRAS, 355, 159
Whitmore, B. C., Gilmore, D. M., & Jones, C.1993, ApJ, 407, 489
Zwicky, F. 1951, PASP, 63, 61
This 2-column preprint was prepared with the AAS LATEXmacros v5.2.
15


![[Document title] - Food Security Cluster](https://static.fdokumen.com/doc/165x107/63150bb56ebca169bd0b096c/document-title-food-security-cluster.jpg)