Short-term nutritional supplementation of ewes in low body condition affects follicle development...
11
REPRODUCTION RESEARCH Short-term nutritional supplementation of ewes in low body condition affects follicle development due to an increase in glucose and metabolic hormones C Vin ˜oles 1,2 , M Forsberg 2 , G B Martin 3 , C Cajarville 4 , J Repetto 4 and A Meikle 5 1 School of Agriculture ‘Emilia Vigil de Olmos’, Universidad del Trabajo del Uruguay (UTU), Uruguay, 2 Centre for Reproductive Biology, Department of Clinical Chemistry, Swedish University of Agricultural Sciences (SLU), Uppsala, Sweden, 3 School of Animal Biology, University of Western Australia, Perth, Australia, 4 Department of Nutrition, Faculty of Veterinary Medicine, Montevideo, Uruguay and 5 Department of Cellular and Molecular Biology, Faculty of Veterinary Medicine, Lasplaces 1550, Montevideo, Uruguay Correspondence should be addressed to C Vin ˜oles Gil, Department of Cellular and Molecular Biology, Faculty of Veterinary Medicine, Lasplaces 1550, Montevideo, Uruguay; Email: [email protected] Abstract This study tested whether the effects of a short period of nutritional supplementation given to ewes during the luteal phase on follicle development and ovulation rate is associated with an increase in circulating concentrations of FSH, glucose or meta- bolic hormones. Oestrus was synchronised with two prostaglandin injections given 9 days apart and the supplement consisted of corn grain and soybean meal. Corriedale ewes with low body condition were randomly assigned to 2 groups: the control group (C; n 5 10) received a maintenance diet while the short-term supplemented group (STS; n 5 10) received double the maintenance diet over days 9 to 14 of the oestrous cycle (day 0 5 ovulation). Ovaries were examined daily by ultrasound and blood was sampled three times a day during the inter-ovulatory interval for measuring reproductive and metabolic hormones. On days 9, 11 and 14 of the oestrous cycle, half of the ewes from each group (n 5 5) were bled intensively to determine the concentrations of glucose, insulin, IGF-I and leptin. Plasma FSH, progesterone, oestradiol and androstenedione concentrations were similar among groups. Dietary supplementation increased plasma insulin concentrations from the first to the sixth day of supplementation and increased glucose concentrations on the third day, compared with control ewes. Plasma leptin concen- trations were higher in STS ewes from the second to the fifth day of supplementation. The pattern of IGF-I concentrations was similar among groups. In STS ewes, the nutritional treatment prolonged the lifespan of the last non-ovulatory follicle, so fewer follicular waves developed during the cycle. In STS ewes, increased concentrations of glucose, insulin and leptin one day before ovulatory wave emergence were associated with increased numbers of follicles growing from 2 to 3mm and with stimulation of the dominant follicle to grow for a longer period. We suggest that the mechanism by which short-term nutri- tional supplementation affects follicle development does not involve an increase in FSH concentrations, but may involve responses to increased concentrations of glucose, insulin and leptin, acting directly at the ovarian level. This effect is acute, since concentrations of all three substances decrease after reaching peak values on the third day of supplementation. The status of follicle development at the time of maximum concentrations of glucose and metabolic hormones may be one of the factors that determines whether ovulation rate increases or not. Reproduction (2005) 129 299–309 Introduction Nutrition is one of the most important factors affecting ovulation rate. For example, supplementation for 4–6 days with lupin grain, a high energy and high protein sup- plement, is sufficient to increase the ovulation rate in sheep (Gherardi & Lindsay 1982, Oldham & Lindsay 1984, Stewart & Oldham 1986). This effect is not associ- ated with a specific component in the lupin grain but to an increase in energy-yielding nutrients (Teleni et al. 1989b, Downing & Scaramuzzi 1991). To be effective, short-term supplements have to be fed on days 9 to 13 of the oestrous cycle or 6 days before luteolysis (Nottle et al. 1985, 1990, Stewart & Olhdam 1986, Downing et al. 1995). This is the time range when the ovulatory wave emerges (for review see Vin ˜oles 2000). However, the wave-like pattern of follicle development was not clear q 2005 Society for Reproduction and Fertility DOI: 10.1530/rep.1.00536 ISSN 1470–1626 (paper) 1741–7899 (online) Online version via www.reproduction-online.org
-
Upload
wwwfhuceedu -
Category
Documents
-
view
1 -
download
0
Transcript of Short-term nutritional supplementation of ewes in low body condition affects follicle development...

REPRODUCTIONRESEARCH
Short-term nutritional supplementation of ewes in low bodycondition affects follicle development due to an increasein glucose and metabolic hormones
C Vinoles1,2, M Forsberg2, G B Martin3, C Cajarville4, J Repetto4 and A Meikle5
1School of Agriculture ‘Emilia Vigil de Olmos’, Universidad del Trabajo del Uruguay (UTU), Uruguay, 2Centrefor Reproductive Biology, Department of Clinical Chemistry, Swedish University of Agricultural Sciences (SLU),Uppsala, Sweden, 3School of Animal Biology, University of Western Australia, Perth, Australia, 4Department ofNutrition, Faculty of Veterinary Medicine, Montevideo, Uruguay and 5Department of Cellular and MolecularBiology, Faculty of Veterinary Medicine, Lasplaces 1550, Montevideo, Uruguay
Correspondence should be addressed to C Vinoles Gil, Department of Cellular and Molecular Biology, Faculty of Veterinary
Medicine, Lasplaces 1550, Montevideo, Uruguay; Email: [email protected]
Abstract
This study tested whether the effects of a short period of nutritional supplementation given to ewes during the luteal phase on
follicle development and ovulation rate is associated with an increase in circulating concentrations of FSH, glucose or meta-
bolic hormones. Oestrus was synchronised with two prostaglandin injections given 9 days apart and the supplement consisted
of corn grain and soybean meal. Corriedale ewes with low body condition were randomly assigned to 2 groups: the control
group (C; n 5 10) received a maintenance diet while the short-term supplemented group (STS; n 5 10) received double the
maintenance diet over days 9 to 14 of the oestrous cycle (day 0 5 ovulation). Ovaries were examined daily by ultrasound and
blood was sampled three times a day during the inter-ovulatory interval for measuring reproductive and metabolic hormones.
On days 9, 11 and 14 of the oestrous cycle, half of the ewes from each group (n 5 5) were bled intensively to determine the
concentrations of glucose, insulin, IGF-I and leptin. Plasma FSH, progesterone, oestradiol and androstenedione concentrations
were similar among groups. Dietary supplementation increased plasma insulin concentrations from the first to the sixth day of
supplementation and increased glucose concentrations on the third day, compared with control ewes. Plasma leptin concen-
trations were higher in STS ewes from the second to the fifth day of supplementation. The pattern of IGF-I concentrations was
similar among groups. In STS ewes, the nutritional treatment prolonged the lifespan of the last non-ovulatory follicle, so fewer
follicular waves developed during the cycle. In STS ewes, increased concentrations of glucose, insulin and leptin one day
before ovulatory wave emergence were associated with increased numbers of follicles growing from 2 to 3 mm and with
stimulation of the dominant follicle to grow for a longer period. We suggest that the mechanism by which short-term nutri-
tional supplementation affects follicle development does not involve an increase in FSH concentrations, but may involve
responses to increased concentrations of glucose, insulin and leptin, acting directly at the ovarian level. This effect is acute,
since concentrations of all three substances decrease after reaching peak values on the third day of supplementation.
The status of follicle development at the time of maximum concentrations of glucose and metabolic hormones may be
one of the factors that determines whether ovulation rate increases or not.
Reproduction (2005) 129 299–309
Introduction
Nutrition is one of the most important factors affectingovulation rate. For example, supplementation for 4–6days with lupin grain, a high energy and high protein sup-plement, is sufficient to increase the ovulation rate insheep (Gherardi & Lindsay 1982, Oldham & Lindsay1984, Stewart & Oldham 1986). This effect is not associ-ated with a specific component in the lupin grain but to
an increase in energy-yielding nutrients (Teleni et al.
1989b, Downing & Scaramuzzi 1991). To be effective,
short-term supplements have to be fed on days 9 to 13 of
the oestrous cycle or 6 days before luteolysis (Nottle et al.
1985, 1990, Stewart & Olhdam 1986, Downing et al.
1995). This is the time range when the ovulatory wave
emerges (for review see Vinoles 2000). However, the
wave-like pattern of follicle development was not clear
q 2005 Society for Reproduction and Fertility DOI: 10.1530/rep.1.00536
ISSN 1470–1626 (paper) 1741–7899 (online) Online version via www.reproduction-online.org

when the critical period of supplementation wasdescribed, so it was not possible to associate daily follicu-lar growth with the endocrine and metabolic responses tothe nutritional treatment.
Data on the effects of nutritional stimuli on follicle-stimulating hormone (FSH) levels during the cycle areequivocal, with reports for (Rhind et al. 1985, Rhind &McNeilly 1986) and against (Findlay & Cumming 1976,Rhind et al. 1989, Xu et al. 1989, Smith & Stewart 1990)the induction of a change. When we used ultrasonographyto study the static effect of nutrition on daily folliculardevelopment, we found that the increased ovulation ratein ewes with high body condition was associated withincreased FSH and decreased oestradiol concentrationsduring the follicular phase (Vinoles et al. 2002). Wesuggested that lower oestradiol concentrations inhibitedFSH less, thus allowing more gonadotrophin responsivefollicles to grow and become selected to ovulate.
An alternative mechanism of the immediate nutritionaleffect on follicular growth might involve direct actions atthe ovarian level of glucose and metabolic hormones,such as insulin-like growth factor I (IGF-I) and leptin,since glucose transporter proteins and specific receptorsfor these hormones are present in the follicles (Williamset al. 2001, Munoz-Gutierrez et al. 2004). Since the finalstages of follicle growth are the most sensitive to low FSHlevels, but increased FSH concentrations are not a con-sistent finding, it has been proposed that nutritionchanges the ability of gonadotrophin-dependent folliclesto use the small amounts of FSH that are available(Scaramuzzi & Radford 1983, Souza et al. 1997). Insulinand IGF-I, the concentrations of which increase after ashort-term supplementation, could fulfill this role becausethey increase responsiveness to gonadotrophins andsuppress apoptosis in follicles (Monget & Martin 1997,Poretsky et al. 1999, Scaramuzzi et al. 1999, Williamset al. 2001). Leptin influences whole-body glucosehomeostasis and the action of insulin, and its concen-trations are sensitive to short-term alterations in foodintake (Cunningham et al. 1999, Marie et al. 2001). Insu-lin stimulates the secretion of leptin by adipocytes and,by promoting lipogenesis, it may indirectly increase leptinproduction (Poretsky et al. 1999). Metabolic hormonesalso regulate steroidogenesis: glucose and insulin infusedtogether decrease it, while IGF-I infusion is stimulatory(Scaramuzzi et al. 1999). Leptin antagonizes the stimu-latory effect of insulin on theca cell steroidogenesis, ulti-mately leading to a decrease in oestradiol secretion(Spicer & Francisco 1997).
The aim of the present study was to test whether a6-day nutritional supplement, applied over days 9 to 14 ofthe cycle, affected follicle development and ovulation ratethrough an increase in circulating FSH concentrations,and whether these responses were associated withincreases in circulating concentrations of glucose, insulinor leptin.
Materials and Methods
Animals
The experiment was conducted at the experimental farmof the Agronomy Faculty in Cerro Largo, Uruguay (latitude31.58 S) during the period February to April 2002, using20 Corriedale ewes aged 4.6 ^ 0.2 years (mean ^ S.E.M.)that had had one lamb the previous year. They had a bodyweight of 36.4 ^ 0.6 kg and a body condition score of1.8 ^ 0.1 units (1 ¼ emaciated, 5 ¼ obese; Suiter 1994).The body condition of the animals was selected based onthe experimental model applied to male sheep to studythe effects of nutrition on reproduction (Blache et al.2002). Body condition and body weight were measuredweekly. Ewes were randomly assigned to 2 groups: thecontrol group (C; n ¼ 10) received a maintenance diet,while the short-term supplemented group (STS; n ¼ 10)received double the maintenance diet for 6 days, fromdays 9 to 14 of the cycle (day 0 ¼ ovulation). During theexperimental period, all ewes received the diet in onemeal at 1200 h, except during the 6-day supplementationperiod when STS ewes received two meals of equalamounts at 1200 h and 1300 h.
During the experiment, the animals were maintainedunder 13 h light per day. The mean temperature inside thebarn was 20.1 ^ 0.5 8C, 26.4 ^ 0.5 8C and 24.8 ^ 0.5 8Cat 0730 h, 1400 h and 1930 h respectively. Four weeksbefore the beginning of the experiment, ewes were placedin individual pens (dimensions: 1.21 m £ 1.51 m) wherethey were kept. The sequential order of the animals wasconsidered for all procedures.
Diets
Ewes were fed a maintenance diet (AFRC 1993) formu-lated for restricted intake (46 g dry matter (DM) per kg ofmetabolic body weight; BW0.75) to avoid refusals. Thebasal diet consisted of 70% hay (Trifolium alexandrinum)and 30% concentrate (80% corn grain and 20% soybeanmeal). This allocation supplied 6.4 MJ metabolisableenergy (ME) and 94 g crude protein (CP) per ewe daily.The ME of the diet was calculated by the equation elabo-rated by MAAF (1975) and dry matter digestibility (DMD)was calculated by applying the equation described byOddy et al. (1993). Hay was chopped into a particle sizeof 2 to 5 cm. The chemical composition of the com-ponents of the diet is presented in Table 1.
Table 1 Chemical composition of the different components of thediet: dry matter (DM), ash, acid detergent fibre (ADF), crude protein(CP) and fat (values on a dry matter basis).
DM(g/kg)
Ash(g/kg)
ADF(g/kg)
CP(g/kg)
Fat(g/kg)
Hay 843 79 408 119 25Corn grain 882 15 46 93 36Soybean meal 889 65 95 476 17
300 C Vinoles and others
Reproduction (2005) 129 299–309 www.reproduction-online.org

Water was available to ewes ad libitum. Mineral salt(8 g crystalline salt, El Valor, Canelones, Las BrujesUruguay) and bicarbonate (2% of total diet) were addedto the diet. Refusals were removed at 0700 h of the follow-ing day and were low throughout the experimental period(less than 10% for hay and concentrates).
Experimental design
A schematic representation of the experimental designis shown in Fig. 1. Oestrus was synchronised with twointramuscular injections of prostaglandin (PG; 30mgCloprostenol, Dalmaprost-D, Fatro Laboratory, Montevi-deo, Uruguay) given 9 days apart. Oestrous behaviourwas detected by testing the ewes every 12 h with vasecto-mised rams from the day of the second PG injection andfrom day 15 of the next oestrous cycle. Daily ultrasoundexaminations began on the day of the second PG injectionand continued until 7 days after the second ovulation (Fig.1). Ovulation was detected by the collapse of a large fol-licle and was considered to be day 0 of the oestrouscycle. During the second period of oestrous detection,ultrasound examinations were increased to every 12 hfrom oestrous behaviour until the detection of the secondovulation.
Ultrasound examinations
Transrectal ultrasound examinations were conductedusing a real-time, B-mode scanner (Aloka SSD 500 Echocamera, Overseas Monitor Corp. Ltd, Richmond, BC,Canada) and a rigid 7.5 MHz transducer adapted to bemanipulated externally in the rectum (Rubianes et al.1997). The total number, the diameter and the position
of all follicles $2 mm in diameter and all corpora lutea(CL) were assessed in both ovaries each day. A follicularwave was defined as one or more follicles growing to atleast 5 mm in diameter. Groups of follicles emergingwithin 48 h were regarded as a single follicular wave.The subordinate follicle was defined as a follicle thatreached 3 mm and could be followed by ultrasonographyfor at least 3 days. Morphological characteristics of fol-licular waves were described based on the followingparameters of the largest follicle: day of emergence,maximum diameter, lifespan, interwave interval. Thesevariables have been defined previously (Vinoles et al.2001). The day of wave emergence was the day the lar-gest follicle of the wave was retrospectively identified at3 mm in diameter. Time of deviation was defined as thebeginning of the greatest difference in diameter changesbetween the two largest follicles, at the examinationwhen the second largest follicle reached its maximumdiameter (adapted from Ginther et al. 1996). The mor-phological growing phase was defined as the number ofdays from emergence to maximum diameter of the lar-gest follicle of each wave, and the morphological domi-nance phase as the number of days from deviation tothe emergence of the next wave. Ovulation rate wasdetermined by counting the number of CL 7 days afterovulation. The predictive value and sensitivity of ultra-sound for evaluating the presence or absence of CL is100% and 96% respectively. The predictive value ofultrasound for the number of follicles is 98–100% for2 mm, 4 mm and $5 mm diameter follicles except forthose of 3 mm diameter (71%). The sensitivity of ultra-sonography is high for all sized follicles (90–95%)except those of 2 mm diameter (62%; Vinoles et al.2004).
Figure 1 Schematic representation of theexperimental design. PG, injection of aprostaglandin analogue; *, glucosemeasurements.
Nutritional supplementation and follicle development in ewes 301
www.reproduction-online.org Reproduction (2005) 129 299–309

Blood sampling for glucose and hormonalmeasurements
From the day of the second PG injection until the day ofthe second ovulation, blood was collected in all ewes threetimes a day into heparinised tubes. Blood was sampled inrelation to feeding time (hour 0) at 25 h, 1.5 h and 7 h. Todescribe acute changes in metabolic hormones and metab-olites in relation to feeding, in half of the ewes from eachgroup (n ¼ 5) blood was sampled on days 9, 11 and 14 ofthe cycle. Samples were taken via an indwelling jugularcatheter for a period of 24 h – every hour from 2 h beforeuntil 10 h after feeding and every second hour thereafter.Frequency was increased to every 30 min in the first 2 hafter feeding (Fig. 1). The volume of blood taken eachtime was 5 ml. Blood was placed in heparinised tubesand maintained on ice until it was centrifugedwithin 10 min of collection. Plasma was stored at 220 8Cuntil assayed.
Progesterone concentrations were estimated in allsamples by a direct solid-phase radioimmunoassay (RIA)using DPC kits (Diagnostic Product Co., Los Angeles, CA,USA) as previously described (Meikle et al. 1997). The RIAhad a sensitivity of 0.2 nmol l21. The intra-assay coeffi-cients of variation for low (3 nmol l21), medium(24 nmol l21) and high (50 nmol l21) controls were 5%, 6%and 3% respectively. The corresponding inter-assay coeffi-cients of variation were 12%, 10% and 4% respectively.
Oestradiol-17b concentrations were determined in allsamples by RIA using DPC kits (oestradiol double antibody,KE2D, Diagnostic Product Co.) as previously described(Meikle et al. 1997). The detection limit of the assay was4 pmol l21. The intra-assay coefficient of variation was25% at 5 pmol l21 and ,10% for concentrations between11 and 180 pmol l21. The inter-assay coefficients of vari-ations for three control samples were 30% (7 pmol l21),11% (33 pmol l21) and 16% (63 pmol l21).
Plasma FSH concentrations were determined in samplestaken at 25 h and 7 h with respect to feeding by RIA(Vinoles et al. 1999). The sensitivity of the assay was0.2mg l21. The intra-assay coefficient of variation was 9%at 3mg l21, 10% at 5mg l21 and 9% at 7mg l21. The inter-assay coefficients of variations for three control sampleswere 13% (3mg l21), 13% (5mg l21) and 14% (7mg l21).
Androstenedione concentrations were determined twicea day by RIA (DSL-4200, Diagnostic Systems Laboratories,Inc., Texas, TX, USA) in samples taken at 25 h and 7 hdaily, from the day of emergence of the last non-ovulatorywave to ovulation. To increase the sensitivity of the assay,150ml tracer and 25ml antibody were used (50% bindingfor the 0 standard). On the first day, samples (250ml) wereextracted with 2.5 ml ether and 500ml of the standard(1725 pmol l21) was extracted in 4.5 ml ether. A pool ofplasma from ewes known to have low (110 pmol l21),medium (225 pmol l21) and high (385 pmol l21) androste-nedione concentrations from previous studies were usedas quality controls. After extraction, 25ml PBS were added
to each tube and 1000ml PBS were added to the stand-ards. The samples and standards were incubated overnightat 4 8C. On the second day, the standard curve was madeby serial dilutions of the standard (1:2). The standardcurve ranged from 7 pmol l21 to 432 pmol l21. An aliquotof 25ml from each dilution was used in the standardcurve. The antibody and tracer were added to the samplesand the standard curve and incubated overnight at roomtemperature. On the third day, 500ml precipitating reagentwere added to the tubes and, after incubation for 30 minat room temperature, the tubes were centrifuged for30 min at 4 8C. The detection limit of the assay was16 pmol l21. The intra-assay coefficients of variation were7% for the low, 3% for the medium and 9% for the highcontrol. The inter-assay coefficients of variations forthe low, medium and high controls were 14%, 6% and9% respectively.
IGF-I concentrations in plasma were measured in allsamples by double-antibody RIA (Gluckman et al. 1983).Interference by binding proteins was minimised by acid-ethanol cryoprecipitation, as validated for ruminantsamples (Breier et al. 1991). The samples were assayed asduplicate 100ml aliquots and the limit of detection was3.0 ng/ml. Six replicates of two control samples containing7.7 and 27.7 ng/ml were included in the assay and wereused to estimate the intra-assay variation (10.5% and6.9%).
Leptin was analysed in all samples by RIA using anti-bodies raised in an emu (Blache et al. 2000). The sampleswere assayed as duplicate 100ml aliquots and the limit ofdetection was 0.1 ng/ml. Six replicates of three controlsamples containing 1.3, 1.6 and 2.4 ng/ml were includedin the assay. The intra-assay coefficients of variation were6.9%, 7.9% and 10.2%. All the samples were analysed inone assay.
Insulin concentrations were measured in all samples bya direct solid-phase radioimmunoassay (RIA) using DPCkits (Diagnostic Product Co.). According to the manufac-turer, the sensitivity of the assay is 8.6 pmol l21. For low(14 pmol l21), medium (251 pmol l21) and high(667 pmol l21) controls, the intra-assay coefficients of vari-ation were 11%, 5% and 2% and the inter-assay coeffi-cients of variation were 38%, 7% and 4% respectively.
Glucose concentrations were measured in fresh bloodfrom one hour before until six hours after feeding (10samples each day, Fig. 1) using an Elite glucose meter(Bayer, Montevideo, Uruguay). The normal reading was inthe range of 20 to 600 mg/dl21.
Statistical analyses
The number of follicular waves and the number of ovula-tory follicles in three size classes (#5 mm, 6 mm and.6 mm) were compared using Fisher’s exact probabilitytest. The morphological characteristics of the largestfollicle of the last non-ovulatory wave and the ovulatorywave were compared by analysis of variance using
302 C Vinoles and others
Reproduction (2005) 129 299–309 www.reproduction-online.org
the mixed procedure of the Statistical Analysis System(SAS Institute Inc., Carg, NC, USA). The model includedthe fixed effect of treatment and the random effect of ewewithin group. For the analysis of repeated measurements,the mixed procedure of the SAS was used. The modelincluded the fixed effects of treatment and day, and theirinteraction. The covariance structure was modelled usingthe random effect of ewe within group plus autoregressiveorder 1, to account for the correlation between sequentialmeasurements within the same animal (Littell et al. 2000).Data with repeated measurements included: (1) bodyweight, (2) body condition, (3) plasma concentrations ofprogesterone, FSH, oestradiol, IGF-I and leptin, all ofwhich were analysed considering the period before treat-ment (day 0 to day 8) as a covariate in the model, and (4)plasma concentrations of glucose, insulin, leptin and IGF-Iincluded the fixed effect of time after feeding in themodel. Mean values were compared by the method ofLeast Square Means. The relationships between increasesin FSH concentrations and follicular wave emergencewere analysed using a skewness method (Vinoles et al.2002). Profiles of oestradiol and androstenedione associ-ated with the growing profile of the largest follicle of thelast two waves of the interovulatory interval were studiedindividually. For each ewe and each hormone, the base-line and standard deviation of the baseline value were cal-culated as the average of the lowest 25% of all valuesmeasured. The time at which the concentration of a hor-mone began to increase was defined as the time when atleast two consecutive values increased above the baselineby threefold the standard deviation of the baseline. Factorsaffecting plasma leptin concentrations were evaluated bymultiple regression analysis using a backwards eliminationprocedure in SAS, using the data obtained during the fre-quent bleeding. The mean values for concentrations ofleptin, glucose, insulin, and IGF-I from 22 to 6 h afterfeeding (period 1; n ¼ 30), and for leptin, insulin andIGF-I from 7 and 24 h after feeding (period 2; n ¼ 30),were calculated. The dependent variable was plasma lep-tin concentrations and the independent variables includedgroup, day, period and plasma concentrations of glucose,insulin and IGF-I. Since the effects of period and glucoseconcentrations were not significant in the model, a meanfor the 24-h period was calculated for leptin, insulin andIGF-I and included in the final model (n ¼ 30). Data arepresented as least square means ^ S.E.M. Differences wereconsidered significant if P , 0.05.
Results
Body weight and body condition score
Body condition score and body weight were similar ingroups C (1.8 ^ 0.1 and 36.3 ^ 0.7 kg respectively) andSTS (1.9 ^ 0.1 and 36.0 ^ 0.7 kg respectively) during theperiod before treatment, but body weight was higher inthe STS group (38.3 ^ 0.7 kg) than in the C group
(36.2 ^ 0.7 kg; P , 0.01) during the period after nutri-tional treatment, perhaps due to the increased ruminaland intestinal content in the supplemented animals.
Follicular measurements
Ewes from the STS group developed fewer follicularwaves than ewes from the C group (2.9 ^ 0.1 vs3.4 ^ 0.2; P , 0.05). In the STS group, 9 of the 10 ewesdeveloped three follicular waves while the other ewedeveloped two waves during the cycle. Ewes in thecontrol group developed three (n ¼ 6) and four (n ¼ 4)follicular waves. The mean time of emergence of the lastnon-ovulatory wave and the ovulatory wave was ondays 5.5 ^ 0.7 and 11 ^ 0.7 for the STS group and ondays 5.8 ^ 0.7 and 12 ^ 0.7 for the C group respectively.
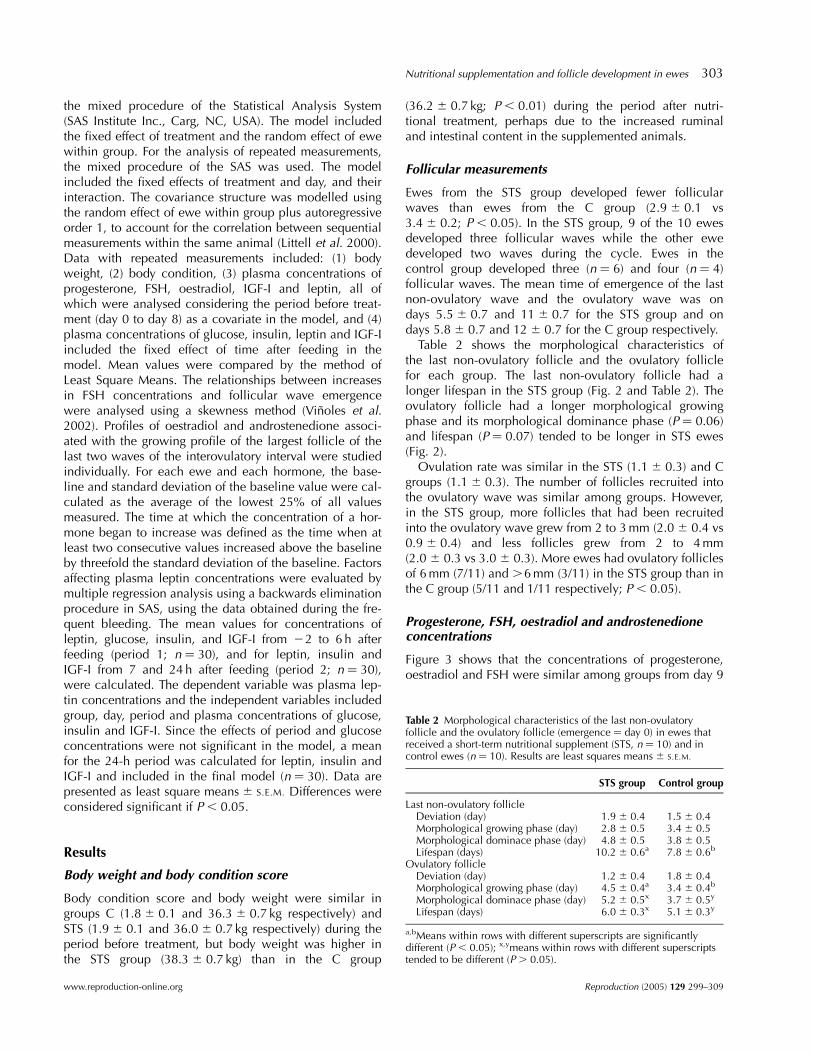
Table 2 shows the morphological characteristics ofthe last non-ovulatory follicle and the ovulatory folliclefor each group. The last non-ovulatory follicle had alonger lifespan in the STS group (Fig. 2 and Table 2). Theovulatory follicle had a longer morphological growingphase and its morphological dominance phase (P ¼ 0.06)and lifespan (P ¼ 0.07) tended to be longer in STS ewes(Fig. 2).
Ovulation rate was similar in the STS (1.1 ^ 0.3) and Cgroups (1.1 ^ 0.3). The number of follicles recruited intothe ovulatory wave was similar among groups. However,in the STS group, more follicles that had been recruitedinto the ovulatory wave grew from 2 to 3 mm (2.0 ^ 0.4 vs0.9 ^ 0.4) and less follicles grew from 2 to 4 mm(2.0 ^ 0.3 vs 3.0 ^ 0.3). More ewes had ovulatory folliclesof 6 mm (7/11) and .6 mm (3/11) in the STS group than inthe C group (5/11 and 1/11 respectively; P , 0.05).
Progesterone, FSH, oestradiol and androstenedioneconcentrations
Figure 3 shows that the concentrations of progesterone,oestradiol and FSH were similar among groups from day 9
Table 2 Morphological characteristics of the last non-ovulatoryfollicle and the ovulatory follicle (emergence ¼ day 0) in ewes thatreceived a short-term nutritional supplement (STS, n ¼ 10) and incontrol ewes (n ¼ 10). Results are least squares means ^ S.E.M.
STS group Control group
Last non-ovulatory follicleDeviation (day) 1.9 ^ 0.4 1.5 ^ 0.4Morphological growing phase (day) 2.8 ^ 0.5 3.4 ^ 0.5Morphological dominace phase (day) 4.8 ^ 0.5 3.8 ^ 0.5Lifespan (days) 10.2 ^ 0.6a 7.8 ^ 0.6b
Ovulatory follicleDeviation (day) 1.2 ^ 0.4 1.8 ^ 0.4Morphological growing phase (day) 4.5 ^ 0.4a 3.4 ^ 0.4b
Morphological dominace phase (day) 5.2 ^ 0.5x 3.7 ^ 0.5y
Lifespan (days) 6.0 ^ 0.3x 5.1 ^ 0.3y
a,bMeans within rows with different superscripts are significantlydifferent (P , 0.05); x,ymeans within rows with different superscriptstended to be different (P . 0.05).
Nutritional supplementation and follicle development in ewes 303
www.reproduction-online.org Reproduction (2005) 129 299–309

to day 17 of the oestrous cycle (Fig. 3). Concentrations ofFSH reached a maximum (2.3 ^ 0.2mg l21) 1.3 ^ 0.2days before the emergence of the ovulatory wave,remained high for 1.6 ^ 0.2 days and fell to minimumvalues 2.5 ^ 0.2 days after wave emergence. Oestradiolconcentrations reached a maximum (19.5 ^ 0.9 pmol l21)4.1 ^ 0.3 days after emergence and remained high for2.9 ^ 0.2 days. Androstenedione concentrations reacheda maximum (356 ^ 30 pmol l21) 3.9 ^ 0.4 days afteremergence and remained high for 1.0 ^ 0.1 days.
Leptin and IGF-I concentrations
Figure 3 shows that leptin concentrations were higher inSTS than in C ewes from day 10 to day 13 of the oestrouscycle (P , 0.05). In both groups, leptin concentrationsstarted to increase on day 9 of the oestrous cycle and thendecreased from day 11 to the end of the oestrous cycle.
Plasma leptin concentrations fluctuated with time rela-tive to feeding but there was no clear post-prandial surge(Fig. 4). In the STS group, leptin concentrations werehigher on day 11 than on days 9 and 14 while, in the Cgroup, leptin concentrations were lower on day 14 thanon days 9 and 11 (P , 0.05), in agreement with theobserved decrease in leptin concentrations from day 11 ofthe cycle (Fig. 3). Factors affecting plasma leptin concen-trations were group, day and plasma insulin concen-trations (P , 0.001; r2 ¼ 0.5; n ¼ 30). The effects ofperiod (22 to 6 h and 7 to 24 h after feeding) and glucoseconcentrations were not significant.
The IGF-I pattern was similar in STS and control ewes(Fig. 3). IGF-I concentrations decreased from days 9 to11–12 (P , 0.05) and increased from day 14 to day 17 ofthe oestrous cycle (P , 0.001). The effects of time afterfeeding, day and their interaction were all significant(P , 0.001). Figure 4 shows that IGF-I concentrationswere higher on day 9 than on days 11 and 14 in both STSand control ewes (P , 0.001), in agreement with thepattern observed during the oestrous cycle (Fig. 3).
Glucose and insulin concentrations
Glucose concentrations decreased in both groups from21 h to 1.5 h relative to feeding (P , 0.05) and increasedgradually from 2 to 5 h after feeding (P , 0.001) on days9, 11 and 14 (Fig. 4). In the control group, glucose con-centrations were similar on days 9 and 11 but increasedon day 14 (P , 0.001). In STS ewes, glucose concen-trations on days 11 and 14 were higher than on day 9(P , 0.001). Glucose concentrations on day 11 were con-sistently higher in STS than in control ewes (Fig. 4).
Plasma insulin concentrations also changed after feed-ing and the changes were more pronounced in STS ewes.In the control ewes, insulin concentrations were similaron days 9 and 11 but increased on day 14 (P , 0.001;Fig. 4). In STS ewes, insulin concentrations increased fromday 9 to day 11 and decreased on day 14, although thevalues on day 14 were still higher than those on day 9(P , 0.001). Plasma insulin concentrations were higherin STS than in C ewes on days 9, 11 and 14 (P , 0.001;Fig. 4), with the greatest difference between groups beingobserved on day 11.
Discussion
Short-term supplementation with corn grain and soybeanmeal from days 9 to 14 of the oestrous cycle prolongedthe lifespan of the last non-ovulatory follicle and thusdecreased the number of follicle waves. This effect wasnot associated with changes in FSH concentrations, but itwas correlated with an increase in the circulating concen-trations of glucose, insulin and leptin. The short-term sup-plementation did not affect ovulation rate.
The static effect of nutrition is consistently associatedwith an increase in ovulation rate (Rhind & McNeilly1986, Rhind et al. 1989, Xu et al. 1989). We have pre-viously found that ewes in high body condition have ahigh ovulation rate which is accompanied by high FSHand low oestradiol concentrations during the follicular
Figure 2 Growth profile of the last non-ovulatory follicle (LNOF) and the ovulatory follicle (OF) in ewes that received a short-term nutritionalsupplement (STS, n ¼ 10, †) and in ewes fed at maintenance level (n ¼ 10, W). Results are least squares means ^ S.E.M.
304 C Vinoles and others
Reproduction (2005) 129 299–309 www.reproduction-online.org

phase, compared with ewes in low body condition(Vinoles et al. 2002). However, the effectiveness of theimmediate effect of nutrition in increasing ovulation rateis not consistent (Stewart 1990). In the present study, a6-day nutritional treatment, fed from days 9 to 14 of theoestrous cycle, did not affect ovulation rate. However, a7-day supplement fed from days 8 to 14 of the oestrouscycle in the same breed and during the same season,increased ovulation rate by 14% (Vinoles 2003). Theinconsistent effect of short-term supplementation on ovu-lation rate suggests that an increase in ovulation rate may
depend on follicular status at the beginning of the nutri-tional treatment, among other factors.
At the beginning of the treatment, the last non-ovula-tory follicle was at the end of its growing phase and thesupplementation prolonged its lifespan (Fig. 2). Thisdelayed atresia may have been induced by changes in thecirculating concentrations of glucose and metabolic hor-mones. Insulin concentrations increased from the first dayof supplementation, with maximum values for glucoseand insulin observed on the third day after supplemen-tation commenced, in agreement with Teleni et al.(1989a). Insulin has a direct effect on adipocytes to stimu-late leptin secretion (Poretsky et al. 1999, Marie et al.2001). In our study, the supplement increased leptin con-centrations from the second to the fifth day of supplemen-tation, with higher values on the third day after the startof feeding. We suggest that increasing concentrations ofglucose, insulin and leptin, from the first to the third dayof feeding, prolonged the lifespan of the last non-ovula-tory follicle and thus delayed the occurrence of atresia,slowing down follicle turnover (fewer follicular waves insupplemented ewes).
The impact of a short-term supplementation at the ovar-ian level may depend upon hormone dynamics. In sup-plemented ewes, peak glucose, insulin and leptinconcentrations occurred one day before ovulatory waveemergence. Although we are aware of the limitations ofultrasonography for determining follicles in smaller sizeclasses (Vinoles et al. 2004), the supplement increased thenumber of follicles growing from 2 to 3 mm. However,fewer follicles continued to grow up to 4 mm one dayafter ovulatory wave emergence compared with theuntreated controls. If increased concentrations of glucose,insulin and leptin are important signals for the initialstimulation of gonadotrophin-responsive follicles, theirconcentrations may need to remain high in order to pro-mote the selection of more than one follicle into the ovu-latory wave. Still, high but decreasing concentrations ofinsulin and leptin on the fifth day of supplementationstimulated the ovulatory follicle to grow for a longerperiod, thus increasing the proportion of ewes withfollicles larger than 6 mm. Similarly, Munoz-Gutierrezet al. (2002) found that the diameter of aromatase-positivefollicles was increased by a nutritional supplement(lupins), and follicles .6 mm in diameter were seen onlyin supplemented ewes. Alternatively, increased concen-trations of metabolic hormones favoured the selectedfollicle which exerted its dominant effect and reduced thenumber of follicles reaching 4 mm in supplemented ewes.
The changes in follicle development observed in thepresent study were independent of FSH action. The resultsof this study and a previous one (Vinoles et al. 2002)suggest that the static and the immediate effects of nutri-tion on follicle development are not mediated throughcommon mechanisms, since, unlike the static effect, theimmediate effect of nutrition is not mediated by changesin the FSH–oestradiol feedback system, but by an increase
Figure 3 Changes in the concentrations of progesterone (diamonds)and oestradiol (triangles; top panel), FSH (triangles, middle panel),and leptin (circles) and IGF-I (squares; bottom panel) from days 9 to17 of the oestrous cycle in ewes that received a short-term nutritionalsupplement (STS, n ¼ 10) from day 9 to 14 of the oestrous cycle(solid symbols) and in ewes fed at maintenance level (n ¼ 10, opensymbols). Results are least squares means ^ S.E.M.
Nutritional supplementation and follicle development in ewes 305
www.reproduction-online.org Reproduction (2005) 129 299–309

in glucose, insulin and leptin concentrations (Fig. 5).Glucose and metabolic hormones act directly at the ovar-ian level to regulate steroidogenesis (Poretsky et al. 1999,Williams et al. 2001, Munoz-Gutierrez et al. 2004). Insu-lin and glucose infused together decrease the secretion ofandrostenedione and, to a lesser extent, oestradiol, whileleptin can directly attenuate insulin-induced steroidogen-esis in theca and granulosa cells (Spicer & Francisco1997, Downing et al. 1999). In this study, androstene-dione and oestradiol concentrations were similar amongsupplemented and control ewes, suggesting that theimmediate effect of nutrition is not acting via the regu-lation of steroidogenesis, but most probably by stimulating
glucose uptake by the follicles (Fig. 5, Munoz-Gutierrezet al. 2004).
The pool of follicles available for the action of glucoseand metabolic hormones may play a key role in stimulat-ing an increase in ovulation rate. Ewes in high body con-dition had a higher number of gonadotrophin-dependentfollicles than did ewes in low body condition (Rhind &McNeilly 1986, Rhind et al. 1989, Xu et al. 1989, Vinoleset al. 2002). Moreover, a better response to nutritionalsupplementation has been described in ewes that are inhigh rather than low body condition (Leury et al. 1990).We suggest that the lack of an increase in ovulation rateobserved in this study may be due to the low body
Figure 4 Concentrations of glucose in entire blood, and plasma concentrations of insulin, leptin and IGF-I, during the first (day 9), third (day 11)and sixth (day 14) days after the start of a short-term supplement in supplemented ewes (X; n ¼ 5) and in control ewes fed a maintenance diet(W; n ¼ 5). Horizontal dotted line, time of feeding. Results are least square means ^ S.E.M.
306 C Vinoles and others
Reproduction (2005) 129 299–309 www.reproduction-online.org
condition of the animals, since metabolic signals actingon a larger pool of follicles may have a better chance ofrescuing follicles from atresia, thus increasing ovulationrate.
IGF-I plays a critical role in the selection of the domi-nant follicle and stimulates glucose metabolism by actingthrough the type I receptor (Fortune et al. 2004, Munoz-Gutierrez et al. 2004). In the present experiment, plasmaIGF-I concentrations were similar between supplementedand control ewes, as shown in other studies (Downinget al. 1995). However, circulating concentrations of IGF-Imay not be a good indicator of the amount available tothe follicle, since IGF-I availability is regulated byproteases and binding proteins produced at the level ofthe follicle (Roche 1996, Mihm & Austin 2002, Fortuneet al. 2004). Short-term nutritional supplementationdecreases the percentage of IGF binding protein-2 positivefollicles and changes the expression of mRNA IGF-I recep-tor (Munoz-Gutierrez et al. 2004) so, if IGF-I is involvedin the response of the follicles to improved nutrition, thenstudies of the follicular microenvironment are necessaryto clarify its role.
Our findings suggest that the effect of a short-term nutri-tional supplement on follicle development may be
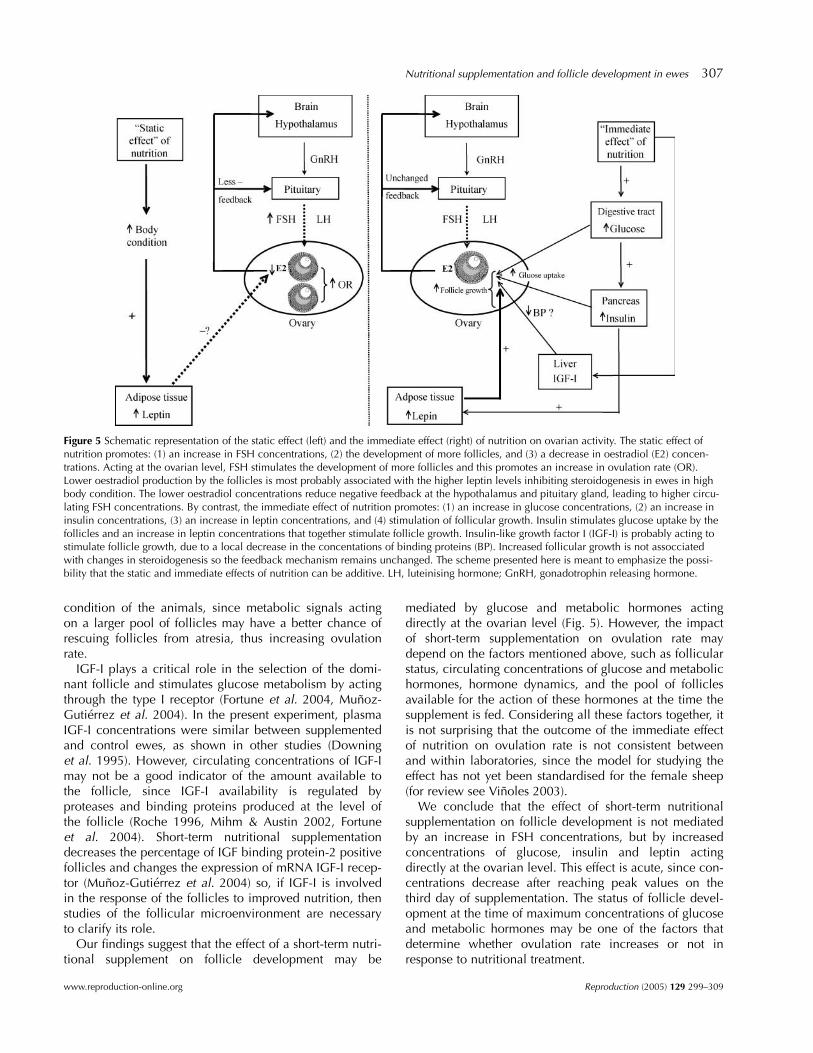
mediated by glucose and metabolic hormones actingdirectly at the ovarian level (Fig. 5). However, the impactof short-term supplementation on ovulation rate maydepend on the factors mentioned above, such as follicularstatus, circulating concentrations of glucose and metabolichormones, hormone dynamics, and the pool of folliclesavailable for the action of these hormones at the time thesupplement is fed. Considering all these factors together, itis not surprising that the outcome of the immediate effectof nutrition on ovulation rate is not consistent betweenand within laboratories, since the model for studying theeffect has not yet been standardised for the female sheep(for review see Vinoles 2003).
We conclude that the effect of short-term nutritionalsupplementation on follicle development is not mediatedby an increase in FSH concentrations, but by increasedconcentrations of glucose, insulin and leptin actingdirectly at the ovarian level. This effect is acute, since con-centrations decrease after reaching peak values on thethird day of supplementation. The status of follicle devel-opment at the time of maximum concentrations of glucoseand metabolic hormones may be one of the factors thatdetermine whether ovulation rate increases or not inresponse to nutritional treatment.
Figure 5 Schematic representation of the static effect (left) and the immediate effect (right) of nutrition on ovarian activity. The static effect ofnutrition promotes: (1) an increase in FSH concentrations, (2) the development of more follicles, and (3) a decrease in oestradiol (E2) concen-trations. Acting at the ovarian level, FSH stimulates the development of more follicles and this promotes an increase in ovulation rate (OR).Lower oestradiol production by the follicles is most probably associated with the higher leptin levels inhibiting steroidogenesis in ewes in highbody condition. The lower oestradiol concentrations reduce negative feedback at the hypothalamus and pituitary gland, leading to higher circu-lating FSH concentrations. By contrast, the immediate effect of nutrition promotes: (1) an increase in glucose concentrations, (2) an increase ininsulin concentrations, (3) an increase in leptin concentrations, and (4) stimulation of follicular growth. Insulin stimulates glucose uptake by thefollicles and an increase in leptin concentrations that together stimulate follicle growth. Insulin-like growth factor I (IGF-I) is probably acting tostimulate follicle growth, due to a local decrease in the concentations of binding proteins (BP). Increased follicular growth is not assocciatedwith changes in steroidogenesis so the feedback mechanism remains unchanged. The scheme presented here is meant to emphasize the possi-bility that the static and immediate effects of nutrition can be additive. LH, luteinising hormone; GnRH, gonadotrophin releasing hormone.
Nutritional supplementation and follicle development in ewes 307
www.reproduction-online.org Reproduction (2005) 129 299–309
Acknowledgements
The authors wish to thank R Garcıa and O Caseres for theirexcellent work and R Quadrelli for his support during thefrequent blood sampling. We are grateful to E van Lier for heradvice with the catheterisation procedure. Thanks are due toY Pardinas for placing all the facilities of the ExperimentalStation ‘Banado de Medina’, Agronomy Faculty in Uruguay atour disposal. Thanks to Fatro Laboratory for the donation ofprostaglandin and J C Sosa for the donation of mineral salt.We are grateful to E Rubianes for technical cooperation. Weare grateful to M A Carlsson (SLU) for developing the andros-tenedione assay and to N Lundeheim and R Littell for theiradvice in statistical analyses. We would also like to thank DBlache, M Blackberry and K Hunt at the RIA Laboratory ofAnimal Science (UWA) for their support in the hormoneanalyses and J Milton for his advice in nutritional equations.We acknowledge Dr A F Parlow, and the NHPP and NIDDKfor reagents to perform the FSH assay. The authors declarethat there is no conflict of interest that would prejudice theimpartiality of this scientific work.
References
AFRC, 1993 In Energy and Protein Requirements of Ruminants, Anadvisor manual prepared by the AFRC technical committee onresponses to nutrients Wallingford, UK: CAB International.
Blache D, Tellam RL, Chagas LM, Blackberry MA, Vercoe PE &Martin GB 2000 Level of nutrition affects leptin concentrations inplasma and cerebrospinal fluid in sheep. Journal of Endocrinology165 625–637.
Blache D, Adam CL & Martin GB 2002 The mature male sheep: amodel to study the effects of nutrition on the reproductive axis.Reproduction Supplement 59 219–233.
Breier BH, Gallaher BW & Gluckman PD 1991 Radioimmunoassayfor insulin-like growth factor-I: solutions to some potential pro-blems and pitfalls. Journal of Endocrinology 128 347–357.
Cunningham MJ, Clifton DK & Steiner RA 1999 Leptin’s actions onthe reproductive axis: perspectives and mechanisms. Biology ofReproduction 60 216–222.
Downing JA & Scaramuzzi RJ 1991 Nutrient effects on ovulationrate, ovarian function and the secretion of gonadotrophic andmetabolic hormones in sheep. Journal of Reproduction andFertility 43 (Suppl) 209–227.
Downing JA, Joss J & Scaramuzzi RJ 1995 Ovulation rate andthe concentrations of gonadotrophins and metabolic hormonesin ewes infused with glucose during the late luteal phase of theoestrous cycle. Journal of Endocrinology 146 403–410.
Downing JA, Joss J & Scaramuzzi RJ 1999 The effect of a direct arter-ial infusion of insulin and glucose on the ovarian secretion rates ofandrostenedione and oestradiol in ewes with an autotransplantedovary. Journal of Endocrinology 163 531–541.
Findlay JK & Cumming IA 1976 FSH in the ewe: effects of season,live weight and plane of nutrition on plasma FSH and ovulationrate. Biology of Reproduction 15 335–342.
Fortune JE, Rivera GM & Yang MY 2004 Follicular development: therole of follicular microenvironment in selection of the dominantfollicle. Animal Reproduction Science 82–83 109–126.
Gherardi PB & Lindsay DR 1982 Response of ewes to lupin sup-plementation at different times of the breeding season. AustralianJournal of Experimental Agriculture and Animal Husbandry 22264–267.
Ginther OJ, Wiltbank MC, Fricke PM, Gibbons JR & Kot K1996 Selection of the dominant follicle in cattle. Biology ofReproduction 55 1187–1194.
Gluckman PD, Johnson-Barrett JJ, Butler JH, Edgar BW & Gunn TR1983 Studies on insulin-like growth factor-I and -II by specificradioligand assays in umbilical cord blood. Clinical Endocrinology19 405–413.
Leury BJ, Murray PJ & Rowe JB 1990 Effect of nutrition on theresponse in ovulation rate in Merino ewes following short-termlupin supplementation and insulin administration. AustralianJournal of Agricultural Research 41 751–759.
Littell RC, Pendergast J & Natarajan R 2000 Modelling covariancestructure in the analysis of repeated measures data. Statisticsin Medicine 19 1793–1819.
MAAF 1975 In Energy Allowances and Feeding Systems for Rumi-nants. London, UK: Her Majesty’s Stationery Office.
Marie M, Findlay PA, Thomas L & Adam CL 2001 Daily patterns ofplasma leptin in sheep: effects of photoperiod and food intake.Journal of Endocrinology 170 277–286.
Meikle A, Tasende C, Rodriguez M & Garofalo EG 1997 Effects ofestradiol and progesterone on the reproductive tract and on uterinesex steroid receptors in female lambs. Theriogenology 481105–1113.
Mihm M & Austin EJ 2002 The final stages of dominant follicle selec-tion in cattle. Domestic Animal Endocrinology 23 155–166.
Monget P & Martin GB 1997 Involvement of insulin-like growthfactors in the interactions between nutrition and reproduction infemale mammals. Human Reproduction 12 (Suppl 1) 33–52.
Munoz-Gutierrez M, Blache D, Martin GB & Scaramuzzi RJ 2002Folliculogenesis and ovarian expression of mRNA encodingaromatase in anoestrous sheep after 5 days of glucose or glucosa-mine infusion or supplementary lupin feeding. Reproduction 124721–731.
Munoz-Gutierrez M, Blache D, Martin GB & Scaramuzzi RJ 2004Ovarian follicular expression of mRNA encoding the type 1 insulinlike growth factor receptor (IGF-IR) and insulin like growth factorbinding protein 2 (IGFBP2) in anoestrous sheep after 5 days ofglucose, glucosamine or supplementary feeding with lupin grain.Reproduction 128 747–756.
Nottle MB, Armstrong DT, Setchell BP & Seamark RF 1985 Lupinfeeding and folliculogenesis in the Merino ewe. Proceedings of theNutrition Society of Australia 10 145.
Nottle MB, Seamark RF & Setchell BP 1990 Feeding lupin grain forsix days prior to a cloprostenol-induced luteolysis can increaseovulation rate in sheep irrespective of when in the oestrous cyclesupplementation commences. Reproduction, Fertility and Develop-ment 2 189–192.
Oddy VH, Robards GE & Low SG 1993 Prediction of in vivo drymatter digestibility from the fibre and nitrogen content of a feed.In Feed Information and Animal Production. Proceedings of theSecond Symposium of the International Network of Feed Infor-mation Centers, pp 395–398. Eds GE Robards & RG Packham.Canberra: Commonwealth Agricultural Bureaux.
Oldham CM & Lindsay DR 1984 The minimum period of intakeof lupin grain required by ewes to increase their ovulation ratewhen grazing dry summer pasture. In Reproduction in Sheep,pp 274–276 Eds DR Lindsay & DT Pearce. Canberra: AustralianAcademy of Science Australian Wool Corporation.
Poretsky L, Cataldo NA, Rosenwaks Z & Giudice LC 1999 Theinsulin-related ovarian regulatory system in health and disease.Endocrinology Review 20 535–582.
Rhind SM & McNeilly AS 1986 Follicle populations, ovulation ratesand plasma profiles of LH, FSH and prolactin in Scottish Blackfaceewes in high and low levels of body condition. Animal Reproduc-tion Science 10 105–115.
Rhind SM, Leslie LD, Gunn RG & Doney JM 1985 Plasma FSH, LH,prolactin and progesterone profiles of Cheviot ewes with differentlevels of intake before and after mating, and associated effects onreproductive performance. Animal Reproduction Science 8301–313.
Rhind SM, McMillen S, McKelvey WA, Rodriguez-Herrejon FF &McNeilly AS 1989 Effect of the body condition of ewes on
308 C Vinoles and others
Reproduction (2005) 129 299–309 www.reproduction-online.org

the secretion of LH and FSH and the pituitary response to gonado-trophin-releasing hormone. Journal of Endocrinology 120 497–502.
Roche JF 1996 Control and regulation of follicologenesis – a sym-posium in perspective. Reviews of Reproduction 1 19–27.
Rubianes E, Ungerfeld R, Vinoles C, Rivero A & Adams GP 1997Ovarian response to gonadotropin treatment initiated relativeto wave emergence in ultrasonographically monitored ewes.Theriogenology 47 1479–1488.
Scaramuzzi RJ & Radford HM 1983 Factors regulating ovulation ratein the ewe. Journal of Reproduction and Fertility 69 353–367.
Scaramuzzi RJ, Murray JF, Downing JA & Campbell BK 1999 Theeffects of exogenous growth hormone on follicular steroidsecretion and ovulation rate in sheep. Domestic Animal Endocrin-ology 17 269–277.
Smith AJ & Stewart RD 1990 Effects of nutrition on the ovulation rateof ewes. In Reproductive Physiology of Merino Sheep: Conceptsand Consequences, pp 85–101. Eds. CM Oldham, GB Martin &IW Purvis. Canberra: School of Agriculture (Animal Science) TheUniversity of Western Australia.
Souza CJ, Campbell BK & Baird DT 1997 Follicular dynamics andovarian steroid secretion in sheep during the follicular and earlyluteal phases of the estrous cycle. Biology of Reproduction 56483–488.
Spicer LJ & Francisco CC 1997 The adipose obese gene product,leptin: evidence of a direct inhibitory role in ovarian function.Endocrinology 138 3374–3379.
Stewart R 1990 The effect of nutrition on the ovulation rate of theewe. Doctoral Thesis, p 206 Perth: Department of Animal Science,University of Western Australia.
Stewart R & Oldham CM 1986 Feeding lupins to ewes for four daysduring the luteal phase can increase ovulation rate. Proceedings ofthe Australian Society of Animal Production 16 367–370.
Suiter J 1994 Body condition scoring in sheep and goats. Farmnonte69 94.
Teleni E, King WR, Rowe JB & McDowell GH 1989a Lupins andenergy-yielding nutrients in ewes. I. Glucose and acetate bio-kinetics and metabolic hormones in sheep fed a supplement oflupin grain. Australian Journal of Agricultural Research 40913–924.
Teleni E, Rowe JB, Croker KP, Murray PJ & King WR 1989bLupins and energy-yielding nutrients in ewes. II. Responses in
ovulation rate in ewes to increased availability of glucose, acetateand amino acids. Reproduction, Fertility and Development 1117–125.
Vinoles C 2000 Some aspects on the effects of estrous synchroniza-tion treatments on ovarian dynamics in the cyclic ewe. LicentiateThesis 86. Uppsala, Sweden: Department of Clinical Chemistry,Swedish University of Agricultural Sciences, Faculty of VeterinaryMedicine.
Vinoles C 2003 Effect of nutrition on follicle development and ovu-lation rate in the ewe Doctoral Thesis, p. 109. Uppsala, Sweden:Department of Clinical Chemistry, Swedish University of Agricul-tural Sciences, Faculty of Veterinary Medicine.
Vinoles C, Meikle A, Forsberg M & Rubianes E 1999 The effect ofsubluteal levels of exogenous progesterone on follicular dynamicsand endocrine patterns during early luteal phase of the ewe.Theriogenology 51 1351–1361.
Vinoles C, Forsberg M, Banchero G & Rubianes E 2001 Effect oflong-term and short-term progestagen treatment on folliculardevelopment and pregnancy rate in cyclic ewes. Theriogenology55 993–1004.
Vinoles C, Forsberg M, Banchero G & Rubianes E 2002 Ovarianfollicular dynamics and endocrine profiles in Polwarth ewes withhigh and low body condition. Animal Science 74 539–545.
Vinoles C, Meikle A & Forsberg M 2004 Accuracy of evaluation ofovarian structures by transrectal ultrasonography in ewes. AnimalReproduction Science 80 69–79.
Williams SA, Blache D, Martin GB, Foot R, Blackberry MA &Scaramuzzi RJ 2001 Effect of nutritional supplementation onquantities of glucose transporters 1 and 4 in sheep granulosa andtheca cells. Reproduction 122 947–956.
Xu ZZ, McDonald MF & McCutcheon SN 1989 The effects ofnutritionally induced liveweight differences on follicular develop-ment, ovulation rate, oestrus activity and plasma follicle stimulat-ing hormone levels in the ewe. Animal Reproduction Science 1967–78.
Received 28 October 2004First decision 22 November 2004Accepted 22 November 2004
Nutritional supplementation and follicle development in ewes 309
www.reproduction-online.org Reproduction (2005) 129 299–309