shear wall tests and finite element analysis of
399
APPROVED: Cheng Yu, Major Professor Seifollah Nasrazadani, Committee Member Phillip R. Foster, Committee Member Rick Haws, Committee Member Nourredine Boubekri, Chair of the Department of Engineering Technology Tsatsoulis Costas, Dean of the College of Engineering Sandra L. Terrell, Dean of the Robert B. Toulouse School of Graduate Studies SHEAR WALL TESTS AND FINITE ELEMENT ANALYSIS OF COLD‐FORMED STEEL STRUCTURAL MEMBERS Hitesh Vora Thesis Prepared for the Degree of MASTER OF SCIENCE UNIVERSITY OF NORTH TEXAS December 2008
-
Upload
khangminh22 -
Category
Documents
-
view
1 -
download
0
Transcript of shear wall tests and finite element analysis of
APPROVED: Cheng Yu, Major Professor Seifollah Nasrazadani, Committee Member Phillip R. Foster, Committee Member Rick Haws, Committee Member Nourredine Boubekri, Chair of the Department of
Engineering Technology Tsatsoulis Costas, Dean of the College of
Engineering Sandra L. Terrell, Dean of the Robert B. Toulouse
School of Graduate Studies
SHEAR WALL TESTS AND FINITE ELEMENT ANALYSIS OF
COLD‐FORMED STEEL STRUCTURAL MEMBERS
Hitesh Vora
Thesis Prepared for the Degree of
MASTER OF SCIENCE
UNIVERSITY OF NORTH TEXAS
December 2008

Vora, Hitesh, Shear Wall Tests and Finite Element Analysis of Cold‐Formed Steel
Structural Members, Master of Science (Engineering Systems), December 2008, 390
pages, 26 tables, 58 figures, 39 references.
The research was focused on the three major structural elements of a typical
cold‐formed steel building – shear wall, floor joist, and column. Part 1 of the thesis
explored wider options in the steel sheet sheathing for shear walls. An experimental
research was conducted on 0.030 in and 0.033 in. (2:1 and 4:1 aspect ratios) and 0.027
in. (2:1 aspect ratio) steel sheet shear walls and the results provided nominal shear
strengths for the American Iron and Steel Institute Lateral Design Standard.
Part 2 of this thesis optimized the web hole profile for a new generation C‐joist,
and the web crippling strength was analyzed by finite element analysis. The results
indicated an average 43% increase of web crippling strength for the new C‐joist
compared to the normal C‐joist without web hole.
To improve the structural efficiency of a cold‐formed steel column, a new
generation sigma (NGS) shaped column section was developed in Part 3 of this thesis.
The geometry of NGS was optimized by the elastic and inelastic analysis using finite strip
and finite element analysis. The results showed an average increment in axial
compression strength for a single NGS section over a C‐section was 117% for a 2 ft. long
section and 135% for an 8 ft. long section; and for a double NGS section over a C‐section
was 75% for a 2 ft. long section and 103% for an 8 ft. long section.

Copyright 2008
by
Hitesh Vora
ii

ACKNOWLEDGEMENT
This thesis could not have been written without the mentorship of Dr. Cheng Yu.
He not only served as my major professor but also encouraged and challenged me
throughout my academic program. I am truly thankful to Dr. Cheng Yu for providing me
this valuable learning opportunity, excellent guidance, attention and time. I would like
to express gratitude to my professors and committee members – Dr. Seifollah
Nasrazadani, and Dr. Phillip R. Foster – for their support and guidance throughout my
graduate program and in completing this thesis. I thank Dr. Nourredine Boubekri, Chair
of the Department of Engineering Technology, for his time and support. I express my
gratitude to my committee member and industrial representative, Mr. Rick Haws,
NuconSteel, for his support in this project.
The research assistant sponsorship of NuconSteel and the donation of materials
by NuconSteel, SSMA, and Simpson Strong‐Tie Company, Inc., for the first part of my
research are gratefully acknowledged. The assistance of lab technician Bobby Grimes
and Chris Matheson in setting up the facilities has been invaluable. Pradeep Kumar and
Jimmy Tucker both University of North Texas students, involved in the specimen
preparation, and the project could not be completed without their contributions.
Last but not least, I would also like to thank my family for their support and
encouragement throughout my studies in United States of America.
iii

TABLE OF CONTENTS
LIST OF FIGURES……………………………………………………………………………………………………… vi
LIST OF TABLES……………………………………………………………………………………………………….. viii
CHAPTER I INTRODUCTION……………..……………….…..………………..…......................... 1
1.1 Cold‐Formed Steel Shear Walls……………………………………………… 3
1.2 Cold‐Formed Steel C‐Joist……………………………………………………... 8
1.3 Cold‐Formed Steel Column……………………………………………………. 21
CHAPTER II TESTING AND ANALYSIS OF COLD‐FORMED STEEL SHEAR WALL USING STEEL SHEATHING………………………………………………………………… 30
2.1 EXPERIMENTAL APPROACH FOR COLD‐FORMED STEEL SHEAR
WALLS…………………………………………………………………………………… 30
2.1.1 Test Setup…...…………………………………………………………. 32
2.1.2 Test Procedure……………………………………………………….. 36
2.1.3 Test Specimen – Main Group………………………………….. 38
2.1.4 Test Specimen – Supporting Group…………………………. 47
2.2 RESULTS AND DISCUSSION……………………………………………………. 50
2.2.1 Shear Wall Tests for Specimens in Main Group………. 50
2.2.2 Shear Wall Tests for Specimens in Supporting Group 60
2.2.3 Material Properties…………………………………………………. 66
2.3 SUMMARY ……………………………………………………………………………. 68
CHAPTER III OPTIMIZATION AND ANALYSIS OF COLD‐FORMED STEEL C‐ JOIST WITH EDGE STIFFENED WEB HOLES………………………………………………… 72
3.1 FINITE ELEMENT APPROACH FOR COLD‐FORMED STEEL C‐
JOIST……..…………………………………………………………………………….. 72
3.2 RESULTS AND DISCUSSION…………………………………………………… 78
3.2.1 Optimization of New Generation C‐Joist in Web
Crippling………………………………………..……………………….. 78
3.2.2 Elastic and Inelastic Analysis of New Generation C‐
Joist …………………………………………….…………………………. 83
3.3 SUMMARY …………………..………………………………………………….…… 87
iv
CHAPTER IV FINITE ELEMENT ANALYSIS OF INNOVATIVE COLD‐FORMED STEEL COLUMN SECTION………………………………………………………………………….. 88
4.1 FINITE STRIP AND FINITE ELEMENT APPROACH FOR COLD‐
FORMED STEEL COLUMN……………………………………………………... 88
4.1.1 Elastic Analysis of Single NGS Section to Optimize
the Profile Shape………………………………………………..….. 92
4.1.2 Elastic Analysis of Double NGS Section to Optimize
the Profile Shape…………………………………………………… 97
4.1.3 Inelastic Analysis of Optimized Profile of Single and
Double NGS Section……….…………………………………….. 101
4.1.4 Comparison between NGS Section and SigmaStud®
Section………………………………………………………………….. 108
4.2 RESULTS AND DISCUSSION……………………………………………………. 110
4.3 SUMMARY …………………..………………………………………………………. 115
CHAPTER V CONCLUSIONS………………………………………………………………………………… 117
APPENDIX A MONOTONIC TESTS OF SHEAR WALLS…………………………………………….. 120 APPENDIX B CYCLIC TESTS OF SHEAR WALLS………………………………………………………. 181 APPENDIX C ADDITIONAL TESTS OF SHEAR WALLS……………………………………………… 242 APPENDIX D INELASTIC ANALYSIS OF WEB CRIPPLING OF C‐JOIST IN ABAQUS....... 253
APPENDIX E FINITE STRIP ANALYSIS OF SINGLE C‐JOIST VERSUS SINGLE NGS JOIST……………………………………………………………………………………………….. 266
APPENDIX F FINITE STRIP ANALYSIS OF SINGLE C‐JOIST VERSUS DOUBLE NGS JOIST……………………………………………………………………………………………….. 319
APPENDIX G INELASTIC ANALYSIS OF SINGLE AND DOUBLE NGS SECTION IN ABAQUS………………………………………………………………………………………….. 372
REFERENCES…………………………………………………………………………………………………………… 387
v

LIST OF FIGURES
Figure 1.1 Shear walls…………………………………………………………………………………….. 3 Figure 1.2 Joist with edge stiffened web holes……………………………………………….. 9 Figure 1.3 C‐section with web holes……………………………………………………………….. 10 Figure 1.4 Loading conditions for web crippling tests ………………….………………… 13 Figure 1.5 Types of compression members…………………………………………………….. 21 Figure 1.6 C‐section with different profile shape on the web…………………………. 22 Figure 1.7 Double section………………………………………………………………………………. 23 Figure 1.8 Types of Columns…………………………………………………………………………… 24 Figure 1.9 Buckling modes of cold‐formed steel C‐section……………………………… 26
Figure 2.1 Front view of the reaction frame…………………………………………………… 32
Figure 2.2 Back view of the reaction frame…………………………………………………….. 33
Figure 2.3 The schematic of the test setup (Yu 2008)……………………………………… 34
Figure 2.4 Close up of the top of the wall specimen……………………………………….. 34
Figure 2.5 CUREE basic loading history (0.2 HZ)……………………………………………… 37
Figure 2.6 Dimensions of 8 ft. X 4 ft. Wall assembly (Yu 2008)……........…………… 39
Figure 2.7 Dimensions of 8 ft. X 8 ft. Wall assembly (Yu 2008)……........…………… 39
Figure 2.8 Typical screw spacing schedule (2 in./12 in. As shown) (Yu 2008)..... 40
Figure 2.9 Definition of test label for 8 ft. X 4 ft. Wall (Main Group)………………. 42
Figure 2.10 Definition of test label for 8 ft. X 2 ft. Wall (Main Group)………………. 42
Figure 2.11 Locations of the measured gap……………………………………………………… 44
Figure 2.12 Screw installed on inner stud (2 in./12 in.)…………………………………….. 48
Figure 2.13 Staggered screw patterns (2 in./12 in.)………………………………………….. 48
Figure 2.14 Typical failure modes for 4 ft. X 8 ft. Wall in Monotonic test…………. 52
Figure 2.15 Buckling of double studs for 2 ft. X 8 ft. Wall 2 in./12 in. Screw spacing………………………………………………………………………………………….
52
Figure 2.16 Observed hysteresis curve for test 4x8x43x33‐4/12‐C1………………… 55
Figure 2.17 Failure mode for test 4x8x43x33‐4/12‐C1…………………………………….. 56
Figure 2.18 Observed hysteresis curve for test 4x8x43x30‐2/12‐C1………………… 57
Figure 2.19 Failure mode for test 4x8x43x30‐2/12‐C1…………………………………….. 57
Figure 2.20 Observed hysteresis curve for test 2x8x43x33‐6‐C1………………..……. 58 Figure 2.21 Failure mode for test 2x8x43x33‐6‐C1………………………………………….. 59
vi

Figure 2.22 Comparison of the performance of No. 10 and No. 8 screws…………. 61 Figure 2.23 Stud failure of 4 ft. X 8 ft. Walls in Monotonic tests……………………….. 62 Figure 2.24 Observed stud failure in test A‐5……………………………………………………. 63 Figure 2.25 Setup for axial compression tests…………………………………………………… 64 Figure 2.26 INSTRON® 4482 universal testing machine……………………………………. 66 Figure 2.27 Nominal strengths for wind loads versus fastener spacing at panel
edges…………………………………………………………………………….………………. 68 Figure 2.28 Nominal strengths for seismic loads versus fastener spacing at
panel edges……………………………………………………………………………………. 69 Figure 3.1 Product identification code……………………………………………………………. 72 Figure 3.2 Nomenclature for the C‐Joist…………………………………………………………. 73 Figure 3.3 ITF boundary condition for web crippling test……………………………….. 74 Figure 3.4 Finite element model after analysis……………………………………………….. 76 Figure 3.5 Typical peak load versus displacement curve…………………………………. 76 Figure 3.6 Comparison of peak load value of 600s162‐33 C‐Joist……………………. 79 Figure 3.7 Definition of geometric imperfections…………………………………………… 83 Figure 4.1 Finite strip and finite element model…………………………………………….. 88 Figure 4.2 Nomenclature of the NGS section………………………………………………….. 90 Figure 4.3 Member identification code…………………………………………………………… 92 Figure 4.4 Buckling curve for the single 600S200‐54 NGS section…………………… 93 Figure 4.5 Buckling curve comparison for the single 600S200‐54 NGS section 95 Figure 4.6 Double NGS section in CUFSM……………………………………………………….. 97 Figure 4.7 Buckling curve for the single 600S200‐54 NGS section…………………… 98 Figure 4.8 Buckling curve comparison for the single 600S200‐54 NGS section 99 Figure 4.9 Finite element model of double NGS Section in ABAQUS………………. 103 Figure 4.10 Boundary conditions for double NGS section………………………………… 105 Figure 4.11 Failure mode of double NGS section……………………………………………… 106 Figure 4.12 Load versus displacement curve……………………………………………………. 107 Figure 4.13 Sigma shape section………………………………………………………………………. 108 Figure 4.14 Sigma section drawn from inscribed the circle………………………………. 109
vii
LIST OF TABLES
Table 2.1 CUREE basic loading history...…………………………………………………………. 37
Table 2.2 Test matrix for shear wall tests in the main group…………………………… 43
Table 2.3 Measured gap between double stud and tracks for monotonic test walls (main group)…………………..……………………………………………………… 45
Table 2.4 Measured gap between double stud and tracks for cyclic test walls (main group)…………………..………………………………………………………………. 46
Table 2.5 Configuration of the additional shear wall tests (supporting group)……….……………………………………………………………………………………. 49
Table 2.6 Measured gap between double stud and tracks for cyclic test walls (supporting group)…………………..……………………………………………………… 49
Table 2.7 Monotonic test results for shear walls (main group).....………………….. 53
Table 2.8 CUREE cyclic test results for shear walls (main group).....……………….. 54
Table 2.9 Results of the additional shear wall tests (main group)….……………….. 60
Table 2.10 Result of the axial compression tests………………………………………………. 65
Table 2.11 Coupon test results…………………………………………………………………………. 67
Table 2.12 Recommended nominal shear strength for wind load for shear walls.………………………………………………………………………………….…………… 70
Table 2.13 Recommended nominal shear strength for seismic load for shear walls.……………………………………………………………………………………….……….. 70
Table 3.1 C‐section selected from SSMA catalogue…………………………………….….… 72
Table 3.2 Results matrix of inelastic analysis for 600s162‐33 C‐Joist………….…….. 78
Table 3.3 Peak load values at best ratio………………….……………………………………….. 80
Table 3.4 Result matrix of C‐Joist…………………….…….…………………………………..……. 81
Table 3.5 Comparison matrix for C‐Joist.…………………………………………………….……. 85
Table 4.1 C‐sections selected from the SSMA catalogue…………………………..……… 90
Table 4.2 Test matrix for inelastic analysis……………………………………………….……… 101
Table 4.3 Member identification code………………..…………………………………………… 102
Table 4.4 Best d/h ratio………………………….………………………………………..……………… 110
Table 4.5 Result matrix of inelastic analysis………………………………………….…………. 112
Table 4.6 Overall performance of NGS sections………………………………….……………. 113
Table 4.7 Comparison of NGS section with SigmaStud® section……………………….. 114
Table 4.8 Overall performance of NGS section with SigmaStud® section…………. 114
viii

CHAPTER I
INTRODUCTION
The uses of cold‐formed steel structural members have been increased in recent
years both in both commercial and residential building (Wei‐Wen Yu 2000). This is
mainly because cold‐formed steel members are light in weight; stronger and stiffer;
easily produced in mass quantities; easily installed and erected; easily transported and
100% recyclable.
Cold‐formed steel structural members can be categories into two major types:
(1) individual structural framing members and (2) Panels and decks. The major function
of an individual structural framing member is to carry loads, provide structural strength
and stiffness. The usual shapes such as C‐sections, Z sections, angles, hat sections, I‐
sections, T‐sections and tubular members of cold‐formed sections are generally used in
structural framing. Load carrying panels and decks are used for roof decks, floor decks,
wall panels, siding material, and bridge forms. The panels and decks can provide useful
surface for floor, roof, and wall constructions as well as provide enclosed cells for
electrical conduit and water pipes. The panels and decks can be perforated and
combined with sound absorption materials to form acoustically conditioned ceilings.
The major structural components used for building are wall studs, floor and ceiling
joists, roof rafters, roof and floor trusses, decks, and panels.
1

This research comprehensively studied the cold‐formed steel buildings; three
structural components – shear walls, joists, and columns – have been selected for the
present research. The research mainly focuses on the testing and analyzing of these
three structural components. The whole research is split into three parts and each part
of the research is discussed in separate chapters. The chapter once gives the
introduction, literature reviews and the research objectives of these three structural
components. The second chapter of thesis discusses the experimental research and
analysis of cold‐formed steel shear walls (Part 1). The third chapter of thesis focuses on
the optimization and analysis of cold‐formed steel new generation C‐joist (Part 2). Finite
element analysis of innovative cold‐formed steel column section (Part 3) is discussed in
the fourth chapter.
2
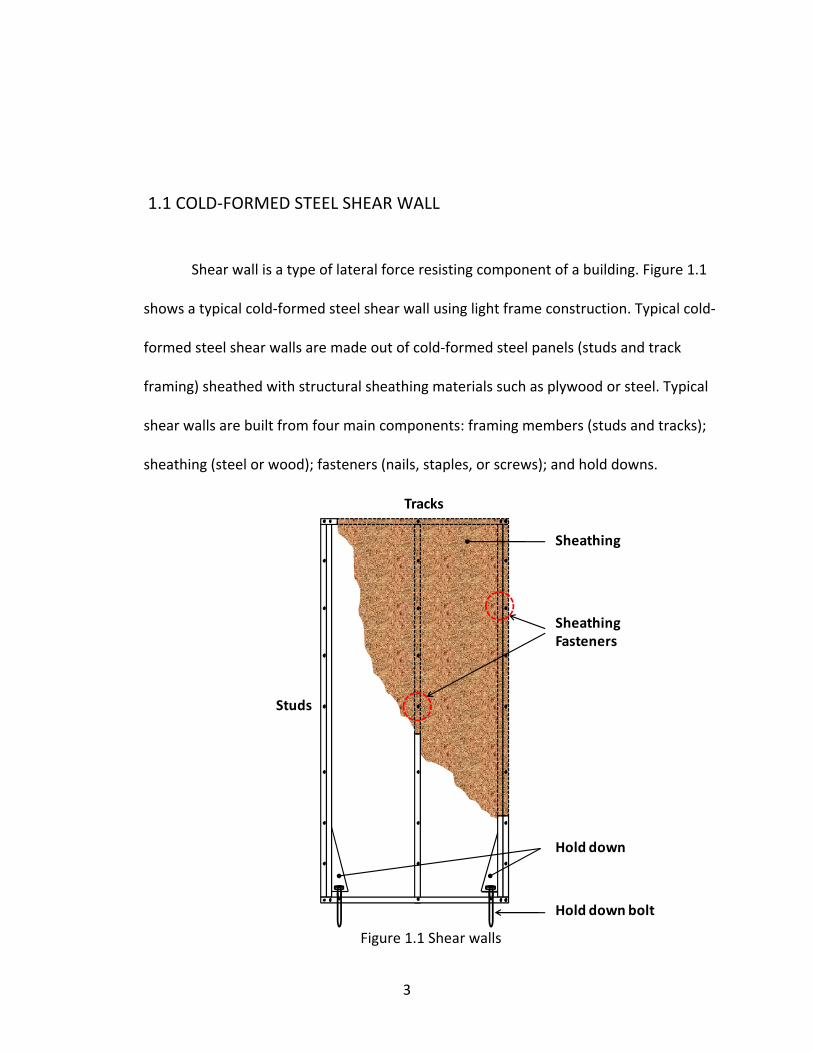
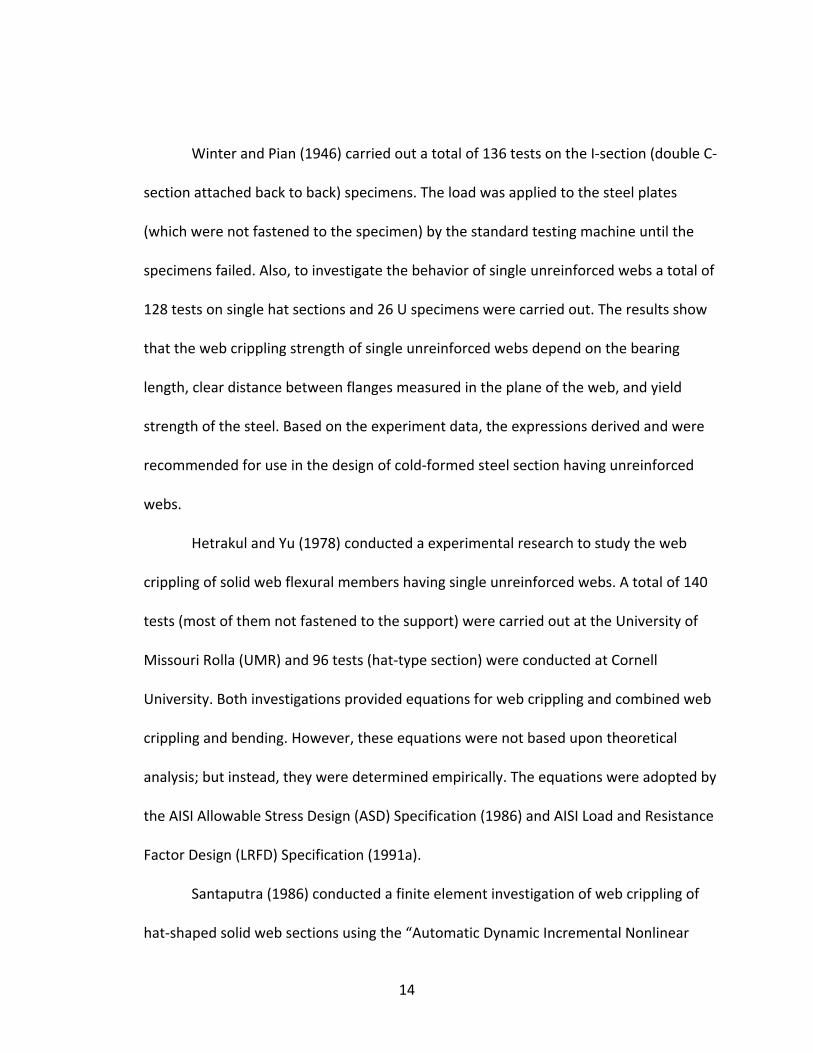
1.1 COLD‐FORMED STEEL SHEAR WALL
Shear wall is a type of lateral force resisting component of a building. Figure 1.1
shows a typical cold‐formed steel shear wall using light frame construction. Typical cold‐
formed steel shear walls are made out of cold‐formed steel panels (studs and track
framing) sheathed with structural sheathing materials such as plywood or steel. Typical
shear walls are built from four main components: framing members (studs and tracks);
sheathing (steel or wood); fasteners (nails, staples, or screws); and hold downs.
Studs
Tracks
Sheathing
Hold down
Sheathing Fasteners
Hold down bolt
Figure 1.1 Shear walls
3
Stud is the vertical framing member and track is the horizontal member of the
cold‐formed steel frame. Hold downs are attached to the boundary studs by the
fasteners and they are connected to the foundation or footing of the building by the
hold down bolt. When the sheathing of the cold‐formed steel shear walls is fastened
properly on stud wall assembly (frame/panel), hold downs can withstand the lateral
forces directed along the length of the wall. Hold down acts as vertical cantilevers when
the wind and earthquake forces acting on the shear walls.
Uplift force and shear force are the two forces acting on cold‐formed steel shear
walls. The hold down bolt on the shear wall resists uplift forces. The shear forces acted
on the top part of the building is collected by the track through framing fasteners. This is
then transferred through the sheathing to sheathing fasteners. The shear resistance
provided by the sheathing frame transfers this shear load to the track members of the
cold‐formed steel shear walls through the sheathing fasteners.
A number of researchers performed the parametric study on the cold‐formed
steel shear walls. Breyer (1999), Diekmann (1997), Tissel (1990), Dolan(1994), Commins
and Greg (1994) and many other researchers conducted experimental, numerical and
analytical investigations on the cold‐formed steel shear walls with various aspect ratios,
sheathing thickness and testing protocols for monotonic and cyclic tests.
However, in investigating shear wall performance, a few investigations have
focused on aspect ratio (height‐to‐length ratio) effects. Breyer (1999) emphasized the
importance of the aspect ratio of a shear wall and suggested that the lateral force was
4

uniformly distributed along the length of all shear panels. Tissel (1990) performed static
monotonic tests on 8 ft. x 8 ft. square wood walls (1:1 aspect ratio); based on his results,
the design values for wood shear walls were proposed to the American Plywood
Association (APA).
Most of the research to find strength and stiffness of shear walls were
performed by using a few aspect ratios, different materials of framing and sheathing
members and various manufacturing, and testing procedures. However, the research
was not sufficient to allow for direct comparisons among all the researches. Therefore
Salenikovich and Dolan (2000) conducted experimental and numerical analyses of wood
shear walls at Virginia Tech University using monotonic (part 1) and cyclic tests (part 2)
of full‐size shear walls with 4:1, 2:1, 1:1, and 2:3 aspect ratios (height‐to‐length ratio). It
was assumed that the failure modes of cyclic tests resembled with the actual
earthquake conditions, which was generally not seen from monotonic tests.
Salenikovich and Dolan (2000) also suggested the importance of cyclic test protocols to
be considered for cyclic tests.
The patterns of amplitudes, frequency, and the number of cycles, which make up
the cyclic test protocol, have been the subject of discussion for many years. Till date,
researchers use many different cyclic test protocols. The Structural Engineers
Association of Southern California (SEAOSC 1997) adopted a standard method of cyclic
load test for shear walls, which uses a sequential phased displacement (SPD) test
protocol.
5

In late nineties, the International Organization for Standardization (ISO)
proposed a cyclic test protocol for timber joints (ISO 1998) in which the loading
increments are derived from earlier static tests. The ISO (1998) approach is more
convenient and consistent in predicting the test cycle for cyclic tests. In addition, the
Federal Emergency Management Administration (FEMA) sponsored the Consortium
Universities for Research in Earthquake Engineering (CUREE) project in order to improve
the seismic design and construction methodologies for light‐frame wood buildings. As
an outcome of this combined research, a CUREE (2004) cyclic test protocol was
developed.
The American Iron and Steel Institute (AISI) S213 (2007), “The North American
Standard for cold‐formed steel Framing ‐ Lateral Design” provides shear strength values
for cold‐formed steel framed walls with different sheathing materials including 15/32 in.
Structural 1 plywood sheathing, 7/16 in. oriented strand board (OSB), and 0.018 in. and
0.027 in. flat steel sheet. These published values in AISI standard (AISI S213 2007) were
based on research conducted in 1996, 1997, and 2002 by Dr. Reynaud Serrette (1996,
1997, 2002) and his team at Santa Clara University, CA. Compared to wood sheathing,
the 0.027 in. and 0.018 in. steel sheet sheathing yielded relatively lower shear strength
and the test results (Serrette 1997, 2002) indicated that the buckling of the steel sheet
sheathing was the primary mode of failure for steel sheet shear walls. Also in their
research they only investigated 0.018 in. and 0.027 in. steel sheet walls with 2:1 aspect
ratio for wind load design and limited options for seismic load design. Furthermore, for
6

the 0.027 in. steel sheet walls, the published shear strength were developed according
to the test results on 4:1 aspect ratio shear wall assemblies.
The objective of the research is to develop experimental data and produce
nominal shear strengths for both wind and seismic loads for cold‐formed steel framed
shear wall assemblies with 0.033 in., 0.030 in. or 0.027 in. flat steel sheathing.
The specific goals are to determine the nominal shear strength for:
1. 0.030 in and 0.033 in. steel sheet shear walls with 2:1 and 4:1 aspect ratios
(height/width) for both wind and seismic loads,
2. 0.027 in. steel sheet shear walls with 2:1 aspect ratio for both wind and seismic
loads.
3. Fastener spacing of 6 in., 4 in., 3 in., and 2 in. at panel edges for all
configurations of interest.
7
1.2 COLD‐FORMED STEEL C‐JOIST
Joist is a horizontal supporting member in a building to support a ceiling, roof, or
floor. It may be made of wood, steel, or concrete. Joists are usually repetitive in
constant pitch and are often supported by beams. In cold‐formed steel constructions, a
channel shaped section (C‐section) is commonly used for joists.
In a cold‐formed steel structural C‐section joist, holes may be provided for
functional requirements such as piping, electrical cables, ducts and other utilities.
Openings may also be required to accommodate the transverse member, which may be
structural or non‐structural.
Traditionally, holes in the cold‐formed steel C‐section joist are flat punched. The
size of the holes and the distance between the holes are greatly restricted due to the
weakened flexural strength. To overcome these restrictions, a new generation of profile
for web holes was developed by some cold‐formed steel companies in United States.
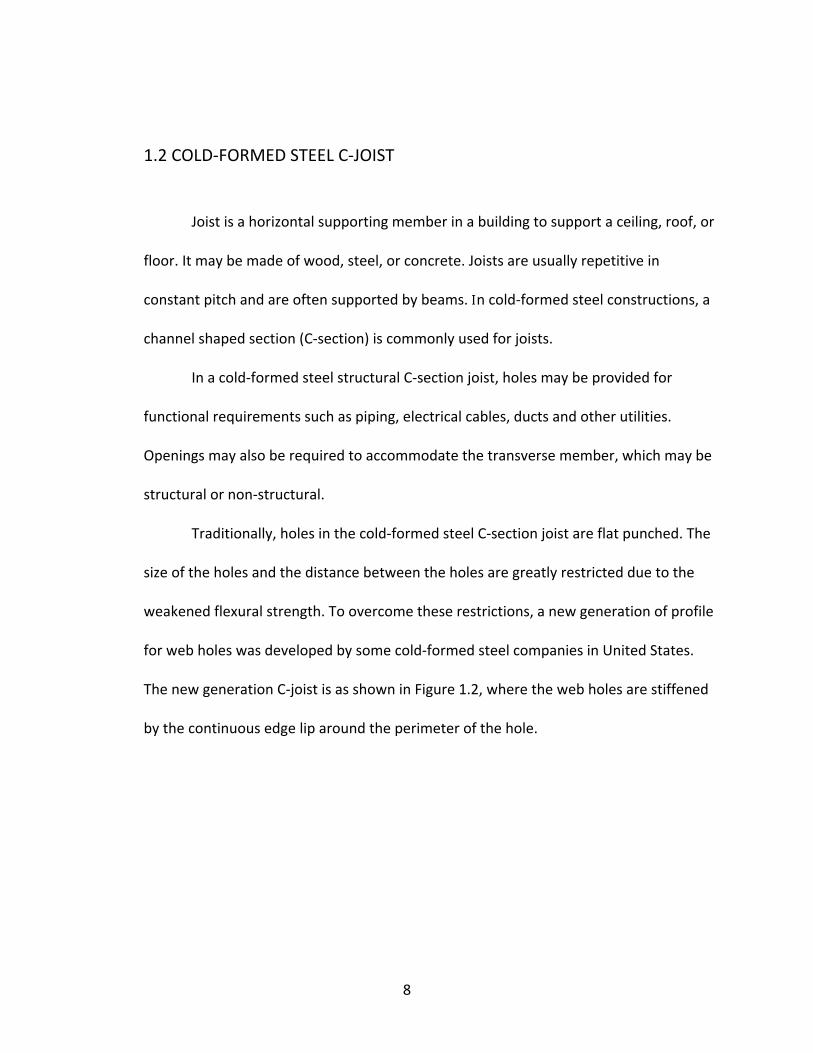
The new generation C‐joist is as shown in Figure 1.2, where the web holes are stiffened
by the continuous edge lip around the perimeter of the hole.
8

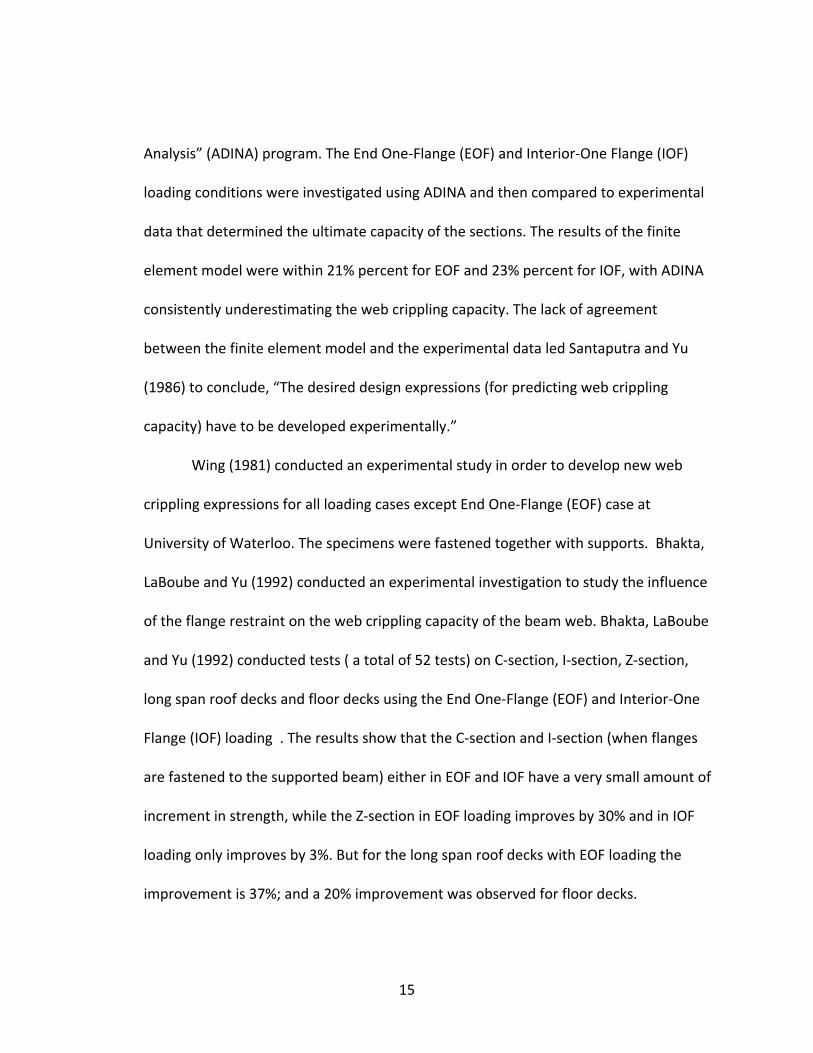
Figure 1.2 Joist with edge stiffened web holes
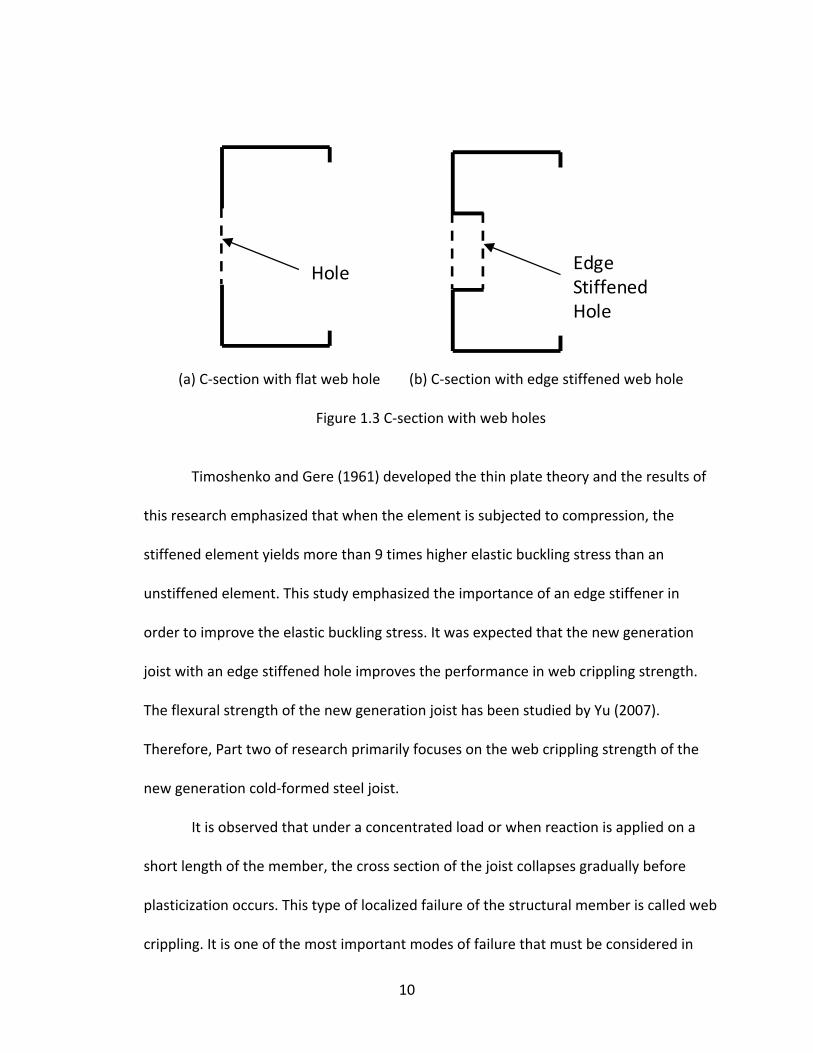
The Figure 1.3 illustrates the C‐joist and the new generation joist (C‐section with
edge stiffened hole).The boundary condition and resultant stress distribution of the web
element varies due to the new generation joist shape (edge stiffener hole on the web).
As a result, elastic and post‐buckling performance of the whole joist is altered. A flat
hole is traditionally punched on the C‐section joist as result two unstiffened elements
are created from one stiffened element (full web). Therefore, the weakest zone of the
section is located near this hole. In the new generation joist, this hole is stiffened by the
lip and the lip serves as an edge stiffener. As a result, the web consists of two stiffened
elements.
9
Hole Edge Stiffened Hole
(a) C‐section with flat web hole (b) C‐section with edge stiffened web hole
Figure 1.3 C‐section with web holes
Timoshenko and Gere (1961) developed the thin plate theory and the results of
this research emphasized that when the element is subjected to compression, the
stiffened element yields more than 9 times higher elastic buckling stress than an
unstiffened element. This study emphasized the importance of an edge stiffener in
order to improve the elastic buckling stress. It was expected that the new generation
joist with an edge stiffened hole improves the performance in web crippling strength.
The flexural strength of the new generation joist has been studied by Yu (2007).
Therefore, Part two of research primarily focuses on the web crippling strength of the
new generation cold‐formed steel joist.
It is observed that under a concentrated load or when reaction is applied on a
short length of the member, the cross section of the joist collapses gradually before
plasticization occurs. This type of localized failure of the structural member is called web
crippling. It is one of the most important modes of failure that must be considered in
10
the design of new generation joist. The behavior of the joist under web crippling
involves a complex interaction of flexural, local, and distortional buckling. Since the new
generation joist is a relatively new and there is currently no suitable tool available for
predicting the web crippling strength. Therefore, in this research, a numerical
investigation of cold‐formed C‐joist with edge stiffened web holes is analyzed by finite
element approach using ABAQUS (2003). The research objectives of this research are:
1. Study the web crippling behavior of cold‐formed C‐joist with edge stiffened web
hole under concentrated loads using a finite element analysis.
2. Optimize the geometry of cold‐formed C‐joist with edge stiffened web hole using
ITF loading condition in ABAQUS.
3. Develop a design table for the web crippling strength of the new generation
joists with optimized perforation profiles.
A number of theoretical approaches have been developed to evaluate the
theoretical elastic analysis of web crippling for cold‐formed steel C‐section joist in
different loading conditions. The theoretical approaches are mostly based on the
research work done by Euler, Timoshenko (1961). Walker, and Zetlin. However, the
results of theoretical analysis of each study vary one from one another. In order to
develop the web crippling design expression, most of the studies rely on the
experimental investigation.
11

The present AISI Specification (AISI 2007) provisions for web crippling were
initially based upon extensive experiments conducted by Winter and Pian (1946) and by
Zetlin (1955) at Cornell University throughout the 1940s and 1950s. Revisions of the AISI
Specification were primarily based on tests conducted at the University of Missouri‐
Rolla by Hetrakul and Yu (1978) and Santaputra (1986) and tests conducted at the
University of Waterloo by Prabakaran (1993) and Gerges (1997).
Winter and Pian (1946) conducted an experimental investigation of web
crippling on cold formed sections at Cornell University throughout the 1940s and 1950s.
All the investigations were carried out to investigate the web crippling strength of their
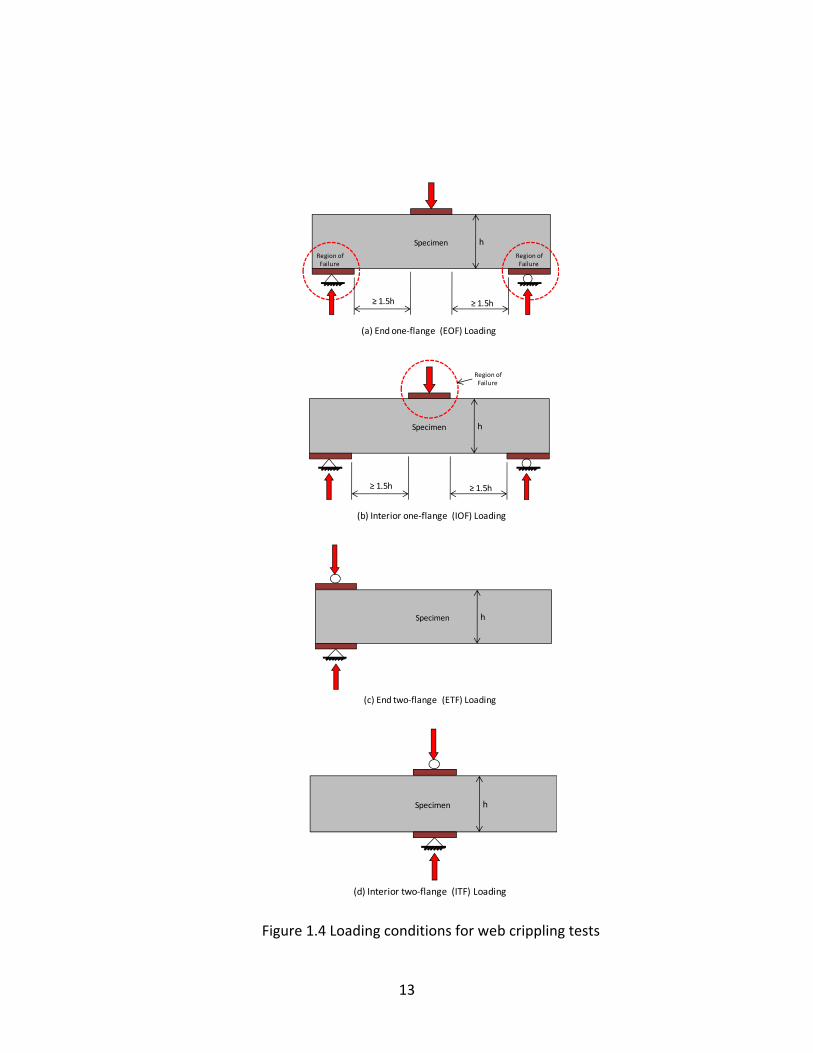
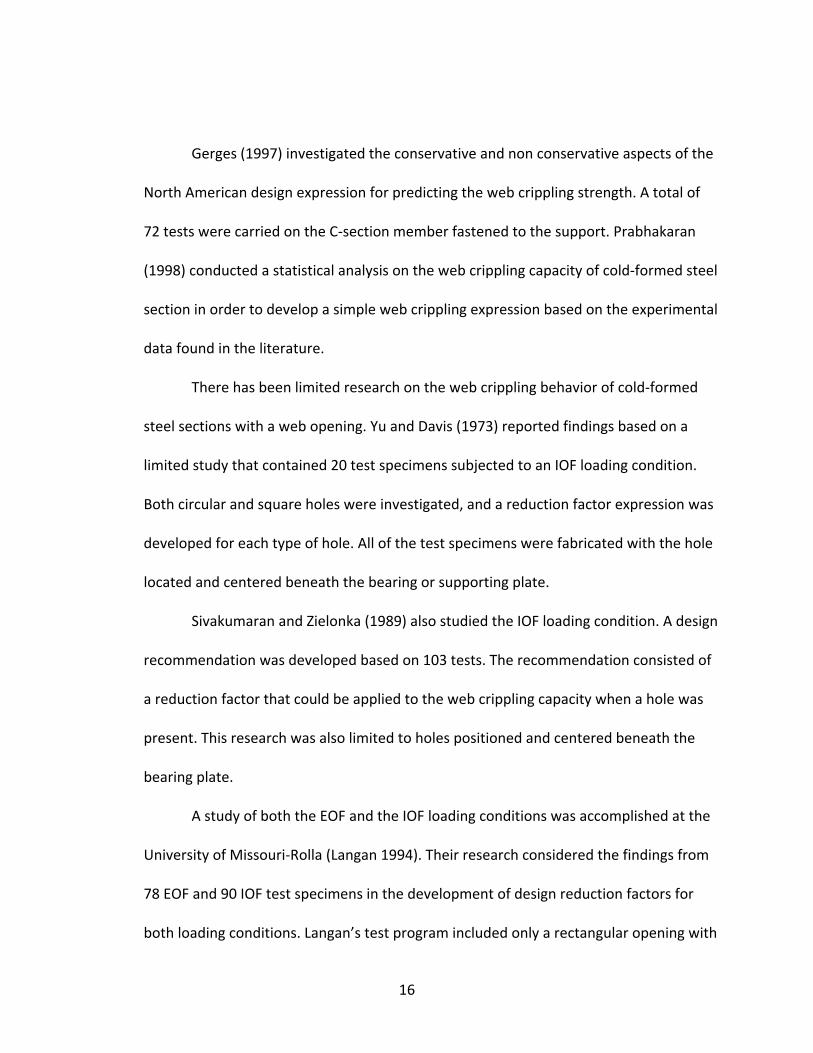
respective sections are under four loading conditions:
1. End‐One‐Flange (EOF) loading,
2. Interior‐One‐Flange (IOF) loading,
3. End‐Two‐Flange (ETF) loading, and
4. Interior‐Two‐Flange (ITF) loading.
These four loading conditions are illustrated in Figure 1.4, where the load is
applied to a bearing plate and the regions of failure are shown within the dashed circles.
12
SpecimenRegion of Failure
≥ 1.5h
hRegion of Failure
≥ 1.5h
(a) End one‐flange (EOF) Loading
Specimen
Region of Failure
≥ 1.5h
h
≥ 1.5h
(b) Interior one‐flange (IOF) Loading
Specimen h
(c) End two‐flange (ETF) Loading
Specimen h
(d) Interior two‐flange (ITF) Loading
Figure 1.4 Loading conditions for web crippling tests
13
Winter and Pian (1946) carried out a total of 136 tests on the I‐section (double C‐
section attached back to back) specimens. The load was applied to the steel plates
(which were not fastened to the specimen) by the standard testing machine until the
specimens failed. Also, to investigate the behavior of single unreinforced webs a total of
128 tests on single hat sections and 26 U specimens were carried out. The results show
that the web crippling strength of single unreinforced webs depend on the bearing
length, clear distance between flanges measured in the plane of the web, and yield
strength of the steel. Based on the experiment data, the expressions derived and were
recommended for use in the design of cold‐formed steel section having unreinforced
webs.
Hetrakul and Yu (1978) conducted a experimental research to study the web
crippling of solid web flexural members having single unreinforced webs. A total of 140
tests (most of them not fastened to the support) were carried out at the University of
Missouri Rolla (UMR) and 96 tests (hat‐type section) were conducted at Cornell
University. Both investigations provided equations for web crippling and combined web
crippling and bending. However, these equations were not based upon theoretical
analysis; but instead, they were determined empirically. The equations were adopted by
the AISI Allowable Stress Design (ASD) Specification (1986) and AISI Load and Resistance
Factor Design (LRFD) Specification (1991a).
Santaputra (1986) conducted a finite element investigation of web crippling of
hat‐shaped solid web sections using the “Automatic Dynamic Incremental Nonlinear
14
Analysis” (ADINA) program. The End One‐Flange (EOF) and Interior‐One Flange (IOF)
loading conditions were investigated using ADINA and then compared to experimental
data that determined the ultimate capacity of the sections. The results of the finite
element model were within 21% percent for EOF and 23% percent for IOF, with ADINA
consistently underestimating the web crippling capacity. The lack of agreement
between the finite element model and the experimental data led Santaputra and Yu
(1986) to conclude, “The desired design expressions (for predicting web crippling
capacity) have to be developed experimentally.”
Wing (1981) conducted an experimental study in order to develop new web
crippling expressions for all loading cases except End One‐Flange (EOF) case at
University of Waterloo. The specimens were fastened together with supports. Bhakta,
LaBoube and Yu (1992) conducted an experimental investigation to study the influence
of the flange restraint on the web crippling capacity of the beam web. Bhakta, LaBoube
and Yu (1992) conducted tests ( a total of 52 tests) on C‐section, I‐section, Z‐section,
long span roof decks and floor decks using the End One‐Flange (EOF) and Interior‐One
Flange (IOF) loading . The results show that the C‐section and I‐section (when flanges
are fastened to the supported beam) either in EOF and IOF have a very small amount of
increment in strength, while the Z‐section in EOF loading improves by 30% and in IOF
loading only improves by 3%. But for the long span roof decks with EOF loading the
improvement is 37%; and a 20% improvement was observed for floor decks.
15
Gerges (1997) investigated the conservative and non conservative aspects of the
North American design expression for predicting the web crippling strength. A total of
72 tests were carried on the C‐section member fastened to the support. Prabhakaran
(1998) conducted a statistical analysis on the web crippling capacity of cold‐formed steel
section in order to develop a simple web crippling expression based on the experimental
data found in the literature.
There has been limited research on the web crippling behavior of cold‐formed
steel sections with a web opening. Yu and Davis (1973) reported findings based on a
limited study that contained 20 test specimens subjected to an IOF loading condition.
Both circular and square holes were investigated, and a reduction factor expression was
developed for each type of hole. All of the test specimens were fabricated with the hole
located and centered beneath the bearing or supporting plate.
Sivakumaran and Zielonka (1989) also studied the IOF loading condition. A design
recommendation was developed based on 103 tests. The recommendation consisted of
a reduction factor that could be applied to the web crippling capacity when a hole was
present. This research was also limited to holes positioned and centered beneath the
bearing plate.
A study of both the EOF and the IOF loading conditions was accomplished at the
University of Missouri‐Rolla (Langan 1994). Their research considered the findings from
78 EOF and 90 IOF test specimens in the development of design reduction factors for
both loading conditions. Langan’s test program included only a rectangular opening with
16
fillet corners – the most common opening geometry used in the United States. The
openings were pre‐punched and were either 3/4 in. (19 mm) deep by 4 in.(102 mm)
long or 1 ½ in. (38 mm) deep by 4 in. (102 mm) in depth. Langan (1994) determined that
web crippling strength was influenced primarily by two parameters: the ratio of the hole
depth to the flat portion of the web, a/h, and the location of the hole as defined by the
distance of the hole from the edge of the bearing divided by the flat portion of the web,
x/h. Langan (1994) proposed two equations for reduction factor. The effect of web
crippling is precluded by either requiring that a hole be placed away from the bearing
location or; when such distance cannot be provided; reinforcement must be provided
(Steel 1990). Although research has documented the behavior of a hole on a flat plate
(Shanmugam 1996), the research is not germane to defining the web crippling behavior
of a cross section.
Few researchers have studied and investigated the Stress distribution in an edge‐
stiffened semi‐infinite elastic plate containing a circular hole. Lee and Klang (1992)
studied an edge‐stiffened semi‐infinite elastic plate containing a circular hole under
tension at infinity has been studied using a conformal mapping technique. Pertinent
stress distributions were examined to illustrate the roll of the stiffener under the
presence of a circular hole near the straight edge. It was concluded that the stiffener
contributes to indirectly suppress the stress concentration around the hole.
The current North American Specification for the design of cold‐formed steel
Structural Members (NAS 2007) does not provide design provisions for the C‐section
17
with edge stiffened holes. NAS specifically includes the provisions for C‐section webs
with flat holes under stress gradient (Section B2.4, NAS 2007). The design provisions
were developed from 57 simple tests conducted at University of Missouri‐Rolla (Shan
1994), and the specimens were C‐sections beams with standard flat holes. However, the
new generation of C‐section joists has shown significantly improved performance due to
the edge stiffened holes applicable for those members (Yu 2007). On the other hand,
because the product is newly developed, the industry has not established standards for
this type of geometric configuration.
Prabakaran and Schuster (1998) provide a recommended design equation for the
nominal web crippling strength of cold‐formed steel members subjected to End One‐
Flange (EOF), Interior‐One Flange (IOF), and Interior‐Two Flange (ITF) loading conditions
for one solid web connecting top and bottom flanges and it is the current design
method in NAS (NAS 2007). This is a consistent unified web crippling equation that can
be used by both the Load and Resistance Factor Design (LRFD) and allowable Stress
Design (ASD). The difference comes from multiplying the nominal web crippling strength
by a designated factor of safety for ASD or resistance factor for LRFD. These factors are
dependent upon the type of section being tested, the support and flange conditions,
and the load case. The coefficients used in the web crippling equation are significant and
have undergone many changes due to subsequent experimentation.
18
The current NAS Specification web crippling provisions are provided in Section
C3.4, Web Crippling Strength [Resistance] of Webs without Holes (NAS 2007). The base
web crippling equation, Eq. C3.4.1‐1, is as follows:
The web crippling equation provided in the 2007 NAS Specification calculates the
nominal web crippling strength, Pn, in a normalized and non‐dimensional format, so any
consistent system of measurement can be used. With only one equation for web
crippling, the coefficients chosen vary the base equation to become applicable for each
specific case. The coefficients are located in five tables in the NAS specification, C3.4.1‐1
to C3.4.1‐5
The review of literature reveals numerous studies that have been conducted on
the web crippling of cold‐formed steel and these researches have been used to develop
the NAS web crippling provisions. The provision for web crippling of C‐section joist with
an edge stiffener hole opening is not included in NAS (2007). This research emphasizes
the specific need for a study on the web crippling of the C‐section joist with an edge
stiffener hole opening. The literature review yielded no previously obtained information
on the web crippling of the C‐section joist with an edge stiffened hole opening. The
19

significantly improved performance of the edge stiffened web opening, in combination
with the potential for increased web crippling strength gives considerable reason to
conduct this research investigation.
20

1.3 COLD‐FORMED STEEL COLUMNS
The cold‐formed steel columns (compression members) can be used to carry a
compressive load applied through the centroid of the cross section. The cross section of
steel columns can be of any shape that may be composed entirely of stiffened elements
such as cylindrical, square or rectangular tubular sections (Figure 1.5‐a), unstiffened
elements such L shaped section (Figure 1.5‐b), or a combination of stiffened and
unstiffened elements (Figure 1.5‐c). Unusual and cylindrical tubular sections are also
often found in use. In practice, uses of cold‐formed steel columns are limited to one‐to‐
six story structures due to its less load carrying capacity.
(a) Stiffened elements
(b) Unstiffened elements
(c) Combination of both
Figure 1.5 Types of compression members
21

This research focuses on the performance of the new generation sigma (NGS)
section. The primary objective of this work is to study the advantages of half round
shapes on the web. The Steel Network Inc. (TSN®) developed a special stud known as
SigmaStud® (2008) section which is shown in Figure1.6 (B). Recently, popularity of
SigmaStud® section is gaining because of its more load carrying capacity over existing C‐
section stud. Therefore, existing C‐section and SigmaStud® section are taken under
consideration to compare the axial strength with NGS sections. All three sections are
shown in Figure 1.6.
Sigma Shapeon the Web
Half roundShape Sigma on the Web
(b) SigmaStud® (c) NGS Section
Web
(a) C‐section
Figure 1.6 C‐section with different profile shape on the web
As the demand for light‐weight steel structures continues to rise, efficient and
accurate design of cold‐formed steel elements is essential. One frequently used cold‐
formed steel column is a double member, formed by two or more attached steel
22
elements. Because of the double members’ unique characteristic to buckle under load,
either as one single member or two individual members, a specific provision for these
members exists. The design of cold‐formed steel, double section (placed back to back)
compression members is addressed in Section D1.1 of the 2007 edition of the American
Iron and Steel Institute (AISI) North American Specification for the Design of cold‐
formed steel Structural Members (NAS 2007).
To achieve the advantages of double (back to back) members, in practice,
members composed of both stiffened and unstiffened elements are fastened together
back to back, which is shown in Figure 1.7.
Both individual sections fastened together
(a) Double C‐section (b) Double NGS Section Figure 1.7 Double sections
Limited research has been conducted in the area of cold‐formed steel with
members connected to back to back (double members), and less investigation exists in
the area of members with sigma shapes on the web.
23
Columns are mainly subjected to axial forces and they may buckle under these
stresses. When section is loaded by the pure compressive load the column suddenly fails
or buckles before the loading reaches the ultimate compressive stress level. This type of
failure mode is generally known as buckling, and it is the primary mode of failure of the
columns.
Short Column Long Column
F
F
F
F
Yielding Buckling
Figure 1.8 Types of columns and mode of failure
The yielding occurs in the short compression member when loaded with
compressive stresses while, for a longer compression member the buckling is more
evident, as shown in Figure 1.8.
24
There are mainly three types of buckling modes studied in the past (found from
literatures and researches) for cold‐formed steel unstiffened (open section) columns
and it includes local buckling, distortional buckling or lateral‐torsion buckling (Euler). It
was observed that the local buckling mode predominantly controls the buckling
behavior for short columns, and the lateral‐torsion buckling mode controls the behavior
of long or slender columns. However, for intermediate lengths both (local and lateral‐
torsion) buckling modes have their own effects, and it was found that the actual
buckling capacity was lower than any of the two buckling modes.
The elastic analysis of C‐shape cold‐formed steel columns under pure
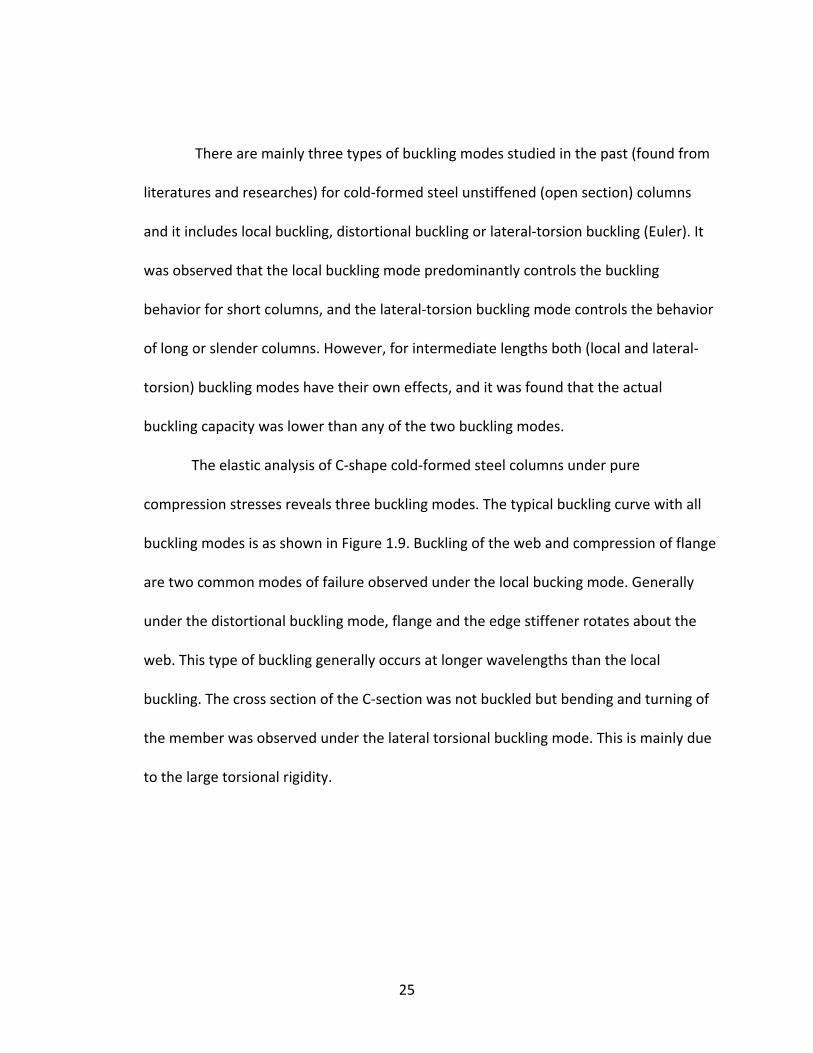
compression stresses reveals three buckling modes. The typical buckling curve with all
buckling modes is as shown in Figure 1.9. Buckling of the web and compression of flange
are two common modes of failure observed under the local bucking mode. Generally
under the distortional buckling mode, flange and the edge stiffener rotates about the
web. This type of buckling generally occurs at longer wavelengths than the local
buckling. The cross section of the C‐section was not buckled but bending and turning of
the member was observed under the lateral torsional buckling mode. This is mainly due
to the large torsional rigidity.
25
Local Buckling
Distortional BucklingLateral Torsional Buckling
Figure 1.9 Buckling modes of cold‐formed steel C‐section
The distortional buckling mode was found more significant because that buckling
stresses are higher than any of the other two buckling modes. Therefore, a huge
amount of research was done over the past 50 years to analyze distortional buckling
numerically. The history of distortional buckling of cold‐formed steel columns was
summarized by Schafer (2000). He notes that research on cold‐formed steel columns
actually began in 1940.
Hancock (1985) conducted a research to study a range of buckling modes (local,
distortional, and flexural–torsional) in lipped channel sections. His studies emphasized
that the design for certain geometries may control the distortional buckling mode. Lau
and Hancock (1987) developed a simple analytical expression to calculate the
distortional buckling stress for any geometry of cross‐section. Also, Lau and Hancock
26

(1990) worked on designing a curve for sections where the yield stress and distortional
buckling stress were approximately the same so that failure occurred before the elastic
distortional buckling stress was reached. Australian cold‐formed steel structure codes
are based on this design expressions derived by Lau and Hancock (1990).
The Generalized Beam Theory (GBT) was developed by Davies and Jiang (1996)
and was used to analyze the individual buckling modes. The algorithm used in GBT
allows explicit expressions to be derived for the critical stress and wavelength for
distortional buckling. Davies and Jiang (1998) have used this GBT method and they
found only a small fraction of time was needed for distortional buckling analyses.
Papangelis and Hancock (1998) developed a finite strip computer program
“THINWALL” to investigate local, distortional, and flexural–torsional buckling modes, but
it was restricted to simply supported end boundary conditions and a single buckle half‐
wavelength. Kwon and Hancock (1992) developed a non‐linear elastic analysis that can
handle local, distortional, and overall buckling mode in the post‐buckling range and the
interactions between them.
Schafer and Ádány (2006) indicated the uses of CUFSM in their research. They
claimed that the conventional finite strip method combined with the constrained finite
strip method provide a powerful tool for exploring cross‐section stability in cold‐formed
steel members. Therefore, the algorithms for a constrained finite strip method are
implemented in CUFSM.
27
Due to the complexity in the prediction of the buckling curve it is very difficult to
evaluate the peak loads from any finite strip analysis, but the CUFSM shows good
reliability based on past studies; and therefore, CUFSM is used for elastic analysis in my
present research.
Due to the complexity in numerical computation, it is very difficult to evaluate
the distortional bucking. Schafer (2000) suggested that if the local buckling stress is
significantly lower than the distortional buckling stress then it may be possible to ignore
distortional buckling safely. In this research work elastic analysis of cold‐formed steel
columns are analyzed by using finite strip software CUFSM (developed by Schafer‐ 2006)
to optimize the web profile of the cold‐formed steel column.
There is very limited research on the cold‐formed sigma shaped section. Also,
the majority of this research comes from outside of the United States. Mainly, because
the cold‐formed steel sigma shape is not commonly used shape in the construction
industry in the United States of America. But, the sigma shaped section is much more
popular in Europe, and this more common use correlates to the increased amount on
research of this particular type of section. The two primary uses of the sigma shape are
as roof purlins or as elements used within an industrial building frame.
28
Therefore the objectives of this research work are:
1. Study the behavior of cold‐formed steel columns under pure compression
stresses.
2. Optimize the geometry of new generation sigma shaped cold‐formed steel
columns with the help of elastic and inelastic analysis using finite strip (CUFSM)
and finite element (ABAQUS) methodologies.
3. Establish recommendations for the new generation sigma shaped channel
column, and develop a design table for the new generation cold‐formed steel
column section.
29
CHAPTER II
TESTING AND ANALYSIS OF COLD‐FORMED STEEL SHEAR WALL USING STEEL
SHEATHING
2.1 EXPERIMENTAL APPROCH FOR COLD‐FORMED STEEL SHEAR WALL
In Part 1 of the research, the work primarily involves two series of shear wall
tests referred as main group. In the first series, static (monotonic) tests were conducted
on all configurations of the designated stud walls to determine the nominal shear
strength for wind loads. The monotonic tests conform to the ASTM E564‐06 (2006)
“Standard Practice for Static Load Test for Shear Resistance of Framed Walls for
Buildings.” In the second series, reversed cyclic tests were conducted in order to obtain
the nominal shear strength for seismic loads. The reversed cyclic tests adopt CUREE
(Consortium of Universities for Research in Earthquake Engineering) protocol in
accordance with ICC AC130 (2004).
Five additional shear wall tests and three axial compression tests on wall
assemblies were also performed at the early stage of this research, to determine the
fastener size and the fastener installation pattern used for the main group specimens.
These additional tests are referred to as the supporting group in this report. Tensile
tests were conducted to obtain material properties.
30

The test program was carried out in the NUCONSTEEL Materials Testing
Laboratory at the University of North Texas. A total of 33 monotonic tests, 32 cyclic
shear wall tests, and 3 compression tests were conducted.
31
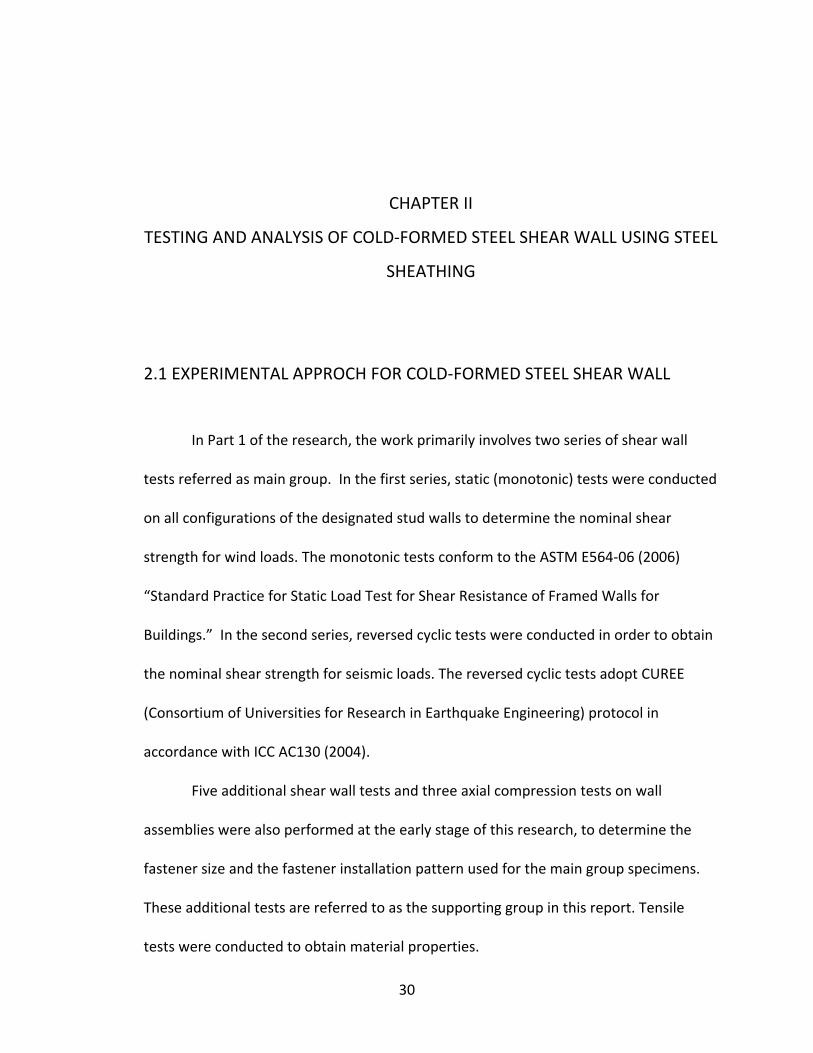
2.1.1 Test Setup
Both the monotonic and cyclic tests were performed on a 16 ft. span, 12 ft. high
adaptable testing frame. Figure 2.1 shows the front view of the testing frame with 4 ft.
by 8 ft. steel shear wall.
Lateral SupportLoad Cell
Lever
Hydraulic Actuator
Specimen
Square Tube
Base Beam
Figure 2.1 Front view of the reaction frame
All the shear wall specimens were assembled in a horizontal position and then
installed vertically in the testing frame. The 5 in. × 5 in. square tube was bolted with
grade 8‐ ½ in. hex head bolt on the top of the base beam.
32

The shear wall is bolted on the top of a 5 in. × 5 in. square tube and loaded
horizontally on the top. The rectangle pockets on the sides of the square tube provide
for easy access from the side.
Lateral SupportLoad Cell
Lever
Hydraulic Actuator
Specimen
Square Tube
Base Beam
Figure 2.2 Back view of the reaction frame
Figure 2.2 shows the back view of the frame. Figure 2.3 illustrates the schematic
view of the test setup. The out‐of‐plane displacement of the wall was prevented by a
series of steel rollers on the front side and two individual rollers on the back side of the
wall top. The rollers also worked as a guide for the T‐shape load spreader as shown in
Figure 2.4. A T‐shape load spreader was made 4½ in. wide so that the rollers did not
33

touch the specimen during the test. The T‐shape load spreader was attached to the
load cell with a hardened pin, and it was attached to the top track member of the wall
by No.12x1‐ ½ in. hex washer head self drilling screws (one pair placed every 3 in. on
center).
PositionTransducer
Lateral support
Steel base
Load cell LeverLoad spreader
MTS actuator
Figure 2.3 The schematic view of the test setup (Yu 2008)
Lateral Support
Pin
T‐shapeLoad Spreader
Load Cell
Figure 2.4 Close up of the top of the wall specimen
34
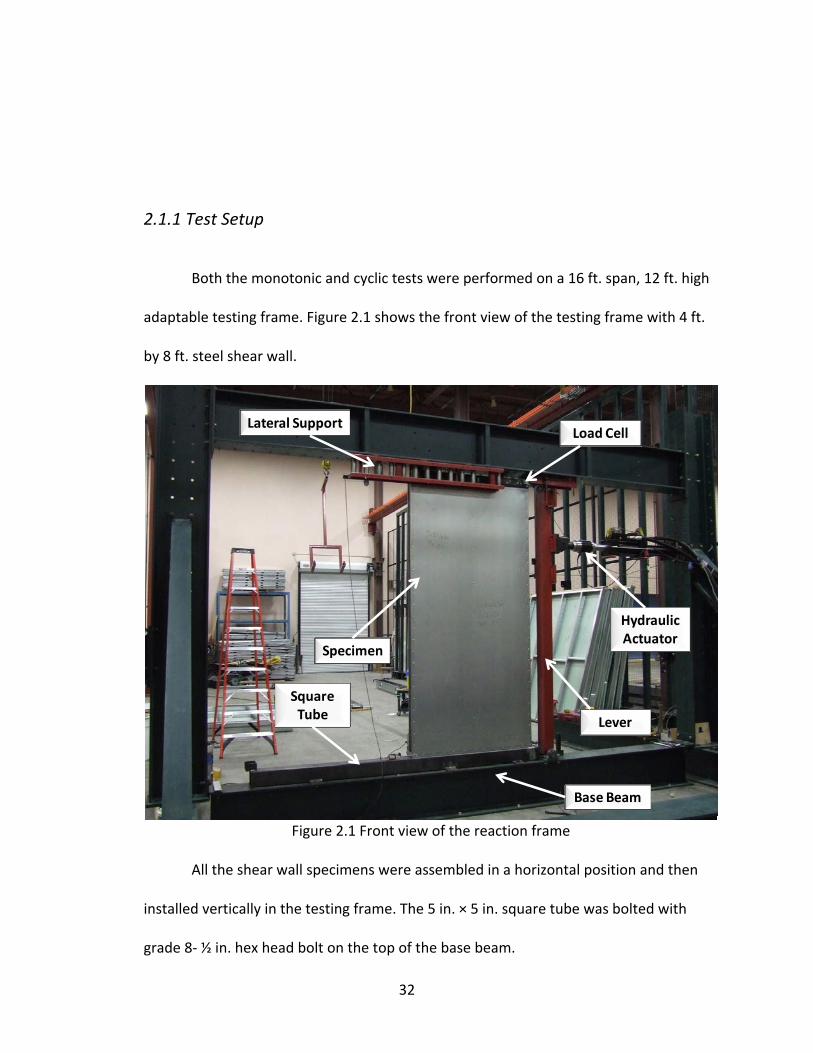
The anchorage system for monotonic tests consists of three grade 8‐ ½ in. shear
anchorage bolts with standard cut washers (reference ASME B18.22.1 (R 1998)) and one
Simpson Strong‐Tie® S/HD10S hold‐down with one grade 8‐ ½ in. bolt. For the cyclic
tests, the anchorage system includes two grade 8‐ ½ in. anchorage bolts and two
Simpson Strong‐Tie® S/HD10S hold‐downs.
The testing frame is equipped with one MTS® 35 kip 10 in. stroke hydraulic
actuator with ± 5 in. stroke, which is controlled by the MTS 407 controller. The MTS 35
kips loading system was used for both static and cyclic tests. One lever was added to the
existing test setup in order to amplify the applicable displacement while holding
relatively high load frequency and improving the performance of the hydraulic actuator.
This lever was made by a 4 in. x 4 in. hot‐rolled steel square tube; additionally; ½ in.
thick 4 in. wide plates were welded on both sides.
A 10 kip universal compression/tension load cell was placed to connect the top
of the lever to the T‐shape load spreader for force measuring. Four position transducers
(LVDTs) measured the in‐plane lateral displacements of the top and bottom tracks and
the uplift displacements of the bottom track on both ends, as shown in Figure 2.3. A
National Instrument data acquisition system was used to record the data from the
LVDTs. The applied force and five deflections were measured and recorded
instantaneously during the test.
35
2.1.2 Test Procedure
The displacement control mode was used to conduct both the monotonic and
cyclic tests. The procedure for the monotonic tests was in accordance with “ASTM E564‐
06: Standard Practice for Static Load Test for Shear Resistance of Framed Walls for
Buildings ‐ 2006)” A preload of approximately 10% of the estimated nominal load was
first applied to the specimen and held for 5 minutes to seat all connections. After the
preload was removed, an incremental loading procedure started until it failed; the load
increment was approximately 1/3 of the estimated nominal load.
For reversed cyclic tests, the CUREE protocol (in accordance with ICC AC130 ‐
2004) was chosen. Figure 2.5 shows the CUREE basic loading history including 40 cycles
with specific displacement amplitudes that are listed in Table 2.1. The specified
displacement amplitudes are based on a percentage of the ultimate deformation
capacity for monotonic tests.
The ultimate deformation capacity is defined as a portion (i.e. γ=0.60) of the
maximum inelastic response Δm which corresponds to 20% reduced post‐peak shear
resistance. However, the CUREE protocol was originally developed for wood frame
structures, and it was found in this test program that using 0.60Δm as the reference
displacement was not large enough to capture the post peak behavior of steel sheet
walls in the cyclic tests.
36
Therefore, the lower value of the 2.5% of the wall height (2.4 in. for 8 ft. high
wall) and deformation at the peak load in the monotonic tests were chosen as the
reference displacement in the CUREE protocol. A constant cycling frequency of 0.2 Hz in
the CUREE loading history was adopted for all the cyclic tests in this research.
Table 2.1 CUREE basic loading history Cycle No.
%∆m Cycle No.
%∆m Cycle No.
%∆m Cycle No.
%∆m
1 5.0 11 5.6 21 20 31 30 2 5.0 12 5.6 22 15 32 70 3 5.0 13 5.6 23 15 33 53 4 5.0 14 10 24 15 34 53 5 5.0 15 7.5 25 30 35 100 6 5.0 16 7.5 26 23 36 75 7 7.5 17 7.5 27 23 37 75 8 5.6 18 7.5 28 23 38 150 9 5.6 19 7.5 29 40 39 113 10 5.6 20 7.5 30 30 40 113
0 20 40 60 80 100 120 140 160 180 200
-150
-100
-50
0
50
100
150
Time (s)
Spe
cim
en D
ispl
acem
ent (
%Δ
)
Figure 2.5 CUREE basic loading history (0.2 Hz)
37
2.1.3 Test Specimens – Main Group
The test specimens in the main group were designed to add nominal shear
strength values to the AISI Lateral Design Standard (2004). The test matrix covered two
overall wall dimensions: 8 ft. (wide) x 4 ft. (high) (2:1 aspect ratio) and 8 ft. x 2 ft. (4:1
aspect ratio); three steel sheet thicknesses: 0.033 in., 0.030 in., 0.027 in.; and three
fastener spacing schedules on the panel edges: 6 in., 4 in., and 2 in. The 3 in. spacing
configuration was skipped in the main group and the nominal shear strength
corresponding to the 3 in. fastener spacing was expected to be obtained by
interpolating the test results of the other spacing configurations.
The dimensions of the steel frame, anchorage bolts, and the hold‐downs are
indicated in Figures 2.6 and 2.7. The framing members were assembled by No. 8‐1/2 in.
modified truss head self drilling screws. Double C‐shaped studs (back‐to‐back) were
used for both chord studs of the wall and the double studs were put together by paired
No. 8‐1/2 in. modified truss head self drilling screws spaced at 6 in. on center on the
web. The 43 mils (0.043 in.) and 33 mils (0.033 in.) SSMA (Steel Stud Manufacturers
Association) standard framing members (2007) were chosen for the wall assembles. For
the monotonic tests, one Simpson Strong‐Tie® S/HD10S hold‐down was attached to the
loaded chord stud from inside by using a total of 15 #14x1 in. HWH self‐drilling screws.
38

Two Simpson Strong‐Tie® S/HD10S hold downs, and 15 #14 x 1 in. HWH self‐drilling
screws for each hold‐down were used for the cyclic tests.
(a) Wall assembly for monotonic test (b) Wall assembly for cyclic test
Figure 2.6 Dimensions of 8 ft. x 4 ft. wall assembly (Yu 2008)
(a) Wall assembly for monotonic test (b) Wall assembly for cyclic test
Figure 2.7 Dimensions of 8 ft. x 2 ft. wall assembly (Yu 2008)
39
In this research three steel sheet sheathing thicknesses were investigated: 0.027
in., 0.030 in., and 0.033 in. The steel sheet sheathing was installed on one side of the
wall by No. 8‐1/2 in. modified truss head self drilling screws. The typical screw spacing
schedule is shown in Figure 2.8. The screw spacing of 2 in., 4 in., and 6 in. on the panel
edges and 12 in. in the field was investigated, and the screws were installed on the
outer flange of the chord studs for all the tests in the main group. The steel sheet
sheathing was installed parallel to the wall studs (vertical). Test results by Serrette
(1996) indicated that the shear strength of walls with perpendicular oriented sheathing
was higher than that of walls with parallel sheathing. Therefore, the results for the
parallel orientation can be used for either orientation.
(a) 8 ft x 2 ft Sheathed shear wall assembly (b) ) 8 ft x 4 ft Sheathed shear wall assembly
Figure 2.8 Typical screw spacing schedule (2 in./12 in. as shown) (Yu 2008)
40
The details of the components of the tested steel stud walls are as follows:
STUDS:
• 350S162‐33 SSMA structural stud, 0.033 in. 3‐1/2 in. x 1‐5/8 in. made of ASTM
A1003 Grade 33 steel, placed in 2 ft. o. c. for 0.027 in. steel sheeted walls.
• 350S162‐43 SSMA structural stud, 0.043 in. 3‐1/2 in. x 1‐5/8 in. made of ASTM
A1003 Grade 33 steel, placed in 2 ft. o. c. for 0.030 in. and 0.033 in. steel sheeted
walls.
TRACKS:
• 350T150‐33 SSMA structural track, 0.033 in. 3‐1/2 in. x 1‐1/4 in. made of ASTM
A1003 Grade 33 steel for 0.027 in. steel sheeted walls.
• 350T150‐33 SSMA structural track, 0.043 in. 3‐1/2 in. x 1‐1/4 in. made of ASTM
A1003 Grade 33 steel for 0.030 in. and 0.033 in. steel sheeted walls.
SHEATHING:
• 0.033 in. thick ASTM A1003 Grade 33 steel.
• 0.030 in. thick ASTM A1003 Grade 33 steel.
• 0.027 in. thick ASTM A1003 Grade 33 steel.
• Steel sheet was installed on one side of the stud wall.
FRAMING AND SHEATHING SCREWS:
• No. 8‐1/2 in. modified truss head self‐drilling screws. Spacing at panel edge is 6,
4, or, 2 in. o.c. Spacing in the field of the sheathing is 12 in. for all specimen
configurations.
HOLD‐DOWNS:
• Simpson Strong‐Tie® S/HD10S hold‐downs with 15 #14x1 in. HWH self‐drilling
screws.
41
Two identical tests were conducted for each specimen configuration. For the
monotonic testing, a third specimen should be tested if the results of the second
specimen tests are not within 15% of the results of the first specimen tested. For the
cyclic testing, a third specimen should be tested if the difference between the ultimate
test loads of the first two specimens is more than 10% apart. The test matrix of the main
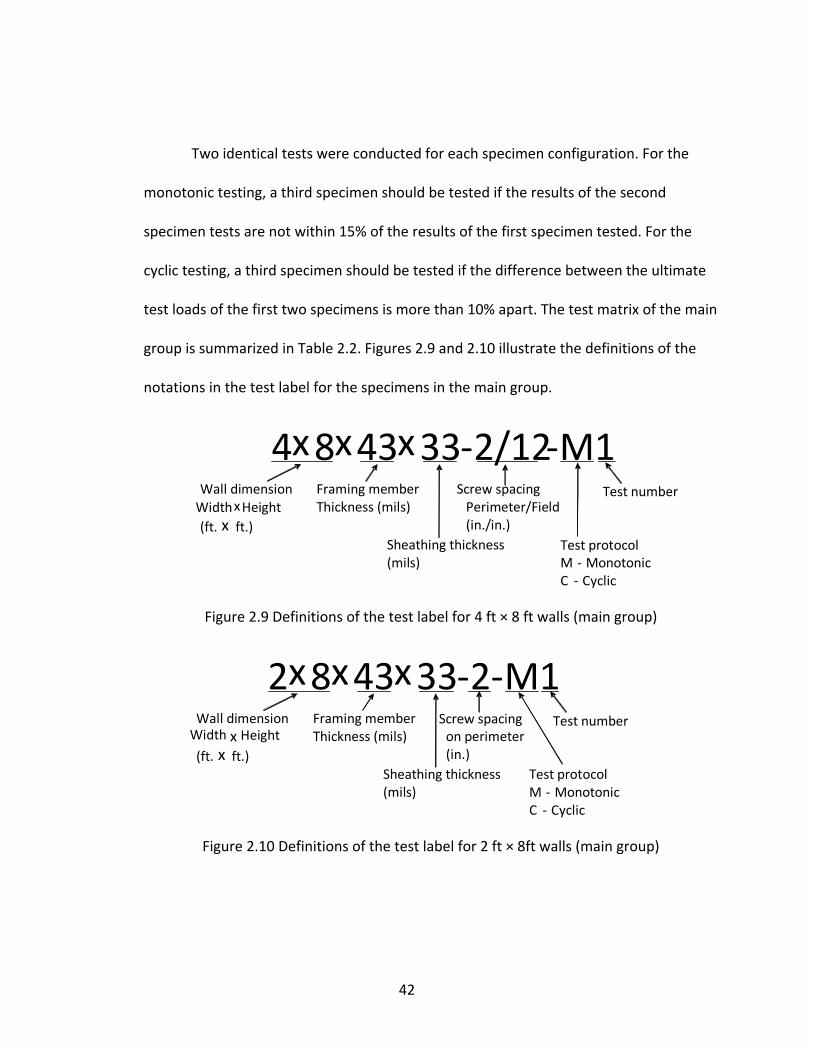
group is summarized in Table 2.2. Figures 2.9 and 2.10 illustrate the definitions of the
notations in the test label for the specimens in the main group.
Wall dimensionWidthx Height(ft. x ft.)
4x8x43x33‐2/12‐M1Framing memberThickness (mils)
Screw spacingPerimeter/Field(in./in.)
Test protocol M ‐ MonotonicC ‐ Cyclic
Test number
Sheathing thickness(mils)
Figure 2.9 Definitions of the test label for 4 ft × 8 ft walls (main group)
Wall dimensionWidth x Height(ft. x ft.)
2 x 8x43x33‐2‐M1Framing memberThickness (mils)
Screw spacingon perimeter(in.)
Test protocolM ‐ MonotonicC ‐ Cyclic
Test number
Sheathing thickness(mils)
Figure 2.10 Definitions of the test label for 2 ft × 8ft walls (main group)
42
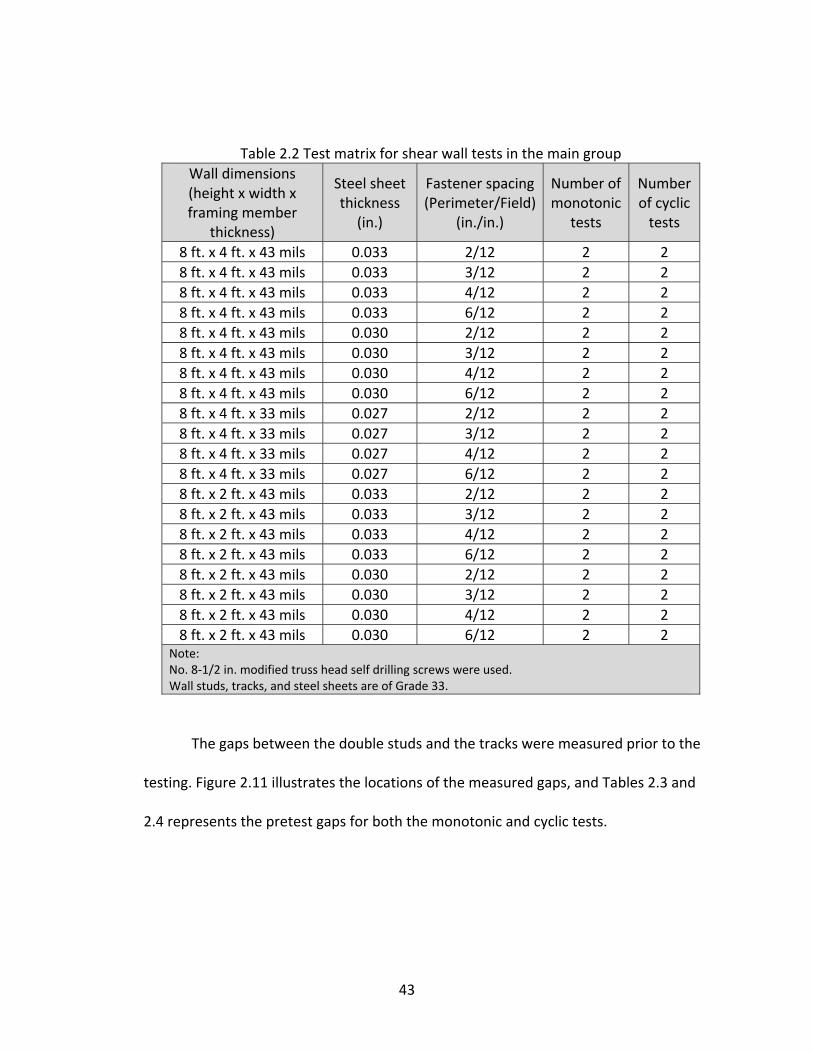
Table 2.2 Test matrix for shear wall tests in the main group Wall dimensions (height x width x framing member
thickness)
Steel sheet thickness
(in.)
Fastener spacing (Perimeter/Field)
(in./in.)
Number of monotonic
tests
Number of cyclic tests
8 ft. x 4 ft. x 43 mils 0.033 2/12 2 2 8 ft. x 4 ft. x 43 mils 0.033 3/12 2 2 8 ft. x 4 ft. x 43 mils 0.033 4/12 2 2 8 ft. x 4 ft. x 43 mils 0.033 6/12 2 2 8 ft. x 4 ft. x 43 mils 0.030 2/12 2 2 8 ft. x 4 ft. x 43 mils 0.030 3/12 2 2 8 ft. x 4 ft. x 43 mils 0.030 4/12 2 2 8 ft. x 4 ft. x 43 mils 0.030 6/12 2 2 8 ft. x 4 ft. x 33 mils 0.027 2/12 2 2 8 ft. x 4 ft. x 33 mils 0.027 3/12 2 2 8 ft. x 4 ft. x 33 mils 0.027 4/12 2 2 8 ft. x 4 ft. x 33 mils 0.027 6/12 2 2 8 ft. x 2 ft. x 43 mils 0.033 2/12 2 2 8 ft. x 2 ft. x 43 mils 0.033 3/12 2 2 8 ft. x 2 ft. x 43 mils 0.033 4/12 2 2 8 ft. x 2 ft. x 43 mils 0.033 6/12 2 2 8 ft. x 2 ft. x 43 mils 0.030 2/12 2 2 8 ft. x 2 ft. x 43 mils 0.030 3/12 2 2 8 ft. x 2 ft. x 43 mils 0.030 4/12 2 2 8 ft. x 2 ft. x 43 mils 0.030 6/12 2 2
Note: No. 8‐1/2 in. modified truss head self drilling screws were used. Wall studs, tracks, and steel sheets are of Grade 33.
The gaps between the double studs and the tracks were measured prior to the
testing. Figure 2.11 illustrates the locations of the measured gaps, and Tables 2.3 and
2.4 represents the pretest gaps for both the monotonic and cyclic tests.
43
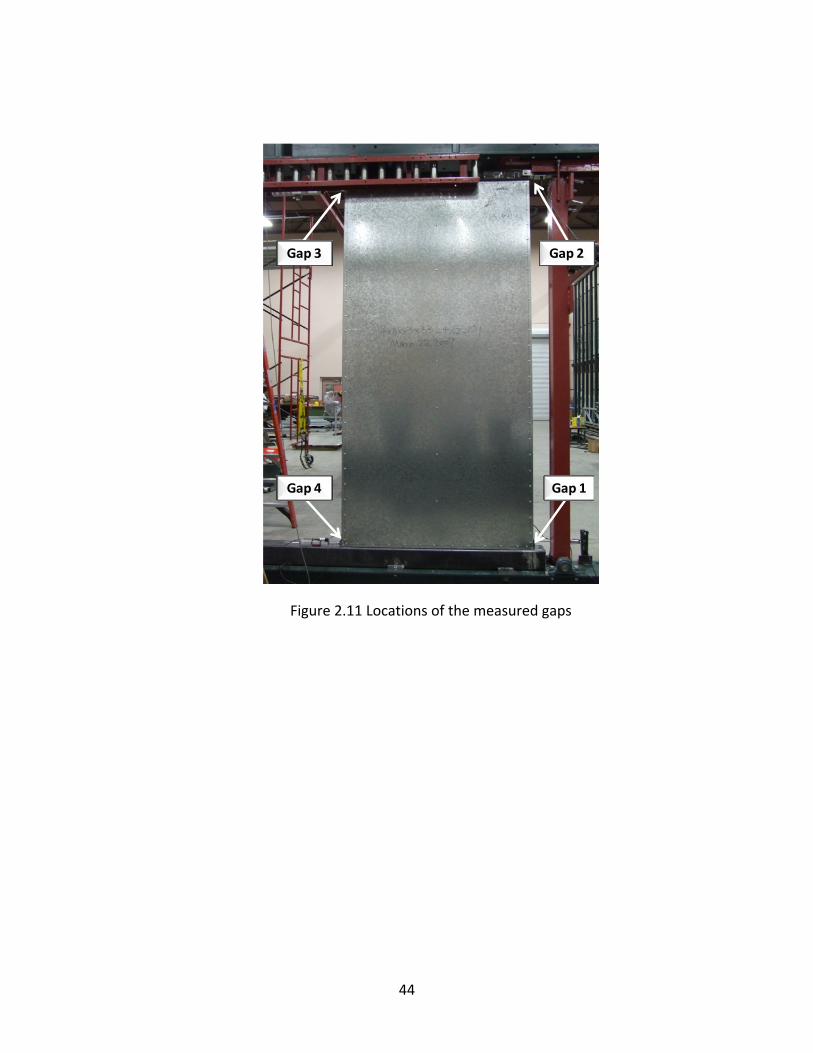
Gap 3
Gap 4
Gap 2
Gap 1
Figure 2.11 Locations of the measured gaps
44

Table 2.3 Measured gaps between double studs and tracks for monotonic test walls (main group)
Test label Gap 1 (in.) Gap 2 (in.) Gap 3 (in.) Gap 4 (in.)
4x8x43x33‐6/12‐M1 1/16 1/16 1/16 1/16 4x8x43x33‐6/12‐M2 1/16 1/16 1/8 1/16 4x8x43x33‐4/12‐M1 1/8 1/8 1/8 1/16 4x8x43x33‐4/12‐M2 1/16 1/8 1/16 1/16 4x8x43x33‐2/12‐M1 1/8 1/16 1/16 1/8 4x8x43x33‐2/12‐M2 1/16 1/8 1/16 1/16
4x8x43x30‐6/12‐M1 ‐ ‐ ‐ ‐ 4x8x43x30‐6/12‐M2 1/8 1/8 1/4 1/8 4x8x43x30‐4/12‐M1 1/16 1/8 1/8 1/16 4x8x43x30‐4/12‐M2 1/16 1/16 0 1/8 4x8x43x30‐2/12‐M1 1/16 1/8 1/8 1/8 4x8x43x30‐2/12‐M2 1/32 1/32 1/32 1/16
4x8x33x27‐6/12‐M1 1/8 1/8 1/16 1/16 4x8x33x27‐6/12‐M2 1/8 1/8 1/8 1/8 4x8x33x27‐4/12‐M1 1/16 1/8 1/16 1/16 4x8x33x27‐4/12‐M2 1/16 1/16 1/8 1/16 4x8x33x27‐2/12‐M1 1/8 1/8 1/4 1/8 4x8x33x27‐2/12‐M2 1/8 1/16 1/8 1/8
2x8x43x33‐6‐M1 1/16 1/16 1/8 1/16 2x8x43x33‐6‐M2 0 1/16 1/16 1/16 2x8x43x33‐4‐M1 0 1/8 1/8 1/16 2x8x43x33‐4‐M2 0 1/16 0 0 2x8x43x33‐2‐M1 1/32 1/16 1/16 1/8 2x8x43x33‐2‐M2 1/8 1/32 1/16 1/16
2x8x43x30‐6‐M1 1/16 1/8 1/16 1/32 2x8x43x30‐6‐M2 0 1/8 1/8 1/16 2x8x43x30‐4‐M1 1/16 1/16 1/16 1/32 2x8x43x30‐4‐M2 1/16 1/32 1/16 1/32 2x8x43x30‐2‐M1 1/16 1/8 1/16 1/8 2x8x43x30‐2‐M2 1/8 1/16 1/8 1/16
45
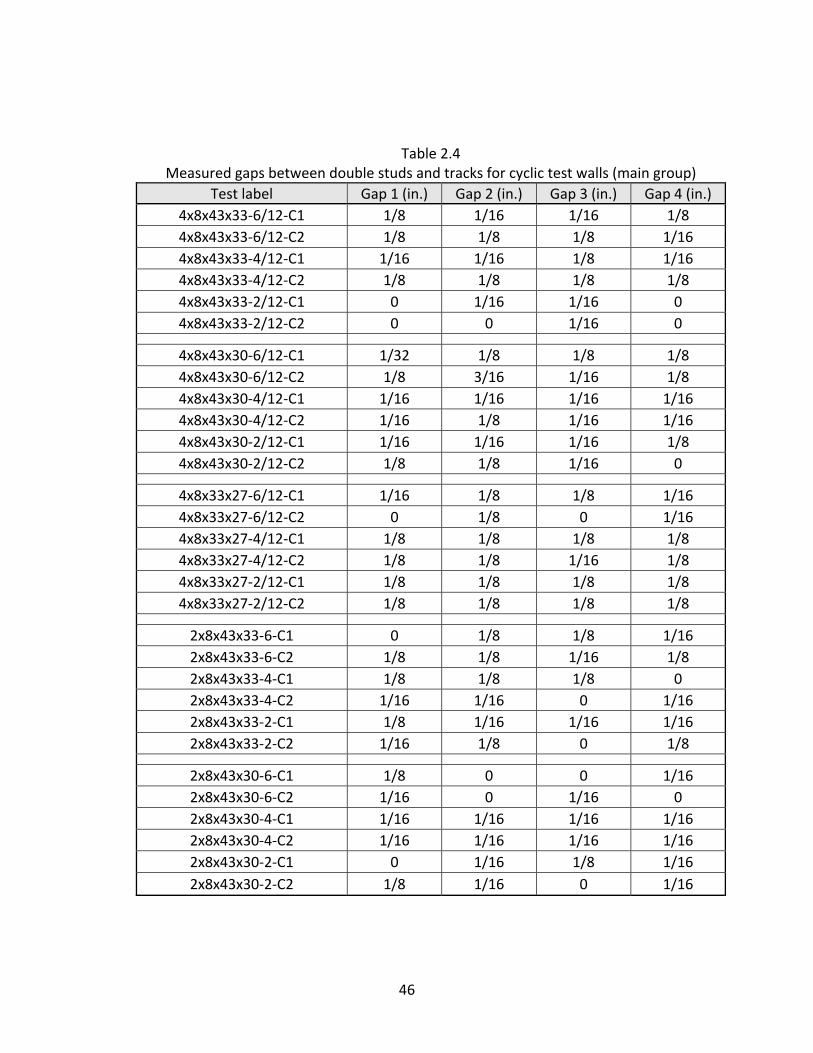
Table 2.4 Measured gaps between double studs and tracks for cyclic test walls (main group)
Test label Gap 1 (in.) Gap 2 (in.) Gap 3 (in.) Gap 4 (in.) 4x8x43x33‐6/12‐C1 1/8 1/16 1/16 1/8 4x8x43x33‐6/12‐C2 1/8 1/8 1/8 1/16 4x8x43x33‐4/12‐C1 1/16 1/16 1/8 1/16 4x8x43x33‐4/12‐C2 1/8 1/8 1/8 1/8 4x8x43x33‐2/12‐C1 0 1/16 1/16 0 4x8x43x33‐2/12‐C2 0 0 1/16 0
4x8x43x30‐6/12‐C1 1/32 1/8 1/8 1/8 4x8x43x30‐6/12‐C2 1/8 3/16 1/16 1/8 4x8x43x30‐4/12‐C1 1/16 1/16 1/16 1/16 4x8x43x30‐4/12‐C2 1/16 1/8 1/16 1/16 4x8x43x30‐2/12‐C1 1/16 1/16 1/16 1/8 4x8x43x30‐2/12‐C2 1/8 1/8 1/16 0
4x8x33x27‐6/12‐C1 1/16 1/8 1/8 1/16 4x8x33x27‐6/12‐C2 0 1/8 0 1/16 4x8x33x27‐4/12‐C1 1/8 1/8 1/8 1/8 4x8x33x27‐4/12‐C2 1/8 1/8 1/16 1/8 4x8x33x27‐2/12‐C1 1/8 1/8 1/8 1/8 4x8x33x27‐2/12‐C2 1/8 1/8 1/8 1/8
2x8x43x33‐6‐C1 0 1/8 1/8 1/16 2x8x43x33‐6‐C2 1/8 1/8 1/16 1/8 2x8x43x33‐4‐C1 1/8 1/8 1/8 0 2x8x43x33‐4‐C2 1/16 1/16 0 1/16 2x8x43x33‐2‐C1 1/8 1/16 1/16 1/16 2x8x43x33‐2‐C2 1/16 1/8 0 1/8
2x8x43x30‐6‐C1 1/8 0 0 1/16 2x8x43x30‐6‐C2 1/16 0 1/16 0 2x8x43x30‐4‐C1 1/16 1/16 1/16 1/16 2x8x43x30‐4‐C2 1/16 1/16 1/16 1/16 2x8x43x30‐2‐C1 0 1/16 1/8 1/16 2x8x43x30‐2‐C2 1/8 1/16 0 1/16
46
2.1.4 Test Specimens ‐ Supporting Group
The tests for the supporting group were performed at the beginning stage of the
entire research project. The purpose of these additional tests was to investigate: (1) the
difference between No. 8 and No. 10 self‐drilling screws when applied to steel sheet
shear walls; (2) the screw installation pattern on the chord studs.
One cyclic test on a 8 ft. × 4 ft. wall with a 6 in./12 in. screw spacing schedule
was studied by using fasteners of No. 10‐3/4 in. flat truss self drilling screws. Three
screw patterns were investigated in the supporting group: screws on the outer stud
(shown in Figure 2.8, eventually chosen for the main group tests), screws on the inner
stud (shown in Figure 2.12), and screws staggered on the chord studs (shown in Figure
2.13). For the pattern with screws on the inner stud, the overall dimensions of the wall
had to be 8 ft. high × 4 ft. 3 1/4 in. wide in order to fit the 8 ft. × 4 ft. sheet. This screw
pattern was also adopted by Serrette (1997). Table 2.5 summaries the configurations of
the supporting group specimens. Refer to Figure 2.11 for the location of the gap
measured between double studs and tracks for additional specimens.
47

4 ft. ¾ in.
8 ft.
2 in.
2 in.
2 in.
2 in.12 in.
Figure 2.12 Screws installed on inner stud (2 in./12 in.)
4 ft.
8 ft.
12 in.
4 in.
2 in.
4 in.
2 in.
Figure 2.13 Staggered screw patterns (2 in./12 in.)
48

Table 2.5 Configurations of the additional shear wall tests (supporting group)
Test label
Wall dimensions (height x width x framing member
thickness)
Steel sheet
thickness (in.)
Screw size and installation pattern
Screw spacing Perimeter/Field
(in./in.)
Test protocol
A‐1 8 ft. x 4 ft. x 43 mils 0.033 No. 10 on
outer stud 6/12 Cyclic
A‐2 8 ft. x 4 ft. x 43 mils 0.030 No. 8 on
inner stud 2/12 Monotonic
A‐3 8 ft. x 4 ft. x 43 mils 0.030 No. 8 on
inner stud 2/12 Cyclic
A‐4 8 ft. x 4 ft. x 43 mils 0.030 No. 8
staggered on studs
2/12 Monotonic
A‐5 8 ft. x 4 ft. x 43 mils 0.030 No. 8
staggered on studs
2/12 Cyclic
Table 2.6 Measured gaps between double studs and tracks for additional specimens (supporting
group)
Test label Gap 1 (in.)
Gap 2 (in.)
Gap 3 (in.)
Gap 4 (in.)
A‐1 1/32 1/8 1/8 1/8 A‐2 1/8 1/8 1/8 1/8 A‐3 1/16 1/16 1/16 1/8 A‐4 1/16 1/16 1/8 1/16 A‐5 1/8 1/8 1/8 1/8
49
2.2 RESULTS AND DISCUSSION
2.2.1 Shear Wall Tests for Specimens in Main Group
In the main group, a total of 30 monotonic tests and 30 cyclic tests were
conducted. The main group specimens employed No. 8 ‐1/2 in. modified truss head self‐
drilling screws and the screws were installed on the outer flange of both chord studs.
For all specimen configurations, the differences between the two tests are within the
required values (15% for monotonic tests, 10% for cyclic tests); therefore, the third test
was not performed for all cases.
The observed failure mode and measured responses of all monotonic tests are
provided in Appendix A. The response curve for each test gives the relationships
between the applied load in pound per linear foot (plf) and the net lateral displacement
on the top of the wall. Table 3.1 summarizes the monotonic test results for the main
group specimens. The nominal shear strengths are calculated as the average of the peak
loads of two tests.
50
In the 4 ft. x 8 ft. wall monotonic tests, the back‐to‐back double studs were able
to provide enough resistance against overturning forces. For the wall assemblies with
less tight screw spacing schedules (4 in./12 in. and 6 in./12 in.), the failure resulted from
a combination of shear buckling of the steel sheet and pullout of screws from the studs.
Figure 2.14 (a) shows a typical failure mode for 0.033 in. steel sheet walls with a 6 in./12
in. screw spacing schedule. For the 4 ft. x 8 ft. walls with a 2 in./12 in. screw schedule,
the failure on the outer flange of the double studs was found evident, and no screw
pullout failure was observed. Figure 2.14(b) shows the typical stud failure.
In the 2 ft. x 8 ft. wall monotonic tests, it was found that the drifts at peak load
were systematically greater than those in the 4 ft. x 8 ft. walls tests. Similar to the failure
modes for the 4 ft. x 8 ft. walls, a combination of sheet buckling and screws pullout were
observed for 2 ft. x 8 ft. walls with a 6 in./12 in. or 4 in./12 in. screw spacing schedule.
And combinations of sheet buckling and flange distortion of the double studs were
observed for 2 ft. x 8 ft. walls with a 2 in./12 in. screw spacing schedule. In addition to
those modes, the buckling in the web and flange of the double studs at the compression
side was also observed on walls with a 2 in./12 in. screw schedule. Figure 2.15 shows
such stud buckling failure.
51

(a) Test 4x8x43x33‐6/12‐M1 (b) Test 4x8x33x33‐2/12‐M1
Figure 2.14 Typical failure modes for 4 ft. x 8 ft. wall in monotonic test
Figure 2.15 Buckling of double studs for 2 ft x 8 ft wall 2 in./12 in. screw spacing
52

Table 3.1 Monotonic test results for shear walls (main group)
Test label Peak load
(plf)
Nominal shear
strength (plf)
Lateral displacement on top of wall at peak load (in.)
Average Lateral displacement
on top of wall at peak load (in.)
4x8x43x33‐6/12‐M1 1023 1074
2.08 1.9 4x8x43x33‐6/12‐M2 1124 1.72
4x8x43x33‐4/12‐M1 1173 1189
1.72 2.02 4x8x43x33‐4/12‐M2 1204 2.31
4x8x43x33‐2/12‐M1 1317 1346
2.53 2.09 4x8x43x33‐2/12‐M2 1376 1.64
4x8x43x30‐6/12‐M1 801 794
2.5 2.47 4x8x43x30‐6/12‐M2 786 2.43
4x8x43x30‐4/12‐M1 940 959
2.47 2.62 4x8x43x30‐4/12‐M2 977 2.76
4x8x43x30‐2/12‐M1 1078 1054
3.45 3.2 4x8x43x30‐2/12‐M2 1030 2.94
4x8x33x27‐6/12‐M1 644 625
1.87 1.91 4x8x33x27‐6/12‐M2 607 1.95
4x8x33x27‐4/12‐M1 685 684
1.89 2.1 4x8x33x27‐4/12‐M2 682 2.3
4x8x33x27‐2/12‐M1 856 836
2.01 1.98 4x8x33x27‐2/12‐M2 816 1.95
2x8x43x33‐6‐M1 1065 1017
3.12 2.8 2x8x43x33‐6‐M2 968 2.47
2x8x43x33‐4‐M1 1147 1155
2.63 2.77 2x8x43x33‐4‐M2 1163 2.9
2x8x43x33‐2‐M1 1386 1361
3.3 3.18 2x8x43x33‐2‐M2 1335 3.05
2x8x43x30‐6‐M1 872 882
3.3 3.35 2x8x43x30‐6‐M2 891 3.39
2x8x43x30‐4‐M1 937 950
3.34 3.31 2x8x43x30‐4‐M2 963 3.27
2x8x43x30‐2‐M1 1096 1097
3.3 3.37 2x8x43x30‐2‐M2 1098 3.43
Note: No. 8‐1/2 in. modified truss head self drilling screws were used. Wall studs, tracks, and steel sheets are of ASTM Grade 33.
53
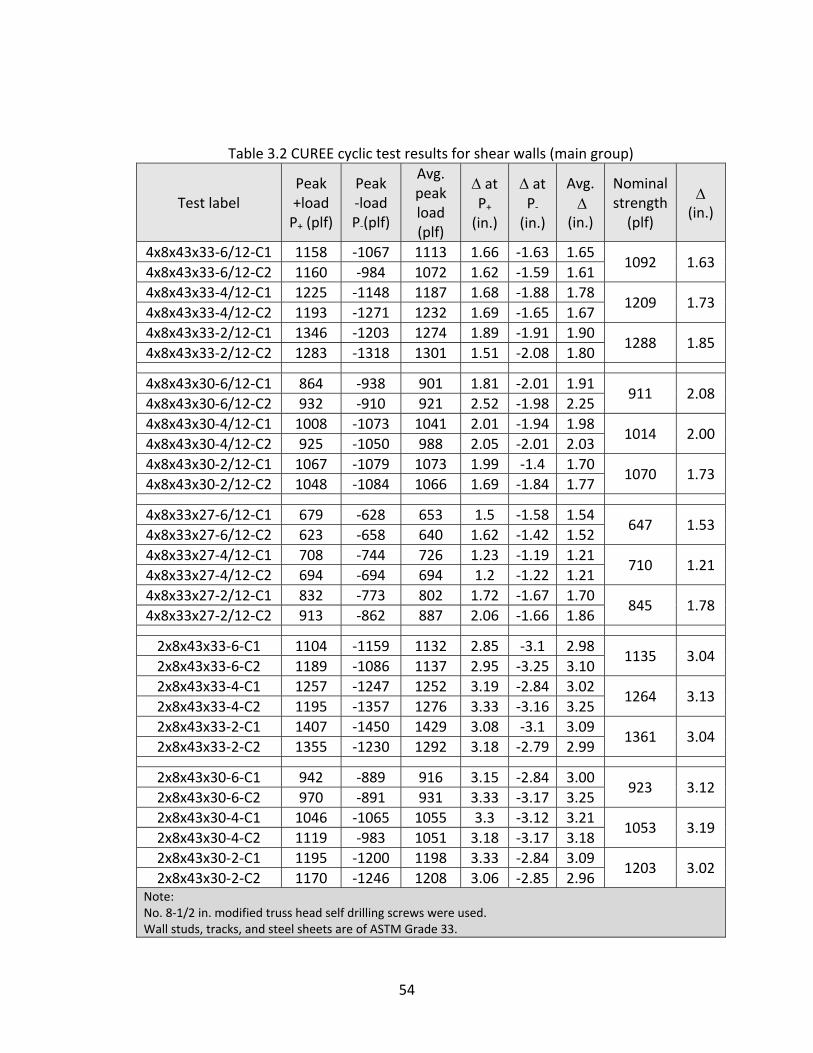
Table 3.2 CUREE cyclic test results for shear walls (main group)
Test label Peak +load P+ (plf)
Peak ‐load P‐(plf)
Avg. peak load (plf)
Δ at P+ (in.)
Δ at P‐ (in.)
Avg. Δ (in.)
Nominal strength (plf)
Δ (in.)
4x8x43x33‐6/12‐C1 1158 ‐1067 1113 1.66 ‐1.63 1.65 1092 1.63
4x8x43x33‐6/12‐C2 1160 ‐984 1072 1.62 ‐1.59 1.61 4x8x43x33‐4/12‐C1 1225 ‐1148 1187 1.68 ‐1.88 1.78
1209 1.73 4x8x43x33‐4/12‐C2 1193 ‐1271 1232 1.69 ‐1.65 1.67 4x8x43x33‐2/12‐C1 1346 ‐1203 1274 1.89 ‐1.91 1.90
1288 1.85 4x8x43x33‐2/12‐C2 1283 ‐1318 1301 1.51 ‐2.08 1.80
4x8x43x30‐6/12‐C1 864 ‐938 901 1.81 ‐2.01 1.91 911 2.08
4x8x43x30‐6/12‐C2 932 ‐910 921 2.52 ‐1.98 2.25 4x8x43x30‐4/12‐C1 1008 ‐1073 1041 2.01 ‐1.94 1.98
1014 2.00 4x8x43x30‐4/12‐C2 925 ‐1050 988 2.05 ‐2.01 2.03 4x8x43x30‐2/12‐C1 1067 ‐1079 1073 1.99 ‐1.4 1.70
1070 1.73 4x8x43x30‐2/12‐C2 1048 ‐1084 1066 1.69 ‐1.84 1.77
4x8x33x27‐6/12‐C1 679 ‐628 653 1.5 ‐1.58 1.54 647 1.53
4x8x33x27‐6/12‐C2 623 ‐658 640 1.62 ‐1.42 1.52 4x8x33x27‐4/12‐C1 708 ‐744 726 1.23 ‐1.19 1.21
710 1.21 4x8x33x27‐4/12‐C2 694 ‐694 694 1.2 ‐1.22 1.21 4x8x33x27‐2/12‐C1 832 ‐773 802 1.72 ‐1.67 1.70
845 1.78 4x8x33x27‐2/12‐C2 913 ‐862 887 2.06 ‐1.66 1.86
2x8x43x33‐6‐C1 1104 ‐1159 1132 2.85 ‐3.1 2.98 1135 3.04
2x8x43x33‐6‐C2 1189 ‐1086 1137 2.95 ‐3.25 3.10 2x8x43x33‐4‐C1 1257 ‐1247 1252 3.19 ‐2.84 3.02
1264 3.13 2x8x43x33‐4‐C2 1195 ‐1357 1276 3.33 ‐3.16 3.25 2x8x43x33‐2‐C1 1407 ‐1450 1429 3.08 ‐3.1 3.09
1361 3.04 2x8x43x33‐2‐C2 1355 ‐1230 1292 3.18 ‐2.79 2.99
2x8x43x30‐6‐C1 942 ‐889 916 3.15 ‐2.84 3.00 923 3.12
2x8x43x30‐6‐C2 970 ‐891 931 3.33 ‐3.17 3.25 2x8x43x30‐4‐C1 1046 ‐1065 1055 3.3 ‐3.12 3.21
1053 3.19 2x8x43x30‐4‐C2 1119 ‐983 1051 3.18 ‐3.17 3.18 2x8x43x30‐2‐C1 1195 ‐1200 1198 3.33 ‐2.84 3.09
1203 3.02 2x8x43x30‐2‐C2 1170 ‐1246 1208 3.06 ‐2.85 2.96
Note: No. 8‐1/2 in. modified truss head self drilling screws were used. Wall studs, tracks, and steel sheets are of ASTM Grade 33.
54
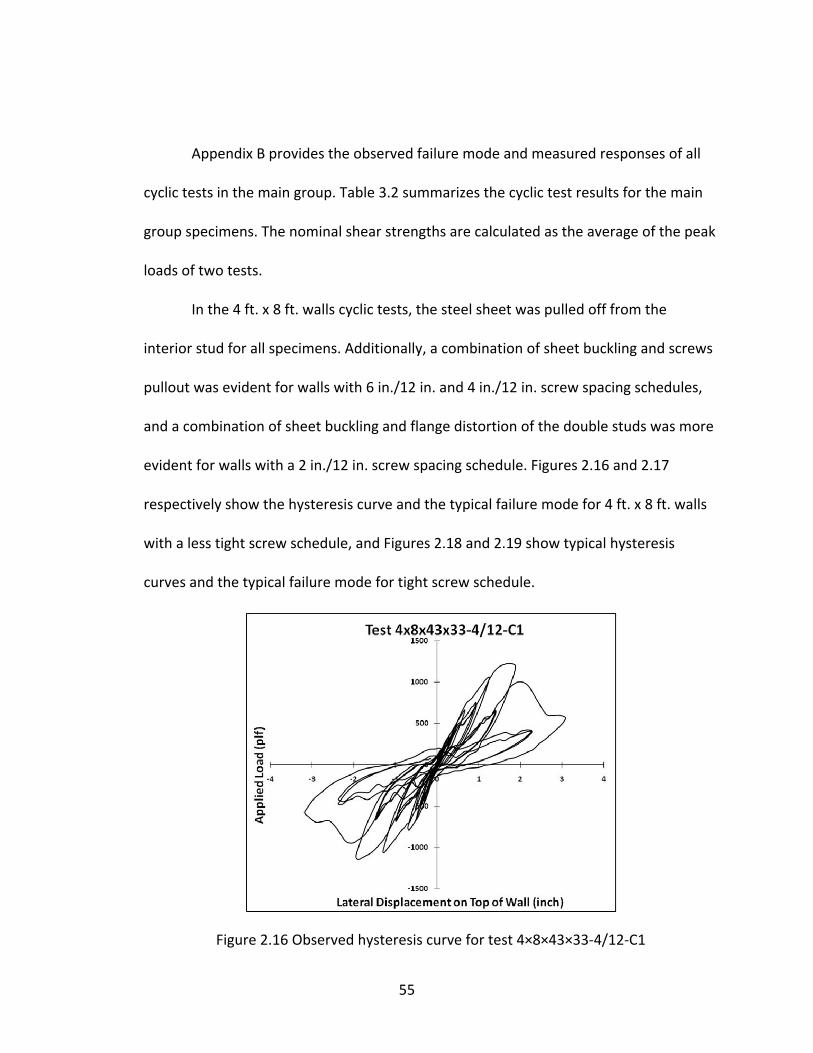
Appendix B provides the observed failure mode and measured responses of all
cyclic tests in the main group. Table 3.2 summarizes the cyclic test results for the main
group specimens. The nominal shear strengths are calculated as the average of the peak
loads of two tests.
In the 4 ft. x 8 ft. walls cyclic tests, the steel sheet was pulled off from the
interior stud for all specimens. Additionally, a combination of sheet buckling and screws
pullout was evident for walls with 6 in./12 in. and 4 in./12 in. screw spacing schedules,
and a combination of sheet buckling and flange distortion of the double studs was more
evident for walls with a 2 in./12 in. screw spacing schedule. Figures 2.16 and 2.17
respectively show the hysteresis curve and the typical failure mode for 4 ft. x 8 ft. walls
with a less tight screw schedule, and Figures 2.18 and 2.19 show typical hysteresis
curves and the typical failure mode for tight screw schedule.
Figure 2.16 Observed hysteresis curve for test 4×8×43×33‐4/12‐C1
55
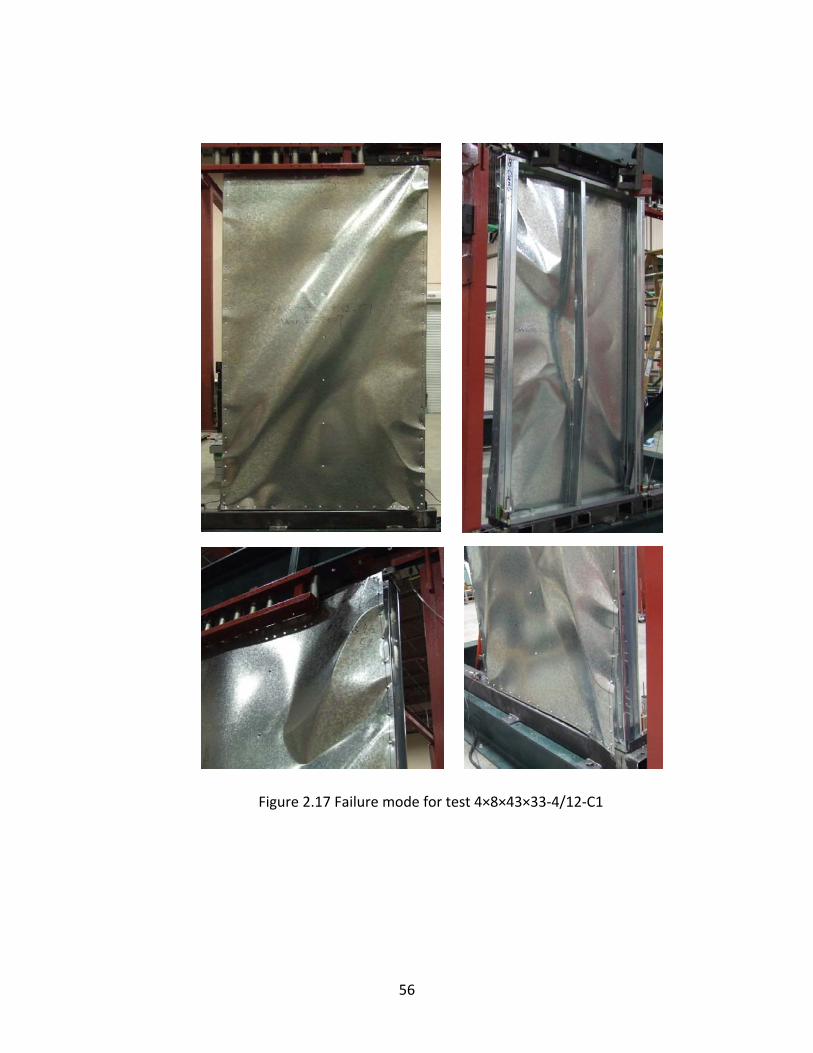
Figure 2.17 Failure mode for test 4×8×43×33‐4/12‐C1
56

Figure 2.18 Observed hysteresis curve for test 4×8×43×30‐2/12‐C1
Figure 2.19 Failure mode for test 4×8×43×30‐2/12‐C1
57

In the 2 ft. x 8 ft. wall cyclic tests, the observed hysteresis curves show little post‐
peak behavior of the specimens. Since the 2 ft. x 8 ft. walls yielded a large deformation
capacity in the monotonic tests and the values are greater than the capacity (2.5% wall
height) on the reference displacement specified by ICC‐ES AC130, therefore the applied
displacement to the top of wall was limited during the CUREE cyclic tests and was not
efficient to achieve post‐peak behavior in some cases. Figure 2.20 and 2.21 show typical
hysteresis curves and the failure mode for 2 ft. x 8 ft. wall assemblies.
Figure 2.20 Observed hysteresis curve for cyclic test 2×8×43×33‐6‐C1
58
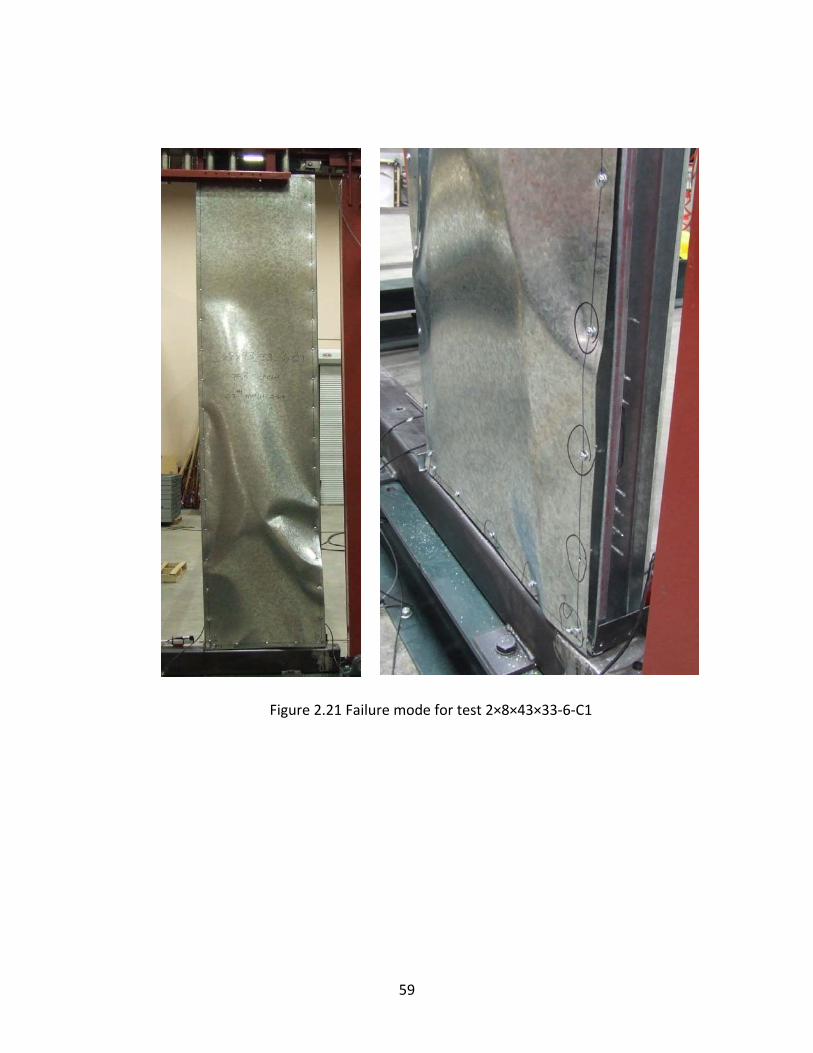
Figure 2.21 Failure mode for test 2×8×43×33‐6‐C1
59
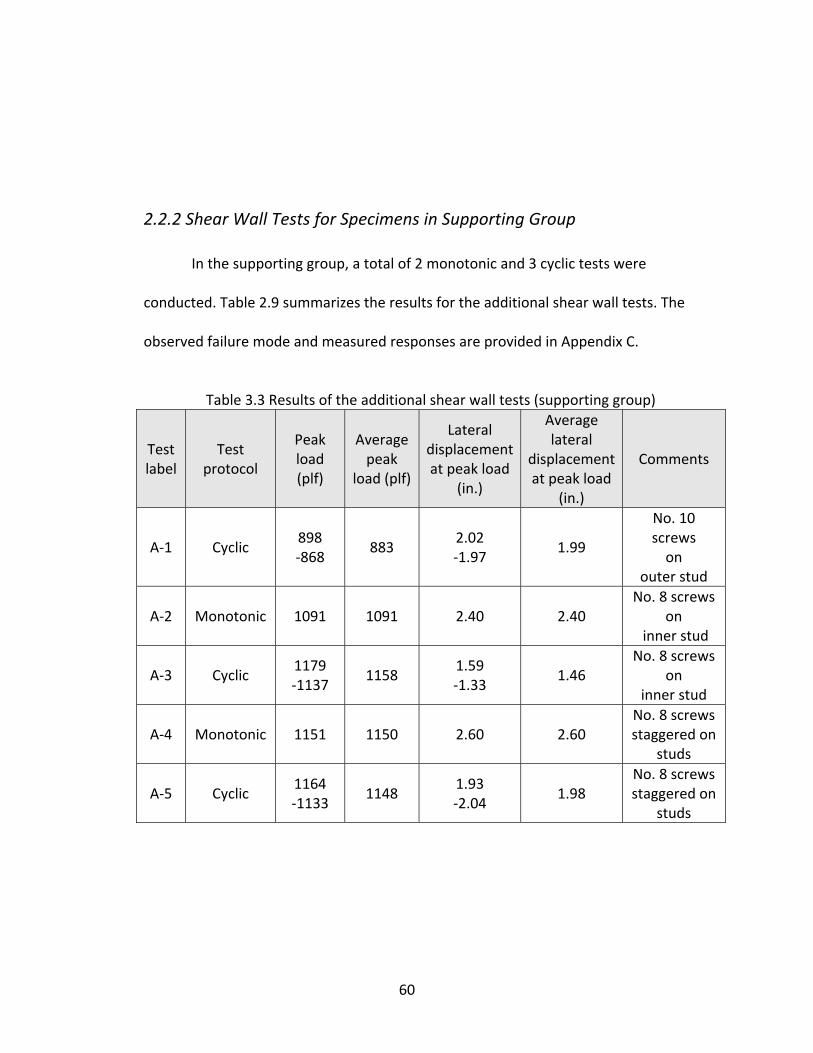
2.2.2 Shear Wall Tests for Specimens in Supporting Group
In the supporting group, a total of 2 monotonic and 3 cyclic tests were
conducted. Table 2.9 summarizes the results for the additional shear wall tests. The
observed failure mode and measured responses are provided in Appendix C.
Table 3.3 Results of the additional shear wall tests (supporting group)
Test label
Test protocol
Peak load (plf)
Average peak
load (plf)
Lateral displacement at peak load
(in.)
Average lateral
displacement at peak load
(in.)
Comments
A‐1 Cyclic 898 ‐868
883 2.02 ‐1.97
1.99
No. 10 screws on
outer stud
A‐2 Monotonic 1091 1091 2.40 2.40 No. 8 screws
on inner stud
A‐3 Cyclic 1179 ‐1137
1158 1.59 ‐1.33
1.46 No. 8 screws
on inner stud
A‐4 Monotonic 1151 1150 2.60 2.60 No. 8 screws staggered on
studs
A‐5 Cyclic 1164 ‐1133
1148 1.93 ‐2.04
1.98 No. 8 screws staggered on
studs
60
It was found in the previously conducted test 4×8×43×33‐6/12‐C1 that No. 8
screws were pulled out, and this failure mode was more evident for shear walls with less
tight screw schedules. To compare this performance with the No. 10 screws, one cyclic
test was conducted on specimen A‐1 which employed the same configurations as test
4×8×43×33‐6/12‐C1 except that No. 10‐3/4in. flat truss self‐drilling screws were used.
Test A‐1 also failed by pull‐out of the screws at the bottom corners of the walls as well
as the interior studs. This is similar to the failure mode of test 4×8×43×33‐6/12‐C1.
Figure 2.22 shows the failure mode of these two cyclic tests.
(a) Test A‐1 with # 10 screws (b) Test 4×8×43×33‐6/12‐C1 with # 8 screws
Figure 3.9 Comparison of the performance of No. 10 and No. 8 screws
The average peak load of specimen A‐1 was 883 plf, which is even less than the
results for test 4×8×43×33‐6/12‐C1( 901 plf). The No. 10‐3/4 in. flat truss self‐drilling
61
screws did not produce an improved performance compared to the No. 8‐ ½ in.
modified truss head self‐drilling screws in the cyclic shear wall test; therefore, the No. 8
screws were chosen for this test program.
At the early stage of this project, in addition to the sheathing sheet buckling,
stud failure was observed in the monotonic tests for 0.030 in. sheeted 4 ft. ×8 ft. × 43
mil shear walls with a 2 in./12 in. screw spacing schedule. Figure 2.23 shows the
observed stud failures. The outer flanges of the double studs were distorted due to the
buckling of the steel sheet. Because of the tight screw schedule, the screws were able to
hold the steel sheets being pulled off the frame during the test; therefore, a significant
amount of load was transferred to the outer flange to cause such flange distortion.
(a) Test 4×8×43×33‐2/12‐M1 (b) Test 4×8×43×33‐2/12‐M2
Figure 2.23 Stud failure of 4 ft. x 8 ft. walls in monotonic tests
62
Two alternative screw patterns (screws on inner stud and screws staggered on
chord studs) were investigated in both the monotonic and cyclic shear wall tests. The
test results show that both alternative screw patterns yielded higher shear strength
than the original screw pattern (screws on the outer stud). And stud failure was no
longer evident for the two alternative configurations; only one test (A‐5 with staggered
pattern) demonstrated significant distortion on the outer stud as shown in Figure 2.24.
Figure 2.24 Observed stud failure in test A‐5
To further investigate the three screw installation configurations, axial
compression tests were also carried out to examine the vertical load capacity of shear
walls with different screw patterns after the tests. Figure 2.25 shows the compression
test setup. The axial force was applied to the more damaged double studs after a cyclic
63
shear wall testing. A 17 kip hydraulic cylinder and a 10 kip load cell were utilized for the
compression tests. Table 2.10 summarizes the test results. It indicates that after the
cyclic shear wall test, the shear wall with staggered screw patterns was the least
damaged, and it still can take over 10000 lbs of vertical load. The shear wall with screws
on the outer stud gave the weakest performance in the compression tests, but it still
took a peak load of 5987 lbs, which is still higher than the nominal compression strength
of 4360 lbs according to the AISI Design Manual 2002 Edition (AISI 2002).
Figure 2.25 Set up for axial compression tests
64
Table 2.10 Results of the axial compression tests
Specimen Peak axial load (lbs) Comments
4×8×43‐2/12‐C1 5987 No. 8 screws on outer stud
A‐3 7925 No. 8 screws on inner stud
A‐5 >10000* No. 8 screws
staggered on studs
Note: * test stopped at the capacity limit of the load cell
Based on the additional shear wall tests and the axial compression tests, it was
decided that “screws on the outer stud” pattern would be chosen for all the shear walls
in this test program. The nominal shear strength obtained from this research project will
represent the lower bond values among the three investigated screw installation
configurations.
65
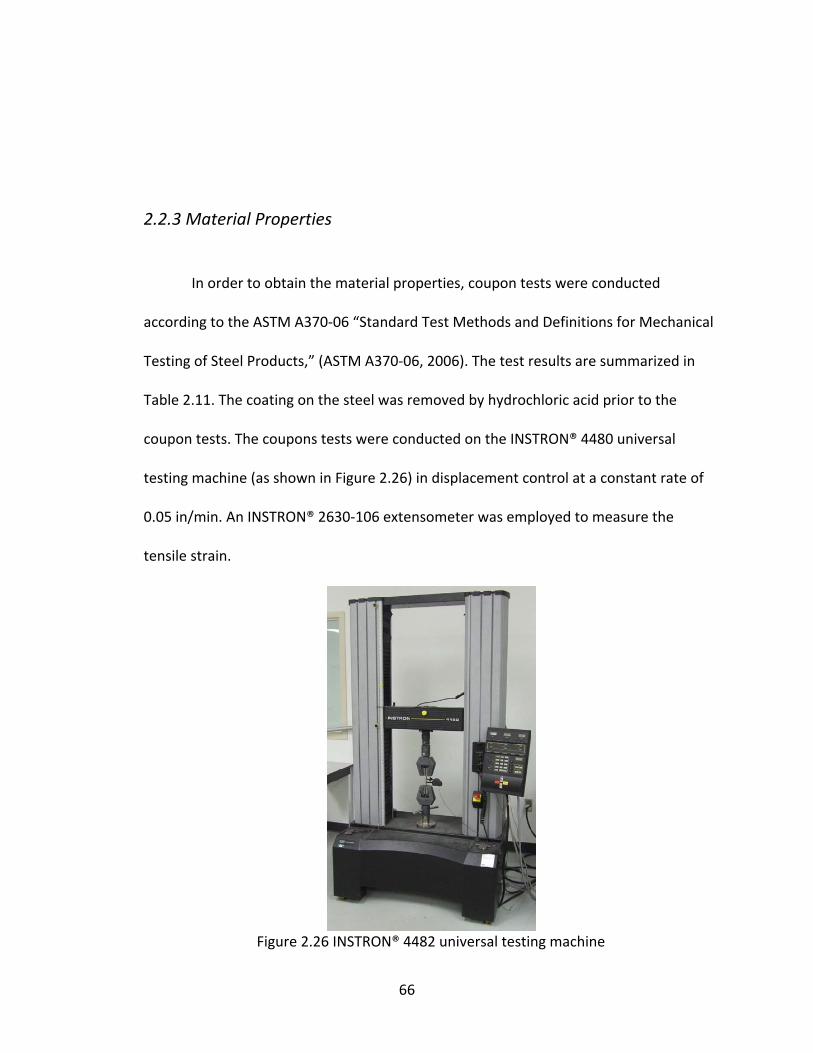
2.2.3 Material Properties
In order to obtain the material properties, coupon tests were conducted
according to the ASTM A370‐06 “Standard Test Methods and Definitions for Mechanical
Testing of Steel Products,” (ASTM A370‐06, 2006). The test results are summarized in
Table 2.11. The coating on the steel was removed by hydrochloric acid prior to the
coupon tests. The coupons tests were conducted on the INSTRON® 4480 universal
testing machine (as shown in Figure 2.26) in displacement control at a constant rate of
0.05 in/min. An INSTRON® 2630‐106 extensometer was employed to measure the
tensile strain.
Figure 2.26 INSTRON® 4482 universal testing machine
66
Table 2.11 Coupon test results
Member Uncoated Thickness
(in.)
Yield Stress (ksi)
Tensile Strength (ksi)
Tensile Strength/Yield Stress Ratio
Elongation for 2 in. Gage Length (%)
33 mil steel sheet 0.0358 43.4 53.8 1.24 27%
30 mil steel sheet 0.0286 52.5 56.6 1.08 24%
27 mil steel sheet 0.0240 50.3 57.8 1.15 21%
43 mil stud 0.0430 47.6 55.1 1.15 29%
33 mil stud 0.0330 47.7 55.7 1.17 24%
43 mil track 0.0420 43.1 55.6 1.29 25%
33 mil track 0.0330 57.4 67.2 1.17 28%
Note: Steel is specified as ASTM grade 33 for all members.
The test results of coupon tests indicate that the measured uncoated thicknesses
are less than the nominal values except for the 33 mil steel sheet. All the coupons were
meet the minimum ductility requirement set by the NAS 2007 Edition (NAS 2007: “North
American Specification for Design of cold‐formed steel Structural Members”), which
requires the tensile strength to yield point ratio greater than 1.08, and the elongation
on a 2 in. gauge length must be higher than 10%.
67
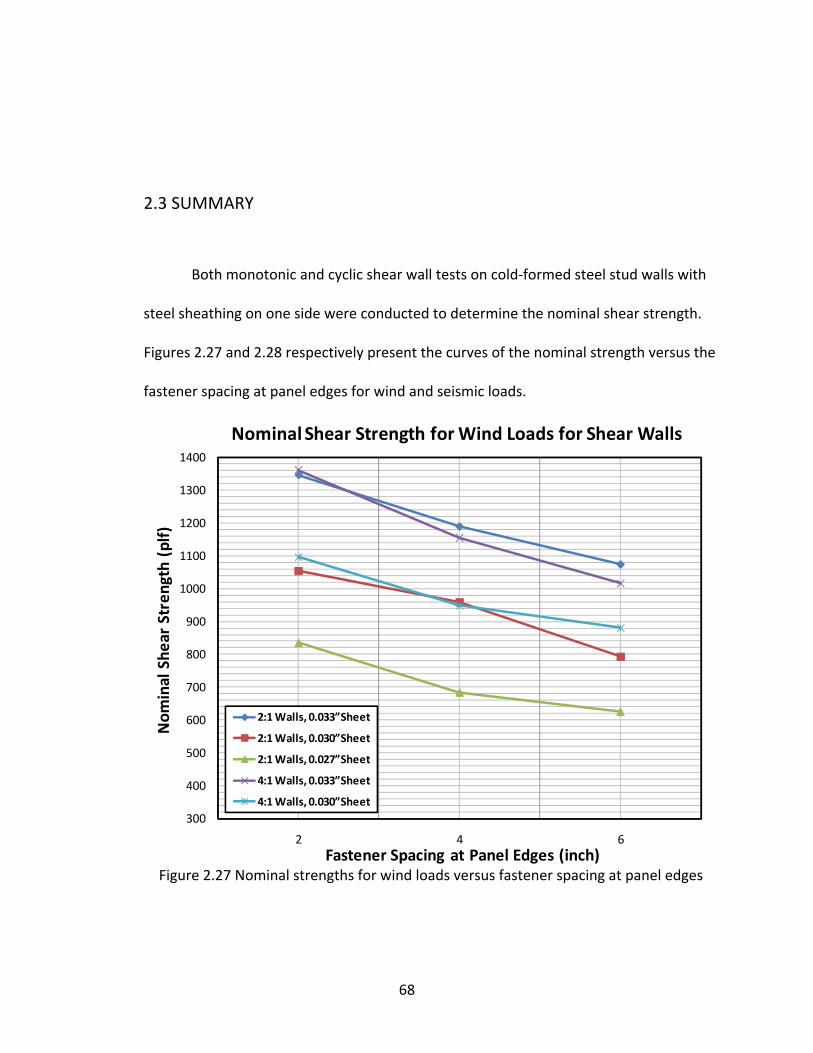
2.3 SUMMARY
Both monotonic and cyclic shear wall tests on cold‐formed steel stud walls with
steel sheathing on one side were conducted to determine the nominal shear strength.
Figures 2.27 and 2.28 respectively present the curves of the nominal strength versus the
fastener spacing at panel edges for wind and seismic loads.
300
400
500
600
700
800
900
1000
1100
1200
1300
1400
2 4 6
Nom
inal She
ar Stren
gth (plf)
Fastener Spacing at Panel Edges (inch)
Nominal Shear Strength for Wind Loads for Shear Walls
2:1 Walls, 0.033”Sheet
2:1 Walls, 0.030”Sheet
2:1 Walls, 0.027”Sheet
4:1 Walls, 0.033”Sheet
4:1 Walls, 0.030”Sheet
Figure 2.27 Nominal strengths for wind loads versus fastener spacing at panel edges
68

300
400
500
600
700
800
900
1000
1100
1200
1300
1400
2 4 6
Nom
inal She
ar Stren
gth (plf)
Fastener Spacing at Panel Edges (inch)
Nominal Shear Strength for Seismic Loads for Shear Walls
2:1 Walls, 0.033”Sheet
2:1 Walls, 0.030”Sheet
2:1 Walls, 0.027”Sheet
4:1 Walls, 0.033”Sheet
4:1 Walls, 0.030”Sheet
Figure 2.28 Nominal strengths for seismic loads versus fastener spacing at panel edges
The relationship between the nominal shear strength and the fastener spacing at
the panel edges could be assumed as indicated in the Figures 2.27 and 2.28. In this test
program, fastener spacing of 6 in., 4 in., and 2 in. were investigated; therefore, the
nominal strength for walls with 3 in. fastener spacing can be estimated as the average
nominal strength for 4 in. and 2 in. fastener spacing.
69

Based on the results of this research project, nominal shear strengths for steel
sheet shear walls are summarized in Tables 2.7 and 2.8, and the values are
recommended for the new version of the AISI Lateral Design Standard.
Table 2.7 Recommended nominal shear strength for wind load for shear walls 1,2 (plf)
Assembly Description Aspect
Ratio (h:w)
Fastener Spacing at Panel Edges (inches)
6 4 3 2 0.033 in. steel sheet, one Side3 2:1 1074 1189 1268 1346 0.030 in. steel sheet, one side3 2:1 794 959 1007 1054 0.027 in. steel sheet, one side4 2:1 625 684 760 836 0.033 in. steel sheet, one side3 4:1 1017 1155 1258 1361 0.030 in. steel sheet, one side3 4:1 882 950 1024 1097
Note: (1) Screws in the field of panel shall be installed 12 in. o.c. (2) Wall studs and track shall be of ASTM Grade 33. (3) Wall studs and track shall be 43 mil or thicker. (4) Wall studs and track shall be 33 mil or thicker.
Table 2.8 Recommended nominal shear strength for seismic load for shear walls 1,2 (plf)
Assembly Description Aspect
Ratio (h:w)
Fastener Spacing at Panel Edges (inches)
6 4 3 2 0.033 in. steel sheet, one side3 2:1 1092 1209 1249 1288 0.030 in. steel sheet, one side3 2:1 911 1014 1042 1070 0.027 in. steel sheet, one side4 2:1 647 710 778 845 0.033 in. steel sheet, one side3 4:1 1135 1264 1313 1361 0.030 in. steel sheet, one side3 4:1 923 1053 1128 1203
Note: (1) Screws in the field of panel shall be installed 12 in. o.c. (2) Wall studs and track shall be of ASTM Grade 33. (3) Wall studs and track shall be 43 mil or thicker. (4) Wall studs and track shall be 33 mil or thicker.
It was found that No. 10 flat truss self‐drilling screws did not significantly
improve the shear resistance of the steel sheet wall assemblies because the shear
70

failure of the fasteners did not dominate the failure mechanism in the tests.
Furthermore, Flange distortion of the chord studs was observed on the walls with tight
screw schedule. Two alternative screw installation patterns were investigated in this
research, and it was found that staggered screw pattern on both flanges of the chord
studs or screws installed on the inner flange of the chord studs would improve the shear
strength of the walls, and, at the same time, reduce the distortion of the stud flanges
after tests. To avoid such flange failure on the steel sheet shear walls, two alternative
screw installation patterns or thicker framing members are possible solutions.
71
CHAPTER III
OPTIMIZATION AND ANALYSIS OF COLD‐FORMED STEEL C‐JOIST WITH EDGE
STIFFENED WEB HOLES
3.1 FINITE ELEMENT ANALYSIS OF COLD‐FORMED STEEL C‐JOIST
The new generation C‐section joist in this research work is based on 12 C‐
sections chosen from the SSMA (SSMA‐2007) catalogue, the sections are shown in Table
5.1. The sections were chosen in such a way that they include all web heights, flange
widths and thickness. The sections can be identified by a product identification code as
shown in Figure 3.1.
Table 3.1 C‐section selected from SSMA catalogue
# Section Configuration # Section Configuration
1 600S162‐33 7 1000S162‐43
2 600S200‐54 8 1000S200‐54
3 600S250‐97 9 1000S250‐97
4 800S162‐33 10 1200S162‐54
5 800S200‐54 11 1200S200‐68
6 800S250‐97 12 1200S250‐97
72

Figure 3.1 Product identification code
To optimize the geometry of the cold‐formed C‐joist with edge stiffened web
holes, each configuration has been modeled with three stiffener widths to web depth
ratios (q/h) of 0.06, 0.08 and 0.10 and five hole diameters to web depth ratios (d/h) of
0.2, 0.4, 0.5, 0.6, and 0.8. Figure 3.2 shows the geometric entity of these parameters.
b
q
h d
h = web depth
b = Flange Width
d = Hole diameter
q = Stiffener width
Figure 3.2 Nomenclature for the C‐joist
600 S 162 ‐ 33
Web depth (h) 6” = 600 x 1/100 inches
Flange width (b) 1.62” = 162 x 1/100 inches
Style S = Stud or Joist
Material Thickness 0.033 = 33 mils 1 mils = 1/1000 inches
73
To study the inelastic behavior of the cold‐formed C‐joist with edge stiffened
web hole, each section is compared with the section without a web hole. The
theoretical equation is used to measure the accuracy of the finite element model.
A total of 180 (three q/h ratios, five d/h ratios and 12 sections, i.e. 3x5x12=180)
specimens are modeled and analyzed using ABAQUS. The interior two flange loading
(ITF) conditions were analyzed in the finite element model. Figure 3.3 illustrates the ITF
boundary conditions. The material property used in finite element modeling (33 ksi and
50 ksi yield stress) was taken from the coupon test conducted in Part 1 of this thesis
with Young’s modulus of 29500 ksi and Poisson’s ratio of 0.3.
Applied Load
Specimen
Bottom Plate
(fixed)72 inch
h
6 inch
Top Plate
d
Figure 3.3 ITF Boundary condition for web crippling Test
74

The analyzed specimens are of 6 ft length with four web heights of 6, 8, 10 and
12 in. respectively. Under the ITF loading condition of web crippling, the load is applied
on the top plate (6 in. span and the width is the same as the flange width) while the
bottom plate is fixed. The MatLab program was written to generate the ABAQUS model.
In the ABAQUS models, the load was applied by forcing the top flange;
corresponds to the top node set; to move in downward direction. The middle bottom of
the flange was fixed, which is similar to the ITF loading condition for web crippling tests.
In this study, the general purpose three‐dimensional, force/displacement, shell element
S4R is used to model the specimen. The approximate global seed size was 5 and with a
deviation factor of 0.1 was used.
The precision of the analysis using the finite element method depends on the
mesh size, and the accuracy of the model to simulate the actual loading and boundary
conditions. Due to the significant effect of geometric nonlinearity in the large
deformation, the static NLGEOM option is used. To minimize the local effect, it is
necessary to use a consistent nodal point to simulate the loading. This is achieved by
assigning a displacement of 5 inch to the top flange. The sum of all the reaction forces at
top node set and the average of all the spatial displacements from the top node points
are recorded for further analysis. The typical web crippling failure observed in finite
element analysis after the analysis is shown in the Figure 3.4.
75
Top FlangeX,Z,1,2,3 = fixed
Y = ‐5 in. Displacement
Bottom FlangeX,Y,Z,1,2,3 = fixed
Y
Z X
Figure 3.4 Finite element model after analysis
The data which was recorded earlier (in history output) in ABAQUS was used to
plot a peak load versus Displacement curve. Figure 3.5 illustrate a typical load versus
displacement curve.
0
200
400
600
800
1000
1200
0 0.1 0.2 0.3 0.4 0.5 0.6
Peak Lo
ad in
lbs
Displacement in inch
Peak Load Vs Displacement CurveSection‐600S200‐54
Figure 3.5 Typical peak load versus displacement curve.
76

In comparison analysis, the peak load value (maximum force value) of the curve
is considered and the particular value is recorded in the result matrix. Appendix D
represents the finite element result matrix with the maximum peak load values of all C‐
joists at each d/h and each q/h ratio. The result matrix was created for each d/h and
each q/h ratio. The maximum value of peak load value particular to this result matrix is
identified and the corresponding d/h and q/h ratio is selected as the optimum ratio.
77
3.2 RESULTS AND DISCUSSION
3.2.1 Optimization of New generation C‐Joist in Web Crippling
All the finite element models were inelastic nonlinear analyses. Geometric
nonlinearity were considered in the ABAQUS model, however, geometric imperfection
was not included. A total of 180 simulations were run in ABAQUS and the result matrix is
generated based on the results. Appendix D represents the values for peak loads of the
sections with edge stiffened web holes, theoretical values for sections without hole and
peak loads of the sections without holes. Theoretical values are calculated from the
equation given by the NAS (2007) for the sections without holes. The Table 3.2 shows
the typical result matrix of the 600S162‐33 C‐joist. Table 3.2 shows that the 600S162‐33
section gives the highest peak load in web crippling failure when the d/h ratio equals 0.2
and the q/h ratio equals 0.06.
Table 3.2 Result matrix of in‐elastic analysis for 600s162‐33 C‐Joist
600S162‐33 Peak load in lbs at 33 ksi
q/h d/h
0.2 0.4 0.5 0.6 0.8
0.06 1110.8* 1025.8 1027.2 1028.0 1052.2
0.08 1052.2 1029.1 1029.1 1029.9 1058.3
0.1 1079.6 1031.0 1031.8 1035.4 1065.5
Note: *Optimum d/h Ratio = 0.2 and Optimum q/h Ratio = 0.06 (see Figure 3.6)
78

Figure 3.6 illustrates the comparison of peak load values at different d/h and q/h
ratios. The 0.2 d/h ratio and 0.06 q/h ratio gives the highest peak load for the 600s162‐
33 section; therefore, these ratios are picked as the winner and is used for further
analysis.
1020
1030
1040
1050
1060
1070
1080
1090
1100
1110
1120
0.06 0.08 0.1
Peak Load (lbs)
q/h Ratio
600s162‐33
0.2
0.4
0.5
0.6
0.8
d/h Ratio
Figure 3.6 Comparison of peak load value of 600s162‐33 C‐Joist
For further analysis, the optimum ratios of all the C‐joists with their peak load
values are tabulated in Table 3.3. Table 16 shows the optimum d/h and q/h ratios for
the web opening as well as the corresponding highest peak load. It also shows the
dimensions of the diameter of the web opening and the depth of the edge stiffener. The
nearest fractional value is recommended to facilitate the manufacturing process.
79
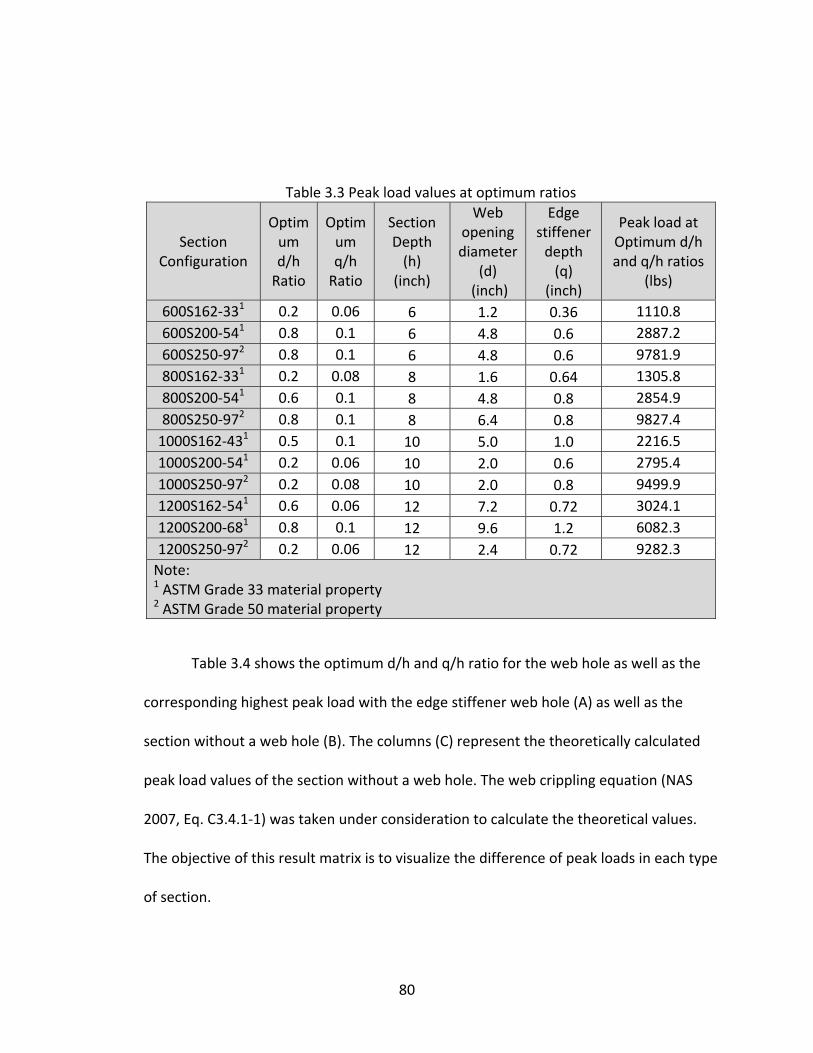
Table 3.3 Peak load values at optimum ratios
Section Configuration
Optimum d/h Ratio
Optimum q/h Ratio
Section Depth (h)
(inch)
Web opening diameter
(d) (inch)
Edge stiffener depth (q)
(inch)
Peak load at Optimum d/h and q/h ratios
(lbs)
600S162‐331 0.2 0.06 6 1.2 0.36 1110.8 600S200‐541 0.8 0.1 6 4.8 0.6 2887.2 600S250‐972 0.8 0.1 6 4.8 0.6 9781.9 800S162‐331 0.2 0.08 8 1.6 0.64 1305.8 800S200‐541 0.6 0.1 8 4.8 0.8 2854.9 800S250‐972 0.8 0.1 8 6.4 0.8 9827.4 1000S162‐431 0.5 0.1 10 5.0 1.0 2216.5 1000S200‐541 0.2 0.06 10 2.0 0.6 2795.4 1000S250‐972 0.2 0.08 10 2.0 0.8 9499.9 1200S162‐541 0.6 0.06 12 7.2 0.72 3024.1 1200S200‐681 0.8 0.1 12 9.6 1.2 6082.3 1200S250‐972 0.2 0.06 12 2.4 0.72 9282.3 Note: 1 ASTM Grade 33 material property 2 ASTM Grade 50 material property
Table 3.4 shows the optimum d/h and q/h ratio for the web hole as well as the
corresponding highest peak load with the edge stiffener web hole (A) as well as the
section without a web hole (B). The columns (C) represent the theoretically calculated
peak load values of the section without a web hole. The web crippling equation (NAS
2007, Eq. C3.4.1‐1) was taken under consideration to calculate the theoretical values.
The objective of this result matrix is to visualize the difference of peak loads in each type
of section.
80
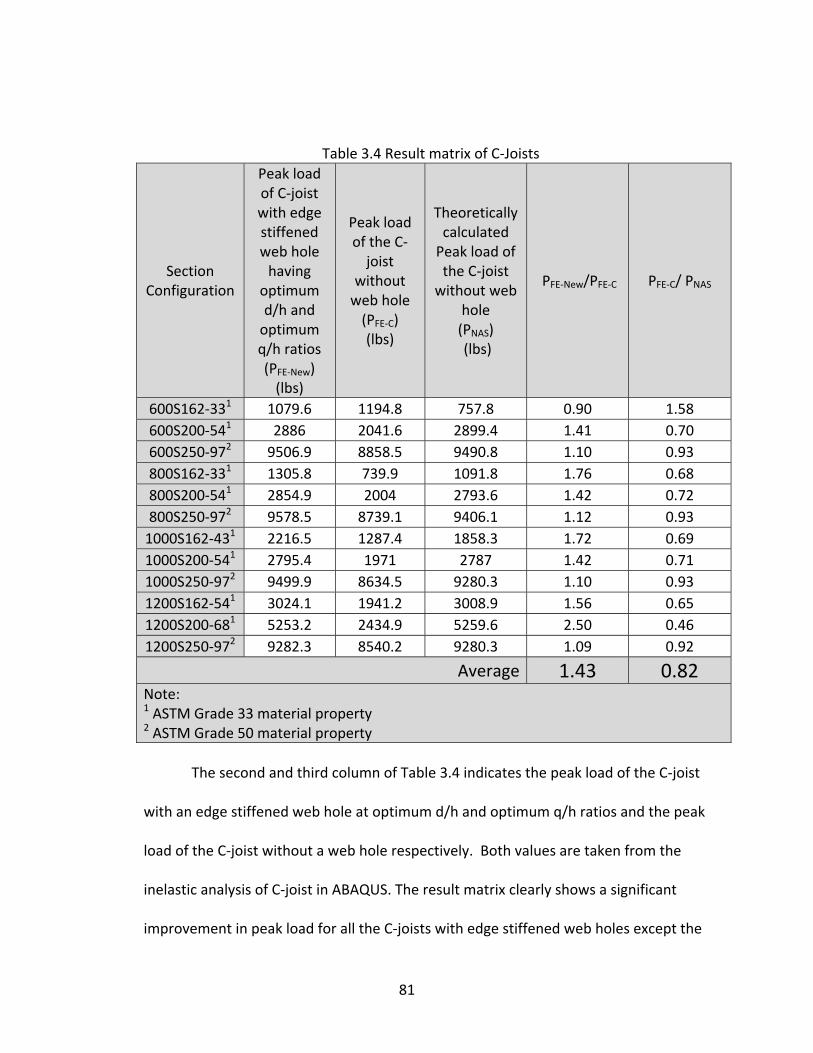
Table 3.4 Result matrix of C‐Joists
Section Configuration
Peak load of C‐joist with edge stiffened web hole having
optimum d/h and optimum q/h ratios (PFE‐New) (lbs)
Peak load of the C‐joist
without web hole (PFE‐C) (lbs)
Theoretically calculated Peak load of the C‐joist without web
hole (PNAS) (lbs)
PFE‐New/PFE‐C PFE‐C/ PNAS
600S162‐331 1079.6 1194.8 757.8 0.90 1.58 600S200‐541 2886 2041.6 2899.4 1.41 0.70 600S250‐972 9506.9 8858.5 9490.8 1.10 0.93 800S162‐331 1305.8 739.9 1091.8 1.76 0.68 800S200‐541 2854.9 2004 2793.6 1.42 0.72 800S250‐972 9578.5 8739.1 9406.1 1.12 0.93 1000S162‐431 2216.5 1287.4 1858.3 1.72 0.69 1000S200‐541 2795.4 1971 2787 1.42 0.71 1000S250‐972 9499.9 8634.5 9280.3 1.10 0.93 1200S162‐541 3024.1 1941.2 3008.9 1.56 0.65 1200S200‐681 5253.2 2434.9 5259.6 2.50 0.46 1200S250‐972 9282.3 8540.2 9280.3 1.09 0.92
Average 1.43 0.82Note: 1 ASTM Grade 33 material property 2 ASTM Grade 50 material property
The second and third column of Table 3.4 indicates the peak load of the C‐joist
with an edge stiffened web hole at optimum d/h and optimum q/h ratios and the peak
load of the C‐joist without a web hole respectively. Both values are taken from the
inelastic analysis of C‐joist in ABAQUS. The result matrix clearly shows a significant
improvement in peak load for all the C‐joists with edge stiffened web holes except the
81

600s162‐33 C‐joist. The results shows the C‐joist with an edge stiffened web holes is a
average 43% (1.43) improvement over the C‐joist without a hole, the deviation is 10%.
The last column of Table 6.3 represents the comparison of theoretically
calculated peak loads (calculated from the web crippling equation for the C‐joist without
a web hole) and peak loads of the C‐joist without a web hole from the inelastic analysis
in ABAQUS. It clearly shows the peak load values calculated from the theoretical
equation are significantly lower (0.82 or 18%) than the peak load found from the
inelastic analysis of ABAQUS model of the C‐joist without a web hole.
82
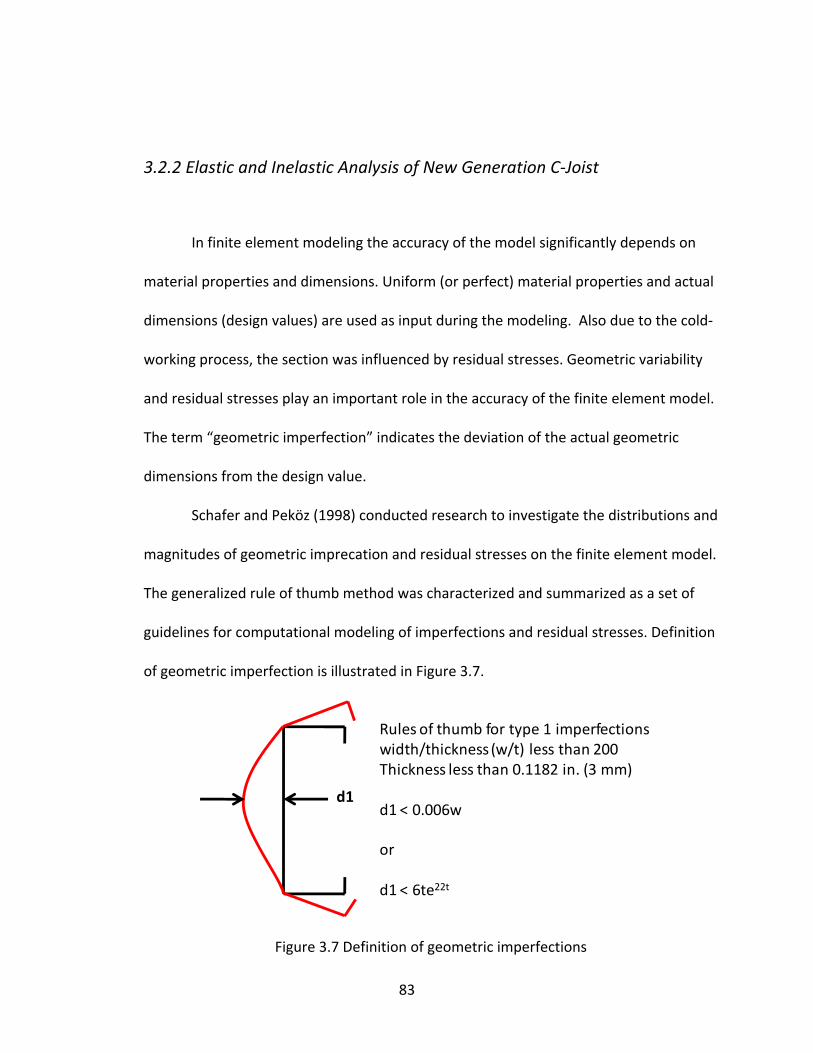
3.2.2 Elastic and Inelastic Analysis of New Generation C‐Joist
In finite element modeling the accuracy of the model significantly depends on
material properties and dimensions. Uniform (or perfect) material properties and actual
dimensions (design values) are used as input during the modeling. Also due to the cold‐
working process, the section was influenced by residual stresses. Geometric variability
and residual stresses play an important role in the accuracy of the finite element model.
The term “geometric imperfection” indicates the deviation of the actual geometric
dimensions from the design value.
Schafer and Peköz (1998) conducted research to investigate the distributions and
magnitudes of geometric imprecation and residual stresses on the finite element model.
The generalized rule of thumb method was characterized and summarized as a set of
guidelines for computational modeling of imperfections and residual stresses. Definition
of geometric imperfection is illustrated in Figure 3.7.
d1
Rules of thumb for type 1 imperfectionswidth/thickness (w/t) less than 200Thickness less than 0.1182 in. (3 mm)
d1 < 0.006w
or
d1 < 6te22t
Figure 3.7 Definition of geometric imperfections
83
Based on their research, the geometric factor d1=0.34 x t was selected for the
ABAQUS models. The particular value has a 50% probability of occurrence with a
particular imperfection magnitude.
The input file for the particular C‐joist, which was created earlier from the
MatLab, was modified. The “buckle, eigensolver=lanczos” command was introduced in
the input file. This command was specifically used to perform the elastic buckling
analysis of the C‐joist. The input file was saved as an elastic file (e.g. 600s162‐33_e). The
different buckling modes (failure modes) were investigated and it was found that
buckling modes 1 and 2 were particularly interesting for the research; therefore, these
buckling modes were accommodated in the inelastic (or plastic) analysis. In inelastic
analysis, the geometric imperfection was introduced in the input file by giving the
command as “imperfection, file=600s162‐33_e, step=1 … 1, 0.01176.” The command
described as the inelastic analysis with geometric imperfection was performed on the
elastic input file (600s162‐33_e). 1 indicates the buckling mode 1 and 0.01176 (=0.34*t,
where t =0.0346 inch) indicates the geometric imperfection factor (d1/t =0.34), which
was chose, based on the research studies of Schafer and Peköz (1998).
Initially, two sections (600s162‐33 and 1200s162‐54) with two types of buckling
modes are considered and results are compared with the theoretical values. The Table
6.4 compares the theoretically calculated peak load with peak load with geometric
imperfection of the C‐joist without a web hole. The first column shows the factor of the
geometric imperfection introduced in the input file. It is evident that the peak load with
84
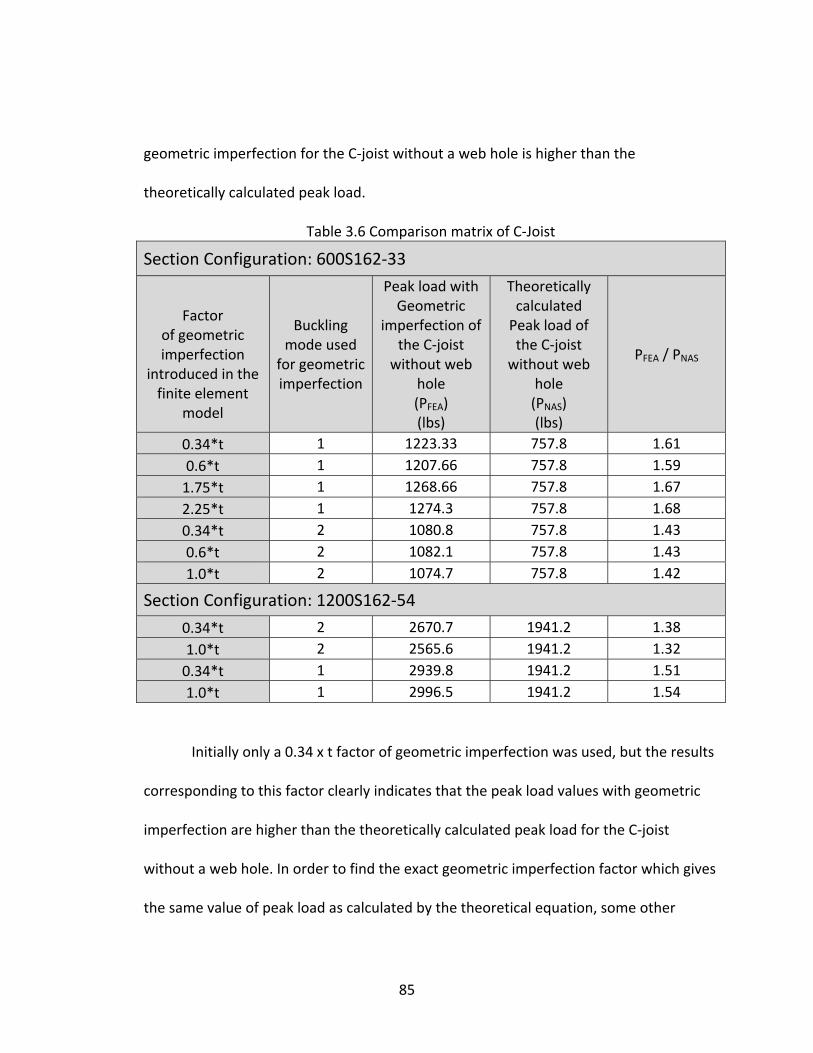
geometric imperfection for the C‐joist without a web hole is higher than the
theoretically calculated peak load.
Table 3.6 Comparison matrix of C‐Joist
Section Configuration: 600S162‐33
Factor
of geometric imperfection
introduced in the finite element
model
Buckling mode used
for geometric imperfection
Peak load with Geometric
imperfection of the C‐joist without web
hole (PFEA) (lbs)
Theoretically calculated Peak load of the C‐joist without web
hole (PNAS) (lbs)
PFEA / PNAS
0.34*t 1 1223.33 757.8 1.61 0.6*t 1 1207.66 757.8 1.59 1.75*t 1 1268.66 757.8 1.67 2.25*t 1 1274.3 757.8 1.68 0.34*t 2 1080.8 757.8 1.43 0.6*t 2 1082.1 757.8 1.43 1.0*t 2 1074.7 757.8 1.42
Section Configuration: 1200S162‐54
0.34*t 2 2670.7 1941.2 1.38 1.0*t 2 2565.6 1941.2 1.32 0.34*t 1 2939.8 1941.2 1.51 1.0*t 1 2996.5 1941.2 1.54
Initially only a 0.34 x t factor of geometric imperfection was used, but the results
corresponding to this factor clearly indicates that the peak load values with geometric
imperfection are higher than the theoretically calculated peak load for the C‐joist
without a web hole. In order to find the exact geometric imperfection factor which gives
the same value of peak load as calculated by the theoretical equation, some other
85

geometric imperfection factors were also analyzed, and the results are as given in Table
3.6.
The results corresponding to all the geometric imperfection factors clearly
indicate that the peak load values with geometric imperfection are still higher than the
theoretically calculated peak load for the C‐joist without a web hole.
86
3.3 SUMMARY
The extensive web crippling investigation of cold‐formed steel C‐joist with edge
stiffened web holes is successfully analyzed using finite element package ABAQUS. The
results show the optimum stiffened hole can greatly increase the web crippling strength
of the joist with the optimum hole profile. The results indicate an average performance
improvement of 43% in the peak load can be achieved by the new generation joist
compared to the C‐joist without a web hole.
NAS provides the web crippling equation for the section without a web hole. The
theoretical nominal value of the C‐joist without a web hole was calculated using this
equation, and the results clearly show that the theoretical values of peak loads are 18%
lower than values found from the finite element model of the joist without a web hole.
Geometric imperfection was also introduced in the finite element model but the results
do not confirm with the theoretical values. Therefore, it is recommended that some
other factors along with geometric imperfection be considered for finite element
modeling in future research.
87
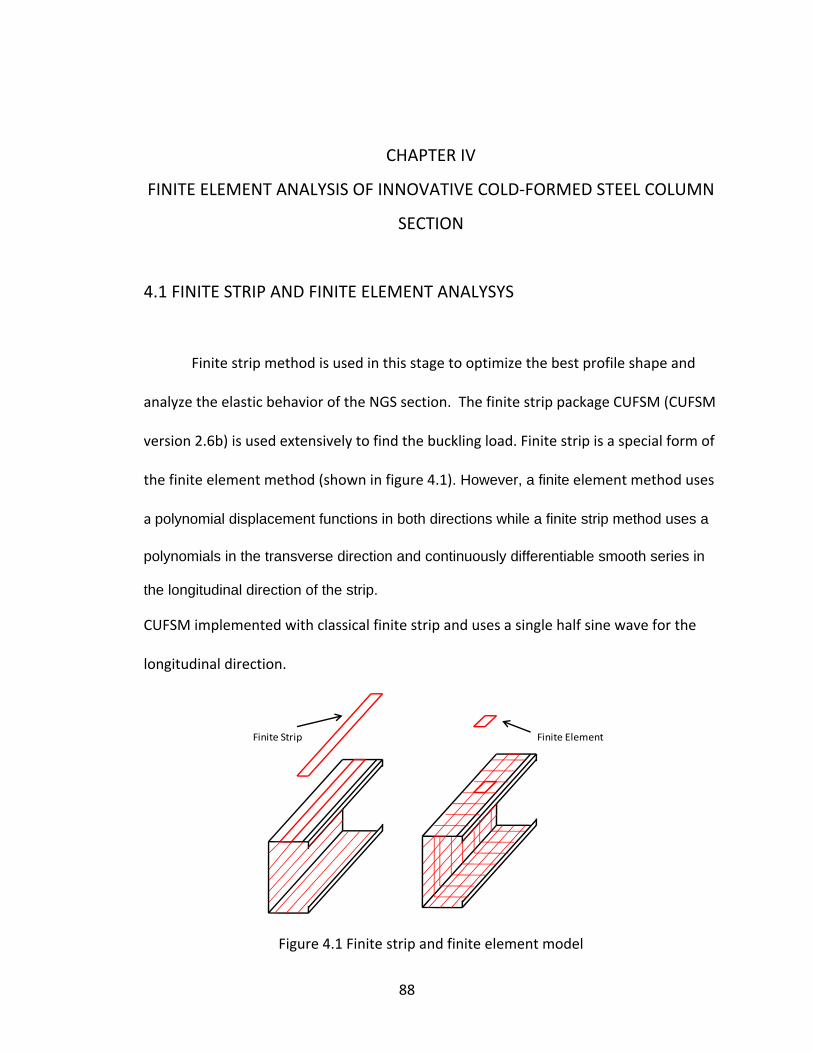
CHAPTER IV
FINITE ELEMENT ANALYSIS OF INNOVATIVE COLD‐FORMED STEEL COLUMN
SECTION
4.1 FINITE STRIP AND FINITE ELEMENT ANALYSYS
Finite strip method is used in this stage to optimize the best profile shape and
analyze the elastic behavior of the NGS section. The finite strip package CUFSM (CUFSM
version 2.6b) is used extensively to find the buckling load. Finite strip is a special form of
the finite element method (shown in figure 4.1). However, a finite element method uses
a polynomial displacement functions in both directions while a finite strip method uses a
polynomials in the transverse direction and continuously differentiable smooth series in
the longitudinal direction of the strip.
CUFSM implemented with classical finite strip and uses a single half sine wave for the
longitudinal direction.
Finite Strip Finite Element
Figure 4.1 Finite strip and finite element model
88

In order to optimize the profile shape and evaluate the peak load of the new
generation section (NGS), this study is divided into four stages:
1. Elastic analysis of single NGS section by a finite strip method to optimize
the profile shape using CUFSM software.
2. Elastic analysis of double NGS section by a finite strip method to optimize
the profile shape using CUFSM software.
3. Inelastic analysis of the optimized profile of single and double NGS
sections to find the peak load by a finite element method using ABAQUS
software.
4. Comparison analysis of the peak load of single and double NGS sections
with a corresponding SigmaStud® section by a finite element method
using ABAQUS software.
A total of 52 sections were selected from the Steel Stud Manufacturers
Association (SSMA‐2007) catalogue. The section under consideration were chosen in
such a way that all typical section configurations (all web heights, flange widths,
thickness) are covered so that the conclusions are drawn from the cumulative results
and represent the true picture. Figure 4.2 shows the NGS section with nomenclature.
Table 4.1 shows the C‐section selected from the Steel Stud Manufacturer Association
(SSMA) catalogue with member depth; flange width, thickness, inside corner radius and
edge stiffener length. The same product identification code described in Part two is also
applicable for all the 52 sections.
89
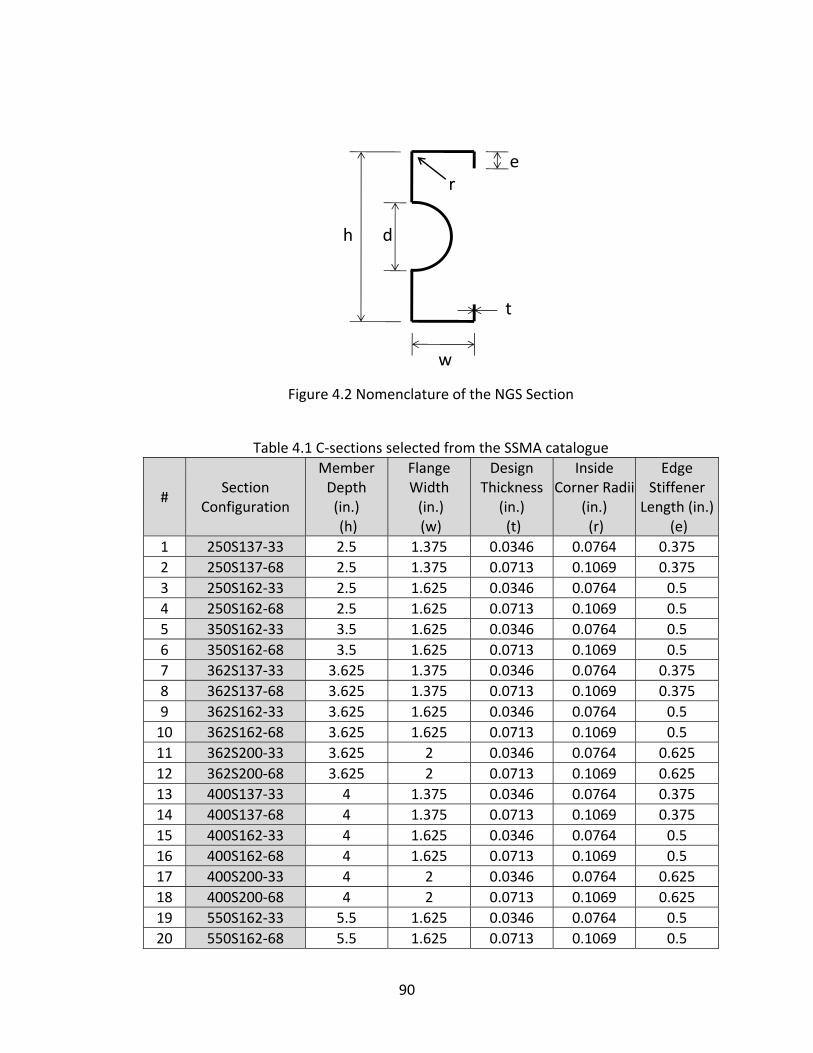
w
h
e
t
r
d
Figure 4.2 Nomenclature of the NGS Section
Table 4.1 C‐sections selected from the SSMA catalogue
# Section
Configuration
Member Depth (in.) (h)
Flange Width (in.) (w)
Design Thickness
(in.) (t)
Inside Corner Radii
(in.) (r)
Edge Stiffener
Length (in.) (e)
1 250S137‐33 2.5 1.375 0.0346 0.0764 0.375 2 250S137‐68 2.5 1.375 0.0713 0.1069 0.375 3 250S162‐33 2.5 1.625 0.0346 0.0764 0.5 4 250S162‐68 2.5 1.625 0.0713 0.1069 0.5 5 350S162‐33 3.5 1.625 0.0346 0.0764 0.5 6 350S162‐68 3.5 1.625 0.0713 0.1069 0.5 7 362S137‐33 3.625 1.375 0.0346 0.0764 0.375 8 362S137‐68 3.625 1.375 0.0713 0.1069 0.375 9 362S162‐33 3.625 1.625 0.0346 0.0764 0.5 10 362S162‐68 3.625 1.625 0.0713 0.1069 0.5 11 362S200‐33 3.625 2 0.0346 0.0764 0.625 12 362S200‐68 3.625 2 0.0713 0.1069 0.625 13 400S137‐33 4 1.375 0.0346 0.0764 0.375 14 400S137‐68 4 1.375 0.0713 0.1069 0.375 15 400S162‐33 4 1.625 0.0346 0.0764 0.5 16 400S162‐68 4 1.625 0.0713 0.1069 0.5 17 400S200‐33 4 2 0.0346 0.0764 0.625 18 400S200‐68 4 2 0.0713 0.1069 0.625 19 550S162‐33 5.5 1.625 0.0346 0.0764 0.5 20 550S162‐68 5.5 1.625 0.0713 0.1069 0.5
90
Table 4.1 C‐sections selected from the SSMA catalogue (continued)
21 600S137‐33 6 1.375 0.0346 0.0764 0.375 22 600S137‐54 6 1.375 0.0566 0.0849 0.375 23 600S137‐97 6 1.375 0.1017 0.1525 0.375 24 600S162‐33 6 1.625 0.0346 0.0764 0.5 25 600S162‐54 6 1.625 0.0566 0.0849 0.5 26 600S162‐97 6 1.625 0.1017 0.1525 0.5 27 600S200‐33 6 2 0.0346 0.0764 0.625 28 600S200‐54 6 2 0.0566 0.0849 0.625 29 600S200‐97 6 2 0.1017 0.1525 0.625 30 800S137‐33 8 1.375 0.0346 0.0764 0.375 31 800S137‐54 8 1.375 0.0566 0.0849 0.375 32 800S137‐97 8 1.375 0.1017 0.1525 0.375 33 800S162‐33 8 1.625 0.0346 0.0764 0.5 34 800S162‐54 8 1.625 0.0566 0.0849 0.5 35 800S162‐97 8 1.625 0.1017 0.1525 0.5 36 800S200‐33 8 2 0.0346 0.0764 0.625 37 800S200‐54 8 2 0.0566 0.0849 0.625 38 800S200‐97 8 2 0.1017 0.1525 0.625 39 800S250‐43 8 2.5 0.0451 0.0712 0.625 40 800S250‐97 8 2.5 0.1017 0.1525 0.625 41 1000S162‐43 10 1.625 0.0451 0.0712 0.5 42 1000S162‐97 10 1.625 0.1017 0.1525 0.5 43 1000S200‐43 10 2 0.0451 0.0712 0.625 44 1000S200‐97 10 2 0.1017 0.1525 0.625 45 1000S250‐43 10 2.5 0.0451 0.0712 0.625 46 1000S250‐97 10 2.5 0.1017 0.1525 0.625 47 1200S162‐54 10 1.625 0.0566 0.0849 0.5 48 1200S162‐97 10 1.625 0.1017 0.1525 0.5 49 1200S200‐54 10 2 0.0566 0.0849 0.625 50 1200S200‐97 10 2 0.1017 0.1525 0.625 51 1200S250‐54 10 2.5 0.0566 0.0849 0.625 52 1200S250‐97 10 2.5 0.1017 0.1525 0.625
91
4.1.1 Elastic Analysis of NGS Section to Optimize the Profile Shape
The finite strip method is used in this stage to optimize the profile shape and
analyze the elastic behavior of the NGS sections. The finite strip package CUFSM
(CUFSM version 2.6b ‐ 2007) is used extensively to find the elastic buckling load.
To optimize the profile shape (half round Sigma shape), seven d/h ratios were
chosen. The identification of each member with its corresponding identification code is
shown in Figure 4.3.
Web depth (h)
6” = 600 x 1/100 inches
Flange width (b)
1.62” = 162 x 1/100 inches
Style
S = Stud or Joist
SG = Sigma Stud or Joist
Material Thickness
0.033 = 33 mils
1 mils = 1/1000 inches
600 S 162 33- 2-D
d/h Ratio
2= 2/10=0.2
1 = regular C‐section
w = 2b/h
Section
S = Single
D= Double or back to back
Figure 4.3 Member Identification Code
92
The section under consideration is then sent for analysis, and the results display
the buckling curve (load factor versus half wavelength), which is as shown in Figure 4.4.
Minimaindicates the lowest load level at which particular mode of buckling occurs
Local Buckling
Distortional Buckling
Lateral Torsional Buckling @ 96 inch length
S600s200‐54‐5
Figure 4.4 Buckling curve for the 600s200‐54 NGS section
Three types of buckling modes namely Local, distortional, and lateral–torsional
buckling are observed in cold formed steel open cross section columns or compression
members when it subjected to pure compressive stresses.
The minimum (minima) of this curve indicates the critical half‐wavelength and
load factor for a given buckling mode. The minima, indicates the lowest load level at
which a particular type of buckling occurs. The minimum is sought for each type of
buckling. It observed that an identified cross‐section mode shape is repeated along the
length of the member. In CUFSM, the member is loaded with a reference load
distribution, which is load factor time the load distribution is equal to the buckling load.
93

For the S600s200‐54‐5 section the member is under compression stresses with a
load distribution of 1.0 kip on whole model. After the analysis a local buckling load
factor of 77.80 is identified; therefore, the local buckling load is 1.0 kip x 77.80 = 77.80
kip.
Similarly, an analysis is performed for each member with its seven corresponding
ratios. After the analysis of the ratios, the results of all the buckling curves are placed
together in one page. The data are then compared and the optimum d/h ratio is
selected. The maximum load factor value of each minima of buckling mode qualifies for
the optimum ratio and subjectively comparing these three buckling mode values allows
for the selection of the optimum d/h ratio. Figure 4.5 illustrate the buckling curve
comparison of the single 600S200‐54 NGS sections with the 600S200‐54 C‐section.
94

Best d/h RatioThe maximum value of each minima of buckling mode qualifies for the best ratio.
Local Buckling
Distortional Buckling
Lateral Torsional
Buckling @ 96 inch length
Figure 4.5 Buckling curve comparison for 600s200‐54 single NGS section
Figure 4.5 shows three buckling modes (local, distortional, and later‐torsional) of
600s200‐54 single NGS section and 600s200‐54 C‐section. The buckling shape in the
Figure 4.5 indicates the buckling mode of the section (web and flange).
For the NGS sections, local buckling stresses are higher than distortional buckling
stresses and lateral‐torsional buckling stresses and lateral‐torsional buckling stresses are
the lowest. But for the C‐section local buckling stresses were lower than the other two
buckling stresses. For the C‐section, it was observed that the flange and web buckled
95
under the local buckling mode while there is no such buckling observed on the web of
NGS section. The buckling of flange is similar in both the sections.
For the NGS sections, distortional buckling is the first mode of failure for the
section having a short length (less than 40 in.) and the lateral‐torsional buckling is the
second failure mode for the section having a long wavelength. In distortional buckling
mode, the web of the C‐section buckled and flange rotates about the web, but such
buckling of web was not seen on NGS sections. The buckling of the web was restricted
due to the new generation profile of the web. This profile act as an intermediate
stiffener and because of this new generation shape the buckling strength of NGS
sections was significantly higher than the C‐sections. Also, in lateral‐torsional buckling
the C‐section rotates axially and turning of this section visible in the Figure 4.5, while
such rotation was not observed in NGS section. Due to the NGS profile on the web the
torsional rigidity of the section was increased and the NGS section was moved rather
than turning and twisting.
Appendix E shows the comparison of all buckling curves of a single NGS section
and also shows the optimum d/h ratio.
96

4.1.2 Elastic Analysis of Double NGS Section to Optimize the Profile Shape
In this stage, a finite strip analysis is performed on the double NGS section using
CUFSM software. Two NGS sections are tied together on opposite faces so that they
form an I‐section and the thickness at the connecting edges is doubled. In CUFSM, the
node points are given to the software in terms of a I‐section; to models a double section
the elements corresponding to the connecting edges are assigned by double section
thickness. Figure 4.6 shows a typical double section model in CUFSM. Figure shows the
thicker element connected with 3 and 4 node points as well as 22 and 23 node points.
3
4
22
23
Figure 4.6 Double NGS section in CUFSM
97

Similar to stage one, once the model is created, the pure compression stresses
are applied on all the node points. The Double NGS section is then sent for analysis and
the results are produced in terms of a buckling curve (load factor versus half
wavelength), which is shown in Figure 4.7. As mentioned previously, the minimum
buckling curve for the single NGS section indicates the critical half wavelength and load
factor for a given buckling mode.
Minimaindicates the lowest load level at which particular mode of buckling occurs
Local Buckling Distortional Buckling
Lateral Torsional Buckling @ 96 inch length
D600s200‐54‐w
Figure 4.7 Buckling curve for the 600s200‐54 double NGS section
Figure shows all three types of buckling modes and corresponding buckling
shape. For the D600s200‐54‐w section, the member is under compression stresses with
98
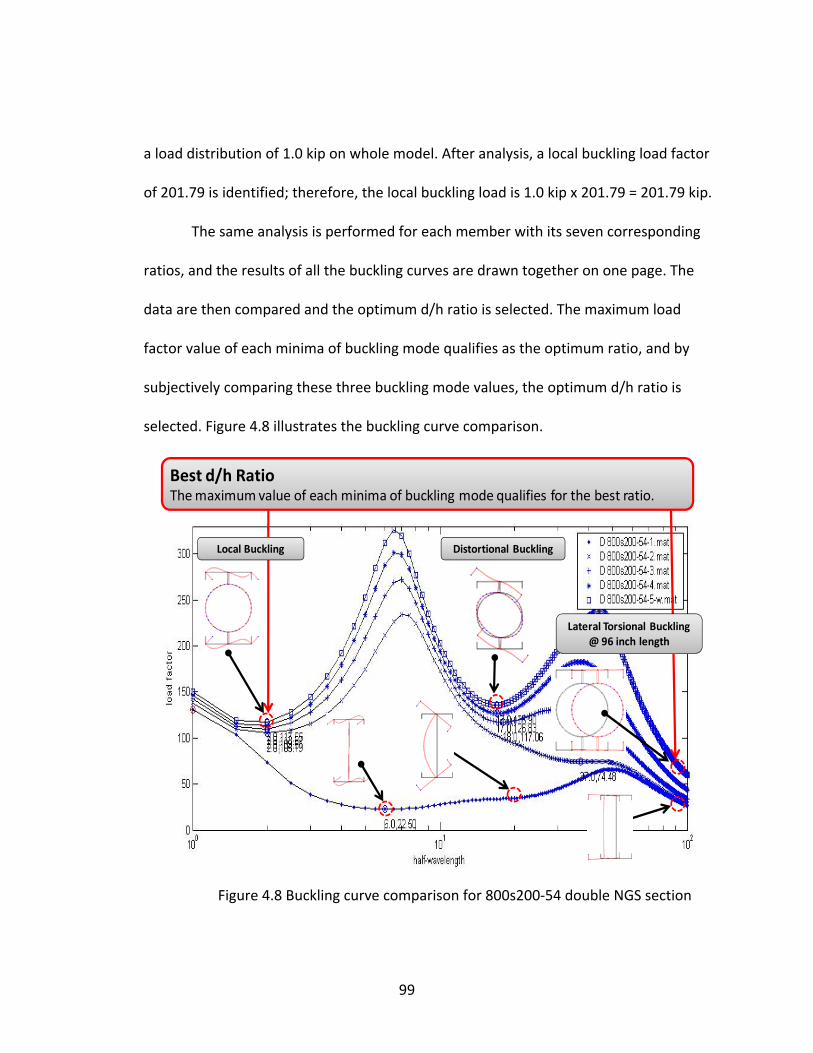
a load distribution of 1.0 kip on whole model. After analysis, a local buckling load factor
of 201.79 is identified; therefore, the local buckling load is 1.0 kip x 201.79 = 201.79 kip.
The same analysis is performed for each member with its seven corresponding
ratios, and the results of all the buckling curves are drawn together on one page. The
data are then compared and the optimum d/h ratio is selected. The maximum load
factor value of each minima of buckling mode qualifies as the optimum ratio, and by
subjectively comparing these three buckling mode values, the optimum d/h ratio is
selected. Figure 4.8 illustrates the buckling curve comparison.
Distortional Buckling
Best d/h RatioThe maximum value of each minima of buckling mode qualifies for the best ratio.
Local Buckling
Lateral Torsional Buckling @ 96 inch length
Figure 4.8 Buckling curve comparison for 800s200‐54 double NGS section
99
Similar to single NGS section, the buckling stresses of the double NGS sections
are also higher than the C‐section which is as shown in Figure 4.8. The buckling shape
corresponds to the NGS section shows that the new generation web profile restricted
the web failure which is occurs in double C‐section. The local buckling stresses of the
double NGS sections are higher than the other two buckling stresses, and the lateral‐
torsional buckling stresses are the lowest. The local buckling loads of the C‐sections are
lower than the other two buckling mode loads. The buckling of web was not seen in
both the double and the NGS section. It was also noticed that the local buckling of NGS
occurs at relatively short wavelength with compare to C‐section.
In the distortional buckling mode, the web of the C‐section was buckled while
no such web buckling was observed on the web of NGS sections. In lateral‐torsional
buckling, both the sections show the same performance and turning and twisting was
restricted due to the double section.
Appendix F compares all the buckling curves of the double NGS section, and it
also shows the optimum d/h ratio for the corresponding section configuration.
100
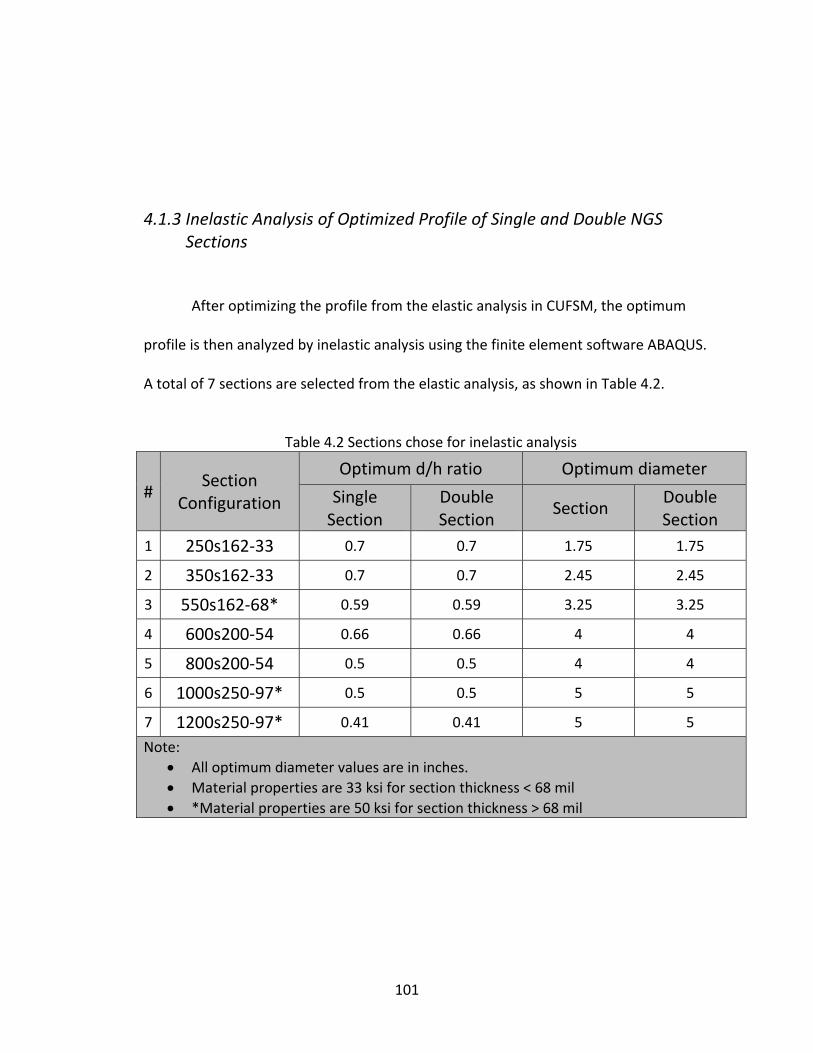
4.1.3 Inelastic Analysis of Optimized Profile of Single and Double NGS Sections
After optimizing the profile from the elastic analysis in CUFSM, the optimum
profile is then analyzed by inelastic analysis using the finite element software ABAQUS.
A total of 7 sections are selected from the elastic analysis, as shown in Table 4.2.
Table 4.2 Sections chose for inelastic analysis
# Section
Configuration
Optimum d/h ratio Optimum diameter
Single Section
DoubleSection
Section DoubleSection
1 250s162‐33 0.7 0.7 1.75 1.75
2 350s162‐33 0.7 0.7 2.45 2.45
3 550s162‐68* 0.59 0.59 3.25 3.25
4 600s200‐54 0.66 0.66 4 4
5 800s200‐54 0.5 0.5 4 4
6 1000s250‐97* 0.5 0.5 5 5
7 1200s250‐97* 0.41 0.41 5 5
Note: • All optimum diameter values are in inches. • Material properties are 33 ksi for section thickness < 68 mil • *Material properties are 50 ksi for section thickness > 68 mil
101
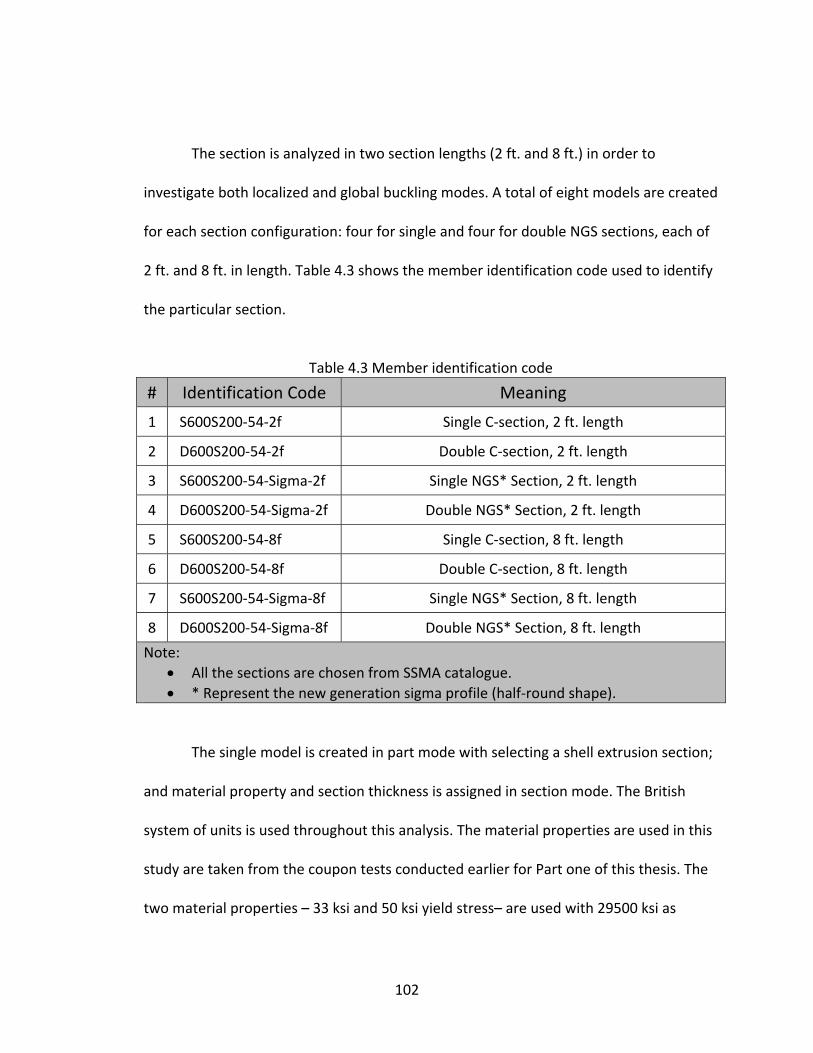
The section is analyzed in two section lengths (2 ft. and 8 ft.) in order to
investigate both localized and global buckling modes. A total of eight models are created
for each section configuration: four for single and four for double NGS sections, each of
2 ft. and 8 ft. in length. Table 4.3 shows the member identification code used to identify
the particular section.
Table 4.3 Member identification code
# Identification Code Meaning
1 S600S200‐54‐2f Single C‐section, 2 ft. length
2 D600S200‐54‐2f Double C‐section, 2 ft. length
3 S600S200‐54‐Sigma‐2f Single NGS* Section, 2 ft. length
4 D600S200‐54‐Sigma‐2f Double NGS* Section, 2 ft. length
5 S600S200‐54‐8f Single C‐section, 8 ft. length
6 D600S200‐54‐8f Double C‐section, 8 ft. length
7 S600S200‐54‐Sigma‐8f Single NGS* Section, 8 ft. length
8 D600S200‐54‐Sigma‐8f Double NGS* Section, 8 ft. length
Note: • All the sections are chosen from SSMA catalogue. • * Represent the new generation sigma profile (half‐round shape).
The single model is created in part mode with selecting a shell extrusion section;
and material property and section thickness is assigned in section mode. The British
system of units is used throughout this analysis. The material properties are used in this
study are taken from the coupon tests conducted earlier for Part one of this thesis. The
two material properties – 33 ksi and 50 ksi yield stress– are used with 29500 ksi as
102
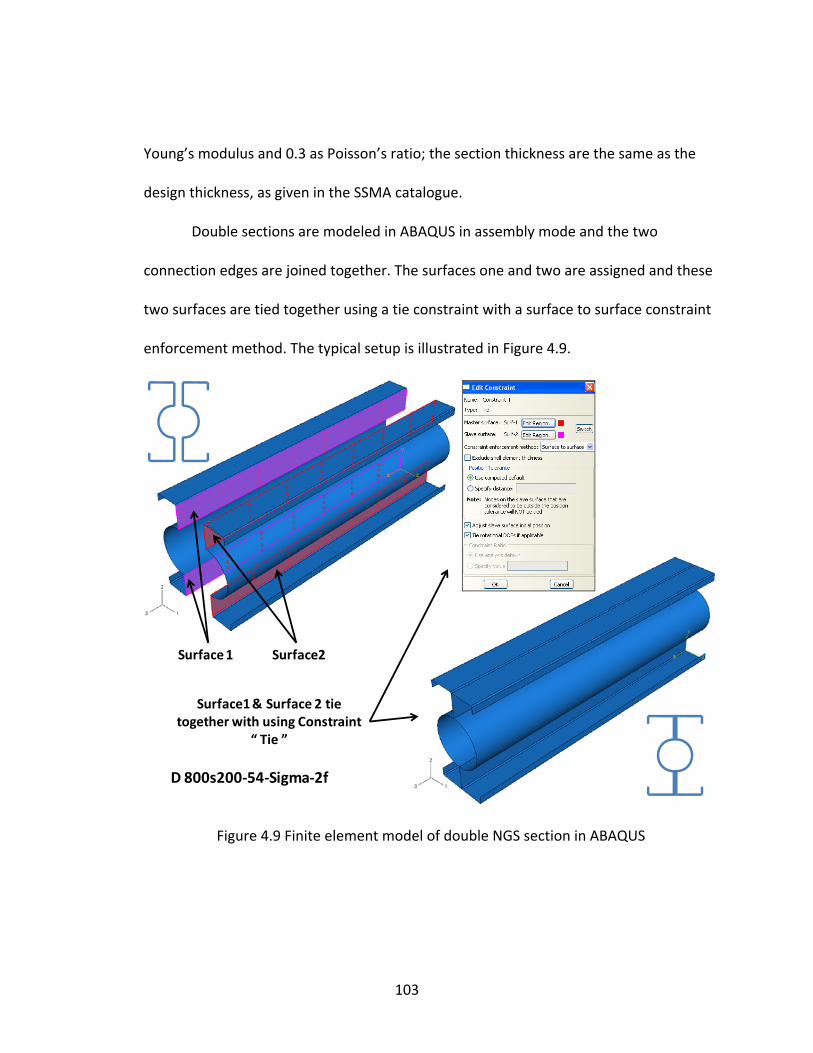
Young’s modulus and 0.3 as Poisson’s ratio; the section thickness are the same as the
design thickness, as given in the SSMA catalogue.
Double sections are modeled in ABAQUS in assembly mode and the two
connection edges are joined together. The surfaces one and two are assigned and these
two surfaces are tied together using a tie constraint with a surface to surface constraint
enforcement method. The typical setup is illustrated in Figure 4.9.
Surface 1 Surface2
D 800s200‐54‐Sigma‐2f
Surface1 & Surface 2 tie together with using Constraint
“ Tie ”
Figure 4.9 Finite element model of double NGS section in ABAQUS
103
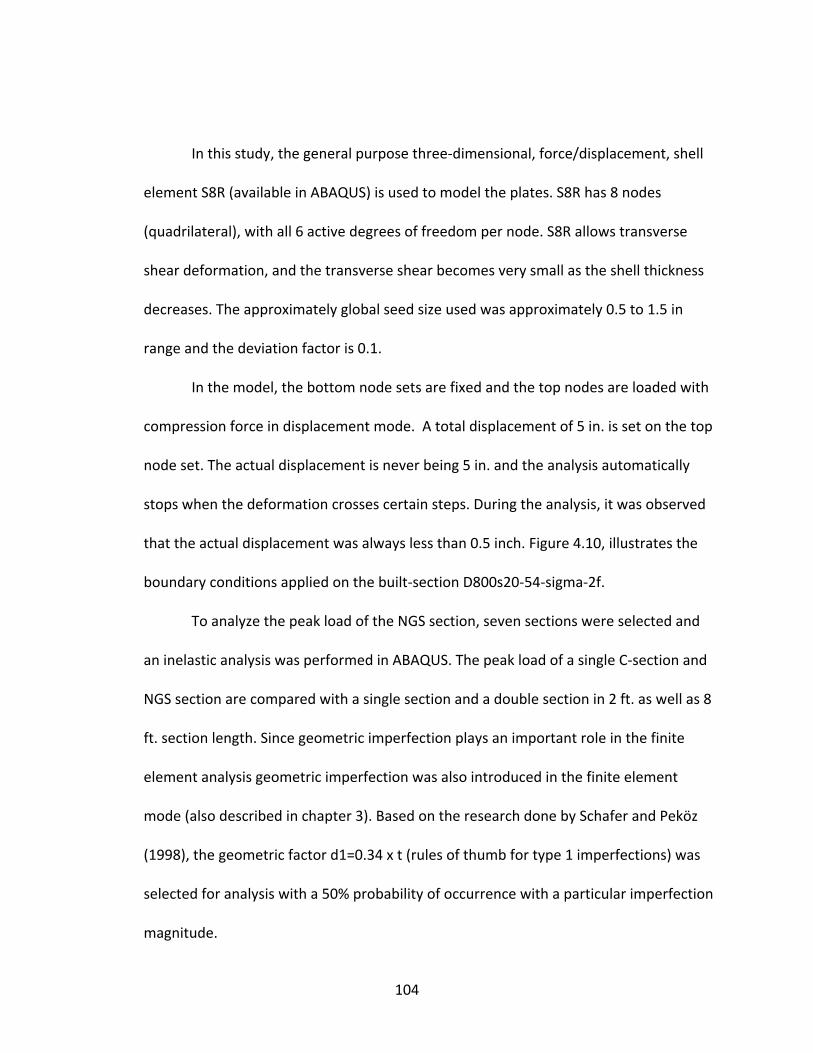
In this study, the general purpose three‐dimensional, force/displacement, shell
element S8R (available in ABAQUS) is used to model the plates. S8R has 8 nodes
(quadrilateral), with all 6 active degrees of freedom per node. S8R allows transverse
shear deformation, and the transverse shear becomes very small as the shell thickness
decreases. The approximately global seed size used was approximately 0.5 to 1.5 in
range and the deviation factor is 0.1.
In the model, the bottom node sets are fixed and the top nodes are loaded with
compression force in displacement mode. A total displacement of 5 in. is set on the top
node set. The actual displacement is never being 5 in. and the analysis automatically
stops when the deformation crosses certain steps. During the analysis, it was observed
that the actual displacement was always less than 0.5 inch. Figure 4.10, illustrates the
boundary conditions applied on the built‐section D800s20‐54‐sigma‐2f.
To analyze the peak load of the NGS section, seven sections were selected and
an inelastic analysis was performed in ABAQUS. The peak load of a single C‐section and
NGS section are compared with a single section and a double section in 2 ft. as well as 8
ft. section length. Since geometric imperfection plays an important role in the finite
element analysis geometric imperfection was also introduced in the finite element
mode (also described in chapter 3). Based on the research done by Schafer and Peköz
(1998), the geometric factor d1=0.34 x t (rules of thumb for type 1 imperfections) was
selected for analysis with a 50% probability of occurrence with a particular imperfection
magnitude.
104
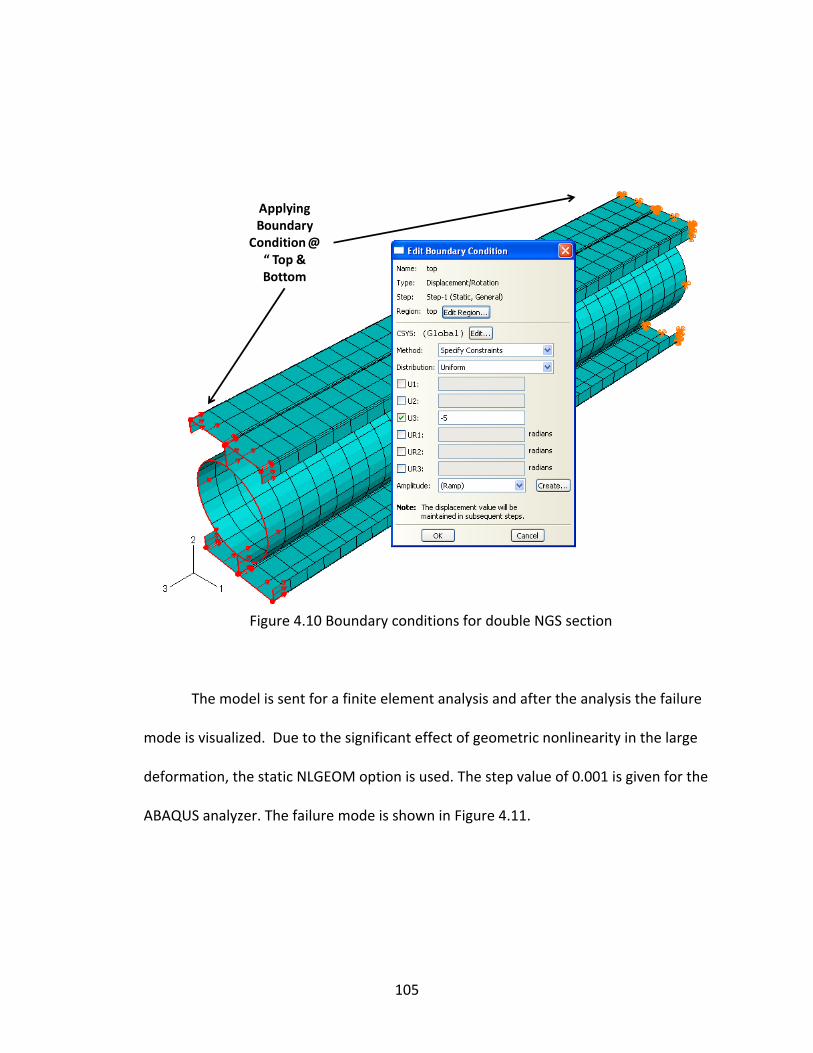
Applying Boundary
Condition @“ Top & Bottom
Figure 4.10 Boundary conditions for double NGS section
The model is sent for a finite element analysis and after the analysis the failure
mode is visualized. Due to the significant effect of geometric nonlinearity in the large
deformation, the static NLGEOM option is used. The step value of 0.001 is given for the
ABAQUS analyzer. The failure mode is shown in Figure 4.11.
105

D 600s200‐54‐Sigma‐2f
Result@
Frame # 0
Result@
Frame # 70
Figure 4.11 Failure mode of double NGS Section on ABAQUS
The load versus displacement curve are plotted to find the strength of the
member. A typical curve is as shown in Figure 4.12. Appendix G represents the load
versus displacement curve for all the sections under consideration.
106

Figure 4.12 Load versus displacement curve
From the curve, the maximum peak load can be obtained and this data is useful
in the comparing the NGS section with a single SigmaStud® section.
107
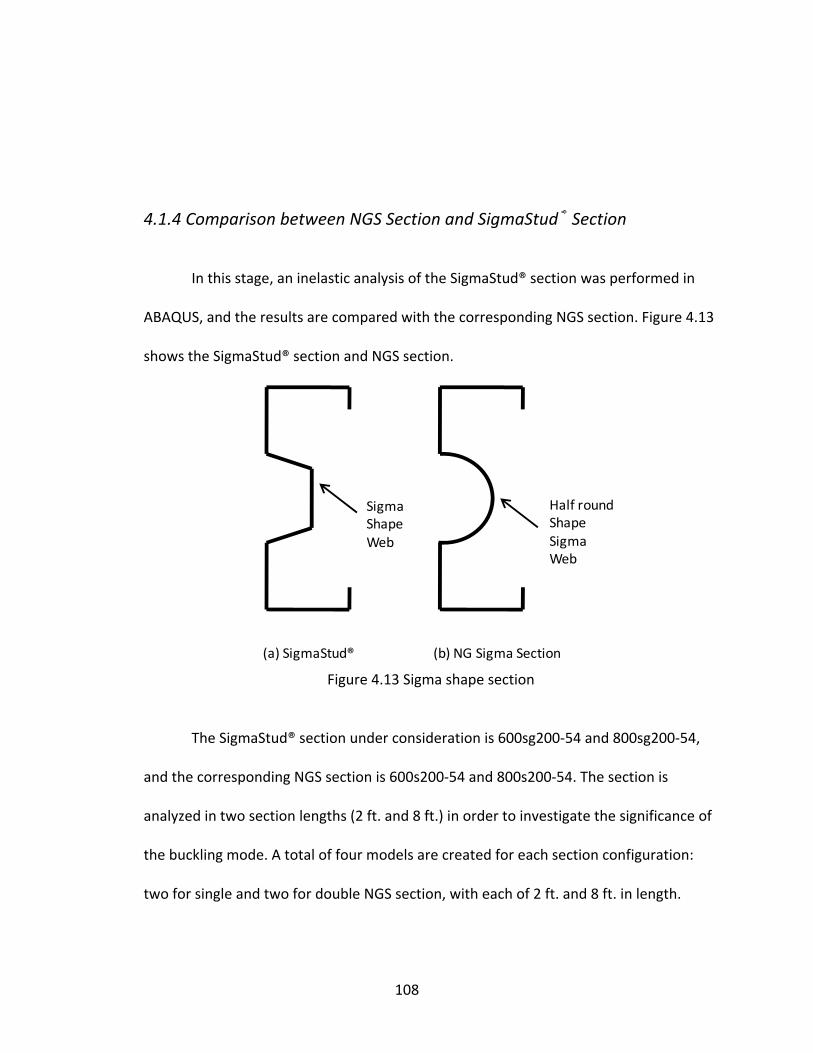
4.1.4 Comparison between NGS Section and SigmaStud® Section
In this stage, an inelastic analysis of the SigmaStud® section was performed in
ABAQUS, and the results are compared with the corresponding NGS section. Figure 4.13
shows the SigmaStud® section and NGS section.
Sigma ShapeWeb
Half roundShape SigmaWeb
(a) SigmaStud® (b) NG Sigma Section
Figure 4.13 Sigma shape section
The SigmaStud® section under consideration is 600sg200‐54 and 800sg200‐54,
and the corresponding NGS section is 600s200‐54 and 800s200‐54. The section is
analyzed in two section lengths (2 ft. and 8 ft.) in order to investigate the significance of
the buckling mode. A total of four models are created for each section configuration:
two for single and two for double NGS section, with each of 2 ft. and 8 ft. in length.
108

This investigation helps in comparing the NGS section with the single
SigmaStud® section. The dimensions were taken from the SigmaStud® (2008) catalogue
to create the finite element model of the SigmaStud® section profile. It was observed
that the depth of the NGS section (or radius) is bigger than the depth of the SigmaStud®
section, and both these finite element models are not good for a competitive
comparison. Therefore, to avoid this error in comparison, two more NGS section were
modeled, which is inscribed from the SigmaStud® section, which is as shown in Figure
4.14. This modified SigmaStud® section is then compared with the NGS section as well
as with the SigmaStud® section.
Sigma ShapeWebGenerated from inscribed
Figure 4.14 Sigma section drawn from inscribed the circle
109

4.2 RESULTS AND DISCUSSION
A total of 52 single sections as well as a total of 52 double sections were
analyzed by elastic analysis using CUFSM, and the optimum d/h ratio are identified for
all the sections. Table 4.4 shows the optimum d/h ratios for single and double section.
Appendix E and F show the buckling curves of the CUFSM analysis of single and double
NGS sections versus single and double C‐joists.
Table 4.4 Optimum d/h ratio
Single Section Double section
w
h
e
d
t
r
Section Configuration Optimum d/h Ratio* Optimum d/h Ratio* 250S137‐33 0.50 0.70 250S137‐68 0.50 0.70 250S162‐33 0.40 0.70 250S162‐68 0.40 0.70 350S162‐33 0.40 0.70 350S162‐68 0.40 0.70 362S137‐33 0.40 0.60 362S137‐68 0.40 0.60 362S162‐33 0.50 0.70 362S162‐68 0.50 0.70 362S200‐33 0.60 0.70 362S200‐68 0.60 0.70 400S137‐33 0.50 0.69 400S137‐68 0.50 0.69
110
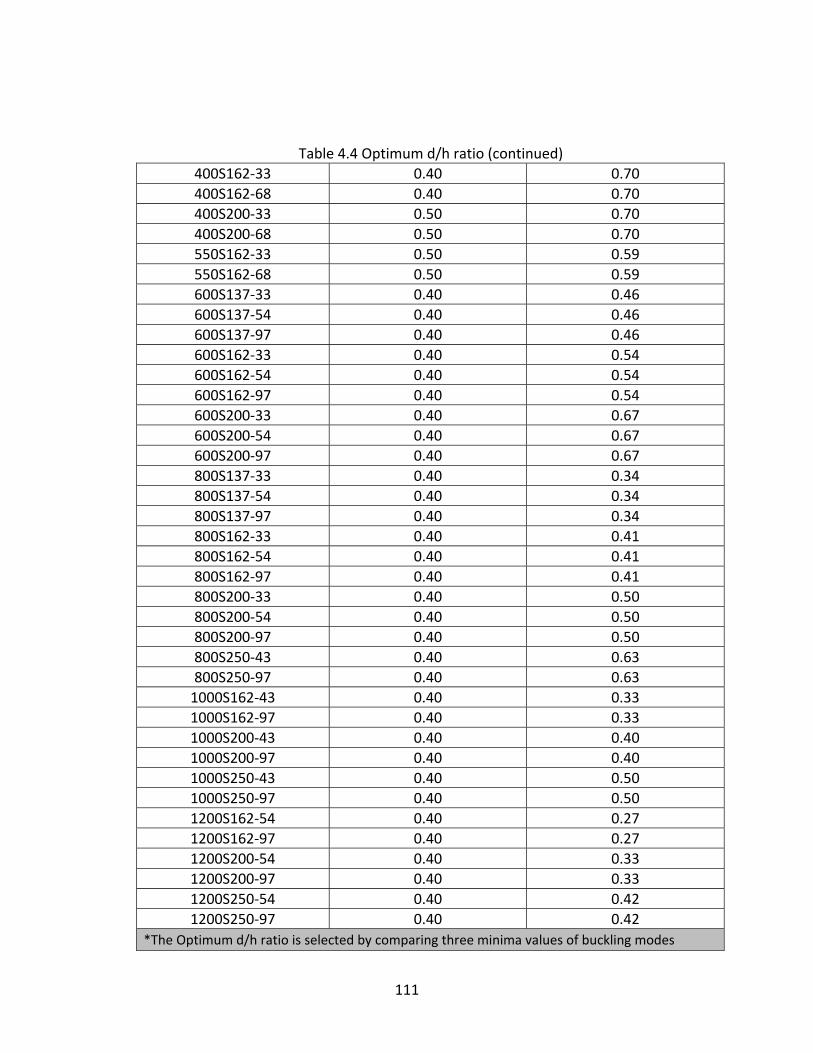
Table 4.4 Optimum d/h ratio (continued) 400S162‐33 0.40 0.70 400S162‐68 0.40 0.70 400S200‐33 0.50 0.70 400S200‐68 0.50 0.70 550S162‐33 0.50 0.59 550S162‐68 0.50 0.59 600S137‐33 0.40 0.46 600S137‐54 0.40 0.46 600S137‐97 0.40 0.46 600S162‐33 0.40 0.54 600S162‐54 0.40 0.54 600S162‐97 0.40 0.54 600S200‐33 0.40 0.67 600S200‐54 0.40 0.67 600S200‐97 0.40 0.67 800S137‐33 0.40 0.34 800S137‐54 0.40 0.34 800S137‐97 0.40 0.34 800S162‐33 0.40 0.41 800S162‐54 0.40 0.41 800S162‐97 0.40 0.41 800S200‐33 0.40 0.50 800S200‐54 0.40 0.50 800S200‐97 0.40 0.50 800S250‐43 0.40 0.63 800S250‐97 0.40 0.63 1000S162‐43 0.40 0.33 1000S162‐97 0.40 0.33 1000S200‐43 0.40 0.40 1000S200‐97 0.40 0.40 1000S250‐43 0.40 0.50 1000S250‐97 0.40 0.50 1200S162‐54 0.40 0.27 1200S162‐97 0.40 0.27 1200S200‐54 0.40 0.33 1200S200‐97 0.40 0.33 1200S250‐54 0.40 0.42 1200S250‐97 0.40 0.42
*The Optimum d/h ratio is selected by comparing three minima values of buckling modes
111
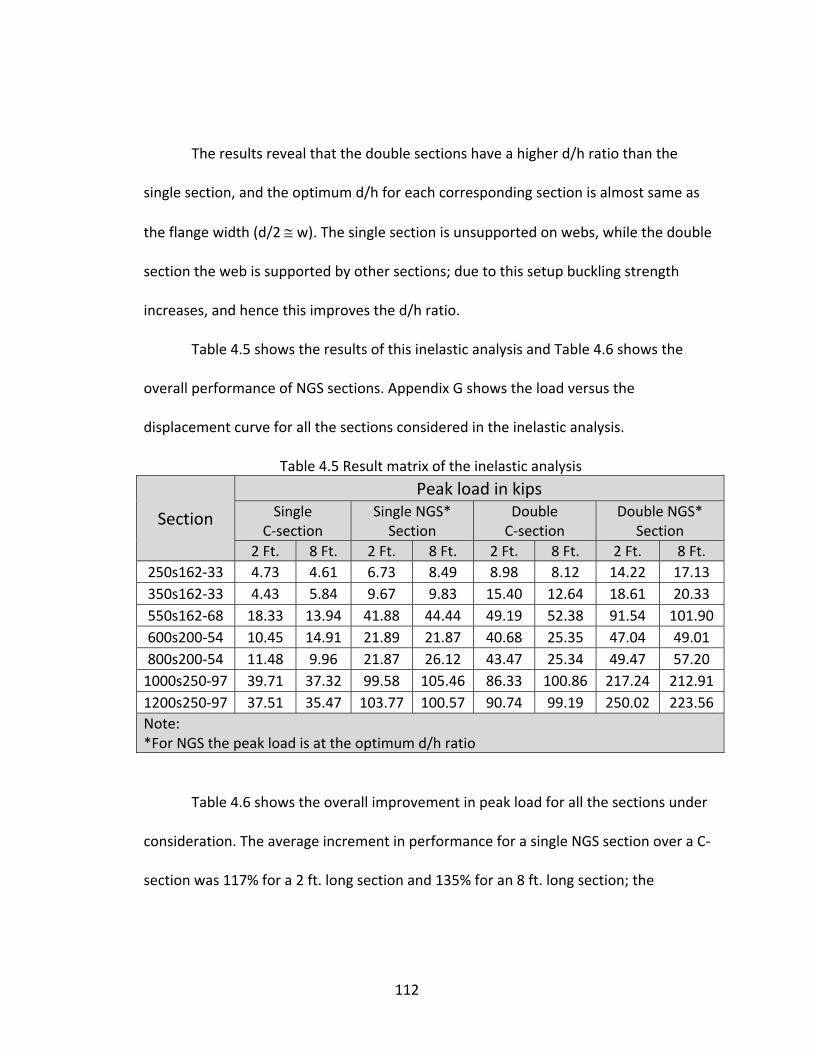
The results reveal that the double sections have a higher d/h ratio than the
single section, and the optimum d/h for each corresponding section is almost same as
the flange width (d/2 ≅ w). The single section is unsupported on webs, while the double
section the web is supported by other sections; due to this setup buckling strength
increases, and hence this improves the d/h ratio.
Table 4.5 shows the results of this inelastic analysis and Table 4.6 shows the
overall performance of NGS sections. Appendix G shows the load versus the
displacement curve for all the sections considered in the inelastic analysis.
Table 4.5 Result matrix of the inelastic analysis
Section
Peak load in kips Single
C‐section Single NGS* Section
Double C‐section
Double NGS* Section
2 Ft. 8 Ft. 2 Ft. 8 Ft. 2 Ft. 8 Ft. 2 Ft. 8 Ft. 250s162‐33 4.73 4.61 6.73 8.49 8.98 8.12 14.22 17.13 350s162‐33 4.43 5.84 9.67 9.83 15.40 12.64 18.61 20.33 550s162‐68 18.33 13.94 41.88 44.44 49.19 52.38 91.54 101.90 600s200‐54 10.45 14.91 21.89 21.87 40.68 25.35 47.04 49.01 800s200‐54 11.48 9.96 21.87 26.12 43.47 25.34 49.47 57.20 1000s250‐97 39.71 37.32 99.58 105.46 86.33 100.86 217.24 212.91 1200s250‐97 37.51 35.47 103.77 100.57 90.74 99.19 250.02 223.56 Note: *For NGS the peak load is at the optimum d/h ratio
Table 4.6 shows the overall improvement in peak load for all the sections under
consideration. The average increment in performance for a single NGS section over a C‐
section was 117% for a 2 ft. long section and 135% for an 8 ft. long section; the
112

increment for a double NGS section over a C‐section was 75% for a 2 ft. long section
and 103% for a 8 ft. long section.
Table 4.6 Overall performances of NGS Sections
Section Length
Ps‐NGS/ Ps‐c
Ps‐NGS/ Ps‐c
PD‐NGS
/ PD‐c
PD‐NGS / PD‐c
2 Ft. 8 Ft. 2 Ft. 8 Ft.250s162‐33 142% 184% 158% 211%
350s162‐33 219% 168% 121% 161%
550s162‐68 229% 319% 186% 195%
600s200‐54 209% 147% 116% 193%
800s200‐54 190% 262% 114% 226%
1000s250‐97 251% 283% 252% 211%
1200s250‐97 277% 283% 276% 225%
Average 217% 235% 175% 203% Note: Ps‐NGS : Performance of single NGS section Ps‐c : Performance of single C‐section PD‐NGS : Performance of double NGS section PD‐c : Performance of single C‐section
To further evaluate the advantages of the NGS section, the results were
compared with the corresponding SigmaStud® sections. An inelastic analysis was
performed on both the sections and the results are drawn in terms of nominal strength.
The depth of the sigma profile of the SigmaStud® section is less. To overcome this
problem, a special NGS section was modeled, which was created by taking the inscribed
circle from the SigmaStud® section profile. Table 4.7 shows the results of all three
113

configurations and Table 4.8 shows the overall performance of the NGS Sections with
SigmaStud® section.
Table 4.7 Comparison of NGS section with SigmaStud® section
Section ConfigurationPeak load in kips
Single section Double section2 Ft. 8 Ft. 2 Ft. 8 Ft.
600S200‐54 NGS 21.89 21.87 47.04 49.01
600SG200‐54 SigmaStud® 23.42 26.12 53.91 55.51
600SG200‐54* Inscribed NGS 22.09 25.79 44.03 50.56
800S200‐54 NGS 21.87 26.12 49.47 57.20
800SG200‐54 SigmaStud® 19.64 22.30 44.66 46.84
800SG200‐54* Inscribed NGS 17.12 19.72 39.19 43.99 Note: *The section is model by inscribing sigma profile from the corresponding
SigmaStud® section.
It was observed that the performance of inscribed NGS sections was lower than
the SigmaStud® sections. Single 2ft. and 8ft.long 600s200‐54 SigmaStud® section,
showing 6% and 1% increment in performance over corresponding inscribed NGS
section, while for the same section with double 2ft. and 8ft. long sections shows 18%
and 9% increment over corresponding inscribed NGS section.
Table 4.8 Overall performances of NGS Sections with SigmaStud® section
Section Configuration Single section Double section2 Ft. 8 Ft. 2 Ft. 8 Ft.
600S200‐54 Inscribed NGS
versus SigmaStud® 94% 99% 82% 91%
800S200‐54 Inscribed NGS
versus SigmaStud® 87% 88% 88% 94%
Similarly, single 2ft. and 8ft.long 800s200‐54 SigmaStud® section, showing 13%
and 12% increase in improvement over corresponding inscribed NGS section, while for
114

the same section with double 2ft. and 8ft. long sections shows 12% and 6% increment in
improvement over corresponding inscribed NGS section.
4.3 SUMMARY
A total of 52 sections from the SSMA catalogue were selected for elastic and
inelastic analysis. Elastic analysis was performed on 52 single and double NGS sections
by a finite‐strip method using CUFSM software. The objective of the elastic analysis was
to optimize the new generation sigma (NGS) shape (or optimize the diameter), which
was done by analyzing seven d/h ratios. The maximum of each minima value of buckling
mode was taken into consideration to compare the d/h ratio. It was observed that the
d/h ratios of each NGS double section are higher than that of each NGS single section
and the radius of the half‐round profile is almost equal to the flange width.
A total of 7 sections were selected for an inelastic analysis, which were chosen
from the previously analyzed sections. An Inelastic analysis was performed by a finite
element analysis using ABAQUS software. The peak load of each section was taken into
consideration for comparison. Two section length 2 ft. and 8 ft were investigated. The
results were compared between a single C‐section, an NGS section in single mode as
well as a double mode with two lengths. It was found that the average increment in
performance for a single NGS section over a C‐section was 117% for a 2 ft. long section
and 135% for an 8 ft. long section; the increment in performance for a double NGS
115

section over a C‐section was 75% for a 2 ft. long section and 103% for a 8 ft. long
section.
A special NGS section was modeled by inscribing a half‐round profile from the
sigma profile of the original SigmaStud® section. The peak load values of this section
were also taken into consideration for comparison purpose. It was found that the
overall performance of the NGS section is 29% higher than both the SigmaStud® section
and the specially inscribed NGS section. It was observed that the performance of
inscribed NGS sections was lower than the SigmaStud® sections. Single 600s200‐54
SigmaStud® section, showing 6% increment on 2ft.long section while 1% for 8ft.long
section over corresponding inscribed NGS section, while for the same section with
double 2ft. and 8ft. long sections shows 18% and 9% increase in improvement over
corresponding inscribed NGS section. Also, single 2ft. and 8ft.long 800s200‐54
SigmaStud® section, showing 13% and 12% increment over corresponding inscribed NGS
section, while for the same section with double 2ft. and 8ft. long sections shows 12%
and 6% increase in improvement over corresponding inscribed NGS section.
116
CHAPTER V
CONCLUSIONS
Three important structural components of the cold‐formed steel building –shear
wall, floor joist and column – were studied using experimental (for shear walls) as well
as finite element (for joist and columns) and finite strip (for columns) methodology.
In Part 1, an experimental test were conducted on steel sheet shear walls to
determine their nominal strength and optimum profiles were produced in both Part 2
and Part 3 of the research.
In part 1 (chapter 2) research, a total of 33 monotonic tests, 32 cyclic tests, and 3
compression tests were conducted on 0.030 in and 0.033 in. steel sheet shear walls (2:1
and 4:1 aspect ratios) and 0.027 in. steel sheet shear walls (2:1 aspect ratio) for both
monotonic and cyclic shear wall tests on cold‐formed steel stud walls with steel
sheathing on one side to determine their nominal shear strength. In this test program,
fastener spacing of 6 in., 4 in., and 2 in. were investigated; therefore, the nominal
strength for walls with 3 in. fastener spacing can be estimated as the average of nominal
strengths for 4 in. and 2 in. fastener spacing. The results of the nominal shear strengths
for steel sheet shear walls are summarized and the values are recommended for the
new version of the AISI Lateral Design Standard.
To enhance the performance of the C‐joist against web crippling failure, a new
generation of profile for the web hole was developed (edge stiffened web hole) and the
117
behavior of new member was analyzed by a finite element analysis in Part 2 (chapter 3).
Each configuration has been modeled with three stiffener width to web depth ratios
(q/h) of 0.06, 0.08 and 0.10 and five hole diameter to web depth ratios (d/h) of 0.2, 0.4,
0.5, 0.6, and 0.8. The results show the optimum stiffened hole can greatly increase the
web crippling strength of the joists. The new generation joists with optimized holes
were also analyzed by post‐buckling finite element modeling and the peak load of each
C‐joist was determined. The results indicate that an average 43% increase in web
crippling can be achieved by the new generation joist using optimum hole profile
compared to typical SSMA C‐section joists.
NAS (2007) provide the web crippling equation for the section without a web
hole. The theoretical peak load value of the joist without web hole was calculated using
this equation, but the results show a 12% average decrement from the value found in
the finite element model of the joist without web hole. Geometric imperfection was also
introduced in the finite element model, but the results do not confirming the theoretical
values.
A new generation sigma (NGS) shaped intermediate stiffener was developed to
improve the axial strength of the cold‐formed steel C‐shape column in Part 3 (chapter
4). The research mainly focused on optimization of the new generation sigma (NGS)
columns under pure compression stresses. The geometry of NGS was optimized by
analyzing elastic buckling load using a finite strip method (CUFSM). A total of 52 sections
from the SSMA catalogue were selected for the elastic analysis. The objective of the
118
elastic analysis was to optimize the new generation sigma shape (or optimize the
diameter), which was done by using seven d/h ratios. The buckling curve was the
principal output from the CUFSM and was very useful in finding the optimum d/h ratio.
A total of 7 sections were selected for the inelastic finite element analysis. The
objective of the inelastic analysis was to evaluate the peak load under a pure
compressive load. The results between single and double C‐section with single and
double NGS section with two different (2 ft. and 8 ft.) lengths were compared.
Geometric imperfection was introduced in the finite element model with using 0.34 x t
as the geometric imperfection factor. The results show an average increment in
performance for a single NGS section over a C‐section was 117% for a 2 ft. long section
and 135% for an 8 ft. long section; the improvement in performance for a double NGS
section over a C‐section was 75% for a 2 ft. long section and 103% for a 8 ft. long
section.
119

120
APPENDIX A
MONOTONIC TESTS OF SHEAR WALLS
Test Label: 4×8×43×33‐6/12‐M1
Specimen ConfigurationTest Date: March 21, 2007Wall dimensions: 4 ft. × 8 ft.Studs: 350S162‐43, 24 inch off centerTracks: 350T150‐43Steel sheathing: 0.033 inch thick Steel Sheet
Fastener: #8x18‐½ ” Modified Truss head self drilling screw, 6 inch off center on the perimeter,12 inch off center in the field
Test protocol: Monotonic
Load Vs Displacement Curve
Test results Maximum load: 2584.15 plfLateral displacement at top of wall: 2.08 inch
121

Observed Failure Mode 4×8×43×33‐6/12‐M1Steel sheet buckled and pulled off the frame at the bottom of the loaded chord stud
122

Test Label: 4×8×43×33‐6/12‐M2
Specimen ConfigurationTest Date: March 21, 2007Wall dimensions: 4 ft. × 8 ft.Studs: 350S162‐43, 24 inch off centerTracks: 350T150‐43Steel sheathing: 0.033 inch thick Steel Sheet
Fastener: #8x18‐½ ” Modified Truss head self drilling screw, 6 inch off center on the perimeter, 12 inch off center in the field
Test protocol: Monotonic
Load Vs Displacement Curve
Test results Maximum load: 1124.03 plfLateral displacement at top of wall: 1.72 inch
123

Observed Failure Mode 4×8×43×33‐6/12‐M2Steel sheet buckled and pulled off the frame at the corner of the wall on the loaded side
124

Test Label: 4×8×43×33‐4/12‐M1
Specimen ConfigurationTest Date: March 22, 2007Wall dimensions: 4 ft. × 8 ft.Studs: 350S162‐43, 24 inch off centerTracks: 350T150‐43Steel sheathing: 0.033 inch thick Steel Sheet
Fastener: #8x18‐½ ” Modified Truss head self drilling screw, 4 inch off center on the perimeter, 12 inch off center in the field
Test protocol: Monotonic
Load Vs Displacement Curve
Test results Maximum load: 1173.02 plfLateral displacement at top of wall: 1.72 inch
125

Observed Failure Mode 4×8×43×33‐4/12‐M1Steel sheet buckled at the lower corner of the wall on the loaded side; the flange of the outer stud and the bottom track distorted; and two screws pulled out in the same area
126
Test Label: 4×8×43×33‐4/12‐M2
Specimen ConfigurationTest Date: March 22, 2007Wall dimensions: 4 ft. × 8 ft.Studs: 350S162‐43, 24 inch off centerTracks: 350T150‐43Steel sheathing: 0.033 inch thick Steel Sheet
Fastener: #8x18‐½ ” Modified Truss head self drilling screw, 4 inch off center on the perimeter, 12 inch off center in the field
Test protocol: Monotonic
Load Vs Displacement Curve
Test results Maximum load: 1204.06 plfLateral displacement at top of wall: 2.31 inch
127
Observed Failure Mode 4×8×43×33‐4/12‐M2Steel sheet buckled; and the flange of the outer stud at the loaded side distorted
128
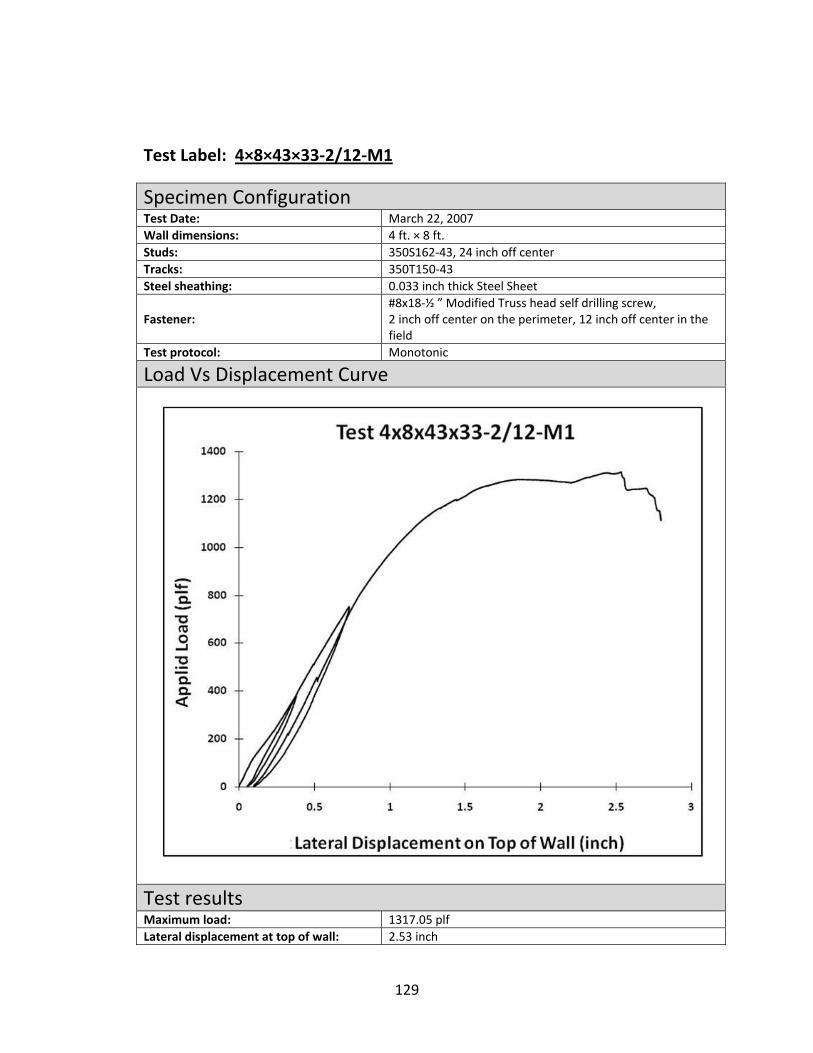
Test Label: 4×8×43×33‐2/12‐M1
Specimen ConfigurationTest Date: March 22, 2007Wall dimensions: 4 ft. × 8 ft.Studs: 350S162‐43, 24 inch off centerTracks: 350T150‐43Steel sheathing: 0.033 inch thick Steel Sheet
Fastener: #8x18‐½ ” Modified Truss head self drilling screw, 2 inch off center on the perimeter, 12 inch off center in the field
Test protocol: Monotonic
Load Vs Displacement Curve
Test results Maximum load: 1317.05 plfLateral displacement at top of wall: 2.53 inch
129
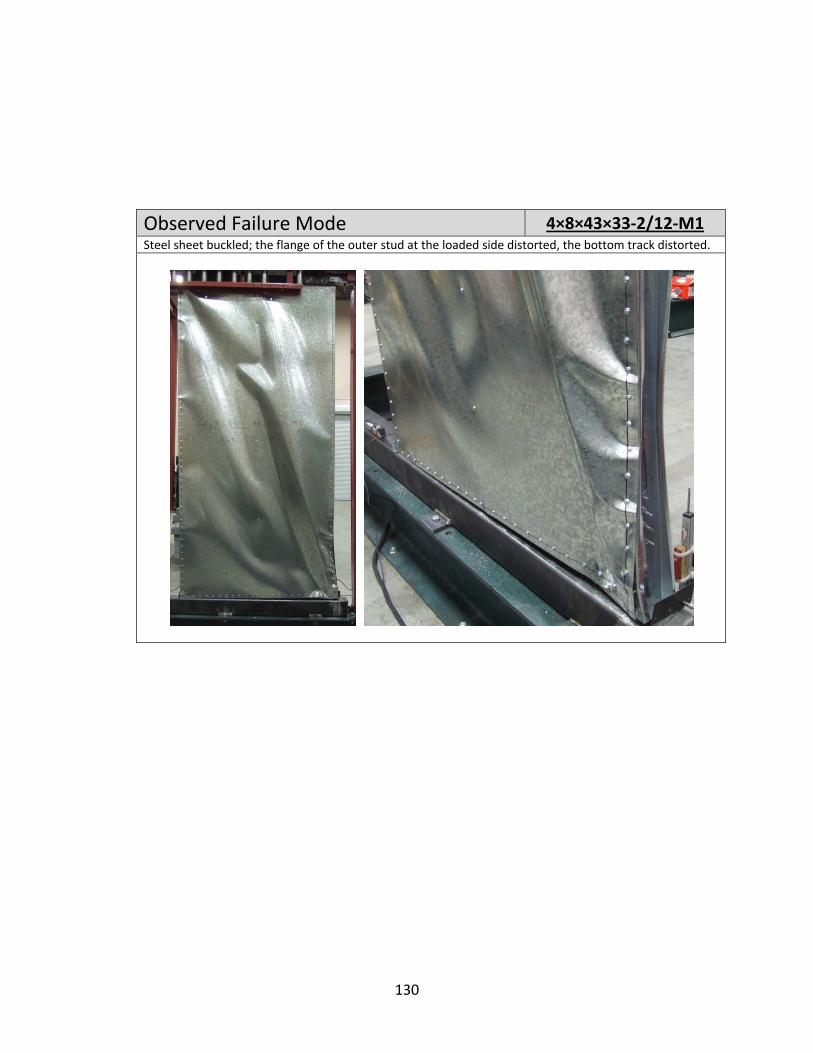
Observed Failure Mode 4×8×43×33‐2/12‐M1Steel sheet buckled; the flange of the outer stud at the loaded side distorted, the bottom track distorted.
130

Test Label: 4×8×43×33‐2/12‐M2
Specimen ConfigurationTest Date: March 22, 2007Wall dimensions: 4 ft. × 8 ft.Studs: 350S162‐43, 24 inch off centerTracks: 350T150‐43Steel sheathing: 0.033 inch thick Steel Sheet
Fastener: #8x18‐½ ” Modified Truss head self drilling screw, 2 inch off center on the perimeter, 12 inch off center in the field
Test protocol: Monotonic
Load Vs Displacement Curve
Test results Maximum load: 1375.55 plfLateral displacement at top of wall: 1.64 inch
131
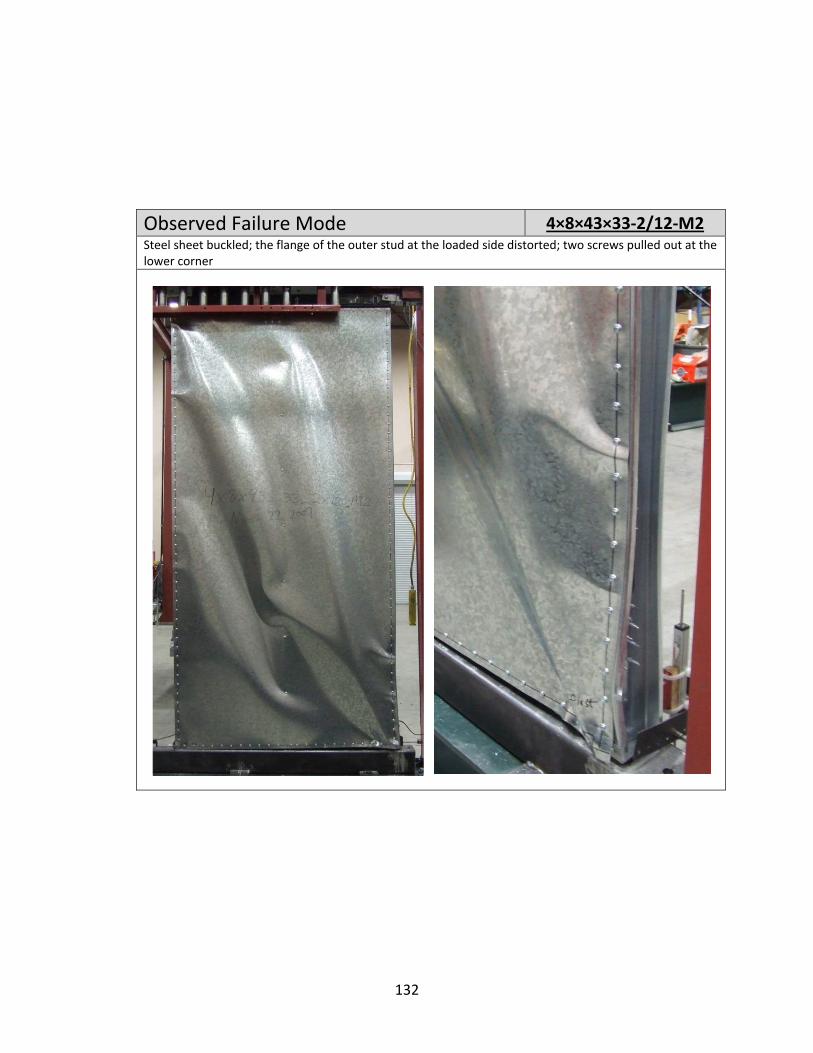
Observed Failure Mode 4×8×43×33‐2/12‐M2Steel sheet buckled; the flange of the outer stud at the loaded side distorted; two screws pulled out at the lower corner
132

T
STeWStTrSt
Fa
Te
L
TMLa
Test Label:
Specimen est Date: Wall dimensiontuds: racks: teel sheathing
astener:
est protocol:
Load Vs D
Test resultMaximum loadateral displace
4×8×43×3
Configur
ns:
:
isplacem
ts : ement at top o
30‐6/12‐M
ration
ent Curve
of wall:
M1
February 16,4 ft. × 8 ft.350S162‐43, 350T150‐430.030 inch th#8x18‐½ ” M6 inch off cenfield Monotonic
e
800.94 plf2.50 inch
2007
24 inch off ce
hick Steel Sheeodified Truss hnter on the pe
nter
ethead self drillinrimeter, 12 inc
ng screw, ch off center inn the
133

Observed Failure Mode 4×8×43×30‐6/12‐M1Steel buckled and pulled out at the lower corner at the loaded end
134

Test Label: 4×8×43×30‐6/12‐M2
Specimen ConfigurationTest Date: February 27, 2007Wall dimensions: 4 ft. × 8 ft.Studs: 350S162‐43, 24 inch off centerTracks: 350T150‐43Steel sheathing: 0.030 inch thick Steel Sheet
Fastener: #8x18‐½ ” Modified Truss head self drilling screw, 6 inch off center on the perimeter, 12 inch off center in the field
Test protocol: Monotonic
Load Vs Displacement Curve
Test results Maximum load: 786.35 plfLateral displacement at top of wall: 2.43 inch
135
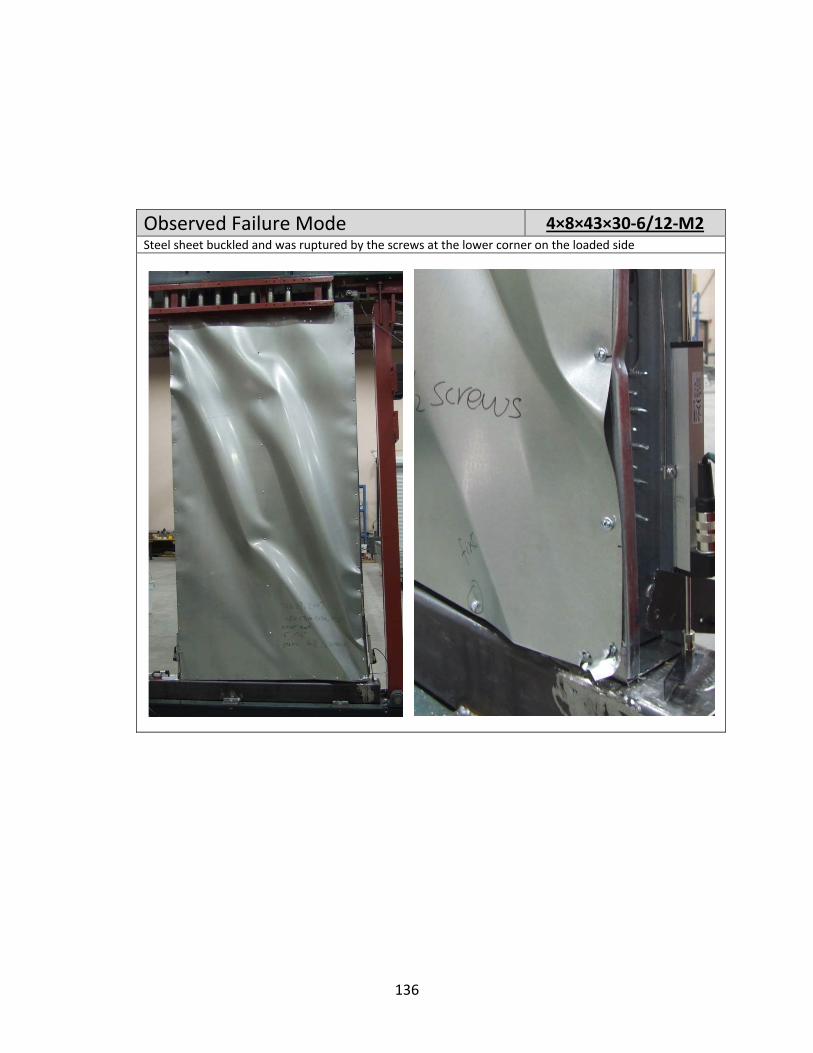
Observed Failure Mode 4×8×43×30‐6/12‐M2Steel sheet buckled and was ruptured by the screws at the lower corner on the loaded side
136

T
STeWStTrSt
Fa
Te
L
TMLa
Test Label:
Specimen est Date: Wall dimensiontuds: racks: teel sheathing
astener:
est protocol:
Load Vs D
Test resultMaximum loadateral displace
4×8×43×3
Configur
ns:
:
isplacem
ts : ement at top o
30‐4/12‐M
ration
ent Curve
of wall:
M1
February 27,4 ft. × 8 ft.350S162‐43, 350T150‐430.030 inch th#8x18‐½ ” M4 inch off cenfield Monotonic
e
939.65 plf2.47 inch
2007
24 inch off ce
hick Steel Sheeodified Truss hnter on the pe
nter
ethead self drillinrimeter, 12 inc
ng screw, ch off center inn the
137
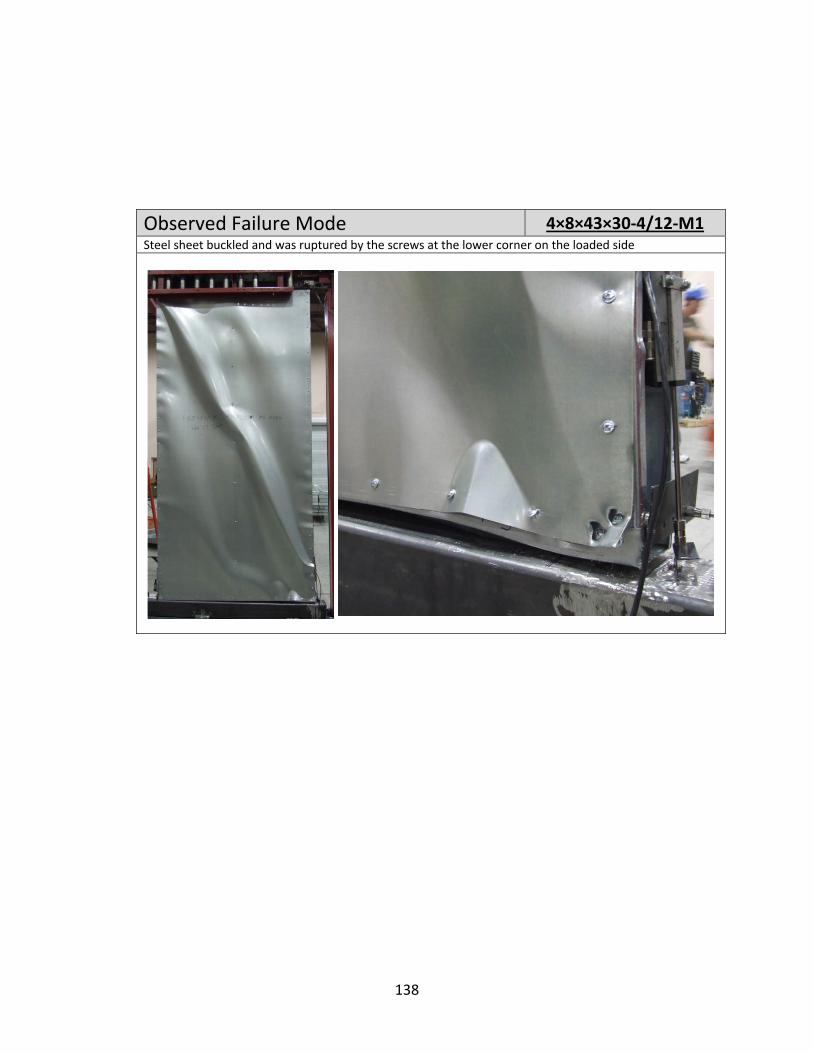
Observed Failure Mode 4×8×43×30‐4/12‐M1Steel sheet buckled and was ruptured by the screws at the lower corner on the loaded side
138
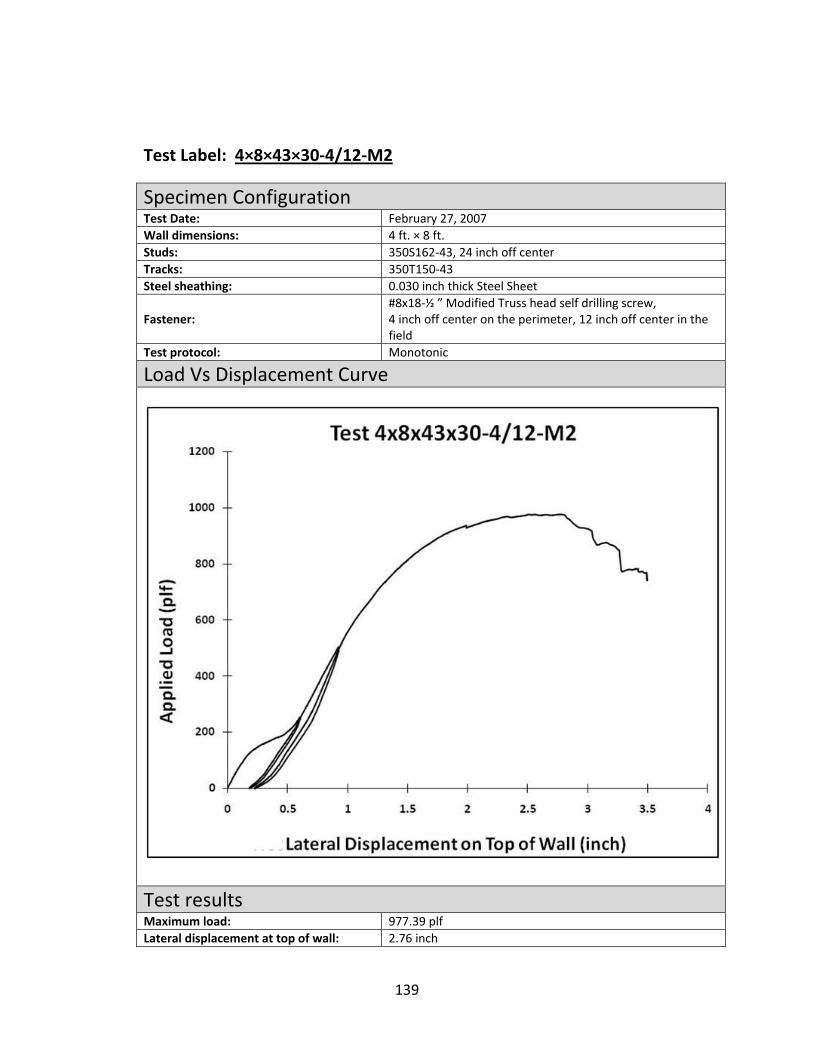
Test Label: 4×8×43×30‐4/12‐M2
Specimen ConfigurationTest Date: February 27, 2007Wall dimensions: 4 ft. × 8 ft.Studs: 350S162‐43, 24 inch off centerTracks: 350T150‐43Steel sheathing: 0.030 inch thick Steel Sheet
Fastener: #8x18‐½ ” Modified Truss head self drilling screw, 4 inch off center on the perimeter, 12 inch off center in the field
Test protocol: Monotonic
Load Vs Displacement Curve
Test results Maximum load: 977.39 plfLateral displacement at top of wall: 2.76 inch
139

Observed Failure Mode 4×8×43×30‐4/12‐M2Steel buckled and pulled of the frame at the lower corner on the loaded side
140
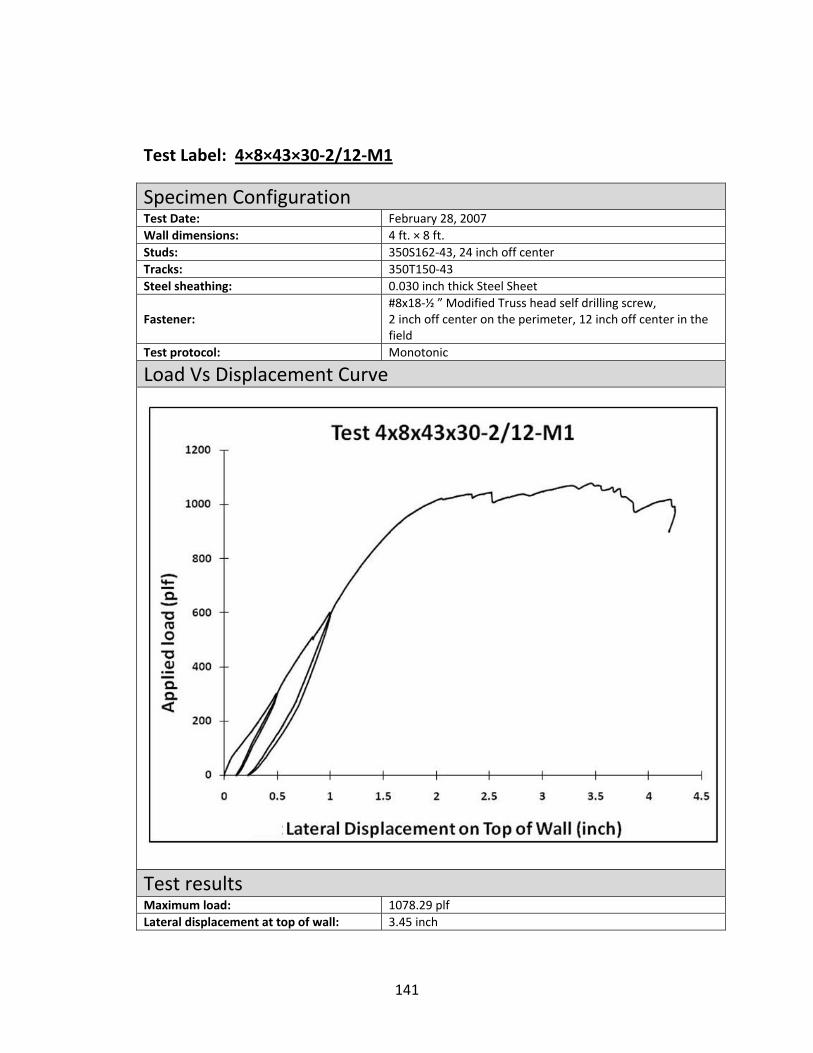
Test Label: 4×8×43×30‐2/12‐M1
Specimen ConfigurationTest Date: February 28, 2007Wall dimensions: 4 ft. × 8 ft.Studs: 350S162‐43, 24 inch off centerTracks: 350T150‐43Steel sheathing: 0.030 inch thick Steel Sheet
Fastener: #8x18‐½ ” Modified Truss head self drilling screw, 2 inch off center on the perimeter, 12 inch off center in the field
Test protocol: Monotonic
Load Vs Displacement Curve
Test results Maximum load: 1078.29 plfLateral displacement at top of wall: 3.45 inch
141

Observed Failure Mode 4×8×43×30‐2/12‐M1Steel sheet buckled, the flange of the outer stud distorted at the loaded side
142
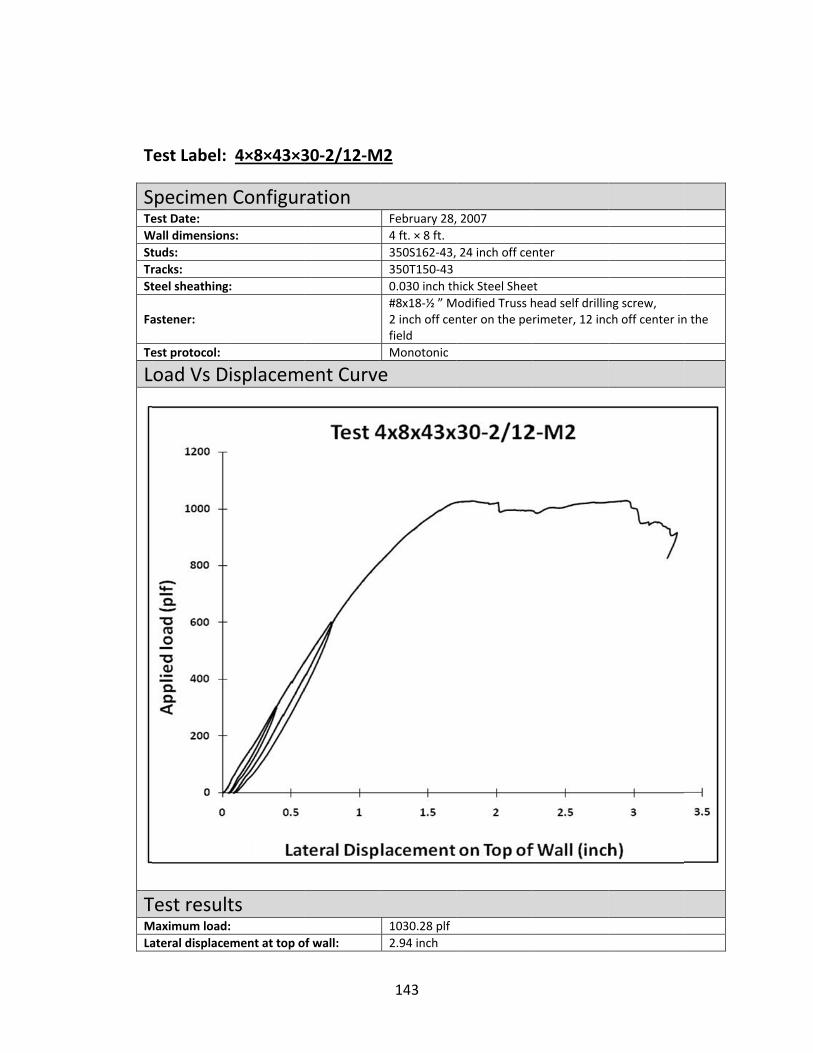
T
STeWStTrSt
Fa
Te
L
TMLa
Test Label:
Specimen est Date: Wall dimensiontuds: racks: teel sheathing
astener:
est protocol:
Load Vs D
Test resultMaximum loadateral displace
4×8×43×3
Configur
ns:
:
isplacem
ts : ement at top o
30‐2/12‐M
ration
ent Curve
of wall:
M2
February 28,4 ft. × 8 ft.350S162‐43,350T150‐430.030 inch th#8x18‐½ ” M2 inch off cenfield Monotonic
e
1030.28 plf2.94 inch
2007
24 inch off ce
hick Steel SheeModified Truss hnter on the pe
nter
ethead self drillinrimeter, 12 inc
ng screw, ch off center inn the
143
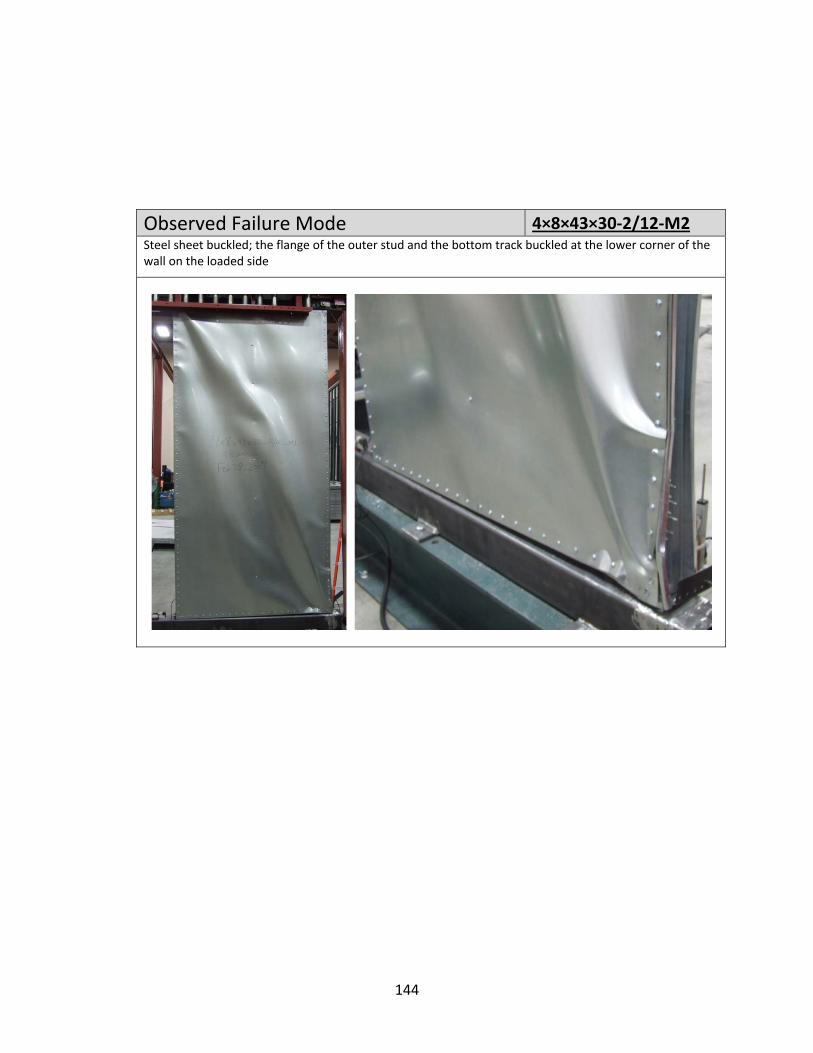
Observed Failure Mode 4×8×43×30‐2/12‐M2Steel sheet buckled; the flange of the outer stud and the bottom track buckled at the lower corner of the wall on the loaded side
144
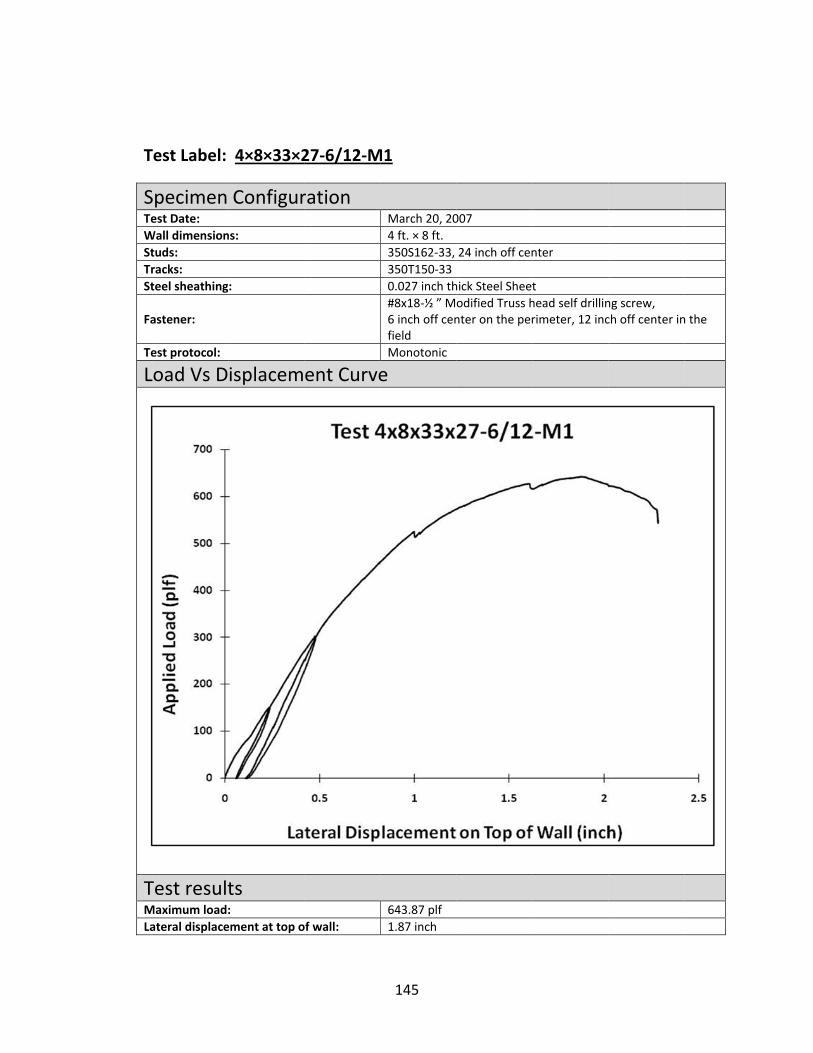
T
STeWStTrSt
Fa
Te
L
TMLa
Test Label:
Specimen est Date: Wall dimensiontuds: racks: teel sheathing
astener:
est protocol:
Load Vs D
Test resultMaximum loadateral displace
4×8×33×2
Configur
ns:
:
isplacem
ts : ement at top o
27‐6/12‐M
ration
ent Curve
of wall:
M1
March 20, 204 ft. × 8 ft.350S162‐33, 350T150‐330.027 inch th#8x18‐½ ” M6 inch off cenfield Monotonic
e
643.87 plf1.87 inch
007
24 inch off cen
hick Steel Sheetodified Truss hnter on the per
nter
thead self drillinrimeter, 12 inc
ng screw, ch off center inn the
145
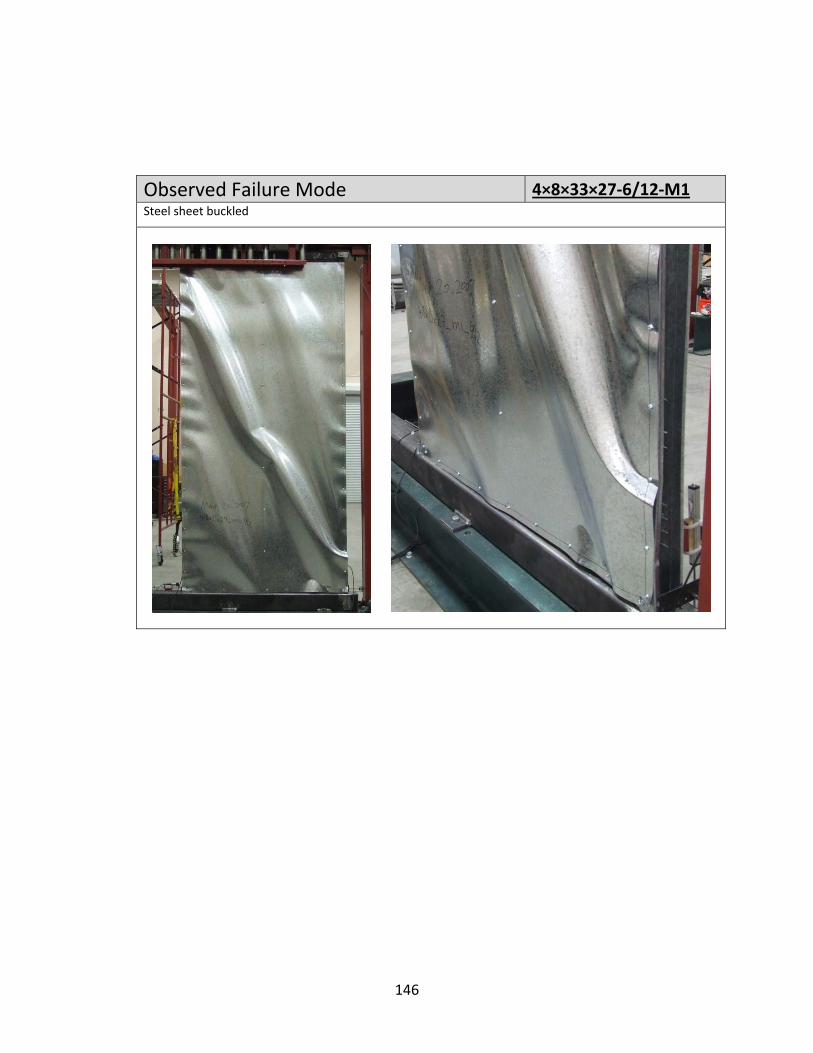
Observed Failure Mode 4×8×33×27‐6/12‐M1Steel sheet buckled
146

T
STeWStTrSt
Fa
Te
L
TMLa
Test Label:
Specimen est Date: Wall dimensiontuds: racks: teel sheathing
astener:
est protocol:
Load Vs D
Test resultMaximum loadateral displace
4×8×33×2
Configur
ns:
:
isplacem
ts : ement at top o
27‐6/12‐M
ration
ent Curve
of wall:
M2
March 20, 204 ft. × 8 ft.350S162‐33,350T150‐330.027 inch th#8x18‐½ ” M6 inch off cefield Monotonic
e
606.69 plf1.95 inch
007
24 inch off ce
hick Steel SheeModified Truss hnter on the pe
nter
ethead self drillinrimeter, 12 inc
ng screw, ch off center inn the
147
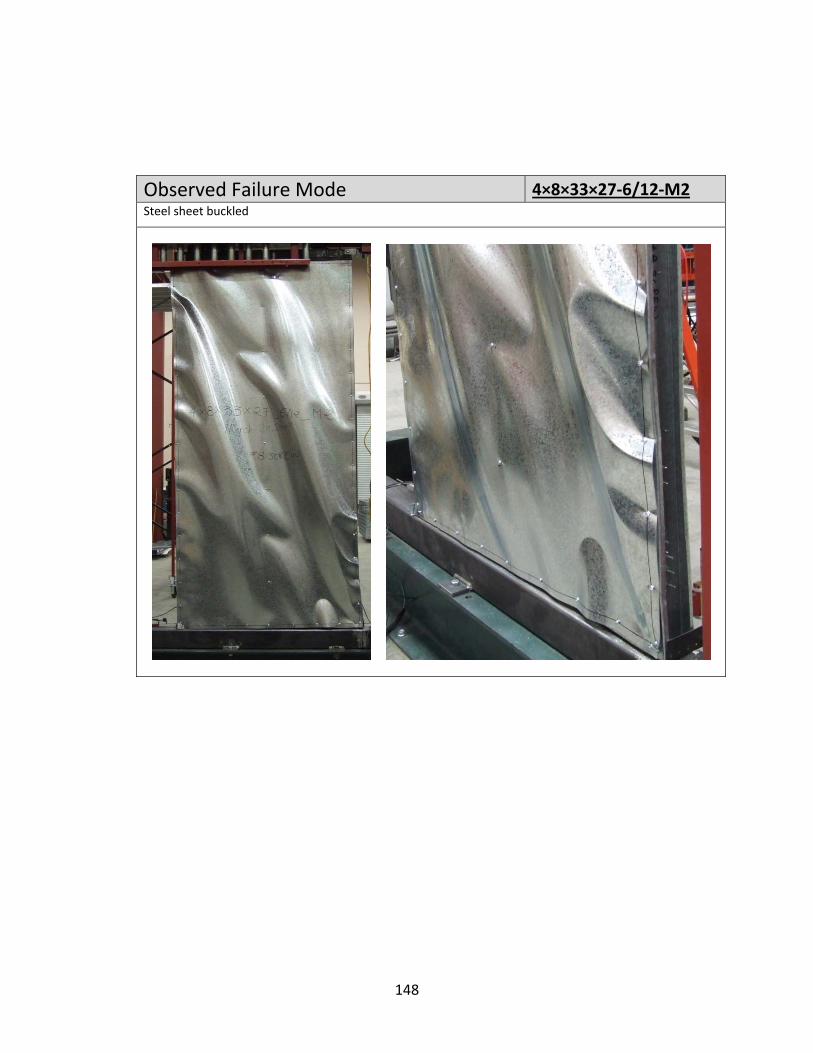
Observed Failure Mode 4×8×33×27‐6/12‐M2Steel sheet buckled
148
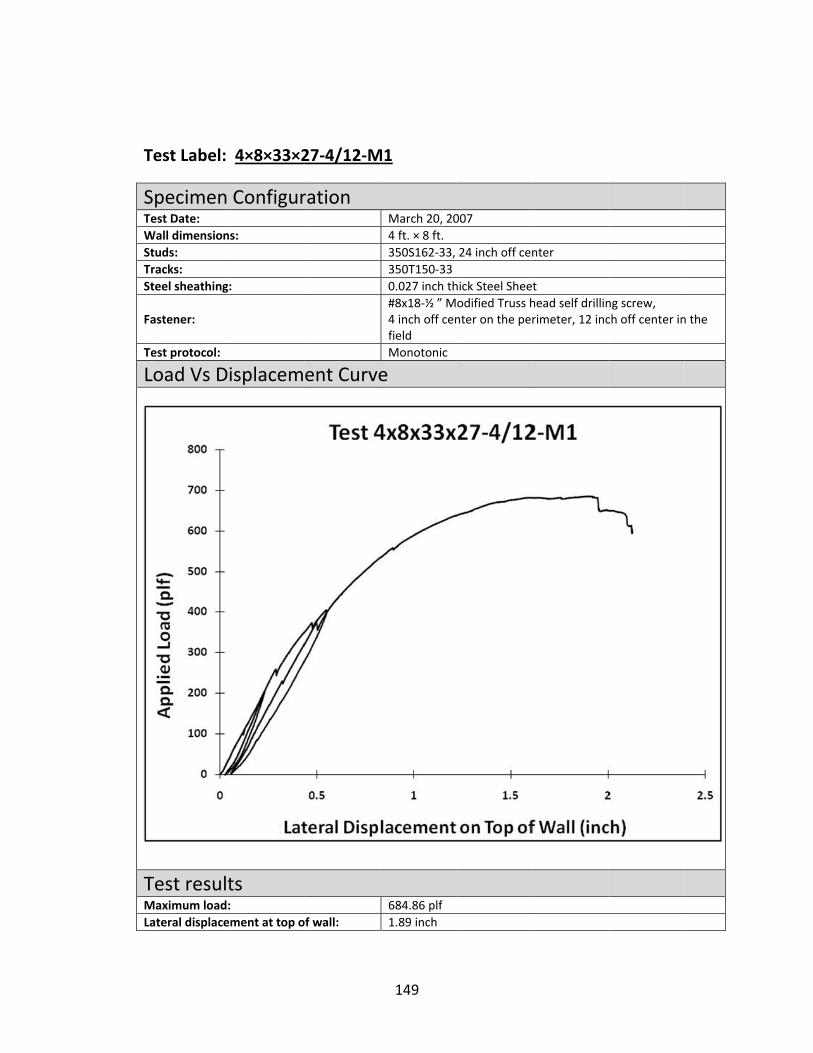
T
STeWStTrSt
Fa
Te
L
TMLa
Test Label:
Specimen est Date: Wall dimensiontuds: racks: teel sheathing
astener:
est protocol:
Load Vs D
Test resultMaximum loadateral displace
4×8×33×2
Configur
ns:
:
isplacem
ts : ement at top o
27‐4/12‐M
ration
ent Curve
of wall:
M1
March 20, 204 ft. × 8 ft.350S162‐33, 350T150‐330.027 inch th#8x18‐½ ” M4 inch off cenfield Monotonic
e
684.86 plf1.89 inch
007
24 inch off cen
hick Steel Sheeodified Truss hnter on the pe
nter
thead self drillinrimeter, 12 inc
ng screw, ch off center inn the
149
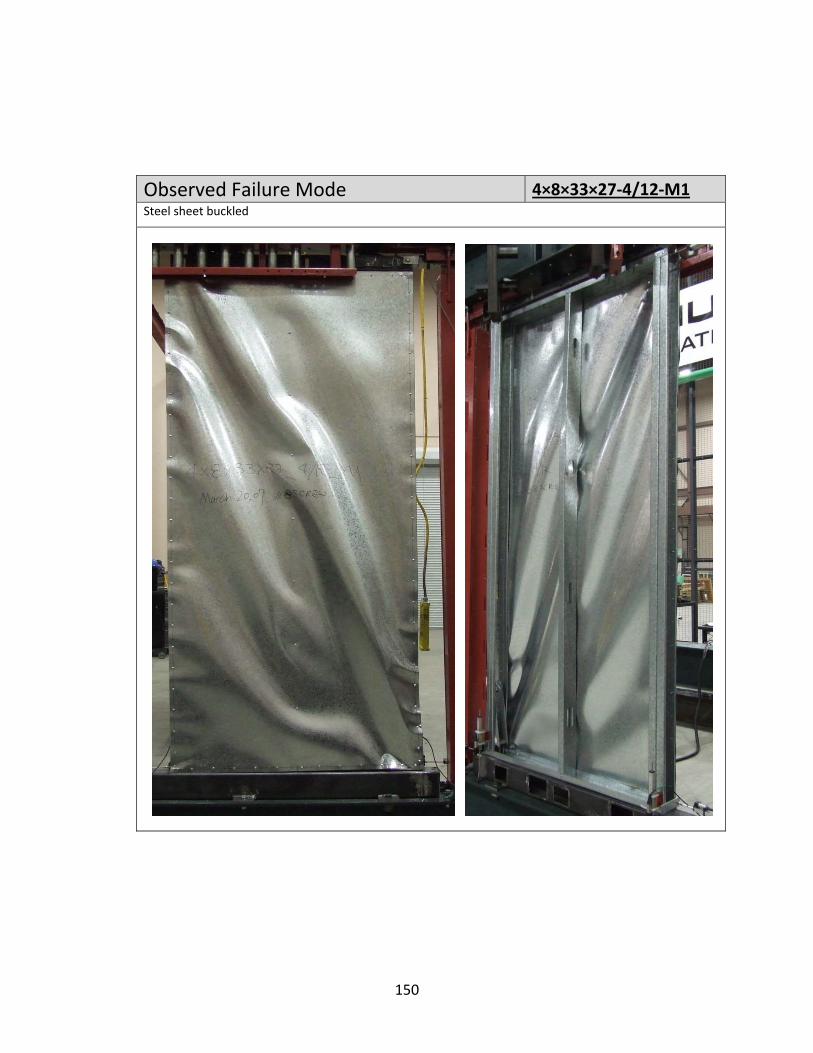
Observed Failure Mode 4×8×33×27‐4/12‐M1Steel sheet buckled
150

T
STeWStTrSt
Fa
Te
L
TMLa
Test Label:
Specimen est Date: Wall dimensiontuds: racks: teel sheathing
astener:
est protocol:
Load Vs D
Test resultMaximum loadateral displace
4×8×33×2
Configur
ns:
:
isplacem
ts : ement at top o
27‐4/12‐M
ration
ent Curve
of wall:
M2
March 20, 204 ft. × 8 ft.350S162‐33,350T150‐330.027 inch th#8x18‐½ ” M4 inch off cenfield Monotonic
e
682.24 plf2.30 inch
007
24 inch off ce
hick Steel SheeModified Truss hnter on the pe
nter
ethead self drillinrimeter, 12 inc
ng screw, ch off center inn the
151
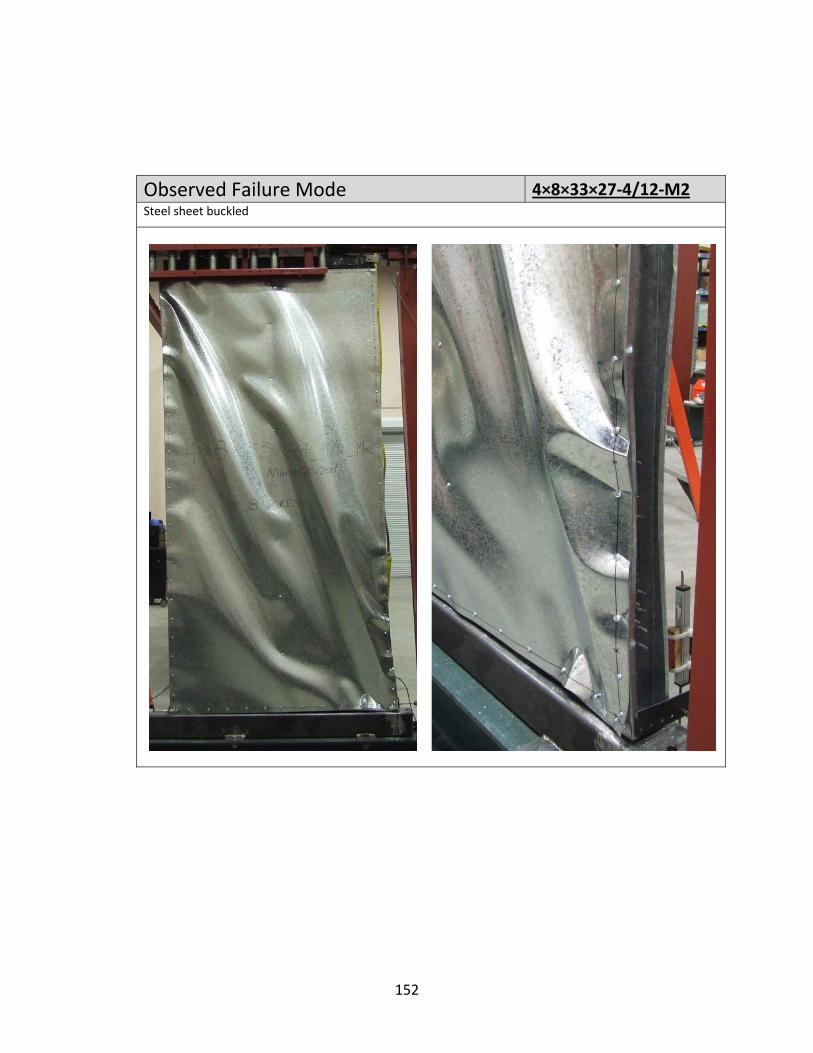
Observed Failure Mode 4×8×33×27‐4/12‐M2Steel sheet buckled
152
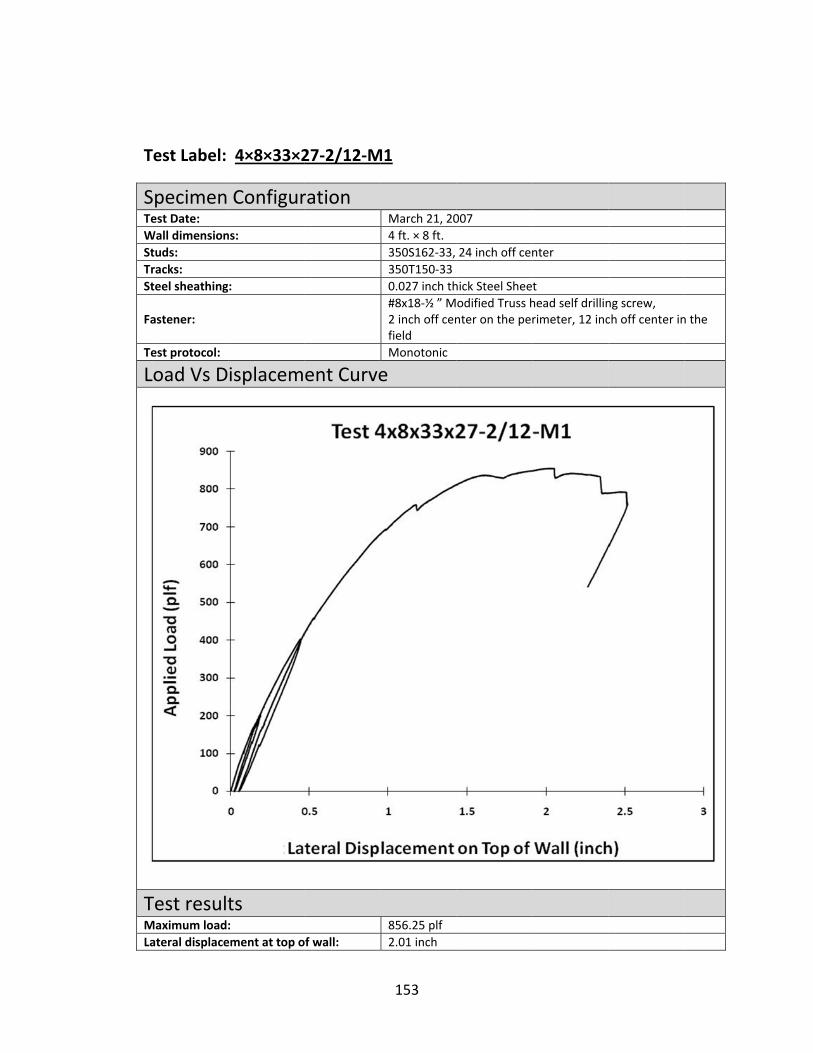
T
STeWStTrSt
Fa
Te
L
TMLa
Test Label:
Specimen est Date: Wall dimensiontuds: racks: teel sheathing
astener:
est protocol:
Load Vs D
Test resultMaximum loadateral displace
4×8×33×2
Configur
ns:
:
isplacem
ts : ement at top o
27‐2/12‐M
ration
ent Curve
of wall:
M1
March 21, 204 ft. × 8 ft.350S162‐33, 350T150‐330.027 inch th#8x18‐½ ” M2 inch off cenfield Monotonic
e
856.25 plf2.01 inch
007
24 inch off cen
hick Steel Sheeodified Truss hnter on the pe
nter
thead self drillinrimeter, 12 inc
ng screw, ch off center inn the
153

Observed Failure Mode 4×8×33×27‐2/12‐M1Steel buckled, the flange of the outer stud at the loaded side distorted at the bottom portion
154
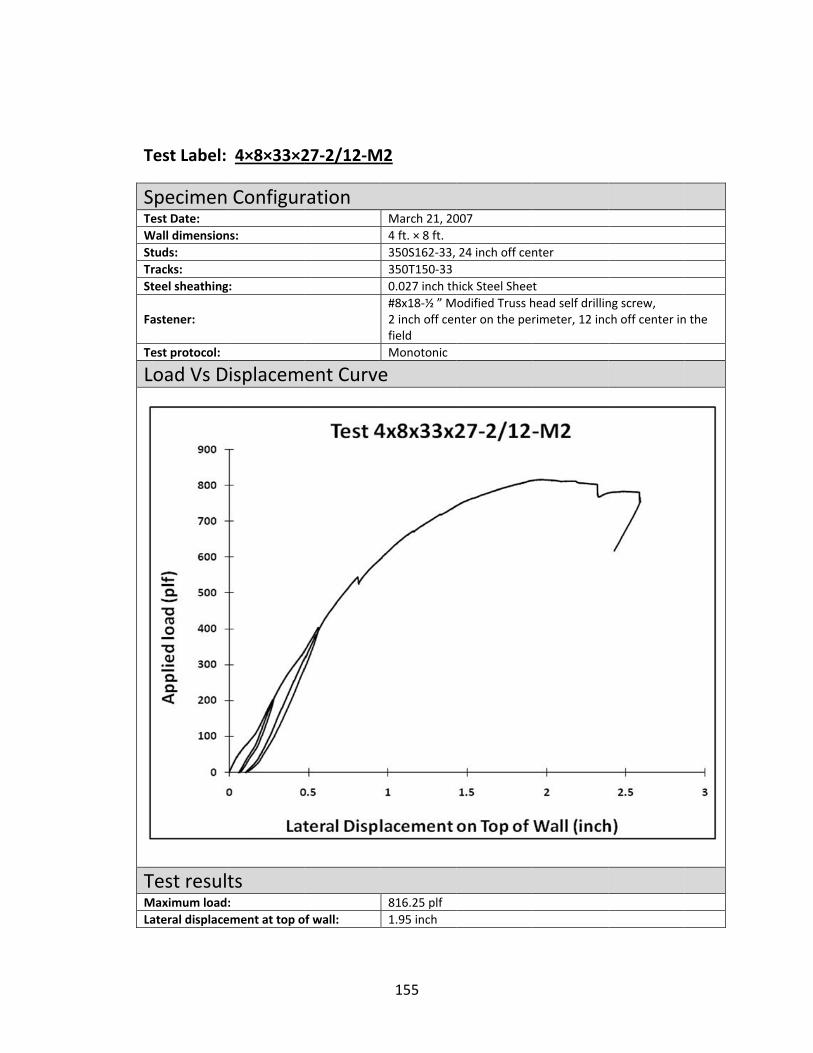
T
STeWStTrSt
Fa
Te
L
TMLa
Test Label:
Specimen est Date: Wall dimensiontuds: racks: teel sheathing
astener:
est protocol:
Load Vs D
Test resultMaximum loadateral displace
4×8×33×2
Configur
ns:
:
isplacem
ts : ement at top o
27‐2/12‐M
ration
ent Curve
of wall:
M2
March 21, 204 ft. × 8 ft.350S162‐33, 350T150‐330.027 inch th#8x18‐½ ” M2 inch off cenfield Monotonic
e
816.25 plf1.95 inch
007
24 inch off cen
hick Steel Sheeodified Truss hnter on the pe
nter
thead self drillinrimeter, 12 inc
ng screw, ch off center in
n the
155
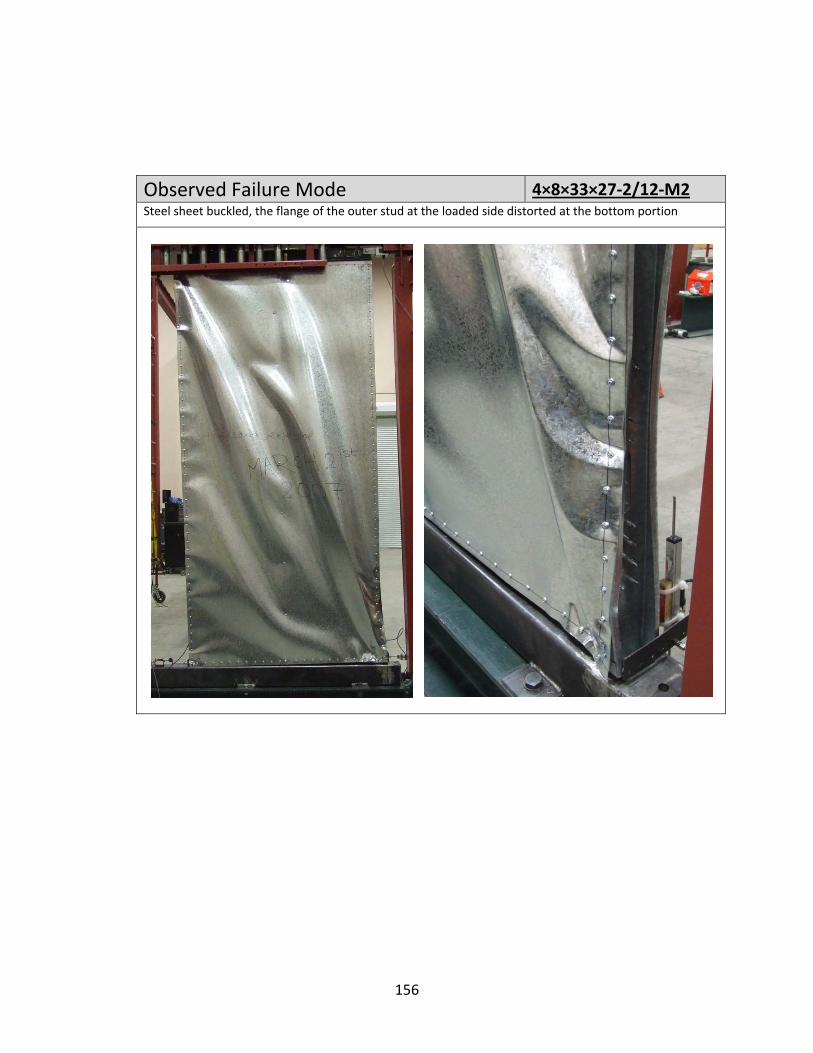
Observed Failure Mode 4×8×33×27‐2/12‐M2Steel sheet buckled, the flange of the outer stud at the loaded side distorted at the bottom portion
156
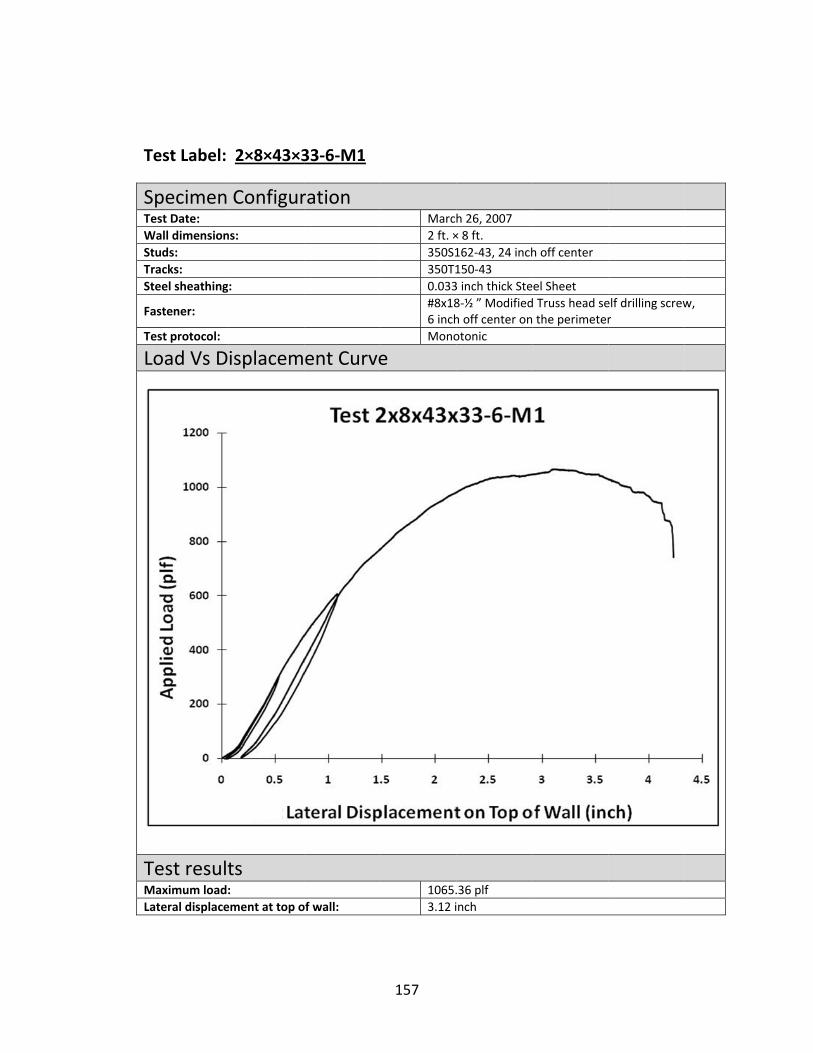
T
STeWStTrSt
Fa
Te
L
TMLa
Test Label:
Specimen est Date: Wall dimensiontuds: racks: teel sheathing
astener:
est protocol:
Load Vs D
Test resultMaximum loadateral displace
2×8×43×3
Configur
ns:
:
isplacem
ts : ement at top o
33‐6‐M1
ration
ent Curve
of wall:
Marc2 ft. ×350S1350T10.033#8x186 inchMono
e
1065.3.12 i
h 26, 2007× 8 ft.162‐43, 24 inch150‐433 inch thick Ste8‐½ ” Modifiedh off center onotonic
.36 plfinch
h off center
el Sheet d Truss head se the perimeter
elf drilling screwr
w,
157
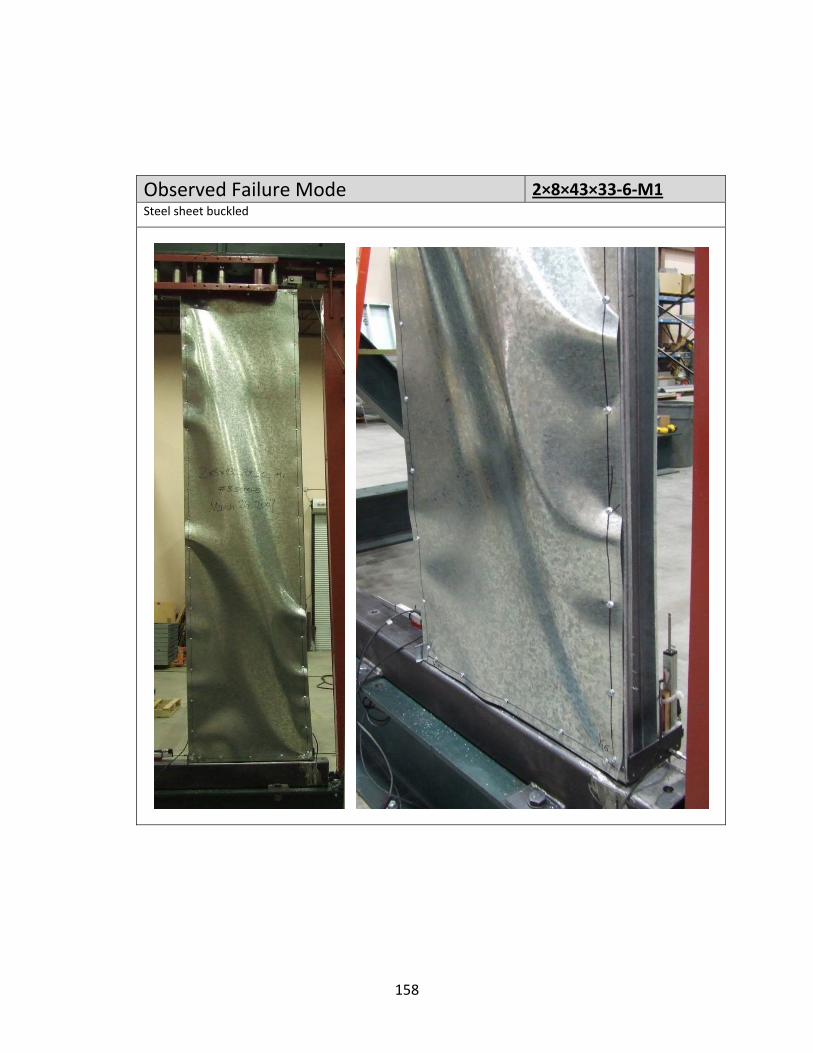
Observed Failure Mode 2×8×43×33‐6‐M1Steel sheet buckled
158

T
STeWStTrSt
Fa
Te
L
TMLa
Test Label:
Specimen est Date: Wall dimensiontuds: racks: teel sheathing
astener:
est protocol:
Load Vs D
Test resultMaximum loadateral displace
2×8×43×3
Configur
ns:
:
isplacem
ts : ement at top o
33‐6‐M2
ration
ent Curve
of wall:
March 22 ft. × 8 f350S162350T1500.033 inc#8x18‐½6 inch ofMonoto
e
967.89 p2.47 inch
6, 2007ft.2‐43, 24 inch of0‐43ch thick Steel S½ ” Modified Trff center on thnic
plfh
ff center
Sheetuss head self de perimeter
drilling screw,
159
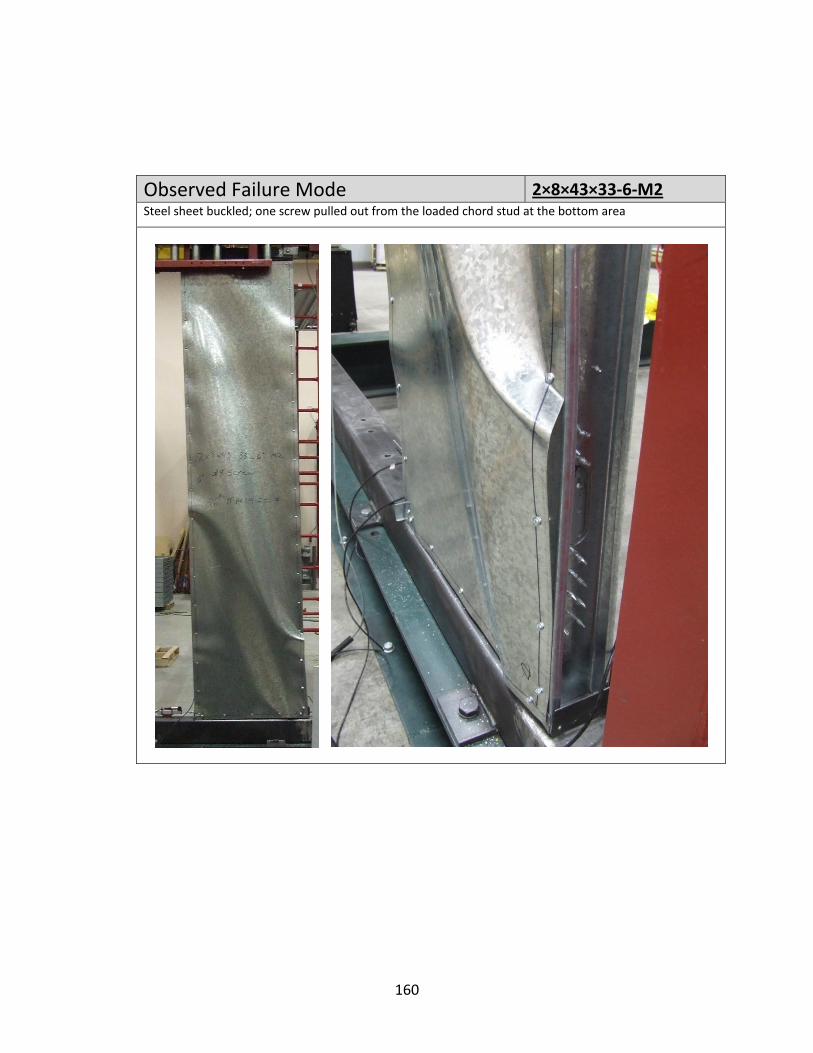
Observed Failure Mode 2×8×43×33‐6‐M2Steel sheet buckled; one screw pulled out from the loaded chord stud at the bottom area
160

T
STeWStTrSt
Fa
Te
L
TMLa
Test Label:
Specimen est Date: Wall dimensiontuds: racks: teel sheathing
astener:
est protocol:
Load Vs D
Test resultMaximum loadateral displace
2×8×43×3
Configur
ns:
:
isplacem
ts : ement at top o
33‐4‐M1
ration
ent Curve
of wall:
March2 ft. ×350S1350T10.033 #8x184 inchMono
e
1147.2.63 in
h 24, 2007 8 ft.162‐43, 24 inch150‐43inch thick Stee
8‐½ ” Modified h off center on otonic
18 plfnch
h off center
el Sheet Truss head sethe perimeter
lf drilling screwr
w,
161
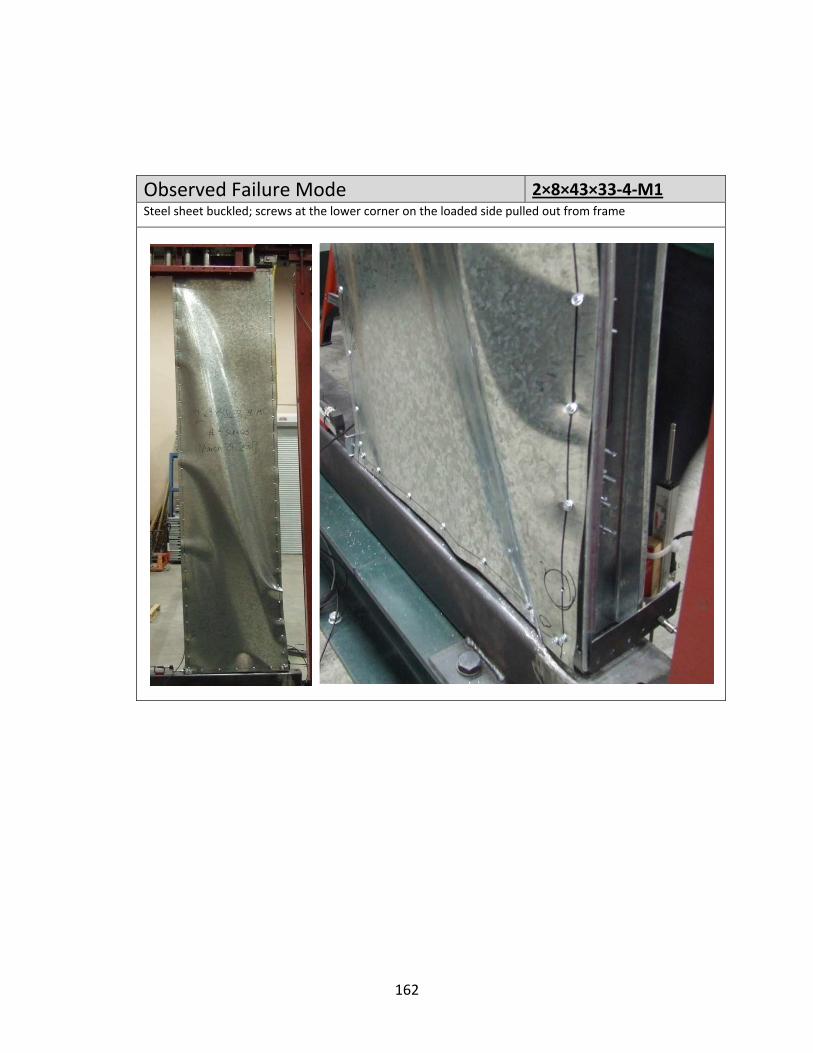
Observed Failure Mode 2×8×43×33‐4‐M1Steel sheet buckled; screws at the lower corner on the loaded side pulled out from frame
162
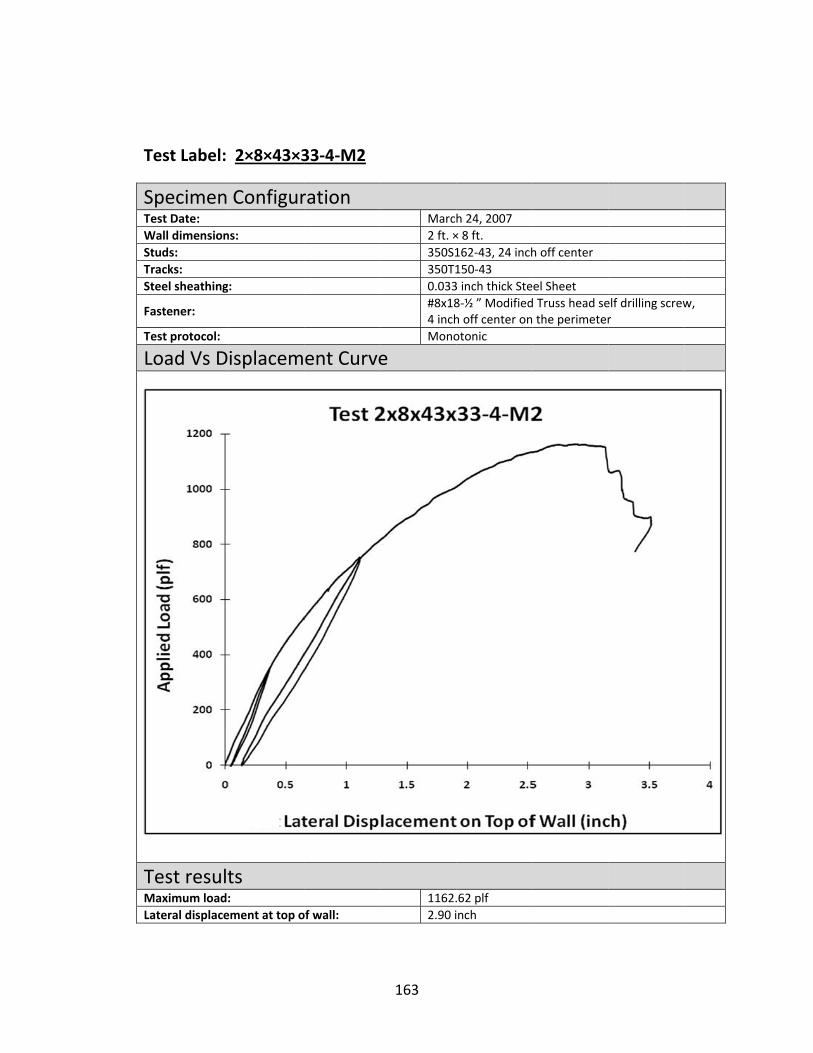
T
STeWStTrSt
Fa
Te
L
TMLa
Test Label:
Specimen est Date: Wall dimensiontuds: racks: teel sheathing
astener:
est protocol:
Load Vs D
Test resultMaximum loadateral displace
2×8×43×3
Configur
ns:
:
isplacem
ts : ement at top o
33‐4‐M2
ration
ent Curve
of wall:
Marc2 ft. ×350S1350T10.033#8x184 inchMono
e
1162.2.90 i
h 24, 2007× 8 ft.162‐43, 24 inch150‐433 inch thick Ste8‐½ ” Modifiedh off center onotonic
.62 plfinch
h off center
el Sheet d Truss head se the perimeter
elf drilling screwr
w,
163
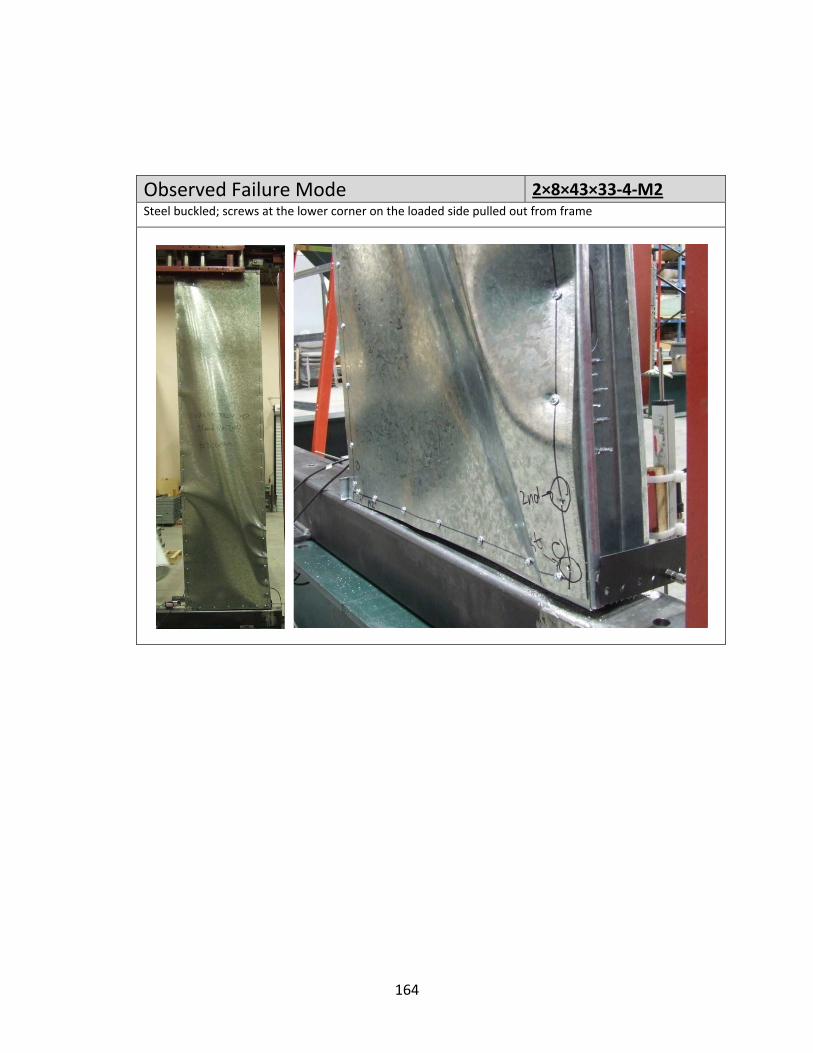
Observed Failure Mode 2×8×43×33‐4‐M2Steel buckled; screws at the lower corner on the loaded side pulled out from frame
164

T
STeWStTrSt
Fa
Te
L
TMLa
Test Label:
Specimen est Date: Wall dimensiontuds: racks: teel sheathing
astener:
est protocol:
Load Vs D
Test resultMaximum loadateral displace
2×8×43×3
Configur
ns:
:
isplacem
ts : ement at top o
33‐2‐M1
ration
ent Curve
of wall:
Marc2 ft. ×350S1350T10.033#8x182 inchMono
e
1386.3.30 i
h 24, 2007× 8 ft.162‐43, 24 inch150‐433 inch thick Ste8‐½ ” Modifiedh off center onotonic
.38 plfinch
h off center
el Sheet d Truss head se the perimeter
elf drilling screwr
w,
165

Observed Failure Mode 2×8×43×33‐2‐M1Steel sheet buckled; the flanges of the outer stud on the loaded side distorted in the bottom portion
166
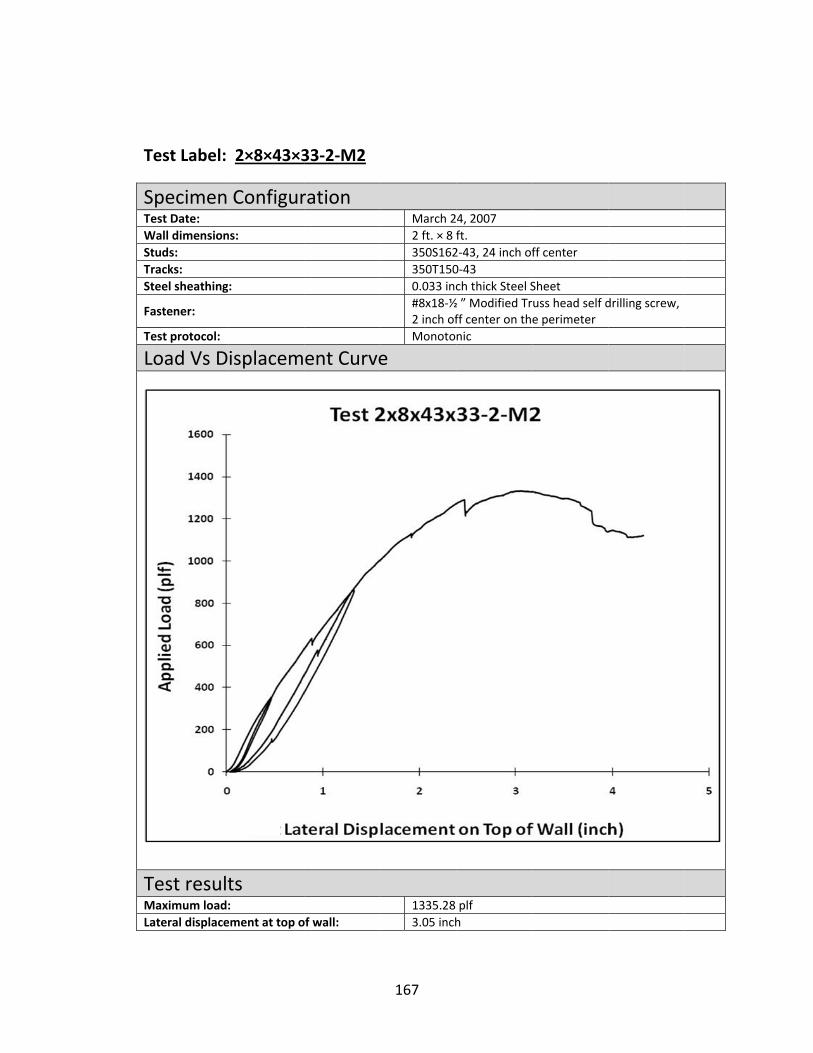
T
STeWStTrSt
Fa
Te
L
TMLa
Test Label:
Specimen est Date: Wall dimensiontuds: racks: teel sheathing
astener:
est protocol:
Load Vs D
Test resultMaximum loadateral displace
2×8×43×3
Configur
ns:
:
isplacem
ts : ement at top o
33‐2‐M2
ration
ent Curve
of wall:
March 22 ft. × 8 f350S162350T1500.033 inc#8x18‐½2 inch ofMonoto
e
1335.28 3.05 inch
4, 2007ft.2‐43, 24 inch of0‐43ch thick Steel S½ ” Modified Trff center on thnic
plfh
ff center
Sheetuss head self de perimeter
drilling screw,
167

Observed Failure Mode 2×8×43×33‐2‐M2Steel sheet buckled; the flanges of the outer stud on the loaded side distorted in the bottom portion
168
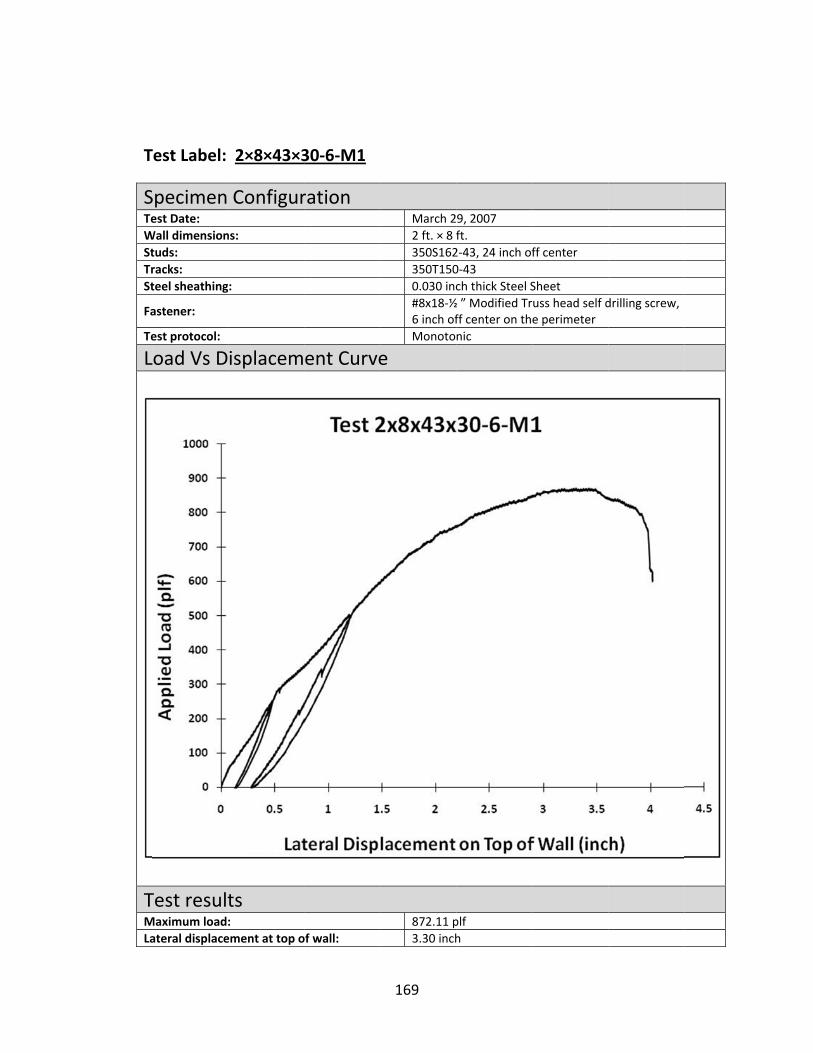
T
STeWStTrSt
Fa
Te
L
TMLa
Test Label:
Specimen est Date: Wall dimensiontuds: racks: teel sheathing
astener:
est protocol:
Load Vs D
Test resultMaximum loadateral displace
2×8×43×3
Configur
ns:
:
isplacem
ts : ement at top o
30‐6‐M1
ration
ent Curve
of wall:
March 22 ft. × 8 f350S162350T1500.030 inc#8x18‐½6 inch ofMonoto
e
872.11 p3.30 inch
9, 2007ft.2‐43, 24 inch of0‐43ch thick Steel S½ ” Modified Trff center on thnic
plfh
ff center
Sheetuss head self de perimeter
drilling screw,
169

OStdi
Observed teel sheet buckistorted in the
Failure Mkled and finallyflange
Modey put off the fr
ame at the up
per unloaded c
2×8×43×30corner; the un
0‐6‐M1loaded chord sstud
170
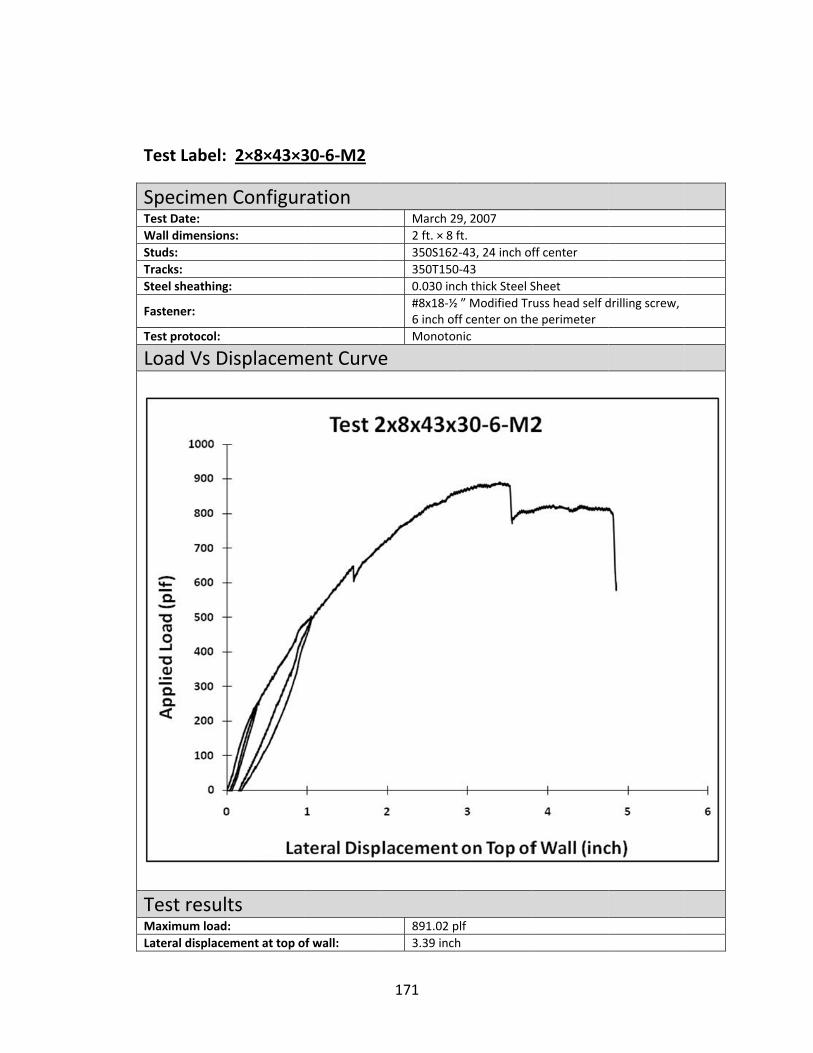
T
STeWStTrSt
Fa
Te
L
TMLa
Test Label:
Specimen est Date: Wall dimensiontuds: racks: teel sheathing
astener:
est protocol:
Load Vs D
Test resultMaximum loadateral displace
2×8×43×3
Configur
ns:
:
isplacem
ts : ement at top o
30‐6‐M2
ration
ent Curve
of wall:
March 22 ft. × 8 f350S162350T1500.030 inc#8x18‐½6 inch ofMonoto
e
891.02 p3.39 inch
9, 2007ft.2‐43, 24 inch of0‐43ch thick Steel S½ ” Modified Trff center on thnic
plfh
ff center
Sheetuss head self de perimeter
drilling screw,
171

Observed Failure Mode 2×8×43×30‐6‐M2Steel sheet buckled and finally put off the frame at the along the loaded chord stud at the bottom
172

T
STeWStTrSt
Fa
Te
L
TMLa
Test Label:
Specimen est Date: Wall dimensiontuds: racks: teel sheathing
astener:
est protocol:
Load Vs D
Test resultMaximum loadateral displace
2×8×43×3
Configur
ns:
:
isplacem
ts : ement at top o
30‐4‐M1
ration
ent Curve
of wall:
March 22 ft. × 8 f350S162350T1500.030 inc#8x18‐½4 inch ofMonoto
e
936.72 p3.34 inch
8, 2007ft.2‐43, 24 inch of0‐43ch thick Steel S½ ” Modified Trff center on thnic
plfh
ff center
Sheetuss head self de perimeter
drilling screw,
173
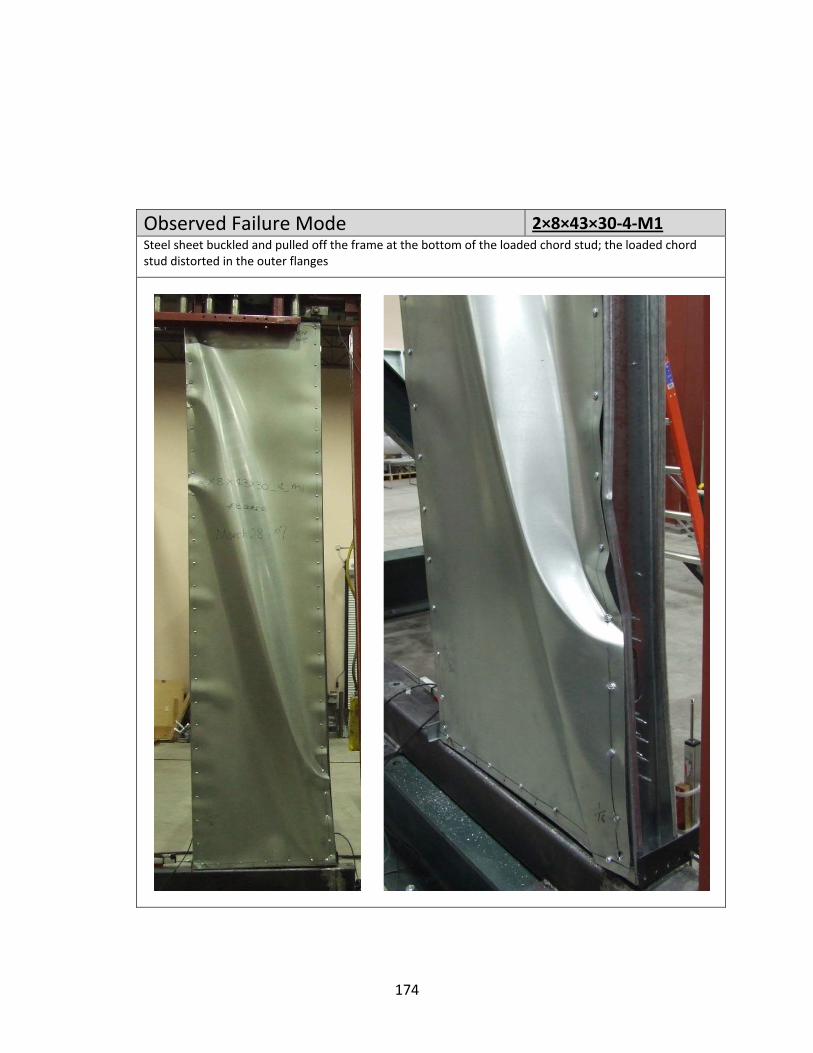
Observed Failure Mode 2×8×43×30‐4‐M1Steel sheet buckled and pulled off the frame at the bottom of the loaded chord stud; the loaded chord stud distorted in the outer flanges
174
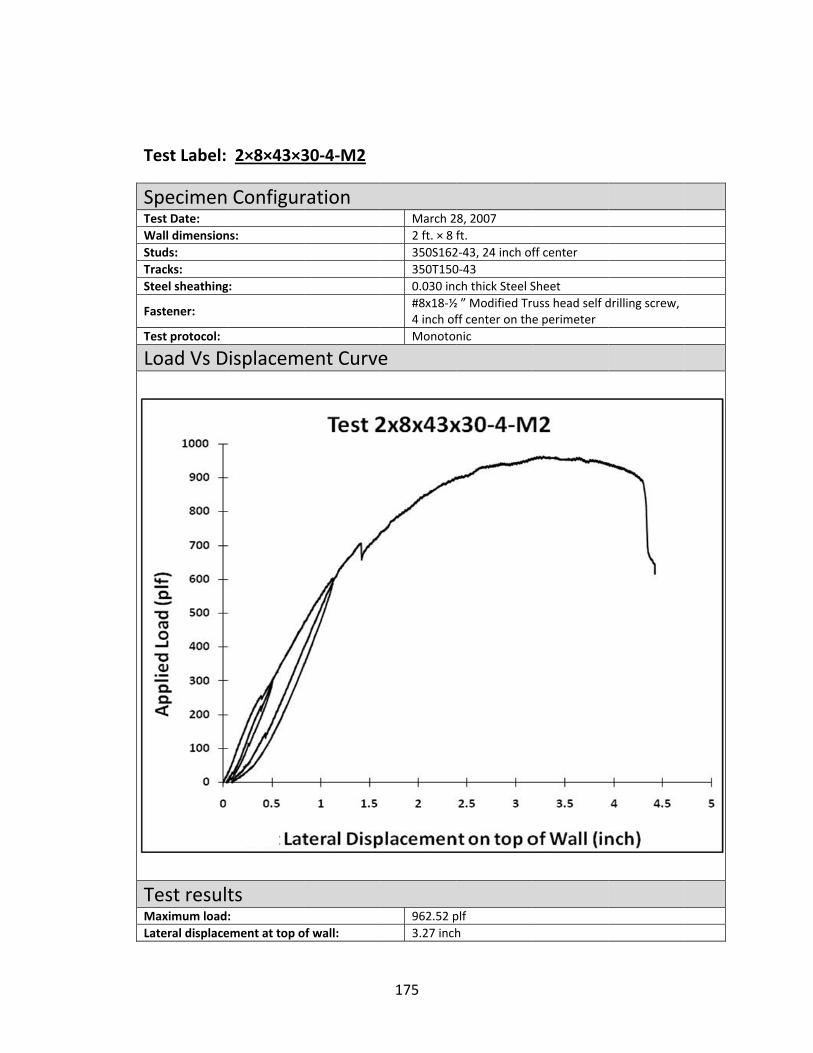
T
STeWStTrSt
Fa
Te
L
TMLa
Test Label:
Specimen est Date: Wall dimensiontuds: racks: teel sheathing
astener:
est protocol:
Load Vs D
Test resultMaximum loadateral displace
2×8×43×3
Configur
ns:
:
isplacem
ts : ement at top o
30‐4‐M2
ration
ent Curve
of wall:
March 22 ft. × 8 f350S162350T1500.030 inc#8x18‐½4 inch ofMonoto
e
962.52 p3.27 inch
8, 2007ft.2‐43, 24 inch of0‐43ch thick Steel S½ ” Modified Trff center on thnic
plfh
ff center
Sheetuss head self de perimeter
drilling screw,
175

Observed Failure Mode 2×8×43×30‐4‐M2Steel sheet buckled and pulled off the frame at the bottom of the loaded chord stud; the loaded chord stud distorted in the outer flanges
176
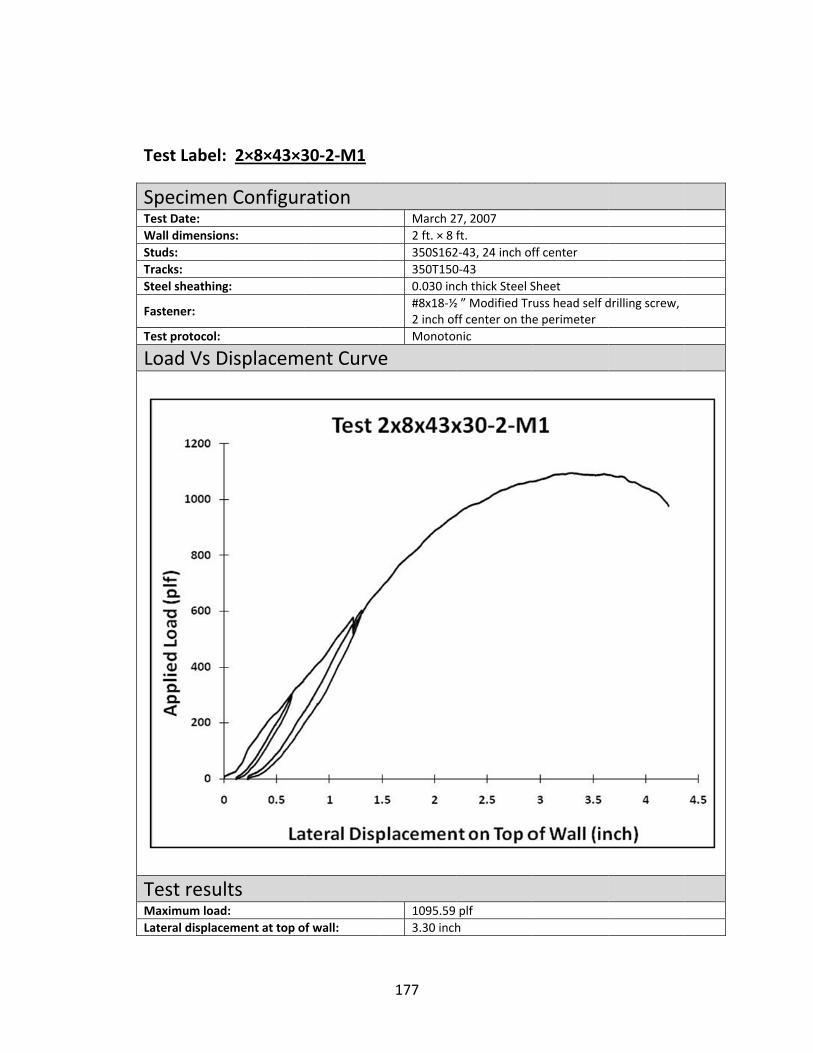
T
STeWStTrSt
Fa
Te
L
TMLa
Test Label:
Specimen est Date: Wall dimensiontuds: racks: teel sheathing
astener:
est protocol:
Load Vs D
Test resultMaximum loadateral displace
2×8×43×3
Configur
ns:
:
isplacem
ts : ement at top o
30‐2‐M1
ration
ent Curve
of wall:
March 22 ft. × 8 f350S162350T1500.030 inc#8x18‐½2 inch ofMonoto
e
1095.59 3.30 inch
7, 2007ft.2‐43, 24 inch of0‐43ch thick Steel S½ ” Modified Trff center on thnic
plfh
ff center
Sheetuss head self de perimeter
drilling screw,
177
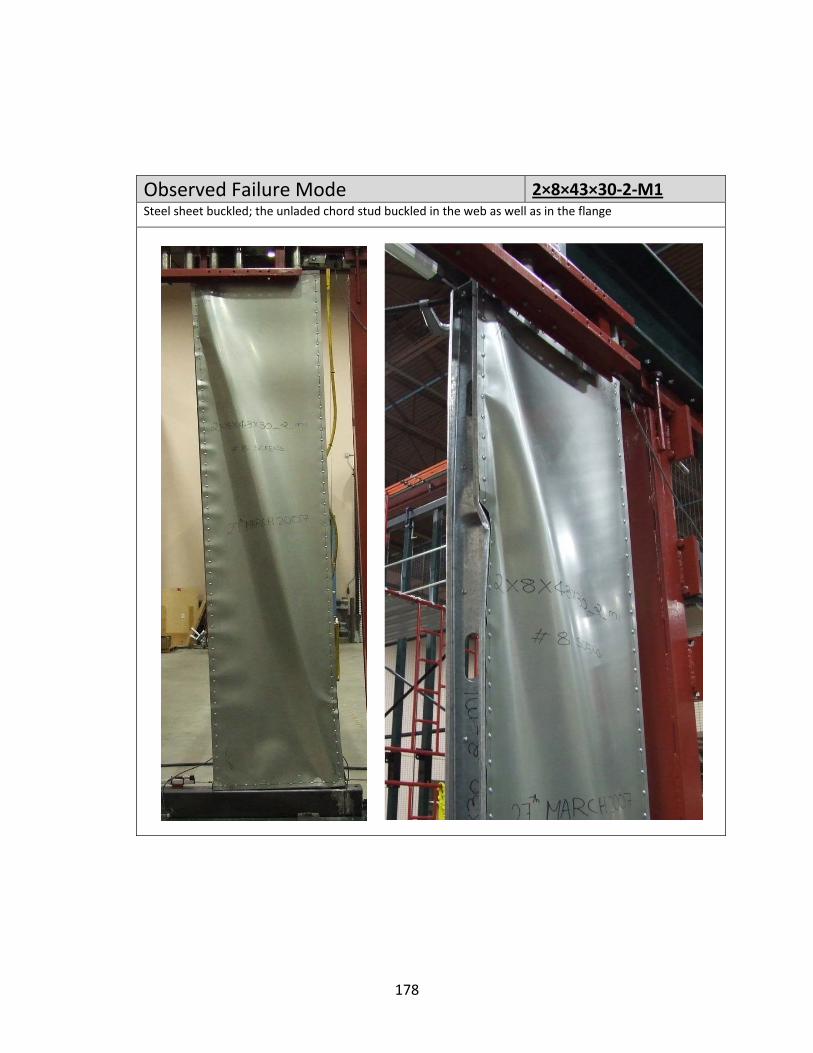
Observed Failure Mode 2×8×43×30‐2‐M1Steel sheet buckled; the unladed chord stud buckled in the web as well as in the flange
178
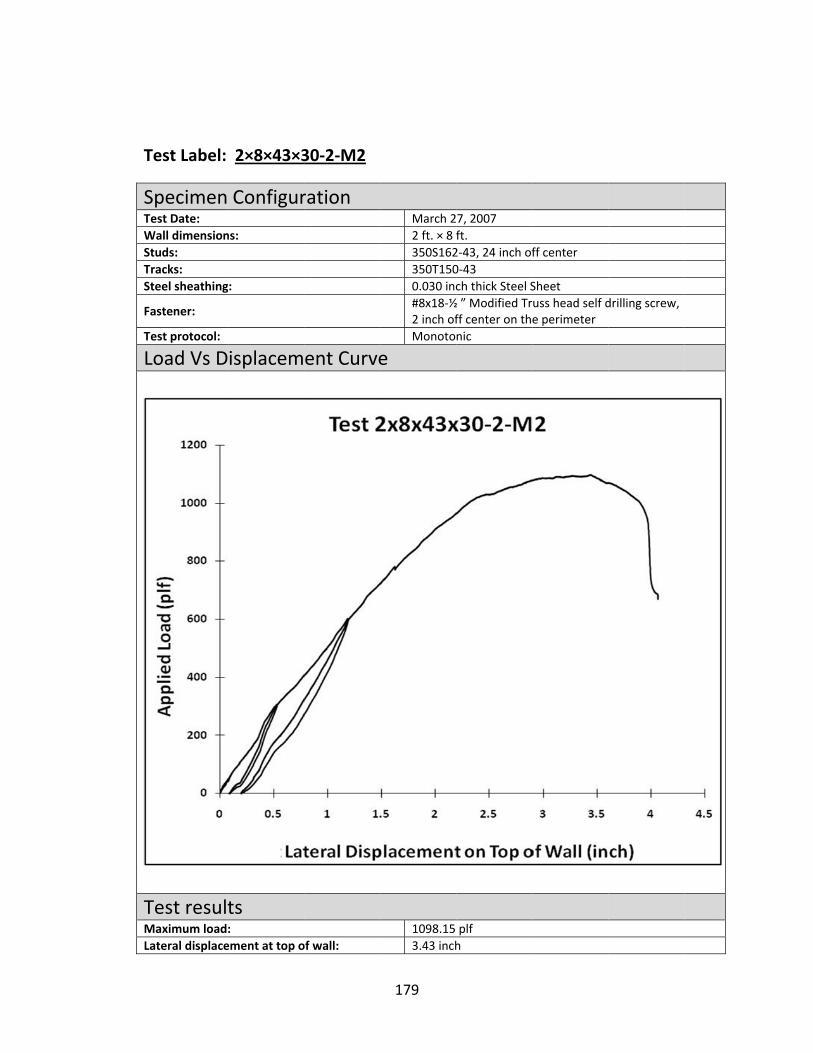
T
STeWStTrSt
Fa
Te
L
TMLa
Test Label:
Specimen est Date: Wall dimensiontuds: racks: teel sheathing
astener:
est protocol:
Load Vs D
Test resultMaximum loadateral displace
2×8×43×3
Configur
ns:
:
isplacem
ts : ement at top o
30‐2‐M2
ration
ent Curve
of wall:
March 22 ft. × 8 f350S162350T1500.030 inc#8x18‐½2 inch ofMonoto
e
1098.15 3.43 inch
7, 2007ft.2‐43, 24 inch of0‐43ch thick Steel S½ ” Modified Trff center on thnic
plfh
ff center
Sheetuss head self de perimeter
drilling screw,
179

OSt
Observed teel sheet buck
Failure Mkled; the unlad
Modeded chord stud
buckled in the
e web as well a
2×8×43×30as in the flange
0‐2‐M2e
180

181
APPENDIX B
CYCLIC TESTS OF SHEAR WALLS

Test Lab
SpecimTest Date: Wall dimeStuds: Tracks: Steel shea
Fastener:
Test proto
Load V
Test reMaximumLateral disMaximumLateral disAverage MAverage La
bel: 4×8×4
men Confi
nsions:
thing:
ocol:
Vs Displac
esults +load: splacement at ‐load: splacement at Maximum loadateral displace
43×33‐6/1
iguration
cement Cu
max +load:
max ‐load: : ement:
2‐C1
Mar4 ft.3503500.03#8x6 inCycl
urve
+11+1.6‐106‐1.61111.64
rch 22, 2007. × 8 ft.S162‐43, 24 inT150‐4333 inch thick St18‐½ ” Modifiech off center olic CUREE
57.63 plf66 inch67.44 plf63 inch2.53 plf4 inch
nch off center
teel Sheeted Truss head son the perimet
self drilling scrter, 12 inch off
ew, center on the field
182
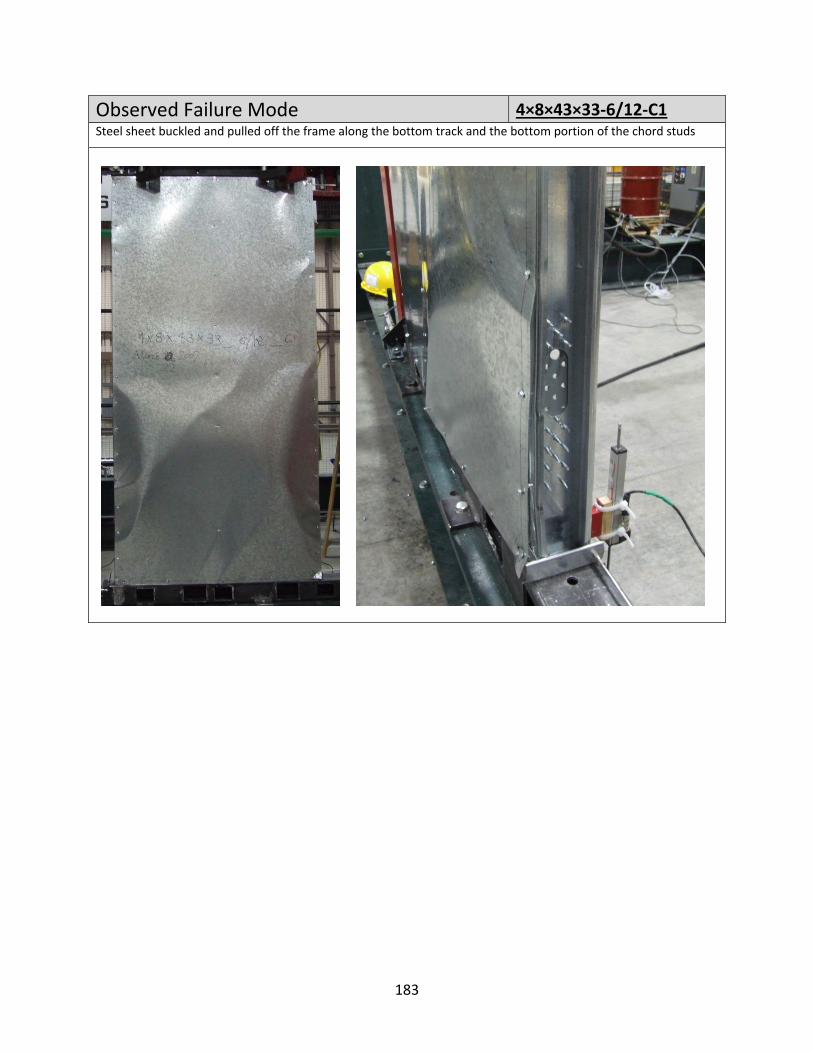
Observed Failure Mode 4×8×43×33‐6/12‐C1Steel sheet buckled and pulled off the frame along the bottom track and the bottom portion of the chord studs
183
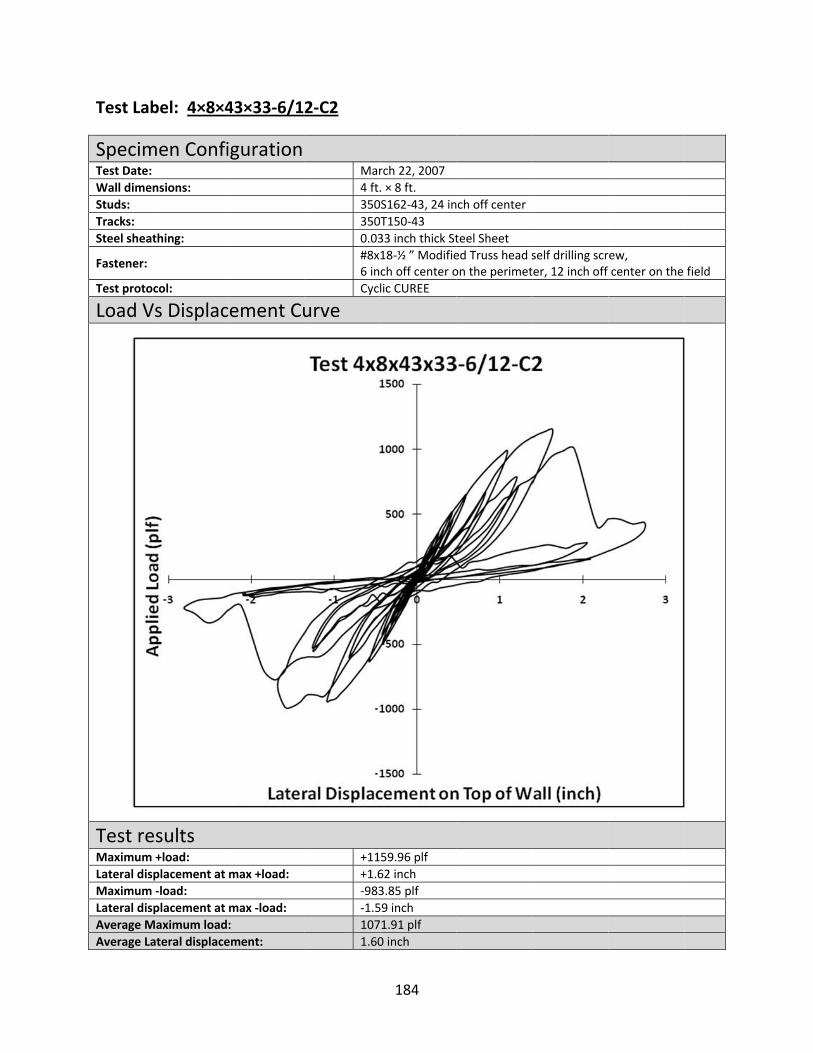
Test Lab
SpecimTest Date: Wall dimeStuds: Tracks: Steel shea
Fastener:
Test proto
Load V
Test reMaximumLateral disMaximumLateral disAverage MAverage La
bel: 4×8×4
men Confi
nsions:
thing:
ocol:
Vs Displac
esults +load: splacement at ‐load: splacement at Maximum loadateral displace
43×33‐6/1
iguration
cement Cu
max +load:
max ‐load: : ement:
2‐C2
Mar4 ft.3503500.03#8x6 inCycl
urve
+11+1.6‐983‐1.51071.60
rch 22, 2007. × 8 ft.S162‐43, 24 inT150‐4333 inch thick St18‐½ ” Modifiech off center olic CUREE
59.96 plf62 inch3.85 plf59 inch1.91 plf0 inch
nch off center
teel Sheeted Truss head son the perimet
self drilling scrter, 12 inch off
ew, center on the field
184
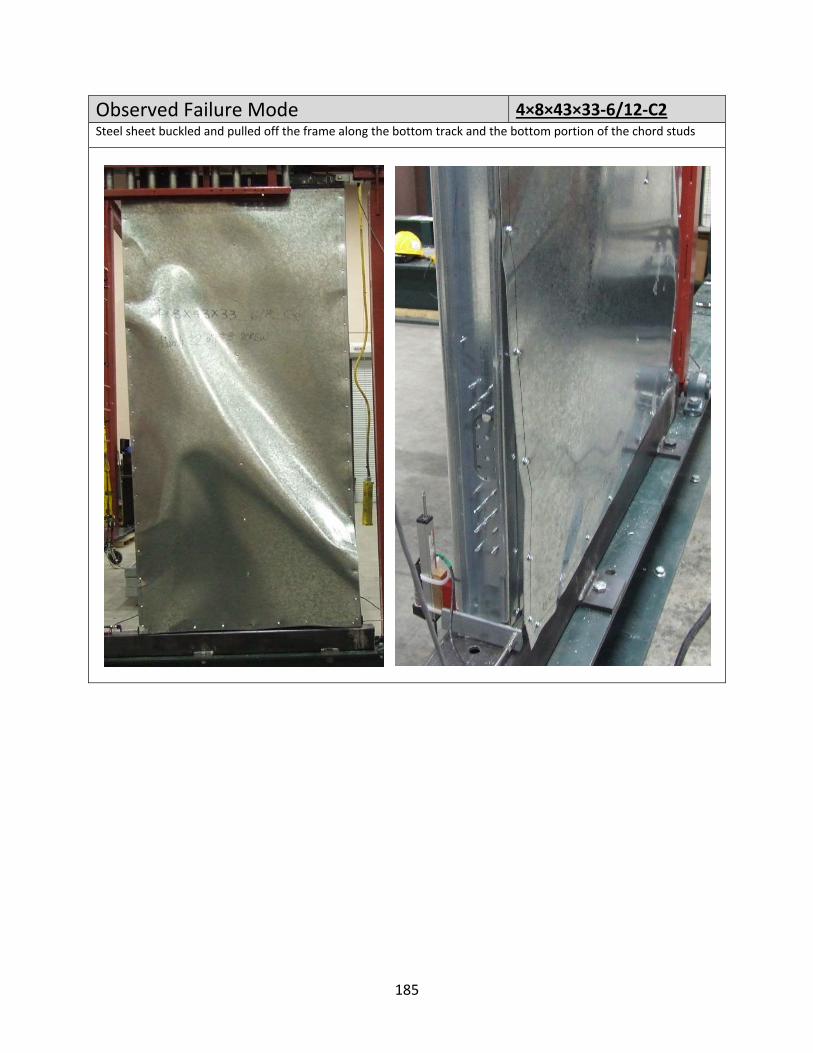
Observed Failure Mode 4×8×43×33‐6/12‐C2Steel sheet buckled and pulled off the frame along the bottom track and the bottom portion of the chord studs
185

Test Lab
SpecimTest Date: Wall dimeStuds: Tracks: Steel shea
Fastener:
Test proto
Load V
Test reMaximumLateral disMaximumLateral disAverage MAverage La
bel: 4×8×4
men Confi
nsions:
thing:
ocol:
Vs Displac
esults +load: splacement at ‐load: splacement at Maximum loadateral displace
43×33‐4/1
iguration
cement Cu
max +load:
max ‐load: : ement:
2‐C1
Mar4 ft.3503500.03#8x4 inCycl
urve
+12+1.6‐114‐1.81181.78
rch 22, 2007. × 8 ft.S162‐43, 24 inT150‐4333 inch thick St18‐½ ” Modifiech off center olic CUREE
25.35 plf68 inch48.02 plf88 inch6.68 plf8 inch
nch off center
teel Sheeted Truss head son the perimet
self drilling scrter, 12 inch off
ew, center on the field
186
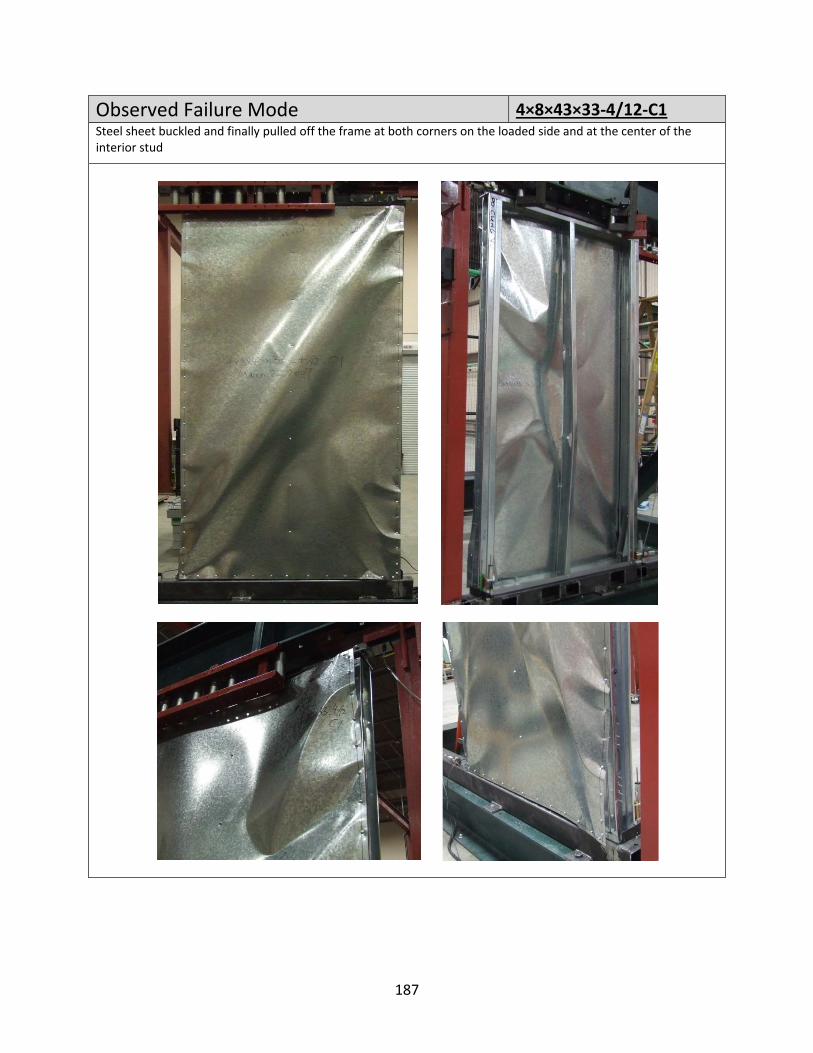
Observed Failure Mode 4×8×43×33‐4/12‐C1Steel sheet buckled and finally pulled off the frame at both corners on the loaded side and at the center of the interior stud
187
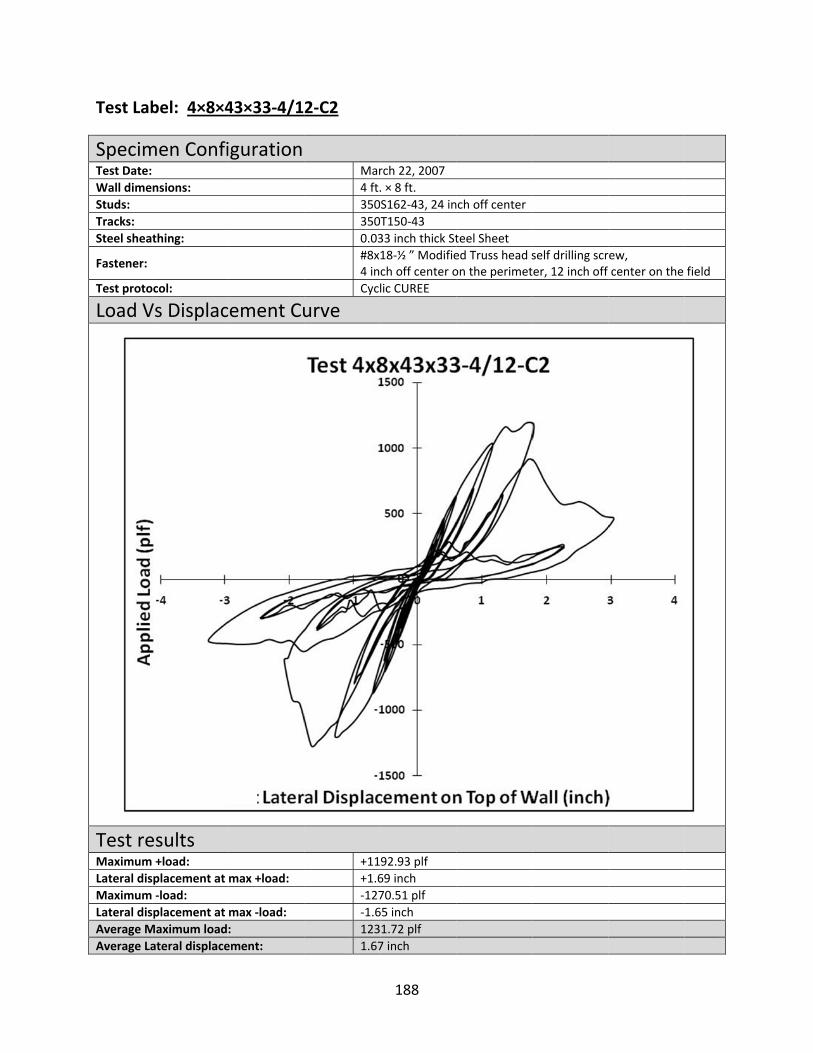
Test Lab
SpecimTest Date: Wall dimeStuds: Tracks: Steel shea
Fastener:
Test proto
Load V
Test reMaximumLateral disMaximumLateral disAverage MAverage La
bel: 4×8×4
men Confi
nsions:
thing:
ocol:
Vs Displac
esults +load: splacement at ‐load: splacement at Maximum loadateral displace
43×33‐4/1
iguration
cement Cu
max +load:
max ‐load: : ement:
2‐C2
Mar4 ft.3503500.03#8x4 inCycl
urve
+11+1.6‐127‐1.61231.67
rch 22, 2007. × 8 ft.S162‐43, 24 inT150‐4333 inch thick St18‐½ ” Modifiech off center olic CUREE
92.93 plf69 inch70.51 plf65 inch1.72 plf7 inch
nch off center
teel Sheeted Truss head son the perimet
self drilling scrter, 12 inch off
ew, center on the field
188
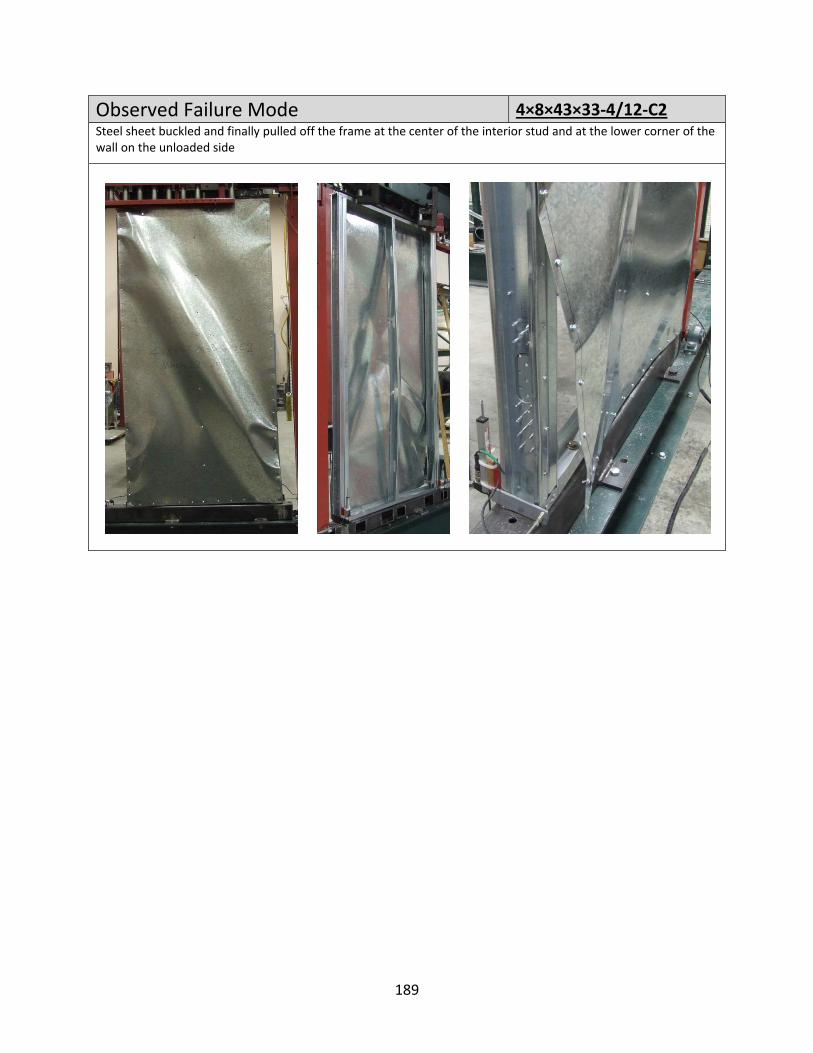
Observed Failure Mode 4×8×43×33‐4/12‐C2Steel sheet buckled and finally pulled off the frame at the center of the interior stud and at the lower corner of the wall on the unloaded side
189
Test Lab
SpecimTest Date: Wall dimeStuds: Tracks: Steel shea
Fastener:
Test proto
Load V
Test reMaximumLateral disMaximumLateral disAverage MAverage La
Observ
bel: 4×8×4
men Confi
nsions:
thing:
ocol:
Vs Displac
esults +load: splacement at ‐load: splacement at Maximum loadateral displace
ved Failur
43×33‐2/1
iguration
cement Cu
max +load:
max ‐load: : ement:
re Mode
2‐C1
Mar4 ft.3503500.03#8x2 inCycl
urve
+13+1.8‐120‐1.91271.9
rch 23, 2007. × 8 ft.S162‐43, 24 inT150‐4333 inch thick St18‐½ ” Modifiech off center olic CUREE
45.87 plf89 inch02.78 plf91 inch4.32 plfinch
nch off center
teel Sheeted Truss head son the perimet
4×
self drilling scrter, 12 inch off
×8×43×33‐2
ew, center on the
2/12‐C1
field
190
Steel sheet buckled and finally pulled off the frame at the center of the interior stud
191

Test Lab
SpecimTest Date: Wall dimeStuds: Tracks: Steel shea
Fastener:
Test proto
Load V
Test reMaximumLateral disMaximumLateral disAverage MAverage La
bel: 4×8×4
men Confi
nsions:
thing:
ocol:
Vs Displac
esults +load: splacement at ‐load: splacement at Maximum loadateral displace
43×33‐2/1
iguration
cement Cu
max +load:
max ‐load: : ement:
2‐C2
Mar4 ft.3503500.03#8x2 inCycl
urve
+12+1.5‐131‐2.01301.79
rch 23, 2007. × 8 ft.S162‐43, 24 inT150‐4333 inch thick St18‐½ ” Modifiech off center olic CUREE
83.3 plf51 inch18.09 plf08 inch0.69 plf9 inch
nch off center
teel Sheeted Truss head son the perimet
self drilling scrter, 12 inch off
ew, center on the field
192
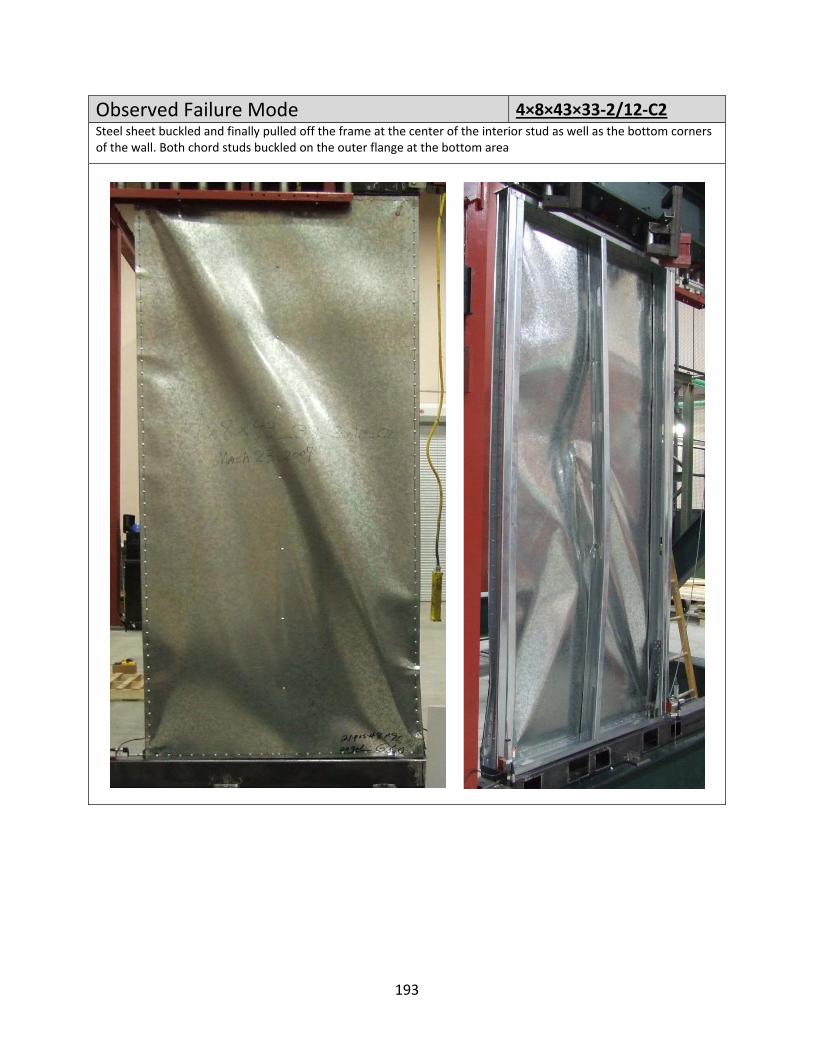
Observed Failure Mode 4×8×43×33‐2/12‐C2Steel sheet buckled and finally pulled off the frame at the center of the interior stud as well as the bottom corners of the wall. Both chord studs buckled on the outer flange at the bottom area
193
Test Lab
SpecimTest Date: Wall dimeStuds: Tracks: Steel shea
Fastener:
Test proto
Load V
Test reMaximumLateral disMaximumLateral disAverage MAverage La
Observ
bel: 4×8×4
men Confi
nsions:
thing:
ocol:
Vs Displac
esults +load: splacement at ‐load: splacement at Maximum loadateral displace
ved Failur
43×30‐6/1
iguration
cement Cu
max +load:
max ‐load: : ement:
re Mode
2‐C1
Feb4 ft.3503500.03#8x6 inCycl
urve
+86+1.8‐938‐2.09011.91
ruary 16, 2007. × 8 ft.S162‐43, 24 inT150‐4330 inch thick St18‐½ ” Modifiech off center olic CUREE
4.11 plf81 inch8.07 plf01 inch.09 plf1 inch
7
nch off center
teel Sheeted Truss head son the perimet
4×
self drilling scrter, 12 inch off
×8×43×30‐6
ew, center on the
6/12‐C1
field
194
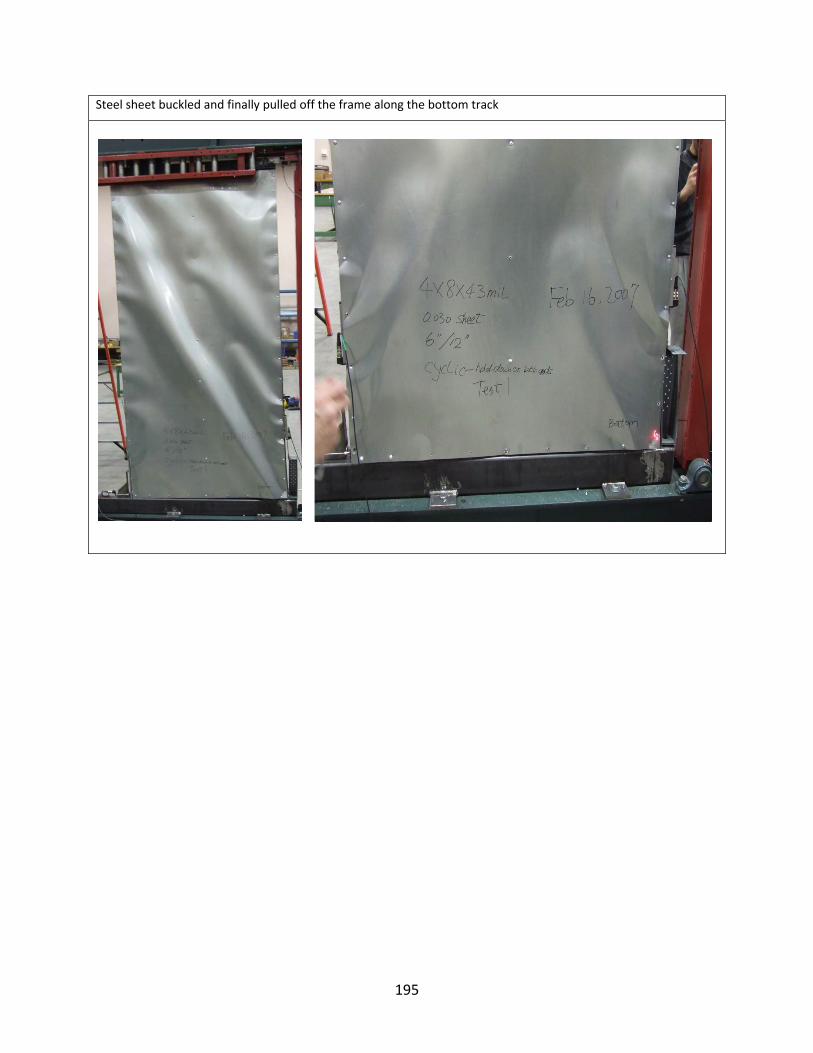
Steel sheet buckled and finally pulled off the frame along the bottom track
195

Test Lab
SpecimTest Date: Wall dimeStuds: Tracks: Steel shea
Fastener:
Test proto
Load V
Test reMaximumLateral disMaximumLateral disAverage M
bel: 4×8×4
men Confi
nsions:
thing:
ocol:
Vs Displac
esults +load: splacement at ‐load: splacement at Maximum load
43×30‐6/1
iguration
cement Cu
max +load:
max ‐load: :
2‐C2
Feb4 ft.3503500.03#8x6 inCycl
urve
+93+2.5‐909‐1.9920
ruary 26, 2007. × 8 ft.S162‐43, 24 inT150‐4330 inch thick St18‐½ ” Modifiech off center olic CUREE
1.80 plf52 inch9.79 plf98 inch.80 plf
7
nch off center
teel Sheeted Truss head son the perimet
self drilling scrter, 12 inch off
ew, center on the field
196
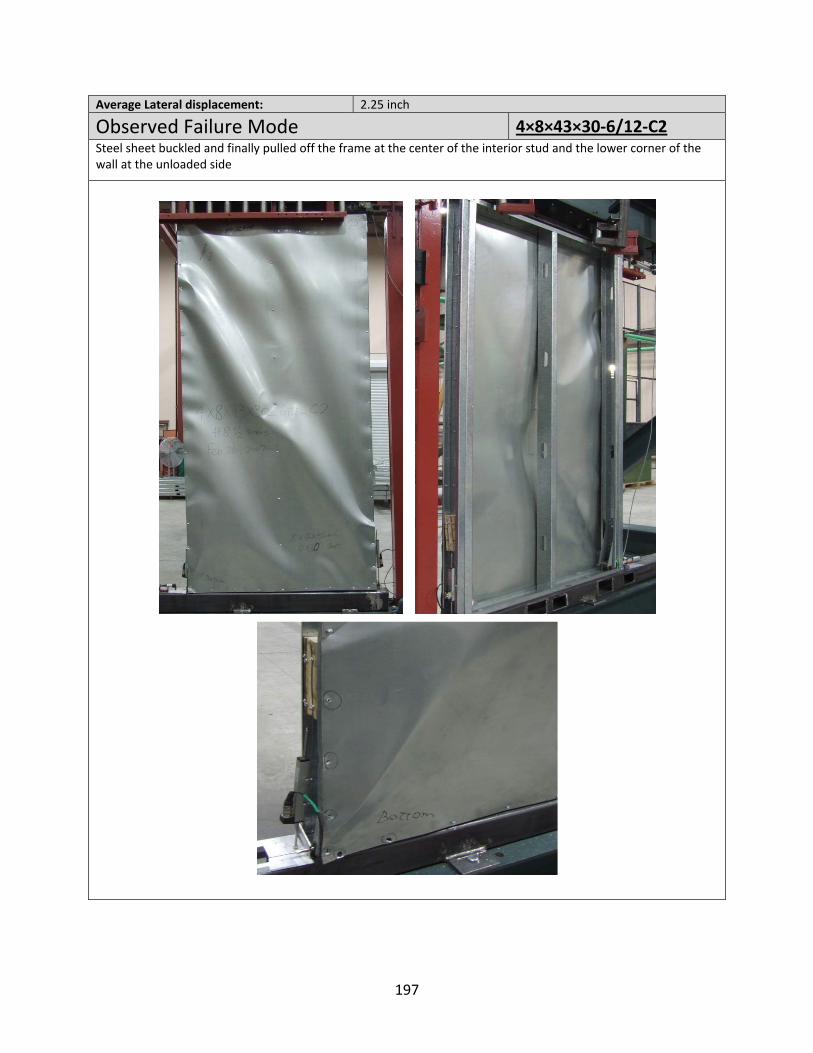
Average Lateral displacement: 2.25 inch
Observed Failure Mode 4×8×43×30‐6/12‐C2Steel sheet buckled and finally pulled off the frame at the center of the interior stud and the lower corner of the wall at the unloaded side
197
Test Lab
SpecimTest Date: Wall dimeStuds: Tracks: Steel shea
Fastener:
Test proto
Load V
Test reMaximumLateral disMaximumLateral disAverage MAverage La
Observ
bel: 4×8×4
men Confi
nsions:
thing:
ocol:
Vs Displac
esults +load: splacement at ‐load: splacement at Maximum loadateral displace
ved Failur
43×30‐4/1
iguration
cement Cu
max +load:
max ‐load: : ement:
re Mode
2‐C1
Feb4 ft.3503500.03#8x4 inCycl
urve
+10+2.0‐107‐1.91041.97
ruary 16, 2007. × 8 ft.S162‐43, 24 inT150‐4330 inch thick St18‐½ ” Modifiech off center olic CUREE
08.30 plf01 inch73.10 plf94 inch0.69 plf7 inch
7
nch off center
teel Sheeted Truss head son the perimet
4×
self drilling scrter, 12 inch off
×8×43×30‐4
ew, center on the
4/12‐C1
field
198
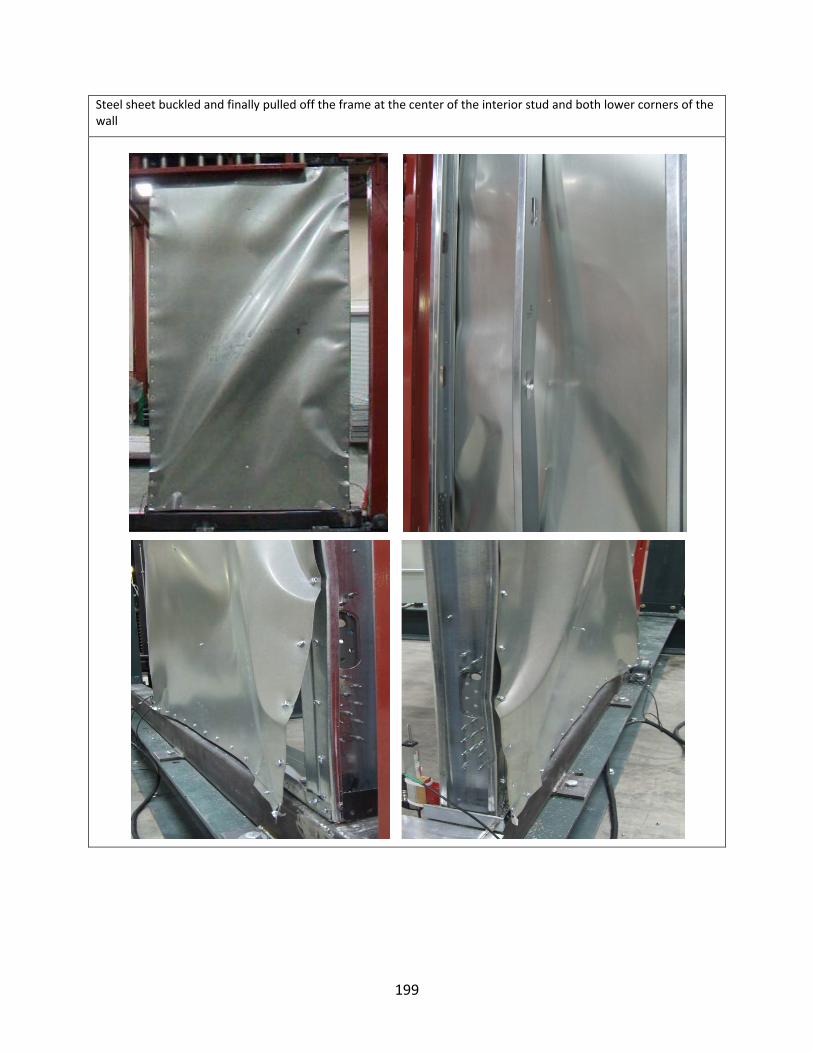
Steel sheet buckled and finally pulled off the frame at the center of the interior stud and both lower corners of the wall
199
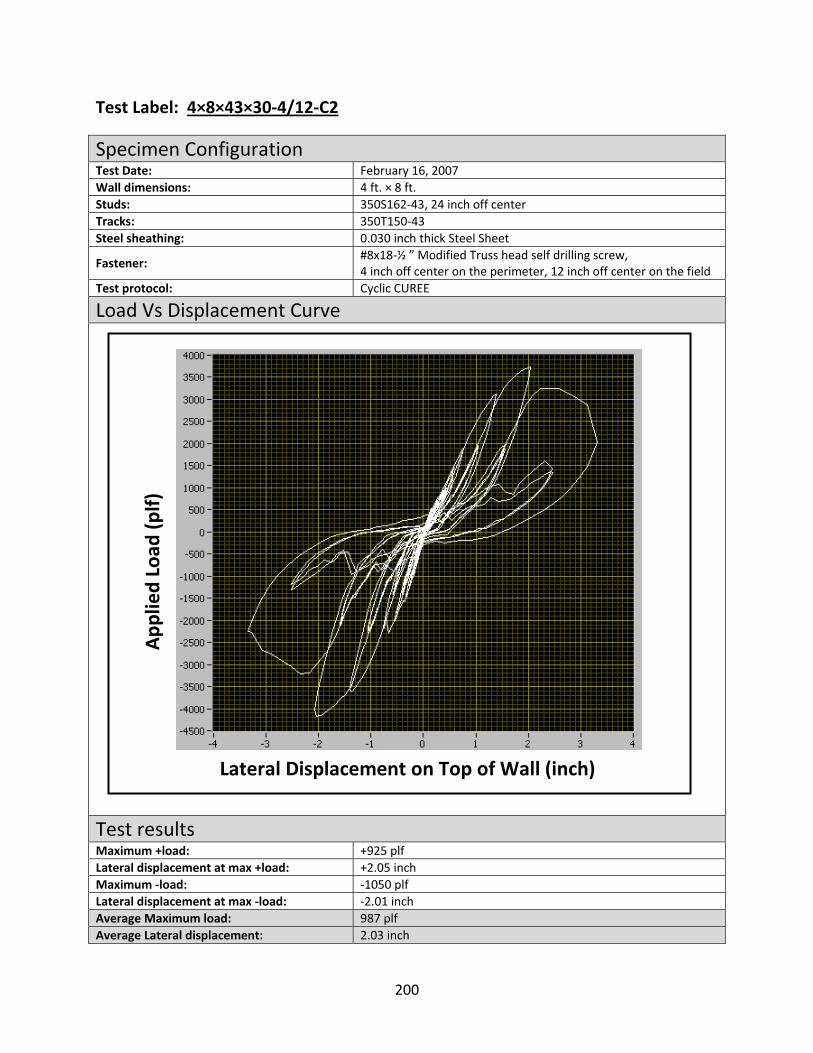
Test Label: 4×8×43×30‐4/12‐C2
Specimen Configuration Test Date: February 16, 2007Wall dimensions: 4 ft. × 8 ft.Studs: 350S162‐43, 24 inch off centerTracks: 350T150‐43Steel sheathing: 0.030 inch thick Steel Sheet
Fastener: #8x18‐½ ” Modified Truss head self drilling screw, 4 inch off center on the perimeter, 12 inch off center on the field
Test protocol: Cyclic CUREE
Load Vs Displacement Curve
Test results Maximum +load: +925 plfLateral displacement at max +load: +2.05 inchMaximum ‐load: ‐1050 plfLateral displacement at max ‐load: ‐2.01 inchAverage Maximum load: 987 plfAverage Lateral displacement: 2.03 inch
Lateral Displacement on Top of Wall (inch)
App
lied Load
(plf)
200
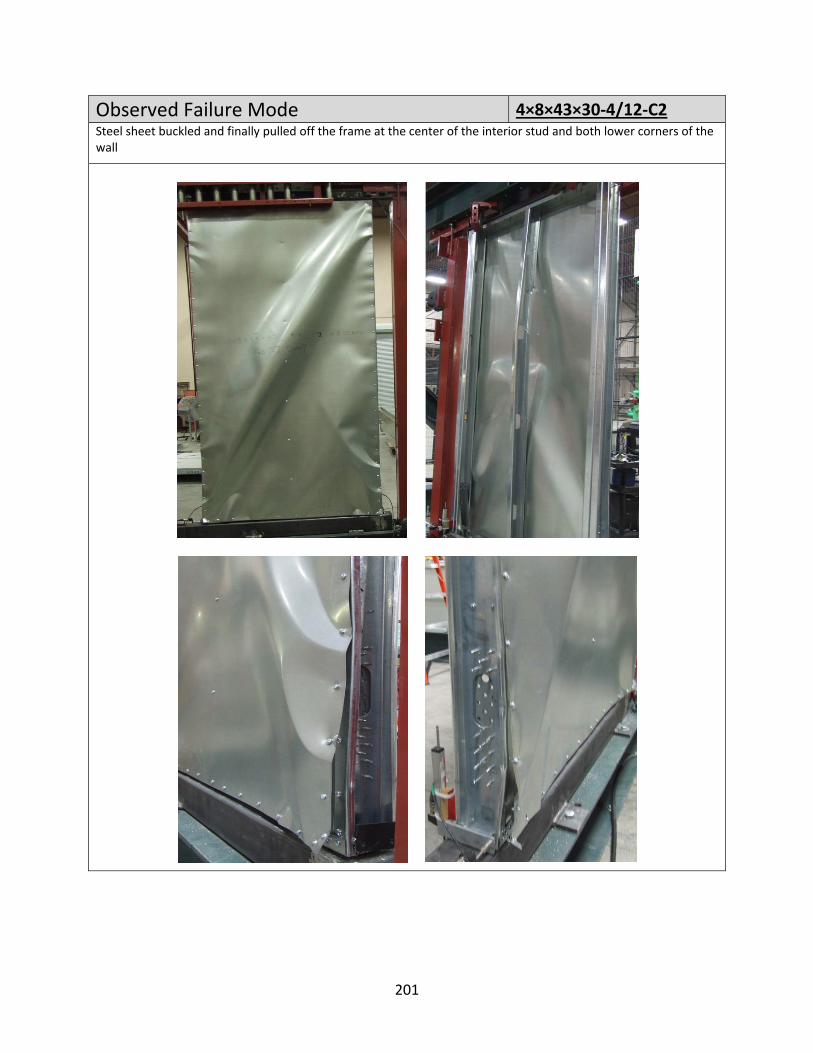
Observed Failure Mode 4×8×43×30‐4/12‐C2Steel sheet buckled and finally pulled off the frame at the center of the interior stud and both lower corners of the wall
201
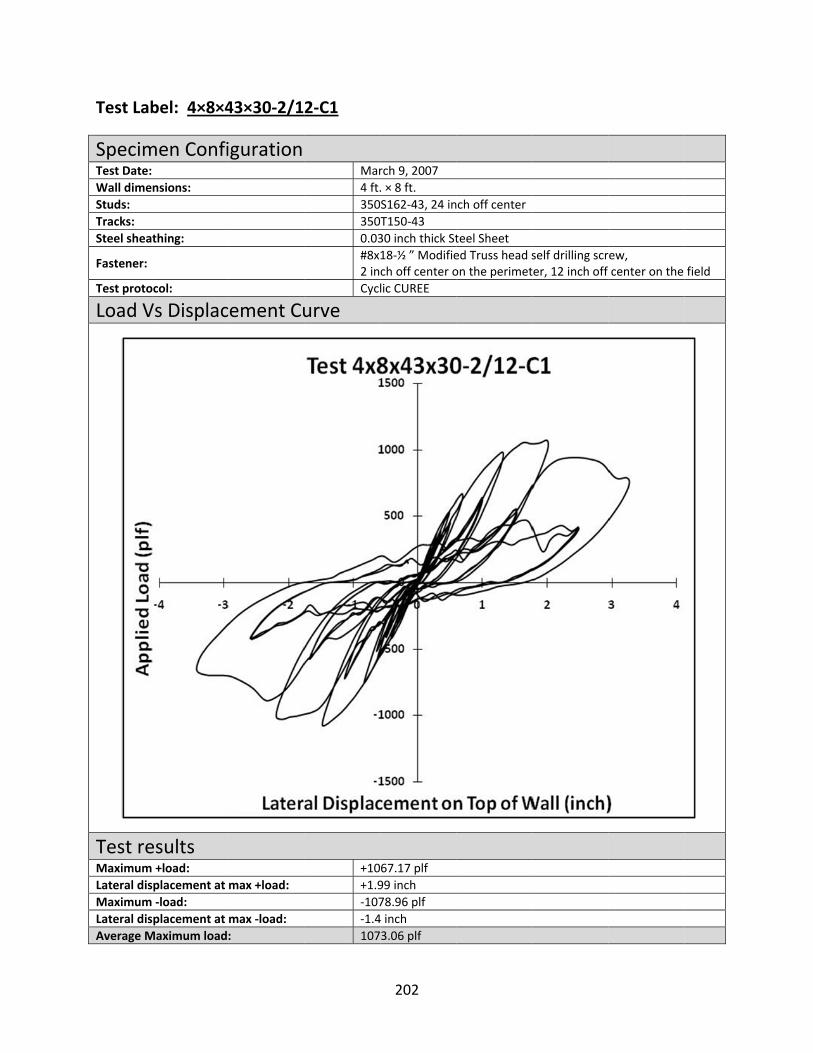
Test Lab
SpecimTest Date: Wall dimeStuds: Tracks: Steel shea
Fastener:
Test proto
Load V
Test reMaximumLateral disMaximumLateral disAverage M
bel: 4×8×4
men Confi
nsions:
thing:
ocol:
Vs Displac
esults +load: splacement at ‐load: splacement at Maximum load
43×30‐2/1
iguration
cement Cu
max +load:
max ‐load: :
2‐C1
Mar4 ft.3503500.03#8x2 inCycl
urve
+10+1.9‐107‐1.4107
rch 9, 2007. × 8 ft.S162‐43, 24 inT150‐4330 inch thick St18‐½ ” Modifiech off center olic CUREE
67.17 plf99 inch78.96 plf4 inch3.06 plf
nch off center
teel Sheeted Truss head son the perimet
self drilling scrter, 12 inch off
ew, center on the field
202
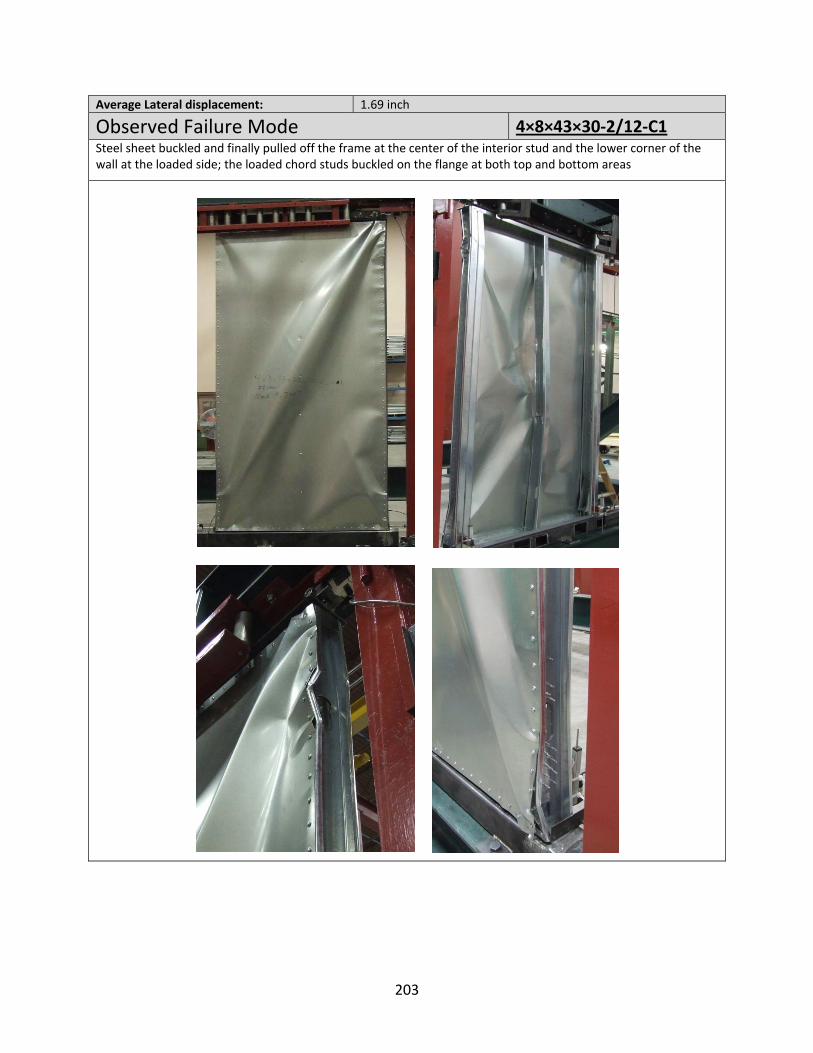
Average Lateral displacement: 1.69 inch
Observed Failure Mode 4×8×43×30‐2/12‐C1Steel sheet buckled and finally pulled off the frame at the center of the interior stud and the lower corner of the wall at the loaded side; the loaded chord studs buckled on the flange at both top and bottom areas
203

Test Lab
SpecimTest Date: Wall dimeStuds: Tracks: Steel shea
Fastener:
Test proto
Load V
Test reMaximumLateral disMaximumLateral disAverage M
bel: 4×8×4
men Confi
nsions:
thing:
ocol:
Vs Displac
esults +load: splacement at ‐load: splacement at Maximum load
43×30‐2/1
iguration
cement Cu
max +load:
max ‐load: :
2‐C2
Feb4 ft.3503500.03#8x2 inCycl
urve
+10+1.6‐108‐1.8106
ruary 16, 2007. × 8 ft.S162‐43, 24 inT150‐4330 inch thick St18‐½ ” Modifiech off center olic CUREE
47.88 plf69 inch84.27 plf84 inch6.07 plf
7
nch off center
teel Sheeted Truss head son the perimet
self drilling scrter, 12 inch off
ew, center on the field
204
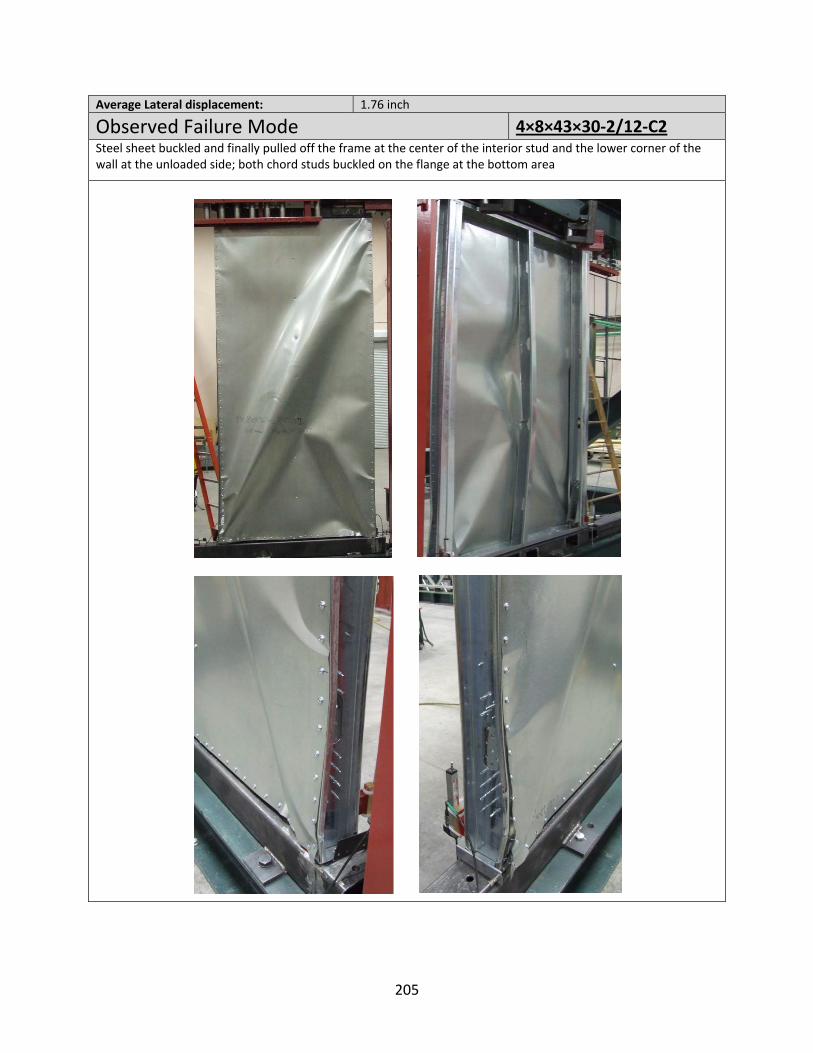
Average Lateral displacement: 1.76 inch
Observed Failure Mode 4×8×43×30‐2/12‐C2Steel sheet buckled and finally pulled off the frame at the center of the interior stud and the lower corner of the wall at the unloaded side; both chord studs buckled on the flange at the bottom area
205

Test Lab
SpecimTest Date: Wall dimeStuds: Tracks: Steel shea
Fastener:
Test proto
Load V
Test reMaximumLateral disMaximumLateral disAverage M
bel: 4×8×3
men Confi
nsions:
thing:
ocol:
Vs Displac
esults +load: splacement at ‐load: splacement at Maximum load
33×27‐6/1
iguration
cement Cu
max +load:
max ‐load: :
2‐C1
Mar4 ft.3503500.02#8x6 inCycl
urve
+67+1.5‐628‐1.5653
rch 20, 2007. × 8 ft.S162‐33, 24 inT150‐3327 inch thick St18‐½ ” Modifiech off center olic CUREE
8.55 plf5 inch8.41 plf58 inch.48 plf
nch off center
teel Sheeted Truss head son the perimet
self drilling scrter, 12 inch off
ew, center on the field
206
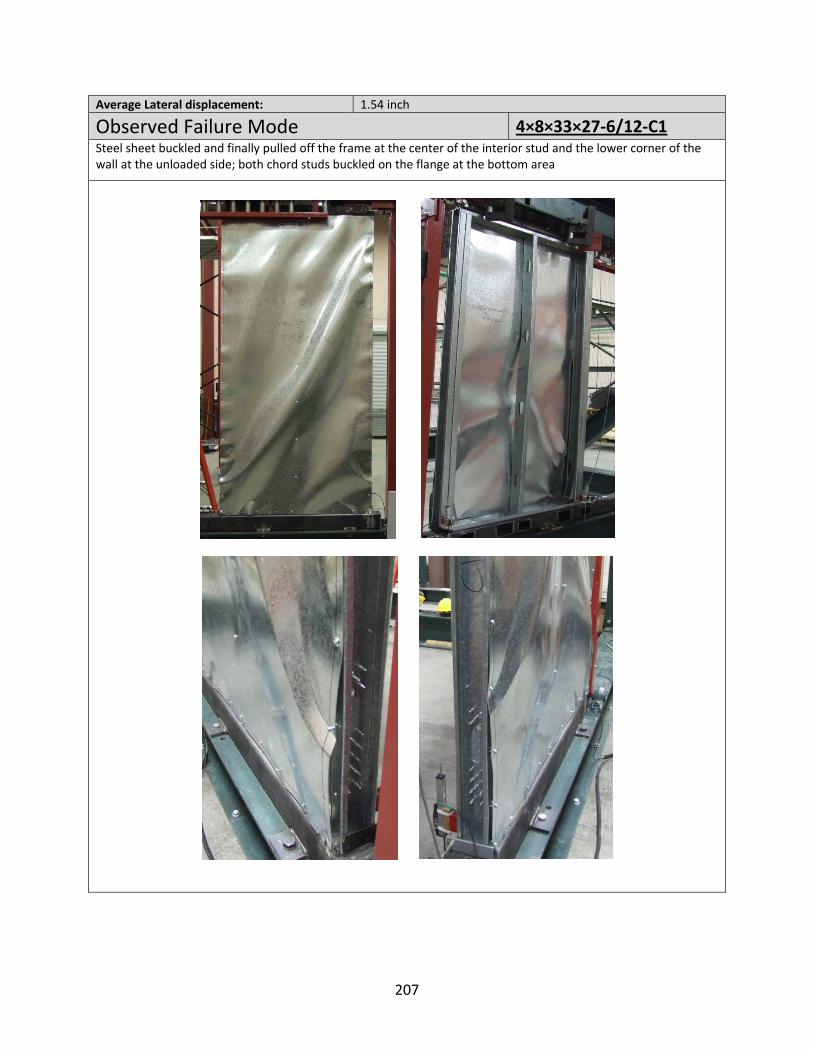
Average Lateral displacement: 1.54 inch
Observed Failure Mode 4×8×33×27‐6/12‐C1Steel sheet buckled and finally pulled off the frame at the center of the interior stud and the lower corner of the wall at the unloaded side; both chord studs buckled on the flange at the bottom area
207
Test Lab
SpecimTest Date: Wall dimeStuds: Tracks: Steel shea
Fastener:
Test proto
Load V
Test reMaximumLateral disMaximumLateral disAverage M
bel: 4×8×3
men Confi
nsions:
thing:
ocol:
Vs Displac
esults +load: splacement at ‐load: splacement at Maximum load
33×27‐6/1
iguration
cement Cu
max +load:
max ‐load: :
2‐C2
Mar4 ft.3503500.02#8x6 inCycl
urve
+62+1.6‐657‐1.4640
rch 20, 2007. × 8 ft.S162‐33, 24 inT150‐3327 inch thick St18‐½ ” Modifiech off center olic CUREE
2.78 plf62 inch7.86 plf42 inch.32 plf
nch off center
teel Sheeted Truss head son the perimet
self drilling scrter, 12 inch off
ew, center on the field
208
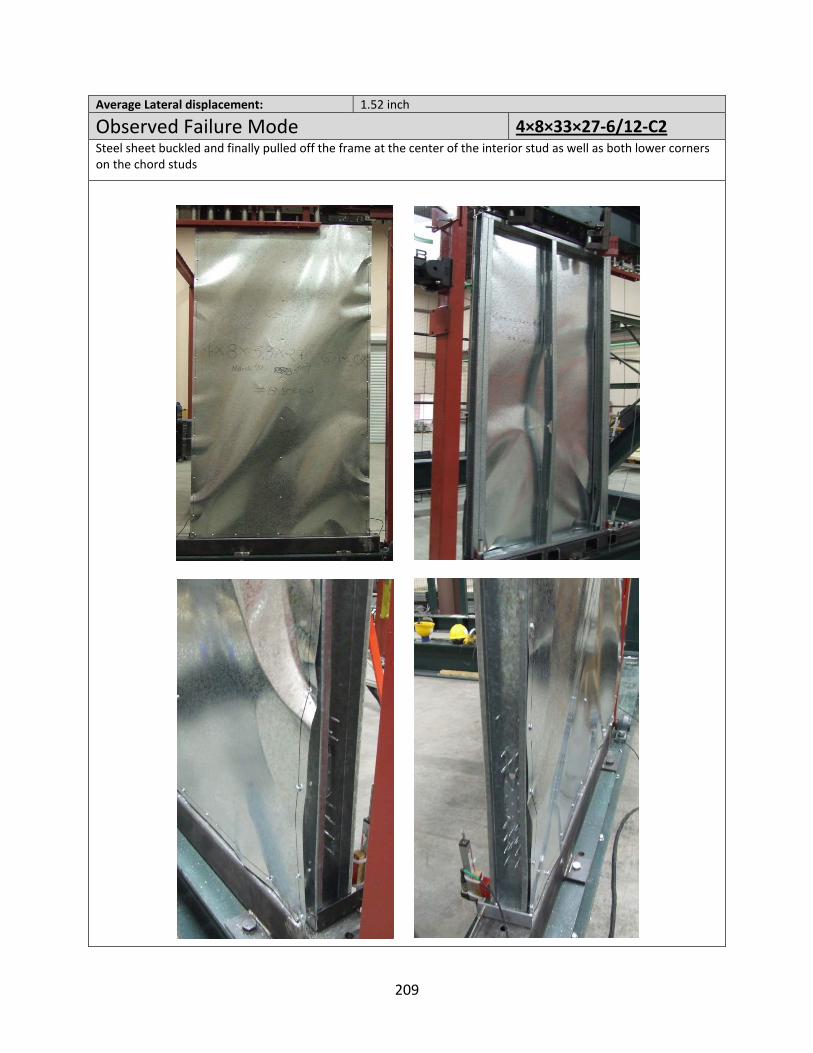
Average Lateral displacement: 1.52 inch
Observed Failure Mode 4×8×33×27‐6/12‐C2Steel sheet buckled and finally pulled off the frame at the center of the interior stud as well as both lower corners on the chord studs
209
Test Lab
SpecimTest Date: Wall dimeStuds: Tracks: Steel shea
Fastener:
Test proto
Load V
Test reMaximumLateral disMaximumLateral dis
bel: 4×8×3
men Confi
nsions:
thing:
ocol:
Vs Displac
esults +load: splacement at ‐load: splacement at
33×27‐4/1
iguration
cement Cu
max +load:
max ‐load:
2‐C1
Mar4 ft.3503500.02#8x4 inCycl
urve
+70+1.2‐743‐1.1
rch 21, 2007. × 8 ft.S162‐33, 24 inT150‐3327 inch thick St18‐½ ” Modifiech off center olic CUREE
7.64 plf23 inch3.88 plf19 inch
nch off center
teel Sheeted Truss head son the perimet
self drilling scrter, 12 inch off
ew, center on the field
210
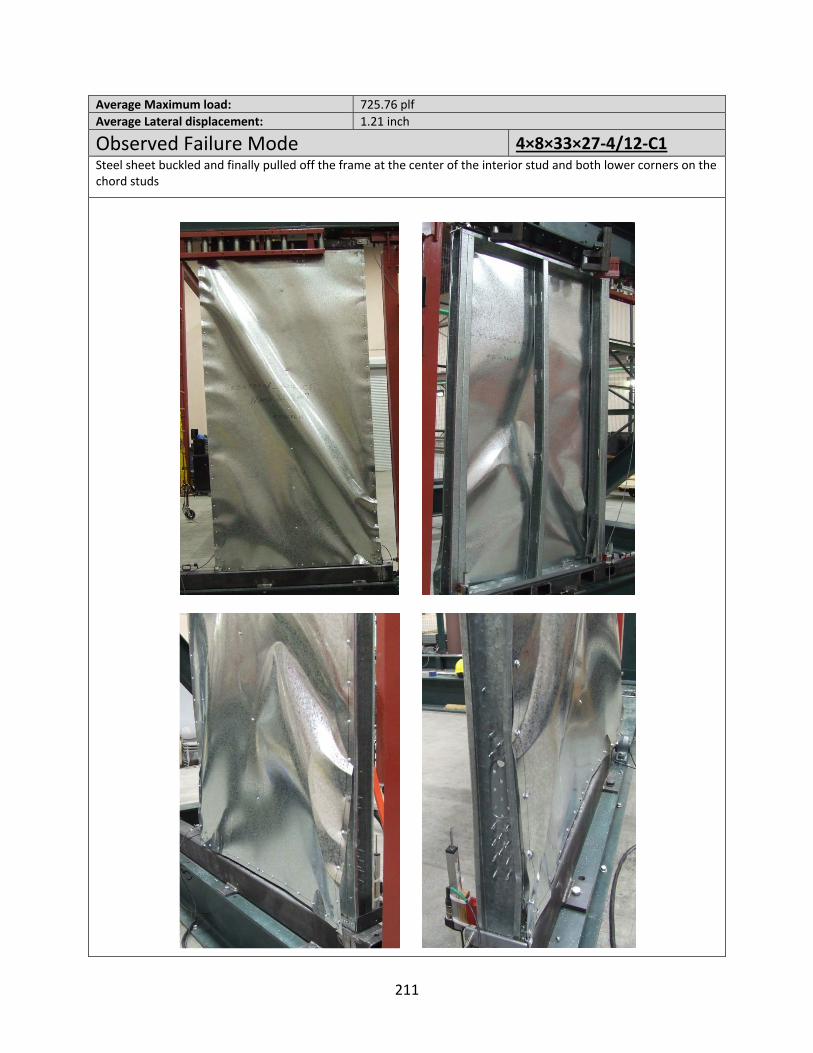
Average Maximum load: 725.76 plfAverage Lateral displacement: 1.21 inch
Observed Failure Mode 4×8×33×27‐4/12‐C1Steel sheet buckled and finally pulled off the frame at the center of the interior stud and both lower corners on the chord studs
211
Test Lab
SpecimTest Date: Wall dimeStuds: Tracks: Steel shea
Fastener:
Test proto
Load V
Test reMaximumLateral disMaximumLateral disAverage MAverage La
bel: 4×8×3
men Confi
nsions:
thing:
ocol:
Vs Displac
esults +load: splacement at ‐load: splacement at Maximum loadateral displace
33×27‐4/1
iguration
cement Cu
max +load:
max ‐load: : ement:
2‐C2
Mar4 ft.3503500.02#8x4 inCycl
urve
+69+1.2‐694‐1.26931.21
rch 21, 2007. × 8 ft.S162‐33, 24 inT150‐3327 inch thick St18‐½ ” Modifiech off center olic CUREE
3.82 plf2 inch4.06 plf22 inch.94 plf1 inch
nch off center
teel Sheeted Truss head son the perimet
self drilling scrter, 12 inch off
ew, center on the field
212

Observed Failure Mode 4×8×33×27‐4/12‐C2Steel sheet buckled and finally pulled off the frame at the center of the interior stud and the lower corner of the wall at the unloaded side; both chord studs buckled on the flange at the bottom area
213

Test Lab
SpecimTest Date: Wall dimeStuds: Tracks: Steel shea
Fastener:
Test proto
Load V
Test reMaximumLateral disMaximumLateral disAverage MAverage La
bel: 4×8×3
men Confi
nsions:
thing:
ocol:
Vs Displac
esults +load: splacement at ‐load: splacement at Maximum loadateral displace
33×27‐2/1
iguration
cement Cu
max +load:
max ‐load: : ement:
2‐C1
Mar4 ft.3503500.02#8x2 inCycl
urve
+83+1.7‐772‐1.68021.69
rch 21, 2007. × 8 ft.S162‐33, 24 inT150‐3327 inch thick St18‐½ ” Modifiech off center olic CUREE
1.61 plf72 inch2.73 plf67 inch.17 plf9 inch
nch off center
teel Sheeted Truss head son the perimet
self drilling scrter, 12 inch off
ew, center on the field
214
ObservSteel sheetthe outer f
ved Failurt buckled and fflange at the to
re Mode finally pulled oop portion
off the frame at the center of
4×f the interior st
×8×33×27‐2tud; both chor
2/12‐C1d studs buckle
ed on
215
Test Lab
SpecimTest Date: Wall dimeStuds: Tracks: Steel shea
Fastener:
Test proto
Load V
Test reMaximumLateral disMaximumLateral disAverage MAverage La
bel: 4×8×3
men Confi
nsions:
thing:
ocol:
Vs Displac
esults +load: splacement at ‐load: splacement at Maximum loadateral displace
33×27‐2/1
iguration
cement Cu
max +load:
max ‐load: : ement:
2‐C2
Mar4 ft.3503500.02#8x2 inCycl
urve
+91+2.0‐861‐1.68871.86
rch 21, 2007. × 8 ft.S162‐33, 24 inT150‐3327 inch thick St18‐½ ” Modifiech off center olic CUREE
3.37 plf06 inch1.62 plf66 inch.49 plf6 inch
nch off center
teel Sheeted Truss head son the perimet
self drilling scrter, 12 inch off
ew, center on the
field
216

Observed Failure Mode 4×8×33×27‐2/12‐C2Steel sheet buckled and finally pulled off the frame at the center of the interior stud; the flange of the outer stud on the loaded side significantly distorted, the stud on the other side showed slight distortion
217
Test Lab
SpecimTest Date: Wall dimeStuds: Tracks: Steel shea
Fastener:
Test proto
Load V
Test reMaximumLateral disMaximumLateral disAverage MAverage La
bel: 2×8×4
men Confi
nsions:
thing:
ocol:
Vs Displac
esults +load: splacement at ‐load: splacement at Maximum loadateral displace
43×33‐6‐C1
iguration
cement Cu
max +load:
max ‐load: : ement:
1
Mar2 ft.3503500.03#8x6 inCycl
urve
+11+2.8‐115‐3.11132.97
rch 27, 2007. × 8 ft.S162‐43, 24 inT150‐4333 inch thick St18‐½ ” Modifiech off center olic CUREE
04.34 plf85 inch59.48 plf10 inch1.91 plf7 inch
nch off center
teel Sheeted Truss head son the perimet
self drilling scrter
ew,
218
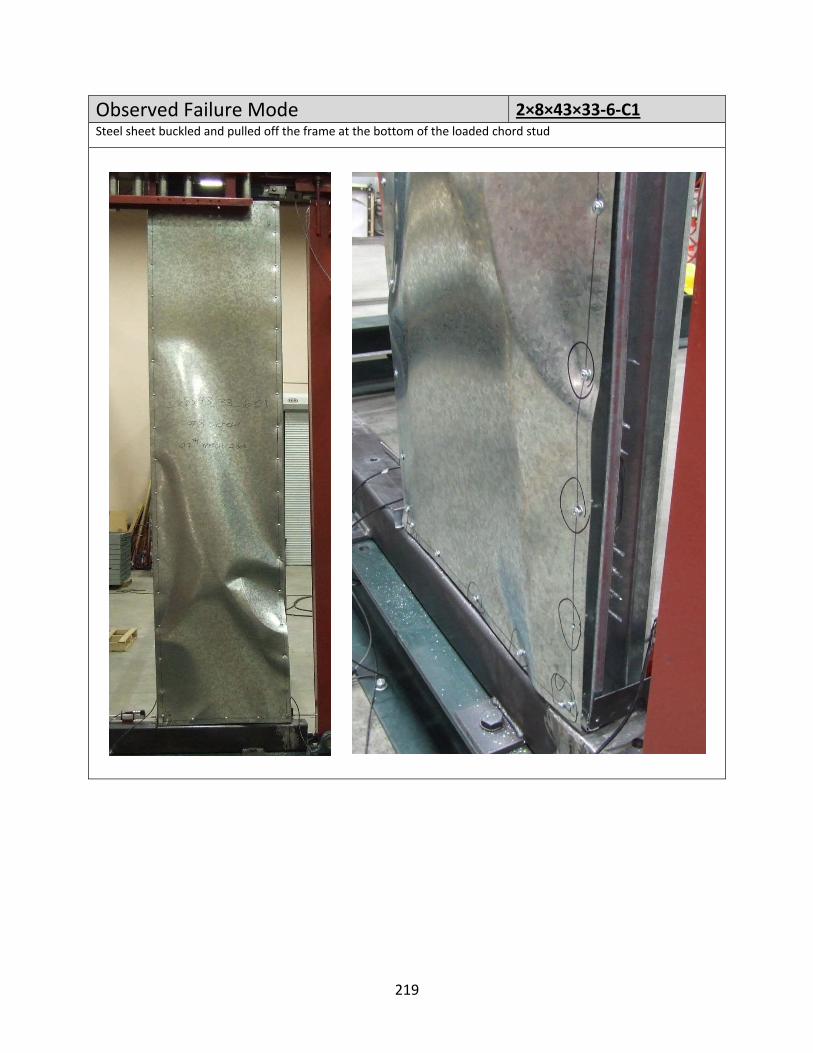
Observed Failure Mode 2×8×43×33‐6‐C1 Steel sheet buckled and pulled off the frame at the bottom of the loaded chord stud
219

Test Lab
SpecimTest Date: Wall dimeStuds: Tracks: Steel shea
Fastener:
Test proto
Load V
Test reMaximumLateral disMaximumLateral disAverage MAverage La
bel: 2×8×4
men Confi
nsions:
thing:
ocol:
Vs Displac
esults +load: splacement at ‐load: splacement at Maximum loadateral displace
43×33‐6‐C2
iguration
cement Cu
max +load:
max ‐load: : ement:
2
Mar2 ft.3503500.03#8x6 inCycl
urve
+11+2.9‐108‐3.21133.1
rch 27, 2007. × 8 ft.S162‐43, 24 inT150‐4333 inch thick St18‐½ ” Modifiech off center olic CUREE
89.31 plf95 inch85.52 plf25 inch7.41 plfinch
nch off center
teel Sheeted Truss head son the perimet
self drilling scrter
ew,
220
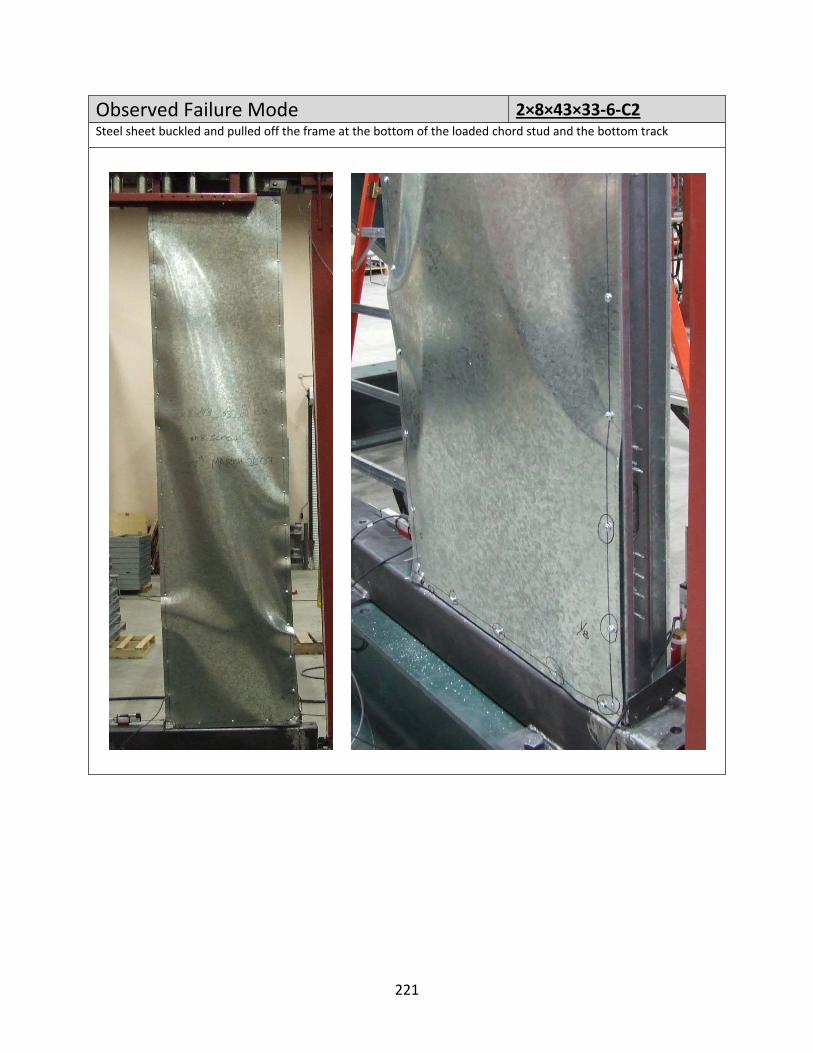
Observed Failure Mode 2×8×43×33‐6‐C2 Steel sheet buckled and pulled off the frame at the bottom of the loaded chord stud and the bottom track
221
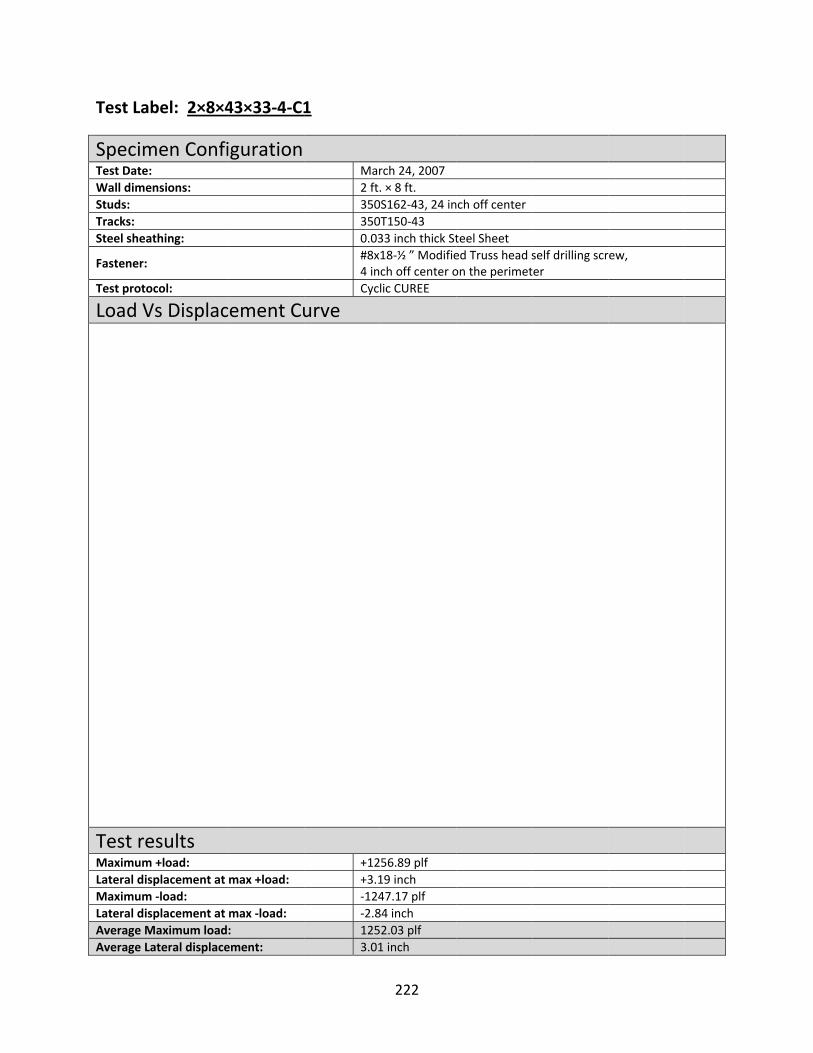
Test Lab
SpecimTest Date: Wall dimeStuds: Tracks: Steel shea
Fastener:
Test proto
Load V
Test reMaximumLateral disMaximumLateral disAverage MAverage La
bel: 2×8×4
men Confi
nsions:
thing:
ocol:
Vs Displac
esults +load: splacement at ‐load: splacement at Maximum loadateral displace
43×33‐4‐C1
iguration
cement Cu
max +load:
max ‐load: : ement:
1
Mar2 ft.3503500.03#8x4 inCycl
urve
+12+3.1‐124‐2.81253.01
rch 24, 2007. × 8 ft.S162‐43, 24 inT150‐4333 inch thick St18‐½ ” Modifiech off center olic CUREE
56.89 plf19 inch47.17 plf84 inch2.03 plf1 inch
nch off center
teel Sheeted Truss head son the perimet
self drilling scrter
ew,
222
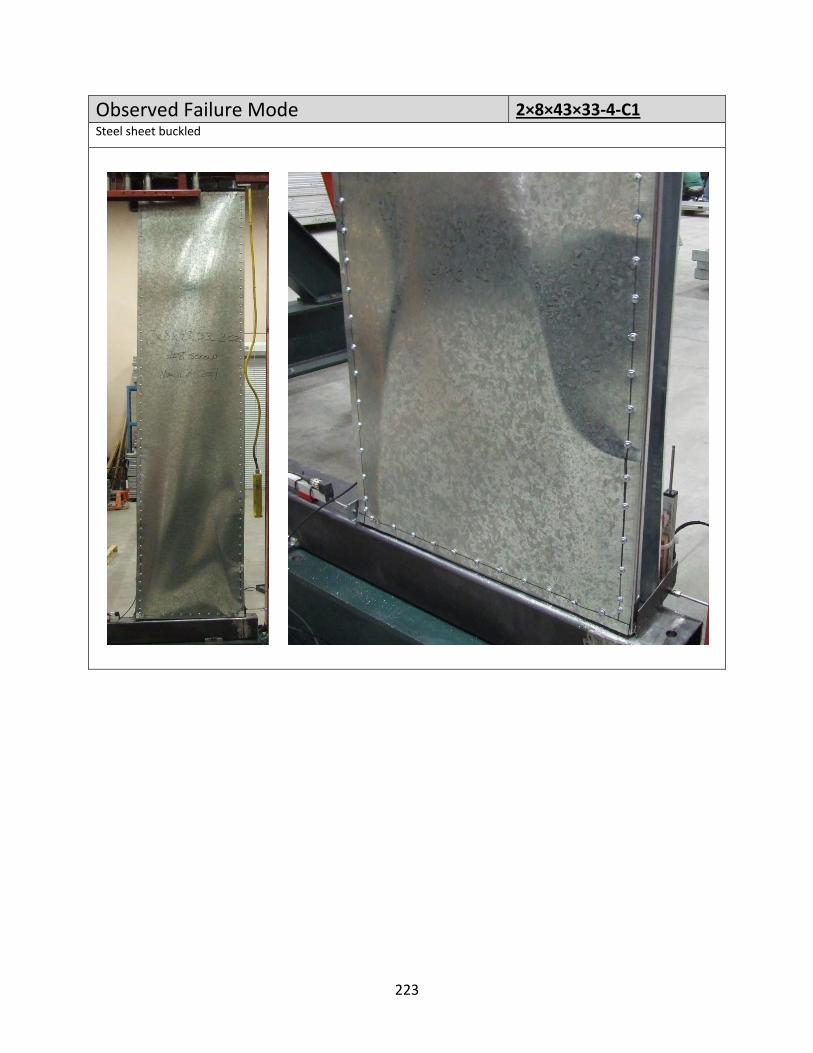
Observed Failure Mode 2×8×43×33‐4‐C1 Steel sheet buckled
223
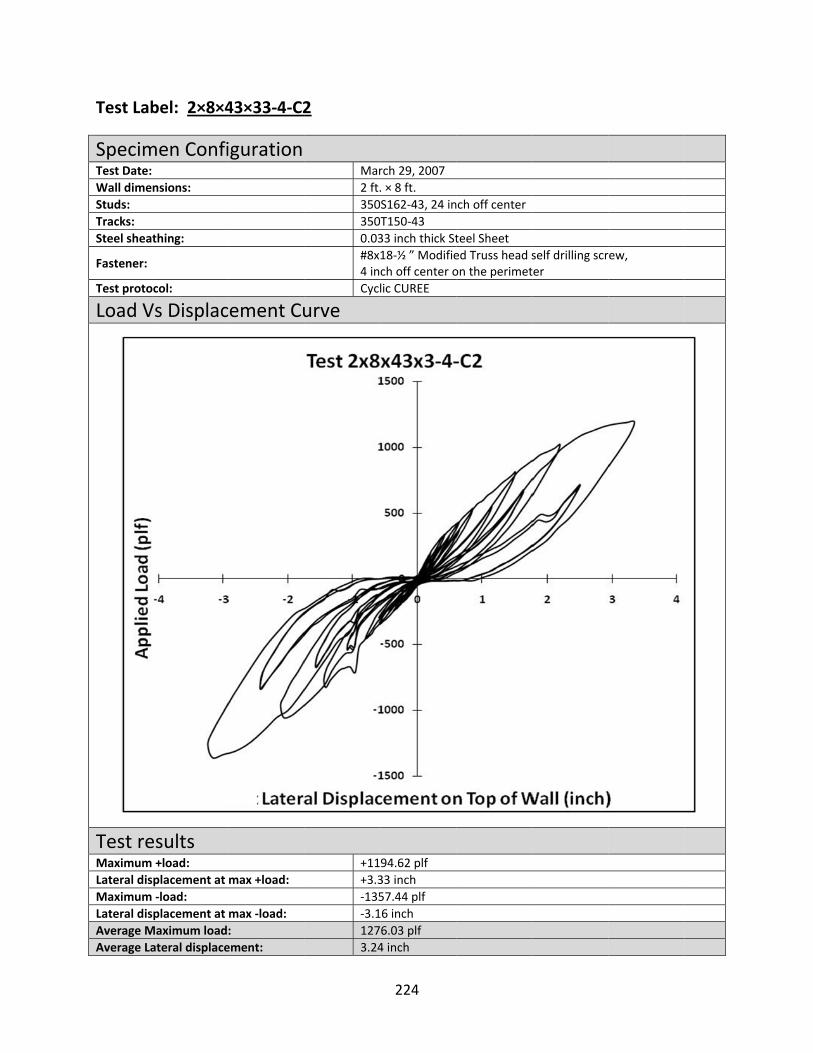
Test Lab
SpecimTest Date: Wall dimeStuds: Tracks: Steel shea
Fastener:
Test proto
Load V
Test reMaximumLateral disMaximumLateral disAverage MAverage La
bel: 2×8×4
men Confi
nsions:
thing:
ocol:
Vs Displac
esults +load: splacement at ‐load: splacement at Maximum loadateral displace
43×33‐4‐C2
iguration
cement Cu
max +load:
max ‐load: : ement:
2
Mar2 ft.3503500.03#8x4 inCycl
urve
+11+3.3‐135‐3.11273.24
rch 29, 2007. × 8 ft.S162‐43, 24 inT150‐4333 inch thick St18‐½ ” Modifiech off center olic CUREE
94.62 plf33 inch57.44 plf16 inch6.03 plf4 inch
nch off center
teel Sheeted Truss head son the perimet
self drilling scrter
ew,
224
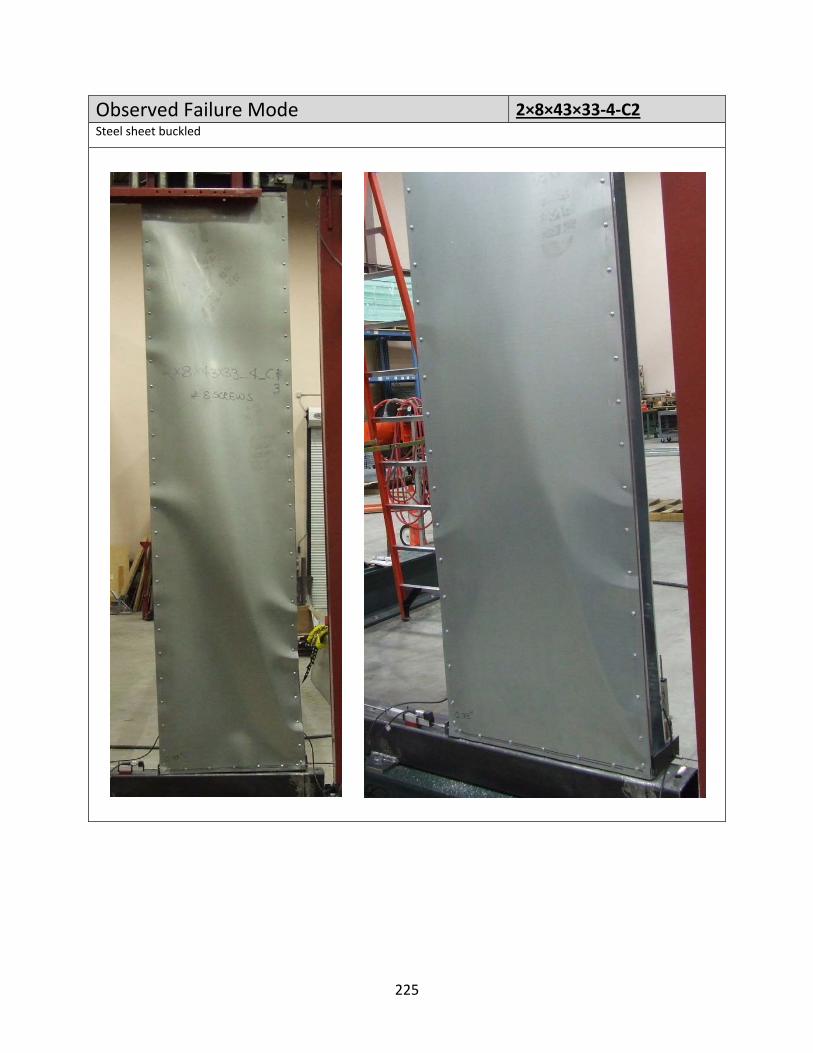
Observed Failure Mode 2×8×43×33‐4‐C2 Steel sheet buckled
225

Test Lab
SpecimTest Date: Wall dimeStuds: Tracks: Steel shea
Fastener:
Test proto
Load V
Test reMaximumLateral disMaximumLateral disAverage MAverage La
bel: 2×8×4
men Confi
nsions:
thing:
ocol:
Vs Displac
esults +load: splacement at ‐load: splacement at Maximum loadateral displace
43×33‐2‐C1
iguration
cement Cu
max +load:
max ‐load: : ement:
1
Mar2 ft.3503500.03#8x2 inCycl
urve
+14+3.0‐145‐3.11423.09
rch 24, 2007. × 8 ft.S162‐43, 24 inT150‐4333 inch thick St18‐½ ” Modifiech off center olic CUREE
07.47 plf08 inch50.00 plf10 inch8.73 plf9 inch
nch off center
teel Sheeted Truss head son the perimet
self drilling scrter
ew,
226
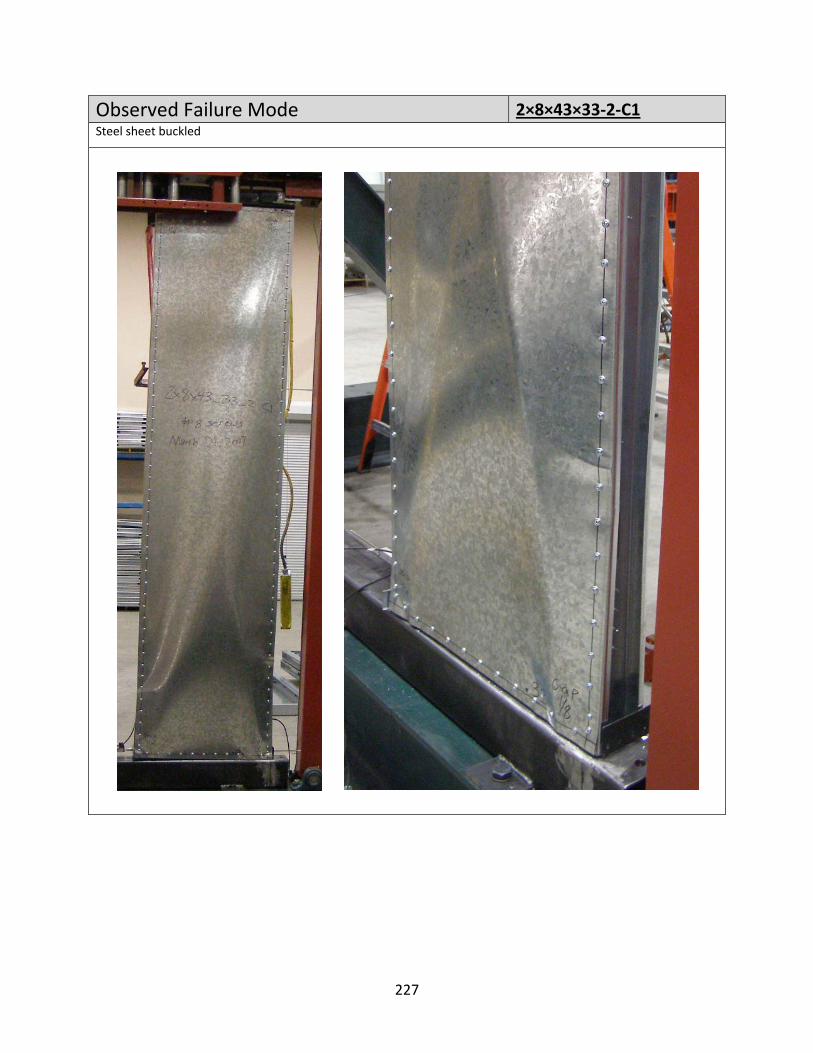
Observed Failure Mode 2×8×43×33‐2‐C1 Steel sheet buckled
227

Test Lab
SpecimTest Date: Wall dimeStuds: Tracks: Steel shea
Fastener:
Test proto
Load V
Test reMaximumLateral disMaximumLateral disAverage MAverage La
bel: 2×8×4
men Confi
nsions:
thing:
ocol:
Vs Displac
esults +load: splacement at ‐load: splacement at Maximum loadateral displace
43×33‐2‐C2
iguration
cement Cu
max +load:
max ‐load: : ement:
2
Mar2 ft.3503500.03#8x2 inCycl
urve
+13+3.1‐123‐2.71292.98
rch 24, 2007. × 8 ft.S162‐43, 24 inT150‐4333 inch thick St18‐½ ” Modifiech off center olic CUREE
54.74 plf18 inch30.13 plf74 inch2.43 plf8 inch
nch off center
teel Sheeted Truss head son the perimet
self drilling scrter
ew,
228
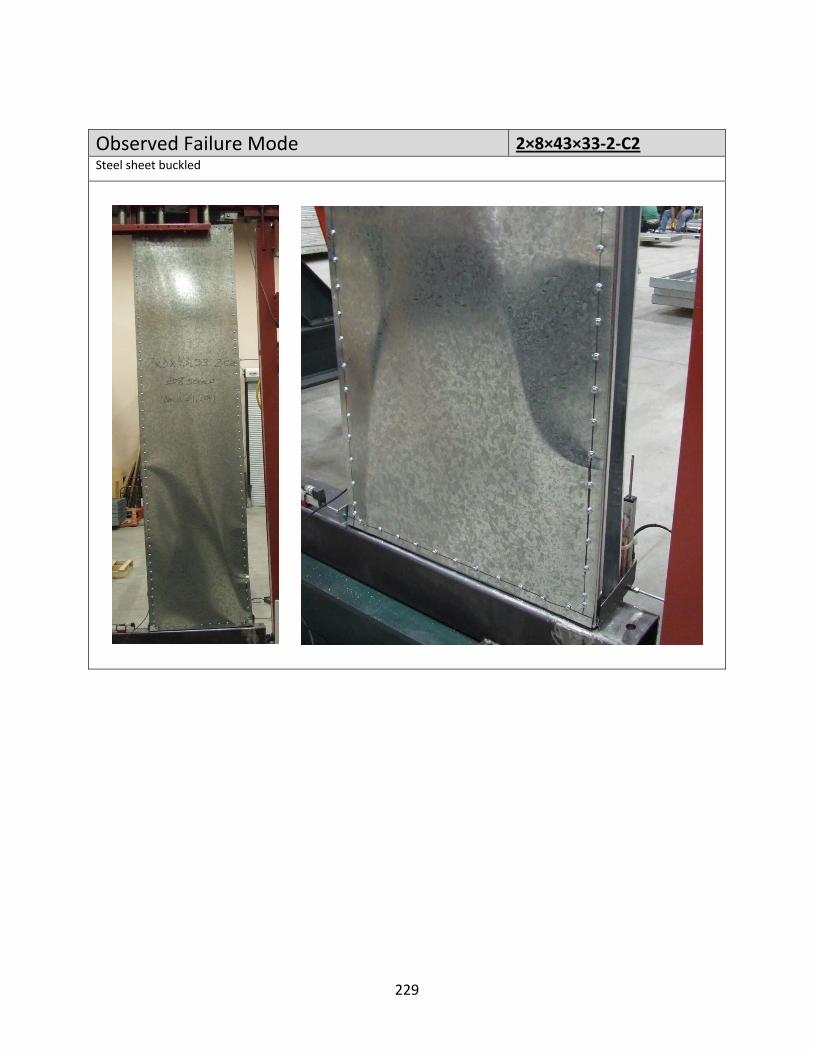
Observed Failure Mode 2×8×43×33‐2‐C2 Steel sheet buckled
229

Test Lab
SpecimTest Date: Wall dimeStuds: Tracks: Steel shea
Fastener:
Test proto
Load V
Test reMaximumLateral disMaximumLateral disAverage MAverage La
bel: 2×8×4
men Confi
nsions:
thing:
ocol:
Vs Displac
esults +load: splacement at ‐load: splacement at Maximum loadateral displace
43×30‐6‐C1
iguration
cement Cu
max +load:
max ‐load: : ement:
1
Mar2 ft.3503500.03#8x6 inCycl
urve
+94+3.1‐889‐2.89152.99
rch 29, 2007. × 8 ft.S162‐43, 24 inT150‐4330 inch thick St18‐½ ” Modifiech off center olic CUREE
2.26 plf15 inch9.10 plf84 inch.68 plf9 inch
nch off center
teel Sheeted Truss head son the perimet
self drilling scrter
ew,
230

Observed Failure Mode 2×8×43×30‐6‐C1 Steel sheet buckled and finally pulled off the frame at the center of the interior stud; the flange of the outer stud on the loaded side significantly distorted, the stud on the other side showed slight distortion
231
Test Lab
SpecimTest Date: Wall dimeStuds: Tracks: Steel shea
Fastener:
Test proto
Load V
Test reMaximumLateral disMaximumLateral disAverage MAverage La
bel: 2×8×4
men Confi
nsions:
thing:
ocol:
Vs Displac
esults +load: splacement at ‐load: splacement at Maximum loadateral displace
43×30‐6‐C2
iguration
cement Cu
max +load:
max ‐load: : ement:
2
Mar2 ft.3503500.03#8x6 inCycl
urve
+96+3.3‐891‐3.19303.25
rch 29, 2007. × 8 ft.S162‐43, 24 inT150‐4330 inch thick St18‐½ ” Modifiech off center olic CUREE
9.74 plf33 inch1.34 plf17 inch.54 plf5 inch
nch off center
teel Sheeted Truss head son the perimet
self drilling scrter
ew,
232

Observed Failure Mode 2×8×43×30‐6‐C2 Steel sheet buckled; two screws at the bottom of the unloaded stud pulled out
233

Test Lab
SpecimTest Date: Wall dimeStuds: Tracks: Steel shea
Fastener:
Test proto
Load V
Test reMaximumLateral disMaximumLateral disAverage MAverage La
bel: 2×8×4
men Confi
nsions:
thing:
ocol:
Vs Displac
esults +load: splacement at ‐load: splacement at Maximum loadateral displace
43×30‐4‐C1
iguration
cement Cu
max +load:
max ‐load: : ement:
1
Mar2 ft.3503500.03#8x4 inCycl
urve
+10+3.3‐106‐3.11053.21
rch 28, 2007. × 8 ft.S162‐43, 24 inT150‐4330 inch thick St18‐½ ” Modifiech off center olic CUREE
46.17 plf30 inch64.62 plf12 inch5.39 plf1 inch
nch off center
teel Sheeted Truss head son the perimet
self drilling scrter
ew,
234
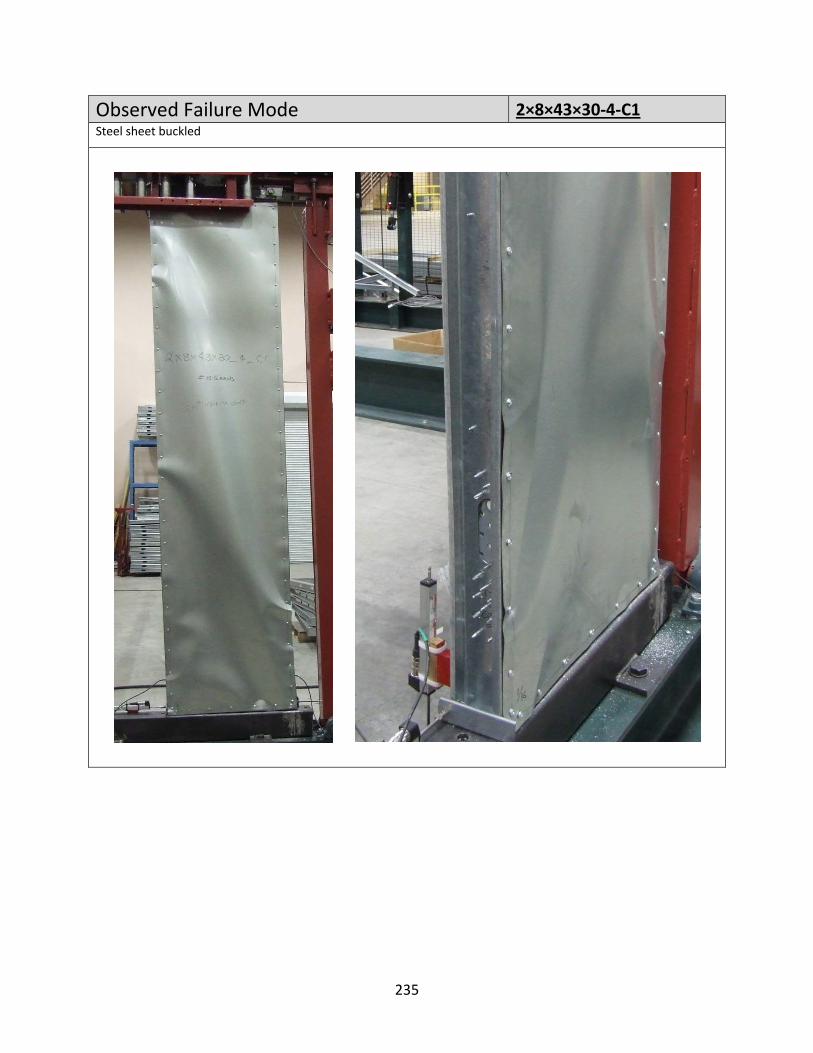
Observed Failure Mode 2×8×43×30‐4‐C1 Steel sheet buckled
235

Test Lab
SpecimTest Date: Wall dimeStuds: Tracks: Steel shea
Fastener:
Test proto
Load V
Test reMaximumLateral disMaximumLateral disAverage MAverage La
bel: 2×8×4
men Confi
nsions:
thing:
ocol:
Vs Displac
esults +load: splacement at ‐load: splacement at Maximum loadateral displace
43×30‐4‐C2
iguration
cement Cu
max +load:
max ‐load: : ement:
2
Mar2 ft.3503500.03#8x4 inCycl
urve
+11+3.1‐983‐3.11053.17
rch 28, 2007. × 8 ft.S162‐43, 24 inT150‐4330 inch thick St18‐½ ” Modifiech off center olic CUREE
18.73 plf18 inch3.25 plf17 inch0.99 plf7 inch
nch off center
teel Sheeted Truss head son the perimet
self drilling scrter
ew,
236
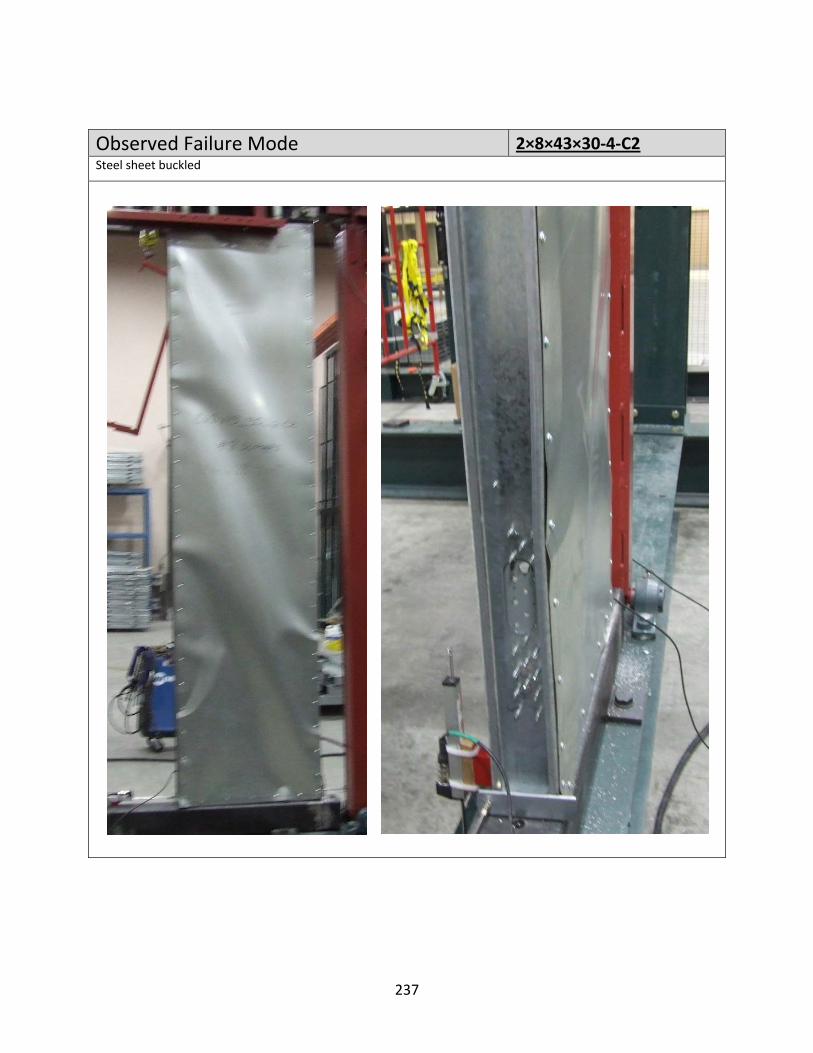
Observed Failure Mode 2×8×43×30‐4‐C2 Steel sheet buckled
237

Test Lab
SpecimTest Date: Wall dimeStuds: Tracks: Steel shea
Fastener:
Test proto
Load V
Test reMaximumLateral disMaximumLateral disAverage MAverage La
bel: 2×8×4
men Confi
nsions:
thing:
ocol:
Vs Displac
esults +load: splacement at ‐load: splacement at Maximum loadateral displace
43×30‐2‐C1
iguration
cement Cu
max +load:
max ‐load: : ement:
1
Mar2 ft.3503500.03#8x2 inCycl
urve
+11+3.3‐119‐2.81193.08
rch 27, 2007. × 8 ft.S162‐43, 24 inT150‐4330 inch thick St18‐½ ” Modifiech off center olic CUREE
95.29 plf33 inch99.77 plf84 inch7.53 plf8 inch
nch off center
teel Sheeted Truss head son the perimet
self drilling scrter
ew,
238

Observed Failure Mode 2×8×43×30‐2‐C1 Steel sheet buckled
239

Test Lab
SpecimTest Date: Wall dimeStuds: Tracks: Steel shea
Fastener:
Test proto
Load V
Test reMaximumLateral disMaximumLateral disAverage MAverage La
bel: 2×8×4
men Confi
nsions:
thing:
ocol:
Vs Displac
esults +load: splacement at ‐load: splacement at Maximum loadateral displace
43×30‐2‐C2
iguration
cement Cu
max +load:
max ‐load: : ement:
2
Mar2 ft.3503500.03#8x2 inCycl
urve
+11+3.0‐124‐2.81202.95
rch 27, 2007. × 8 ft.S162‐43, 24 inT150‐4330 inch thick St18‐½ ” Modifiech off center olic CUREE
70.45 plf06 inch46.41 plf85 inch8.43 plf5 inch
nch off center
teel Sheeted Truss head son the perimet
self drilling scrter
ew,
240
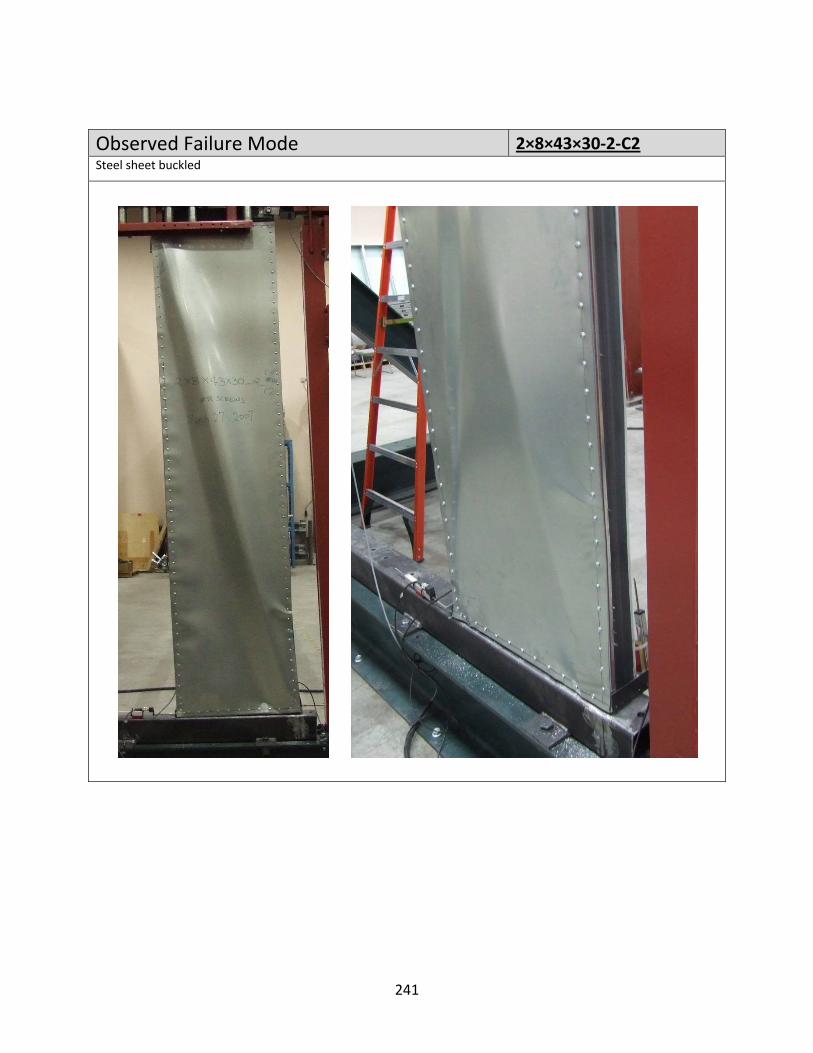
Observed Failure Mode 2×8×43×30‐2‐C2 Steel sheet buckled
241

242
APPENDIX C
ADDITIONAL TESTS OF SHEAR WALLS
Test Lab
SpecimTest Date: Wall dimeStuds: Tracks: Steel shea
Fastener:
Test proto
Load V
Test reMaximumLateral disMaximumLateral disAverage MAverage La
bel: A‐1
men Confi
nsions:
thing:
ocol:
Vs Displac
esults +load: splacement at ‐load: splacement at Maximum loadateral displace
iguration
cement Cu
max +load:
max ‐load: : ement:
Feb4 ft.3503500.03#106 inCycl
urve
+89+2.0‐868‐1.98831.99
ruary 20, 2007. × 8 ft.S162‐43, 24 inT150‐4330 inch thick Stx18‐1” Modifiech off center olic CUREE
8.17 plf02 inch8.01 plf97 inch.09 plf9 inch
7
nch off center
teel Sheeted Truss head on the perimet
self drilling scrter, 12 inch off
rew, center on the field
243

Observed Failure Mode A‐1Steel sheet buckled and pulled off the frame at the center of the interior stud and at both bottom corners
244
Test Lab
SpecimTest Date: Wall dimeStuds: Tracks: Steel shea
Fastener:
Test proto
Load V
Test reMaximum Lateral dis
bel: A‐2
men Confi
nsions:
thing:
ocol:
Vs Displac
esults load: placement at t
iguration
cement Cu
top of wall:
March 4 ft. 3¼350S16350T150.030 in#8x18‐½2 inch oScrews Monoto
urve
1091.422.40 inc
2, 2007¼ in. × 8 ft.62‐43, 24 inch o50‐43nch thick Steel½ ” Modified Toff center on thon inner flangonic
2 plfch
off center
SheetTruss head self he perimeter,1ges
drilling screw,12 inch off cen
, ter in the field,
245

Observed Failure Mode A‐2 Steel sheet buckled and finally pulled off the frame at the center of the interior stud
246
Test Lab
SpecimTest Date: Wall dimeStuds: Tracks: Steel shea
Fastener:
Test proto
Load V
Test reMaximumLateral disMaximumLateral disAverage MAverage La
bel: A‐3
men Confi
nsions:
thing:
ocol:
Vs Displac
esults +load: splacement at ‐load: splacement at Maximum loadateral displace
iguration
cement Cu
max +load:
max ‐load: : ement:
Mar4 ft.3503500.03#8x2 inScreCycl
urve
+11+1.5‐113‐1.31151.46
rch 9, 2007. 3¼ in. × 8 ft.S162‐43, 24 inT150‐4330 inch thick St18‐1” Modifiedch off center oews on inner fllic CUREE
79.21 plf59 inch36.81 plf33 inch8.00 plf6 inch
nch off center
teel Sheetd Truss head seon the perimetanges
elf drilling screter, 12 inch off
ew, center on the field,
247
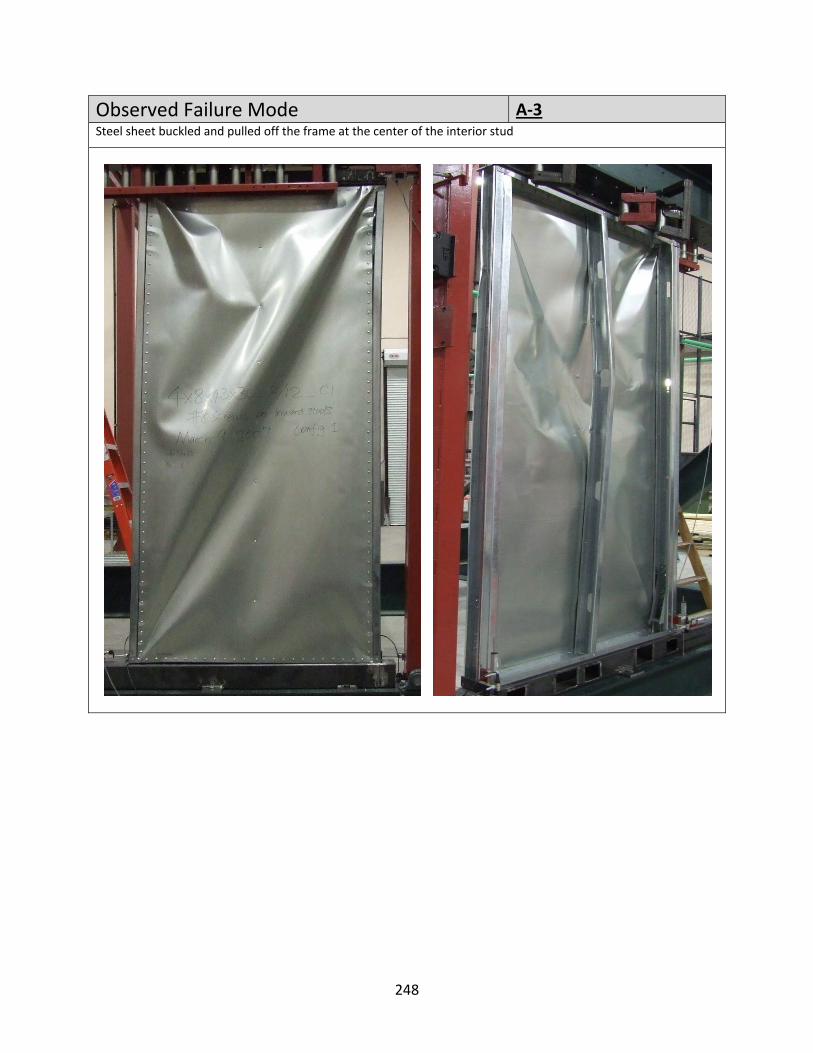
Observed Failure Mode A‐3Steel sheet buckled and pulled off the frame at the center of the interior stud
248
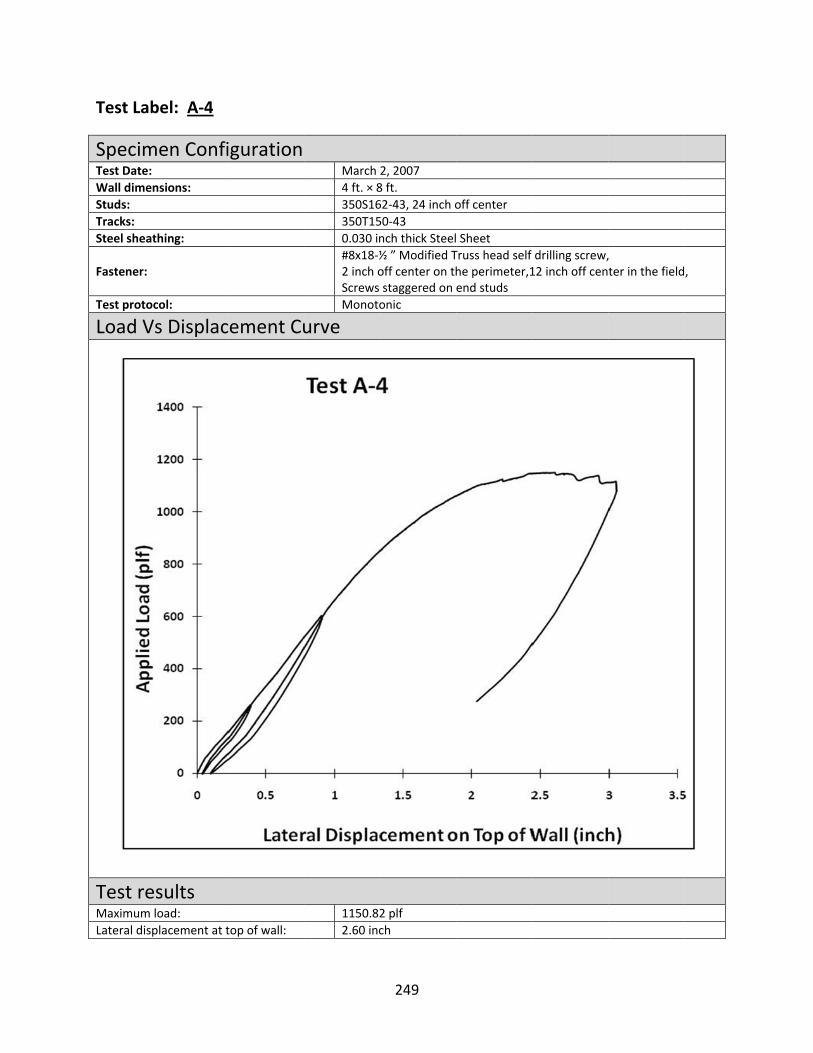
Test Lab
SpecimTest Date: Wall dimeStuds: Tracks: Steel shea
Fastener:
Test proto
Load V
Test reMaximum Lateral dis
bel: A‐4
men Confi
nsions:
thing:
ocol:
Vs Displac
esults load: placement at t
iguration
cement Cu
top of wall:
March 4 ft. × 8350S16350T150.030 in#8x18‐½2 inch oScrews Monoto
urve
1150.822.60 inc
2, 20078 ft.62‐43, 24 inch o50‐43nch thick Steel½ ” Modified Toff center on thstaggered on onic
2 plfch
off center
SheetTruss head self he perimeter,1end studs
drilling screw,12 inch off cen
, ter in the field,
249
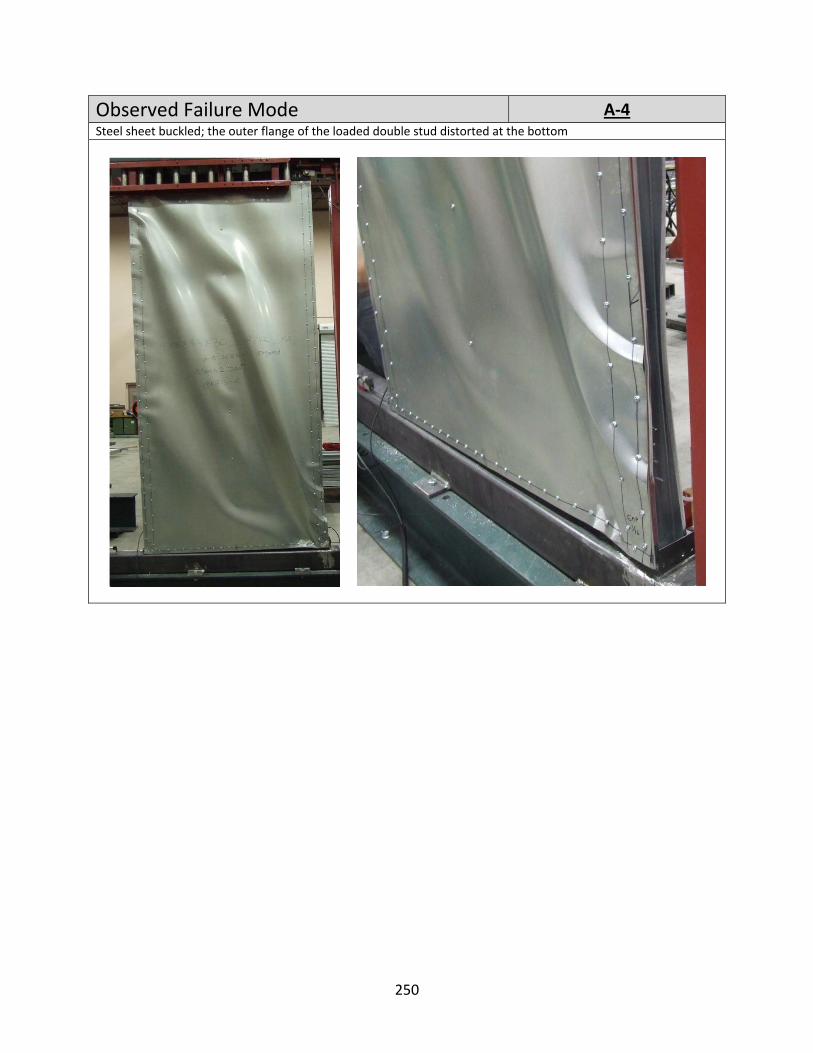
Observed Failure Mode A‐4 Steel sheet buckled; the outer flange of the loaded double stud distorted at the bottom
250
Test Lab
SpecimTest Date: Wall dimeStuds: Tracks: Steel shea
Fastener:
Test proto
Load V
Test reMaximumLateral disMaximumLateral disAverage MAverage La
bel: A‐5
men Confi
nsions:
thing:
ocol:
Vs Displac
esults +load: splacement at ‐load: splacement at Maximum loadateral displace
iguration
cement Cu
max +load:
max ‐load: : ement:
Mar4 ft.350S350T0.03#8x12 incScreCycl
urve
+116+1.9‐113‐2.011481.98
rch 9, 2007 × 8 ft.S162‐43, 24 incT150‐c4330 inch thick St18‐1” Modifiedch off center oews staggered ic CUREE
64.28 plf93 inch32.91 plf3 inch8.59 plf8 inch
ch off center
teel Sheetd Truss head seon the perimeteon end stud
elf drilling screer, 12 inch off
w, center on the field,
251

Observed Failure Mode A‐5Steel sheet buckled and pulled off the frame at the center of the interior stud, outer flange of one double stud distorted
252

253
APPENDIX D
INELASTIC ANALYSIS OF WEB CRIPPLING OF C‐JOIST IN ABAQUS
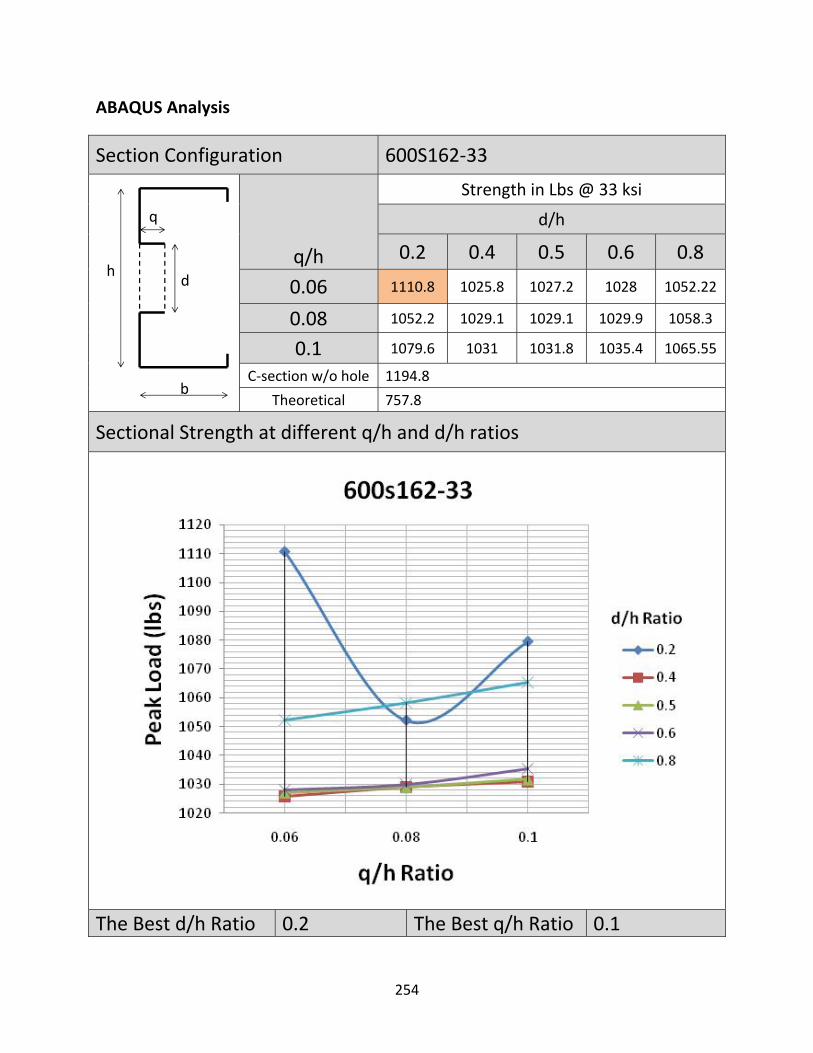
ABAQUS Analysis
Section Configuration 600S162‐33
q/h
Strength in Lbs @ 33 ksi
d/h
0.2 0.4 0.5 0.6 0.8
0.06 1110.8 1025.8 1027.2 1028 1052.22
0.08 1052.2 1029.1 1029.1 1029.9 1058.3
0.1 1079.6 1031 1031.8 1035.4 1065.55
C‐section w/o hole 1194.8
Theoretical 757.8
Sectional Strength at different q/h and d/h ratios
The Best d/h Ratio 0.2 The Best q/h Ratio 0.1
d
b
q
h
254
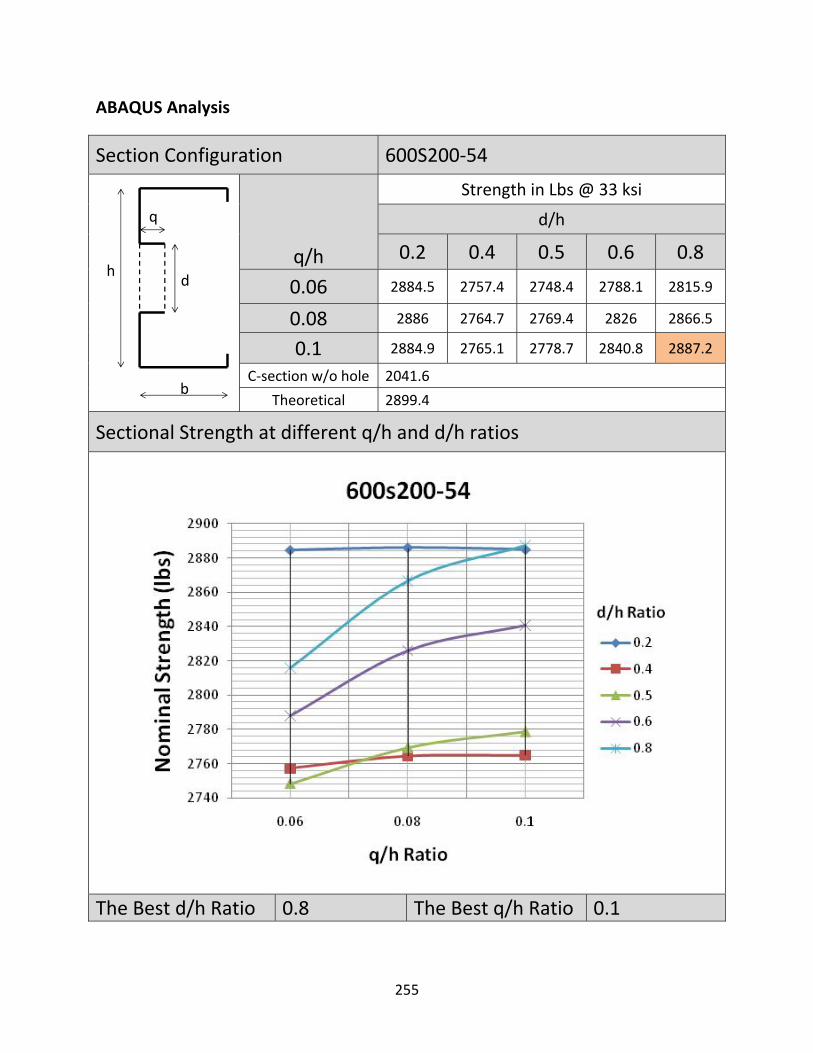
ABAQUS Analysis
Section Configuration 600S200‐54
q/h
Strength in Lbs @ 33 ksi
d/h
0.2 0.4 0.5 0.6 0.8
0.06 2884.5 2757.4 2748.4 2788.1 2815.9
0.08 2886 2764.7 2769.4 2826 2866.5
0.1 2884.9 2765.1 2778.7 2840.8 2887.2
C‐section w/o hole 2041.6
Theoretical 2899.4
Sectional Strength at different q/h and d/h ratios
The Best d/h Ratio 0.8 The Best q/h Ratio 0.1
d
b
q
h
255

ABAQUS Analysis
Section Configuration 600S250‐97
q/h
Strength in Lbs @ 50 ksi
d/h
0.2 0.4 0.5 0.6 0.8
0.06 9487.5 9041.3 8728.9 8566.2 8513.9
0.08 9499.7 9158.7 9218.2 9319.6 9579.6
0.1 9506.9 9190.3 9280.5 9424.3 9781.9
C‐section w/o hole 8858.5
Theoretical 9490.8
Sectional Strength at different q/h and d/h ratios
The Best d/h Ratio 0.8 The Best q/h Ratio 0.1
d
b
q
h
256

ABAQUS Analysis
Section Configuration 800S162‐33
q/h
Strength in Lbs @ 33 ksi
d/h
0.2 0.4 0.5 0.6 0.8
0.06 1301.4 1036.5 1057.7 1113 1242.1
0.08 1305.8 1033.3 1021.4 1073 1085.2
0.1 1295.8 1037.5 1021.8 1077.1 1112.4
C‐section w/o hole 739.9
Theoretical 1091.8
Sectional Strength at different q/h and d/h ratios
The Best d/h Ratio 0.2 The Best q/h Ratio 0.08
d
b
q
h
257
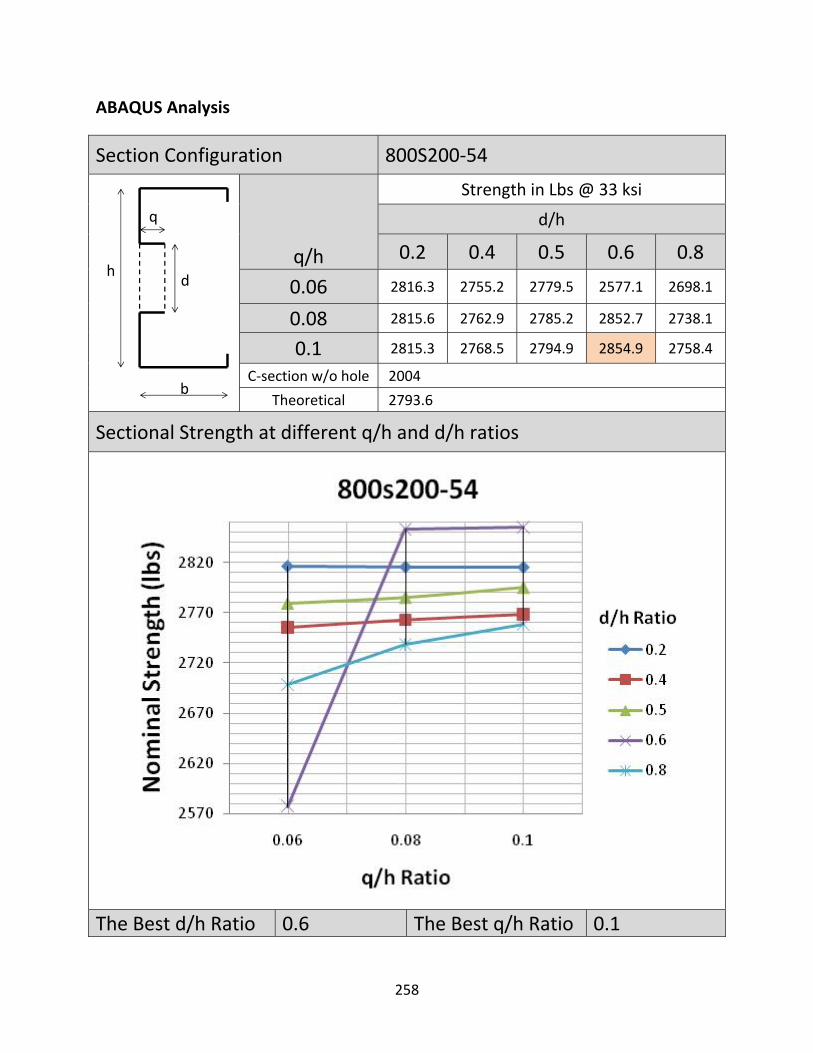
ABAQUS Analysis
Section Configuration 800S200‐54
q/h
Strength in Lbs @ 33 ksi
d/h
0.2 0.4 0.5 0.6 0.8
0.06 2816.3 2755.2 2779.5 2577.1 2698.1
0.08 2815.6 2762.9 2785.2 2852.7 2738.1
0.1 2815.3 2768.5 2794.9 2854.9 2758.4
C‐section w/o hole 2004
Theoretical 2793.6
Sectional Strength at different q/h and d/h ratios
The Best d/h Ratio 0.6 The Best q/h Ratio 0.1
d
b
q
h
258
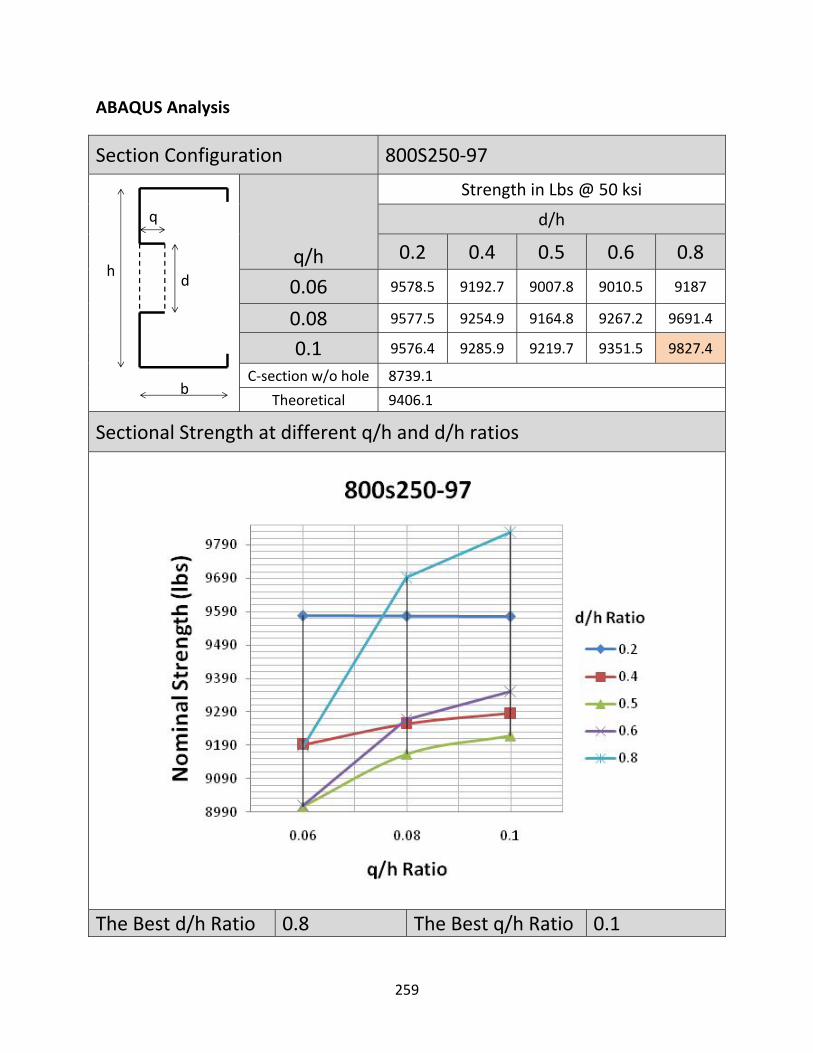
ABAQUS Analysis
Section Configuration 800S250‐97
q/h
Strength in Lbs @ 50 ksi
d/h
0.2 0.4 0.5 0.6 0.8
0.06 9578.5 9192.7 9007.8 9010.5 9187
0.08 9577.5 9254.9 9164.8 9267.2 9691.4
0.1 9576.4 9285.9 9219.7 9351.5 9827.4
C‐section w/o hole 8739.1
Theoretical 9406.1
Sectional Strength at different q/h and d/h ratios
The Best d/h Ratio 0.8 The Best q/h Ratio 0.1
d
b
q
h
259
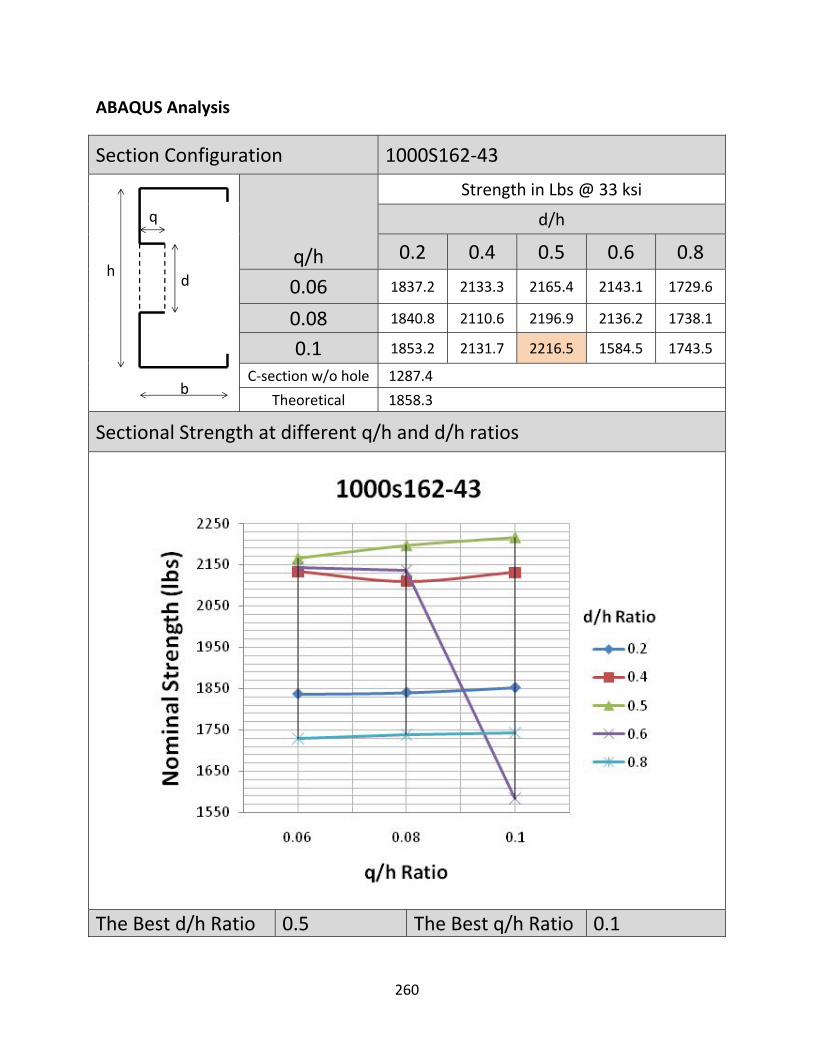
ABAQUS Analysis
Section Configuration 1000S162‐43
q/h
Strength in Lbs @ 33 ksi
d/h
0.2 0.4 0.5 0.6 0.8
0.06 1837.2 2133.3 2165.4 2143.1 1729.6
0.08 1840.8 2110.6 2196.9 2136.2 1738.1
0.1 1853.2 2131.7 2216.5 1584.5 1743.5
C‐section w/o hole 1287.4
Theoretical 1858.3
Sectional Strength at different q/h and d/h ratios
The Best d/h Ratio 0.5 The Best q/h Ratio 0.1
d
b
q
h
260
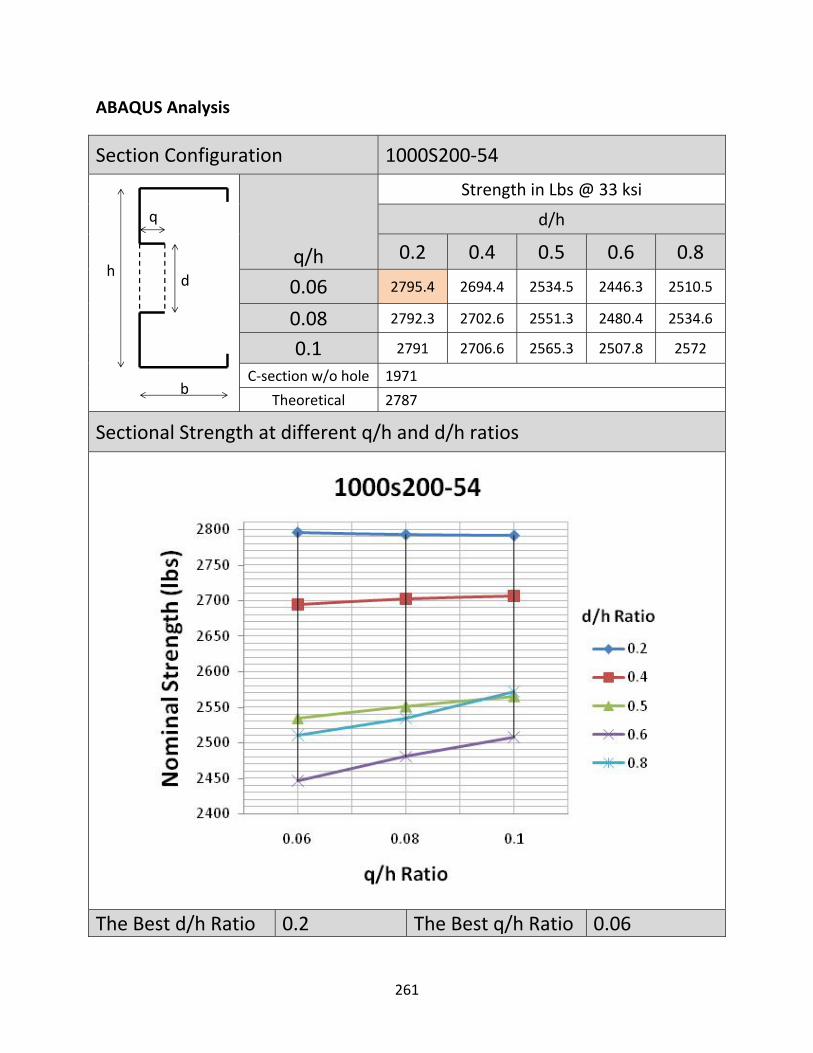
ABAQUS Analysis
Section Configuration 1000S200‐54
q/h
Strength in Lbs @ 33 ksi
d/h
0.2 0.4 0.5 0.6 0.8
0.06 2795.4 2694.4 2534.5 2446.3 2510.5
0.08 2792.3 2702.6 2551.3 2480.4 2534.6
0.1 2791 2706.6 2565.3 2507.8 2572
C‐section w/o hole 1971
Theoretical 2787
Sectional Strength at different q/h and d/h ratios
The Best d/h Ratio 0.2 The Best q/h Ratio 0.06
d
b
q
h
261
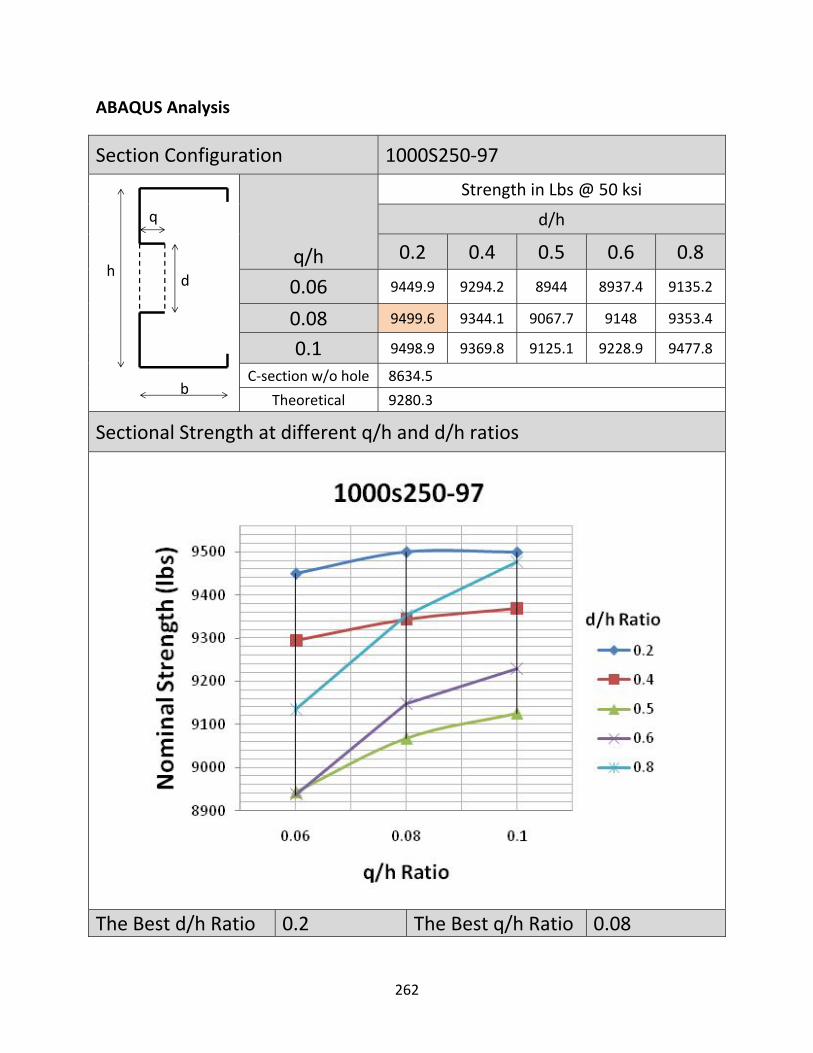
ABAQUS Analysis
Section Configuration 1000S250‐97
q/h
Strength in Lbs @ 50 ksi
d/h
0.2 0.4 0.5 0.6 0.8
0.06 9449.9 9294.2 8944 8937.4 9135.2
0.08 9499.6 9344.1 9067.7 9148 9353.4
0.1 9498.9 9369.8 9125.1 9228.9 9477.8
C‐section w/o hole 8634.5
Theoretical 9280.3
Sectional Strength at different q/h and d/h ratios
The Best d/h Ratio 0.2 The Best q/h Ratio 0.08
d
b
q
h
262
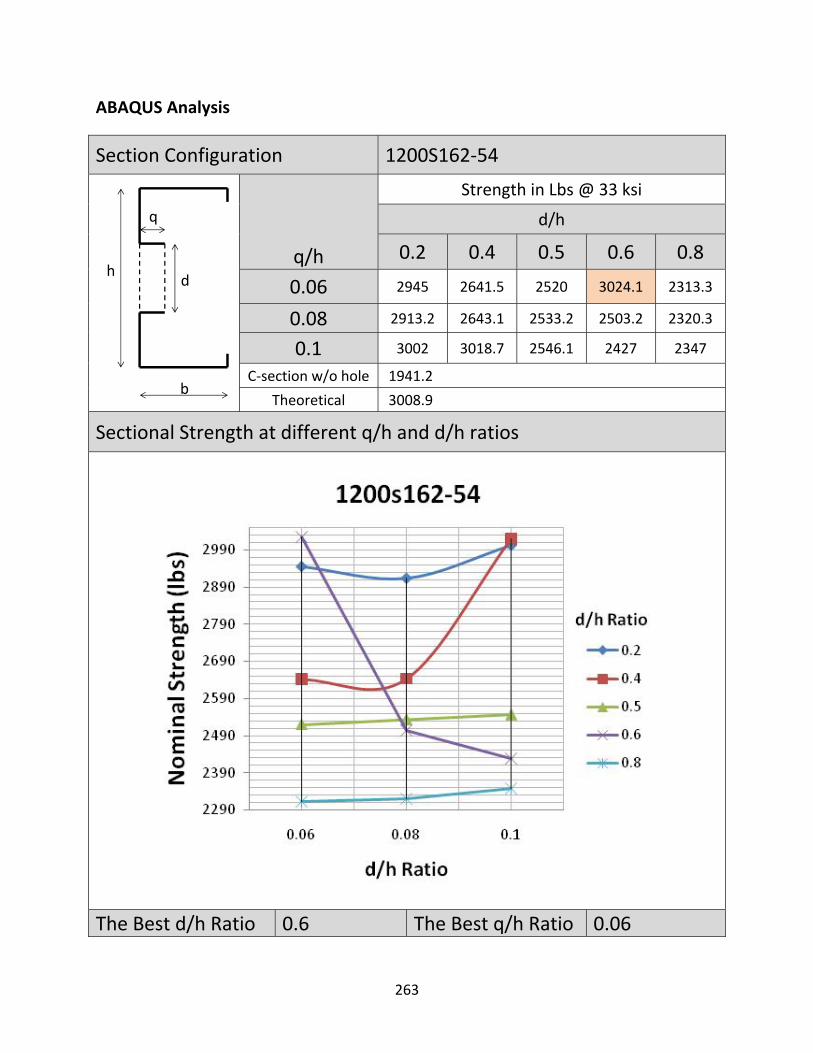
ABAQUS Analysis
Section Configuration 1200S162‐54
q/h
Strength in Lbs @ 33 ksi
d/h
0.2 0.4 0.5 0.6 0.8
0.06 2945 2641.5 2520 3024.1 2313.3
0.08 2913.2 2643.1 2533.2 2503.2 2320.3
0.1 3002 3018.7 2546.1 2427 2347
C‐section w/o hole 1941.2
Theoretical 3008.9
Sectional Strength at different q/h and d/h ratios
The Best d/h Ratio 0.6 The Best q/h Ratio 0.06
d
b
q
h
263
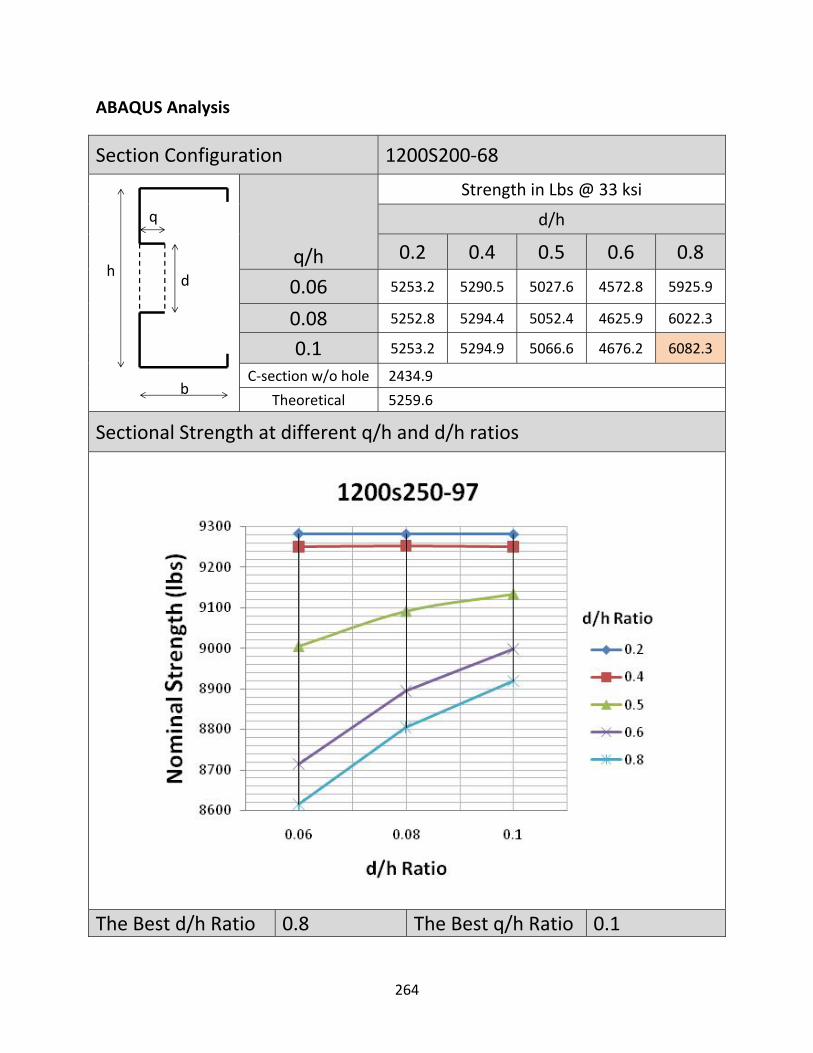
ABAQUS Analysis
Section Configuration 1200S200‐68
q/h
Strength in Lbs @ 33 ksi
d/h
0.2 0.4 0.5 0.6 0.8
0.06 5253.2 5290.5 5027.6 4572.8 5925.9
0.08 5252.8 5294.4 5052.4 4625.9 6022.3
0.1 5253.2 5294.9 5066.6 4676.2 6082.3
C‐section w/o hole 2434.9
Theoretical 5259.6
Sectional Strength at different q/h and d/h ratios
The Best d/h Ratio 0.8 The Best q/h Ratio 0.1
d
b
q
h
264
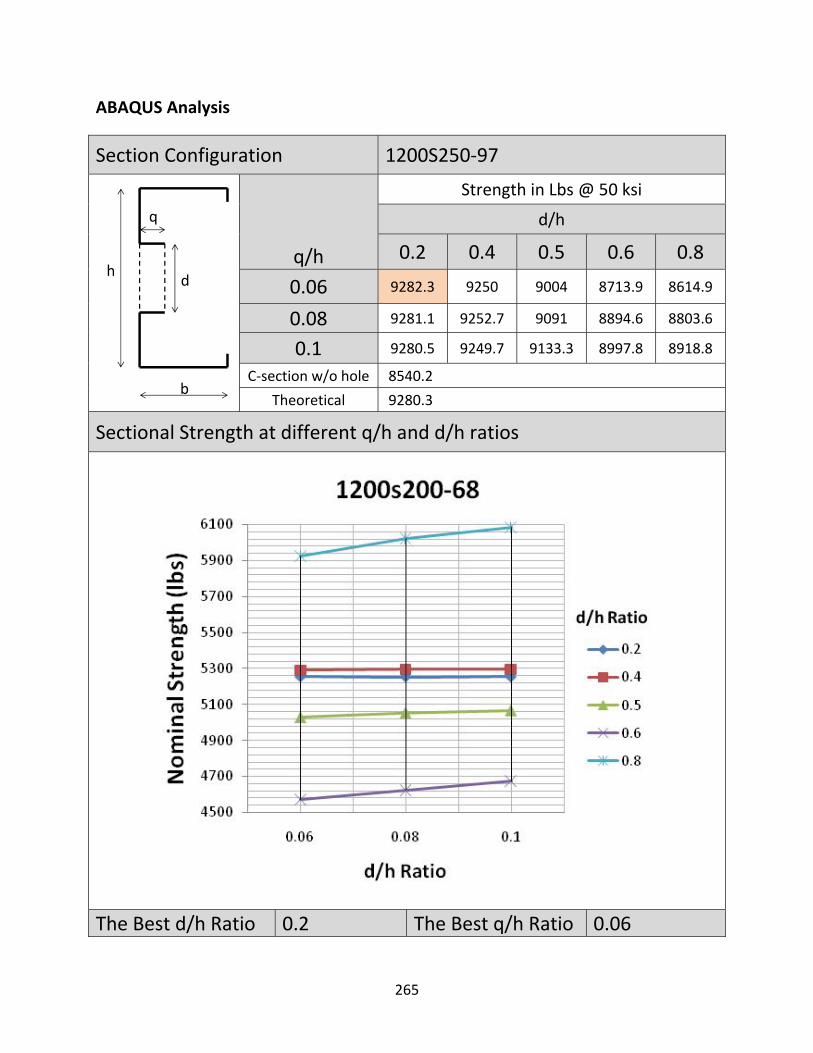
ABAQUS Analysis
Section Configuration 1200S250‐97
q/h
Strength in Lbs @ 50 ksi
d/h
0.2 0.4 0.5 0.6 0.8
0.06 9282.3 9250 9004 8713.9 8614.9
0.08 9281.1 9252.7 9091 8894.6 8803.6
0.1 9280.5 9249.7 9133.3 8997.8 8918.8
C‐section w/o hole 8540.2
Theoretical 9280.3
Sectional Strength at different q/h and d/h ratios
The Best d/h Ratio 0.2 The Best q/h Ratio 0.06
d
b
q
h
265

266
APPENDIX E
FINITE STRIP ANALYSIS OF SINGLE C‐JOIST VS SINGLE NGS JOIST
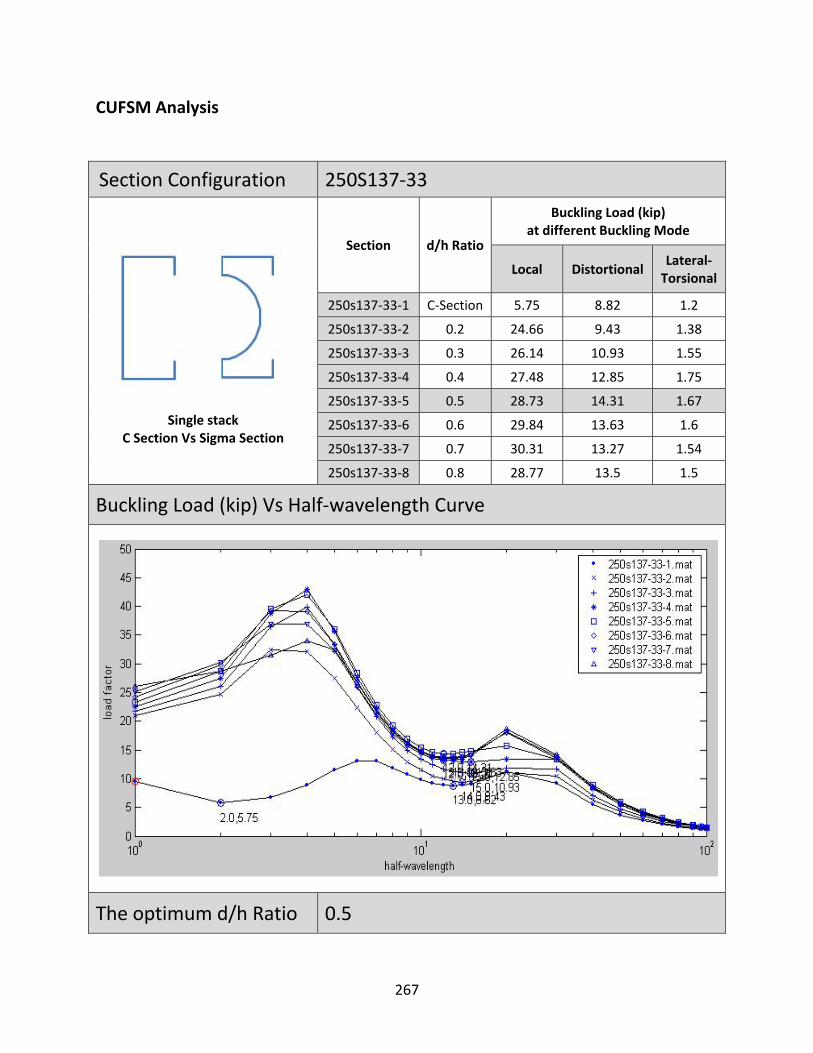
CUFSM Analysis
Section Configuration 250S137‐33
Single stack C Section Vs Sigma Section
Section d/h Ratio
Buckling Load (kip) at different Buckling Mode
Local Distortional Lateral‐Torsional
250s137‐33‐1 C‐Section 5.75 8.82 1.2
250s137‐33‐2 0.2 24.66 9.43 1.38
250s137‐33‐3 0.3 26.14 10.93 1.55
250s137‐33‐4 0.4 27.48 12.85 1.75
250s137‐33‐5 0.5 28.73 14.31 1.67
250s137‐33‐6 0.6 29.84 13.63 1.6
250s137‐33‐7 0.7 30.31 13.27 1.54
250s137‐33‐8 0.8 28.77 13.5 1.5
Buckling Load (kip) Vs Half‐wavelength Curve
The optimum d/h Ratio 0.5
267
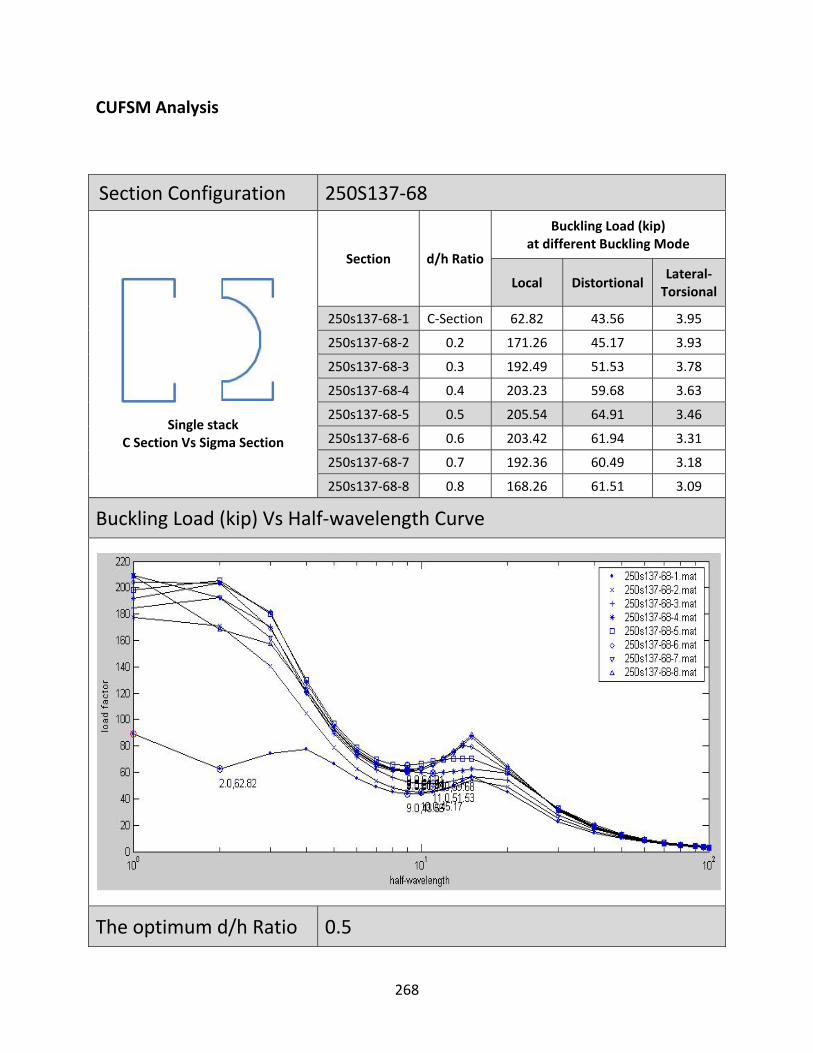
CUFSM Analysis
Section Configuration 250S137‐68
Single stack
C Section Vs Sigma Section
Section d/h Ratio
Buckling Load (kip) at different Buckling Mode
Local Distortional Lateral‐Torsional
250s137‐68‐1 C‐Section 62.82 43.56 3.95
250s137‐68‐2 0.2 171.26 45.17 3.93
250s137‐68‐3 0.3 192.49 51.53 3.78
250s137‐68‐4 0.4 203.23 59.68 3.63
250s137‐68‐5 0.5 205.54 64.91 3.46
250s137‐68‐6 0.6 203.42 61.94 3.31
250s137‐68‐7 0.7 192.36 60.49 3.18
250s137‐68‐8 0.8 168.26 61.51 3.09
Buckling Load (kip) Vs Half‐wavelength Curve
The optimum d/h Ratio 0.5
268

CUFSM Analysis
Section Configuration 250S162‐33
Single stack
C Section Vs Sigma Section
Section d/h Ratio
Buckling Load (kip) at different Buckling Mode
Local Distortional Lateral‐Torsional
250S162‐33‐1 C‐Section 7.65 10.39 1.51
250S162‐33‐2 0.2 17.41 10.29 1.62
250S162‐33‐3 0.3 18.08 10.9 1.79
250S162‐33‐4 0.4 18.76 12 2.05
250S162‐33‐5 0.5 19.43 13.48 2.44
250S162‐33‐6 0.6 20.05 15 2.64
250S162‐33‐7 0.7 20.47 15.11 2.49
250S162‐33‐8 0.8 20.18 15.06 2.35
Buckling Load (kip) Vs Half‐wavelength Curve
The optimum d/h Ratio 0.4
269
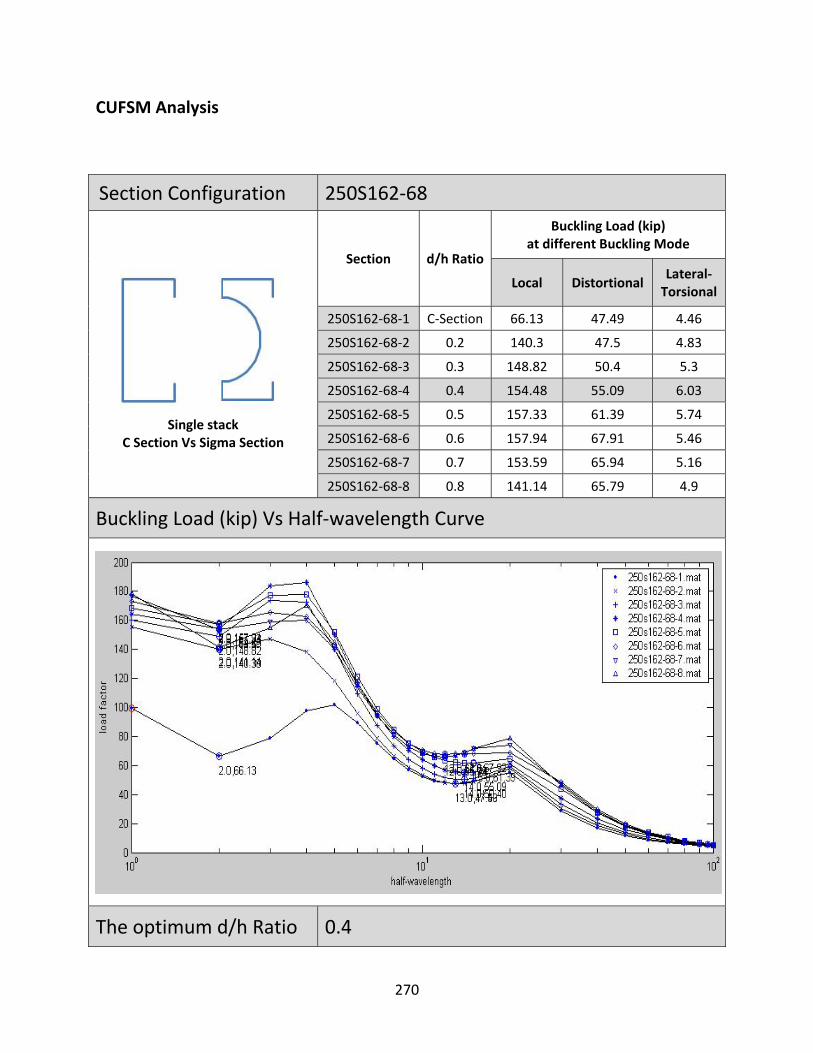
CUFSM Analysis
Section Configuration 250S162‐68
Single stack
C Section Vs Sigma Section
Section d/h Ratio
Buckling Load (kip) at different Buckling Mode
Local Distortional Lateral‐Torsional
250S162‐68‐1 C‐Section 66.13 47.49 4.46
250S162‐68‐2 0.2 140.3 47.5 4.83
250S162‐68‐3 0.3 148.82 50.4 5.3
250S162‐68‐4 0.4 154.48 55.09 6.03
250S162‐68‐5 0.5 157.33 61.39 5.74
250S162‐68‐6 0.6 157.94 67.91 5.46
250S162‐68‐7 0.7 153.59 65.94 5.16
250S162‐68‐8 0.8 141.14 65.79 4.9
Buckling Load (kip) Vs Half‐wavelength Curve
The optimum d/h Ratio 0.4
270

CUFSM Analysis
Section Configuration 350S162‐33
Single stack
C Section Vs Sigma Section
Section d/h Ratio
Buckling Load (kip) at different Buckling Mode
Local Distortional Lateral‐Torsional
350S162‐33‐1 C‐Section 5.22 9.13 0.04
350S162‐33‐2 0.2 18.97 9.81 2.74
350S162‐33‐3 0.3 20.08 12.13 3.14
350S162‐33‐4 0.4 21.14 16.63 3.13
350S162‐33‐5 0.5 22.11 16.04 3.01
350S162‐33‐6 0.6 23.13 15.03 2.93
350S162‐33‐7 0.7 24.15 14.48 2.93
350S162‐33‐8 0.8 24.91 14.66 2.97
Buckling Load (kip) Vs Half‐wavelength Curve
The optimum d/h Ratio 0.4
271

CUFSM Analysis
Section Configuration 350S162‐68
Single stack
C Section Vs Sigma Section
Section d/h Ratio
Buckling Load (kip) at different Buckling Mode
Local Distortional Lateral‐Torsional
350S162‐68‐1 C‐Section 45.42 42.87 6.72
350S162‐68‐2 0.2 157.79 45.15 7.09
350S162‐68‐3 0.3 168.86 55.07 6.81
350S162‐68‐4 0.4 178 66.75 6.52
350S162‐68‐5 0.5 185.19 70.86 6.27
350S162‐68‐6 0.6 191.84 66.48 6.12
350S162‐68‐7 0.7 194.44 64.11 6.06
350S162‐68‐8 0.8 214.22 65 6.13
Buckling Load (kip) Vs Half‐wavelength Curve
The optimum d/h Ratio 0.4
272

CUFSM Analysis
Section Configuration 362S137‐33
Single stack
C Section Vs Sigma Section
Section d/h Ratio
Buckling Load (kip) at different Buckling Mode
Local Distortional Lateral‐Torsional
362S137‐33‐1 C‐Section 4.69 7.35 2
362S137‐33‐2 0.2 22.33 9.65 2.09
362S137‐33‐3 0.3 24.33 13.77 2.01
362S137‐33‐4 0.4 25.96 15.82 1.96
362S137‐33‐5 0.5 27.37 15.09 1.96
362S137‐33‐6 0.6 28.72 13.84 2.03
362S137‐33‐7 0.7 30.11 13.48 2.18
362S137‐33‐8 0.8 31.7 14.31 2.39
Buckling Load (kip) Vs Half‐wavelength Curve
The optimum d/h Ratio 0.4
273
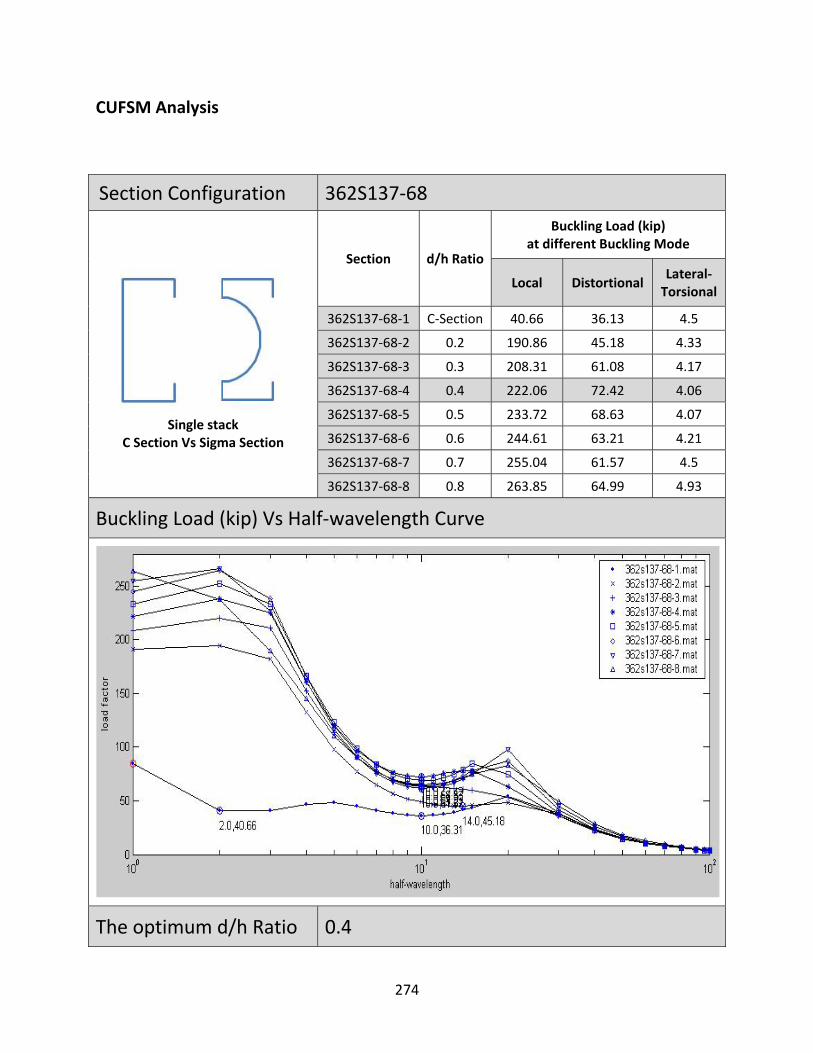
CUFSM Analysis
Section Configuration 362S137‐68
Single stack
C Section Vs Sigma Section
Section d/h Ratio
Buckling Load (kip) at different Buckling Mode
Local Distortional Lateral‐Torsional
362S137‐68‐1 C‐Section 40.66 36.13 4.5
362S137‐68‐2 0.2 190.86 45.18 4.33
362S137‐68‐3 0.3 208.31 61.08 4.17
362S137‐68‐4 0.4 222.06 72.42 4.06
362S137‐68‐5 0.5 233.72 68.63 4.07
362S137‐68‐6 0.6 244.61 63.21 4.21
362S137‐68‐7 0.7 255.04 61.57 4.5
362S137‐68‐8 0.8 263.85 64.99 4.93
Buckling Load (kip) Vs Half‐wavelength Curve
The optimum d/h Ratio 0.4
274

CUFSM Analysis
Section Configuration 362S162‐33
Single stack
C Section Vs Sigma Section
Section d/h Ratio
Buckling Load (kip) at different Buckling Mode
Local Distortional Lateral‐Torsional
362S162‐33‐1 C‐Section 5.06 8.96 2.6
362S162‐33‐2 0.2 19.01 9.84 2.89
362S162‐33‐3 0.3 20.31 15.14 3.3
362S162‐33‐4 0.4 21.38 15.24 3.15
362S162‐33‐5 0.5 22.4 16.04 3.05
362S162‐33‐6 0.6 23.47 14.96 3.09
362S162‐33‐7 0.7 24.56 14.41 3.02
362S162‐33‐8 0.8 25.44 14.66 3.09
Buckling Load (kip) Vs Half‐wavelength Curve
The optimum d/h Ratio 0.5
275

CUFSM Analysis
Section Configuration 362S162‐68
Single stack
C Section Vs Sigma Section
Section d/h Ratio
Buckling Load (kip) at different Buckling Mode
Local Distortional Lateral‐Torsional
362S162‐68‐1 C‐Section 43.79 42.14 6.98
362S162‐68‐2 0.2 159.2 45.06 7.16
362S162‐68‐3 0.3 171.1 56.254 6.87
362S162‐68‐4 0.4 180.18 68.31 6.58
362S162‐68‐5 0.5 187.95 71.06 6.36
362S162‐68‐6 0.6 195.12 66.41 6.24
362S162‐68‐7 0.7 198.96 64.04 6.24
362S162‐68‐8 0.8 218.41 65.21 6.38
Buckling Load (kip) Vs Half‐wavelength Curve
The optimum d/h Ratio 0.5
276
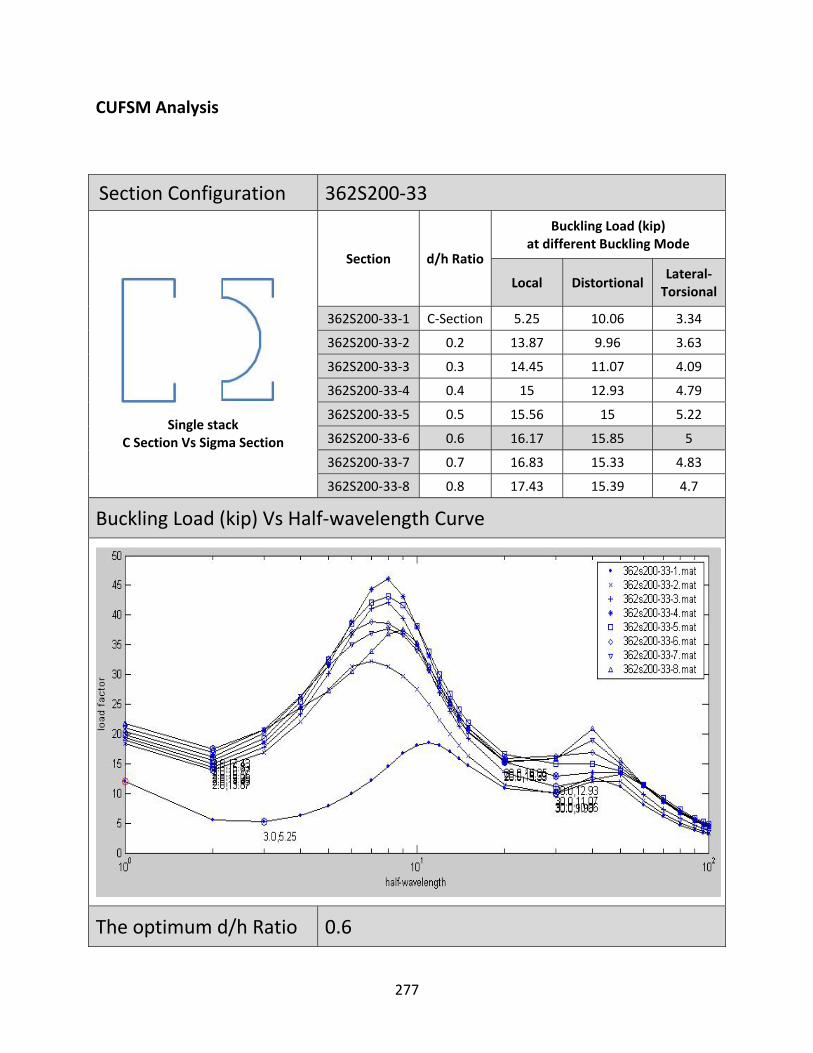
CUFSM Analysis
Section Configuration 362S200‐33
Single stack
C Section Vs Sigma Section
Section d/h Ratio
Buckling Load (kip) at different Buckling Mode
Local Distortional Lateral‐Torsional
362S200‐33‐1 C‐Section 5.25 10.06 3.34
362S200‐33‐2 0.2 13.87 9.96 3.63
362S200‐33‐3 0.3 14.45 11.07 4.09
362S200‐33‐4 0.4 15 12.93 4.79
362S200‐33‐5 0.5 15.56 15 5.22
362S200‐33‐6 0.6 16.17 15.85 5
362S200‐33‐7 0.7 16.83 15.33 4.83
362S200‐33‐8 0.8 17.43 15.39 4.7
Buckling Load (kip) Vs Half‐wavelength Curve
The optimum d/h Ratio 0.6
277
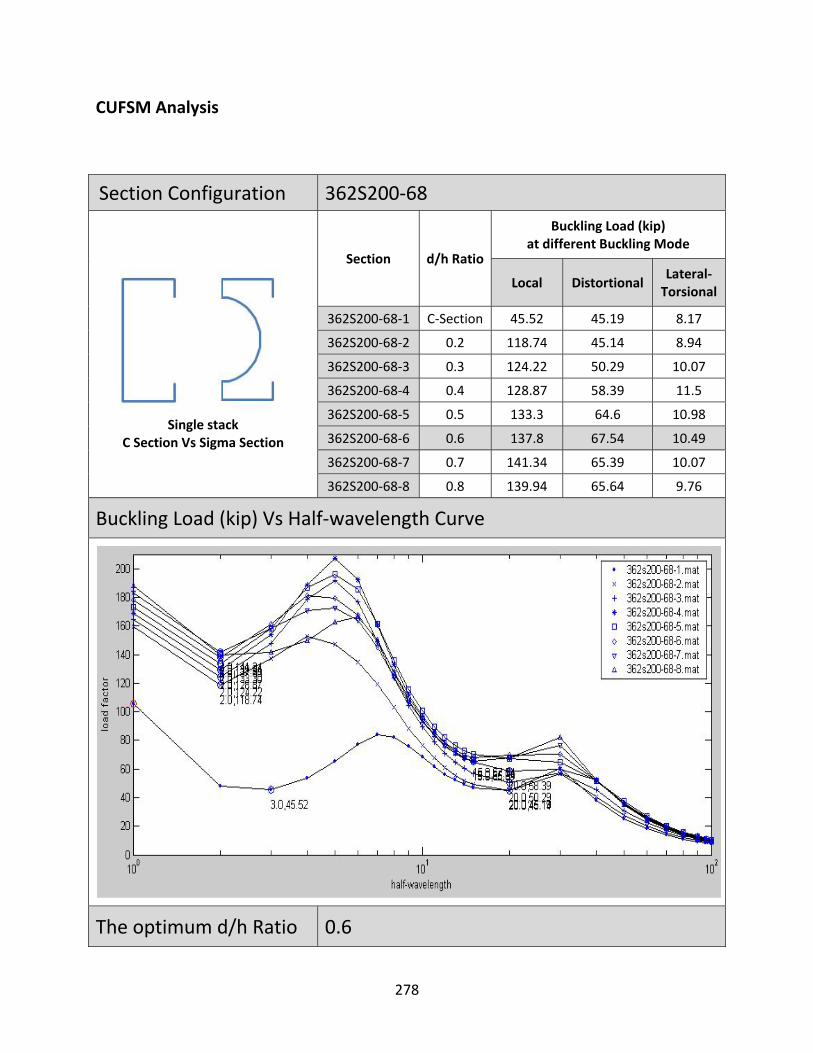
CUFSM Analysis
Section Configuration 362S200‐68
Single stack
C Section Vs Sigma Section
Section d/h Ratio
Buckling Load (kip) at different Buckling Mode
Local Distortional Lateral‐Torsional
362S200‐68‐1 C‐Section 45.52 45.19 8.17
362S200‐68‐2 0.2 118.74 45.14 8.94
362S200‐68‐3 0.3 124.22 50.29 10.07
362S200‐68‐4 0.4 128.87 58.39 11.5
362S200‐68‐5 0.5 133.3 64.6 10.98
362S200‐68‐6 0.6 137.8 67.54 10.49
362S200‐68‐7 0.7 141.34 65.39 10.07
362S200‐68‐8 0.8 139.94 65.64 9.76
Buckling Load (kip) Vs Half‐wavelength Curve
The optimum d/h Ratio 0.6
278
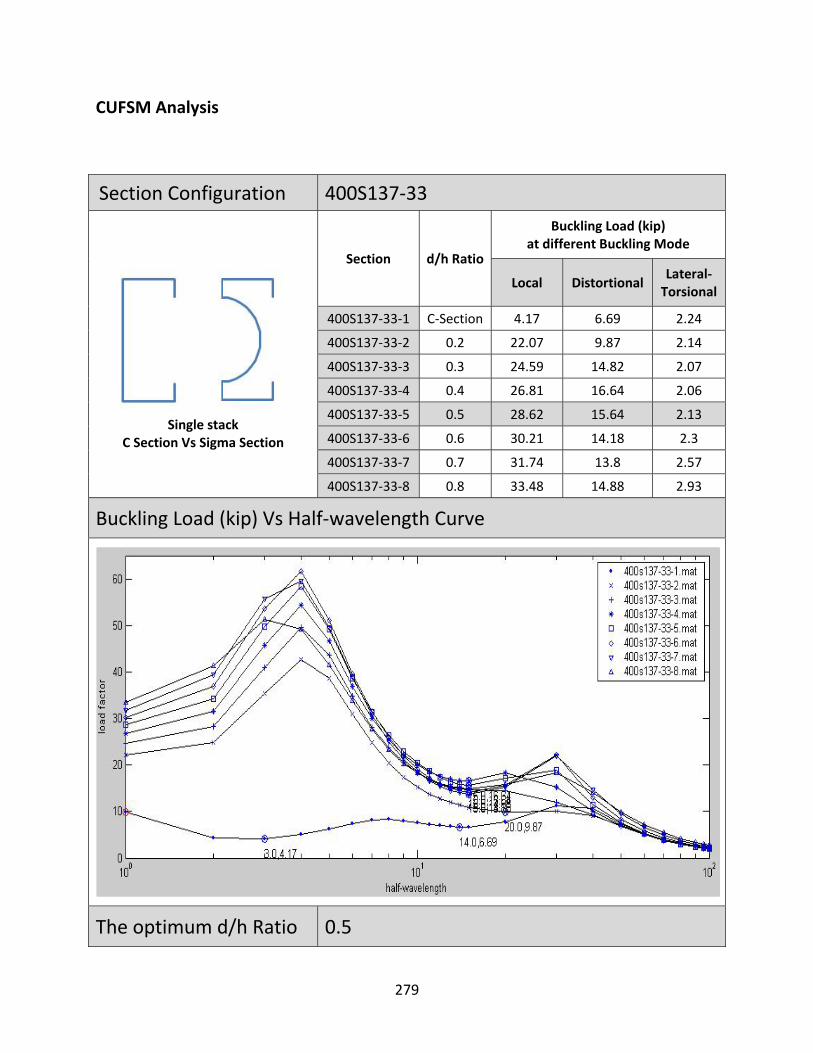
CUFSM Analysis
Section Configuration 400S137‐33
Single stack
C Section Vs Sigma Section
Section d/h Ratio
Buckling Load (kip) at different Buckling Mode
Local Distortional Lateral‐Torsional
400S137‐33‐1 C‐Section 4.17 6.69 2.24
400S137‐33‐2 0.2 22.07 9.87 2.14
400S137‐33‐3 0.3 24.59 14.82 2.07
400S137‐33‐4 0.4 26.81 16.64 2.06
400S137‐33‐5 0.5 28.62 15.64 2.13
400S137‐33‐6 0.6 30.21 14.18 2.3
400S137‐33‐7 0.7 31.74 13.8 2.57
400S137‐33‐8 0.8 33.48 14.88 2.93
Buckling Load (kip) Vs Half‐wavelength Curve
The optimum d/h Ratio 0.5
279

CUFSM Analysis
Section Configuration 400S137‐68
Single stack
C Section Vs Sigma Section
Section d/h Ratio
Buckling Load (kip) at different Buckling Mode
Local Distortional Lateral‐Torsional
400S137‐68‐1 C‐Section 35.1 33.36 4.63
400S137‐68‐2 0.2 188.87 45.82 4.46
400S137‐68‐3 0.3 210.87 66.2 4.31
400S137‐68‐4 0.4 229.62 75.92 4.28
400S137‐68‐5 0.5 244.73 70.85 4.41
400S137‐68‐6 0.6 257.68 64.51 4.76
400S137‐68‐7 0.7 269.59 62.79 5.3
400S137‐68‐8 0.8 280.6 67.18 6.05
Buckling Load (kip) Vs Half‐wavelength Curve
The optimum d/h Ratio 0.5
280

CUFSM Analysis
Section Configuration 400S162‐33
Single stack
C Section Vs Sigma Section
Section d/h Ratio
Buckling Load (kip) at different Buckling Mode
Local Distortional Lateral‐Torsional
400S162‐33‐1 C‐Section 4.37 8.39 2.97
400S162‐33‐2 0.2 19.33 10.15 3.34
400S162‐33‐3 0.3 20.8 13.55 3.37
400S162‐33‐4 0.4 22.13 16.09 3.25
400S162‐33‐5 0.5 23.35 16.1 3.2
400S162‐33‐6 0.6 24.56 14.86 3.24
400S162‐33‐7 0.7 25.79 14.28 3.36
400S162‐33‐8 0.8 26.94 14.73 3.57
Buckling Load (kip) Vs Half‐wavelength Curve
The optimum d/h Ratio 0.4
281
CUFSM Analysis
Section Configuration 400S162‐68
Single stack
C Section Vs Sigma Section
Section d/h Ratio
Buckling Load (kip) at different Buckling Mode
Local Distortional Lateral‐Torsional
400S162‐68‐1 C‐Section 37.62 39.71 7.6
400S162‐68‐2 0.2 161.74 45.59 7.34
400S162‐68‐3 0.3 175.64 59.96 7.05
400S162‐68‐4 0.4 187.02 72.9 6.8
400S162‐68‐5 0.5 196.78 71.93 6.68
400S162‐68‐6 0.6 205.64 66.54 6.72
400S162‐68‐7 0.7 211.81 63.98 6.94
400S162‐68‐8 0.8 230.95 65.79 7.36
Buckling Load (kip) Vs Half‐wavelength Curve
The optimum d/h Ratio 0.4
282

CUFSM Analysis
Section Configuration 400S200‐33
Single stack
C Section Vs Sigma Section
Section d/h Ratio
Buckling Load (kip) at different Buckling Mode
Local Distortional Lateral‐Torsional
400S200‐33‐1 C‐Section 4.55 9.59 3.89
400S200‐33‐2 0.2 14.25 9.7 4.28
400S200‐33‐3 0.3 14.91 11.42 4.86
400S200‐33‐4 0.4 15.55 16.19 5.56
400S200‐33‐5 0.5 16.2 16.21 5.34
400S200‐33‐6 0.6 16.87 15.88 5.18
400S200‐33‐7 0.7 17.59 15.36 5.1
400S200‐33‐8 0.8 18.33 15.44 5.08
Buckling Load (kip) Vs Half‐wavelength Curve
The optimum d/h Ratio 0.5
283
CUFSM Analysis
Section Configuration 400S200‐68
Single stack
C Section Vs Sigma Section
Section d/h Ratio
Buckling Load (kip) at different Buckling Mode
Local Distortional Lateral‐Torsional
400S200‐68‐1 C‐Section 39.54 43.39 9.37
400S200‐68‐2 0.2 122.26 44.32 10.36
400S200‐68‐3 0.3 128.32 52.1 11.74
400S200‐68‐4 0.4 133.86 68.47 11.79
400S200‐68‐5 0.5 139.15 71.72 11.28
400S200‐68‐6 0.6 144.35 68 10.89
400S200‐68‐7 0.7 148.91 65.63 10.64
400S200‐68‐8 0.8 149.77 66.67 10.54
Buckling Load (kip) Vs Half‐wavelength Curve
The optimum d/h Ratio 0.5
284
CUFSM Analysis
Section Configuration 550S162‐33
Single stack
C Section Vs Sigma Section
Section d/h Ratio
Buckling Load (kip) at different Buckling Mode
Local Distortional Lateral‐Torsional
550S162‐33‐1 C‐Section 2.93 6.05 3.97
550S162‐33‐2 0.2 17.37 17.77 3.72
550S162‐33‐3 0.3 20.79 23.82 3.67
550S162‐33‐4 0.4 23.86 19.36 3.84
550S162‐33‐5 0.5 26.38 18.3 4.26
550S162‐33‐6 0.6 28.46 16.4 4.92
550S162‐33‐7 0.7 30.38 15.87 5.77
550S162‐33‐8 0.8 32.29 16.54 5.13
Buckling Load (kip) Vs Half‐wavelength Curve
The optimum d/h Ratio 0.5
285

CUFSM Analysis
Section Configuration 550S162‐68
Single stack
C Section Vs Sigma Section
Section d/h Ratio
Buckling Load (kip) at different Buckling Mode
Local Distortional Lateral‐Torsional
550S162‐68‐1 C‐Section 25.44 29.42 8.34
550S162‐68‐2 0.2 146.73 63.59 7.94
550S162‐68‐3 0.3 176.04 74.3 7.81
550S162‐68‐4 0.4 202.57 85.49 8.08
550S162‐68‐5 0.5 223.86 79.04 8.84
550S162‐68‐6 0.6 240.93 70.79 10.15
550S162‐68‐7 0.7 255.41 68.46 11.99
550S162‐68‐8 0.8 264.63 72.97 12.68
Buckling Load (kip) Vs Half‐wavelength Curve
The optimum d/h Ratio 0.5
286

CUFSM Analysis
Section Configuration 600S137‐33
Single stack
C Section Vs Sigma Section
Section d/h Ratio
Buckling Load (kip) at different Buckling Mode
Local Distortional Lateral‐Torsional
600S137‐33‐1 C‐Section 2.55 3.74 2.46
600S137‐33‐2 0.2 16.4 15.27 2.36
600S137‐33‐3 0.3 21.71 20.48 2.55
600S137‐33‐4 0.4 26.67 22.79 3.06
600S137‐33‐5 0.5 32.07 19.59 3.88
600S137‐33‐6 0.6 36.67 17.57 4.96
600S137‐33‐7 0.7 39.95 17.32 5.19
600S137‐33‐8 0.8 42.65 17.45 3.49
Buckling Load (kip) Vs Half‐wavelength Curve
The optimum d/h Ratio 0.4
287

CUFSM Analysis
Section Configuration 600S137‐54
Single stack
C Section Vs Sigma Section
Section d/h Ratio
Buckling Load (kip) at different Buckling Mode
Local Distortional Lateral‐Torsional
600S137‐54‐1 C‐Section 10.77 11.49 4.08
600S137‐54‐2 0.2 69.84 37.04 3.94
600S137‐54‐3 0.3 92.16 54.82 4.23
600S137‐54‐4 0.4 115.62 62.82 5.01
600S137‐54‐5 0.5 138.93 54.81 6.36
600S137‐54‐6 0.6 158.78 48.21 8.25
600S137‐54‐7 0.7 172.79 47.2 9.32
600S137‐54‐8 0.8 184.04 47.89 6.39
Buckling Load (kip) Vs Half‐wavelength Curve
The optimum d/h Ratio 0.4
288
CUFSM Analysis
Section Configuration 600S137‐97
Single stack
C Section Vs Sigma Section
Section d/h Ratio
Buckling Load (kip) at different Buckling Mode
Local Distortional Lateral‐Torsional
600S137‐97‐1 C‐Section 92.36 47.41 7.39
600S137‐97‐2 0.2 372.77 123.98 7.16
600S137‐97‐3 0.3 550.97 185.42 7.66
600S137‐97‐4 0.4 654.61 215.25 9.03
600S137‐97‐5 0.5 780.53 183.62 11.47
600S137‐97‐6 0.6 884.7 162.39 14.95
600S137‐97‐7 0.7 956 159.68 19.43
600S137‐97‐8 0.8 957.81 166.44 15.64
Buckling Load (kip) Vs Half‐wavelength Curve
The optimum d/h Ratio 0.4
289
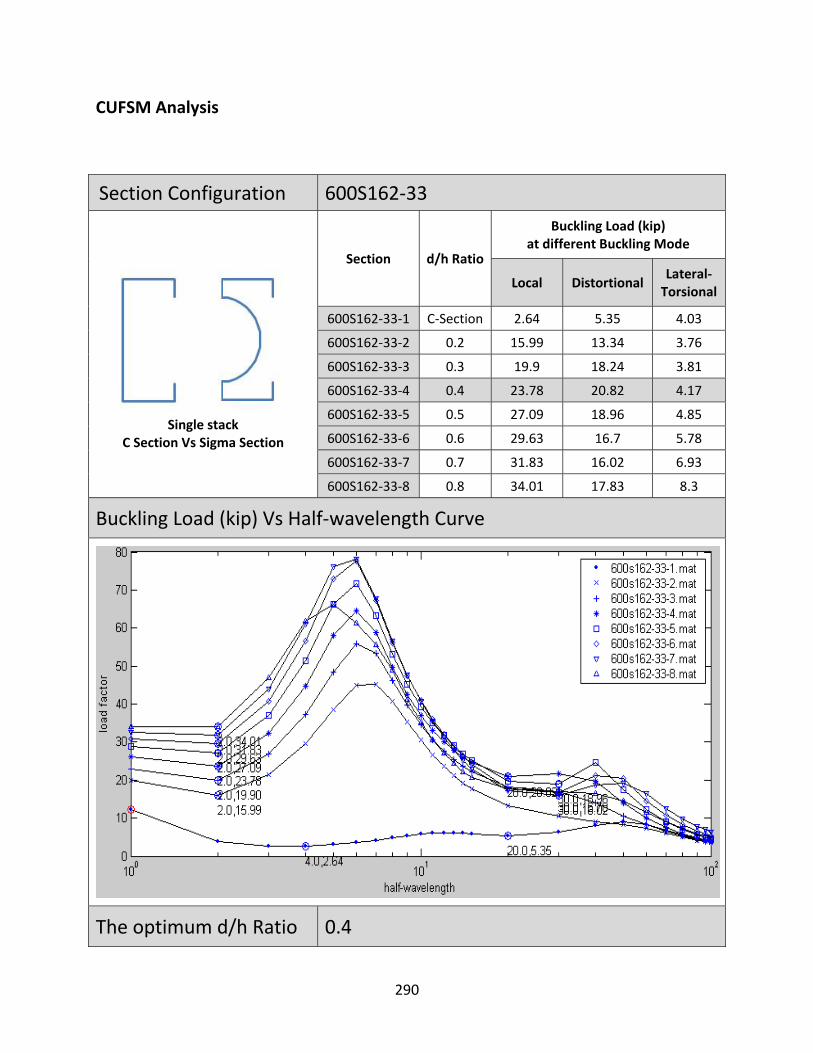
CUFSM Analysis
Section Configuration 600S162‐33
Single stack
C Section Vs Sigma Section
Section d/h Ratio
Buckling Load (kip) at different Buckling Mode
Local Distortional Lateral‐Torsional
600S162‐33‐1 C‐Section 2.64 5.35 4.03
600S162‐33‐2 0.2 15.99 13.34 3.76
600S162‐33‐3 0.3 19.9 18.24 3.81
600S162‐33‐4 0.4 23.78 20.82 4.17
600S162‐33‐5 0.5 27.09 18.96 4.85
600S162‐33‐6 0.6 29.63 16.7 5.78
600S162‐33‐7 0.7 31.83 16.02 6.93
600S162‐33‐8 0.8 34.01 17.83 8.3
Buckling Load (kip) Vs Half‐wavelength Curve
The optimum d/h Ratio 0.4
290

CUFSM Analysis
Section Configuration 600S162‐54
Single stack
C Section Vs Sigma Section
Section d/h Ratio
Buckling Load (kip) at different Buckling Mode
Local Distortional Lateral‐Torsional
600S162‐54‐1 C‐Section 11.42 15.74 6.74
600S162‐54‐2 0.2 68.73 47.47 6.38
600S162‐54‐3 0.3 85.65 47.54 6.42
600S162‐54‐4 0.4 102.42 58.27 6.91
600S162‐54‐5 0.5 116.78 49.95 7.95
600S162‐54‐6 0.6 127.65 44.17 9.5
600S162‐54‐7 0.7 136.81 43.02 11.54
600S162‐54‐8 0.8 144.88 50.25 9.41
Buckling Load (kip) Vs Half‐wavelength Curve
The optimum d/h Ratio 0.4
291
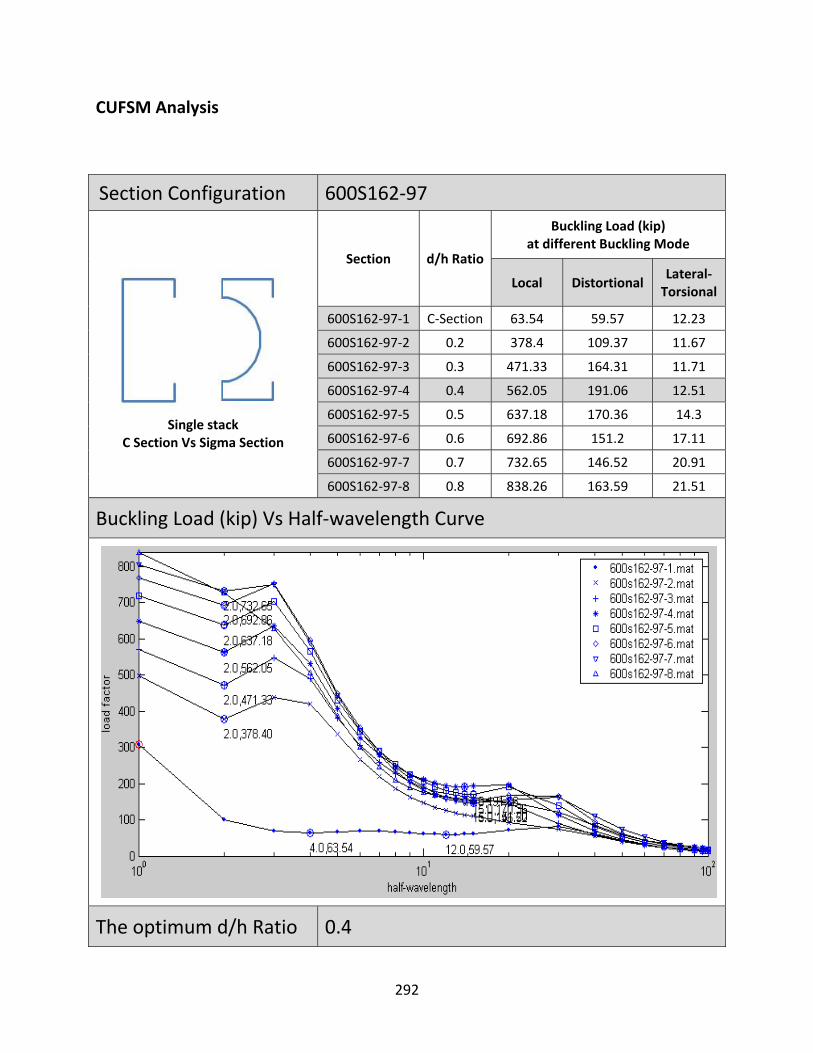
CUFSM Analysis
Section Configuration 600S162‐97
Single stack
C Section Vs Sigma Section
Section d/h Ratio
Buckling Load (kip) at different Buckling Mode
Local Distortional Lateral‐Torsional
600S162‐97‐1 C‐Section 63.54 59.57 12.23
600S162‐97‐2 0.2 378.4 109.37 11.67
600S162‐97‐3 0.3 471.33 164.31 11.71
600S162‐97‐4 0.4 562.05 191.06 12.51
600S162‐97‐5 0.5 637.18 170.36 14.3
600S162‐97‐6 0.6 692.86 151.2 17.11
600S162‐97‐7 0.7 732.65 146.52 20.91
600S162‐97‐8 0.8 838.26 163.59 21.51
Buckling Load (kip) Vs Half‐wavelength Curve
The optimum d/h Ratio 0.4
292
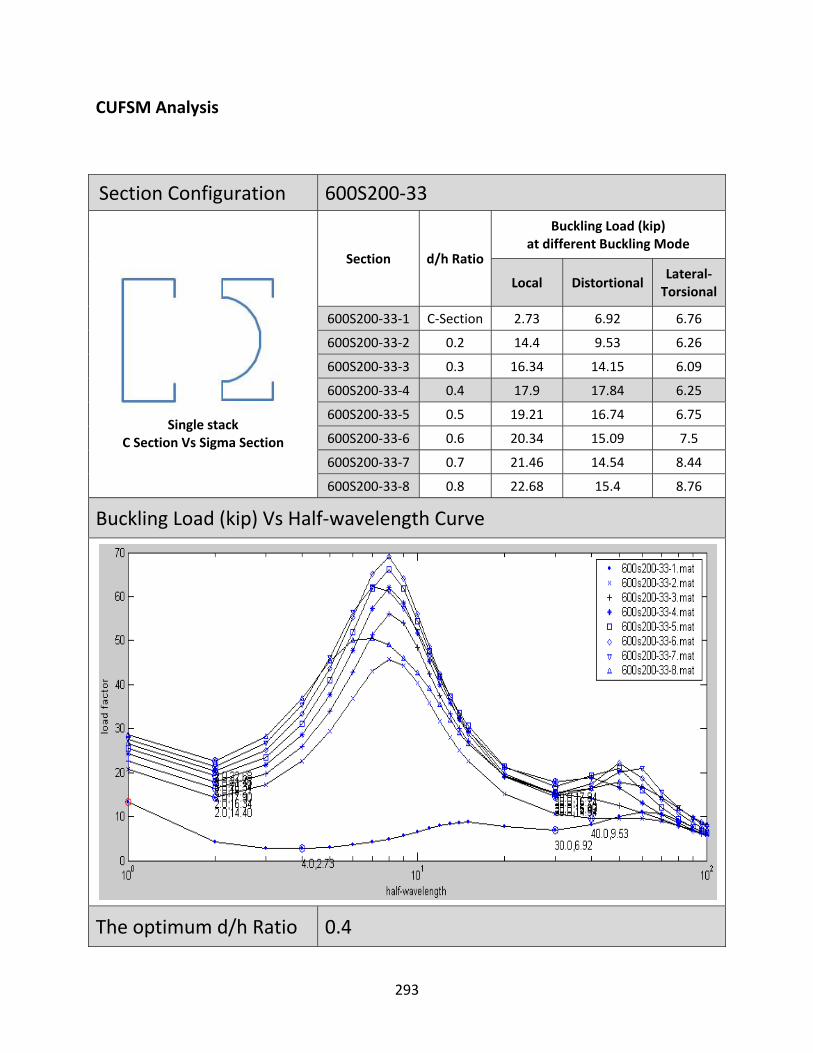
CUFSM Analysis
Section Configuration 600S200‐33
Single stack
C Section Vs Sigma Section
Section d/h Ratio
Buckling Load (kip) at different Buckling Mode
Local Distortional Lateral‐Torsional
600S200‐33‐1 C‐Section 2.73 6.92 6.76
600S200‐33‐2 0.2 14.4 9.53 6.26
600S200‐33‐3 0.3 16.34 14.15 6.09
600S200‐33‐4 0.4 17.9 17.84 6.25
600S200‐33‐5 0.5 19.21 16.74 6.75
600S200‐33‐6 0.6 20.34 15.09 7.5
600S200‐33‐7 0.7 21.46 14.54 8.44
600S200‐33‐8 0.8 22.68 15.4 8.76
Buckling Load (kip) Vs Half‐wavelength Curve
The optimum d/h Ratio 0.4
293
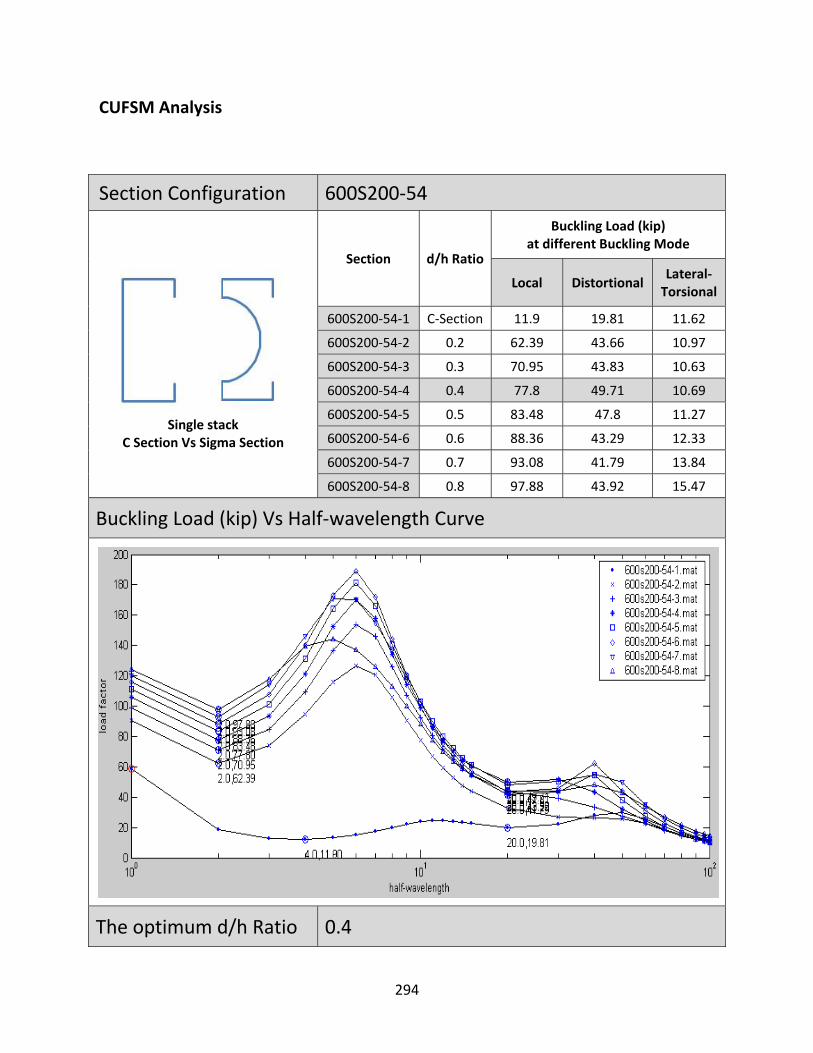
CUFSM Analysis
Section Configuration 600S200‐54
Single stack
C Section Vs Sigma Section
Section d/h Ratio
Buckling Load (kip) at different Buckling Mode
Local Distortional Lateral‐Torsional
600S200‐54‐1 C‐Section 11.9 19.81 11.62
600S200‐54‐2 0.2 62.39 43.66 10.97
600S200‐54‐3 0.3 70.95 43.83 10.63
600S200‐54‐4 0.4 77.8 49.71 10.69
600S200‐54‐5 0.5 83.48 47.8 11.27
600S200‐54‐6 0.6 88.36 43.29 12.33
600S200‐54‐7 0.7 93.08 41.79 13.84
600S200‐54‐8 0.8 97.88 43.92 15.47
Buckling Load (kip) Vs Half‐wavelength Curve
The optimum d/h Ratio 0.4
294
CUFSM Analysis
Section Configuration 600S200‐97
Single stack
C Section Vs Sigma Section
Section d/h Ratio
Buckling Load (kip) at different Buckling Mode
Local Distortional Lateral‐Torsional
600S200‐97‐1 C‐Section 67.85 71.97 21.28
600S200‐97‐2 0.2 351.26 95.37 20.28
600S200‐97‐3 0.3 401.04 137.74 19.66
600S200‐97‐4 0.4 440.25 168.81 19.63
600S200‐97‐5 0.5 471.88 159.91 20.46
600S200‐97‐6 0.6 498.23 144.72 22.21
600S200‐97‐7 0.7 521.46 138.34 24.91
600S200‐97‐8 0.8 535.55 142.62 28.48
Buckling Load (kip) Vs Half‐wavelength Curve
The optimum d/h Ratio 0.4
295
CUFSM Analysis
Section Configuration 800S137‐33
Single stack
C Section Vs Sigma Section
Section d/h Ratio
Buckling Load (kip) at different Buckling Mode
Local Distortional Lateral‐Torsional
800S137‐33‐1 C‐Section 1.84 2.19 2.54
800S137‐33‐2 0.2 11.42 19.8 2.66
800S137‐33‐3 0.3 14.87 24.38 3.57
800S137‐33‐4 0.4 20.58 27.87 5.08
800S137‐33‐5 0.5 29.72 23.07 6.93
800S137‐33‐6 0.6 38.32 20.47 8.81
800S137‐33‐7 0.7 46.51 20.87 6.59
800S137‐33‐8 0.8 51.4942 19.44 4.34
Buckling Load (kip) Vs Half‐wavelength Curve
The optimum d/h Ratio 0.4
296
CUFSM Analysis
Section Configuration 800S137‐54
Single stack
C Section Vs Sigma Section
Section d/h Ratio
Buckling Load (kip) at different Buckling Mode
Local Distortional Lateral‐Torsional
800S137‐54‐1 C‐Section 7.59 6.98 4.31
800S137‐54‐2 0.2 48.86 52.21 4.51
800S137‐54‐3 0.3 63.64 69.02 5.86
800S137‐54‐4 0.4 87.68 78.8 8.41
800S137‐54‐5 0.5 125.82 66.34 11.9
800S137‐54‐6 0.6 165.94 56.14 15.24
800S137‐54‐7 0.7 201.39 59.84 11.53
800S137‐54‐8 0.8 222.59 54.13 7.63
Buckling Load (kip) Vs Half‐wavelength Curve
The optimum d/h Ratio 0.4
297
CUFSM Analysis
Section Configuration 800S137‐97
Single stack
C Section Vs Sigma Section
Section d/h Ratio
Buckling Load (kip) at different Buckling Mode
Local Distortional Lateral‐Torsional
800S137‐97‐1 C‐Section 96.31 30.07 7.87
800S137‐97‐2 0.2 272.01 175.18 8.24
800S137‐97‐3 0.3 352.39 248.31 10.57
800S137‐97‐4 0.4 457.97 282.21 15.23
800S137‐97‐5 0.5 741.1 242.66 22.14
800S137‐97‐6 0.6 854.73 210.58 31.27
800S137‐97‐7 0.7 920.38 205.64 24.22
800S137‐97‐8 0.8 919.02 182.83 16.58
Buckling Load (kip) Vs Half‐wavelength Curve
The optimum d/h Ratio 0.4
298
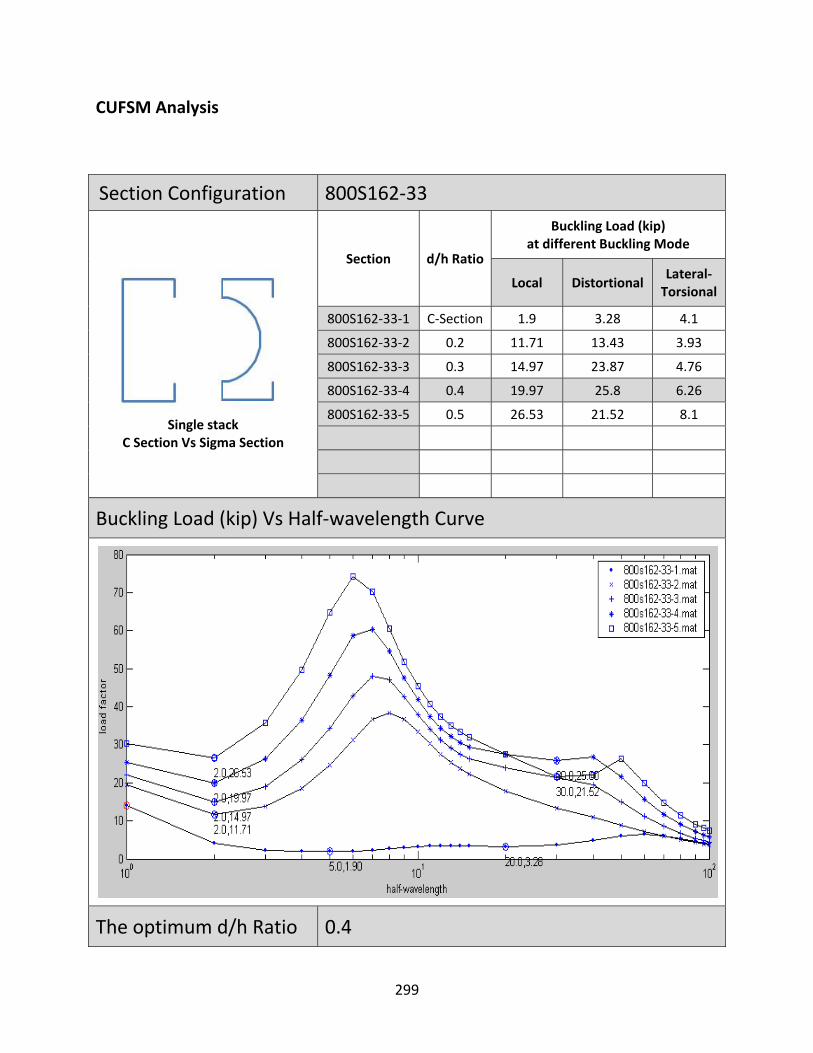
CUFSM Analysis
Section Configuration 800S162‐33
Single stack
C Section Vs Sigma Section
Section d/h Ratio
Buckling Load (kip) at different Buckling Mode
Local Distortional Lateral‐Torsional
800S162‐33‐1 C‐Section 1.9 3.28 4.1
800S162‐33‐2 0.2 11.71 13.43 3.93
800S162‐33‐3 0.3 14.97 23.87 4.76
800S162‐33‐4 0.4 19.97 25.8 6.26
800S162‐33‐5 0.5 26.53 21.52 8.1
Buckling Load (kip) Vs Half‐wavelength Curve
The optimum d/h Ratio 0.4
299

CUFSM Analysis
Section Configuration 800S162‐54
Single stack
C Section Vs Sigma Section
Section d/h Ratio
Buckling Load (kip) at different Buckling Mode
Local Distortional Lateral‐Torsional
800S162‐54‐1 C‐Section 8.16 9.89 7.11
800S162‐54‐2 0.2 50.33 40.87 6.91
800S162‐54‐3 0.3 64.46 61.19 7.98
800S162‐54‐4 0.4 85.83 72.03 10.26
800S162‐54‐5 0.5 114.15 59.33 13.51
Buckling Load (kip) Vs Half‐wavelength Curve
The optimum d/h Ratio 0.4
300

CUFSM Analysis
Section Configuration 800S162‐97
Single stack
C Section Vs Sigma Section
Section d/h Ratio
Buckling Load (kip) at different Buckling Mode
Local Distortional Lateral‐Torsional
800S162‐97‐1 C‐Section 102.52 38.99 13.09
800S162‐97‐2 0.2 283.17 177.02 12.85
800S162‐97‐3 0.3 362.4 207.37 14.54
800S162‐97‐4 0.4 478.51 243.28 18.47
800S162‐97‐5 0.5 630.57 195.34 24.62
Buckling Load (kip) Vs Half‐wavelength Curve
The optimum d/h Ratio 0.4
301

CUFSM Analysis
Section Configuration 800S200‐33
Single stack
C Section Vs Sigma Section
Section d/h Ratio
Buckling Load (kip) at different Buckling Mode
Local Distortional Lateral‐Torsional
800S200‐33‐1 C‐Section 1.94 4.61 6.72
800S200‐33‐2 0.2 11.85 13.27 6
800S200‐33‐3 0.3 14.57 18.83 6.76
800S200‐33‐4 0.4 17.93 21.8 83.1
800S200‐33‐5 0.5 21.03 18.96 10.23
800S200‐33‐6 0.6 23.33 16.55 12.3
Buckling Load (kip) Vs Half‐wavelength Curve
The optimum d/h Ratio 0.4
302
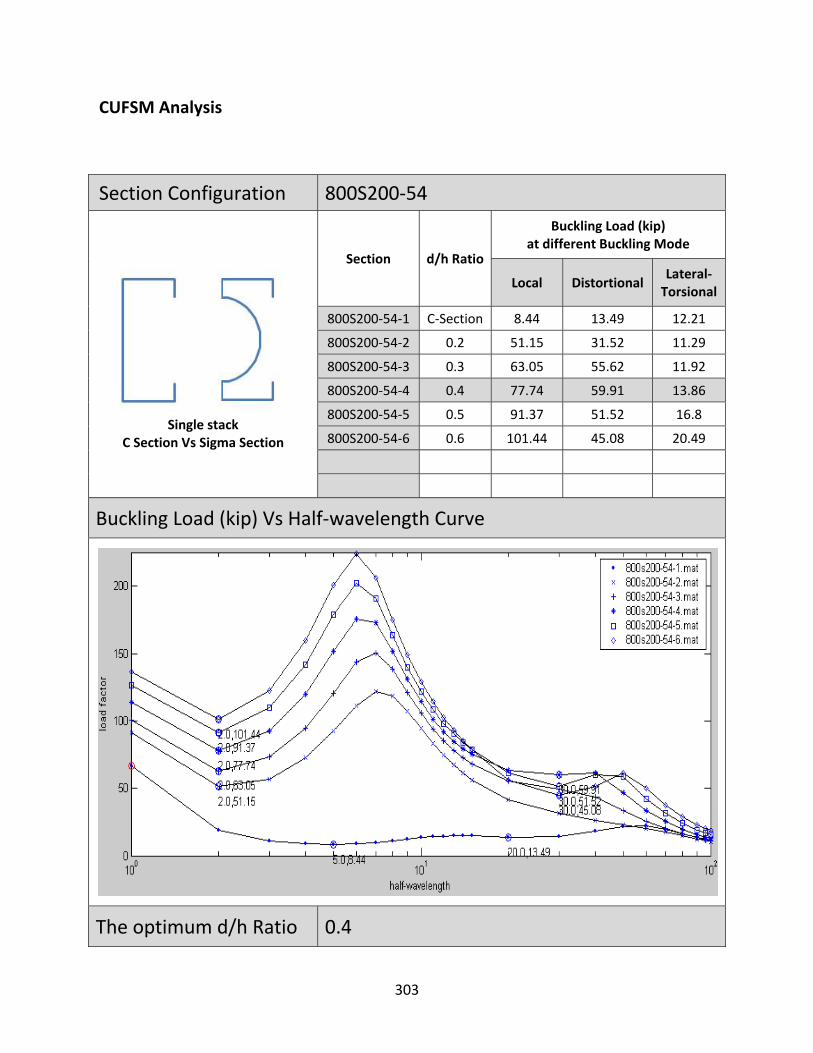
CUFSM Analysis
Section Configuration 800S200‐54
Single stack
C Section Vs Sigma Section
Section d/h Ratio
Buckling Load (kip) at different Buckling Mode
Local Distortional Lateral‐Torsional
800S200‐54‐1 C‐Section 8.44 13.49 12.21
800S200‐54‐2 0.2 51.15 31.52 11.29
800S200‐54‐3 0.3 63.05 55.62 11.92
800S200‐54‐4 0.4 77.74 59.91 13.86
800S200‐54‐5 0.5 91.37 51.52 16.8
800S200‐54‐6 0.6 101.44 45.08 20.49
Buckling Load (kip) Vs Half‐wavelength Curve
The optimum d/h Ratio 0.4
303
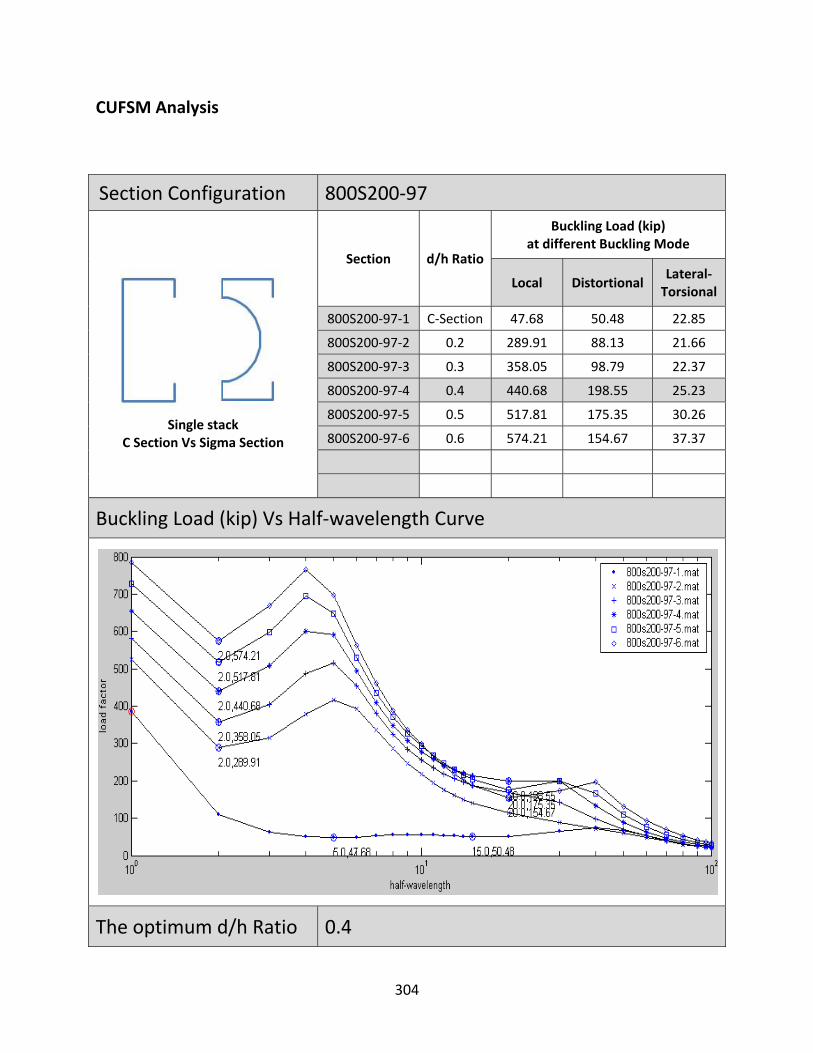
CUFSM Analysis
Section Configuration 800S200‐97
Single stack
C Section Vs Sigma Section
Section d/h Ratio
Buckling Load (kip) at different Buckling Mode
Local Distortional Lateral‐Torsional
800S200‐97‐1 C‐Section 47.68 50.48 22.85
800S200‐97‐2 0.2 289.91 88.13 21.66
800S200‐97‐3 0.3 358.05 98.79 22.37
800S200‐97‐4 0.4 440.68 198.55 25.23
800S200‐97‐5 0.5 517.81 175.35 30.26
800S200‐97‐6 0.6 574.21 154.67 37.37
Buckling Load (kip) Vs Half‐wavelength Curve
The optimum d/h Ratio 0.4
304
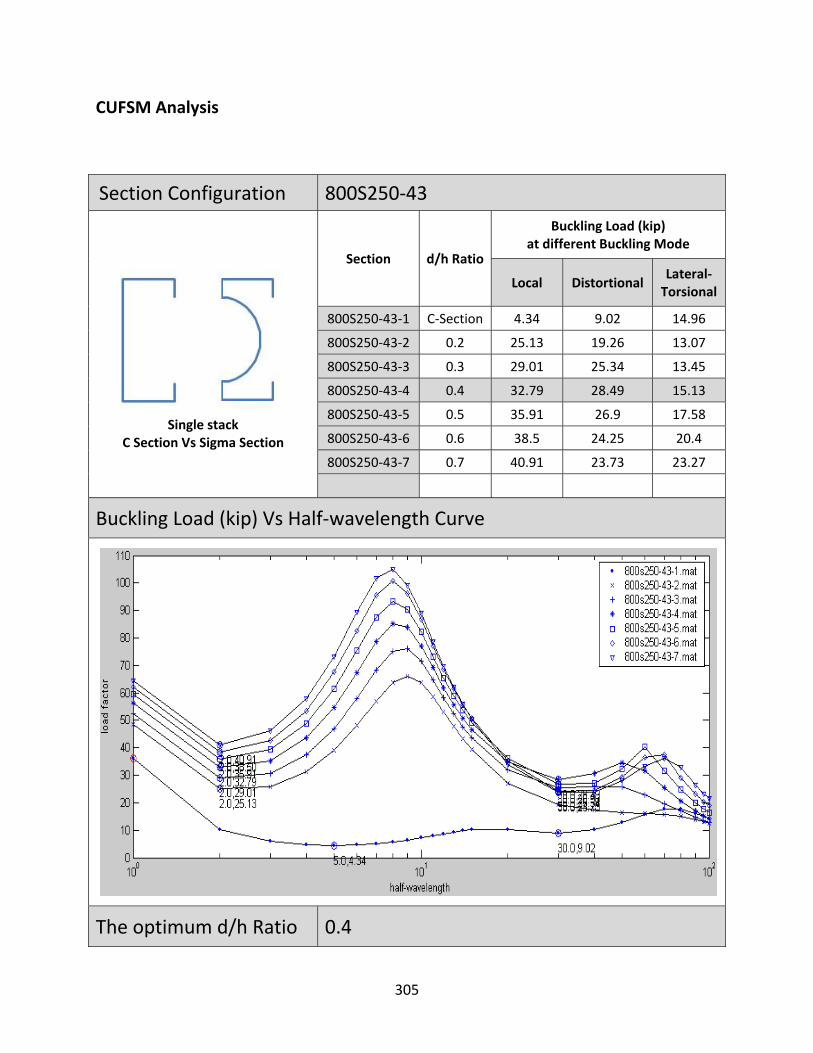
CUFSM Analysis
Section Configuration 800S250‐43
Single stack
C Section Vs Sigma Section
Section d/h Ratio
Buckling Load (kip) at different Buckling Mode
Local Distortional Lateral‐Torsional
800S250‐43‐1 C‐Section 4.34 9.02 14.96
800S250‐43‐2 0.2 25.13 19.26 13.07
800S250‐43‐3 0.3 29.01 25.34 13.45
800S250‐43‐4 0.4 32.79 28.49 15.13
800S250‐43‐5 0.5 35.91 26.9 17.58
800S250‐43‐6 0.6 38.5 24.25 20.4
800S250‐43‐7 0.7 40.91 23.73 23.27
Buckling Load (kip) Vs Half‐wavelength Curve
The optimum d/h Ratio 0.4
305

CUFSM Analysis
Section Configuration 800S250‐97
Single stack
C Section Vs Sigma Section
Section d/h Ratio
Buckling Load (kip) at different Buckling Mode
Local Distortional Lateral‐Torsional
800S250‐97‐1 C‐Section 48.98 54.24 38.28
800S250‐97‐2 0.2 282.19 106.37 35.81
800S250‐97‐3 0.3 326.67 138.48 35.27
800S250‐97‐4 0.4 368.84 154.53 36.78
800S250‐97‐5 0.5 403.34 145.08 40.47
800S250‐97‐6 0.6 431.68 131.39 46.17
800S250‐97‐7 0.7 457.19 128.37 53.5
Buckling Load (kip) Vs Half‐wavelength Curve
The optimum d/h Ratio 0.4
306
CUFSM Analysis
Section Configuration 1000S162‐43
Single stack
C Section Vs Sigma Section
Section d/h Ratio
Buckling Load (kip) at different Buckling Mode
Local Distortional Lateral‐Torsional
1000S162‐43‐1 C‐Section 3.27 3.82 5.5
1000S162‐43‐2 0.2 20.97 26.95 5.98
1000S162‐43‐3 0.3 26.24 46.33 8.57
1000S162‐43‐4 0.4 34.61 53.4 12.2
1000S162‐43‐5 0.5 48.38 40.82 16.29
Buckling Load (kip) Vs Half‐wavelength Curve
The optimum d/h Ratio 0.4
307

CUFSM Analysis
Section Configuration 1000S162‐97
Single stack
C Section Vs Sigma Section
Section d/h Ratio
Buckling Load (kip) at different Buckling Mode
Local Distortional Lateral‐Torsional
1000S162‐97‐1 C‐Section 111.45 26.99 13.62
1000S162‐97‐2 0.2 230.1 143.28 14.51
1000S162‐97‐3 0.3 292.01 260.51 19.45
1000S162‐97‐4 0.4 382.42 299.93 28.33
1000S162‐97‐5 0.5 529.78 234.44 40.57
Buckling Load (kip) Vs Half‐wavelength Curve
The optimum d/h Ratio 0.4
308
CUFSM Analysis
Section Configuration 1000S200‐43
Single stack
C Section Vs Sigma Section
Section d/h Ratio
Buckling Load (kip) at different Buckling Mode
Local Distortional Lateral‐Torsional
1000S200‐43‐1 C‐Section 3.34 5.59 8.96
1000S200‐43‐2 0.2 21.4 21.76 8.7
1000S200‐43‐3 0.3 26.86 36.21 11.48
1000S200‐43‐4 0.4 34.36 44.24 15.48
1000S200‐43‐5 0.5 44.78 36.46 19.91
Buckling Load (kip) Vs Half‐wavelength Curve
The optimum d/h Ratio 0.4
309
CUFSM Analysis
Section Configuration 1000S200‐97
Single stack
C Section Vs Sigma Section
Section d/h Ratio
Buckling Load (kip) at different Buckling Mode
Local Distortional Lateral‐Torsional
1000S200‐97‐1 C‐Section 36.53 35.45 23.72
1000S200‐97‐2 0.2 234.95 105.4 23.12
1000S200‐97‐3 0.3 300.47 180.8 27.07
1000S200‐97‐4 0.4 383.46 244.81 35.13
1000S200‐97‐5 0.5 499.21 196.15 46.54
Buckling Load (kip) Vs Half‐wavelength Curve
The optimum d/h Ratio 0.4
310
CUFSM Analysis
Section Configuration 1000S250‐43
Single stack
C Section Vs Sigma Section
Section d/h Ratio
Buckling Load (kip) at different Buckling Mode
Local Distortional Lateral‐Torsional
1000S250‐43‐1 C‐Section 3.35 6.34 13.4
1000S250‐43‐2 0.2 20.79 20.61 12.13
1000S250‐43‐3 0.3 26.45 30.01 15.33
1000S250‐43‐4 0.4 32.17 34.72 20.02
1000S250‐43‐5 0.5 37.94 30.25 25.08
Buckling Load (kip) Vs Half‐wavelength Curve
The optimum d/h Ratio 0.4
311

CUFSM Analysis
Section Configuration 1000S250‐97
Single stack
C Section Vs Sigma Section
Section d/h Ratio
Buckling Load (kip) at different Buckling Mode
Local Distortional Lateral‐Torsional
1000S250‐97‐1 C‐Section 37.42 39.95 39.45
1000S250‐97‐2 0.2 230.27 128.31 36.6
1000S250‐97‐3 0.3 293.04 162.42 39.29
1000S250‐97‐4 0.4 362.17 187.49 46.42
1000S250‐97‐5 0.5 426.97 162.35 57.06
Buckling Load (kip) Vs Half‐wavelength Curve
The optimum d/h Ratio 0.4
312
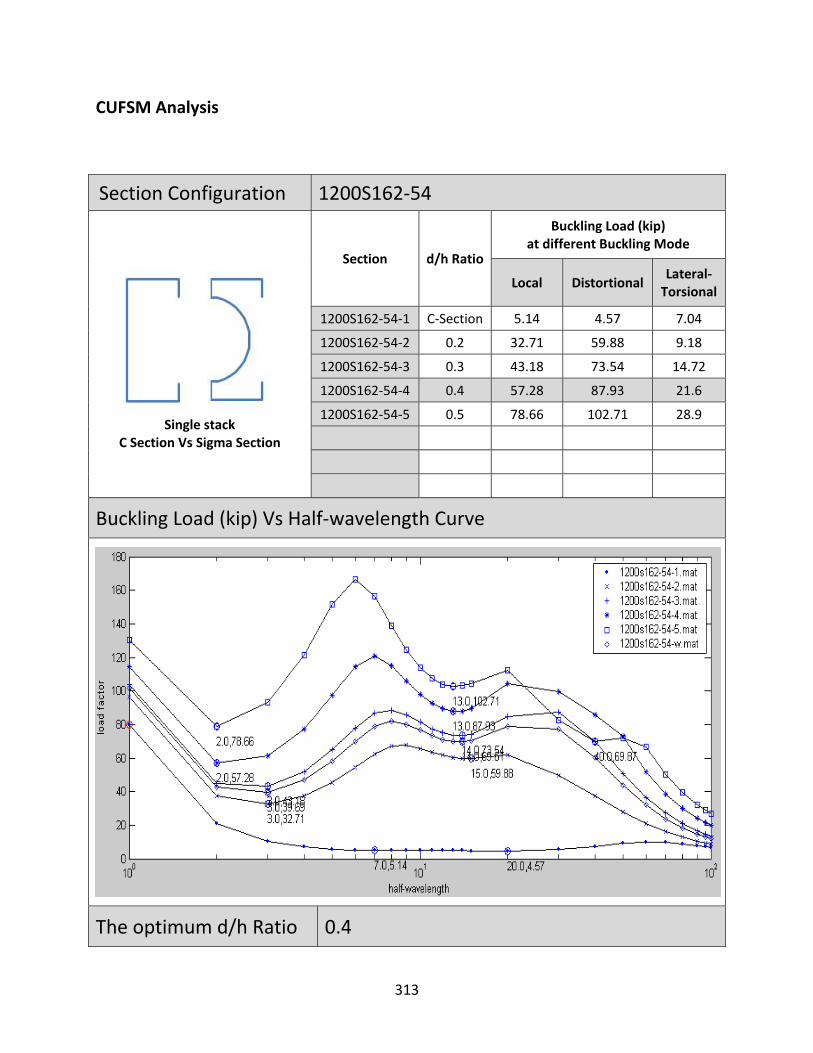
CUFSM Analysis
Section Configuration 1200S162‐54
Single stack
C Section Vs Sigma Section
Section d/h Ratio
Buckling Load (kip) at different Buckling Mode
Local Distortional Lateral‐Torsional
1200S162‐54‐1 C‐Section 5.14 4.57 7.04
1200S162‐54‐2 0.2 32.71 59.88 9.18
1200S162‐54‐3 0.3 43.18 73.54 14.72
1200S162‐54‐4 0.4 57.28 87.93 21.6
1200S162‐54‐5 0.5 78.66 102.71 28.9
Buckling Load (kip) Vs Half‐wavelength Curve
The optimum d/h Ratio 0.4
313
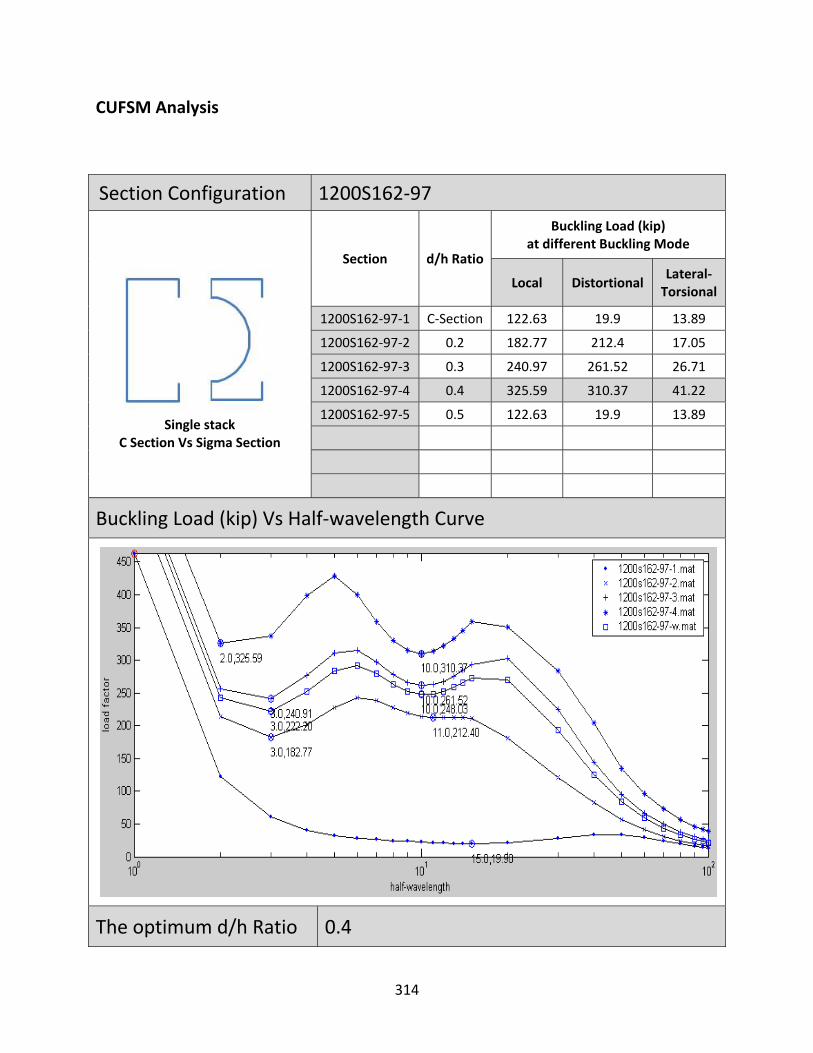
CUFSM Analysis
Section Configuration 1200S162‐97
Single stack
C Section Vs Sigma Section
Section d/h Ratio
Buckling Load (kip) at different Buckling Mode
Local Distortional Lateral‐Torsional
1200S162‐97‐1 C‐Section 122.63 19.9 13.89
1200S162‐97‐2 0.2 182.77 212.4 17.05
1200S162‐97‐3 0.3 240.97 261.52 26.71
1200S162‐97‐4 0.4 325.59 310.37 41.22
1200S162‐97‐5 0.5 122.63 19.9 13.89
Buckling Load (kip) Vs Half‐wavelength Curve
The optimum d/h Ratio 0.4
314
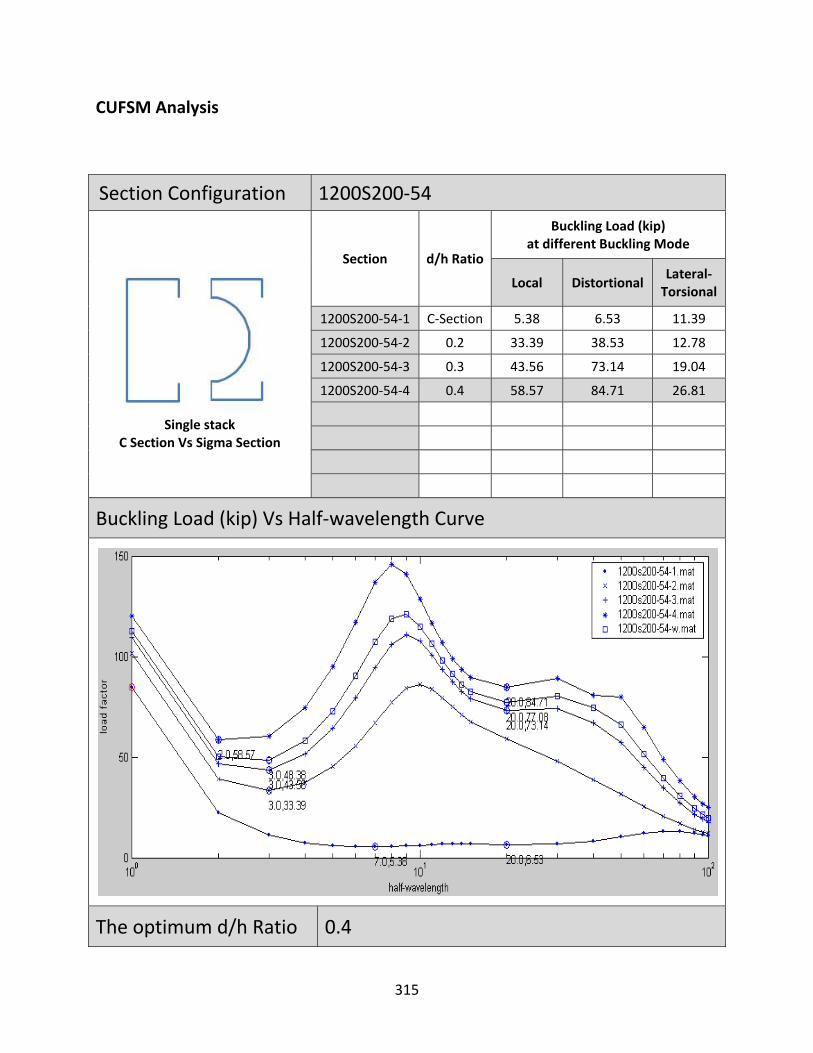
CUFSM Analysis
Section Configuration 1200S200‐54
Single stack
C Section Vs Sigma Section
Section d/h Ratio
Buckling Load (kip) at different Buckling Mode
Local Distortional Lateral‐Torsional
1200S200‐54‐1 C‐Section 5.38 6.53 11.39
1200S200‐54‐2 0.2 33.39 38.53 12.78
1200S200‐54‐3 0.3 43.56 73.14 19.04
1200S200‐54‐4 0.4 58.57 84.71 26.81
Buckling Load (kip) Vs Half‐wavelength Curve
The optimum d/h Ratio 0.4
315

CUFSM Analysis
Section Configuration 1200S200‐97
Single stack
C Section Vs Sigma Section
Section d/h Ratio
Buckling Load (kip) at different Buckling Mode
Local Distortional Lateral‐Torsional
1200S200‐97‐1 C‐Section 129.95 25.62 23.98
1200S200‐97‐2 0.2 188.22 127.19 25.32
1200S200‐97‐3 0.3 245.66 251.97 34.58
1200S200‐97‐4 0.4 334.24 290 49.12
Buckling Load (kip) Vs Half‐wavelength Curve
The optimum d/h Ratio 0.4
316
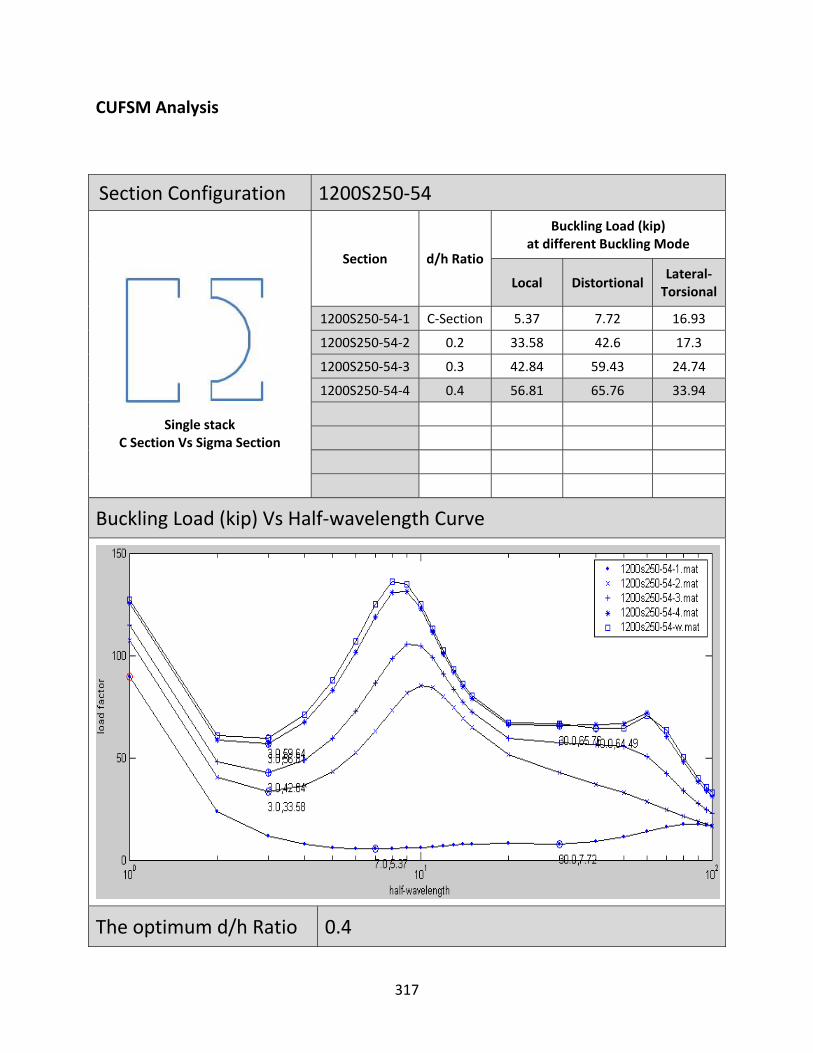
CUFSM Analysis
Section Configuration 1200S250‐54
Single stack
C Section Vs Sigma Section
Section d/h Ratio
Buckling Load (kip) at different Buckling Mode
Local Distortional Lateral‐Torsional
1200S250‐54‐1 C‐Section 5.37 7.72 16.93
1200S250‐54‐2 0.2 33.58 42.6 17.3
1200S250‐54‐3 0.3 42.84 59.43 24.74
1200S250‐54‐4 0.4 56.81 65.76 33.94
Buckling Load (kip) Vs Half‐wavelength Curve
The optimum d/h Ratio 0.4
317
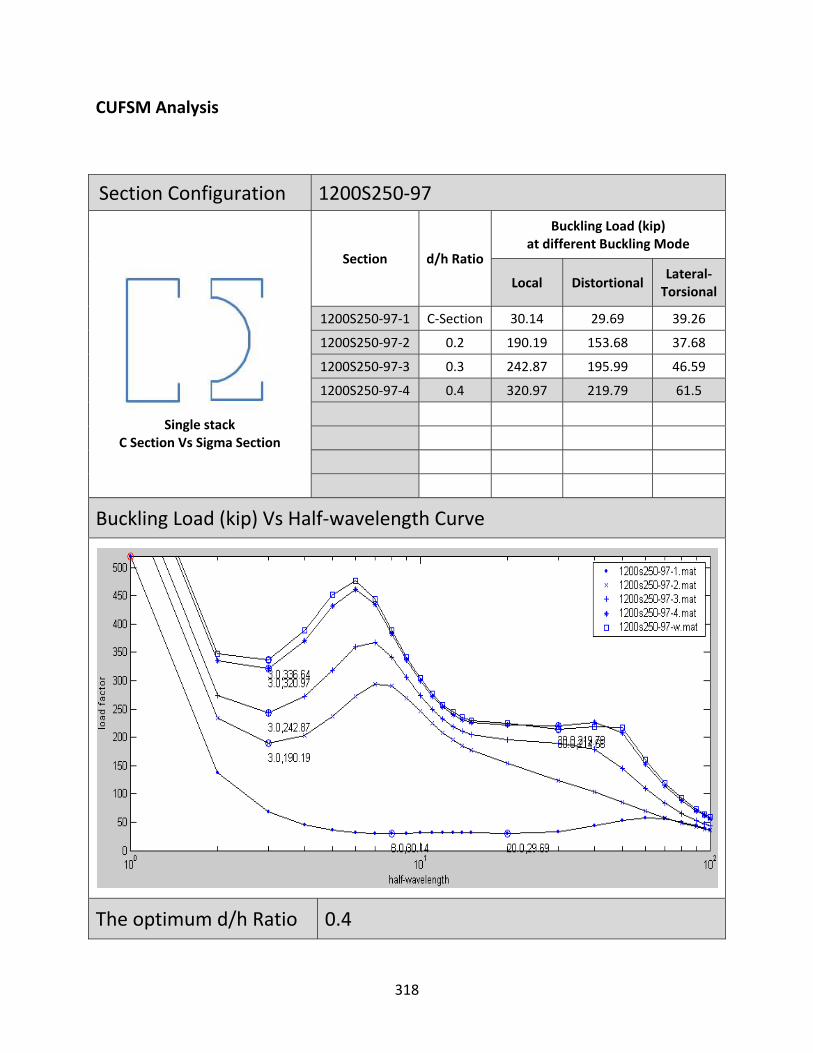
CUFSM Analysis
Section Configuration 1200S250‐97
Single stack
C Section Vs Sigma Section
Section d/h Ratio
Buckling Load (kip) at different Buckling Mode
Local Distortional Lateral‐Torsional
1200S250‐97‐1 C‐Section 30.14 29.69 39.26
1200S250‐97‐2 0.2 190.19 153.68 37.68
1200S250‐97‐3 0.3 242.87 195.99 46.59
1200S250‐97‐4 0.4 320.97 219.79 61.5
Buckling Load (kip) Vs Half‐wavelength Curve
The optimum d/h Ratio 0.4
318

319
APPENDIX F
FINITE STRIP ANALYSIS OF DOUBLE C‐JOIST VS DOUBLE NGS JOIST
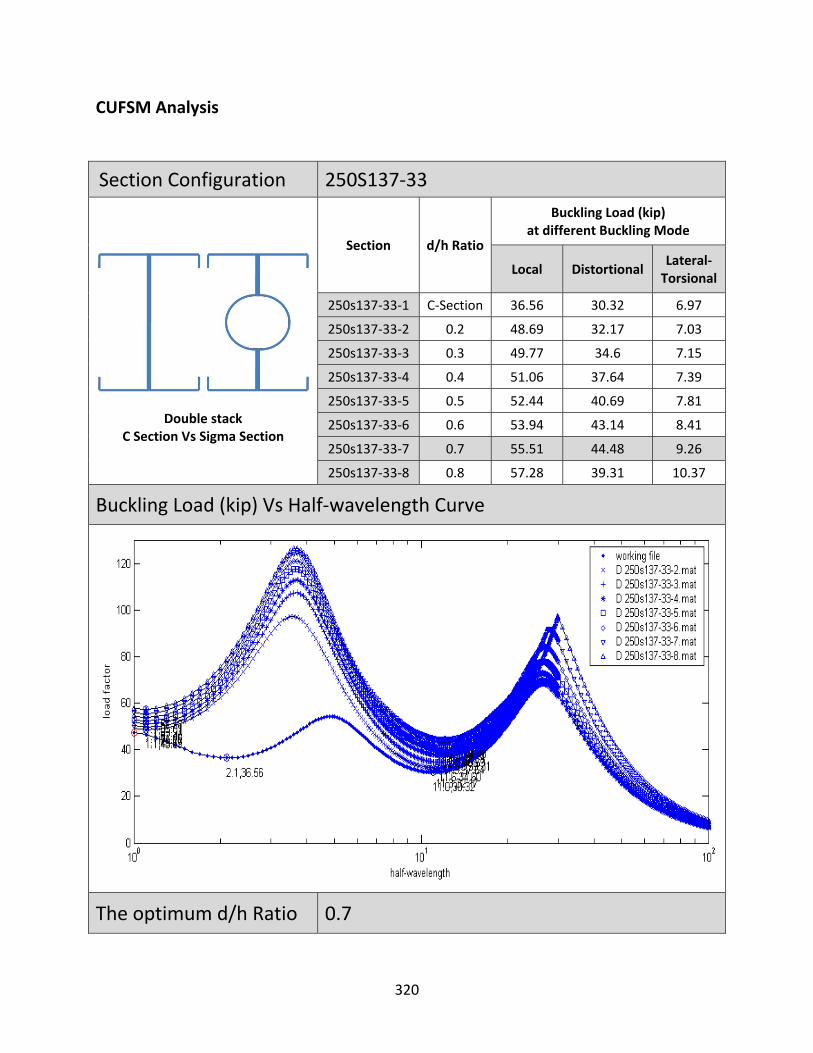
CUFSM Analysis
Section Configuration 250S137‐33
Double stack C Section Vs Sigma Section
Section d/h Ratio
Buckling Load (kip) at different Buckling Mode
Local Distortional Lateral‐Torsional
250s137‐33‐1 C‐Section 36.56 30.32 6.97
250s137‐33‐2 0.2 48.69 32.17 7.03
250s137‐33‐3 0.3 49.77 34.6 7.15
250s137‐33‐4 0.4 51.06 37.64 7.39
250s137‐33‐5 0.5 52.44 40.69 7.81
250s137‐33‐6 0.6 53.94 43.14 8.41
250s137‐33‐7 0.7 55.51 44.48 9.26
250s137‐33‐8 0.8 57.28 39.31 10.37
Buckling Load (kip) Vs Half‐wavelength Curve
The optimum d/h Ratio 0.7
320
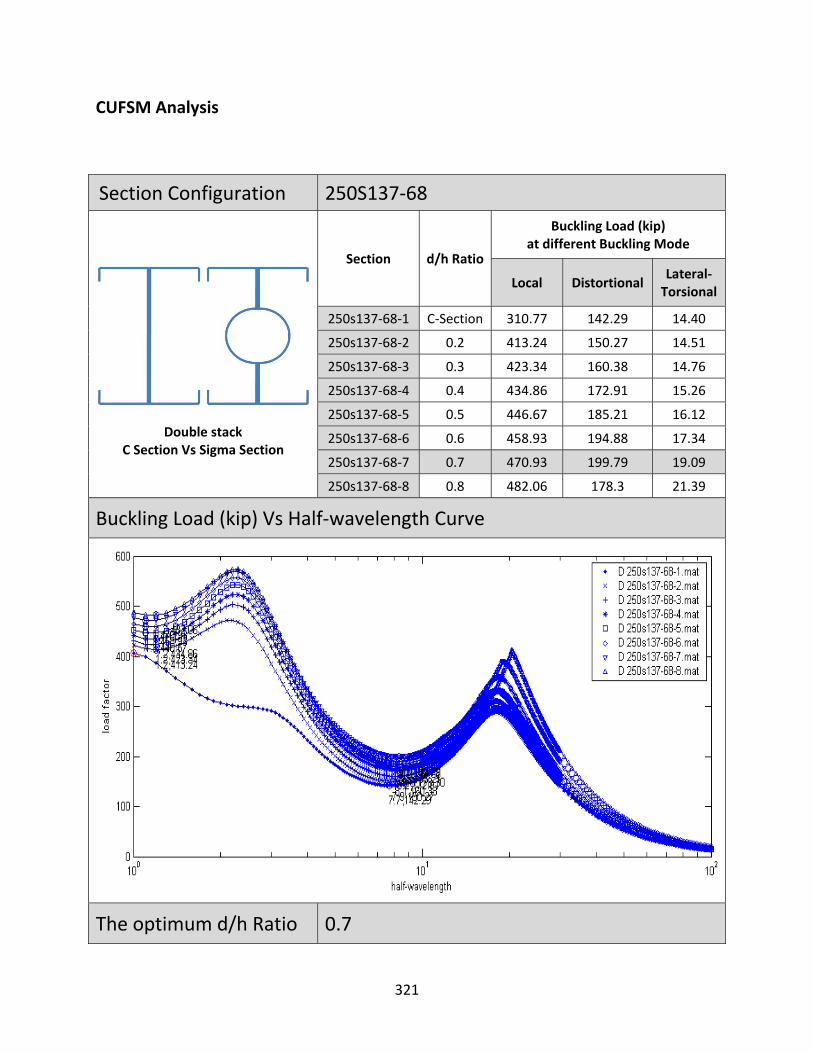
CUFSM Analysis
Section Configuration 250S137‐68
Double stack C Section Vs Sigma Section
Section d/h Ratio
Buckling Load (kip) at different Buckling Mode
Local Distortional Lateral‐Torsional
250s137‐68‐1 C‐Section 310.77 142.29 14.40
250s137‐68‐2 0.2 413.24 150.27 14.51
250s137‐68‐3 0.3 423.34 160.38 14.76
250s137‐68‐4 0.4 434.86 172.91 15.26
250s137‐68‐5 0.5 446.67 185.21 16.12
250s137‐68‐6 0.6 458.93 194.88 17.34
250s137‐68‐7 0.7 470.93 199.79 19.09
250s137‐68‐8 0.8 482.06 178.3 21.39
Buckling Load (kip) Vs Half‐wavelength Curve
The optimum d/h Ratio 0.7
321
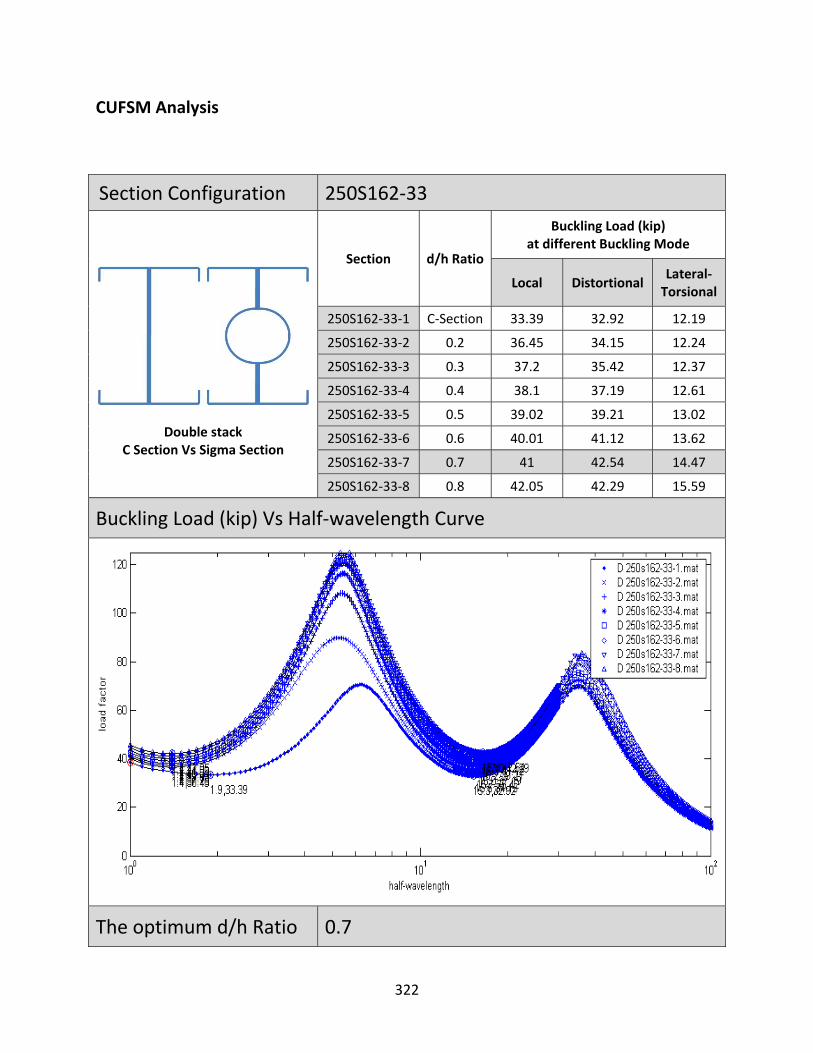
CUFSM Analysis
Section Configuration 250S162‐33
Double stack C Section Vs Sigma Section
Section d/h Ratio
Buckling Load (kip) at different Buckling Mode
Local Distortional Lateral‐Torsional
250S162‐33‐1 C‐Section 33.39 32.92 12.19
250S162‐33‐2 0.2 36.45 34.15 12.24
250S162‐33‐3 0.3 37.2 35.42 12.37
250S162‐33‐4 0.4 38.1 37.19 12.61
250S162‐33‐5 0.5 39.02 39.21 13.02
250S162‐33‐6 0.6 40.01 41.12 13.62
250S162‐33‐7 0.7 41 42.54 14.47
250S162‐33‐8 0.8 42.05 42.29 15.59
Buckling Load (kip) Vs Half‐wavelength Curve
The optimum d/h Ratio 0.7
322

CUFSM Analysis
Section Configuration 250S162‐68
Double stack C Section Vs Sigma Section
Section d/h Ratio
Buckling Load (kip) at different Buckling Mode
Local Distortional Lateral‐Torsional
250S162‐68‐1 C‐Section 287.25 149.54 25.16
250S162‐68‐2 0.2 314.4 154.92 25.27
250S162‐68‐3 0.3 321.23 160.44 25.53
250S162‐68‐4 0.4 328.94 168 26.03
250S162‐68‐5 0.5 336.77 176.47 26.88
250S162‐68‐6 0.6 344.87 184.34 28.11
250S162‐68‐7 0.7 352.43 190.03 29.86
250S162‐68‐8 0.8 358.89 186.21 32.16
Buckling Load (kip) Vs Half‐wavelength Curve
The optimum d/h Ratio 0.7
323
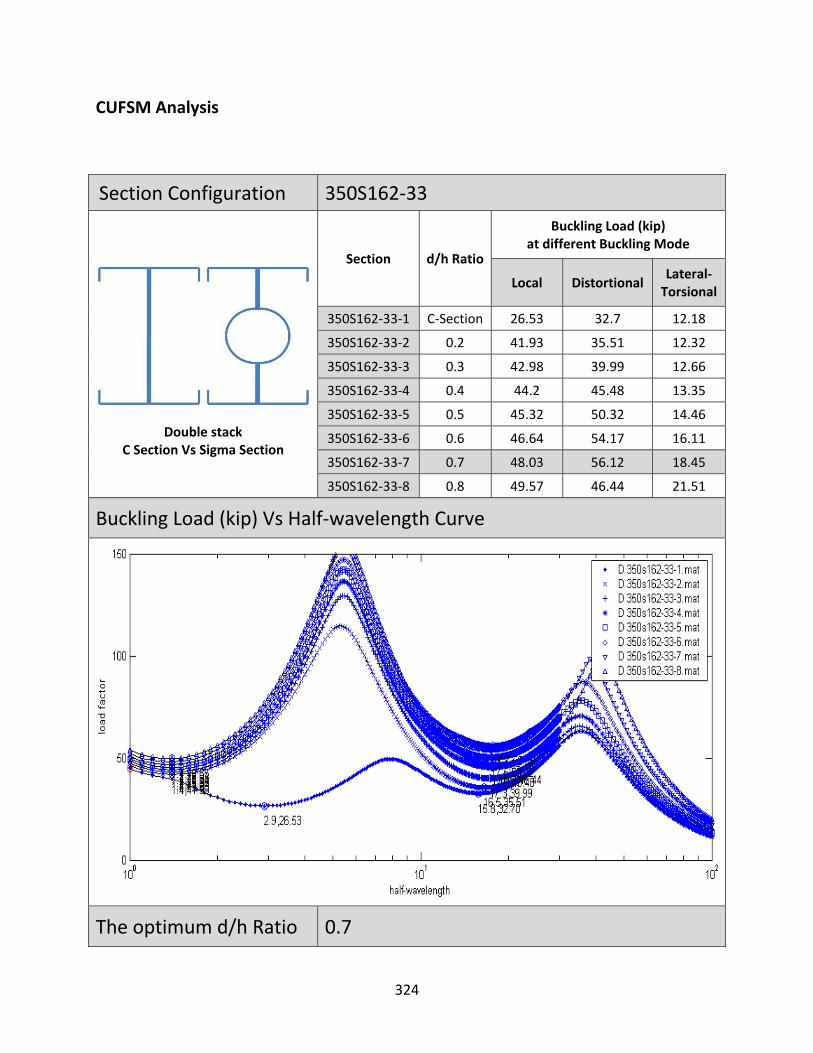
CUFSM Analysis
Section Configuration 350S162‐33
Double stack C Section Vs Sigma Section
Section d/h Ratio
Buckling Load (kip) at different Buckling Mode
Local Distortional Lateral‐Torsional
350S162‐33‐1 C‐Section 26.53 32.7 12.18
350S162‐33‐2 0.2 41.93 35.51 12.32
350S162‐33‐3 0.3 42.98 39.99 12.66
350S162‐33‐4 0.4 44.2 45.48 13.35
350S162‐33‐5 0.5 45.32 50.32 14.46
350S162‐33‐6 0.6 46.64 54.17 16.11
350S162‐33‐7 0.7 48.03 56.12 18.45
350S162‐33‐8 0.8 49.57 46.44 21.51
Buckling Load (kip) Vs Half‐wavelength Curve
The optimum d/h Ratio 0.7
324
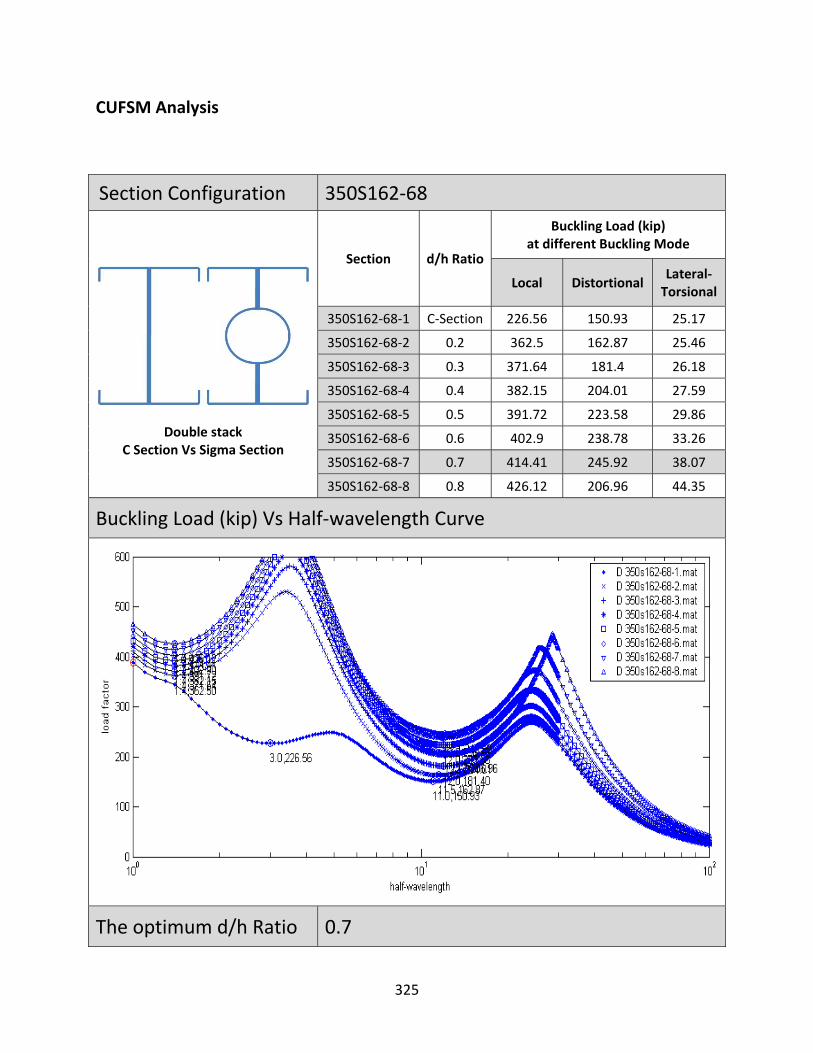
CUFSM Analysis
Section Configuration 350S162‐68
Double stack C Section Vs Sigma Section
Section d/h Ratio
Buckling Load (kip) at different Buckling Mode
Local Distortional Lateral‐Torsional
350S162‐68‐1 C‐Section 226.56 150.93 25.17
350S162‐68‐2 0.2 362.5 162.87 25.46
350S162‐68‐3 0.3 371.64 181.4 26.18
350S162‐68‐4 0.4 382.15 204.01 27.59
350S162‐68‐5 0.5 391.72 223.58 29.86
350S162‐68‐6 0.6 402.9 238.78 33.26
350S162‐68‐7 0.7 414.41 245.92 38.07
350S162‐68‐8 0.8 426.12 206.96 44.35
Buckling Load (kip) Vs Half‐wavelength Curve
The optimum d/h Ratio 0.7
325
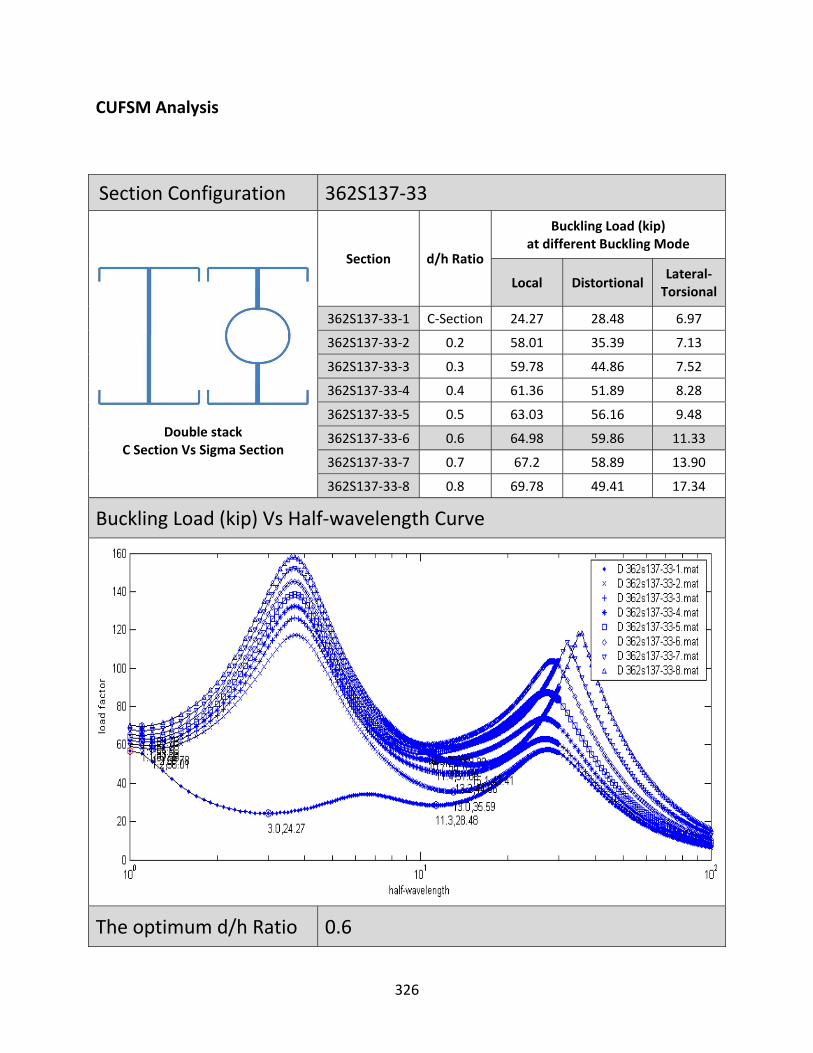
CUFSM Analysis
Section Configuration 362S137‐33
Double stack C Section Vs Sigma Section
Section d/h Ratio
Buckling Load (kip) at different Buckling Mode
Local Distortional Lateral‐Torsional
362S137‐33‐1 C‐Section 24.27 28.48 6.97
362S137‐33‐2 0.2 58.01 35.39 7.13
362S137‐33‐3 0.3 59.78 44.86 7.52
362S137‐33‐4 0.4 61.36 51.89 8.28
362S137‐33‐5 0.5 63.03 56.16 9.48
362S137‐33‐6 0.6 64.98 59.86 11.33
362S137‐33‐7 0.7 67.2 58.89 13.90
362S137‐33‐8 0.8 69.78 49.41 17.34
Buckling Load (kip) Vs Half‐wavelength Curve
The optimum d/h Ratio 0.6
326

CUFSM Analysis
Section Configuration 362S137‐68
Double stack C Section Vs Sigma Section
Section d/h Ratio
Buckling Load (kip) at different Buckling Mode
Local Distortional Lateral‐Torsional
362S137‐68‐1 C‐Section 200.25 139.13 14.41
362S137‐68‐2 0.2 492.89 167.53 14.73
362S137‐68‐3 0.3 507.85 205.02 15.54
362S137‐68‐4 0.4 521.63 233.89 17.09
362S137‐68‐5 0.5 536.58 251.86 19.57
362S137‐68‐6 0.6 553.84 266.5 23.37
362S137‐68‐7 0.7 572.35 259.13 28.67
362S137‐68‐8 0.8 592.15 223.63 35.75
Buckling Load (kip) Vs Half‐wavelength Curve
The optimum d/h Ratio 0.6
327

CUFSM Analysis
Section Configuration 362S162‐33
Double stack C Section Vs Sigma Section
Section d/h Ratio
Buckling Load (kip) at different Buckling Mode
Local Distortional Lateral‐Torsional
362S162‐33‐1 C‐Section 25.54 32.51 12.17
362S162‐33‐2 0.2 42.64 35.69 12.33
362S162‐33‐3 0.3 43.81 40.91 12.72
362S162‐33‐4 0.4 44.88 46.82 13.48
362S162‐33‐5 0.5 46.06 51.93 14.69
362S162‐33‐6 0.6 47.41 56.01 16.54
362S162‐33‐7 0.7 48.88 58.13 19.12
362S162‐33‐8 0.8 50.5 47.08 22.55
Buckling Load (kip) Vs Half‐wavelength Curve
The optimum d/h Ratio 0.7
328

CUFSM Analysis
Section Configuration 362S162‐68
Double stack C Section Vs Sigma Section
Section d/h Ratio
Buckling Load (kip) at different Buckling Mode
Local Distortional Lateral‐Torsional
362S162‐68‐1 C‐Section 218.07 150.47 25.17
362S162‐68‐2 0.2 368.65 163.88 25.50
362S162‐68‐3 0.3 378.8 185.43 26.30
362S162‐68‐4 0.4 388.08 209.64 27.85
362S162‐68‐5 0.5 398.14 230.3 30.34
362S162‐68‐6 0.6 409.61 246.33 34.13
362S162‐68‐7 0.7 421.87 253.73 39.44
362S162‐68‐8 0.8 434.32 210.02 46.51
Buckling Load (kip) Vs Half‐wavelength Curve
The optimum d/h Ratio 0.7
329
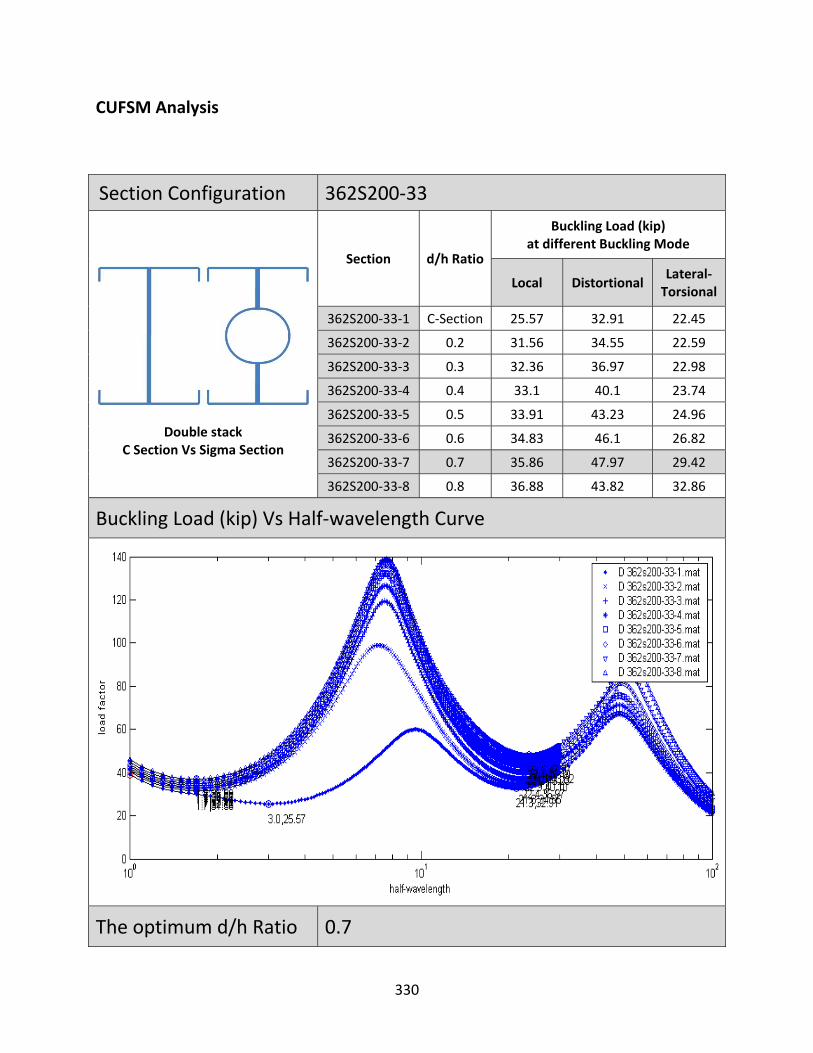
CUFSM Analysis
Section Configuration 362S200‐33
Double stack C Section Vs Sigma Section
Section d/h Ratio
Buckling Load (kip) at different Buckling Mode
Local Distortional Lateral‐Torsional
362S200‐33‐1 C‐Section 25.57 32.91 22.45
362S200‐33‐2 0.2 31.56 34.55 22.59
362S200‐33‐3 0.3 32.36 36.97 22.98
362S200‐33‐4 0.4 33.1 40.1 23.74
362S200‐33‐5 0.5 33.91 43.23 24.96
362S200‐33‐6 0.6 34.83 46.1 26.82
362S200‐33‐7 0.7 35.86 47.97 29.42
362S200‐33‐8 0.8 36.88 43.82 32.86
Buckling Load (kip) Vs Half‐wavelength Curve
The optimum d/h Ratio 0.7
330
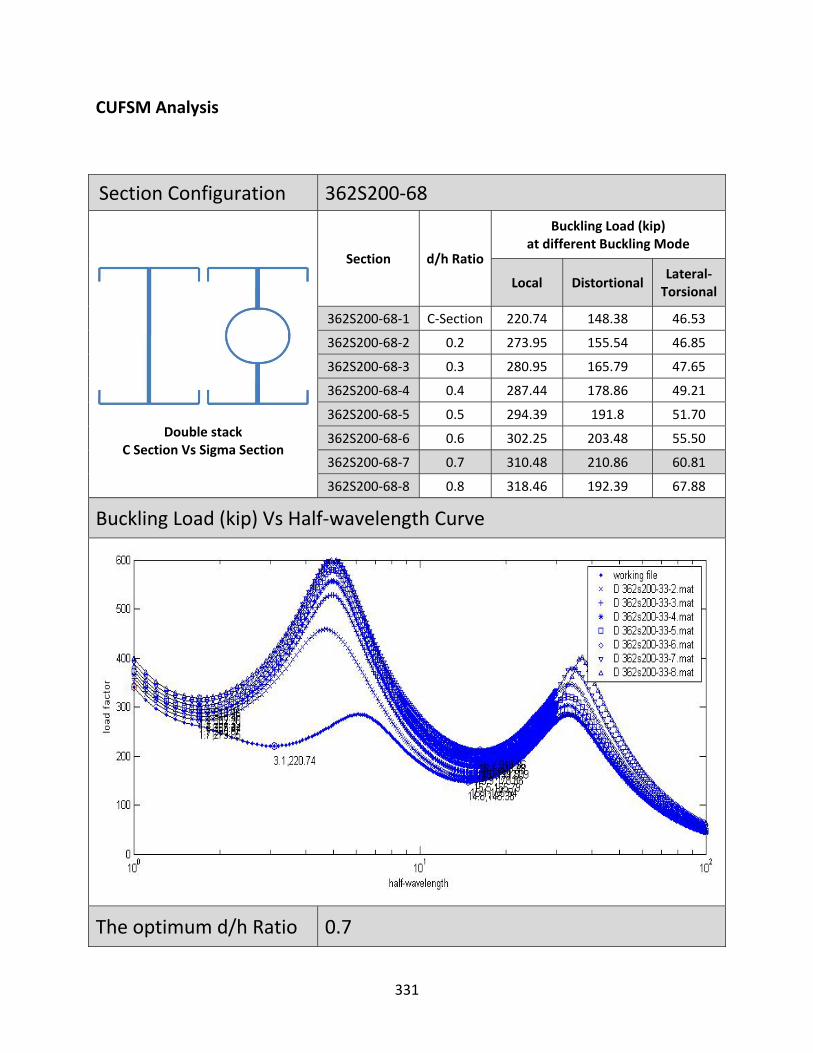
CUFSM Analysis
Section Configuration 362S200‐68
Double stack C Section Vs Sigma Section
Section d/h Ratio
Buckling Load (kip) at different Buckling Mode
Local Distortional Lateral‐Torsional
362S200‐68‐1 C‐Section 220.74 148.38 46.53
362S200‐68‐2 0.2 273.95 155.54 46.85
362S200‐68‐3 0.3 280.95 165.79 47.65
362S200‐68‐4 0.4 287.44 178.86 49.21
362S200‐68‐5 0.5 294.39 191.8 51.70
362S200‐68‐6 0.6 302.25 203.48 55.50
362S200‐68‐7 0.7 310.48 210.86 60.81
362S200‐68‐8 0.8 318.46 192.39 67.88
Buckling Load (kip) Vs Half‐wavelength Curve
The optimum d/h Ratio 0.7
331
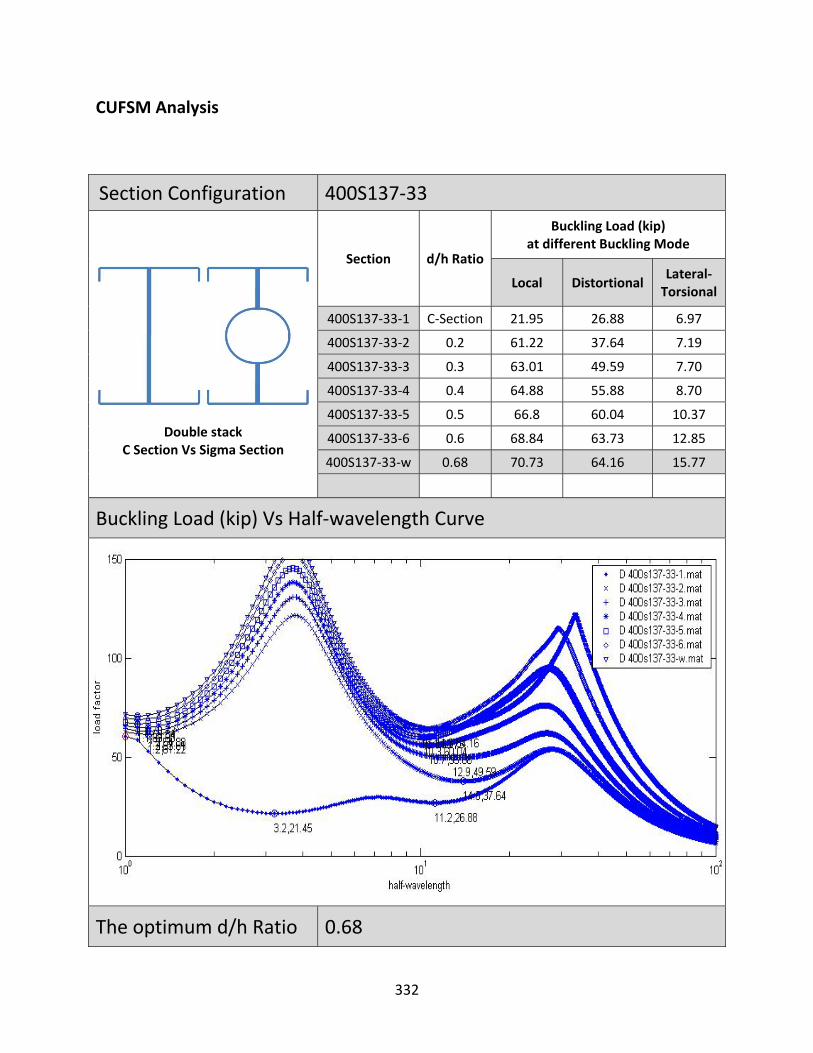
CUFSM Analysis
Section Configuration 400S137‐33
Double stack C Section Vs Sigma Section
Section d/h Ratio
Buckling Load (kip) at different Buckling Mode
Local Distortional Lateral‐Torsional
400S137‐33‐1 C‐Section 21.95 26.88 6.97
400S137‐33‐2 0.2 61.22 37.64 7.19
400S137‐33‐3 0.3 63.01 49.59 7.70
400S137‐33‐4 0.4 64.88 55.88 8.70
400S137‐33‐5 0.5 66.8 60.04 10.37
400S137‐33‐6 0.6 68.84 63.73 12.85
400S137‐33‐w 0.68 70.73 64.16 15.77
Buckling Load (kip) Vs Half‐wavelength Curve
The optimum d/h Ratio 0.68
332

CUFSM Analysis
Section Configuration 400S137‐68
Double stack C Section Vs Sigma Section
Section d/h Ratio
Buckling Load (kip) at different Buckling Mode
Local Distortional Lateral‐Torsional
400S137‐68‐1 C‐Section ‐ 134.03 14.41
400S137‐68‐2 0.2 520.3 176.5 14.86
400S137‐68‐3 0.3 535.58 225.03 15.92
400S137‐68‐4 0.4 551.27 252.25 17.97
400S137‐68‐5 0.5 568.33 270.22 21.41
400S137‐68‐6 0.6 586.49 284.81 26.50
400S137‐68‐w 0.68 602.87 282.27 32.51
Buckling Load (kip) Vs Half‐wavelength Curve
The optimum d/h Ratio 0.68
333

CUFSM Analysis
Section Configuration 400S162‐33
Double stack C Section Vs Sigma Section
Section d/h Ratio
Buckling Load (kip) at different Buckling Mode
Local Distortional Lateral‐Torsional
400S162‐33‐1 C‐Section 22.71 31.68 12.17
400S162‐33‐2 0.2 44.8 36.52 12.38
400S162‐33‐3 0.3 45.97 43.74 12.90
400S162‐33‐4 0.4 47.21 51.36 13.90
400S162‐33‐5 0.5 48.55 57.63 15.57
400S162‐33‐6 0.6 49.97 62.04 18.06
400S162‐33‐7 0.7 51.53 62.05 21.50
400S162‐33‐8 0.8 53.31 49.98 26.12
Buckling Load (kip) Vs Half‐wavelength Curve
The optimum d/h Ratio 0.7
334
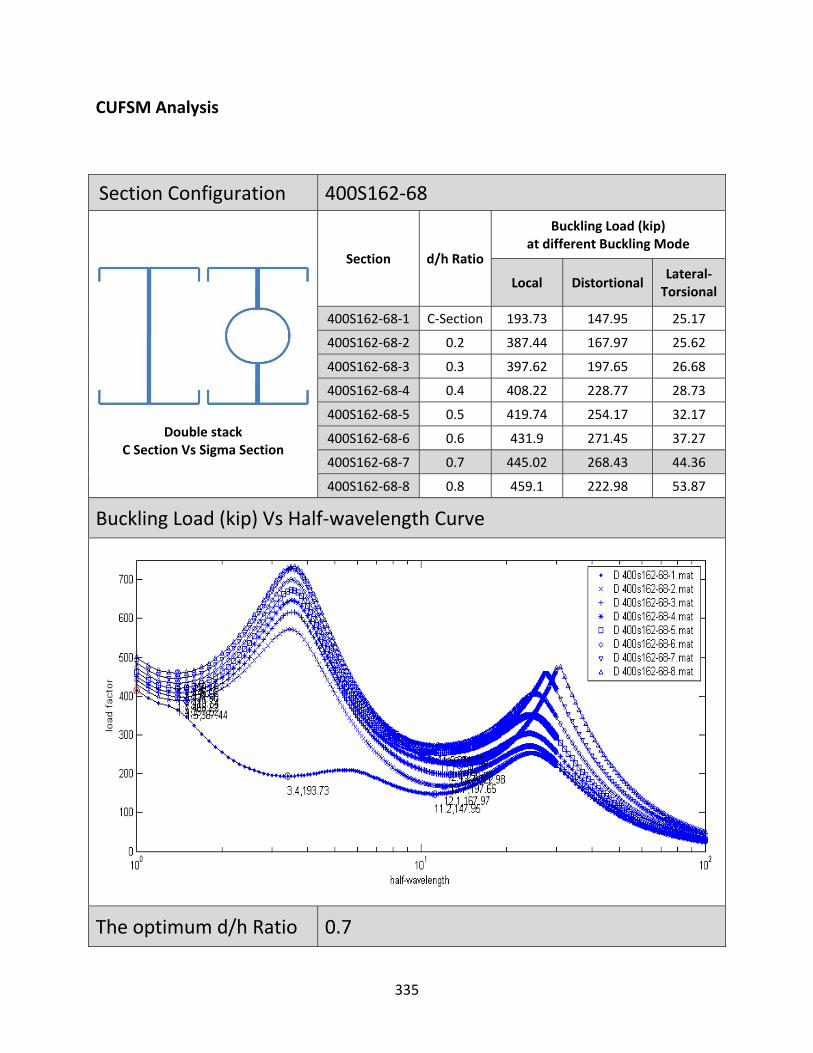
CUFSM Analysis
Section Configuration 400S162‐68
Double stack C Section Vs Sigma Section
Section d/h Ratio
Buckling Load (kip) at different Buckling Mode
Local Distortional Lateral‐Torsional
400S162‐68‐1 C‐Section 193.73 147.95 25.17
400S162‐68‐2 0.2 387.44 167.97 25.62
400S162‐68‐3 0.3 397.62 197.65 26.68
400S162‐68‐4 0.4 408.22 228.77 28.73
400S162‐68‐5 0.5 419.74 254.17 32.17
400S162‐68‐6 0.6 431.9 271.45 37.27
400S162‐68‐7 0.7 445.02 268.43 44.36
400S162‐68‐8 0.8 459.1 222.98 53.87
Buckling Load (kip) Vs Half‐wavelength Curve
The optimum d/h Ratio 0.7
335
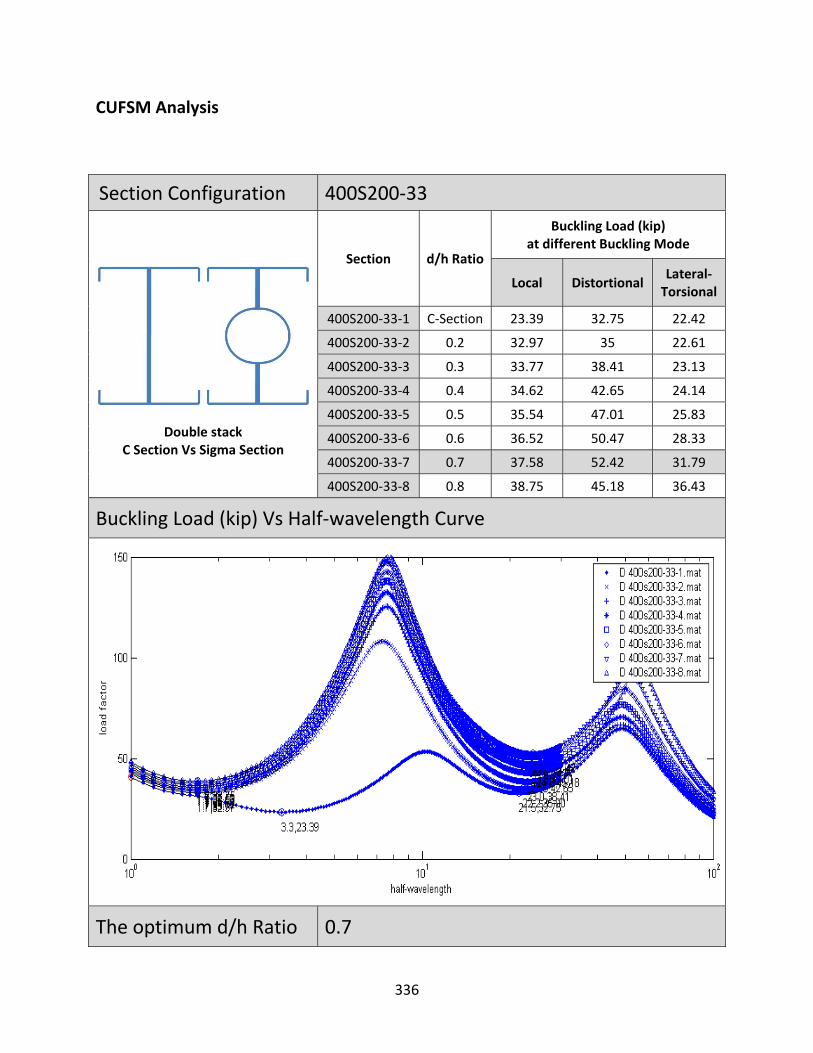
CUFSM Analysis
Section Configuration 400S200‐33
Double stack C Section Vs Sigma Section
Section d/h Ratio
Buckling Load (kip) at different Buckling Mode
Local Distortional Lateral‐Torsional
400S200‐33‐1 C‐Section 23.39 32.75 22.42
400S200‐33‐2 0.2 32.97 35 22.61
400S200‐33‐3 0.3 33.77 38.41 23.13
400S200‐33‐4 0.4 34.62 42.65 24.14
400S200‐33‐5 0.5 35.54 47.01 25.83
400S200‐33‐6 0.6 36.52 50.47 28.33
400S200‐33‐7 0.7 37.58 52.42 31.79
400S200‐33‐8 0.8 38.75 45.18 36.43
Buckling Load (kip) Vs Half‐wavelength Curve
The optimum d/h Ratio 0.7
336

CUFSM Analysis
Section Configuration 400S200‐68
Double stack C Section Vs Sigma Section
Section d/h Ratio
Buckling Load (kip) at different Buckling Mode
Local Distortional Lateral‐Torsional
400S200‐68‐1 C‐Section 201.8 148.28 46.53
400S200‐68‐2 0.2 286.3 157.97 46.97
400S200‐68‐3 0.3 293.32 172.27 48.02
400S200‐68‐4 0.4 300.67 189.88 50.08
400S200‐68‐5 0.5 308.63 207.79 53.52
400S200‐68‐6 0.6 317.02 221.7 58.63
400S200‐68‐7 0.7 325.92 229.21 65.72
400S200‐68‐8 0.8 335.11 199.01 75.24
Buckling Load (kip) Vs Half‐wavelength Curve
The optimum d/h Ratio 0.7
337
CUFSM Analysis
Section Configuration 550S162‐33
Double stack C Section Vs Sigma Section
Section d/h Ratio
Buckling Load (kip) at different Buckling Mode
Local Distortional Lateral‐Torsional
550S162‐33‐1 C‐Section 15.43 25.13 12.11
550S162‐33‐2 0.2 53.2 41.2 12.66
550S162‐33‐3 0.3 54.83 60.53 14.02
550S162‐33‐4 0.4 56.51 67.27 16.65
550S162‐33‐5 0.5 58.14 72.26 20.97
550S162‐33‐w 0.59 59.79 76.48 26.73
Buckling Load (kip) Vs Half‐wavelength Curve
The optimum d/h Ratio 0.59
338

CUFSM Analysis
Section Configuration 550S162‐68
Double stack C Section Vs Sigma Section
Section d/h Ratio
Buckling Load (kip) at different Buckling Mode
Local Distortional Lateral‐Torsional
550S162‐68‐1 C‐Section 129.67 124.1 25.17
550S162‐68‐2 0.2 459.74 188.04 26.33
550S162‐68‐3 0.3 473.75 268.89 29.09
550S162‐68‐4 0.4 488.74 299.26 34.45
550S162‐68‐5 0.5 502.94 320.79 43.29
550S162‐68‐w 0.59 517.08 337.76 55.12
Buckling Load (kip) Vs Half‐wavelength Curve
The optimum d/h Ratio 0.59
339
CUFSM Analysis
Section Configuration 600S137‐33
Double stack C Section Vs Sigma Section
Section d/h Ratio
Buckling Load (kip) at different Buckling Mode
Local Distortional Lateral‐Torsional
600S137‐33‐1 C‐Section 13 ‐ 6.94
600S137‐33‐2 0.2 73.3 59.32 7.67
600S137‐33‐3 0.3 80.24 65.21 9.46
600S137‐33‐4 0.4 83.4 69.9 12.85
600S137‐33‐w 0.45 84.92 72.61 15.77
Buckling Load (kip) Vs Half‐wavelength Curve
The optimum d/h Ratio 0.45
340
CUFSM Analysis
Section Configuration 600S137‐54
Double stack C Section Vs Sigma Section
Section d/h Ratio
Buckling Load (kip) at different Buckling Mode
Local Distortional Lateral‐Torsional
600S137‐54‐1 C‐Section 51.93 ‐ 11.42
600S137‐54‐2 0.2 312.3 171.05 12.62
600S137‐54‐3 0.3 345.22 182.59 15.52
600S137‐54‐4 0.4 359.87 195.46 21.04
600S137‐54‐w 0.45 366.58 202.82 25.81
Buckling Load (kip) Vs Half‐wavelength Curve
The optimum d/h Ratio 0.45
341
CUFSM Analysis
Section Configuration 600S137‐97
Double stack C Section Vs Sigma Section
Section d/h Ratio
Buckling Load (kip) at different Buckling Mode
Local Distortional Lateral‐Torsional
600S137‐97‐1 C‐Section 231.06 ‐ 20.66
600S137‐97‐2 0.2 670.77 485.84 22.80
600S137‐97‐3 0.3 1156.79 644.92 27.98
600S137‐97‐4 0.4 1165.11 688.57 37.88
600S137‐97‐w 0.45 1243.99 712.96 46.44
Buckling Load (kip) Vs Half‐wavelength Curve
The optimum d/h Ratio 0.45
342
CUFSM Analysis
Section Configuration 600S162‐33
Double stack C Section Vs Sigma Section
Section d/h Ratio
Buckling Load (kip) at different Buckling Mode
Local Distortional Lateral‐Torsional
600S162‐33‐1 C‐Section 13.78 ‐ 12.08
600S162‐33‐2 0.2 55.93 42.81 12.79
600S162‐33‐3 0.3 57.85 64.92 14.59
600S162‐33‐4 0.4 59.68 70.67 18.02
600S162‐33‐5 0.5 61.48 75.79 23.63
600S162‐33‐w 0.54 62.2 77.96 26.73
Buckling Load (kip) Vs Half‐wavelength Curve
The optimum d/h Ratio 0.54
343
CUFSM Analysis
Section Configuration 600S162‐54
Double stack C Section Vs Sigma Section
Section d/h Ratio
Buckling Load (kip) at different Buckling Mode
Local Distortional Lateral‐Torsional
600S162‐54‐1 C‐Section 59.25 66.73 19.93
600S162‐54‐2 0.2 243.33 119.15 21.11
600S162‐54‐3 0.3 251.65 178.92 24.02
600S162‐54‐4 0.4 259.6 194.77 29.56
600S162‐54‐5 0.5 267.57 208.65 38.69
600S162‐54‐w 0.54 270.71 214.41 43.75
Buckling Load (kip) Vs Half‐wavelength Curve
The optimum d/h Ratio 0.54
344
CUFSM Analysis
Section Configuration 600S162‐97
Double stack C Section Vs Sigma Section
Section d/h Ratio
Buckling Load (kip) at different Buckling Mode
Local Distortional Lateral‐Torsional
600S162‐97‐1 C‐Section 262.71 ‐ 36.01
600S162‐97‐2 0.2 1372.24 414.59 38.15
600S162‐97‐3 0.3 1422.92 612.5 43.33
600S162‐97‐4 0.4 1467.44 666.86 53.25
600S162‐97‐5 0.5 1513.8 712.53 69.61
600S162‐97‐w 0.54 1532.42 730.51 78.68
Buckling Load (kip) Vs Half‐wavelength Curve
The optimum d/h Ratio 0.54
345

CUFSM Analysis
Section Configuration 600S200‐33
Double stack C Section Vs Sigma Section
Section d/h Ratio
Buckling Load (kip) at different Buckling Mode
Local Distortional Lateral‐Torsional
600S200‐33‐1 C‐Section 14.51 27.89 22.11
600S200‐33‐2 0.2 40.34 38.49 22.74
600S200‐33‐3 0.3 41.57 52.56 24.57
600S200‐33‐4 0.4 42.78 62.3 28.07
600S200‐33‐5 0.5 44.01 67.63 33.79
600S200‐33‐6 0.6 45.33 72.51 42.17
600S200‐33‐w 0.67 46.28 72.97 49.46
Buckling Load (kip) Vs Half‐wavelength Curve
The optimum d/h Ratio 0.67
346
CUFSM Analysis
Section Configuration 600S200‐54
Double stack C Section Vs Sigma Section
Section d/h Ratio
Buckling Load (kip) at different Buckling Mode
Local Distortional Lateral‐Torsional
600S200‐54‐1 C‐Section 63 79.38 36.72
600S200‐54‐2 0.2 175.92 107.08 37.86
600S200‐54‐3 0.3 181.28 144.21 40.78
600S200‐54‐4 0.4 186.52 170.22 46.37
600S200‐54‐5 0.5 191.96 184.6 55.56
600S200‐54‐6 0.6 197.67 197.29 69.15
600S200‐54‐w 0.67 201.79 197.54 81.04
Buckling Load (kip) Vs Half‐wavelength Curve
The optimum d/h Ratio 0.67
347
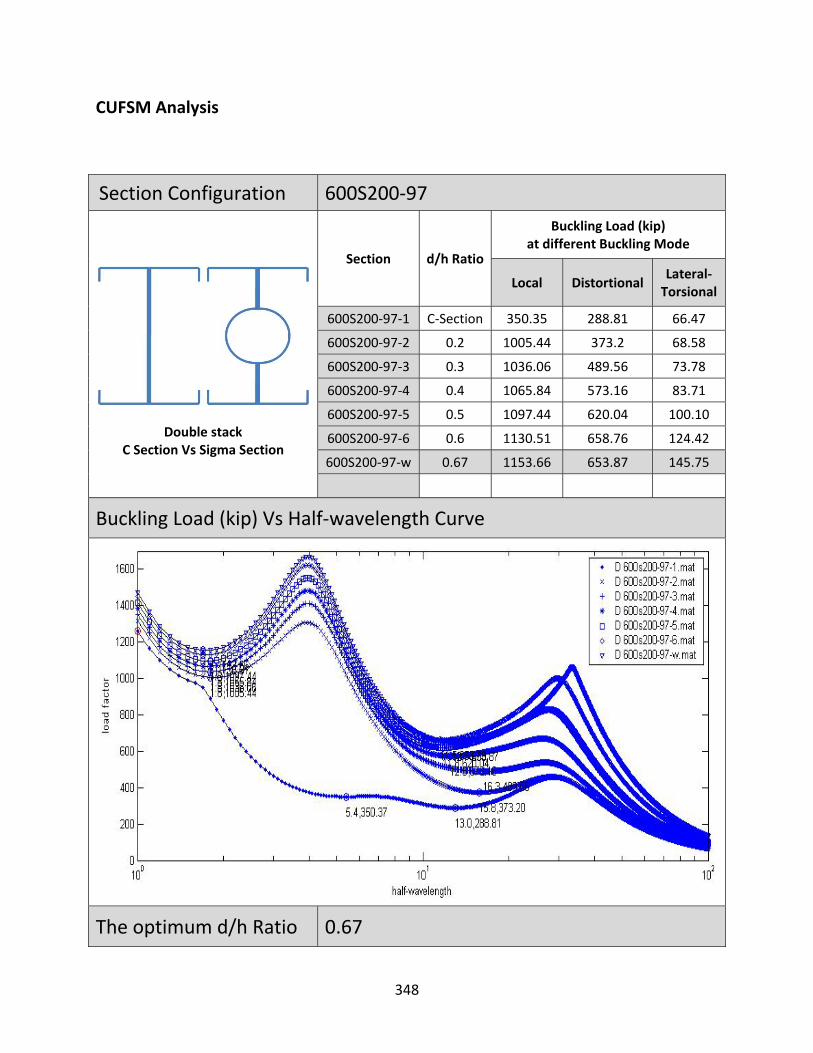
CUFSM Analysis
Section Configuration 600S200‐97
Double stack C Section Vs Sigma Section
Section d/h Ratio
Buckling Load (kip) at different Buckling Mode
Local Distortional Lateral‐Torsional
600S200‐97‐1 C‐Section 350.35 288.81 66.47
600S200‐97‐2 0.2 1005.44 373.2 68.58
600S200‐97‐3 0.3 1036.06 489.56 73.78
600S200‐97‐4 0.4 1065.84 573.16 83.71
600S200‐97‐5 0.5 1097.44 620.04 100.10
600S200‐97‐6 0.6 1130.51 658.76 124.42
600S200‐97‐w 0.67 1153.66 653.87 145.75
Buckling Load (kip) Vs Half‐wavelength Curve
The optimum d/h Ratio 0.67
348
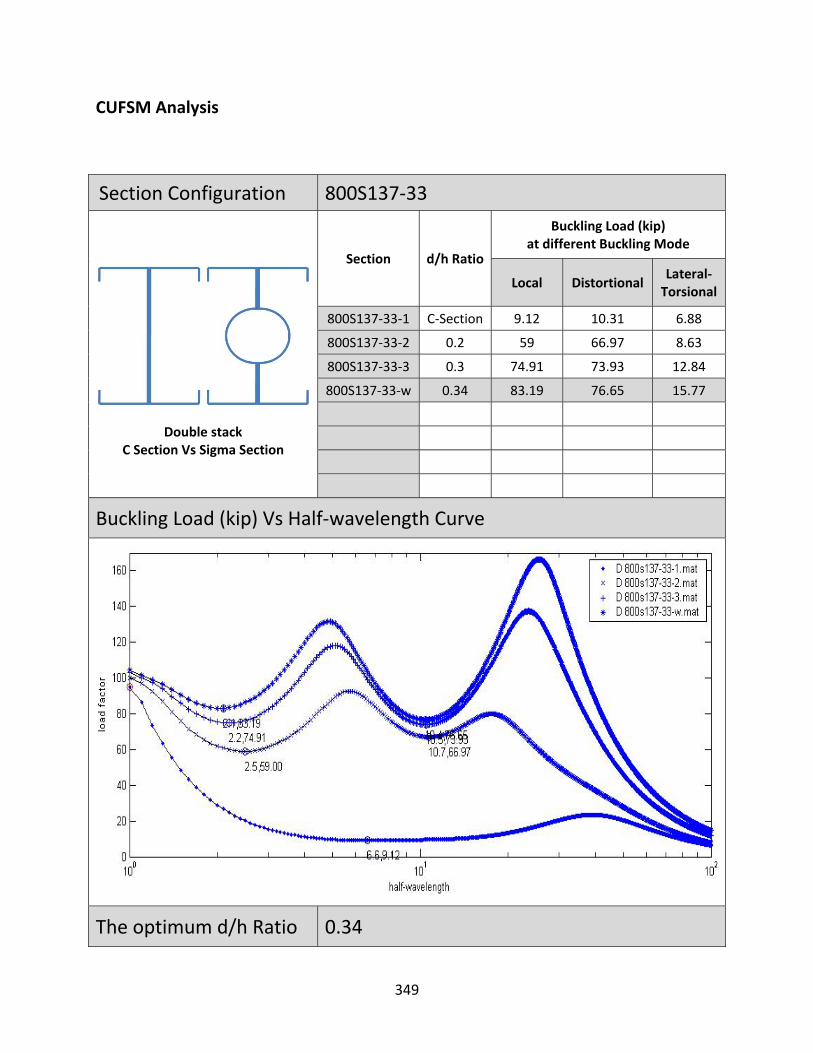
CUFSM Analysis
Section Configuration 800S137‐33
Double stack C Section Vs Sigma Section
Section d/h Ratio
Buckling Load (kip) at different Buckling Mode
Local Distortional Lateral‐Torsional
800S137‐33‐1 C‐Section 9.12 10.31 6.88
800S137‐33‐2 0.2 59 66.97 8.63
800S137‐33‐3 0.3 74.91 73.93 12.84
800S137‐33‐w 0.34 83.19 76.65 15.77
Buckling Load (kip) Vs Half‐wavelength Curve
The optimum d/h Ratio 0.34
349
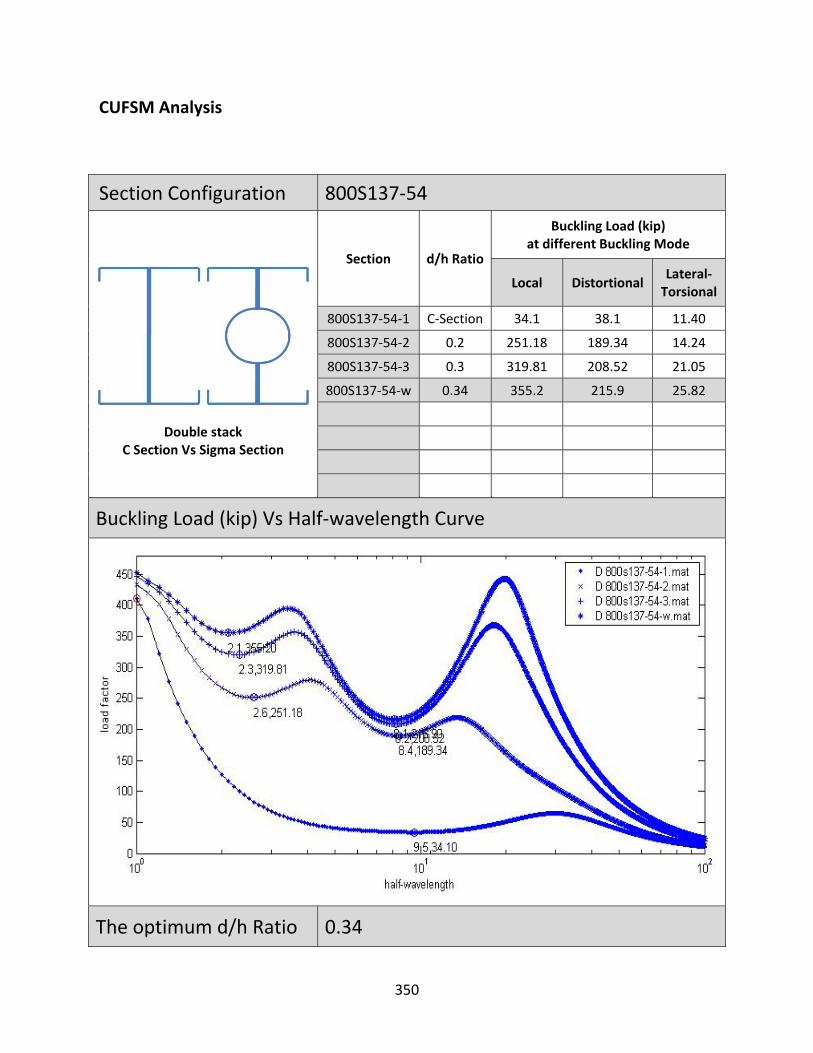
CUFSM Analysis
Section Configuration 800S137‐54
Double stack C Section Vs Sigma Section
Section d/h Ratio
Buckling Load (kip) at different Buckling Mode
Local Distortional Lateral‐Torsional
800S137‐54‐1 C‐Section 34.1 38.1 11.40
800S137‐54‐2 0.2 251.18 189.34 14.24
800S137‐54‐3 0.3 319.81 208.52 21.05
800S137‐54‐w 0.34 355.2 215.9 25.82
Buckling Load (kip) Vs Half‐wavelength Curve
The optimum d/h Ratio 0.34
350
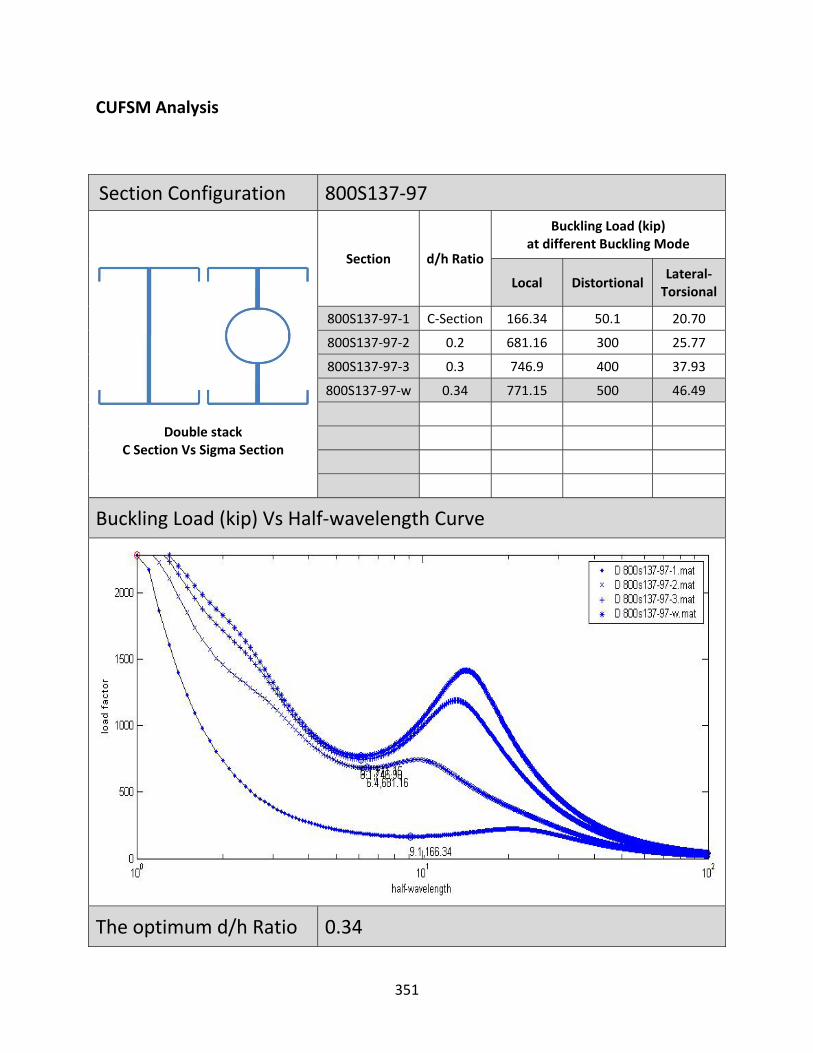
CUFSM Analysis
Section Configuration 800S137‐97
Double stack C Section Vs Sigma Section
Section d/h Ratio
Buckling Load (kip) at different Buckling Mode
Local Distortional Lateral‐Torsional
800S137‐97‐1 C‐Section 166.34 50.1 20.70
800S137‐97‐2 0.2 681.16 300 25.77
800S137‐97‐3 0.3 746.9 400 37.93
800S137‐97‐w 0.34 771.15 500 46.49
Buckling Load (kip) Vs Half‐wavelength Curve
The optimum d/h Ratio 0.34
351
CUFSM Analysis
Section Configuration 800S162‐33
Double stack C Section Vs Sigma Section
Section d/h Ratio
Buckling Load (kip) at different Buckling Mode
Local Distortional Lateral‐Torsional
800S162‐33‐1 C‐Section 9.75 8 11.88
800S162‐33‐2 0.2 58.58 70 13.60
800S162‐33‐3 0.3 68.4 75.47 17.92
800S162‐33‐4 0.4 72 81.57 26.12
800S162‐33‐w 0.41 72.07 81.87 26.73
Buckling Load (kip) Vs Half‐wavelength Curve
The optimum d/h Ratio 0.41
352
CUFSM Analysis
Section Configuration 800S162‐54
Double stack C Section Vs Sigma Section
Section d/h Ratio
Buckling Load (kip) at different Buckling Mode
Local Distortional Lateral‐Torsional
800S162‐54‐1 C‐Section 41.19 40 19.83
800S162‐54‐2 0.2 251.87 160 22.65
800S162‐54‐3 0.3 296.67 209.11 29.52
800S162‐54‐4 0.4 313.27 225.72 42.78
800S162‐54‐w 0.41 313.58 226.54 43.76
Buckling Load (kip) Vs Half‐wavelength Curve
The optimum d/h Ratio 0.41
353

CUFSM Analysis
Section Configuration 800S162‐97
Double stack C Section Vs Sigma Section
Section d/h Ratio
Buckling Load (kip) at different Buckling Mode
Local Distortional Lateral‐Torsional
800S162‐97‐1 C‐Section 188.95 150 36.03
800S162‐97‐2 0.2 700 450 41.08
800S162‐97‐3 0.3 1641.65 723.54 53.28
800S162‐97‐4 0.4 1767.37 779.18 76.97
800S162‐97‐w 0.41 1769.59 781.82 78.74
Buckling Load (kip) Vs Half‐wavelength Curve
The optimum d/h Ratio 0.41
354

CUFSM Analysis
Section Configuration 800S200‐33
Double stack C Section Vs Sigma Section
Section d/h Ratio
Buckling Load (kip) at different Buckling Mode
Local Distortional Lateral‐Torsional
800S200‐33‐1 C‐Section 10.21 8 21.44
800S200‐33‐2 0.2 47.58 43.28 23.00
800S200‐33‐3 0.3 49.54 68.07 27.53
800S200‐33‐4 0.4 51.42 73.75 36.08
800S200‐33‐5 0.5 53.23 79.09 49.46
Buckling Load (kip) Vs Half‐wavelength Curve
The optimum d/h Ratio 0.5
355
CUFSM Analysis
Section Configuration 800S200‐54
Double stack C Section Vs Sigma Section
Section d/h Ratio
Buckling Load (kip) at different Buckling Mode
Local Distortional Lateral‐Torsional
800S200‐54‐1 C‐Section 22.5 12 28.61
800S200‐54‐2 0.2 105.19 74.48 30.74
800S200‐54‐3 0.3 109.51 117.06 36.42
800S200‐54‐4 0.4 113.67 126.83 47.30
800S200‐54‐5 0.5 117.65 135.9 63.88
Buckling Load (kip) Vs Half‐wavelength Curve
The optimum d/h Ratio 0.5
356

CUFSM Analysis
Section Configuration 800S200‐97
Double stack C Section Vs Sigma Section
Section d/h Ratio
Buckling Load (kip) at different Buckling Mode
Local Distortional Lateral‐Torsional
800S200‐97‐1 C‐Section 222.12 200 66.36
800S200‐97‐2 0.2 1182.89 500 71.36
800S200‐97‐3 0.3 1281.04 634.21 83.63
800S200‐97‐4 0.4 1277.37 686.65 107.43
800S200‐97‐5 0.5 1321.74 734.39 145.81
Buckling Load (kip) Vs Half‐wavelength Curve
The optimum d/h Ratio 0.5
357
CUFSM Analysis
Section Configuration 800S250‐43
Double stack C Section Vs Sigma Section
Section d/h Ratio
Buckling Load (kip) at different Buckling Mode
Local Distortional Lateral‐Torsional
800S250‐43‐1 C‐Section 23.18 37.21 49.41
800S250‐43‐2 0.2 81.5 65.05 51.11
800S250‐43‐3 0.3 83.91 85.99 57.03
800S250‐43‐4 0.4 86.38 93.22 68.39
800S250‐43‐5 0.5 88.89 99.32 86.23
800S250‐43‐6 0.6 91.69 104.97 112.06
800S250‐43‐w 0.625 92.42 106.24 120.04
Buckling Load (kip) Vs Half‐wavelength Curve
The optimum d/h Ratio 0.625
358
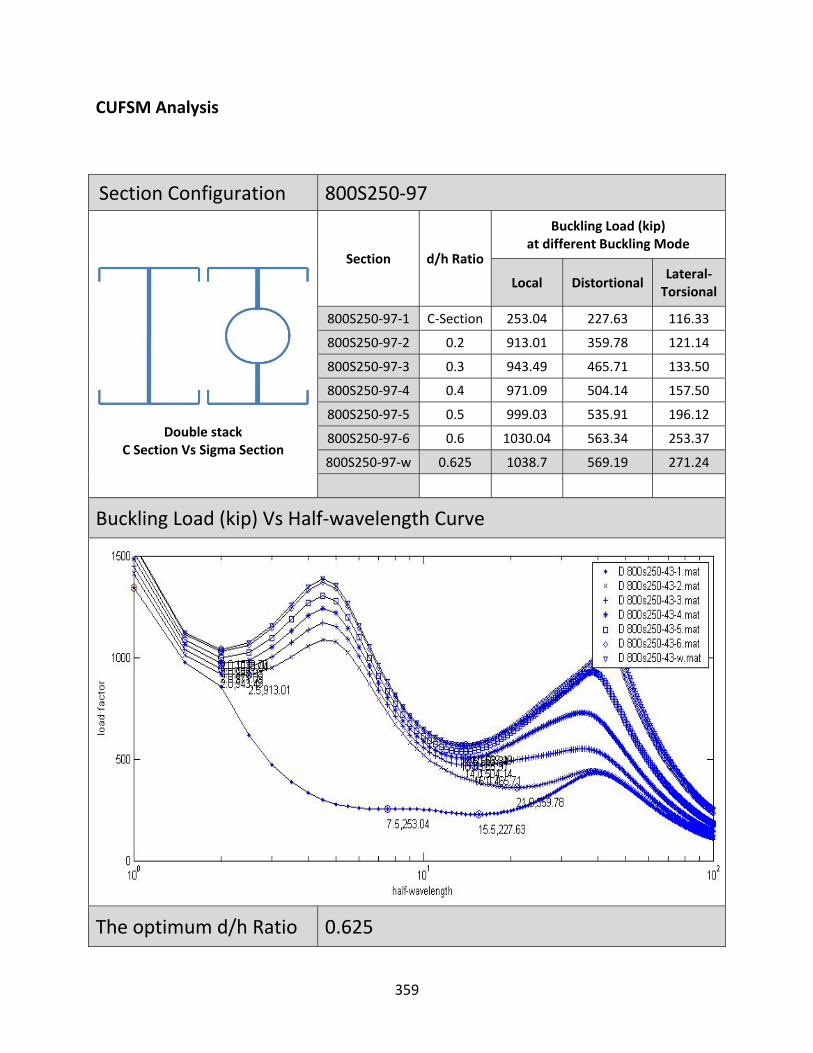
CUFSM Analysis
Section Configuration 800S250‐97
Double stack C Section Vs Sigma Section
Section d/h Ratio
Buckling Load (kip) at different Buckling Mode
Local Distortional Lateral‐Torsional
800S250‐97‐1 C‐Section 253.04 227.63 116.33
800S250‐97‐2 0.2 913.01 359.78 121.14
800S250‐97‐3 0.3 943.49 465.71 133.50
800S250‐97‐4 0.4 971.09 504.14 157.50
800S250‐97‐5 0.5 999.03 535.91 196.12
800S250‐97‐6 0.6 1030.04 563.34 253.37
800S250‐97‐w 0.625 1038.7 569.19 271.24
Buckling Load (kip) Vs Half‐wavelength Curve
The optimum d/h Ratio 0.625
359
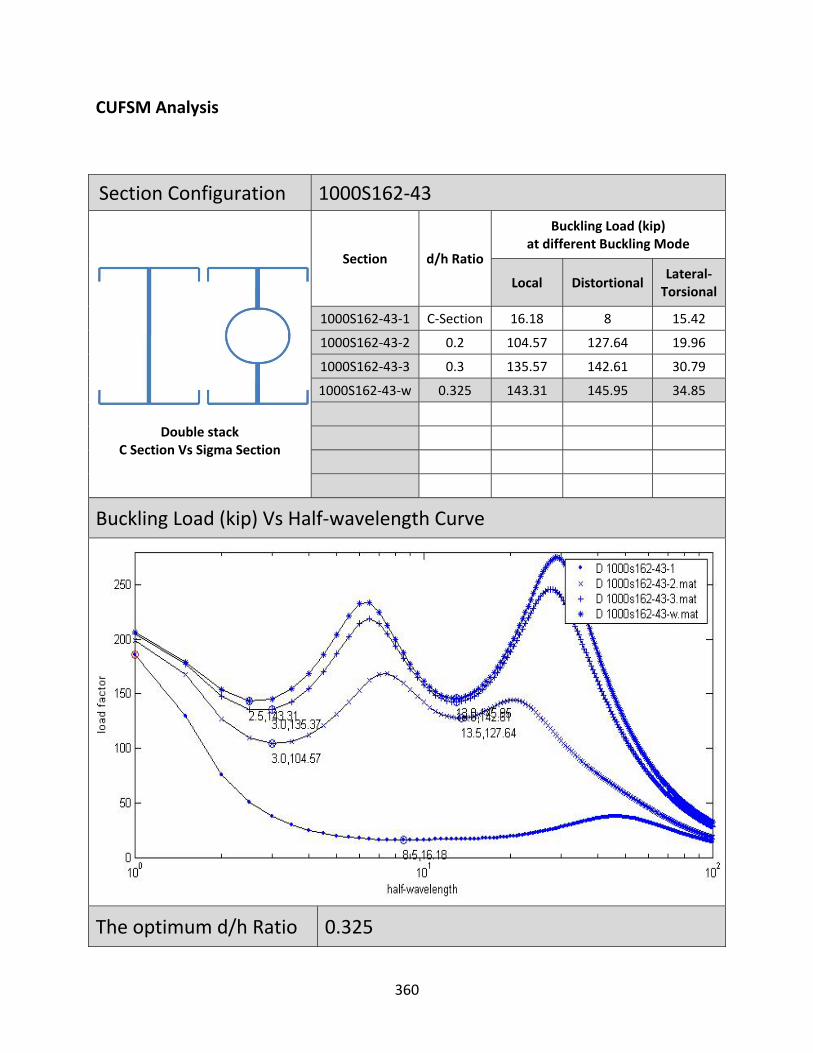
CUFSM Analysis
Section Configuration 1000S162‐43
Double stack C Section Vs Sigma Section
Section d/h Ratio
Buckling Load (kip) at different Buckling Mode
Local Distortional Lateral‐Torsional
1000S162‐43‐1 C‐Section 16.18 8 15.42
1000S162‐43‐2 0.2 104.57 127.64 19.96
1000S162‐43‐3 0.3 135.57 142.61 30.79
1000S162‐43‐w 0.325 143.31 145.95 34.85
Buckling Load (kip) Vs Half‐wavelength Curve
The optimum d/h Ratio 0.325
360

CUFSM Analysis
Section Configuration 1000S162‐97
Double stack C Section Vs Sigma Section
Section d/h Ratio
Buckling Load (kip) at different Buckling Mode
Local Distortional Lateral‐Torsional
1000S162‐97‐1 C‐Section 140.83 50 35.91
1000S162‐97‐2 0.2 719.62 300 53.29
1000S162‐97‐3 0.3 801.56 400 72.56
1000S162‐97‐w 0.325 818.73 500 78.84
Buckling Load (kip) Vs Half‐wavelength Curve
The optimum d/h Ratio 0.325
361
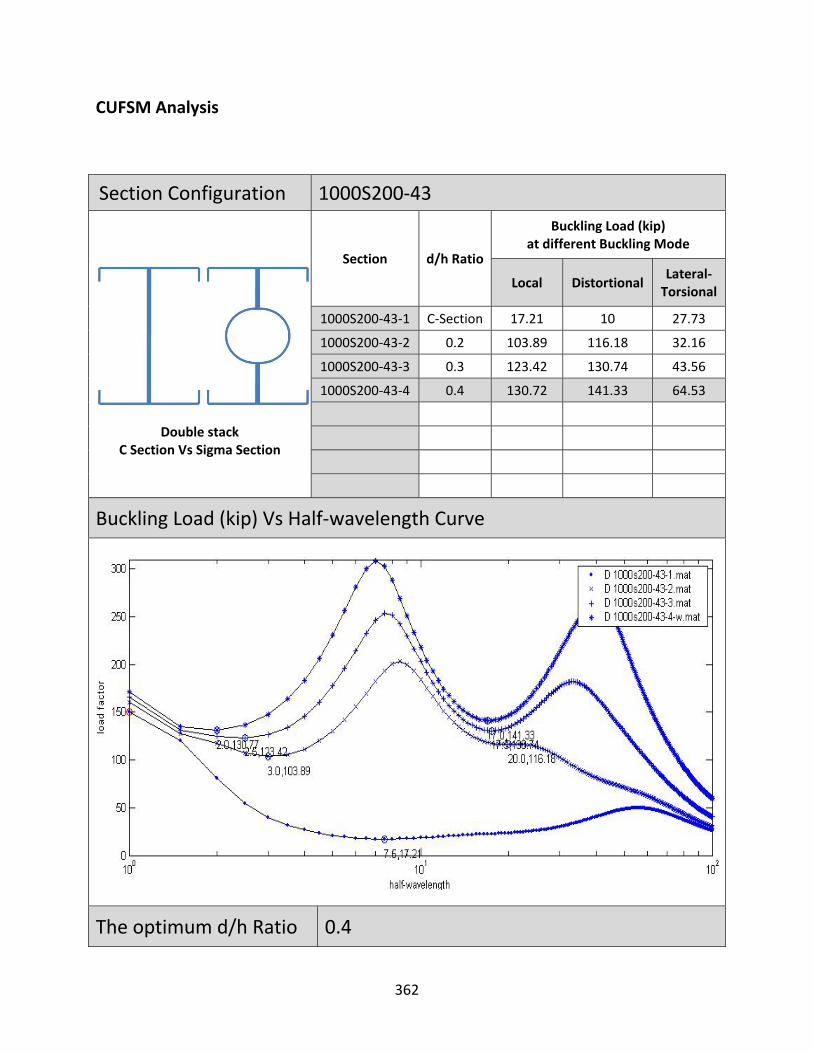
CUFSM Analysis
Section Configuration 1000S200‐43
Double stack C Section Vs Sigma Section
Section d/h Ratio
Buckling Load (kip) at different Buckling Mode
Local Distortional Lateral‐Torsional
1000S200‐43‐1 C‐Section 17.21 10 27.73
1000S200‐43‐2 0.2 103.89 116.18 32.16
1000S200‐43‐3 0.3 123.42 130.74 43.56
1000S200‐43‐4 0.4 130.72 141.33 64.53
Buckling Load (kip) Vs Half‐wavelength Curve
The optimum d/h Ratio 0.4
362
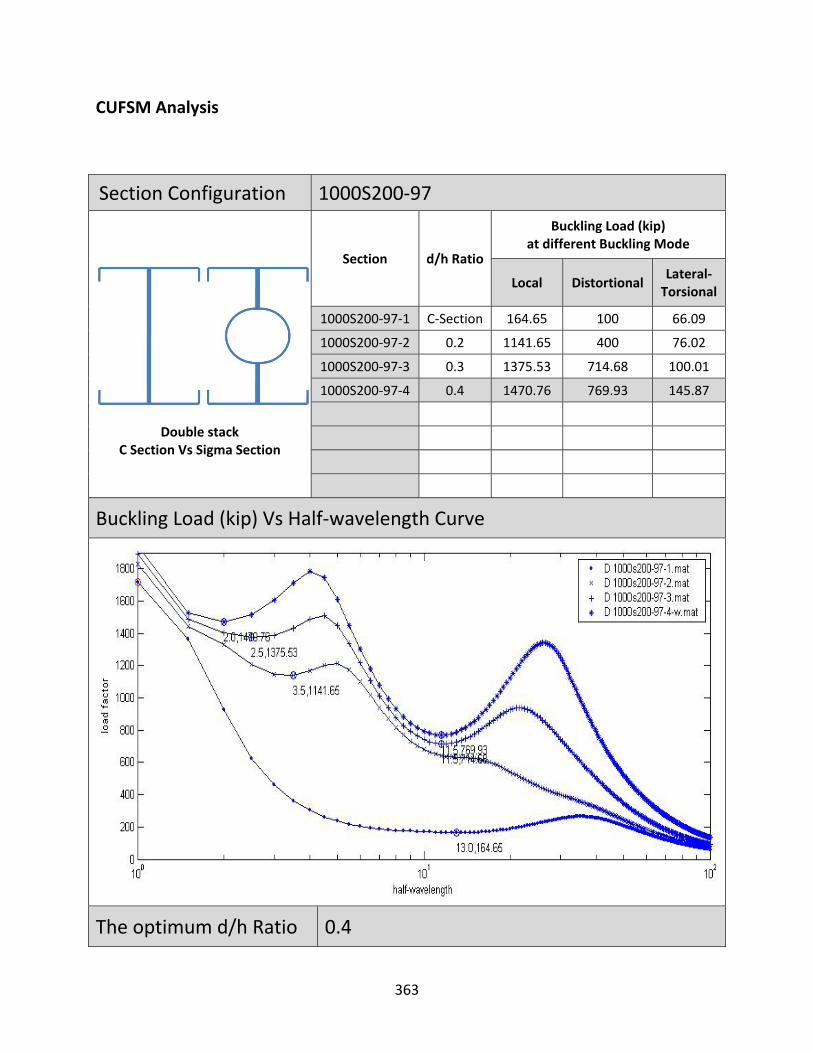
CUFSM Analysis
Section Configuration 1000S200‐97
Double stack C Section Vs Sigma Section
Section d/h Ratio
Buckling Load (kip) at different Buckling Mode
Local Distortional Lateral‐Torsional
1000S200‐97‐1 C‐Section 164.65 100 66.09
1000S200‐97‐2 0.2 1141.65 400 76.02
1000S200‐97‐3 0.3 1375.53 714.68 100.01
1000S200‐97‐4 0.4 1470.76 769.93 145.87
Buckling Load (kip) Vs Half‐wavelength Curve
The optimum d/h Ratio 0.4
363

CUFSM Analysis
Section Configuration 1000S250‐43
Double stack C Section Vs Sigma Section
Section d/h Ratio
Buckling Load (kip) at different Buckling Mode
Local Distortional Lateral‐Torsional
1000S250‐43‐1 C‐Section 17.66 20 46.86
1000S250‐43‐2 0.2 91.2 74.86 50.68
1000S250‐43‐3 0.3 96.33 97.7 63.00
1000S250‐43‐4 0.4 99.58 104.6 85.50
1000S250‐43‐5 0.5 102.62 111.67 120.06
Buckling Load (kip) Vs Half‐wavelength Curve
The optimum d/h Ratio 0.5
364
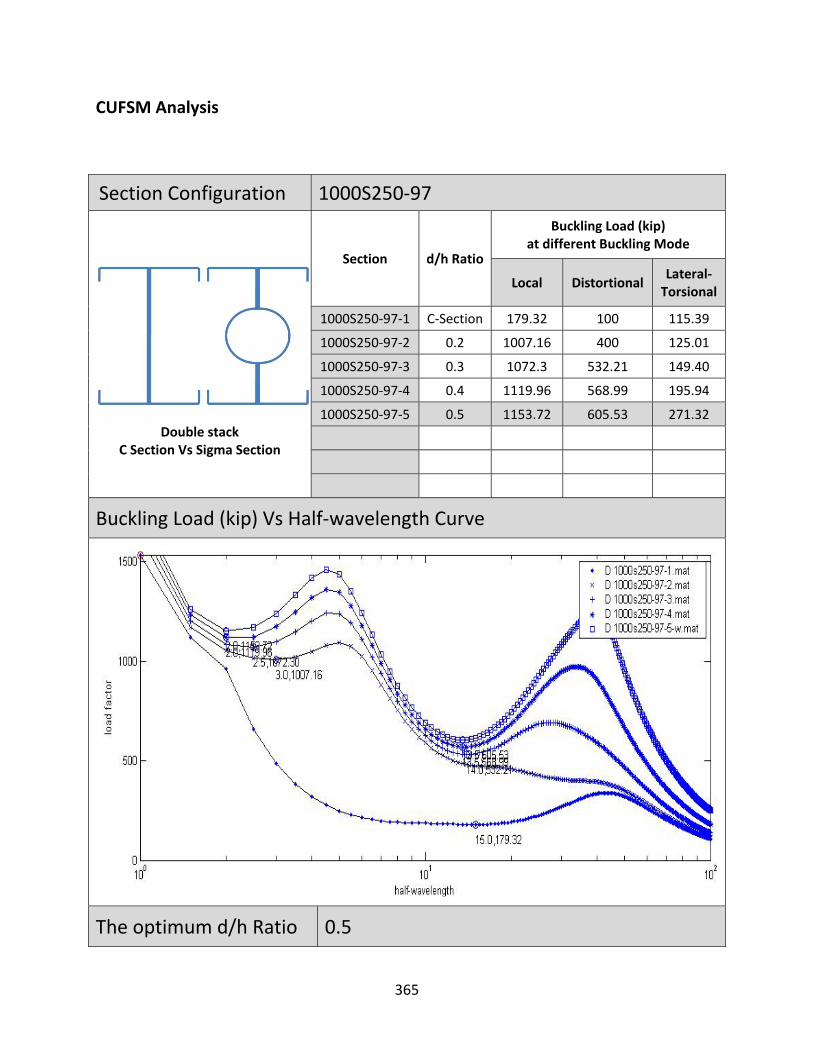
CUFSM Analysis
Section Configuration 1000S250‐97
Double stack C Section Vs Sigma Section
Section d/h Ratio
Buckling Load (kip) at different Buckling Mode
Local Distortional Lateral‐Torsional
1000S250‐97‐1 C‐Section 179.32 100 115.39
1000S250‐97‐2 0.2 1007.16 400 125.01
1000S250‐97‐3 0.3 1072.3 532.21 149.40
1000S250‐97‐4 0.4 1119.96 568.99 195.94
1000S250‐97‐5 0.5 1153.72 605.53 271.32
Buckling Load (kip) Vs Half‐wavelength Curve
The optimum d/h Ratio 0.5
365
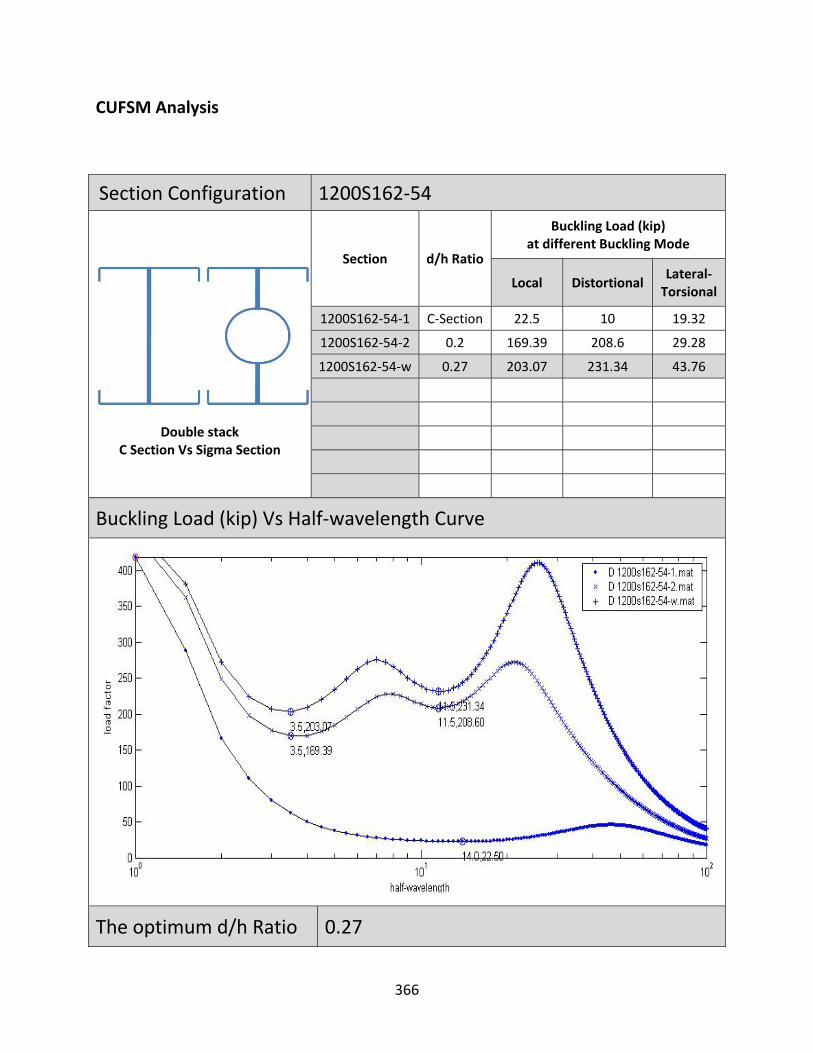
CUFSM Analysis
Section Configuration 1200S162‐54
Double stack C Section Vs Sigma Section
Section d/h Ratio
Buckling Load (kip) at different Buckling Mode
Local Distortional Lateral‐Torsional
1200S162‐54‐1 C‐Section 22.5 10 19.32
1200S162‐54‐2 0.2 169.39 208.6 29.28
1200S162‐54‐w 0.27 203.07 231.34 43.76
Buckling Load (kip) Vs Half‐wavelength Curve
The optimum d/h Ratio 0.27
366
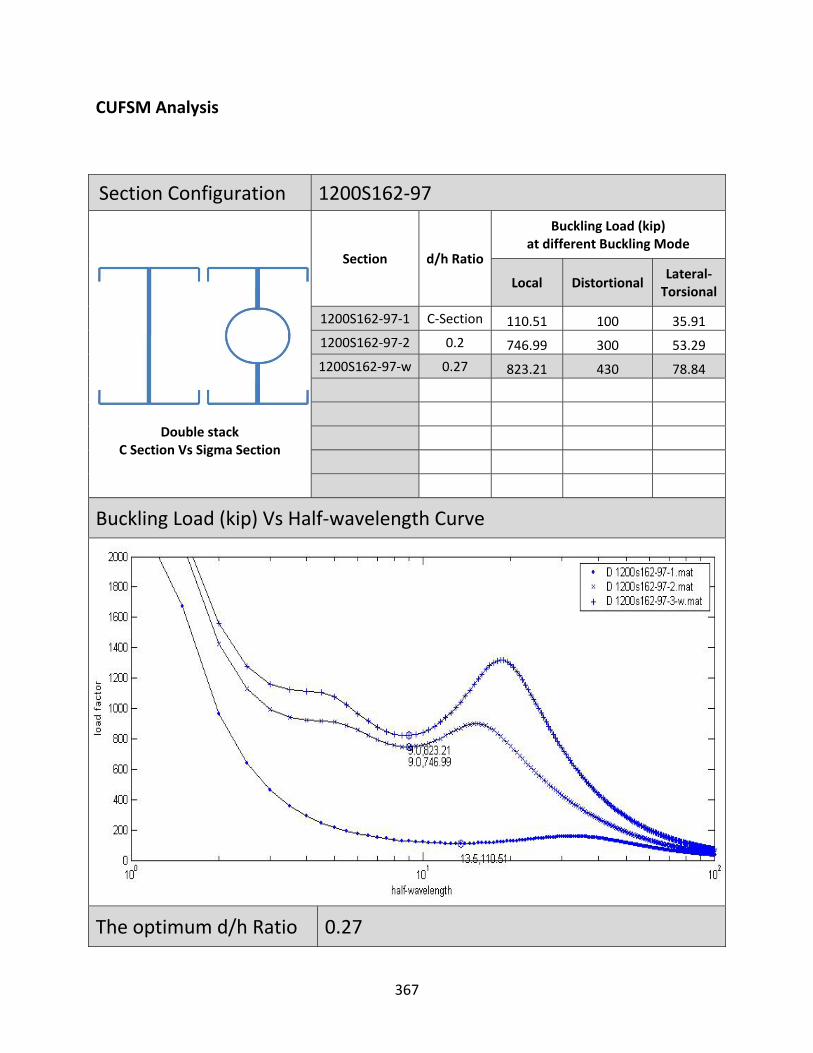
CUFSM Analysis
Section Configuration 1200S162‐97
Double stack C Section Vs Sigma Section
Section d/h Ratio
Buckling Load (kip) at different Buckling Mode
Local Distortional Lateral‐Torsional
1200S162‐97‐1 C‐Section 110.51 100 35.91
1200S162‐97‐2 0.2 746.99 300 53.29
1200S162‐97‐w 0.27 823.21 430 78.84
Buckling Load (kip) Vs Half‐wavelength Curve
The optimum d/h Ratio 0.27
367

CUFSM Analysis
Section Configuration 1200S200‐54
Double stack C Section Vs Sigma Section
Section d/h Ratio
Buckling Load (kip) at different Buckling Mode
Local Distortional Lateral‐Torsional
1200S200‐54‐1 C‐Section 26.79 10 34.60
1200S200‐54‐2 0.2 173.19 201.62 44.67
1200S200‐54‐3 0.3 220.62 224.93 68.88
1200S200‐54‐w 0.33 239.57 231.86 81.02
Buckling Load (kip) Vs Half‐wavelength Curve
The optimum d/h Ratio 0.33
368
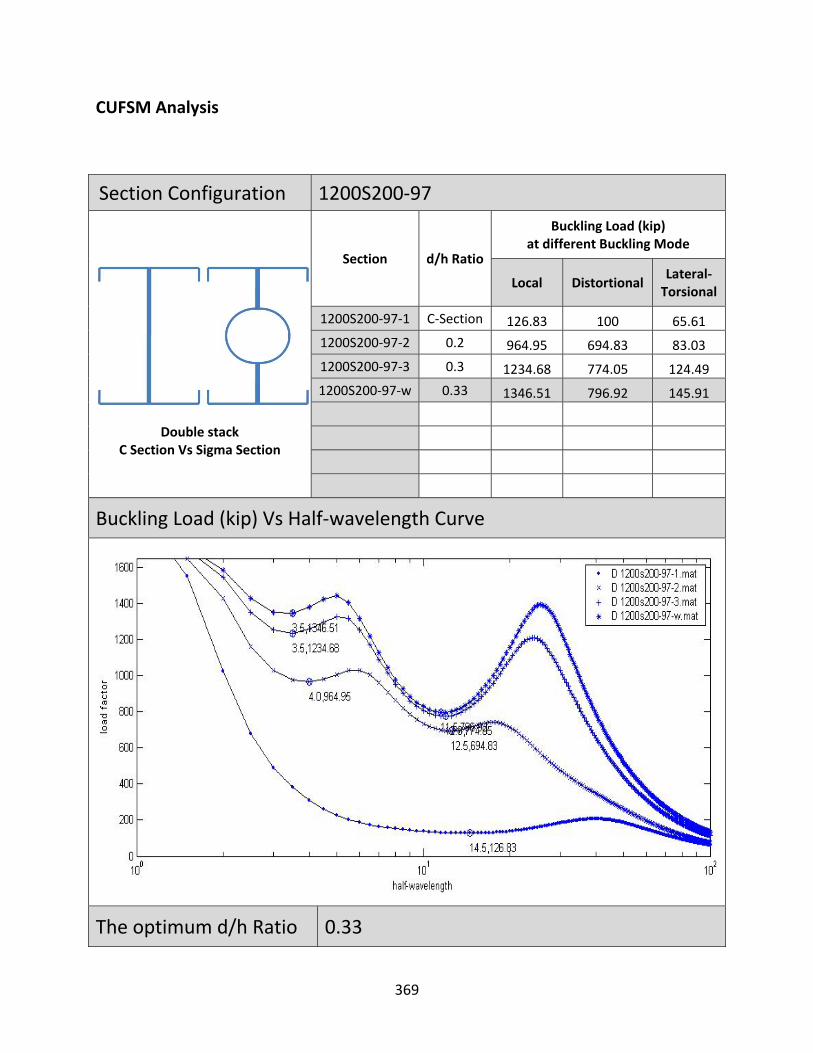
CUFSM Analysis
Section Configuration 1200S200‐97
Double stack C Section Vs Sigma Section
Section d/h Ratio
Buckling Load (kip) at different Buckling Mode
Local Distortional Lateral‐Torsional
1200S200‐97‐1 C‐Section 126.83 100 65.61
1200S200‐97‐2 0.2 964.95 694.83 83.03
1200S200‐97‐3 0.3 1234.68 774.05 124.49
1200S200‐97‐w 0.33 1346.51 796.92 145.91
Buckling Load (kip) Vs Half‐wavelength Curve
The optimum d/h Ratio 0.33
369

CUFSM Analysis
Section Configuration 1200S250‐54
Double stack C Section Vs Sigma Section
Section d/h Ratio
Buckling Load (kip) at different Buckling Mode
Local Distortional Lateral‐Torsional
1200S250‐54‐1 C‐Section 27.73 20 58.19
1200S250‐54‐2 0.2 169.31 155.88 67.82
1200S250‐54‐3 0.3 202.21 170.43 94.13
1200S250‐54‐w 0.41 222.67 185.15 150.77
Buckling Load (kip) Vs Half‐wavelength Curve
The optimum d/h Ratio 0.41
370

CUFSM Analysis
Section Configuration 1200S250‐97
Double stack C Section Vs Sigma Section
Section d/h Ratio
Buckling Load (kip) at different Buckling Mode
Local Distortional Lateral‐Torsional
1200S250‐97‐1 C‐Section 139.51 100 113.82
1200S250‐97‐2 0.2 943.29 534.59 130.93
1200S250‐97‐3 0.3 1135.67 583.65 173.59
1200S250‐97‐w 0.41 1259.29 632.71 271.36
Buckling Load (kip) Vs Half‐wavelength Curve
The optimum d/h Ratio 0.41
371
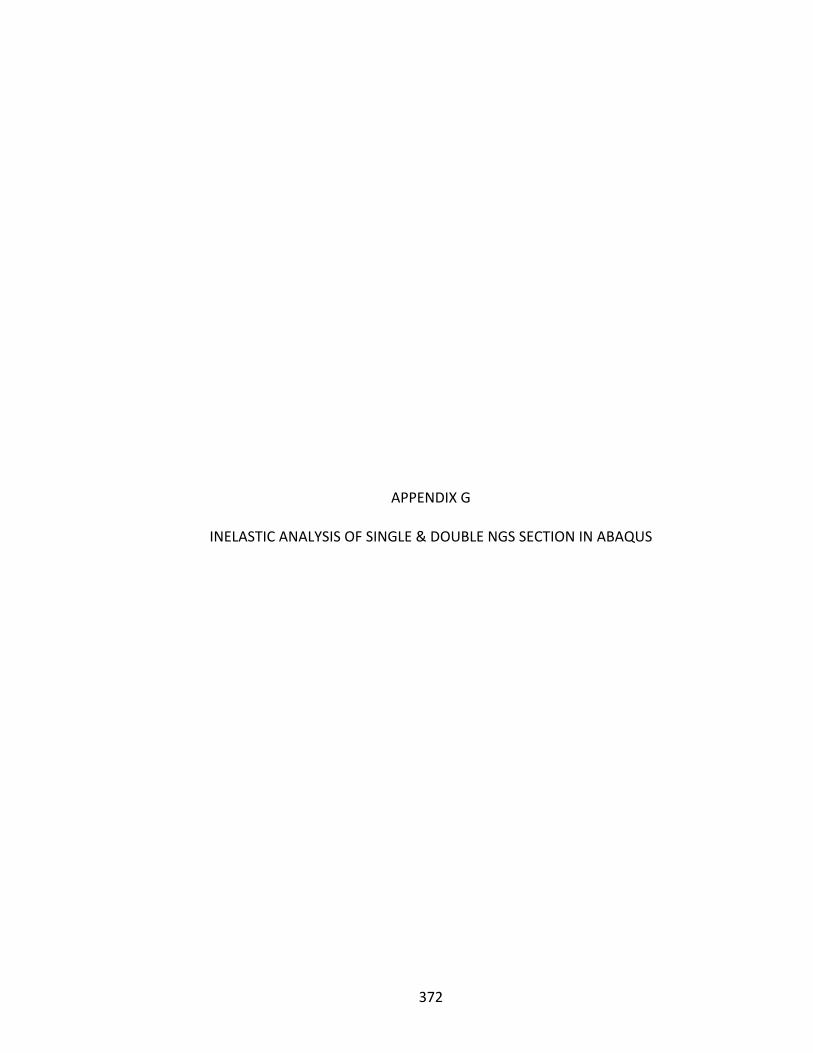
372
APPENDIX G
INELASTIC ANALYSIS OF SINGLE & DOUBLE NGS SECTION IN ABAQUS
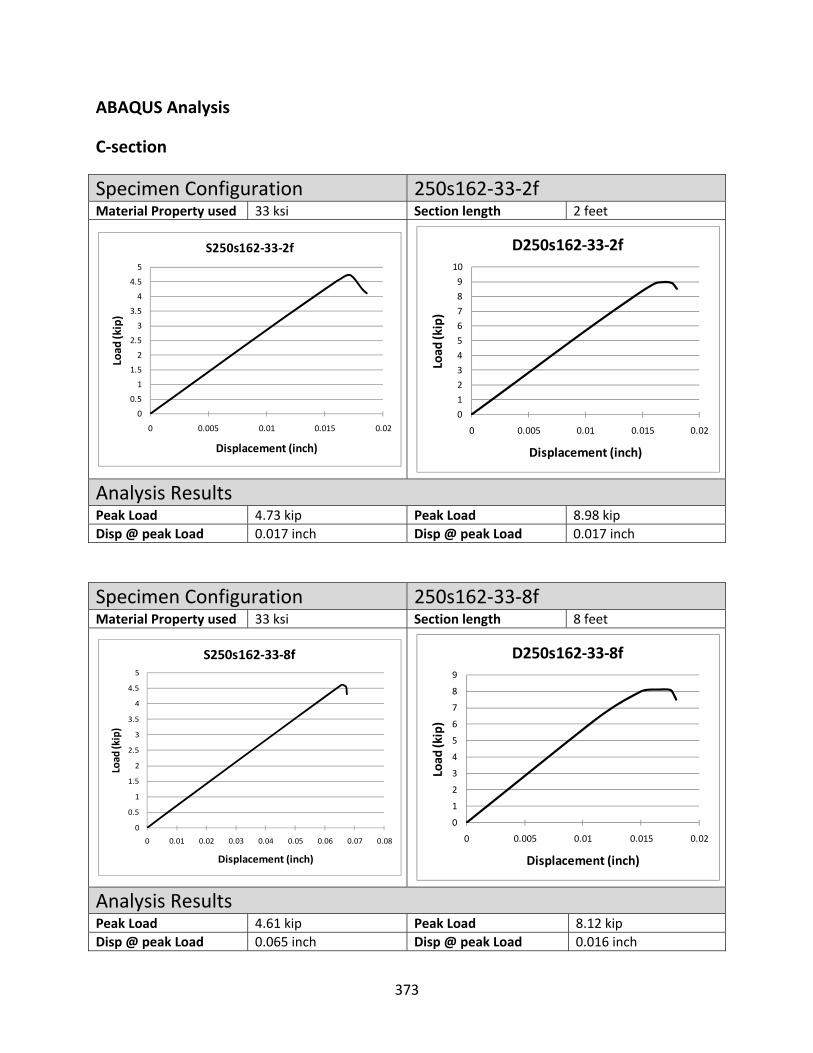
ABAQUS Analysis
C‐section
Specimen Configuration 250s162‐33‐2fMaterial Property used 33 ksi Section length 2 feet
Analysis Results Peak Load 4.73 kip Peak Load 8.98 kip Disp @ peak Load 0.017 inch Disp @ peak Load 0.017 inch
Specimen Configuration 250s162‐33‐8fMaterial Property used 33 ksi Section length 8 feet
Analysis Results Peak Load 4.61 kip Peak Load 8.12 kip Disp @ peak Load 0.065 inch Disp @ peak Load 0.016 inch
0
0.5
1
1.5
2
2.5
3
3.5
4
4.5
5
0 0.005 0.01 0.015 0.02
Load
(kip)
Displacement (inch)
S250s162‐33‐2f
0
1
2
3
4
5
6
7
8
9
10
0 0.005 0.01 0.015 0.02Load
(kip)
Displacement (inch)
D250s162‐33‐2f
0
0.5
1
1.5
2
2.5
3
3.5
4
4.5
5
0 0.01 0.02 0.03 0.04 0.05 0.06 0.07 0.08
Load
(kip)
Displacement (inch)
S250s162‐33‐8f
0
1
2
3
4
5
6
7
8
9
0 0.005 0.01 0.015 0.02
Load
(kip)
Displacement (inch)
D250s162‐33‐8f
373
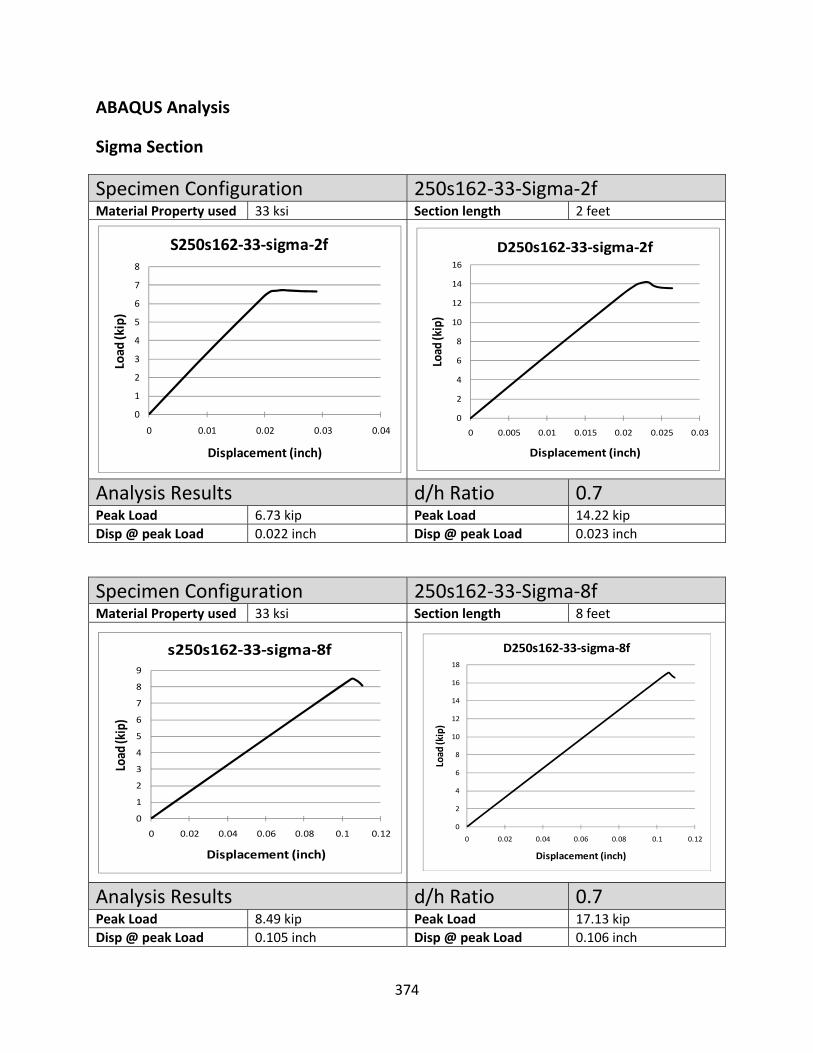
ABAQUS Analysis
Sigma Section
Specimen Configuration 250s162‐33‐Sigma‐2f Material Property used 33 ksi Section length 2 feet
Analysis Results d/h Ratio 0.7 Peak Load 6.73 kip Peak Load 14.22 kip Disp @ peak Load 0.022 inch Disp @ peak Load 0.023 inch
Specimen Configuration 250s162‐33‐Sigma‐8f Material Property used 33 ksi Section length 8 feet
Analysis Results d/h Ratio 0.7 Peak Load 8.49 kip Peak Load 17.13 kip Disp @ peak Load 0.105 inch Disp @ peak Load 0.106 inch
0
1
2
3
4
5
6
7
8
0 0.01 0.02 0.03 0.04
Load
(kip)
Displacement (inch)
S250s162‐33‐sigma‐2f
0
2
4
6
8
10
12
14
16
0 0.005 0.01 0.015 0.02 0.025 0.03Load
(kip)
Displacement (inch)
D250s162‐33‐sigma‐2f
0
1
2
3
4
5
6
7
8
9
0 0.02 0.04 0.06 0.08 0.1 0.12
Load
(kip)
Displacement (inch)
s250s162‐33‐sigma‐8f
0
2
4
6
8
10
12
14
16
18
0 0.02 0.04 0.06 0.08 0.1 0.12
Load
(kip)
Displacement (inch)
D250s162‐33‐sigma‐8f
374

ABAQUS Analysis
C‐section
Specimen Configuration 350s162‐33‐2fMaterial Property used 33 ksi Section length 2 feet
Analysis Results Peak Load 4.43 kip Peak Load 15.40 kip Disp @ peak Load 0.016 inch Disp @ peak Load 0.024 inch
Specimen Configuration 350s162‐33‐8fMaterial Property used 33 ksi Section length 8 feet
Analysis Results Peak Load 5.84 kip Peak Load 12.64 kip Disp @ peak Load 0.082 inch Disp @ peak Load 0.090 inch
0
0.5
1
1.5
2
2.5
3
3.5
4
4.5
5
0 0.005 0.01 0.015 0.02
Load
(kip)
Displacement (inch)
S350s162‐33‐2f
0
2
4
6
8
10
12
14
16
18
0 0.02 0.04 0.06 0.08 0.1 0.12Load
(kip)
Displacement (inch)
D350s162‐33‐2f
0
1
2
3
4
5
6
7
0 0.02 0.04 0.06 0.08 0.1
Load
(kip)
displacement (inch)
S350s162‐33‐8f
0
2
4
6
8
10
12
14
0 0.02 0.04 0.06 0.08 0.1 0.12
Load
(kip)
Displacement (inch)
D350s162‐33‐8f
375
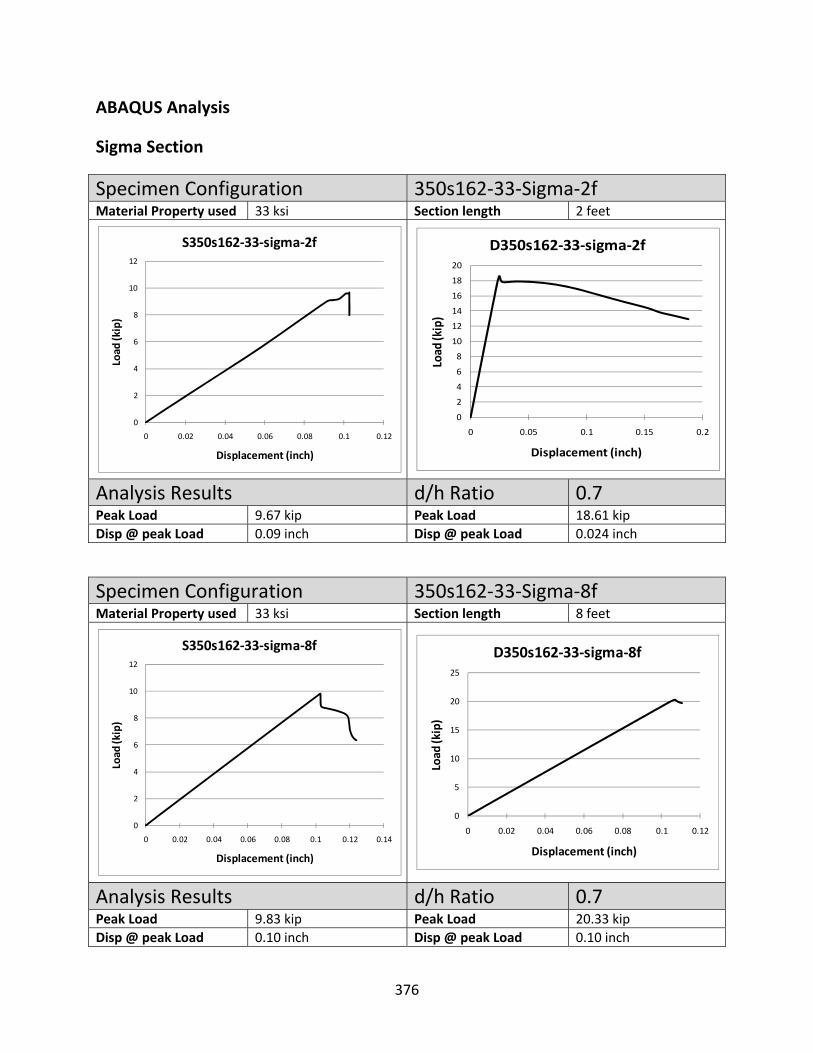
ABAQUS Analysis
Sigma Section
Specimen Configuration 350s162‐33‐Sigma‐2f Material Property used 33 ksi Section length 2 feet
Analysis Results d/h Ratio 0.7 Peak Load 9.67 kip Peak Load 18.61 kip Disp @ peak Load 0.09 inch Disp @ peak Load 0.024 inch
Specimen Configuration 350s162‐33‐Sigma‐8f Material Property used 33 ksi Section length 8 feet
Analysis Results d/h Ratio 0.7 Peak Load 9.83 kip Peak Load 20.33 kip Disp @ peak Load 0.10 inch Disp @ peak Load 0.10 inch
0
2
4
6
8
10
12
0 0.02 0.04 0.06 0.08 0.1 0.12
Load
(kip)
Displacement (inch)
S350s162‐33‐sigma‐2f
0
2
4
6
8
10
12
14
16
18
20
0 0.05 0.1 0.15 0.2Load
(kip)
Displacement (inch)
D350s162‐33‐sigma‐2f
0
2
4
6
8
10
12
0 0.02 0.04 0.06 0.08 0.1 0.12 0.14
Load
(kip)
Displacement (inch)
S350s162‐33‐sigma‐8f
0
5
10
15
20
25
0 0.02 0.04 0.06 0.08 0.1 0.12
Load
(kip)
Displacement (inch)
D350s162‐33‐sigma‐8f
376
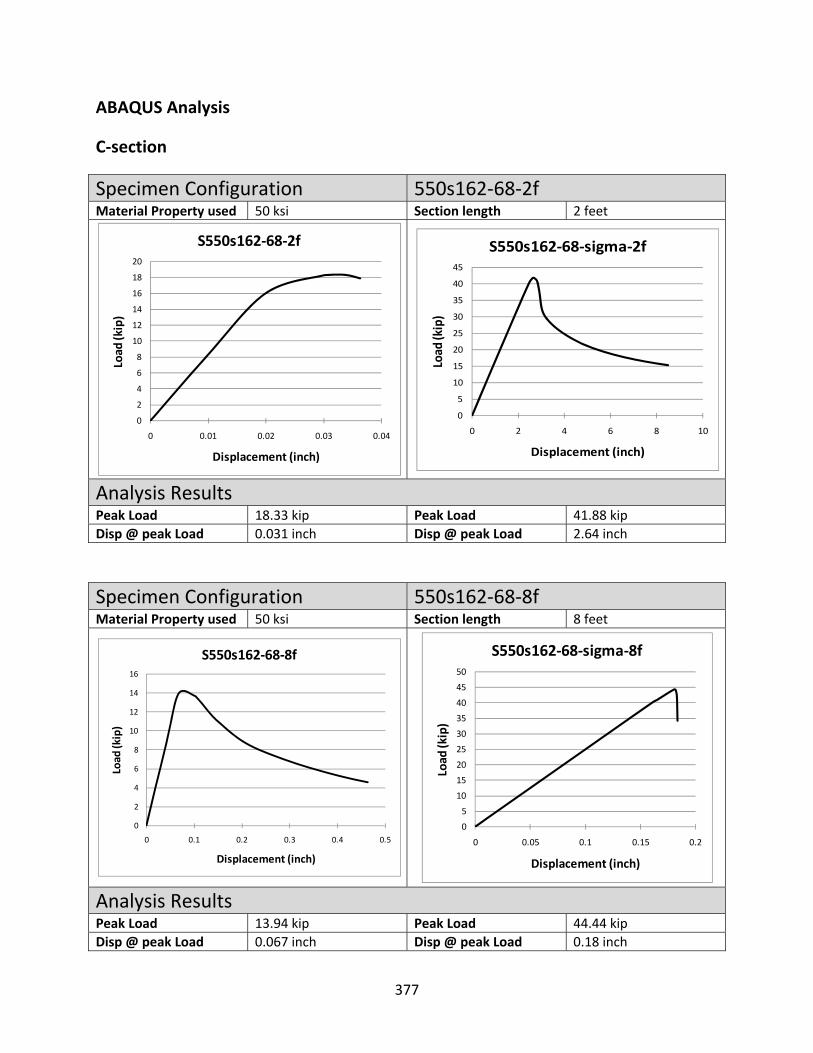
ABAQUS Analysis
C‐section
Specimen Configuration 550s162‐68‐2fMaterial Property used 50 ksi Section length 2 feet
Analysis Results Peak Load 18.33 kip Peak Load 41.88 kip Disp @ peak Load 0.031 inch Disp @ peak Load 2.64 inch
Specimen Configuration 550s162‐68‐8fMaterial Property used 50 ksi Section length 8 feet
Analysis Results Peak Load 13.94 kip Peak Load 44.44 kip Disp @ peak Load 0.067 inch Disp @ peak Load 0.18 inch
0
2
4
6
8
10
12
14
16
18
20
0 0.01 0.02 0.03 0.04
Load
(kip)
Displacement (inch)
S550s162‐68‐2f
0
5
10
15
20
25
30
35
40
45
0 2 4 6 8 10Load
(kip)
Displacement (inch)
S550s162‐68‐sigma‐2f
0
2
4
6
8
10
12
14
16
0 0.1 0.2 0.3 0.4 0.5
Load
(kip)
Displacement (inch)
S550s162‐68‐8f
0
5
10
15
20
25
30
35
40
45
50
0 0.05 0.1 0.15 0.2
Load
(kip)
Displacement (inch)
S550s162‐68‐sigma‐8f
377
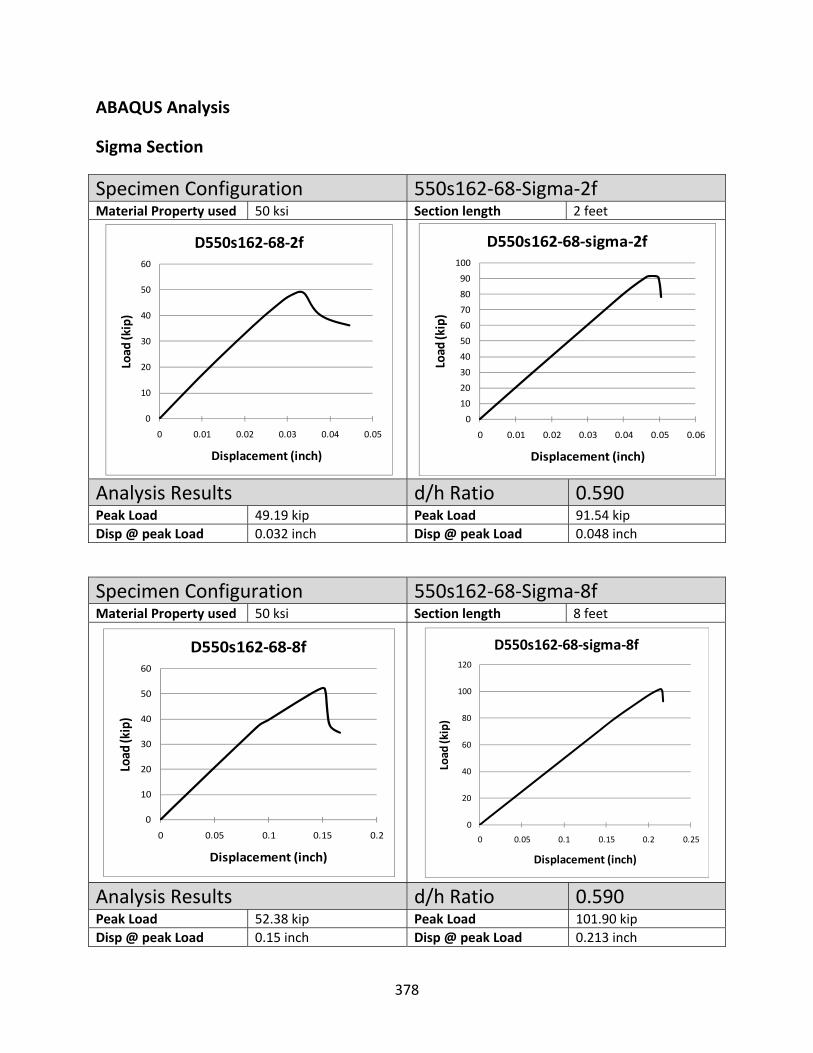
ABAQUS Analysis
Sigma Section
Specimen Configuration 550s162‐68‐Sigma‐2f Material Property used 50 ksi Section length 2 feet
Analysis Results d/h Ratio 0.590 Peak Load 49.19 kip Peak Load 91.54 kip Disp @ peak Load 0.032 inch Disp @ peak Load 0.048 inch
Specimen Configuration 550s162‐68‐Sigma‐8f Material Property used 50 ksi Section length 8 feet
Analysis Results d/h Ratio 0.590 Peak Load 52.38 kip Peak Load 101.90 kip Disp @ peak Load 0.15 inch Disp @ peak Load 0.213 inch
0
10
20
30
40
50
60
0 0.01 0.02 0.03 0.04 0.05
Load
(kip)
Displacement (inch)
D550s162‐68‐2f
0
10
20
30
40
50
60
70
80
90
100
0 0.01 0.02 0.03 0.04 0.05 0.06Load
(kip)
Displacement (inch)
D550s162‐68‐sigma‐2f
0
10
20
30
40
50
60
0 0.05 0.1 0.15 0.2
Load
(kip)
Displacement (inch)
D550s162‐68‐8f
0
20
40
60
80
100
120
0 0.05 0.1 0.15 0.2 0.25
Load
(kip)
Displacement (inch)
D550s162‐68‐sigma‐8f
378

ABAQUS Analysis
C‐section
Specimen Configuration 600s200‐54‐2fMaterial Property used 33 ksi Section length 2 feet
Analysis Results Peak Load 10.45 kip Peak Load 21.89 kip Disp @ peak Load 0.017 inch Disp @ peak Load 0.024 inch
Specimen Configuration 600s200‐54‐8fMaterial Property used 33 ksi Section length 8 feet
Analysis Results Peak Load 14.91 kip Peak Load 21.87 kip Disp @ peak Load 0.096 inch Disp @ peak Load 0.095 inch
0
2
4
6
8
10
12
0 0.005 0.01 0.015 0.02 0.025
Load
(kip)
Displacement (inch)
S600s200‐54‐2f
0
5
10
15
20
25
0 0.005 0.01 0.015 0.02 0.025 0.03Load
(kip)
Displacement (inch)
S600s200‐54‐sigma‐2f
0
2
4
6
8
10
12
14
16
0 0.02 0.04 0.06 0.08 0.1 0.12
Load
(kip)
Displacement (inch)
S600s200‐54‐8f
0
5
10
15
20
25
0 0.05 0.1 0.15 0.2
Load
(kip)
Displacement (inch)
S600s200‐54‐8f
379
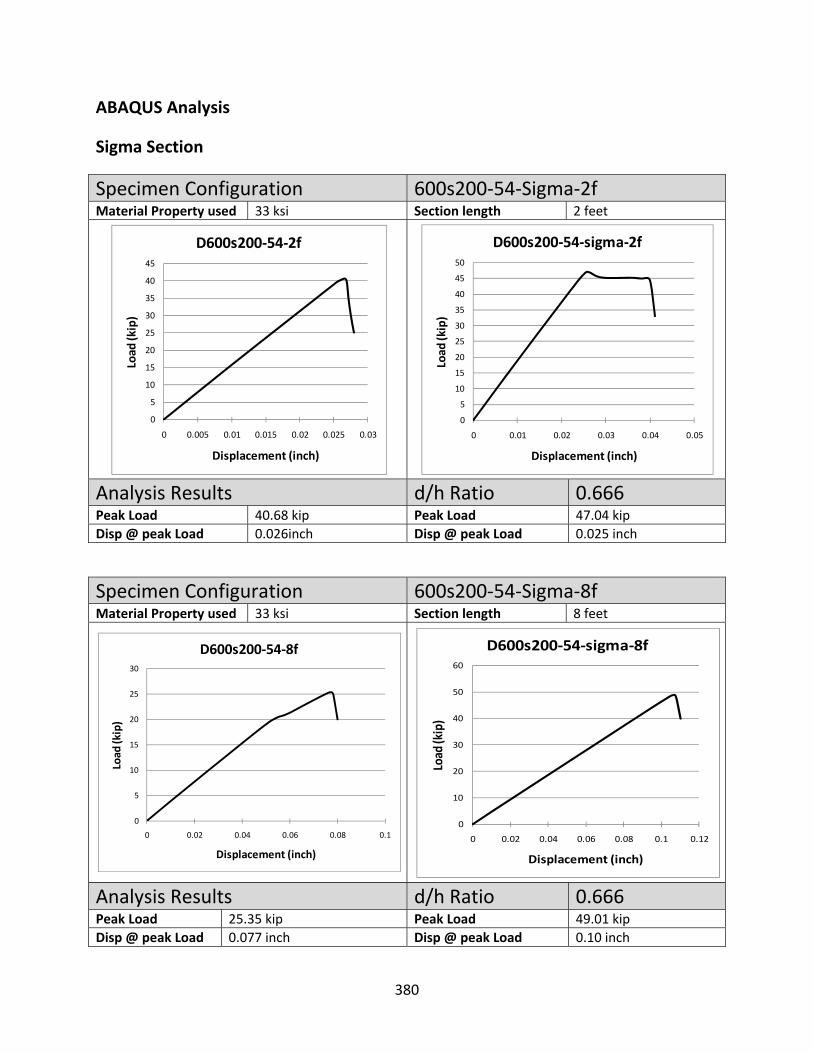
ABAQUS Analysis
Sigma Section
Specimen Configuration 600s200‐54‐Sigma‐2f Material Property used 33 ksi Section length 2 feet
Analysis Results d/h Ratio 0.666 Peak Load 40.68 kip Peak Load 47.04 kip Disp @ peak Load 0.026inch Disp @ peak Load 0.025 inch
Specimen Configuration 600s200‐54‐Sigma‐8f Material Property used 33 ksi Section length 8 feet
Analysis Results d/h Ratio 0.666 Peak Load 25.35 kip Peak Load 49.01 kip Disp @ peak Load 0.077 inch Disp @ peak Load 0.10 inch
0
5
10
15
20
25
30
35
40
45
0 0.005 0.01 0.015 0.02 0.025 0.03
Load
(kip)
Displacement (inch)
D600s200‐54‐2f
0
5
10
15
20
25
30
35
40
45
50
0 0.01 0.02 0.03 0.04 0.05Load
(kip)
Displacement (inch)
D600s200‐54‐sigma‐2f
0
5
10
15
20
25
30
0 0.02 0.04 0.06 0.08 0.1
Load
(kip)
Displacement (inch)
D600s200‐54‐8f
0
10
20
30
40
50
60
0 0.02 0.04 0.06 0.08 0.1 0.12
Load
(kip)
Displacement (inch)
D600s200‐54‐sigma‐8f
380

ABAQUS Analysis
C‐section
Specimen Configuration 800s200‐54‐2fMaterial Property used 33 ksi Section length 2 feet
Analysis Results Peak Load 11.48 kip Peak Load 21.87 kip Disp @ peak Load 0.016 inch Disp @ peak Load 0.023 inch
Specimen Configuration 800s200‐54‐8fMaterial Property used 33 ksi Section length 8 feet
Analysis Results Peak Load 9.96 kip Peak Load 26.12 kip Disp @ peak Load 0.069 inch Disp @ peak Load 0.098 inch
0
2
4
6
8
10
12
14
0 0.01 0.02 0.03 0.04 0.05
Load
(kip)
Displacement (inch)
S800s200‐54‐2f
0
5
10
15
20
25
0 0.01 0.02 0.03 0.04Load
(kip)
Displacement (inch)
S800s200‐54‐sigma‐2f
0
2
4
6
8
10
12
0 0.02 0.04 0.06 0.08 0.1
Load
(kip)
Displacement (inch)
S800s200‐54‐8f
0
5
10
15
20
25
30
0 0.02 0.04 0.06 0.08 0.1 0.12
Load
(kip)
Displacement (inch)
S800s200‐54‐8f
381
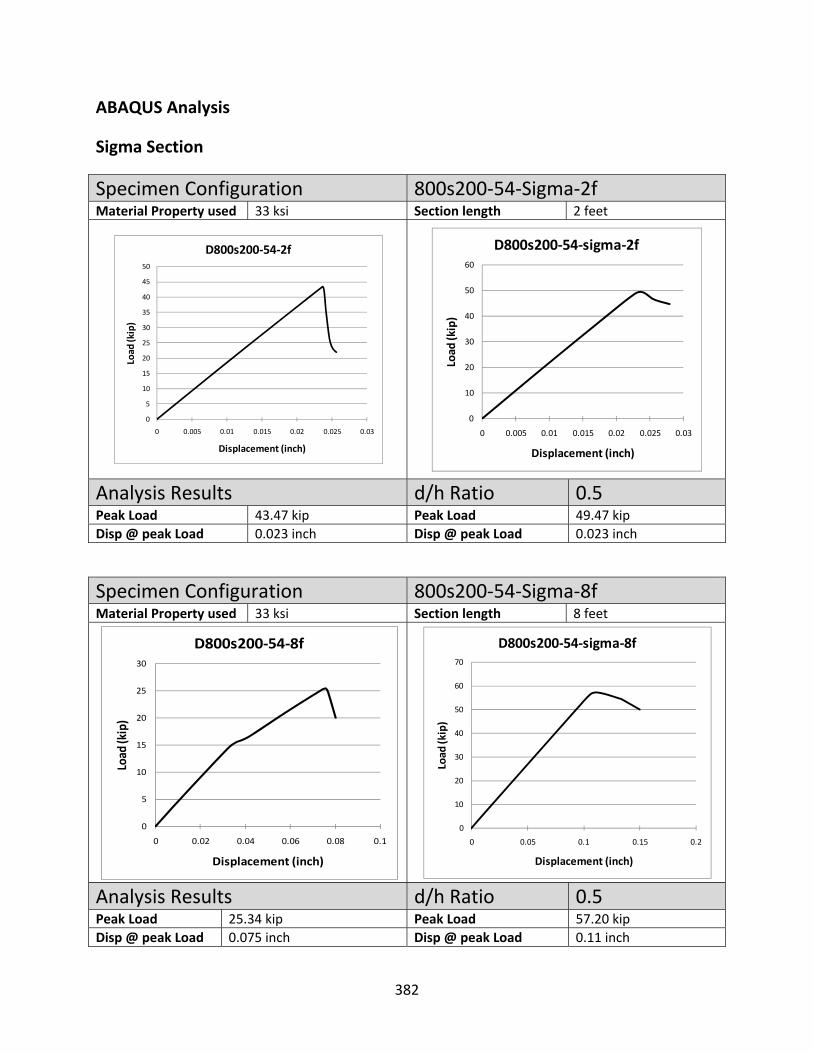
ABAQUS Analysis
Sigma Section
Specimen Configuration 800s200‐54‐Sigma‐2f Material Property used 33 ksi Section length 2 feet
Analysis Results d/h Ratio 0.5 Peak Load 43.47 kip Peak Load 49.47 kip Disp @ peak Load 0.023 inch Disp @ peak Load 0.023 inch
Specimen Configuration 800s200‐54‐Sigma‐8f Material Property used 33 ksi Section length 8 feet
Analysis Results d/h Ratio 0.5 Peak Load 25.34 kip Peak Load 57.20 kip Disp @ peak Load 0.075 inch Disp @ peak Load 0.11 inch
0
5
10
15
20
25
30
35
40
45
50
0 0.005 0.01 0.015 0.02 0.025 0.03
Load
(kip)
Displacement (inch)
D800s200‐54‐2f
0
10
20
30
40
50
60
0 0.005 0.01 0.015 0.02 0.025 0.03
Load
(kip)
Displacement (inch)
D800s200‐54‐sigma‐2f
0
5
10
15
20
25
30
0 0.02 0.04 0.06 0.08 0.1
Load
(kip)
Displacement (inch)
D800s200‐54‐8f
0
10
20
30
40
50
60
70
0 0.05 0.1 0.15 0.2
Load
(kip)
Displacement (inch)
D800s200‐54‐sigma‐8f
382

ABAQUS Analysis
C‐section
Specimen Configuration 1000s250‐97‐2fMaterial Property used 50 ksi Section length 2 feet
Analysis Results Peak Load 39.71 kip Peak Load 99.58 kip Disp @ peak Load 0.027 inch Disp @ peak Load 0.043inch
Specimen Configuration 1000s250‐97‐8fMaterial Property used 50 ksi Section length 8 feet
Analysis Results Peak Load 37.32 kip Peak Load 105.46 kip Disp @ peak Load 0.095 inch Disp @ peak Load 0.18 inch
0
5
10
15
20
25
30
35
40
45
0 0.02 0.04 0.06 0.08 0.1 0.12
Load
(kip)
Displacement (inch)
S1000s250‐97‐2f
0
20
40
60
80
100
120
0 0.01 0.02 0.03 0.04 0.05 0.06 0.07Load
(kip)
Displacement (inch)
S1000s250‐97‐sigma‐2f
0
5
10
15
20
25
30
35
40
0 0.1 0.2 0.3 0.4
Load
(kip)
Displacement (inch)
S1000s250‐97‐8f
0
20
40
60
80
100
120
0 0.05 0.1 0.15 0.2
Load
(kip)
Displacement (inch)
S1000s250‐97‐sigma‐8f
383
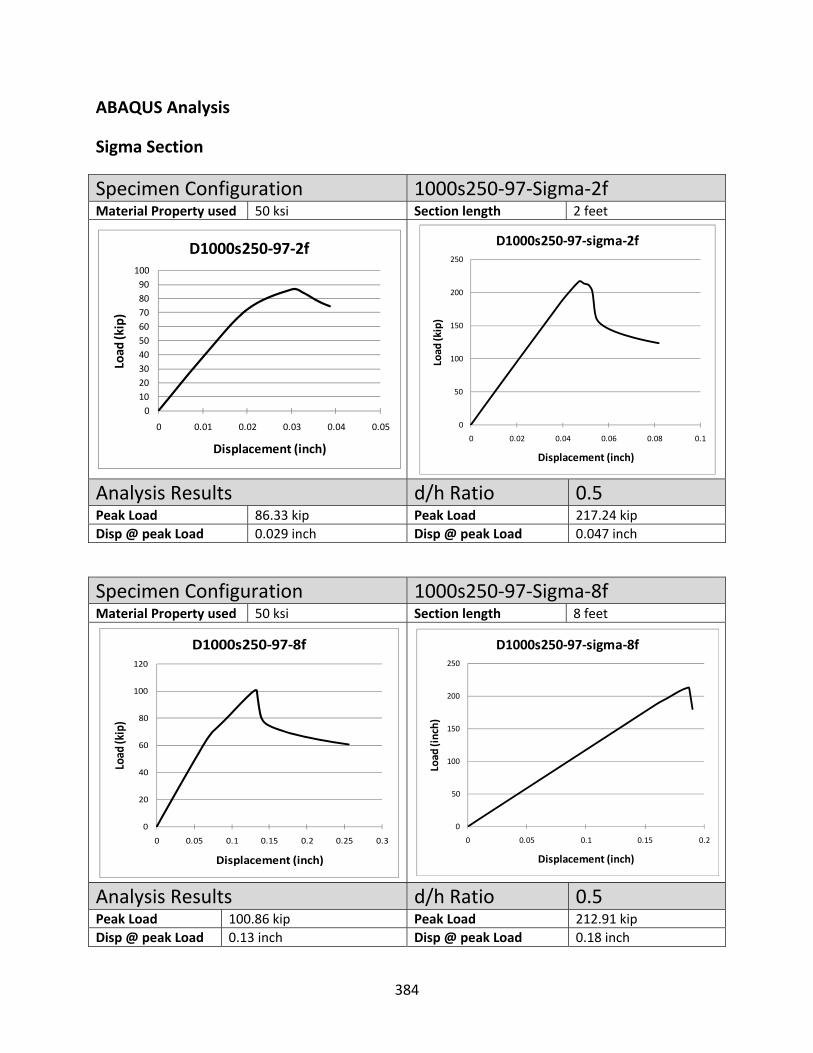
ABAQUS Analysis
Sigma Section
Specimen Configuration 1000s250‐97‐Sigma‐2f Material Property used 50 ksi Section length 2 feet
Analysis Results d/h Ratio 0.5 Peak Load 86.33 kip Peak Load 217.24 kip Disp @ peak Load 0.029 inch Disp @ peak Load 0.047 inch
Specimen Configuration 1000s250‐97‐Sigma‐8f Material Property used 50 ksi Section length 8 feet
Analysis Results d/h Ratio 0.5 Peak Load 100.86 kip Peak Load 212.91 kip Disp @ peak Load 0.13 inch Disp @ peak Load 0.18 inch
0102030405060708090100
0 0.01 0.02 0.03 0.04 0.05
Load
(kip)
Displacement (inch)
D1000s250‐97‐2f
0
50
100
150
200
250
0 0.02 0.04 0.06 0.08 0.1Load
(kip)
Displacement (inch)
D1000s250‐97‐sigma‐2f
0
20
40
60
80
100
120
0 0.05 0.1 0.15 0.2 0.25 0.3
Load
(kip)
Displacement (inch)
D1000s250‐97‐8f
0
50
100
150
200
250
0 0.05 0.1 0.15 0.2
Load
(inch)
Displacement (inch)
D1000s250‐97‐sigma‐8f
384
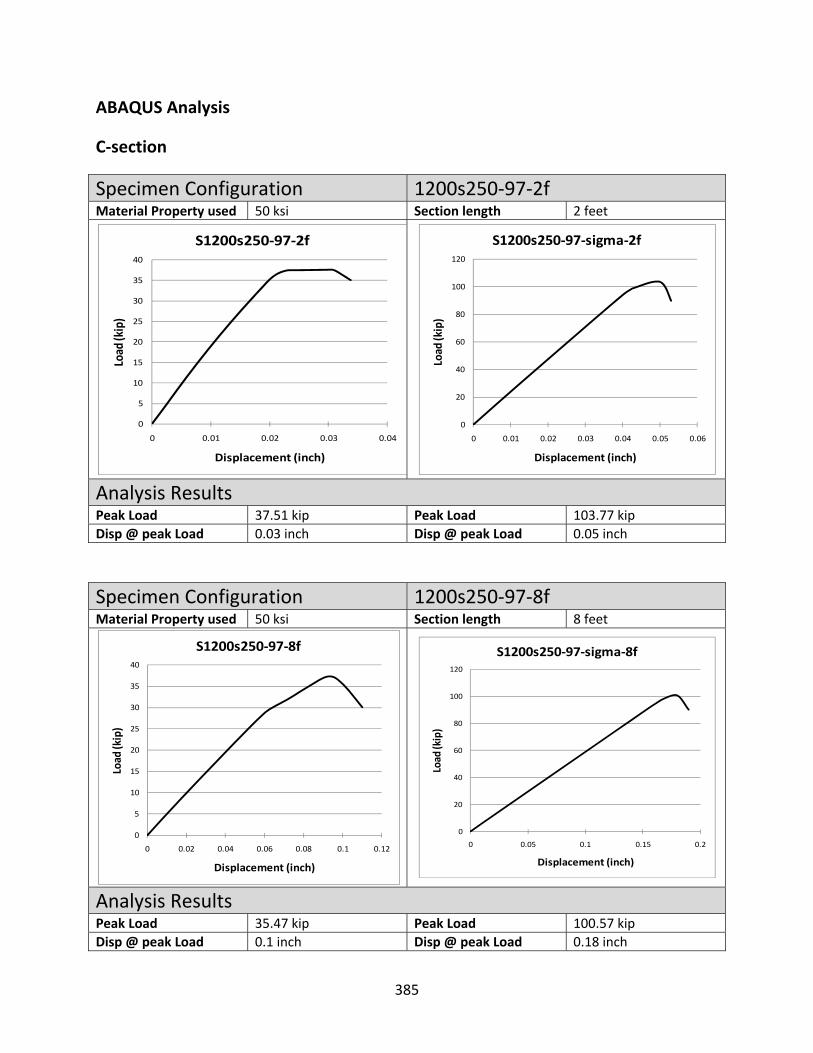
ABAQUS Analysis
C‐section
Specimen Configuration 1200s250‐97‐2fMaterial Property used 50 ksi Section length 2 feet
Analysis Results Peak Load 37.51 kip Peak Load 103.77 kip Disp @ peak Load 0.03 inch Disp @ peak Load 0.05 inch
Specimen Configuration 1200s250‐97‐8fMaterial Property used 50 ksi Section length 8 feet
Analysis Results Peak Load 35.47 kip Peak Load 100.57 kip Disp @ peak Load 0.1 inch Disp @ peak Load 0.18 inch
0
5
10
15
20
25
30
35
40
0 0.01 0.02 0.03 0.04
Load
(kip)
Displacement (inch)
S1200s250‐97‐2f
0
20
40
60
80
100
120
0 0.01 0.02 0.03 0.04 0.05 0.06Load
(kip)
Displacement (inch)
S1200s250‐97‐sigma‐2f
0
5
10
15
20
25
30
35
40
0 0.02 0.04 0.06 0.08 0.1 0.12
Load
(kip)
Displacement (inch)
S1200s250‐97‐8f
0
20
40
60
80
100
120
0 0.05 0.1 0.15 0.2
Load
(kip)
Displacement (inch)
S1200s250‐97‐sigma‐8f
385

ABAQUS Analysis
Sigma Section
Specimen Configuration 1200s250‐97‐Sigma‐2f Material Property used 50 ksi Section length 2 feet
Analysis Results d/h Ratio 0.416 Peak Load 90.74 kip Peak Load 250.02 kip Disp @ peak Load 0.03 inch Disp @ peak Load 0.05inch
Specimen Configuration 1200s250‐97‐Sigma‐8f Material Property used 50 ksi Section length 8 feet
Analysis Results d/h Ratio 0.416 Peak Load 99.19 kip Peak Load 225.56 kip Disp @ peak Load 0.14inch Disp @ peak Load 0.19 inch
0102030405060708090100
0 0.01 0.02 0.03 0.04 0.05
Load
(kip)
Displacement (inch)
D1200s250‐97‐2f
0
50
100
150
200
250
300
0 0.01 0.02 0.03 0.04 0.05 0.06Load
(kip)
Displacement (inch)
D1200s250‐97‐sigma‐2f
0
20
40
60
80
100
120
0 0.05 0.1 0.15 0.2
Load
(kip)
Displacement (inch)
D1200s250‐97‐8f
0
50
100
150
200
250
0 0.05 0.1 0.15 0.2 0.25 0.3
Load
(inch)
Displacement (inch)
D1200s250‐97‐sigma‐8f
386
REFERENCES
ABAQUS (2003), “ABAQUS Version 6.4,” ABAQUS Inc, Pawtucket, RI.
AISI Design Manual (2002), “American Iron and Steel Institute,” Washington, DC.
AISI S213 (2007), “The North American Standard for Cold‐formed steel Framing ‐ Lateral
Design, 2007 Edition”, American Iron and Steel Institute, Washington, DC.
ASTM A370‐06 (2006), “A370‐06: Standard Test Methods and Definitions for Mechanical
Testing of Steel Products,” American Society for Testing and Materials, West
Conshohocken, PA.
ASTM E564‐06 (2006), “E564‐06: Standard Practice for Static Load Test for Shear
Resistance of Framed Walls for Buildings”, American Society for Testing and
Materials, West Conshohocken, PA.
ASME (1998), “B18.22.1: Plan Washers”, American Society of Mechanical Engineers,
New York, NY.
CUREE (2004), “Consortium of Universities for Research in Earthquake Engineering,”
Protocol in Accordance with ICC AC 130 (2004).
CUFSM (2007), “CUFSM Version 2.6,” Website: http://www.ce.jhu.edu/bschafer/cufsm.
Davies, J. M. and Jiang, C. (1998), “Buckling Mode Interaction in Cold‐Formed Steel
Columns and Beams,” International Specialty Conference on Cold‐Formed Steel
Structures: Recent Research and Developments in Cold‐Formed Steel Design and
Construction, Fourteenth International Specialty Conference on Cold‐Formed Steel
Structures: 1998, P 53‐67.
Davies, J. M. and Jiang, C. (1996), “Design of Thin‐Walled beams for Distortional
Buckling,” International Specialty Conference on Cold‐Formed Steel Structures:
Recent Research and Developments in Cold‐Formed Steel Design and Construction,
387

Thirteenth International Specialty Conference on Cold‐Formed Steel Structures,
1996, p 141‐153.
Gerges, R.R., (1997), “Web Crippling of Single Web Cold‐Formed Steel Members
Subjected to End One‐Flange Loading.” M. A. Sc. Thesis, University of Waterloo,
Waterloo, Ontario, Canada.
Hetrakul, N. and Yu, W.W., (1978), “Structural Behavior of Beam Webs Subjected to
Web Crippling and a Combination of Web Crippling and Bending.” Final Report, Civil
Engineering Study 78‐4. University of Missouri‐Rolla, Rolla, MO.
ISO, (1998), “International Organization for Standardization.” 56, CH‐1211, Geneva 20.
Kwon, Y. B. and Hancock, G.J., (1992), “Tests of Cold‐Formed Channels with Local and
Distortional Buckling.” Journal of Structural Engineering, v 118, n 7, Jul, 1992, p
1786‐1803.
Lau S, Hancock G. (1987), “Distortional Buckling Formulae for Channel Columns.” Journal
of Structural Engineering (ASCE) 1987; 113(5):1063–78.
Lau S, Hancock G. (1990), “Inelastic Buckling of Channel Columns in the Distortional
Mode” Thin‐Walled Structures, v 10, n 1, 1990, 59‐84.
NAS (2007), “North American Specification for the Design of Cold‐Formed Steel
Structural Members”, American Iron and Steel Institute, Washington DC.
Papangelis, J.P. and Hancock, G.J., (1998),“Computer Design of Cold‐Formed C‐section
and Z‐section Purlins,” Journal of Constructional Steel Research, v 46, n 1‐3, Apr‐Jun,
1998, p 169‐171.
Prabakaran, K., (1993), “Web Crippling of Cold‐Formed Steel Sections.” M.S. Thesis,
University of Waterloo, Waterloo, Ontario, Canada.
388
Prabakaran, K. and Schuster, R.M., (1998), “Web Crippling of Cold‐Formed Steel
Members.” Proceedings of the Fourteenth International Specialty Conference on
Cold‐Formed Steel Structures, University of Missouri‐Rolla, Rolla, MO.
Salenikovich, A.J., Dolan, J.D., Easterling, W.S. (2000), “Racking performance of long
steel‐frame shear walls.” In Proceedings of the 15th International Specialty
Conference on Cold‐Formed Steel Structures. St. Louis, MO, USA: 471‐480.
Santaputra, C., (1986), “Web Crippling of High Strength Cold‐Formed Steel Beams.” Ph.D
Thesis, University of Missouri‐Rolla, Rolla, MO.
Schafer, B.W., Ádány, S. (2006), “Buckling Analysis of Cold‐Formed Steel Members Using
CUFSM: Conventional and Constrained Finite Strip Methods.” Eighteenth
International Specialty Conference on Cold‐Formed Steel Structures, Orlando, FL.
Schafer B., (2000), “Direct Strength Design For Cold‐Formed Steel Members with
Perforations,” Department of Civil Engineering, The Johns Hopkins University,
Baltimore, Maryland.
Schafer, B.W., Peköz, T. (1998), “Computational Modeling of Cold‐Formed Steel:
Characterizing Geometric Imperfections and Residual Stresses”, Elsevier, Journal of
Constructional Steel Research. 47 (3) 193‐210.
SEAOSC , (1997), “The Structural Engineers Association of Southern California “
Serrette, R.L., Nguyen, H., Hall, G. (1996), “Shear Wall Values for Light Weight Steel
Framing.” Report No. LGSRG‐3‐96, Santa Clara University. Santa Clara, CA.
Serrette, R.L. (1997), “Additional Shear Wall Values for Light Weight Steel Framing.”
Report No. LGSRG‐1‐97, Santa Clara University. Santa Clara, CA.
Serrette, R.L. (2002), “Performance of Cold‐Formed Steel‐Framed Shear Walls:
Alternative Configurations,” Final Report: LGSRG‐06‐02, Santa Clara University. Santa
Clara, CA.
389
SigmaStud® (2008), “Load Bearing Wall Systems, June 2008 Edition.” The Steel Network,
Inc., 3215 Wellington Court, Building M Raleigh, North Carolina 27615.
SSMA (2007). “Product Technical Information ICBO ER‐4943P”, Steel Stud Manufacturer
Association, Chicago, IL.
Timoshenko, S.P., Gere J.M. (1961), “Theory of Elastic Stability” Second Edition.
McGraw‐Hill Book Co, Columbus, OH.
Tissell, J.R. (1990), “Panel‐Sheathed Shear Walls ‐ Past and Future”, American Plywood
Association, Structural Design, Anal Test, 1989, p 124‐133.
Tissell, J.R. (1993), “Wood Structural Panel Shear Walls: Report No.154,” American
Plywood Association, Tacoma, WA, USA.
Yu, C. (2008), “Shear Resistance of Cold‐Formed Steel Framed Shear Wall Assemblies
with 0.027, 0.030, and 0.033 in. Steel Sheet Sheathing,” The 19th International
Specialty Conference on Cold‐Formed Steel Structures, St. Louis, MO. October 2008.
Yu, C. (2007), “Behavior and Design of Cold‐Formed Steel Joists with Edge Stiffened
Perforations”, Annual Technical Session and Meeting, Structural Stability Research
Council, February 2007, New Orleans, LA.
Yu, W.W., (2000). “Cold‐Formed Steel Design,” John Wiley and Sons Inc, 3rd Edition.
Winter, G. and Pian, R. H. J. (1946), “Crushing Strength of Thin Steel Webs,” Engineering
Experiment Station, Bulletin No. 35, Part 1, Cornell University, April 1946.
Zetlin, L., (1955), “Elastic Instability of Flat Plates Subjected to Partial Edge Loads.”
Journal of the Structural Division, American Society of Civil Engineers, Vol. 81.
390