Assessment: Interviews, Tests, Techniques - Perfectionism ...
Upload
khangminh22Category
view
0download
0
ФЕДЕРАЛЬНОЕ АГЕНТСТВО ПО ОБРАЗОВАНИЮ Государственное образовательное учреждение высшего профессионального образования
«НАЦИОНАЛЬНЫЙ ИССЛЕДОВАТЕЛЬСКИЙ ТОМСКИЙ ПОЛИТЕХНИЧЕСКИЙ УНИВЕРСИТЕТ»
УТВЕРЖДАЮ Проректор-директор ИПР А.К. Мазуров « » 2011 г.
Laboratory testing of soils Part II. Mechanical properties of soils
Методические указания к выполнению лабораторных работ по курсу «Грунтоведение»
для студентов обучающихся по направлению 130100 «Геология и разведка полезных ископаемых».
Составитель Крамаренко В.В.
Издательство
Томского политехнического университета 2010
2
УДК 624.131.37(076.5)
ББК 26.3я73
Л-125
Крамаренко В.В. Laboratory testing of soils. Part II. Mechanical properties of soils:
Методические указания к выполнению лабораторных работ по курсу
«Грунтоведение» для студентов, обучающихся по направлению 130100
«Геология и разведка полезных ископаемых». / сост. В.В. Крамаренко;
Национальный исследовательский Томский политехнический
университет. – Томск: Изд-во Томского политехнического университета,
2011.– 52 с.
УДК 624.131.37(076.5)
ББК 26.3я73
Методические указания рассмотрены и рекомендованы
к изданию методическим семинаром кафедры
гидрогеологии, инженерной геологии и гидрогеоэкологии ИГНД
«26» января 2009
Зав. кафедрой ГИГЭ
Доктор геолого-минералогических наук _________С.Л. Шварцев
Председатель учебно-методической
комиссии _________Н. Г. Наливайко
Рецензент
канд. геол.-минер. наук доцент ТПУ Т.Я. Емельянова
© Составление. ГОУ ВПО «Национальный
исследовательский Томский политехнический университет», 2011
© Крамаренко В.В. 2011 © Оформление. Издательство Томского
политехнического университета, 2011
3
5. MECHANICAL PROPERTIES OF SOILS
5.1. Stress in soils
5.1.1. Load-deformation process in soils
The design and analysis of shallow and deep foundations, excavations,
earth retention structures, and fills and slopes require a thorough
understanding of soil strength parameters. The selection of strength
parameters needed and the corresponding types of tests to be performed vary
depending on the type of construction, the foundation design, the intensity,
type and duration of loads to be imposed, and soil materials existing at the
site.
For simple projects, sufficient strength information can be obtained from
strength correlations using field and laboratory index tests. However, strength
testing may be needed when there is uncertainty in the knowledge of material
properties, or if design loads/stresses are significant. The type of tests needed
depends on whether the analysis is performed using total or effective stresses.
The purpose of laboratory testing is to simulate in-situ soil loading under
controlled boundary conditions. There are three general ways to induce
deformations in solids or semi-solids: tension, compression, and shear.
When a load is applied to a soil sample, the deformation which occurs
will depend on the grain-to-grain contact (intergranular) forces and the
amount of water in the voids. If no porewater exists, the sample deformation
will be due to sliding between soil grains and deformation of the individual
soil grains. The rearrangement of soil grains due to sliding accounts for most
of the deformation. Adequate deformation is required to increase the grain
contact areas to take the applied load. As the amount of pore water in the
void increases, the pressure it exerts on soil grains will increase and reduce
the intergranular contact forces.
In fact, tiny clay particles may be forced completely apart by water in
the pore space.
Deformation of a saturated soil is more complicated than that of dry soil
as water molecules, which fill the voids, must be squeezed out of the sample
before readjustment of soil grains can occur. The more permeable a soil is,
the faster the deformation under load will occur. However, when the load on
a saturated soil is quickly increased, the increase is carried entirely by the
pore water until drainage begins. Then more and more load is gradually
transferred to the soil grains until the excess pore pressure has dissipated and
the soil grains readjust to a denser configuration. This process is called
consolidation and results in a higher unit weight and a decreased void ratio.
4
5.1.2. Principle of effective stress
The consolidation process demonstrates the very important principle of
effective stress. Under an applied load, the total stress in a saturated soil
sample is composed of the intergranular stress and porewater pressure
(neutral stress). As the porewater has zero shear strength and is considered
incompressible, only the intergranular stress is effective in resisting shear or
limiting compression of the soil sample. Therefore, the intergranular contact
stress is called the effective stress. Simply stated, this fundamental principle
states that the effective stress (σ') on any plane within a soil mass is the net
difference between the total stress (σ) and porewater pressure (u).
When porewater drains from soil during consolidation, the area of
contact between soil grains increases, which increases the level of effective
stress and therefore the soils shear strength. In practice, staged construction
of embankments is used to permit increase of effective stress in the
foundation soil before subsequent fill load is added. In such operations the
effective stress increase is frequently monitored with piezometers to ensure
the next stage of embankment can be safely placed.
Soil deposits below the water table will be considered saturated and the
ambient pore pressure at any depth may be computed by multiplying the unit
weight of water (w) by the height of water above that depth. For partially
saturated soil, the effective stress will be influenced by the soil structure and
degree of saturation. In many cases involving silts & clays, the continuous
void spaces that exist in the soil behave as capillary tubes of variable cross-
section. Due to capillarity, water may rise above the static groundwater table
(phreatic surface) as a negative porewater pressure and the soils may be
nearly or fully saturated.
5.1.3. Overburden stress
Soils existing at a depth below the ground surface are affected by the
weight of the soil above that depth.
The influence of this weight, known generally as the overburden stress,
causes a state of stress to exist which is unique at that depth for that soil.
When a soil sample is removed from the ground, that state of stress is
relieved as all confinement of the sample has been removed. In testing, it is
important to reestablish the in-situ stress conditions and to study changes in
soil properties when additional stresses representing the expected design
loading are applied. In this regard, the effective stress (grain-to-grain contact)
is the controlling factor in shear, state of stress, consolidation, stiffness, and
flow. Therefore, the designer should try to re-establish the effective stress
condition during most testing. The test confining stresses are estimated from
5
the total, hydrostatic, and effective overburden stresses. The engineer’s first
task is determining these stress and pressure variations with depth. This
involves determining the total unit weights (density) for each soil layer in the
subsurface profile, and determining the depth of the water table. Unit weight
may be accurately determined from density tests on undisturbed samples or
estimated from in-situ test measurements.
The total vertical (overburden) stress (σ vo) at any depth (z) may be
found as the accumulation of total unit weights (γt) of the soil strata above
that depth:
σ vo =γt dz=γt Δz. (5.1)
For soils above the phreatic surface, the applicable value of total unit
weight may be dry, moist, or saturated depending upon the soil type and
degree of capillarity. For soil elements situated below the groundwater table,
the saturated unit weight is normally adopted.
The hydrostatic pressure depends upon the degree of saturation and level
of the phreatic surface and is determined as follow:
Soil elements above water table:
uo = 0 (completely dry); (5.2)
uo = γw (z- zw) (full capillarity). (5.3)
Soil elements below water table:
uo = γw (z- zw), (5.4)
where z = depth of soil element, zw = depth to groundwater table.
Another case involves partial saturation with intermediate values
between (2 and 3) which literally vary daily with the weather and can be
obtained via tensiometer measurements in the field. Usual practical
calculations adopt (3) for many soils, yet the negative capillary values from
(2) often apply to saturated clay & silt deposits. The effective vertical stress
is obtained as the difference between (1) and (2):
σ vo = σ vo - uo (5.5).
A plot of effective overburden profile with depth is called a σ‘v diagram
and is extensively used in all aspects of foundation testing and analysis.
5.1.4. Total and effective stress analysis
Soils are controlled by the effective stress strength envelope (c and ')
6
and therefore the proper determination of these parameters is paramount.
The strength envelope is best determined by either a series of
(1) consolidated undrained triaxial shear tests with porewater pressure
measurements (CU);
(2) consolidated drained triaxial tests at slow strain rates (CD);
or (3) drained direct shear tests (DDS).
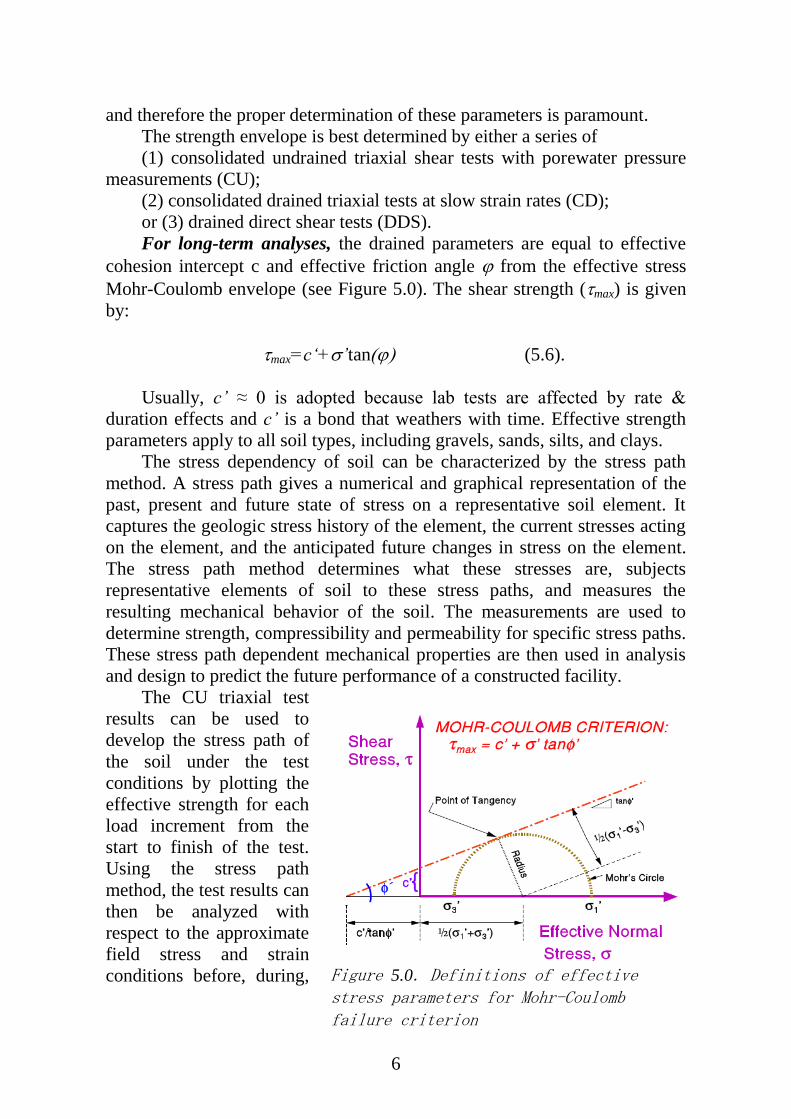
For long-term analyses, the drained parameters are equal to effective
cohesion intercept c and effective friction angle from the effective stress
Mohr-Coulomb envelope (see Figure 5.0). The shear strength (max) is given
by:
max=c‘+’tan (5.6).
Usually, c’ ≈ 0 is adopted because lab tests are affected by rate &
duration effects and c’ is a bond that weathers with time. Effective strength
parameters apply to all soil types, including gravels, sands, silts, and clays.
The stress dependency of soil can be characterized by the stress path
method. A stress path gives a numerical and graphical representation of the
past, present and future state of stress on a representative soil element. It
captures the geologic stress history of the element, the current stresses acting
on the element, and the anticipated future changes in stress on the element.
The stress path method determines what these stresses are, subjects
representative elements of soil to these stress paths, and measures the
resulting mechanical behavior of the soil. The measurements are used to
determine strength, compressibility and permeability for specific stress paths.
These stress path dependent mechanical properties are then used in analysis
and design to predict the future performance of a constructed facility.
The CU triaxial test
results can be used to
develop the stress path of
the soil under the test
conditions by plotting the
effective strength for each
load increment from the
start to finish of the test.
Using the stress path
method, the test results can
then be analyzed with
respect to the approximate
field stress and strain
conditions before, during,
Figure 5.0. Definitions of effective stress parameters for Mohr-Coulomb failure criterion
7
and after construction.
For short-term loading of clays & silts, total stress analysis uses the
undrained shear strength (designated su or cu, the old archaic term ‖cohesion‖
designated ―c‖ has been replaced with undrained shear strength) that is a soil
behavioral response that reflects the combination of the effective stress
frictional envelope (c’ and ’) plus excess porewater pressures that depend
on stress history. From this regard, perhaps the simple shear is the most
appropriate test for stability & bearing capacity analyses, however, the device
is not in widespread use. Other modes of su include triaxial compression &
extension, plane strain active & passive, true triaxial, hollow cylinder, and
directional shear, all of which provide different values of su depending upon
the boundary conditions, direction of loading, strain rate, and initial stress
state. As this is a complex issue, the best value is calculated from the
normalized value
su /σvo’ = 0.5 sinφ’ OCR0.8
.
For extensively fissured clays and tills, the macrofabric of
discontinuities reduces the overall strength should be reduced by a factor of 2.
In the case of fissured geomaterials, it is also common that these exhibit past
problems with landsliding and slope instability, therefore the drained strength
parameters may be more appropriately assigned to the residual values (cr’ and
r’). Residual strengths can be determined by ring shear tests or series of
repeated drained direct shear box tests.
Subsurface Investigations provides guidance on the selection of test
types and the determination of applied loads/pressures. The general design
cases and applicable stress categories are summarized below:
– foundations total stress – undrained strengths;
– excavation effective stress – drained strengths;
– natural slope effective stress – drained strengths.
Typically, at least three strength tests are performed to obtain a strength
envelope and identify any obviously erroneous test results. The confining
pressures for each test should be estimated by the engineer, which should be
based on the range of stress levels to be experienced during various stages of
construction (including the initial overburden pressures). Typically, the first
test has a confining stress similar to the existing overburden pressure, and the
second and third tests would have higher confining stresses to determine .
Testing pressures are commonly about 10, 20, and 40 psi (effective
stresses). In cases where the Mohr envelope is not linear (because of past
preconsolidation) or the project is complex, additional tests should be
conducted in the lower stress range to better model the Mohr envelope and to
8
better define the cohesion intercept.
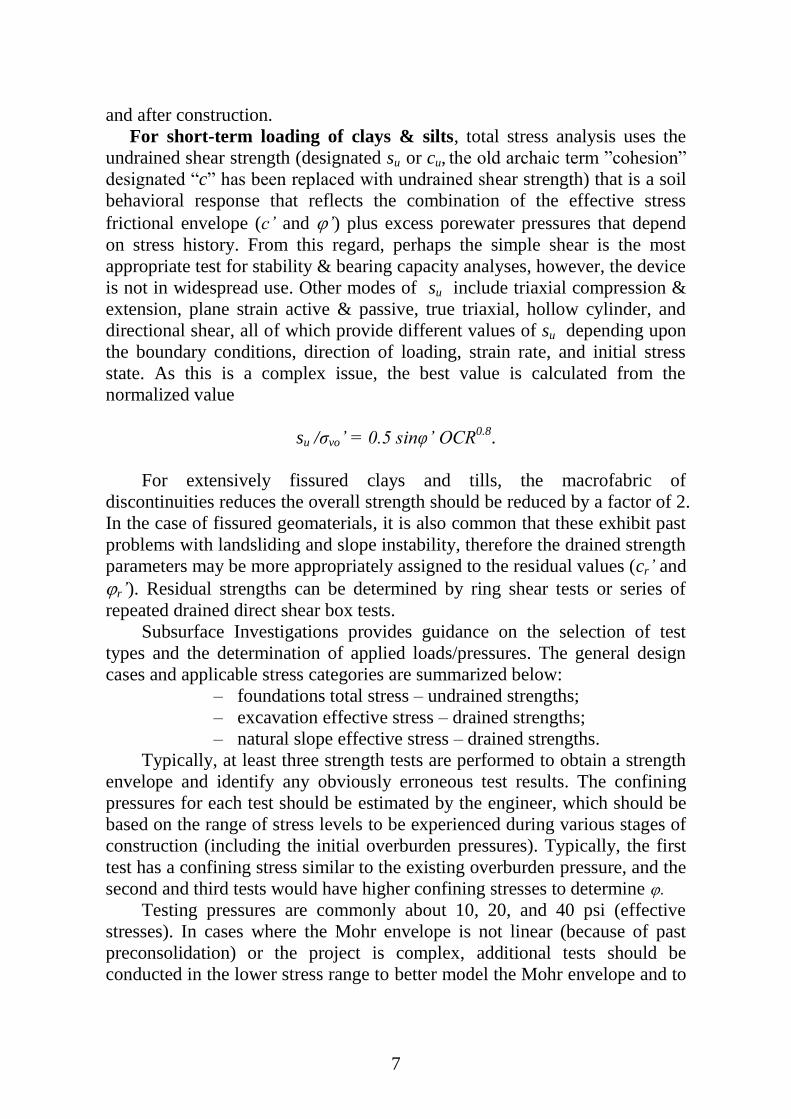
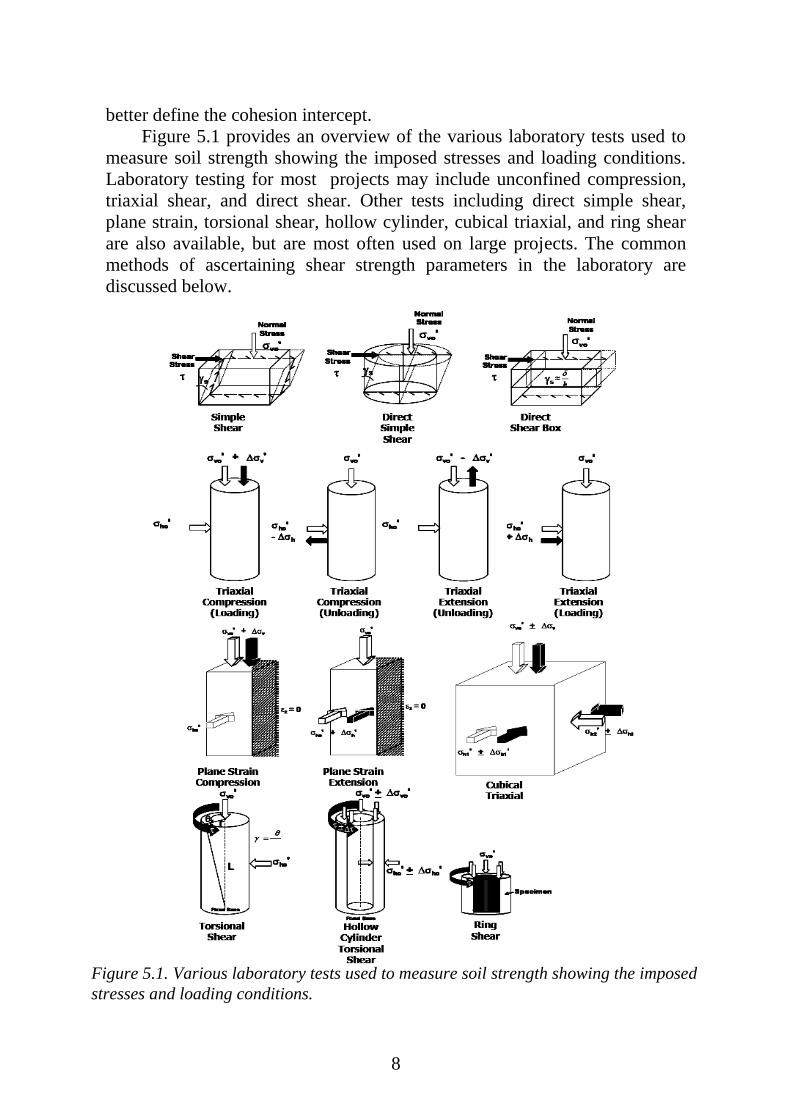
Figure 5.1 provides an overview of the various laboratory tests used to
measure soil strength showing the imposed stresses and loading conditions.
Laboratory testing for most projects may include unconfined compression,
triaxial shear, and direct shear. Other tests including direct simple shear,
plane strain, torsional shear, hollow cylinder, cubical triaxial, and ring shear
are also available, but are most often used on large projects. The common
methods of ascertaining shear strength parameters in the laboratory are
discussed below.
Figure 5.1. Various laboratory tests used to measure soil strength showing the imposed
stresses and loading conditions.
9
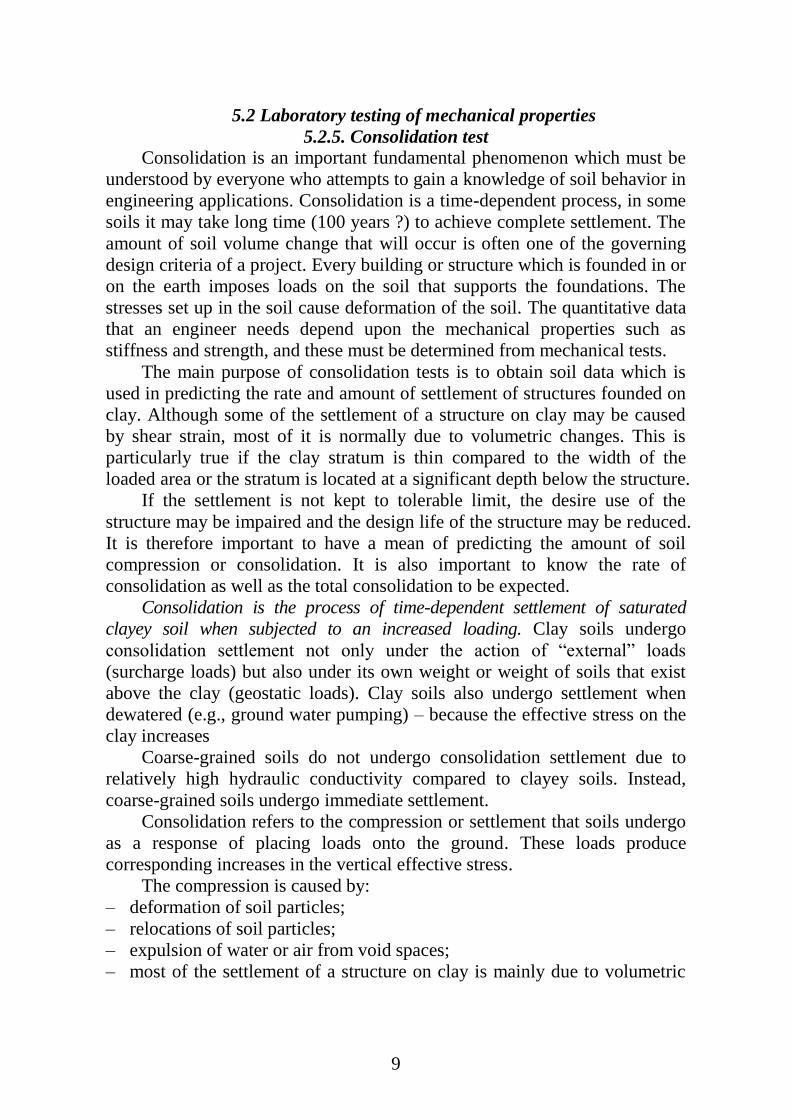
5.2 Laboratory testing of mechanical properties
5.2.5. Consolidation test
Consolidation is an important fundamental phenomenon which must be
understood by everyone who attempts to gain a knowledge of soil behavior in
engineering applications. Consolidation is a time-dependent process, in some
soils it may take long time (100 years ?) to achieve complete settlement. The
amount of soil volume change that will occur is often one of the governing
design criteria of a project. Every building or structure which is founded in or
on the earth imposes loads on the soil that supports the foundations. The
stresses set up in the soil cause deformation of the soil. The quantitative data
that an engineer needs depend upon the mechanical properties such as
stiffness and strength, and these must be determined from mechanical tests.
The main purpose of consolidation tests is to obtain soil data which is
used in predicting the rate and amount of settlement of structures founded on
clay. Although some of the settlement of a structure on clay may be caused
by shear strain, most of it is normally due to volumetric changes. This is
particularly true if the clay stratum is thin compared to the width of the
loaded area or the stratum is located at a significant depth below the structure.
If the settlement is not kept to tolerable limit, the desire use of the
structure may be impaired and the design life of the structure may be reduced.
It is therefore important to have a mean of predicting the amount of soil
compression or consolidation. It is also important to know the rate of
consolidation as well as the total consolidation to be expected.
Consolidation is the process of time-dependent settlement of saturated
clayey soil when subjected to an increased loading. Clay soils undergo
consolidation settlement not only under the action of ―external‖ loads
(surcharge loads) but also under its own weight or weight of soils that exist
above the clay (geostatic loads). Clay soils also undergo settlement when
dewatered (e.g., ground water pumping) – because the effective stress on the
clay increases
Coarse-grained soils do not undergo consolidation settlement due to
relatively high hydraulic conductivity compared to clayey soils. Instead,
coarse-grained soils undergo immediate settlement.
Consolidation refers to the compression or settlement that soils undergo
as a response of placing loads onto the ground. These loads produce
corresponding increases in the vertical effective stress.
The compression is caused by:
– deformation of soil particles;
– relocations of soil particles;
– expulsion of water or air from void spaces;
– most of the settlement of a structure on clay is mainly due to volumetric
10
changes and rarely due to shear strain.
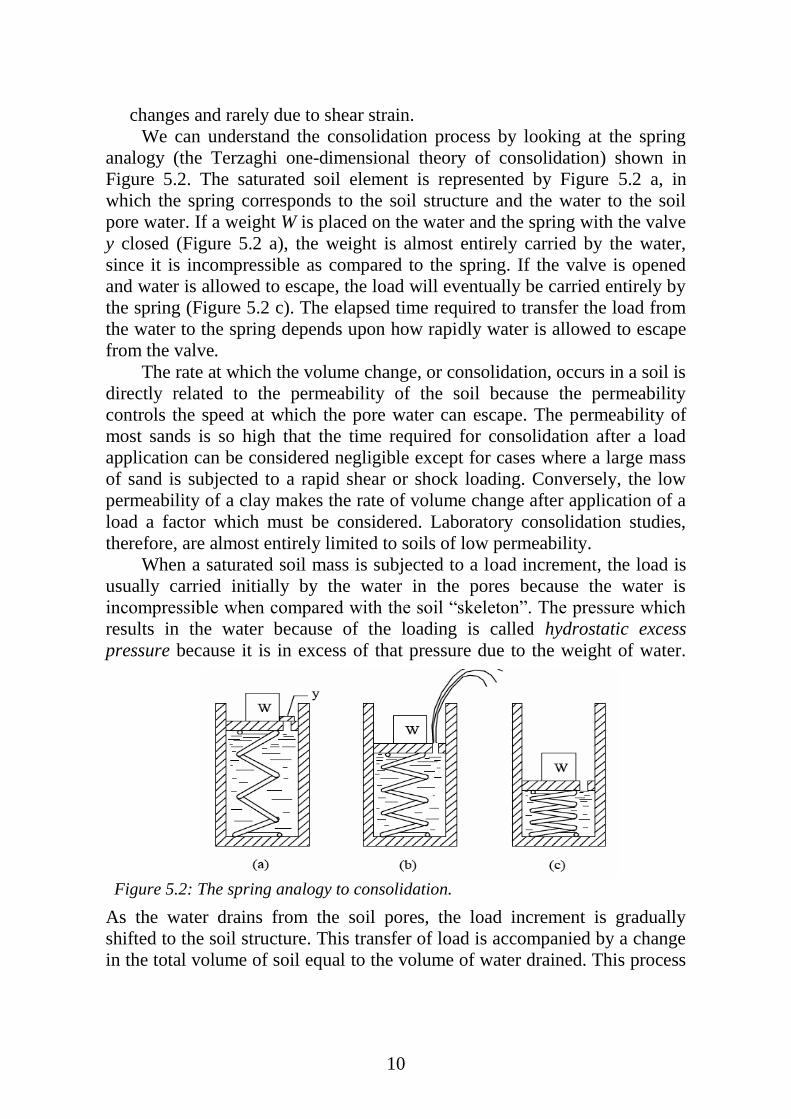
We can understand the consolidation process by looking at the spring
analogy (the Terzaghi one-dimensional theory of consolidation) shown in
Figure 5.2. The saturated soil element is represented by Figure 5.2 a, in
which the spring corresponds to the soil structure and the water to the soil
pore water. If a weight W is placed on the water and the spring with the valve
y closed (Figure 5.2 a), the weight is almost entirely carried by the water,
since it is incompressible as compared to the spring. If the valve is opened
and water is allowed to escape, the load will eventually be carried entirely by
the spring (Figure 5.2 c). The elapsed time required to transfer the load from
the water to the spring depends upon how rapidly water is allowed to escape
from the valve.
The rate at which the volume change, or consolidation, occurs in a soil is
directly related to the permeability of the soil because the permeability
controls the speed at which the pore water can escape. The permeability of
most sands is so high that the time required for consolidation after a load
application can be considered negligible except for cases where a large mass
of sand is subjected to a rapid shear or shock loading. Conversely, the low
permeability of a clay makes the rate of volume change after application of a
load a factor which must be considered. Laboratory consolidation studies,
therefore, are almost entirely limited to soils of low permeability.
When a saturated soil mass is subjected to a load increment, the load is
usually carried initially by the water in the pores because the water is
incompressible when compared with the soil ―skeleton‖. The pressure which
results in the water because of the loading is called hydrostatic excess
pressure because it is in excess of that pressure due to the weight of water.
As the water drains from the soil pores, the load increment is gradually
shifted to the soil structure. This transfer of load is accompanied by a change
in the total volume of soil equal to the volume of water drained. This process
Figure 5.2: The spring analogy to consolidation.
11
is known as consolidation.
Therefore are three types of consolidation:
– immediate consolidation; caused by elastic deformation of dry soil or
moist and saturated soil without change in moisture content;
– primary consolidation; caused as a result of volume change in
saturated cohesive soils due to exclusion of water occupied the void spaces;
– secondary consolidation; occurs in saturated cohesive soils as a result
of the plastic adjustment of soil fabrics.
The one-dimensional consolidation test (or oedometer test) provides one
of the most useful and reliable laboratory measurements for soil behavior.
The test determines the compressibility parameters (Cc, Cs, Cr), stiffness in
terms of constrained modulus (Dr = 1/mv), preconsolidation stress (σp), rate
of consolidation (cv), creep rate (C ), and approximate value of permeability
(k).
Data obtained from these tests together with classification data and
knowledge of the soils loading history, enables estimates to be made of the
behavior of foundations under load. Tests are carried out on specimens
prepared from undisturbed samples.
This test method assumes that dimensional change due to consolidation
will take place in the vertical direction. This assumption is generally
acceptable for stiff or medium, confined cohesive soils, but it is not true for
soft soils or for soils that are not confined (i.e., bridge approaches). The data
and the analysis produced from this test have proved to be reasonably reliable.
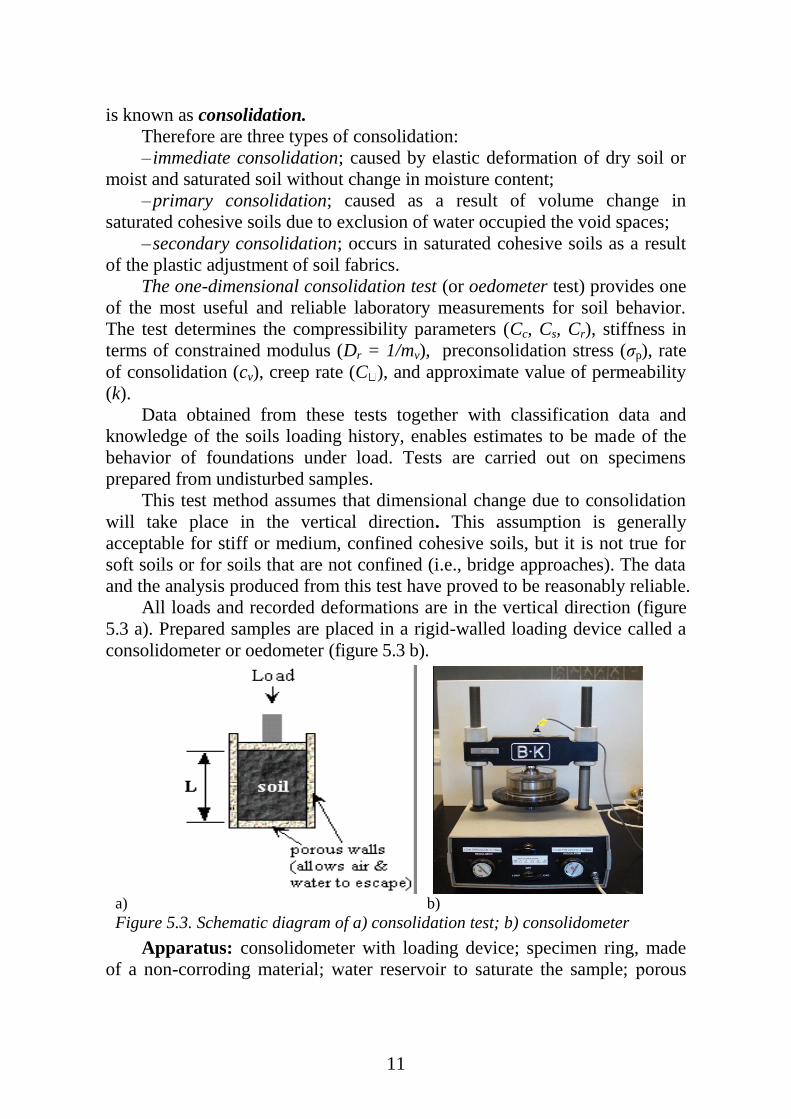
All loads and recorded deformations are in the vertical direction (figure
5.3 a). Prepared samples are placed in a rigid-walled loading device called a
consolidometer or oedometer (figure 5.3 b).
Apparatus: consolidometer with loading device; specimen ring, made
of a non-corroding material; water reservoir to saturate the sample; рorous
a) b)
Figure 5.3. Schematic diagram of a) consolidation test; b) consolidometer
12
stones; soil trimming tool, like knife, spatula; dial gauge, accuracy 0.002 mm;
рressure pad; weighing balance, accuracy 0.01g; oven; ball.
Procedure
1. Preparation of sample:
undisturbed soil specimen: Clean dry and then lubricate the
consolidation ring from inside with silicon grease. Push the sample
directly into the consolidation ring and hold the ring firmly about 5
mm above the sample tube keeping the cutting face down ward and
eject the sample gently and steadily out of the tube by means of
hydraulic jack so that it intrudes into the ring. During this process,
continue trimming the specimen care fully from outside the
consolidation ring to reduce friction. Trim and flush the soil sample
with the ends of the consolidation ring.
remoulded soil specimen: Prepare the soil sample by compaction
method. Place the consolidation ring on glass plate with cutting edge
upward. Press the remoulded soil into the ring by suitable means. Flush
the soil specimen with the top end of the ring and weigh. Alternatively,
the soil specimen may be intruded into the consolidation ring.
1. Clean and dry the metal ring. Measure its diameter and height. Take
the mass of the empty ring.
2. Press the ring into the soil sample at the desired density and the water
content. The ring is to be pressed with hands. Any voids in the specimen due
to the removal of large particles should be filled back by pressing the soil
lightly.
3. Trim the specimen flush with the top and bottom of the ring.
4. Saturate the porous stones by boiling them in distilled water for about
15 minutes.
5. Assemble the consolidometer. Place the bottom porous stone, bottom
filter paper, specimen, top filter paper and the top porous stone, one by one.
6. Position the loading block centrally on the top porous stone. Mount
the mould assembly on the loading frame. Centre it such that the load applied
is axial in the lever-loading system.
7. Set the dial gauge in the position. Allow sufficient margin for the
swelling of the soil.
8. Connect the mould assembly to the water reservoir having the water
level at about the same level as the soil specimen. Allow the water flow into
the specimen till it is fully saturated.
9. Take the initial reading of the dial gauge.
10. Apply an initial setting load to give a pressure of 0.05 kg/cm2 to the
assembly so that there is no swelling and allow the setting load to stand till
13
there is no change in the dial gauge reading or for 24 hours. Take the final
gauge reading under the initial setting load.
11. Normal sequence of pressure to be applied is 0.25, 0.50, 1.0, 2.0, 4.0,
8.0 and 16.0 kg /cm2 and take the dial gauge reading after application of each
load at a time sequence of 0.25, 1.0, 2.25, 4.0, 6.25, 12.25, 16, 20, 25, 36, 49,
64, 81, 100, 121, 144, 169, 196, 225, 289, 324, 361, 400, and finally 1440
minutes.
12. After the last load increment had been applied and the reading taken,
decrease the load to . of the last load and allow it stand for 24 hours. Take the
dial gauge reading after 24 hours. Further reduce the load and repeat the
above procedure, likewise further reduce the load and repeat the procedure.
Finally reduce the load to the initial setting load and keep out for 24 hours
and take the final dial gauge reading.
13. Dismantle the assembly. Take out the ring with the specimen. Wipe
out the excess surface water using bloating paper and remove the filter paper
both side the specimen.
14. Take weight of the ring with specimen.
15. Dry the specimen in oven for 24 hours and determine the dry weight
of the specimen.
16. Determine the specific gravity of soil from the dried specimen.
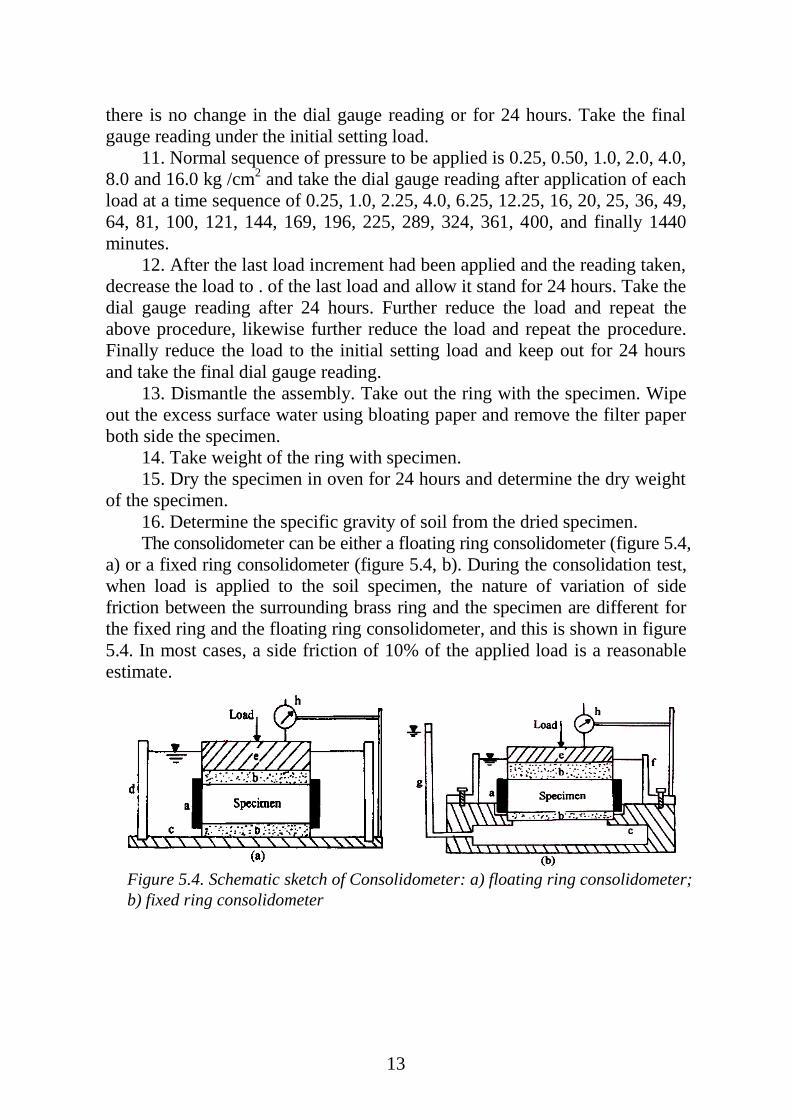
The consolidometer can be either a floating ring consolidometer (figure 5.4,
a) or a fixed ring consolidometer (figure 5.4, b). During the consolidation test,
when load is applied to the soil specimen, the nature of variation of side
friction between the surrounding brass ring and the specimen are different for
the fixed ring and the floating ring consolidometer, and this is shown in figure
5.4. In most cases, a side friction of 10% of the applied load is a reasonable
estimate.
Figure 5.4. Schematic sketch of Consolidometer: a) floating ring consolidometer;
b) fixed ring consolidometer
14
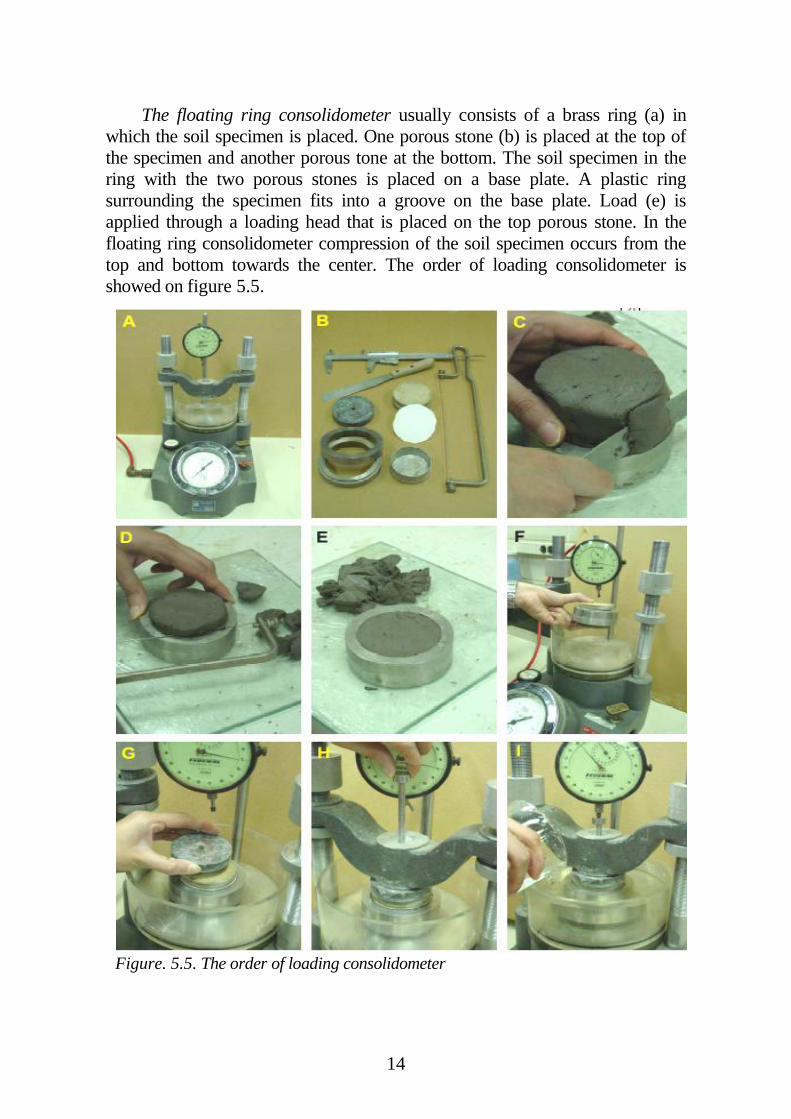
The floating ring consolidometer usually consists of a brass ring (a) in
which the soil specimen is placed. One porous stone (b) is placed at the top of
the specimen and another porous tone at the bottom. The soil specimen in the
ring with the two porous stones is placed on a base plate. A plastic ring
surrounding the specimen fits into a groove on the base plate. Load (e) is
applied through a loading head that is placed on the top porous stone. In the
floating ring consolidometer compression of the soil specimen occurs from the
top and bottom towards the center. The order of loading consolidometer is
showed on figure 5.5.
Figure. 5.5. The order of loading consolidometer
15
The fixed ring consolidometer essentially consists of the same components,
i.e., a hollow base plate, two porous stones, a brass ring to hold the soil
specimen, and a metal ring that can be fixed tightly to the top of the base
plate. In the fixed ring consolidometer, the compression of the specimen
occurs from the top towards the bottom.
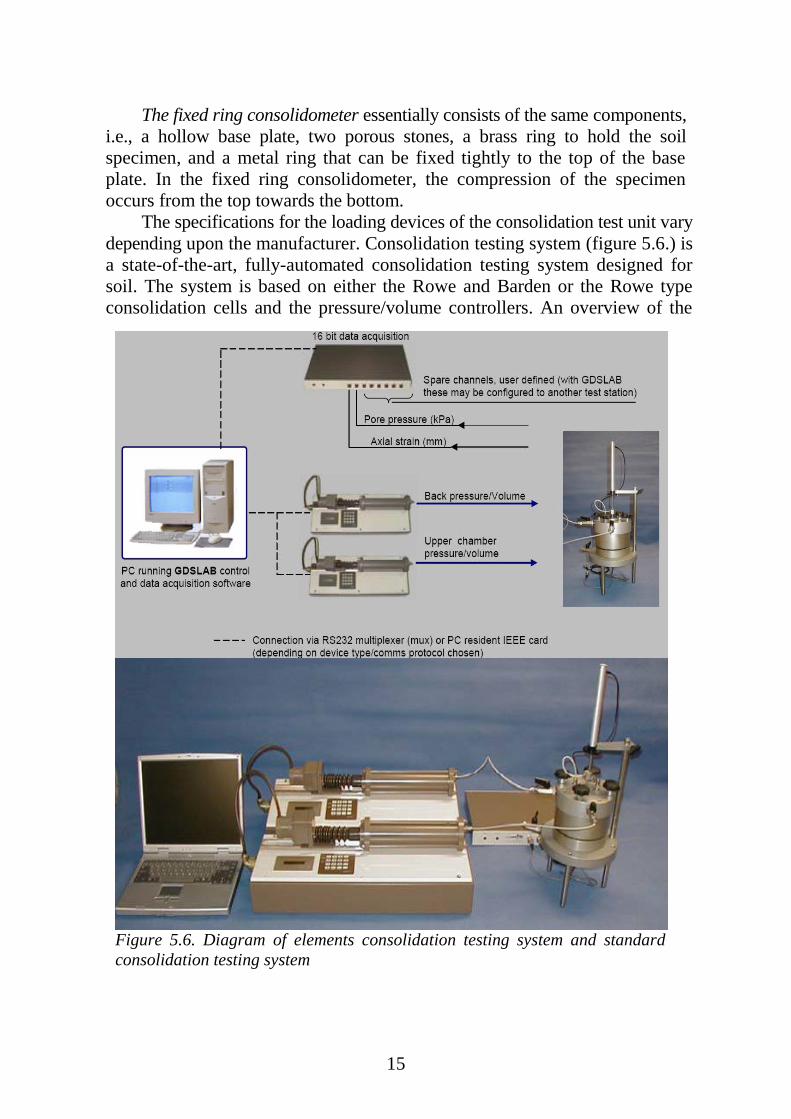
The specifications for the loading devices of the consolidation test unit vary
depending upon the manufacturer. Consolidation testing system (figure 5.6.) is
a state-of-the-art, fully-automated consolidation testing system designed for
soil. The system is based on either the Rowe and Barden or the Rowe type
consolidation cells and the pressure/volume controllers. An overview of the
Figure 5.6. Diagram of elements consolidation testing system and standard
consolidation testing system
16
two types of consolidation cell is described later. Two of these pressure
controllers link the computer to the test cell as follows: one for axial stress and
axial displacement control, one for setting back pressure and measuring
volume change. System can run classic tests such as step loading to more
advanced tests such as automated testing rate by controlled hydraulic gradient
or cyclic loading, all under PC control. Using the flexibility of software,
almost any user-defined test may be performed. The hardware used may be
chosen to suit your testing and budgetary requirements. The test is performed
using a small 50-mm to 75-mm diameter thin specimen (25 mm thick) taken
from an undisturbed sample. Selection of representative samples for testing is
critical.
The range of Rowe-type consolidation cells is a development of the
original cell designed by Professor P.W. Rowe at Manchester University,
England. These cells, in which load is applied to the sample hydraulically,
offer many advantages and considerably widen the scope of laboratory
testing. In addition, the hydraulic loading system gives accurate control of
applied loads over a wide range, including high pressures on large diameter
samples (figure 5.7).
The use of hydraulic consolidation
allows tests to be performed on samples of
large diameter. The most important feature
of this system is the ability to control
drainage and to measure pore water
pressure during the consolidation test.
Several drainage conditions are possible
and back pressure can be applied to the
sample.
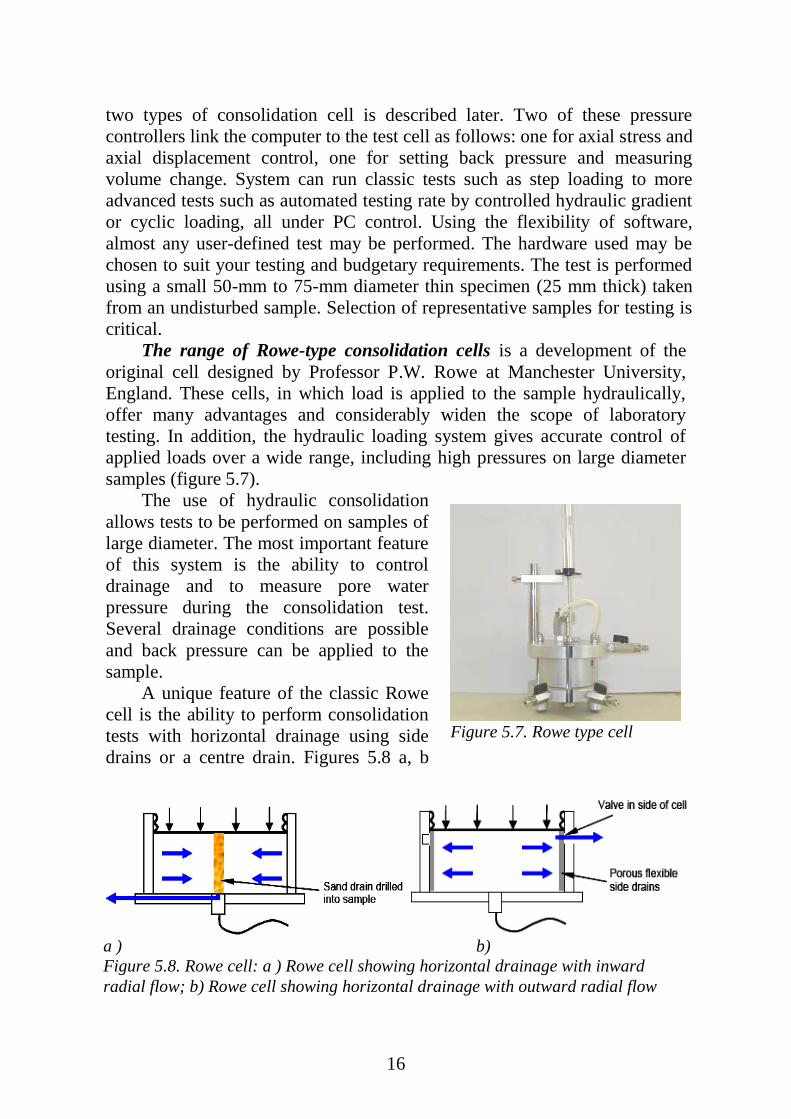
A unique feature of the classic Rowe
cell is the ability to perform consolidation
tests with horizontal drainage using side
drains or a centre drain. Figures 5.8 a, b
a ) b)
Figure 5.8. Rowe cell: a ) Rowe cell showing horizontal drainage with inward
radial flow; b) Rowe cell showing horizontal drainage with outward radial flow
Figure 5.7. Rowe type cell
17
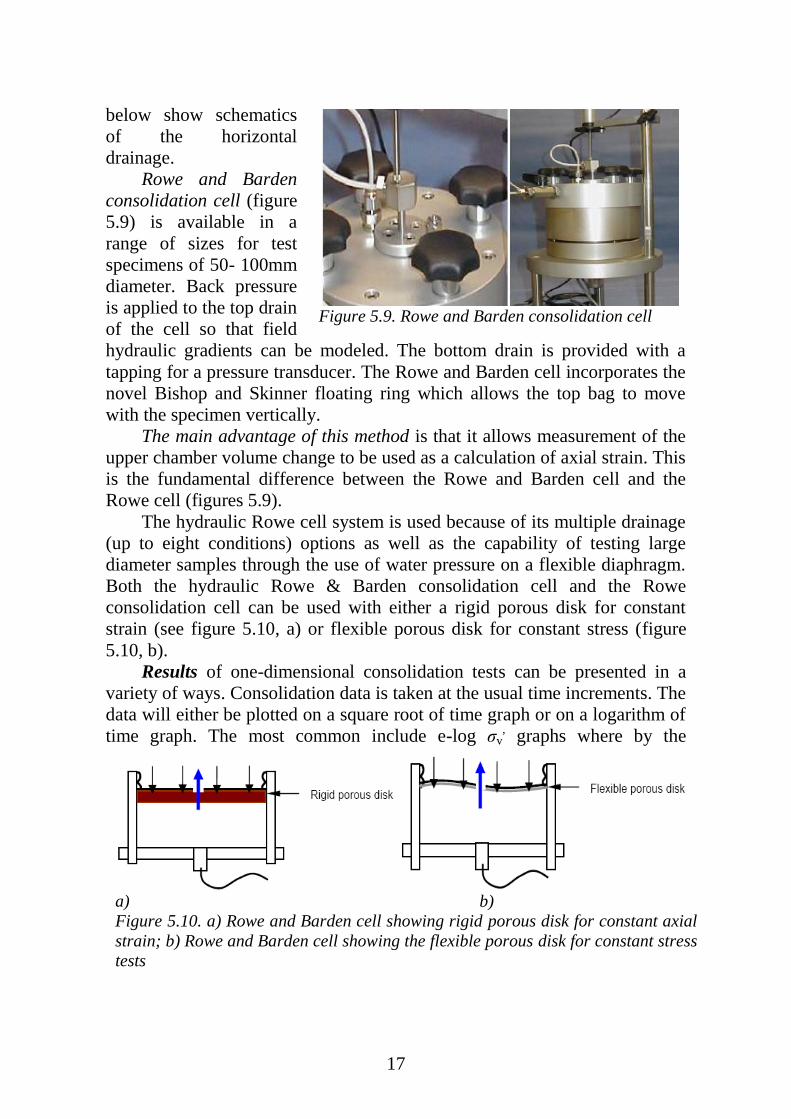
below show schematics
of the horizontal
drainage.
Rowe and Barden
consolidation cell (figure
5.9) is available in a
range of sizes for test
specimens of 50- 100mm
diameter. Back pressure
is applied to the top drain
of the cell so that field
hydraulic gradients can be modeled. The bottom drain is provided with a
tapping for a pressure transducer. The Rowe and Barden cell incorporates the
novel Bishop and Skinner floating ring which allows the top bag to move
with the specimen vertically.
The main advantage of this method is that it allows measurement of the
upper chamber volume change to be used as a calculation of axial strain. This
is the fundamental difference between the Rowe and Barden cell and the
Rowe cell (figures 5.9).
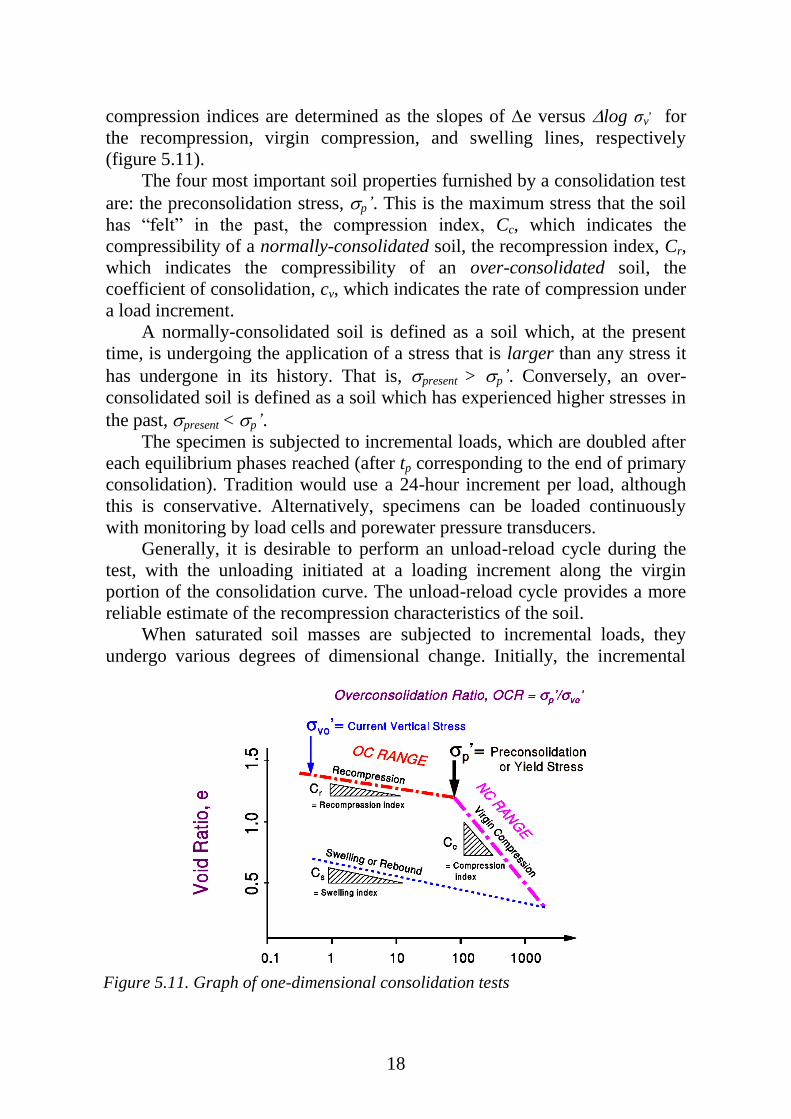
The hydraulic Rowe cell system is used because of its multiple drainage
(up to eight conditions) options as well as the capability of testing large
diameter samples through the use of water pressure on a flexible diaphragm.
Both the hydraulic Rowe & Barden consolidation cell and the Rowe
consolidation cell can be used with either a rigid porous disk for constant
strain (see figure 5.10, a) or flexible porous disk for constant stress (figure
5.10, b).
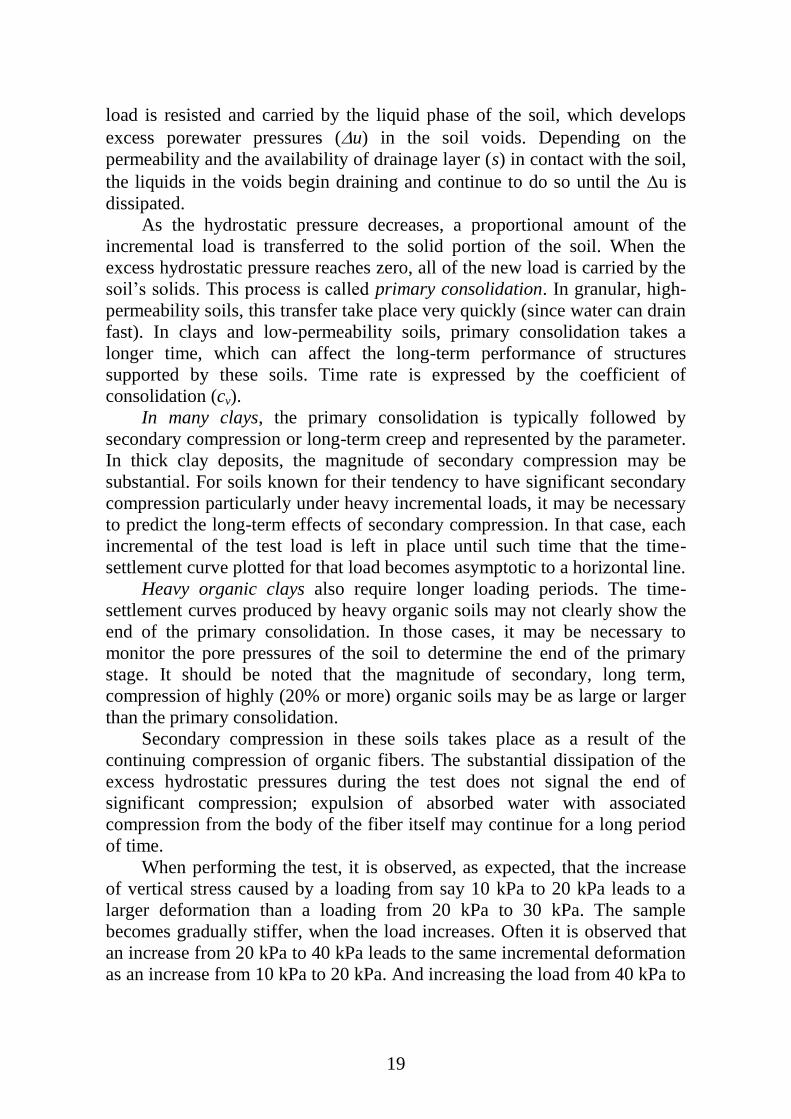
Results of one-dimensional consolidation tests can be presented in a
variety of ways. Consolidation data is taken at the usual time increments. The
data will either be plotted on a square root of time graph or on a logarithm of
time graph. The most common include e-log σv, graphs where by the
Figure 5.9. Rowe and Barden consolidation cell
a) b)
Figure 5.10. a) Rowe and Barden cell showing rigid porous disk for constant axial
strain; b) Rowe and Barden cell showing the flexible porous disk for constant stress
tests
18
compression indices are determined as the slopes of e versus log σv, for
the recompression, virgin compression, and swelling lines, respectively
(figure 5.11).
The four most important soil properties furnished by a consolidation test
are: the preconsolidation stress, p’. This is the maximum stress that the soil
has ―felt‖ in the past, the compression index, Cc, which indicates the
compressibility of a normally-consolidated soil, the recompression index, Cr,
which indicates the compressibility of an over-consolidated soil, the
coefficient of consolidation, cv, which indicates the rate of compression under
a load increment.
A normally-consolidated soil is defined as a soil which, at the present
time, is undergoing the application of a stress that is larger than any stress it
has undergone in its history. That is, present > p’. Conversely, an over-
consolidated soil is defined as a soil which has experienced higher stresses in
the past, present < p’.
The specimen is subjected to incremental loads, which are doubled after
each equilibrium phases reached (after tp corresponding to the end of primary
consolidation). Tradition would use a 24-hour increment per load, although
this is conservative. Alternatively, specimens can be loaded continuously
with monitoring by load cells and porewater pressure transducers.
Generally, it is desirable to perform an unload-reload cycle during the
test, with the unloading initiated at a loading increment along the virgin
portion of the consolidation curve. The unload-reload cycle provides a more
reliable estimate of the recompression characteristics of the soil.
When saturated soil masses are subjected to incremental loads, they
undergo various degrees of dimensional change. Initially, the incremental
Figure 5.11. Graph of one-dimensional consolidation tests
19
load is resisted and carried by the liquid phase of the soil, which develops
excess porewater pressures (u) in the soil voids. Depending on the
permeability and the availability of drainage layer (s) in contact with the soil,
the liquids in the voids begin draining and continue to do so until the u is
dissipated.
As the hydrostatic pressure decreases, a proportional amount of the
incremental load is transferred to the solid portion of the soil. When the
excess hydrostatic pressure reaches zero, all of the new load is carried by the
soil’s solids. This process is called primary consolidation. In granular, high-
permeability soils, this transfer take place very quickly (since water can drain
fast). In clays and low-permeability soils, primary consolidation takes a
longer time, which can affect the long-term performance of structures
supported by these soils. Time rate is expressed by the coefficient of
consolidation (cv).
In many clays, the primary consolidation is typically followed by
secondary compression or long-term creep and represented by the parameter.
In thick clay deposits, the magnitude of secondary compression may be
substantial. For soils known for their tendency to have significant secondary
compression particularly under heavy incremental loads, it may be necessary
to predict the long-term effects of secondary compression. In that case, each
incremental of the test load is left in place until such time that the time-
settlement curve plotted for that load becomes asymptotic to a horizontal line.
Heavy organic clays also require longer loading periods. The time-
settlement curves produced by heavy organic soils may not clearly show the
end of the primary consolidation. In those cases, it may be necessary to
monitor the pore pressures of the soil to determine the end of the primary
stage. It should be noted that the magnitude of secondary, long term,
compression of highly (20% or more) organic soils may be as large or larger
than the primary consolidation.
Secondary compression in these soils takes place as a result of the
continuing compression of organic fibers. The substantial dissipation of the
excess hydrostatic pressures during the test does not signal the end of
significant compression; expulsion of absorbed water with associated
compression from the body of the fiber itself may continue for a long period
of time.
When performing the test, it is observed, as expected, that the increase
of vertical stress caused by a loading from say 10 kPa to 20 kPa leads to a
larger deformation than a loading from 20 kPa to 30 kPa. The sample
becomes gradually stiffer, when the load increases. Often it is observed that
an increase from 20 kPa to 40 kPa leads to the same incremental deformation
as an increase from 10 kPa to 20 kPa. And increasing the load from 40 kPa to
20
80 kPa gives the same additional deformation. Each doubling of the load has
about the same effect.
In order to predict the settlements of structures in the field, a method of
extrapolating laboratory test results in the settlement analysis is needed. Total
settlement is computed from knowledge of the preconsolidation pressure, and
the coefficients of compression and recompression.
In engineering practice, reasonably good predictions of a structure’s
settlements can be made from the results of carefully run laboratory tests.
Predicted settlements are larger than actual settlements more often than not.
Time rate predictions are often rather poor in practice. Better predictions,
naturally, can be made for those cases which have conditions more closely in
agreement with the assumptions made in the theory derivation. This would be
the case, for example, when the soil involved experiences most of its
settlement due to primary consolidation, or when drainage conditions in the
field are accurately known.
5.2.6. Swell and collapse tests
Swelling of foundation, embankment, or pavement soils result in serious
and costly damage to structures above them. It is therefore important to
estimate the swell potential of these soils. Swell Potential of Clays is used to
estimate this potential of (expansive) soils. The percentage of volumetric
swell of a soil depends on the amount of clay, its relative density, the
compaction moisture and density, permeability, location of the water table,
presence of vegetation and trees, and overburden stress.
Swelling is a characteristic reaction of some clay to saturation. The
potential for swell depends on the mineralogical composition. Some soils,
particularly those containing montmorillonite clay, tend to increase in volume
when their moisture content increases. While montmorillonite (smectite)
exhibits a high degree of swell potential, illite has none to moderate swell
characteristics, and kaolinite exhibits almost none. These soils can be highly
problematic resulting in costly damage to structures being supported by them.
The clay have a tendency to swell in small or more proportion when
submerged in water. Free swell or differential free swell also termed as free
swell index, is the increase in volume of soil with out any external constraint
when subjected to submergence in water.
Vd - Vk
Free swell index FS (%) = ———— x 100;
Vk
21
where Vd = volume of soil specimen read from the graduate cylinder
containing distilled water, Vk = volume of soil specimen read from the
graduate cylinder containing kerosene.
Apparatus: sieve : 425 micron sieve; oven; balance : weighing accuracy
of 0.01 g; graduate glass cylinder : two nos. each of 100 ml capacity.
Procedure
1. Take two specimens of 10 g each of pulverised soil passing 425
micron sieve and oven dried.
2. Pour each soil specimen in 100 ml capacity graduate glass cylinder.
3. Pour distilled water in one and kerosene oil in other cylinder upto 100
ml mark.
4. Remove entrapped air by gentle shaking or stirring with glass rod.
5. Allow attainment of equilibrium state of volume of suspension (for
not less than 24 hours).
6. Final volume of soil in each of the cylinder shall be read out.
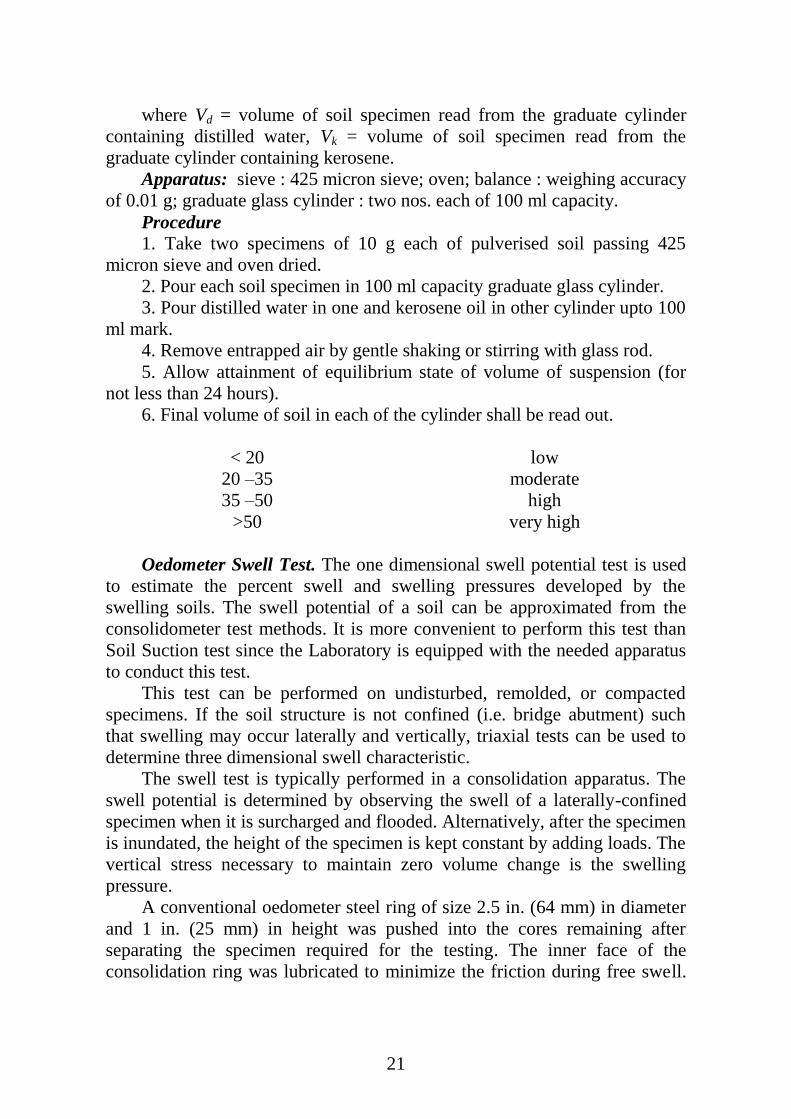
< 20 low
20 –35 moderate
35 –50 high
>50 very high
Oedometer Swell Test. The one dimensional swell potential test is used
to estimate the percent swell and swelling pressures developed by the
swelling soils. The swell potential of a soil can be approximated from the
consolidometer test methods. It is more convenient to perform this test than
Soil Suction test since the Laboratory is equipped with the needed apparatus
to conduct this test.
This test can be performed on undisturbed, remolded, or compacted
specimens. If the soil structure is not confined (i.e. bridge abutment) such
that swelling may occur laterally and vertically, triaxial tests can be used to
determine three dimensional swell characteristic.
The swell test is typically performed in a consolidation apparatus. The
swell potential is determined by observing the swell of a laterally-confined
specimen when it is surcharged and flooded. Alternatively, after the specimen
is inundated, the height of the specimen is kept constant by adding loads. The
vertical stress necessary to maintain zero volume change is the swelling
pressure.
A conventional oedometer steel ring of size 2.5 in. (64 mm) in diameter
and 1 in. (25 mm) in height was pushed into the cores remaining after
separating the specimen required for the testing. The inner face of the
consolidation ring was lubricated to minimize the friction during free swell.
22
Two such specimens were retrieved from cores samples at regular depths.
These specimens were then sealed in polyethylene bags and preserved in the
100% relative humidity room prior to testing.
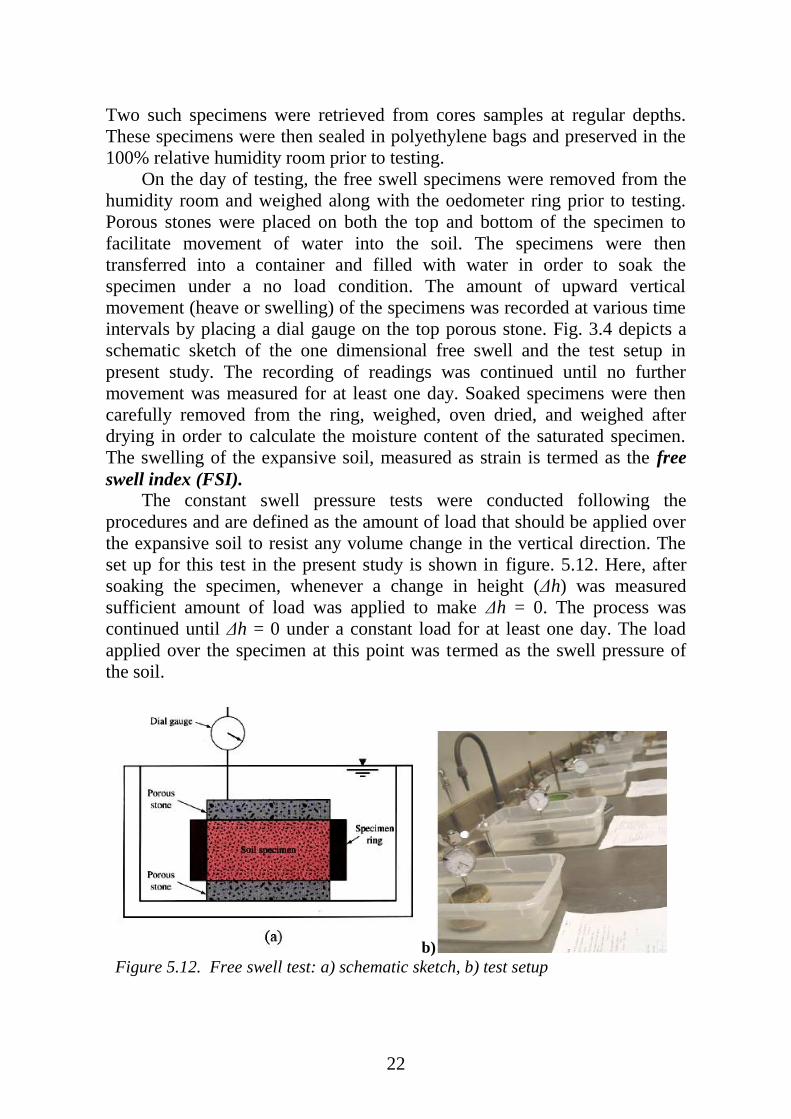
On the day of testing, the free swell specimens were removed from the
humidity room and weighed along with the oedometer ring prior to testing.
Porous stones were placed on both the top and bottom of the specimen to
facilitate movement of water into the soil. The specimens were then
transferred into a container and filled with water in order to soak the
specimen under a no load condition. The amount of upward vertical
movement (heave or swelling) of the specimens was recorded at various time
intervals by placing a dial gauge on the top porous stone. Fig. 3.4 depicts a
schematic sketch of the one dimensional free swell and the test setup in
present study. The recording of readings was continued until no further
movement was measured for at least one day. Soaked specimens were then
carefully removed from the ring, weighed, oven dried, and weighed after
drying in order to calculate the moisture content of the saturated specimen.
The swelling of the expansive soil, measured as strain is termed as the free
swell index (FSI).
The constant swell pressure tests were conducted following the
procedures and are defined as the amount of load that should be applied over
the expansive soil to resist any volume change in the vertical direction. The
set up for this test in the present study is shown in figure. 5.12. Here, after
soaking the specimen, whenever a change in height (Δh) was measured
sufficient amount of load was applied to make Δh = 0. The process was
continued until Δh = 0 under a constant load for at least one day. The load
applied over the specimen at this point was termed as the swell pressure of
the soil.
b)
Figure 5.12. Free swell test: a) schematic sketch, b) test setup
23
The collapse potential of suspected soil is used to estimate this potential of
soils. The collapse potential of suspected soils is determined by placing an
undisturbed, compacted or remolded specimen in the consolidometer ring and
in a loading device at their natural moisture content. A load is applied and the
soil is saturated to measure the magnitude of the vertical displacement.
Loess or loess type soils is predominantly composed of silts, and contain
3% to 5% clay. Loess deposits are wind blown formations. Loess type
deposits have similar composition and they are formed as a result of the
removal of organics by decomposition or the leaching of certain minerals
(calcium carbonate). In both cases disturbed samples obtained from these
deposits will be classified as silt. When dry or at low moisture content the in
situ material gives the appearance of a stable silt deposit. At high moisture
contents these soils collapse and undergo sudden changes in volume. Loess,
unlike other non-cohesive soils, will stand on almost a vertical slope until
saturated. It has a low relative density, a low unit weight and a high void ratio.
Structures founded on such soils, upon saturation, may be seriously damaged
from the collapse of the foundation soils.
The collapse during wetting occurs due to the destruction of clay binding
which provide the original strength of these soils. It is conceivable that
remolding and compacting may also destroy the original structure.
5.2.7. Shear strength tests
Engineers must understand the nature of shearing resistance in order to
analyze soil stability problems such as bearing capacity, slope stability,
lateral earth pressure on earth-retaining structures, pavement. The stresses set
up in the soil cause deformation of the soil. Stress failure is caused by
slippage of soil particles, which may lead to sliding of one body of soil
relative to the surrounding mass. The process is known as shear failure and
occurs when shear stresses set up in the soil mass exceed the maximum shear
resistance which the soil can offer, i.e. its shear strength.
Soil is not capable of resisting tension; it is capable of resisting
compression to some extent. In cases of excessive compression, failure
usually occurs in the form of shearing along some internal surface within the
soil. The stress is increased until failure. The theory of Mohr-Coulomb
Failure Criteria states that a material fails because of a critical combination of
normal stress and shear stress, and not from their either maximum normal or
shear stress alone.
Soil strength comes from internal friction and cohesion. The shear
strength of a soil is its resistance to shearing stresses. Shear failure occurs
when the stresses between the particles are such that they slide or roll past
each other.
24
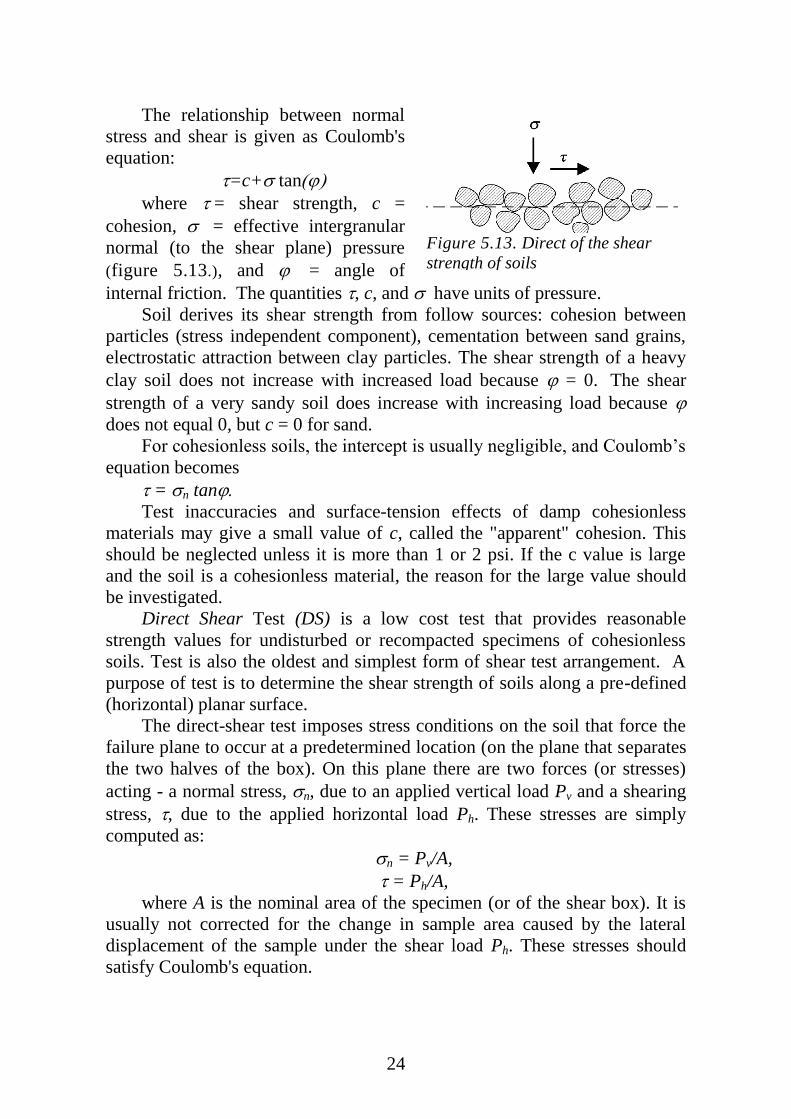
The relationship between normal
stress and shear is given as Coulomb's
equation:
=c+ tan
where = shear strength, c =
cohesion, = effective intergranular
normal (to the shear plane) pressure
(figure 5.13.), and = angle of
internal friction. The quantities , c, and have units of pressure.
Soil derives its shear strength from follow sources: cohesion between
particles (stress independent component), cementation between sand grains,
electrostatic attraction between clay particles. The shear strength of a heavy
clay soil does not increase with increased load because = 0. The shear
strength of a very sandy soil does increase with increasing load because
does not equal 0, but c = 0 for sand.
For cohesionless soils, the intercept is usually negligible, and Coulomb’s
equation becomes
= n tanTest inaccuracies and surface-tension effects of damp cohesionless
materials may give a small value of c, called the "apparent" cohesion. This
should be neglected unless it is more than 1 or 2 psi. If the c value is large
and the soil is a cohesionless material, the reason for the large value should
be investigated.
Direct Shear Test (DS) is a low cost test that provides reasonable
strength values for undisturbed or recompacted specimens of cohesionless
soils. Test is also the oldest and simplest form of shear test arrangement. A
purpose of test is to determine the shear strength of soils along a pre-defined
(horizontal) planar surface.
The direct-shear test imposes stress conditions on the soil that force the
failure plane to occur at a predetermined location (on the plane that separates
the two halves of the box). On this plane there are two forces (or stresses)
acting - a normal stress, n, due to an applied vertical load Pv and a shearing
stress, , due to the applied horizontal load Ph. These stresses are simply
computed as:
n = Pv/A,
= Ph/A,
where A is the nominal area of the specimen (or of the shear box). It is
usually not corrected for the change in sample area caused by the lateral
displacement of the sample under the shear load Ph. These stresses should
satisfy Coulomb's equation.
Figure 5.13. Direct of the shear
strength of soils
25
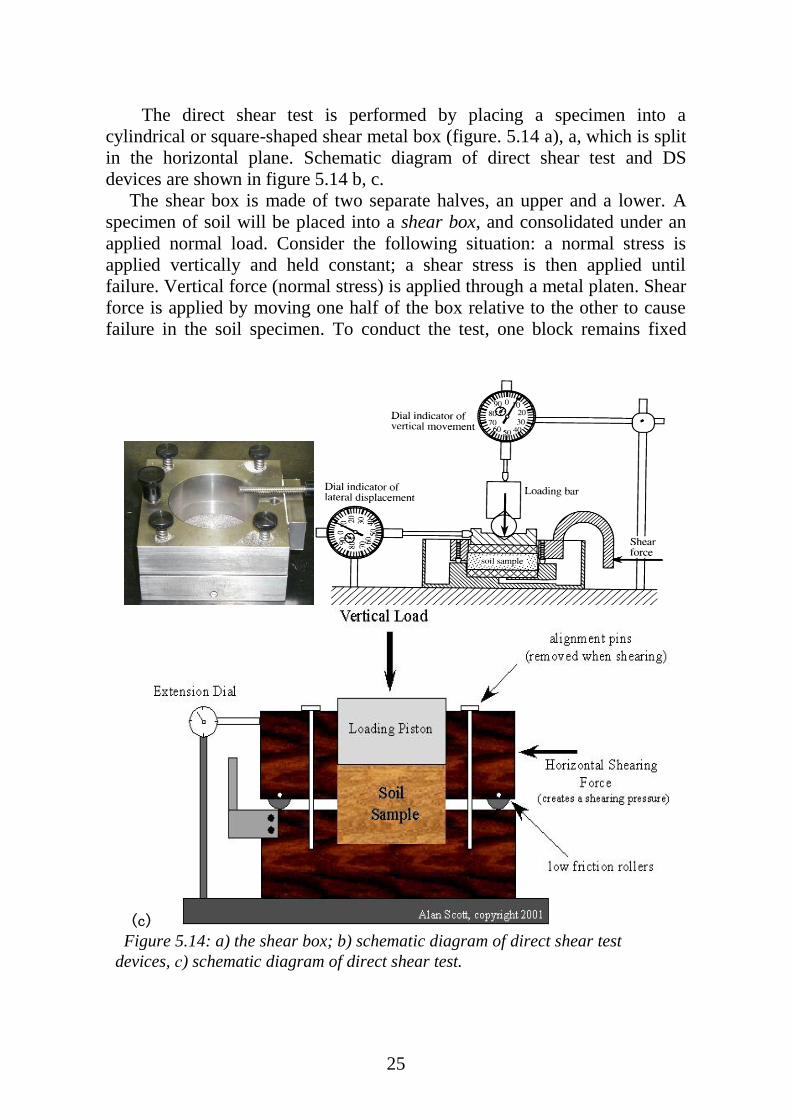
The direct shear test is performed by placing a specimen into a
cylindrical or square-shaped shear metal box (figure. 5.14 a), a, which is split
in the horizontal plane. Schematic diagram of direct shear test and DS
devices are shown in figure 5.14 b, c. The shear box is made of two separate halves, an upper and a lower. A
specimen of soil will be placed into a shear box, and consolidated under an
applied normal load. Consider the following situation: a normal stress is
applied vertically and held constant; a shear stress is then applied until
failure. Vertical force (normal stress) is applied through a metal platen. Shear
force is applied by moving one half of the box relative to the other to cause
failure in the soil specimen. To conduct the test, one block remains fixed
(c)
Figure 5.14: a) the shear box; b) schematic diagram of direct shear test
devices, с) schematic diagram of direct shear test.
26
while the other block is moved parallel to it in a horizontal direction. The soil
fails by shearing along a plane that is forced to be horizontal.
After the application of the normal load, these two halves of the be
moved relative to one another, shearing the soil specimen on the plane that is
the separation of the two halves. Usually the test is carried out past failure to
determine the residual strength which may be used in design. At this point the
test is completed and the machine is dismantled. The shear loading is stopped,
put into reverse, and reduced until no shear stress is on the sample.
As there are two unknown quantitie c and in the above equation, two
values, as a minimum, of normal stress and shear stress will be required to
obtain a solution.
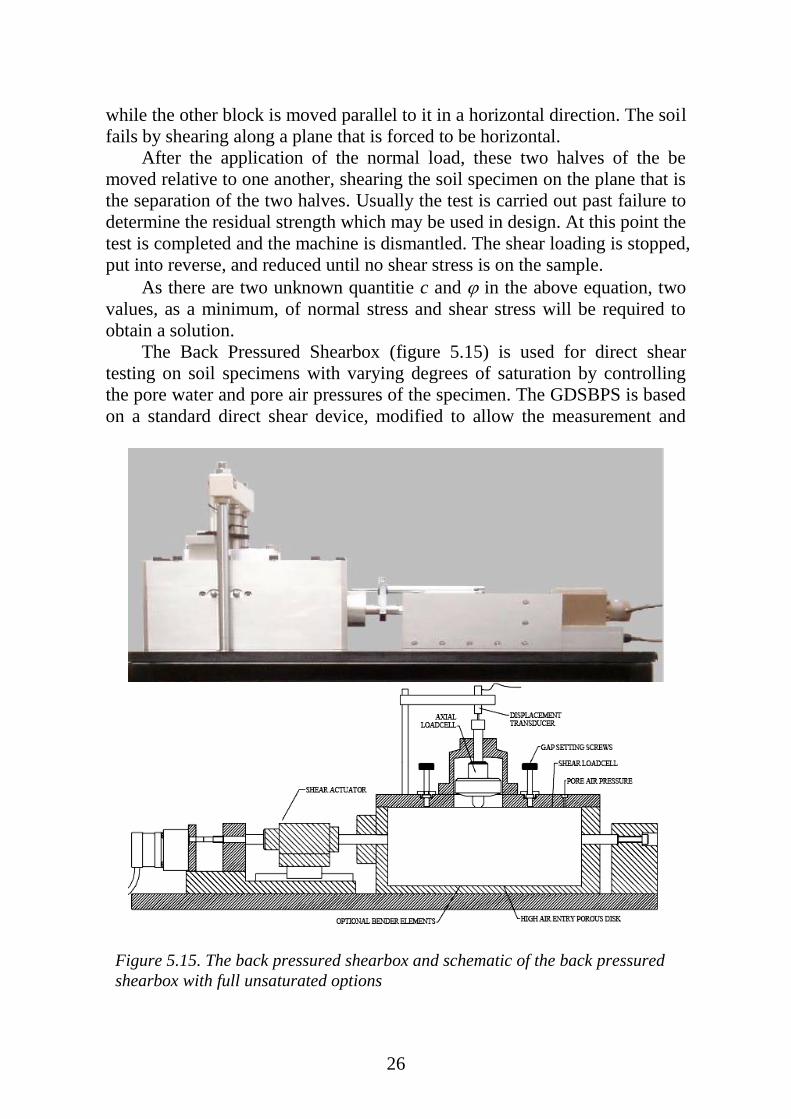
The Back Pressured Shearbox (figure 5.15) is used for direct shear
testing on soil specimens with varying degrees of saturation by controlling
the pore water and pore air pressures of the specimen. The GDSBPS is based
on a standard direct shear device, modified to allow the measurement and
Figure 5.15. The back pressured shearbox and schematic of the back pressured
shearbox with full unsaturated options
27
control of matric suction (the difference between the pore air and water
pressures). The complete system runs using data acquisition software. This
allows standard direct shear tests to be carried out as well as advanced
unsaturated tests under computer control. Control parameters include: shear
force and displacement; effective stress control; total stress control; pore air
and water pressures; axial (normal) force and displacement (with optional
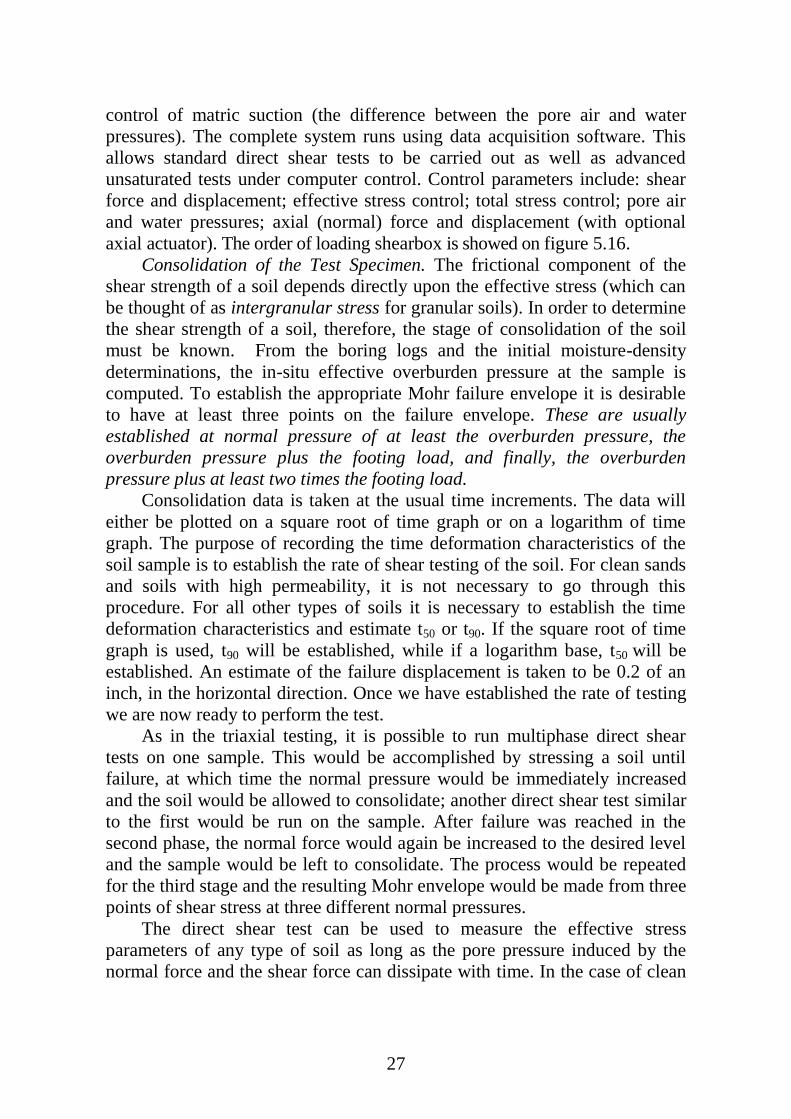
axial actuator). The order of loading shearbox is showed on figure 5.16.
Consolidation of the Test Specimen. The frictional component of the
shear strength of a soil depends directly upon the effective stress (which can
be thought of as intergranular stress for granular soils). In order to determine
the shear strength of a soil, therefore, the stage of consolidation of the soil
must be known. From the boring logs and the initial moisture-density
determinations, the in-situ effective overburden pressure at the sample is
computed. To establish the appropriate Mohr failure envelope it is desirable
to have at least three points on the failure envelope. These are usually
established at normal pressure of at least the overburden pressure, the
overburden pressure plus the footing load, and finally, the overburden
pressure plus at least two times the footing load.
Consolidation data is taken at the usual time increments. The data will
either be plotted on a square root of time graph or on a logarithm of time
graph. The purpose of recording the time deformation characteristics of the
soil sample is to establish the rate of shear testing of the soil. For clean sands
and soils with high permeability, it is not necessary to go through this
procedure. For all other types of soils it is necessary to establish the time
deformation characteristics and estimate t50 or t90. If the square root of time
graph is used, t90 will be established, while if a logarithm base, t50 will be
established. An estimate of the failure displacement is taken to be 0.2 of an
inch, in the horizontal direction. Once we have established the rate of testing
we are now ready to perform the test.
As in the triaxial testing, it is possible to run multiphase direct shear
tests on one sample. This would be accomplished by stressing a soil until
failure, at which time the normal pressure would be immediately increased
and the soil would be allowed to consolidate; another direct shear test similar
to the first would be run on the sample. After failure was reached in the
second phase, the normal force would again be increased to the desired level
and the sample would be left to consolidate. The process would be repeated
for the third stage and the resulting Mohr envelope would be made from three
points of shear stress at three different normal pressures.
The direct shear test can be used to measure the effective stress
parameters of any type of soil as long as the pore pressure induced by the
normal force and the shear force can dissipate with time. In the case of clean
28
sands, this is no problem as the pore pressure dissipates readily; however, in
the case of highly plastic clays, it is merely necessary to have a suitable strain
rate so that the pore pressure can dissipate with time.
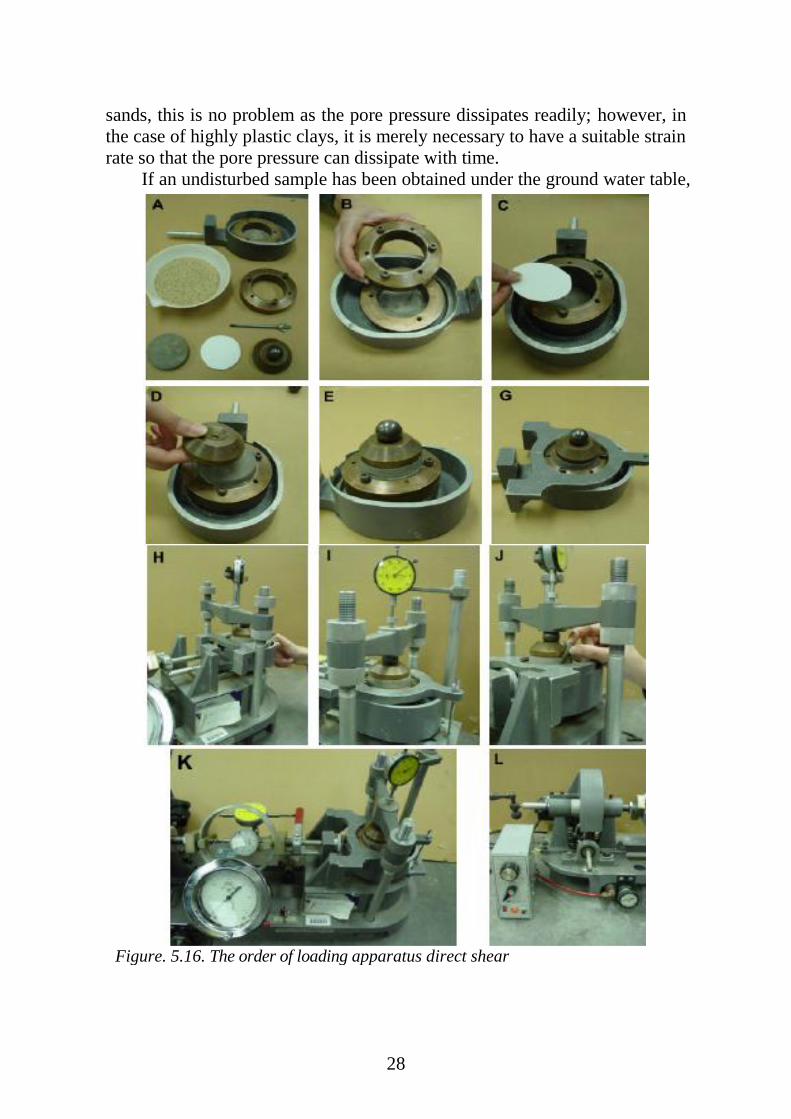
If an undisturbed sample has been obtained under the ground water table,
Figure. 5.16. The order of loading apparatus direct shear
29
it is absolutely necessary to submerge the sample during the test so as to
simulate the field conditions. It is necessary to inundate the sample in order
to relieve any surface tension that may be present in the sample.
The direct shear test can also be used to determine the undrained shear
strength of saturated plastic clays, with qualification. The test must be run
rapidly within 5 to 10 minutes to avoid consolidation under normal force
during testing, and hence, an increase in shear strength.
Similarly, it is desirable to maintain the levels of induced pore pressure
within the sample and not to allow it to dissipate, giving an increase in
strength. Although the top and bottom face of the soil sample are in contact
with filter paper and porous stones providing drainage access, the low
permeability of the plastic clay reduces the rate of pore pressure decrease
with time. As a reasonable approximation, it is assumed that the pore
pressure across the shear plane is very close to the original pore pressure
induced by the normal load. Therefore, as a reasonable approximation, the
test measures the undrained shear strength of the soil.
In cases where the soil sample is saturated insitu regardless of grain size,
soil type, the sample should be inundated to relieve any surface tension that
may develop between the soil particles, inducing tensile forces within the
sample. These tensile forces would tend to consolidate the sample three
dimensionally.
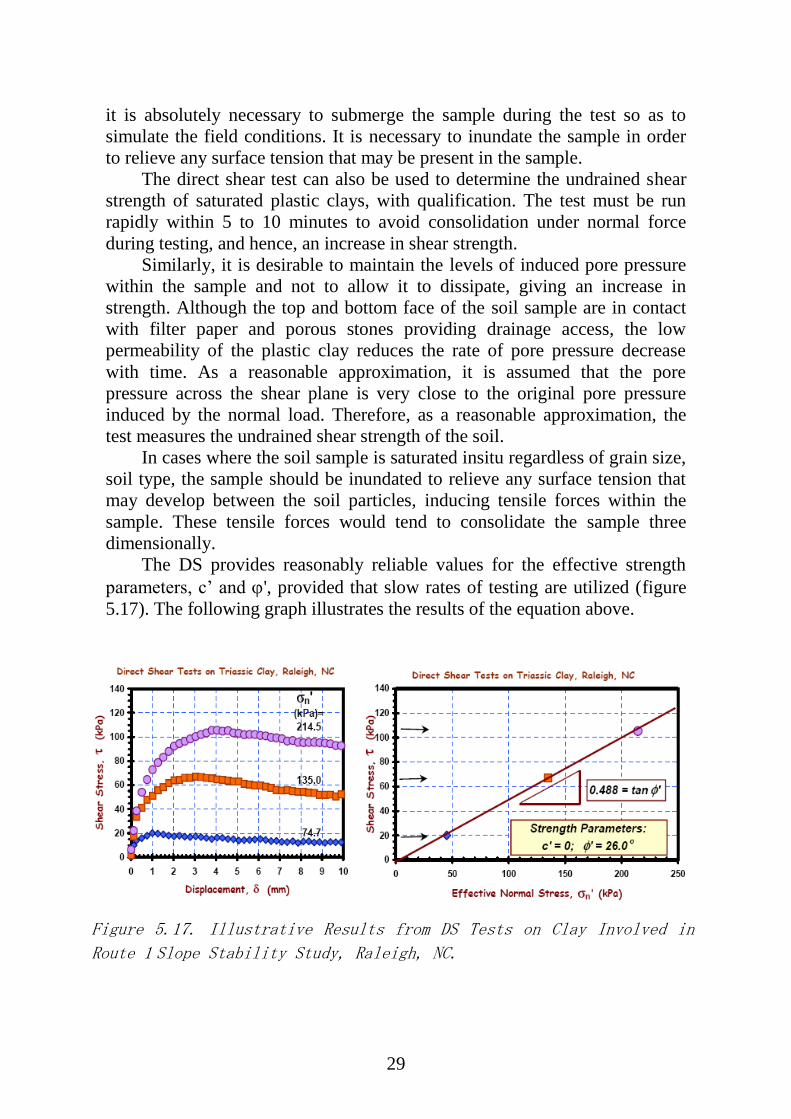
The DS provides reasonably reliable values for the effective strength
parameters, c’ and ', provided that slow rates of testing are utilized (figure
5.17). The following graph illustrates the results of the equation above.
Figure 5.17. Illustrative Results from DS Tests on Clay Involved in
Route 1 Slope Stability Study, Raleigh, NC.
30
Repeated cycles of shearing along the same direction provide an
evaluation of the residual strength parameters (cr’ and r').
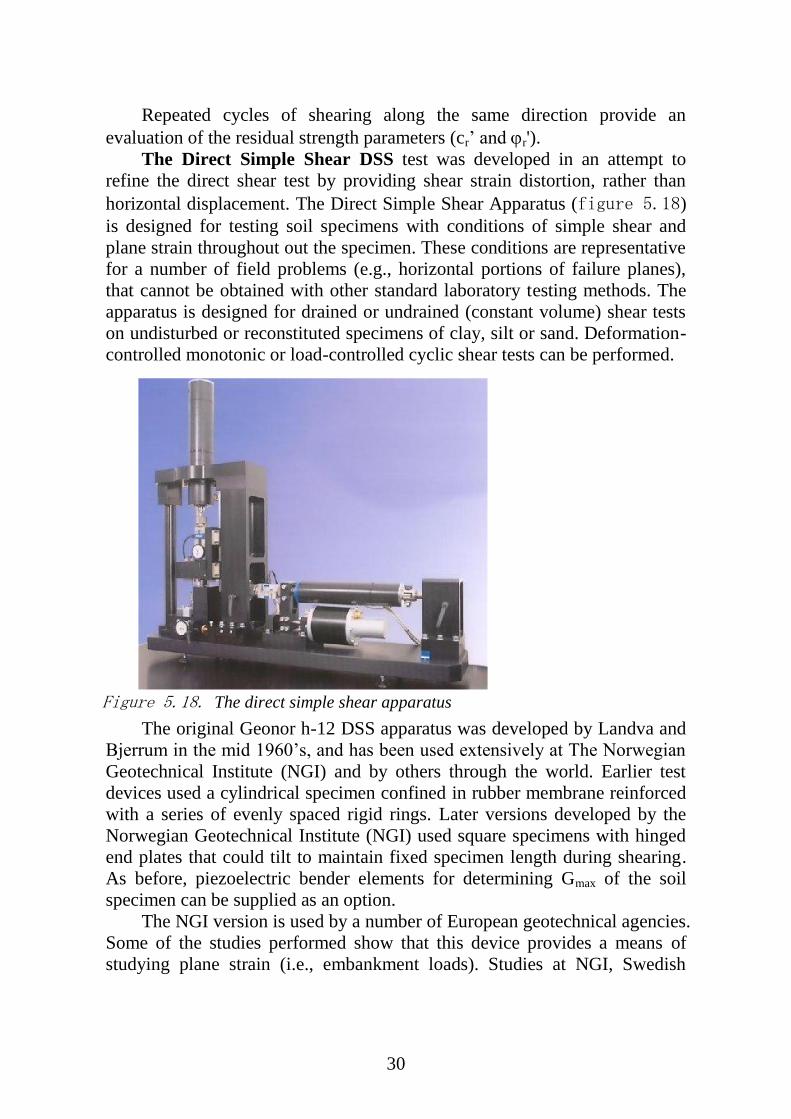
The Direct Simple Shear DSS test was developed in an attempt to
refine the direct shear test by providing shear strain distortion, rather than
horizontal displacement. The Direct Simple Shear Apparatus (figure 5.18)
is designed for testing soil specimens with conditions of simple shear and
plane strain throughout out the specimen. These conditions are representative
for a number of field problems (e.g., horizontal portions of failure planes),
that cannot be obtained with other standard laboratory testing methods. The
apparatus is designed for drained or undrained (constant volume) shear tests
on undisturbed or reconstituted specimens of clay, silt or sand. Deformation-
controlled monotonic or load-controlled cyclic shear tests can be performed.
The original Geonor h-12 DSS apparatus was developed by Landva and
Bjerrum in the mid 1960’s, and has been used extensively at The Norwegian
Geotechnical Institute (NGI) and by others through the world. Earlier test
devices used a cylindrical specimen confined in rubber membrane reinforced
with a series of evenly spaced rigid rings. Later versions developed by the
Norwegian Geotechnical Institute (NGI) used square specimens with hinged
end plates that could tilt to maintain fixed specimen length during shearing.
As before, piezoelectric bender elements for determining Gmax of the soil
specimen can be supplied as an option.
The NGI version is used by a number of European geotechnical agencies.
Some of the studies performed show that this device provides a means of
studying plane strain (i.e., embankment loads). Studies at NGI, Swedish
Figure 5.18. The direct simple shear apparatus
31
Geotechnical Institute, and Politecnico di Torino have concluded that the
DSS provides the most representative mode for the mobilized undrained
strength in stability analyses involving embankments, footings, and
excavations in soft ground.
The standard DSS apparatus consists of a direct simple shear device with
vertical and horizontal motors, load cell and a control unit for: consolidation
load, constant load or height during shear for the vertical motor, shear
direction rate and direction for the horizontal motor. The soil specimen is
mounted inside a rubber membrane of circular cross section and reinforced
by a spiral wire winding. This membrane prevents radial deformation of the
specimen, but allows vertical deformation during consolidation and shear
deformation during simple shear with very little resistance. With this
membrane, constant volume conditions during shear are attained by simply
keeping the height of the specimen constant. The change in stress (load/area)
required to keep the specimen volume constant is equal to the pore pressure
measured in an undrained test. Apparatus: shear box, divided into two halves by a horizontal plane and
fitted with locking and spacing screw; box container to hold the shear box;
base plate having cross grooves on its top surface; grid plates perforated (2
nos.); porous stones 6 mm thick (2 nos.); proving ring; dial gauge accuracy
0.01 mm – 2 mm; static compaction device, spatula; loading yoke, loading
frame, loading pad.
Procedure
1. Preparation of sample
A) undisturbed sample : Specimen is prepared by pushing a cutting
ring of size 10 cm dia and 3 cm high , in the undisturbed soil sample.
The square specimen of size 6 cm x 6 cm x 2.4 cm is then cut from
circular specimen.
B) disturbed sample :
(a) cohesive soil :- the soil may be compacted to required density
and moisture content directly into the shear box after fixing the two
halves of the shear box together by mean of the fixing screw.
(b) cohesion less soil :- soil may be tamped in the shear box itself
with base plate and grid plate or porous stone as required in place at the
bottom of the box.
1. Measure the internal dimension of the shear box and average
thickness of the grid plates
2. Fix the upper part of the box to the lower part using the locking screw.
Attach the base to the lower part .
3. Place the grid plate in the shear box keeping the serration’s of the grid
at right angle to the direction of shear.
32
Place a porous stone over the grid plate.
4. Weight the shear box with base plate, grid plate and porous stone.
5. Place soil specimen in the box and weight the box.
6. Place inside the box container and the loading pad on the box. Mount
the box container on the loading pad.
7. Bring the upper half of the box in contact with the proving ring.
Check the contact by giving slight movement.
8. Fill the container with water and mount the loading yoke on the ball
placed on loading pad.
9. Mount one dial gauge on the loading yoke to record the vertical
displacement and another dial gauge on the container to record the horizontal
displacement.
10. Place the weight on loading yoke to apply a normal stress.
11. Allow the sample to consolidate under the applied normal stress.
Note reading of vertical displacement dial gauge.
12. Remove the locking screws. Using the spacing screws, raise the
upper part slightly above the lower part such as that gap is slightly larger than
the maximum particle size. Remove the spacing screws.
13. Adjust all dial gauges to read zero. The proving ring also read zero.
14. Apply the horizontal shear load at constant rate of strain.
15. Record reading of the proving ring, the vertical displacement dial
gauge.
16. Continue the test, till the specimen fails or till a strain of 20 % is
reached.
17. At the end of the test, remove the specimen from the box.
18. Repeat the test on identical specimens under the normal stress.
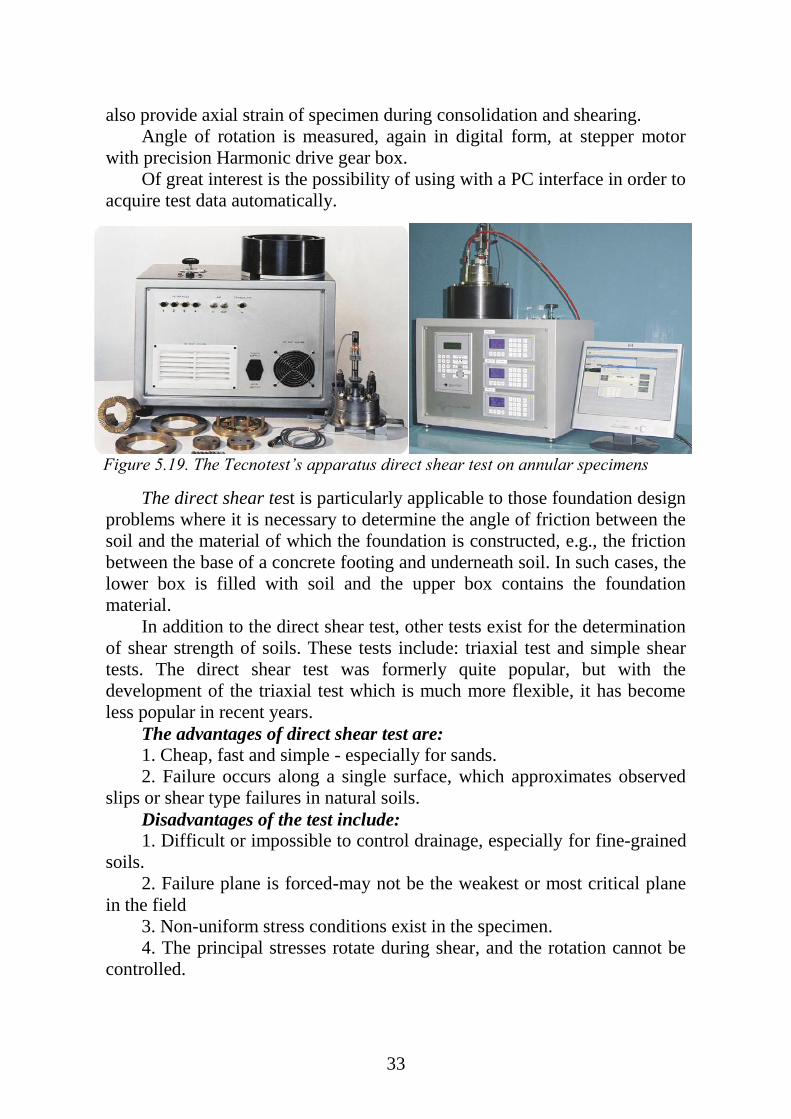
Direct shear test on annular specimens is highly recommended for
measuring residual shear strength on annular specimens. The sample is
subjected to a normal stress on level faces and to a single torque parallel to
same. This apparatus differs greatly from the traditional units in which
shearing stress is measured by means of an arm acting on two proving rings
or load cells (figure 5.19). Here a strain gauge type torque meter, directly
keyed onto the rotational axis, is used. This solution, besides allowing greater
precision, also enables the specimen to be positioned more easily. Stress is
displayed in digital form on a special readout unit. The vertical loading
device is also new: the traditional weight lever has been replaced by an axial
jack with Bellofram rolling membranes operated by compressed air. A
precision valve enables load to be selected and maintained constant, whilst a
strain gauge type transducer and relevant digital readout unit continues
displaying the applied load measurement.
A third strain gauge type transducer and respective digital readout unit
33
also provide axial strain of specimen during consolidation and shearing.
Angle of rotation is measured, again in digital form, at stepper motor
with precision Harmonic drive gear box.
Of great interest is the possibility of using with a PC interface in order to
acquire test data automatically.
The direct shear test is particularly applicable to those foundation design
problems where it is necessary to determine the angle of friction between the
soil and the material of which the foundation is constructed, e.g., the friction
between the base of a concrete footing and underneath soil. In such cases, the
lower box is filled with soil and the upper box contains the foundation
material.
In addition to the direct shear test, other tests exist for the determination
of shear strength of soils. These tests include: triaxial test and simple shear
tests. The direct shear test was formerly quite popular, but with the
development of the triaxial test which is much more flexible, it has become
less popular in recent years.
The advantages of direct shear test are:
1. Cheap, fast and simple - especially for sands.
2. Failure occurs along a single surface, which approximates observed
slips or shear type failures in natural soils.
Disadvantages of the test include:
1. Difficult or impossible to control drainage, especially for fine-grained
soils.
2. Failure plane is forced-may not be the weakest or most critical plane
in the field
3. Non-uniform stress conditions exist in the specimen.
4. The principal stresses rotate during shear, and the rotation cannot be
controlled.
Figure 5.19. The Tecnotest’s apparatus direct shear test on annular specimens
34
Principal stresses are not directly measured.
Because the drainage conditions during all stages of the test markedly
influence the shear strength of soils, the direct shear test is only applicable for
relatively clean sands which are free draining during shear. For clay soils,
some unknown amount of consolidation could occur during shear, which
would give a larger shear strength than actual. Therefore the test is not
generally recommended for cohesive soils.
The distribution of normal stresses and shearing stresses over the sliding
surface is not uniform; typically the edges experience more stress than the
center. Due to this, there is progressive failure of the specimen, i.e., the entire
strength of the soil is not mobilized simultaneously.
In spite of the above shortcomings, the direct shear test is commonly
used as it is simple and easy to perform
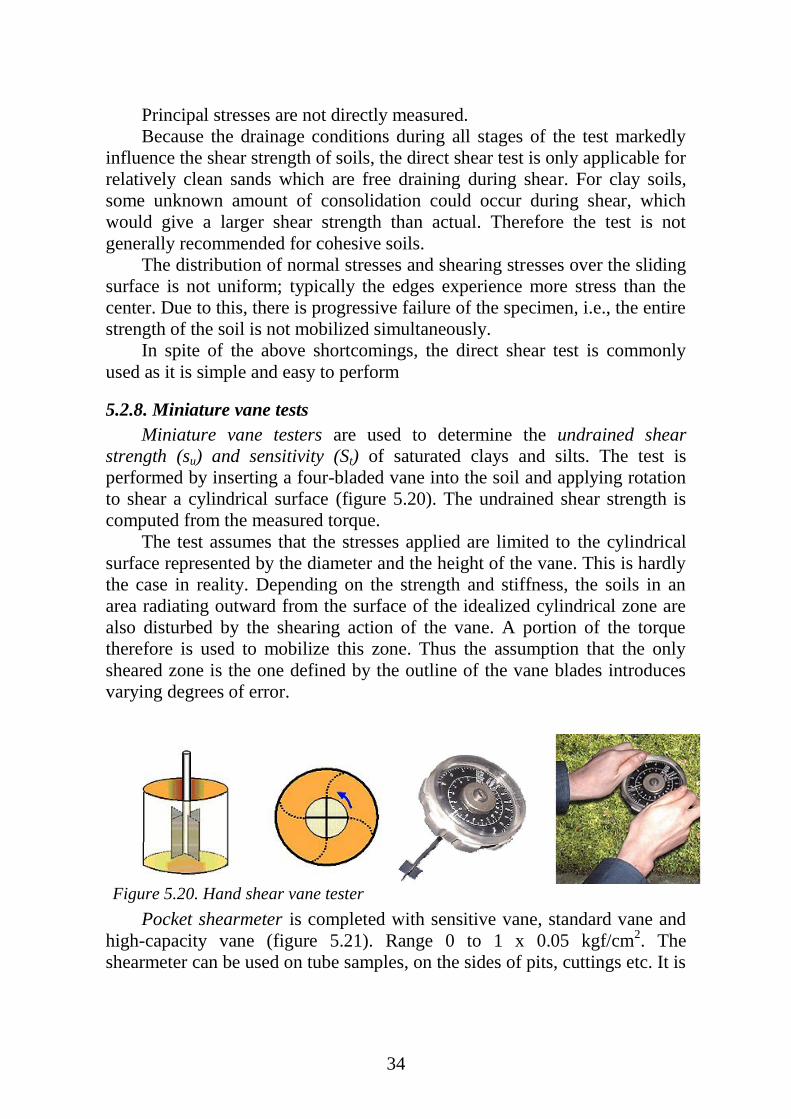
5.2.8. Miniature vane tests
Miniature vane testers are used to determine the undrained shear
strength (su) and sensitivity (St) of saturated clays and silts. The test is
performed by inserting a four-bladed vane into the soil and applying rotation
to shear a cylindrical surface (figure 5.20). The undrained shear strength is
computed from the measured torque.
The test assumes that the stresses applied are limited to the cylindrical
surface represented by the diameter and the height of the vane. This is hardly
the case in reality. Depending on the strength and stiffness, the soils in an
area radiating outward from the surface of the idealized cylindrical zone are
also disturbed by the shearing action of the vane. A portion of the torque
therefore is used to mobilize this zone. Thus the assumption that the only
sheared zone is the one defined by the outline of the vane blades introduces
varying degrees of error.
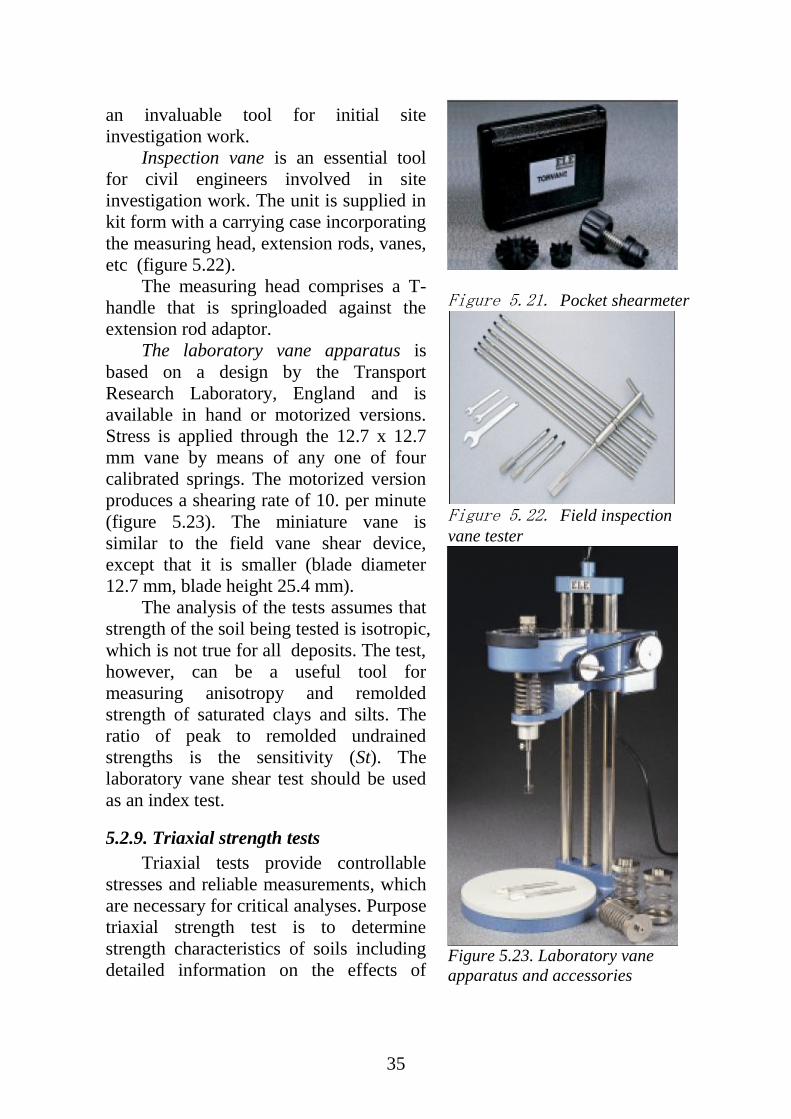
Pocket shearmeter is completed with sensitive vane, standard vane and
high-capacity vane (figure 5.21). Range 0 to 1 x 0.05 kgf/cm2. The
shearmeter can be used on tube samples, on the sides of pits, cuttings etc. It is
Figure 5.20. Hand shear vane tester
35
an invaluable tool for initial site
investigation work.
Inspection vane is an essential tool
for civil engineers involved in site
investigation work. The unit is supplied in
kit form with a carrying case incorporating
the measuring head, extension rods, vanes,
etc (figure 5.22).
The measuring head comprises a T-
handle that is springloaded against the
extension rod adaptor.
The laboratory vane apparatus is
based on a design by the Transport
Research Laboratory, England and is
available in hand or motorized versions.
Stress is applied through the 12.7 x 12.7
mm vane by means of any one of four
calibrated springs. The motorized version
produces a shearing rate of 10. per minute
(figure 5.23). The miniature vane is
similar to the field vane shear device,
except that it is smaller (blade diameter
12.7 mm, blade height 25.4 mm).
The analysis of the tests assumes that
strength of the soil being tested is isotropic,
which is not true for all deposits. The test,
however, can be a useful tool for
measuring anisotropy and remolded
strength of saturated clays and silts. The
ratio of peak to remolded undrained
strengths is the sensitivity (St). The
laboratory vane shear test should be used
as an index test.
5.2.9. Triaxial strength tests
Triaxial tests provide controllable
stresses and reliable measurements, which
are necessary for critical analyses. Purpose
triaxial strength test is to determine
strength characteristics of soils including
detailed information on the effects of
Figure 5.21. Pocket shearmeter
Figure 5.22. Field inspection
vane tester
Figure 5.23. Laboratory vane
apparatus and accessories
36
lateral confinement, porewater pressure, drainage and consolidation.
The triaxial compression test is used to measure the shear strength of a
soil under controlled drainage conditions.
The test is called "triaxial" because the three principal stresses are
assumed to be known and are controlled. During shear, the major principal
stress, 1 is equal to the applied axial stress (Ds = P/A) plus the chamber
(confining) pressure, 3. The applied axial stress, 1 - 3 is termed the
"principal stress difference" or sometimes the "deviator stress―. The
intermediate principal stress, 2 and the minor principal stress, 3 are
identical in the test, and are equal to the confining or chamber pressure.
Triaxial tests provide a reliable means to determine the friction angle of
natural clays & silts, as well as reconstituted sands. The stiffness (modulus)
at intermediate to large strains can also be evaluated.
Developed by Casagrande in an attempt to overcome some of the serious
disadvantages of the direct shear test.
Advantages of triaxial tests over direct shear test
– more versatile;
– drainage can be well controlled;
– there is no rotation of the principal stresses like the direct shear test;
– also the failure plane can occur anywhere.
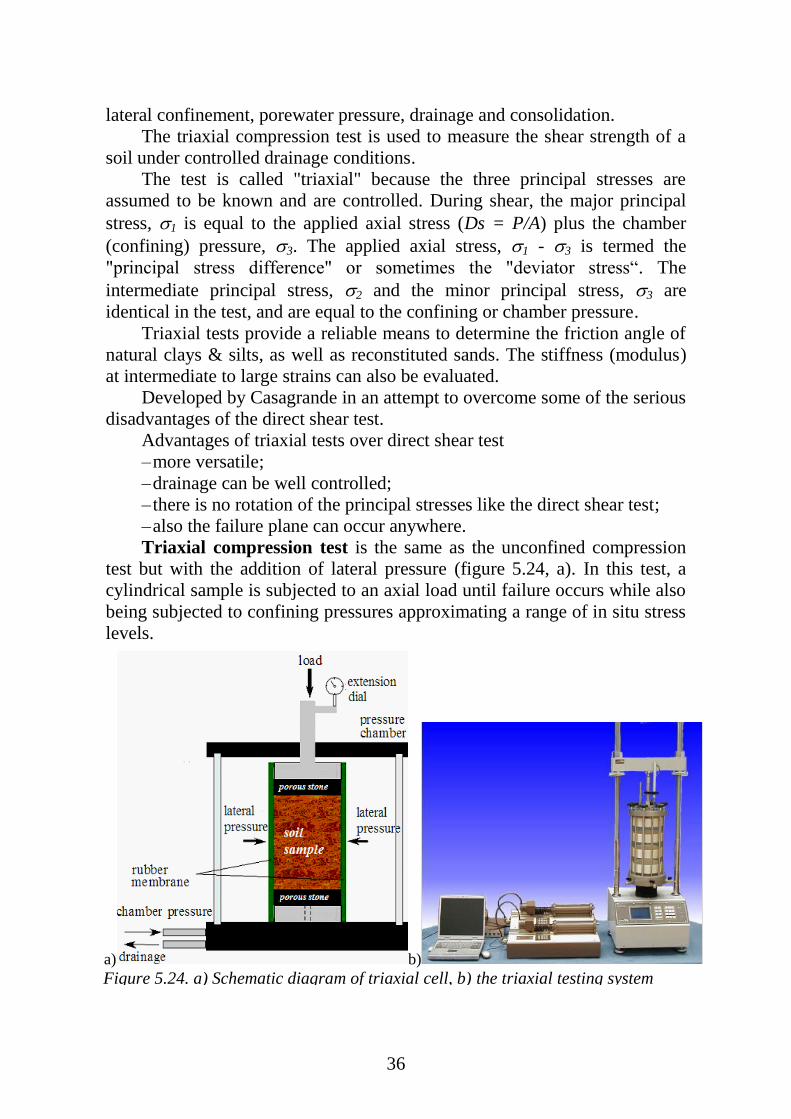
Triaxial compression test is the same as the unconfined compression
test but with the addition of lateral pressure (figure 5.24, a). In this test, a
cylindrical sample is subjected to an axial load until failure occurs while also
being subjected to confining pressures approximating a range of in situ stress
levels.
a) b) Figure 5.24. a) Schematic diagram of triaxial cell, b) the triaxial testing system
37
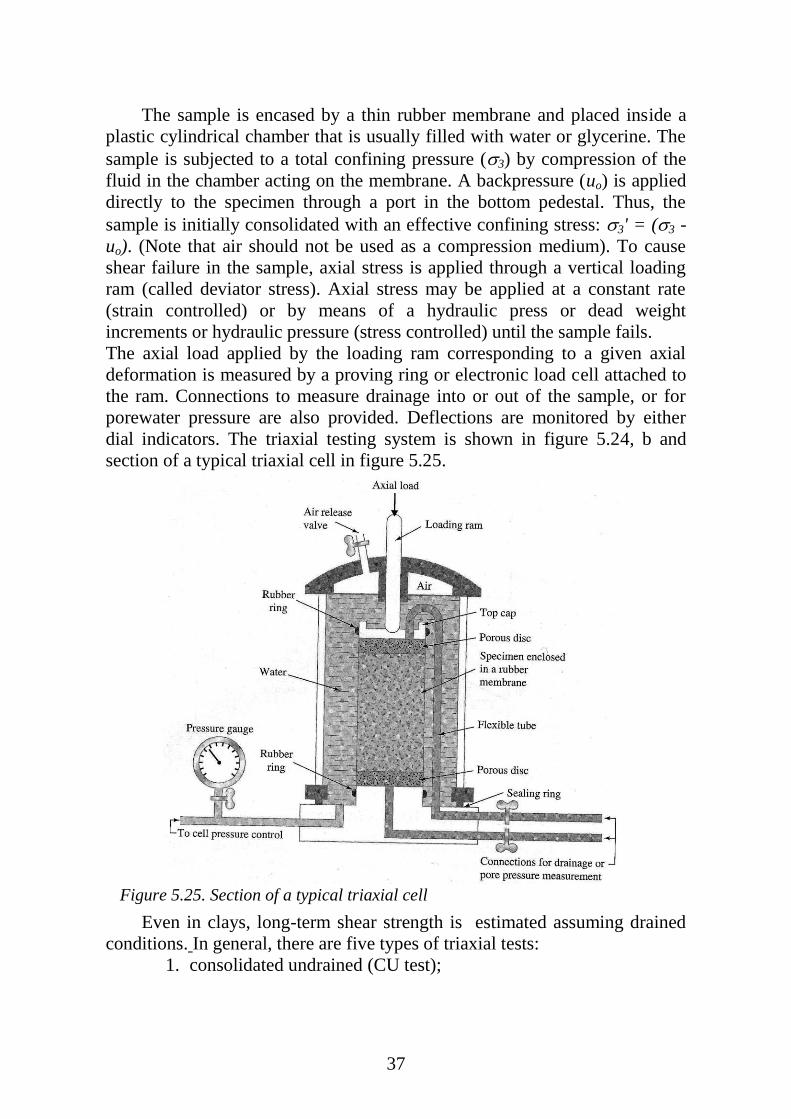
The sample is encased by a thin rubber membrane and placed inside a
plastic cylindrical chamber that is usually filled with water or glycerine. The
sample is subjected to a total confining pressure (3) by compression of the
fluid in the chamber acting on the membrane. A backpressure (uo) is applied
directly to the specimen through a port in the bottom pedestal. Thus, the
sample is initially consolidated with an effective confining stress: 3' = (3 -
uo). (Note that air should not be used as a compression medium). To cause
shear failure in the sample, axial stress is applied through a vertical loading
ram (called deviator stress). Axial stress may be applied at a constant rate
(strain controlled) or by means of a hydraulic press or dead weight
increments or hydraulic pressure (stress controlled) until the sample fails.
The axial load applied by the loading ram corresponding to a given axial
deformation is measured by a proving ring or electronic load cell attached to
the ram. Connections to measure drainage into or out of the sample, or for
porewater pressure are also provided. Deflections are monitored by either
dial indicators. The triaxial testing system is shown in figure 5.24, b and
section of a typical triaxial cell in figure 5.25.
Even in clays, long-term shear strength is estimated assuming drained
conditions. In general, there are five types of triaxial tests:
1. consolidated undrained (CU test);
Figure 5.25. Section of a typical triaxial cell
38
2. undrained unconsolidated (UU test);
3. consolidated drained (CD test);
4. consolidated undrained with pore pressure measurement (CU);
5. cyclic triaxial loading tests (CTX).
Consolidated-Undrained (CU) differs from the UU test by applying
confining stresses to reconsolidate the specimen before testing. If the goal is
to determine short-term undrained shear strengths, then no pore water
pressure measurements are made, which simplifies test procedures. However,
the advantage of using this test type is to determine effective stress
parameters for both short-term and long-term design cases, which requires
the measurement of pore water pressures and more effort in test set-up. The
Geotechnical Engineer should determine the type of data needed for the
design analyses and the locations and numbers of tests required. The CU test
specimen is allowed to consolidate under the confining pressure prior to
shearing, but no drainage is permitted during shearing. This test takes longer
and is more expensive than a UU test because the sample must be
backpressure saturated (to accurately measure pore water pressures and
specimen response), which may take a few days. A minimum of three tests at
different confining pressures is required to develop the Mohr envelope over
the applicable stress range. Often a 3-stage test can be performed on one
specimen, which saves time and reduces cost, as well as eliminates
inconsistency between specimens.
A 3-stage test might not be possible where soft/compressible soil
specimens experience large deformations in the first or second shearing
stages.
Different types of soils show different characteristics on being subjected
to loading. The test helps to determine load supporting capacity of a
particular soil under fully saturated condition. This test is required for design
of foundation for structure and analysis of slope stability. This test can
simulates long term as well as short term shear strength for cohesive soils if
pore water pressure is measured during the shearing phase.
Various Loading devices may be used to apply axial load to the
specimen. These devices can be classified as either apparatus in which axial
loads are measured outside the triaxial chamber or apparatus in which axial
loads are measured inside the triaxial chamber by using a proving ring or
frame, an electrical transducer, or a pressure capsule. Any- equipment used
should be calibrated to permit determination of loads actually applied to the
soil specimen.
Loading devices can be further grouped under controlled-strain or
controlled-stress types. In controlled-strain tests, the specimen is strained
axially at a predetermined rate; in controlled-stress tests, predetermined
39
increments of load are applied to the specimen at fixed intervals of time.
Controlled-strain loading devices, such as commercial testing machines, are
preferred for short-duration tests using piston-type test apparatus. If available,
an automatic stress-strain recorder may be used to measure and record
applied axial loads and strains.
Procedure 1. Remove wax sealing from field sample tube.
2. Place sample cutter tube (38 mm inner dia) on field sample tube.
3. Insert sample cutter tube in the soil with the help of hydraulic jack.
4. Take out the sample cutter tube from field sample tube by pushing
soil with hydraulic jack.
5. Transfer soil sample from sample cutter tube to split mould of proper
length (76 mm).
6. Take out soil specimen from split mould.
7. Clean base of triaxial cell.
8. Put porous stone over bottom pedestal and a filter paper of 38 mm
dia over this porous stone.
9. Place soil specimen over filter paper and put another filter paper then
porous stone on the top of the soil specimen.
10. Place about 8 filter paper strips vertically around soil specimen
extending from top porous stone to bottom porous stone to facilitate uniform
and quick saturation.
11. Put rubber membrane around the soil specimen with the help of
stretcher.
12. Place ring around top and bottom pedestal in the grooves.
13. Place the triaxial cell and tight the nut to the base plate.
14. Saturate the soil sample from 24 to 48 hours, by opening drainage
valve, which is connected with burette filled with water. Water level in
burette is kept little more than the top of specimen.
15. After saturation triaxial cell is filled with water and all around cell
pressure (σ3) is applied by mercury controlled device. The pore water
pressure is measured the sample is saturated (not less than 90% of σ3).
16. Four soil specimen of a sample are tested at 0.5, 1.0, 1.5, and 2.0 kg /
cm2 of lateral pressure (σ3).
17. For consolidated un-drained test (UC), the sample is to be placed for
consolidation. The drainage reading during consolidation in the burette is to
be recorded in time interval of 1, 4, 9, 16, 25, 36.....minutes up to 24 hrs.
18. On account of consolidation the length and diameter of specimen
changed.
19. Changed length, cross sectional area and rate of strain on
consolidated specimen has to be calculated.
40
20. Apply calculated rate of strain on consolidated specimen and note
down the deformation and corresponding load on specimen un till the failure
of specimen.
21. Four specimen has been tested at four confining pressure (0.5, 1, 1.5
and 2 kg/cm2) as explained above.
22. Now from above reading plot Mohr’s circle and get the shear
parameter.
In a UU test, the samples are not allowed to drain or consolidate prior to
or during the testing. The results of undrained tests depend on the degree of
saturation (S) of the specimens. Where S=100%, the test results will provide
a value of undrained shear strength, however, the test is affected by sample
disturbance and rate effect. This test is not applicable for granular (S=100%)
soils. The test is performed with the drain valve closed for all phases of the
test. (Water is not allowed to drain).
Consolidated-Drained (CD) is not as common as the CU test because
the test may require a potentially longer time to run and is primarily
applicable for relatively cohesionless soils. This test is similar to the CU test
except that drainage is allowed during shearing and the rate of shearing is
very slow to prevent the buildup of excess pore water pressure. This test may
take days to perform, making it expensive. These tests are not performed
often because similar results can be obtained with the quicker CU tests. As
with the CU test, a minimum of three tests (or stages) is required. Effective
stress strength parameters are obtained without the need for pore water
pressure measurement. Test results are used for calculating long-term
stability of embankments where relatively cohesionless materials exist along
potential failure surfaces.
You will conduct a CD test on sand. Soil specimens will be loaded to
failure under 3 different confining pressures; 15, 30 and 45 psi. Failure will
be defined as the peak or 3 maximum value of principal stress difference
reached.
The CU test with porewater pressure measurements is the most useful as
it provides a direct measure of the undrained shear strength (su), for triaxial
compressive mode, as well as the important effective stress parameters (c'
and ').
Cyclic triaxial tests are used for projects with repeated and/or cyclic
loading, resilient modulus determinations, and/or liquefaction analysis of
soils.
In each of these tests, the specimen is initially consolidated to the
effective vertical overburden stress prior to shear. If additional specimens
from the same tube are tested, these may be tested at confining stress levels
of 0.5 (vo') to 1.5 (vo'), in order to provide a range of operating values.
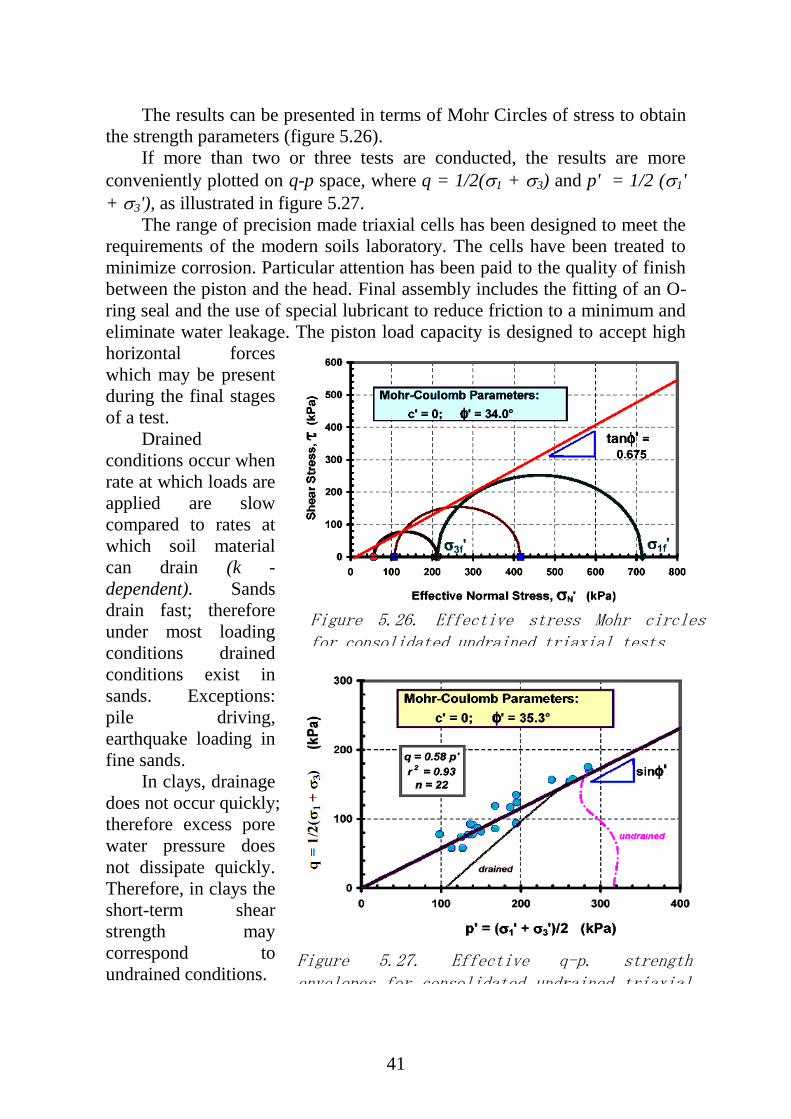
41
The results can be presented in terms of Mohr Circles of stress to obtain
the strength parameters (figure 5.26).
If more than two or three tests are conducted, the results are more
conveniently plotted on q-p space, where q = 1/2(1 + 3) and p' = 1/2 (1'
+ 3'), as illustrated in figure 5.27.
The range of precision made triaxial cells has been designed to meet the
requirements of the modern soils laboratory. The cells have been treated to
minimize corrosion. Particular attention has been paid to the quality of finish
between the piston and the head. Final assembly includes the fitting of an O-
ring seal and the use of special lubricant to reduce friction to a minimum and
eliminate water leakage. The piston load capacity is designed to accept high
horizontal forces
which may be present
during the final stages
of a test.
Drained
conditions occur when
rate at which loads are
applied are slow
compared to rates at
which soil material
can drain (k -
dependent). Sands
drain fast; therefore
under most loading
conditions drained
conditions exist in
sands. Exceptions:
pile driving,
earthquake loading in
fine sands.
In clays, drainage
does not occur quickly;
therefore excess pore
water pressure does
not dissipate quickly.
Therefore, in clays the
short-term shear
strength may
correspond to
undrained conditions.
Figure 5.26. Effective stress Mohr circles for consolidated undrained triaxial tests
Figure 5.27. Effective q-p. strength envelopes for consolidated undrained triaxial tests.
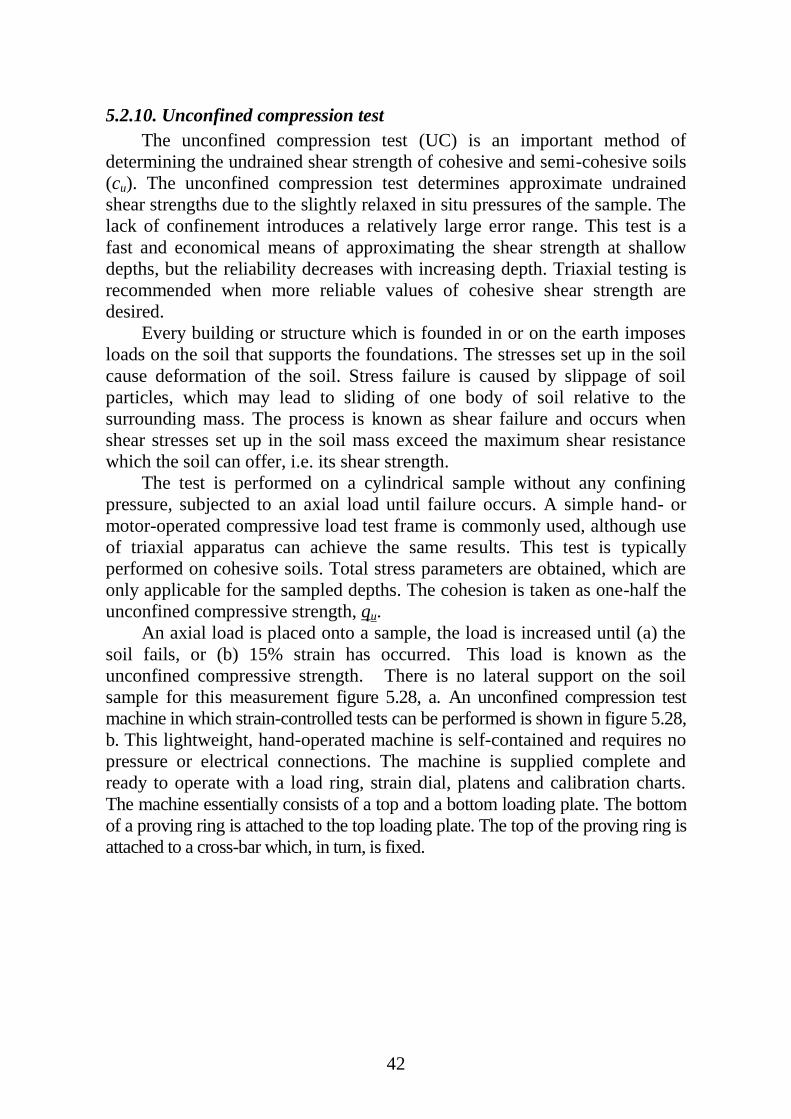
42
5.2.10. Unconfined compression test
The unconfined compression test (UC) is an important method of
determining the undrained shear strength of cohesive and semi-cohesive soils
(cu). The unconfined compression test determines approximate undrained
shear strengths due to the slightly relaxed in situ pressures of the sample. The
lack of confinement introduces a relatively large error range. This test is a
fast and economical means of approximating the shear strength at shallow
depths, but the reliability decreases with increasing depth. Triaxial testing is
recommended when more reliable values of cohesive shear strength are
desired.
Every building or structure which is founded in or on the earth imposes
loads on the soil that supports the foundations. The stresses set up in the soil
cause deformation of the soil. Stress failure is caused by slippage of soil
particles, which may lead to sliding of one body of soil relative to the
surrounding mass. The process is known as shear failure and occurs when
shear stresses set up in the soil mass exceed the maximum shear resistance
which the soil can offer, i.e. its shear strength.
The test is performed on a cylindrical sample without any confining
pressure, subjected to an axial load until failure occurs. A simple hand- or
motor-operated compressive load test frame is commonly used, although use
of triaxial apparatus can achieve the same results. This test is typically
performed on cohesive soils. Total stress parameters are obtained, which are
only applicable for the sampled depths. The cohesion is taken as one-half the
unconfined compressive strength, qu.
An axial load is placed onto a sample, the load is increased until (a) the
soil fails, or (b) 15% strain has occurred. This load is known as the
unconfined compressive strength. There is no lateral support on the soil
sample for this measurement figure 5.28, a. An unconfined compression test
machine in which strain-controlled tests can be performed is shown in figure 5.28,
b. This lightweight, hand-operated machine is self-contained and requires no
pressure or electrical connections. The machine is supplied complete and
ready to operate with a load ring, strain dial, platens and calibration charts.
The machine essentially consists of a top and a bottom loading plate. The bottom
of a proving ring is attached to the top loading plate. The top of the proving ring is
attached to a cross-bar which, in turn, is fixed.
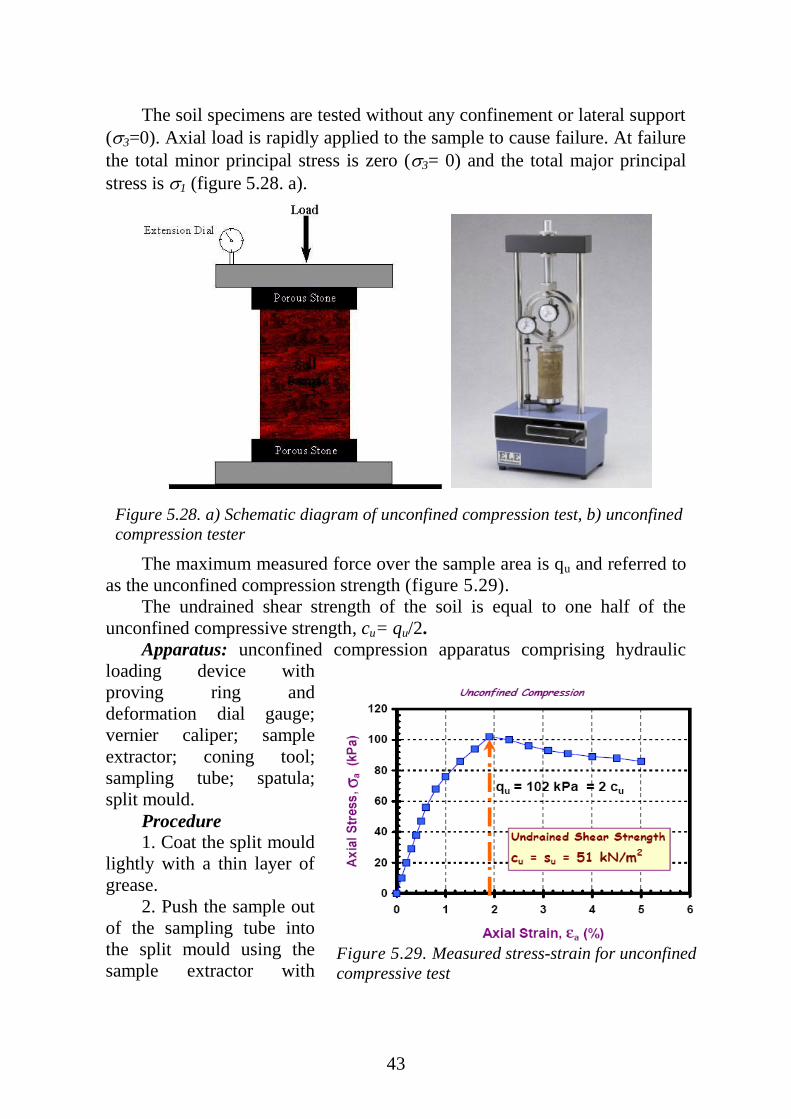
43
The soil specimens are tested without any confinement or lateral support
(3=0). Axial load is rapidly applied to the sample to cause failure. At failure
the total minor principal stress is zero (3= 0) and the total major principal
stress is 1 (figure 5.28. a).
The maximum measured force over the sample area is qu and referred to
as the unconfined compression strength (figure 5.29).
The undrained shear strength of the soil is equal to one half of the
unconfined compressive strength, cu= qu/2.
Apparatus: unconfined compression apparatus comprising hydraulic
loading device with
proving ring and
deformation dial gauge;
vernier caliper; sample
extractor; coning tool;
sampling tube; spatula;
split mould.
Procedure
1. Coat the split mould
lightly with a thin layer of
grease.
2. Push the sample out
of the sampling tube into
the split mould using the
sample extractor with
Figure 5.28. a) Schematic diagram of unconfined compression test, b) unconfined
compression tester
Figure 5.29. Measured stress-strain for unconfined
compressive test
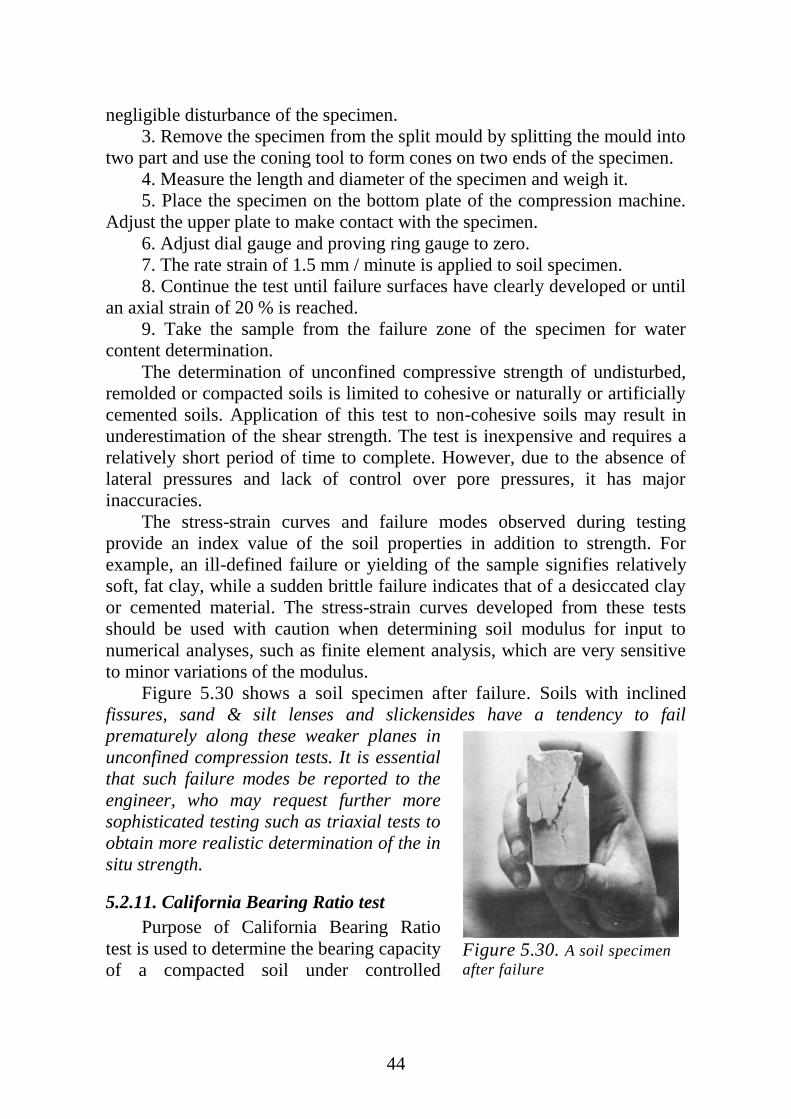
44
negligible disturbance of the specimen.
3. Remove the specimen from the split mould by splitting the mould into
two part and use the coning tool to form cones on two ends of the specimen.
4. Measure the length and diameter of the specimen and weigh it.
5. Place the specimen on the bottom plate of the compression machine.
Adjust the upper plate to make contact with the specimen.
6. Adjust dial gauge and proving ring gauge to zero.
7. The rate strain of 1.5 mm / minute is applied to soil specimen.
8. Continue the test until failure surfaces have clearly developed or until
an axial strain of 20 % is reached.
9. Take the sample from the failure zone of the specimen for water
content determination.
The determination of unconfined compressive strength of undisturbed,
remolded or compacted soils is limited to cohesive or naturally or artificially
cemented soils. Application of this test to non-cohesive soils may result in
underestimation of the shear strength. The test is inexpensive and requires a
relatively short period of time to complete. However, due to the absence of
lateral pressures and lack of control over pore pressures, it has major
inaccuracies.
The stress-strain curves and failure modes observed during testing
provide an index value of the soil properties in addition to strength. For
example, an ill-defined failure or yielding of the sample signifies relatively
soft, fat clay, while a sudden brittle failure indicates that of a desiccated clay
or cemented material. The stress-strain curves developed from these tests
should be used with caution when determining soil modulus for input to
numerical analyses, such as finite element analysis, which are very sensitive
to minor variations of the modulus.
Figure 5.30 shows a soil specimen after failure. Soils with inclined
fissures, sand & silt lenses and slickensides have a tendency to fail
prematurely along these weaker planes in
unconfined compression tests. It is essential
that such failure modes be reported to the
engineer, who may request further more
sophisticated testing such as triaxial tests to
obtain more realistic determination of the in
situ strength.
5.2.11. California Bearing Ratio test
Purpose of California Bearing Ratio
test is used to determine the bearing capacity
of a compacted soil under controlled
Figure 5.30. A soil specimen
after failure
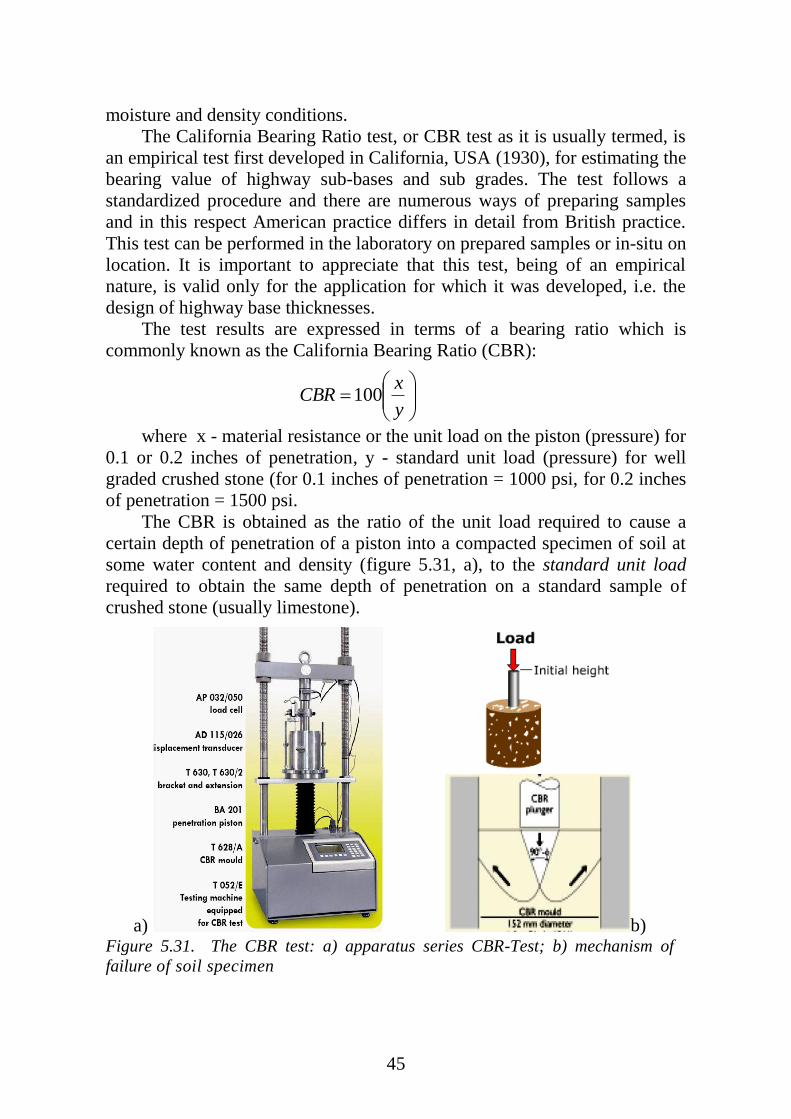
45
moisture and density conditions.
The California Bearing Ratio test, or CBR test as it is usually termed, is
an empirical test first developed in California, USA (1930), for estimating the
bearing value of highway sub-bases and sub grades. The test follows a
standardized procedure and there are numerous ways of preparing samples
and in this respect American practice differs in detail from British practice.
This test can be performed in the laboratory on prepared samples or in-situ on
location. It is important to appreciate that this test, being of an empirical
nature, is valid only for the application for which it was developed, i.e. the
design of highway base thicknesses.
The test results are expressed in terms of a bearing ratio which is
commonly known as the California Bearing Ratio (CBR):
where x - material resistance or the unit load on the piston (pressure) for
0.1 or 0.2 inches of penetration, y - standard unit load (pressure) for well
graded crushed stone (for 0.1 inches of penetration = 1000 psi, for 0.2 inches
of penetration = 1500 psi.
The CBR is obtained as the ratio of the unit load required to cause a
certain depth of penetration of a piston into a compacted specimen of soil at
some water content and density (figure 5.31, a), to the standard unit load
required to obtain the same depth of penetration on a standard sample of
crushed stone (usually limestone).
a)
b) Figure 5.31. The CBR test: a) apparatus series CBR-Test; b) mechanism of
failure of soil specimen
y
xCBR 100
46
Mechanism of failure is shown on figure 5.31, b. Typically soaked
conditions should be used to simulate anticipated long-term conditions in the
field. The CBR test is run on three identically compacted samples. Each
series of the CBR test is run for a given relative density and moisture content.
The geotechnical engineer must specify the conditions (dry, at optimum
moisture, after soaking, 95% relative density, etc.) under which each test
should be performed.
CBR is a practical bearing capacity test, yet provides only discrete point
test data for evaluation. Most CBR testing is laboratory-based, thus the
results will be highly dependent on the representativeness of the samples
tested. The test results are used for highway, airport, parking lot and other
pavement designs using empirical local or agency-specific methods. More
often than not, pavement failures are due to poor drainage, overloaded truck
traffic, increased overall road traffic, and wear.
47
References
1. Schofield A. and Wroth P. Critical state soil mechanics.. Lecturers in
Engineering at Cambridge University.
2. Manual on Subsurface Investigations, American Association of State
Highway and Transportation Officials (AASHTO) (1988). Developed
by the Subcommittee on Materials, Washington, D.C.
3. Standard specifications for transportation materials and methods of
sampling and testing: part II: tests, American Association of State
Highway and Transportation Officials (AASHTO). (1995). Sixteenth
Edition, Washington, D.C.
4. Book of Standards, American Society for Testing & Materials. (2000).
ASTM Vol. 4, Section 08 and 09, Construction Materials: Soils &
Rocks, Philadelphia, PA.
5. Atkinson, J.H. (2000) Non-linear soil stiffness in routine design.
Geotechnique 50, No5, 487 - 508.
6. Bowles, J. E. 1992. Engineering properties of soils and their
measurements, 4th Edition, McGraw-Hill, Enc.
7. C. Karg is with the Civil Engineering Department, Ghent University
(UGent), Gent, Belgium.
8. Critical state soil mechanics. Andrew Schofield and Peter Wroth.
Lecturers in Engineering at Cambridge University.
9. Designation: C 136 - 95a, Standard Test Method for Sieve Analysis of
Fine and Coarse Aggregates. In 1997 Annual Book of ASTM
Standards, Section 4, Volume 04.08, Soil and Rock (1): D 420 - D
4914, pg. 78 - 82. ASTM, West Conshohocken, PA, USA.
10. Engineering and design. Laboratory soils testing. Department of the
army . U. S. Army Corps of Engineers .Washington, D. C. 1986
11. Head, K. H. 1980. Manual of soil laboratory testing, Vol. 1: Soil
Classification and Compaction Tests, Pentech Press Limited, Plymouth,
London.
12. http://www.uic.edu/classes/cemm
13. Manual on subsurface investigations. Paul W. Mayne, Barry R.
Christopher, and Jason DeJong. National Highway Institute, Federal
Highway Administration Washington, DC. 2001.
14. Soil Mechanics – Laboratory Manual, B.M. DAS
15. Soil mechanics. Arnold Verruijt. Delft University of Technology, 2001
16. Soil Properties, Testing, Measurement, and Evaluation, C. Liu, J. Evett
17. Standards Association of Australia. AS 1289.C4.1-1977 Methods of
testing soils forengineering purposes - Soil classification tests -
Determination of the linear shrinkage ofa soil - Standard method.
18. Wagner, A. A. 1957. The use of the unified soil classification system
48
by the bureau of reclamation. Proceedings. 4th International
Conference SMFE, Butterworths, London, Vol. 1. pp. 125 - 134.
19. www.geo-observations.com/
20. www .ed mu nd-nuttall.co .u k
21. www. [email protected]
22. www. Tecnotest.com
23. www.ele. com
24. www.gdsinstruments.com
49
TABLE OF CONTENTS
5. MECHANICAL PROPERTIES OF SOILS .................................................. 3
5.1. Stress in soils ........................................................................................... 3
5.1.1. Load-deformation process in soils ................................................... 3
5.1.2. Principle of effective stress .............................................................. 4
5.1.3. Overburden stress ............................................................................ 4
5.1.4. Total and effective stress analysis ................................................... 5
5.2 Laboratory testing of mechanical properties ............................................ 9
5.2.5. Consolidation test ............................................................................ 9
5.2.6. Swell and collapse tests ................................................................. 20
5.2.7. Shear strength tests ........................................................................ 23
5.2.8. Miniature vane tests ....................................................................... 34
5.2.9. Triaxial strength tests .................................................................... 35
5.2.10. Unconfined compression test ....................................................... 42
5.2.11. California Bearing Ratio test ....................................................... 44
References ........................................................................................................ 47

50

51
52
Учебное издание
Составитель
КРАМАРЕНКО Виолетта Валентиновна
LABORATORY TESTING OF SOILS Part II. Mechanical properties of soils
Методические указания к выполнению лабораторных работ по курсу «Грунтоведение»
для студентов обучающихся по направлению 130100 «Геология и разведка полезных ископаемых».
Научный редактор к.г.-м.н., доцент Т.Я. Емельянова
Отпечатано в Издательстве ТПУ в полном соответствии
с качеством предоставленного оригинал-макета
Подписано к печати 05.11.2010. Формат 60х84/16. Бумага «Снегурочка». Печать XEROX. Усл.печ.л. 9,01. Уч.-изд.л. 8,16.
Заказ . Тираж 30 экз.
Национальный исследовательский Томский политехнический университет Система менеджмента качества
Томского политехнического университета сертифицирована NATIONAL QUALITY ASSURANCE по стандарту ISO 9001:2008
. 634050, г. Томск, пр. Ленина, 30 Тел./факс: 8(3822)56-35-35, www.tpu.ru
Copyright © 2022 FDOKUMEN