Shear Failure Behavior of Monopanel Slabs Structural
10
International Journal of Engineering and Information Systems (IJEAIS) ISSN: 2643-640X Vol. 5 Issue 1, January - 2021, Pages: 78-87 www.ijeais.org/ijeais 78 Shear Failure Behavior of Monopanel Slabs Structural Faris Jassim Jaber 1 and Samir Thamer Saeed 2 1 Professor of Civil Engineering, Faculty of Engineering, University of Kufa Al-Najaf, Iraq [email protected] 2 M.Sc. Candidate of Civil Engineering, Faculty of Engineering, University of Kufa Al-Najaf, Iraq [email protected] Abstract— Monopanel is a new building system consisting of two thin layers of ferrocement, interspersed with a thick layer of low-density material, and the two layers of ferrocement are connected together by means of reinforcement lacing with a diameter of (4 and 5) mm containing longitudinal bars and inclined bars at an angle of 45 degrees. The longitudinal bars works to resist bending and the inclined members resists shear stresses as this system works as a one slab where the loads are distributed between them. In this research, continuous Monopanel slabs with two spans were used to study its structural behavior. Twelve samples were constructed where it designed for shear failure, where the force was applied near the middle support of each span. In this research the parameters were adopted, number of lacing and number of layers of wire mesh. The focus in this research was on the load of first crack, ultimate load, service deflection, maximum deflection and the width cracks. Keywords— Monopanel, slab, lacing, wire mesh and shear failure. 1. INTRODUCTION Structural buildings developed and became more complex, so the search for materials that reduce costs, weights and ease of work began. In this research, the Monopanel system, which appeared recently, and which is characterized by several characteristics was studied that makes it a good choice for many simple and medium buildings (such as homes, schools, service buildings, etc.). The Monopanel system is characterized by its light weight compared to normal concrete, reaching 50% of the density of normal concrete. In addition to being easy to work and the availability of its materials in the local market. It consists of two layers of ferrocement, which is consisted core with low-density foam material (12 kg / m3) and contains a lacing reinforcement with a diameter of 4 mm for the longitudinal bar and 5 mm for the inclined bar at an angle of 45 degrees. This reinforcement is covered with wire mesh, which is in the form of layers wrapping around lacing to be poured cement mortar with a thickness of (25-45) mm, to be the required structural slab. 2. EXPERIMENTAL WORK 2.1 MATERIAL 2.1.1 CEMENT Ordinary Portland cement - obtained from Al Kara Factory in Najaf city- was used in the present investigation. Bags of (50 kg) were used. Physical and chemical tests have been done for this type of cement according to (The Iraqi Specification 5/2016),Table1. 2.1.2 SAND Natural silica sand obtained from (Bahr Al Najaf) area was used as fine aggregate in mortar mix. Maximum aggregate size was (4.75 mm). Sand used in this study was tested and the results matching the (Iraqi Specification 45/2016) (zone 2) as shown in Table 2. Table 1. Chemical properties of cement Specification (5/2016) Results Components ----- 20.88 % SiO 2 Silicon Dioxide ----- 2.24 % Al 2 O 3 Aluminum Trioxide ----- 4.68 % Fe 2 O 3 Ferric Oxide ----- 59.77 % CaO Calcium Oxide (0.66-1.02) % 0.89 % L.S.F Lime Saturation Factor < 5 % 3.06 % MgO Magnesium oxide < 3.5 % 0.21 % C 3 A Tricalcium Silicate < 2.5 % 1.81 % SO 3 when C 3 A ˂ 5 % < 2.8 % ----- SO 3 when C 3 A ˃ 5 %
-
Upload
khangminh22 -
Category
Documents
-
view
3 -
download
0
Transcript of Shear Failure Behavior of Monopanel Slabs Structural

International Journal of Engineering and Information Systems (IJEAIS)
ISSN: 2643-640X
Vol. 5 Issue 1, January - 2021, Pages: 78-87
www.ijeais.org/ijeais
78
Shear Failure Behavior of Monopanel Slabs Structural Faris Jassim Jaber
1 and Samir Thamer Saeed
2
1Professor of Civil Engineering, Faculty of Engineering, University of Kufa
Al-Najaf, Iraq
[email protected] 2M.Sc. Candidate of Civil Engineering, Faculty of Engineering, University of Kufa
Al-Najaf, Iraq
Abstract— Monopanel is a new building system consisting of two thin layers of ferrocement, interspersed with a thick layer of
low-density material, and the two layers of ferrocement are connected together by means of reinforcement lacing with a diameter
of (4 and 5) mm containing longitudinal bars and inclined bars at an angle of 45 degrees. The longitudinal bars works to resist
bending and the inclined members resists shear stresses as this system works as a one slab where the loads are distributed
between them. In this research, continuous Monopanel slabs with two spans were used to study its structural behavior. Twelve
samples were constructed where it designed for shear failure, where the force was applied near the middle support of each span.
In this research the parameters were adopted, number of lacing and number of layers of wire mesh. The focus in this research
was on the load of first crack, ultimate load, service deflection, maximum deflection and the width cracks.
Keywords— Monopanel, slab, lacing, wire mesh and shear failure.
1. INTRODUCTION
Structural buildings developed and became more complex, so the search for materials that reduce costs, weights and ease of
work began. In this research, the Monopanel system, which appeared recently, and which is characterized by several characteristics
was studied that makes it a good choice for many simple and medium buildings (such as homes, schools, service buildings, etc.).
The Monopanel system is characterized by its light weight compared to normal concrete, reaching 50% of the density of
normal concrete. In addition to being easy to work and the availability of its materials in the local market. It consists of two layers of
ferrocement, which is consisted core with low-density foam material (12 kg / m3) and contains a lacing reinforcement with a
diameter of 4 mm for the longitudinal bar and 5 mm for the inclined bar at an angle of 45 degrees. This reinforcement is covered
with wire mesh, which is in the form of layers wrapping around lacing to be poured cement mortar with a thickness of (25-45) mm,
to be the required structural slab.
2. EXPERIMENTAL WORK
2.1 MATERIAL
2.1.1 CEMENT
Ordinary Portland cement - obtained from Al Kara Factory in Najaf city- was used in the present investigation. Bags of (50
kg) were used. Physical and chemical tests have been done for this type of cement according to (The Iraqi Specification
5/2016),Table1.
2.1.2 SAND
Natural silica sand obtained from (Bahr Al Najaf) area was used as fine aggregate in mortar mix. Maximum aggregate size
was (4.75 mm). Sand used in this study was tested and the results matching the (Iraqi Specification 45/2016) (zone 2) as shown in
Table 2.
Table 1. Chemical properties of cement
Specification (5/2016) Results Components
----- 20.88 % SiO2 Silicon Dioxide
----- 2.24 % Al2O3 Aluminum Trioxide
----- 4.68 % Fe2O3 Ferric Oxide
----- 59.77 % CaO Calcium Oxide
(0.66-1.02) % 0.89 % L.S.F Lime Saturation
Factor
< 5 % 3.06 % MgO Magnesium oxide
< 3.5 % 0.21 % C3A Tricalcium Silicate
< 2.5 % 1.81 % SO3 when C3A ˂ 5 %
< 2.8 % ----- SO3 when C3A ˃ 5 %

International Journal of Engineering and Information Systems (IJEAIS)
ISSN: 2643-640X
Vol. 5 Issue 1, January - 2021, Pages: 78-87
www.ijeais.org/ijeais
79
< 4 % 3.09 % L.O.I Loss on Ignition
< 1.5 % 0.82 % Ins. Res Insolvent Materials
Table 2. Sieve analysis of sand
Iraqi Specification
(45/2016), Zone 2 Passing % Sieve Size (mm)
100 100 10
90-100 95.6 4.75
75-100 86.8 2.36
55-90 74.3 1.18
35-59 44.0 0.6
8-30 18.8 0.3
0-10 2.6 0.15
< 5 % 3.8 % 75 microns
˂ 0.75 % (other) 0.37 % Sulfate Content
2.1.3 STEEL REINFORCEMENT
2.1.3.1. Steel bars
In Skeletal lacing used two diameters of deformed steel bars:
5 mm for the longitudinal bars of lacing.
4 mm for the zigzag members of lacing.
2.1.3.2. Steel Wire mesh
Galvanized square chicken wire mesh smooth with 12 x12 mm opening and with an average wire diameter of 0.6 mm.
Table 3. Tensile strength test results of steel reinforcement
Tensile Strength* fu (MPa) Yielding Stress* fy (MPa) Diameter (mm)
730 573 5
659 558 4
437 329 0.6
*The result is average of six specimen.
2.1.4 POLYSTYRENE FOAM
A polystyrene foam with low density of (12 kg / m3) and low cost was use as a core filling material. The foam was
cutting 10cm thick, where the width was different according properties of samples.
2.1.5 ADMIXTURE
The admixture used bonding agent type (Latex Modified Bonding Agent) produced by the company (PAC Technologies), and it
complies with the standard (ASTM C1059 Type II), which is an aqueous emulsion specially formulated for use as a bonding agent
and as an additive with cementitious mixes to improve the mix properties.
2.1.6 WATER
Pure water devoid from salt was use in mixing mortar of the samples.

International Journal of Engineering and Information Systems (IJEAIS)
ISSN: 2643-640X
Vol. 5 Issue 1, January - 2021, Pages: 78-87
www.ijeais.org/ijeais
80
2.2 DETAILS OF SAMPLES
Fig. 1-a. Detail of test samples (4 lacing & one layer wire mesh).

International Journal of Engineering and Information Systems (IJEAIS)
ISSN: 2643-640X
Vol. 5 Issue 1, January - 2021, Pages: 78-87
www.ijeais.org/ijeais
81
Fig. 1-b. Detail of test samples (4 lacing & one layer wire mesh).
Table 4. Details of samples.
Locate
of
load
No. of
wire
mesh
Lacing
spacing
(mm)
No.
of
lacing
Face
thickness
(mm)
Height
(mm)
Width
(mm)
Length
(mm)
Names
of
sample
Near
mid.
Suppor
1 360 3 30 160 760 3200 MS-1
1 240 4 30 160 760 3200 MS-2
1 145 6 30 160 760 3200 MS-3
2 360 3 40 180 770 3200 MS-4
2 240 4 40 180 770 3200 MS-5
2 145 6 40 180 770 3200 MS-6
4 360 3 45 190 780 3200 MS-7
4 240 4 45 190 780 3200 MS-8
4 145 6 45 190 780 3200 MS-9
2.3. MORTAR MIXING
Many cement mortar mixtures were made using materials with different weights (cement, sand, water and admixture) and the
compressive strength was examined to obtain the best compressive strength with the best workability of the cement mortar, where
the best compressive strength with good workability was obtained. Compressive strength test of cube specimen (50×50×50) mm
has been carried out by using digital compressive machine according to (the British standard BS.1881 and the American standards
ASTM-C39, ASTM-C109, ASTM-C469 and ASTM-C78.
Table 5. Property of mortar.
Comp. strength
fcu 28 days (Mpa)
Comp. strength fcu 7
days (Mpa)
Water cement
ratio w/c Cement : Sand
29.72 22.11 0.45 1 : 1.5
International Journal of Engineering and Information Systems (IJEAIS)
ISSN: 2643-640X
Vol. 5 Issue 1, January - 2021, Pages: 78-87
www.ijeais.org/ijeais
82
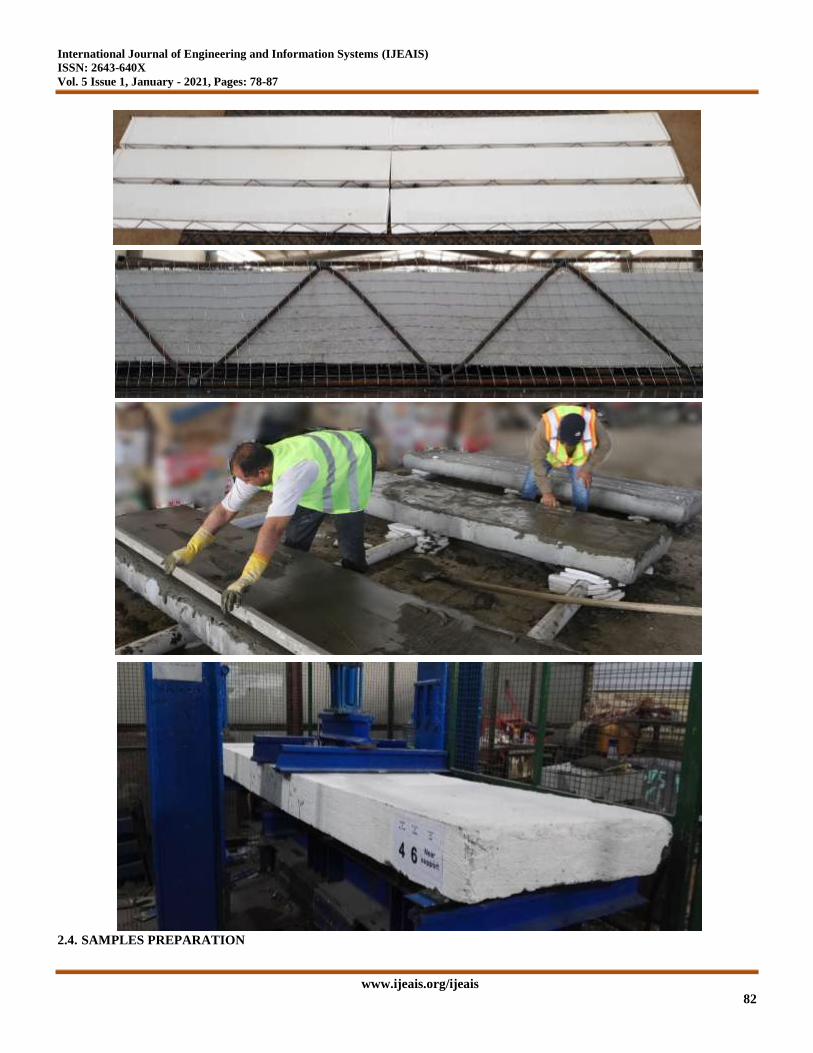
2.4. SAMPLES PREPARATION
International Journal of Engineering and Information Systems (IJEAIS)
ISSN: 2643-640X
Vol. 5 Issue 1, January - 2021, Pages: 78-87
www.ijeais.org/ijeais
83
Plate 1. Samples preparation
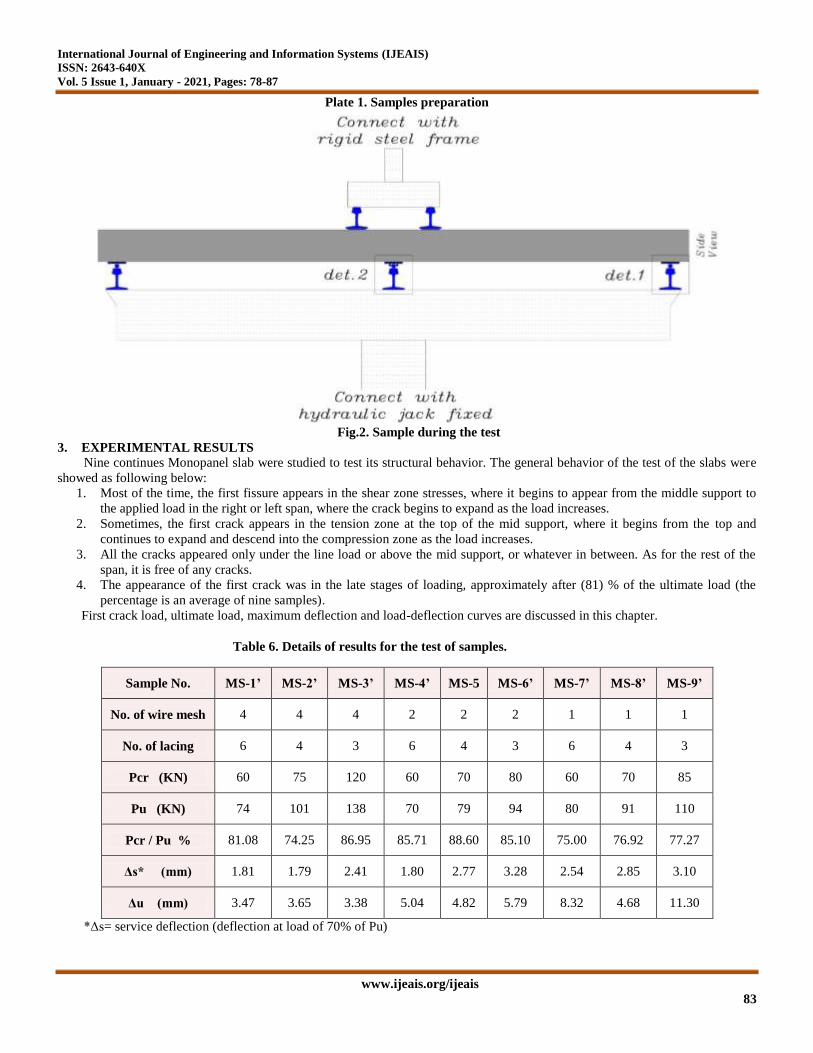
Fig.2. Sample during the test
3. EXPERIMENTAL RESULTS
Nine continues Monopanel slab were studied to test its structural behavior. The general behavior of the test of the slabs were
showed as following below:
1. Most of the time, the first fissure appears in the shear zone stresses, where it begins to appear from the middle support to
the applied load in the right or left span, where the crack begins to expand as the load increases.
2. Sometimes, the first crack appears in the tension zone at the top of the mid support, where it begins from the top and
continues to expand and descend into the compression zone as the load increases.
3. All the cracks appeared only under the line load or above the mid support, or whatever in between. As for the rest of the
span, it is free of any cracks.
4. The appearance of the first crack was in the late stages of loading, approximately after (81) % of the ultimate load (the
percentage is an average of nine samples).
First crack load, ultimate load, maximum deflection and load-deflection curves are discussed in this chapter.
Table 6. Details of results for the test of samples.
MS-9’ MS-8’ MS-7’ MS-6’ MS-5 MS-4’ MS-3’ MS-2’ MS-1’ Sample No.
1 1 1 2 2 2 4 4 4 No. of wire mesh
3 4 6 3 4 6 3 4 6 No. of lacing
85 70 60 80 70 60 120 75 60 Pcr (KN)
110 91 80 94 79 70 138 101 74 Pu (KN)
77.27 76.92 75.00 85.10 88.60 85.71 86.95 74.25 81.08 Pcr / Pu %
3.10 2.85 2.54 3.28 2.77 1.80 2.41 1.79 1.81 Δs* (mm)
11.30 4.68 8.32 5.79 4.82 5.04 3.38 3.65 3.47 Δu (mm)
*Δs= service deflection (deflection at load of 70% of Pu)

International Journal of Engineering and Information Systems (IJEAIS)
ISSN: 2643-640X
Vol. 5 Issue 1, January - 2021, Pages: 78-87
www.ijeais.org/ijeais
84
Plate 2. Failure pattern of sample MS-2’.

International Journal of Engineering and Information Systems (IJEAIS)
ISSN: 2643-640X
Vol. 5 Issue 1, January - 2021, Pages: 78-87
www.ijeais.org/ijeais
85
Fig.3. Load-Deflection Curves between MS-1’, MS-2’ and MS3’
Fig.4. Load-Deflection Curves between MS-4’, MS-5’ and MS6’
Fig.5. Load-Deflection Curves between MS-7’, MS-8’ and MS9’
0
20
40
60
80
100
120
140
0 0.5 1 1.5 2 2.5 3 3.5 4
Load
K
N
Deflection (mm)
MS-3'
MS-2'
MS-1'
0
10
20
30
40
50
60
70
80
90
100
0 1 2 3 4 5 6 7 8
Load
K
N
Deflection (mm)
MS-6'
MS-5'
MS-4
0
20
40
60
80
100
120
0 2 4 6 8 10 12
Load
K
N
Deflection (mm)
MS-9'
MS-8'
MS-7'

International Journal of Engineering and Information Systems (IJEAIS)
ISSN: 2643-640X
Vol. 5 Issue 1, January - 2021, Pages: 78-87
www.ijeais.org/ijeais
86
Fig.6. Load-Deflection Curves between MS-1’, MS-4’ and MS7’
Fig.7. Load-Deflection Curves between MS-2’, MS-5’ and MS8’
Fig.8. Load-Deflection Curves between MS-3’, MS-6’ and MS9’
0
10
20
30
40
50
60
70
80
90
0 2 4 6 8 10
Load
K
N
Deflection (mm)
MS-7'
MS-4'
MS-1'
0
20
40
60
80
100
120
0 2 4 6 8 10
Load
K
N
Deflection (mm)
MS-8
MS-5'
MS-2'
0
20
40
60
80
100
120
140
160
0 2 4 6 8 10 12
Load
K
N
Deflection (mm)
MS-9'
MS-6'
MS-3'

International Journal of Engineering and Information Systems (IJEAIS)
ISSN: 2643-640X
Vol. 5 Issue 1, January - 2021, Pages: 78-87
www.ijeais.org/ijeais
87
4. CONCLUSIONS
From the research that were presented, which included nine samples for shear stresses failure test, the main conclusions
can be summarized based on this study and the evaluation of the recorded data, the following conclusions are drawn:
The increase in the reinforcement of the lacing reinforcement gave a very noticeable increase in terms of the ultimate
load, as it gave an increase of (21.03)% when increasing of the lacing reinforcement from (3) to (4). In addition, the
ultimate load increased by (52.75)% when increased the lacing from (3) to (6).
The increased number of the wire mesh also gave a noticeable decrease in the ultimate load shear samples, where the
ultimate load decreased by (19.69)% when the number of layers changed from (one layer) to (two layers). And the
percentage decreased it reached more (7.36)% when the number of layers changed from (one layer) to (four layers).
Deflection was really affected by the increase in the lacing reinforcement, as the ultimate deflection rate of samples
decreased by (12.55)% when using (4) lacing instead of (3), and the rate of descent was further reduced to a percentage
(26.55)% when using (6)lacing, but the deflection was increase when increasing the wire mesh.
It was apparent that the crack appearing load and the width of the crack would be less with the increase in the number of
lacing, while the variation between increase and decrease with the increase in the number of wire mesh layers.
5. REFERENCES
[1] Faris J. Al-Talqany., (2018), " Effect of Number of Wire Mesh Layers and Depth Ratio on Ultimate Shear Force for
Monopanel Beam Specimens." Journal of University of Babylon, Engineering Sciences, Vol.(26), No.(1), pp. 407-413.
[2] Swamy R. N. and El-Ahboud M. I., 1988, “Application of Ferrocement Concept to Low Cost Lightweight Concrete
Sandwich Panels”, Journal of Ferrocement, Vol.18, No.3, PP.285-292.
[3] Nanni A., and Chang W. F., 1986, “Ferrocement Sandwich Panels under Bending and Edge-Wise Compression”, Journal
of Ferrocement, Vol.16, No.2, PP. 129-140.
[4] Faris J. Al-Talqany, December, 2007,”Structural Behavior of Monopanel Wall and Beam Elements” Ph.D. Thesis,
Building and Construction Engineering Department, University of Technology.
Authors
Faris Jassim Jaber
Professor of Civil Engineering,
Faculty of Engineering, University of Kufa
Samir Thamer Saeed
M.Sc. Candidate of Civil Engineering,
Faculty of Engineering, University of Kufa