It's a small world: managing human resources in small businesses
Upload
khangminh22Category
view
3download
0
SERVICE QUALITY IN A LANDLORD-SMALL BUSINESS RELATIONSHIP IN SHOPPING CENTRES
by
CORNELIA PETRONELLA JOHANNA HARMSE 28578602
SUBMITTED IN PARTIAL FULFILMENT OF THE REQUIREMENTS FOR THE DEGREE PHD IN ENTREPRENEURSHIP
in the
Faculty of Economic and Management Sciences
at the
University of Pretoria
SUPERVISOR:
PROF GH NIEMAN
April 2012
©© UUnniivveerrssiittyy ooff PPrreettoorriiaa

ii
DECLARATION
I declare that the thesis,
“SERVICE QUALITY IN A LANDLORD-SMALL BUSINESS RELATIONSHIP IN
SHOPPING CENTRES”,
is my own work, that all the sources used or quoted have been indicated and
acknowledged by means of complete references, and that this thesis was not previously
submitted by me for a degree at another university.
CORNELIA PETRONELLA JOHANNA HARMSE

iii
ACKNOWLEDGEMENTS
Dedicated to my parents, Jan and Lenie Labuschagne. Wish I could have shared this with
you.
My sincere appreciation to:
• My promoter and friend, Professor Gideon Nieman for his expert guidance and
support. I am grateful for his motivation and belief in my abilities.
• Ms Rina Owen from the Department of Statistics at the University of Pretoria for her
hard work, advice and continuous help during the empirical part of the study.
• Professor Jurie van Vuuren for his statistical advice when so little made sense to me.
• Marlize Bosch and Anneke Glas for their valuable help as field workers.
• Trevor Koopman for taking care of the linguistic and editorial aspects.
• Tshwane University of Technology for financial support and much appreciated study
leave.
• And above all, thank you to Gerrit, Anke and Divan.

iv
SUMMARY
SERVICE QUALITY IN A LANDLORD-SMALL BUSINESS RELATIONSHIP IN SHOPPING CENTRES
By
CORNELIA PETRONELLA JOHANNA HARMSE
Supervisor: Prof. G.H. Nieman
Department: Business Management
Degree: PhD Entrepreneurship
The service sector in the world economy is growing and becomes increasingly important. It
is widely recognised that the success and vitality of the service sector are the essential
factors in measuring an economy’s progress, its quality and its future. Improving service
quality is therefore considered an essential strategy for success and survival in today’s
competitive economic environment. Small businesses are equally important for a country’s
economy. They play an important role in the economic and social development of
countries. The correct location for small businesses can contribute to their success and,
many consider shopping centres as a good location for their businesses. The landlords
however, have a huge impact on small business tenants’ success in shopping centres.
Although landlords of shopping centres realise the importance of accommodating small
independent businesses in their centres, it is argued that they are at a competitive
disadvantage regarding the service they receive in comparison with that of bigger anchor
tenants. There are several research studies on the measurement of service quality in
several service sectors, but none has addressed the quality of service rendered by
landlords of shopping centres to their small business tenants.
The purpose of this study is to measure the perceived service quality that small business
tenants in shopping centres receive from landlords. The study will also determine whether

v
the existing SERVPERF and FAIRSERV service quality models will be suitable to measure
the service quality that landlords render to small business tenants.
The findings of the empirical study have revealed that small business tenants in shopping
centres are in general dissatisfied with the service that they receive from their landlords.
Factor analysis was done to determine the factors or dimensions of service quality that
small business tenants deemed as important. From this study it became clear that small
business tenants in shopping centres are concerned about mainly two aspects of the
service they receive from landlords, namely intangible aspects as well as marketing and
tangible aspects. This study has therefore proved that the five dimensions of SERVPERF
and the one dimension of FAIRSERV cannot be applied directly to measure the perceived
service quality that small business tenants receive from their landlords. The One Way
Analysis of Variance (ANOVA) was also executed to illustrate statistical differences
between various variables.
The contribution of this study to the science, as well as its possible limitations and areas
for future research, is also discussed. This study further shows that, although small
business tenants are dissatisfied with the service they receive from landlords, they have
indicated that they will stay on as tenants in the centres. The reason for this is that it is
simply too expensive for them to move to another location and also because shopping
centres are good locations for their businesses.

1
TABLE OF CONTENT
DECLARATION.................................................................................................................... ii
ACKNOWLEDGEMENTS ....................................................................................................iii
ABSTRACT ......................................................................................................................... vi
LIST OF FIGURES...............................................................................................................7
LIST OF TABLES.................................................................................................................8
CHAPTER 1: BACKGROUND AND DEFINITION OF THE STUDY 10
1.1 INTRODUCTION.......................................................................................................10
1.2 BACKGROUND AND IMPORTANCE OF THE STUDY............................................12
1.3 LITERATURE REVIEW.............................................................................................18
1.4 THE RESEARCH PROBLEM....................................................................................21
1.5 PURPOSE OF THE STUDY .....................................................................................22
1.6 RESEARCH OBJECTIVES.......................................................................................22
1.6.1 Primary objective ....................................................................................................22
1.6.2 Secondary objectives..............................................................................................22
1.7 HYPOTHESES..........................................................................................................23
1.8 RESARCH METHODOLOGY ...................................................................................25
1.8.1 Sample selection and size ......................................................................................25
1.8.2 Design of the study .................................................................................................26
1.9 IMPORTANCE AND BENEFITS OF THE STUDY....................................................26
1.10 STRUCTURE OF THE STUDY.................................................................................27
1.11 ABBREVIATIONS .....................................................................................................29
1.12 REFEENCING TECHNIQUE.....................................................................................29
CHAPTER 2: SERVICES AND AN INTRODUCTION TO QUALITY ............................... 30
2.1 INTRODUCTION.......................................................................................................30
2
2.2 SERVICE QUALITY VERSUS CUSTOMER SATISFACTION..................................30
2.3 SERVICES................................................................................................................36
2.3.1 Meaning of services ................................................................................................36
2.3.2 Characteristics of services ......................................................................................40
2.3.2.1 Intangibility .........................................................................................................42
2.3.2.2 Heterogeneity.....................................................................................................44
2.3.2.3 Inseparability ......................................................................................................47
2.3.2.4 Perishability........................................................................................................49
2.4 QUALITY.................................................................................................................51
2.4.1 The meaning of quality............................................................................................51
2.4.1.1 The transcendent approach ...............................................................................52
2.4.1.2 The product-based approach .............................................................................53
2.4.1.3 The user-based approach ..................................................................................54
2.4.1.4 The manufacturing-based approach ..................................................................56
2.4.1.5 The value-based approach................................................................................57
2.4.2 Concluding remarks on quality................................................................................58
2.5 CONCLUSION ........................................................................................................59
CHAPTER 3: SERVICE QUALITY...................................................................................60
3.1 INTRODUCTION ....................................................................................................60
3.2 THE CONCEPT OF PERCEIVED QUALITY ..........................................................61
3.3 SERVICE QUALITY DEFINED ...............................................................................63
3.4 A REVIEW OF SELECTED SERVICE QUALITY MODELS....................................65
3.4.1 The Grönroos service quality model .......................................................................65
3.4.2 The SERVQUAL model of service quality ...............................................................68
3.4.3 Performance only model of Cronin and Taylor (SERVPERF) .................................81
3.4.4 Haywood-Farmer’s conceptual model of service quality .........................................83
3.4.5 The dynamic process model of Boulding, Kalra, Staelin and Zeithaml ...................85

3
3.4.6 The three-component model of Rust and Oliver .....................................................88
3.4.7 The return-on-quality approach of Rust, Zahorik and Keiningham..........................89
3.4.8 The P-C-P service attribute model of Philip and Hazlett .........................................90
3.4.9 Dabholkar, Shepherd and Thorpe’s antecedents model .........................................92
3.4.10 The hierarchical approach of Brady and Cronin ....................................................93
3.4.11 Grönroos’s model as adapted by Kang and James ...............................................96
3.4.12 Kang’s hierarchical structure of service quality .....................................................98
3.4.13 Carr’s FAIRSERV model .....................................................................................100
3.4.14 Other service quality models ............................................................................... 104
3.5 CONCLUSION ...................................................................................................... 108
CHAPTER 4: SMALL BUSINESS TENANTS IN SHOPPING CENTRES ..................... 110
4.1 INTRODUCTION .................................................................................................. 110
4.2 INTRODUCTION TO SHOPPING CENTRES....................................................... 112
4.3 DEFINITION OF A SHOPPING CENTRE............................................................. 114
4.4 TYPES OF SHOPPING CENTRES ...................................................................... 114
4.4.1 Small free standing and convenience centres....................................................... 116
4.4.2 Neighbourhood centres......................................................................................... 116
4.4.3 Community centres ............................................................................................... 117
4.4.4 Small regional shopping centres/Large community shopping centres .................. 119
4.4.5 Regional centres .................................................................................................. 120
4.4.6 Super regional centres ......................................................................................... 121
4.4.7 Lifestyle centres ................................................................................................... 122
4.4.8 Value/strip centres ............................................................................................... 123
4.4.9 Hyper centres....................................................................................................... 124
4.5 SHOPPING CENTRES AS INVESTMENTS......................................................... 124
4.6 SHOPPING CENTRE MANAGEMENT................................................................. 126
4.7 THE IMPORTANCE OF TENANT MIX ................................................................. 127
4
4.8 THE LANDLORD-TENANT RELATIONSHIP IN A SHOPPING CENTRE ............ 130
4.9 LANDLORD-TENANT CONTRACT OF LEASE.................................................... 132
4.10 DEFINITION OF SMALL BUSINESS.................................................................... 135
4.11 THE ROLE OF SMALL BUSINESSES IN SHOPPING CENTRES ....................... 138
4.11.1 Lack of business knowledge................................................................................ 140
4.11.2 Inadequate finances ............................................................................................ 140
4.11.3 Inferior customer service ..................................................................................... 141
4.11.4 Poor merchandising............................................................................................. 141
4.12 CONCLUSION ...................................................................................................... 143
CHAPTER 5: RESEARCH DESIGN AND METHODOLOGY ........................................ 144
5.1 INTRODUCTION .................................................................................................. 144
5.2 THE RESEARCH PROBLEM ............................................................................... 146
5.3 THE RESEARCH OBJECTIVES........................................................................... 147
5.3.1 Primary objective .................................................................................................. 148
5.3.2 Secondary objectives ............................................................................................ 148
5.4 HYPOTHESES........................................................................................................149
5.4.1 Hypotheses testing.................................................................................................. 151
5.5 RESEARCH METHODOLOGY............................................................................... 152
5.5.1 Research design .................................................................................................... 152
5.5.2 Sampling design and data collection methods ....................................................... 153
5.5.2.1 Sample error .................................................................................................... 157
5.5.2.2 Response rate.................................................................................................. 157
5.5.2.3 Data collection.................................................................................................. 159
5.5.3 Purpose of the study .............................................................................................. 160
5.5.4 Time dimension...................................................................................................... 161
5.5.5 Topical scope ......................................................................................................... 161
5.5.6 The research environment ..................................................................................... 162
5
5.5.7 Participants’ perceptions ........................................................................................ 162
5.6 QUESTIONNAIRE DESIGN, VALIDITY AND MEASUREMENT .......................... 162
5.6.1 Measurement of the research instrument.............................................................. 163
5.6.2 Characteristics of sound measurement................................................................. 170
5.6.2.1 Validity of the measurement instrument ........................................................... 170
5.6.2.2 Reliability of the measurement instrument ....................................................... 171
5.6.2.3 Factor analysis ................................................................................................. 173
5.7 DATA PROCESSING AND ANALYSIS................................................................. 174
5.7.1 Descriptive statistics.............................................................................................. 175
5.7.2 Inferential statistics ............................................................................................... 175
5.7.3 Statistical significance ........................................................................................... 175
5.8 CONCLUSION ...................................................................................................... 176
CHAPTER 6: RESEARCH FINDINGS ........................................................................... 177
6.1 INTRODUCTION .................................................................................................. 177
6.2 DESCRIPTIVE STATISTICS ................................................................................ 178
6.3 RESPONDENTS’ PERCEIVED SERVICE QUALITY FROM LANDLORDS......... 188
6.4 VALIDITY AND RELIABILITY OF THE MEASURING INSTRUMENT .................. 193
6.5 PERCEIVED SERVICE QUALITY ACCORDING TO THE TWO FACTORS ........ 200
6.6 ONE-WAY ANALYSIS OF VARIANCE (ANOVA) ................................................. 202
6.7 RESPONSE TO OPEN-ENDED QUESTIONS ..................................................... 210
6.7.1 Reasons for selecting the shopping centre ........................................................... 215
6.7.2 Most positive features of landlord’s service........................................................... 215
6.7.3 Most negative features of landlord’s service ......................................................... 216
6.7.4 Reasons for remaining in the shopping centre...................................................... 216
6.7.5 Conclusion ............................................................................................................217
6.8 CONCLUSION ...................................................................................................... 218

6
CHAPTER 7: CONCLUSION AND RECOMMENDATIONS .......................................... 219
7.1 INTRODUCTION .................................................................................................. 219
7.2 SUMMARY OF THE CHAPTERS ......................................................................... 219
7.2.1 Background and definition of the study ................................................................. 219
7.2.2 Services and an introduction to quality.................................................................. 220
7.2.3 Service quality....................................................................................................... 222
7.2.4 Small business tenants in shopping centres ......................................................... 228
7.2.5 Research design and methodology....................................................................... 231
7.2.6 Research findings ................................................................................................. 231
7.3 RESEARCH OBJECTIVES REVISITED............................................................... 232
7.3.1 Primary objective revisited .................................................................................... 233
7.3.2 Secondary objectives revisited.............................................................................. 234
7.4 RESEARCH QUESTIONS REVISITED ................................................................ 237
7.5 HYPOTHESES REVISITED.................................................................................. 239
7.4 CONTRIBUTION/NEW KNOWLEDGE GENERATED BY THE STUDY............... 242
7.5 LIMITATIONS OF THE STUDY ............................................................................ 243
7.6 RECOMMENDATIONS FOR FURTHER RESEARCH ......................................... 244
7.7 CONCLUSION ...................................................................................................... 245
8. REFERENCES ........................................................................................................... 246
APPENDIX A: Informed consent form ..............................................................................281
APPENDIX B: Data collection instrument..........................................................................283
APPENDIX C: Comments from small business tenants ...................................................290
APPENDIX D: Details of reliability analysis ......................................................................338

7
LIST OF FIGURES
Figure 2.1: The service quality cycle………………………………………………………........34
Figure 3.1: The perceived quality component ....................................................................62
Figure 3.2: The service quality model of Grönroos …………………………………………...66
Figure 3.3: Service quality – identification of gaps.............................................................70
Figure 3.4: Determinants of perceived service quality .......................................................73
Figure 3.5: A three-dimensional classification scheme .....................................................83
Figure 3.6: Attribute service quality model .........................................................................84
Figure 3.7: A dynamic process model of service quality ....................................................85
Figure 3.8: The three-component model............................................................................88
Figure 3.9: P-C-P service attribute model of service quality ..............................................90
Figure 3.10: Antecedents model of service quality ............................................................92
Figure 3.11: The hierarchical approach .............................................................................94
Figure 3.12: Adaptation of Grönroos’s model by Kang and James....................................95
Figure 3.13: The hierarchical structure of service quality...................................................98
Figure 3.14: The FAIRSERV model. ................................................................................101
Figure 5.1: The research process of the study...................................................................144
Figure 5.2: Stages in the selection of a sample .................................................................153
Figure 6.1: Total number of full-time employees ...............................................................179
Figure 6.2: Distribution of respondents' number of years in shopping centre ...................180
Figure 6.3: Distribution of respondents' number of years having their business ...............181
Figure 6.4: Years of business experience prior to leasing in the centre ............................183
Figure 6.5: Number of shopping centres leased in before .................................................184

8
LIST OF TABLES
Table 1.1: The service sector in South Africa.....................................................................11
Table 3.1: Determinants of service quality..........................................................................72
Table 3.2: Refined determinants of service quality ............................................................74
Table 3.3: The SERVQUAL scale ......................................................................................76
Table 3.4: Summary of service quality models .................................................................104
Table 4.1: Size criteria of different types of shopping centres in South Africa ..................114
Table 4.2: Location criteria of different types of shopping centres in South Africa............114
Table 4.3: Classification of small businesses in terms of National Small Business
Amendment Act, Act 26 of 2003 .....................................................................136
Table 5.1: Type I and Type II errors in hypotheses testing ...............................................151
Table 5.2: Types of sample designs .................................................................................154
Table 5.3: Response rate (Time frame: December 2011 - March 2012 ...........................157
Table 5.4: Characteristics of response strategies used in questionnaire .........................163
Table 5.5: Linking objectives with questions and proposed data analysis methods ........164
Table 5.6: Summary of validity estimates .........................................................................168
Table 5.7: Summary of reliability estimates ......................................................................169
Table 6.1: Business demographics of the respondents ....................................................176
Table 6.2: Personal demographics of the respondents ....................................................182
Table 6.3: Perceived service quality that small business tenants receive from
landlords in shopping centres .........................................................................185
Table 6.4: List of variables that were eliminated for two-factor analysis ............................190
Table 6.5: Rotated factor analysis of respondents' perceived service quality from
their landlords in shopping centres .................................................................191
Table 6.6: Labels given to two factors …………………………………………………….......193
Table 6.7: Cronbach alpha results .....................................................................................195
Table 6.8: Correlation between two factors........................................................................195
Table 6.9: The mean scores on perceive service quality ...................................................197
Table 6.10: ANOVA: intangibles ........................................................................................198
Table 6.11: Mean scores of the number of shopping centres tenants leased from

9
before in terms of the intangibles ....................................................................200
Table 6.12: Mean scores of the number of business experience of tenants prior to
leasing in the centre in terms of intangibles .................................................201
Table 6.13: Mean scores of the different type of shopping centres in terms of
intangibles ....................................................................................................202
Table 6.14: ANOVA: marketing and tangibles ................................................................203
Table 6.15: Mean scores of the number of years as tenant in particular shopping
centre in terms of marketing and intangibles ...............................................204
Table 6.16: Mean scores of the number of shopping centres tenants leased from
before in terms of marketing and tangibles ..................................................205
Table 6.17: Mean scores of the types of shopping centre in terms of marketing
and tangibles ...............................................................................................206
Table 6.18: Results of open-ended questions per type of centre ...................................208
Table 7.1: Summary of service quality models …………………………………………….221
Table 7.2: Perceived service quality of landlords' service to small business tenants ....230
Table 7.3: Relationships in terms of respective independent variables …………………233
Table 7.4: A summary of the findings in response to the research questions ………….234
Table 7.5: Findings from testing of the null hypotheses …………………………………..237

10
CHAPTER 1
BACKGROUND AND DEFINITION OF THE STUDY
1.1 INTRODUCTION
Size does count. This is how many small businesses feel if they are tenants in shopping
centres. They come up against landlords that favour bigger, well-known retailers, mainly
for economic reasons (Damien, Curto & Pinto, 2011:457; Ibrahim & Galven, 2007:240;
Levy & Weitz, 2009:200). As a result, the perception is that the service quality that small
business tenants receive from their landlords leaves a lot to be desired.
Although landlords of shopping centres realise the importance of accommodating small
independent businesses in their centres, it is still argued today that, they are at a
competitive disadvantage regarding several issues. In the early 1970s Kinnard and
Messner (1972:21) reported that since at least 1960, there has been documentary
evidence in support of the claim that small retailers in shopping centres are discriminated
against when it comes to prime retail locations in shopping centres. This is still the case
today and, several other areas of poor service delivery by landlords, especially where
small business owners feel that they are being victimised and bullied, are mentioned in the
literature (Barrios, 2007; Carswell, 2008; Cockram, 2002:43; Nieman, 2000:12; Roberts et
al., 2010:599).
The services sector in the world economy is growing and becomes increasingly important
and, the world is in effect becoming characterised by services (Akehurst, 2008:1; Bitner &
Brown, 2008:39; Chase & Apte, 2007:375; Godlevskaja, Van Iwaarden & Van der Wiele,
2011:62; Hollensen, 2010:393; Johnstone, Dainty & Wilkinson, 2009:521; Kasper, Van
Helsdingen & Gabbott, 2006:7; Ostrom, Bitner, Brown, Burkhard, Goul, Smith, Daniels,
Demirkan & Rabinovich, 2010:4; Wilson, Zeithaml, Bitner & Gremler, 2008:8). It is widely
recognised that the success and vitality of the services sector are the essential factors in

11
measuring an economy’s progress, its quality and its future (Lee, Ribeiro, Olson & Roig,
2007:2). Lovelock (in Kueh & Voon, 2007:656) argues that, as countries become more
developed and income levels rise, the observable trend, called the “hollowing out effect”, is
that the emphasis of economic activity shifts from the agricultural and manufacturing
sectors to services. The most advanced economies in the world are dominated by
services, with many having more than 70 percent of their gross domestic product (GDP)
generated by services (Carrilat, Jaramillo & Mulki, 2009:95; Kotler & Armstrong, 2010:268;
Ostrom et al., 2010:4; Talib & Rahman, 2010:364; Wilson et al., 2008:8; Young, 2008:3).
In South Africa, as a developing country, the services sector also makes up the majority of
the GDP and of the labour force (Table 1.1).
Table1.1: The service sector in South Africa
GDP (2010 estimate) LABOUR FORCE (2007 estimate) Service Industry Agriculture Service Industry Agriculture
65,8 % 31,2 % 3 % 65 % 26 % 9 %
Source: Central Intelligence Agency, (2010).
In order for entering and surviving highly competitive domestic and global service markets
in the 21st century, it is therefore essential to respond to customer demands for improved
service quality (Bitner & Brown, 2008:40; Carrilat et al., 2009:105; Milakovich, 2006:ix;
Prajogo & McDermott, 2011:466; Tontini & Picolo, 2010:581). Improving service quality is
therefore considered an essential strategy for success and survival in today’s competitive
economic environment. It is evident from the literature that the provision of high service
quality enables a company to be competitive and contributes to their productivity and
profitability. It increases cash flows and shareholder value, gives businesses a better
chance of success, enhances customer satisfaction, increases the willingness of
customers to positively talk about the service provider, decreases customer defection and
enhances customer loyalty (Bateson & Hoffman, 2011:326; Baumann, Burton, Elliot &
Kehr, 2007; Chen, Tsou & Huang, 2009:49; Ehigie, 2006; Kassim & Souiden, 2007;
Kelkar, 2010:421; Kersten & Koch, 2010:196; Lee et al., 2007:2; Madhavaram & Hunt,

12
2008: 67; Talib & Rahman, 2010:363; Von Freymann & Cuffe, 2010:406, Wiles, 2007:27;
Yoo & Park, 2007:920).
The benefits of high service quality also goes beyond economic indicators and have a
positive social outcome as well, in that these benefits improve communities’ quality of life
(Dagger & Sweeney, 2006:12; Lee et al., 2007:2; Young, 2008:4). This continued growth
in the service sector also makes it the only sector where new employment was created
over the past two decades on a worldwide scale (Evans & Lindsay, 2008:58; Lee et al.,
2007:2; Olorunniwo, Hsu & Udo, 2006:59).
Like many businesses, landlords as property managers are also being subjected to
increased competitive pressures of the changing business and economic environment.
There are, for instance, numerous reports that the shopping centre traffic and sales have
been declining in the United States of America (USA) and limited resources are being
spent on new shopping centre development. Since the mid-1990s, at least 300 older
shopping centres in the USA, each with one or two anchor stores, have shut down (Levy &
Weitz, 2009:202). Only five new shopping centres opened per year between 2000 and
2005 and, since 2006, no new enclosed regional mall has opened in the USA (Bodamer,
2011). Although the worldwide economic recession did not affect South Africa equally
hard, this scenario in the USA should be reason for concern for South African landlords of
shopping centres. Landlords should realise that all their tenants should be treated as
valued customers and that it is very important that their needs should be met (Pinder,
Price, Wilkinson & Demack, 2003:218). The issue of service quality is therefore of
particular interest to them.
The purpose of this study is to determine what the perceived service quality is that small
business tenants receive from landlords in shopping centres.
This chapter provides the background and literature review of the study. The problem
statement, objectives, methodology and design of the study as well as the outline of
Chapters 2 to 7 is set out in this chapter. This is done as a guide to the flow of this study.
1.2 BACKGROUND AND IMPORTANCE OF THE STUDY

13
This study focuses on the measuring of the perceived service quality that small business
tenants receive from landlords in shopping centres. Service quality has been the topic of
many research studies during the last three decades. Of particular interest is the issue of
service quality measurement. This aspect (service quality measurement), is of particular
interest for this study because the purpose of the study is to measure the service quality
that small business tenants in shopping centres receive from their landlords. Review of the
literature indicates that there are several models available to measure service quality. It is
imperative that the correct model is used to measure the service quality that small
business tenants receive from their landlords.
By far the most popular and most often used model is the SERVQUAL model as proposed
by Parasuraman, Zeithaml and Berry (1988). SERVQUAL was proposed by Parasuraman
et al. (1988) as a multiple item scale for measuring customer perceptions of service
quality. During 1985 they identified ten components of service quality, namely, reliability,
responsiveness, competence, access, courtesy, communication, credibility, security,
understanding/knowing the customer and tangibles. After further research by them, the
original ten dimensions were reduced to five, these consisting of three original dimensions
and two combined dimensions. These five dimensions were tangibles, reliability,
responsiveness, assurance and empathy. The measurement scale developed included a
22-item scale termed SERVQUAL that evaluated service quality on the five service quality
dimensions by, comparing customer’s expectations and perceptions.
Since its inception, SERVQUAL has been used to measure perceived service quality of
customers in a variety of service industries. Although several of these researchers have
modified the SERVQUAL dimensions to fit their research purposes and the specific service
industry they have conducted the study in, numerous recent empirical studies have applied
this instrument/modification of it successfully in a variety of industries. These include
studies in healthcare services (Arasli, Ekiz & Katirciogly, 2008; Chaniotakis &
Lymperopoulos, 2009; Dagger, Sweeney & Johnson, 2007; Etgar & Fuchs, 2009; Lin,
Sheu, Pai, Bair, Hung, Yeh & Chou, 2009; Ramsaran-Fowdar, 2008; Rashid & Jusoff,
2009; Rohini & Mahadevappa, 2006; Vinagre & Neves, 2008; Wicks & Chin, 2008), non
profit organisations (Haley & Grant, 2011), mobile communication services (Kung, Yan &
Lai, 2009; Lai, Hutchinson, Li & Bai, 2007; Negi, 2009; Rahman, 2006), the fast food
14
industry (Bougoure & Neu, 2010), the public service sector (Agus, Barker & Kandampully,
2007), the banking sector (Kumar, Kee & Charles, 2010; Kumar, Kee & Manshor, 2009;
Nadiri, Kandampully & Hussain, 2009; Petridou, Spathis, Glaveli & Liassides, 2007), the
restaurant industry (Kueh & Voon, 2007), the hotel industry (Ramsaran-Fodar, 2007), the
computer software industry (Dos Santos, De Oliveira & Da Silva, 2009), the information
technology industry (Roses, Hoppen & Henrique, 2009), higher education (Chatterjee,
Ghosh & Bandyopadhyay, 2009), professional sports (Robinson & Barlas, 2009;
Theodorakis, Alexandris & Ko, 2011), the automobile service sector (Saravanan & Rao,
2007), call centres (Ramseook-Munhurrun, Naidoo & Lukea-Bhiwajee, 2009), the tourism
industry (Kvist & Klefsjö, 2006), the insurance industry (Tsoukatos & Rand, 2006) and the
airline industry (Chau & Kao, 2009).
Since its inception, SERVQUAL was however, not without its fair share of criticism. A
major criticism is the problem of measuring expectations (Carman, 1990; Cronin & Taylor,
1992; Gilmore & McMullan, 2009:645; McDougal & Levesque, 1994). Some researchers
(Juga, Juntunen & Grant, 2010; Ladhari, 2009a; McDougal & Levesque, 1994) for
instance, think that measuring expectations is unnecessary and that measuring
perceptions of outcomes should suffice. Grönroos (in Wilson et al., 2008:133) suggests
three problems when measuring comparisons between expectations and experiences over
a number of attributes. These problems are:
• If expectations are measured after the service experience has taken place, which
frequently happens for practical reasons, then what is measured is not really
expectation but something that has been influenced by the service experience.
• It may not make sense to measure expectations prior to the service experience
either, because the expectations that existed before a service is delivered may not be
the same as the factors that a person experiences when evaluating their
experiences.
• A customer’s view of their experience in a service encounter is influenced by their
prior expectations. Consequently, if expectations are measured and then
experiences are measured, then the measures are not independent of each other
and, the expectations are actually being measured twice.

15
The pairs of statements in the SERVQUAL questionnaire, designed to capture responses
on both expectations and perceptions, make the questionnaire relatively complicated.
There is subjective evidence in a study by Wisniewski (2001:386), where he uses
SERVQUAL to assess customer satisfaction with public sector services, and some
customers were discouraged from completing the questionnaire because of its apparent
length and complexity.
Ladhari (2009a) found the five dimensions of SERVQUAL to be useful and applicable to
the Canadian banking industry, but decided that measuring clients’ expectations of service
quality is not useful and therefore only measured the perceptions of service quality in his
study. Likewise, Theodorakis, Kambitis, Laios and Koustelios (2001) developed the
SPORTSERV scale (a modified SERVQUAL scale) to assess only the perceptions of
service quality amongst sport spectators but not their expectations. Etgar and Fuchs
(2009) also only measure service quality perceptions in their study in the healthcare
services. Other recent studies where only perceptions of service quality were measured, is
that of Andaleeb and Conway (2006), Jain and Gupta (2004), Olorunniwo et al. (2006) and
Qin, Prybutok and Zhao (2010).
Another general critique is that the dimensions used in the SERVQUAL instrument are not
appropriate for all service offerings and need to be contextualised to reflect different
service activities (Babakus & Boller, 1992; Carman, 1990). In recent research studies,
Kumar et al. (2010) and Lai et al. (2007) added one dimension (convenience) to the
original five dimensions. Kumar et al. (2009) only kept two original dimensions (tangibility
and reliability) and added competence and convenience in their study of service quality in
banks. Saravanan and Rao (2007) made use of six dimensions of which only one
(tangibles) was retained. Ramsaran-Fodar (2007) and Negi (2009) found the five original
dimensions useful but, added another two to their studies. From SERVQUAL’s inception
however, Parasuraman et al. (1988:31) have indicated that it may be necessary to add or
delete dimensions from the SERVQUAL scale to suit particular service industries. They do
however believe that the original dimensions provide a valuable starting point for the
development of an appropriate tool.

16
One of the better known alternatives to SERVQUAL is the SERVPERF instrument, (Cronin
and Taylor, 1992) that measures experiences only and does not ask respondents about
expectations. As a result, SERVPERF uses only the perceptions part of the SERVQUAL
scale. They argue that service quality is better predicted by perceptions of actual service
received only, and not as the difference between perceptions and expectations as
suggested by Parasuraman et al. (1988). Experiences are measured over a range of
attributes that were developed to describe the service as conclusively as possible.
Although Cronin and Taylor (1992) do not disagree with the definitions of service quality
that is regarded as the difference between expectations and the perceptions of customers,
they do differ in the way the perceptions of such services are measured. They maintain
that performance, instead of “performance-expectation” determines service quality and
further, they reason that customer expectations are built into the performance and thus it is
not necessary to measure it separately (Kelkar, 2010:424).
Carrillat et al. (2007:473) state that both SERVQUAL and SERVPERF received an equal
amount of citations during the last several years. Nevertheless, although SERVPERF
gained popularity, it has not reduced SERVQUAL’s usage among researchers. In their
study Carrillat et al. (2007:485) found that both SERVQUAL and SERVPERF scales are
adequate and equally valid predictors of overall service quality, although they do admit that
the SERVQUAL scale would have greater interest for practitioners. Andronikidis and
Bellou (2010:579) found that SERVPERF is both theoretically and empirically superior to
SERVQUAL. Jain and Gupta (2004) concur with this finding. In their study in the fast food
restaurant industry in India, they found that SERVPERF is capable of providing a more
convergent and discriminant valid explanation of the service quality construct. They also
found that it is the most economical measure of service quality and, is capable of
explaining a greater proportion of variance present in the overall service quality measured
through a single scale (Jain & Gupta, 2004:34). They also agree with Carrillat et al.
(2007:485) that SERVQUAL possesses superior diagnostic power to pinpoint areas for
managerial intervention. Pérez, Abad, Carrillo and Fernández (2007) have adapted the
SERVPERF scale to the context of public transport and, demonstrated that their
dimensions of SERVPERF (four original dimensions and one new one) were suitable for
their study. Several other researchers have also preferred the SERVPERF scale in a
variety of studies, namely Andaleeb and Conway (2006) in the restaurant industry,
17
Olorunniwo et al. (2006) in the service factory and Qin et al. (2010) in the fast food
restaurant industry. On the other hand, critics of this model state that SERVPERF is much
more industry-specific, thus posing limitations on its application in a wide variety of service
industries (Bahnan, Coleman & Kelkar, 2007; Cunningham, Young & Lee, 2004). Although
SERVPERF has not reached the same level of popularity that exists for SERVQUAL, it
has been proven to be a reliable instrument for the measuring of perceptions of service
quality. It is especially appealing for this research study because it is easier to administer,
easier to analyse the data and is more economical.
Another model that is important to mention and is applicable for this research study is the
FAIRSERV model of Carr (2007). Carr (2007:108) feels that an important deficiency of
SERVQUAL and SERVPERF is that it does not include equity theory as the basis for any
of its scales, even if it is clear from previous experience that equity (fairness) is often
evaluated in service encounters. According to Carr (2007:108), service customers are
concerned with getting what they deserve in relation to other customers of the same
service. Customers will therefore not only evaluate the quality of the service encounter, but
also the equity thereof. FAIRSERV posits that an important set of service evaluations
results from a comparison of services against norms of fairness and the treatment of
similar customers (Carr, 2007:108). Service customers also want the procedures used, the
distribution of service resources to be unbiased and consistently applied and, not unduly
favouring any one person or group.
FAIRSERV is proposed by Carr (2007) as an addition to the SERVQUAL/SERVPERF
conceptualisation of customer reactions to services. Carr’s (2007) model posits that one
essential perspective governing customer reactions to services is an evaluation of the
fairness of the service outcomes, procedures and interactions. According to Carr
(2007:110), customers therefore do not only evaluate services against the five
SERVQUAL/SERVPERF dimensions (tangibles, reliability, responsiveness, assurance and
empathy), but also through comparisons with multidimensional norms of fairness
(distributive, procedural, interpersonal, informational and systemic fairness). Customers
will base their comparisons in context to their knowledge of how others were actually
treated by the service providers and through counterfactual reasoning based upon a
mental simulation of how similarly others probably would, could and should be treated by
18
their service providers. Although a customer may feel that the service was of high quality,
he/she may feel cheated if the service is compared with what another customer may have
received. This will affect satisfaction with the service received (Carr, 2007:110).
FAIRSERV, as a whole, may not be suitable for this study, due to its focus on satisfaction
and repatronage intensions. It would most probably be important to pay attention to the
fairness dimensions because, small business tenants in shopping centres often
experience perceived unfairness when it comes to the treatment and services provided by
the landlords to them as compared to those received by bigger anchor tenants.
1.3 LITERATURE REVIEW
As this ex post facto study probes the service quality that small business tenants receive
from landlords in shopping centres, the focus of the literature review is on the service
quality that landlords in shopping centres render to their small business tenants. This
necessitates an understanding of services and quality in general, the service quality, the
different models of measuring service quality and the relationship between landlords and
small business tenants in shopping centres.
The literature review on these focus areas will assist the researcher to gain a better insight
into the research problem. It will evaluate various models for the measuring of service
quality. It will entail a review of existing published research for South Africa and the rest of
the developed and the developing world. The information acquired will also assist in
compiling the research questionnaire.
To proceed, the literature review assists in determining the understanding of the concepts
“services and quality”, “service quality” and “small business tenants in shopping centres”.
Although these constructs are discussed in detail in the body of the thesis (Chapters 2 - 4),
it is important from the onset to understand a brief understanding of these concepts in
context and in relationship with each other. It is firstly necessary to distinguish between the
concepts of service quality and customer satisfaction. Traditionally, service quality and
customer satisfaction were viewed as equivalent constructs but, today there is some
19
degree of consensus among scholars that they are indeed distinct (Al-Hawari & Ward,
2006:131; Anandanatarajan, Sritharan & Kumar, 2006:87; Bateson & Hoffman, 2011:325;
Berry, Parasaburaman & Zeithaml, 1988; Fisk, Grove & John, 2008; Homburg, Koschate &
Hoyer, 2006; Kasper et al., 2006:182; Parasuraman, Zeithaml & Berry, 1994).
Perceived service quality is defined by Parasuraman et al. (1988:16) as a global
judgement, or attitude, relating to the superiority of the service and, by Zeithaml (1988:3)
as the customer’s assessment of the overall excellence or superiority of the service.
Customer satisfaction is defined as the comparison between customer expectations and
perceptions regarding the actual service encounter (Bateson & Hoffman, 2011:295;
Kasper et al., 2006:105). Both of the definitions are based on the so-called
“disconfirmation approach”. It has however, been suggested that customer satisfaction is a
far broader concept than service quality and, there is empirical evidence that perceived
service quality leads to satisfaction (Al-Hawari & Ward, 2006:140; Cristobal, Flavián &
Guinalíu, 2007:332; Dabholkar & Overby, 2005:23; Dagger & Sweeney, 2006:6; Fisk et al.,
2008:155).
The concept of a service has changed considerably during the last thirty years. The most
recent belief is that there is an important interdependence between goods and services
where, some services may require physical goods to support and facilitate the delivery
system and, some physical goods may have intangible aspects. There is a lively debate in
the literature about the differences between goods and services, but several scholars like
Akehurst (2008), Araujo and Spring (2006), Vargo and Lusch (2004b) and Ward and
Graves (2007) are of the opinion that the differences between goods and services became
increasingly blurred. They regard it as out of date, unproductive, distracting and irrelevant.
In the early seventies Levitt (1972) insisted that there are no such things as service
industries, only industries whose service components are greater or less than those other
industries. Today, Vargo and Lusch (2004a:5) emphasise the importance of service
businesses by, maintaining that services becomes the unifying purpose of any business
relationship – a service-dominant, rather than a goods-dominant environment.
Grönroos (1984) was amongst the first scholars that called for conceptual models of
service quality in order to understand the concept of service quality better. Several

20
industry-specific scales and models of service quality have been published in the literature
during the past 15 years. These models are discussed in more detail in Chapter 3.
Small businesses are very important for a country’s economy. They play an important role
in the economic and social development of countries (Craig, Jackson & Thomson,
2007:117; Crosby et al., 2006:164; Nieman & Niewenhuizen, 2009:12; Wickham,
2006:39). The correct location for small businesses can contribute to their success and,
many consider shopping centres as a good location for their businesses. The landlords
however, have a huge impact on small business tenants’ success in shopping centres. A
shopping centre can be defined as “a group of retail and other commercial establishments
that is planned, developed, owned and managed as a single property, with on-site parking
provided” (Berman & Evans, 2010:280; Goedken, 2006:80; Levy & Weitz, 2009:199; Pitt &
Musa, 2009:40). The types of shopping centres from a South African perspective are small
free standing and convenience centres, neighbourhood centres, community centres, small
regional shopping centres, regional centres, super regional centres, lifestyle centres and
strip centres.
These centres are built by developers and are sold to the institutional investment
community. The main focus is therefore, for investors to maximise profit by leasing out
space in these shopping centres. It is, however, also the responsibility of the owners
(landlords) to ensure the success of shopping centres by managing the facilities and
tenant mix. The most important factor to ensure the success of shopping centres, is the
managing of the tenant mix. Tenant mix refers to “having a variety of stores that work well
together to enhance the performance of the entire centre, as well as performing
successfully as individual businesses” (Greenspan, 1987:29). The tenants in shopping
centres can be categorised into traffic attractors (anchor tenants) and traffic users (smaller
independent tenants) (Konishi & Sandfort, 2003:413; Levy & Weitz, 2009:200; Mirel,
2008:29; Pitt & Musa, 2009:44). Landlords are well aware of the fact that the realisation of
a maximum return on their investment requires the presence of a major anchor tenant. For
this reason, landlords often favour these stores and, small business tenants have to pay a
much higher leasing fee than these anchors. For the success of the shopping centre and
the individual tenants, it is important that there is a good relationship between the landlord
and the tenants.
21
1.4 THE RESEARCH PROBLEM
From the background of the study, it is clear that small business tenants in shopping
centres experience difficulties regarding several issues relating to the service quality they
receive from their landlords. The literature study deals with these difficulties and service
quality in general. The research problem deals with the measurement of service quality in
the landlord-small business tenant relationship in shopping centres and, the decision
whether the five service quality dimensions of SERVPERF and the one dimension of
FAIRSERV as service quality measurement instruments can be used to do this. While the
research problem is discussed in more detail in Chapter 5, the study sought to address the
following research questions:
• Are small business tenants in shopping centres generally satisfied with the quality of
service they receive from landlords?
• Are the combined SERVPERF and FAIRSERV service quality models, in its original
form, suitable for measuring the perceived service quality that small business tenants
in shopping centres receive from their landlords?
• Are there any significant differences regarding the perception of service quality
provided by landlords to small business tenants depending on their position in the
business?
• Are there any significant differences regarding the perception of service quality
received between small business tenants who have been a tenant in the centre for a
short time and those who have been a tenant for long?
• Are there any significant differences regarding the perceived service quality received
between small business tenants who have been a tenant in other shopping centres
before and those who have never been a tenant in other shopping centres before?
• Are there any significant differences regarding the perceived service quality received
between small business tenants who had no or little business experience prior to
leasing in the shopping centre and those who had business experience?
• Are there any significant differences regarding the perception of service quality
received by small business tenants, between landlords of different types of shopping
centres in Pretoria?

22
1.5 PURPOSE OF THE STUDY
The purpose of this study is to investigate whether small businesses in shopping centres
are satisfied with the service quality they receive from landlords and, to determine whether
the combined SERVPERF and FAIRSERV model of service quality, in its original form, will
be suitable to measure the service quality in a landlord-small business relationship in
shopping centres.
1.6 RESEARCH OBJECTIVES
The primary and secondary objectives are presented here to illustrate and guide the
direction of the research.
1.6.1 Primary objective
The primary objective of the study is to measure the perceived service quality that small
business tenants in shopping centres receive from landlords.
1.6.2 Secondary objectives
The secondary objectives of the study are to:
• Determine whether the combined SERVPERF and FAIRSERV model of service
quality, in its original form, will be suitable to measure the perceived service quality
that small business tenants in shopping centres receive from landlords.
• Determine whether there are any significant differences regarding the perceived
service quality provided by landlords to small business tenants depending on their
position in the business.
• Determine whether there are any significant differences regarding the perception of
service quality received between small business tenants who have been in the centre
for a short time and those who have been in the centre for long.

23
• Determine whether there are any significant differences regarding the perceived
service quality received between small business tenants who have been a tenant in
other shopping centres before and those who have never been a tenant in other
shopping centres before.
• Determine whether there are any significant differences regarding the perceived
service quality received between small business tenants who had no or little business
experience prior to leasing in the shopping centre and those who had business
experience.
• Determine whether there are any significant differences regarding the perception of
service quality received by small business tenants, between landlords of different
types of shopping centres in Pretoria.
1.7 HYPOTHESES
From the research objectives, the following hypotheses were formulated:
• H1o (Null hypothesis): Small business tenants in shopping centres are in general
not satisfied with the service quality that they receive from landlords.
• H1a (Alternative hypothesis): Small business tenants in shopping centres are in
general satisfied with the service quality that they receive from landlords.
• H2o: The combined SERVPERF and FAIRSERV models of service quality, in its
original form, will not be suitable to measure the perceived service quality that small
business tenants in shopping centres receive from their landlords.
• H2a: The combined SERVPERF and FAIRSERV models of service quality, in its
original form, will be reliable to measure the perceived service quality that small
business tenants in shopping centres receive from their landlords.
• H3o: There are significant differences regarding the perceived service quality that
small business tenants have of the landlords’ service to them, irrespective of what the
position of the respondent in the business is.
24
• H3a: There are no significant differences regarding the perceived service quality
that small business tenants have of the landlords’ service to them, irrespective of
what the position of the respondent in the business is.
• H4o: There are no significant differences regarding the perception of service
quality received between small business tenants who have been a tenant in the
centre for a short time and those who have been a tenant for long.
• H4a: There are significant differences regarding the perception of service quality
received between small business tenants who have been a tenant in the centre for a
short time and those who have been in the centre for long.
• H5o: There are no significant differences regarding the perceived service quality
received between small business tenants who have been a tenant in other shopping
centres before and those who have never been a tenant in other shopping centres
before.
• H5a: There are significant differences regarding the perceived service quality
received between small business tenants who have been a tenant in other shopping
centres before and those who have never been a tenant in other shopping centres
before.
• H6o: There are no significant differences regarding the perceived service quality
received between small business tenants who had no or little business experience
prior to leasing in the shopping centre and those who had business experience.
• H6a: There are significant differences regarding the perceived service quality
received between small business tenants who had no or little business experience
prior to leasing in the shopping centre and those who had business experience.
• H7o: There are no significant differences, regarding the perception of service
quality of small business tenants between landlords of different types of shopping
centres in Pretoria.
25
• H7a: There are significant differences regarding the perception of service quality
of small business tenants between landlords of different types of shopping centres in
Pretoria.
1.8 RESARCH METHODOLOGY
The study consists of a literature review and an empirical study. The literature review aims
to review the background of service quality, the available measuring models of service
quality and the relationship between small business tenants in shopping centres and their
landlords. It will provide an insight and understanding into the research problem as well as
the necessary background to guide the empirical part of the study.
The empirical part of the study will focus on the measuring of service quality that small
business tenants in shopping centres receive from their landlords. This research study is
designed as a formal study. The objective of a formal research design is to test the
hypotheses or answer the research questions posed (Cooper & Schindler, 2006:140).
1.8.1 Sample selection and size
For the selection of the target group out of the population, it is important to describe the
deciding elements that determined the profile of the selected target group. The
determining factors that were taken into consideration when the sample was selected are
known as the sampling frame and include the following:
• owner of the small business;
• manager of the small business;
• both owner and manager of the small business; and
• the full time employee that directly deals with the landlord or centre manager.
The sample of the study consists of 457 small business tenants. The sample includes
respondents from 27 different shopping centres throughout Pretoria, South Africa. Of these
457 respondents, 109 are the owner of the small business, 270 are the manager, 50 are
both owner and manager and 28 are full time employees of the small business.

26
1.8.2 Design of the study
As already mentioned, this study will be based on a formal research study. The empirical
study will consist of quantitative research in which a questionnaire (Appendix B) will be
used to obtain information from respondents. The questionnaire will be given to small
business tenants in shopping centres in Pretoria, South Africa.
1.9 IMPORTANCE AND BENEFITS OF THE STUDY
From a theoretical perspective, the study makes the following valuable contribution to the
existing body of knowledge on service quality and, in particular, the measuring of service
quality in a landlord-small business tenant relationship in shopping centres. Numerous
researchers investigated the viability and reliability of several service quality models as a
service quality measure in a number of different service industries, but none has focused
on the specific area of the landlord-small business tenant relationship in shopping centres.
This study addresses this issue. It is suggested by many researchers that studies should
be done to further examine the transferability of these available models to other service
industries (Gaur & Agrawal, 2006; Kang, James & Alexandris, 2002; Ramsaran-Fowdar,
2007). This study also makes a valuable contribution to the existing body of knowledge on
small businesses in general and in particular the relationship between the landlord and the
small business tenant in shopping centres.
From a practical perspective, the study makes the following valuable contributions: Firstly,
the study provides landlords/shopping centre managers with a model that is reliable as a
tool to measure perceived service quality specifically between landlords and small tenants
in shopping centres. These findings can be used by landlords to address possible
shortcomings in their quality service offered to small business tenants. The findings of this
study can also be provided to landlords to make them aware of the special needs that
small businesses in shopping centres have. This is important as, it was indicated in the
background section, landlords as property managers, are being subjected more and more
to increased competitive pressures in the economy. Lastly, tenants can use the findings of
the study to evaluate the shopping centre, prior to entering in the lease agreement.

27
1.10 STRUCTURE OF THE STUDY
The study was done in such a way that it follows a logical progression to build up to the
specific research problem and objectives. The research starts with a thorough and broad
literature review based on service quality, and small business tenants in shopping centres
in general. The rest of the literature review is broken down into specific topics such as:
services and an introduction to quality, service quality and lastly, a discussion on small
business tenants in shopping centres. The research methodology and findings will then be
discussed and finally, the conclusion and recommendations will conclude the study.
Chapter 1: Introduction and background of the study
This chapter introduces and gives the background of the study. The importance and
purpose of the study are discussed and the research problem is defined. The objectives
and hypotheses are clearly stated to guide the flow of the research. In this chapter, the
research design and a description of the benefits that this study will be presented to the
reader, landlords and small business tenants in shopping centres will be given.
Chapter 2: Services and an introduction to quality
Chapter 2 explores the literature on services and quality. The difference between service
quality and customer satisfaction is first discussed in order for the research to be based on
the correct measurement construct. The differences between goods and services are
analysed with special reference to the characteristics of services, the possible influence of
these characteristics on the measurement of service quality and the criticism in the
literature on each of these characteristics. An attempt is also made to get a better
understanding of the concept of quality. This is done from the viewpoint of the various
approaches used by various researchers. The chapter concludes with deciding on a
suitable quality approach for this study.

28
Chapter 3: Service quality
The main focus of this chapter is on the several service quality measurement models
suggested by several researchers. The concept of perceived quality is first discussed after
which the concept of service quality is defined. The chapter is concluded by deciding on an
appropriate service quality measurement tool for the measuring of service quality that
small business tenants in shopping centres receive from their landlords.
Chapter 4: Small business tenants in shopping centres
Chapter 4 focuses on small business tenants in shopping centres. The first section
focuses on shopping centres as a retail location option for small businesses. After that, the
various types of shopping centres from a South African perspective are discussed.
Shopping centres as investments, shopping centre management, the importance of tenant
mix and, the landlord-tenant relationship is also explored further in this chapter. The
definition of a small business is given and the chapter concludes with emphasising the
difficulties that small business tenants are faced with when dealing with landlords,
especially in comparison to big anchor tenants.
Chapter 5: Research design and methodology of the study
The research problem, objectives and hypotheses, as well as means of testing the
hypotheses are presented in this chapter. The chapter discusses the research design and
methodology in more detail, outlining the specific methods used to gather the empirical
information. The reliability and validity of the study are also looked at in this chapter, as
well as the design of the questionnaire to collect data. Lastly, the data processing and
analyses are explained by means of the statistical techniques of factor analysis, Cronbach
alpha coefficient, One Way Analysis of Variance (ANOVA) and Post-Hoc tests using least
square means t-tests.

29
Chapter 6: Research findings
This chapter highlights the business demographical data, the personal demographical data
of the respondents as well as other descriptive statistics. The chapter then presents all the
research findings obtained by means of descriptive research, reliability tests, factor
analysis, ANOVA and Post hoc tests using least square means t-tests. The results of this
empirical study are provided in tabular format and by means of figures and tables.
Chapter 7: Discussions, conclusions and recommendations
Chapter 7 summarises the study and its findings. The research objectives, research
questions and hypotheses are revisited and the limitations of the study, contributions to the
science and areas for further research are presented. A summary of the literature review is
also given.
1.11 ABBREVIATIONS
The following abbreviations are used in this study:
ANOVA One Way Analysis of Variance
Eg. For example
Etc. Etcetera
GDP Gross domestic product
Ha Hectare
Ltd. Limited
m2 Square metres
ROI Return on investment
USA United States of America
1.12 REFEENCING TECHNIQUE
The Harvard referencing technique is used in this study.

30
CHAPTER 2
SERVICES AND AN INTRODUCTION TO QUALITY
2.1 INTRODUCTION
The main objective of this research study is to determine the perceived service quality that
small business tenants in shopping centres have with regard to the service they receive
from their landlords. It is therefore important to decide on a service quality model that can
be used in order to reach this objective. Firstly it is important to distinguish between
service quality and satisfaction because it may seem as if these perceptions from tenants
can also be evaluated through the measurement of customer satisfaction. This chapter
therefore begins by distinguishing between service quality and customer satisfaction to
conceptualise the two constructs thoroughly in order for the research to be based on the
correct measurement construct. The concepts of services and quality will be discussed
next in order to enhance understanding of the inherent characteristics and problems of the
phenomena of services and quality. A critical evaluation of prior research regarding these
concepts will consequently be covered in this chapter. In chapter three, the construct
“service quality” will be discussed with special reference to several service quality models
available in the literature.
2.2 SERVICE QUALITY VERSUS CUSTOMER SATISFACTION
In an era of increased competition and, the service sector being the dominant sector in
world economy, it is apparent that companies would focus upon service quality and
customer satisfaction improvement issues in order to drive high levels of business
performance (Bitner & Brown, 2008:40; Kumar, Smart, Maddern & Maull, 2008:176;
Morgan & Rego, 2006:436). It is however, common to find unclear distinctions between
service quality and customer satisfaction in the literature (Bateson & Hoffman, 2011:325;
Tsoukatos & Rand, 2007:469) but Van Ossel, Stremersch and Gemmel (2003:124) believe
31
that it is an important distinction to make. The distinction is also important for Cronin and
Taylor (1992:56) as they state that it is important for service providers to know “whether
their objective should be to have consumers who are ‘satisfied’ with their performance or
to deliver the maximum level of ‘perceived service quality’”. Many researchers have
traditionally viewed service quality and customer satisfaction as equivalent constructs
because of the considerable overlap between the two concepts, (Bansal & Taylor, 1997;
Hernon in Marx, 2005:10; Johnson & Gustafsson, 2000; Spreng & Singh, 1993). Today,
however, there is some degree of consensus among researchers that service quality and
customer satisfaction are distinctive constructs, although they do admit that the constructs
are related (Al-Hawari & Ward, 2006:131; Anandanatarajan et al., 2006:87; Bateson &
Hoffman, 2011:325; Berry et al., 1988; Fisk et al., 2008; Homburg et al., 2006; Kasper et
al., 2006:182; Parasuraman et al., 1994).
Perceived service quality is defined by Parasuraman et al. (1988:16) as a global judgment,
or attitude, relating to the superiority of the service and by Zeithaml (1988:3) as the
customer’s assessment of the overall excellence or superiority of the service. In these
terms service quality means conforming to customer expectations and implies that
consumers compare their expectations with their perceptions of actual service
performance (Parasuraman, Zeithaml & Berry, 1985:42). This is the so-called
“disconfirmation approach”. The most popular definition of customer satisfaction in the
literature is also based on this disconfirmation approach where customer satisfaction is
said to be a comparison of customer expectations to perceptions regarding the actual
service encounter (Bateson & Hoffman, 2011:295; Kasper et al., 2006:105). In other
words, if customer perceptions meet expectations, the expectations are viewed to be
confirmed and the customer is satisfied. On the other hand, if customers’ perceptions and
expectations are not equivalent, then the expectation is viewed to be disconfirmed and the
customer will not be satisfied.
It seems as if customer satisfaction definitions are also made from the perspective of
mainly two schools of thought. The first is where customer satisfaction is viewed as an
outcome resulting from a post-consumption evaluation containing both cognitive and
affective (emotional) elements (Churchill & Suprenant, 1982:492). This is called the
transaction-specific approach by Wang, Lo & Yang (2004:328). This approach is also
32
called the cumulative approach which is argued as being more fundamental and useful in
the service environment as consumption is an experience and consists of collective
perceptual, evaluative and psychological processes that, in combination, generate
customer satisfaction (Bassi & Guido, 2006:78; Boshof & Gray, 2004:28; Jamali,
2007:372; Pantouvakis, 2010:368; Wang et al., 2004:328). Schneider and White (2004:51-
53) suggest that service quality is descriptive and based on fact (in other words, it is a
consumer’s judgement about the service itself), while satisfaction is more evaluative and
based on emotion (in other words, it is more of a judgement of how the service affects the
consumer emotionally). Zhang, Lam and Chow (2009: 71) concur with this by stating that
most definitions of satisfaction would involve an evaluative, affective or emotional
response. There seems to be general consensus today though, that both cognition and
affect significantly predict satisfaction judgements (Homburg et al., 2006). Kasper et al.
(2006:182) note that it is important to bear in mind that a customer can have perceptions
of service quality without having actually experienced the service, whereas a customer has
to experience a service to make a judgement on satisfaction. A customer can for instance
perceive a service to be of high quality because of advertisements or positive word of
mouth communications, but cannot claim high satisfaction of that service without
experiencing it.
Due to the general acceptance in the literature (as mentioned above) that service quality
and satisfaction are two distinct constructs, it is also suggested that customer satisfaction
should be measured separately from service quality (Dabholkar, Shepherd & Thorpe,
2000:166). However, both constructs can usually be measured by making use of the so-
called gap approach, or disconfirmation approach, in other words, the difference between
perceptions and expectations. It is however important to note that different definitions of
expectations exist for service quality and customer satisfaction. In relation to service
quality, expectations are regarded as desires or “wants” of customers, that is, what
customers feel a service provider should offer them, rather than what a service provider
would offer them (Bateson & Hoffman, 2011:333-334; Parasuraman, Zeithaml & Berry,
1986:6). Customer satisfaction, on the other hand, is believed to result from a comparison
between what did happen in a service encounter and what customers predicted would
happen (Bateson & Hoffman, 2011:313; Bitner, 1990:70; Parasuraman et al., 1986:6). As
consumers are unsure of what to expect, their expectation in a satisfaction context

33
represents a prediction and will be expressed by a mean expectation value, with a degree
of uncertainty surrounding the mean. Since, in contrast, consumers’ expectations in a
service quality context represent what they desire, it can be regarded as a distinct value
with little or no uncertainty relating to it (Parasuraman et al., 1986:6). It appears as if a
higher standard of service delivery is measured by service quality measures than what is
the case with customer satisfaction (Bateson & Hoffman, 2011:334).
It has been suggested that customer satisfaction is a far broader concept than service
quality and initially it was argued that repeated incidents of satisfaction over time will lead
to a perception of service quality (Bitner, 1990:70; Bolton & Drew, 1991:2; Oliver, 1981:26;
Parasuraman et al., 1988:16). There is however, empirical evidence that the opposite is in
fact true and that perceived service quality leads to satisfaction (Al-Hawari & Ward,
2006:140; Cristobal et al., 2007:332; Dabholkar & Overby, 2005:23; Dagger & Sweeney,
2006:6; Fisk et al., 2008:155; Gounaris, Dimitriadis & Stathakopoulos, 2010:150; Hume,
2008:349; Kasper et al., 2006:105; Lundahl, Vegholm & Silver, 2009:588; Maddern, Maull,
Smart & Baker, 2007:1013; Pantouvakis & Lymperopoulos, 2008:623; Pollack, 2008:537,
Pollack, 2009:46; Solvang, 2007:120; Zhang et al., 2009:81).
The positive outcomes of high service quality do not end with customer satisfaction.
According to Fisk et al. (2008:153), service quality creates a chain reaction with regard to
customer satisfaction and customer loyalty to establish enduring relationships with service
firms. This interaction starts with high service quality. This will lead to high levels of
customer satisfaction and in turn to stronger links between the customer and the service
provider. The satisfied customers will then be loyal toward the service provider and form
strong relationships with them (An & Noh, 2009; Carrillat et al., 2009; Cristobal et al., 2007;
Dagger & Sweeney, 2006; Fisk et al., 2008; Gounaris et al., 2010; Shukla, 2010; Solvang,
2007). Service providers will then be in a better position to render high quality service to
these loyal customers and in this way the service delivery link with the customer will be
strengthened even more (Fisk et al., 2008). The rationale will therefore be that this notion
also holds true for the relationship between the shopping centre landlord and the small
business tenant. If the small business tenant experiences high perceived service quality
from the landlord, they will be more likely to remain at the location and the landlord can
save capital on marketing and related costs to fill the vacancy again.

34
The chain of connections that links service customers and the service provider by their
actions and reactions is illustrated in Figure 2.1.
Figure 2.1: The service quality cycle
Source: Fisk et al. (2008:154)
As illustrated in Figure 2.1 the customer and the service provider are connected by three
links, namely the service delivery link, the customer satisfaction link and the
customer-provider link (Fisk et al., 2008:154). The first link, the service delivery link,
represents the interactive character of the service and is reinforced through satisfying
service encounters. The connection between the customer’s satisfaction level and degree
of loyalty to the service provider is represented by the customer satisfaction link. The
customer-provider link represents the mutually rewarding relationship between the
Service Provider Wheel
Customer Commitment to Process
Improvement
Service Offering Improve-
ments
Attribute and
Encounter Satisfaction
Overall Service Quality
Perceptions
Customer
Satisfaction
Customer
Relationship
Customer
Loyalty
Word of Mouth
Service Customer Wheel
Customer Satisfaction
Link
Customer- Provider Link
Service Delivery Link
Service Encounter Wheel

35
customer and the service provider, which gives way to the customer’s commitment to that
service provider. Activities that fall into the three domains, or wheels, representing the
domains of the customer, the provider and the service encounter, are connected by these
links. The three wheels connected by the three links, form the service quality cycle. Fisk et
al. (2008:155) use the term cycle to emphasise that service quality involves important links
between the service business and the customer in a recurring series of activities.
Many recent empirical studies have found a positive relationship between the constructs of
service quality, customer satisfaction and behavioural intentions in a variety of industries
and cultures. These include studies of the performing arts in the USA (Akhter, 2010), in e-
markets in the USA (Anderson & Swaminathan, 2011), in e-shopping in Greece (Gounaris
et al., 2010), the performing arts in Australia (Hume, 2008), the audit industry in Malaysia
(Ismail, Haron, Ibrahim & Isa, 2006), the hospitality industry in Canada (Ladhari, 2009b), in
a variety of services contexts (Ng, David & Dagger, 2011), the lodging industry in the USA
(Olorunniwo et al., 2006), in a hairdressing and phone service company in the USA
(Pollock, 2009), the low cost airline industry in Thailand (Saha & Theingi, 2009), the retail
industry in Norway (Solvang, 2007) and the banking sector in Australia (Yap & Sweeney,
2007). According to Fornell, Mithas, Morgeson III and Krishnan (2006:4), both marketing
and neoclassical economics view customer satisfaction (and by implication service quality
as the antecedent of customer satisfaction) as the real standard for economic growth.
Several studies have indeed found a relationship between customer satisfaction and
higher stock prices (Aksoy, Cooil, Groening, Keiningham & Yalçin, 2008; Fornell et al.,
2006; Tuli & Bharadwaj, 2009; Wiles, 2007), between customer satisfaction and financial
performance of businesses (Al-Hawari & Ward, 2006; Yoo & Park, 2007) and between
service quality and business success in general (Kersten & Koch, 2010; Morgan & Rego,
2006).
Another view with regards to the causal relationship between perceived service quality and
satisfaction is that of Dabholkar and Overby (2005:14), where it is suggested that this
relationship is situation-specific and therefore depends on the context of the service
encounter. This contingency approach implies that factors such as the nature of the
service experience and the customers’ rational predispositions will impact the causal
36
sequence of service quality and satisfaction. This view is supported by Kueh (2006),
Ladhari (2009b), Pollack (2008) and Solvang (2007).
The mediating role that customer satisfaction plays in the relationship between service
quality and behavioural intentions is confirmed by several of the research studies
mentioned above. This research though, will concentrate on service quality as the spark
that ignites the chain reaction towards customer satisfaction and positive behavioural
intentions from the small business tenants as the customers. High service quality is thus
viewed as the most important aspect that needs investigation in the relationship between
landlords and small business tenants in shopping centres.
2.3 SERVICES
2.3.1 Meaning of services
The concept of a service has changed considerably during the last thirty years. Initially, it
was argued that a service can be defined by emphasising the differences between goods
and services by referring to the characteristics of services. The early debate about the
differences between services and goods tended to encourage the notion that services and
physical goods are an either-or dichotomy (Fisk et al., 2008:6). Although the distinction
between pure goods and pure services is not always very clear, (Bateson & Hoffman,
2011:4), they are not distinct. There is an important interdependence between services
and goods, where some services may require physical goods to support and facilitate the
delivery system and some physical goods may have intangible aspects. Services are
being arrayed on a continuum of intangibility, with pure services (which have no tangible
component) at the one extreme of the continuum, and pure goods (which have no
intangible component) at the other extreme (Shostack, 1977:74). Since several services
have both tangible and intangible elements, those services will fall between the two
extremes of the continuum (Bateson & Hoffman, 2011:5; Fisk et al., 2008:6; Lovelock &
Wirtz, 2011:15; Schneider & White, 2004:7). Services offered by landlords to their tenants
probably are a good example of a service that fall between the two extremes of the
intangibility continuum. Landlords supply a tenant with a physical leasing space (tangible

37
element) to do business in and they are responsible for shopping centre advertising and
promotion campaigns (intangible element).
The distinction between services and goods was useful in early services research in order
to identify the unique characteristics of services and to establish services as an area of
study separate from manufacturing (Akehurst, 2008:4, Corrêa, Ellram, Scavarda &
Cooper, 2007:446). Today, the debate about the differences between goods and services
has become increasingly blurred and in many ways is out of date, unproductive, distracting
and irrelevant (Akehurst, 2008:4; Araujo & Spring, 2006:803; Corrêa et al., 2007:445;
Vargo & Lusch, 2004b:326; Ward & Graves, 2007:463). As early as the early seventies,
Levitt (1972:41) insisted that there are no such things as service industries, only industries
whose service components are greater or less than those other industries. Although
Greenfield (2002:20) accepts the notion of a distinction between goods and services, he
feels that it should be emphasised that the two concepts are intimately related and that
they are in fact, interdependent. He emphasised that the demand for many services
cannot be met without the existence and availability of many physical goods. It can
therefore be argued, for instance, that, in the present research study, the physical
shopping centre building first have to be constructed and made available to the tenants
before the landlord can offer certain services to the tenants.
More and more traditionally manufacturing companies today are also realising that
services can have the potential for ensuring financial, strategic and marketing benefits and
as a result, start offering services in conjunction with their products (Araujo & Spring,
2006:802; Bjurklo, Edvardsson & Gebauer, 2009:493; Cohen, Agrawal & Agrawal,
2006:129; Godlevskaja, Van Iwaarden & Van der Wiele, 2011:62; Young, 2008:2).
Examples of companies that have experienced this are International Business Machines
(IBM), Hewlett-Packard, Xerox, Nokia, Johnson & Johnson Allegiance Corporation,
General Motors and General Electric. (Corrêa et al., 2007:447; Godlevskaja et al.,
2011:62; Young, 2008:1). Forty-one percent of IBM’s total 2003-revenue was for instance
generated from services. In 2006 and 2007 this was already 53,20 percent and 55,30
percent respectively. Gebauer, Krempl and Fleisch (2008:219) also argue that
manufacturing companies can extend to service business proceeds for better marketing
opportunities, better strategic opportunities and for better financial benefits. Corrêa et al.

38
(2007:449) add that customer satisfaction and customer loyalty can be increased if
services are provided to support goods. This emphasis from manufacturing to introducing
services has shifted to the extent that the manufactured products are now viewed by some
as incidental. (Ward & Graves, 2007:465).
Initially, this movement was termed “servitisation” by Vandermerwe and Rada (1988) and
is now, more than twenty years later, seen as a necessity for manufacturing businesses
(Cohen et al., 2006; Corrêa et al., 2007; Pawar, Beltagui & Riedel, 2009). Other terms
allocated to this movement is “total offerings” (Godlevskaja et al., 2011:68), “value
package” (Corrêa et al., 2007:445) and “bundle of resources” (Grönroos, 2006:326). This
“bundle of resources", in which the goods are nothing but one resource among others, are
viewed by Grönroos (2006:326) as important to support the customers’ processes so that
value is created in those processes. Corrêa et al. (2007:448) put it bluntly: “Services are
really what provides the value added to these companies, rather than the goods”. In a
groundbreaking article Vargo and Lusch (2004a:5) emphasise the importance of service in
business by maintaining that service becomes the unifying purpose of any business
relationship.- a service-dominant rather than a goods-dominant environment.
Consequently, goods are simply a means of rendering a service to the customer, or as
Hurwitz, Bloor, Kaufman and Halper (2009:8) put it, “in an increasingly interconnected
business world, everything is becoming a service”.
To define a service, is not an easy task. Grönroos (1988:10) admits that a service is a
complicated phenomenon. Lovelock and Wirtz (2011:15) believe that services are difficult
to define because of the fact that services cover a vast array of different and often very
complex activities. The word has in fact many meanings, ranging from a personal service
to a service as a product. Edvardsson, Gustafsson and Roos (2005:119) and Hurwitz et al.
(2009:8) suggest that the definitions of a service are changing constantly because of many
factors, such as changing competitive situations that affect customer value-in-use and also
rapid changes in technology. Moeller (2010:359) links on to this way of thinking and even
claims that the term “services” remains undefined. Grönroos (2006:323) also admits that
there is no universal definition for the concept “service” in the literature. Lovelock and Wirtz
(2011:15) feel however, strongly about the fact that services should be defined in their own
right and not in relation to goods.

39
In an attempt to get closer to a universally accepted definition of services, Edvardsson et
al. (2005) conducted a study where they consulted eleven experts in the field of service
quality and ask the question: “What definition do you think best captures what you
consider to be the essence of services?” Three of the experts suggest definitions like
“satisfying customer needs and wants”, “a performance meant to provide benefit” and “the
essence of service is the experience created for the customer” (Edvardsson et al.,
2005:111) .They point out that these definitions are more outcome-related. In other words,
they focus on the value that services create. The Nordic School on the other hand, view
services as “processes that consist of a set of activities which take place in interactions
between a customer and people, goods and other physical resources, systems and/or
infrastructures representing the service provider and possibly involving other customers,
which aim at solving customers’ problems” (Grönroos, 2006:323). This definition is based
on the service activity, in other words, what a service is. Lusch and Vargo’s (2011:1302)
and Vargo and Lusch’s (2004a:2; 2008:26) definition of a service is based on the so-called
value-in-use view: “the application of specialised competences (operant resources –
knowledge and skills), through deeds, processes, and performances for the benefit of
another entity or the entity itself”.
There are essentially two parts to this definition. Firstly service comprises activities, deeds,
processes and performances and secondly, it specifies that these activities provide the
benefits, or functions performed, for the beneficiary (Lusch & Vargo, 2011:1302). They
stress the importance of making use of the singular term “service” which reflects the
process of doing something beneficial for and in conjunction with some entity, rather than
the term “services” which they view as units of output (immaterial goods). According to this
more recent view in the literature, value is created when products, goods or services are
used by customers. Customers are in other words revealed as both producers and
consumers who determine what is of value (Ballantyne & Varey, 2008:12). Grönroos
(2006:323) believes that this view of the concept of service and value creation is likely to
become the accepted view amongst scholars. With their view of service Vargo and Lusch
(2004b:326) are suggesting that everything is a service and that economic exchange is
fundamentally about service provision. From this perspective, the concept of service

40
therefore becomes an inclusive term where neither goods nor services can be captured
through residual definitions.
The view with regard to this research study is that it is unnecessary and unproductive to
spend time on differentiating between goods and services. What is important though is that
any contact with or offering to customers must be done by bearing in mind that customers
deserve good quality. It also boils down to basic good manners and ethical behaviour on
the side of the service provider. What is important is not so much as to try and “delight” the
customer with every service encounter, but simply to make sure of consistently good
service, a personal relationship and to make it as easy as possible for customers to obtain
the service. This notion is supported by Dixon, Freeman and Toman (2010:119) and
Goodman (2008:33). All the arguments on service quality therefore, point to one emerging
fact, namely the customer has to be treated in a courteous and respectful way.
Many of the current textbooks and research articles however, still complement their
discussion of what services are by differentiating between goods and services by means of
the characteristics of services (Bateson & Hoffman, 2011; Chase, Jacobs & Aquilano,
2006; Evans & Lindsay, 2008; Fisk et al., 2008; Fitzsimmons & Fitzsimmons, 2006; Heizer
& Render, 2006; Hollensen, 2010; Kasper et al., 2006; Kotler & Armstrong, 2010; Lewis,
2009:234; Palmer, 2008; Tuzovic, 2009; Wilson et al., 2008; Young, 2008). Many
experienced businesses also suggest that a service business is different from a goods
business, although they do not know exactly how they differ (Young, 2008:73). It is
therefore considered to be still important to discuss these differences by means of the
unique characteristics of services.
2.3.2 Characteristics of services
As discussed in section 2.3.1 above, the underlying paradigm in services research since
the 1980s has been that services and goods are distinctly different from each other. For
more than three decades, the differences between goods and services have been
emphasised by four specific characteristics, namely intangibility, inseparability,
heterogeneity and perishability.

41
Later however, several criticisms on the four characteristics of services were voiced
(Araujo & Spring, 2006; Beaven & Scotti, 1990; Corrêa et al., 2007; Edvardsson et al.,
2005; Lovelock & Gummesson, 2004; Moeller, 2010; Vargo & Lusch, 2004b). Lovelock
and Gummesson (2004:32) come straight to the point and say that the notion that the four
characteristics make services uniquely different from goods is deeply flawed. They based
their statement on the fact that, according to them, the focus of the services field has
changed and that the development of information and communication technology has
advanced dramatically. Moeller (2010:359) agrees and also feel that there are more and
more changes in general conditions, especially in the development of technology. These
changes, according to Moeller (2010:359), are the reason why the applicability of most of
the four characteristics of services loses its impact. Moeller (2010:359) believes that the
inseparability of production and consumption and the perishability of production and
services can today be overcome by technology-based communications.
Vargo and Lusch (2004b:326) also add their voice and state that “the delineation of
characteristic differences between services and goods is also misleading, if not
counterproductive”. Edvardsson et al. (2005:113) state that these four widely accepted
characteristics are “neither based on empirical research in an inductive way, nor
developed from previous research and theories in a deductive way”. They suggest, that
the characteristics should not be generalised to all services, but that it should only be used
for the services when they are relevant and in situations where they are useful and fruitful
(Edvardsson et al., 2005:115). Corrêa’s et al. (2007:449) perspective is that, because of
the blurring of services and goods (discussed in 2.3.1), a new framework is needed for this
new environment. They suggest a new set of characteristics that will make it easier to
manage and understand the change from a goods-dominant to service-dominant
environment (discussed briefly in the next section together with the traditional
characteristics). Corrêa’s et al. (2007:452) stress though, that these characteristics are not
a way to differentiate services from goods, but rather a way to help managers design and
manage the delivery process.
In spite of the several criticisms in the literature, the four characteristics of services as
mentioned, remain a unifying theme for the service industry (Lovelock & Gummesson,
2004:25). The four essential characteristics of services will subsequently be discussed.
42
2.3.2.1 Intangibility
There is no doubt that intangibility is the most fundamental and most frequently mentioned
of the various characteristics of a service (Bateson & Hoffman, 2011:57; Fisk et al.,
2008:7; Kasper et al., 2006:57; Schneider & White, 2004:6; Zeithaml, Parasuraman &
Berry, 1985:33). This characteristic in essence means that services are activities and not
physical objects. In most cases services cannot be seen, touched, tasted, held, felt or
stored (Bateson & Hoffman, 2011:57; Fisk et al., 2008:8; Hollensen, 2010:394; Kotler &
Armstrong, 2010:269; La, Patterson & Styles, 2005:380; Wilson et al., 2008:16; Young,
2008:73). According to Bateson and Hoffman (2011:57), intangibility is the basic
characteristic of services from which all other differences emerge. Bateson and Hoffman
(2011:57) further make a distinction between physical intangibility, that which cannot be
touched, and mental intangibility, that which cannot be mentally grasped. Bielen and
Sempels (in Edvardsson et al., 2005:114) support this conceptualisation by an empirical
study. Fisk et al. (2008:8) and La et al. (2005:380) point out though, that services are not
merely an “intangible product” but a state of being and that an experience, performance,
time, process or some form of intellectual property cannot be purchased by a customer but
they can still get value out of this intangibility.
Many services are entirely nonexistent before they are bought and cannot be easily
examined or evaluated by consumers prior to purchase (Fisk et al., 2008:8; Sichtmann,
Von Selasinsky & Diamantopoulos, 2011:3). This makes it difficult for customers to predict
the experiential aspects of a service and for service providers to provide customers with a
clear pre-purchase understanding of what they might be buying (Edvardsson, Enquist &
Johnston, 2010:312; Kasper et al., 96; Kotler & Armstrong, 2010:269; Wilson et al.,
2008:16; Young, 2008:74). It is presumed that the more intangible the choice for a
consumer, the more likely they will be to perceive it as being riskier and more difficult to
evaluate (Fisk et al., 2008:8; Kasper et al., 2006:58; La et al., 2005:380; Laroche,
Nepomuceno & Richard, 2010:206).
43
It will therefore be necessary for service firms to make the service offering more tangible
and often the quality of a service will then be evaluated based on these tangible cues. One
method to do this is the use of physical evidence or tangible cues (or “signals”) such as
physical surroundings and employee responses (Bateson & Hoffman, 2011:60; Dean &
Lang, 2008:48; Fisk et al., 2008:8; Kotler & Armstrong, 2010:269; La et al., 2005:380;
Laroche et al., 2010:207). In a landlord-tenant relationship in shopping centres for
instance, examples of cues can be the availability and willingness of the centre
management to listen to tenants’ needs, and the overall design and cleanliness of the
centre. This can prompt the tenants to associate the tangible cue, availability of the
personnel and a trendy, clean centre, with the intangible, the service.
Another way to deal with the intangibility of services is the relatively new approach of “test
driving” the service prior to purchase (Edvardsson et al., 2010:312). The “test drive” is
done to let the customer have some actual experience of the service they are offering,
such as cleaning one carpet for free before the client commits to the service of cleaning all
the carpets.
Often, customers that make use of services with a complicated technical or scientific
nature will not necessarily possess the knowledge to confidently evaluate the quality of the
advice they purchase (La et al., 2005:380; Wilson et al., 2008:16). It should also be borne
in mind that pure services are in essence processes that are more psychological
experiences than experiences of physical possessions (Schneider & White, 2004:6;
Young, 2008:74). It is therefore important to remember that it is not physical goods that
should be measured, but a psychological process. It is for this reason that the perceptions
of the users of the service are obtained, like for instance in the present research.
Schneider and White (2004:6) point out that researchers and practitioners should be
careful when analysing these results because, although the measurement might not be
completely accurate, it may be the best indication of the service quality obtainable from the
users of the service. It however appears as if there is not any empirical evidence, on an
ongoing basis, that goods are easier to evaluate than services (Lovelock & Gummesson,
2004:27).

44
Intangibility is not unique to services (Corrêa et al., 2007:447; Lovelock & Gummesson,
2004:26; Moeller, 2010:362; Vargo & Lusch, 2004b:328). There are numerous goods that
also possess elements of intangibility, such as foodstuffs, cosmetics and medicines, to
mention a few. A customer will often not know how the food will taste and if the cosmetics
and medicine will give promised results prior to purchasing and using it (Corrêa et al.,
2007:447; Lovelock & Gummesson, 2004:26; Moeller, 2010:362; Vargo & Lusch,
2004b:328). Yet many services that involve tangible elements can be evaluated before
use. The core product in the relationship between landlords and small business tenants for
instance, is the available space for lease. A tenant can look over the space for lease as
well as the look and feel of the shopping centre and even how busy the centre is at a given
time, prior to signing the leasing contract. It can therefore be concluded that intangibility is
not a universally applicable characteristic of all services during all stages from pre-
purchase through delivery, consumption and output (Corrêa et al., 2007:447; Edvardsson
et al., 2005:115; Lovelock & Gummesson, 2004:26; Moeller, 2010:362; Vargo & Lusch,
2004b:328).
Corrêa et al. (2007:450-451) suggest that intangibility be changed to “degree of ease in
performance assessment”. It has been suggested that the characteristic of intangibility
makes it difficult to measure service quality. Corrêa et al. (2007) argue that it is not the
tangibility or intangibility that drives the measurement issue, but the degree of ease or
difficulty to measure the service output. They suggest that value packages (services
and/or goods) with a low degree of difficulty to assess require formulation of different
management strategies as apposed to those that are difficult to assess, regardless of
whether they are tangible or intangible offerings.
2.3.2.2 Heterogeneity
Heterogeneity (variability) in the service context implies that it is difficult to standardise
services, especially in labour-intensive services (Bateson & Hoffman, 2011:68; Fisk et al.,
2008:9; Kasper et al., 2006:59; Lewis, 2009:234; Lovelock & Gummesson, 2004:27;
Young, 2008:75). Heterogeneity concerns the possibility for high variability in the delivering
of services, mainly because the customers are actively involved in the production process

45
(Bateson & Hoffman, 2011:68; Hollensen, 2010:395; Wilson et al., 2008:16; Young,
2008:75). Both the service provider and the customer may bring in some form of variation
to the service (Bateson & Hoffman, 2011:69; Edvardsson et al., 2005:117; Fisk et al.,
2008:9; Young, 2008:75). The quality and fundamental nature of a service can vary from
service provider to service provider, from customer to customer, and from time to time.
This is the case because an employee, delivering the service to various customers, may
not maintain absolute consistency throughout a specific timeframe. The same customer
may also encounter different employees who provide a service and this may raise a
problem of consistency of behaviour (Bateson & Hoffman, 2011:69; Edvardsson et al.,
2005:117; Fisk et al., 2008:9; Kotler & Armstrong, 2010:269; Zeithaml et al., 1985:34).
Customer perceptions may also vary from one service encounter to the next and from one
time to another (Bateson & Hoffman, 2011:69; Wilson et al., 2008:16; Zeithaml et al.,
1985:34). No two customers are precisely alike and may have specific individual demands
or may experience the same service encounter differently. More variables are added to
this picture, namely the presence and behaviour of other customers during service delivery
and variations in external condition like weather, crowding and differences between
service locations (Desmet, Van Looy & Van Dierdonck, 2003:15).
Heterogeneity can have an effect on the whole product development process, including
the design, production and delivery stages. It is more difficult to control the output of a
service organisation than it is to control the output of an organisation that produces goods
(Bateson & Hoffman, 2011:69; Edvardsson et al., 2005:117). Due to the absence, or only
the partially presence, of standards in service industries, customers perceive a greater risk
in purchasing services than they do in purchasing goods. In order to minimise the effect of
heterogeneity, the service encounter should be controlled. This can be done by making
use of uniform production processes and increasing the amount of automation. The
degree of variability in each service encounter will be reduced so that more consistency
can be gained. Lovelock and Gummesson (2004:28) state that during the past two
decades, there has been a significant trend from service delivery organisations to replace
labour by automation to achieve standardisation in the delivering of their services. This
makes variability less of a problem than previously.

46
The relative heterogeneity of services makes it more difficult to measure service quality
and to do quality control checks prior to service delivering (Bateson & Hoffman, 2011:69;
Fisk et al., 2008:9; Hollensen, 2010:395; Schneider & White, 2004:8). Ensuring consistent
service quality for services can therefore be challenging. Services cannot be measured
against exact uniform standards and, even when exactly the same quality of service is
delivered to customers with unique individual circumstances, each customer could
evaluate these services differently (Bateson & Hoffman, 2011:69).
In order to ensure that the results of this study are a true reflection of the perceptions of
small business tenants in shopping centres, the response rate has to be large enough and
there has to be a high representation from the small business tenants of each shopping
centre that will be part of the study.
Heterogeneity, as a characteristic of services, has however been criticised by several
researchers because of the many possibilities of standardisation in services (Corrêa et al.,
2007:450; Lovelock & Gummesson, 2004:28; Moeller, 2010:363; Vargo & Lusch,
2004b:328). They argue that heterogeneity is not only a problem for service industries, but
also for manufactured goods industries. Very often at least parts of many services are as
standardised and homogenised as their product counterparts. Lovelock and Gummesson
(2004:28) conclude that “it is inappropriate to continue to generalise about heterogeneity
(or variability) as being a distinctive characteristic that sets all services apart from all
goods”. It is also argued that the “problem” of heterogeneity in services is not necessarily a
disadvantage (Corrêa et al., 2007:450; Lovelock & Gummesson, 2004:28; Vargo & Lusch,
2004b:328). A degree of non-standardisation, where each customer will receive his/her
own customised service, is a desirable feature in some services and a distinct marketing
strength (Evans & Lindsay, 2008:59).
Corrêa et al. (2007:450) substitute heterogeneity with “the degree of intensity of
interaction”. They are in agreement that some services may be very homogeneous and
that all goods are not necessarily homogeneous. What matters to them though, is not
heterogeneity, nor whether the process renders a service or produces a good, but the
degree of intensity of interaction between the customer and the process. A greater degree

47
of interaction to acquire information about the specific needs of the customer will be
necessary for greater customisation of offerings. Highly customised packages will
therefore require more intense interaction with more flexibility than less customised
packages.
2.3.2.3 Inseparability
Inseparability in relation to services implies that the production and consumption are
inseparable and occur simultaneously (Bateson & Hoffman, 2011:63; Evans & Lindsay,
2008:59; Fisk et al., 2008:8; Hollensen, 2010:395; Kasper et al., 2006:58; Lewis,
2009:234; Schneider & White, 2004:7; Sierra, Heiser & McQuitty, 2009:111; Wilson et al.,
2008:16; Young, 2008:76). The inseparability of services therefore leads to a relatively
small time-gap between production and consumption, and the services are often
consumed as they are produced. The customer has to be present during the production of
many services and the customer is forced into intimate contact with the production process
(Kotler & Armstrong, 2010:269; Wilson et al., 2008:17).
Quite often in delivering a service, special skills like communication and interpersonal skills
from the service provider’s employees, will be necessary, which is not the case with a
manufacturing worker (Bateson & Hoffman, 2011:63). What this inseparability of
production and consumption further implies is that services are subject to “interference” by
the customer where the consumer often has to contribute information or effort before the
service transaction can be consummated. The information or effort given by the customer
can indeed influence the quality of the service delivered (Bateson & Hoffman, 2011:63;
Fisk et al., 2008:9; Wilson et al., 2008:17; Zhenfeng & Dubé, 2011:93). Bateson and
Hoffman (2011:64), Kotler and Armstrong, (2010:269) and Sierra et al. (2009:111) point
out that it is important to realise though that the customers and the service provider’s
employees share the responsibility for successful service outcomes, although they admit
that the degree of mutual involvement can vary from service to service. The service
provider can also influence the quality of the service because the service provider’s
employee becomes a tangible cue on which at least part of the customer’s evaluation of
the service experience is based upon (Bateson & Hoffman, 2011:63; Fisk et al., 2008:9;

48
Young, 2008:77). They argue that the customer has the opportunity to observe the detail
of the service encounter and that non-verbal behaviour, clothing, personal hygiene and
linguistic ability can have an influence on the service quality as perceived by the customer.
Due to the fact that it is not possible to produce a service long before actual consumption
takes place, the effectiveness of a service cannot be guaranteed in advance and it
therefore introduces uncertainty (Edvardsson et al., 2005:117; Young, 2008:76). The
service provider cannot produce the service and check it for defects prior to delivering it,
but can merely assure the customer on the basis of the proven expertise of the supplier at
a previous service encounter (Gaster & Squires, 2003:7; Young, 2008:76).
Corrêa et al. (2007:449), Lovelock and Gummesson (2004:29), Moeller (2010:364) and
Vargo and Lusch (2004b:330) argue that the characteristic of inseparability is not unique to
the service encounter. It is also applicable to goods. Vargo and Lusch (2004b:330) find
that tangible goods cannot provide the desired benefits (the service) unless the customer
interacts with the goods. The benefits from the goods purchased are indeed obtained by
the use of these goods. They argue further that the mere act of purchasing (or not)
provides feedback which involves the customer in the design and delivery of all offerings
(Vargo & Lusch, 2004b:330). Lovelock and Gummesson (2004:29), argue that many
offerings that are normally classified as services are partially, and quite often, largely
“manufactured” separately from the consumer. They conclude that the generalisation that
inseparability is a distinctive characteristic of all services is not valid as there are far too
many separable services. Beaven and Scotti (1990:10) agree with this but believe that
inseparability of services is also an advantage and that offerings produced without the
relative involvement of the consumer are in fact at a disadvantage. They point out that
because a service is a lived-through event which impacts on the consumer’s personal
biography, it makes the service encounter special.
A landlord renders different types of services to their tenants. The services of issuing rent
statements to tenants can technically be separated, as there could be internal processes
to check for its correctness before it is delivered. On the other hand, when, for example,

49
queries on the statements need to be discussed with management, the service cannot be
separated.
Corrêa et al. (2007:450) substitute the characteristic of inseparability with “degree of
simultaneousness between production and consumption”. They argue that while high
inseparability (simultaneity) generally equates to low stockability, (see discussion in
2.3.2.4) low stockability does not necessarily equate to high inseparability. A technician
must wait for something to break for instance, before his service will be needed (“degree of
stockability” is zero). While fixing the product however, the customer does not necessarily
have to be present and it may be hours or even days before the customer actually
consumes the result of that process, implying low simultaneity (or inseparability). In the
time between fixing the product and consuming it, quality control can be performed. In
other types of services, the customer is consuming the service while receiving it and the
“degree of stockability” is also zero. It is however not possible to do quality control prior to
the customer consuming the product because of high inseparability.
2.3.2.4 Perishability
Perishability, like in the case with tangibility, means that because services are not tangible
they cannot be produced at a certain point in time, stored, and then sold later when
demanded (Bateson & Hoffman, 2011:71; Fisk et al., 2008:9; Hollensen, 2010:394; Kasper
et al., 2006:60; Lewis, 2009:235; Vargo & Lusch, 2004:331; Young, 2008:78). Services
therefore, have to be consumed when produced and if it is not consumed it perishes.
Although perishability exists for goods as well, perishability of services is more critical and
more difficult to overcome. Service organisations is therefore more seriously affected by
changes in demand because, when demand is low, unused capacity is wasted and the
opportunity to maximise profit has gone forever, and when demand is higher than the
capacity, it goes unfulfilled and business may be lost (Bateson & Hoffman, 2011:72; Fisk
et al., 2008:10; Hollensen, 2010:395; Kasper et al., 2006:60; Kotler & Armstrong,
2010:270; Wilson et al., 2008:17; Young, 2008:78). It is therefore important for service
firms to manage demand and supply in order to better meet their needs.
50
The attribute of perishability as a characteristic of services, has however been criticised.
Gummesson (2000:123) is very frank in his criticism when he states that “the claim that
services cannot be stored is nonsense”. Lovelock and Gummesson (2004:30) also believe
that the claim that perishability is an exclusive characteristic of services requires significant
qualification. They argue that this concept is multidimensional that includes productive
capacity, the producer’s output, the customers’ experience of the performance, and the
output the customers obtain from the service. Several previous articles have focussed on
perishability from the producer’s perspective but perishability from the customer
perspective, however, may give a different perspective (Edvardsson et al., 2005:117). If
perishability would be seen from the service provider’s perspective, the benefits or
outcomes derived from the service processes will be clear. Some service processes may
even have durable, imperishable effects on an individual’s life (Beaven & Scotti, 1990:9).
In the case with landlords in shopping centres, perishability as a characteristic of services
is also relevant. Landlords render a service to tenants by making space available for them
to operate their businesses in. If a particular space is not leased out however, it has a
negative economical effect on the landlord as the space will be empty and they will lose
the leasing fee.
Corrêa et al. (2007:449) suggest the “degree of stockability” as the characteristic relating
to perishability. This refers to the ability to inventory items needed to deliver the service
before demand occurs and also the ability to inventory the service to be delivered. A
barber for instance, can have the razor and shampoo available in stock, but the haircuts
cannot be stocked. The haircut therefore cannot be separated from the actual service
when demanded. They argue that certain goods can also not be stocked before
consumption takes place. A restaurant serving coffee for instance is providing a physical
good but still cannot stock many coffees ready for consumptions when the demand occurs.
They make the point that inseparability of goods does not guarantee that it is possible to
build anticipation stocks. It depends on the item’s “degree of stockability” as a function of
the maximum time span between possible build up of anticipation stocks and the actual
demand, to determine how far in advance anticipation stocks can be built.

51
It should however, be noted that, because services fall in many places along the
continuum that ranges from tangible dominant to intangible dominant, as described in
section 3.2.1, the magnitude and subsequent impact that each of these four characteristics
have on individual services will vary (Bateson & Hoffman, 2011:57).
2.4 QUALITY
When it comes to customers that have to choose among competing products and services,
quality has become one of the most important decision factors (Montgomery, Jennings &
Pfund, 2011:2). Quality also plays an important role in assuring the safety of the
customers. The phenomenon of quality is widespread and understanding and improving
quality are key factors leading to business success, growth and competitiveness (Dale,
Van der Wiele & Van Iwaarden, 2009:18; Evans & Lindsay, 2008:9; Kasper et al.,
2006:175; Montgomery et al., 2011:2; Sower, 2011:3; Starcke, 2006:80). It is common
knowledge that there is a substantial return on investment from improved quality and, from
successfully employing quality as an integral part of overall business strategy.
2.4.1 The meaning of quality
Quality has always been a bone of contention. It stemmed a flood of rivalry from large to
small businesses, everyone claiming his products’ superior quality. Quality can be defined
in many ways but Grönroos (1988:11), Montgomery et al. (2011:4), Palmer (2008:320),
Sower (2011:4) and Sower and Fair (2005:8) feel that it is a complex, multifaceted
phenomenon and is often defined too narrowly.
It is however important to have an understanding of the concept quality if businesses have
to measure and improve their quality (Dale et al., 2009:4). Quality must also be defined in
such a way that it can be assessed and measured (Sower, 2011:5). According to Evans
and Lindsay (2008:12) there is no agreement on a universal definition of quality. It is
therefore important to understand the various perspectives from which quality is viewed to
fully appreciate the role it plays in businesses and the economy at large. The numerous
definitions of quality in the literature today results mostly from five major approaches to
52
defining quality, namely transcendent, product-based, user-based, manufacturing-based
and value based. These approaches have their roots in varied disciplines. Although Garvin
proposed these different approaches to defining quality in 1984, its relevance for defining
quality is apparent given its continued use in guiding research in this area and the
inclusion thereof in several current textbooks and research articles (Evans & Lindsay, 13-
15; Ivanović & Majstorović, 2006:414; Kasper et al., 2006:177-180; Kaya & Özer,
2009:671; Lovelock & Wirtz, 2011:383-384; Mitra, 2008:7; Sebastianelli & Tamimi,
2002:443-445; Sower, 2011:10; Sower & Fair, 2005:8; Stiglingh, 2008:32-36). It is the
opinion of Garvin (1984) that multiple definitions of quality are needed, not only to capture
the complexity of the quality concept, but to enable firms to address quality issues that
change as products and services move through the various stages of design, production
and marketing. These five different approaches of understanding quality is a good
summary of the different ways quality is viewed. It also provides a framework for
appreciating some of the problems associated with service quality (Kasper et al.,
2006:177).
2.4.1.1 The transcendent approach
This approach is also called the philosophical approach and the advocates of this
approach claim that quality cannot be defined precisely but can only be recognised
through relevant experience (Garvin, 1984:25). This approach borrows heavily from Plato’s
view of beauty. Philosophers that consider beauty to be “logically primitive” also consider
other such constructs, like quality, to be understood only after one is exposed to several
objects that display its characteristics. In relation to services for instance, it could be
possible for a customer to say that one service experience was better than the next
service experience but will not be able to explain why (Kasper et al., 2006:177).
Nevertheless, quality is described by the same advocates of this approach as both
absolute and universally recognisable, a mark of uncompromising standards and high
achievement (Garvin, 1984:25). Sower and Fair’s (2005:8) view with regard to the
transcendent approach, is that it is fundamentally the most important approach when
thinking about quality, especially in the quality of breakthrough products and services
designs.
53
Schneider and White (2004:10) criticise this view and argue that this approach is useless
from a research point of view because quality, from a philosophical perspective, is not
understandable and cannot be measured. Evans and Lindsay (2008:13) and Lovelock and
Wirtz (2011:383) also believe that a definition from this perspective is of little practical
value to managers and it cannot be assumed that managers or customers will know quality
when they see it. Quality cannot be measured or assessed as a basis for decision making
by using this approach.
2.4.1.2 The product-based approach
An example of the product-based approach of defining quality is the definition of
Parasuraman et al. (1985:41): “quality is zero defects – doing it right the first time”. In
contrast with the transcendent-based view, product-based definitions view quality as a
precise and measurable variable (Garvin, 1984:25). According to this approach, the
differences in the quantity of a specific component or attribute that is part of a product or
service, determine the differences in its quality. This, in other words, implies that “more” on
the attribute is “better”. It will however only be possible to make a clear-cut ranking of the
quality of the product or service if all the consumers consider the attributes in question as
important (Garvin, 1984:26). There are various problems to this approach. Firstly, incurring
higher costs will be the only way to improve quality. The production of attributes is
considered costly and quite often quality is mistakenly considered to be related to price. It
can therefore be assumed by many that, the higher the price, the higher the quality of the
product or service would be (Evans & Lindsay, 2008:13). Secondly, quality is not viewed
as something ascribed to a product or service, but rather as an inherent characteristic of it.
Because the presence or absence of measurable attributes in the product or service will
be a reflection of the quality, it can be assessed objectively and is based on more than
only preferences (Garvin, 1984:27).
This approach in the opinion of Klaus (1985:21) is not suitable in a service encounter
environment. Juran (1988:4) sees the primary goal of measuring service performance by
making use of the product-based approach, is usually working towards becoming equal or
superior to competitors with regard to the quality of competing services. From this
viewpoint, the product-based approach can be suitable for the measuring of service quality

54
in a landlord-tenant relationship in shopping centres, because shopping centres compete
against each other in relation with attracting and keeping suitable tenants. Kasper et al.
(2006:178) however feel that it is problematic to compare the characteristics of services
“side by side” because one cannot experience two similar services at the same time and
because many service attributes are not identifiable. They further point out that even if all
the attributes of the service that were assessed could be identified, the assessment would
not be complete until the service ended, or the service benefit was finally revealed. A
tenant can for instance not lease a premise in one shopping centre and “try out” the
service they receive from the landlord and then decide to move to another shopping
centre. If they lease space in a shopping centre, they would be bound by the leasing
contract for quite some time before they can cancel the contract.
2.4.1.3 The user-based approach
Juran, Gryna and Bingham’s (1974:16) definition of quality is consistent with the user-
based approach. He defines quality as “fitness for use, the extent to which the product
successfully serves the purpose of the user during usage”. This approach means that
those goods and services that consumers consider the best to satisfy their needs are
those that they regard as having the best quality. In other words “quality lies in the eyes of
the beholder” (Garvin, 1984:27). This is a highly personal and subjective view of quality.
The quality of a service is judged to be high when customers say it is, but this does not
necessarily mean that the service conforms to technical criteria (Berry et al., 1988:35;
Grönroos, 1988:11; Juran, 1988:5; Schneider & White, 2004:10).
This approach is close to definitions cited by various researchers in the literature. Monroe
and Krishnan (1985:212) define quality as “the perceived ability of a product or service to
provide satisfaction ‘relative’ to available alternatives". Parasuraman et al. (1985:41) define
quality as meeting customers’ expectations and Edvardsson (1988:430) sees quality as
finding out what creates value to the customer and then offering it. This will require the
service provider to have a deep understanding of the customer and to define their needs
correctly, or otherwise high quality can never be achieved. Townsend and Gebhardt
(1988:7) mention “quality in perception” as one of the elements of quality, meaning that it
would be high quality when the product or service being offered meets customers’

55
expectations. Gummesson (1988:15) points out that the customer may understand his
needs better than the manufacturer or the service provider and therefore the customer has
to define quality. Peters (1999:6) is of the opinion that quality, to a great degree, is what
the customer says it is. Lehtinen (in Edvardsson, 1988:430) differentiates between process
quality and output quality. Process quality is when the customer is judging the quality
during the service encounter, while output quality concerns the result of what the customer
has received and is judged afterwards. Grönroos (1988:11) pointed out that customers
often perceive quality as a broad concept where the quality experience is dominated by
non-technical aspects. He also emphasises that it is essential that quality in a business
has to be defined in the same way that customers would define it and that the quality as it
is perceived by the customers is most important.
This approach has led to the notion of “ideal points” which is described by Garvin
(1984:27) as “precise combinations of product attributes that provide the greatest
satisfaction to a specified consumer”. There are especially three important questions that
are asked when considering this concept. The first is whether this is practical, namely how
to take all the widely varying individual preferences of customers and combine them to
come up with a meaningful definition of quality that will suit everyone (Kasper et al.,
2006:178). The second is more elementary, namely how to distinguish those product
attributes that imply quality from those that simply maximise customer satisfaction (Garvin,
1984:27). A third question that should be considered is how to cope with the fact that
consumers’ perceptions and priorities change over time (Takeuchi & Quelch, 1983:141;
Boulding, Kalra, Staelin & Zeithaml, 1993:9). The first problem, namely practicality, can
usually be resolved by assuming that those quality products or services that best meet the
needs of the majority of consumers can be considered to be the best quality. This can,
however be problematic because each individual do not necessarily attach the same
weights to quality characteristics, making it difficult to devise an unbiased statistical
procedure for aggregating such widely varying preferences (Garvin, 1984:27). The second,
more elementary question is whether quality is similar to customer satisfaction. As
discussed in section 2.2 the constructs of quality and satisfaction, although they are
related, are by no means identical. A product or service that meets or exceeds customer
satisfaction is regarded to be preferred to one that meets fewer needs, but the quality is
not necessarily also better (Garvin, 1984:27). The third problem of how to cope with the
56
changing perceptions and priorities of consumers, is simply for service providers to do
their market research and to familiarise themselves with their customers’ changing needs
(Edvardsson, 1988:430).
Despite the various shortcomings of the user-based approach, the importance of this
approach is summarised by Boothe (1990:65) as follows: “In the uncertain world of
providing services, one thing is certain: the customer defines quality”.
2.4.1.4 The manufacturing-based approach
Virtually all definitions that are part of this approach identify quality as “conformance to
requirements” (Crosby, 1979:7). At the core of this approach is the notion that any
deviation from predetermined specifications would imply a reduction in quality and the
objective of any business should therefore be one of “making it right the first time” (Garvin,
1984:27). The main difference between this approach and the product-based approach is
that the definitions in the former approach are related to the delivered service and the
definitions in the latter approach are linked to concept design. Because this approach is
seen as a fairly objective way of measuring quality, it has a place in measuring the
technical outcomes of services experiences, such as the correctness of tenant rent
statements issued by landlords in shopping centres. Time can also be used as an example
of quality service. Centre management sets for instance predetermined standards with
regard to the periods allowed for certain services (concept design), which implies that the
manufacturing approach would define quality as conformance with these standards. The
present research uses partly the manufacturing approach to define quality as the
conformance of the particular shopping centre with industry norms.
The manufacturing approach however, cannot be the only approach used to measure the
quality of the services rendered by the various shopping centre management. For
example, the product attribute of reaction time of centre management to a tenant
complaint can for instance be one hour. Based only on this information, it cannot be
judged whether this is good quality service or not, but the manufacturing approach of
defining quality could result in a situation in which employees strive to achieve this
standard. Centre management may try to conform to the standard set regarding the
57
reaction time to deal with a complaint, but in trying to do so, may be in such a hurry that
they deal with the complaint not fully prepared and inadequately.
2.4.1.5 The value-based approach
With this approach, quality is defined in terms of costs and prices. Feigenbaum (1951:10)
for instance, define quality as value. Advocates of this view, define a quality product or
service as one that provides performance at an acceptable price or conformance at an
acceptable cost (Garvin, 1984:28). Consumers are prepared to pay more for services if
they view the value as higher than that of other available services but, they have their own
personal assessments of what they receive in relation to the price they are willing and able
to pay (Edvardsson, 1988:431). The two related, but distinct concepts of quality, which is a
measure of excellence, and value, which is a measure of worth, are equated. This
blending of the two concepts makes it difficult to employ the value-based approach in
businesses (Garvin, 1984:28). The rent that small business tenants in shopping centres
pay is market-related and therefore “affordable,” but it is not necessarily linked to value as
well. It is common knowledge that the small business tenants in shopping centres pay far
more rent per square meters than the big anchor stores. Although they pay more per
square meter for a much smaller space than the big anchor stores, the small business
tenant does not receive more value than the anchor store (the opposite is in fact often
true). This approach to define quality is therefore not suitable for the present research.
While it may be possible to determine tenant satisfaction in general with the services they
receive from their centre management in exchange for the rent they pay, the present
research seeks to assess the perceptions of small business tenants. By implication, the
connection between the rent that small business tenants pay and the service they receive
is absent. The cost versus the benefit measure is more likely to determine whether the
efficiency of the centre management will enable them to recover the cost of their time from
the small business tenant in full.
58
2.4.2 Concluding remarks on quality
The various existing definitions of quality in the literature usually fall into one of these
approaches discussed above. There are basically two major approaches that practitioners
and researchers would advocate, namely technical quality definitions or user-based
definitions. Technical quality definitions, based on the product-based- and the
manufacturing-based approaches, are usually associated with the production process and
focus therefore on the supply side of the equation. User-based definitions, on the other
hand, are rooted in consumer preferences and incorporate subjective elements. These
seemingly conflicting views of defining quality is not necessarily problematic. Although
there is potential that these different views can cause serious breakdowns in
communication, businesses need to encourage it in order to provide a high quality product
or service (Garvin, 1984:29). Irrespective of the preferred approach however, Garvin
(1984:29) adds that the characteristics that represent quality should first be identified. This
can best be done by thorough market research of customers (a user-based approach to
quality) and then to translate this into identifiable products or service attributes (a product-
based approach). The next step should then be a manufacturing-based approach to
quality, namely to manufacture a product made precisely to these specifications
(Edvardsson, 1988:430; Garvin, 1984:29; Takeuchi & Quelch, 1983:139).
For evaluating the quality of services, which are in essence intangible, the user-based
approach is better to use than an objective checklist approach. According to Schneider
and White (2004:11) technical approaches are more suitable to measure the quality of the
“what” of services, while user-based approaches are more suitable to the “how” of
services.
The user-based approach will predominantly be used for the present research, although
the principles of the manufacturing approach and some aspects of the product-based
approach will also be incorporated to ensure that the full spectrum of quality, as perceived
by the small business tenants in shopping centres, is captured in the proposed service
quality model.
59
2.5 CONCLUSION
The differences between the two constructs, service quality and customer satisfaction
were discussed. The present study is concerned with using a service quality model for the
evaluation of the services of shopping centres to their small business tenants and
therefore the service quality construct will be measured.
Although it appears from the literature reviewed, that services and quality are not so easy
to define, an attempt was made in this chapter to analyse and describe these phenomena.
The differences between goods and services were analysed with special reference to their
characteristics, the possible influence of these characteristics on the measurement of
service quality and the criticism in the literature on each of these characteristics were
discussed. The measurement of service quality is, in some way or the other, influenced by
these characteristics, namely intangibility, inseparability, heterogeneity and perishability.
An attempt was also made to get a better understanding of the concept of quality. This
was done from the viewpoint of the various approaches used by various researchers.
From this analysis, it was found that the user-based approach is the most suitable
approach for the present research. Some features of the product-based- and
manufacturing-based approach will also be considered.
In the next chapter the constructs of service quality and service quality measurement will
be analysed in more detail. An analysis will also be made of the different service quality
models proposed by researchers and a suitable model will be chosen to measure the
perceived service quality of small business tenants in shopping centres.

60
CHAPTER 3
SERVICE QUALITY
3.1 INTRODUCTION
The two separate constructs of “services” and “quality” were analysed in Chapter 2 where
“services” was defined with regard to the inherent characteristics of the particular service
and “quality” was defined by making use of predominantly a user-based approach. It is
also evident from the previous chapter that service quality is a complex and ephemeral
concept. It is recognised by businesses that improving service quality is an essential
strategy for success and survival in today’s competitive economic environment. It is
apparent from the literature that the provision of high service quality enables a company to
be competitive and, contributes to their productivity and profitability. It increases cash flow
and shareholder value, gives businesses a better chance of success, enhances customer
satisfaction, increases the willingness of customers to positively talk about the service
provider, decreases customer defection and enhances customer loyalty (Bateson &
Hoffman, 2011:326; Baumann et al., 2007; Carr, 2007:107; Carrilat et al., 2009:96; Chen
et al., 2009:49; Ehigie, 2006; Kassim & Souiden, 2007; Kelkar, 2010:421; Kersten & Koch,
2010:196; Lee et al., 2007:2; Madhavaram & Hunt, 2008:67; Talib & Rahman, 2010:363;
Von Freymann & Cuffe, 2010:406; Wiles, 2007:27; Yoo & Park, 2007:920). The benefits of
high service quality also go beyond economic indicators and have a positive social
outcome as well, in that it improves communities’ quality of life (Dagger & Sweeney,
2006:12; Lee et al., 2007:2; Young, 2008:4).
Like many businesses, landlords are also being subjected to increased competitive
pressures of the changing business environment. Landlords increasingly realised that their
tenants should be treated as valued customers and that it is very important that they
should meet their needs (Pinder et al., 2003:218). In order to achieve the objective of this
research, namely to measure service quality by making use of a service quality model that
can be used as a framework to establish the perceptions that small business tenants in
61
shopping centres hold with regard to the services the landlord provides, it is necessary to
have a thorough understanding of the construct of service quality. As it has been
established beyond doubt that any quality initiative has to begin with a proper definition
followed by suitable measurements, this chapter investigates service quality and how to
measure service quality by focusing on service quality models.
3.2 THE CONCEPT OF PERCEIVED QUALITY
In Chapter 2, reference was made to the difficulty in defining the concept “quality”. The
point of view from which many of these definitions were formed is from the so-called
“objective quality” perspective. This is a concept used to describe the actual technical
superiority or excellence of products and is determined and controlled by the service
provider (the product based- and manufacturing based approaches). The judge of quality,
however, has always and will always be the customer. The customer judges the quality
and his/her perceptions create an image of good or bad quality. This statement is
supported by Grönroos (1988), Parasuraman et al. (1986), Schneider and White (2004)
and Zeithaml (1988) where they express a preference for the concept “perceived quality”.
They feel that this will overcome some of the problems and difficulties associated with the
“objective quality” approach. The reasoning is that objective quality might possibly not
even exist, because those dimensions which are frequently described as objective
dimensions of quality are also those elements which are perceived as quality by a person,
in other words, a subjective evaluation. What this implies is that, even if quality standards
or specifications are set against which the so-called objective quality can be evaluated,
these standards are indeed formulated by managers (people) according to their personal
perceptions of quality. It can therefore be argued that all quality evaluations in effect are
subjective. Parasuraman et al. (1986:3) define perceived quality as “the customer’s
judgement about a service’s overall excellence or superiority”. Zeithaml (1988:3-4) adds
that perceived quality also:
• differs from objective or actual quality;
• has a higher level abstraction rather than a specific attribute of a product;
• is a global assessment that in some cases resembles attitude; and
• is a judgement usually made within a customer’s evoked set.

62
REPUTATION
The factors that influence perceptions of quality are depicted in Figure 3.1. Figure 3.1: The perceived quality component
EXTRINSIC ATTRIBUTES
INTRINSIC ATTRIBUTES
PERCEPTIONS OF LOWER-LEVEL ATTRIBUTES HIGHER-LEVEL ATTRIBUTES Source: Zeithaml (1988:7)
Figure 3.1 above shows that customers’ perceptions of quality are influenced by extrinsic
attributes (brand name and level of advertising), intrinsic attributes, and perceptions of
lower-level attributes (perceived monetary price and reputation).
BRAND NAME
LEVEL OF
ADVERTISING
OBJECTIVE
PRICE
PERCEIVED MONETARY
PRICE
ABSTRACT DIMENSIONS
PERCEIVED QUALITY
INTRINSIC
ATTRIBUTES

63
Services are still regarded by many to be vaguely defined and described, hence it has led
many researchers to use perceived quality to describe and define service quality, rather
than to attempt to employ objective measures for this purpose.
3.3 SERVICE QUALITY DEFINED
There is general consensus amongst researchers and practitioners that service quality is
an elusive and abstract concept that is difficult to define and measure (Bateson &
Hoffman, 2011:324; Kasper et al., 2006:175; Kotler & Armstrong, 2010:272; Parasuraman
et al., 1985:41; Sower, 2011:8). What is also apparent, is the fact that increases in quality
have numerous benefits and can have a dramatic impact on a business’s survival
(Bateson & Hoffman, 2011:326; Baumann et al., 2007; Ehigie, 2006; Hollensen, 2010:395;
Kasper et al., 2006:176; Kassim & Souiden, 2007; Kelkar, 2010:421; Madhavaram & Hunt,
2008:67; Talib & Rahman, 2010:363; Von Freymann & Cuffe, 2010:406, Wiles, 2007:27). It
is mainly for this reason that ongoing research and much debate is done in the field of
service quality and in service quality measurement. The debate revolves mainly around
two competing perspectives, termed the Nordic (Scandinavian or European) and the
American schools. The Nordic school defines service quality using overall categorical
terms that include the aspects of technical- and functional quality. The American school on
the other hand, uses descriptive terms and includes inter alia the five dimensions of
reliability, responsiveness, assurance, empathy, and tangibles (Brady & Cronin, 2001:44;
Pollack, 2009:42). Although both schools of thought highlight important aspects of service
quality, it still seems from the literature that there is no consensus that these definitions
fully capture the essence of the construct. For this reason, it is important to review several
different perspectives, both old and new, and from several different conceptual and
empirical approaches.
Definitions of service quality in the literature focus primarily on meeting customers’ needs
and requirements and how well the delivered service meets customers’ expectations
(Bateson & Hoffman, 2011:327; Berry et al., 1985:46; Grönroos, 1984:36; Kasper et al.,
2006:183; Yoo & Park, 2007:912; Zeithaml, Parasuraman & Berry, 1990:2). These
definitions are in line with the user-based approach discussed in section 2.4.1.3.
Differences between expected and perceived performances give rise to disconfirmation,
which can be either positive or negative. This is often termed the “disconfirmation
64
paradigm’. Expectations in this context are based on individual norms, values, wishes and
needs and are therefore very individualistic (Kasper et al., 2006:184). Customer
expectations are beliefs about the service that serve as standards or reference points
against which quality is judged (Wilson et al., 2008:155). Whether or not these
expectations are met by the service provider will have a crucial bearing on their perceived
service quality (Bateson & Hoffman, 2011:327; Kasper et al., 2006:183). It should be noted
though, that the expectations between two individuals are not necessarily identical, even if
the service delivery is absolutely identical. The perceived service quality of the service is
therefore also not necessarily identical (Kasper et al., 2006:184). Changing personal
circumstances such as income levels, educational achievement or increasing aspiration
levels may also change an individual’s expectations over time.
Expectations are also affected by the interaction of a person with for instance, the media,
the service provider, other customers, and observation of specific situations (Kasper et al.,
2006:184). In relation to the services provided by the landlord to small business tenants in
shopping centres, these “personal circumstances” mentioned above, may play a minor role
in the perceived service quality the small business tenants receive from their landlords.
The small business tenants’ circumstances, experiences and needs may be quite similar
to one another. They are all leasing from the same landlord and are all “small” businesses
with their own unique needs and challenges.
Grönroos (1984:36; 1988:10) was amongst the first researchers that call for conceptual
models of service quality in order to understand the concept better. He believes that these
models will show how the quality of services is perceived by customers. He argues that it
will subsequently be possible for the service provider to manage perceived service quality
evaluations by customers if they understand how the services will be evaluated by them.
Conceptual service quality models can be very useful as they provide an overview of the
factors which have the potential to influence the service quality of a business and to
identify quality shortfalls (Ghobadian, Speller & Jones, 1993:56; Philip & Hazlett,
1997:263; Seth, Deshmukh & Vrat, 2005:914). A model will attempt to show the
relationship that exists between prominent variables and can be seen as a simplified
description of the reality (Ghobadian et al., 1993:56; Seth et al., 2005:914). Over the past
approximately 15 years, at least 30 industry-specific scales and models of service quality
65
have been published in the literature on service quality (Ladhari, 2008:65). These
conceptual models and scales were used by several authors in an attempt to define and
describe service quality, including, among others, Abdullah, Suhaimi, Saban and Hamali
(2011), Boulding et al. (1993), Brady and Cronin (2001), Cronin and Taylor (1992),
Dabholkar et al. (2000), Gaster and Squires (2003), Grönroos (1984, 1988), Haywood-
Farmer (1988), Kang and James (2004), Lehtinen and Lethtinen (1991), Parasuraman et
al. (1985, 1986, 1988), Parasuraman, Berry and Zeithaml (1991a), Parasuraman, Zeithaml
and Malhotra (2005), Rust and Oliver (1994), Philip and Hazlett (1997), Rust Zahorik and
Keiningham (1995), Santos (2003), Senthilkumar and Arulraj (2011), Speller and
Ghobadian (1993b), Zeithaml, Parasuraman and Malhotra (2002) and Zhu, Wymer and
Chen (2002). A more in-depth analysis of several of these models is necessary and
thirteen of these models will be investigated next.
3.4 A REVIEW OF SELECTED SERVICE QUALITY MODELS
As mentioned, the difficulty of defining and conceptualising the service quality construct
has compelled researchers to develop models for better comprehension of this
phenomenon. In this section, some of the attempts to propose models of service quality
will be reviewed briefly.
3.4.1 The Grönroos service quality model
Grönroos (1984:36), one of the leaders in the Nordic school of thought with regard to the
service literature, states that a proper conceptualisation of service quality should be
customer-based (Grönroos, 1984:36). The customer’s perceptions of service quality are
therefore the main feature in his service quality model and secondly, the determinants of
what influence service quality are also included. The model emphasises (see Figure 3.2)
that the interaction between the buyer and seller in a service setting is as important as the
eventual outcome. The basic principle in his model is that service quality is dependent on
the comparison of two variables: the expected service from customers and the actual
service as perceived by them (Grönroos, 1984:36). The outcome of this comparison
process will then be the perceived quality of the service (Figure 3.2 on the next page
illustrates this model). It should be noted however, that this model measures service
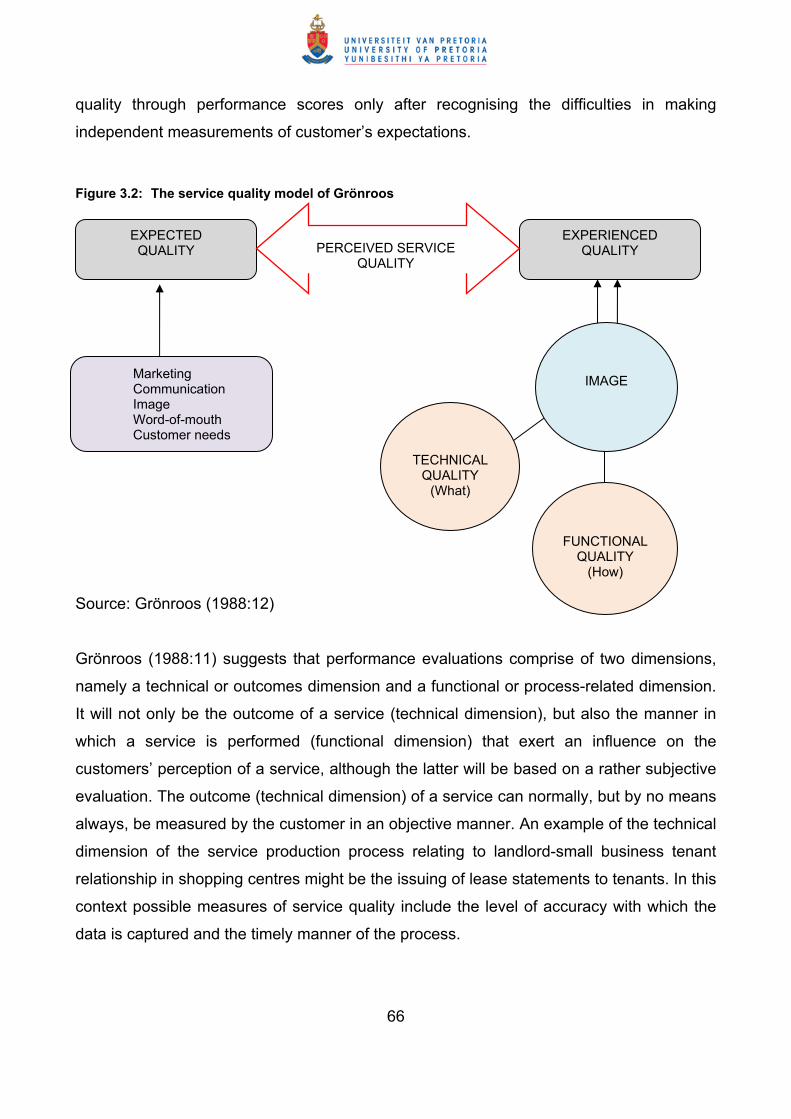
66
quality through performance scores only after recognising the difficulties in making
independent measurements of customer’s expectations.
Figure 3.2: The service quality model of Grönroos
Source: Grönroos (1988:12)
Grönroos (1988:11) suggests that performance evaluations comprise of two dimensions,
namely a technical or outcomes dimension and a functional or process-related dimension.
It will not only be the outcome of a service (technical dimension), but also the manner in
which a service is performed (functional dimension) that exert an influence on the
customers’ perception of a service, although the latter will be based on a rather subjective
evaluation. The outcome (technical dimension) of a service can normally, but by no means
always, be measured by the customer in an objective manner. An example of the technical
dimension of the service production process relating to landlord-small business tenant
relationship in shopping centres might be the issuing of lease statements to tenants. In this
context possible measures of service quality include the level of accuracy with which the
data is captured and the timely manner of the process.
EXPECTED QUALITY
EXPERIENCED QUALITY
Marketing Communication Image Word-of-mouth Customer needs
TECHNICAL QUALITY
(What)
FUNCTIONAL
QUALITY (How)
IMAGE
PERCEIVED SERVICE QUALITY
67
According to Grönroos’ (1988:11) view, the tenants’ perception of overall quality in this
regard can also be influenced by the way in which the technical quality, the end result of
the process, is offered to them. The lease statements that tenants for instance receive can
also be judged by the tenants in relation to the format or ease of understanding of it. The
way in which the landlord reacts and behaves if tenants have queries about their
statements can also be regarded as part of the functional performance of the service. The
technical service provided by the landlord can therefore be similar between several
shopping centres but the functional quality (the manner in which the service is performed)
is what gives the competitive edge.
Figure 3.2 also shows that Grönroos (1984:39) believes that a third dimension, namely a
firm’s corporate image, exerts an influence on perceived service quality. Several factors
can influence this image, like the technical and functional quality, price, external
communications, physical location, appearance of the site and the competence and
behaviour of service firms’ employees (Ghobadian et al., 1993:51). Grönroos (1984:40)
also points out that, if a customer has a positive image of a business (because of one or
more of the abovementioned reasons for instance) the customer will tend to find excuses
for negative technical or functional quality. If the negative experience with quality however,
continues, that person’s image of the service provider will deteriorate. In the same way, a
negative image may easily increase perceived problems with service quality. In the case of
service quality perception, the service provider’s image can be regarded as a filter
(Grönroos, 1984:43; 1988:12).
It is important to note that these various quality dimensions are interrelated (Grönroos,
1984:43). It can be argued that acceptable technical quality can be thought of as a
prerequisite for successful functional quality. Grönroos (1984:41) found that, as long as the
technical quality dimension is at least satisfactory, functional quality is more important to
overall perceived service quality. Where there is no technical quality to talk of however,
functional quality alone will not be able to compensate for this (Czepiel, Solomon,
Surprenant & Gutman, 1985:13). Functional quality can however not be affected by the
satisfaction with the technical service quality (Czepiel et al., 1985:13).
68
Later, Grönroos (1988:13) adds to the model by including six criteria of good perceived
service quality, based on previous empirical and conceptual research and existing
knowledge on how service quality is perceived. He classifies each of these six criteria into
his three-dimensional service quality model. The first of these criteria, professionalism and
skills, is outcomes-related and is therefore a technical quality dimension. The last criterion,
reputation and credibility, is image related and will fulfil a filtering function. The other four
criteria, namely attitudes and behaviour, accessibility and flexibility, reliability and
trustworthiness, and recovery, are all process-related and represent therefore the
functional quality dimension (Grönroos, 1988:13).
Many aspects of the model proposed by Grönroos (1984; 1988) have been generally
accepted, especially the way in which customers perceive quality. The model has been
applied by inter alia Kang and James (2004) and Lasser, Manolis and Windsor (2002).
There is however, some criticism on the model, especially with regard to three aspects.
Bernardt and Shostack (in George & Gibson, 1988:4) argue firstly, that the dimensions of
technical and functional quality do not describe all the elements of a service adequately.
Secondly, they believe that neither of the two dimensions should enjoy preference over the
other. Their third concern is that, because the model is based primarily on services in
which human interaction takes place, it will not be able to adequately accommodate
services in which physical and technological elements play an important role.
With regard to this research study, it can be concluded that image as proposed by
Grönroos (1984; 1988) will not play an important role in the landlord-small business
relationship in shopping centres. Small business tenants may initially consider image when
they choose a location for their business, but after that, image will not play a significant
role in their perceived service quality. If the image of the shopping centre as a whole
deteriorates in future and influence their businesses negatively, the tenants may choose to
relocate to another shopping centre.
3.4.2 The SERVQUAL model of service quality
It is rare to read through a service quality research article or text book without any mention
of the SERVQUAL model of Parasuraman, Zeithaml and Berry (1986). SERVQUAL is
69
without a doubt the most widely used and tested method to measure customers’
perceptions of service quality (Bateson & Hoffman, 2011:334; Carrillat , Jaramillo & Mulki,
2007:473; Chau & Kao, 2009:109; Gilmore & McMullan, 2009:646; Kang et al., 2002:280;
Kasper et al., 2006:188; Kueh & Voon, 2007:659; Ladhari, 2008:67). It has been widely
cited in the marketing and retailing literature and its use in industry has also been
widespread.
The SERVQUAL scale was developed following procedures recommended for developing
valid and reliable measures of marketing constructs (Asubonteng, McCleary & Swan,
1996:64; Brown, Churchill & Peter, 1993:129). The article in 1985 that set the scene for
SERVQUAL, conceptualised service quality as a gap between customers’ expectations
and perceptions (Parasuraman et al., 1985). They conducted an exploratory study to
investigate the concept of service quality. Interviews with business executives from four
different service industries were conducted and these interviews led them to conclude that
there are discrepancies (gaps) between what management believes service quality
constitutes and what customers believe service quality is. This set of gaps was seen as
the major obstacles in attempting to deliver a service which customers perceive as being
of high quality (Parasuraman et al., 1985:44). These gaps are illustrated in Figure 3.3 on
the next page.
Gap 1: Customer expectation – management perception gap
There are inconsistencies between customer expectations and management perceptions
of those expectations. Managers of service organisations may not always understand what
features indicate high quality to customers, what features a service must have in order to
meet customers’ needs, and what the level of performance on those features should be to
deliver high quality service. As a result, customers’ service quality perceptions may be
affected (Parasuraman et al., 1985:44).
Gap 2: Management perceptions – service quality specification gap
The gap between management perceptions of customer expectations and the actual
specifications established for a service may occur as a result of resource constraints,

70
market conditions and a lack of management commitment to service quality. This
discrepancy may affect the service quality perceptions of customers (Parasuraman et al.,
1985:44).
Figure 3.3: Service quality – identification of gaps
CUSTOMER
GAP 5
MARKETER GAP 4 GAP 3
GAP 1
GAP 2
Source: Parasuraman et al. (1985:44)
Gap 3: Service quality specifications – service delivery gap
Although firms may have formal standards or specifications for maintaining service quality,
it may be difficult to adhere to these standards because of variability in employee
Word of Mouth Communications
Personal Needs
Past Experience
Expected Service
Perceived Service
Service Delivery (including pre- and post-
contacts)
External Communications
to Customers
Translation of Perceptions into
Service Quality Specifications
Management Perceptions of
Customer Expectations
71
performance (Parasuraman et al., 1985:45). This will affect service quality from the
customer’s point of view.
Gap 4: Service delivery – external communications gap
This gap in the discrepancies between service delivery and what the organisation
promises through external communications and/or the absence of information about
service delivery aspects may affect customer perceptions of service quality (Parasuraman
et al., 1985:46).
Gap 5: Expected service – perceived service gap
Gap 5, the most important gap, can be regarded as a function of the first four gaps and
Parasuraman et al. (1985:46) argue that there is indeed a relationship between Gap 5 and
the first four gaps. The quality that a customer perceives in a service is a function of the
magnitude and direction of the gap between expected service and perceived service
(Parasuraman et al., 1985:46).
In order to manage service quality, it will therefore be important to manage the gaps that
exist between expectations and perceptions on the part of management, employers and
customers (Zeithaml & Bitner, 2003:25). By referring to the gap model (see Figure 3.3) the
service provider should close Gap 5, but in order to do so, the four other gaps that inhibit
delivery of quality service within the organisation should be closed (Bateson & Hoffman,
2011:328; Lau, Akbar & Fie, 2005:48).
Since service quality is considered as a multi-dimensional construct, Parasuraman et al.
(1985:46-47) also identified ten key service dimensions (see Table 3.1 on the next page).
They recognised that regardless of the type of service, customers basically use similar
criteria in evaluating service quality.
Table 3.1 is presented on the next page.

72
Table 3.1: Determinants of service quality
Determinant Example of evaluative criteria
Tangibility Appearance of physical facilities and personnel
Reliability Performing services right the first time
Responsiveness Willingness and ability to provide prompt service
Communication Explaining service to customers in a language they can understand
Credibility Trustworthiness of customer-contact personnel
Security Confidentiality of transactions
Competence Knowledge and skill of customer-contact personnel
Courtesy Friendliness of customer-contact personnel
Understanding/
Knowing customers
Making an effort to ascertain a customer’s specific requirements
Access Ease of contacting service
Source: Parasuraman et al. (1986:6-7)
As seen in Table 3.1, only two of the determinants, namely tangibles and credibility, can
be known in advance of purchase, thereby indicating that the number of search properties
is few. Access, courtesy, reliability, responsiveness, understanding/knowing the customer
and communication are seen as experience properties and was mentioned by most of the
participants in the study. Only when the customer is purchasing or consuming the service,
can each of these properties be known to them. (Parasuraman et al., 1985:48). It was also
noted that two of the determinants that surfaced in the focus group interviews will most
likely fall into the category of credence properties (properties that customers cannot
evaluate even after purchase and consumption). These include competence (the
possession of the required skills and knowledge to perform the service) and security
(freedom from danger, risk or doubt). Parasuraman et al. (1985:48) indicate that
customers will typically rely on experience properties when evaluating service quality
because credence properties are too difficult to evaluate and only a few search properties
exist with services.

73
With insights from their study, Parasuraman et al. (1985:48) state that perceived service
quality can be positioned along a continuum ranging from ideal quality to totally
unacceptable quality. Satisfactory quality will lie at some point along this continuum.
Where a customer’s perception of service quality will be positioned on this continuum
depends on the nature of the discrepancy between the expected service (ES) and
perceived service (PS):
• when ES > PS, perceived quality is less than satisfactory and tends toward totally
unacceptable quality, with an increased discrepancy between ES and PS;
• when ES = PS, perceived quality is satisfactory;
• when ES < PS, perceived quality is more than satisfactory and tends toward ideal
quality, with an increased discrepancy between ES and PS (Parasuraman et al.,
1985:48).
Figure 3.4 below illustrates that perceived service quality is the result of the customer’s
comparison between the expected service and the perceived service.
Figure 3.4: Determinants of perceived service quality
Determinants of Service Quality
1. Access
2. Communication
3. Competence
4. Courtesy
5. Credibility
6. Reliability
7 Responsiveness
8. Security
9. Tangibles
10. Understanding/
Knowing the Customer
Word of Mouth
Personal Needs
Past Experience
Expected Service
Perceived Service
Perceived Service Quality

74
Source: Parasuraman et al. (1985:48)
Parasuraman et al. (1988) have refined their exploratory research done in 1985 with the
subsequent scale named SERVQUAL for measuring customers’ perceptions of service
quality. The original ten dimensions as identified by them in 1985 were collapsed into five
dimensions, namely reliability, responsiveness, assurance, tangibles (tangibles include
the original communication, competence, credibility, courtesy and security) and empathy (which includes the original access and understanding/knowing the customers).
The refined determinants of service quality are shown in Table 3.2 and will be briefly
discussed below the table.
Table 3.2: Refined determinants of service quality
Determinant Examples of evaluative criteria Reliability Ability to perform the promised service dependably and accurately Responsiveness Willingness to help customers and provide prompt service Assurance Knowledge and courtesy of employees and their ability to convey trust and
confidence Tangibility Appearance of physical facilities, equipment, written materials and
personnel Empathy Caring, individualised attention the firm provides its customers
Source: Parasuraman et al. (1986:14-15)
Reliability: delivering on promises. This dimension is consistently shown to be the most
important determinant of perceptions of service quality (Wilson et al., 2008:85). This
dimension includes the consistency in which service promises are met which could include
keeping schedules or appointment times, completing tasks on time, and ensuring that
outcomes are met.
Responsiveness: being willing to help. This dimension emphasises the attentiveness and
promptness in dealing with customer requests, questions, complaints and problems. This
includes the length of time a customer has to wait for assistance, answers to questions or
attention to problems. Notion of flexibility and ability to customise the service to customer
needs. Reflect customer’s point of view, not companies (Wilson et al., 2008:85).

75
Assurance: inspiring trust and confidence. This dimension is important when customers
perceive services as high risk or feel uncertain about their ability to evaluate outcomes.
The company has to seek to build trust and loyalty between key contact people and
customers (Wilson et al., 2008:86).
Tangibles: representing the service physically. Companies should provide physical
representations or images of their service that customers will use to evaluate quality, to
enhance image, provide continuity and signal quality. Most companies would however,
combine this dimension with another dimension to create a service quality strategy (Wilson
et al., 2008:86).
Empathy: treating customers as individuals. Customers are unique and special and it is
important that their needs are understood. Every customer wants to feel important and
understood by firms that provide a specific service. It would be a good strategy for
businesses to know their customers by name and build relationships that reflect their
personal knowledge of their requirements and preferences. In cases where a small firm
has to compete with larger firms, the ability to be empathetic to their customers may give
the small firm a definite advantage. In business to business firms, customers want firms to
understand their industries and issues (Wilson et al., 2008:86). This dimension is
especially important for small business tenants in shopping centres. Due to the perception
that landlords favour larger well-established anchor tenants, small business tenants may
often feel neglected and left-out. It would then mean a lot to the small tenant if landlords
would pay attention to this dimension.
Although SERVQUAL has only five distinct dimensions, these dimensions capture facets
of all original ten dimensions of the conceptual service quality domain with which the scale
development began (Parasuraman et al., 1986:15). The scale was first published in 1988
but has undergone numerous improvements and revisions since then. In 1991 the word
“should” was replaced by “would” and in 1994 the total number of items was reduced to
22. They proposed that service expectations exist at two different levels, namely desired
service and adequate service that customers use as comparison standards in assessing
76
service quality. Desired service is the level of service representing a blend of what
customers believe “can be” and “should be” provided and, adequate service is the
minimum level of service customers are willing to accept. SERVQUAL currently contains
21 perception items and a series of expectation items that reflect the five service quality
dimensions described in Table 3.3 on the next page (Wilson et al. 2008:132). Referring to
Table 3.3, for actual survey respondents, instructions are also included, and within each
dimension, each statement is accompanied by a seven-point scale ranging from “strongly
agree” (7) to “strongly disagree” (1). Only the end points of the scale are labelled; there are
no words above the numbers 2 through 6. For some of the expectation questions, the
scale ranges from 1 (lowest) through 9 (highest).
According to Wilson et al. (2008:132) the survey data gathered through the SERVQUAL
survey can be used for a variety of purposes, namely:
• to determine the average gap score (between customers’ perceptions and
expectations) for each service attribute;
• to assess a company’s service quality along each of the five SERVQUAL
dimensions;
• to track customers’ expectations and perceptions (on individual service attributes
and/or on the SERVQUAL dimensions) over time;
• to compare a company’s SERVQUAL scores against those of competitors;
• to identify and examine customer segments that differ significantly in their
assessments of a company’s service performance; and
• to assess internal service quality (that is, the quality of service rendered by one
department or division of a company to others within the same company).
Table 3.3 is presented on the next page.

77
Table 3.3: The SERVQUAL scale
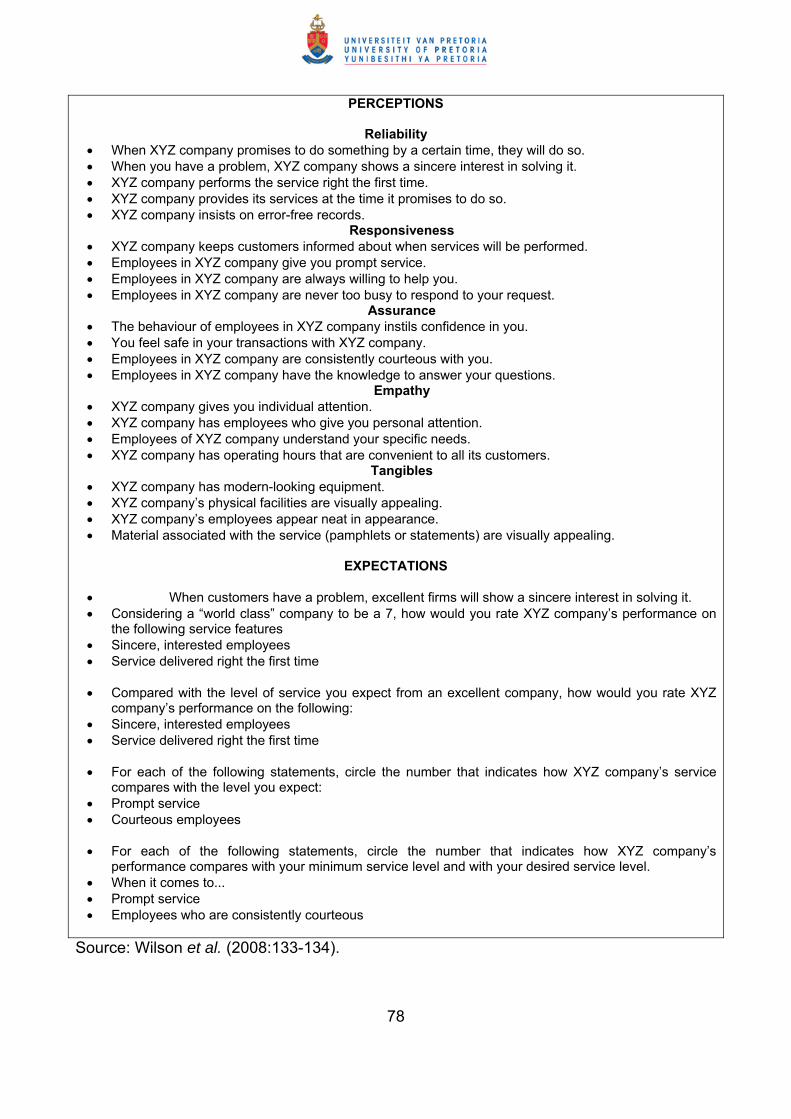
78
PERCEPTIONS
Reliability • When XYZ company promises to do something by a certain time, they will do so. • When you have a problem, XYZ company shows a sincere interest in solving it. • XYZ company performs the service right the first time. • XYZ company provides its services at the time it promises to do so. • XYZ company insists on error-free records.
Responsiveness • XYZ company keeps customers informed about when services will be performed. • Employees in XYZ company give you prompt service. • Employees in XYZ company are always willing to help you. • Employees in XYZ company are never too busy to respond to your request.
Assurance • The behaviour of employees in XYZ company instils confidence in you. • You feel safe in your transactions with XYZ company. • Employees in XYZ company are consistently courteous with you. • Employees in XYZ company have the knowledge to answer your questions.
Empathy • XYZ company gives you individual attention. • XYZ company has employees who give you personal attention. • Employees of XYZ company understand your specific needs. • XYZ company has operating hours that are convenient to all its customers.
Tangibles • XYZ company has modern-looking equipment. • XYZ company’s physical facilities are visually appealing. • XYZ company’s employees appear neat in appearance. • Material associated with the service (pamphlets or statements) are visually appealing.
EXPECTATIONS
• When customers have a problem, excellent firms will show a sincere interest in solving it. • Considering a “world class” company to be a 7, how would you rate XYZ company’s performance on
the following service features • Sincere, interested employees • Service delivered right the first time • Compared with the level of service you expect from an excellent company, how would you rate XYZ
company’s performance on the following: • Sincere, interested employees • Service delivered right the first time
• For each of the following statements, circle the number that indicates how XYZ company’s service
compares with the level you expect: • Prompt service • Courteous employees • For each of the following statements, circle the number that indicates how XYZ company’s
performance compares with your minimum service level and with your desired service level. • When it comes to... • Prompt service • Employees who are consistently courteous
Source: Wilson et al. (2008:133-134).
79
From the literature on SERVQUAL so far, it seems as if it will be possible to use the
SERVQUAL instrument to assess the landlord’s service quality to small business tenants
along each of the five dimensions. SERVQUAL can also be used to compare one
landlord’s SERVQUAL scores against those of other shopping centres that will be part of
this study.
As mentioned before, SERVQUAL has been used to measure perceived service quality of
customers in a variety of service industries. Although several of these researchers have
modified the SERVQUAL dimensions to fit their research purposes and the specific service
industry they have conducted the study in, numerous recent empirical studies have applied
this instrument/modification of it successfully in a variety of industries. These include
studies in healthcare services (Arasli, Ekiz & Katirciogly, 2008; Chaniotakis &
Lymperopoulos, 2009; Dagger, Sweeney & Johnson, 2007; Etgar & Fuchs, 2009; Lin,
Sheu, Pai, Bair, Hung, Yeh & Chou, 2009; Ramsaran-Fowdar, 2008; Rashid & Jusoff,
2009; Rohini & Mahadevappa, 2006; Vinagre & Neves, 2008; Wicks & Chin, 2008), non
profit organisations (Haley & Grant, 2011), mobile communication services (Kung, Yan &
Lai, 2009; Lai, Hutchinson, Li & Bai, 2007; Negi, 2009; Rahman, 2006), the fast food
industry (Bougoure & Neu, 2010), the public service sector (Agus, Barker & Kandampully,
2007), the banking sector (Kumar, Kee & Charles, 2010; Kumar, Kee & Manshor, 2009;
Nadiri, Kandampully & Hussain, 2009; Petridou, Spathis, Glaveli & Liassides, 2007), the
restaurant industry (Kueh & Voon, 2007), the hotel industry (Ramsaran-Fodar, 2007), the
computer software industry (Dos Santos, De Oliveira & Da Silva, 2009), the information
technology industry (Roses, Hoppen & Henrique, 2009), higher education (Chatterjee,
Ghosh & Bandyopadhyay, 2009), professional sports (Theodorakis, Alexandris & Ko,
2011), the automobile service sector (Saravanan & Rao, 2007), call centres (Ramseook-
Munhurrun, Naidoo & Lukea-Bhiwajee, 2009), the tourism industry (Kvist & Klefsjö, 2006),
the insurance industry (Tsoukatos & Rand, 2006) and the airline industry (Chau & Kao,
2009).
Since its inception, SERVQUAL was however, not without its fair share of criticism. A
major criticism is the problem of measuring expectations (Carman, 1990; Cronin & Taylor,
1992; Gilmore & McMullan, 2009:645; McDougal & Levesque, 1994). Some researchers
(Juga, Juntunen & Grant, 2010; Ladhari, 2009a; McDougal & Levesque, 1994) for
80
instance, think that measuring expectations is unnecessary and that measuring
perceptions of outcomes should be enough. Grönroos (in Wilson et al., 2008:133)
suggests three problems when measuring comparisons between expectations and
experiences over a number of attributes.
• If expectations are measured after the service experience has taken place, which
frequently happens for practical reasons, then what is measured is not really
expectation but something which has been influenced by the service experience.
• It may not make sense to measure expectations prior to the service experience
either, because the expectations that exist before a service is delivered may not be
the same as the factors that a person uses when evaluating their experiences.
• A customer’s view of their experience in a service encounter is influenced by their
prior expectations. Consequently, if expectations are measured and then
experiences are measured, then the measures are not independent of each other
and the expectations are actually being measured twice.
The pairs of statements in the SERVQUAL questionnaire, designed to capture responses
on both expectations and perceptions, make the questionnaire relatively complicated.
Where he uses SERVQUAL to assess customer satisfaction within public sector services,
there is subjective evidence in his study that some customers were discouraged from
completing the questionnaire because of its apparent length and complexity (Wisniewski,
2001:386).
Ladhari (2009a) found the five dimensions of SERVQUAL to be useful and applicable to
the Canadian banking industry, but decided that measuring clients’ expectations of service
quality is not useful and therefore measures only the perceptions of service quality in his
study. Likewise, Theodorakis, Kambitis, Laios and Koustelios (2001) developed the
SPORTSERV scale (a modified SERVQUAL scale) to assess only the perceptions of
service quality among sport spectators and not their expectations as well. Etgar and Fuchs
(2009) also measure service quality perceptions only in their study in healthcare services.
Other recent studies where only perceptions of service quality were used are those of

81
Andaleeb and Conway (2006), Jain and Gupta (2004), Olorunniwo et al. (2006) and Qin,
Prybutok and Zhao (2010).
With regard to the current study, it will also not be considered to give the small business
tenants two questionnaires that will represent expected quality and perceived service
quality. Two questionnaires will be time-consuming and clumsy and the feeling is that
fewer small business tenants would as a consequence, be prepared to take part in the
study.
Another general critique is that the dimensions used in the SERVQUAL instrument are not
appropriate for all service offerings and need to be contextualised to reflect different
service activities (Babakus & Boller, 1992; Carman, 1990). In recent research studies,
Kumar et al. (2010) and Lai et al. (2007) add one dimension (convenience) to the original
five dimensions. Kumar et al. (2009) only kept two original dimensions (tangibility and
reliability) and added competence and convenience in their study of service quality in
banks. Saravanan and Rao (2007) made use of six dimensions of which only one
(tangibles) was retained. Ramsaran-Fodar (2007) and Negi (2009) found the five original
dimensions useful but added another two to their studies. From SERVQUAL’s inception
however, Parasuraman et al. (1988:31) have indicated that it may be necessary to add or
delete dimensions from the SERVQUAL scale to suit particular service industries. The
original dimensions however, do provide a valuable starting point for the development of
an appropriate tool.
3.4.3 Performance only model of Cronin and Taylor (SERVPERF)
One of the better known alternatives to SERVQUAL is the SERVPERF instrument, (Cronin
& Taylor, 1992) which measures experiences only and does not ask respondents about
expectations. As a result, SERVPERF uses only the perceptions part of the SERVQUAL
scale. They argue that service quality is better predicted by perceptions of actual service
received only and not as the difference between perceptions and expectations as
suggested by Parasuraman et al. (1988). Experiences are measured over a range of
attributes that was developed to describe the service as conclusively as possible. Although
82
Cronin and Taylor (1992) do not disagree with the definitions of service quality that regard
it as the difference between expectations and the perceptions of customers, they do differ
in the manner in which to measure perceptions of such services. They maintained that
performance instead of “performance-expectation” determines service quality and they
reason further that customer expectations are built into the performance and is therefore
not necessary to measure it separately (Kelkar, 2010:424).
Carrillat et al. (2007:473) state that both SERVQUAL and SERVPERF received an equal
amount of citations during the last several years. Nevertheless, although SERVPERF
gained popularity, it has not reduced SERVQUAL’s usage among researchers. In their
study Carrillat et al. (2007:485) found that both SERVQUAL and SERVPERF scales are
adequate and equally valid predictors of overall service quality although they admit that the
SERVQUAL scale would have greater interest for practitioners. Andronikidis and Bellou
(2010:579) found that SERVPERF is both theoretically and empirically superior to
SERVQUAL. Jain and Gupta (2004) concur with this finding. In their study in the fast food
restaurant industry in India, they found that SERVPERF is capable of providing a more
convergent and discriminant valid explanation of the service quality construct. They also
found that it to be the most economical measure of service quality and is capable of
explaining greater proportion of variance present in the overall service quality measured
through a single scale (Jain & Gupta, 2004:34). They however, also agree with Carrillat et
al. (2007:485) that SERVQUAL possesses superior diagnostic power to pinpoint areas for
managerial intervention.
Pérez, Abad, Carrillo and Fernández (2007) have adapted the SERVPERF scale to the
context of public transport and demonstrated that their dimensions of SERVPERF (four
original dimensions and one new one) were suitable for their study. Several other
researchers have also preferred the SERVPERF scale in a variety of studies, namely
Andaleeb and Conway (2006) in the restaurant industry, Olorunniwo et al. (2006) in the
service factory and Qin et al. (2010) in the fast food restaurant industry. On the other hand,
critics of this model state that SERVPERF is much more industry-specific, posing
limitations on its application in a wide variety of service industries (Bahnan, Coleman &
Kelkar, 2007; Cunningham, Young & Lee, 2004). Although SERVPERF has not reached
the same level of popularity that exists for SERVQUAL it has been proven to be a reliable

83
instrument for the measuring of perceptions of service quality. It is especially appealing for
the current research study because it may be easier to administer, easier to analyse the
data and be more economical.
3.4.4 Haywood-Farmer’s conceptual model of service quality
Haywood-Farmer (1988:21) suggests that services have three basic attributes, the so-
called three Ps of service quality. These three Ps represent:
• physical facilities, processes and procedures
• people’s behaviour elements; and
• professional judgement.
Although Haywood-Farmer (1988:21) did not identify different service dimensions, he
believes that the choice of elements from each of these three sets of service quality factors
is an important, strategic managerial decision. The combination of these factors should be
chosen very carefully by managers in order to ensure an appropriate balance between the
three attributes. The relative degrees of labour intensity, service process customisation,
and contact and interaction between the customer and the service process, partially
determine an appropriate mix (Haywood-Farmer, 1988:28). To assist managers in
classifying each service correctly, Haywood-Farmer (1988:25) suggests a three-
dimensional classification scheme for services. This will then enable managers to get the
correct mix of the three Ps (see Figure 3.5 on the next page).
With services of low labour intensity, the customers’ impression of the physical facilities,
processes and procedures becomes important (Haywood-Farmer, 1988:26). If service
contact increases, the labour intensity of services increases and more attention has to be
paid to making sure that staff members behave appropriately. The services that landlords
render to small business tenants in shopping centres will typically be an example of low
labour intensity services. The emphasis would therefore be on how small business tenants
experience the physical facilities (neatness and cleanliness of the centre, aesthetics of and
modern looking centre), as well as the process and procedures (process and procedures
of dealing with complaints and lease statements).
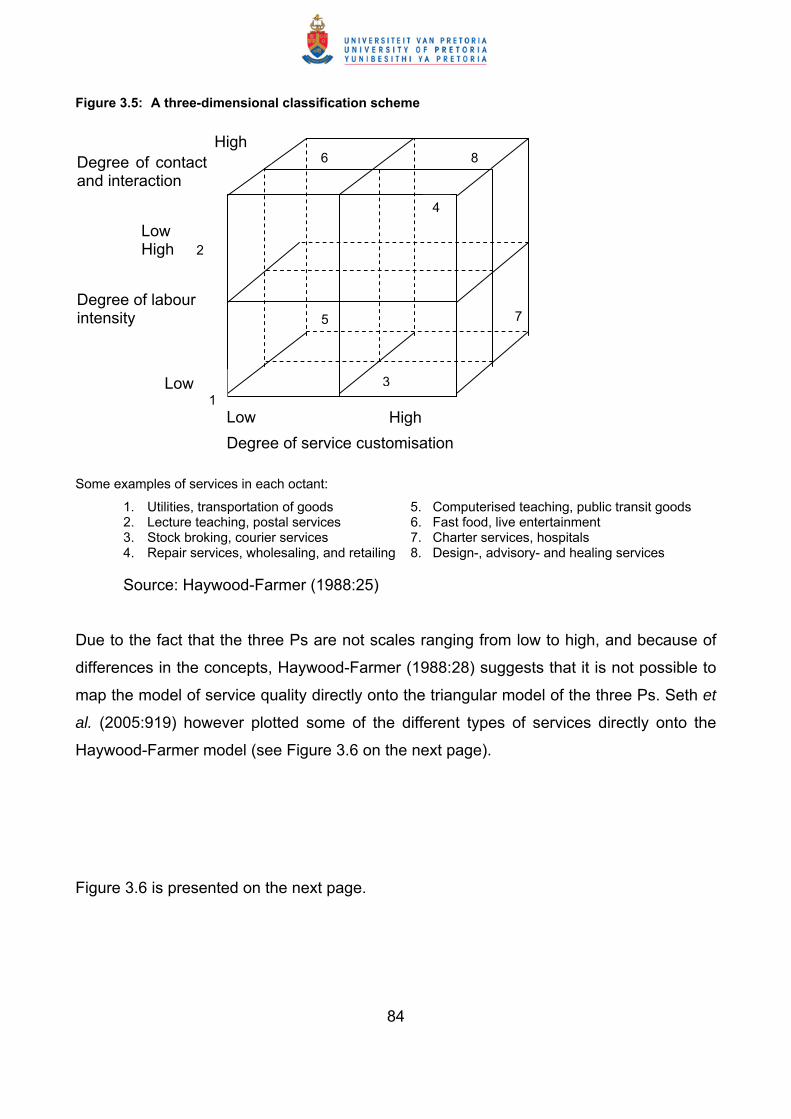
84
Figure 3.5: A three-dimensional classification scheme
Some examples of services in each octant:
1. Utilities, transportation of goods 5. Computerised teaching, public transit goods 2. Lecture teaching, postal services 6. Fast food, live entertainment 3. Stock broking, courier services 7. Charter services, hospitals 4. Repair services, wholesaling, and retailing 8. Design-, advisory- and healing services
Source: Haywood-Farmer (1988:25)
Due to the fact that the three Ps are not scales ranging from low to high, and because of
differences in the concepts, Haywood-Farmer (1988:28) suggests that it is not possible to
map the model of service quality directly onto the triangular model of the three Ps. Seth et
al. (2005:919) however plotted some of the different types of services directly onto the
Haywood-Farmer model (see Figure 3.6 on the next page).
Figure 3.6 is presented on the next page.
High
Low High 2
Degree of labour intensity
Degree of contact and interaction
Low 1
Low High
3
4
5
6
7
8
Degree of service customisation

85
Figure 3.6: Attribute service quality model
Source: Haywood-Farmer (1988) as adapted by Seth et al. (2005:919)
Managers may find this model suitable when designing the processes of the services
offered and it may also be relevant in considering the importance of the various
determinants to be measured. When the three-dimensional service classification model (see
Figure 3.5) is interpreted, it can be concluded that the different landlords cannot be plotted
on the model, simply because there is not a big variation in the contact interactions between
landlords and small business tenants in shopping centres. The three service attributes
identified by Haywood-Farmer (1988) can also not be directly compared with the three
service dimensions of Grönroos (1984) or the five dimensions of Parasuraman et al. (1985,
1986).
3.4.5 The dynamic process model of Boulding, Kalra, Staelin and Zeithaml
With their model of service quality, Boulding et al. (1993:7) attempt to provide insights into
both the process by which customers form judgements of service quality and the way
Professional Judgement Diagnosis; Competence; Advice; Guidance; Innovation; Honesty; Confidentiality; Flexibility; Discretion; Knowledge
1
2
3
45
Physical facilities and processes: Location, Layout; Décor; Size; Facility reliability; Process flow; Capacity balance; Control of flow; Process flexibility; Timeliness; Speed; Ranges of services offered; Communication
Behavioural aspects: Timeliness; Speed; Communication (verbal, non-verbal); Courtesy; Warmth; Friendliness; Tact; Attitude; Tone of voice; Dress; Neatness; Politeness; Attentiveness; Anticipation; Handling complaints; Solving problems
1. Short contact/interaction intensity-low customisation, for e.g. Hardware/grocery shop 2. Medium contact/interaction intensity-low customisation 3. High contact/interaction intensity-low customisation, for e.g. Education 4. Low contact/interaction intensity-high customisation, for e.g. Clubs 5. High contact/interaction intensity-high customisation, for e.g. Health care services
2

86
these judgements affect subsequent behaviour. They base the model (see Figure 3.7
below) on the assumption that customers’ perceptions of the service quality immediately
after a service encounter, are a mix of especially two aspects, namely their prior
expectations of what will and what should happen during the encounter, and the actual delivered service during the service encounter. They are acknowledging the fact that
customers’ perceptions and expectations change over time and therefore they establish
that the model will be able to clarify and test the relationships between expectations,
perceptions and intended behaviour (Boulding et al., 1993:24).
Figure 3.7: A dynamic process model of service quality
WE = Will Expectation
SE = Should Expectation
DS = Delivered Service
PS = Perceived Service
OSQ = Overall Perceived Service
BI = Behavioural Intention
etc...
etc...
Source: Boulding et al. (1993:12)
SE
WE
Z
SE
X
WE
DS
PS
Z
SE
X
WE
DS
PS
OSQ
BI
OSQ
BI

87
After empirically testing the model, they found that the greater the customers’ perceptions
of the overall service quality of a business, the more likely they will be to act in a way that
will be to the benefit of the business. This can include positive word of mouth
communications or customers recommending the service to somebody else. Theoretically,
businesses can therefore increase customers’ perceptions of their overall service quality
by either increasing perceptions or to lower their expectations. This however, was found
not to be the case. It is only customers’ perceptions that directly influence service quality.
To increase customer expectations of what a firm will provide during a service encounter,
in reality leads to higher perceptions of quality after a positive service experience. what
businesses can do to increase the customers’ perceptions of quality, is to manage the
customers’ expectations of what a firm should deliver, downward. The difficulty in this lies
however in the fact that, if a customers’ “will expectations” increase, the “should
expectations” also increase. In other words, if customers believe the business will deliver a
service of a certain quality (because of past experience or word of mouth communications)
they would also expect that the business should offer that quality service. According to
Boulding et al. (1993:25) the “will expectations” will however, increase faster than the
“should expectations” which will result in an increase in overall service quality.
Boulding et al. (1993:25) claim that service providers can make use of their model to get a
better understanding of the relative importance of service delivery and customer
expectations for their businesses. This insight will make it easier for service providers to
assess the relative value of trying to modify perceptions through changes in the service
delivery system and the firm’s communications. Service providers will also be able to
estimate the speed with which they can expect perceptions to change over time. Boulding
et al. (1993:25) admit that this estimation technique requires that multiple measures of
perceptions and expectations need to be made. Care should also be taken that all of the
measures within a dimension have identical influence on that dimension, and customers
with different levels of prior experience should be segmented accordingly so that the
possible differences in the updating parameters can be reflected.
Although the process model suggests that customers update their expectations and
perceptions frequently, it does not explore the antecedents of the different expectation
variables. This information can be critical for service providers because they need to

88
manage the “will expectations” up and the “should expectations” down. Another limitation
of this model is the fact that the empirical analyses do not provide evidence on the
cognitive process by which customers form, store, or retrieve perceptions. The “will
expectations” and “should expectations” in their model imply that both service quality and
customer satisfaction are addressed. In the service quality literature, expectations are
viewed as desires or wants, in other words, the “should expectations” (Lewis, 1993:4). In
the satisfaction literature, expectations are seen as predictors or probabilities made by a
customer about what will happen during a service encounter (Oliver, 1981). This model
therefore contradicts the overall belief that the two constructs, namely satisfaction and
service quality cannot be measured simultaneously. The model is rarely cited in the
literature and is not considered as a measuring tool to determine the perceived service
quality of small business tenants in the current research study as, only perceived service
quality is measured and not satisfaction and behavioural intentions as well.
3.4.6 The three-component model of Rust and Oliver
Rust and Oliver (1994) developed the two dimensions, namely functional and technical
quality further into a three-component model (see Figure 3.8 on the next page):
• the service product (the service as it is designed to be delivered – similar to technical
quality);
• the service delivery (the sequence of events and service provider role expectations –
similar to functional quality); and
• the service environment (physical ambience of the service setting).
Grönroos’s (1984, 1988) functional quality incorporates both tangibles (environment) and
the service delivery, but tangibles are identified by Rust and Oliver (1994) as a dimension
on its own. Although Rust and Oliver (1994) did not test their conceptualisation, support for
their model has been found in literature (Brady & Cronin, 2001; Martínez & Martínez,
2010:30; McDougall & Levesque, 1994).

89
Figure 3.8: The three-component model
Source: Rust and Oliver (1994)
3.4.7 The return-on-quality approach of Rust, Zahorik and Keiningham
All the various quality models presented thus far have been developed from the
customers’ point of view. Although Rust et al. (1995:59) adhere to the notion of defining
service quality from the customers’ perspective, they argue that the dimensions of service
quality to be measured should relate to the organisation’s business processes. They would
then use the survey data collected from this perspective to enable them to facilitate
change and they want the change to be actionable. For this to be realised, quality
improvement efforts must be targeted at the process and sub-process level (Rust et al.,
1995:59). It is recommended by Rust et al. (1995:59) that customer focus groups be used
in order to ensure that no major areas of concern are omitted from customer surveys, and
to ensure that survey items are worded so that it is easily understood by customers.
Apart from being organised according to business processes, the return-on-quality
approach is characterised by four assumptions, namely that
• quality is an investment;
• quality efforts must be financially accountable;
90
• it is possible to spend too much on quality; and
• not all quality expenditures are equally valid.
Rust et al. (1995) provide a framework in this approach, which can be used to evaluate the
financial impact of quality improvement efforts. This approach assumes that quality
improvement efforts must be made financially accountable and that these efforts be
treated as investments (Rust et al., 1995:59). The financial viability of a quality expense is
measured by the return-on-quality approach by quantifying the market share implications,
net present value of the resulting profit stream, and return-on-quality of a proposed quality
expenditure. This approach links on to the value-based approach of viewing quality
(discussed in section 2.4.1.5 on page 46). Since one of the main measurement
foundations of the return-on-quality model is based on customer retention or repurchase
behaviour, the use of this model in its totality is not suitable for the current study as it does
not fall within the scope of this study where only perceived service quality is measured.
3.4.8 The P-C-P service attribute model of Philip and Hazlett
The basic premise of Philip and Hazlett’s (1997:272-273) model is that it became
necessary to develop service specific service quality dimensions and that SERVQUAL’s
dimensions and other models do not adequately address some of the more critical issues
associated with the assessment of individual services. They also argue, like Cronin and
Taylor (1992) that a combined (single) scale should be used to measure the “gap”
between expectations and perceptions, rather than two separate scales. Philip and Hazlett
(1997:272) propose a model that takes the form of a hierarchical structure, based on three
main classes of attributes, namely pivotal, core and peripheral. The P-C-P model is
illustrated in Figure 3.9 on the next page.
Referring to Figure 3.9, every service consists of three, albeit overlapping areas where
many of the dimensions and concepts of service quality that have been identified before
(SERVQUAL (1985; 1988) and Grönroos (1984; 1988) for instance), are included. These
ranked levels can be loosely defined as the inputs, processes and outputs of a service
organisation.

91
The pivotal attribute at the summit of the pyramid, represents collectively the single most
determinant why the customer will decide to make use of a particular service provider. This
will be what a customer expects to achieve and receive when the service process is duly
completed (Philip & Hazlett, 1997:273). Core attributes, centred upon the pivotal attributes,
can best be described as the amalgamation of the people, processes and the service
organisational structure through which customers must interact and/or negotiate so that
they can achieve or receive the pivotal attribute. The bottom part of the pyramid focuses
on the peripheral attributes which will be the “incidental extras” designed to make the
whole service experience for the customer a complete delight (Philip & Hazlett, 1997:274).
Figure 3.9: P-C-P service attribute model of service quality
Source: Philip and Hazlett (1997:279)
PIVOTAL ATTRI- BUTES
“Acquired” Information
CORE ATTRIBUTES • Reliability • Responsiveness • Assurance • Empathy
PERIPHERAL ATTRIBUTES • Access • Tangibles
92
It is quite apparent that the core and the peripheral groupings in the P-C-P model is a
combination of the SERVQUAL dimensions and the pivotal grouping is part of the
technical quality of services advocated by Grönroos (1984, 1988). Philip and Hazlett
(1997:281) believe that the P-C-P attribute model is more appropriate than SERVQUAL for
evaluating the quality of a service. This view is confirmed by the results of a study done by
Philip and Stewart (1999:4) where they found that the output (pivotal) was as important as
(and perhaps more important than) the personal qualities (SERVQUAL dimensions) of the
staff involved in the delivery of the service. This model has however, has not found a great
number of support in the literature and will also not be considered as the measuring tool
for this research study.
3.4.9 Dabholkar, Shepherd and Thorpe’s antecedents model
Service quality was not regarded as a separate construct by any of the previous studies,
but is regarded as the sum of the components required to obtain an estimate or average of
service quality. Dabholkar et al. (2000:141) argue that service quality is better visualised
by its antecedents rather than its components. As indicated in Figure 3.10 on the next
page, this model examines some conceptual issues in service quality as the relevant
factors related to service quality. These conceptual issues are better conceived as
components or antecedents and the relationship of customer satisfaction with behavioural
intentions. Customers evaluate not only different components related to the service, but
also form a separate overall evaluation of the service quality (which is not the sum or
average of the components) (Dabholkar et al., 2000:166). The components were however,
important predictors of total service quality and Dabholkar et al. (2000:166) is of the
opinion that, for diagnostic purposes, the different components should still be measured
and evaluated. It could therefore be concluded from this model that, in addition to
measuring the different determinants of service quality, a global measurement is also
required and should be added to the measuring instrument.
The antecedents model of service quality is depicted in Figure 3.10 on the next page.
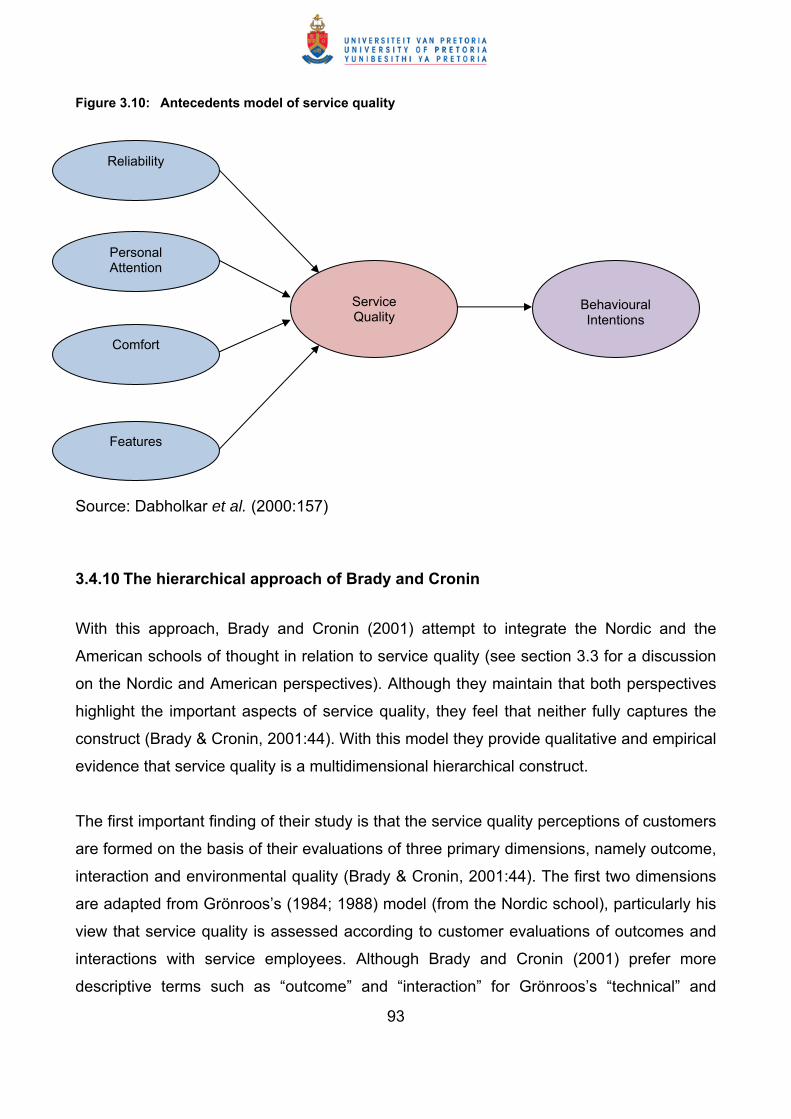
93
Figure 3.10: Antecedents model of service quality
Source: Dabholkar et al. (2000:157)
3.4.10 The hierarchical approach of Brady and Cronin
With this approach, Brady and Cronin (2001) attempt to integrate the Nordic and the
American schools of thought in relation to service quality (see section 3.3 for a discussion
on the Nordic and American perspectives). Although they maintain that both perspectives
highlight the important aspects of service quality, they feel that neither fully captures the
construct (Brady & Cronin, 2001:44). With this model they provide qualitative and empirical
evidence that service quality is a multidimensional hierarchical construct.
The first important finding of their study is that the service quality perceptions of customers
are formed on the basis of their evaluations of three primary dimensions, namely outcome,
interaction and environmental quality (Brady & Cronin, 2001:44). The first two dimensions
are adapted from Grönroos’s (1984; 1988) model (from the Nordic school), particularly his
view that service quality is assessed according to customer evaluations of outcomes and
interactions with service employees. Although Brady and Cronin (2001) prefer more
descriptive terms such as “outcome” and “interaction” for Grönroos’s “technical” and
Reliability
Personal Attention
Comfort
Features
Service Quality
Behavioural Intentions
94
“functional quality” terms, their first two constructs could represent the technical and
functional quality dimensions of Grönroos (1984; 1988). The third primary dimension in
Brady and Cronin’s (2001) model reflects the influence of the service environment on
quality perceptions. As a result, they provide the first empirical evidence of Rust and
Oliver’s (1994) three-component conceptualisation of service quality model.
Brady and Cronin (2001:37) further find that the three primary dimensions, namely
interaction, environment and outcome have three sub-dimensions. Customers will first
make an assessment of the three corresponding sub-dimensions before they evaluate the
primary dimensions. The customers’ assessment of the sub-dimensions will therefore
influence their evaluation of the primary dimensions and these perceptions will lead to an
overall service quality perception (Brady & Cronin, 2001:37). Based on these findings, a
hierarchical conceptualisation of service quality seems appropriate (Brady & Cronin,
2001:44).
Brady and Cronin’s (2001:44) results further show that the three dimensions of reliability,
responsiveness and empathy, as suggested by the American school (Parasuraman et al.,
1985; 1988) are important for the provision of superior service quality. Brady and Cronin
(2001:44) however, argue that these three dimensions are only modifiers of the sub-
dimensions and not direct determinants of service quality. The implication of this is that
these “modifiers” represent how each sub-dimension is evaluated (reliable or not,
responsive or not, and so on), whereas the sub-dimensions would answer the actual
question as to what about the service should be reliable, responsive and empathetic.
The hierarchical approach of Brady and Cronin (2001) is depicted in Figure 3.11 on the
next page.

95
Figure 3.11: The hierarchical approach
R = a reliable item
SP = a responsiveness item
E= an empathy item
The broken line indicates that the path was added as part of model re-specification
Source: Brady and Cronin (2001:37)
Service Quality
Physical Environment
Quality
Interaction Quality
Outcome Quality
Attitude Ambient Conditions
Design Social Factors
Beha- viour
Ex-pertise
Waiting Time
Tan- gibles
Valence
SP SP SP SP SP SP SP SP SP R E R E R E R E R E R E R E R E R E

96
3.4.11 Grönroos’s model as adapted by Kang and James
Kang and James (2004) attempt to capture in their model of service quality, the
perspective that conceptualises service quality in relation to functional quality, technical
quality and image (see Figure 3.12).
Figure 3.12: Adaptation of Grönroos’s model by Kang and James
Source: Kang and James (2004:269)
Reliability
Assurance
Tangible
Empathy
Responsive- ness
Functional Quality
Service Quality Percep-
tion
Technical Quality
R
R
A
A
T
T
E
E
R
R
Customer Satis- faction
Image
T
T

97
The majority of research pertaining to service quality has focused on the measurement of
service quality based on the functional dimension only. Kang and James (2004)
empirically tested Grönroos’s (1984; 1988) conceptual model and they confirmed the five-
factor structure of the SERVQUAL instrument (Kang & James, 2004:274). They found
that the high correlations between the five SERVQUAL factors are an indication that the
constructs are represented by a second-order latent variable, namely functional quality. It
is, however, sensible to consider that there are other sub-dimensions of service delivery
that should be assessed as part of a firm’s functional quality (Kang & James, 2004:274).
Their study also confirmed the multidimensional nature of service quality which supports
the Nordic (European) perspective (Kang & James, 2004:274). The results of the study
indicated that the perceptions of overall service quality is influenced by both functional
and technical quality. A third finding is the mediating role that a business’s image plays in
a customer’s perception of overall service quality. They also found that functional quality
has an influence on an individual’s mental image of a business, which suggests that the
interaction between a customer and a business’s representatives has an important effect
on a customer’s mental image of the business, and the customer’s subsequent evaluation
of service quality (Kang & James, 2004:275). Their last finding was that, although the
direct effects of functional and technical quality on overall service quality were equal, the
effect of functional quality on image was larger than the effect of technical quality.
From their findings, it was clear that technical quality, functional quality and a business’s
public image should be measured to fully capture an individual’s overall perception of
service quality (Kang & James, 2004:275). Technical quality has traditionally been
disregarded, since it was believed that customers would not be able to detect the
technical quality of services, and therefore would rely on other attributes associated with
the process of service delivery and functional quality to rate service quality. Although
functional quality may have a larger influence on perceptions of service quality for certain
services, it is important to recognise the differential influence of functional and technical
quality, on other service organisations (Kang & James, 2004:275).

98
Kang and James (2004) confirmed the fact that the service quality construct is
multidimensional with sub-dimensions or determinants for each dimension (the
hierarchical approach to service quality). They adapted Grönroos’s (1984; 1988) model
(see Figure 3.12).
3.4.12 Kang’s hierarchical structure of service quality
In a later study by Kang (2006), the hierarchical structure of service quality was proposed
(see Figure 3.13 on the next page).
Figure 3.13 is presented on the next page.

99
Figure 3.13: The hierarchical structure of service quality
Source: Kang (2006:41).
Process Quality
Outcome Quality
Reliability Assu- rance
Tangible Empathy Respon- siveness
Y Y Y Y Y Y Y Y Y Y Y Y
100
While his model only depicts the second-order factor structure, Kang (2006:41) indicates
that the full structure of a higher-order factor model for service quality should be the three-
order factor structure. There has to be a latent variable (service quality perception) that
has a direct effect on both technical and functional quality dimensions in the full structure.
Due to a lack of guidance for simultaneously analysing a third-order factor model and the
technical difficulties accompanied by the analysis, Kang’s (2006) study does not attempt
to fully analyse the third-order factor model. An alternative method to estimate the
relationship between service quality perception and technical/functional quality
dimensions was employed (Kang, 2006:41).
His model is from the perspective of the Nordic (European) researchers that define
service quality in categorical terms (technical quality and functional quality). The model
also adopted the view of several researchers who have suggested that SERVQUAL
represents only the process dimension (functional quality) of the service quality
perception (Kang, 2006:47). It was shown in his study that SERVQUAL has a distinctive
five-factor structure and that these five latent variables are correlated, suggesting the
unidimensionality of SERVQUAL. As an alternative, a second-order factor model was
implemented (see Figure 3.13), and these results supported the model well. His study
confirmed that, although the five-factor structure as proposed by SERVQUAL was
confirmed, this represented the functional quality dimension in the perception of service
quality. The study provides thus evidence that customers form perceptions of service
quality on the basis of their evaluations of two primary dimensions (technical quality and
functional quality). Kang (2006) claims that his study consisting primarily of the technical
quality and functional quality components, offers the first empirical evidence for the Nordic
(European) perspective of service quality.
3.4.13 Carr’s FAIRSERV model
Carr (2007:108) is of the opinion that an important deficiency of SERVQUAL is that it
does not include equity theory as the basis for any of its scales, even if it is clear from
101
previous experiences that equity (fairness) is often evaluated in service encounters.
According to Carr (2007:108), service customers are concerned with getting what they
deserve in relation to other customers of the same service. Customers will therefore not
only evaluate the quality of the service encounter, but also the equity thereof. FAIRSERV
posits that an important set of service evaluations results from a comparison of services
against norms of fairness and the treatment of similar customers (Carr, 2007:108).
Service customers also want the procedures used and the distribution of service
resources to be unbiased and consistently applied, not unduly favouring any one person
or group.
FAIRSERV is proposed by Carr (2007) as an addition to the SERVQUAL
conceptualisation of customer reactions to services. Carr’s (2007) model posits that one
essential perspective governing customer reactions to services is an evaluation of the
fairness of the service outcomes, procedures and interactions (see Figure 3.14).
According to Carr (2007:110), customers therefore do not only evaluate services against
the five SERVQUAL dimensions (tangibles, reliability, responsiveness, assurance and
empathy), but also through comparisons with multidimensional norms of fairness
(distributive, procedural, interpersonal, informational and systemic fairness). Customers
will base their comparisons in context and will depend on their knowledge of how similar
others were actually treated by the service providers and/or through counterfactual
reasoning based upon a mental simulation of how similarly others probably would, could
and should be treated by the service providers. Although a customer may feel that the
service was of high quality, he/she may feel cheated if the service is compared with what
another customer may have received. This will affect satisfaction with the service (Carr,
2007:110).
Before Carr’s (2007) model is discussed further, it is necessary to give a brief explanation of distributive-, procedural-, interpersonal-, informational-, and systemic fairness.
• Distributive fairness deals with the perceived fairness of outcomes. It is defined by
Cohen-Charash & Spector (in Carr, 2007:111) as the cognitive, affective and

102
behavioural reaction to outcome distributions from a source. Thus, when a particular
outcome or set of outcomes is perceived to be unfair, it may affect the person’s
emotions, cognitions and ultimately their behaviour (Carr, 2007:111).
• Procedural fairness is the fairness of the policies and processes contributing to
outcomes embodying certain types of normatively acceptable principles (Carr,
2007:111). All customers should receive the same service procedures and there
should be no bias in the application of these procedures. If this is not the case, the
customer may perceive the situation as unfair.
Figure 3.14: The FAIRSERV model
PROCEDURAL FAIRNESS
DISTRIBUTIVE FAIRNESS
INFORMATIONAL FAIRNESS
SYSTEMIC SERVICE
FAIRNESS
SERVICE SATISFACTION
RE-PATRONAGE INTENTION
SERVICE QUALITY
TANGIBLES
RELIABILITY
RESPONSIVE-NESS
ASSURANCE
EMPATHY
INTERPERSONAL FAIRNESS
Source: Carr (2007:121).

103
• Interpersonal fairness is showing concern for individuals regarding the manner in
which outcomes are distributed, for example, with politeness and civility (Carr,
2007:112).
• Informational fairness is providing information or knowledge about procedures that
demonstrate regard for people’s concerns (Carr, 2007:112). Interpersonal- and
informational fairness focus on the human side of distributional practices. When a
customer perceives interpersonal- and informational unfairness, he/she would
negatively react toward the responsible service employee.
• Systemic fairness is the overall fairness/unfairness judgement that emerges from
perceptions of distributive, procedural, interpersonal and informational
fairness/unfairness.
Figure 3.14 illustrates that distributive fairness, procedural fairness, informational fairness
and interpersonal fairness do have an influence on how customers judge overall fairness
(systemic fairness). The systemic fairness construct is a distinct construct from its
antecedents (distributive, procedural, informational and interpersonal fairness) and act in
its turn, as a mediator between each of the four dimensions of fairness and the
satisfaction and repatronage outcomes (Carr, 2007:122). These results show that the
more generally fair the service provider is perceived to be in its interactions with
customers, the more customers will feel satisfied and, the more likely they are to feel
loyalty towards the service provider. The perception of fairness/unfairness will then also
influence their perception of overall service quality.
Although FAIRSERV as a whole will not be suitable for the present study because of its
focus on satisfaction and repatronage intensions, it would probably be important to pay
attention to the fairness dimensions because small business tenants in shopping centres
often experience perceived unfairness when it comes to the treatment and services
provided by the landlords to them, in comparison with the bigger anchor tenants.

104
3.4.14 Other service quality models
A number of other industry-specific models were developed during the last few years that
are worth mentioning. A new model, consisting of a 29-item questionnaire, was developed
by Abdullah et al. (2011) specifically for the unique nature of the banking sector.
Senthilkumar and Arulraj (2011) developed the SQM-HI model (service quality
measurement in higher education in India) which is a 30-item scale that has been
empirically tested for unidimensionality, reliability and validity. Kersten and Koch (2010)
developed a new approach to measuring logistics service quality, which they called the
structural equation model. A hierarchical model of health service quality was developed
by Dagger, Sweeney and Johnson (2007), consisting of three levels. The model is
developed so that service quality can be measured at any one, or all of these levels
depending on the information requirements (Dagger et al., 2007:135).
Because of rapid technological advances, it is not surprising that a number of electronic
service models were developed. Cristobal et al. (2007) developed and empirically tested
a multiple-item scale for measuring e-service quality. Bauer, Falk and Hammerschmidt
(2006) developed eTransQual, a transaction process-based scale for measuring service
quality in online shopping. This model integrates both utilitarian and hedonic e-service
quality elements. Collier and Bienstock (2006) developed and empirically tested a
conceptual framework for how customers judge e-service quality in online shopping. A
broadly applicable, hierarchical quality model for electronic services that includes three
dimensions and nine sub-dimensions was developed by Fassnacht and Koese (2006).
Ibrahim, Joseph and Ibeh (2006) developed a 26-item, 5 point scale for e-banking
customers. A multiple-item scale (E-S-QUAL) for measuring the service quality delivered
by Web sites was developed by Parasuraman et al. (2005).
A summary of all the important service quality models will be given next.

105
Table 3.4: Summary of service quality models
Model Key findings Limitations/suitability for this study
1. Technical and functional quality model of Grönroos.
Service quality depends on technical quality, functional quality and corporate image of the organisation in consideration. Functional quality is regarded as more important than technical quality.
The model will not be considered for this study because it does not offer an explanation on how to measure functional and technical quality.
2. SERVQUAL model of Parasuraman et al.
The model is an analytical tool. It enables management to systematically identify service quality gaps between a number of variables affecting the quality of the offering. The model is externally focused. It can assists management in identifying the relevant service quality factors from the viewpoint of the consumer.
The model will not be considered for this study because to measure expectations as well as perceptions, will make the questionnaire relatively complicated and time-consuming.
3. SERVPERF model of Cronin and Taylor.
Uses only the perceptions part of the SERVQUAL scale. Measures service quality experiences only and not customer expectations as well. It directly reduces the number of items by 50 %.
The model will be considered for this study because the five dimensions suits the landlord-small business tenant relationship in shopping centres. By measuring only the perceptions, will make the questionnaire less complicated and more economical to administer.
4. Attribute service quality model of Haywood-Farmer.
This model provides a base of segregating service organisations on three dimensions for better management of quality. These dimensions are physical facilities, people’s behaviour elements and professional judgement. The model enhances understanding of the concept of service quality.
The model will not be considered for this study because it does not offer an instrument for measuring service quality. It does not offer a practical procedure capable of helping management to identify service quality problems or practical means of improving service quality.
5. The dynamic process model of Boulding et al.
This model attempt to provide insights into the process by which customers form judgements of service quality and the way these judgements affect subsequent behaviour. Customers’ perceptions and expectations change over time, and the model claim to test the relationships between expectations, perceptions and intended behaviour.
The model will not be considered for this study because it does not offer an instrument for measuring service quality. The model merely enhances understanding of service quality and behavioural intentions of customers.
Table 3.4 continues on the next page.

106
Table 3.4: Continued
Model Key findings Limitations/suitability for this study
6. The three-component model of Rust and Oliver.
The three components of this model are the service product, the service delivery and the service environment.
The model will not be considered for this study because it does not offer an instrument for measuring service quality.
7. The return-on-quality approach of Rust et al.
The model advocates that the dimensions of measuring service quality should be related to the organisation’s business processes. The model concentrates on making the quality improvement efforts financially viable.
The model is based on customer retention or repurchases behaviour and does not offer a practical procedure to identify service quality problems and will therefore not be considered for this study.
8. The P-C-P attribute model of Philip and Hazlett.
Provides a simple, effective and general framework of assessing service quality for any service sector. The model highlights the area of improvements for service quality depending on the frequency of the encounter. The dimensions to these three levels of attributes are individual sector-dependent and with reference to the consumer.
The model does not provide general dimensions to the three levels of attributes. It also lacks empirical validation and will therefore not be considered for this study.
9. The antecedents model of Dabholkar et al.
Service quality is better visualised by its antecedents rather than its components. This model can provide a complete understanding of service quality and how these evaluations are formed. Customer satisfaction should be evaluated separately from service quality when trying to determine customer evaluations of service.
The model measures behavioural intentions rather than actual behaviour and will not be considered for this study.
10. The hierarchical approach of Brady and Cronin.
Service quality is a multidimensional, hierarchical construct. Perceptions are based on evaluations of three primary dimension, outcome, interaction and environmental quality, which have each three sub-dimensions. The three sub-dimensions will first be evaluated and will influence evaluation of the primary dimensions that will lead to an overall service quality perception.
The model will not be considered for this study because it does not offer an instrument for measuring service quality and few efforts have been made to provide empirical evidence for this hierarchical structure.
Table 3.4 continues on the next page.

107
Table 3.4: Continued
Model Key findings Limitations/suitability for this study
11. Grönroos’s model as adapted by Kang and James.
Technical, functional and image should be measured to fully capture overall perceptions of service quality. Grönroos’s model is empirically tested and the five-factor structure of SERVQUAL is confirmed. Other than most other models, it is believed that technical quality can be assessed by customers.
The model will not be considered for this study because the technical quality- and image dimensions do not play such a big role in the landlord-small business tenant relationship.
12. Kang’s hierarchical structure of service quality.
The five-factor structure as proposed by SERVQUAL is confirmed and represents the functional quality dimension of perceived service quality. This model provides empirical evidence for the claim that perceived service quality is based on technical quality and functional quality components.
Few efforts have been made to provide empirical evidence for this hierarchical structure. It also does not offer an instrument for measuring service quality.
13. Carr’s FAIRSERV model.
The five SERVQUAL dimensions are accepted for measuring service quality, but equity (fairness) is added as an important dimension. It is felt that customers are concerned with getting what they deserve in relation to other customers of the same service. Their evaluation of the fairness of the service encounter will have an influence on their overall perception of service quality.
Since small business tenants in shopping centres often feel that they are treated unfairly in comparison with the bigger anchor tenants, especially in relation to leasing fees and location, it will be considered to add a “fairness” dimension to SERVQUAL’s five dimensions.

108
3.5 CONCLUSION
Although there is not yet a meaningful agreement on the basic fundamentals of the service
quality construct, further insight was obtained by the analyses of the various service quality
models. For the purpose of this research study, it is however, not sufficient to only have a
thorough understanding of what is meant by service quality as it does not completely solve
the problem. It is important to use an appropriate tool to measure the perceived service
quality that small business tenants in shopping centres experience from their landlords.
The various models were carefully analysed and it became clear that several of the models
are using all, or some of the SERVQUAL dimensions to measure service quality. In a study
of 30 industry specific scales of service quality, Ladhari (2008:76) also found that
SERVQUAL was utilised as a starting point for the development of the item pool for several
of their service quality instruments. The SERVPERF instrument is one of the models that
uses all five of SERVQUAL’s dimensions, namely reliability, responsiveness, assurance,
empathy and tangibles but measures only the perception of service quality and not the
expectations of customers as well. Several researchers have used the SERVPERF model
(or a modified version thereof) with success and consider it a valid instrument. The position
of this research study is that it agrees with Cronin and Taylor’s (1992) argument that it is
perceptions of actual service delivered and not a comparison between perceptions and
expectations that determines service quality. Customer expectations are built into the
perceptions that customers have of a service and it is therefore not necessary to measure it
separately.
It is therefore decided that the SERVPERF instrument will be used to measure the perceived
service quality that small business tenants receive from their landlords. From the extensive
literature review, the five dimensions of service quality proposed by this instrument
(reliability, responsiveness, assurance, empathy and tangibles) seem to fit in with the
relationship between the landlord and small business tenants in shopping centres. The fact
that small business tenants in shopping centres often feel that they are unfairly treated in

109
comparison with the bigger anchor tenants makes the FAIRSERV model also relevant to this
research study. In addition to the five dimensions of SERVPERF, the “systemic fairness”
dimension of the FAIRSERV model will be included in this research study’s model.
The model will make it possible to achieve the two main research objectives of this study,
namely to measure the perceived service quality that landlords render to small business
tenants in shopping centres, to investigate whether this model with its dimensions of
SERVPERF and one dimension of FAIRSERV are pertinent to the landlord-small business
tenant relationship in shopping centres, and the other secondary research objectives.
In the next chapter the small business tenant in shopping centres will be discussed.

110
CHAPTER 4
SMALL BUSINESS TENANTS IN SHOPPING CENTRES
4.1 INTRODUCTION
It is increasingly recognised all over the world that small businesses, especially those with
potential to grow, play an important role in the economic and social development of countries
(Craig et al., 2007:117; Crosby et al., 2006:164; Nieman & Niewenhuizen, 2009:12;
Wickham, 2006:39). Much employment is generated by small businesses and it is widely
considered to be vital for competitiveness and economic growth (Caniëls & Romijn,
2005:591; Nieman & Niewenhuizen, 2009:14; Stokes & Wilson, 2010:152). It is from this
understanding that the South African Government has since 1994 strived to create a
favourable environment for small businesses as vehicles to address the challenges of job
creation, poverty alleviation, economic growth and equity (Department of Trade and Industry,
1995:vii; Rogerson, 2004:765). The major role played by the government since then is
through institutional restructuring, policy and regulatory reform that create a favourable
environment for various institutions to work together and support small businesses in the
country. If leases to small businesses in shopping centres were found to be inhibiting their
ability to survive and to grow, it would be a cause for considerable concern that would be
contrary to the Government’s efforts.
Retail land uses constitute a significant part of the urban environment in all developed, as
well as in a substantial and growing proportion of developing countries (Prinsloo, 2010:1). It
is therefore important that careful consideration should be given to retail location. Retail
location has long been considered as an important strategic business decision for a number
of reasons (Yan & Eckman, 2009:24). Firstly, customers’ store choice decisions are to a
large extent influenced by accessibility of retail locations according to spatial interaction
models, which indicate the relationship between a customer’s perception of utility and
111
characteristics of a destination. Secondly, a sustainable competitive advantage through
location strategy can be developed by retailers (Levy & Weitz, 2009:210). The most crucial
measures of a location’s and site’s value are however, the number and type of people
passing by. The site with the most pedestrian traffic therefore is often the best location for a
business (Berman & Evans, 2010:287).
In South Africa, retailers, and in particular small business retailers, have a number of
location options, ranging from unplanned retail locations such as CBDs to planned shopping
centres. Small businesses have come to realise the advantages of locating their businesses
in shopping centres. Shopping centres play a major role in attracting customer traffic to all
the tenants because it is convenient for customers and, it provides an assortment of
merchandise that in many cases exceeds that of the CBD (Levy & Weitz, 2009:201;
Rajagpal, 2009:99; Roberts, Merrilees, Herington & Miller, 2010:598). Binding many stores
under one roof creates a synergy that attracts more customers than if the stores were
located in separate locations. In most cases, there will be a shopping centre only a short
drive from home and parking is not such a problem as in the CBD.
Although planned shopping centres are an excellent site option for most businesses, they
have some disadvantages. Firstly, the leasing fees in centres are relatively higher than those
of some free-standing- and CBD sites. For small business this is especially troublesome
because it can lower their eventual profits considerably. Secondly, shopping centres often
limit retailers’ flexibility in that landlords may require uniform hours and may specify the size
and type of exterior design. Finally, competition within some shopping centres can be
intense. It may be difficult, especially for small speciality stores, to compete directly with
larger department stores (Levy & Weitz, 2009:201).
In spite of these difficulties, many small businesses found that the advantages of locating in
shopping centres far exceed the disadvantages. The landlord however, has a huge impact
on small business tenants in shopping centres. The objective of this research study is to
explore this relationship and to determine what the level of perceived service quality is that
small business tenants receive from their landlords in shopping centres.
112
In the previous two chapters, literature on services and service quality were analysed. Since
the main objective of this research study is to investigate the service quality that small
business tenants receive from landlords of shopping centres, this chapter will give an
overview of shopping centres, small businesses in shopping centres and the relationship
between tenants and the landlord.
4.2 INTRODUCTION TO SHOPPING CENTRES
The concept of the enclosed shopping centre became popular during the 1950s and early
1960s when business declined in many CBD’s. During this time, shopping centres have
become a popular way to build retail and it has since then dramatically reshaped retailing
across the world (Carter, 2009:166; Kajalo & Lindblom, 2010:47). Shopping centres have
perhaps been the most successful retail business concept of the last 50 years and have
become the most powerful and adaptable machine for consumption that the world has ever
seen (Beyard & O’Mara in Kajalo & Lindblom, 2010:47; Goedken, 2006:80). In fact, shopping
centres also play a major role in customers’ lifestyles and have become a community centre
for social and recreational activities (Damian et al., 2011:471; Howard, 2007:666; Lotz,
Eastlick, Mishra & Shim, 2010:402; Meyer-Ohle, 2009:124; Miller, 2009:33; Mirel, 2008:31;
Misonzhnik, 2011; Ng, 2003:449; Rintamäki, Kuusela & Spence, 2006:7; Terblanche,
1999:141).
The first shopping centres, as we know them today, were introduced in the USA during the
1950s and it has been estimated that there are currently almost 91 000 shopping centres in
the USA, of which 1 100 are fully enclosed (Berman & Evans, 2010:281). Recently, shopping
centre traffic and sales have however been declining in the USA and today limited resources
are being spent on new shopping centre development. Since the mid-1990s, at least 300
older shopping centres in the USA, each with one or two anchor stores, have shut down
(Levy & Weitz, 2009:202). Only five new shopping centres per year have opened between
2000 and 2005 and since 2006 no new enclosed regional malls have opened in the USA
(Bodamer, 2011). During the past three years however, there have been numerous reports

113
that regional shopping centres in the USA have weathered the storm better than any of their
supposed replacements, such as lifestyle centres (Bodamer, 2010; Bodamer, 2011;
Misonzhnik, 2010; Misonzhnik, 2011).
The first completely covered shopping centre in South Africa was Hyde Park Corner,
developed in 1969, and the first regional shopping centre was Sandton City that opened in
1973 (Cloete & Skinner, 2002:22). In contrast with the situation in the USA, South Africa has
seen unprecedented growth in the demand for shopping centre retail space during the past
15 years, resulting in a significant shift in shopping focus from CBDs to suburban areas
(Uys, 2009). In the five year period between 2006 and 2010, South Africa recorded the
highest boom period ever in terms of shopping centre development, with the total amount of
new retail space built over this period being an incredible 2,8 million square metres (Muller,
2009:21). From 2000 to 2005 1,4 million square metres of retail space was added to the
market. Since 2007 alone, South Africa’s total of shopping centres bigger than 30 000
square metres has surged by 50 percent, from 88 to 131 (Business Day, 2011a). Currently,
South Africa has approximately 1 619 formal shopping centres, ranging from 1 000 square
metres up to almost 150 000 square metres. These centres represent approximately 17
million square metres of an estimated 37 million square metres of all retail facilities (Prinsloo,
2010:1).
The declining market for some shopping centres in the USA may perhaps be all the more
reason for shopping centre landlords in South Africa to improve their efforts in providing high
quality services to their tenants. This research study may provide shopping centre landlords
with the reality of how small business tenants perceive their services and may be an
encouragement for them to pay attention to this important matter.
With the growing number of shopping centres, shoppers tend to be more selective.
Shoppers in general are more likely to support centres that are more attractive and have a
wide variety of stores and merchandise (El-Adly, 2007:937; Teller & Reutterer, 2008:130). If
shoppers therefore prefer a specific shopping centre, the tenants will be more successful
and they will tend to stay in the shopping centre. Shopping centres have indeed become a

114
prominent feature and an integral part of the modern urban landscape that today exist in
towns and cities of widely divergent cultures and economies (Cloete & Skinner, 2002:2). One
reason for this is that customers, in response to increasing time scarcity, have begun
performing more than one activity at a time. This translates into multi-purpose shopping and
one-stop shopping and accounts for the success of shopping centres (Carpenter, 2008:5;
Martin, 2009:49; Reimers & Clulow, 2009:543).
4.3 DEFINITION OF A SHOPPING CENTRE A range of definitions have been developed for shopping centres. A commonly used
definition states that a shopping centre is “a group of retail and other commercial
establishments that is planned, developed, owned and managed as a single property, with
on-site parking provided” (Berman & Evans, 2010:280; Goedken, 2006:80; Levy & Weitz,
2009:199; Pitt & Musa, 2009:40). A definition by Haque and Rahman (2009:170) describes a
shopping centre as “basically a clean, protected place, where several businesses (retail,
leisure and entertainment) are gathered in self contained, roof-over space with single
location parking, designed so that people could both shop and spend time in a pleasurable
atmosphere”.
4.4 TYPES OF SHOPPING CENTRES
Various types of shopping centres may be distinguished in relation to functional, locational
and physical criteria. Although South African shopping centres are in many respects similar
to shopping centres in the USA and Europe, there are some differences, especially
regarding the type of key tenants, the number of smaller shopping centres and the continued
importance of the CBDs (Foreman, Skinner & Cloete, 2002:55). A distinction between the
different types of shopping centres from a South African perspective will first be done
according to their size criteria (Table 4.1) and location criteria (Table 4.2). This is done by
primarily using the latest South African classification by Prinsloo (2010). Thereafter the
different types of shopping centres will be briefly discussed.

115
Table 4.1: Size criteria of different types of shopping centres in South Africa
Type of centre Size of centre (m²)
Number of stores
Size of land (ha)
Small free standing and convenience
500 -5 000 5-25 0,15 – 1.5
Neighbourhood 5 000 – 12 000 25 - 50 1.5 – 3,6
Community 12 000 – 25 000 50 – 100 3,6 – 7,5
Small regional/ Large community 25 000 – 50 000 75 – 150 7,5 - 15
Regional 50 000 – 100 000 150 – 250 15+
Super regional Bigger than 100 000 More than 250
Lifestyle 17 000 - 50 000 50 – 125 4,5 – 12+
Value/Strip 10 000 - 50 000 20 – 40 3 – 12+
Source: Prinsloo (2010:8-44)
Table 4.2: Location criteria of different types of shopping centres in South Africa
Type of centre Average radius of primary trade area
Median travel time to the
centre
Access requirements
Small free standing and convenience
1 – 1,5 kilometres 2 – 3 minutes Suburban street or minor collector road
Neighbourhood 1,5 - 2 kilometres 4 – 9 minutes Major collector road
Community 2,5 – 3 kilometres 6 – 14 minutes Major arterial road
Small regional/ Large community
3 – 5 kilometres 10 – 16 minutes Major suburban arterial road linking to a highway
Regional 5 - 8 kilometres 14 – 20 minutes Major arterial road, usually a provincial road linking to a national road
Super regional 10+ kilometres 24 – 30 minutes Major arterial road, usually a provincial road linking to a national road
Source: Prinsloo (2010:9-38)

116
4.4.1 Small free standing and convenience centres
These facilities aim at satisfying the local needs of the residents within one or two adjacent
suburbs. It can comprise of a single building or a number of buildings located in close
proximity to each other to provide a single destination (Prinsloo, 2010:8).
These centres can consist of one tenant or a number of very small tenants. An express
convenience function is mostly offered by these centres (Prinsloo, 2010:8). Small free
standing and convenience centres are usually located on collector streets in suburbs.
The tenant mix normally consists of an anchor tenant that is usually smaller than 1 000
square metres. Anchors typically can include a café, superette, Woolworths Food or other
smaller grocery stores such as Kwik Spar or Pick-‘n-Pay Family. Other tenants are
convenience retailers including a pharmacy, deli, butchery, video store, hairdresser, dry
cleaner, liquor store, florist and a hardware store.
Over the past 5 to 10 years, the popularity of small free standing and convenience centres
has mainly been due to more and better supermarket/grocery/food offerings. Small food
anchors like Woolworths Food have moved into these types of centres to improve the
attractiveness, to increase the trade area and to offer a specialised product (Prinsloo,
2010:8).
4.4.2 Neighbourhood centres
This retail facility is aimed at the suburban level with a larger impact than the local
convenience centre. These centres usually service the surrounding neighbourhood within a
two kilometre range for people living or working in the area (Berman & Evans, 2010:285).
Neighbourhood centres can also play an intercepting role for passing traffic to other suburbs
(Prinsloo, 2010:12). The three most critical aspects with regard to these centres are the
following:
117
• a reputable, good, attractive and well known food anchor;
• the provision of sufficient parking; and
• a very good micro location offering easy access for residents from the surrounding
suburbs.
Neighbourhood centres intended for the suburb(s) in the immediate vicinity, are usually
located on major collector roads in suburbs or township areas offering high visibility and
accessibility to passing traffic.
Neighbourhood centres are typically anchored by a supermarket and designed for
convenient shopping. This centre focuses on convenience-oriented goods and services
(Berman & Evans, 2010:285). The anchor tenant is usually larger than 1 400 square metres
with the typical tenants being Spar, Pick-‘n-Pay, Checkers, Shoprite or Woolworths Food.
The preferred supermarket is in most cases a reflection of the socio-economic profile of the
residents in the surrounding suburbs. In many cases the food offering is complimented with
stores like Fruit and Veg City and Everfresh. Other tenants in neighbourhood centres are
convenience retailers such as a pharmacy, butchery, video store, hairdresser, dry cleaner,
liquor store and a hardware store. Other tenants could include specialised stores, small
clothing stores, restaurants and takeaways, as well as services like medical and banking
facilities (Prinsloo, 2010:12).
Examples of neighbourhood shopping centres that are part of this study are Madelief Centre
with 5 971 square metres of retail space and 29 stores, Montana Corner with 7 386 square
metres of retail space and 36 stores, Moreleta Plaza with 7 934 square metres of retail
space and Waverley Plaza with 10 992 square metres of retail space, and 52 stores.
4.4.3 Community centres
The role of a community centre is to satisfy the need for shopping facilities between that of a
neighbourhood centre and that of a regional centre. The community centre has a larger
catchment area and services more households. These centres are larger than a
118
neighbourhood centre and are anchored by a discount department store and may have
additional anchors than what the neighbourhood centres have (Levy & Weitz, 2009:200).
The definition of a community centre is often not precise and are often defined the same as
neighbourhood centres and small regional/community centres.
Community centres are offering a wider tenant mix than a neighbourhood centre. These
centres however, are not large enough to offer a full range of comparative tenants.
Community centres are located on main arterial roads which are accessible from a number
of suburbs located in the area. The site typically offers high visibility to passing traffic and
accessibility to the residents in the area (see Table 4.6). Between 60 percent and 70 percent
of the customers of community centres visit these centres on at least a weekly basis where
they spend between 60 – and 80 minutes at a time (Prinsloo, 2010:16).
The anchor tenants are mostly large supermarkets bigger than 2 500m², consisting mostly of
Spar, Pick-‘n-Pay Family, Pick-‘n-Pay and Shoprite/Checkers (or combined with a
Woolworths Food store). The anchors are supported by smaller speciality stores that
typically include a pharmacy, butchery, video store, hairdresser, dry cleaner, liquor store and
a hardware store (Levy & Weitz, 2009:200; Prinsloo, 2010:16). Although to a limited extent,
national clothing stores, boutiques and shoe stores are also included in the tenants mix.
Restaurants, takeaway food stores and services like medical facilities, banking and a limited
number of office tenants make up the rest of the tenants in these centres.
Examples of community shopping centres in Pretoria that are part of this study are Glenfair
Boulevard with 16 800 square metres of retail space and 45 stores, Jakaranda Shopping
Centre with 19 000 square metres of retail space and 54 stores, Mayville Mall with 21 000
square metres of retail space and 44 stores, Quagga Shopping Centre with 23 428 square
metres of retail space and 56 stores and Waterglen Shopping Centre with 12 296 square
metres of retail space and 45 stores.

119
4.4.4 Small regional shopping centres/Large community shopping centres
These shopping centres’ role and function are mainly to satisfy the needs of the broader
community and to offer a better tenant mix than the community centres. Most of these
centres do not necessarily fulfil a true regional role, but rather that of a larger community
facility. Some of these centres can also address the needs of a specific market segment.
The tenants mix is wider and competes on both ends against community- and regional
centres.
This retail facility offers a wide variety of stores, is bigger than a community centre and is at
a better location with a wider tenant mix, but is not yet in the category of a regional centre.
These centres have good regional accessibility and the site offers high visibility to passing
traffic and easy accessibility to the residents in the community/region.
Anchor tenants of a small regional/large community centre are one large supermarket
(bigger than 4 000 square metres) with the typical tenants being Pick-‘n-Pay and
Shoprite/Checkers. Occasionally, one centre can have up to two food anchors. Convenience
retailers are also part of the tenant mix with major national clothing anchor stores like
Edgars, Woolworths and Mr Price, boutiques and shoe shops. Other tenants include
restaurants, take away food stores, entertainment such as cinemas and services such as
medical and banking facilities as well as limited office functions. The focus of the tenant mix
is on comparative shopping in clothing and household items.
In most cases, these centres fulfil the needs of the community as well as that of a wider
catchment area, because of the variety of stores available.
Examples of small regional centres/large community centres in Pretoria that are part of this
study are Mall at Reds with 58 500 square metres of retail space and 118 stores,
Wonderboom Junction with 40 000 square metres of retail space and 79 stores, Wonderpark

120
Shopping Centre with 62 950 square metres of retail space and 119 stores and Zambezi
Mall with 50 000 square metres of retail space and 85 stores.
4.4.5 Regional centres
The role and function of these centres are to satisfy the needs of a large primary and
secondary catchment area. These centres are often supported by a strong workforce in the
immediate vicinity. Regional centres offer a wider entertainment component to attract
people, especially during the evenings and for children during holiday periods. These
centres also act as a catalyst for the establishment of a mixed use node with retail facilities,
office firms, hotels, residential development and entertainment. These areas then develop
into strong nodal areas (Prinsloo, 2010:25).
This is a large retail facility offering a wide variety of stores, sufficient parking facilities and a
significant entertainment component. Regional centres are typically located near a major
arterial road, usually a provincial road linked to a national road offering very high
accessibility and visibility.
Regional centres can vary greatly in size and in many cases, two large supermarkets (larger
than 3 500 square metres each) or one large supermarket of 8 000 square metres, are the
anchor tenants (Berman & Evans, 2010:283; Pitt & Musa, 2009:43; Prinsloo, 2010:25).
Typical anchor tenants will be Pick-‘n-Pay, or Pick-‘n-Pay Hyper, Shoprite/Checkers, or
Checkers Hyper. A wide range of convenience retailer, clothing anchor stores such as
Edgars, Woolworths, Mr Price, Foschini and Truworths, boutiques, shoe stores, restaurants,
food court areas, entertainment such as cinemas, electronic games/games arcades and
other services such as medical facilities, banking, cell phone service centres and office
functions make up the rest of the tenant mix. The focus of the tenant mix is on comparative
and destination shopping specifically in clothing and household items.
Examples of regional centres in Pretoria that are part of this study are Brooklyn Mall, with 81
830 square metres of retail space and 159 stores, Centurion Mall with 105 000 square

121
metres of retail space and 217 stores and Kolonnade Shopping Centre with 72 736 square
metres of retail space and more than 155 stores.
4.4.6 Super regional centres
The role and function of these centres are to provide retail facilities for the whole
metropolitan area, a large region, as well as national and international tourists (Berman &
Evans, 2010:284; Levy & Weitz, 2009:201; Pitt & Musa, 2009:43; Prinsloo, 2010:29). These
centres offer a very wide tenant mix, entertainment, services and the latest retail concepts.
Super regional centres are a very large retail facility offering the widest possible variety of
stores, an appealing shopping atmosphere, open and under cover parking facilities with a
large entertainment component. Customers typically come as far as 15 to 70 kilometres to
take advantage of the full range of merchandise and services offered by the major stores
(Evans, 2010:284; Levy & Weitz, 2009:201; Pitt & Musa, 2009:43).
Super regional centres are situated in close proximity of a major arterial road, usually a
provincial road linked to a national road offering very high accessibility and visibility.
These centres are characterised by the widest possible tenant mix with at least six anchor
tenants that include groceries, clothing (all the national clothing brands), household goods (a
wide variety of comparative home- and décor stores) and entertainment (cinemas, electronic
games and exciting/fun facilities). The main focus of this type of centre is a wide range of
entertainment facilities, and to provide the latest trends in all retail products and categories.
New retail concepts are normally tested and first implemented on the super regional level
(Prinsloo, 2010:30).
An example of a super regional shopping centre in Pretoria that is part of this study is
Menlyn Shopping Centre, with 118 253 square metres of retail space and 300 stores.

122
4.4.7 Lifestyle centres
Lifestyle centres is an emerging retail location that are gaining popularity over traditional
enclosed shopping malls, especially in the USA (LaSalle, 2006:2; Levy & Weitz, 2009:204;
Little, 2006:35; Wright, 2003:24; Yan & Eckman, 2009:29). A Lifestyle centre is an open-air,
pedestrian-friendly project located near affluent residential neighbourhoods that includes at
least 17 000 square metres of retail space occupied by upscale national chain speciality
stores and restaurants. A heavy emphasis is placed on design and landscaping, giving the
lifestyle centre a village square or Main Street atmosphere (Little, 2006:35; Reimers &
Clulow, 2009:544). The design of these centres allows customers to have a distinct shopping
experience by walking around in an open-air plaza with individual storefronts in sight and
street furniture available. These outdoor retail settings are providing an ambiance that
encourages customers to feel more relaxed and enjoy their shopping experience (LaSalle,
2006:2; Levy & Weitz, 2009:204; Miller, 2009:32; Yan & Eckman, 2009:24-25).
The typical tenants that will be found in a lifestyle centre are:
• coffee shops;
• upper class restaurants;
• high fashion clothing shops;
• Woolworths and other national flagship stores;
• book shops;
• good quality home ware stores;
• music stores;
• furniture stores; and
• other speciality stores.
Examples of Lifestyle centres in Pretoria that are part of this study are Brooklyn Design
Square, with 13 500 square metres of retail space and 35 stores, Lynnwood Bridge with 13
000 square metres of retail space and 29 stores and West End Life Style Centre with 23
stores.
123
4.4.8 Value/strip centres
The role and function of a value centre are to compliment the retail facilities that are not
necessarily represented in large regional and super regional centres. These centres do not
necessarily offer a full range of goods compared to other centres in the hierarchy. They are
usually limited to specific product types. Only a few clothing stores are represented in this
type of centre (Prinsloo, 2010:44).
Value/Strip centres normally complement other retail offerings in a particular node or sub
node. These centres do not duplicate and compete with adjacent regional and super regional
centres. The emphasis is on quality products at affordable prices. In some areas more than
one value centre is found within the same node because of a variety of different products
provided by different retailers (Prinsloo, 2010:44).
Most of these centres also offer a strong food/grocery component. The function therefore is
destination and convenience driven. The value centres are mostly occupied by traders
requiring large space and are destination oriented. Value/Strip centres are a collection of
particular or complementary merchandise category dominant stores. The design and layout
of the centre is open, with parking in front of the stores. The quality of the building is good
but basic, with no extra frills (Prinsloo, 2010:44).
Some of the traders in these centres, such as Mr Price, Look & Listen and Incredible
Connection are located in both shopping centres and in value centres. Sometimes a grocery
store, and recently also hypermarkets, form part of the tenant mix. Value/Strip centres are in
most cases complementary to traditional centres because of a different tenant mix.
There are basically two trends emerging from successful value centres, namely a location
next to a regional centre, or a facility fulfilling a regional role like a Hyper store or
Makro/Trade Centre. Alternative locations at highly visible and accessible locations along a
main or national road prove to be more successful.

124
A value/strip centre could have the following type of tenants:
• specialised retailers occupying a large space, offering a wide variety of products at
competitive prices, for example Incredible Connection, CD Warehouse, Hi-Fi
Corporation, Sportsman Warehouse and Toys R Us (so called category killers);
• home improvement facilities like hardware, paint, furniture, tiles and interior decorating;
• a number of specific clothing stores like Clothing City and Shoe City;
• so-called factory shops;
• discounters;
• a grocery store (may vary from small to large space;
• a small component fast foods; and
• financial institutions.
For these centres to be successful, the most important requirement is to offer the right tenant
mix. In the USA the equivalent of these centres are called “power centres” (Levy & Weitz,
2009:200; Pitt & Musa, 2009:43).
Examples of a value/strip centre in Pretoria that is part of this study is Montana Crossings
with 20 508 square metres of retail space and Montana Value Centre with 30 stores.
4.4.9 Hyper centres
Hyper centres are providing supermarket facilities on a large scale. These centres also
operate on a regional scale and were developed in the 1980s and 1990s. This concept is
however not favoured by developer and retailers any more. This is now replaced with a
“value/strip centre” where the hypermarket is one of the major tenants.
4.5 SHOPPING CENTRES AS INVESTMENTS
Shopping centres are built by developers and are sold to the institutional investment
community. The core business of a shopping centre is therefore above all, an investment

125
(Musa & Pitt, 2009:198). Most of these institutions are life insurance companies and big
pension funds (Pitt & Musa, 2009:46). In South Africa a great deal of the estimated 1 300
shopping centres are also owned by pension funds and life insurance companies (Muller,
2008:24). More recently, there has been a massive inflow of investment from listed property
groups and private developers. The biggest mall owner in South Africa is the listed property
fund Growthpoint Properties Limited who has total property assets worth R45 billion, that
include regional shopping centres such as Brooklyn Mall (Pretoria), Brooklyn Design Square
(Pretoria), a share in the Kolonnade Shopping Centre (Pretoria), Waterfall Mall
(Rustenburg), Northgate Shopping Centre (Johannesburg) and 50 percent share in the V &
A Waterfront (Cape Town) (Business Day, 2011). Old Mutual’s property portfolio is worth
R26 billion. Prime properties like Gateway Theatre of Shopping (Umhlanga), Menlyn Park
(Pretoria), Montana Crossings (Pretoria) and Cavendish Square (Cape Town) are owned by
Old Mutual. Liberty Life’s property assets valued at R23 billion (including hotels and a few
offices). Liberty Life’s portfolio includes Sandton City and Eastgate Shopping Centre
(Johannesburg). Hyprop Investments’ portfolio is a substantial R17,90 billion, that includes
shopping centres such as Clearwater Mall (West Rand) and Woodlands Boulevard (Pretoria)
(Business Day, 2011). The Public Investment Corporation has an estimated R8 billion
exposure in shopping centres (Muller, 2008:24). Private developers, such as Atterbury
Property Holdings and Zenprop, have retail portfolios valued at around R7 billion and R4,50
billion respectively.
The aim of the owners of shopping centres is to secure a future stream of income in return
for their capital investment. Retail property investments do offer long-term security and a
reliable income stream to investors (Pitt & Musa, 2009:47; Singh, Bose & Sahay, 2010:59).
The owners’ main focus is therefore on making maximum profit for their investors. The
quality of management in the shopping centres is an important factor that can affect the
success or failure of the shopping centre and can have an influence on the profit for the
owners. The shopping centre management should therefore optimise the return from the
productive resource of the property, extend the productive life of the building and preserve
and enhance the capital value of the centre (Musa & Pitt, 2009:198; Pitt & Musa, 2009:47).
126
In this way the owners seek to secure a future stream on the capital investment while also
adding capital value to the investment. This quest of shopping centre management for
maximum return on investment (ROI) for their owners, often serves as a spoke in the wheel
when it comes to the service quality being offered to the tenants. In order to satisfy the
owners, centre managers often try to cut costs when it comes to services offered to the
tenants.
4.6 SHOPPING CENTRE MANAGEMENT
A shopping centre’s success is dependent on the operation and management thereof.
Shopping centre managers have the daunting task of identifying, understanding and meeting
the ongoing needs of customers, tenants and the owners. Shopping centres’ core business
is however, not retailing, but the provision of a business place that includes retail space,
facilities and services to the potential tenants. The core business of shopping centres is
therefore to lease retail space for profit (Pitt & Musa, 2009:40). The non-core business of
shopping centres is a supporting function to the core business and its tenants. This non-core
business is not aimed at generating income, but at a cost ensures the effectiveness of the
supporting function. This aspect of the non-core business of shopping centres is identified as
managing the property and facilities (Pitt & Musa, 2009:40). For centre managers in a
shopping centre to maximise the income stream, they have to optimise the operational costs.
This would be the main challenge for shopping centre managers today.
Shopping centres are becoming more complex in terms of its size, type and characteristics
and this complexity depicts the challenging role the management team face. From the onset,
it is vital for the owner to establish excellent management teams in order to face these
challenges. The reality is that all shopping centres have to compete with other shopping
centres (Pitt & Musa, 2009:54) and it is therefore essential to pay attention to service quality.
The roles of the shopping centre management team include a thorough development of
decision-making, managerial creativity and the art of management (Pitt & Musa, 2009:48).
The management teams may differ from centre to centre, because every shopping centre
127
will seek and attempt to establish the right teams to face the challenges of their unique
shopping centre in today’s competitive environment. A joint partnership-based focus on
business by all the parties involved thus seems to be important for successful shopping
centre management (Howard, 1997:267). Shopping centres have to be managed just like
any other business and a most precious asset of any business is its relationship with its
customers and suppliers. To identify, understand and meet the ongoing needs of the
customers, tenants and owners, is understandably the most consistent challenges for
shopping centre management (Alter, 2008:34; Ashley, 2009:33; Pitt & Musa, 2009:48).
The shopping centre manager has a duty to ensure the success of the shopping centre.
Three main aspects will be part of the operation and management of shopping centres,
namely property, facilities and tenant mix (tenant mix will be discussed in the next section). It
is important for the management to maintain and organise in particular the image and the
physical facilities of the shopping centre. Aside from this, it is also important to retain the
value of the property and optimise the operational cost (Pitt & Musa, 2009:49).
4.7 THE IMPORTANCE OF TENANT MIX
A shopping centre’s marketing and financial success is dependent on many factors.
Previous studies suggested tenant mix, the quality of location and accessibility, car-parking
provision, internal layout, atmosphere that the facility provides, cleanliness, security, store
layout and environment as among the main success factors (Haque & Rahman, 2009:179).
Dornbusch (1992:9) and El-Adly (2007:946) stated that the hallmarks of a well-managed
shopping centre include a clean, safe and attractive centre and, at the same time, a quality
and diverse tenant mix. These factors in combination will have an influence on whether or
not a developer/landlord will be successful in marketing the centre to both potential tenants
and potential customers.
Among these success factors, it is widely recognised that the tenant mix of a shopping
centre is most critical for all parties concerned – customers, retail tenants and the
developer/landlord (Ibrahim & Galven, 2007:242; Misonzhnik, 2010; Musa & Pitt, 2009:198;

128
Teller & Reutterer, 2008:137; Warnaby, Bennison & Davies, 2005:894; Yiu, Xu & Ng,
2008:317). The term tenant mix refers to “having a variety of stores that work well together to
enhance the performance of the entire centre as well as performing successfully as
individual businesses” (Greenspan, 1987:29).
It is important for a landlord to decide on a unique identity for the shopping centre and to use
this identity as basis for setting up a proper mix of tenants (Alexander in Ibrahim & Galven,
2007:241). Each tenant should be evaluated and the landlord should determine if the tenant
would fit the tenant mix. A tenant plan, created through market research and lengthy
investigations, will help place tenants in the accurate area of the shopping centre where they
are expected to prosper (Plant, 2009; Yiu et al., 2008:317). According to Ibrahim and Galven
(2007:242) and LaSalle (2006:3), substantial representation among a wide range of tenant
types should be a primary goal. The number and kind of stores are also linked to overall
population needs (Berman & Evans, 2010:280). It is believed that tenant diversification is a
great long-term investment strategy that will serve to absorb shocks when customer
preferences abruptly change. The most important aspect for the owners of shopping centres
and the tenants is undoubtedly traffic to the shopping centre and with the correct tenant mix,
the landlord’s profit can be maximised. Chebat, Sirgy and Grzeskowiak (2009:2), Meyer-
Ohle (2009:131) and Haque and Rahman (2009:179) also point out that with more and more
shopping centres being opened, it is essential for landlords to differentiate what they offer to
customers in order to stay competitive.
The most important element of survival for shopping centres lies with its tenants (El-Adly,
2007:946; Ibrahim & Galven, 2007:241). The tenants in shopping centres can be categorised
into two types, namely traffic attractors and traffic users (Baey in Ibrahim & Galven,
2007:241). The traffic users within a shopping centre depend on the visitors drawn by the
traffic attractors. These tenants are normally specialised shops such as jewellery stores,
exclusive boutiques, small sunglasses shops and small business retailers such as curio
shops. It is a general assumption that the smaller tenants’ survival depends on the success
of the traffic attractors. A traffic attractor is typically the tenant that draws the human traffic to
the shopping centre and controls the customer movement patterns within the centre (Ibrahim
129
& Galven, 2007:240; Mirel, 2008:29; Snyders & Cloete, 2002:364). Examples of these stores
are usually large grocery stores such as Pick & Pay, Pick & Pay Hyper, Checkers, Checkers
Hyper and Shoprite. Other traffic attractors can be large variety stores such as Woolworths
and Game. These tenants are able to draw huge crowds to them, mainly because of their
good reputation and because they have an extensive range of goods and services to offer.
These large and prominent stores within shopping centres are known as anchor tenants
(Konishi & Sandfort, 2003:413; Levy & Weitz, 2009:200; Mirel, 2008:29; Pitt & Musa,
2009:44). An anchor store can be defined as “a store that increases, through its name’s
reputation, the traffic of shoppers at or near its location” (Konishi & Sandfort, 2003:413; Levy
& Weitz, 2009:200). For many years, it was an important aim for any landlord, to secure an
anchor tenant’s lease, even before the space is available for occupation (Ibrahim & Galven,
2007:240). According to Damian et al. (2011:457), an anchor store is typically a unit
integrated within a shopping centre with a mixed variety of stores, whose purpose is to
significantly increase the centre’s appeal. Features that are typical of anchor tenants are that
they are large (usually more than 600 square metres), are a national or international chain,
has a strong brand (high awareness and positive response levels), contributes significantly
to traffic flow into the centre (specifically generates footfall), has widespread appeal (it would
trade successfully as a stand-alone unit) and usually enjoys a privileged position with regard
to rent and service charges (Damian et al., 2011:457).
Initially, anchors were typically supermarkets and department stores, but today’s anchors
can be anything from full-service department stores, mass merchandising retailers and
grocery stores, to movie theatres, restaurants, bookstores, electronic stores, upscale
retailers and gourmet food and wine markets (Mirel, 2008:29). It is generally accepted that
customers visit the shopping centre and that the particular anchor tenant’s presence will
drive traffic to that site. This in turn helps to generate sales and profits for the other smaller
independent tenants (Damian et al., 2011:471; Ibrahim & Galven, 2007:242). Emphasis is
also being placed on the anchor tenant’s role in creating movement patterns within the
centre itself and the anchoring of zones in the centre (Snyders & Cloete, 2002:365).

130
Landlords are well aware of the fact that the realisation of a maximum return on their
investment requires the presence of such a major tenant (Damian et al., 2011:471; Ibrahim &
Galven, 2007:242; Mirel, 2008:29). This is actually one of the reasons why anchor tenants
are able to enjoy rents that are far less per square metre than the smaller independent
retailers. Landlords are using this strategy to lure the well-established anchor tenants into
their shopping centres (Levy & Weitz, 2009:200). The small retailers however, do not have
much bargaining power and landlords mostly see no incentive to lower their leasing fees.
The result is therefore, that small business tenants have to pay a much higher leasing fee
per square metre than the anchor tenants (Damian et al., 2011:471; Ibrahim & Galven,
2007:243).
It is on the other hand, important for landlords to realise that the different tenant categories
(anchor stores and small independent businesses) are interdependent on attracting
customers to the shopping centre. The anchor stores will attract most customers to the
centre while a proportion of smaller retail tenants will add variety and help build a
differentiated image to attract customers. It is evident that the success of individual tenants
and the success of a shopping centre as a whole are interdependent and enhanced by the
cumulative synergy generated by the tenant mix (Damian et al., 2011:471; Carlson, 1991:15;
Ibrahim & Galven, 2007:242; Jones, 2007:42). It is also important that shopping centre
management needs to adapt and change their tenant mix strategy in response to external
forces and, that they should bear in mind that the ongoing maintenance of a centre’s market
positioning and image will most likely require periodic incremental changes (Warnaby et al.,
2005:895). To ensure the overall success of shopping centres, it is also important that
landlords realise the significance of rendering good quality service to all their tenants and,
maintaining a good relationship with them.
4.8 THE LANDLORD-TENANT RELATIONSHIP IN A SHOPPING CENTRE
Shopping centres include a complex network of internal and external relationships that can
impact on the operations and working environment of the centre (Roberts & Merrilees,
2003:1095; Whyatt, 2008:317; Yu & Ramanathan, 2008:879). The most important and most

131
critical of these relationships is the one between landlords and the tenants. This is also the
relationship that is perhaps most loaded with potential conflict (Pharr, 2010:10). An
interesting aspect of shopping centres is that their success is dependent on the success of
the tenants. It can therefore be argued that shopping centres can be seen as a joint
business of tenants and owners. It only makes sense then, that the relationship between
landlords and all the tenants (big anchors and small businesses) should be a high priority.
In this regard, Howard (1997:267) suggests that a partnership approach among all the
tenants and shopping centre management is key for the success of the centre, as
collaboration in the relationships provides mutual benefits and synergies. In order to work
jointly together for the mutual benefit of both parties, it will be important to develop good
communication and trust between them to overcome these conflicts (Alter, 2008:34;
Bodamer, 2010:6; Roberts & Merrilees, 2003:1095; Roberts et al., 2010:607). In a study by
Roberts and Merrilees (2003:1098) they found that a positive relationship does impact on a
landlord’s performance, but landlords see this impact as less significant than what the
tenants thought it to be. This is in line with Perendergast, Marr and Jarratt’s (1996) findings
that in general, landlords rated their own performance much higher than what the tenants
did.
Roberts et al. (2010:607) also found that landlords must realise that there is also benefits for
them if trust is part of their relationship. Apart from greater harmony, there are also
performance consequences of higher levels of trust, namely a higher rate of lease renewal
by retail tenants. Roberts et al. (2010:608) feel strongly about the fact that the level of
service quality provided by landlords is the most powerful way of enhancing brand attitudes
and, if they want to increase the level of favourable perception of overall service quality, they
need no improve the level of service quality. This would amongst other things, contribute to
better relations between landlords and tenants and, increase the profits for the shopping
centres.
In the opinion of Dean and Lee (1998:42), maintaining tenant satisfaction and goodwill have
become as important to property management as rent collection. It is of particular
132
importance for landlords to ensure that their tenants stay with them, as the costs of attracting
new tenants are much higher than the costs of keeping the present tenants (Ashley,
2009:34; Matzler & Hinterhuber, 1998:26; Roberts et al., 2010:609). “Suburban shopping
centres were the most successful retail establishments of the twentieth century.” This is the
view of Carter (2009:165) and it is therefore understandable that landlords in shopping
centres will have to be proactive in the area of service quality. According to Ashley
(2009:35), Dogge, Dogge and Smeets (in Appel-Meulenbroek, 2008:44) and Roberts et al.
(2010:608), satisfied tenants are more committed, making them more loyal to the landlord
and are not likely to move to other premises.
One reason why so many landlords seldom keep the promise of quality service to their
tenants is that it is often difficult to quantify. As a result, although they intend to make service
quality a top priority, they never really know how well the objective of service quality is being
achieved (Gray, 1992:48). Property managers, landlords and asset managers in the real
estate industry are acknowledging the value of measuring and benchmarking the level of
service quality as a technique for retaining tenants at their properties. Measuring service
quality can help landlords to identify the areas that can provide them with a competitive edge
and those areas that need to be improved upon (Gray, 1992:48). This research study will
attempt to give landlords a service quality measurement tool to measure their tenants’
perception of service quality received from them.
4.9 LANDLORD-TENANT CONTRACT OF LEASE
The definition of a contract of lease is “an agreement entered into by the parties when the
one party called the lessor, makes the use and enjoyment of property available to the other,
called the lessee, in return for the payment of rent” (Jacobsberg, 2009:1; Marnitz, 2002:420).
The subject matter of the lease is not the leased property itself, but the use and enjoyment
thereof. The lease is therefore the contract that controls the relationship between the
landlord and the tenant (Crosby, Hughes & Murdoch, 2006:164).

133
The relationship between the lessor and lessee is governed by the contract or by Common
Law. In terms of the Common Law the lessor’s (landlord’s) obligations are:
• to warrant against substantial or material defects;
• to make the premises available to the lessee;
• to allow the lessee undisturbed use and enjoyment of the property (warrant against
eviction);
• to maintain the leased property; and
• to pay the taxes levied against the property by any authority.
In terms of the Common Law the lessee’s (tenant’s) obligations are:
• to pay the leasing fee;
• to use the leased premises in a proper manner; and
• to restore the leased property on termination of the agreement to the lessor in the
same condition as it was received , fair wear and tear excluded.
For shopping centres, with its variety of tenants all seeking to do business with the public,
proper lease arrangements are vital for successful operation. The tenants will on the one
hand be competing with each other and on the other hand should be strengthening and
complementing each other (Marnitz, 2002:425). Leases between landlords of shopping
centres and their tenants generally have provisions affecting all aspects of the occupation.
These can include the leasing fee, the liabilities of repair and insurance, the ability to assign
(sell the business) and sublet the premises to other tenants or to break (terminate) the lease
before the expiry date (Crosby et al., 2006:164). It is therefore clear that lease terms can
have an impact on the ability of a tenant’s business to develop and grow. The lease terms
can inhibit or facilitate certain aspects of day-to-day operation and substantially affect cash
flow for the tenant’s business.

134
A commercial lease is however, a long and complex document that details how the premises
may be used and where the relationship between the tenant and landlord is set out. It can
thus be daunting, especially for small business tenants, to negotiate a lease. According to
Jacobsberg (2009:1), the following clauses to the leasing contract should be considered
before committing to the contract:
• The usage clause: a lease in a shopping centre will usually only allows the tenant to
use the premises for a specified purpose. In some cases, the tenant may be restricted
to trade under a particular brand name. Landlords are normally unlikely to be flexible
when it comes to this clause as the viability of the shopping centre depends on having
a good tenant mix.
• Merchant Association contribution: most shopping centres have a Merchant
Association. This is a group that represents the tenants and deals with matters such as
parking, use and maintenance of general areas, the marketing of the centre, and so
forth. A tenant may be obliged to contribute a monthly amount (generally a proportion
of turnover) towards the administrative expenses of this body.
• Refurbishment of the tenant’s store: the tenant will normally need some time to
install shop fittings and equipment before the shop can be opened and, it is unlikely
that the tenant will earn an income during this period. The landlord may agree that no
rental, or at least a reduced rental, be paid during this period. The landlord may
however ask the tenant to finish the shop fittings and open the shop within a
reasonable period of time.
• Compulsory trading hours: Most landlords will insist that tenants keep their stores
open for a minimum number of hours per day and a minimum number of days of the
week. The tenant will have to take into account the cost of keeping the business open
and in particular, paying staff to work these hours, even though it may not be profitable
to do so.
• Cession and sub-letting: it is very unusual for landlords to permit joint occupancy of
premises by different businesses. This is related to the issue of tenant mix as the
landlord want to retain control over the number and types of businesses in a shopping
centre. If sub-letting is allowed, a tenant will need the landlord’s consent in advance.

135
• Option to renew: tenants would want to renew their lease, especially if the business is
successful. An option to renew is very common in retail leases, but the landlord will
naturally only consider allowing the tenants to renew if they have been meticulous
about paying rent and meeting other obligations during the initial period of the lease.
Landlords may be prepared to negotiate on certain terms of leases, but they can normally
afford to be flexible only up to a certain point. Jacobsberg (2009:1) advises that small
business tenants in particular employ an appropriate professional to help them through the
process of negotiating a lease. The terms of many retail leases are detailed and complicated
and the advice of an attorney with the necessary experience is essential.
Before small businesses in shopping centres are discussed, it is necessary to define a small
business and briefly look at the most important constraints they are facing.
4.10 DEFINITION OF SMALL BUSINESS
Unemployment is one of the most important challenges faced by the government of South
Africa. This has been made worse by the fact that over the last two decades, the formal
economy (especially mining) has been shedding jobs and many workers were retrenched.
Furthermore, every year hundreds of thousands of new job seekers (the vast majority of
them youth) join the army of the unemployed.
It is accepted worldwide that the development and growth of small, micro and medium
enterprises (SMMEs) can play an important role in turning this situation around. Policies and
programmes to support the development of SMMEs are therefore an important part of the
democratic government’s programmes to create a better life.
A strategy was outlined in a White paper by the Department of Trade and Industry (the lead
department for SMME development) entitled: “A National Strategy for the Development of

136
Small Business in South Africa (May 1995)”. A year later, the National Small Business Act
was passed by Parliament, which provided a way for the institutions to implement this
strategy. Small businesses include a wide variety of business types that are independently
owned, operated and financed. The definition of small business varies between countries.
The most common criterion used to distinguish between large and small businesses is the
number of employees. Other criteria include sales revenue, the total value of assets and the
value of owners’ equity (Hatten, 2003:5). In South Africa, the National Small Business Act
No. 102 of 1996 defines a small business as:
“A separate and distinct business entity, including co-operative enterprises and non-
governmental organisations, managed by one owner or more which, including its branches
or subsidiaries, if any, is predominantly carried on in any sector or subsector of the economy
mentioned in column one of the Schedule (see Table 4.3 on the next page) and which can
be classified as a micro-, a very small, a small or a medium enterprise by satisfying the
criteria mentioned in columns three, four and five of the Schedule (see Table 4.3) opposite
the smallest relevant size or class as mentioned in column 2 of the Schedule” (National
Small Business Amendment Act, 2003).
Table 4.3 is presented on the next page.

137
Table 4.3: Classification of small businesses in terms of National Small Business Amendment Act, Act 26 of 2003
Sector or subsector in accordance with the Standard Industrial
Classification
Size of class
Total full-time
equivalent of paid
employees Less than
Total annual
turnover Less than
Total gross asset value
(fixed property
excluded) Less than
Agriculture Medium Small Very small Micro
100 50 10 5
R 5.00 m R 3.00 m R 0.50 m R 0.20 m
R 5.00 m R 3.00 m R 0.50 m R 0.10 m
Mining and Quarrying Medium Small Very small Micro
200 50 20 5
R39.00 m R10.00 m R 4.00 m R 0.20 m
R23.00 m R 6.00 m R 2.00 m R 0.10 m
Manufacturing Medium Small Very small Micro
200 50 20 5
R51.00 m R13.00 m R 5.00 m R 0.20 m
R19.00 m R 5.00 m R 2.00 m R 0.10 m
Electricity, Gas and Water Medium Small Very small Micro
200 50 20 5
R51.00 m R13.00 m R 5.10 m R 0.20 m
R19.00 m R 5.00 m R 1.90 m R 0.10 m
Construction Medium Small Very small Micro
200 50 20 5
R26.00 m R 6.00 m R 3.00 m R 0.20 m
R 5.00 m R 1.00 m R 0.50 m R 0.10 m
Retail and Motor Trade and Repair Services
Medium Small Very small Micro
200 50 20 5
R39.00 m R19.00 m R 4.00 m R 0.20 m
R 6.00 m R 3.00 m R 0.60 m R 0.10 m
Wholesale Trade, Commercial Agents and Allied Services
Medium Small Very small Micro
200 50 20 5
R64.00 m R32.00 m R 6.00 m R 0.20 m
R10.00 m R 5.00 m R 0.60 m R 0.10 m
Catering, Accommodation and other Trade
Medium Small Very small Micro
200 50 20 5
R13.00 m R 6.00 m R 5.10 m R 0.20 m
R 3.00 m R 1.00 m R 1.90 m R 0.10 m
Table 4.3 continues on the next page.

138
Table 4.3: Continued
Sector or subsector in accordance with the Standard Industrial Classification
Size of class
Total full-time equivalent of paid employees Less than
Total annual turnover Less than
Total gross asset value (fixed property excluded) Less than
Transport, Storage and Communications
Medium Small Very small Micro
200 50 20 5
R26.00 m R13.00 m R 3.00 m R 0.20 m
R 6.00 m R 3.00 m R 0.60 m R 0.10 m
Finance and Business Services
Medium Small Very small Micro
200 50 20 5
R26.00 m R13.00 m R 3.00 m R 0.20 m
R 5.00 m R 3.00 m R 0.50 m R 0.10 m
Community, Social and Personal Services
Medium Small Very small Micro
200 50 20 5
R13.00 m R 6.00 m R 1.00 m R 0.20 m
R 6.00 m R 3.00 m R 0.60 m R 0.10 m
Source: National Small Business Amendment Act No. 26 of 2003
4.11 THE ROLE OF SMALL BUSINESSES IN SHOPPING CENTRES
Small businesses require suitable locations to do business in (Crosby et al., 2006:164). It is
common knowledge that location is one of the most important factors behind business
competitiveness. Small businesses therefore seek space in shopping centres, which they
see as good locations for their businesses because the site with the most pedestrian traffic
(like shopping centres) is often the best location for a small business (Berman & Evans,
2010:287).
Small businesses often give character and uniqueness to a shopping centre and are indeed
essential to the success of a shopping centre (Haber, 2009; Ibrahim & Galven, 2007:243).
Developers and landlords of shopping centres admit that they need variety in their tenant
mix because they do not want one shopping centre end up looking like the next one (Plant,
2009; Whittemore, 1992:53). In their research, Chebat et al. (2009:2) found that shopping

139
centres with a variety of different stores are likely to be more favoured by customers than
centres with less store assortment. According to Ibrahim and Galven (2007:243) and Haber
(2009), another advantage that small tenants have over larger stores, is the fact that they
are more sensitive and more flexible in providing for the ever-changing needs of the
customers. Another important fact to remember is that small business retailers yield higher
rentals per square metre as compared to anchor tenants in the same shopping centre
(Ibrahim & Galven, 2007:243).
Although landlords of shopping centres realise the importance of accommodating small
independent businesses in their centres, it is still argued today that they are at a competitive
disadvantage regarding several issues. Kinnard and Messner (1972:21) state that since at
least 1960, there has been documentary evidence in support of the claim that small retailers
in shopping centres are discriminated against when it comes to prime retail locations in
shopping centres. Fickes (2002:20) admits that small tenants “may be getting squeezed out
of better centres here and there”. Even if a small business gets hold of a space in a
shopping centre, their difficulties do not stop there. The fact that small tenants pay a much
higher leasing fee per square metre than the anchor tenants is often the cause of inter-
tenant tensions that impact on the overall relationship between disaffected tenants and
landlords (Roberts et al., 2010:599). Crosby et al. (2006:183) also point out that, although
small business tenants get different leases in comparison with larger tenants, it does not
necessarily mean that their leases are appropriate to their needs. It does not mean that a
lease that suits one small business tenant will also suit another small business tenant. They
may have different needs with regard to the length of a lease and also the flexibility to exit
their leases early by way of assignment, subletting or a break. Because the needs of small
business tenants differ, an appropriate outcome will hinge on the individual tenant’s ability to
appreciate their business needs and to negotiate effectively (Crosby et al., 2006:183).
Another potential conflict area between small business tenants and landlords is to centre
promotions. The small tenants often perceive that they are excluded from promotional
ventures that focus primarily on the larger anchor stores (Roberts et al., 2010:599).

140
Alter (1999:61) argues that small independent tenants often fail due to a deficiency in areas
such as business knowledge, money, customer service, and merchandising or marketing.
While no landlord can ensure that all tenants succeed, Alter (1999:61) suggests that learning
to help tenants avoid these all-too-familiar problems and can help to increase turnover.
4.11.1 Lack of business knowledge
Although small business tenants may be very knowledgeable about their particular field, they
may not be shrewd businesspeople. Holmes (2006:1) concurs fully with this and says that
“statistics reveal that 90 percent of small business failures are due to a lack of knowledge or
skills on the part of the entrepreneur”. In a study done by Crosby et al. (2006:183) for
instance, they found that many small business tenants are not aware of the implications of
leases and take little appropriate advice prior to signing leases. Their priorities, especially
when it comes to lease negotiations, are dictated by immediate operational needs and little
consideration is given to future and longer-term requirements. They found that in most
cases, small tenants will not address issues such as the type of lease, assignment,
subletting and breaks.
4.11.2 Inadequate finances
Together with a lack of business skills, a lack of capital is among the major reasons for the
high failure rates among small businesses (Lotz & Marais, 2007:694; Strydom & Tustin,
2004:1). These aspects make it more difficult for small businesses to face competition and
as a result, they have a high mortality (Makatiani, 2006:1). This holds especially true for
small business tenants in shopping centres as they are faced with high leasing fees.
According to Carswell (2008), these leasing fees of small business tenants can be up to ten
times the amount per square metre than what the anchor tenants pay. Although this disparity
between the rents paid is justified by the fact that anchor tenants are magnets for the smaller
tenants and provide them with high foot traffic, they often simply do not have the sales to
meet the leasing fees (Carswell, 2008). Another drawback for small business tenants is the

141
fact that they normally secure short-term leases that provide built-in mechanisms for
increasing the leasing fees whenever deemed necessary by the landlord (Fickes, 2002:20).
It is also critical that the tenant and landlord understand how the new store will be financed
and what it will take to actually run it. Often, small start-up tenants may not understand that
their work is not complete and their worries less, once the store opens. They often do not
have adequate cash to cover their first six to twelve months in business. Sometimes they are
unprepared for the fact that they may not make money immediately (Alter, 1999:62). Small
business tenants that are independently owned and managed, usually with a relatively low
volume of sales have no “big brother” company to carry them through tough economic times.
As a result they are inevitably the first to close their door under financial pressure (Uys,
2009).
4.11.3 Inferior customer service
Small business tenants do not always understand how crucial good service quality to their
customers can be, or they may not have the knowledge on how to achieve good service
quality. Lack of experience in this regard may be one of the most pressing problems (Hatten,
2003:23).
4.11.4 Poor merchandising
Small tenants do not have the research capacities of large, national chain stores, but they
should not neglect the demographic and market research needed to pinpoint their customers
(Alter, 1999:64).
While landlords and shopping centre managers cannot make up for limited business savvy
or finances on a small tenant’s part, it is certainly possible to help tenants by taking a
proactive approach.

142
Alter (1999:64) suggests the following on how landlords and small tenants can help
themselves:
• Firm qualification procedures should be put in place by landlords. Prospective tenants
have to give landlords a business plan, including their current financial statements.
Landlords should familiarise themselves with the tenant’s business and feel
comfortable that the small tenant can be successful.
• Landlords must make sure their prospective tenant fits the tenant mix in the shopping
centre. They have to take a close look at their new tenant’s placement in the centre,
and their compatibility with the other users.
• Landlords should be a source of information and be resourceful towards tenants.
Landlords should provide their tenants with good customer service.
• Landlords should share information with their tenants about industry norms and
standards, retailing and marketing.
• If possible, landlords should provide additional marketing opportunities for tenants
within the centre.
• Landlords could develop training programmes on customer service, loss prevention,
and merchandising for the small tenants and their employees.
• Landlords should encourage communication with the tenants by visiting their stores
and talking with them about problems that they might experience.
In spite of all these suggestions and assistance offered to help small tenants in shopping
centres, the reality often looks totally different. Quite often the landlord is victimising and
bullying the small business owners in shopping centres, especially with regards to the lease
agreement (Barios, 2007; Carswell, 2008; Cockram, 2002:43; Nieman, 2000:12; Roberts et
al., 2010:599). Landlords seldom budge on any clauses or fees when it comes to small
businesses. They are treating small tenants with an attitude of “take it or leave it”.

143
Nieman (2000:12) indicates that the following clauses in most lease agreements are
discriminatory and not small business-friendly:
• Trading hours are enforced without consideration of the cost or limited manpower.
Quite often merchants’ associations are run and dominated by the anchor tenants and
it is here where shop hours and other rules are often introduced.
• The landlord must approve shop fronts and fittings. Often these are ridiculous
expectations from the centre architect for the sake of aesthetics, and thus ignoring that
beauty is in the eye of the beholder.
• Businesses cannot be sold without the prior approval of the landlord.
• Lease agreements cannot be transferred to another party without prior approval of the
landlord. Quite often a small tenant wants to cancel their lease and finds another tenant
but then the landlord refuses to release the entrepreneur from his or her obligations.
• Enforcement of electronic point of sales systems with the right of direct access to
information by the landlord. With this clause landlords ignore the right to confidentiality.
4.12 CONCLUSION
In this chapter insight was given on the landlord, tenant and the leasing contract in general
from a South African perspective. This chapter also emphasised the difficulties that small
business tenants are faced with when dealing with landlords, especially in comparison to big
anchor tenants.
This chapter concludes the literature review on service quality, small business tenants and
the relationship between landlords and tenants in shopping centres. The literature review
was of particular importance in determining the critical factors of service expected in
shopping centres by customers in general and small business tenants in particular.
In the next chapter the research methodology used in this research study will be described.

144
CHAPTER 5
RESEARCH DESIGN AND METHODOLOGY
5.1 INTRODUCTION
There would be a cause for considerable concern and it would be contrary to the
Government’s efforts to create a favourable environment for small businesses in South
Africa if the quality of services that small businesses in shopping centres receive from their
landlords were found to inhibit their ability to survive and to grow. It is therefore justified to
use a service quality model for assessing the services provided by shopping centre
managers, because it would be an essential means to improve these services and make it
more conducive for small businesses to survive.
This study is based on this issue and, the most important objective of this research study is
to assess the service quality that small business tenants receive from landlords. In order to
achieve this objective, a literature review was necessary and empirical research was
conducted as well. The literature review was dealt with in Chapters 2, 3 and 4. This chapter
will focus on the research design and methodology used to address the research objective.
Figure 5.1 on the next page illustrates the research process as used throughout this study.
This research study made use of a formal research design to test the hypotheses
formulated. In this chapter the research problem, objectives of the study, hypotheses and
data collection methods will be presented. This chapter also describes how the research
questionnaires were designed and measured to ensure that the researcher obtained valid
responses from the respondents.

145
Figure 5.1: The research process of the study
Define the research questions
Refine the research questions
Literature review (Chapters 2-4)
Research Design (Chapter 5)
Design strategy (type, purpose, time frame, scope)
Data collection
Sampling design
Questions and Instrument Pilot testing
Data analysis and interpretation (Chapter 6)
Research findings and reporting (Chapter 7)
Research proposal (Chapter 1)
146
Source: Adapted from Cooper and Schindler (2006:55)
The research proposal was summarised in Chapter 1, where the research problem and
questions were stated. As explained in Figure 5.1, Chapter 6 takes an in-depth look at the
research design, data collection and sampling design. In this chapter the data analyses and
interpretation are presented and finally, in Chapter 7, the research findings are presented.
5.2 THE RESEARCH PROBLEM
From the literature review (addressed in Chapters 2, 3 and 4) it is evident that to develop
and nurture businesses’ current and future competitive advantages, it is of cardinal
importance to consistently deliver high service quality. Like many businesses, landlords as
property managers, are also being subjected to increased competitive pressures of the
changing business environment. In several areas there is a significant amount of written
evidence regarding poor service delivery by the landlords, where small business tenants, in
particular, feel they are being victimised and bullied (Barrios, 2007; Carswell, 2008;
Cockram, 2002; Nieman, 2000). Landlords increasingly realised that their tenants should be
treated as valued customers and that it is very important that they should meet their needs
(Pinder et al., 2003:218). The issue of service quality is therefore of particular interest to
them.
There are numerous models in the literature available to measure service quality. It is
important that the right model is chosen to measure the service quality that landlords render
to small business tenants in shopping centres. An extensive search of leading electronic
journal databases, including EBSCOHost, Emerald, ScienceDirect, SABINET and Wiley
Interscience, suggest that no academic research has been done specifically on the level of
satisfaction of small business tenants in shopping centres regarding the service quality they
receive from landlords. The application of any of the models as a service quality
measurement model has consequently not been done in a landlord–small business
relationship in shopping centres.

147
This study therefore sought, to address the following research questions:
• Are small business tenants in shopping centres generally satisfied with the quality of
service they receive from landlords?
• Are the combined SERVPERF and FAIRSERV service quality models, in its original
form, suitable for measuring the perceived service quality that small business tenants in
shopping centres receive from their landlords?
• Are there any significant differences regarding the perception of service quality
provided by landlords to small business tenants depending on their position in the
business?
• Are there any significant differences regarding the perception of service quality
received between small business tenants who have been a tenant in the centre for a
short time and those who have been a tenant for long?
• Are there any significant differences regarding the perceived service quality received
between small business tenants who have been a tenant in other shopping centres
before and those who have never been a tenant in other shopping centres before?
• Are there any significant differences regarding the perceived service quality received
between small business tenants who had no or little business experience prior to
leasing in the shopping centre and those who had business experience?
• Are there any significant differences regarding the perception of service quality
received by small business tenants, between landlords of different types of shopping
centres in Pretoria?
5.3 THE RESEARCH OBJECTIVES
The primary and secondary objectives are presented here to illustrate and guide the
direction of the research.

148
5.3.1 Primary objective
The primary objective of the study is to measure the perceived service quality that small
business tenants in shopping centres receive from landlords.
5.3.2 Secondary objectives
The secondary objectives of the study are to:
• Determine whether the combined SERVPERF and FAIRSERV model of service quality,
in its original form, will be suitable to measure the perceived service quality that small
business tenants in shopping centres receive from landlords.
• Determine whether there are any significant differences regarding the perceived service
quality provided by landlords to small business tenants depending on their position in
the business.
• Determine whether there are any significant differences regarding the perception of
service quality received between small business tenants who have been in the centre
for a short time and those who have been in the centre for long.
• Determine whether there are any significant differences regarding the perceived service
quality received between small business tenants who have been a tenant in other
shopping centres before and those who have never been a tenant in other shopping
centres before.
• Determine whether there are any significant differences regarding the perceived service
quality received between small business tenants who had no or little business
experience prior to leasing in the shopping centre and those who had business
experience.
149
• Determine whether there are any significant differences regarding the perception of
service quality received by small business tenants, between landlords of different types
of shopping centres in Pretoria.
5.4 HYPOTHESES
This study states hypotheses rather than propositions. The reason for this is that several
business research authors state that a hypothesis is a testable proposition (Cooper &
Schindler, 2006:43; Saunders et al., 2009:495; Struwig & Stead, 2004:4). A proposition is a
statement about observable phenomena that may be judged as true or false. When a
proposition is formulated for empirical testing, it is called a hypothesis (Cooper & Schindler,
2006:43; Struwig & Stead, 2004:4). A hypothesis is therefore a statement regarding a
population or populations that may or may not be true (Diamantopoulos & Schlegelmilch,
2006:130). It is also stated that a proposition is a statement concerned with the relationships
between concepts; an assertion of a universal connection between events that have certain
properties (Zikmund, 2003:43).
The hypotheses are therefore stated below and the hypothesis testing is presented in
Chapter 6. This indicates that the hypotheses will be tested empirically. The null hypothesis
is always used for testing. It is important to note that the null hypothesis (Ho) indicates that
there are no differences between groups or, no relationship between measured variables.
The alternative hypothesis (Ha) indicates that there is a difference or relationship between
measured variables.
From the research objectives, the following hypotheses were formulated:
• H1o (Null hypothesis): Small business tenants in shopping centres are in general not
satisfied with the service quality that they receive from landlords.
• H1a (Alternative hypothesis): Small business tenants in shopping centres are in
general satisfied with the service quality that they receive from landlords.
150
• H2o: The combined SERVPERF and FAIRSERV models of service quality, in its
original form, will not be reliable to measure the perceived service quality that small
business tenants in shopping centres receive from their landlords.
• H2a: The combined SERVPERF and FAIRSERV models of service quality, in its
original form, will be reliable to measure the perceived service quality that small
business tenants in shopping centres receive from their landlords.
• H3o: There are significant differences regarding the perceived service quality that
small business tenants have of the landlords’ service to them, irrespective of what the
position of the respondent in the business is.
• H3a: There are no significant differences regarding the perceived service quality that
small business tenants have of the landlords’ service to them, irrespective of what the
position of the respondent in the business is.
• H4o: There are no significant differences regarding the perception of service quality
received between small business tenants who have been a tenant in the centre for a
short time and those who have been a tenant for long.
• H4a: There are significant differences regarding the perception of service quality
received between small business tenants who have been a tenant in the centre for a
short time and those who have been in the centre for long.
• H5o: There are no significant differences regarding the perceived service quality
received between small business tenants who have been a tenant in other shopping
centres before and those who have never been a tenant in other shopping centres
before.
• H5a: There are significant differences regarding the perceived service quality
received between small business tenants who have been a tenant in other shopping
centres before and those who have never been a tenant in other shopping centres
before.

151
• H6o: There are no significant differences regarding the perceived service quality
received between small business tenants who had no or little business experience prior
to leasing in the shopping centre and those who had business experience.
• H6a: There are significant differences regarding the perceived service quality
received between small business tenants who had no or little business experience prior
to leasing in the shopping centre and those who had business experience.
• H7o: There are no significant differences, regarding the perception of service quality
of small business tenants between landlords of different types of shopping centres in
Pretoria.
• H7a: There are significant differences regarding the perception of service quality of
small business tenants between landlords of different types of shopping centres in
Pretoria.
5.4.1 Hypotheses testing
The purpose of hypothesis testing is to determine which of the null or alternative hypotheses
is correct. The hypotheses testing procedure will be done in Chapter 6, where the null or
alternative hypothesis will be accepted or rejected. The significance level is a critical
probability in choosing between the null hypothesis and the alternative hypothesis (Cooper &
Schindler, 2006:718; Zikmund, 2003:500). The level of significance determines the
probability level that is to be considered too low to merit support of the null hypothesis. As no
statement about a sample can be made with complete certainty, a chance that an error will
be made always exists. These types of errors are referred to as Type I or Type II errors as
depicted in Table 5.1 on the next page
Table 5.1 is presented on the next page.

152
Table 5.1: Type I and Type II errors in hypotheses testing
Decision State of null hypothesis in the population Accept Ho Reject Ho
Ho is true Correct – no error Type I error
Ho is false Type II error Correct – no error
Source: Zikmund (2003:504)
Table 5.1 indicates that the null hypothesis can either be true or false and the statistical
decision will be either to accept or to reject the hypothesis. When a Type I error (α) is
committed, a true null hypothesis is rejected. This means it is stated that a statistically
significant difference exists when in reality one does not exist. A Type II (β) error is made if
the alternative hypothesis is true but the researcher indicates that the Ho should not be
rejected.
In business problems, Type I errors are in general more serious than Type II errors and
there is a greater concern with determining the significance level alpha (α) than with
determining β.
5.5 RESEARCH METHODOLOGY
The research methodology presented in this section focuses on the research design, the
methods and procedures for the collection, and measurement and analysis of data used in
the study. The next section will explain the research design used in this study.
5.5.1 Research design
The research design is a blueprint for fulfilling objectives and answering questions. It
constitutes the blueprint for collection, measurement and analysis of data (Cooper &
153
Schindler, 2006:71). It will be the general plan of how to go about answering the research
question (Saunders et al., 2009:136).
This research study is designed as a formal study. The objective of a formal research design
is to test the hypotheses or answer the research questions posed (Cooper & Schindler,
2006:140). This study consists of a literature review and an empirical study. The literature
review aims to survey the background on service quality and small business tenants in
shopping centres in terms of:
• the concept of service;
• the concept of service quality;
• models for measuring service quality;
• the definition of a small business and the unique challenges they are faced with;
• shopping centres as retail locations; and
• the relationship between a small business tenant and the landlord in shopping centres.
The literature review provides an insight and understanding into the research problem as
well as the necessary background to guide the empirical part of the study.
The empirical part of the study focuses on the measurement of the perceived service quality
that small business tenants in shopping centres receive from the landlord. The measurement
is done by means of a questionnaire developed from dimensions of the SERVPERF (Cronin
& Taylor, 1992) and FAIRSERV (Carr, 2007), service quality models.
5.5.2 Sampling design and data collection methods
Sampling basically means any procedure where, by selecting some of the elements in a
population, conclusions can be drawn about the entire population (Diamantopoulos &
Schlegelmilch, 2006:10; Cooper & Schindler, 2006:402). Decisions on several stages in the
selection of a sample should first be done before a conclusion can be made of the sample to
use. These stages are summarised in Figure 5.2 on the next page.

154
Figure 5.2: Stages in the selection of a sample
Source: Cooper and Schindler (2008:183-203)
The full set of elements about which one wishes to make some inferences is called the
population (Cooper & Schindler, 2006:402; Diamantopoulos & Schlegelmilch, 2006:10;
Saunders et al., 2009:212). In this study the population is all the small business tenants in
shopping centres in Pretoria, South Africa. According to Cooper and Schindler (2006:409),
parameters of interest are summary descriptors of variables of interest in the population.
For this study the parameter of interest is the following:
• The selected respondents must be the owner, manager or full time employee of the
small business in the shopping centres.
Sampling frame refers to a list of elements from which a sample may be drawn (Cooper &
Schindler, 2006:411; Saunders et al., 2009:214). A list of small business tenants in each
Determine the population
Determine the parameters of interest
Determine the sampling frame
Determine the type of sample
Determine the sample size
Select actual sample units
Conduct fieldwork
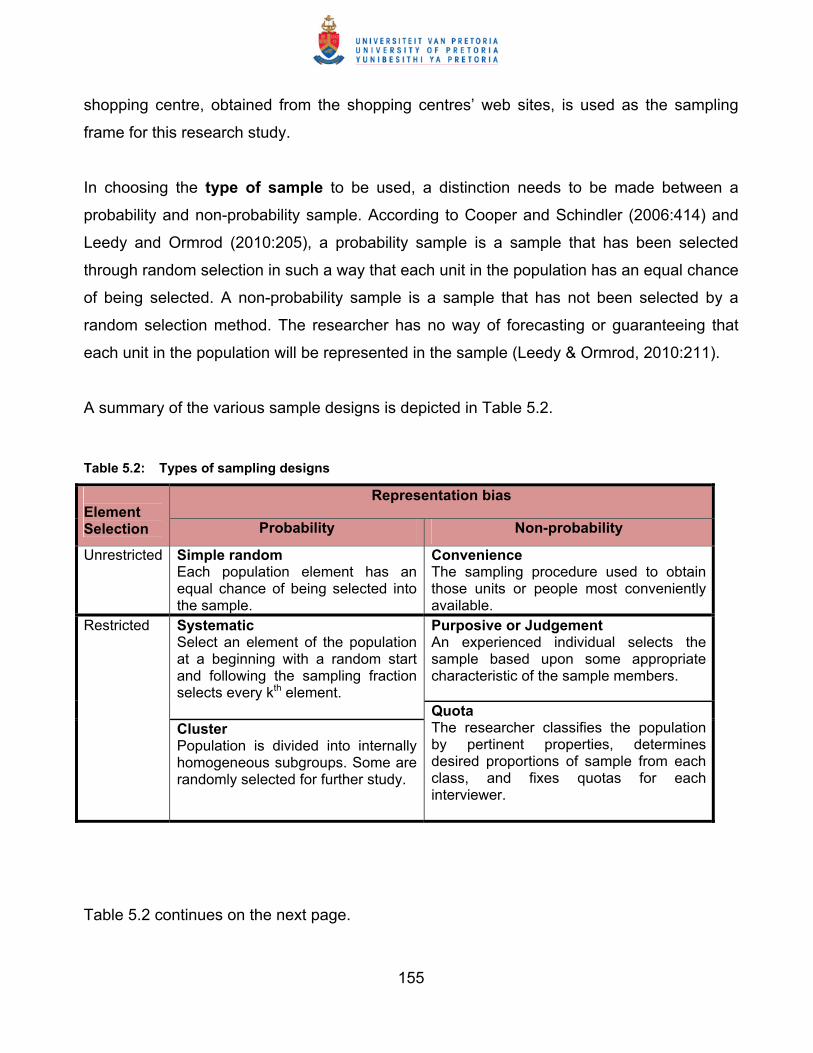
155
shopping centre, obtained from the shopping centres’ web sites, is used as the sampling
frame for this research study.
In choosing the type of sample to be used, a distinction needs to be made between a
probability and non-probability sample. According to Cooper and Schindler (2006:414) and
Leedy and Ormrod (2010:205), a probability sample is a sample that has been selected
through random selection in such a way that each unit in the population has an equal chance
of being selected. A non-probability sample is a sample that has not been selected by a
random selection method. The researcher has no way of forecasting or guaranteeing that
each unit in the population will be represented in the sample (Leedy & Ormrod, 2010:211).
A summary of the various sample designs is depicted in Table 5.2.
Table 5.2: Types of sampling designs
Representation bias Element Selection Probability Non-probability
Unrestricted Simple random Each population element has an equal chance of being selected into the sample.
Convenience The sampling procedure used to obtain those units or people most conveniently available. Purposive or Judgement An experienced individual selects the sample based upon some appropriate characteristic of the sample members.
Systematic Select an element of the population at a beginning with a random start and following the sampling fraction selects every kth element.
Restricted
Cluster Population is divided into internally homogeneous subgroups. Some are randomly selected for further study.
Quota The researcher classifies the population by pertinent properties, determines desired proportions of sample from each class, and fixes quotas for each interviewer.
Table 5.2 continues on the next page.

156
Table 5.2: Continued
Representation bias Element Selection Probability Non-probability
Stratified Divides population into subpopulations or strata and uses simple random on each stratum. Results may we weighted and combined.
Restricted
Double Process includes collecting data from a sample using a previously defined technique. Based on the information found, a subsample is selected for further study.
Snowball Initial respondents are selected by probability samples; additional respondents are obtained by referral from initial respondents.
Source: Cooper and Schindler (2008:184, 199)
This study makes use of a non-probability, judgement sampling because the shopping
centres (population element) that were selected for this study did not have an equal chance
of being included in the sample. An effort was made though to include different types of
shopping centres, owned by different landlords from different parts of the city in the study.
The small business tenants in a specific shopping centre were also selected by making use
of non-probability sampling as each of the population elements (small business tenants) did
not have an equal chance of being included in the sample. It can be regarded as judgement
sampling because the respondents were selected on the basis of their direct involvement
with the landlords or centre management. They should in other words have been able to
judge the perceived service quality they receive from landlords based on their involvement
and experience with them.
When sample size is considered, Saunders et al. (2009:217) indicate that the larger the
sample size, the lower the likely error in generalising to the population. The sample of this
study consisted of 457 respondents from small business tenants of 27 different shopping
centres throughout Pretoria, South Africa. The shopping centres that were part of the study
included seven neighbourhood centres, seven community centres, four small regional
centres/large community centres, three regional centres, one super regional centre, three
157
lifestyle centres and two value/strip centres. These 27 shopping centres are owned by 19
different landlords.
5.5.2.1 Sample error
An important consideration when selecting a sample is, the effect that excluded population
elements are likely to have on the quality of the sample (Diamantopoulos & Schlegelmilch,
2006:12). Sampling in fact means that certain population elements will be excluded from the
sample and this exclusion is known as sampling error. Sampling error is therefore the
difference between a result based on a sample and that which would have been obtained if
the entire population were studied (Diamantopoulos & Schlegelmilch, 2006:12).
5.5.2.2 Response rate
Saunders et al. (2009:587) explain that a response rate is the total number of responses
divided by the total number in the sample after ineligible and unreachable respondents have
been excluded. Table 5.3 on the next page indicates that a total of 510 questionnaires were
issued to small business tenants in 27 different shopping centres in Pretoria between the
period of December 2011 and March 2012. A total of 457 questionnaires were received back
from the respondents. This represents a response rate of 89,61 percent. The relatively high
response rate may be due to the fact that all questionnaires were delivered and later
collected by the researcher, with the help of two field workers. The researcher and the field
workers often had to go back to the small business tenants several times in order to collect
the completed questionnaires. This diligence from them certainly paid off, as the high
response rate indicates. Another reason for the high response rate may also have been that
small business tenants in shopping centres might have been eager to fill in the questionnaire
because they wanted to air their view on the important matter of service quality.
In Table 5.3 the response rate per shopping centre is indicated, bringing the total response
rate to 89,61 percent.

158
Table 5.3: Response rate (Time frame: December 2011 – March 2012)
Type of centre Name of centre Number of stores in centre
Number of question-
naires issued
Number of question-
naires received
back
Response rate per
centre (%)
Doornpark Shopping Centre
24 14 14 100,00
Madelief Shopping Centre
29 10 8 80,00
Montana Corner 36 8 8 100,00 Moreleta Plaza 50 13 8 61,54 Silver Oaks Crossing 45 11 10 90,91 Waverley Plaza 52 17 14 82,35 Zambezi Junction 30 16 16 100,00
Neighbourhood Centres
Sub Total
266 89 78 87,64
Jakaranda Shopping Centre
54 11 7 63,64
Glenfair Boulevard 45 10 8 80,00 Glen Village North 41 24 24 100,00 Glen Village South 41 16 16 100,00 Mayville Shopping Centre
44 26 26 100,00
Quagga Shopping Centre
56 8 7 87,50
Waterglen Shopping Centre
45 15 15 100,00
Community Centres
Sub Total
326 110 103 93,64
Mall @ Reds 118 21 21 100,00 Wonderboom Junction 79 9 4 44,44 Wonderpark Shopping Centre
119 14 8 57,14
Zambezi Mall 85 12 12 100,00
Small Regional Centres
Sub Total
401 56 45 80,36
Brooklyn Mall 159 40 31 77,50 Centurion Mall 217 47 47 100,00
Regional Centres
Kolonnade Shopping Centre
155 31 23 74,19
Sub Total
531 118 101 85,59
Table 5.3 continues on the next page.

159
Table 5.3: Continued
Type of centre Name of centre Number of stores in centre
Number of question-
naires issued
Number of question-
naires received
back
Response rate per
centre (%)
Menlyn Shopping Centre 300 86 86 100,00 Super Regional Centre Sub Total 300 86 86 100,00
Brooklyn Design Square 35 12 8 66,66 Lynnwood Bridge 29 14 11 78,57 West End Life Style and Décor Centre
23 10 10 100,00
Lifestyle Centres
Sub Total 87 36 29 80,56
Montana Crossings 30 9 9 100,00 Montana Value Centre 20 6 6 100,00 Sub Total
50 15 15 100,00
Strip Centres
TOTAL 1 961 510 457 89,61
5.5.2.3 Data collection
Data can be collected in the form of primary or secondary data. Primary data refers to data
that are collected with a specific purpose in mind, such as for the needs of a particular
research project and, the researcher personally collects it (Diamantopoulos & Schlegelmilch,
2006:5; Saunders et al., 2009:598; Struwig & Stead, 2004:40). Primary data can, amongst
others, be collected by means of questionnaires, surveys, checklists, interviews,
documentation review, observation, focus groups and case studies (Coldwell & Herbst,
2004:48-49). Secondary data, on the other hand, refers to data which has not been gathered
expressly for the immediate study at hand but for some other purpose (Diamantopoulos &
Schlegelmilch, 2006:5; Struwig & Stead, 2004:40), or as Cooper and Schindler (2006:77) put
it: “secondary data have had at least one level of interpretation inserted between the event
and its recording”. Diamantopoulos and Schlegelmilch (2006:5) identify several forms of
secondary data, namely published statistics (by government departments, trade
associations, chambers of commerce and research foundations), annual reports (published
by business firms as well as non-profit organisations), abstracting and index services
(covering thousands of periodicals, academic journals, books and newspapers), syndicated

160
services (providing regular detailed information on a particular country/industry/ product
group) and database services (providing tailor-made mailing lists, allowing fast access to
computerised information sources worldwide).
Data for the literature section of this research study was collected by means of a literature
search using secondary data such as journals, textbooks, newspapers, databases and the
Internet. This literature was presented in Chapters 2, 3 and 4.
The primary data for this study (measuring the service quality that small business tenants in
shopping centres receive from their landlords) is collected by means of a self-administered
questionnaire. The responses are anonymous and this confidentiality is respected within the
study. This was considered to be the best option available in order to access data. The
respondents were assured of their anonymity and that the data will be treated as
confidential.
The questionnaires were distributed to and collected from small tenants in shopping centres
by the researcher and two fieldworkers. Three of the respondents submitted the completed
questionnaires via electronic mail or a facsimile. A covering letter and consent form
(Annexure A) accompanied each questionnaire.
Saunders et al. (2009:362) state that questionnaires work best with standardised questions
that can confidently be interpreted the same way by all respondents. Questionnaires can
therefore be used for descriptive or explanatory research. Explanatory or analytical research
will enable one to examine and explain relationships between variables.
5.5.3 Purpose of the study
The purpose of the study is to investigate whether small businesses in shopping centres are
satisfied with the service quality they receive from landlords and, to determine whether the
service quality dimensions of SERVPERF and the fairness dimension of FAIRSERV will be

161
suitable to measure the service quality in a landlord-small business relationship in shopping
centres.
This study will inform and provide information to landlords of shopping centres and shopping
centre management, acting as agents of the landlords, of the value of measuring service
quality received by their small business tenants that could assist in sustaining a competitive
advantage. The study can also be valuable to prospective small business tenants where the
results of this study could help them to decide on a shopping centre to lease from.
5.5.4 Time dimension
Cooper and Schindler (2006:141) explain that cross-sectional studies are carried out once
and represent a snapshot of one point in time. Saunders et al. (2009:155) concur with this
explanation and add that cross sectional studies often seek to describe the incidence of a
phenomenon or to explain how factors are related in different organisations. Bryman and
Bell (2007:55) add further that in a cross sectional design, relationships are examined
between variables and that there is no time order to the variables. The data on the variables
is collected more or less simultaneously and the researcher does not manipulate any of the
variables. The time dimension of this study is cross-sectional. The respondents were
measured only once.
5.5.5 Topical scope
The topical scope of a study refers to the depth and breadth of a study (Cooper & Schindler,
2006:139). If a research study is designed for breadth rather than depth, it will be a statistical
research study and, if it is designed for depth it will be based on a case study. The topical
scope of this study was based on a statistical study in which the researcher attempts to
capture a population’s characteristics by drawing inferences from a sample’s characteristics.
According to Cooper and Schindler (2006:142) and Saunders et al. (2009:218),
generalisations about the findings of a statistical study are based on the representativeness
of the sample and the validity of the design.
162
5.5.6 The research environment
Cooper and Schindler (2006:142) state that research designs also differ as to whether they
occur under actual environmental conditions (field conditions) or under staged or
manipulated conditions (laboratory conditions).
This research study will be conducted in a field environment in shopping centres in Pretoria,
South Africa.
5.5.7 Participants’ perceptions
The usefulness of a research design may be reduced when, participants in a disguised study
perceive that research is being conducted and may behave differently as usual (Cooper &
Schindler, 2006:142; Saunders et al., 2009:156). With regard to this research study it may
happen that the small business tenants would give an overly critical rating because they may
think in doing so, management will pay more attention to service quality. On the other hand
though, participants may give an overly positive rating because they may fear that the
landlord may somehow know about their involvement with the study and could hold it against
the small business tenant if they are too critical in their rating of the service. Cooper and
Schindler (2006:143) therefore point out that participants’ perceptions serve as a reminder
to, firstly classify one’s study by type, then to examine validation strengths and weaknesses
and lastly, to be prepared to qualify results accordingly.
5.6 QUESTIONNAIRE DESIGN, VALIDITY AND MEASUREMENT
The questionnaire for this study was designed after a thorough literature review of several
service quality models. After thorough deliberation, the SERVPERF model was used to
conduct the assessment for this research study. Certain elements of the FAIRSERV model
were also considered. A detailed discussion on several service quality models was done in
Chapter 3.

163
5.6.1 Measurement of the research instrument
According to Cooper and Schindler (2006:309) and Diamantopoulos and Schlegelmilch
(2006:22), measurement in research consists of assigning numbers to empirical events,
objects or properties or activities in compliance with a set of rules. Measurement rules
ensure that the relations between the numbers assigned reflect the actual relations between
the objects with respect to the characteristic concerned.
The process structure (response strategies) that was used in the questionnaire consisted of
the following questions (Table 5.4 on the next page):
• Multiple-choice, single-response questions;
• 5-point Likert scale summated rating question; and
• Free-response questions (open-ended, unstructured questions).
Different measurement rules result therefore in different types of measurement scales
(Diamantopoulos & Schlegelmilch, 2006:23). Different types of measurement scales can be
distinguished according to the level of measurement that these scales provide. Four major
types of measurement scales can be distinguished, namely nominal, ordinal, interval and
ratio (Cooper & Schindler, 2006:311; Diamantopoulos & Schlegelmilch, 2006:24). These
types of measurement scales are outlined in Table 5.4.
According to Diamantopoulos and Schlegelmilch (2006:24) and Leedy and Ormrod
(2010:26), an ordinal scale establishes an ordered relationship between persons or objects
being measured. In ordinal scaling, numbers are used to indicate whether a person, object
and so forth, has more or less of a given characteristic than some other person or object.
They also add that an interval scale possesses all the characteristics of an ordinal scale and
is also characterised by equality of intervals between adjacent scale values. The last scale,
the ration scale, also has all the features of an interval scale plus an absolute zero point
(also known as true or natural zero). All these scales were incorporated in the research
questionnaire.
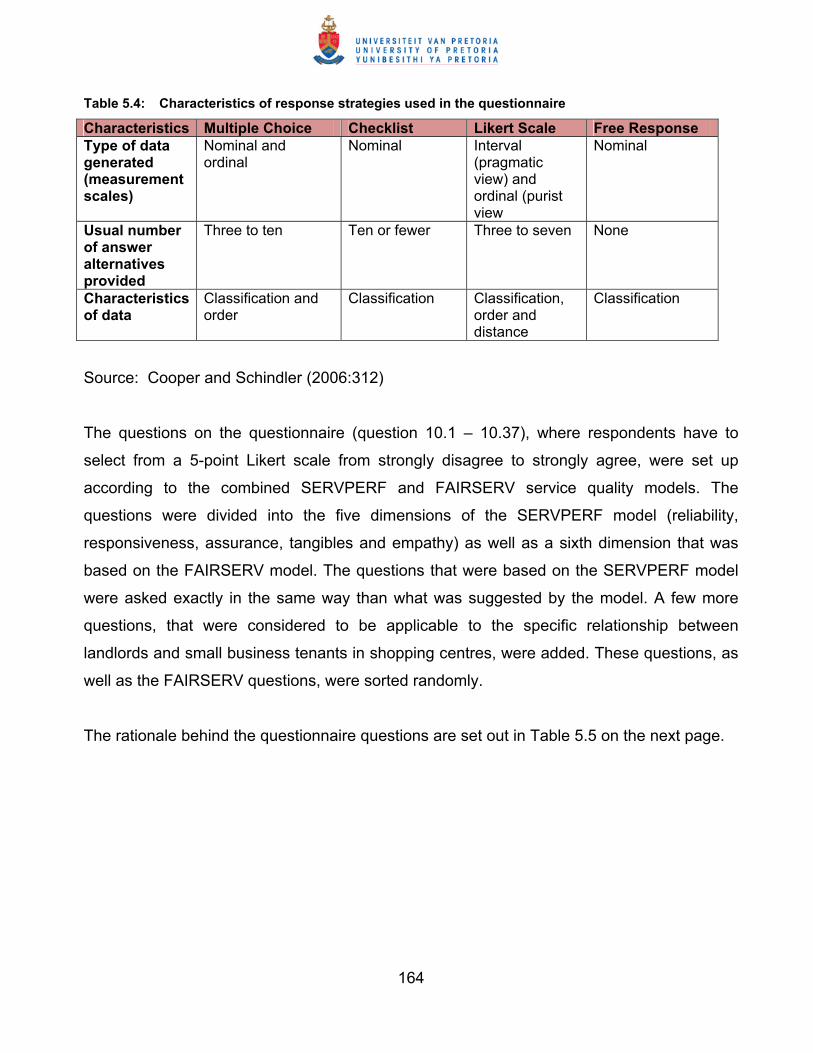
164
Table 5.4: Characteristics of response strategies used in the questionnaire
Characteristics Multiple Choice Checklist Likert Scale Free Response Type of data generated (measurement scales)
Nominal and ordinal
Nominal Interval (pragmatic view) and ordinal (purist view
Nominal
Usual number of answer alternatives provided
Three to ten Ten or fewer Three to seven None
Characteristics of data
Classification and order
Classification Classification, order and distance
Classification
Source: Cooper and Schindler (2006:312)
The questions on the questionnaire (question 10.1 – 10.37), where respondents have to
select from a 5-point Likert scale from strongly disagree to strongly agree, were set up
according to the combined SERVPERF and FAIRSERV service quality models. The
questions were divided into the five dimensions of the SERVPERF model (reliability,
responsiveness, assurance, tangibles and empathy) as well as a sixth dimension that was
based on the FAIRSERV model. The questions that were based on the SERVPERF model
were asked exactly in the same way than what was suggested by the model. A few more
questions, that were considered to be applicable to the specific relationship between
landlords and small business tenants in shopping centres, were added. These questions, as
well as the FAIRSERV questions, were sorted randomly.
The rationale behind the questionnaire questions are set out in Table 5.5 on the next page.

166
Table 5.5 Linking objectives with questions and proposed data analysis methods
Research Objectives Research Concept/ Construct
Variables Question component Question type/
Measures
Anticipated Statistical analysis
1. Measure service quality of landlords’ service to small business tenants
Service quality
Reliability Responsive-ness Assurance Empathy Tangibles Fairness
Q 10.1; 10.5; 10.7; 10.14; 10.21 Q 10.10; 10.13; 10.18; 10.29 Q 10.2; 10.11; 10.16; 210.3; 10.28; 10.33; 10.34; 10.35, Q 10.3; 10.8; 10.19; 10.22; 10.27; 10.32; 10.36 Q 10.4; 10.9; 10.17; 10.20; 10.24; 10.25; 10.31 Q 10.6; 10.12; 10.15; 10.26; 10.30; 10.37.
Interval scales (5-point Likert)
Standard deviation/ cronbach’s coefficient alpha
2. Investigate whether SERVPERF/FAIRSERV dimensions are pertinent to the landlord-small business relationship in shopping centres
Relevance of SERVPERF/ FAIRSERV dimensions
Reliability Responsive-ness Assurance Empathy Tangibles Fairness
Q 10 Interval scales Nominal Ratio Open-ended
Factor analysis
3. Determine whether there are significant differences regarding the perceived service quality that small business tenants of different types of shopping centres receive from the landlords.
Measurement of perceived service quality
Type of shopping centre Reliability Responsive-ness Assurance Empathy Tangibles
Q 10;
Interval scales (5-point Likert)
ANOVA Mean performance scores/ correlation analysis/ Cronbach’s oefficient alpha
Table 5.5 continues on the next page.

167
Table 5.5: Continued
Research Objectives Research Concept/ Construct
Variables Question component Question type/ Measures
Anticipated Statistical analysis
4. Determine whether there are significant differences regarding the perceived service quality between small business tenants who have been in the centre for a short period of time and those who have been in the centre for a long period of time
Measurement of perceived service quality
Period of time in centre Reliability Responsive-ness Assurance Empathy Tangibles
Q 5 Q 10
Ratio Interval scales (5-point Likert)
ANOVA Mean performance scores/ correlation analysis/ Cronbach’s coefficient alpha
5. Determine whether there are significant differences regarding the perceived service quality between small business tenants who had no or little business experience prior to leasing in the shopping centre and those who had business experience.
Measurement of perceived service quality
Business experience Reliability Responsive-ness Assurance Empathy Tangibles
Q 7 Q 10
Ratio Interval-scalses (5-point Likert)
ANOVA Mean performance scores/ correlation analysis/ Cronbach’s coefficient alpha
6. Determine whether there are significant differences regarding the perceived service quality between small business tenants who have been a tenant in other shopping centres before and those who have never been a tenant in a shopping centre.
Measurement of perceived service quality
Tenant in other centres Reliability Responsive-ness Assurance Empathy Tangibles
Q 8 Q 10
Ratio Interval-scalses (5-point Likert)
ANOVA Mean performance scores/ correlation analysis/ Cronbach’s coefficient alpha
Table 5.5 continues on the next page.

168
Table 5.5: Continued
Research Objectives Research Concept/ Construct
Variables Question component Question type/ Measures
Anticipated Statistical analysis
7. Determine whether there are any significant differences regarding the perceived service quality that small business tenants depending on their position in the business receive from the landlords.
Measurement of perceived service quality
Position in business Reliability Responsive-ness Assurance Empathy Tangibles
Q 1 Q 10
Ratio Interval-scalses (5-point Likert)
ANOVA Mean performance scores/ correlation analysis/ Cronbach’s coefficient alpha

169

170
5.6.2 Characteristics of sound measurement
A measuring instrument is sound if it is valid and reliable (Cooper & Schindler, 2006:318;
Diamantopoulos & Schlegelmilch, 2006:24; Saunders et al., 2009:273). Validity refers to the
extent in which an empirical measure adequately reflects the real meaning of the concept
under consideration. It asks the question: “does it measure what it intends to measure?”
Reliability refers to whether a particular technique, applied repeatedly to the same object,
yields the same result each time.
5.6.2.1 Validity of the measurement instrument
Cooper and Schindler (2006:318) and Leedy and Ormrod (2010:92) state that validity refers
to the ability of a research instrument to measure what it is supposed to measure. They
propose three widely accepted classifications of validity that consist of three major forms,
namely content validity, criterion-related validity, and construct validity. Table 5.6 on
the next page gives a summary of the validity estimates.
Since one of the research objectives of this study is to determine whether the SERVPERF
service quality instrument can be used to measure the perceived service quality that small
business tenants in shopping centres receive from landlords, the research questionnaire
were compiled using the SERVPERF instrument’s dimensions. The exact same questions as
suggested by the SERVPERF instrument were asked in the questionnaire (Table 3.3 on
page 77). As discussed in the literature review section of this study, it has been found that
the SERVPERF instrument is a valid instrument for the measuring of perceptions of service
quality in a number of other industries (Andaleeb & Conway, 2006; Carrilat et al., 2007:473;
Olorunniwo et al., 2006).
It can therefore be said that the measurement instrument has construct validity since the
SERVPERF instrument was empirically tested by several researchers before and found to
be a valid instrument.

171
Table 5.6: Summary of validity estimates
Type What is measured Methods
Content Degree to which the content of the items adequately represents the universe of all relevant items under study
Judgemental or panel evaluation with content validity ration
Criterion related • Concurrent • Predictive
Degree to which the predictor is adequate in capturing the relevant aspects of the criterion Description of the present; criterion data are available at the same time as predictor scores Prediction of the future; criterion data are measured after the passage of time
Correlation Correlation Correlation
Construct Answer the question, “What accounts for the variance in the measure?”; attempts to identify the underlying construct(s) being measured and determine how well the test represents it (them)
Judgemental Correlation of proposed test with established one Convergent-discriminant techniques Factor analysis Multitrait-multimethod analysis
Source: Cooper and Schindler (2006:319)
5.6.2.2 Reliability of the measurement instrument
Reliability is concerned with whether the measure is reliable to the degree that it supplies
consistent results (Diamantopoulos & Schlegelmilch, 2006:34; Leedy & Ormrod, 2010:93).
According to Diamantopoulos and Schlegelmilch (2006:34), if a measure is not reliable then
it cannot be valid, but if it is reliable it may or may not be valid. To put it differently, a
measure that is valid is also reliable but the reverse is not necessarily true. Reliable
instruments are robust, that work well at different times under different conditions. This
distinction of time and condition is the basis for frequently used perspectives on reliability,
namely stability, equivalence and internal consistency as seen in Table 5.7 on the next page.
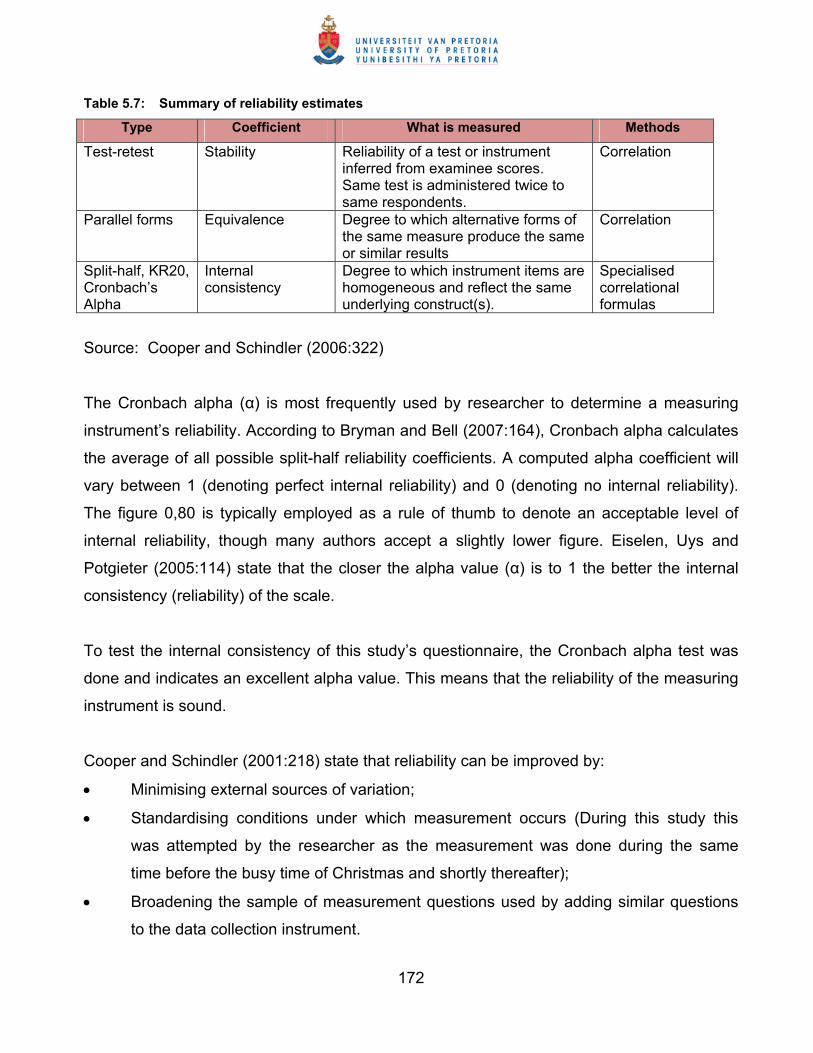
172
Table 5.7: Summary of reliability estimates
Type Coefficient What is measured Methods
Test-retest Stability Reliability of a test or instrument inferred from examinee scores. Same test is administered twice to same respondents.
Correlation
Parallel forms Equivalence Degree to which alternative forms of the same measure produce the same or similar results
Correlation
Split-half, KR20, Cronbach’s Alpha
Internal consistency
Degree to which instrument items are homogeneous and reflect the same underlying construct(s).
Specialised correlational formulas
Source: Cooper and Schindler (2006:322)
The Cronbach alpha (α) is most frequently used by researcher to determine a measuring
instrument’s reliability. According to Bryman and Bell (2007:164), Cronbach alpha calculates
the average of all possible split-half reliability coefficients. A computed alpha coefficient will
vary between 1 (denoting perfect internal reliability) and 0 (denoting no internal reliability).
The figure 0,80 is typically employed as a rule of thumb to denote an acceptable level of
internal reliability, though many authors accept a slightly lower figure. Eiselen, Uys and
Potgieter (2005:114) state that the closer the alpha value (α) is to 1 the better the internal
consistency (reliability) of the scale.
To test the internal consistency of this study’s questionnaire, the Cronbach alpha test was
done and indicates an excellent alpha value. This means that the reliability of the measuring
instrument is sound.
Cooper and Schindler (2001:218) state that reliability can be improved by:
• Minimising external sources of variation;
• Standardising conditions under which measurement occurs (During this study this
was attempted by the researcher as the measurement was done during the same
time before the busy time of Christmas and shortly thereafter);
• Broadening the sample of measurement questions used by adding similar questions
to the data collection instrument.
173
Factor analysis was furthermore executed to confirm the validity and reliability of the
measuring instrument (questionnaire) used in this study and is explained in the next section.
5.6.2.3 Factor analysis
The main application of factor analysis techniques is firstly, to reduce the number of
variables and secondly, to detect structure in the relationship between variables. The
variables have to be classified. Variables that highly correlate with each other, as identified
from the correlation matrix, are grouped together under a single factor. Each distinct
grouping of highly correlated original variables represents a separate factor (Diamantopoulos
& Schlegelmilch, 2006:216; Eiselen, et al. (2005:104). The principal component analysis
method is used to identify the factors. The number of unique factors and the significant
variables associated with each are identified by this approach. Each factor that is identified,
describes a separate dimension embedded within the large set of variables. In statistical
terms, each factor explains a certain percentage of the total variation between the original
variables. As many factors as there are original variables can be identified by the principal
components process (Cooper & Schindler, 2006:592; Leedy & Ormrod, 2010:282). All these
factors can however, not explain a significant percentage of total variation within the original
set of variables.
The significance of a factor is determined by its eigenvalue, which is generated by principal
component analysis for each factor. In order to decide how many significant factors can
meaningfully be used to describe the underlying dimensionality of the original set of
variables, each eigenvalue should exceed 1 (the Kaiser criterion). This criterion can
however, sometimes retain too many factors and therefore a graphical method, the scree test, is used to narrow down the factors. With the scree test, the eigenvalues are plotted in a
simple line plot. The point where the smooth decrease of eigenvalues appear to level off to
the right of the plot, is to be the cut-off point for factors. This test can sometimes retain too
few factors and, the criterion which makes the best sense is to be taken into consideration.
A factor can be seen as a new “generic” variable used to represent a subset of the original
variables which highly correlate with it. If expressed in mathematical terms, each factor is a

174
linear combination of the original variables, X11, X12, X13, ......, X47. The coefficients of the
linear combination are a measure of the correlation between each variable and the given
factor.
In general, further mathematical manipulation of the initial set of factors takes place. This
process that is used to refine the associations between factors and variables is called factor rotations. To assist the process of interpreting factors, the principal components method
also computes measures called factor loadings. A factor loading is a correlations measure (-
) between a variable and a factor. A high factor loading (values close to 1) indicates
a close association between a variable and a factor, while a low factor loading (values close
to 0) indicates virtually no association between a variable and a factor. This makes it
possible for a user to identify which variables are “explained’ by, or relates to a given factor.
By examining the nature of the variables that “load heavily” on a given factor, the factor can
be labelled. Factor analysis is furthermore executed on variables to strengthen the reliability
of the research questionnaire used in this study.
5.7 DATA PROCESSING AND ANALYSIS
Data processing generally begins with the editing and coding of data. According to Cooper
and Schindler (2006:441), editing involves checking the data collection forms for omissions,
errors, legibility and consistency in classification. The questionnaire of this study was
scrutinised and the questions coded accordingly. The data were captured on an Excel
spreadsheet by the Department of Statistics at the University of Pretoria. The captured data
were scrutinised for possible mistakes and thereafter, it was processed by the Department of
Statistics at the University of Pretoria. The BMDP statistical programme was used to compile
the descriptive and inferential statistics. Data analysis usually involves reducing accumulated
data to a manageable size, developing summaries, looking for patterns and applying
statistical techniques. Scaled responses on questionnaires often require the analyst to derive

175
various functions as well as to explore relationships among variables (Cooper & Schindler,
2006:442).
5.7.1 Descriptive statistics
In quantitative research, data analysis is normally used to refer to the process of breaking
down collected data into constituent parts in order to obtain answers to research questions.
Descriptive statistics is the method used to describe characteristics of a population or a
sample. It therefore aims at describing data by investigating the distribution of scores for
each variable and by determining whether the scores on different variables are related to
each other (Terre Blanche & Durrheim, 2002:105).
5.7.2 Inferential statistics
Inferential statistics is the method used to draw conclusions about the population itself. While
the descriptive analysis allows the researcher to generalise from the sample to the
population, inferential analysis allows the researcher to draw conclusions about the
population on the basis of data obtained from samples (Terre Blanche & Durrheim,
2002:105). The following techniques, based on the distribution of the descriptive statistics
obtained from this study, were used to perform the inferential analysis: frequency
distribution, factor analysis, One-Way Analysis of Variance (ANOVA) and Post-Hoc test
using least square means t-tests.
5.7.3 Statistical significance
Earlier in this chapter, the hypotheses were stated and it will be tested as well as either
accepted or rejected in Chapter 6. Since any sample will almost certainly vary somewhat
from its population, it must be judged whether these differences are statistically significant or
insignificant (Cooper & Schindler, 2006:492). A method of presenting the results of a
statistical test, reports the extent to which the test statistic disagrees with the null hypothesis.
This method has become very popular because analysts want to know what percentage of
176
the sampling distribution lies beyond the sample statistic on the curve and, most reports the
results of statistical tests as probability values (ρ values). The ρ value is compared to the
significance level (α) and on that basis the null hypothesis is either rejected or not rejected. If
the ρ value is less than the significance level (0.05 or 0.001) then the null hypothesis is
rejected. If ρ is greater than, or equal to the significance level, the null hypothesis is not
rejected.
5.8 CONCLUSION
In this chapter, a description of the methodology applied in this study was provided. The
chapter focuses on the research question posed: whether small business tenants in
shopping centres are satisfied with the quality of service they receive from their landlords.
The data collection was primarily based on personal responses and was conducted in the
form of the research questionnaire. The data processing and analysis attempt to answer the
research question through the research findings which are presented in the following
chapter.
The explanation of the statistical techniques preceded the actual tests carried out and is
presented in Chapter 6. These techniques included frequency distribution, factor analysis,
One-Way Analysis of Variance (ANOVA) and Post hoc tests using least square means t-
tests.
The next chapter explains and interprets the most significant results yielded by executing
the above techniques.

177
CHAPTER 6
RESEARCH FINDINGS
6.1 INTRODUCTION
The literature study revealed that, for any business to be competitive, it is essential that their
service delivery is of a high quality. The importance of the small business sector for a
country’s economy was also emphasised and, it was revealed that landlords in shopping
centres also have to ensure that their service to small business tenants is of a high quality.
In Chapter 5, the research design and methodology that were used to collect and analyse
the primary data needed in this study, were discussed. In this chapter, the findings obtained
from the analysis of the data are presented and discussed.
The first section of this chapter reports on the business demographics of the respondents.
The second section focuses on the personal demographics of the respondents. Thirdly, this
chapter will focus on describing the respondents’ satisfaction or dissatisfaction with the
service they receive from their landlords in shopping centres. Fourthly, the results of the
factor analysis are presented to illustrate the reliability and validity of the measuring
instrument that was used in this study. The next section summarises the significant
differences between certain aspects of the respondents and their perception of service
quality and, the One-Way Analysis of Variance (ANOVA) is presented. The final section of
this chapter focuses on providing general comments on open-ended questions from the
respondents regarding the perceived service quality they have received from their landlords
in shopping centres.

178
6.2 DESCRIPTIVE STATISTICS
Struwig and Stead (2004:158) state that descriptive statistics provide statistical summaries
of data. The purpose of these statistics is to provide an overall, coherent and straightforward
picture of a large amount of data. Saunders et al. (2009:591) simply state that descriptive
statistics are a generic term for statistics that can be used to describe variables. The
descriptive statistics of this study will be presented through frequencies and percentages by
means of tables and graphs. The sample consisted of 510 small business tenants in
shopping centres in Pretoria, South Africa and 457 questionnaires of the 510 submitted,
were returned. This gives a response rate of 89,61 percent.
Descriptive statistics will be provided on the business demographics namely, position of the
respondent in the business, type of business, total number of full-time employees, the total
annual turnover of the business, the number of years the small business tenants have been
in the particular shopping centre and the number of years the small business tenants are or
were in the business (Table 6.1).
Descriptive statistics will also be provided on the personal demographics of the respondents,
namely the number of other shopping centres the small business tenants have leased in
before, the number of years of business experience prior to leasing in the centre and, the
respondents’ higher educational qualifications (Table 6.2).
Table 6.1 is presented on the next page.
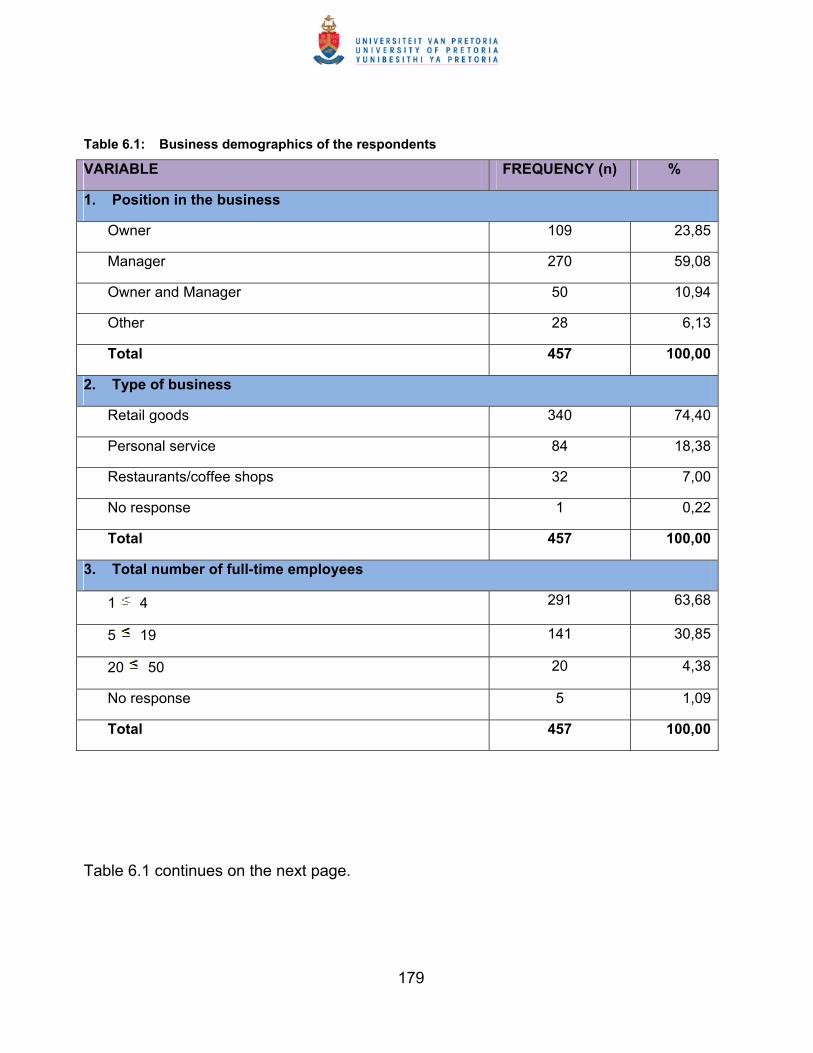
179
Table 6.1: Business demographics of the respondents
VARIABLE FREQUENCY (n) %
1. Position in the business
Owner 109 23,85
Manager 270 59,08
Owner and Manager 50 10,94
Other 28 6,13
Total 457 100,00
2. Type of business
Retail goods 340 74,40
Personal service 84 18,38
Restaurants/coffee shops 32 7,00
No response 1 0,22
Total 457 100,00
3. Total number of full-time employees
1 4 291 63,68
5 19 141 30,85
20 50 20 4,38
No response 5 1,09
Total 457 100,00
Table 6.1 continues on the next page.

180
Table 6.1: Continued
VARIABLE FREQUENCY (n) %
4. Total annual turnover
Less than R150 000 32 7,00
R150 001 R500 000 76 16,63
R500 001 R1 000 000 106 23,19
R1 000 001 R2 000 000 73 15,97
R2 000 001 R5 000 000 46 10,07
R5 000 001 R10 000 000 23 5,03
R10 000 001 or more 18 3,94
No response 83 18,17
Total 457 100,00
5. Number of years a tenant in the centre
Less than 2 years 41 8,97
2 6 years 235 51,42
7 11 years 87 19,04
12 16 years 64 14,00
More than 16 years 21 4,60
No response 9 1,97
Total 457 100,00
Table 6.1 continues on the next page.
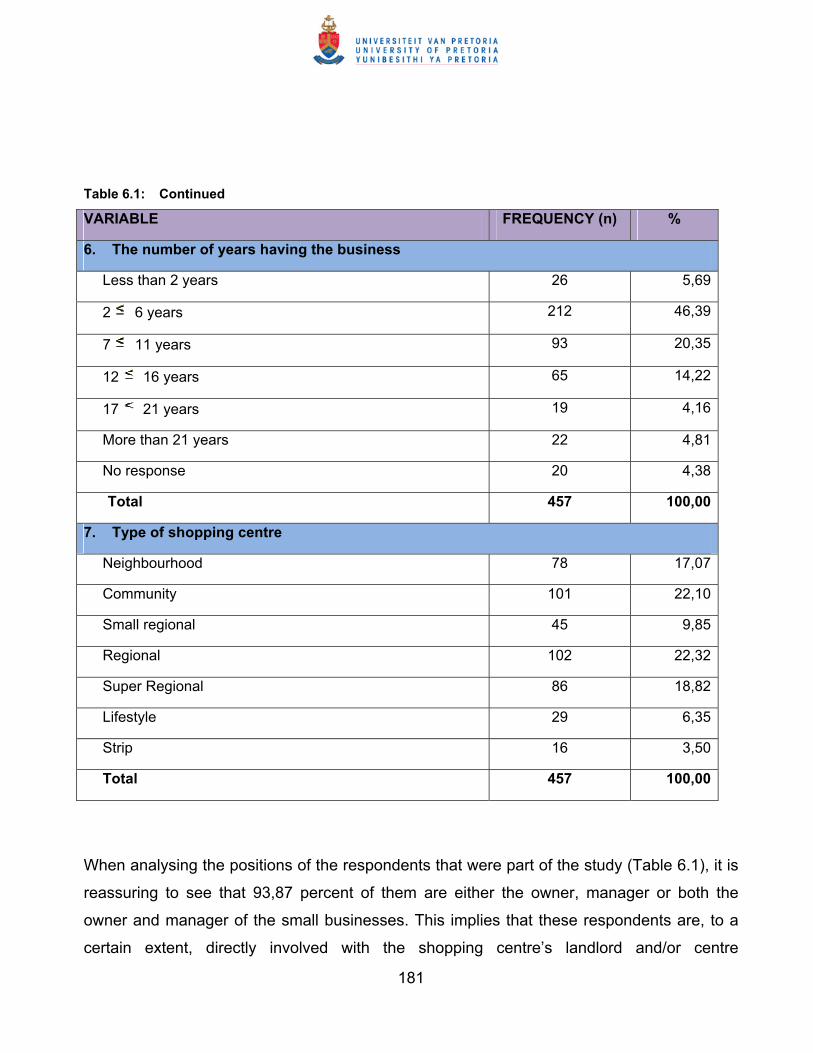
181
Table 6.1: Continued
VARIABLE FREQUENCY (n) %
6. The number of years having the business
Less than 2 years 26 5,69
2 6 years 212 46,39
7 11 years 93 20,35
12 16 years 65 14,22
17 21 years 19 4,16
More than 21 years 22 4,81
No response 20 4,38
Total 457 100,00
7. Type of shopping centre
Neighbourhood 78 17,07
Community 101 22,10
Small regional 45 9,85
Regional 102 22,32
Super Regional 86 18,82
Lifestyle 29 6,35
Strip 16 3,50
Total 457 100,00
When analysing the positions of the respondents that were part of the study (Table 6.1), it is
reassuring to see that 93,87 percent of them are either the owner, manager or both the
owner and manager of the small businesses. This implies that these respondents are, to a
certain extent, directly involved with the shopping centre’s landlord and/or centre

182
management. The assumption can therefore be made that they are credible respondents in
this research study. The remainder of the respondents (6,13 percent) is full time employees
with a direct involvement with either the landlords or the centre management.
As seen in Table 6.1, the respondents included 341 retailers of goods (74,40 percent), 84
businesses that provided a personal service (18,38 percent) and 32 restaurants and coffee
shops (7,00 percent).
Figure 6.1: Total number of full-time employees
Table 6.1 and Figure 6.1 show that the largest proportion of the total sample (63,68 percent)
have between one and four full time employees. According to the National Small Business
Amendment Act, Act 26 of 2003’s classification, this makes the majority of the sample that
were part of this study, micro businesses (see Table 4.3 on page 136). Very small
businesses (between five and 19 full time employees), accounted for 30,85 percent of this
sample, and only 4,38 percent from the sample was small businesses.

183
Of the businesses that were part of the study, the annual turnover of the majority (46,82
percent) is R1 million or less, which is a typical small business venture in terms of the South
African classification. Only 3,94 percent of the small businesses have an annual turnover of
R10 million or more. Due to the sensitivity of the information, 18,17 percent did not disclose
their annual turnover.
Figure 6.2: Distribution of respondents’ number of years in shopping centre
The majority of the sample was tenants at the shopping centre for a period of between two
and six years (51,42 percent). The high percentage of small business tenants that fall within
this time frame may be due to the fact that tenants in shopping centres normally sign leasing
contracts for this period of time. They are therefore bound by the leasing contract for this
period of time. Only 4,60 percent of respondents are leasing in the particular shopping
centre for more than 16 years. This can be an indication that small businesses in shopping
centres do not remain tenants for extended periods of time.
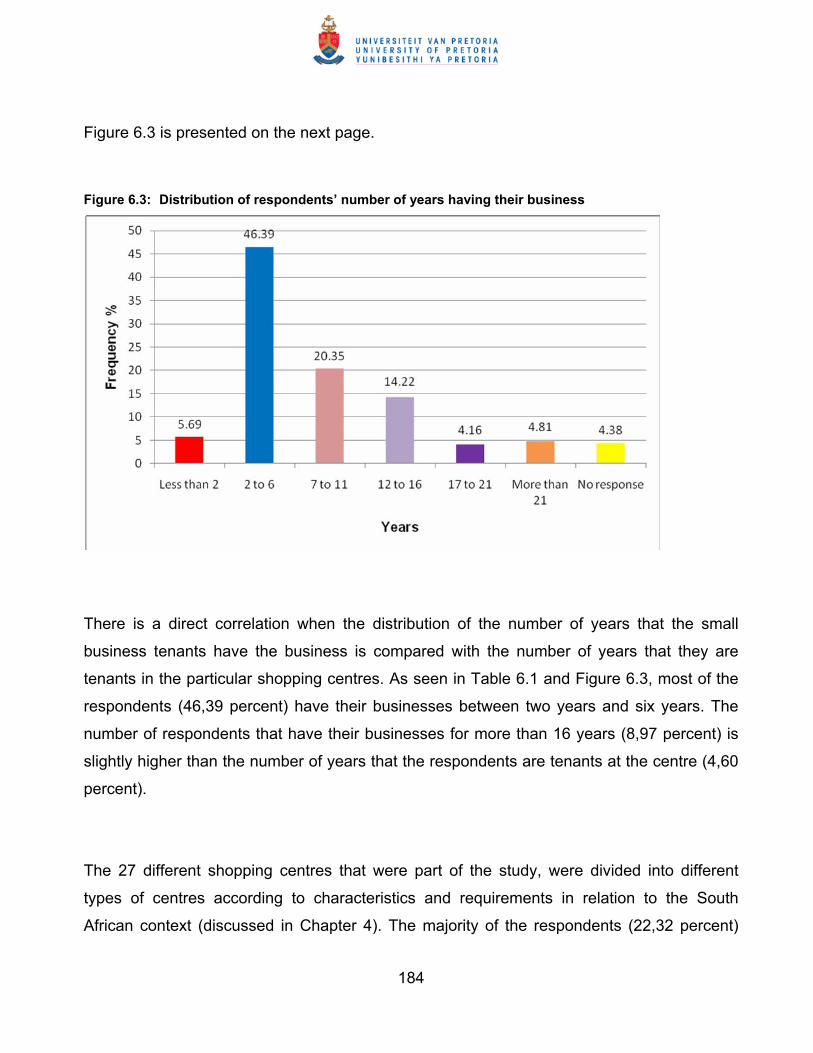
184
Figure 6.3 is presented on the next page.
Figure 6.3: Distribution of respondents’ number of years having their business
There is a direct correlation when the distribution of the number of years that the small
business tenants have the business is compared with the number of years that they are
tenants in the particular shopping centres. As seen in Table 6.1 and Figure 6.3, most of the
respondents (46,39 percent) have their businesses between two years and six years. The
number of respondents that have their businesses for more than 16 years (8,97 percent) is
slightly higher than the number of years that the respondents are tenants at the centre (4,60
percent).
The 27 different shopping centres that were part of the study, were divided into different
types of centres according to characteristics and requirements in relation to the South
African context (discussed in Chapter 4). The majority of the respondents (22,32 percent)

185
were small businesses in regional shopping centres. Only 3,50 percent of the respondents
were small businesses in strip centres. This can be explained by the fact that strip centres
normally have few small businesses as part of their tenant mix.
Table 6.2: Personal demographics of respondents
VARIABLE FREQUENCY (n)
%
1. Years of business experience prior to leasing in the centre
Less than 2 years 42 9,19
2 6 years 63 13,79
7 11 years 83 18,16
12 16 years 53 11,60
17 21 years 115 25,16
More than 22 years 68 14,88
No response 33 7,22
Total 457 100,00
2. Number of shopping centres leased in before
Less than 2 286 62,58
2 3 95 20,79
4 5 12 2,63
More than 5 18 3,94
No response 46 10,06
Total 457 100,00
3. Highest educational qualification
Standard 8 or less 7 1,53
Matric certificate 223 48,80
Diploma 166 36,32
B-Tech/Degree 35 7,66
Post graduate 24 5,25
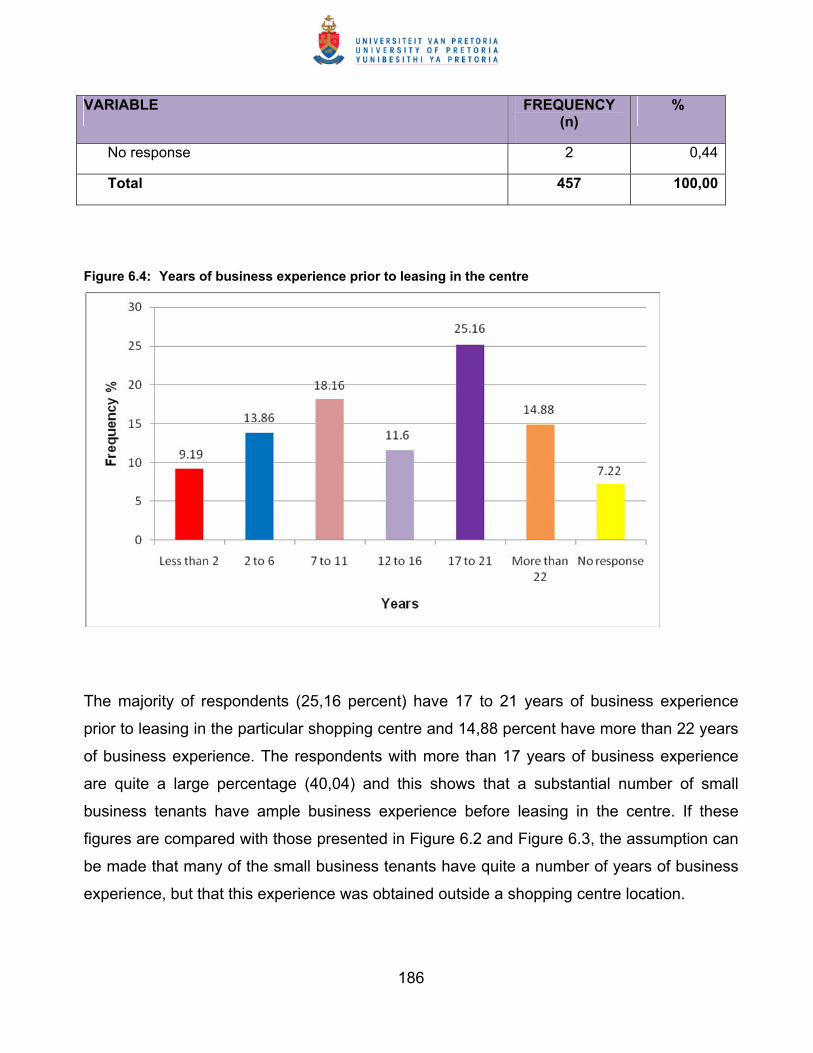
186
VARIABLE FREQUENCY (n)
%
No response 2 0,44
Total 457 100,00
Figure 6.4: Years of business experience prior to leasing in the centre
The majority of respondents (25,16 percent) have 17 to 21 years of business experience
prior to leasing in the particular shopping centre and 14,88 percent have more than 22 years
of business experience. The respondents with more than 17 years of business experience
are quite a large percentage (40,04) and this shows that a substantial number of small
business tenants have ample business experience before leasing in the centre. If these
figures are compared with those presented in Figure 6.2 and Figure 6.3, the assumption can
be made that many of the small business tenants have quite a number of years of business
experience, but that this experience was obtained outside a shopping centre location.
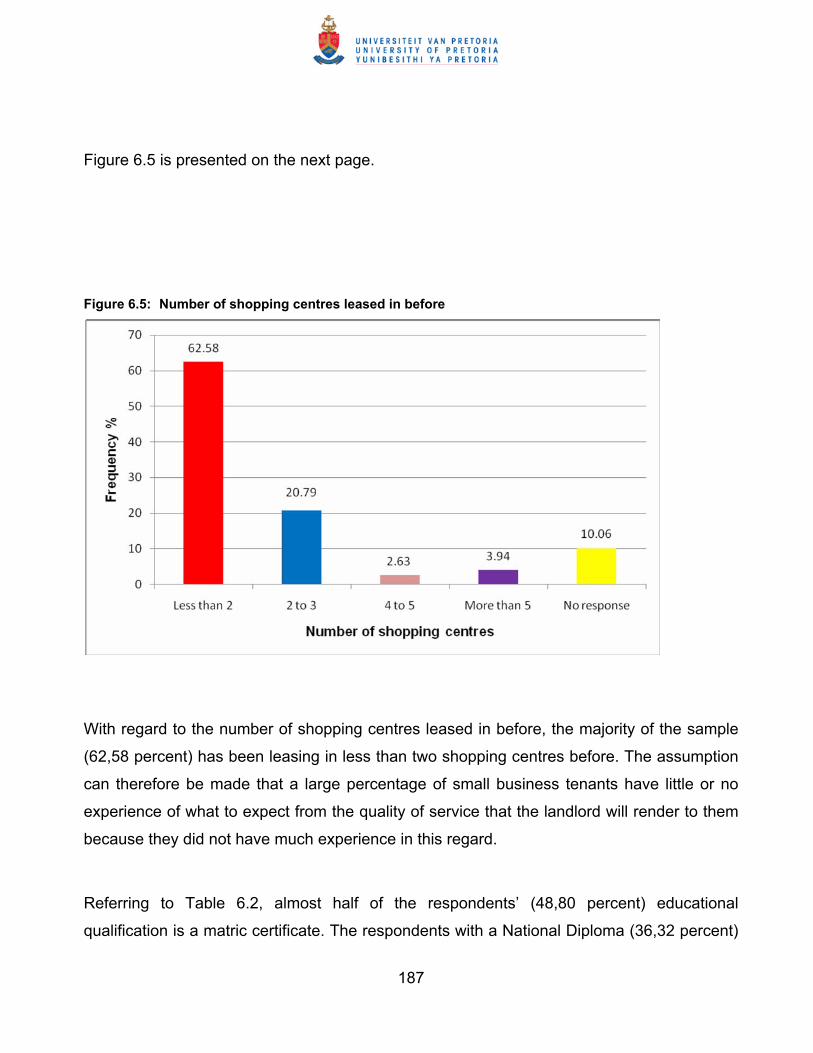
187
Figure 6.5 is presented on the next page.
Figure 6.5: Number of shopping centres leased in before
With regard to the number of shopping centres leased in before, the majority of the sample
(62,58 percent) has been leasing in less than two shopping centres before. The assumption
can therefore be made that a large percentage of small business tenants have little or no
experience of what to expect from the quality of service that the landlord will render to them
because they did not have much experience in this regard.
Referring to Table 6.2, almost half of the respondents’ (48,80 percent) educational
qualification is a matric certificate. The respondents with a National Diploma (36,32 percent)

188
and B Tech or Degree (7,66 percent) accounted for 43,98 percent of the respondents and
only 5,25 percent of the respondents have a post graduate qualification. This brings the total
of respondents with a post-matric qualification to a substantial 49,23 percent.
6.3 RESPONDENTS’ PERCEIVED SERVICE QUALITY FROM LANDLORDS
The responses with regard to the perceived service quality that the respondents experienced
of the services rendered by the landlords in shopping centres are presented in Table 6.3. On
a 5-point Likert scale, the respondents had to choose whether they strongly disagree,
disagree, are neutral, agree or strongly agree with a statement on service quality. The
statements are arranged according to the five SERVPERF and one FAIRSERV dimension
as suggested by these models. The frequencies as well as the percentage of the
frequencies are given. In the last two columns, the mean and standard deviation is given.
Table 6.3: Perceived service quality that small business tenants receive from landlords in shopping centres (N – 457)
Strongly D
isagree
Disagree
Neutral
Agree
Strongly A
gree
1 2 3 4 5
Variable
Fr % Fr % Fr % Fr % Fr %
Mean
Standard Deviation
Reliability
96 21,05 V11 When promised to do something by a certain time, management will do so.
26 5.70 126 27,63 189 41,45
19 4,17 2,9059 0,9353
V15 A service is provided at the time management promises to do so
19 4,18 116 25,49 223 49,01 80 17,58 17 3,74 2,9124 0,8590

189
Strongly D
isagree
Disagree
Neutral
Agree
Strongly A
gree
1 2 3 4 5
Variable
Fr % Fr % Fr % Fr % Fr %
Mean
Standard Deviation
V17 When experiencing a problem,
management shows sincere interest in solving it.
35 7,66 116 25,38 200 43,76 86 18,82 20 4,38 2,8687 0,9529
V24 Management performs the service right the first time.
22 4,81 113 24,73 242 52,95 69 15,10 11 2,41 2,8555 0,8171
V31 Management insists on error-free leasing statements and other records.
18 4,06 102 23,02 217 48,98 83 18,74 23 5,19 2,9737 0,8806
Table 6.3 continues on the next page.
Table 6.3: Continued
Strongly D
isagree
Disagree
Neutral
Agree
Strongly A
gree
1 2 3 4 5
Variable
Fr % Fr % Fr % Fr % Fr %
Mean
Standard Deviation
Responsiveness
V20 You are informed when services will be performed.
9 1,97 83 18,16 192 42,01 138 30,20 35 7,66 3,2341 0,9031
V23 Management is never too busy to respond to your requests.
30 6,56 108 23,63 241 52,74 66 14,44 12 2,63 2,8293 0,8490
V28 You receive prompt service (eg. reaction to maintenance complaints).
28 6,15 101 22,20 235 51,65 74 16,26 17 3,74 2,8927 0,8757
V39 You are satisfied with the response time of security.
26 5,70 80 17,54 181 39,69 135 29,61 34 7,46 3,1553 0,9867
Assurance
V12 Behaviour of management Instils confidence in you
19 4,18 112 24,62 227 49,89 77 16,92 20 4,40 2,9277 0,8668

190
Strongly D
isagree
Disagree
Neutral
Agree
Strongly A
gree
1 2 3 4 5
Variable
Fr % Fr % Fr % Fr % Fr %
Mean
Standard Deviation
V21 You feel safe in your transactions with management.
17 3,72
93
20,35 209 45,73 114 24,95 24 5,25 3,0765 0,8987
V26 Management is consistently courteous with you.
15 3,30 48 10,55 251 55,16 114 25,05 27 5,93 3,1969 0,8275
V33 Management has the knowledge to answer your questions.
17 3,73 62 13,60 258 56,58 101 22,15 18 3,95 3,0897 0,8101
V38 You are satisfied with the visibility of security in the centre.
24 5,25 83 18,16 154 33,70 151 33,04 45 9,85 3,2407 1,0297
V43 You are satisfied with the marketing of the centre.
63 13,79 135 29,54 125 27,35 119 26,04 15 3,28 2,7549 1,0867
V44 You are satisfied with the number of daily visitors to
the centre.
44 9,63 74 16,19 162 35,45 160 35,01 17 3,72 3,0700 1,0214
V45 The marketing fund of the centre is managed effectively.
63 13,82 149 32,68 147 32,24 89 19,52 8 1,75 2,6280 1,0030
Table 6.3 continues on the next page.
Table 6.3: Continued
Strongly D
isagree
Disagree
Neutral
Agree
Strongly A
gree
1 2 3 4 5
Variable
Fr % Fr % Fr % Fr % Fr %
Mean
Standard Deviation
V13 Management gives you individual attention and is
interested in your opinion.
36 7,88 132 28,88 207 45,30 74 16,19 8 1,75 2,7505 0,8805
Empathy
V18 Management shows interest in communicating with you.
29 6,36 99 21,71 221 48,46 82 17,98 25 5.48 2,9452 0,9314

191
Strongly D
isagree
Disagree
Neutral
Agree
Strongly A
gree
1 2 3 4 5
Variable
Fr % Fr % Fr % Fr % Fr %
Mean
Standard Deviation
V29 Management understands your specific needs.
21 4,61 94 20,61 254 55,70 78 17,11 9 1,97 2,9124 0,7954
V32 Management is always willing to help.
17 3,74 72 15,82 259 56,92 88 19,34 19 4,18 3,0437 0,8153
V37 Shopping hours are realistic. 30 6,58 67 14,69 114 25,00 225 49,34 20 4,39 3,2997 0,9955
V42 Shopping hours are convenient.
16 3,50 55 12,04 111 24,29 249 54,49 26 5,69 3,4682 0,9029
Tangibles
V14 Centre and facilities are neat and clean.
12 2,63 78 17,11 127 27,85 198 43,42 41 8,99 3,3916 0,9584
V19 The décor and facilities of the centre are visually appealing.
13 2,86 53 11,65 121 26,59 232 50,99 36 7,91 3,4945 0,9010
V27 You are satisfied with the air conditioning.
76 16,89 118 26,22 174 38,67 70 15,56 12 2,67 2,6017 1,0190
V30 There is sufficient parking at the centre.
19 4,18 42 9,23 97 21,32 249 54,73 48 10,55 3,5820 0,9426
V34 Routine maintenance and repairs are done regularly.
24 5,25 108 23,63 209 45,73 104 22,76 12 2,63 2,9387 0,8814
V35 Website of the centre is visua appealing.
24 5,61 46 10,75 235 54,91 104 24,30 19 4,44 3,0984 0,8436
V41 Brochures/pamphlets of the centre are visually appealing.
32 7,13 97 21,60 175 38,98 127 28,29 18 4,01 3,0043 0,9710
Table 6.3 continues on the next page.
Table 6.3: Continued
Variable
Strongly D
isagree
Disagree
Neutral
Agree
Strongly A
gree
Mean
Standard D
eviation

192
1 2 3 4 5
Fr % Fr % Fr % Fr % Fr %
Fairness
V25 You have the opportunity to fair negotiations with regard to the leasing contract.
47 10,42 120 26,61 208 46,12 67 14,86 9 2,00 2,7177 0,9063
V22 Terms and conditions of lease are equally fair for small tenants and bigger tenants.
119 26,50 131 29,18 137 30,51 53 11,80 9 2,00 2,3326 1,0465
V16 In general, small tenants are treated the same as bigger tenants.
154 33,77 136 29,82 101 22,15 52 11,40 13 2,85 2,1969 1,1104
V36 Your rental fee is realistic in comparison with that of bigger tenants.
95 20,97 166 36,64 138 30,46 47 10,38 7 1,55 2,3479 0,9707
V40 You perceive the promotions done at the centre to equally include the small tenants and the bigger tenants.
60 13,16 151 33,11 135 29,61 94 20,61 16
3,51 2,6827 1,0502
V46 You get value for your leasing fee.
28 6,17 71 15,64 214 47,14 132 29,07 9 1,98 2,9559 1,1391
The statement that rated the highest on mean score in Table 6.3 is “There is sufficient
parking at the centre” with a mean score of 3,5820 and standard deviation of 0,9426. The
statement that rated the second highest on mean score also relates to the tangibles aspect
of service quality, namely “the décor and facilities of the centre are visually appealing” (mean
score of 3,4945 and standard deviation of 1,1104). Fifteen statements had a mean score of
between 3 and 4 as indicated in Table 6.3.
The statement that rated the lowest on mean score (2,1969 and standard deviation of
1,1104) is “In general, small tenants are treated the same as bigger tenants”. The second
and third lowest statements also refer to the fairness aspect of service quality, namely “terms
and conditions of lease are equally fair for small tenants and bigger tenants” (mean score of
2,3326 and standard deviation of 1,0465) and “your rental fee is realistic in comparison with
that of bigger tenants” (mean score of 2,3479 and standard deviation of 0,9707). This
193
confirms what was found in the literature regarding small business tenants that feel that they
are being bullied and treated unfairly in comparison with big anchor tenants (Barrios, 2007;
Carswell, 2008; Cockram, 2002:43; Nieman, 2000:12; Roberts et al., 2010:599). A total of 21
statements had a mean score of between 2 and 3 as indicated in Table 6.3.
To confirm the validity and reliability of the measuring instrument, factor analysis was
executed and is discussed next.
6.4 VALIDITY AND RELIABILITY OF THE MEASURING INSTRUMENT
As mentioned in Chapter 5, factor analysis looks for patterns among the variables to
discover whether an underlying combination of the original variables (a factor) can
summarise the original set. Factor analysis attempts to reduce the number of variables and
discover the underlying constructs that explain the variance (Cooper & Schindler, 2006:590;
Diamantopoulos & Schlegelmilch, 2006:216).
Factor analysis was done on variables from the questionnaire used in this study. The
variables were sorted and rotated to obtain a clear pattern of loadings. These are factors
clearly marked by high loadings for some variables, and low loadings for others. This rotation
is aimed at maximising the variances of normalised factor loadings across the variables for
each factor.
The BMDP statistical programme was used to run the factor analysis on the variables. The
programme was run for four, three and two factors respectively. From the onset, variable 46
(the parking fees are realistic) were excluded due to the many respondents that did not
respond to that statement. The reason for the low response to this variable is because many
tenants do not pay an hourly parking fee at their shopping centres or they are on monthly
rented contracts in respect of parking. The two factor model produced the most acceptable
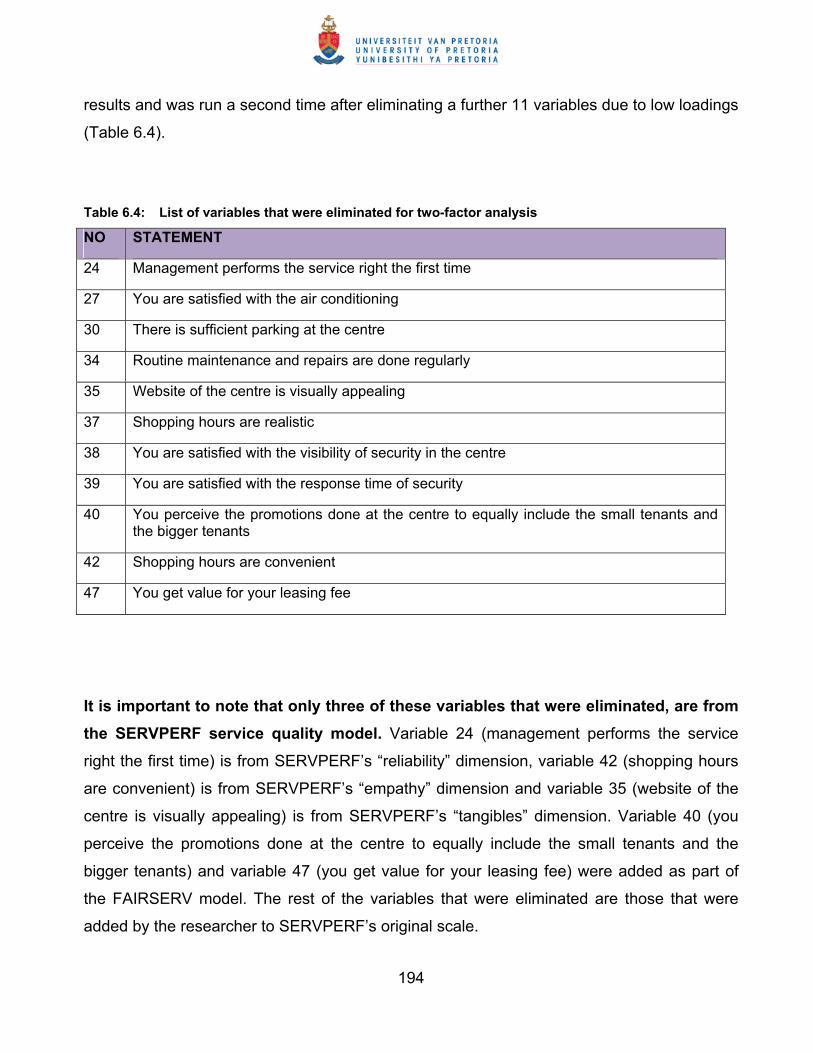
194
results and was run a second time after eliminating a further 11 variables due to low loadings
(Table 6.4).
Table 6.4: List of variables that were eliminated for two-factor analysis
NO STATEMENT
24 Management performs the service right the first time
27 You are satisfied with the air conditioning
30 There is sufficient parking at the centre
34 Routine maintenance and repairs are done regularly
35 Website of the centre is visually appealing
37 Shopping hours are realistic
38 You are satisfied with the visibility of security in the centre
39 You are satisfied with the response time of security
40 You perceive the promotions done at the centre to equally include the small tenants and the bigger tenants
42 Shopping hours are convenient
47 You get value for your leasing fee
It is important to note that only three of these variables that were eliminated, are from the SERVPERF service quality model. Variable 24 (management performs the service
right the first time) is from SERVPERF’s “reliability” dimension, variable 42 (shopping hours
are convenient) is from SERVPERF’s “empathy” dimension and variable 35 (website of the
centre is visually appealing) is from SERVPERF’s “tangibles” dimension. Variable 40 (you
perceive the promotions done at the centre to equally include the small tenants and the
bigger tenants) and variable 47 (you get value for your leasing fee) were added as part of
the FAIRSERV model. The rest of the variables that were eliminated are those that were
added by the researcher to SERVPERF’s original scale.
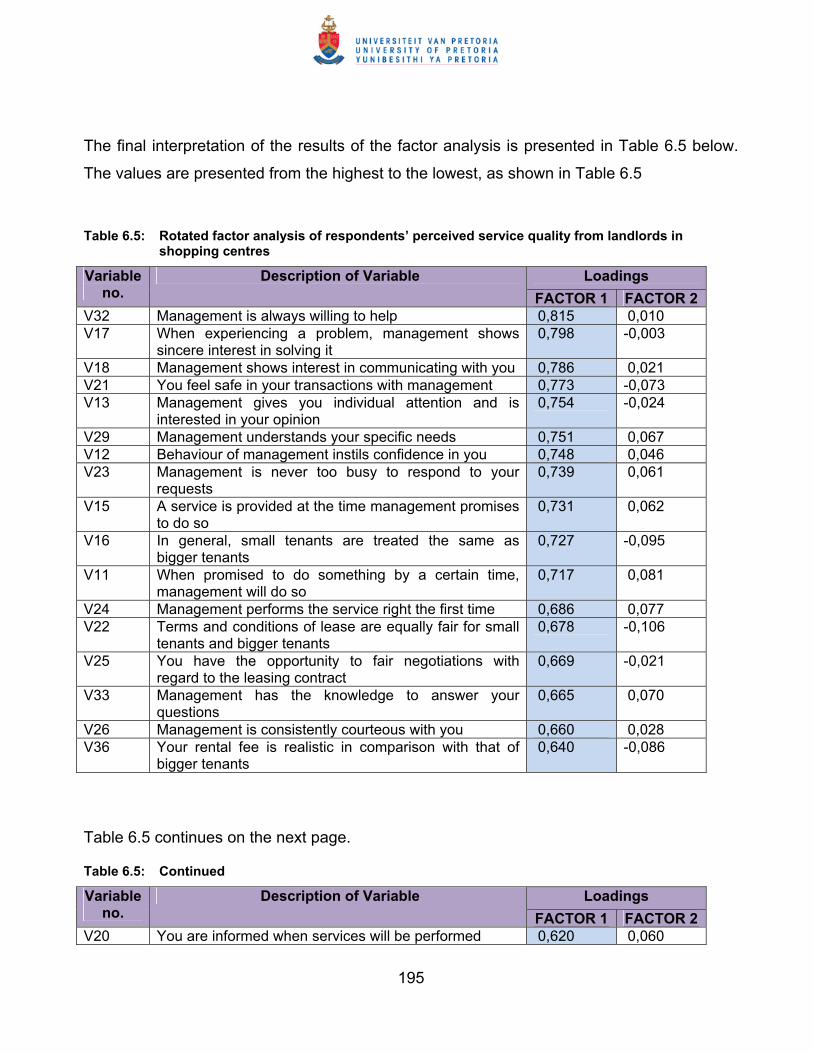
195
The final interpretation of the results of the factor analysis is presented in Table 6.5 below.
The values are presented from the highest to the lowest, as shown in Table 6.5
Table 6.5: Rotated factor analysis of respondents’ perceived service quality from landlords in shopping centres
Loadings Variable no.
Description of Variable FACTOR 1 FACTOR 2
V32 Management is always willing to help 0,815 0,010 V17 When experiencing a problem, management shows
sincere interest in solving it 0,798 -0,003
V18 Management shows interest in communicating with you 0,786 0,021 V21 You feel safe in your transactions with management 0,773 -0,073 V13 Management gives you individual attention and is
interested in your opinion 0,754 -0,024
V29 Management understands your specific needs 0,751 0,067 V12 Behaviour of management instils confidence in you 0,748 0,046 V23 Management is never too busy to respond to your
requests 0,739 0,061
V15 A service is provided at the time management promises to do so
0,731 0,062
V16 In general, small tenants are treated the same as bigger tenants
0,727 -0,095
V11 When promised to do something by a certain time, management will do so
0,717 0,081
V24 Management performs the service right the first time 0,686 0,077 V22 Terms and conditions of lease are equally fair for small
tenants and bigger tenants 0,678 -0,106
V25 You have the opportunity to fair negotiations with regard to the leasing contract
0,669 -0,021
V33 Management has the knowledge to answer your questions
0,665 0,070
V26 Management is consistently courteous with you 0,660 0,028 V36 Your rental fee is realistic in comparison with that of
bigger tenants 0,640 -0,086
Table 6.5 continues on the next page.
Table 6.5: Continued
Loadings Variable no.
Description of Variable FACTOR 1 FACTOR 2
V20 You are informed when services will be performed 0,620 0,060

196
Loadings Variable no.
Description of Variable FACTOR 1 FACTOR 2
V28 You receive prompt service (eg. reaction to maintenance complaints)
0,577 0,135
V31 Management insists on error-free leasing statements and other records
0,548 0-,004
V43 You are satisfied with the marketing of the centre 0,029 0,891 V45 The marketing fund of the centre is applied and
managed effectively 0,018 0,811
V41 Brochures/pamphlets of the centre are visually appealing
0,123 0,688
V44 You are satisfied with the number of daily visitors to the centre
-0,071 0,633
V19 The décor and facilities of the centre are visually appealing
0,042 0,521
According to Cooper and Schindler (2006:591) eigenvalues is the sum of the variances of
the factor values. When divided by the number of variables, an eigenvalue yields an
estimate of the amount of total variance explained by the factor.
The eigenvalues, that determine the number of factors when factor loading is done, are:
• Factor 1: 11,6116; and
• Factor 2: 2,35115.
The eigenvalue has to be greater or equal to one in order to be included as a factor when
loading is done on variables.
The percent of variance explained for the two factors are:

197
Factor 1: 44,4 percent; and
Factor 2: 7,64 percent.
Table 6.6: Labels given to the two factors
Factor 1: Intangibles
Factor 2: Marketing and tangibles
Factor 1 includes four of the items of the original reliability dimension as suggested by the
SERVPERF service quality model. It also includes three items of the responsiveness
dimension (SERVPERF), four items of the assurance dimension (SERVPERF), four items of
the empathy dimension (SERVPERF), as well as four items of the fairness dimension as
suggested by the FAIRSERV service quality model. “Intangibles” seems an appropriate title
as all the items relates to the “softer” and “caring” (intangible) aspects of the service offering
from the landlords to the small business tenants in shopping centres. It is also important to
note that none of the original “tangibles” aspect of the SERVPERF model is included here.
Another meaningful finding is that four out of the six items that were added by the researcher
as part of the fairness dimension of SERVPERF, have high factor loadings. This confirms
the relevance of the fairness aspect when perceived quality of landlords to small business
tenants is measured, although it is not identified as a separate factor. The relative high
eigenvalue (11,1020) relative to factor 2 (1,9113) indicates the importance of this factor for
small business tenants when it comes to the perceived service quality that they receive from
their landlords.
Factor 2 includes two of the items of the tangibles dimension as suggested by SERVPERF.
The other three items relate to marketing and were added by the researcher. All the items of
this factor include items clearly related to marketing and other tangibles.
198
Although the majority of the individual items from the SERVPERF scale were retained as
part of the two factors, it is clear that only two distinct dimensions are relevant in measuring
the service quality that small business tenants in shopping centres receive from their
landlords. Most of the FAIRSERV elements that were added to the measuring instrument
were retained after the factor analysis, but it was not identified as a separate dimension of
perceived service quality.
It seems that small business tenants in shopping centres are concerned mainly about two aspects namely, how they are treated by their landlords and how the tangibles and marketing of the shopping centre are handled by their landlords. The two most
important aspects about the landlord-small business tenant relationship therefore is that
small tenants want to be treated with respect and courtesy by their landlords and they want
their landlords to secure a steady flow of daily visitors to the shopping centre as well as to
their stores. It was therefore found that the combined SERVPERF and FAIRSERV model is
not suitable for measuring the perceived service quality that small business tenants in
shopping centres receive from their landlords. The implication of this is that other service
quality measurement tools need to be explored in order to find a suitable tool for this
relationship. Further research could also be done to explore the unique service quality
dimensions that small business tenants in shopping centres deemed important from which a
new model can be suggested.
With regard to the stated hypothesis the following can be deduced:

199
Hypothesis H2o is accepted: The combined SERVPERF and FAIRSERV model of service
quality, in its original form, will not be suitable to measure the perceived service quality that
small business tenants in shopping centres receive from their landlords.
To confirm the reliability and accuracy of the measuring instrument, the Cronbach alpha
coefficients were computed because the purpose of the analysis was to establish internal
consistency, in other words, the extent to which the administered questionnaire scales
measured the variables in a consistent manner. Struwig and Stead (2004:133) point out that
Cronbach coefficient alpha is appropriate when individuals respond to items on multiple
levels. According to them, it is particularly useful for measures that have Likert-type scales
where responses range for example from “strongly agree” to “strongly disagree”. Table 6.7
summarises these values. As can be seen from this table, the derived two factors delivered
excellent Cronbach alpha results. There is some debate in the literature on what constitutes
an acceptable alpha score. Nunally (1978) recommended that 0,500 is an acceptable
threshold for an acceptable alpha score and this is also the threshold adopted for this
research study.
Table 6.7: Cronbach alpha results
Factor Description Cronbach alpha value
Factor 1 Intangibles 0,9491
Factor 2 Marketing and tangibles 0,9535
Table 6.8 Correlation between two factors
Factor Factor 1 Factor 2
Factor 1 1,000
Factor 2 0,477 1,000
Table 6.8 indicates a positive correlation between the two factors, intangibles and marketing
and tangibles.
200
6.5 PERCEIVED SERVICE QUALITY ACCORDING TO THE TWO FACTORS
The respondents’ perceived service quality of the landlords’ service provided to them will
now be analysed according to the two identified factors (also refer to Table 6.3).
Statements that the respondents had to rate from 1 (strongly disagree) to 5 (strongly agree)
regarding the intangible dimension are the following:
• When promised to do something by a certain time, management will do so;
• Behaviour of management instils confidence in you;
• Management gives you individual attention and is interested in your opinion;
• A service is provided at the time management promises to do so;
• In general, small tenants are treated the same as bigger tenants;
• When experiencing a problem, management shows sincere interest in solving it;
• Management shows interest in communicating with you;
• You are informed when services will be performed;
• You feel safe in your transactions with management;
• Terms and conditions of lease are equally fair for small tenants and bigger tenants;
• Management is never too busy to respond to your requests;
• Management performs the service right the first time;
• You have the opportunity for fair negotiations with regard to the leasing contract;
• Management is consistently courteous to you;
• You receive prompt service (eg. reaction to maintenance complaints;
• Management understands your specific needs;
• Management insists on error-free leasing statement and other records;
• Management is always willing to help;
• Management has the knowledge to answer your questions; and
• Your rental fee is realistic in comparison with that of bigger tenants;
The mean score for evaluating the intangible aspect of service quality that small business
tenants in shopping centres receive from landlords, is 2,8812 (Table 6.9 on the next page).
Since a 5-point Likert scale was used, this score clearly indicates that respondents were
201
dissatisfied with this aspect of the service that they received. This indicates that the small
business tenants in shopping centres are in general not satisfied with the “softer” intangible
aspects of the service quality that they receive from their landlords. Numerous of the
comments that respondents made on the open-ended questions in the questionnaire,
confirm the fact that small business tenants in shopping centres are concerned about this
“caring” aspect of the landlords’ service provided to them (refer to section 6.7 on page 207
and Appendix C).
Statements that the respondents had to rate from 1 (strongly disagree) to 5 (strongly agree)
regarding the marketing and tangible dimension are the following:
• The décor and facilities of the centre are visually appealing;
• Brochures/pamphlets of the centre are visually appealing;
• You are satisfied with the marketing of the centre;
• You are satisfied with the number of daily visitors to the centre; and
• The marketing fund of the centre is managed effectively.
With respect to the marketing and tangibles factor, the mean score is 2,9903 (Table 6.9).
Although this indicates that respondents were slightly more satisfied with this aspect of
service quality from the landlord, the mean score is still below three and therefore indicates
that small business tenants are also dissatisfied with this aspect of the service to them.
Table 6.9: The mean scores on perceived service quality
VARIABLE N MEAN STANDARD DEVIATION
Factor 1: Intangibles 457 2,8812 2,8812Factor 2: Marketing and tangibles 457 2,9903 2,9904
From table 6.9 it is clear that the mean scores for both factors on the 5-point Likert scale are
less than three. This is an indication that the respondents are in general dissatisfied with the
overall perceived service quality that they receive from the landlords. The small business

202
tenants are more dissatisfied with the intangibles aspect of service quality than the
marketing and tangibles aspect. This is once again an indication of the importance of the
“softer”, caring aspect of service quality to the small business tenants in shopping centres.
In terms of the stated hypothesis the following can be deduced:
Hypothesis H1o is accepted: Small business tenants in shopping centres are in general
not satisfied with the service quality they receive from landlords.
6.6 ONE-WAY ANALYSIS OF VARIANCE (ANOVA)
In order to establish whether relationships exist between the factors and the independent
variables, a one-way analysis of variance (ANOVA) was conducted. ANOVA is a versatile
statistic which tests for the significant relationship between two or more groups of means
and also breaks down the variability of a set of data into its component sources of variation
(Cooper & Schindler, 2006:517; Wimmer & Dominic, 1983:215). Some of this study’s
hypotheses are built on the significant differences between variables and factors. ANOVA is
therefore used to prove or disprove some of these hypotheses. The ANOVA tables
presented in Tables 6.10 to 6.17 that follow are based on the data obtained from the 457
completed questionnaires. To comply with the assumptions for ANOVA namely, the
requirement of equal variances and normality of the residuals, the data was transformed
using a normal transformation.
Table 6.10 is presented on the next page.
Table 6.10: ANOVA: Intangibles
SOURCE F-VALUE ρ-Value V2 Respondents’ position in business 1,24 0,2951
203
V9 Number of centres leased from before 5,93 0,0006*** V6 Period as tenant in the centre 1,11 0,3462 V8 Business experience prior to leasing 2,56 0,0272*** v64 Types of shopping centres 8,49 0,0001***
The ρ-value of 0,05 indicates that the intangible determinants (factor 1) is significantly
influenced by the number of other shopping centres the small business tenant leased from
and also by the amount of business experience that the small business tenants had prior to
leasing in the particular centre (ρ 0,05). The type of shopping centre also significantly
influences the intangible determinants (ρ 0,05).
The intangible determinants are however, not significantly influenced by the respondents’
position in the business or by the period of time that the small business tenants are at a
particular shopping centre.
These findings show that it made no difference whether the respondents were the owners,
managers, owners and managers or any other full-time employees of the business when it
came to their perception of the intangible aspect of service quality received from the
landlords. The respondents’ perceptions of the intangibles aspects of service quality were
also not influenced by how long they have been tenants in the shopping centre.
In terms of hypotheses H3o and H4o the following can be deduced:
Hypothesis H3o is accepted. There are no statistical significant differences regarding the
perceived service quality that small business tenants receive from landlords, with regards to
the position of the respondent in the business in regarding the service quality construct:
intangibles.
Hypothesis H4o is accepted. With respect to the service quality construct intangibles, there
are no statistical significant differences regarding the perception of service quality between

204
small business tenants who have been a tenant in the centre for a short time and those who
have been a tenant for long.
To further investigate the ANOVA results, Post-Hoc tests were done using least square
means t-tests.
Table 6.11: Mean scores of the number of other shopping centres tenants leased from in terms of the intangibles
Level of V9 (Number of other centres leased in before)
N Mean Standard Deviation
0 123 2,830 a b 0,6391 154 2,742 a 0,5172 60 3,103 c 0,7513-5 52 2,945 b c 0,611Means with different alphabetic indicators (a, b, c) differ significantly on the 5 % level
A significant statistical difference exists between the small business tenants that have not
leased in other shopping centres before and those that have been leasing in two other
centres before.
The respondents’ perceptions of the intangibles aspect of perceived service quality were
therefore significantly influenced by their previous tenancies in other shopping centres. This
may be because of good or bad experiences that the small business tenants might have in
other shopping centres. These experiences may create expectations and may have an
influence on their current perception of the service quality they receive from the landlords.
In terms of hypothesis H5 the following can be deduced:

205
Hypothesis H5o is rejected. There are no statistical significant differences regarding the
service quality construct: intangibles between small business tenants who has been a tenant
in other shopping centres before and those who have never been a tenant in other shopping
centres before with respect to the perceived service quality.
Table 6.12: Mean scores of the number of business experience of the tenants prior to leasing in the centre in terms of intangibles.
Level of V8 (Business experience prior to leasing)
N Mean Standard Deviation
0-1 39 2,896 a 0,619
2-6 54 3,111 b 0,8237-11 76 2,856 a 0,587
12-16 50 2,778 a 0,49717-21 104 2,781 a 0,56122+ 66 2,781 a 0,601Means with different alphabetic indicators (a, b) differ significantly on the 5 % level
Table 6.12 shows that there is a significant statistical difference between those small
business tenants that have two to six years of business experience prior to leasing in the
centre and those with 7 to 11 years, those with 12 to 16 years, those with 17 to 21 years and
those with more than 22 years of business experience.
The respondents’ perceptions of the intangibles aspects of service quality were therefore
influenced by their previous business experience.
In terms of hypothesis H6o the following can be deduced:
Hypothesis H6o is rejected. There are no statistical significant differences regarding the
service quality construct: intangibles between small business tenants who had no or little
business experience prior to leasing in the shopping centre and those who had business
experience with respect to the perceived service quality.

206
Table 6.13: Mean scores of the different types of shopping centres in terms of intangibles
Level of v64 (Types of shopping centres) N
Mean Standard Deviation
Community 93 2,605 a 0,683Lifestyle 23 3,084 c d 0,604Neighbourhood 65 3,086 d 0,467Regional 84 2,934 b c 0,676Small Regional 42 2,998 c d 0,631Strip 14 2,408 a 0,599Super Regional 68 2,790 b 0,395Means with different alphabetic indicators (a, b, c, d) differ significantly on the 5 % level
Table 6.13 indicates that there is a significant statistical difference between community
centres and all the other types of centres with the exception of strip centres. There are also
significant statistical differences between lifestyle centres and strip centres, between
neighbourhood centres and regional centres, strip centres and super regional centres and
between regional centres and strip centres. The other significant statistical differences are
between small regional centres and strip centres, small regional centres and super regional
centres and between strip centres and super regional centres.
The respondents’ perceptions of perceived service quality were therefore significantly
influenced, depending on the type of shopping centre they were leasing from.
In terms of the stated hypotheses the following can be deduced:
Hypothesis H7o is rejected. There are no statistical significant differences with respect to
service quality construct: intangibles regarding the perception of service quality received by
small business tenants from landlords of different types of shopping centres in Pretoria.
Table 6.14: ANOVA: Marketing and tangibles
SOURCE F-VALUE ρ-Value V2 Respondents’ position in business 0,97 0,4083

207
V9 Tenant in other centres before 3,36 0,0190***
V6 Period as tenant in the centre 5,59 0,0009***
V8 Business experience prior to leasing 1,46 0,2032
V64 Types of shopping centres 24,95 0,0001***
The ρ-value of 0,05 indicates that the marketing and tangibles determinants (factor 2) are
significantly influenced by whether the small business tenant was a tenant in other shopping
centres and also by the period that the tenant is at that particular shopping centre. The type
of shopping centre also significantly influences the intangible determinants (ρ 0,05).
The fact that the intangible, as well as the marketing and tangible determinants are
significantly influenced by whether the small business tenant was a tenant in other shopping
centres before, might have been expected. The small business tenants have experience of
the level of service quality they received from previous landlords, and therefore will have
certain expectations of their current landlord’s service.
The marketing and tangible determinants are however, not significantly influenced by the
respondents’ position in the business or by the amount of business experience that the small
business tenants had prior to leasing in the particular centre.
These findings show that it made no difference whether the respondents were the owners,
managers, owners and managers or any other full-time employees of the business when it
came to their perception of the marketing and tangible aspect of service quality received
from the landlords.
Their perceptions of the marketing and tangible aspects of service quality were also not
influenced by their previous business experience.
In terms of the stated hypotheses the following can be deduced:

208
Hypothesis H3o is accepted: There are no statistical significant differences in terms of the
marketing and tangibles service quality construct regarding the perceived service quality that
landlords provide to small business tenants, relative to the respondent’s position in the
business.
Hypothesis H6o is accepted: There are no significant differences regarding the perceived
service quality received between small business tenants who had no business experience
prior to leasing in the shopping centre and those who had no business experience.
Table 6.15: Mean scores of the number of years as tenant in particular centre in terms of marketing and tangibles
Level of V6 (Period as tenant in the centre) N Mean Standard Deviation
2 34 3,058 a b 0,9322-6 209 2,951 a b 0,7157-11 76 3,068 a b 0,71812+ 70 2,860 a 0,895Means with different alphabetic indicators (a, b) differ significantly on the 5 % level
Table 6.15 shows that there is a significant statistical difference between tenants who are
tenants in the particular shopping centre for less than two years and those with more than
twelve years tenancy in the centre. There is also a difference between tenants with two to six
years tenancy in the centre and those with more than 12 years in the centre as well as
between tenants with 7 to 11 years in the centre and those with more than 12 years in the
centre. Their perceptions of the marketing and tangible aspects of service quality were in
other words influenced by the length of their tenancy.
It can therefore be deduced that:
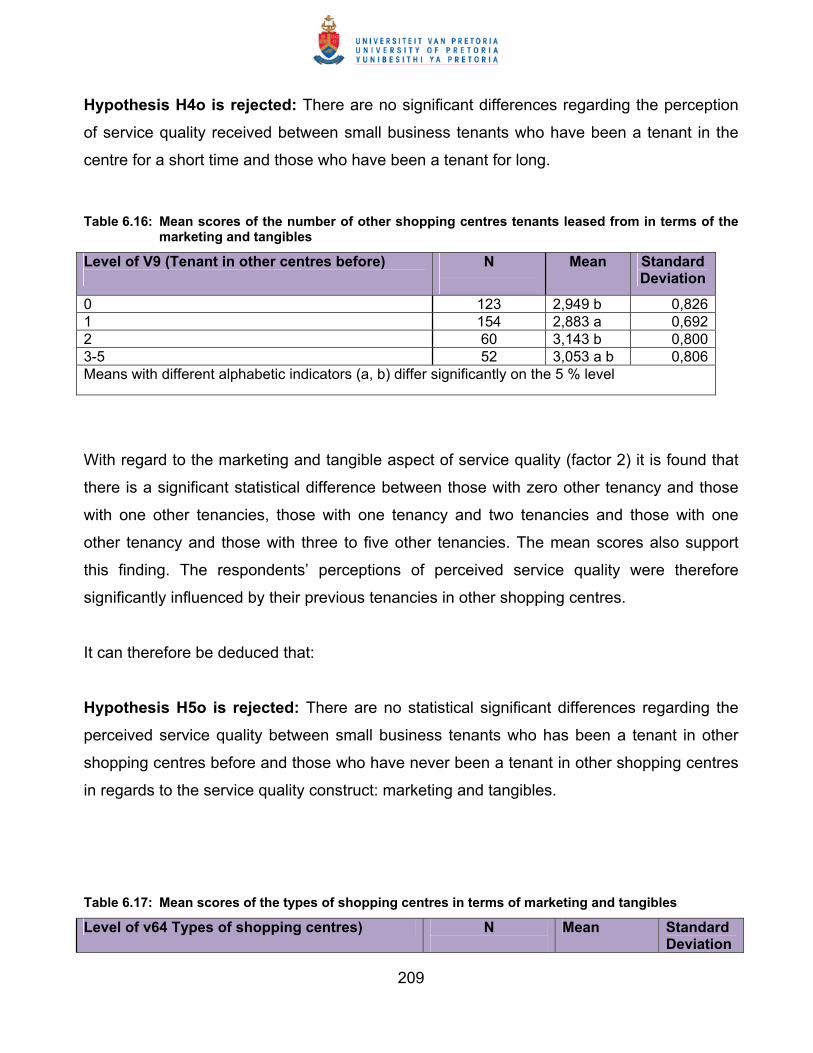
209
Hypothesis H4o is rejected: There are no significant differences regarding the perception
of service quality received between small business tenants who have been a tenant in the
centre for a short time and those who have been a tenant for long.
Table 6.16: Mean scores of the number of other shopping centres tenants leased from in terms of the marketing and tangibles
Level of V9 (Tenant in other centres before)
N
Mean Standard
Deviation
0 123 2,949 b 0,8261 154 2,883 a 0,6922 60 3,143 b 0,8003-5 52 3,053 a b 0,806Means with different alphabetic indicators (a, b) differ significantly on the 5 % level
With regard to the marketing and tangible aspect of service quality (factor 2) it is found that
there is a significant statistical difference between those with zero other tenancy and those
with one other tenancies, those with one tenancy and two tenancies and those with one
other tenancy and those with three to five other tenancies. The mean scores also support
this finding. The respondents’ perceptions of perceived service quality were therefore
significantly influenced by their previous tenancies in other shopping centres.
It can therefore be deduced that:
Hypothesis H5o is rejected: There are no statistical significant differences regarding the
perceived service quality between small business tenants who has been a tenant in other
shopping centres before and those who have never been a tenant in other shopping centres
in regards to the service quality construct: marketing and tangibles.
Table 6.17: Mean scores of the types of shopping centres in terms of marketing and tangibles
Level of v64 Types of shopping centres) N
Mean Standard Deviation
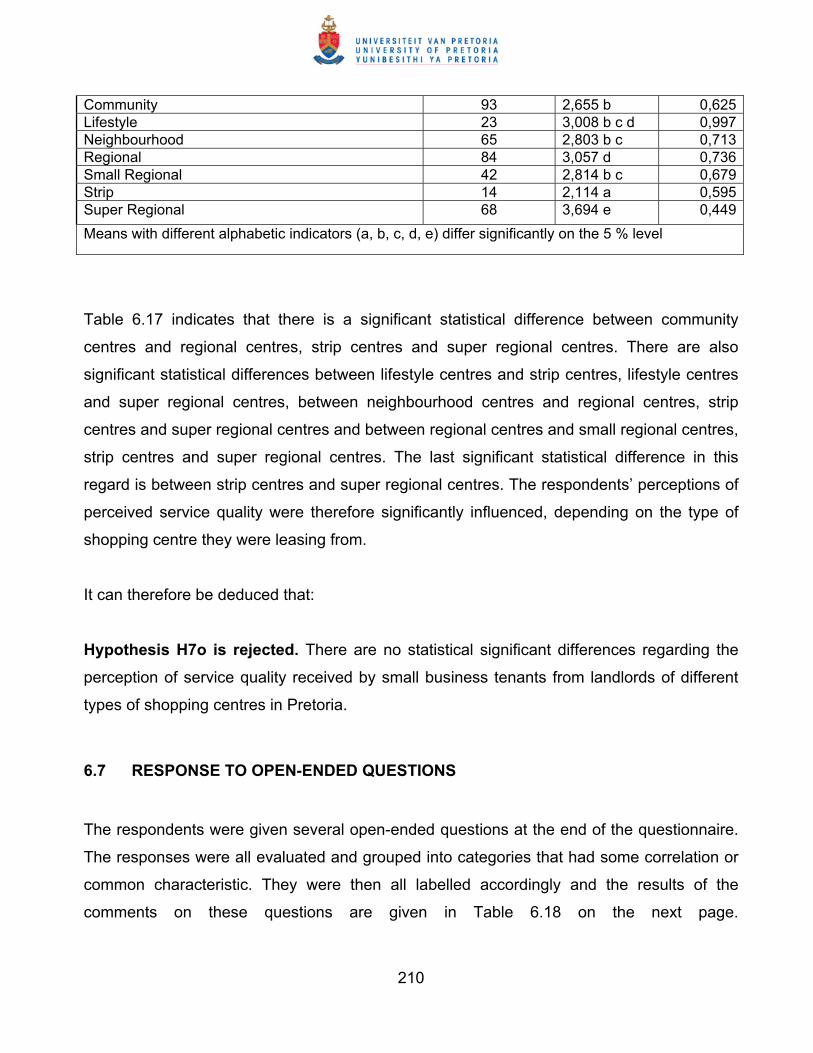
210
Community 93 2,655 b 0,625Lifestyle 23 3,008 b c d 0,997Neighbourhood 65 2,803 b c 0,713Regional 84 3,057 d 0,736Small Regional 42 2,814 b c 0,679Strip 14 2,114 a 0,595Super Regional 68 3,694 e 0,449Means with different alphabetic indicators (a, b, c, d, e) differ significantly on the 5 % level
Table 6.17 indicates that there is a significant statistical difference between community
centres and regional centres, strip centres and super regional centres. There are also
significant statistical differences between lifestyle centres and strip centres, lifestyle centres
and super regional centres, between neighbourhood centres and regional centres, strip
centres and super regional centres and between regional centres and small regional centres,
strip centres and super regional centres. The last significant statistical difference in this
regard is between strip centres and super regional centres. The respondents’ perceptions of
perceived service quality were therefore significantly influenced, depending on the type of
shopping centre they were leasing from.
It can therefore be deduced that:
Hypothesis H7o is rejected. There are no statistical significant differences regarding the
perception of service quality received by small business tenants from landlords of different
types of shopping centres in Pretoria.
6.7 RESPONSE TO OPEN-ENDED QUESTIONS
The respondents were given several open-ended questions at the end of the questionnaire.
The responses were all evaluated and grouped into categories that had some correlation or
common characteristic. They were then all labelled accordingly and the results of the
comments on these questions are given in Table 6.18 on the next page.

211
Table 6.18: Results of open-ended questions per type of centre
Type of centre Neigh-
bourhood Community Small
Regional Regional Super
Regional Lifestyle Strip Total
Question 11 Reason(s) for
selecting particular centre
Fr % Fr % Fr % Fr % Fr % Fr % Fr % Fr %
Big, prominent and well-known centre
20 18,02 35 21,74 28 49,12 51 32,69 74 56,92 13 33,33 3 14,29 224 33,19
Good, convenient location
35 31,53 65 40,37 16 28,07 61 39,10 35 26,92 20 51,28 7 33,33 239 35,41
Good marketing mix in centre
13 11,71 20 12,42 4 7,02 14 8,97 13 10,00 4 10,26 3 14,29 71 10,52
Marketing of centre is good
1 0,90 0 0,00 0 0,00 0 0,00 1 0,77 0 0,00 0 0,00 2 0,30
Rental fee is reasonable
9 8,11 11 6,83 2 3,51 2 1,28 0 0,00 0 0,00 6 28,57 30 4,44
Business was available and was good investment
14 12,61 16 9,94 3 5,26 10 6,41 5 3,85 0 0,00 1 4,76 49 7,26
Sufficient and cheap/ free parking
2 1,80 0 0,00 0 0,00 0 0,00 0 0,00 0 0,00 0 0,00 2 0,30
Shopping hours convenient
2 1,80 1 0,62 0 0,00 2 1,28 0 0,00 0 0,00 0 0,00 5 0,74
Good feet count 15 13,51 13 8,07 4 7,02 16 10,26 2 1,54 2 5,13 1 4,76 53 7,85 Total 111 16,44 161 23,85 57 8,44 156 23,11 130 19,26 39 5,78 21 3,11 675 100,00
Question 12 Most positive
features of service
Good marketing and promotions
12 16,67 4 3,70 3 16,24 19 16,24 61 61,00 5 16,13 0 0,00 104 21,62
Table 6.18 continues on the next page.
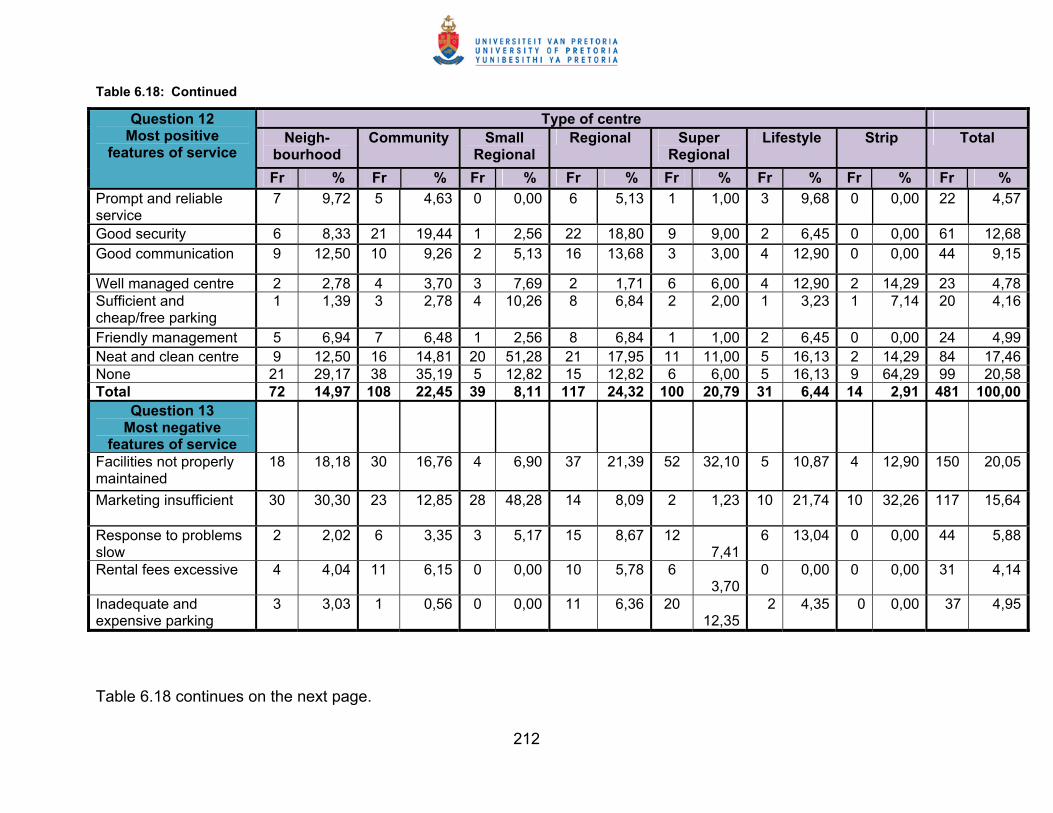
212
Table 6.18: Continued
Type of centre Neigh-
bourhood Community Small
Regional Regional Super
Regional Lifestyle Strip Total
Question 12 Most positive
features of service Fr % Fr % Fr % Fr % Fr % Fr % Fr % Fr %
Prompt and reliable service
7 9,72 5 4,63 0 0,00 6 5,13 1 1,00 3 9,68 0 0,00 22 4,57
Good security 6 8,33 21 19,44 1 2,56 22 18,80 9 9,00 2 6,45 0 0,00 61 12,68 Good communication 9 12,50 10 9,26 2 5,13 16 13,68 3 3,00 4 12,90 0 0,00 44 9,15
Well managed centre 2 2,78 4 3,70 3 7,69 2 1,71 6 6,00 4 12,90 2 14,29 23 4,78 Sufficient and cheap/free parking
1 1,39 3 2,78 4 10,26 8 6,84 2 2,00 1 3,23 1 7,14 20 4,16
Friendly management 5 6,94 7 6,48 1 2,56 8 6,84 1 1,00 2 6,45 0 0,00 24 4,99 Neat and clean centre 9 12,50 16 14,81 20 51,28 21 17,95 11 11,00 5 16,13 2 14,29 84 17,46 None 21 29,17 38 35,19 5 12,82 15 12,82 6 6,00 5 16,13 9 64,29 99 20,58 Total 72 14,97 108 22,45 39 8,11 117 24,32 100 20,79 31 6,44 14 2,91 481 100,00
Question 13 Most negative
features of service
Facilities not properly maintained
18 18,18 30 16,76 4 6,90 37 21,39 52 32,10 5 10,87 4 12,90 150 20,05
Marketing insufficient 30 30,30 23 12,85 28 48,28 14 8,09 2 1,23 10 21,74 10 32,26 117 15,64
Response to problems slow
2 2,02 6 3,35 3 5,17 15 8,67 12 7,41
6 13,04 0 0,00 44 5,88
Rental fees excessive 4 4,04 11 6,15 0 0,00 10 5,78 6 3,70
0 0,00 0 0,00 31 4,14
Inadequate and expensive parking
3 3,03 1 0,56 0 0,00 11 6,36 20 12,35
2 4,35 0 0,00 37 4,95
Table 6.18 continues on the next page.
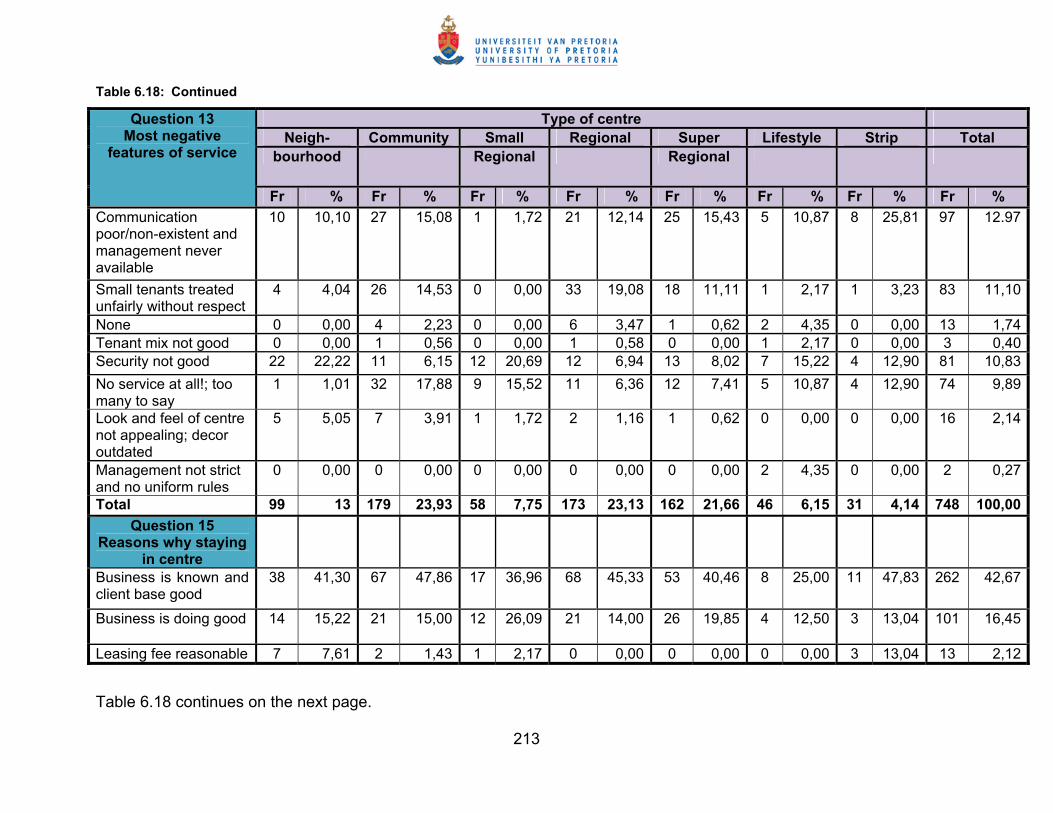
213
Table 6.18: Continued
Type of centre Neigh- Community Small Regional Super Lifestyle Strip Total
bourhood Regional Regional
Question 13 Most negative
features of service
Fr % Fr % Fr % Fr % Fr % Fr % Fr % Fr % Communication poor/non-existent and management never available
10 10,10 27 15,08 1 1,72 21 12,14 25 15,43 5 10,87 8 25,81 97 12.97
Small tenants treated unfairly without respect
4 4,04 26 14,53 0 0,00 33 19,08 18 11,11 1 2,17 1 3,23 83 11,10
None 0 0,00 4 2,23 0 0,00 6 3,47 1 0,62 2 4,35 0 0,00 13 1,74 Tenant mix not good 0 0,00 1 0,56 0 0,00 1 0,58 0 0,00 1 2,17 0 0,00 3 0,40 Security not good 22 22,22 11 6,15 12 20,69 12 6,94 13 8,02 7 15,22 4 12,90 81 10,83 No service at all!; too many to say
1 1,01 32 17,88 9 15,52 11 6,36 12 7,41 5 10,87 4 12,90 74 9,89
Look and feel of centre not appealing; decor outdated
5 5,05 7 3,91 1 1,72 2 1,16 1 0,62 0 0,00 0 0,00 16 2,14
Management not strict and no uniform rules
0 0,00 0 0,00 0 0,00 0 0,00 0 0,00 2 4,35 0 0,00 2 0,27
Total 99 13 179 23,93 58 7,75 173 23,13 162 21,66 46 6,15 31 4,14 748 100,00 Question 15
Reasons why staying in centre
Business is known and client base good
38 41,30 67 47,86 17 36,96 68 45,33 53 40,46 8 25,00 11 47,83 262 42,67
Business is doing good 14 15,22 21 15,00 12 26,09 21 14,00 26 19,85 4 12,50 3 13,04 101 16,45
Leasing fee reasonable 7 7,61 2 1,43 1 2,17 0 0,00 0 0,00 0 0,00 3 13,04 13 2,12
Table 6.18 continues on the next page.

214
Table 6.18: Continued
Type of centre Neigh-
bourhood Community Small
Regional Regional Super
Regional Lifestyle Strip Total
Question 15 Reasons why staying
in centre Fr % Fr % Fr % Fr % Fr % Fr % Fr % Fr %
Shopping hours are convenient
1 1,09 1 0,71 0 0,00 3 2,00 0 0,00 0 0,00 0 0,00 5 0,81
Security is good 2 2,17 4 2,86 0 0,00 2 1,33 0 0,00 0 0,00 0 0,00 8 1,30 Free/cheap parking 2 2,17 0 0,00 0 0,00 0 0,00 0 0,00 1 3,13 0 0,00 3 0,49 Bound by leasing contract
5 25,43 21 15,00 7 15,22 24 16,00 11 8,40 11 34,38 4 17,39 83 13,52
Not staying 2 2,17 3 2,14 1 2,17 2 21,33 0 0,00 2 6,25 0 0,00 11 1,79 Total 92 14,98 140 22,80 46 7,49 150 24,43 131 21,34 32 5,21 23 3,75 614 100,00 Fr = n of responses and % = fr % of all the type of centres’ responses

215
6.7.1 Reasons for selecting the shopping centre
Referring to Table 6.18, the majority of responses, on the reasons why small business
tenants have selected the particular shopping centre, were that the centre is a good and
convenient location to do business in (35,41 percent). This confirms Yan and Eckman’s
(2009:24) and Levy and Weitz’s (2009:210) belief that retail location has long been
considered as an important strategic business decision and that a sustainable competitive
advantage can be developed through the right location for a business. Berman and Evans
(2010:287) found that the site with the most pedestrian traffic is often the best location for a
business. Levy and Weitz (2009:201), Rajagpal (2009:99) and Roberts et al. (2010:598)
found that shopping centres play a major role in attracting customer traffic to all the tenants
because it is convenient for customers and it provides an assortment of merchandise. The
small business tenants that were part of this study surely agreed with this and considered it
an advantage to locate their businesses in a shopping centre. The second most responses
(33,19 percent) also referred to location. These respondents indicated that they chose the
shopping centre because it was a big, prominent and well-known centre. A total of 68,60
percent of the respondents therefore have selected the shopping centre because it was a
good location for their businesses.
6.7.2 Most positive features of landlord’s service
On the question of what the most positive features of the landlord’s service to the small
business tenants in shopping centres are, a percentage of 20,58 indicated that there were
no positive features. This is quite alarming, since it is the second highest response to this
question after good marketing and promotions. If we add the 9,89 percent of respondents
that indicated under the question of the most negative features, that there are “no service at
all” and “too many negative features to mention”, it brings the total of very dissatisfied
respondents to 30,47 percent. A clean and neat centre is 17,46 percent of the respondents’
most positive feature.

216
6.7.3 Most negative features of landlord’s service
It is interesting that 15,64 percent of respondents indicated that marketing of the centre is
the most negative feature of the landlord’s service provided to them. The majority of
respondents (20,05 percent) indicated that the most negative feature of their landlord’s
service provided to them is that facilities are not properly maintained. Poor or non-existing
communication and, small tenants being treated unfairly and without respect, accounted for
12,97 percent and 11,10 percent respectively of the respondents’ most negative features of
their landlords’ services provided to them. If the other “intangible” aspects namely, response
to problems (5,88 percent), excessive rental fees (4,14 percent), expensive parking (4,95
percent), poor security (10,83 percent) and unfair application of rules by management (0,27
percent) of the most negative features of service quality are added to these two aspects, it
brings the total percentage to 50,14 percent of respondents that are dissatisfied with the
intangible service quality aspect.
Over half of the respondents therefore have mentioned intangible aspects as the most
negative features of the service they receive from their landlords. From this large
percentage, it can be deduced that small business tenants in shopping centres are very
much concerned about how they are treated by landlords and, whether the landlords have in
general empathy with them (intangible aspects). This is supported by the empirical findings
indicated in Table 6.9 where it was shown that the mean score on this aspect is 2,8812.
6.7.4 Reasons for remaining in the shopping centre
Referring to Table 6.18, most of the respondents (59,12 percent) have indicated that they
remain as a tenant in the shopping centre because their business is known, their client base
is good and that their business is doing well. Only 1,79 percent of the respondents have
indicated that they are going to move out of the centre and 13,52 percent have indicated that
the only reason why they are staying, is because they are bound by their leasing contract.

217
6.7.5 Conclusion
It is thus clear that many small business tenants are in fact dissatisfied with many aspects of
the services that they receive from their landlords, but are still going to stay on as a tenant in
the shopping centre. The reason for this is probably due to the fact that the landlord-small
business tenant relationship in shopping centres is quite unique. This relationship is not the
same as a customer that is doing business with a retailer. If customers are not satisfied with
the service that they receive from a retailer, it is easy for the customers to simply change to
another service provider. In the case of tenants in shopping centres, it is not that easy (or
inexpensive) to simply change their location to another shopping centre if the service they
receive from their landlord is, in their opinion not good. Most small business tenants cannot
change to another shopping centre as they are usually tied into three or five year lease
agreements.
If their business in a shopping centre is known, their client base is good and their business is
doing well, (as indicated by the 59,12 percent in this study) they are most likely willing to stay
on as a tenant even if they perceive the service that they receive from their landlords as
poor. In many cases, a particular shopping centre is perceived to be such a good location for
businesses, that there is a long waiting list of interested tenants ready to move in. It is
indeed probable that landlords know this, and it will therefore not be a matter of urgency for
these landlords to satisfy their clients in the same way as the other “ordinary” service
providers.
Also refer to the verbatim comments made by small business tenants in shopping centres
(Appendix C).
Since it was found that the separate SERVPERF and FAIRSERV dimensions are not
appropriate for measuring quality in a landlord-small business relationship in shopping
centres, these responses to the open-ended questions can in reality also be used as a base
for future research in determining the dimensions of service quality that small business
tenants in shopping centres deemed important.

218
6.8 CONCLUSION
In this chapter, relevant information was obtained and explained by means of descriptive and
inferential statistics. Relevant data was captured and provided in tabular and figure format.
The various statistical techniques and methods as discussed within the scope of Chapter 5
(Research design and methodology) were practically applied within Chapter 6.
The business demographic information of the respondents was presented as well as their
personal demographic information. The respondents’ perceptions of the service quality they
receive from their landlords were captured in relation to the original five SERVPERF
dimensions and one FAIRSERV dimension. Later in the chapter, this was also done after
factor analysis on the two distinct factors of intangibles, and marketing and tangibles.
Factor analysis confirmed two perceived service quality factors, namely intangibles and
marketing and tangibles. The factor analysis indicated relatively high construct validity of
the measuring instrument as evidenced by the high Cronbach alpha scores. The One-Way
ANOVA test and Post hoc tests using least square means t-tests were also executed to
illustrate statistical differences between various variables. ANOVA was used to test
hypotheses H3o to H7o.
In the next chapter, attention will be paid to the conclusions and the most important
recommendations. The objectives and hypotheses of the study will be revisited. The
information obtained will be applied within the boundaries and limitations of this particular
study.

219
CHAPTER 7
CONCLUSION AND RECOMMENDATIONS
7.1 INTRODUCTION
The previous chapter presented the empirical findings of the study and these were
discussed in detail. This chapter provides an overview of the literature study, while the
research objectives, research questions and hypotheses are revisited and interpreted. The
hypotheses are furthermore accepted or rejected based on the statistical techniques
executed in Chapter 6. The contribution to the science and limitations of the study is
indicated, together with the recommendations for further research into this field. The chapter
ends with a summary and conclusion to the study.
7.2 SUMMARY OF THE CHAPTERS
A review of each chapter of this thesis is presented next.
7.2.1 Background and definition of the study
Chapter One discussed the background of the study and presented the problem statement
as well as the primary and secondary objectives of the study. The chapter also presented an
overview of the scope of the study. In so doing, it examined the rationale and
conceptualisation of the study, thereby laying a foundation for the subsequent chapters of
the thesis that were outlined. The chapter further formulated a number of research questions
that were answered, and it also stated the hypotheses that were tested in the study.

220
7.2.2 Services and an introduction to quality
This chapter provided a critical review of literature about the concepts of services and
quality. A distinction was first made between service quality and customer satisfaction. The
literature revealed that it is important to distinguish between the two concepts, although clear
distinctions were not always found in the literature. Traditionally, service quality and
customer satisfaction were viewed as equivalent constructs but some degree of consensus
among scholars were found in the literature that these are indeed distinctive constructs. The
most popular definition of service quality in the literature is based on the so-called
“disconfirmation approach” where customer satisfaction is said to be a comparison between
customer expectations and perceptions regarding the actual service encounter (Bateson &
Hoffman, 2010:295; Kasper et al., 2006:105). It has been suggested that service quality is
descriptive and based on fact (the customers’ judgement about the service itself), while
satisfaction is more evaluative and based on emotion (more of a judgement of how the
service affects the customer emotionally) (Schneider & White, 2004:51).
Empirical evidence was found in the literature that perceived service quality leads to
satisfaction (Al-Hawari & Ward, 2006:140; Cristobal et al., 2007:332; Dabholkar & Overby,
2005:23; Dagger & Sweeney, 2006:6; Fisk et al., 2008:155; Gounaris et al., 2010:150;
Hume, 2008:349; Kasper et al., 2006:105; Lundahl et al., 2009:588; Maddern et al.,
2007:1013; Pantouvakis & Lymperopoulos, 2008:623; Pollack, 2008:537; 2009:46; Solvang,
2007:120; Zhang et al., 2009:81). It was suggested that service quality creates a chain
reaction with regard to customer satisfaction and customer loyalty in the establishment of
enduring relationships with service firms (Fisk et al., 2008:153). The assumption was
therefore made that this notion also holds true for the relationship between small business
tenants in shopping centres and their landlords. If the small business tenant is experiencing
high service quality from the landlord, they will be more likely to remain at their location in
the shopping centre and the landlord would not need to waste money on marketing and
other related costs to fill the vacancy.
221
This research study though, concentrated on service quality as the spark that ignites the
chain reaction towards customer satisfaction and positive behavioural intentions from the
small business tenants. High service quality is thus viewed as an important aspect that
needed investigation in the relationship between landlords and small business tenants in
shopping centres.
With regard to the concept of services, it was found that it has changed considerably during
the past 30 years. In earlier work found in the literature, the characteristics of services were
viewed as a means to explain services and, it was believed that services should be defined
by emphasising the difference between services and goods. Although many scholars admit
that the distinction between goods and services is not always very clear, it is generally
accepted that they are not distinct. These scholars believed that there is an important
interdependence between goods and services, where some services may require physical
goods to support and facilitate the delivery system and some physical goods may have
intangible aspects. The view of Shostack (1977), that services can be arrayed on a
continuum of intangibility, with pure services at the one extreme of the continuum and pure
goods at the other extreme were widely accepted by researchers. Services offered by
landlords to small business tenants in shopping centres were regarded as a good example
of services that fall between the two extremes of the continuum.
Chapter Two further reported on the lively debate in the literature about the differences
between goods and services. Several scholars like Akehurst (2008), Araujo and Spring
(2006), Corrêa et al. (2007), Vargo and Lusch (2004b) and Ward and Graves (2007) were of
the opinion that the differences between goods and services became increasingly blurred
and regarded it as out of date, unproductive, distracting and irrelevant. It was found that in
the early seventies, Levitt (1972) insisted that there are no such things as service industries,
only industries whose service components are greater or less than those of other industries.
The literature further revealed that more than 30 years later, Vargo and Lusch (2004a:5)
emphasised the importance of service businesses by, maintaining that services become the
unifying purpose of any business relationship – a service-dominant rather than a goods-
dominant environment.
222
The literature cited from the scholarly work of Edvardsson et al. (2005), Grönroos (1988),
Grönroos (2006), Lovelock and Wirtz (2011) and Moeller (2010) were in agreement with the
fact that it is difficult to define a service. A more recent view in the literature on the definition
of a service was found to be that of Lusch and Vargo (2011) and Vargo and Lusch (2004)
where they base their definition of a service on the so-called value-in-use view: “the
application of specialised competences, through deeds, processes and performances for the
benefit of another entity or the entity itself”. According to this more recent view in the
literature, value is created when products, goods or services are used by customers.
It was found that many textbooks and research articles still complement their discussion of
what services are by differentiating between goods and services by means of the
characteristics of services (Bateson & Hoffman, 2011; Chase et al., 2006; Evans & Lindsay,
2008; Fisk et al., 2008; Fitzsimmons & Fitzsimmons, 2006; Heizer & Render, 2006;
Hollensen, 2010; Kasper et al., 2006), to mention only a few. The characteristics of services
(intangibility, inseparability, heterogeneity and perishability) as discussed in the literature by
several scholars were therefore also discussed in Chapter 2. Several criticisms on these four
characteristics were however found in the literature and were briefly discussed as well.
As far as the concept of quality is concerned, the reviewed literature revealed that the
understanding and improving of quality are key factors leading to business success, growth
and competitiveness. The meaning of quality was discussed in this chapter from Garvin’s
(1984) proposed approaches, namely the transcendent approach, the product-based
approach, the user-based approach, the manufacturing-based approach and the value-
based approach.
7.2.3 Service quality
The third chapter presented a review of the literature on service quality. The literature
covered a brief review of perceived quality as a concept and also covered several service
quality models. It was found in the literature that scholars like Grönroos (1988),
Parasuraman et al. (1986), Schneider and White (2004) and Zeithaml (1988) have

223
expressed a preference for the concept “perceived quality”. They argued that all quality
evaluations in effect are subjective, because these are made by people. Therefore,
perceived quality was cast as “the customer’s judgement about a service’s overall
excellence or superiority” and it was found in the literature that perceived quality is
influenced by aspects such as extrinsic attributes (brand name and level of advertising),
intrinsic attributes, and perceptions of lower-level attributes (perceived monetary price and
reputation).
It was found in the literature that the debate on service quality revolved mainly around two
competing perspectives, termed the Nordic school (Scandinavian or European) and the
American school. The Nordic school defined service quality using overall categorical terms
and included the aspects of technical- and functional quality. The American school on the
other hand, used descriptive terms and included inter alia the five dimensions of reliability,
responsiveness, assurance, empathy and tangibles in their definition.
In this chapter, it was also revealed that Grönroos (1984; 1988) was amongst the first
scholars that called for conceptual models of service quality in order to understand the
concept better. It was found that during the past approximately 15 years, at least 30 industry-
specific scales and models of service quality have been published in the literature on service
quality. A summary of 13 of the most important of these models are presented in Table 7.1.

224
Table 7.1: Summary of service quality models
Model Key findings Limitations/suitability for this study 1. Technical and
functional quality model of Grönroos.
Service quality depends on technical quality, functional quality and corporate image of the organisation in consideration. Functional quality is regarded as more important than technical quality.
The model was not considered for this study because it does not offer an explanation on how to measure functional and technical quality.
2. SERVQUAL model of Parasuraman et al.
The model is an analytical tool. It enables management to systematically identify service quality gaps between a number of variables affecting the quality of the offering. The model is externally focused. It can assists management in identifying the relevant service quality factors from the viewpoint of the consumer.
The model was not considered for this study because, to measure expectations as well as perceptions, would have made the questionnaire relatively complicated and time-consuming.
3. SERVPERF model of Cronin and Taylor.
Uses only the perceptions part of the SERVQUAL scale. Measures service quality experiences only and not customer expectations as well. It directly reduces the number of items by 50 %.
The model was considered for this study because it was found that the five dimensions suited the landlord-small business tenant relationship in shopping centres. By measuring only the perceptions, made the questionnaire less complicated and more economical to administer.
4. Attribute service quality model of Haywood-Farmer.
This model provides a base of segregating service organisations on three dimensions for better management of quality. These dimensions are physical facilities, people’s behaviour elements and professional judgement. The model enhances understanding of the concept of service quality.
The model was not considered for this study because it did not offer an instrument for measuring service quality. It did not offer a practical procedure capable of helping management to identify service quality problems or practical means of improving service quality.
Table 7.1 continues on the next page.

225
Table 7.1: Continued
Model Key findings Limitations/suitability for this study 5. The dynamic process
model of Boulding et al.
This model attempt to provide insights into the process by which customers form judgements of service quality and the way these judgements affect subsequent behaviour. Customers’ perceptions and expectations change over time, and the model claim to test the relationships between expectations, perceptions and intended behaviour.
The model was not considered for this study because it did not offer an instrument for measuring service quality. The model merely has enhanced understanding of service quality and behavioural intentions of customers.
6. The three-component model of Rust and Oliver.
The three components of this model are the service product, the service delivery and the service environment.
The model was not considered for this study because it did not offer an instrument for measuring service quality.
7. The return-on-quality approach of Rust et al.
The model advocates that the dimensions of measuring service quality should be related to the organisation’s business processes. The model concentrates on making the quality improvement efforts financially viable.
The model is based on customer retention or repurchases behaviour and did not offer a practical procedure to identify service quality problems and, was therefore not considered for this study.
8. The P-C-P attribute model of Philip and Hazlett.
Provides a simple, effective and general framework of assessing service quality for any service sector. The model highlights the area of improvements for service quality depending on the frequency of the encounter. The dimensions to these three levels of attributes are individual sector-dependent and with reference to the consumer.
The model did not provide general dimensions to the three levels of attributes. It also lacked empirical validation and, was therefore not considered for this study.
Table 7.1 continues on the next page.

226
Table 7.1: Continued
Model Key findings Limitations/suitability for this study 9. The antecedents
model of Dabholkar et al.
Service quality is better visualised by its antecedents rather than its components. This model can provide a complete understanding of service quality and how these evaluations are formed. Customer satisfaction should be evaluated separately from service quality when trying to determine customer evaluations of service.
The model measured behavioural intentions rather than actual behaviour and was not considered for this study.
10. The hierarchical approach of Brady and Cronin.
Service quality is a multidimensional, hierarchical construct. Perceptions are based on evaluations of three primary dimension, outcome, interaction and environmental quality, which have each three sub-dimensions. The three sub-dimensions will first be evaluated and will influence evaluation of the primary dimensions that will lead to an overall service quality perception.
The model was not considered for this study because it did not offer an instrument for measuring service quality and, few efforts have been made to provide empirical evidence for this hierarchical structure.
11. Grönroos’s model as adapted by Kang and James.
Technical, functional and image should be measured to fully capture overall perceptions of service quality. Grönroos’s model is empirically tested and the five-factor structure of SERVQUAL is confirmed. Other than most other models, it is believed that technical quality can be assessed by customers.
The model was not considered for this study because the technical quality- and image dimensions did not play a big role in the landlord-small business tenant relationship.
12. Kang’s hierarchical structure of service quality.
The five-factor structure as proposed by SERVQUAL is confirmed and represents the functional quality dimension of perceived service quality. This model provides empirical evidence for the claim that perceived service quality is based on technical quality and functional quality components.
Few efforts have been made to provide empirical evidence for this hierarchical structure. It also did not offer an instrument for measuring service quality.
Table 7.1 continues on the next page.

227
Table 7.1: Continued
Model Key findings Limitations/suitability for this study 13. Carr’s FAIRSERV
model. The five SERVQUAL dimensions are accepted for measuring service quality, but equity (fairness) is added as an important dimension. It is felt that customers are concerned with getting what they deserve in relation to other customers of the same service. Their evaluation of the fairness of the service encounter will have an influence on their overall perception of service quality.
Since small business tenants in shopping centres often feel that they are treated unfairly in comparison with the bigger anchor tenants, especially in relation to leasing fees and location, it was considered to add a “fairness” dimension to SERVQUAL’s five dimensions.

228
The chapter was concluded by the decision that the SERVPERF instrument will be used to
measure the perceived service quality that small business tenants receive from their
landlords. From the extensive literature review, it was found that the five dimensions of
service quality proposed by this instrument (reliability, responsiveness, assurance, empathy
and tangibles) fitted in with the relationship between the landlord and small business tenants
in shopping centres. Since it was found in the literature that small business tenants in
shopping centres often feel that they are treated unfairly, it was decided that a dimension of
the FAIRSERV model will be included in this study’s model.
7.2.4 Small business tenants in shopping centres
This chapter started off with a critical review of literature about the importance of small
businesses for a country’s economy, and the importance of the correct location for small
businesses. Next, shopping centres as a good location for small businesses were discussed.
In this respect, it was found that the concept of enclosed shopping centres became popular
during the 1950s and early 1960s due to the decline of business within many Central
Business Districts. Several scholars like Beyard and O’Mara (in Kajalo & Lindblom, 2010)
and Goedken (2006), found that shopping centres have been the most successful retail
business concept for the last 50 years and, have become the most powerful and adaptable
machine for consumption that the world has ever seen. It was also revealed in the literature
that shopping centres play a major role in customers’ lifestyles where it became a
community centre for social and recreational activities.
The literature revealed that, during the past few years, the market for some shopping centres
in the USA has been declining. It has consequently been found that this should be all the
more reason for shopping centre landlords in South Africa to improve their efforts in
providing high quality services to their tenants.
Berman and Evans (2010), Goedken (2006), Levy and Weitz (2009) and Pitt and Musa
(2009) defined a shopping centre as “a group of retail and other commercial establishments

229
that is planned, developed, owned and managed as a single property, with on-site parking
provided”. Various types of shopping centres in South Africa were discussed, mainly from
the work of Berman and Evans (2010), Levy and Weitz (2009) and Prinsloo (2010). These
included small free standing and convenience centres with five to 25 stores, neighbourhood
centres with 25 to 50 stores, community centres with 50 to 100 stores, small regional
shopping centres with 75 to 150 stores, regional centres with 150 to 250 stores, and super
regional centres with more than 250 stores. Other centres that were identified were lifestyle
centres with 50 to 125 stores and value or strip centres with 20 to 40 stores.
Chapter 4 further reviewed literature on shopping centres as investments. The literature
cited, particularly from Pitt and Musa (2009), Muller (2008) and Singh et al. (2010), showed
that shopping centres are built by developers and sold to the institutional investment
community. It was found that a great deal of the estimated 1 300 shopping centres in South
Africa are owned by pension funds, life insurance companies, listed property groups and
private developers. The main focus of these owners was found to be the maximising of profit
for their investors. In order to do this and, to ensure the success of the shopping centre, the
literature revealed the importance of managing the shopping centres effectively.
In this chapter the marketing and financial success of a shopping centre was found to be
dependent on several factors, of which the importance of the right tenant mix was
recognised to be the most critical factor. Greenspan (1997) defined tenant mix as “having a
variety of stores that work well together to enhance the performance of the entire centre as
well as performing successfully as individual businesses. Work by El-Adly (2007) and
Ibrahim and Galven (2007) indicated that the most important element of survival for
shopping centres lies with its tenants. In the literature reviewed, these tenants in shopping
centres were divided into two types, namely traffic attractors and traffic users. A traffic
attractor was identified as the tenant that draws the human traffic to the shopping centre and
controls the customer movement patterns within the centre. These tenants are called anchor
stores. The traffic users were typically found to be the stores that depended on the visitors
drawn by the anchor stores. Small business tenants in shopping centres are typically traffic
users. It was also found in the literature that landlords are well aware of the fact that the

230
realisation of a maximum return on their investment requires the presence of these anchor
tenants. This was found to be one of the reasons why anchor tenants are able to enjoy rents
per square metre that are far less than the rents of the smaller independent retailers.
The observations drawn from Damian et al. (2011), Carlson (1991), Ibrahim and Galven
(2007) as well as that of Jones (2007), revealed that the success of individual tenants, as
well as the success of the entire shopping centre, are interdependent and are enhanced by
the cumulative synergy generated by the tenant mix. With regard to the landlord-tenant
relationship in shopping centres, a review of the work of Roberts and Merrillees (2003),
Whyatt (2008) as well as Yu and Ramanathan (2008) revealed that shopping centres include
a complex network of internal and external relationships that can impact on the operations
and working environment of the centre. The most important and most critical of these
relationships were found to be the one between landlords and the tenants. In this regard,
Howard (1997) suggested that a partnership approach among all the tenants and shopping
centre management is the key for the success of the centre, as collaboration in the
relationships provides mutual benefits and synergies.
It was found in the literature that it is of particular importance for landlords to ensure that
their tenants stay with them, as the costs of attracting new tenants are much higher than the
costs of keeping the present tenants. It therefore became clear that landlords in shopping
centres will have to be proactive in the area of service quality. The work of Gray (1992)
indicated that the measuring of service quality can help landlords to identify the areas that
can provide them with a competitive edge and, those areas that need to be improved upon.
Chapter 4 further reviewed literature on the landlord-tenant contract of lease and set out the
terms and conditions of such a contract. Crosby et al. (2006) pointed out that the lease terms
can inhibit or facilitate certain aspects of the day-to-day operation and substantially affect
cash flow for the tenant’s business. Jacobsberg (2009) found that it is significantly important
for small business tenants to employ an appropriate professional to help them through the
process of negotiating a lease.

231
The definition and classification of small businesses in terms of the National Small Business
Amendment Act, Act 26 of 2003, were also given in this chapter. Lastly, the role of small
businesses in shopping centres was reviewed and it was found that shopping centres with a
high volume of pedestrian traffic are seen as good locations for their businesses. The
literature also reviewed that, although landlords realise the importance of accommodating
small independent businesses in their centres, small independent businesses are still at a
competitive disadvantage regarding several issues. Chapter 4 concluded with literature that
revealed that small businesses often fail due to a deficiency in areas such as business
knowledge, money, customer service, merchandising and marketing.
7.2.5 Research design and methodology
This chapter discussed the research design and methodology adopted in this study. The
chapter examined the research methods, population, sample, as well as the data collection
and data analysis techniques used in the study.
Data were collected from the sample by the researcher, with the help of two field workers.
An official introductory letter and consent form were obtained from the University of Pretoria
to assure respondents that the collected data were purely for academic purposes and that
their responses will be treated as strictly confidential. The data were coded and entered into
the Microsoft Excel programme. This helped to edit and screen the data before it was
imported into the BMDP statistical programme that analysed the data by means of
descriptive and inferential statistical techniques deemed appropriate for the research
questions and hypotheses of the study.
7.2.6 Research findings
This chapter presented and discussed the findings obtained from an analysis of the data.
The chapter described the sample from which the data was collected. The sample consisted
of small business tenants in shopping centres in Pretoria, South Africa. The majority of these

232
small business tenants were from the retail goods sector and most of the respondents were
managers of the businesses. The business demographics and the personal demographics of
the respondents were presented and discussed. The results on the perceived service quality
that respondents received from landlords were presented with each variable’s mean score
and standard deviation. It was found that the statement that rated the highest on mean score
was from SERVPERF’s tangible dimension namely, “There is sufficient parking at the centre”
(mean score of 3,5820). The statement that rated the lowest on mean score was from the
fairness dimension of FAIRSERV namely “In general, small tenants are treated the same as
bigger tenants” (mean score of 2,1969).
The chapter further presented factor analysis in order to confirm the validity and reliability of
the measuring instrument, and two distinct factors were identified namely, intangibles as well
as marketing and tangibles. The mean scores of these factors were found to be 2,8812 and
2,9903 respectively and is an indication that the respondents were in general dissatisfied
with the overall perceived service quality that they received from the landlords.
The chapter also presented and discussed the findings in response to the research
objectives, research questions and hypotheses of the study.
7.3 RESEARCH OBJECTIVES REVISITED
The need to conduct this study arose as small business tenants in shopping centres felt that
they were prejudiced by landlords that favour bigger, well-known retailers, mainly for
economic reasons. As a result, the perception was that the service quality that they received
from their landlords left a lot to be desired. The purpose of the study was therefore to
measure the perceived service quality that small business tenants in shopping centres
received from their landlords. The realisation of this purpose has been guided by a primary
objective and six secondary objectives.

233
The primary and secondary objectives of the study are revisited and presented.
7.3.1 Primary objective revisited
The primary objective of the study was to measure the perceived service quality that small
business tenants in shopping centres receive from their landlords.
The primary objective of the research was achieved, as the perceived service quality that
small business tenants in shopping centres receive from their landlords was measured by
the use of the combined SERVPERF and FAIRSERV model. Factor analysis was done on
variables from the questionnaire used in this study and the two factors that were identified
were: Factor 1, intangibles and Factor 2, marketing and intangibles.
Table 7.2: Perceived service quality of landlords’ service to small business tenants
FACTOR FINDINGS
Factor 1: Intangibles
The mean score for this factor was 2,881 (standard deviation 0,634), indicating that respondents were in general more dissatisfied than satisfied with the intangible factor of service quality that they receive from landlords.
Factor 2: Marketing and tangibles
With respect to the marketing and tangible aspect, the mean score was 2,990 (standard deviation 0,784), indicating that more respondents were dissatisfied than satisfied with the marketing and tangibles aspect of service quality that they receive from landlords.
Table 7.2 illustrates that more respondents were in general dissatisfied than satisfied with
the overall perceived service quality that they received from their landlords. They were more
dissatisfied though, with the intangible aspect of service quality that they receive from
landlords.
234
7.3.2 Secondary objectives revisited
The secondary objectives of the study were to:
• Determine whether the combined SERVPERF and FAIRSERV model of service quality,
in its original form, will be suitable to measure the perceived service quality that small
business tenants in shopping centres receive from their landlords.
• Determine whether the are statistical significant differences regarding the perceived
service quality that small business tenants receive from landlords, with regards to the
position of the respondent within the business.
• Determine whether there are significant differences regarding the perceived service
quality between small business tenants who have been in the centre for a short time and
those who have been in the centre for long.
• Determine whether there are significant differences regarding the perceived service
quality between small business tenants who have been a tenant in other shopping
centres before and, those who have never been a tenant in another shopping centre.
• Determine whether there are significant differences regarding the perceived service
quality between small business tenants who had no business experience prior to leasing
in the shopping centre and those who had business experience.
• Determine whether there are significant differences regarding the perception of
service quality received by small business tenants from landlords of different types of
shopping centres in Pretoria.
The first secondary objective was met as follows:
The questions of the questionnaire were set according to the SERVPERF and FAIRSERV
service quality models. Factor analyses were used to discover the underlying constructs that
explain the variance and, it was found that only two distinct dimensions of service quality

235
were identified, namely intangibles, and marketing and tangibles. This was found to be
contrary to what was suggested by the SERVPERF and FAIRSERV service quality models.
The models suggested six service quality dimensions namely, reliability, responsiveness,
assurance, empathy, tangibles and fairness. Although elements of these dimensions were
retained in the two factors, it was clear that small business tenants in shopping centres only
rated the perceived service quality received from the landlord according to the intangibles
and the marketing and tangibles dimensions. The conclusion was therefore made that the
combined SERVPERF and FAIRSERV service quality models, in its original form, were not
suitable to measure the perceived service quality that small business tenants in shopping
centres receive from their landlords.
The other secondary objectives were met as follows:
ANOVA was conducted in order to establish whether relationships exist between the factors
and the independent variables. The results are depicted in Table 7.3 on the next page.
Table 7.3 is presented on the next page.

236
Table 7.3: Relationships in terms of respective independent variables
FACTOR Independent variable FINDINGS Intangibles Respondents’ position in the
business. With a ρ-value of 0,2951, it is clear that no statistical significant difference was found between the respondents’ position in the business and this aspect of perceived service quality (Table 6.10).
Period as tenant in the centre. It was found that there were no statistical significant differences between the period of time that the small business tenants were at a particular shopping centre and this aspect of perceived service quality (ρ-value: 0,3462).
Tenant in other shopping centres before.
There were statistical significant differences regarding the perception of service quality between small business tenants regarding to whether they have been a tenant in other shopping centres before.
Business experience prior to leasing in centre
There were statistical significant differences regarding the perception of service quality between small business tenants who had no or little business experience prior to leasing in the shopping centre and those who had business experience.
Types of shopping centres. There were statistical significant differences regarding the perceived service quality that small business tenants receive from landlords, with regards to the type of shopping centre they were leasing from.
Marketing and tangibles
Respondents’ position in the business.
It was found that there were no statistical significant differences between the period of time that the small business tenants were at a particular shopping centre and this aspect of perceived service quality (ρ-value: 0,3462).
Period as tenant in the centre. There were statistical significant differences regarding the perception of service quality between small business tenants who have been a tenant in the centre for a short time and those who have been a tenant for long.
Table 7.3 continues on the next page.

237
Table 7.3: Continued
FACTOR Independent variable FINDINGS Marketing and tangibles
Tenant in other shopping centres before.
There were statistical significant differences regarding the perception of service quality between small business tenants regarding to whether they have been a tenant in other shopping centres before.
Business experience prior to leasing in centre
The respondents’ perceptions of the marketing and tangible aspects of service quality were not influenced by their previous business experience.
Types of shopping centres. There were statistical significant differences regarding the perceived service quality that small business tenants receive from landlords, with regards to the type of shopping centre they were leasing from.
7.4 RESEARCH QUESTIONS REVISITED
A summary of the findings in response to the research questions of the study is presented in
Table 7.4.
Table 7.4: A summary of the findings in response to the research questions
Research Questions
Findings
Research question one: Are small business tenants in shopping centres generally satisfied with the quality of service they receive from landlords?
With mean scores of 2,881 (standard deviation 0,634) for the intangibles aspect and 2,990 (standard deviation 0,784) for the marketing and tangibles aspect of service quality, it can be concluded that the respondents were in general not satisfied with the service quality that small business tenants in shopping centres receive from their landlords
Table 7.4 continues on the next page.
238
Table 7.4: Continued
Research Questions
Findings
Research question two: Is the combined SERVPERF and FAIRSERV service quality model, in its original form, suitable for measuring the perceived service quality that small business tenants in shopping centres receive from their landlords?
Although several of the elements of the five SERVPERF dimensions were found to be relevant, the factor analysis showed that these elements are divided into only two distinct factors, namely intangibles and, marketing and tangibles. The five separate dimensions as suggested by the SERVPERF model, namely reliability, responsiveness, assurance, empathy and tangibles were found not to be relevant to the landlord-small business relationship in shopping centres. Most of the FAIRSERV elements that were added to the measuring instrument were retained after the factor analysis, but it was not identified as a separate dimension of perceived service quality. It was therefore found that the combined SERVPERF and FAIRSERV model, in its original form, is not suitable for measuring the perceived service quality that small business tenants in shopping centres receive from their landlords.
Research question three: Are there any significant differences regarding the perceived service quality provided by landlords to small business tenants depending on their position in the business?
There were no significant differences regarding the perceived service quality that small business tenants receive from landlords, with regards to the position of the respondents in the business. This was the case for both the intangibles construct, and the marketing and tangibles construct of service quality. These findings show that it made no difference whether the respondents were the owners, managers, owners and managers or any other full-time employees of the business when it came to their perception of service quality received from the landlords.
Research question four: Are there any significant differences regarding the perception of service quality received by small business tenants who have been a tenant in the centre for a short time and those who have been a tenant for long?
With respect to the service quality construct intangibles, there were no statistical significant differences regarding the perception of service quality between small business tenants who have been a tenant in the centre for a short period of time and those who have been a tenant for long. This was however, not the case with the service quality construct marketing and tangibles, where a statistical difference was found for this variable. The respondents’ perceptions of the intangibles aspects of service quality were therefore not influenced by how long they have been tenants in the shopping centre. Their perceptions of the marketing and tangible aspects of service quality were on the other hand, influenced by the length of their tenancy.
Table 7.4 continues on the next page.
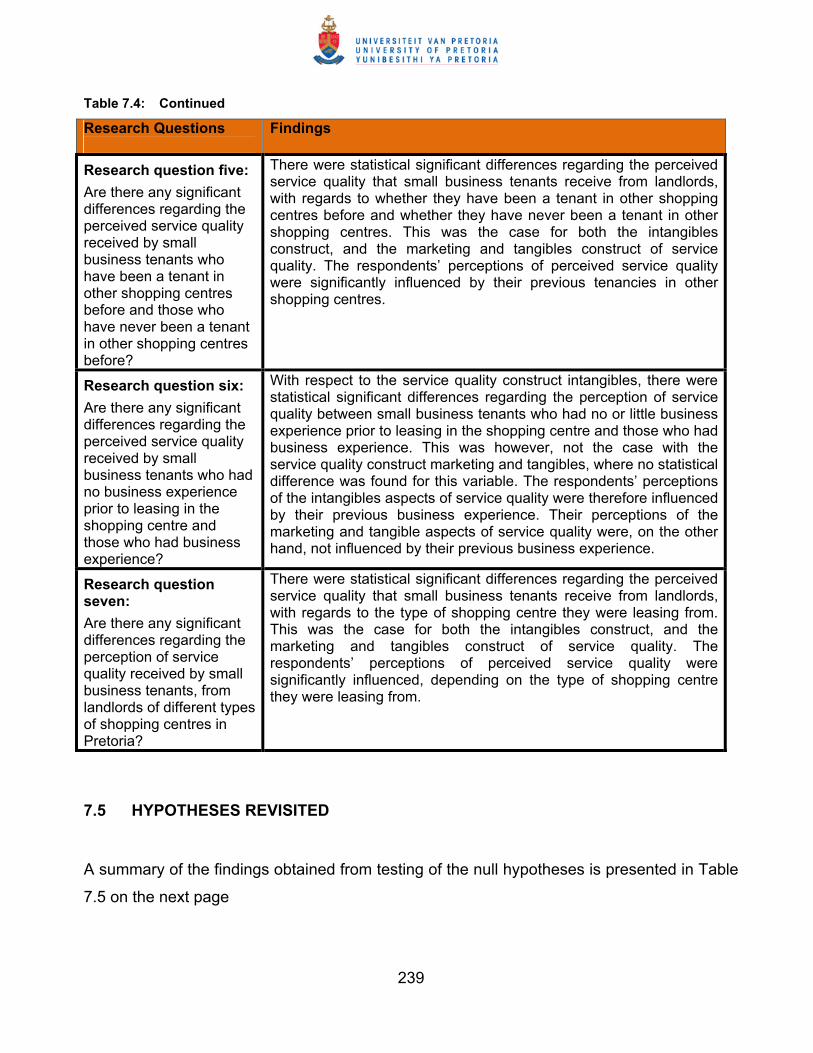
239
Table 7.4: Continued
Research Questions
Findings
Research question five: Are there any significant differences regarding the perceived service quality received by small business tenants who have been a tenant in other shopping centres before and those who have never been a tenant in other shopping centres before?
There were statistical significant differences regarding the perceived service quality that small business tenants receive from landlords, with regards to whether they have been a tenant in other shopping centres before and whether they have never been a tenant in other shopping centres. This was the case for both the intangibles construct, and the marketing and tangibles construct of service quality. The respondents’ perceptions of perceived service quality were significantly influenced by their previous tenancies in other shopping centres.
Research question six: Are there any significant differences regarding the perceived service quality received by small business tenants who had no business experience prior to leasing in the shopping centre and those who had business experience?
With respect to the service quality construct intangibles, there were statistical significant differences regarding the perception of service quality between small business tenants who had no or little business experience prior to leasing in the shopping centre and those who had business experience. This was however, not the case with the service quality construct marketing and tangibles, where no statistical difference was found for this variable. The respondents’ perceptions of the intangibles aspects of service quality were therefore influenced by their previous business experience. Their perceptions of the marketing and tangible aspects of service quality were, on the other hand, not influenced by their previous business experience.
Research question seven: Are there any significant differences regarding the perception of service quality received by small business tenants, from landlords of different types of shopping centres in Pretoria?
There were statistical significant differences regarding the perceived service quality that small business tenants receive from landlords, with regards to the type of shopping centre they were leasing from. This was the case for both the intangibles construct, and the marketing and tangibles construct of service quality. The respondents’ perceptions of perceived service quality were significantly influenced, depending on the type of shopping centre they were leasing from.
7.5 HYPOTHESES REVISITED
A summary of the findings obtained from testing of the null hypotheses is presented in Table
7.5 on the next page
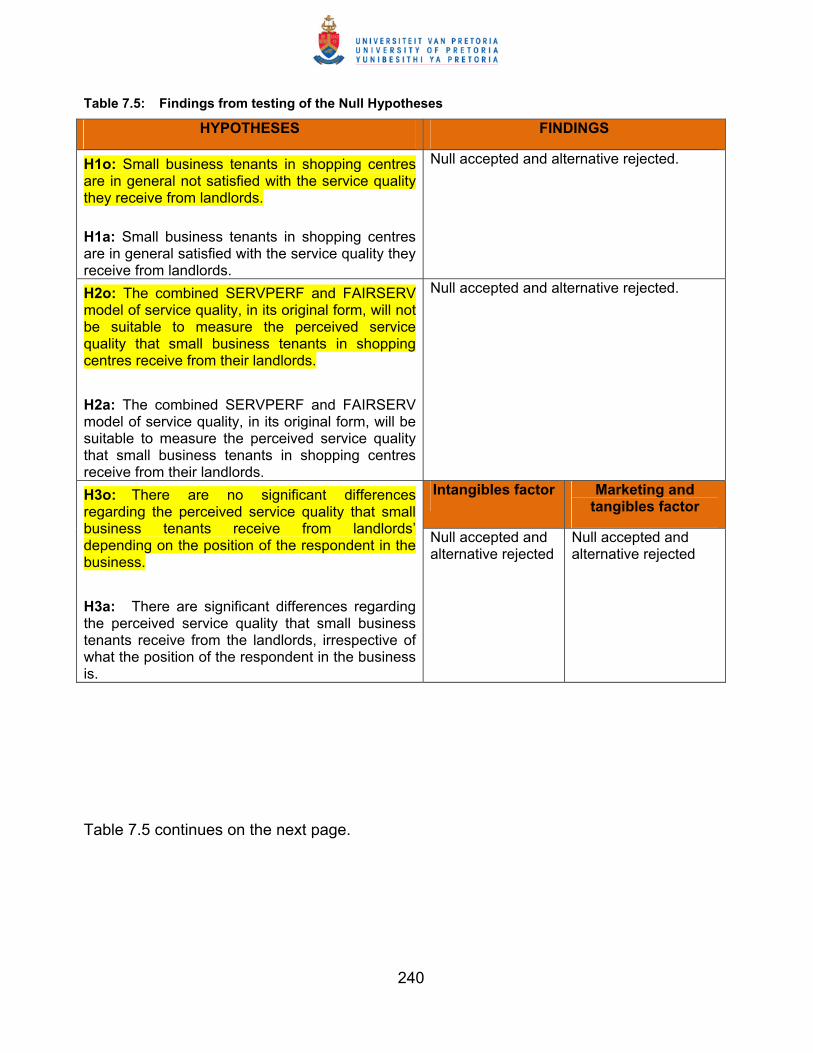
240
Table 7.5: Findings from testing of the Null Hypotheses
HYPOTHESES FINDINGS
H1o: Small business tenants in shopping centres are in general not satisfied with the service quality they receive from landlords. H1a: Small business tenants in shopping centres are in general satisfied with the service quality they receive from landlords.
Null accepted and alternative rejected.
H2o: The combined SERVPERF and FAIRSERV model of service quality, in its original form, will not be suitable to measure the perceived service quality that small business tenants in shopping centres receive from their landlords. H2a: The combined SERVPERF and FAIRSERV model of service quality, in its original form, will be suitable to measure the perceived service quality that small business tenants in shopping centres receive from their landlords.
Null accepted and alternative rejected.
Intangibles factor Marketing and tangibles factor
H3o: There are no significant differences regarding the perceived service quality that small business tenants receive from landlords’ depending on the position of the respondent in the business. H3a: There are significant differences regarding the perceived service quality that small business tenants receive from the landlords, irrespective of what the position of the respondent in the business is.
Null accepted and alternative rejected
Null accepted and alternative rejected
Table 7.5 continues on the next page.

241
Table 7.5: Continued
FINDINGS HYPOTHESES
Intangibles factor Marketing and tangibles factor
H4o: There are no significant differences regarding the perception of service quality between small business tenants who have been a tenant in the centre for a short period of time and those who have been a tenant for a longer period of time. H4a: There are significant differences regarding the perception of service quality between small business tenants who have been a tenant in the centre for a short period of time and those who have been in the centre for a longer period of time.
Null accepted and alternative rejected
Null rejected and alternative accepted
H5o: There are no significant differences regarding the perceived service quality between small business tenants who have been a tenant in other shopping centres before and those who have never been a tenant in other shopping centres. H5a: There are significant differences regarding the perceived service quality between small business tenants who have been a tenant in other shopping centres before and those who have never been a tenant in other shopping centres .
Null rejected and alternative accepted
Null rejected and alternative accepted
Intangibles factor Marketing and tangibles factor
H6o: There are no significant differences regarding the perceived service quality between small business tenants who had no or little business experience prior to leasing in the shopping centre and those who had business experience.
H6a: There are significant differences regarding the perceived service quality between small business tenants who had no or little business experience prior to leasing in the shopping centre and those who had business experience.
Null rejected and alternative accepted
Null accepted and alternative rejected
Table 7.5 continues on the next page.

242
Table 7.5: Continued
FINDINGS HYPOTHESES
Intangibles factor Marketing and tangibles factor
H7o: There are no significant differences regarding the perception of service quality that small business tenants receive from landlords/centre management of different types of shopping centres in Pretoria. H7a: There are significant differences regarding the perception of service quality that small business tenants receive from landlords/centre management of different types of shopping centres in Pretoria.
Null rejected and alternative accepted
Null rejected and alternative accepted
7.4 CONTRIBUTION/NEW KNOWLEDGE GENERATED BY THE STUDY
This study has comprehensively revealed and documented the nature of the perceived
service quality that small business tenants in shopping centres in Pretoria, South Africa
receive from their landlords. This study was the first of its kind in South Africa. There are
several instruments available to measure perceived service quality, but none of them had
been used previously in determining the unique relationship between small business tenants
in shopping centres and their landlords. The major contribution of the study is a validation of
the SERVPERF dimensions in a landlord-small business tenant relationship. This study
proves that these five dimensions of SERVPERF and the one dimension of FAIRSERV
cannot be applied directly to the landlord-small business tenant relationship in shopping
centres and will need to be adjusted and adapted to add more service quality dimensions,
especially on the tangible items.
Further contributions to the science are as follows:
• The latest theory on perceived service quality and small business tenants in shopping
centres has been organised, captured and documented. This can assist in the increase
243
of the body of knowledge on service quality and the relationship between landlords and
small business tenants in shopping centres.
• No research has been done on the perceived service quality that small business
tenants in shopping centres receive from their landlords. The results of this study can
be used by landlords in an effort to improve their service quality as well as their image
to small business tenants.
• The findings can assist small businesses to assess a specific shopping centre’s
landlord before deciding to lease from that landlord. A more informed decision can
therefore be taken.
7.5 LIMITATIONS OF THE STUDY
This study is only a starting point for the measuring of service quality in a landlord-small
business tenant relationship in shopping centres. It is thus not suggested that the concepts,
findings, conclusions and recommendations as discussed in the study are definitive. It
should be kept in mind that this research study could be incomplete and may have
deficiencies. Given the exploratory nature of the research, the reader should be aware of the
following limitations of the study, namely:
• The sample frame that was used in the study was from shopping centres in one city
only, namely Pretoria, South Africa. It is thus important to be aware that any references
made in this study regarding any part of the universe should not be read to be
representing the population, but rather seen in context of the sample frame that was
used.
• This research study is confined to the landlords’ provisioning of service quality to small
business tenants in shopping centres. It may not be possible to generalise into other
industries, though with continued research similar constructs could materialise.
Parasuraman, et al. (1988:23) emphasised this when considering the SERVQUAL
model, as there are idiosyncrasies in every industry and not all dimensions of the model
may be relevant in all industries.
244
• Although the researcher might have assured the participants of the anonymity of their
responses, participants might still have been cautious in the amount of information that
they have divulged. Small business tenants especially, might not have shared
information freely because they might have felt that their responses could have been
held against them by landlords.
7.6 RECOMMENDATIONS FOR FURTHER RESEARCH
Collecting data on the perceived service quality that small business tenants in shopping
centres receive from their landlords has a very clear importance and further research in
service quality in this relationship is still required. It is clear that the landlord-small business
tenant relationship in shopping centres is a unique one. This is not a normal “business-
customer” relationship as the small business tenants and the landlord are interdependent.
They need one another for their survival. This study has contributed results and research
approaches that could stimulate further research on this important issue.
The following opportunities for further research were identified during the course of this
research study, namely:
• A study to determine specific service quality dimensions that would be pertinent for a
landlord-small business tenant relationship in shopping centres.
• A study to develop a specific model for measuring perceived service quality that small
business tenants in shopping centres receive from landlords.
• A comparative study between small business tenants and bigger anchor tenants in
shopping centres with regard to the perceived service quality they receive from their
landlords.
• A comparative study between the perceived service quality that small business tenants
in shopping centres in other cities and other provinces of South Africa receive from their
landlords.

245
7.7 CONCLUSION
The literature review of this study introduced various important elements within the field of
perceived service quality and, specifically in the context of service quality measurement
models. The literature review also introduced shopping centres as important business
locations for small businesses and the unique relationship between them and the landlords.
During this chapter the major aspects of service quality and small businesses in shopping
centres were highlighted and the objectives that showed that the objectives of the study
were met were revisited. Furthermore, the research questions and hypotheses were
revisited, summarised and indicated whether they were rejected or accepted.
The findings from the empirical part of this study have helped to highlight the important
aspects of service quality that is considered as important by small business tenants as well
as their level of satisfaction with these aspects. This study has shown that small business
tenants in shopping centres are in general not satisfied with the perceived service quality
that they received from landlords. This study has further shown that the combined
SERVPERF and FAIRSERV models of service quality, in its original form, are not suitable to
measure the perceived service quality that small business tenants in shopping centres have
received from their landlords. An important finding is the fact that only two distinct
dimensions of perceived service quality were found to be pertinent in this relationship. The
study has shown that small business tenants in shopping centres are concerned about the
intangible, softer issues, and the marketing and tangibles issues of service quality received
from the landlords. Small business tenants in shopping centres basically want to be treated
with respect and courtesy by the landlord and, they want the landlord to assure them of
continued and sufficient foot traffic to the centre as well as to their stores.
Hopefully the findings of the study will serve as a motivation and a guideline for landlords of
shopping centres to assess their quality of service that they provide to their small business
tenants and that they will get insight in the aspects of service quality that is most important
for small business tenants.

246
8. REFERENCES
Abdullah, F., Suhaimi, R., Saban, G. & Hamali, J. 2011. Bank service quality (BSQ) index:
an indicator of service performance. International Journal of Quality and Reliability
Management, 28(5):542-555.
Agus, A., Barker, S. & Kandampully, J. 2007. An exploratory study of service quality in the
Malaysian public service sector. International Journal of Quality and Reliability Management,
24(2):177-190.
Akehurst, G. 2008. What do we really know about services? Service Business, 2(1):1-15.
Akhter, S.H. 2010. Service attributes satisfaction and actual repurchase behaviour: the
mediating influence of overall satisfaction and purchase intention. Journal of Customer
Satisfaction, Dissatisfaction and Complaining Behavior, 23:52-64.
Aksoy, L., Cooil, B., Groening, C., Keiningham, T.L. & Yalçin, A. 2008. The long-term stock
market valuation of customer satisfaction. Journal of Marketing, 72(4):105-122.
Al-Hawari, M. & Ward, T. 2006. The effect of automated service quality on Australian banks’
financial performance and the mediating role of customer satisfaction. Marketing Intelligence
and Planning, 24(2):127-147.
Alter, S. 1999. Helping small tenants merchandise. Journal of Property Management,
64(3):61-65.
Alter, S. 2008. Managing properties in a fast-paced world: how to make communication &
customer service a priority. Journal of Property Management, 73(6):30-34.

247
An, M. & Noh, Y. 2009. Airline customer satisfaction and loyalty: impact of in-flight service
quality. Service Business, 3(3):293-307.
Anandanatarajan, K., Sritharan, R. & Kumar, C.R. 2006. Customer loyalty in service
industry: an overview. In: Balakrishnan, V. & Rajakumar, C.S. (eds.) Innovations in
marketing management. New Delhi: Excel Books.
Andaleeb, S.S. & Conway, C. 2006. Customer satisfaction in the restaurant industry: an
examination of the transaction-specific model. Journal of Services Marketing, 20(1):3-11.
Anderson, R.E. & Swaminathan, S. 2011. Customer satisfaction and loyalty in e-markets: a
PLS path modelling approach. Journal of Marketing Theory and Practice, 19(2):221-234.
Andronikidis, A. & Bellou, V. 2010. Verifying alternative measures of the service-quality
construct: consistencies and contradictions. Journal of Marketing Management, 26(5/6):570-
587.
Appel-Meulenbroek, R. 2008. Managing “keep” factors of office tenants to raise satisfaction
and loyalty. Property Management, 26(1):43-55.
Arasli, H., Ekiz, E.H. & Katircioglu, S.T. 2008. Gearing service quality into public and private
hospitals in small islands: empirical evidence from Cyprus. International Journal of Health
Care Quality Assurance, 21(1):8-23.
Araujo, L. & Spring, M. 2006. Services, products, and the institutional structure of production.
Industrial Marketing Management, 35(7):797-805.
Ashley, B. 2009. Strategies to keep owners & tenants afloat. Journal of Property
Management, 74(3):32-36.
Asubonteng, P., McCleary, K.J. & Swan, J.E. 1996. SERVQUAL revisited: a critical review of
service quality. The Journal of Services Marketing, 10(6):62-81.

248
Babakus, E. & Boller, W.G. 1992. An empirical assessment of the SERVQUAL scale.
Journal of Business Research, 24(3):253-268.
Babakus, E. & Mangold, G.W. 1989. “Adapting the SERVQUAL scale to hospital services:
An empirical investigation”. Hospital Services Research, (6):767-786.
Bahnan, N., Coleman, L.J. & Kelkar, M. 2007. A review of service quality: definitions and
measurement. Paper presented at the 14th Annual Meeting of the American Society of
Business and Behavioral Sciences, Las Vegas, NV.
Ballantyne, D. & Varey, R.J. 2008. The service-dominant logic and the future of marketing.
Journal of the Academy of Marketing Science, 36(1):11-14.
Bansal, H.S. & Taylor, S. 1997. Investigating the relationship between service quality,
satisfaction and switching intentions. In: Elizabeth, J.W. & Joseph, C.H. (eds.).
Developments in marketing science. Coral Gables, FL: Academy of Marketing Science.
Barrios, J. 2007. Rising rent hits small stores: Many move out, to be replaced by chains,
franchises. Arizona Daily Star, 21 January.
Bassi, F. & Guido, G. 2006. Measuring customer satisfaction: from product performance to
consumption experience. Journal of Customer Satisfaction, Dissatisfaction and Complaining
Behavior, 19:76-88.
Bateson, J.E.G. & Hoffman, K.D. 2011. Services marketing. 4th ed. Australia: South-Western
Cengage Learning.
Bauer, H.H., Falk, T. & Hammerschmidt, M. 2006. eTransQual: a transaction process-based
approach for capturing service quality in online shopping. Journal of Business Research,
59(7):866-875.
249
Baumann, C., Burton, S. Elliott, G. & Kehr, H.M. 2007. Prediction of attitude and behavioural
intentions in retail banking. International Journal of Bank Marketing, 25(2):102-116.
Beaven, M.H. & Scotti, D.J. 1990. Service-oriented thinking and its implications for the
marketing mix. The Journal of Services Marketing, 4(4):5-19.
Bei, L.T. & Chiao, Y.C. 2006. The determinants of customer loyalty: an analysis of intangible
factors in three service industries. International Journal of Commerce and Management,
16(3/4):162-177).
Berman, B. & Evans, J.R. 2010. Retail management: a strategic approach. 11th ed. Upper
Saddle River, NJ: Prentice Hall
Berry, L.L., Parasuraman, A. & Zeithaml, V.A. 1988. The service-quality puzzle. Business
Horizons, 35-43.
Bitner, M.J. 1990. Evaluating serviced encounters: the effect of physical surrounding and
employee responses. Journal of Marketing, 54(2):69-82.
Bitner, M.J. & Brown, S.W. 2008. The service imperative. Business Horizons, 51(1):39-46.
Bitner, M.J. Hubbert, A.R. 1994. Encounter satisfaction versus overall satisfaction versus
quality. In: Rust, R.T. & Oliver, R.L. (eds.) Service quality: new directions in theory and
practice. Thousand Oaks, CA: Sage.
Bjurklo, M., Edvardsson, B. & Gebauer, H. 2009. The role of competence in initiating the
transition from products to service. Managing Service Quality, 19(5):493-510.
Bodamer, D. 2010. What’s going on? Retail Traffic, July:6. [Online] Available from:
http://retailtrafficmag.com/management/what’s_going_on?/ [Accessed: 2011-10-16].
250
Bodamer, D. 2010. Refreshing takes. Retail Traffic, 1 September. [Online] Available from:
http://retailtrafficmag.com/management/edletter/retail_refreshing_takes/ [Accessed: 2011-
10-16].
Bodamer, D. 2011. The mall is not dead. Retail Traffic, 20 May. [Online] Available from:
http://retailtrafficmag.com/management/edletter/retail_mall_not_dead/ [Accessed: 2011-10-
16].
Bolton, R.N. & Drew, J.H. 1991. A multistage model of customers’ assessments of service
quality and value. Journal of Customer Research, 54(2):1-9.
Boothe, R. 1990. Who defines quality in service industries? Quality Progress, 23(2):65-67.
Boshoff, C. & Gray, B. 2004. The relationships between service quality, customer
satisfaction and buying intentions in the private hospital industry. South African Journal of
Business Management, 35(4):27-38.
Bougoure, U.S. & Neu, M.K. 2010. Service quality in the Malaysian fast food industry: an
examination using DINESERVE. Services Marketing Quarterly, 31(2):194-212.
Boulding, W., Kalra, A., Staelin, R. & Zeithaml, V.A. 1993. A dynamic process model of
service quality: from expectations to behavioural intentions. Journal of Marketing Research,
30(1):7-27.
Brady, M.K. & Cronin, J.J. 2001. Some new thoughts on conceptualising perceived service
quality: a hierarchical approach. Journal of Marketing, 65(3):34-49.
Brown, T.J., Churchill, G.A. Jr. & Peter, J.P. 1993. Research note: improving the
measurement of service quality. Journal of Retailing, 69(1):127-139.

251
Bryman, A. & Bell, E. 2007. Business research studies. 2nd ed. New York: Oxford University
Press.
Business Day. 2011. Liberty plans R1bn spend on malls. Business Day, 9 February. [Online]
Available from: http://www.businessday.co.za/Articles/Content.aspx?id=133766
[Accessed: 2011-10-20].
Business Day. 2011. Hyprop-Attfund Retail shopping centre portfolio. Business Day, 5 May.
[Online] Available from: http://www.businessday.co.za/Articles/Content.aspx?
id=141839 [Accessed: 2011-10-20].
Business Day. 2011. New listings: Rebosis Property Fund. Business Day, 19 May. [Online]
Available from: http://www.businessday.co.za/Articles/Content.aspx?id=143218
[Accessed: 2011-10-20].
Business Day. 2011. Listed property. Business Day, 16 June. [Online] Available from:
http://www.businessday.co.za/Articles/Content.aspx?id=146011
[Accessed: 2011-10-20].
Caniëls, M.C.J. & Romijn, H.A. 2005. What works, and why, in business services provision
for SME: insights from evolutionary theory. Managing Service Quality, 15(6):591-608.
Carlson, H.J. 1991. The role of the shopping centre in US retailing. International Journal of
Retail and Distribution Management, 19(6):13-20.
Carman, J.M. 1990. “Customer perceptions of service quality: An assessment of the
SERVQUAL dimensions”. Journal of Retailing, 66(1):33-55.
Carpenter, J. 2008. Demographics and patronage motives of supercenter shoppers in the
United States. International Journal of Retail and Distribution Management, 36(1):5-16.

252
Carr, C.L. 2007. The FAIRSERV model: customer reactions to services based on a
multidimensional evaluation of service fairness. Decision Sciences, 38(1):107-130.
Carrillat, F.A., Jaramillo, F. & Mulki, J.P. 2007. The validity of the SERVQUAL and
SERVPERF scales: a meta-analytic view of 17 years of research across five continents.
International Journal of Service Industry Management, 18(5):472-490.
Carrillat, F.A., Jaramillo, F. & Mulki, J.P. 2009. Examining the impact of service quality: a
meta-analysis of empirical evidence. Journal of Marketing Theory and Practice, 17(2):95-
110.
Carswell, A. 2008. Rent raises shut shops – exclusive. The Daily Telegraph (Sydney), 11
July.
Carter, C.C. 2009. What we know about shopping centers. Journal of Real Estate Literature,
17(2):165-180.
Central Intelligence Agency 2010. The World Factbook 2010. Washington DC. [Online]
Available from: https://www.cia.gov/library/publications/the-world-factbook [Accessed: 2011-
07- 28].
Chaniotakis, I.E. & Lymperopoulos, C. 2009. Service quality effect on satisfaction and word
of mouth in the health care industry. Managing Service Quality, 19(2):229-242.
Chase, R.B. & Apte, U.M. 2007. A history of research in service operations: what’s the big
idea? Journal of Operations Management, 25(2):375-386.
Chase, R., Jacobs, R. & Aquilano, N. 2006. Operations management for competitive
advantage. 11th ed. New York, NY: Irwin/McGraw-Hill.
253
Chatterjee, A., Ghosh, C. & Bandyopadhyay, S. 2009. Assessing students’ rating in higher
education: a SERVQUAL approach. Total Quality Management and Business Excellence,
20(10):1095-1109.
Chau, V.S. & Kao, Y.Y. 2009. Bridge over troubled water or long and winding road? Gap-5 in
airline service quality performance measures. Managing Service Quality, 19(1):106-134.
Chebat, J.C., Sirgy, M.J. & Grzeskowiak, S. 2009. How can shopping mall management best
capture mall image? Journal of Business Research, not known.
Chen, J.S., Tsou, H.T. & Huang, A.Y.H. 2009. Service delivery innovation. Journal of Service
Research, 12(1):36-55.
Churchill, G.A. Jr. & Surprenant, C. 1982. An investigation into the determinants of customer
satisfaction. Journal of Marketing Research, 19:491-504.
Cloete, C.E. & Skinner, J. 2002. History of shopping centres in South Africa. In: Cloete, C.E.
(ed.) Shopping centre management in South Africa. Sandton: South African Council of
Shopping Centres.
Cockram, A. 2002. Small retailers challenge shopping centre evictions. Estate Gazette, 22
June:43.
Cohen, M.A., Agrawal, N. & Agrawal, V. 2006. Winning in the aftermarket. Harvard Business
Review, 84(5):129-138.
Cohen-Charash, Y. & Spector, P.E. 2001. The role of justice in organizations: a meta-
analysis. Organizational Behavior and Human Decision Processes, 86:278-321.
Coldwell, D. & Herbst, F. 2004. Business Research. Cape Town: Juta.
254
Collier, J.E. & Bienstock, C.C. 2006. Measuring service quality in e-retailing. Journal of
Service Research, 8(3):260-275.
Cooper, D.R. & Schindler, P.S. 2006. Business research methods. 9th ed. New York,
NY:McGraw-Hill.
Cooper, D.R. & Schindler, P.S. 2008. Business research methods. 10th ed. New York,
NY:McGraw-Hill.
Corrêa, H.L., Ellram, L.M., Scavarda, A.J. & Cooper, M.C. 2007. An operations management
view of the services and goods offering mix. International Journal of Operations and
Production Management, 27(5):444-463.
Craig, B.R., Jackson III, W.E., & Thomson, J.B. 2007. Small firm finance credit rationing and
the impact of SBA-Guaranteed lending on local economic growth. Journal of Small Business
Management, 45(1):116-132.
Cristobal, E., Flaviān, C. & Guinalíu, M. 2007. Perceived e-service quality (PeSQ):
measurement validation and effects on customer satisfaction and web site loyalty. Managing
Service Quality, 17(3):317-340.
Cronin, J.J. & Taylor, S.A. 1992. Measuring service quality: a re-examination and extension.
Journal of Marketing, 56:55-68.
Crosby, P.B. 1979. Quality is free: the art of making quality certain. New York: New
American Library.
Crosby, N., Hughes, C. & Murdoch, S. 2006. Flexible property leasing and the small
business tenant. Journal of Property Research, 23(2):163-188.
255
Cunningham, L.F., Young, E.C. & Lee, M. 2004. Perceptions of airline service quality. Public
Works Management and Policy, 9(1):10-25.
Czepiel, P.A., Solomon, M.R., Surprenant, C.F. & Gutman, E.G. 1985. Service encounters:
an overview. In: Czepiel, P.A., Solomon, M.R. & Surprenant, C.F. (eds.) The service
encounter: managing employee/customer interaction in service business. Lexington, MA:
New York University Press.
Dabholkar, P.A. & Overby, J.W. 2005. Linking process and outcome to service quality and
customer satisfaction evaluations. International Journal of Service Industry Management,
16(1):10-27.
Dabholkar, P.A., Shepherd, C.D. & Thorpe, D.I. 2000. A comprehensive framework for
service quality: an investigation of critical conceptual and measurement issues through a
longitudinal study. Journal of Retailing, 76(2):139-173.
Dagger, T.S. & Sweeney, J.C. 2006. The effect of service evaluations on behavioural
intentions and quality of life. Journal of Service Research, 9(1):3-18.
Dagger, T.S., Sweeney, J.C. & Johnson, L.W. 2007. A hierarchical model of health service
quality. Journal of Service Research, 10(2):123-142.
Dale, B.G., Van der Wiele, A. & Van Iwaarden, J.D. 2009. TQM: an overview. In: Dale, B.G.,
Van Der Wiele, A. & Van Iwaarden, J.D. (eds.) Managing quality. 5th ed. Malden, MA:
Blackwell Publishing.
Damian, D.S., Curto, J.D. & Pinto, J.C. 2011. The impact of anchor stores on the
performance of shopping centres: the case of Sonae Sierra. International Journal of Retail
and Distribution Management, 39(6):456-475.
256
Dean, D.H. & Lang, J.M. 2008. Comparing three signals of service quality. Journal of Service
Marketing, 22(1):48-58.
Dean, D. & Lee, C. 1998. Winning applause: tenant satisfaction in property management.
Journal of Property Management, 63(2):42-45.
Department of Trade and Industry. 1995. White paper on the national strategy for the
development and promotion of small business in South Africa. Pretoria: Government Printer.
Desmet, S., Van Looy, B. & Van Dierdonck, R. 2003. The nature of services. In: Van Looy,
B., Van Dierdonck, R. & Gemmel, P. (eds). Service management: an integrated approach.
Harlow, UK: Financial Times Prentice-Hall.
Diamantopoulos, A. & Schlegelmilch, B.B. 2006. Taking the fear out of data analysis.
London: Thomson.
Dixon, M., Freeman, K. & Toman, N. 2010. Stop trying to delight your customers. Harvard
Business Review, 88(7/8):116-122.
Dornbusch, M.A. 1992. Management key to successful mall. Austin Business Journal,
12(41):9.
Dos Santos, R.P., De Oliveira, K.M. & Da Silva, W.P. 2009. Evaluating the service quality of
software providers appraised in CMM/CMMI. Software Quality Journal, 17(3):283-301.
Edvardsson, B. 1988. Service quality in customer relationships: a study of critical incidents in
mechanical engineering companies. Service Industries Journal, 54(3):427-445.

257
Edvardsson, B., Enquist, B. & Johnston, R. 2010. Design dimensions of experience rooms
for service test drives: case studies in several service contexts. Managing Service Quality,
20(4):312-327.
Edvardsson, B., Gustafsson, A. & Roos, I. 2005. Service portraits in service research: a
critical review. International Journal of Service Industry Management, 16(1):107-121.
Ehigie, B.O. 2006. Correlates of customer loyalty to their bank: a case study in Nigeria.
International Journal of Bank Marketing, 24(7):494-508.
Eiselen, R., Uys, T. & Potgieter, N. 2005. Analysing survey data using SPSS13. 3rd ed.
University of Johannesburg.
El-Adly, M.I. 2007. Shopping malls attractiveness: a segmentation approach. International
Journal of Retail and Distribution Management, 35(11):936-950.
Etgar, M. & Fuchs, G. 2009. Why and how service quality perceptions impact customer
responses. Managing Service Quality, 19(4):474-485.
Evans, J.R. & Lindsay, W.M. 2008. The management and control of quality. 7th ed. Masan,
OH: Thomson South-Western.
Fassnacht, M. & Koese, I. 2006. Quality of electronic services: conceptualizing and testing a
hierarchical model. Journal of Service Research, 9(1):19-37.
Feigenbaum, A.V. 1951. Quality control: principles, practice and administration. New York:
McGraw-Hill.
Fickes, M. 2002. Local talent. Shopping Center World, June:16-23.

258
Fisk, R.P., Grove, S.J. & John, J. 2008. Interactive services marketing. 3rd ed. Boston:
Houghton Mifflin Company.
Fitzsimmons, J.A. & Fitzsimmons, M.J. 2006. Service management: operations, strategy,
and information technology. 5th ed. London: Mc-Graw-Hill.
Foreman, C., Skinner, G.J. & Cloete, C.E. 2002. Typology and terminology. In: Cloete, C.E.
(ed.) Shopping centre management in South Africa. Sandton: The South African Council of
Shopping Centres.
Fornell, C., Mithas, S., Morgeson III, F.V. & Krishnan, M.S. 2006. Customer satisfaction and
stock prices: high returns, low risk. Journal of Marketing, 70(1):3-14.
Garvin, D.A. 1984. What does “product quality” really mean? Sloan Management Review,
26(1):25-43.
Gaster, L. & Squires, A. 2003. Providing quality in the public sector: a practical approach to
improving public services. Maidenhead, PA: Open University Press.
Gaur, S.S. & Agrawal, R. 2006. Service quality measurement in retail store context: a review
of advances made using SERVQUAL and RSQS. The Marketing Review, 6:317-330.
Gebauer, H., Krempl, R. & Fleisch, E. 2008. Service development in traditional product
manufacturing companies. European Journal of Innnovation, 11(2):219-240.
George, W.R. & Gibson, B.E. 1988. Blueprinting: a tool for managing quality in service.
Paper presented at the QUIS Symposium on service quality, University of Karlstad, Karlstad,
Sweden, August.
Ghobadian, A., Speller, S. & Jones, M. 1993. Service quality: concepts and models.
International Journal of Quality and Reliability Management, 11(9):43-66.

259
Gilmore, A. & McMullan, R. 2009. Scales in services marketing research: a critique and way
forward. European Journal of Marketing, 48(5/6):640-651.
Godlevskaja, O., Van Iwaarden, J. & Van Der Wiele, T. 2011. Moving from product-based to
service-based business strategies: services categorisation schemes for the automotive
industry. International Journal of Quality and Reliability Management, 28(1):62-94.
Goedken, A.K. 2006. The shopping center’s future. Buildings of the Decades, November:80-
82.
Goodman, J. 2006. Manage complaints to enhance loyalty. Quality Progress, 39(2):28-33.
Gounaris, S.P., Dimitriadis, S. & Stathakopoulos, V. 2010. An examination of the effects of
service quality and satisfaction on customers’ behavioral intentions in e-shopping. Journal of
Services Marketing, 24(2):142-156.
Gray, J. 1992. How satisfied are your tenants? Journal of Property Management, 57(6):48-
49.
Greenfield, H.I. 2002. A note on the goods/services dichotomy. Service Industries Journal,
22(4):19-21.
Greenspan, J. 1987. Solving the tenant mix puzzle in your shopping center. Journal of
Property Management, 53(4):27-31.
Grönroos, C. 1984. A service quality model and its marketing implications. European Journal
of Marketing, 18(4):36-44.
Grönroos, C. 1988. Service Quality: the six criteria of good perceived service quality. Review
of Business, 9(3):10-13.

260
Grönroos, C. 2006. Adopting a service logic for marketing. Marketing Theory, 6(3):317-333.
Gummesson, E. 1988. Service quality and product quality combined. Review of Business,
9(3):14-19.
Haber, H. 2009. Malls look toward smaller retailers. Women’s Wear Daily, 4 August. [Online]
Available from: http://0-web.ebscohost.com.innopac.up.ac.za/ehost/delivery?
vid=9&hid=108&sid=aff [Accessed: 2010-05-10].
Haley, L.M. & Grant, E.S. 2011. Third-party payer exchanges: the case for an enhanced
model of service quality for non-profit organizations. Journal of Marketing Theory and
Practice, 19(3):277-291.
Haque, A. & Rahman, S. 2009. Exploring customers’ shopping experience through shopping
center branding in Malaysia. Journal of Management Research, 9(3):167-181.
Hatten, T.S. 2003. Small business management: entrepreneurship and beyond. Boston, MA:
Houghton Mifflin Company.
Haywood-Farmer, J. 1988. A conceptual model of service quality. International Journal of
Operations & Production Management, 8(6):19-29.
Heizer, J. & Render, B. 2006. Operations management. 8th ed. Upper Saddle River, NJ:
Pearson Prentice-Hall.
Hollensen, S. 2010. Marketing management: a relationship approach. 2nd ed. Harlow,
England: Prentice Hall.
Holmes, M. 2006. Lack of knowledge hastens small business failures. Real Business, 18
October. [Online] Available from http://www.realbusiness.co.za/Article.aspx?article
ID=3821&typeID=9 [Accessed: 2009-01-17].

261
Homburg, C., Koschate, N. & Hoyer, W.D. 2006. The role of cognition and affect in the
formation of customer satisfaction: a dynamic perspective. Journal of Marketing, 70(3):21-
31.
Howard, E. 1997. The management of shopping centres: conflict or collaboration? The
International Review of Retail, Distribution and Customer Research, 7(3):263-285.
Howard, E. 2007. New shopping centres: is leisure the answer? International Journal of
Retail and Distribution Management, 35(8):661-672.
Hume, M. 2008. Understanding core and peripheral service quality in customer repurchase
of the performing arts. Managing Service Quality, 18(4):349-369.
Hurwitz, J., Bloor, R., Kaufman, M. & Halper, F. 2009. Service management for dummies.
Haboken, NJ: Wiley Publishing.
Ibrahim, M.F. & Galven, T.W.R. 2007. New age retail tenants: a new phenomenon. Journal
of Retail and Leisure Property, 6(3):239-262.
Ibrahim, E.E., Joseph, M. & Ibeh, K.I.N. 2006. Customers’ perception of electronic service
delivery in the UK retail banking sector. International Journal of Bank Marketing, 24(7):475-
493.
Ismail, H., Haron, H., Ibrahim, D.N. & Isa, S.M. 2006. Service quality, client satisfaction and
loyalty towards audit firms: perceptions of Malaysian public listed companies. Managerial
Auditing Journal, 21(7):738-756.
Ivanović, M.D. & Majstorović, V.D. 2006. Model developed for the assessment of quality
management level in manufacturing systems. The Total Quality Management Magazine,
18(4):410-423.

262
Jacobsberg, I. 2009. Is it a tenant’s market or a landlord’s (South Africa). [Online] Available
from http://www.hg.org/article.asp?id=6876 [Accessed: 2011-02-16].
Jain, S.K. & Gupta, G. 2004. Measuring service quality: SERVQUAL vs. SERVPERF scales.
Vikalpa: The Journal for Decision Makers, 29(2):25-37.
Jamali, D. 2007. A study of customer satisfaction in the context of a public private
partnership. International Journal of Quality and Reliability Management, 24(4):370-385.
Johnson, M.D. & Gustafsson, A. 2000. Improving customer satisfaction, loyalty and profit: an
integrated measurement and management system. San Francisco: Jossy-Bass.
Johnstone, S., Dainty, A. & Wilkinson, A. 2009. Integrating products and services through
life: an aerospace experience. International Journal of Operations and Production
Management, 29(5):520-538.
Jones, R.O. 2007. An examination of tenant evolution within the UK factory outlet channel.
International Journal of Retail and Distribution Management, 35(1):38-53.
Juga, J., Juntunen, J. & Grant, D.B. 2010. Service quality and its relation to satisfaction and
loyalty in logistics outsourcing relationships. Managing Service Quality, 20(6):496-510.
Juran, J.M. 1988. Juran on planning for quality. New York: Free Press.
Juran, J.M., Gryna, F.J.R. & Bingham, R.S. 1974. Quality control handbook. New York:
McGraw-Hill.
Kajalo, S. & Lindblom, A. 2010. The perceived effectiveness of surveillance in reducing
crime at shopping centers in Finland. Property Management, 28(1):47-59.

263
Kang, G.D. 2006. The hierarchical structure of service quality: integration of technical and
functional quality. Managing Service Quality, 16(1):37-50.
Kang, G.D. & James, J.J. 2004. Service quality dimensions: an examination of Grönroos’s
service quality model. Managing Service Quality, 14(4):266-277.
Kang, G.D., James, J.J. & Alexandris, K. 2002. Measurement of internal service quality:
application of the SERVQUAL battery to internal service quality. Managing Service Quality,
12(5):278-291.
Kasper, H., Van Helsdingen, P. & Gabbott, M. 2006. Services marketing management: a
strategic perspective. 2nd ed. Chichester, England: John Wiley & Sons, Ltd.
Kassim, N.M. & Souiden, N. 2007. Customer retention measurement in the UAE banking
sector. Journal of Financial Services Marketing, 11(3):217-228.
Kaya, M. & Özer, Ö. 2009. Quality risk in outsourcing: noncontractible product quality and
private quality cost information. Naval Research Logistics, 56(7):669-685.
Kelkar, M. 2010. SERVDIV: a Vedic approach to measurement of service quality. Services
Marketing Quarterly, 31(4):420-433.
Kersten, W. & Koch, J. 2010. The effect of quality management on the service quality and
business success of logistics service providers. International Journal of Quality and
Reliability Management, 27(2):185-200.
Kinnard, W.N. & Messner, S.D. 1972. Obtaining competitive locations for small retailers in
shopping centers. Journal of Small Business Management, 10(1):21-26.
Kirkup, M. & Rafiq, M. 1994. Managing tenant mix in new shopping centres. International
Journal of Retail and Distribution Management, 22(6):29-38.

264
Klaus, P.G. 1985. Quality epiphenomenon: the conceptual understanding of quality in face-
to-face service encounters. In: Czepiel, J.A., Solomon, M.R. & Suprenant, C.F. (eds.) The
service encounter: managing employee/customer interaction in service business. Lexington,
MA: New York University Press.
Konishi, H. & Sandfort, M.T. 2003. Anchor stores. Journal of Urban Economics, 53:413-435.
Kotler, P. & Armstrong, G. 2010. Principles of Marketing. 13th ed. Upper Saddle River:
Pearson.
Kouthouris, C. & Alexandris, K. 2005. Can service quality predict customer satisfaction and
behavioural intentions in the sport tourism industry? An application of the SERVQUAL model
in an outdoors setting. Journal of Sport Tourism, 10(2):101-111.
Kueh, K. 2006. Service satisfiers and dissatisfiers among Malaysian customers. Australasian
Marketing Journal, 14(1):79-92.
Kueh, K. & Voon, B.H. 2007. Culture and service quality expectations: evidence from
Generation Y customers in Malaysia. Managing Service Quality, 17(6):656-680.
Kumar, M., Kee, F.T. & Charles, V. 2010. Comparative evaluation of critical factors in
delivering service quality of banks: an application of dominance analysis in modified
SERVQUAL model. International Journal of Quality and Reliability Management, 27(3):351-
377.
Kumar, M, Kee, F.T. & Manshor, A.T. 2009. Determining the relative importance of critical
factors in delivering service quality of banks. Managing Service Quality, 19(2):211-228.
Kumar, V., Smart, P.A., Maddern, H. & Maull, R.S. 2008. Alternative perspectives on service
quality and customer satisfaction: the role of BPM. International Journal of Service Industry
Management, 19(2):176-187.

265
Kung, C.Y., Yan, T.M. & Lai, C.S. 2009. Analyzing service quality in the mobile
communications industry: a comparison between GRA and LISREL methods. Journal of
Grey System, 12(1):49-58.
Kvist, A.K.J. & Klefsjö, B. 2006. Which service quality dimensions are important in inbound
tourism? A case study in a peripheral location. Managing Service Quality, 16(5):520-537.
La, V.Q., Patterson, P.G. & Styles, C.W. 2005. Determinants of export performance across
service types: a conceptual model. Journal of Services Marketing, 19(6):379-391.
Ladhari, R. 2008. Alternative measures of service quality: a review. Managing Service
Quality, 18(1):65-86.
Ladhari, R. 2009a. Assessment of the psychometric properties of SERVQUAL in the
Canadian banking industry. Journal of Financial Service Marketing, 14(1):70-82.
Ladhari, R. 2009b. Service quality, emotional satisfaction, and behavioural intentions: a
study in the hotel industry. Managing Service Quality, 19(3):308-331.
Lai, F., Hutchinson, J., Li, D. & Bai, C. 2007. An empirical assessment and application of
SERVQUAL in mainland China’s mobile communications industry. International Journal of
Quality and Reliability Management, 24(3):244-262.
Laroche, M., Nepomuceno, M.V. & Richard, M.O. 2010. How do involvement and product
knowledge affect the relationship between intangibility and perceived risk for brands and
product categories? Journal of Customer Marketing, 27(3):197-210.
LaSalle, J.L. 2006. The changing face of regional malls. Retail Traffic, 35(6):1-4.
Lassar, W.M., Manolis, C. & Windsor, R. 2002. Service quality perspective and satisfaction
in private banking. Journal of Services Marketing, 14(3):244-271.
266
Lau, P.M., Akbar, A.K. & Fie, D.Y.G. 2005. Service quality: a study of luxury hotels in
Malaysia. The Journal of American Academy of Business, Cambridge, 7(2):46-55.
Lee, S.M., Ribeiro, D., Olson, D.L. & Roig, S. 2007. The importance of the activities of
service business in the economy: welcome to the Service Business – an international
journal. Service Business, 1(1):1-5.
Leedy, P.D. & Ormrod, J.E. 2010. Practical research: planning and design. 9th ed. Upper
Saddle River, NJ:Pearson.
Lehtinen, U., & Lehtinen, J. 1991. Two approaches to service quality dimensions. The
Service Industries Journal, 11(3):287-303.
Levitt, T. 1972. Production-line approach to service. Harvard Business Review, 50(5):41-52.
Levy, M. & Weitz, B.A. 2009. Retail management. 7th ed. Chicago: Irwin.
Lewis, B.R. 2009. Managing service quality. In: Dale, B.G., Van der Wiele, A. & Van
Iwaarden, J.D. Managing quality.5th ed. Malden, MA: Blackwell Publishing.
Lin, D.J., Sheu, I.C., Pai, J.Y., Bair, A., Hung, C.Y., Yeh, Y.H. & Chou, M.J. 2009. Measuring
patients’ expectation and the perception of quality in LASIK services. Health and Quality of
Life Outcomes, 7(63):1-8.
Little, D. Main Street goes mainstream. Journal of Property Management,
November/December:35-37.
Lotz, S.L., Eastlick, M.A., Mishra, A. & Shim, S. 2010. Understanding patrons’ participation in
activities at entertainment malls. International Journal of Retail and Distribution
Management, 38(6):402-422.
267
Lotz, O. & Marais, L. 2007. Manufacturing enterprises and marketing planning in a mining
area of the North West Province, South Africa: lessons for local business support centres.
Developing Southern Africa, 24(5):694-705.
Lovelock, C. & Gummesson, E. 2004. Whither services marketing? In search of a new
paradigm and fresh perspectives. Journal of Service Research, 7(1):20-41.
Lovelock, C. & Wirtz, J. 2011. Services marketing: people, technology, strategy. 7th ed.
Upper Saddle River, NJ: Prentice-Hall
Lusch, R.F. & Vargo, S.L. 2011. Service-dominant logic: a necessary step. European
Journal of Marketing, 45(7/8):1298-1309.
Lundahl, N., Vegholm, F. & Silver, L. 2009. Technical and functional determinants of
customer satisfaction in the bank-SME relationship. Managing Service Quality, 19(5):581-
594.
Maddern, H. Maull, R. Smart, A. & Baker, P. 2007. Customer satisfaction and service quality
in UK financial services. International Journal of Operations and Production Management,
27(9):998-1019.
Madhavaram, S. & Hunt, S.D. 2008. The service-dominant logic and a hierarchy of operant
resources: developing masterful operant resources and implications for marketing strategy.
Journal of the Academy of Marketing Science, 36(1):67-82.
Marnitz, J.P. 2002. The lease agreement. In: Cloete, C.E. (ed.) Shopping centre
management in South Africa. Sandton: South African Council of Shopping Centres.
Martin, C.A. 2009. Consumption motivation and perception ns of malls: a comparison of
mothers and daughters. Journal of Marketing Theory and Practice, 17(1):49-61.
268
Martínez, J.A. & Martínez, L. 2010. Some insights on conceptualizing and measuring service
quality. Journal of Retailing and Customer Services, 17(1):29-42.
Marx, J.M.M. 2005. Customer service as an indication of service quality in South Africa.
Unpublished master’s thesis. Pretoria: University of Pretoria.
Matzler, K. & Hintgerhuber, H.H. 1998. How to make product development projects more
successful by integrating Kano’s model of customer satisfaction into quality function
deployment. Technovation, 18(1):25-38.
McDougall, G.H.G. & Levesque, T.J. 1994. A revised view of service quality dimensions: an
empirical investigation. Journal of Professional Services Marketing, 11(1):189-209.
Meyer-Ohle, H. 2009. Two Asian malls: urban shopping centre development in Singapore
and Japan. Asia Pacific Business Review, 15(1):123-135.
Milakovich, M.E. 2006. Improving service quality in the global economy: achieving high
performance in public and private sectors. 2nd ed. Boca Raton, FL: Auerbach.
Miller, C. 2009. Shopped out: the changing face of American retail. The American
Conservative, November:32-34.
Mirel, D. 2008. Redefining the anchor tenant. Journal of property management, 73(1):28-32.
Misonzhnik, E. 2010. Developers rethink the mall for the 21st century. Retail Traffic, 27 July.
[Online] Available from: http://retailtraffic.com/news/developers_rethink_mall
06272010 [Accessed: 2011-10-16].
Misonzhnik, E. 2011. Return of the mall. Retail Traffic, 5 May. [Online] Available from:
http://retailtraffic.com/development/analysis/return_of_the_mall_05052011/ [Accessed:
2011-10-16].
269
Mitra, A. 2008. Fundamentals of quality control and improvement. Hoboken, NJ: John Wiley
& Sons.
Moeller, S. 2010. Characteristics of services: a new approach uncovers their value. Journal
of Services Marketing, 24(5):359-368.
Monroe, K.B. & Krishnan, R. 1985. The effect of price on subjective product evaluations. In:
Jacoby, J. & Olson, J.C. (eds.) Perceived Quality, Lexington, MA: Lexington Books.
Montgomery, D.C., Jennings, C.L. & Pfund, M.E. 2011. Managing, controlling, and improving
quality. Hoboken, NJ: John Wiley & Sons, Inc.
Morgan, N.A. & Rego, L.L. 2006. The value of different customer satisfaction and loyalty
metrics in predicting business performance. Marketing Science, 25(5):426-439.
Muller, J. 2008. Will mall mania misfire? Finweek, 2 October:22-24.
Muller, J. 2009. Grinched: not so merry malls feeling pain as customers tighten belts.
Finweek, 8 October:20-22.
Musa, Z.N. & Pitt, M. 2009. Defining facilities management service delivery in UK shopping
centres. Journal of Retail and Leisure Property, 8(3):193-205.
Nadiri, H., Kandampully, J. & Hussain, K. 2009. Zone of tolerance for banks: a diagnostic
model of service quality. The Service Industries Journal, 29(11):1547-1564.
Negi, R. 2009. User’s perceived service quality of mobile communications: experience from
Ethiopia. International Journal of Quality and Reliability Management, 26(7):699-711.
Ng, C.F. 2003. Satisfying shoppers’ psychological needs: from public market to cyber-mall.
Journal of Environmental Psychology, 23(4):439-455.
270
Ng, S., David, M.E. & Dagger, T.S. 2011. Generating positive word-of-mouth in the service
experience. Managing Service Quality, 21(2):133-151.
Nieman, G.H. 2000. Landlords of shopping malls throttle small business. The Citizen, 2
June:12.
Nieman, G.H. & Niewenhuizen, 2009. Entrepreneurship: a South African perspective.
Pretoria: Van Schaik.
Nunally, J.C. 1978. Psychometric theory. New York: McGraw-Hill.
Oliver, R.L. 1981. Measuring and evaluation of satisfaction processes in retail settings.
Journal of Retailing, 57(3):25-48.
Olorunniwo, F., Hsu, M.K. & Udo, G.F. 2006. Service quality, customer satisfaction, and
behavioural intentions in the service factory. Journal of Services Marketing, 20(1):59-72.
Ostrom, A.L., Bitner, M.J., Brown, S.W., Burkhard, K.A., Goul, M., Smith-Daniels, V.,
Demirkan, H. & Rabinovich, E. 2010. Moving forward and making a difference: research
priorities for the science of service. Journal of Service Research, 13(1):4-36.
Palmer, A. 2008. Principles of services marketing. 5th ed. Berkshire: McGraw-Hill.
Pantouvakis, A. 2010. The relative importance of service features in explaining customer
satisfaction: a comparison of measurement models. Managing Service Quality, 20(4):366-
387.
Pantouvakis, A. & Lymperopoulos, K. 2008. Customer satisfaction and loyalty in the eyes of
new and repeat customers: evidence from the transport sector. Managing Service Quality,
18(6):623-643.
271
Parasuraman, A., Berry, L.L. & Zeithaml, V.A. 1991. Understanding customer expectations
of service. Sloan Management Review, 32(3):39-48.
Parasuraman, A., Zeithaml, V.A. & Berry, L.L. 1985. A conceptual model of service quality
and its implications for future research. Journal of Marketing, 49(4):41-50.
Parasuraman, A., Zeithaml, V.A. & Berry, L.L. 1986. SERVQUAL: a multi-item scale for
measuring customer perceptions of service quality. Cambridge, MA: Cambridge Marketing
Science Institute.
Parasuraman, A., Zeithaml, V.A. & Berry, L.L. 1988. SERVQUAL: a multiple scale for
measuring customer perceptions of service quality. Journal of Retailing, 64(1):12-37.
Parasuraman, A., Zeithaml, V.A. & Berry, L.L. 1994. Reassessment of expectations as a
comparison standard in measuring service quality: implications for future research. Journal
of Marketing, 58(1):111-124.
Parasuraman, A., Zeithaml, V.A. & Malhotra, A. 2005. E-S-QUAL: a multiple-item scale for
assessing electronic service quality. Journal of Service Research, 7(3):213-233.
Pawar, K.S., Beltagui, A. & Riedel, J.C.K.H. 2009. The PSO triangle: designing product,
service and organisation to create value. International Journal of Operations and Production
Management, 29(5):468-493.
Pérez, M.S., Abad, J.C.G., Carrillo, G.M.M. & Fernández, R.S. 2007. Effects of service
quality dimensions on behavioural purchase intentions: a study in public-sector transport.
Managing Service Quality, 17(2):134-151.
Perendergast, G., Marr, N. & Jarratt, B. 1996. An exploratory study of tenant/manager
relationships in New Zealand’s managed shopping centres. International Journal of Retail
and Distribution Management, 24(9):19-26.
272
Peters, V.J. 1999. Total service quality management. Managing Service Quality, 29(1):6-12.
Petridou, E., Spathis, C., Glaveli, N. & Liassides, C. 2007. Bank service quality: empirical
evidence from Greek and Bulgarian retail customers. International Journal of Quality and
Reliability Management, 24(6):568-585.
Pharr, K. 2010. Relationship advice: good ethics can help you avoid the pitfalls of
manager/vendor relations. Journal of Property Management, May/June:10.
Philip, G. & Hazlett, S. 1997. The measurement of service quality: a new P-C-P attributes
model. International Journal of Quality and Reliability Management, 14(3):260-286.
Philip, G. & Stewart, J. 1999. Assessment of the service quality of a cancer information
service using a new P-C-P attributes model. Managing Service Quality, 9(3):167-179.
Pinder, J., Price, I., Wilkenson, S.J. & Demack. 2003. “A method for evaluating workplace
utility.” Property Management, 21(4):218-229.
Pitt, M. & Musa, Z.N. 2009. Towards defining shopping centres and their management
systems. Journal of Retail & Leisure Property, 8(1):39-55.
Plant, C. 2009. The big leasing debate. Shopping South Africa, March. Shopping South
Africa, March.
Pollack, B.L. 2008. The nature of the service quality and satisfaction relationship: empirical
evidence for the existence of satisfiers and dissatisfiers. Managing Service Quality,
18(6):537-558.
Pollack, B.L. 2009. Linking the hierarchical service quality model to customer satisfaction
and loyalty. Journal of Services Marketing, 23(1):42-50.

273
Prajogo, D.I. & McDermott, P. 2011. Examining competitive priorities and competitive
advantage in service organisations using Importance-Performance Analysis matrix.
Managing Service Quality, 21(5):465-483.
Prinsloo, D.A. 2010. Classification and hierarchy of retail facilities in South Africa. Urban
Studies, 1-76. [Online] Available from: http://www.urbanstudies.co.za/New-Retail-
Classification-2010.pdf. [Downloaded: 2012-01-20].
Qin, H., Prybutok, V.R. & Zhao, Q. 2010. Perceived service quality in fast-food restaurants:
empirical evidence from China. International Journal of Quality and Reliability Management,
27(4):424-437.
Rahman, Z. 2006. Superior service quality in Indian cellular telecommunication industry: a
source of sustainable competitive advantage in an emerging economy. Services Marketing
Quarterly, 27(4):115-139.
Rajagopal. 2009. Growing shopping malls and behaviour of urban shoppers. Journal of
Retail and Leisure Property, 8(2):99-118.
Ramsaran-Fowdar, R.R. 2007. Developing a service quality questionnaire for the hotel
industry in Mauritius. Journal of Vacation Marketing, 13(1):19-27.
Ramsaran-Fowdar, R.R. 2008. The relative importance of service dimension in a healthcare
setting. International Journal of Health Care Quality Assurance, 1:104-124.
Ramseook-Munjurrun, P., Naidoo, P. & Lukea-Bhiwajee, S.D. 2009. Employee perceptions
of service quality in a call centre. Managing Service Quality, 19(5):541-557.
Rashid, W.E.W. & Jusoff, H. K. 2009. Service quality in health care setting. International
Journal of Health Care Quality Assurance, 22(5):471-482.

274
Reimers, V. & Clulow, V. 2009. Retail centres: it’s time to make them convenient.
International Journal of Retail and Distribution Management, 37(7):541-562.
Rintamäki, T.K.A., Kuusela, H. & Spence, M.T. 2006. Decomposing the value of department
store shopping into utilitarian, hedonic and social dimensions: evidence from Finland.
International Journal of Retail and Distribution Management, 34(1):6-24.
Roberts, J. & Merrilees, B. 2003. Managing the relationship: does trust lead to cooperation?
Paper presented at the ANZMAC Conference, Adelaide, 1-3 December:1095-1100.
Roberts, J., Merrilees, B., Herington, C. & Miller, D. 2010. Building retail tenant trust:
neighbourhood versus regional shopping centres. International Journal of Retail and
Distribution Management, 38(8):597-612.
Rogerson, C.M. 2004. The impact of the South African government’s SMME programmes: a
ten year review (1994-2003). Development Southern Africa, 21(5):765-784).
Rohini, R. & Mahadevappa, B. 2006. Service quality in Bangalore hospitals: an empirical
study. Journal of Services Research, 6(1):59-82.
Roses, L.K., Hoppen, N. & Henrique, J.L. 2009. Management of perceptions of information
technology service quality. Journal of Business Research, 62(9):876-882.
Rust, R.T. & Oliver, R.L. 1994. Service quality: insights and managerial implications from the
frontier. In: Rust, R.T. & Oliver, R.L. (eds.) Service quality: new directions in theory and
practice. Thousand Oaks, CA: Sage.
Rust, R.T., Zahorik, A.J. & Keiningham, T.L. 1995. Return on quality (ROQ): making service
quality financially accountable. Journal of Marketing, 59(2):58-70.
275
Saha, G.C. & Theingi. 2009. Service quality, satisfaction, and behavioural intentions: a study
of low-cost airline carriers in Thailand. Managing Service Quality, 19(3):350-372.
Santos, J., 2003. E-service quality: a model of virtual service quality dimensions. Managing
Service Quality, 13(3):233-246.
Saravanan, R. & Rao, K.S.P. 2007. Measurement of service quality from the customer’s
perspective: an empirical study. Total Quality Management, 18(4):435-449.
Sasser, W.E. Jr., Olson, R.P. & Wyckoff, D.D. 1978. Management of service operations.
Boston: Allyn & Bacon.
Saunders, M., Lewis, P. & Thornhill, A. 2009. Research methods for business students. 5th
ed. Harlow, Essex:Pearson.
Schneider, B. & White, S.S. 2004. Service quality: research perspectives. Thousand Oaks,
CA: Sage.
Sebastianelli, R. & Tamimi, N. 2002. How product quality dimensions relate to defining
quality. International Journal of Quality and Reliability Management, 19(4):442-453.
Senthilkumar, N. & Arulraj, A. 2011. SQM-HEI: determination of service quality
measurement of higher education in India. Journal of Modelling in Management, 6(1):60-78.
Seth, N., Deshmukh, S.G. & Vrat, P. 2005. Service quality models: a review. International
Journal of Quality and Reliability Management, 22(9):913-949.
Shostack, G.L. 1977. Breaking free from product marketing. Journal of Marketing, 41(2):73-
80.
276
Shukla, P. 2010. Effects of perceived sacrifice, quality, value, and satisfaction on behavioral
intentions in the service environment. Service Marketing Quarterly, 31(4):466-484.
Sichtmann, C., Von Selasinsky, M. & Diamantopoulos, A. 2011. Service quality and export
performance of business-to-business service providers: the role of service employee- and
customer-oriented quality control initiatives. Journal of International Marketing, 19(1):1-22.
Sierra, J.J., Heiser, R.S. & McQuitty, S. 2009. Exploring determinants and effects of shared
responsibility in service exchanges. Journal of Marketing Theory and Practice, 17(2):111-
128.
Singh, H., Bose, S.K. & Sahay, V. 2010. Management of Indian shopping malls: impact of
the pattern of financing. Journal of Retail and Leisure Property, 9(1):55-64.
Snyders, V. & Cloete, C.E. 2002. Tenant mix in shopping centres. In: Cloete, C.E. (ed.)
Shopping centre management in South Africa. Sandton: South African Council of Shopping
Centres.
Solvang, B.K. 2007. Satisfaction, loyalty, and repurchase: a study of Norwegian customers
of furniture and grocery stores. Journal of Customer Satisfaction, Dissatisfaction and
Complaining Behavior, 20:110-122.
South Africa. Department of Trade and Industries. 1995. White paper on the National
Strategy for Development and Promotion of Small Business in South Africa. Cape Town:
Government Printers.
South Africa. 1996. National Small Business Act, No. 102 of 1996. Government Gazette,
1901:1-14. [Online] Available from: http://www.acts.co.za/acts/1996/a102-96.pdf
[Downloaded: 2011-10-14].
277
South Africa. 2003. National Small Business Amendment Act, No. 26 of 2003. Government
Gazette, 461(25763):1-10. [Online] Available from:
http://www.info.gov.za/View/DownloadFileAction?id=68002 [Downloaded: 2011-10-14].
Sower, V.E. 2011. Essentials of quality. Hoboken, NJ: John Wiley & Sons, Inc.
Sower, V.E. & Fair, F.K. 2005. There is more to quality than continuous improvement:
listening to Plato. The Total Quality Management Journal, 12(1):8-20.
Speller, S. & Ghobadian, A. 1993. Change for the public sector. Managing Service Quality,
2(5):29-32.
Spreng, R.A. & McKoy, R.D. 1996. An empirical examination of a model of perceived service
quality and satisfaction. Journal of Retailing, 72:201-214.
Spreng, R.A. & Singh, A.K. 1993. An empirical assessment of the SERVQUAL scale and the
relationship between service quality and satisfaction. Unpublished manuscript. Michigan:
Michigan State University.
Starcke, C.M. 2006. Process-oriented quality management. In: Ehlers, U.D. & Pawlowski,
J.M. (eds.) Handbook on quality and standardisation in e-learning. Berlin: Springer.
Stiglingh, M. 2008. Developing a model to evaluate the quality of the services rendered by
the South African Revenue Service. Unpublished doctoral thesis. Pretoria: University of
Pretoria.
Stokes, D.R. & Wilson, N. 2010. Small business management and entrepreneurship. 6th ed.
Australia: South Western/Cengage Learning.
Struwig, F.W. & Stead, G.B. 2004. Planning, designing and reporting research. Cape Town:
Pearson Education South Africa.
278
Strydom, J.W. & Tustin, D. 2004. Business skills of small businesses in the peri-urban areas
of northern Tshwane. Proceedings of the forty-ninth International Council for Small Business
(ICSB) World Conference, Johannesburg, 20-23 June.
Takeuchi, H. & Quelch, J.A. 1983. Quality is more than making a good product. Harvard
Business Review, 61(4):139-145.
Talib, F. & Rahman, Z. 2010. Critical success factors of TQM in service organizations: a
proposed model. Services Marketing Quarterly, 31(3):363-380.
Teller, C. & Reutterer, T. 2008. The evolving concept of retail attractiveness: what makes
retail agglomerations attractive when customers shop at them? Journal of Retailing and
Customer Services, 15(3):127-143.
Terblanche, N.S. 1999. The perceived benefits derived from visits to a super regional
shopping centre: an exploratory study. South African Journal of Business Management,
30(4):141-146.
Terre Blanche, M. & Durrheim, K. 2002. Research in practice: applied methods for the social
sciences. Unpublished document. Cape Town: University of Cape Town.
Theodorakis, N.D., Alexandris, K. & Ko, Y.J. 2011. A service quality framework in the context
of professional football in Greece. International Journal of Sports Marketing and
Sponsorship, 12(4):337-351.
Theodorakis, N.D., Kambitis, A., Laios, A. & Koustelios, A. 2001. Relationships between
measures of service quality and satisfaction in professional sports. Managing Service
Quality, 11(6):431-438.

279
Theodorakis, N.D., Koustelios, A., Robinson, M.J. & Barlas, A. 2009. Moderating role of
team identification on the relationship between service quality and repurchase intentions
among spectators of professional sports. Managing Service Quality, 19(
Tontini, G. & Picolo, J.D. 2010. Improving gap analysis. Managing Service Quality,
20(6):565-584.
Townsend, P.L. & Gebhardt, J.E. 1988. Quality: 20th century snake-oil. Review of Business,
9(3):6-26.
Tsoukatos, E. & Rand, G.K. 2006. Path analysis of perceived service quality, satisfaction
and loyalty in Greek insurance. Managing Service Quality, 16(5):501-519.
Tsoukatos, E. & Rand, G.K. 2007. Cultural influences on service quality and customer
satisfaction: evidence from Greek insurance. Managing Service Quality, 17(4):467-485).
Tuli, K.R. & Bharadwaj, S.G. 2009. Customer satisfaction and stock returns risk. Journal of
Marketing, 73(6):184-197.
Tuzovic, S. 2009. Key determinants of real estate service quality among renters and buyers.
Journal of Services Marketing, 2(6/7):496-507.
Uys, S. 2009. Shopping centre rentals face challenging times. Shopping South Africa,
January.
Vandermerwe, S. & Rada, J. 1988. Servitization of business: adding value by adding
service. European Management Journal, 6(4):315-324.
Van Ossel, G., Stremersch, S. & Gemmel, P. 2003. Customer satisfaction and complaint
management. In: Van Looy, B., Gemmel, P. & Van Dierdonck, R. (eds.) Services
management. Harlow, England: Prentice Hall.

280
Vargo, S.L. & Lusch, R.F. 2004a. Evolving to a new dominant logic for marketing. Journal of
Marketing, 68(1):1-17.
Vargo, S.L. & Lusch, R.F. 2004b. The four service marketing myths: remnants of a goods-
based, manufacturing model. Journal of Service Research, 6(4):324-335.
Vargo, S.L. & Lusch, R.F. 2008. Why “service”. Journal of the Academy of Marketing
Science, 36(1):25-38.
Vinagre, M.H. & Neves, J. 2008. The influence of service quality on patients’ emotions on
satisfaction. International Journal of Health Care Quality Assurance, 1:24-38.
Von Freymann, J. & Cuffe, B. 2010. Customer service quality assessments and future
revenues in small businesses: a case study. Services Marketing Quarterly, 31(4):381-413.
Wang, Y., Lo, H.P. & Yang, Y. 2004. An integrated framework for service quality, customer
value, satisfaction: evidence from China’s telecommunication industry. Information Systems
Frontiers, 6(4):325-340.
Ward, Y. & Graves, A. 2007. Through life management: the provision of total customer
solutions in the aerospace industry. International Journal of Services Technology
Management, 8(6):493-495.
Warnaby, G., Bennison, D. & Davies, B.J. 2005. Marketing communications in planned
shopping centres: evidence from the UK. International Journal of Retail and Distribution
Management, 33(12):893-904.
Whittemore, M. 1992. Shopping malls attract small firms. Nation’s Business, 80(12):54-56.
Whyatt, G. 2008. Which factory outlet centre? The UK customer’s selection criteria. Journal
of Retailing and Customer Services, 15(4):315-323.

281
Wickham, P.A. 2006. Strategic entrepreneurship. 4th ed. Harlow: Prentice Hall.
Wicks, A.M. & Chin, W.W. 2008. Measuring the three process segments of a customer’s
service experience for an out-patient surgery center. International Journal of Health Care
Quality Assurance, 1:87-103.
Wiles, M.A. 2007. The effect of customer service on retailers’ shareholder wealth: the role of
availability and reputation cues. Journal of Retailing, 83(1):19-31.
Wilson, A., Zeithaml, V.A., Bitner, M.J. & Gremler, D.D. 2008. Services marketing:
integrating customer focus across the firm. Berkshire: McGraw-Hill.
Wimmer, R.D. & Dominic, J.R. 1983. Mass media research. Belmont: Wadsworth.
Wisniewski, M. 2001. Using SERVQUAL to assess customer satisfaction with public sector
services. Managing Service Quality, 11(6):380-388.
Wright, G. 2003. Out of the box: open-air “lifestyle” shopping centers are gaining momentum
as they move north from the Sunbelt. Building Design and Construction, 44(12):24-28.
Yan, R.N. & Eckman, M. 2009. Are lifestyle centres unique? Consumes’ perceptions across
locations. International Journal of Retail and Distribution Management, 37(1):24-42.
Yap, K.B. & Sweeney, J.C. 2007. Zone-of-tolerance moderates the service quality-outcomes
relationship. Journal of Services Marketing, 21(2):137-148.
Yiu, C.Y., Xu, S.Y.S. & Ng, H.C. 2008. Space allocation and tenant placement at high-rise
shopping malls. Journal of Retail and Leisure Property, 7(4):315-324.
282
Yoo, D.K. & Park, J.A. 2007. Perceived service quality: analyzing relationships among
employees, customers, and financial performance. International Journal of Quality and
Reliability Management, 24(9):908-926.
Young, L. 2008. From products to services: insights and experience from companies which
have embraced the service economy. Chichester, England: John Wiley & Sons, Ldt.
Yu, W. & Ramanathan, R. 2008. An assessment of operational efficiencies in the UK retail
sector. International Journal of Retail and Distributions Management, 36(11):861-882.
Zeithaml, V.A. 1988. Customer perceptions of price, quality, and value: a means-end model
and synthesis of evidence. Journal of Marketing, 52(3):2-22.
Zeithaml, V.A. & Bitner, M.J. 2003. Services Marketing: integrating customer focus across
the firm. 3rd ed. New York: McGraw-Hill.
Zeithaml, V.A., Parasuraman, A. & Berry, L.L. 1990. Delivering quality service: balancing
customer perceptions and expectations. New York: The Free Press.
Zeithaml, V.A., Parasuraman, A. & Berry, L.L. 1985. Problems and strategies in services
marketing. Journal of Marketing, 49:33-46.
Zeithaml, V.A., Parasuraman, A. & Malhotra, 2002. Service quality delivery through web
sites: a critical review of extant knowledge. Journal of the Academy of Marketing Science,
30(4):362-375.
Zhang, L.L., Lam, L.W. & Chow, C.S.F. 2009. Segmenting the customer base in a CRM
program according to customer tolerance to inferiority – a moderator of the service failure-
customer dissatisfaction link. Journal of Customer Satisfaction, Dissatisfaction and
Complaining Behavior, 22:68-87.

283
Zhenfeng, M. & Dubé, L. 2011. Process and outcome interdependency in frontline service
encounters. Journal of Marketing, 75(3):83-98.
Zhu, F.X., Wymer, W. (Jr) & Chen, I. 2002. IT-based services and service quality in
customer banking. International Journal of Service Industry Management, 13(1):69-90.
Zikmund, W.G. 2003. Business research methods. 7th ed. Ohio: Thomson, South Western.

285
APPENDIX A - Informed consent form -

286
Faculty of Economic and Management Sciences
Introduction and Informed Consent for participation in an academic
research study
Dept. of Business Management
SERVICE QUALITY IN A LANDLORD-SMALL BUSINESS RELATIONSHIP IN SHOPPING CENTRES
Research conducted by:
Ms. C.P.J. Harmse (28578602) [email protected]
Tel: +27 83 262 3249 Dear Respondent You are invited to participate in an academic research study conducted by Cornelia Petronella Johanna Harmse, a Doctoral student from the Department Business Management at the University of Pretoria. The purpose of the study is to investigate whether small businesses in shopping centres are satisfied with the service quality they receive from landlords and to determine whether an existing model can be used as a valid measure of service quality in this landlord- small business relationship in shopping centres. Please note the following: This study involves an anonymous survey. Your name will not appear on the questionnaire and the
answers you give will be treated as strictly confidential. You cannot be identified in person based on the answers you give.
Your participation in this study is very important to us. You may, however, choose not to participate and you may also stop participating at any time without any negative consequences.
Please answer the questions in the attached questionnaire as completely and honestly as possible. This should not take more than 15 minutes of your time.
The results of the study will be used for academic purposes only and may be published in an academic journal. We will provide you with a summary of our findings on request.
Please contact my supervisor, Prof. G.H. Nieman, tel. +27 83 282 7456, [email protected], if you have any questions or comments regarding the study.
Please sign the form to indicate that: You have read and understand the information provided above. You give your consent to participate in the study on a voluntary basis.
___________________________ ___________________ Respondent’s signature Date

287
APPENDIX B - Data collection instrument -

288
QUESTIONNAIRE V1
SECTION A
Please mark with an “X” 1. What is your
position in the business? V2
Owner
Manager
Owner & Manager
Other (please specify)
.............................................................
2. What type of
business do you have? V3
........................................................................................................................................
3. Number of
total full-time employees (including yourself). V4
1 – 4
5 – 9
10 – 14
15 – 19
20 or more
4. Total annual turnover. V5
Less than R150 000
R150 001 – R500 000
R500 001 – R1 000 000
R1 000 001 – R2 000 000
R2 000 001 – R5 000 000

289
R5 000 001 – R10 000 000
R10 000 001 or more
5. Since when are you a tenant at this centre? V6
Month ……………………………………...................................... Year…………
6. Since when do you have this business? V7
Month …………………………………….......................................Year…………
7. What is your
educational qualification? V8
Standard 8 or less
Matric certificate
Diploma/degree
B-Tech/Hons degree
Masters
Doctoral
Other (please specify)

290
SECTION B 8. Please respond to each statement by marking with an “X” the column of the appropriate response on
the 5 point scale where: 1 is “strongly disagree” 2 is “disagree” 3 is “neutral” 4 is “agree” 5 is “strongly agree”
Strongly D
isagree
Disagree
Neutral
Agree
Strongly A
gree
Aspect of the service
1 2 3 4 5
For office use only
1 When promised to do something by a certain time, management will do so
V9
2. Behaviour of management instils confidence in you 3 V10
3. Management gives you individual attention and is interested in your opinion
V11
4. Centre and facilities are neat and clean 5 V12
5. A service is provided at the time management promises to do so
6 V13
6. In general, small tenants are treated the same as bigger tenants
7 V14
7. When experiencing a problem, management shows sincere interest in solving it
8 V15
8. Management shows interest in communicating with you 9 V16
9. The décor and facilities of the centre are visually appealing
V17
10. You are informed when services will be performed V18
11. You feel safe in your transactions with management V19
12. Terms and conditions of lease are equally fair for both small tenants and bigger tenants
3 V20
13. Management is never too busy to respond to your requests
V21
14. Management performs the service right the first time 5 V22
15. You have the opportunity to fair negotiations with regard to the leasing contract
6 V23
16. Management is consistently courteous to you 7 V24

291
Strongly D
isagree
Disagree
Neutral
Agree
Strongly A
gree
Aspect of the service
1 2 3 4 5
For officeuse only
17. You are satisfied with the air conditioning V25
18. You receive prompt service (eg. reaction to maintenance complaints)
9 V26
19. Management understands your specific needs V27
20. There is sufficient parking at the centre V28
21. Management insists on error-free leasing statements and other records
V29
22. Management is always willing to help 3 V30
23. Management has the knowledge to answer your questions V31
24. Routine maintenance and repairs are done regularly 5 V32
25. Website of the centre are visually appealing 6 V33
26. Your rental fee is realistic in comparison with that of bigger tenants
7 V34
27. Shopping hours are realistic 8 V35
28. You are satisfied with the visibility of security in the centre 9 V36
29. You are satisfied with the response time of security V37
30. You perceive the promotions done at the centre to include the small tenants and the bigger tenants equally
V38
31. Written material of the centre are visually appealing V39
32. Shopping hours are convenient V40
33. You are satisfied with the marketing of the centre V41
34. You are satisfied with the number of daily visitors to the centre
V42
35. The marketing fund of the centre is applied and managed effectively
V43
36. The parking fees are realistic V44
37. You get value for your leasing fee V45
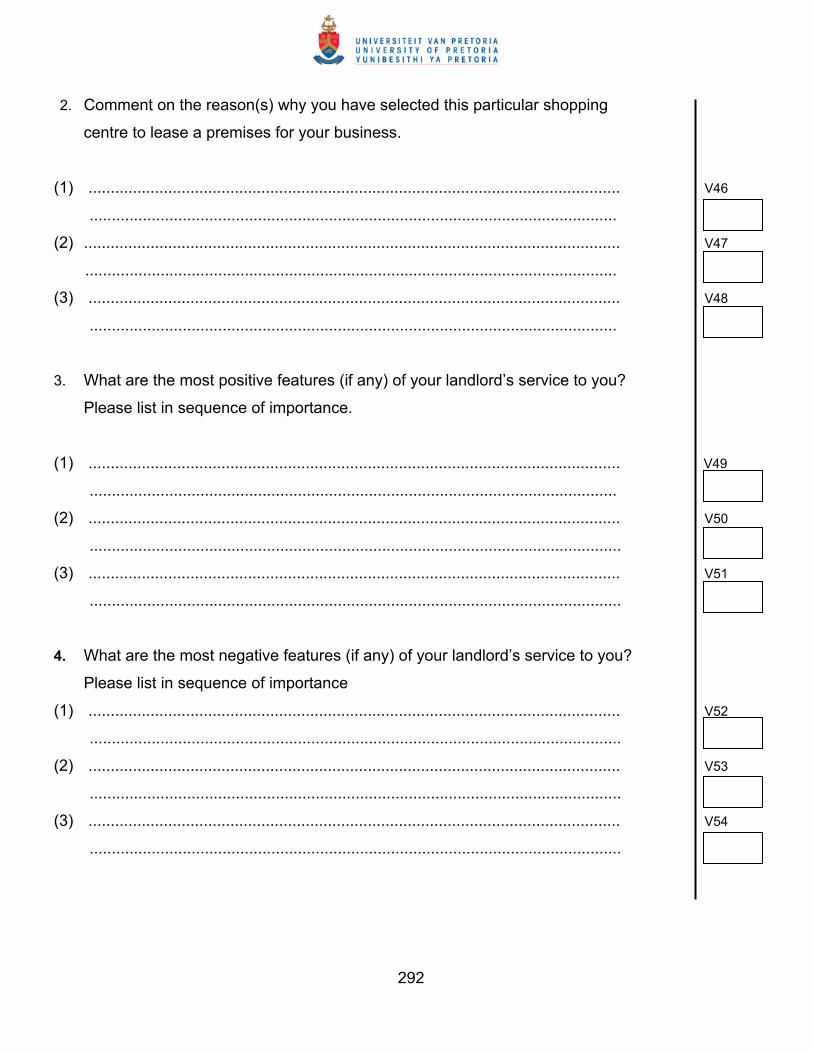
292
2. Comment on the reason(s) why you have selected this particular shopping
centre to lease a premises for your business.
(1) ........................................................................................................................ V46
.......................................................................................................................
(2) ......................................................................................................................... V47
........................................................................................................................
(3) ........................................................................................................................ V48
.......................................................................................................................
3. What are the most positive features (if any) of your landlord’s service to you?
Please list in sequence of importance.
(1) ........................................................................................................................ V49
.......................................................................................................................
(2) ........................................................................................................................ V50
........................................................................................................................
(3) ........................................................................................................................ V51
........................................................................................................................
4. What are the most negative features (if any) of your landlord’s service to you? Please list in sequence of importance
(1) ........................................................................................................................ V52
........................................................................................................................
(2) ........................................................................................................................ V53
........................................................................................................................
(3) ........................................................................................................................ V54
........................................................................................................................
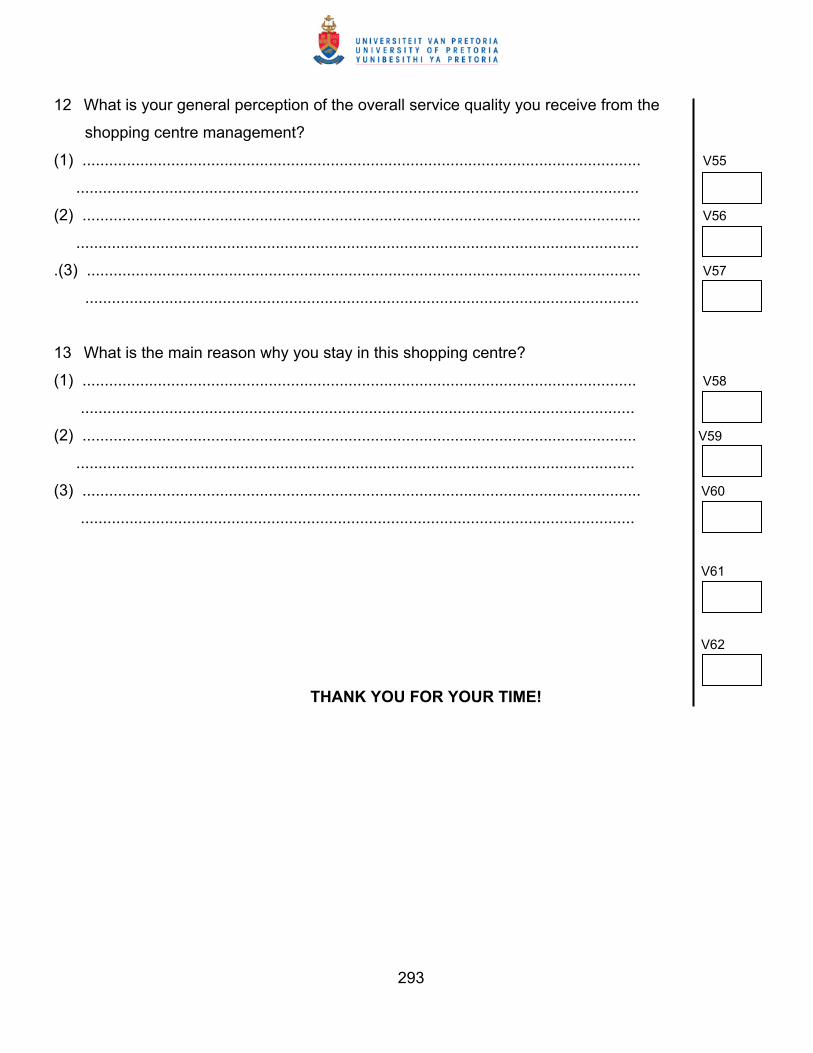
293
12 What is your general perception of the overall service quality you receive from the
shopping centre management?
(1) .............................................................................................................................. V55
...............................................................................................................................
(2) .............................................................................................................................. V56
...............................................................................................................................
.(3) ............................................................................................................................. V57
.............................................................................................................................
13 What is the main reason why you stay in this shopping centre?
(1) ............................................................................................................................. V58
.............................................................................................................................
(2) ............................................................................................................................. V59
..............................................................................................................................
(3) .............................................................................................................................. V60
.............................................................................................................................
V61
V62
THANK YOU FOR YOUR TIME!

294
295
APPENDIX C - Comments from small business tenants -

296
Comments from small business tenants in shopping centres on perceived service quality from landlords
(457 respondents from 27 shopping centres)
MENLYN SHOPPING CENTRE Owned and managed by Old Mutual
(86 respondents)
1. Comment on the reason(s) why you have selected this particular shopping centre to lease a premise for your business.
• High feet count. • Regional shopping centre. • Very busy centre. • As a store manager, what I will say is that our stores are only in up-market places. • Centre is established for many years. • Well-known centre. • Size of centre. • Location. • A lot of marketing is done • Good area • Big centre but no service. • Biggest in Pretoria. • Outstanding development. • There’s not many shops that sells what we have. • Upmarket people with money shop here. • The only shop in the centre that sells our merchandise. . • Lot of development the past years. • Only black empowered salon in Menlyn. • The business I wanted was in this mall. • Menlyn is perceived as the best mall till you actually become a tenant and see the other side
of the coin. • It is good to have a business in good name address. • Spacious centre • Upmarket and modern. • A lot of banks in the centre. • At the time, my shop was the only shop selling my product. • It is rated one of South Africa’s biggest shopping malls which means good business
opportunity. • A lot of shops and activities. • Bought shop from previous owner. • Area needed my kind of shop. • Biggest shopping centre in Pretoria, well established, with high foot traffic and diverse
customer base.

297
2. What are the most positive features (if any) of your centre management’s service to you? Please list in sequence of importance.
• Security is good/helpful. • Maintenance is fast and efficient. • The side-walk sale that they have and that it is for free. • Maintenance – they come to the store to collect the boxes and refuse. • Visuals, marketing and bringing customers to the centre. • Always having attractions – extra events. • Accommodating our terms – staying open later, or closing early if necessary. • Neat centre. • None. • Well developed. • Neat and clean. • Good security. • Helpful car guards. • They have a very good way of talking to people. • Signage inside. • Extra events. • When promotions are done, we are always willing to work with them, so we have a good
relationship with marketing. • Willingness to help. • A lot of other attractions. • Visually appealing. • Variety of shops.
3. What are the most negative features (if any) of your centre management’s service to you?
Please list in sequence of importance.
• Parking is a problem (even tenant parking). • Maintenance. • Look and feel of centre is not appealing. • They are not helpful, friendly or polite, for example: complaint about how dirty and unhygienic
the bathrooms are and management becomes very rude. • Parking fees are too high for tenants. • Need more signage boards. • The dirty toilets and I feel it is not up to standard. • Response time to problems. • Sometimes management passes the problem on and then never gets solved. • The management never comes here. • Have to sort out everything ourselves. • Not enough communication. • Management is selfish. • Lack of interest from management. • Management’s lack of involvement. • Waste becomes a problem. • Air conditioner. • Lack of commitment from management.
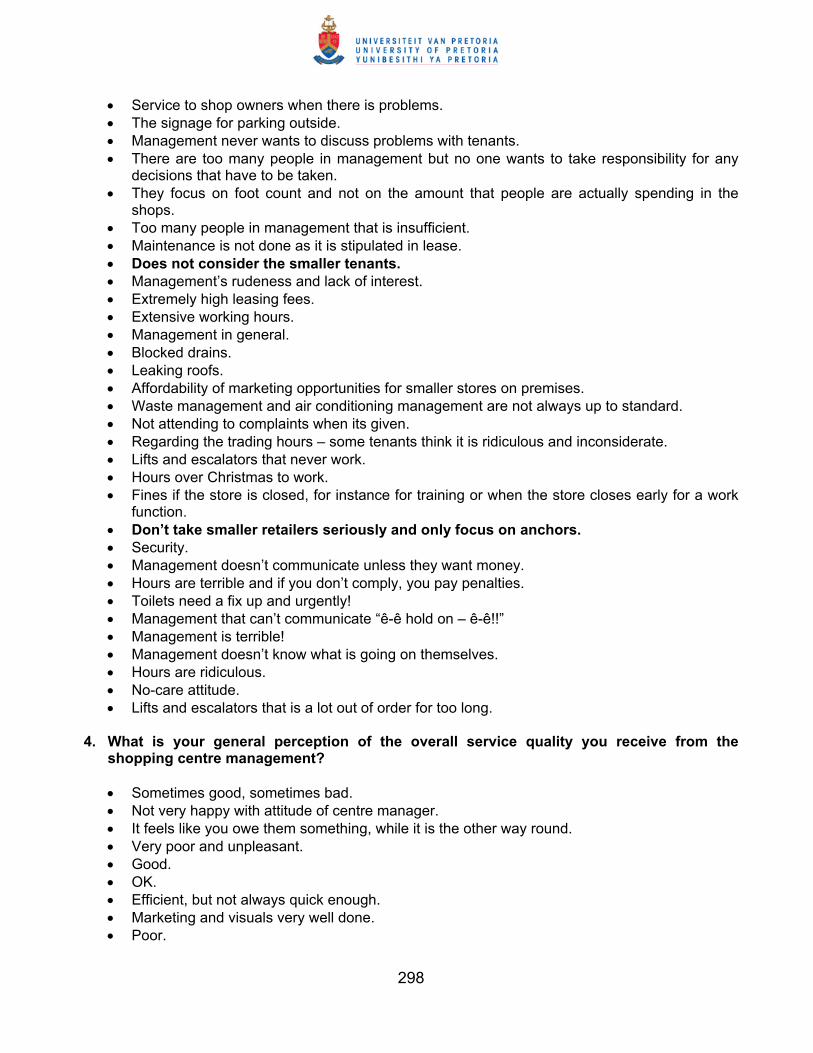
298
• Service to shop owners when there is problems. • The signage for parking outside. • Management never wants to discuss problems with tenants. • There are too many people in management but no one wants to take responsibility for any
decisions that have to be taken. • They focus on foot count and not on the amount that people are actually spending in the
shops. • Too many people in management that is insufficient. • Maintenance is not done as it is stipulated in lease. • Does not consider the smaller tenants. • Management’s rudeness and lack of interest. • Extremely high leasing fees. • Extensive working hours. • Management in general. • Blocked drains. • Leaking roofs. • Affordability of marketing opportunities for smaller stores on premises. • Waste management and air conditioning management are not always up to standard. • Not attending to complaints when its given. • Regarding the trading hours – some tenants think it is ridiculous and inconsiderate. • Lifts and escalators that never work. • Hours over Christmas to work. • Fines if the store is closed, for instance for training or when the store closes early for a work
function. • Don’t take smaller retailers seriously and only focus on anchors. • Security. • Management doesn’t communicate unless they want money. • Hours are terrible and if you don’t comply, you pay penalties. • Toilets need a fix up and urgently! • Management that can’t communicate “ê-ê hold on – ê-ê!!” • Management is terrible! • Management doesn’t know what is going on themselves. • Hours are ridiculous. • No-care attitude. • Lifts and escalators that is a lot out of order for too long.
4. What is your general perception of the overall service quality you receive from the
shopping centre management?
• Sometimes good, sometimes bad. • Not very happy with attitude of centre manager. • It feels like you owe them something, while it is the other way round. • Very poor and unpleasant. • Good. • OK. • Efficient, but not always quick enough. • Marketing and visuals very well done. • Poor.

299
• Average. • Not the standard I would like. • Neutral. • 5 out of 10. • Lack of interest. • Efficient. • If something is not stipulated in the lease, you have no foot to stand on. • No comment. • Average – much room for improvement. • Talk – very little true action (eg. air conditioner and bathrooms). • OK, nothing out of the ordinary. • They could improve on being stricter where hygiene is concerned. • 7 out of 10. • Overall service is good – however, the relationship with the landlord is often one-sided. • Bad. • Service is not up to date and no one knows whose job is who’s. • New generation manager can’t talk or communicate properly. • 4 out of 10. • Not good at all – I think they all need courses in management and communication.
5. What is the main reason why you stay in this shopping centre?
• Feet count. • Good turnover. • Good area. • Regular customers and word of mouth, clients know where we are. • Good business. • Well established. • Location. • It is well situated. • Well known centre. • Very busy centre. • Not renewing contract – are moving out. • Too expensive to move. • Big and busy centre. • Business is known in this centre. • Bound by my contract. • Many people prefer to do their shopping here. • Everybody gets along with everybody. • High income group shops here. • Best in Pretoria. • Location to the N1 and easy access for clients from out of town. • It’s a landmark in Pretoria. • Loyal and new customers. • Too expensive to move. • Invested a lot of money in the shop.

300
KOLONNADE SHOPPING CENTRE Owned and managed by SASOL Pension Fund and Growthpoint Properties Limited
(23 respondents)
1. Comment on the reason(s) why you have selected this particular shopping centre to lease a premise for your business.
• It was the first major shopping centre in the northern part of Pretoria with a high foot count. • There was a need for a comfort/health shoe store. • The rent was reasonable. • Close to home. • Bought shop from my brother. • Good area. • Bigger centre. • It’s a well-known regional centre with a consistently growing customer base. • Management kept time and their promises. • The behaviour that the management has towards their tenants is on point. • The surrounding areas were desperately in need of a big centre. • Becoming a tenant was a very wanted position with promising opportunities. • To increase business – more feet here than at our previous shopping centre. • It is a popular centre – the feet count is good. • The hours are reasonable. • All the shops are conveniently situated. • A lot of development in the area. • Ideal location north of the Magalies range. • Close to all amenities. • Has great entertainment for kids and adults alike. • It’s a big mall and has lots of customers. • I live in area and kids go to school close-by. • Centre was big awaited. • Near my house. • Know people in the area. • Had a previous shop in the area. • One of major shopping centres in Pretoria. • Rent reasonable compared to “big” centres.
2. What are the most positive features (if any) of your centre management’s service to you?
Please list in sequence of importance.
• Reliable, well-informed advice as well as sponsoring of the services of a retail specialist last year.
• Good communication – always available. • Marketing team positive. • Security excellent. • No comment. • They are always willing to listen and assist. • They are actively involved with the centre. • The centre is clean and regularly maintained. • The décor is visually appealing.

301
• Promotions done at the centre involves both small and bigger tenants. • Rental statements are always on time. • Centre is kept clean, including bathroom facilities. • Help and support for disabled customers are always sufficient. • None. • Advertising. • Security. • Clean centre. • Easy to get hold of. • Easy to communicate with (not always positive feedback). • Friendly. • Supports our shops equally. • Effective marketing correspondence. • Shops are given equal opportunity to advertise in shopping centre. • Safe environment (security) • No taxi rank. • They don’t ask too many questions, you barely see them. • Encourage you to perform. • Help you to promote your shop. • Marketing is good, but repetitive – nothing new. • Professional management group.
3. What are the most negative features (if any) of your centre management’s service to you?
Please list in sequence of importance.
• No possibility of negotiating little lower rent in difficult economic times. Turnover has not doubled like rent has increased. Competitors in mall compete for same customers.
• Maintenance not always done fast enough: weeks of loss of turnover due to escalator out of order.
• Not enough lifts in centre; our customers are older and need lifts and escalators. • Not willing to help. • Shopping hours not convenient enough for people using public transport. • Marketing and advertising is really poor and barely noticeable. • Complaints concerning the malfunctioning air conditioner and escalators are not met with any
urgency. • After 5 ‘o clock there is no one present of centre management if any crisis comes up. • The rent is too high in relating to the feet count. • Shopping hours. They only cater for big anchors. The anchors are the only ones
benefit from extended shopping hours. • Air conditioning not working well, particularly during December. • Small tenants do not have the same privileges as anchor tenants. • Small tenants are seen as easily replaceable. • Marketing not done for small tenants. • Insufficient loading areas for smaller tenants. • Loading areas are not always neat and tidy. • They do the bigger tenants’ problems first before they go to the smaller ones. • Centre closes early. Should be open till 19h00. • Needs Gautrain bus services.

302
• Needs more security. • Needs more variety of stores. (greater mix of stores). • Needs more billboards on major roads and freeways. • Needs more police presence. • Marketing – we do not know if they do enough to get customers to visit the centre. It is almost
mid December and there is no attraction to get people in the centre. That is so bad. • Escalators constantly not working. • Centre décor is really out-dated. • Do not support small enterprises. • None.
4. What is your general perception of the overall service quality you receive from the
shopping centre management?
• Very professional centre manager and also most of the staff. • Reliable and helpful. • Technical staff good, but need to address the many problems with escalators as the
connection between top and bottom floor not good. Air conditioner also not very efficient – sometimes too cold, sometimes very hot.
• Not good. • Poor. • The centre management really wants the best for both customer and tenant. • They are always willing to assist and listen. • The service quality is good for both small and big tenants. • This centre is so successful but is not living up to its potential. • Wish they could apply the marketing fund and start to aggressively campaign. If that is the
case, I believe we can double our turn-over easily. • In-between. • Acceptable. • Good. • Medium to good. • Excellent. • Professional/competent. • They involve all tenants – open door policy. • Bad – the centre manager is ok but the marketing component is a problem. • They are not developing this centre to full potential. • The managers are too young and lack experience. • They must communicate with tenants by coming to the shops regularly. • They do what they need to. • Overall good service. Does everything better than normal.
5. What is the main reason why you stay in this shopping centre?
• Well established business – more than 10 years old. • Revamped our shop recently and changed name with new fresher image; lifted shop front. • Still good shopping centre compared to other in vicinity. • Foot count is good. • Not staying. • The consistent customer base.
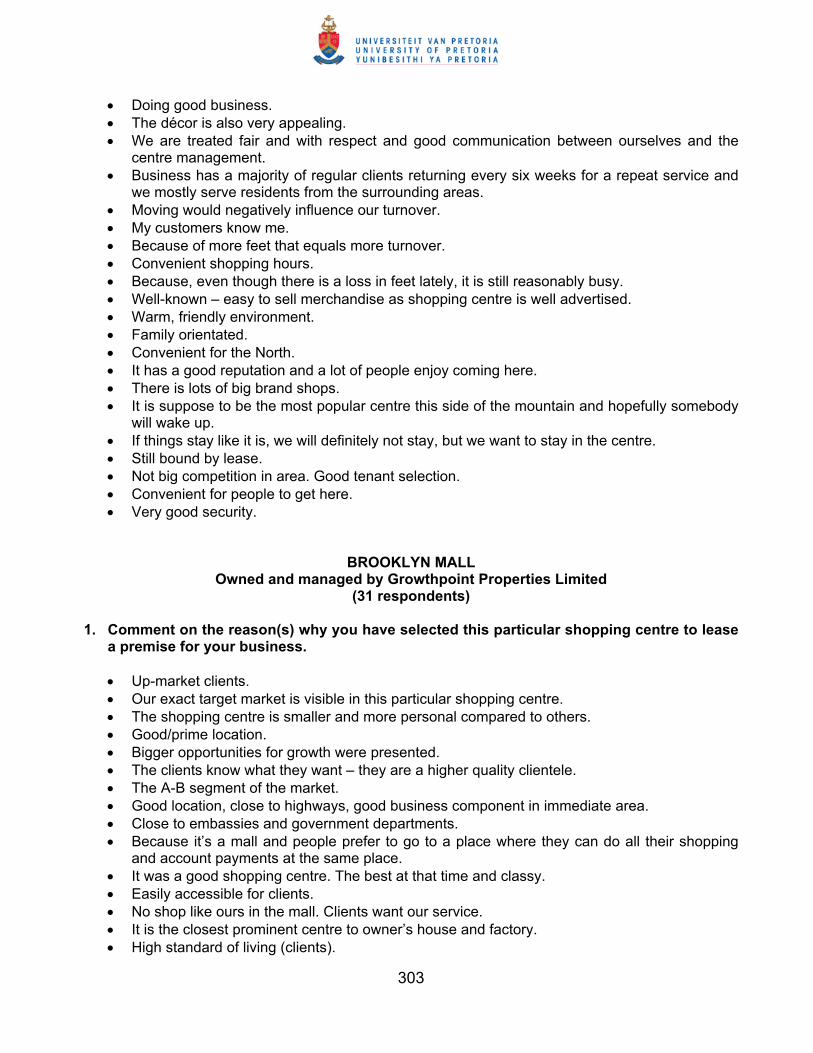
303
• Doing good business. • The décor is also very appealing. • We are treated fair and with respect and good communication between ourselves and the
centre management. • Business has a majority of regular clients returning every six weeks for a repeat service and
we mostly serve residents from the surrounding areas. • Moving would negatively influence our turnover. • My customers know me. • Because of more feet that equals more turnover. • Convenient shopping hours. • Because, even though there is a loss in feet lately, it is still reasonably busy. • Well-known – easy to sell merchandise as shopping centre is well advertised. • Warm, friendly environment. • Family orientated. • Convenient for the North. • It has a good reputation and a lot of people enjoy coming here. • There is lots of big brand shops. • It is suppose to be the most popular centre this side of the mountain and hopefully somebody
will wake up. • If things stay like it is, we will definitely not stay, but we want to stay in the centre. • Still bound by lease. • Not big competition in area. Good tenant selection. • Convenient for people to get here. • Very good security.
BROOKLYN MALL Owned and managed by Growthpoint Properties Limited
(31 respondents) 1. Comment on the reason(s) why you have selected this particular shopping centre to lease
a premise for your business.
• Up-market clients. • Our exact target market is visible in this particular shopping centre. • The shopping centre is smaller and more personal compared to others. • Good/prime location. • Bigger opportunities for growth were presented. • The clients know what they want – they are a higher quality clientele. • The A-B segment of the market. • Good location, close to highways, good business component in immediate area. • Close to embassies and government departments. • Because it’s a mall and people prefer to go to a place where they can do all their shopping
and account payments at the same place. • It was a good shopping centre. The best at that time and classy. • Easily accessible for clients. • No shop like ours in the mall. Clients want our service. • It is the closest prominent centre to owner’s house and factory. • High standard of living (clients).

304
• Centrally located, upmarket. • Was tapping into a niche market. • This shopping centre attracts the type of customers we want. • The appeal of the centre and area. • It suits the products we sell in the Brooklyn area. • We have always loved Brooklyn mall, even if centre is busy, customers feel ok. • Right market for our product. • More customers with more time to shop. • The shop was available to buy. • Centre is of world standard for all the foreign clients/visitors. • Hygiene and general neatness of centre is above average. • The hours the centre is open appealed to me. • Good area in terms of income. • Mall has a good history.
2. What are the most positive features (if any) of your centre management’s service to you?
Please list in sequence of importance.
• Promotion of the mall and its tenants are good. • Keeps the mall in pristine condition and updated. • Listening to what the client wants and improving to better services for the client. • None. • Rental statements always on time. • Security is good. • They are helpful. • Not a good time for us to say anything good. • They are friendly. • Parking. • Positive feedback. • Security is excellent. • Additional space at much lower cost due to renovations – assists us in difficult times. • Always do what you ask. • Advertise when the shop has sales. • Centre is clean, tidy and safe. • They listen when you have a problem. • You get regular feedback of meetings. • They show an interest in my business.
3. What are the most negative features (if any) of your centre management’s service to you?
Please list in sequence of importance.
• Management does not consider small tenants as important. • Management does not always take the smaller tenants’ opinions into consideration. • Promises made to help are not always kept and sometimes completely forgotten. • Service delivery is not the strongest point of management. • Service concerning parking for tenants could be a lot better. • After 23 years you are still treated as a “tenant”. The landlord is above seeing investing in his
tenants.

305
• I am a “client” of the Mall but management don’t treat you like a “customer” should be treated. • Landlord has created the impression that tenants do not have “rights”. • Their marketing strategy to promote their centre is bad. • No feedback regarding problems. • Air conditioning complaints not sorted out after numerous phone calls and confrontations with
management. • Slow service. • I think they could make more effort with the marketing. • Sometimes takes long to get back to you on enquiries. • Slow maintenance systems. • They made us move although they knew that the mall was going to change. • We spend all the money and now... have to move again. • They do not make marketing space other than the store for the shops. • Slow reaction to requests. • No communication in terms of building a relationship with us as the tenants. • Incompetent! • Centre maintenance. • Their lack of ability to respond to our needs as a business. • We are forever waiting to get response, answers and clearance on important issues. • It really feels like they do not really care for us as a business – if we make it or not. • Rents are too high. • Not willing to negotiate. • Favouritism. • Do not take an interest in the tenants at all. • Parking. • Not taking complaints seriously. • Treating the smaller stores unfairly. • Air conditioners never work. • Unfair hours on public holidays. • Marketing department’s failure to respond or give feedback to enquiries. • The bathroom/toilets can be better maintained and cleaned. • Inconvenient shopping hours (especially in December). • No personal contact with tenants. • No ear for problems with regard to feet count and turnover. • Leasing fee is totally too high. • Ought to give us more choices with shopping hours, especially on Sundays and public
holidays (we must be open but do practically no business on Sundays). • Not enough support. • Nothing that I can comment about. • They are not approachable at all. • They have an inflexible attitude and make you understand that you are nothing. • They let you understand that people are waiting for your spot. If you are not satisfied
with the conditions – leave. • Money spent on extending the mall instead of upgrading what exists. • They do not always respond promptly. • You pay for air conditioning over and above the electricity and then you have to clean it as
well. • No flexibility in terms of rental payable during current economic situation.

306
4. What is your general perception of the overall service quality you receive from the shopping centre management?
• Not good. • The overall service quality does not focus on the tenants. • They try to help but don’t really go out of their way to provide excellent service. • They need to get involved more. • For me being a new manager here, no information was given for new managers. • Landlords have an arrogance about their tenants. • It’s all about the money. • Fair. • Neutral. • Quality is fairly good, here and there complaints but not big ones. • They are a good centre management that looks at our basic needs. • In general, relatively good. • Negative. • Impersonal. • One-sided. • In certain areas it is very good, but in other areas not so good. • If we do not get response about our lease contract and proposal to move shop soon, we will
move to another centre. • The management is only interested to get your rent and is not interested in keeping tenant
mix right, etc. • They work according to targets without considering economic climate, recession, etc. • Bad. • Positive and helpful. • Not very pleasant. • It’s normal, nothing special. • Very good and have empathy, except when it comes to the rent and shopping hours. • Lack of interest. • They have an attitude of “take it or leave it”. • You are not important enough. • More interaction necessary on a personal level between shop owners and management. • Not at all too bad and better than where I have been previously.
5. What is the main reason why you stay in this shopping centre?
• Established client base. • Good location. • Centre attracts enough feet. • We have a big client base situated in this area and everyone knows where we are. • Clients prefer to come to our store here rather than to drive to the other side of Pretoria. • Built a good customer base. • Invested in good quality store; too costly to move. • Would consider Menlyn, but their hours are too long. • My business is doing well since I’m here. • Can’t afford to move. • Good, established shop.

307
• Easily accessible to us as well as our clients. • The working hours are not too late. • The type of customers we are serving visits this centre. • Feet count is good. • Regular customers like embassies. • The customer you attract in this area is loyal and wealthy. • Future growth. • All the centres are the same and the landlord has too much power. • Good area. • This is the flagship store as it is the first one open and has been here for 3 years. • Well-known with regular customers. • Safe centre and not too full with people. • Bound by leasing contract. • Paid a huge amount for shop. • Clients are in the direct vicinity – 60 % foreign clients that prefer our unique products. • Because the environment is nice and the customers are very friendly. • I have no other option. • Client profile fits my product offering. • I like the centre and enjoy the atmosphere. • The shopping hours are reasonable. • Do not think I will be better off in another centre.
BROOKLYN DESIGN SQUARE Owned and managed by Growthpoint Properties Limited
(8 respondents)
1. Comment on the reason(s) why you have selected this particular shopping centre to lease a premise for your business.
• 14 years ago it was appealing and there were lots of feet. • We were approached by the landlord to open a shop here. • The verbal promises and arrangements were very advantageous (initially). • Good position • Reasonable rent when we started. • Appealing environment and atmosphere. • Good area – lots of embassies. • It’s “vibey” and a good area for business. • It’s visible and well known. • It’ echo and environmentally friendly and helps to set a standard of service. • There is no other shop with same or similar items in the area. • The vibe of all the décor and design shops. • Location – central to most of my customers. • Popular, established and has many feet (up-market). • My brand suits the market I target.

308
2. What are the most positive features (if any) of your centre management’s service to you? Please list in sequence of importance.
• None. • Manager can be approached directly and she listens. • They keep outside area well cleaned. • Good security and visible to public as well. • Undercover parking – especially in summer. • Appealing décor. • Branding is spot on. • People in office are good, efficient and helpful.
3. What are the most negative features (if any) of your centre management’s service to you?
Please list in sequence of importance.
• No anchor tenant. • No marketing. • Communication. • Management is effective only when they are the disadvantage party. • Lower levels of management personnel lack depth of ability to understand a problem. • Marketing has no ability to understand unique requirements of the environment and to
develop and implement an appropriate approach. • They over-charge on parking. • Lifts are always broken and are a safety hazard. • Their response to complaints is lacking and they lack customer/client skills. • None. • Things don’t always get done properly the first time. • Security does not clamp down on rules like no smoking! • Air conditioning is a nightmare.
4. What is your general perception of the overall service quality you receive from the
shopping centre management?
• Average service. • Mostly negative. • I exist to pay rent. • You can work with them. • Response to a problem normally good. • Cleaning is excellent. • Maintenance is slow. • Very, very good. • Good – great advertising team. • Get service for what you pay. • Parking and other services are great.
5. What is the main reason why you stay in this shopping centre?
• No reason – only the leasing contract keeps us here. • For the sake of the clients.

309
• Still bound by the leasing contract. • I plan on leaving and settling in a neighbourhood complex. • Location. • We’ve been here for years. • Regulars are used to the setting and vibe. • Had to built up the business and moving will break the vibe. • Target market. • Good business (traffic).
MONTANA CROSSINGS Owned and managed by Old Mutual
(9 respondents)
1. Comment on the reason(s) why you have selected this particular shopping centre to lease a premise for your business.
• When I bought the business, it was a busy centre. • Well-known centre. • It was the only available place at the time that was affordable. • This was the only pet and pet food shop in the area. • Got a big shop at a good price. • Good location. • Centrally located. • First retailer of plastics in northern suburbs. • Was a new centre with a lot of potential. • Agreed rent was and still is very attractive. • Business was already here for 10 years.
2. What are the most positive features (if any) of your centre management’s service to you?
Please list in sequence of importance.
• None. • Nothing. • None that I can think of. • Management has no positive features. • They are non-existent.
3. What are the most negative features (if any) of your centre management’s service to you?
Please list in sequence of importance.
• They don’t keep their promises. • Management in general. • Security. • Toilets always dirty and broken. • No marketing. • Having problems to get hold of management. • Have to pay for maintenance. • Management never available.

310
• No management. • No promotions. • Not happy with security (never here). • You can never reach them!!! • No manager on site. • Don’t know who to speak to. • No management on premises and no office or staff – only maintenance. • No communication. • The only way to get repairs done is to withhold rent.
4. What is your general perception of the overall service quality you receive from the
shopping centre management?
• They only work on their budgets and do not worry about the small business person. • Poor. • No service at all. • Bad, bad, bad!!! • Awful. • Disappointing to say the least. • Not good. • Non-existent.
5. What is the main reason why you stay in this shopping centre?
• Business is settled and people know where we are. • Bound by leasing contract. • Good clients. • Looking for another premises to move to. • Business is well known in the area. • Too expensive to move. • Settled. • It is not sound business management to move around from one shopping centre to the next.
We signed a 5-year lease agreement. • Been here for almost 10 years and built up good client bases. • Rent is very attractive. • Good position. • Been here for 13 years – this is our known location. • Fair rental.
JAKARANDA SHOPPING CENTRE Owned by Government Pension Fund and managed by Public Investment Corporation
(7 respondents)
1. Comment on the reason(s) why you have selected this particular shopping centre to lease a premise for your business.
• Good spot in centre to trade. • Was misled by management in regards to rent prices.

311
• Near to my residence. • Located centrally. • Generally neat and tidy. • Have a good customer base. • No other similar business in this area. • Originally there was a good tenant mix. • The shop was available when I left my job. • The lease was at that point very reasonable. • Safe and convenient for customers. • Area is not too much congested. • The centre is very quiet and convenient for customers to shop.
2. What are the most positive features (if any) of your centre management’s service to you?
Please list in sequence of importance.
• None. • Centre kept in a good condition. • Good open door policy. • Manager does give attention to complaints. Due to the landlord, not always with positive
results. 3. What are the most negative features (if any) of your centre management’s service to you?
Please list in sequence of importance.
• Centre unhygienic and smells of urine. Cockroaches everywhere. • Parking design is horrendous. • Service delivery is pathetic as lifts/escalators are seldom working. The fountain in front hasn’t
been working in 2 years. • Too many to say. • Management is completely incompetent and unwilling to rectify all complaints by the tenants
as well as the customers, eg. 2011 escalator was not working for 7 months. • No advertising to attract customers back to centre. • Security staff is not followed up and are left to their own accord and not always on site. • Ridiculous rentals – after all, we are experiencing a recession. • Unwillingness to negotiate. • Landlord has no interest to improve and they turn a deaf ear to complaints. • Already waiting since November 2010 for renewal of contract. Talk, but nothing is happening. • The allocation of outside contractors to read electricity meters makes electricity very
expensive. 4. What is your general perception of the overall service quality you receive from the
shopping centre management?
• Certainly NOT up to standard. • BAD. • Incompetent. • Willing to listen and help. • Deals with problems on time.

312
• Our biggest problem is not with centre management, but with the landlord’s office which does not have a clue what is happening in the centre.
• Can improve a lot. 5. What is the main reason why you stay in this shopping centre?
• It is a prime spot which is centrally located. • We have a prime shop spot in the centre. • Too expensive to relocate. • Not staying – moving out to other premises soon. • Good client base. • Central location. • Centre is strategically located. • Have build up a good customer base over a number of years. • Got nowhere else to go without major expenses. • The only reason is because of the leasing contract.
ZAMBEZI JUNCTION Owned and managed by Sinovich
(16 respondents) 1. Comment on the reason(s) why you have selected this particular shopping centre to lease
a premise for your business.
• Settled development. • Very busy centre. • Next to a busy road. • Situated in a busy area. • Neat centre. • Big signs that indicate shops in centre. • Good area. • Was given good space. • Good community. • Was the only shop of its kind at the time. • Spacious, busy centre. • Nice building.
2. What are the most positive features (if any) of your centre management’s service to you?
Please list in sequence of importance.
• Good parking. • The big bill boards. • Very neat centre. • Good security. • Big signs, lots of marketing. • Big signage. • No empty shops. • No hawkers.

313
3. What are the most negative features (if any) of your centre management’s service to you? Please list in sequence of importance.
• Not enough toilet paper in bathrooms. • Lot of hawkers. • Stinking toilets. • Security. • More security at night needed. • Have to wait a long time for answers. • Not enough marketing and promotions. • Management in general. • Lack of communication. • Papers sometimes lying around.
4. What is your general perception of the overall service quality you receive from the
shopping centre management?
• Good. • OK. • Neutral.
5. What is the main reason why you stay in this shopping centre?
• Busy centre – lots of feet. • Clean centre. • Well-known centre. • Good area. • Accessible centre. • Big names around us. • Business located well next to busy road. • Enough parking. • Established. • Business is settled. • Business is doing good.
WATERGLEN SHOPPING CENTRE Owned by Sharemax and managed by Centroprop
(15 respondents)
1. Comment on the reason(s) why you have selected this particular shopping centre to lease a premise for your business.
• Cheaper rent. • Close to home. • Very good location. • Leasing fee affordable compared to other centres. • Service oriented centre. • Rent seemed reasonable.

314
• Grew up with the centre. • We bought on existing business that’s been established for several years. • Because of the established shop across this shop. • The fairly cheaper rent as opposed to smarter malls. • Close proximity to Virgin Active Gym. • Up-market clients nearby. • Waterglen was the only centre to accept my small business without securities or
surety when I originally applied to become a tenant 14 years ago. 2. What are the most positive features (if any) of your centre management’s service to you?
Please list in sequence of importance.
• Always there to listen to you. • None. • They support the shops in the centre (by buying from them). • Cleaning has improved. • This year I asked for a rent reduction. They were willing to negotiate and consider my
situation. They did grant me a partial reduction in so much as to make life easier for me. • Over the years, security and cleaning became better. • Proper statements.
3. What are the most negative features (if any) of your centre management’s service to you?
Please list in sequence of importance.
• Not attending to the parking signs at entrance 3. • Do not communicate. • No maintenance due to any funds. • No communication unless I initiate • Useless promotional days are constantly organised instead of utilising money for better
marketing. • Marketing of empty shops – bad! • No support. • The centre is very old and requires upgrading (leaking roofs, visually unpleasing, etc.). • Too many empty shops. • In the past, they were less open to negotiation. • The marketing events that are organised in short, SUCK! It is loud and unpleasant. I believe it
has a negative rather than a positive effect. • It seems as if they don’t care. • No feedback on queries. • General lack of interest in tenants. • No attention to small business. Feels that small businesses make the centre, but are
not treated accordingly. • Centre management has no personal contact with tenants. • Problem-solving skills. • Do not respond to e-mail or telephonic communication. • The offices are on the premises... they might just as well be on the moon! • Do not show any interest in their tenants.

315
4. What is your general perception of the overall service quality you receive from the shopping centre management?
• Very good. • Minimum. • Communication can improve with regards to the future of the centre, marketing, etc. • It is good. They are always willing to listen (also only since recently). • They are not very effective or competent. • Poor service and maintenance of mall. • Very poor. • Average – other shops in other centres have the same complaints. • The management is probably doing their best within the parameters set by the landlord.
5. What is the main reason why you stay in this shopping centre?
• People know where I am. A trophy shop doesn’t really need the feet. • Cannot afford to move. • Rates still reasonable. • No communication unless I initiate. • Have to repay debt. • Good customers. • Shopping hours are good. • Signed lease. • I first want to see if my shop shows a profit in this centre, which is cheaper than move to a
more expensive venue. • For the sake of clients I have made in this shopping centre. • It is a mission to move, especially without any guarantee than my shop will do better
elsewhere. • More feet – mostly due to DSTV anchor next door. • Not feasible for me to move (65 years old).
MORELETA PLAZA Owned and managed by Redefine
(8 respondents) 1. Comment on the reason(s) why you have selected this particular shopping centre to lease
a premise for your business.
• Is based in Pretoria East. • Rent is still affordable. • It is on a busy street. • Flexible business hours. • Renovated, • Free parking. • Fair number of daily visitors. • There is sufficient parking for guests and it’s at no charge. • Centre is easy to get in and out. • Bought the business over.

316
• I entered the centre when it was poorly let. Centre management were very negotiable with the per square metre rent.
2. What are the most positive features (if any) of your centre management’s service to you?
Please list in sequence of importance.
• It is convenient in terms of management, flexibility, fairness. • Mall is always clean and continuous improvement is commendable too! • Management is fairly accessible. • Response to problems. • I once left my door not properly locked and the security called to let me know – it was great. • None. • Very little centre management.
3. What are the most negative features (if any) of your centre management’s service to you?
Please list in sequence of importance.
• Marketing of the mall still needs more work. • Don’t answer calls. • For a 10 square metre shop, electricity account is R700 per month. • Certain businesses get help and some don’t. • Manager of centre does not respond quickly enough. • No response to your call or complaint. • Do not listen to complains. Do their own thing.
4. What is your general perception of the overall service quality you receive from the
shopping centre management?
• Overall service is average; there is still room for improvement. • Not good enough. • Fair. • Poor. • Generally the centre management is not sympathetic towards the tenants.
5. What is the main reason why you stay in this shopping centre?
• Rent is still affordable. • Feet count is still adequate. • Good location. • In good nabourhood. • Free parking. • Quick response of security. • To be considered after the lease. • After 10 years, people in the area know of us. • Costs are better than Menlyn or Woodlands. • Better shopping hours than Menlyn. • Business is good – more than 20 years in centre. • Feet count is good.

317
MONTANA VALUE CENTRE Owned by Emira Property Fund and managed by Eris Property Group
(6 respondents)
1. Comment on the reason(s) why you have selected this particular shopping centre to lease a premise for your business.
• Big shop at a good price. • Price was right at the time of lease. • Lots of vehicles drive by. • Only coffee shop in centre.
2. What are the most positive features (if any) of your centre management’s service to you?
Please list in sequence of importance.
• Front shop nearest to the road. • Clean centre. • Enough parking. •
3. What are the most negative features (if any) of your centre management’s service to you? Please list in sequence of importance.
• Not enough marketing of centre. • Not enough promotions. • Lots of empty shops. • Security not good – needs more guards.
4. What is your general perception of the overall service quality you receive from the
shopping centre management?
• Good. • Poor. • Quite good. • Sometimes good.
5. What is the main reason why you stay in this shopping centre?
• Good shop and we are settled. • Established here and doing good business. • Good location. • Leasing fees not too high. • Have been here for many years. • Big centre. • Lots of businesses where you have to wait and then you can eat and drink.

318
WAVERLEY PLAZA Owned by Octodec Portfolio and managed by City Properties
(14 respondents) 1. Comment on the reason(s) why you have selected this particular shopping centre to lease
a premise for your business.
• Shop is in the walk-through and is visible. • They asked me to move here. • Business was available for sale. • We stay in the same community. • Near home – makes it easier to receive stock and to handle any emergency. • Neat centre that will attract customers. • Friendly and convenient. Access to centre is easy and centre is not too big. • Close to home and schools. • Near Pick-‘n-Pay. • Location – central and accessible. • Demographics – lots of disposable income. • We understand and know the customer base very well. • Safe area. • Close to schools – prospective clients. • Rent is reasonable. • Business was already established with a client base. • Saw a lot of potential in the business. • This shop was vacant and I could no longer stay in the CBD. • Centre management approached me to move this shop to the centre. • There is more feet in this centre. • The surroundings are more appealing.
2. What are the most positive features (if any) of your centre management’s service to you?
Please list in sequence of importance.
• None. • They are prompt in delivering service. • Communication. • Promptness – get any emergencies dealt with quickly. • Friendly – always positive but also strict enough. • Regular newsletters. • Statements are correct every month. • Willing to help. • We don’t have to work on Sundays because we are still a small centre. • The maintenance of the centre. Bathrooms, general surroundings. • Security friendly and alert. • Promotions are well organised. • If there is a problem with maintenance, the assistance is very good.

319
3. What are the most negative features (if any) of your centre management’s service to you? Please list in sequence of importance.
• The promotional fees that each tenant has to pay and your shop is not being promoted, only
the centre as a whole. • The response time of security. • Poor maintenance when required. • Security ineffective. • Cannot always get hold of management on the telephone. • Would like management to be on site (in centre) at all times. • Too little promotions. • No fashion shows. • Maintenance of buildings. • Unwillingness to negotiate. • No rental reduction for long time tenants. • General inconsistency in treatment of tenants. • Are not informed about any happenings. • High rent. • Boerewords rolls: the smoke of the braai entering the centre.
4. What is your general perception of the overall service quality you receive from the
shopping centre management?
• We have a centre manager that may not take any decisions by himself. He must always go to “higher” people, so what is the use of centre management?
• Maintenance good. • Clean bathrooms. • Not good. • Average. • Too many different managers and too few people to assist. • Lack of quick response. • Good service quality. • Poor. There is none, no imagination at all! • Some individual of management make the effort, but it is not the norm. • Always willing to help. • The maintenance of the bathrooms are very good. •
5. What is the main reason why you stay in this shopping centre?
• Business is doing very well. • Neat environment – appealing. • Safe centre and area. • We will stay only until the lease contract expires. • We have a long-term lease agreement. • We built a regular customer base. • Shopping centre is easy to access, especially for our older customers. • Our business is known and we have regular clients. • Relocate cost expensive.

320
• Have been here for 15 years. • Brewers BBQ is a “landmark” in the Moot. • Relocation will cost more than staying and paying. • Rent is reasonable. • Management will try and help where possible. • Safe shopping centre. • We have enough clients. • There are more feet in a shopping centre than elsewhere. • The atmosphere in the centre is pleasing. • The variety of shops in the centre.
ZAMBEZI MALL Owned by Sharemax and managed by Capicol
(12 respondents) 1. Comment on the reason(s) why you have selected this particular shopping centre to lease
a premise for your business.
• New development with lots of potential. • No competition in close proximity. • Situated in a good area. • Good anchor tenant. • Business was already established for 3 years when I bought from previous owner. • Close to the highway. • Practical. • Thought it was a good investment. • New centre in the Dinokeng tourist area. • Was a good idea at the time. • Space of the centre. • Movies.
2. What are the most positive features (if any) of your centre management’s service to you?
Please list in sequence of importance.
• More than adequate parking. • Keeps the centre clean. • Nice features. • Not much. • No positives so far. • None.
3. What are the most negative features (if any) of your centre management’s service to you?
Please list in sequence of importance.
• Too many empty shops. • Not enough marketing. • Turnover of management.

321
• The centre’s management has changed 3 times in 3 years because of financial problems of the landlords.
• We can’t complain about the services because the services are non-existing!! • Security. • Toilets. • Management. •
4. What is your general perception of the overall service quality you receive from the
shopping centre management?
• Management is very distant – only concern about rent payments. • All right. • They don’t stay long enough to actually rate them. • No service. • Service is poor, no quality! • Not very helpful. • Poor. • Average. • Bad. • What management and service?
5. What is the main reason why you stay in this shopping centre?
• Established the business since 2007. • So that everyone can get used to where I am. • Can’t afford to close down the business – invested too much already. • Because we have a contract that is binding us. • My regular customers know my location. • Moving out.
Silver Oaks Crossing Owned by CB Richard Ellis Network and managed by Broll
(10 respondents)
1. Comment on the reason(s) why you have selected this particular shopping centre to lease
a premise for your business.
• Big centre. • Clean and neat. • Bought business over. • Leasing not too expensive. • High income area. • Next to a busy road. • Beautiful centre. • New centre at the time. • Situated in a good area.

322
• Busy centre.
2. What are the most positive features (if any) of your centre management’s service to you? Please list in sequence of importance.
• Are in contact with owners. • Impressive centre. • The restaurants let a lot of people come through the centre. • Big signage. • None.
3. What are the most negative features (if any) of your centre management’s service to you?
Please list in sequence of importance.
• Marketing • Security. • The top part of the centre is dead. • Needs more advertising. • Needs more car guards and better security. • Leasing fee is high. • Shop owners have to fix everything by themselves. • Fines to be paid if shop is not open during hours.
4. What is your general perception of the overall service quality you receive from the
shopping centre management?
• Good. • Very good. • Poor.
5. What is the main reason why you stay in this shopping centre?
• Business is well-known here. • Business is settled. • Just moved to another location in the centre; so I will see what is going to happen to
business. • Impressive centre. • A lot of possibilities. • Business is doing well. • Busy centre.
WEST END LIFE STYLE CENTRE
Owned by Photla Group and managed by Metroprop (10 respondents)
1. Comment on the reason(s) why you have selected this particular shopping centre to lease
a premise for your business.
• In the beginning it looked like a promising centre.

323
• It was a new centre with a lot of possibilities. • New developed centre in a good area. • Next to a busy road. • Spacious centre. • It is especially designed for businesses related to furniture needs.
2. What are the most positive features (if any) of your centre management’s service to you?
Please list in sequence of importance. • Centre is clean. • Clean and neat centre. • Big signage. • Modern centre. • Big centre. • None.
3. What are the most negative features (if any) of your centre management’s service to you?
Please list in sequence of importance.
• Not nearly enough marketing. • Management. • Where is management??? • Poor security. • No marketing. • No management! • No proper security during night time. • You never get hold of management. • Very slow when it comes to respond to problems. • A lack of interest in the needs of tenants. • A lack of organisation on the promotion of the centre. • No anchor tenant to draw feet. • No visible signs in Zambezi Road to promote centre. • Centre is dead! No feet!
4. What is your general perception of the overall service quality you receive from the
shopping centre management?
• Ok. • Poor. • Bad. • There is no management. • Very poor service quality. • No comment.
5. What is the main reason why you stay in this shopping centre?
• Too expensive to relocate. • Leasing contract.

324
• Business is growing with centre. • Giving it time to see if feet will increase. • Have spent a lot of money on the shop. • Looking for better option to move to.
WONDERPARK SHOPPING CENTRE Owned by Emira Property Fund and managed by Eris Property Group
(8 respondents) 1. Comment on the reason(s) why you have selected this particular shopping centre to lease
a premise for your business. • Area has a lot of growth potential. • Many people come to this shopping mall. • It is situated in a growing market. • The area consists of 80 % young black (35-) with large amounts of expendable cash. • Direct competition is not threatening. • Beside a busy road. • The size of the premise is just right. • Leasing fee is reasonable.
2. What are the most positive features (if any) of your centre management’s service to you?
Please list in sequence of importance. • Pleasant parking areas with shades for tenants (shaded parking). • Large number of parking spaces. • Neat. • Security. • They always respond eagerly to our concerns. • They are willing to negotiate on rent.
3. What are the most negative features (if any) of your centre management’s service to you?
Please list in sequence of importance.
• Rental statements late. • Incorrect meter reading for electricity. • General cleaning of centre and toilets no of best standards for regional centre. • No sidewalks to centre for customers on rear and side of mall. Customers have to walk in the
road. • Old fashioned interior. • No centre maps for store layouts/locations. • They don’t always have the required expertise to handle all issues. • I feel that marketing of the centre is not handled well enough.
4. What is your general perception of the overall service quality you receive from the
shopping centre management?
• A lot of effort seems to be given to secure mall.

325
• It is very good. • It’s fine. • Average. • Good.
5. What is the main reason why you stay in this shopping centre?
• Area still has potential. • Reasonable leasing fees. • Our businesses are growing and doing well. • Business is doing well and we are able to make a profit.
GLEN VILLAGE NORTH/SOUTH Owned and managed by Greek Consortium
(40 respondents) 1. Comment on the reason(s) why you have selected this particular shopping centre to lease
a premise for your business. • Because of all the development nearby. • Up-market area. • Centre is clean. • Good area. • We are the only shop of our kind in the area. • Busy centre. • A spacious premise was available. • Lot of businesses around area. • Centre is well-known in area. • Next to a very busy road. • Centre looks good from the road. • Was a good investment because of the area. • Lot of shops in the centre. • Only Thai food restaurant. • Up-market shops. • A very nice centre. • Stay in area. • Centre with possibilities. • Centre with a lot of young people.
2. What are the most positive features (if any) of your centre management’s service to you?
Please list in sequence of importance.
• Nothing. • Clean and neat centre. • Good security. • None. • Signage. • Billboards.

326
• No hawkers. • No comment. • The parking. • Clean toilets. • Was not this expensive for lease earlier. • The finishing touches. • The bricks the building was build with. • There is no service.
3. What are the most negative features (if any) of your centre management’s service to you?
Please list in sequence of importance.
• Management as a whole. • We are treated like children. • No effort from management’s side. • Penalties to be paid. • Sign boards not good at all. • No management. • What service?? • Air conditioners please! • Communication. • Attitude of centre management. • The fact that tenants are treated like kids. • Correspondence. • Maintenance. • Having to do our own maintenance. • The signing in and out at security. • Don’t want to listen to shop owners’ problems. • Manager is a very rude person. • Needs upgrade on air conditioner. • No in touch with shop owners. • They don’t want to upgrade the centre. • Management think shop owners are children to let them pay for penalties. • Sometimes the centre is dirty. • Leasing fees. • Management does not do what they promise. • Management does nothing from their side for anything. • No marketing. • Management is up to shit! • Management – there is none – only when you have to pay. • No promotions. • The broken signage. • No proper management. • Stingy and money hungry Greeks. • Toilets. • Lighting at night. • Pay, pay for no service.

327
4. What is your general perception of the overall service quality you receive from the shopping centre management?
• Poor. • Bad. • Stinking attitude towards shop owners. • Management does not worry about tenants, only about our money. • Not very good. • No comment. • Little to no service. • Ask nothing, expect nothing. • Not much to say. • Can be much better. • Not good. • Management treating owners like children. • 0. • Not good at all. • Okay. • There is no service. • Very poor. • Fail to deliver service. • Management can’t manage their own centre.
5. What is the main reason why you stay in this shopping centre?
• Still a lot of development around. • I’m well established in the centre. • No hawkers. • Only shop of our service in centre. • Busy centre. • Business is well-known in area. • In a good area. • Looking for a new space. • Variety of shops. • Business is doing well. • Love the people in the centre that do business. • No competition in centre. • Too expensive to move. • Good security.
WONDERBOOM JUNCTION Owned by Pivitol and managed by Abreal
(4 respondents) 1. Comment on the reason(s) why you have selected this particular shopping centre to lease
a premise for your business.
• Well situated.

328
2. What are the most positive features (if any) of your centre management’s service to you? Please list in sequence of importance. • Always willing to help. • Always very friendly. • Everything is always neat and tidy.
3. What are the most negative features (if any) of your centre management’s service to you?
Please list in sequence of importance.
• I think they can do more to promote the centre to get more feet. • They cannot always assist you or answer your questions.
4. What is your general perception of the overall service quality you receive from the
shopping centre management?
• Good. • They can have more empathy with small businesses.
5. What is the main reason why you stay in this shopping centre?
• Busy centre. • Our target market is here. • We are already a well established business and will lose clients if we move.
QUAGGA CENTRE Owned by Emira Property Fund and managed by Eris Property Group
(7 respondents)
1. Comment on the reason(s) why you have selected this particular shopping centre to lease a premise for your business. • Feet count is good. • Location is good. • Biggest shopping centre in Pretoria West. • There was not a pharmacy in the centre when I started. • It is a short distance to travel from home. • The location of the shop was perfect at that time. • The shop was available during that period. • We purchased a running business. • Great diversity of customers. • Management is flexible and are hosting events and promotions without discrimination.
2. What are the most positive features (if any) of your centre management’s service to you?
Please list in sequence of importance. • They are quick with service delivery. • Communication very good.

329
• Manager is always helpful. • Quick response to requests. • Communication. • Overall service. • Friendliness. • Can think of nothing. • Security and safety is generally good in our shopping centre. • Shopping centre is always clean. • Do not allow hawkers and vendors onto the shopping premises. • Informing tenants on everything that is happening and what is going to happen. • Hosting some events that bring in more feet in the centre.
3. What are the most negative features (if any) of your centre management’s service to you?
Please list in sequence of importance.
• None. • They do not assist tenants with regard to lease, problems, etc. • Poor communication. • The voice of small tenants does not count. Only big shops like Pick-’n-Pay are listened
to. • Do not allow you to expand, eg. incorporate new products into your business. • Demand that stores have to revamp every three to four years – too expensive.
4. What is your general perception of the overall service quality you receive from the
shopping centre management?
• Very good. • Good. • I don’t have any problems with centre management. • Poor service. • It is ok.
5. What is the main reason why you stay in this shopping centre?
• Good vibe and pleasure to work in this centre. • Busy centre. • Business is doing well. • Banks at the centre. • 16 years of established client base. • Other centres’ leasing fees are just as much. • Security and safety of tenants and customers are looked at. • Burglaries and shop lifting is far less than with the outside shops. • It is close to home. • Management makes us feel like a family.

330
DOORNPARK SHOPPING CENTRE Owned and managed by First Land Development Limited
(14 respondents)
1. Comment on the reason(s) why you have selected this particular shopping centre to lease a premise for your business.
• Only laundry shop in area. • Near home. • Small but busy centre. • It was the only shopping centre in the area at the time. • Leasing fee reasonable. • We have a prime spot in the centre.
2. What are the most positive features (if any) of your centre management’s service to you?
Please list in sequence of importance. • None. • Friendly • Punctual. • Can contact and talk to the owner himself.
3. What are the most negative features (if any) of your centre management’s service to you?
Please list in sequence of importance.
• No comment. • A lot of drunks in evening. • Very bad security. • Not enough parking for tenants. • They always say that everything is not their problem. • The lights, the air conditioner, the geyser, the electricity, the plumbing, EVERYTHING! • We have to fix everything ourselves. • No marketing. • The centre is untidy and a lot of hawkers and drunks. • No proper toilets. • No air conditioner. • Expensive leasing fees. • Centre needs to be revamped.
4. What is your general perception of the overall service quality you receive from the
shopping centre management?
• Good. • Bad. • Pathetic and greedy. • Poor. • There is no service. They always say they will get back to you but they never do. • 50/50. • Very bad.

331
5. What is the main reason why you stay in this shopping centre?
• Still happy here. • Everyone knows my shop. • Leasing fee is reasonable. • Well-known to locals. • The lease agreement expires only 2013. • For such a small centre, it is busy. • Well established centre but there is room for improvement. • It is the only centre in Doorpoort. • Looking for better option.
MAYVILLE SHOPPING CENTRE Owned by Government Pension Fund and managed by Shoprite Properties
(26 respondents) 1. Comment on the reason(s) why you have selected this particular shopping centre to
lease a premise for your business.
• Bought an existing shop. • Busy centre. • It is central. • Reasonable rent. • It was a new centre at time. • It was the only big centre in area at time. • Well established centre. • Only shop of its kind at time. • Close to home. • It is next to busy road. • Lease not to high.
2. What are the most positive features (if any) of your centre management’s service to you?
Please list in sequence of importance. • Car guards always friendly. • Helpful. • Friendly. • Effective. • None. • Parking. • Neat and clean centre. • Provide a strong brand as anchor tenant. • Management don’t worry about tenants. • Décor. • They do respond to e-mails. • No comment – I seldom see them.

332
3. What are the most negative features (if any) of your centre management’s service to you? Please list in sequence of importance. • Advertising. • Can revamp the centre. • Poor security. • Marketing. • Overall management – don’t care attitude. • Maintenance need to be done more often. • Management must take some responsibility. • Dirty toilets. Cleaning staff clean only one a day. • Mall needs an upgrade urgently. • Management is not interested in problems or solving it. • Shop owners have to do all upgrading themselves. • Air conditioning. • Do not care about the smaller tenant. • Do not hesitate to put direct competition into centre. • Do not bother to upgrade centre in order to compete with newer centres in area. • Could be more flexible with leasing fee during bad economic times. • Do not give attention to ANY problems tenants might have!! • There is no service. • Leasing fees are high. • They are taking too long to solve a problem. • Monthly fees differ a lot each month – sometime differs up to R2 000. • No comment – I seldom see them.
4. What is your general perception of the overall service quality you receive from the
shopping centre management?
• Average. • They definitely have to learn to speak properly. You cannot hear what they are saying. • Poor. • Very poor. • 50 %. • Average – no – poor!! • Bad. • It is good but there is room for improvement. • Lack of interest in tenant problems. • BAD, BAD, BAD. • Average – they have a lot of rules, which is understandable but frustrating at times, eg.
“nothing to be advertised in the window”. • They are only interested in what is good for them.
5. What is the main reason why you stay in this shopping centre?
• Business is doing well. • Biggest centre in area. • Busy centre. • Lots of feet.

333
• Good relationship with other tenants. • Close to home. • Business is established and well-known. • Too expensive to re-locate. • We have regular clients. • The location is good for this kind of practice. • I’m moving out at the end of February because of management! • Still bound by leasing contract. • It is difficult to re-locate a liquor store.
CENTURION MALL Owned by Fountain Head Property Trust and managed by Broll
(47 respondents)
1. Comment on the reason(s) why you have selected this particular shopping centre to lease a premise for your business. • Development at the time was good. • Only shop of this kind in centre. • Good location. • Well-known centre. • It is a regional mall and attracts more feet than a small centre. • It has an open air area, suiting our product. • It is a popular centre. • Foot count (which is proven by the increase in turnover for the past months). • Location – it is situated in the middle of the centurion target market. • Large centre. • Situated in a high income group area. • Visible centre. • Centre had a lot of possibilities. • Bought existing business. • It’s a regional mall - over 30 years in existence. • Centre management contacted us, was we are leasing in other centres managed by them. • We were promised 1,2 million feet per month. • It is a great shopping centre. • This was the closest shopping centre from where I stay. • Convenience to clients.
2. What are the most positive features (if any) of your centre management’s service to you?
Please list in sequence of importance. • Corridors are open. • Lot of restaurants. • A lot of extra activities. • Efficiency. • Friendliness. • Availability. • They show interest by sharing marketing ideas with the tenants. • One-to-one consultation with the marketing manager.

334
• Friendly security. • Neat and clean centre. • Parking. • None. • Marketing. • The security guards do their jobs very well and are always friendly. • Indications of where shops are. • They respond quickly to maintenance problems. • Looks good on the outside. • No empty shops. • Extra activities in the centre. • They are open to dialogue.
3. What are the most negative features (if any) of your centre management’s service to you?
Please list in sequence of importance.
• Working hours. • Management – there is none. • High parking fees. • No maintenance. • No visible security. • The lake is dirty and stinking. • Discrimination to younger tenants and young business owners. • They won’t assist with a query that is not part of their job description – as a result, certain
things don’t get done. • They require payment for marketing the store in the mall – posters, outside kiosks. • Management is just never available. • Security and car guards are useless. • Toilets need an upgrade. • Not enough marketing. • Fix everything ourselves. • Excessive high parking rates and poor security. • All seems nice till you become a tenant. • Bathrooms are pathetic. • If there is a problem they do not communicate immediately with the right people. • The toilets are disgusting. • Don’t care attitude from management. • High leasing fees. • Lack of communication. • The parking manager is not friendly at all! • When here is an emergency, they don’t phone the shop managers/owners. • Very long shopping hours – every day of the week and public holidays. • Don’t care attitude. • Our small business tenants pay unfairly high leases. • Management deceived us by numbers to get us to sign contracts. • They lied about other shop’s turnovers to get us here. • Enforcing ridiculous trading hours. • Unrealistic expectations – decisions poorly thought through.

335
4. What is your general perception of the overall service quality you receive from the shopping centre management?
• Average. • Poor, poor, poor! • Good. • Bad. • Poor. • Well managed, but never going the extra mile. • Efficient, but more staff could help solve problems quicker. • Management takes notice in everything that happens at the mall. • Newsletters to keep us updated in everything that happens in the mall. • I would give them 7 out of 10. • No comment. • 50 – 50. • They are not too keen to assist – only the security department is willing to. • Neutral. • No comment. • Very, very bad. • Ok. • 3 out of 10. • Management only wants to collect money but don’t care about the tenants. • Security manager is rude. • Less than average. • Not too much. • Very professional, but don’t care about small tenants. • No capable management. • Re-active rather than pro-active.
5. What is the main reason why you stay in this shopping centre?
• Leasing contract. • Shop is settled and well known. • Too expensive to move. • Foot count and store location. • Convenient area, close to home. • Increase in turnover for the past few months. • Competition is limited. • Business is doing well. • Open centre. • Good area. • Relatively clean and neat centre. • Shop is located in a good part of the centre. • Invested a lot in the shop. • Large clientele base. • I am selling my shop – jippy. • I have a water tight contract – unfortunately. • Invest a lot in shop.

336
• It is centrally located. • Spacious shop. • Customer’s convenience.
MADELIEF SHOPPING CENTRE Owned and managed by Moolman Group
(8 respondents)
1. Comment on the reason(s) why you have selected this particular shopping centre to
lease a premise for your business.
• The economy was good and I thought that I could make a living. • Close to my home and child’s school. • The shop was in the market at a good price and it had a good turnover and had already built
up a good customer base. • After 15 years, a good question! • Many clients visiting. • No shop like ours at moment in the centre. • Rent is not that high. • Area is good for the product I am selling.
2. What are the most positive features (if any) of your centre management’s service to you?
Please list in sequence of importance. • The security – the centre is small and has 24 hour security.
3. What are the most negative features (if any) of your centre management’s service to you?
Please list in sequence of importance.
• The person that can make decisions on the rent is never available. • The building owners do not care, as long as they receive their money. • They do not care to pop in to just say hello. • Do not do enough advertising.
4. What is your general perception of the overall service quality you receive from the
shopping centre management?
• The total service and support do not exist. • You never see them, they only care for the money they make. • Management is always willing to help when there are any problems or queries. • Average. • Quality is good.
5. What is the main reason why you stay in this shopping centre?
• It is convenient for me.

337
• It is situated in a good and fairly busy area and there is not many other shopping centres close by with the same shops as this one.
• After 15 years the area’s people know us very well! • It is close to our home. • Potential customers in the vicinity. • Tenants are friendly and helpful. • Business is doing well.
LYNNWOOD BRIDGE Owned by Atterbury Property Holdings (Pty) Ltd and managed by Broll
(11 respondents)
1. Comment on the reason(s) why you have selected this particular shopping centre to lease a premise for your business.
• We were in need to expand our business. • Well established neighbourhood. • We are a famous brand franchisee and they assisted with the negotiations. • Centrally located and a good mix of offices and leisure. • Because of the restaurants and our surroundings, we thought it would be a good location. • Higher income group as feeding area to centre. • Well designed and visually appealing. • Convenient access to highway and located on busy road. • A few residential areas around centre. • The theatre. • Potential buying power in area. • Feet count is good. • New, upper-class, modern centre. • It is a nice centre (prime shopping centre).
2. What are the most positive features (if any) of your centre management’s service to you?
Please list in sequence of importance. • Response to faulty equipment covered by the centre management. • Constant involvement at centre and of great assistance when needed. • Security is good and up to standard. • Immediate response to our problems, i.e air conditioning breaking, flooding, etc. • Proper communication. • Good marketing. • Willingness to help and resolve any issues that may arise. • Also involve small tenants in promotions.
3. What are the most negative features (if any) of your centre management’s service to you?
Please list in sequence of importance.
• Marketing. • Our maintenance service is slow. • Slow response to our problems.
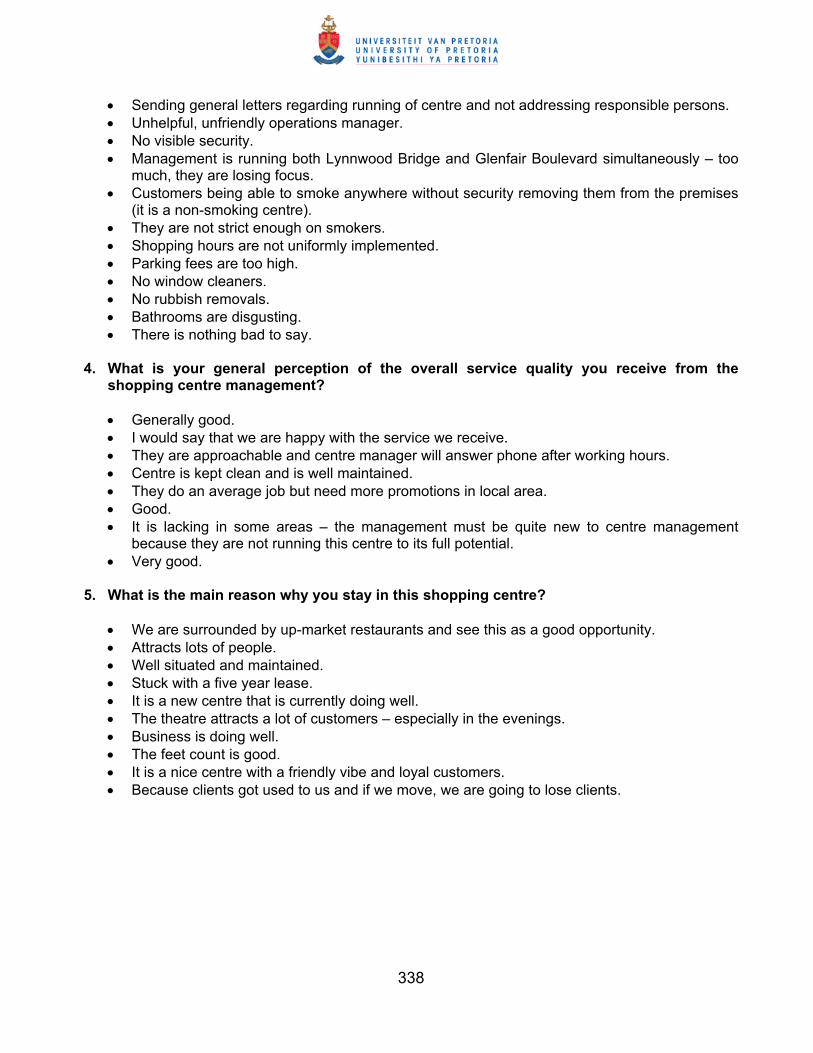
338
• Sending general letters regarding running of centre and not addressing responsible persons. • Unhelpful, unfriendly operations manager. • No visible security. • Management is running both Lynnwood Bridge and Glenfair Boulevard simultaneously – too
much, they are losing focus. • Customers being able to smoke anywhere without security removing them from the premises
(it is a non-smoking centre). • They are not strict enough on smokers. • Shopping hours are not uniformly implemented. • Parking fees are too high. • No window cleaners. • No rubbish removals. • Bathrooms are disgusting. • There is nothing bad to say.
4. What is your general perception of the overall service quality you receive from the
shopping centre management?
• Generally good. • I would say that we are happy with the service we receive. • They are approachable and centre manager will answer phone after working hours. • Centre is kept clean and is well maintained. • They do an average job but need more promotions in local area. • Good. • It is lacking in some areas – the management must be quite new to centre management
because they are not running this centre to its full potential. • Very good.
5. What is the main reason why you stay in this shopping centre?
• We are surrounded by up-market restaurants and see this as a good opportunity. • Attracts lots of people. • Well situated and maintained. • Stuck with a five year lease. • It is a new centre that is currently doing well. • The theatre attracts a lot of customers – especially in the evenings. • Business is doing well. • The feet count is good. • It is a nice centre with a friendly vibe and loyal customers. • Because clients got used to us and if we move, we are going to lose clients.

339
GLENFAIR BOULEVARD Owned by Atterbury Property Holdings (Pty) Ltd and managed by Broll
(8 respondents)
1. Comment on the reason(s) why you have selected this particular shopping centre to lease a premise for your business.
• Location. • Easy access. • Good area. • Good clientele in area. • Good and popular area. • Close to home. • Have been here for a long time. • I had a bad experience with another landlord and centre. • I know the architect – he promoted the centre to me. • Shop was available in this centre to buy and I have developed it further. • The leasing fee was fair at the time.
2. What are the most positive features (if any) of your centre management’s service to you?
Please list in sequence of importance. • Helpful. • Friendly. • Always listens when request to do something. • Manager has lot of empathy with small tenants. • Management looks well after us and care about us. • Good service from all the staff of the centre management, but NO service from the landlord. • None.
3. What are the most negative features (if any) of your centre management’s service to you?
Please list in sequence of importance.
• The maintenance manger does not have very good interpersonal skills and do not always understands our specific needs.
• Rent too high. • Hours impossible. • Keeping the centre clean and everything in working condition, eg. lift has been out of order for
2 months. • The floors are very slippery. • If you get injured, they do not even contact you. • Bathrooms not up to standard. • You as a tenant (especially small tenant) means nothing to them!!
4. What is your general perception of the overall service quality you receive from the
shopping centre management?
• Helpful and friendly. • Good.

340
• Not good. • You never see them. • Takes forever to answer e-mails. • Management: good; landlord: fair.
5. What is the main reason why you stay in this shopping centre?
• Established area. • Established client base. • Location – close to highways. • Business is doing well. • Satisfied with management. • Nowhere else to go – almost near pension age. • Lease only expires next year – not staying after that. • I am satisfied – business is doing better than in other centre. • Centre manager care more and communicates frequently. • Built up excellent clientele.
MONTANA CORNER Owned and managed by Chris and Charmain
(8 respondents)
1. Comment on the reason(s) why you have selected this particular shopping centre to lease a premise for your business.
• Busy centre. • Business was available to buy in centre. • The only shop of its kind at the time. • Good area.
2. What are the most positive features (if any) of your centre management’s service to you?
Please list in sequence of importance. • Management is friendly. • Marketing is done well and information send out in time. • Difficult customers and fights in public are dealt with in good manner. • The landlords are very polite. • The leasing fees are not too high. • None.
3. What are the most negative features (if any) of your centre management’s service to you?
Please list in sequence of importance.
• Security. • Dirty toilets. • Not enough marketing. • Security sleeps on the job – my car was stolen in parking lot and nobody saw anything. • Parking

341
• Dirty centre. • A lot of hawkers. • The look of the centre looks washed out. • Signage boards look terrible. • Centre is very dirty and need an urgent revamp. • Security must be chased away – A.S.A.P.! • Security is bad. They steal just as much as the crooks.
4. What is your general perception of the overall service quality you receive from the
shopping centre management?
• Average. • Well informed and effective. • Poor. • Actually good – management is going to start revamping. • Ok.
5. What is the main reason why you stay in this shopping centre?
• My business is established. • My business is doing well. • Good feet count at centre. • Our business is located well in centre. • With the hope that maintenance is done soon! • The shop is getting busier each day.
MALL AT REDS Owned by Anastasi Group Property Portfolio and managed by Anaprop
(21 respondents)
1. Comment on the reason(s) why you have selected this particular shopping centre to lease a premise for your business.
• Big centre. • Neat and clean. • Good location. • Biggest centre in area. • New and big centre. • A centre with a lot of possibilities. • Spacious centre. • Near where I stay. • Shop was available to buy in the centre. • Centre with a lot of shops. • The leasing fees not too bad.

342
2. What are the most positive features (if any) of your centre management’s service to you? Please list in sequence of importance. • Looks appealing on the outside. • Clean and neat centre. • Lot of different shops. • No empty shops. • Activities for children and movies. • Variety of shops.
3. What are the most negative features (if any) of your centre management’s service to you?
Please list in sequence of importance.
• Marketing. • Security is poor. • Toilets can be dirty sometimes. • Car guards. • Even though their offices are on the premise, they are always too busy to help. • Management can organise some extra events. • More marketing is done for bigger businesses than for smaller ones.
4. What is your general perception of the overall service quality you receive from the
shopping centre management?
• Ok. • Average. • Good. • Neutral.
5. What is the main reason why you stay in this shopping centre?
• Business is doing well. • Management is not too bad. • My shop is established. • It is a busy mall. • Extra activities that is organised. • Shop is well known. • It is a family centre with a variety of shops.

343

344
APPENDIX D - DETAILS OF RELIABILITY ANALYSIS -
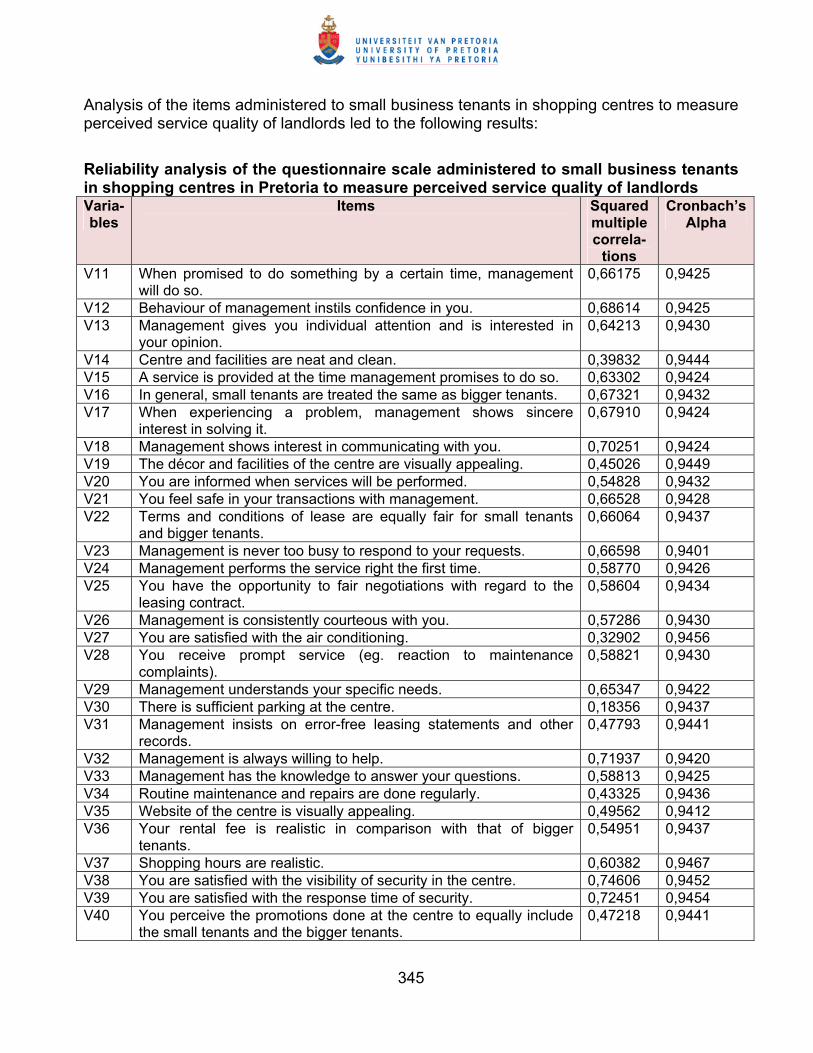
345
Analysis of the items administered to small business tenants in shopping centres to measure perceived service quality of landlords led to the following results:
Reliability analysis of the questionnaire scale administered to small business tenants in shopping centres in Pretoria to measure perceived service quality of landlords Varia-bles
Items Squared multiple correla-
tions
Cronbach’s Alpha
V11 When promised to do something by a certain time, management will do so.
0,66175 0,9425
V12 Behaviour of management instils confidence in you. 0,68614 0,9425 V13 Management gives you individual attention and is interested in
your opinion. 0,64213 0,9430
V14 Centre and facilities are neat and clean. 0,39832 0,9444 V15 A service is provided at the time management promises to do so. 0,63302 0,9424 V16 In general, small tenants are treated the same as bigger tenants. 0,67321 0,9432 V17 When experiencing a problem, management shows sincere
interest in solving it. 0,67910 0,9424
V18 Management shows interest in communicating with you. 0,70251 0,9424 V19 The décor and facilities of the centre are visually appealing. 0,45026 0,9449 V20 You are informed when services will be performed. 0,54828 0,9432 V21 You feel safe in your transactions with management. 0,66528 0,9428 V22 Terms and conditions of lease are equally fair for small tenants
and bigger tenants. 0,66064 0,9437
V23 Management is never too busy to respond to your requests. 0,66598 0,9401 V24 Management performs the service right the first time. 0,58770 0,9426 V25 You have the opportunity to fair negotiations with regard to the
leasing contract. 0,58604 0,9434
V26 Management is consistently courteous with you. 0,57286 0,9430 V27 You are satisfied with the air conditioning. 0,32902 0,9456 V28 You receive prompt service (eg. reaction to maintenance
complaints). 0,58821 0,9430
V29 Management understands your specific needs. 0,65347 0,9422 V30 There is sufficient parking at the centre. 0,18356 0,9437 V31 Management insists on error-free leasing statements and other
records. 0,47793 0,9441
V32 Management is always willing to help. 0,71937 0,9420 V33 Management has the knowledge to answer your questions. 0,58813 0,9425 V34 Routine maintenance and repairs are done regularly. 0,43325 0,9436 V35 Website of the centre is visually appealing. 0,49562 0,9412 V36 Your rental fee is realistic in comparison with that of bigger
tenants. 0,54951 0,9437
V37 Shopping hours are realistic. 0,60382 0,9467 V38 You are satisfied with the visibility of security in the centre. 0,74606 0,9452 V39 You are satisfied with the response time of security. 0,72451 0,9454 V40 You perceive the promotions done at the centre to equally include
the small tenants and the bigger tenants. 0,47218 0,9441

346
Varia-bles
Items Squared multiple correla-
tions
Cronbach’s Alpha
V41 Brochures/pamphlets of the centre are visually appealing. 0,6344 0,9437 V42 Shopping hours are convenient. 0,54276 0,9463 V43 You are satisfied with the marketing of the centre. 0,71700 0,9435 V44 You are satisfied with the number of daily visitors to the centre. 0,49880 0,9454 V45 The marketing fund of the centre is applied and managed
effectively. 0,68895 0,9442
V47 You get value for your leasing fee. 0,52200 0,9441 Number of cases = 457, number of items = 36, Standardised Alpha = 0,9453 Item 36 (variable 46) was excluded from the scale
Copyright © 2022 FDOKUMEN