Investigating Relationship between Personality Traits and ...
Upload
khangminh22Category
view
0download
0
THE RELATIONSHIP BETWEEN LEADERSHIP
BEHAVIOUR, ENTREPRENEURIAL ORIENTATION
AND ORGANISATIONAL PERFORMANCE IN
MALAYSIAN SMALL AND MEDIUM ENTERPRISES
Ahmad Fadhly Arham
School of Management
RMIT University
February 2014
A thesis submitted in fulfilment of the requirements for the degree of Doctor of
Philosophy from the Royal Melbourne Institute of Technology University
ii
STATEMENT OF AUTHORSHIP
I certify that except where due acknowledgement has been made, the research is that
of the author alone; the research has not been submitted previously, in whole or in
part, to qualify for any other academic award; the content of the thesis is the result of
research which has been carried out since the official commencement date of the
approved research program; and any editorial work, paid or unpaid, carried out by a
third party is acknowledged.
Ahmad Fadhly Arham
February 2014

iii
DEDICATION
This dissertation is dedicated to
my dear wife, my precious son
and my beloved parents.

iv
ACKNOWLEDGEMENTS
In the name of ALLAH s.w.t., the most gracious and the most merciful. All praise to
Him for the strengths and blessings that He has given me to complete this thesis.
I would like to thank all of those who have contributed and played a role in
supporting my journey to complete this thesis. My deepest appreciation and thanks
go to my supervisors, Dr Nuttawuth Muenjohn and Associate Professor Carlene
Boucher, for their invaluable and never-ending support, advice, guidance and
encouragement through this dissertation process. Both of you have contributed
immeasurably to my successful, challenging and enjoyable journey. Your superior
knowledge and experience has challenged me to refine my direction and ideas and
you will always be my inspiration. It has been a true pleasure to know you and have
the opportunity to work with you over the past few years.
Most importantly, I would like to thank my wife, Norhayati Sulaiman, for all her love
and support during this process. You were always there in every step of this journey.
Your intelligence, patience, wisdom and support are invaluable and I could not have
finished this thesis without your encouragement. I am so much in debt to you for all
the time I selfishly devoted to my study. I will forever appreciate the sacrifices that
you have made for me to complete this journey. Over the course of my study, we
travelled thousands of miles and got our first son, Muhamad Fyras Nawfal. Having
him and being married to you are the most wonderful things that have ever happened

v
in my life. Both of you are my emotional strengths in pursuing and completing this
remarkable journey. I love you both so much.
To my parents, Haji Arham Haji Nordin and Hajah Aisah Md Nor, I am forever
grateful for your continuous prayers and words of encouragement. You made me
who I am today and I cannot thank you enough for your unconditional love and
continuous support. There is not a day that passes when I do not think of both of you.
My brothers and their wives, my nieces and nephew also deserve sincere thanks for
their support and the joy they bring into my life. Also, to my in-laws, thank you for
your prayer and support.
Last but not least, I would like to thank the Ministry of Education, Malaysia, and
Universiti Teknologi MARA (UiTM), Malaysia, for the scholarship that has allowed
me to pursue my study at RMIT University, Melbourne. I also would like to extent
my gratitude to the academic and administration staff at the School of Management,
RMIT University, for numerous types of assistance during the course of my study.
To my colleagues, thank you for the moments we shared together to make this
journey a wonderful experience.
Thank you all.

vi
ABSTRACT
Malaysia is heading towards having developed country status by 2020. To realise this
national agenda, the country needs to further strengthen its economic development,
growth and well-being. One of the important sources for economic growth is the
development of small and medium enterprises (SMEs). SMEs are acknowledged as a
source of employment, economic dynamism, competition and innovation. But their
contributions to the country’s economy are still comparatively low compared with
the contributions of SMEs in many developed and developing countries. This
indicates an opportunity for further growth and development and a call for a robust
study to further explore how the contributions of SMEs can be improved.
Research has shown that leadership and an entrepreneurial orientation are important
for organisational success. But the literature has indicated that leadership research in
small businesses, especially SMEs in Malaysia, is still lacking. Also, research in the
area of entrepreneurial orientation in Malaysia is still in its infant stage.
Thus, this thesis concentrates on the organisational performance of SMEs in
Malaysia from the perspective of the leadership behaviour of SME leaders and their
entrepreneurial orientation. To accomplish this, this thesis begins by reviewing the
literature in the areas of leadership, entrepreneurship and organisational performance.
To represent leadership behaviour, transformational and transactional leadership have
been chosen, as these types of leadership behaviour are considered the most recent
paradigms of leadership. Innovativeness, proactiveness and risk taking have been

vii
chosen to reflect entrepreneurial orientation. Growth and profitability are used as
measures for organisational performance.
To test hypotheses, data were collected from 395 Malaysian-owned SMEs operating
in the manufacturing and service industries. Exploratory factor analysis, confirmatory
factor analysis and structural equation modelling (SEM) using path analysis were
used to test three models and verify all hypotheses on the direct and indirect effects
of leadership behaviour and entrepreneurial orientation on organisational
performance. Nine interviews were also conducted to provide quantitative findings
and to further elucidate the results of this study.
This study demonstrates that leadership behaviour has a direct impact on
organisational performance, with transformational leadership having the stronger
impact of the two types of leadership behaviour investigated. The attributes of
inspirational motivation and contingent reward were found to be the most favourable
aspects of transformational and transactional leadership respectively, as perceived by
the respondents in this study. Also, entrepreneurial orientation was found to have a
direct impact on organisational performance and was a good mediator between
transformational leadership and organisational performance. These findings suggest
that besides practising transformational leadership, leaders need to focus on
developing their organisation’s entrepreneurial orientation. Transformational
leadership qualities exert a strong effect on entrepreneurial orientation and enhance
organisational performance. This study acknowledges leadership and entrepreneurial
orientation as important resources and capabilities in an organisation because the
viii
integration of these two elements can offer success for SMEs. Key implications of
this study are:
i. Of the two types of leadership behaviour, transformational leadership proved
to be a more efficient form of leadership behaviour than transactional
leadership. Thus, leaders of SMEs in Malaysia need to display, practise and
nurture the qualities of transformational leadership in order to achieve good
organisational performance.
ii. Entrepreneurial orientation (EO) is an important strategic orientation for
Malaysian SMEs. EO is also a mediator between leadership behaviour and the
outcomes produced by organisations. The factors of EO are compatible with
transformational and transactional leadership, being particularly effective for
transformational leadership.
iii. SME Corp. Malaysia, which is the governing body that oversees
entrepreneurial development in Malaysia, should provide more leadership
training and development programs for entrepreneurs. The training should
focus on developing and nurturing the transformational and transactional
leadership qualities of entrepreneurs. Also, continuing support and assistance
from the government and financial institutions would undoubtedly help these
enterprises to fully develop EO in their business practices.

ix
PUBLICATIONS, CONFERENCE PRESENTATIONS AND
AWARDS OF THE CANDIDATE RELATED TO THIS THESIS
Publications
Arham, AF, Muenjohn, N & Boucher, C 2012, 'Leadership, entrepreneurial
orientation and performance: The case of SMEs in Malaysia', in N Muenjohn
(ed.), Organisational Leadership: Concepts, cases and research, Cengage
Learning Australia, Melbourne, pp. 27-50.
Arham, AF & Sulaiman, N 2013, 'Leadership and risk-taking propensity among
entrepreneurs in Malaysia', Business and Management Quarterly Review, vol.
4, no. 1, pp. 31-9.
Arham, AF, Muenjohn, N & Boucher, C 2013, ‘Leadership and entrepreneurial
success: A study of SMEs in Malaysia’, World Journal of Social Sciences,
vol. 3. no. 5, pp. 117 – 130
Presentations
Arham, AF 2010, ‘The relationship between leadership behaviours, entrepreneurial
orientation and organisational performance’, Confirmation of Candidature, 9
September 2010, School of Management, RMIT University, Melbourne
Arham, AF, Muenjohn, N & Boucher, C 2011, 'The role of entrepreneurial
orientation in the leadership-organisational performance relationship: A
Malaysian SMEs perspective', paper presented to 24th Annual Small
Enterprise Association of Australia and New Zealand (SEAANZ)
Conference, Australian Technology Park, Sydney, 13-15 July 2011.
Arham, AF & Muenjohn, N 2012, 'Leadership and organisational performance in
Malaysian SMEs: The mediating role of entrepreneurial orientation', paper
presented to Business and Information 2012, Sapporo, 3-5 July 2012.
Arham, AF, Muenjohn, N & Boucher, 2012, ‘Does leadership matter? A case of
Malaysian SMEs’, paper presented to 19th International Business Research
Conference, Monash University, Melbourne, 19-21 November 2012.
Arham, AF, 2012, ‘Malaysian SMEs: The Impact of leadership and entrepreneurial
orientation’, paper presented to 19th International Business Research
Conference, Monash University, Melbourne, 19-21 November 2012.
Arham, AF 2013, ‘The relationships between leadership behaviours, entrepreneurial
orientation towards organisational performance of SMEs in Malaysia’,
Completion Seminar, 13 March 2013, School of Management, RMIT
University, Melbourne.

x
Arham, AF, Muenjohn, N & Boucher, 2014, ‘Leadership and organisational
performance: An investigating of SMEs in Malaysia’, paper presented to The
4th
Annual Conference of Economic Forum of Entrepreneurship &
International Business, Paris, 31 January 2014.
Best Student Presentation Award
‘The role of entrepreneurial orientation in the leadership-organisational performance
relationship: A Malaysian SMEs perspective’, paper presented to 24th Annual
Small Enterprise Association of Australia and New Zealand (SEAANZ)
Conference, Australian Technology Park, Sydney.
xi
CONTENTS
STATEMENT OF AUTHORSHIP .......................................................................... ii
DEDICATION ........................................................................................................ iii
ACKNOWLEDGEMENTS .................................................................................... iv
ABSTRACT ........................................................................................................... vii
PUBLICATIONS, CONFERENCE PRESENTATIONS AND AWARDS
OF THE CANDIDATE RELATED TO THIS THESIS ......................................... ix
CONTENTS ............................................................................................................ xi
LIST OF TABLES ................................................................................................ xvi
LIST OF FIGURES ............................................................................................... xix
LIST OF ABBREVIATIONS ............................................................................... xxi
DEFINITIONS OF KEY TERMS ...................................................................... xxiii
CHAPTER 1 INTRODUCTION ........................................................... 1
1.1 Introduction ....................................................................................................1
1.2 Background of Study ......................................................................................2
1.3 Problem Statement .........................................................................................6
1.4 Scope of Study ................................................................................................7
1.5 Research Objectives and Research Questions ................................................9
1.6 Justification of Study ......................................................................................9
1.7 Significance of Study ...................................................................................12
1.8 Structure of Thesis ........................................................................................14
1.9 Summary ......................................................................................................15
CHAPTER 2 LITERATURE REVIEW .............................................. 17
2.1 Introduction ..................................................................................................17
2.2 Leadership ....................................................................................................18
2.2.1 Definition of Leadership ................................................................................................. 18
2.2.2 Leadership Approaches ............................................................................................... 20
2.2.3 Transformational Leadership in Practice and Research .................................................. 35
2.2.4 Transformational Leadership and SMEs ......................................................................... 42
2.2.5 Multifactor Leadership Questionnaire (MLQ) ................................................................ 44
2.2.6 Recent Leadership Theories ............................................................................................ 48
2.3 Entrepreneurship and Entrepreneurial Orientation .......................................49

xii
2.3.1 Key Factors of Entrepreneurial Orientation .................................................................... 52
2.3.2 Research and Practices of Entrepreneurial Orientation ................................................... 55
2.4 Organisational Performance .........................................................................60
2.5 Leadership, Entrepreneurial Orientation and Organisational Performance .65
2.6 Summary ......................................................................................................75
CHAPTER 3 OVERVIEW OF SMALL AND MEDIUM
ENTERPRISES (SMEs) IN MALAYSIA .............................................. 77
3.1 Introduction ..................................................................................................77
3.2 Background of Malaysia ..............................................................................77
3.3 Malaysian SMEs ...........................................................................................80
3.3.1 Definition of SMEs in Malaysia ...................................................................................... 80
3.3.2 Development of SMEs in Malaysia ................................................................................. 80
3.3.3 Owners and Top Managers of SMEs ............................................................................... 85
3.4 Leadership Research and Practices in Malaysia ...........................................86
3.5 Entrepreneurial Orientation Research and Practices in Malaysia ................93
3.6 SMEs’ Performance .....................................................................................97
3.7 Summary ....................................................................................................100
CHAPTER 4 DEVELOPMENT OF THEORETICAL
FRAMEWORK ..................................................................................... 101
4.1 Introduction ................................................................................................101
4.2 Theoretical Foundation of Framework .......................................................101
4.2.1 Transformational Leadership Theory ............................................................................ 101
4.2.2 Resource-Based View ................................................................................................... 103
4.3 Research Framework ..................................................................................107
4.3.1 Definitions of Variables ................................................................................................ 108
4.4 Hypotheses Development ...........................................................................112
4.4.1 Leadership Behaviour and Organisational Performance ............................................... 112
4.4.2 Entrepreneurial Orientation and Organisational Performance ....................................... 120
4.4.3 Leadership Behaviour, Entrepreneurial Orientation and Organisational Performance . 127
4.5 Scope of the Research Framework .............................................................131
4.6 Summary ....................................................................................................132
CHAPTER 5 RESEARCH DESIGN AND JUSTIFICATION OF
RESEARCH METHODOLOGY .......................................................... 133
xiii
5.1 Introduction ................................................................................................133
5.2 Research Paradigm .....................................................................................133
5.3 Research Design .........................................................................................136
5.4 Justification of Research Design ................................................................142
5.5 Quantitative Data Collection ......................................................................144
5.5.1 Population...................................................................................................................... 144
5.5.2 Sampling........................................................................................................................ 146
5.5.3 Sampling Frame ............................................................................................................ 147
5.5.4 Sampling Technique ...................................................................................................... 147
5.5.5 Sample Size ................................................................................................................... 148
5.5.6 Recruitment Strategy ..................................................................................................... 149
5.5.7 Research Instrument ...................................................................................................... 150
5.5.8 Scaling of Measures ...................................................................................................... 155
5.5.9 Pre-testing and Pilot Testing ......................................................................................... 156
5.5.10 Data Analysis ............................................................................................................ 158
5.5.11 Evaluation for Goodness-of-fit ........................................................................................ 162
5.5.12 Construct Reliability and Average Variance Extracted ............................................ 167
5.5.13 Validity ..................................................................................................................... 167
5.6 Qualitative Data Collection ........................................................................169
5.6.1 Recruitment Strategy ..................................................................................................... 169
5.6.2 Interview Process .......................................................................................................... 170
5.6.3 Pilot Testing .................................................................................................................. 170
5.6.4 Data Analysis ................................................................................................................ 171
5.7 Ethical Considerations ................................................................................176
5.8 Summary ....................................................................................................177
CHAPTER 6 ANALYSIS AND FINDINGS .................................... 178
6.1 Introduction ................................................................................................178
PART A QUANTITATIVE FINDINGS ........................................................178
6.2 Response Rate ............................................................................................180
6.3 Response Bias Test .....................................................................................180
6.4 Data Screening ...........................................................................................181
6.4.1 Assessment of Common Method Variance ................................................................... 186
6.5 Measures of Reliability: Cronbach’s Alpha Coefficient ............................187
6.6 Descriptive Analysis ...................................................................................189
6.6.1 Demographic Characteristics of Respondents ............................................................... 189

xiv
6.6.2 Leadership Behaviour .................................................................................................... 193
6.6.3 Entrepreneurial Orientation ....................................................................................... 195
6.6.4 Organisational Performance .......................................................................................... 196
6.7 T-tests: Analysis of Size, Type of Industry, Gender and Position between
Leadership Behaviour, Entrepreneurial Orientation and Organisational
Performance ...........................................................................................................197
6.8 Initial Analysis of Variables .......................................................................202
6.9 Development of Path Model .......................................................................208
6.9.1 Exploratory Factor Analysis (EFA) ............................................................................... 208
6.9.2 Confirmatory Factor Analysis (CFA) ............................................................................ 217
6.9.3 Construct Reliability and Validity ................................................................................. 225
6.10 Path Analysis: Hypotheses testing .............................................................230
6.10.1 Leadership Behaviour and Organisational Performance ........................................... 231
6.10.2 Entrepreneurial Orientation and Organisational Performance .................................. 233
6.10.3 Mediating Effects of Entrepreneurial Orientation on the Relationship between
Leadership Behaviour and Organisational Performance ............................................................ 235
PART B QUALITATIVE FINDINGS ..............................................................240
6.11 Respondents and Response Rate ................................................................241
6.12 Demographic Characteristics of Respondents ............................................242
6.13 Themes and Findings Emerging from Interviews ......................................244
6.13.1 Leadership Behaviour ............................................................................................... 244
6.13.2 Entrepreneurial Orientation ....................................................................................... 248
6.13.3 Organisational Performance ...................................................................................... 251
6.13.4 Leadership Behaviour and Organisational Performance ........................................... 252
6.13.5 Entrepreneurial Orientation and Organisational Performance .................................. 254
6.13.6 Leadership Behaviour and Entrepreneurial Orientation .................................................. 255
6.14 Other Findings from the Qualitative Data ..............................................256
6.14.1 Factors Affecting Leadership Behaviour .................................................................. 257
6.14.2 Other Factors Affecting Entrepreneurial Orientation ................................................ 259
6.14.3 Other Factors Affecting Organisational Performance ............................................... 261
6.15 Summary ....................................................................................................265
CHAPTER 7 DISCUSSION .............................................................. 267
7.1 Introduction ................................................................................................267
7.2 Discussion of Key Demographic Results ...................................................267
7.2.1 Race of Respondents ..................................................................................................... 267
7.2.2 Categories of Enterprises ............................................................................................... 270

xv
7.2.3 Gender ........................................................................................................................... 271
7.2.4 T-test Results ................................................................................................................. 272
7.3 Discussion of Main Variables ....................................................................281
7.3.1 Leadership Behaviour ............................................................................................... 281
7.3.2 Entrepreneurial Orientation ........................................................................................... 286
7.3.3 Organisational Performance .......................................................................................... 288
7.4 The Removal of Individualised Consideration ...........................................289
7.5 Discussion on Main Findings .....................................................................292
7.5.1 Relationships between Leadership Behaviour and Organisational Performance .......... 292
7.5.2 Relationship between Entrepreneurial Orientation and Organisational Performance ....... 301
7.5.3 Mediation Effect of Entrepreneurial Orientation on the Relationship between Leadership
and Organisational Performance ................................................................................................ 307
7.6 Summary ....................................................................................................317
CHAPTER 8 CONCLUSIONS, IMPLICATIONS AND FUTURE
RESEARCH .......................................................................................... 319
8.1 Introduction ................................................................................................319
8.2 Conclusions from Research Findings .........................................................320
8.2.1 Conclusions Based on Research Framework ................................................................. 320
8.2.2 Conclusion from Research Questions............................................................................ 322
8.2.3 Methodological Conclusion........................................................................................... 326
8.2.4 Other Important Outcomes ............................................................................................ 327
8.3 Contributions and Implications of Research Findings ...............................330
8.3.1 Theoretical Contributions .............................................................................................. 330
8.3.2 Managerial Implications ................................................................................................ 333
8.3.3 Unique Contribution to Leadership/Entrepreneurship Theory and Practice .................. 338
8.4 Limitations of Study ...................................................................................342
8.5 Directions for Future Research ...................................................................345
8.6 Summary ....................................................................................................347
REFERENCES ...................................................................................... 349
APPENDICES .....................................................................................................390

xvi
LIST OF TABLES
Table 1.1: Definition of SMEs in Malaysia.………………………………………....8
Table 3.1: SMEs Contribution to the Malaysian Economy……………………….. 83
Table 3.2: Real GDP by Key Economic Activity…………………………………..99
Table 3.3: SME Value Added and Overall GDP Growth by Key Economic
Activity in 2010………………………………………………………….………...100
Table 5.1: Alternative Research Paradigms………………………………………..134
Table 5.2: Elements of Research Design…………………………………………..143
Table 5.3: Number of Establishments by Sector………………………………….. 145
Table 5.4: Contribution of SMES to GDP by Key Economic Activity ………….. 145
Table 5.5: Questions on Background of Business/Respondent……………………152
Table 5.6: Samples MLQ Items……………………………………………………153
Table 5.7: Items for Entrepreneurial Orientation…………………………………..154
Table 5.8: Items for Organisational Performance………………………………….155
Table 5.9: Criteria Used for Model Fit……………………………………………..164
Table 5.10: Phases of Thematic Analysis………………………………………….172
Table 6.1: Mean Comparisons of Variables between Online and
Self-Administered Surveys…………….…………………………………………..181
Table 6.2: Correlations between Independent Variables…………………………..185
Table 6.3: Results of Cronbach’s Alpha Coefficients…………………………….. 189
Table 6.4: Demographic Characteristics of Respondents (Quantitative; N=395)….192
Table 6.5: Means and Standard Deviation for Leadership Behaviour (N=395)…...194
Table 6.6: Means and Standard Deviation for Entrepreneurial Orientation
(N=395)…………………………………………………………………………….196

xvii
Table 6.7: Means and Standard Deviation for Organisational Performance
(N=395) ……………………………………….…………………………………...197
Table 6.8: T-test: Size of Enterprises……………………………………………....198
Table 6.9: T-test: Type of Industry………………………………………………...199
Table 6.10: T-test: Gender…………………………………………………………200
Table 6.11: T-test: Position………………………………………………………...201
Table 6.12: Factor Loadings Associated with Transformational Leadership
Scale Following Principal Component Analysis.………………………..………...209
Table 6.13: Factor Loadings Associated with Transactional Leadership Scale
Following Principal Component Analysis ……………………………………….. 210
Table 6.14: Factor Loadings Associated with Entrepreneurial Orientation Scale
Following Principal Component Analysis ………………………………………...212
Table 6.15: Factor Loadings Associated with Organisational Performance Scale
Following Principal Component Analysis….……………………………………...213
Table 6.16: Descriptive Statistics and Correlation Matrix for Transformational
Leadership Construct .……………………………………………………………..214
Table 6.17: Descriptive Statistics and Correlation Matrix for Transactional
Leadership Construct ………………………………………………………………215
Table 6.18: Descriptive Statistics and Correlation Matrix for Entrepreneurial
Orientation Construct………………………………………………………………216
Table 6.19: Descriptive Statistics and Correlation Matrix for Organisational
Performance Construct……………………………………………………………..217
Table 6.20: Fit Analysis: Transformational Leadership……………………………219
Table 6.21: Fit Analysis: Transactional Leadership………………………………..221
Table 6.22: Fit Analysis: Entrepreneurial Orientation……………………………..222
Table 6.23: Fit Analysis: Organisational Performance…………………………….224
Table 6.24: Goodness-of-fit Comparison between Initial and Final
Measurement Models……………….……………………………………………...225

xviii
Table 6.25: A Standardised Factor Loading, T-values, Constructs Reliability,
Average Variance Extracted Values and Average Shared Variances for the
Three-factor Transformational Leadership Measurement Model ………………....226
Table 6.26: A Standardised Factor Loading, T-values, Constructs Reliability,
Average Variance Extracted Values and Average Shared Variances for the
Three-factor Transactional Leadership Measurement Model……………………..227
Table 6.27: A Standardised Factor Loading, T-values, Constructs Reliability,
Average Variance Extracted Values and Average Shared Variances for the
Three-factor Entrepreneurial Orientation Measurement Model…….……………..228
Table 6.28: A Standardised Factor Loading, T-values, Constructs Reliability,
Average Variance Extracted Values and Average Shared Variances for the
Two-factor Organisational Performance Measurement Model …………………....229
Table 6.29: Path Summary of Direct Model between Leadership Behaviour
and Organisational Performance…………….……………………………………..233
Table 6.30: Path Summary of Direct Model between Entrepreneurial Orientation and
Organisational Performance………………………………………………………..235
Table 6.31: Path Summary of Mediating Model…………………………………...240
Table 6.32: Demographic Characteristics of Respondents (Qualitative; N = 9)…...243
Table 6.33: Other Factors Affecting Organisational Performance………………...261
Table 8.1: Summary of Hypotheses Testing……………………………………….326

xix
LIST OF FIGURES
Figure 3.1 Map of Malaysia ………………………………………………………..78
Figure 4.1 Research Framework…………………………………………………...108
Figure 5.1: Sequential Explanatory Design ………………………………………..138
Figure 5.2: Stages of Research Design……………………………………………..139
Figure 6.1: Normal P-P Plot of Regression Standardised Residual: Leadership
Behaviours………………………………………………………………………….182
Figure 6.2: Normal P-P Plot of Regression Standardised Residual:
Entrepreneurial Orientation…….………………………………………………….183
Figure 6.3: Normal P-P Plot of Regression Standardised Residual: .
Organisational Performance ……………………………………………………….184
Figure 6.4: Initial Full Model of All Variables…………………………………….203
Figure 6.5: Initial Measurement Model: Transformational Leadership……………204
Figure 6.6: Initial Measurement Model: Transactional Leadership………………..205
Figure 6.7: Initial Measurement Model: Entrepreneurial Orientation……………..206
Figure 6.8: Initial Measurement Model: Organisational Performance…………….207
Figure 6.9: Final Measurement Model: Transformational Leadership…………….219
Figure 6.10: Final Measurement Model: Transactional Leadership……………….220
Figure 6.11: Final Measurement Model: Entrepreneurial Orientation……………..222
Figure 6.12: Two-factor Organisational Performance Measurement Model………223
Figure 6.13: Final Path of Direct Model: Leadership and Organisational
Performance...……………………………………………………………………...231
Figure 6.14: Final Path of Direct Model: Entrepreneurial Orientation and
Organisational Performance ….................................................................................234
Figure 6.15: Final Path of Mediating Model of Entrepreneurial Orientation in
the Relationship between Leadership and Organisational Performance ...……..….236

xx
Figure 8.1: Final Research Framework…………………………………………….320
Figure 8.2: New Proposed Framework for Organisational Success of SMEs
in Malaysia…………………………………………………………………………339

xxi
LIST OF ABBREVIATIONS
AMOS Analysis of Moment Structure
CEO Chief Executive Officer
CFA Confirmatory factor analysis
CR Contingent reward
EFA Exploratory factor analysis
EO Entrepreneurial orientation
GDP Gross domestic product
GDP-PPP Gross domestic product – Purchasing power parity
GLCs Malaysian Government Linked Companies
GLOBE Global Leadership and Organisational Behavior
Effectiveness
GR Growth
INN Innovativeness
II Idealised influence
IC Individualised consideration
IM Inspirational motivation
IS Intellectual stimulation
IT Information technology
MBEA Management by exception, active
MBEP Management by exception, passive
MITI Ministry of International Trade and Industry
MLQ Multifactor Leadership Questionnaire
NSDC National SME Development Council
xxii
PA Proactiveness
PRO Profitability
SMIDEC Small and Medium Industries Development
Corporation
SMEs Small and medium enterprises
SME Corp. Malaysia SME Corporation Malaysia
RBV Resource-Based View
RT Risk taking
R&D Research and Development
SEM Structural equation modelling
SPSS Statistical Package for the Social Sciences

xxiii
DEFINITIONS OF KEY TERMS
Leadership refers to how a person behaves and takes actions to motivate, stimulate
and encourage a group of individuals to achieve organisational goals (developed by
the researcher).
Transformational leadership is a process where leaders broaden and raise the
interest of their employees to perform above and beyond expectations (Bass &
Avolio 2004).
Transactional leadership is the type of leadership where a leader explains what is
required from employees and what compensation they will get when they accomplish
these requirements (Bass & Avolio 2004).
Entrepreneurial orientation is the inclination of a company’s top management to
take calculated risks, to be innovative, and to display proactiveness in their approach
to strategic decision making (Morris & Paul 1987).
Growth is the owner’s or top manager’s perception of how well their company is
doing in regard to market shares and overall company performance relative to their
competitors (developed by the researcher).
Profitability is the owner’s or top manager’s perception of how well their company
is doing in regard to the return on investment and return on sales (developed by the
researcher).

1
CHAPTER 1
INTRODUCTION
1.1 Introduction
The topic of the performance of small and medium enterprises (SMEs) is creating a
vast amount of discussion among practitioners, researchers, educators and policy
makers. The characteristics and determinants of the performance of SMEs have been
and always will be a focus of debate and interest (McKelvie & Wiklund 2010). Due
to the unique constraints and limitations faced by SMEs such as having a limited
number of employees, insufficient financial resources, a lack of educational
background and experience and a lack of managerial expertise, among other limiting
factors (Samad 2007; Saleh & Ndubisi 2006; Abu Bakar et al. 2006; Mohd Aris
2006), efforts are continuously being made to understand how the performance of
SMEs could be developed and further enhanced. These efforts are important since
this sector of the economy is recognised as one of the important engines of growth
for a country’s economy (Abu Kassim & Sulaiman 2010).
The focus of this research is to examine the impact on performance of SMEs in
Malaysia from the perspectives of leadership behaviour and the entrepreneurial
orientation (EO) in organisations. This is done through the collection and analysis of
quantitative and qualitative data. Leadership and EO are acknowledged as essential
elements for organisational success (Fiedler 1996; Wang 2008; Yang 2008; Hannay
2009; Gul et al. 2012). Effective leadership provides a sound strategic direction and
encourages the motivation of employees (Hashim et al. 2012). Leadership is essential
2
for enhancing organisational performance since leaders are responsible for the
attainment of strategic organisational goals. Thus, leaders are accountable to the
stakeholders of their organisations for creating the best possible products and
services through optimum utilisation of the resources available (Gul et al. 2012).
Entrepreneurial ventures, on the other hand, need to focus on developing EO, which
serves as a strategic orientation that can set them apart from their competitors. Both
factors are needed to improve and sustain organisational performance and to allow
entrepreneurs (the owners and top managers of SMEs in Malaysia) to better equip
themselves to be more competitive in the future.
After this introduction, this chapter discusses the background of the study. Section
1.3 presents the problem statement and Section 1.4 details the scope of this study.
Section 1.5 highlights the objectives and research questions. Section 1.6 presents the
justifications for undertaking this research. Section 1.7 deliberates on the significance
of the study, Section 1.8 provides a summary of the thesis structure and Section 1.9
concludes this chapter.
1.2 Background of Study
Situated in South East Asia, Malaysia is a multi-ethnic country. According to the
Census 2010 (Department of Statistics, Malaysia, 2010), the total population in
Malaysia was 28.3 million in 2010, compared to 23.3 million in 2000. Of these,
91.8% were Malaysians and 8.2% were non-citizens. The population is also divided
into a 67.4% majority of Bumiputera (Malays and other indigenous groups), 24.6%
Chinese, 7.3% Indians and 0.7% other races.
3
Since independence from the British in 1957, Malaysia has accelerated its economic
performance to become one of Asia's best performers. In 2012, the Malaysia
economy was ranked the third largest in South East Asia, after Indonesia and
Thailand, and the 29th largest economy in the world. The country’s real gross
domestic product (GDP) grew by an average of 6.5% per year from 1957 to 2005
(Economic Planning Unit 2010). A recent release by the World Bank acknowledged
Malaysia as the country ranked 6th for ease of doing business. Regarding its political
system, Malaysia practises a parliamentary democracy with a constitutional
monarchy.
SMEs contribute significantly to the growth and development of the economy in
Malaysia. According to the SME Annual Report (NSDC 11), SMEs represent about
99.2% of total business establishments and contribute 39.1% of the country’s GDP.
SMEs provide 59.5% of the total employment and contribute 28.4% to the total
exports of the country. Due to their total number, their size and the nature of their
operations, it has been recognised that this segment of the economy is important in
promoting sources of growth and strengthening the infrastructure for accelerated
economic expansion and development in Malaysia (Mohd Aris 2007). The
government has continuously allocated large amounts of funds through various
sources and programs to assist SMEs to become more competitive in their various
industries. However, the contributions of Malaysian SMEs are still lower in regard to
the GDP and exports than those of some other developed and developing countries
(NSDC 2010).

4
Despite various types of support from the government, SMEs in Malaysia still face
challenges and difficulties in their business operations. Some of the problems are a
lack of capabilities and resources, poor management, low technology, strong
competition, international economic factors and the cost and shortage of workers
(Hashim 2000; Saleh & Ndubisi 2006). These factors have affected their performance
and their contribution to the country’s economy in general. Thus, to overcome these
challenges, good leadership and entrepreneurial attitudes need to be developed. These
two factors have been identified as those that could drive the success of SMEs in the
future (Abdul Razak 2010).
Every organisation needs sound and effective leadership. Acknowledging the
important links between leadership and organisational performance, many
organisations are focusing on developing effective leaders in their organisations
(Hashim et al. 2012). Most of the leadership research has focused on the impact of a
leader’s behaviour on followers’ individual performance (Podsakoff et al. 1996),
motivation (Papalexandris & Galanaki 2009) and satisfaction (Tsai 2008), rather than
examining firm performance, even though the most important effects of leadership
are on organisational performance (Elenkov 2002).
Notably, there is still a lack of understanding about leadership in small businesses
(Wang & Poutziouris 2010). These authors claimed that studying leadership in the
SME environment may result in a better understanding of the organisational
performance of SMEs. In one study of 194 small businesses, effective leadership
was found to result in better business performance (O'Regan et al. 2005). These
researchers further argued that small businesses with strong leadership have better

5
performance than businesses with weak or uncertain leadership. In the context of
leadership in Malaysia, the literature also suggests that very little effort has been
made to examine leaders and leadership behaviour in SMEs (Mohd Sam et al. 2012;
Hashim et al. 2012).
On the other hand, EO is becoming a popular subject in entrepreneurship literature
(Wiklund 1999; Rauch et al. 2009). Studies in the field of entrepreneurship have
indicated that the better the EO of an SME, the better the performance of the firm
(Swierczek & Thanh Ha 2003b; Rauch et al. 2009). EO is regarded as a strategic
orientation of the firm (Covin & Slevin 1989; Lumpkin & Dess 1996) and a source of
competitive advantage (Lumpkin & Dess 1996). With relatively limited resources
and capabilities, EO is a survival kit and a key for outperforming SME competitors in
global markets (Knight 2000). Regarding SMEs in Malaysia, Abdul Razak (2011)
wrote that EO is critical in directing strategic entrepreneurial activities and an
important means to achieving better productivity. Thus, the ability of SMEs in
Malaysia to possess and exercise EO is central for entrepreneurial success. However,
due to mixed results in the research, of the role of entrepreneurship and the impacts
of EO on SMEs in developing countries are not well understood (Fairoz et al. 2010).
Therefore, the purpose of this study is to test the proposed theoretical framework and
hypotheses that represent the relationships between leadership, EO and organisational
performance in SMEs in Malaysia. By providing empirical evidence, the research
should provide a better understanding of the contributions of leadership and EO to
the performance of SMEs in Malaysia and possibly also those in similar developing
economies. The next section discusses the problem addressed by this study.

6
1.3 Problem Statement
Even though SMEs are recognised as an important agent of growth in many countries
(Panitchpakdi 2006; Leutkenhorst 2004; Hilmi et al. 2010), their contribution to the
Malaysian economy is still comparatively low compared with the contributions of
SMEs in industrialised countries as well as other developing countries. SMEs’
contribution to GDP in Japan and Germany is about 53%, in the UK about 51% and
in Korea approximately 49%. Singapore and Thailand also record higher SME
contributions to GDP at 49% and 38% respectively. SMEs in Malaysia only
contributed about 31% to GDP in 2009 (NSDC 2010). This indicates a significant
opportunity to develop and refine SMEs’ performance to become a channel of growth
for the country’s economy (NSDC 2010). Growth is important for job creation and
productivity (Haltiwanger et al. 2013) as well as encouraging business expansion and
internationalisation (Lu & Beamish 2001). Thus, finding the right balance between
the leadership behaviour of entrepreneurs and EO could contribute to improving
SMEs’ performance.
SMEs are always being pressured by fierce competition from within their industries
and globally. To compete and continue productively in the global economy, SMEs
will have to undergo radical changes such as becoming more entrepreneurial and
having effective leadership (Hashim et al. 2012). If SMEs are to grow and to increase
their contribution to the country’s economy as expected, their leaders will have to be
able to identify the need for rejuvenation, to improve their sense of direction, to be
prepared to create necessary changes within their organisation and, most importantly,
to improve organisational performance. Hashim et al. (2012) added that for
7
organisations to sustain growth and profitability, effective leaders are needed to
create the context that encourages employees to take on new challenges and achieve
outstanding business results.
Although the literature has presented evidence of great interest among researchers
and practitioners in the topics of leadership and EO, the arguments have tended to
concentrate on whether there is a relationship between leadership and EO on the one
hand and organisational performance on the other hand. Despite the links identified
between leadership and performance (As-Sadeq & Khoury 2006; Ling et al. 2008; Lo
et al. 2010) and between EO and performance (Moreno & Casillas 2008; Rauch et al.
2009; Wiklund 1999), very few studies have been conducted to examine the
relationship between the three variables simultaneously (Yang 2008; Todorovic &
Schlosser 2007). Thus, the examination of EO as a mediator in the leadership-
performance relationship could add new understanding of the direct and indirect
relationships between leadership and organisational performance in the context of
SMEs in Malaysia.
Finally, there is still a limited understanding of leadership in the context of SMEs in
Malaysia (Mohd Sam et al. 2012; Hashim et al. 2012). Thus, this investigation of the
forms of leadership behaviour in SMEs in Malaysia hopes to close this gap in the
literature on SMEs.
1.4 Scope of Study
This research focuses on the relationship between leadership behaviour and
entrepreneurial orientation in SMEs in Malaysia and their effects on SMEs’

8
performance. The leader of an SME is represented by either the owner or the top
manager, who tends to be the most knowledgeable person about the strategic
direction of the firm (Keh et al. 2007; Yang 2008) and is the person who engages in
entrepreneurial activities. The scope of SMEs is limited to enterprises operating in
the manufacturing and service industries only. These two were chosen for their
largest representation of SME establishments and significant contributions to the
country’s economy. The definition of SMEs is based on the definition provided by
the National SME Development Council (NSDC), as shown in Table 1.1.
Table 1.1: Definition of SMEs in Malaysia
Micro-enterprise Small enterprise Medium enterprise
Manufacturing,
Manufacturing-Related
Services and Agro-
based Industries
Sales turnover of less
than RM50,000 OR
full-time employees
fewer than 5
Sales turnover
between RM250,000
and less than RM10
million OR full-time
employees between 5
and 50
Sales turnover
between RM10
million and RM25
million OR full-time
employees between
51 and 150
Services, Primary
Agriculture and
Information &
Communications
Technology (ICT)
Sales turnover of less
than RM200,000 OR
full-time employees
fewer than 5
Sales turnover
between RM200,000
and less than RM1
million OR full-time
employees between 5
and 19
Sales turnover
between RM1
million and RM5
million OR full-time
employees between
20 and 50
Source: National SME Development Council, 2010
Transactional and transformational types of leadership, the most widely researched
forms of leadership (Lo et al. 2009; Judge & Piccolo 2004), are analysed in this
study. The three factors of entrepreneurial orientation used in this study are the
factors established by Miller (1983): innovativeness, proactiveness and risk taking.
Organisational performance is measured through growth and profitability.

9
1.5 Research Objectives and Research Questions
The following objectives drove the direction of the research:
i. To investigate the relationship between transformational and transactional
leadership behaviour and organisational performance of SMEs in Malaysia.
ii. To examine the relationship between entrepreneurial orientation and
organisational performance of SMEs in Malaysia.
iii. To investigate the mediating effect of entrepreneurial orientation on the
relationship between leadership behaviour and organisational performance of
SMEs in Malaysia.
The following research questions needed to be answered:
i. To what extent do transformational and transactional leadership behaviours
have an impact on organisational performance?
ii. Does transformational leadership have a stronger effect on organisational
performance than transactional leadership does?
iii. To what extent does entrepreneurial orientation influence organisational
performance?
iv. To what extent does entrepreneurial orientation mediate the relationship
between leadership behaviour and organisational performance?
1.6 Justification of Study
This study is important for several reasons. First, the outcomes of this study are
empirical findings on whether certain forms of leadership behaviour and EO are
resources and capabilities needed by organisation to ensure sustainable performance.

10
Ahmad and Ghani (2010) highlighted that it is important for the top management of
SMEs to ensure that all the factors of EO (innovativeness, proactiveness and risk
taking) exist in their organisation. Addressing only one of the factors would inhibit
entrepreneurs from competing and strengthening their business effectively (Wiklund
& Shepherd 2005). To focus on all the factors of EO requires good and effective
leadership. Good leadership can nurture the development of the entrepreneurial skills
of a firm and ensure the success of business enterprises (Yang 2008; Lussier 2006).
Second, most leadership and EO studies have been conducted in Western or other
developed countries, primarily in the US and Western Europe (Lieberson &
O'Connor 1972; Bass 1997; Ardichvili 2001; Den Hartog & Koopman 2001;
Swierczek & Thanh Ha 2003a). Bass (1996) claimed that ‘leadership is a universal
phenomenon’ (p. 732). He further argued that the concept and model of leadership
developed in Western culture is as universal as the concept of leadership itself (Bass
1996). Therefore, it would be interesting to study whether Western leadership
concepts are applicable to a developing country like Malaysia. Even though Bass
(1996) posited that the leadership concept is culturally universal, the transferability of
the theories of leadership to different business and cultural environments needs to be
validated.
Thomas and Mueller (2000) questioned the transferability of EO to different cultural
and business environments outside the US context. Therefore, the theoretical
framework of this study might help to reveal how well the Western-developed
concepts of leadership – specifically, the transformational and transactional
leadership theories and EO – fit the context of entrepreneurial firms in a developing

11
country like Malaysia. According to Wang and Poutziouris (2010), a systematic
approach to studying leadership in the SME environment may result in a better
understanding of the organisational performance of SMEs. Therefore, these findings
add to the literature on leadership and entrepreneurship by examining the
applicability of these two concepts to Malaysian SMEs.
Third, SMEs’ development is increasingly important for the economic performance
of the country. Despite this increased importance, there has been limited research on
the effects of transformational and transactional leadership and EO on the
organisational performance of SMEs in the manufacturing and service industries.
This study therefore aims at generating empirical evidence for the relationships
between leadership behaviour and leaders’ perceptions of their firms’ EO, and the
influence of these factors on organisational performance. It is expected that the
findings will significantly assist leaders of SMEs to be more effective in improving
the EO in their firms and consequently improve organisational performance. Thus,
the findings of this study could help organisations to develop more effective leaders.
The outcomes could help them to make a good choice regarding:
i. Which leadership behaviour is effective in creating EO?
ii. What are the effects of leadership behaviour and EO on organisational
performance?
Fourth, there is also a lack of studies on the relationship between EO and
organisational performance relationship at the individual level of analysis (Todorovic
& Schlosser 2007). Most of the previous studies on EO and performance have been
done at the firm-level (Miller & Friesen 1982; Wiklund 1999). However, a

12
significant number of researchers have asserted that the application of EO at the
individual level could offer important insights into both managerial functions and the
operation of organisations (Gartner 1985; Carland et al. 1988). It is only recently that
the application of EO as an individual-level variable has started to receive some
attention (Davis et al. 2010). Therefore, the analysis of EO from the individual
perspective in this study is expected to provide a contribution to the entrepreneurship
literature by providing a better understanding of how a leader’s entrepreneurial
orientation is affected by their leadership behaviour and also what its impact might
be on organisational performance.
Finally, this study investigates and identifies the form of leadership behaviour that
would be practicable for leaders of SMEs in Malaysia. The identification of this
factor through empirical and qualitative findings could be of great assistance to the
development of training programs for new leaders of SMEs in Malaysia.
1.7 Significance of Study
The outcome of this study will contribute to the body of knowledge on leadership and
entrepreneurship. Many of the previous studies in this area of research have focused
on Western or other developed countries (Swierczek & Thanh Ha 2003a), so this
study will provide empirical evidences of the applicability of these concepts to a
developing country like Malaysia.
Due to the lack of research attention to the leadership behaviour of entrepreneurs in
the context of small businesses, this study could potentially offer a better
understanding of the forms of leadership behaviour that would be appropriate and

13
effective for Malaysian entrepreneurs. This is important since the culture, operating
environment and values in Malaysia are different from those of Western and other
developed countries. Some variables or factors might be important in Western
countries but are not within the scope of SMEs in Malaysia, and vice versa.
Adjustments to some of the Western-developed concepts of leadership and
entrepreneurship may make them better suited to Malaysian entrepreneurs.
The area of study on entrepreneurship in developing countries is now growing. The
outcomes of this research will provide further evidence on the level of
entrepreneurial attitudes in SMEs in a developing country. This evidence will help
the understanding of how the performance of SMEs in entrepreneurial activities
could be improved.
Most studies on leadership and entrepreneurship are inclined to use either a
qualitative or a quantitative method. In the present study, it was considered that the
use of mixed methods might generate more convincing results for understanding the
relationships between leadership and EO and organisational performance in SMEs in
Malaysia. The use of quantitative data provides empirical evidence to test research
hypotheses. The use of qualitative data supplements, clarifies, confirms and contests
some of the quantitative findings, thus inciting interesting discussion on the findings
of the study.
Practically, the outcomes of this study will benefit government-related agencies such
as SME Corporation Malaysia (SME Corp. Malaysia) and the development of
entrepreneurs in Malaysia. For example, a more robust and specific training program

14
may be initiated by SME Corp. Malaysia to foster and develop appropriate leadership
skills and entrepreneurial posture among entrepreneurs in Malaysia.
1.8 Structure of Thesis
Chapter 2 reviews the literature on each of variables in this study: leadership
behaviour, EO and organisational performance. A discussion of the variables leads to
the selection of the measures for forms of leadership behaviour, factors of EO and
organisational performance.
Chapter 3 reviews the literature on SMEs in Malaysia. A detailed review of the
research variables in the context of research and practices in Malaysia is also
presented.
Chapter 4 discusses the development of the theoretical framework of this thesis.
Reviews of the relevant theories that include leadership and EO as resources and
capabilities that enhance organisational performance drive the development of
theoretical hypotheses in this study.
Chapter 5 explains the research methodology that directs the conduct of this study.
Detailed descriptions of the research design, sample population, recruitment strategy,
research instruments, data analysis, validity and reliability, and ethical considerations
are presented.
Chapter 6 presents the outcomes of this study. There are two parts to this chapter.
The first part discusses the outcomes from quantitative analysis and the second part
discusses the outcomes from qualitative analysis. For the quantitative data, an

15
analysis of structural models using Structural Equation Modelling (SEM) to provide
answers to research questions and hypotheses is presented. For the qualitative data,
thematic analysis is used to analyse the interview data.
Chapter 7 discusses the outcomes derived from the analyses of both types of data.
Each of the hypotheses and research questions is addressed.
Chapter 8 draws conclusions from the analyses and from comparisons of the
quantitative and qualitative findings. Recommendations, implications for theory and
practice, the limitations of the study and possible future research directions are also
provided.
1.9 Summary
The topic of leadership has created much interest in management literature (Hannay
2009) and it has been established that effective leadership is important for
organisations of all sizes and industries (Bolden 2007; Yang 2008; Gul et al. 2012).
Effective leadership ensures organisational success and good business performance,
especially in the competitive environment in which most firms are operating (Ireland
& Hitt 2005). For SMEs, good leadership is needed not only to guide organisational
success (Van 2005) but also for survival (Abdul Aziz et al. 2013).
Thus, this study examines the effects of the relationship between leadership
behaviour and EO on the organisational performance of SMEs in Malaysia.
Leadership is a complex phenomenon. Even though many studies have identified that

16
leadership affects performance, its effects in the context of SMEs in developing
countries still need to be validated. This is the issue that has become the focus of this study.
This chapter presents a clear picture of the need for this study. A brief background on
studies and identified problems indicate the gap that needs to be filled. The research
objectives and research questions provide guidance for the direction of this research.
Justifications for this study deliberated on why this study was needed and the
significance of the contributions that this study might make. An outline of the thesis
structure provides guidance to readers on the direction of this thesis. In the next
chapter, this study explores the literature on leadership, EO and organisational
performance.

17
CHAPTER 2
LITERATURE REVIEW
2.1 Introduction
The objective of this chapter is to present a review of the literature relating to the
main variables in this study. Section 2.2 presents a definition of leadership followed
by a historical review of various theories on leadership. There is an extensive and
specific review of the theory of transformational and transactional leadership. This
section also discusses the current literature and practice for this theory and its
application to the context of SMEs. A brief review of the Multifactor Leadership
Questionnaire (MLQ), a tool used to measure transformational and transactional
leadership, is also presented. Section 2.3 presents the literature on EO, its key factors
and its application in research and practice. Section 2.4 discusses the literature on
organisational performance, the dependent variable of this study.
Section 2.5 reviews literature that has integrated the variables used in this study.
Although previous studies examining links between leadership, EO and
organisational performance are not extensive, especially in the context of SMEs, the
findings from those studies in various industries and business environments provide
fruitful insights for developing a strong foundation of this study. Section 2.6
summarises this chapter.

18
2.2 Leadership
2.2.1 Definition of Leadership
A review of the literature on leadership indicates that there is not only a wide range
of leadership theories but also no single agreed definition of leadership (Bass 1990a;
Rost 1993). After 40 years of researchers trying to unravel the meaning of leadership,
Bass (1990a) identified more than 3,500 definitions and concluded, ‘There are almost
as many definitions of leadership as those who have attempted to define the concept’
(Bass 1990a, p.11).
Some definitions of leadership tend to be rather narrow and some are quite
comprehensive. For example, in a popular textbook on leadership, Yukl (2010)
defined it as the process of getting others to understand and follow what should be
accomplished and how, and the process of facilitating individual and collective
efforts to accomplish shared objectives. Narrower definitions see leadership as the
ability to release and engage human potential in the pursuit of common goals (Moore
& Diamond 2000) or the process whereby a person influences a group of individuals
to achieve a shared purpose (Northouse 2007).
Bass (1990a), on the other hand, defined leadership as a relationship between two or
more individuals of a group that often involves a structuring or restructuring of the
situation and the perceptions and expectations of the members. Leaders are seen as
agents of change – people whose behaviour affects other individuals more than the
other individuals’ behaviour affects them. Leadership is established when one
member of a group modifies the motivation or competencies of others in the group.
19
The broad definitions of leadership are perhaps a consequence of the many attempts
of researchers and scholars to study the concept of leadership. Perhaps these
definitions are developed to accord with the different aspects of leadership that
interest them, to match their own perspectives of the leadership process or perhaps to
deal with a certain leadership context that they want to focus on. Therefore, the
selection of an appropriate definition of leadership is important for interpreting the
findings of a study so as to avoid confusion. Hence, in this study, the following
definition of leadership developed by the researcher is used:
Leadership refers to how a person behaves and takes actions to motivate, stimulate
and encourage a group of individuals to achieve organisational goals.
This definition has been developed to suit the needs of this study. Self-perception
measures are used in this study to measure leadership, and this definition allows
leaders to evaluate their own leadership through their understanding of how they
behave, what actions they take to lead and how they engage with their employees.
This definition of leadership seems appropriate for this study as:
i. It reflects on how a leader behaves in dealing with employees.
ii. It stresses the actions carried out by a leader to influence employees’ engagement.
This definition indicates that any form of leadership must be accompanied by
practical actions to ensure that employees are united, motivated and inspired to focus
on achieving the goals of the organisation. Yukl’s (2010) definition of leadership also
stresses the behaviour of a leader, including the activities that are important to fulfil a

20
leader’s responsibilities. These activities include persuading others to work towards
common goals and shared objectives (Yukl 2010; Northouse 2007).
The next section presents a review of past and current research and leadership
theories. The review considers the Great Man theory and the trait approach, the
behavioural approach, the situational approach, and the transactional and
transformational leadership theory. An understanding of these past and present
leadership theories serves as a foundation of this study.
2.2.2 Leadership Approaches
Leadership can be traced back to the emergence of various religious beliefs.
Transformational leadership theory has been chosen as the leadership theory for this
study due to the academic attention that it has gained over the past 20 years as a
useful paradigm for understanding leadership (Spreitzer et al. 2005; Judge & Piccolo
2004). This study acknowledges that this approach to leadership is based on the
Western views and interpretation of leadership. In the eastern countries, approaches
to leadership often relate to religious beliefs such as Islam, Buddhism and
Confucianism.
2.2.2.1 Great Man Theory and Traits Approach
The earliest theory of leadership was the Great Man theory. This theory was popular
in the 19th and early 20th centuries and assumed that great leaders are born and not
made (Kirkpatrick & Locke 1991). This theory depicted great leaders as heroic,
mythic and ordained to rise to leadership when required to. Then, around the late
1940s, studies on leadership started to focus on the trait theory of leadership. This

21
approach was derived from the Great Man theory and therefore had some similarities.
The trait theory assumed that people inherit certain traits and qualities that
distinguish them as great leaders. The trait theory tried to identify the characteristics
that differentiate leaders from followers. The theory of this leadership approach is
that leadership is inborn, meaning that some people are born with certain traits that
make them good leaders. Traits such as energy, intelligence, honesty, self-
confidence, appearance, knowledge, optimism, tolerance of stress, persistence when
encountering obstacles and result-orientation integrity were considered the
characteristics of effective leaders (Northouse 2007; Yukl 1989, 2010).
Stogdill (1948) reviewed 124 studies on the trait theory of leadership and concluded
that the studies were indecisive, inconclusive and unconvincing. However, he did
identify several traits of a leader that were greater than those of the members of his
group: intelligence, scholarship, dependability, activity, social participation and
economic status. His findings also highlighted the importance of situational
conditions that might influence the effectiveness of a leader and stated that leadership
could not be sufficiently described by the trait theory. He concluded that ‘a person
does not become a leader by the virtue of some combination of traits, but the pattern
of personal characteristics of the leader must bear some relevant relationship to the
characteristic, activities and goals of the followers’ (Stogdill 1948, p. 64).
Intelligence, for example, may contribute to the success of a leader when group
members possess an almost similar level of intelligence or a slightly lower lower than
the leader. But this trait may be irrelevant to a leader in other situations. Therefore,
having certain inborn personal traits is not a guarantee for success and Robbins

22
(2003) concluded that having all these traits may increase the likelihood of success as
a leader but they do not promise success.
In another study, Kirkpatrick and Locke (1991) recognised that traits are only a
precondition for successful business leadership. Leaders endowed with the requisites
traits must also take certain actions in order to be successful. It is acknowledged that
the trait theories have been effective in identifying the range of traits for successful
leaders (Bass 1990a) but depending only on the traits is not always an effective
means of distinguishing good leaders (Bass 1990a; Barker 1997), as other criteria are
also important.
2.2.2.2 Behavioural Approach
The inability to prove that individual characteristics are the main determinant for
effective leadership caused a shift towards a behavioural approach to leadership, with
an emphasis on leadership style or behaviour. The idea that unique characteristics
made people effective leaders was no longer considered applicable in every situation.
Behavioural theories which were proposed from the late 1940s to the mid-1960s
argued that leadership can be learned and leaders can be developed rather than just
having inborn personal characteristics (Ayman & Korabik 2010). A behavioural
definition of leadership focuses on the view that leaders are responsible for providing
and shaping an environment which enables followers to achieve specific tasks
(Mosley 1998). Mosley added that for a subordinate to fulfil organisational goals, the
leader can manage his or her behaviour through organising antecedents and
consequences of behaviour.

23
Instead of concentrating on what leaders are, this behavioural approach concentrated
on what leaders do to make them great leaders and ‘the relationship of behaviour to
managerial effectiveness’ (Yukl 1989, p. 257). In the behavioural approach, the
effectiveness of a leader is related either to the nature of managerial work (task
orientation), or to the functions, practices and behaviour of the leader (people
orientation) (Robbins & Coulter 2005). These two broadly defined behavioural sets
also appear in categories such as and production-centred behaviour (task orientation)
and employee-centred behaviour (people orientation) (Bowers & Seashore 1966;
Burns 1978; Bass 1990a; Judge et al. 2004).
Task-oriented leadership behaviour emphasises giving employees specific tasks,
clarifying their roles and duties, and maximising their job performance capacity.
People-oriented leadership behaviour concentrates on showing mutual trust and
respect, making people feel part of the team, building and sustaining effective
interpersonal relationships, and showing concern for employees’ needs and welfare
(McShane & Travaglione 2003; Zimmermann et al. 2008). Research has shown that
organisations with task-oriented leaders have high job performance, but it is usually
related to low job satisfaction accompanied by high absenteeism and a high turnover
rate. Organisations with a people-oriented leader have high job satisfaction, low
absenteeism and a low turnover rate. But the job performance in people-oriented
organisations tends to be lower than in task-oriented organisations (McShane &
Travaglione 2003).
There are several popular behavioural theories on leadership such as the Ohio State
Studies, the University Michigan Studies and the Managerial Grid (Northouse 2007).
24
In all of these studies, the effectiveness of the leaders depends on their style or
behaviour. In some circumstances, it has been proved that task orientation is more
effective than people orientation, especially when the leader is dealing with new
employees. But recently Cummings et al. (2010) found that people-oriented
leadership behaviour is superior to task-oriented leadership behaviour in regard to
productivity and effectiveness, team work and collaboration, job satisfaction,
employee retention, working environment and employee health. Regardless of the
styles used by leaders, those styles can be secluded, defined and taught, which is
contrary to the underlying assumption of the traits theory.
2.2.2.3 Situational Approach
During the 1960s and 1970s, a new perspective of leadership began to emerge
(Ayman & Korabik 2010). In this view, style of leadership alone was seen as
inconclusive in explaining the factors influencing organisational effectiveness. The
disadvantage of the behavioural approach was considered to be a lack of
consideration of the situational influences that might affect leadership effectiveness.
Therefore some researchers begun to assume that a situation creates conditions
suitable for leaders’ efficiency. This is known as the contingency approach (Aronson
2001). According to Yukl (1989, 2010), the situational approach stresses the
importance of contextual factors such as the leader’s authority and discretion, the
nature of the work performed by the leader’s unit, the attributes of followers and the
nature of the external environment. This means that the efficiency of a leader
depends on how well he or she matches their leadership behaviour to different
situational factors.
25
Yukl (1989) identified that research into the situational approach to leadership can be
classified into two categories: researchers who try to discover situational factors that
influence behaviour and researchers who try to discover the moderating effects of
situations on leaders’ behaviour and their effectiveness. The issue is whether the
dependant variable is determined by the situation or by the behaviour of the leader.
Some models have received greater attention than others due to their ability to
distinguish the situational variables that influence leadership effectiveness. These
models include the Fiedler Model, Hersey and Blanchard’s Situational Leadership
Theory, the Leader Participation Model, the Path Goal Model and Leadership
Substitutes (Yukl 1989). Among these models, Hersey and Blanchard’s (1969, 1993)
Situational Leadership Theory (SLT) has been the most widely used by practitioners
(Butler & Reese 1991; Blank et al. 1990). Avery and Ryan (2002) revealed that many
leaders prefer situational leadership to other leadership models as it is more
applicable to the organisational context.
According to Hersey and Blanchard (1993), the foundation of SLT is the interaction
between the extent of leader task behaviour, leader relationship behaviour and
follower readiness/maturity in performing a certain task. In this theory, the followers
are the most important factor in the leadership circumstances. As the maturity level
of the followers varies, so does the style of supervision by the leader. Employee
readiness/maturity is defined as the extent to which a follower has the ability and
willingness to accomplish a task.
Four types of leadership styles relate to four levels of employee maturity. For
employees whose maturity level ranges from low to moderate, the appropriate

26
leadership style is ‘high relationship and moderate task’. As employees became more
mature, the leader’s style shifts to ‘low relationship and low task’. In this theory, the
effectiveness of leaders is based on the interaction between leader task behaviour,
leader relationship behaviour and employee readiness/maturity.
The situational contingency approach has had a huge impact on the study of
leadership. However, the approach has raised some concerns about the complexity of
the models and their validity (Yukl 1999; Graeff 1983). The approach has also been
criticised for treating leadership as a one-way process, with too much emphasis and
responsibility on the leader. This would create a situation, particularly with the path-
goal theory (Chemers 1997; Northouse 2012), where employees become overly
dependent on their leader in order to complete their task.
2.2.2.4 Transformational Leadership
Disagreements about the situational factors that really influence leadership
effectiveness arising from the multiplicity of theories and perspectives have induced
researchers to shift towards a new theory of leadership. The concept of the
transformational leader was first developed by Burns (1978) to deal with political
leadership. Since then, the concept of transformational leadership has been the focus
of much interest, discussion and debate for three decades in leadership and
management literature (Zhu et al. 2012; Kimura 2012; Hannay 2009). Burns (1978)
viewed transformational leaders and transactional leaders as separate from one
another. According to him, transactional leaders are those who intend to influence
their followers’ self-interests. In this model, leaders emphasise task assignments,
work standards and compliance by followers. They also provide rewards and
27
punishment to influence the performance of subordinates. In contrast,
transformational leaders inspire followers to work towards common goals and to
achieve a high level of self-actualisation through instilling a clear mission and vision
and building up trust and confidence (Burns 1978).
Bass (1985) refined Burns’ (1978) view on transactional and transformational
leadership with a proposed theory of transformational leadership. He proposed that
an effective leader with transformational attributes and abilities has the ability to
transform his or her organisation to greater heights and to achieve greater
performance (Bass 1985, 1990a, 1990b).
There were two distinct modifications made by Bass to Burns’ initial concept of
transformational leadership. First, Bass disagree with Burns’ proposition that
transformational and transactional leadership are two separate concepts, representing
the opposite ends of a continuum. Bass (1985) claimed that these two types of
leadership behaviour were not two separate concepts but rather two dimensions of a
single concept. This means that effective leaders can possess both transformational
and transactional leadership attributes (Bryman 2000; Bass & Riggio 2012). Next,
Bass expanded the types of behaviour that represented transformational and
transactional leadership (Judge & Piccolo 2004). Based on the constructs of
transformational and transactional leadership behaviour developed by Burns (1978),
Bass (1985) added the laissez-faire leadership construct to refer to the type of leader
who ‘shows unconcern, procrastinates and avoids decisions’ (Bass 2000, p. 23) and
avoids supervisory responsibility (Den Hartog et al. 1997). Bass (1996) used the label
28
‘full range leadership theory’ to include transformational, transactional and laissez-
faire leadership.
According to Bass (1985), a transactional leader ‘pursues a cost-benefit economic
exchange to meet subordinates’ current material and psychic needs in return for
“contracted” services rendered by the subordinate’ (Bass 1985, p. 14). A
transactional leader provides followers something that they want in return for
something that the leader wants (Kuhnert & Lewis 1987). Transactional leaders
address the self-interest of their employees by using positive and aversive
reinforcement. When employees meet objectives, rewards and praise are granted.
Negative reinforcement such as negative feedback or disciplinary action is used when
they fail to meet commitments (Bass 2000; Bass et al. 2003; Bass & Riggio 2012). It
is an agreed exchange process between the leader and the followers in order to
achieve the necessary standard of performance.
Most transactional leaders are risk averse and perform well in stable and predictable
conditions (Bass 1990a). In essence, transactional leaders favour maintaining
stability in the organisation through economic and social exchanges that achieve
specific goals for both the leaders and the followers (Lussier & Achua 2001). The
relationship between a leader and a follower is simply based on the level of the
transaction. For instance, followers with high and efficient work performance receive
praise and rewards from the leader in exchange. On the other hand, followers with
poor and inefficient performance receive punishment or threats. The relationship
between a leader and a high achieving follower grows stronger as more transactions
occur and more benefits are obtained by both parties.

29
In contrast to transactional leadership, ‘transformational leadership is the process
whereby a person engages with others and creates a connection that raises the level of
motivation and morality in both the leader and follower. This type of leader is
attentive to the needs and motives of followers and tries to help followers reach their
full potential’ (Northouse 2007, p. 76). Bass (1985) asserted that leaders who portray
themselves as transformational leaders can motivate followers to achieve
performance beyond expectations. Leaders affect and transform their organisation by
increasing employees’ awareness of the importance of the task and its value, by
elevating interest in the organisational goals instead of their personal interests, and by
focusing on their higher-order needs. Transformational leaders raise employees’
understanding about what is important, and increase the need for achievement and
self-actualisation (Bass 2000). They motivate employees to strive beyond their self-
interest for the benefit of the group (Bass & Riggio 2012; Bass 2000).
Transformational leaders are able to influence followers to put in extra effort due to
their commitment to the leader, their intrinsic work motivation, the level of their
development, or having a clear sense of purpose or mission that drives them to excel
beyond a standard performance (Bass et al. 2003; Howell & Avolio 1993), and they
also develop followers to take on leadership roles (Bass & Avolio 1993). Lussier and
Achua (2001) described transformational leaders as not afraid to change the status
quo by informing followers about the problems in the current system and providing a
compelling vision of what a better organisation could be. Sarros and Santora (2001)
extended the effects of transformational leaders to appealing to followers’ ideals and
values such as liberty, justice, peace and equality.

30
The third type of leadership identified by Bass (1996) as laissez-fair leadership is a
lack of active leadership (Bass & Avolio 1995). It is characterised by a reluctance to
become actively involved and a view that leadership is expressed by withdrawing
from the action. This type of leadership is sometimes labelled ‘passive-avoidant
leadership’, which is related to the types of ‘no leadership’ (Avolio & Bass 2004) and
‘do nothing leadership’ (Gartner & Stough 2002). Among these three types of
leadership behaviour, laissez-faire is the least effective form of leadership (Jones &
Rudd 2007; Bass & Avolio 1995).
Since laissez-faire leadership is the absence of leadership or ‘no leadership’, this type
of leadership has not been included in this study, similar to previous studies
conducted by Lowe et al. (1996) and Michel et al. (2011). Leaders with this
leadership behaviour show passive indifference to tasks and to followers. They
represent the opposite of change-oriented behaviour, behave in ways that do not
inspire ideas, innovation, creativity, willingness to promote change or a tendency to
take risks, and they encourage a conservative, anti-entrepreneurial organisational
strategy or restrict organisational entrepreneurship (Eyal & Kark 2004).
Many previous studies have also concluded that laissez-faire leadership is not
positively related to significant outcomes in organisations (Judge & Piccolo 2004;
Bass 1985; Bass & Avolio 1989; Yammarino & Bass 1990; Singer 1985) and
therefore it is not included in this study. The research questions stated in Chapter 1
specifically identify whether transformational and transactional styles of leadership
affect organisational performance. Thus, to include leadership behaviour that has
been considered as ‘the most inactive’ and ‘ineffective’ behaviour for leaders in

31
almost all research (Bass & Riggio 2012, p. 8) would be irrelevant, especially in the
scope of SMEs, where most leaders are also the owners of the firm. The next two
sections discuss the key factors of transformational and transactional leadership.
Key Factors of Transformational Leadership
Transformational leadership is defined as a process where leaders broaden and raise
the interest of their employees. It occurs when leaders generate awareness and
acceptance of the purpose and mission of the group and when they inspire their
employees to look beyond their self-interest for the benefit of the group (Bass 1985,
1990b, 2000). There are four factors of transformational leadership: idealised
influence, inspirational motivation, intellectual stimulation and individualised
consideration (Bass & Avolio 1997, 2004; Bass et al. 2003; Bass & Riggio 2012).
As idealised influence, a leader provides vision and a sense of mission, instils pride,
and receives respect and trust in employees (Bass 1990a; Bass & Riggio 2012).
Transformational leadership inspires and excites employees with the idea that they
are able to accomplish great things by putting in extra effort (Bass & Avolio 2004).
Leaders of this type create trust and confidence from employees. They demonstrate
conviction, take stands and also appeal to employees on an emotional level (Judge &
Piccolo 2004). Idealised influence, also known as the charismatic attribute, is central
to the transformational leadership process and is the key component of
transformational leadership (Bass 1985; Yukl 1989).
Inspirational motivation refers to the degree to which leaders articulate a vision that
is appealing and inspiring to employees. Inspirational leaders challenge employees to

32
reach high standards, communicate optimism about the attainment of goals and
provide meaning for the tasks at hand (Judge & Piccolo 2004; Bass et al. 2003).
Inspirational leaders communicate high expectations, and use symbols to focus effort
and convey important purposes to employees in simple ways (Bass 1990a, 1996;
Muenjohn & Armstrong 2008). In other words, they articulate shared goals and
mutual understanding of what is right and important in simple ways to their
employees (Bass & Avolio 2004; Bass & Riggio 2012).
Intellectual stimulation from leaders encourages intelligence, rationality and careful
problem solving (Bass 1990a; Bass & Riggio 2012). This attribute also refers to the
degree to which the leader challenges assumptions, takes chances, and solicits
employees’ views and opinions. Leaders with this attribute incite and encourage
creativity in their employees (Judge & Piccolo 2004). In their behaviour,
transformational leaders provide an example to their employees of using new
perspectives to look at old problems. Leaders of this type encourage innovative
thinking and allow employees to develop their capacity to solve problems unforeseen
by them (Bass & Avolio 2004). Kirkbride (2006) identified one of the main qualities
of a transformational leader as the ability to encourage independent problem solving
and decision making.
Finally, the individualised consideration aspect of transformational leadership means
leaders provide personal attention to employees and treat each of them individually
(Bass 1990a; Bass & Riggio 2012). It also refers to the degree to which leaders attend
to each employee’s needs, act as a mentor or a coach to employees and listen to their
concerns and needs (Judge & Piccolo 2004). These leaders spend time coaching and
33
giving advice productively by paying close attention to the differences among
employees (Muenjohn & Armstrong 2008). This is an effort by the leaders not only
to identify and satisfy employees’ existing needs, but also to enhance and increase
those needs in order to maximise and develop employees’ full potential.
Key Factors of Transactional Leadership
Transactional leadership is where leaders explain what is required from employees
and what compensation they will receive when they accomplish these requirements.
It is a transaction between leaders and followers (Bass 1990, 2000; Bass et al. 2003).
Transactional management can be described as the process of creating clear
expectations on the part of followers with agreement on what they will get in return
for meeting these expectations (Blanchard & Johnson 1985). The three factors of
transactional leadership that are used in this study are: contingent reward, active
management-by-exception and passive management-by-exception.
Contingent reward is the exchange of rewards for efforts. It promises rewards for
excellent performance, acknowledges accomplishments and punishes poor
performance (Bass 1996; Muenjohn & Armstrong 2008). The leaders explain
expectations and establish rewards for meeting these expectations (Judge & Piccolo
2004). This is an agreed reciprocal process between leaders and followers. Each party
understands the system of rewards and the requirements for certain achievements or
behaviour of the followers (Bass 1990, 2000; Bass & Riggio 2012).
Both of the management-by-exception factors originated from contingent
reinforcement theories (Bass 1990), in which followers are punished or rewarded for
34
an assigned action. In active management-by-exception, leaders act as monitors to
watch for deviations from rules and standards and take corrective actions (Bass
1990a, 1996; Muenjohn & Armstrong 2008; Sosik & Jung 2010). In passive
management-by-exception, leaders intervene only when procedures and standards are
not met (Bass 1990a, 1996). Leaders of that kind only expect the status quo to be met
by followers and they do not encourage exceptional performance by followers (Hater
& Bass 1988). Both types of management-by-exception focus on identifying
mistakes in business operations (Bass & Avolio 2004; Bass & Riggio 2012).
The difference between active and passive management-by-exception in identifying
mistakes is the point of intervention by the leader. Leaders do not get involved until
failures or deviations occur in the designated tasks (Bass 1985, 1990). A leader with
the characteristics of active management-by-exception continuously monitors
performance outcomes and takes corrective actions before deviations become a major
issue. In passive management-by-exception leadership, a leader intervenes only after
a problem has occurred. This type of leader waits for the completion of an
assignment before determining that a problem exists and then intervening with
corrective measures or punishment (Howell & Avolio 1993). Barbuto (2005)
suggested that intervention by the leader is necessary only when a failure takes place
and punishment or corrective action is needed. Nevertheless, both types of behaviour
focus on establishing standards and monitoring failures or deviations from the
standards required (Zhu et al. 2012).

35
2.2.3 Transformational Leadership in Practice and Research
Leadership studies have been conducted in various organisational settings and
environments. The literature review has identified that attempts have been made to
evaluate the effect of leadership on followers’ development and engagement
(Luthans & Avolio 2003), on organisational culture and a firm’s innovativeness
(Duygulu & Ozeren 2009), on increasing employees’ satisfaction (Casimir & Ng
2010; Papalexandris & Galanaki 2009), on improving employees’ motivation
(Papalexandris & Galanaki 2009), and on examining the distribution of leadership in
a group or examining team performance (Pearce & Sims 2000). Other studies have
examined the contextual environment of leadership (Somech 2003; Waldman &
Yammarino 1999).
Many attempts have been made to analyse the effects of transformational leadership
theory on various measures of organisational performance in different industry
settings. These attempts have included analysing the effects on the performance of
large corporations (Agle et al. 2006; Ensley et al. 2006), financial institutions and
banks (Xenikou & Simosi 2006; Geyer & Steyer 1998; Howell & Avolio 1993), the
education sector (Paracha et al. 2012; Arnold et al. 2001), non-profit organisations
(Chung & Lo 2007; Langley & Kahnweiler 2003), the hotel industry (Chiang &
Wang 2012; Patiar & Mia 2009) and also on the performance of SMEs in developed
countries (Hood 2003) and developing countries (Lo et al. 2009). All of these studies
have highlighted the importance and applicability of transformational leadership
theory in various contexts and organisational settings all around the world.

36
Xenikou and Simosi (2006) analysed the effect of transformational leadership
behaviour on organisational effectiveness and revealed that transformational
leadership and organisational performance has a positive effect on subordinates’ level
of motivation. Arnold et al. (2001) found that transformational leadership increases
trust, commitment and team efficacy. Hood (2003) and Banerji and Krishnan (2000)
evaluated the effects of transformational leadership on ethical practices. Findings
from Hood (2003) revealed that transformational leaders exhibit significantly higher
levels of ethical practices than either transactional or laissez-faire leaders. Howell
and Avolio (1993) measured senior managers’ leadership behaviour and suggested
that leaders who display more attributes of transformational leadership than
transactional leadership contribute positively to the achievement of business unit
goals. But an earlier study by Dubinsky et al. (1995), which examined the links
between transformational leadership behaviour and personality traits, presented
different results. Based on a sample of 174 sales staff and their manager, they found
that transactional leadership might be more effective in enhancing salespeople’s
affective and behavioural responses.
The interest in examining the effects of transformational leadership theory has also
extended to their effects on non-profit organisations (NPOs). Based on 77 samples of
people involved in social welfare charity foundations (SWCFs) in Taiwan, Chung
and Lo (2007) found that both transformational and transactional leadership
behaviours were important for top managers in SWCFs. Thirty-five respondents
evaluated the leadership practices in their charity foundations as high transactional
and high transformational. Even though several characteristics of NPOs differ from
those of profit-based organisations (such as employing volunteers and generating

37
funding from donations, government subsidies and revenue from their services), they
still need to pay attention to effective management practices and top managers with
the right kind of leadership behaviour to ensure effective services to their customers.
Chung and Lo’s (2007) results confirmed the results of the study by Langley and
Kahnweiler (2003) of the leadership behaviour of 102 African-American pastors
involved in social-political issues in the US. These authors concluded that pastors
with transformational leadership qualities are involved more frequently in social-
political activities.
Most of these studies have suggested that transformational leadership results in better
organisational outcomes. Leaders who display transformational leadership qualities
are able to engage employees, gauge their interest and motivation and improve their
team commitment; all of these translate into better performance. However, there is a
situation where transactional leadership might be more relevant and effective. When
work requires constant monitoring, transactional leadership becomes more important.
As suggested by Dubinsky et al. (1995), salespeople are guided better by
transactional leaders, perhaps due to the nature of this work, which is mostly based
on commission from sales, providing a promising reward for high achievement.
Constantly monitoring the sales progress and exercising punishment for poor
performance might effectively influence the performance of the salespeople.
An important issue that needs to be discussed in regard to the transformational–
transactional leadership theory is the universality of the theory for different
organisational contexts and different cultures. Bass (1997) concluded that there is
universality in the transformational–transactional leadership paradigm and presented

38
cross-continental supportive evidence collected from organisations in business,
education, the military, the government and the independent sector. There were
similar correlations between the different types of leadership behaviour and particular
outcomes in many different countries. Bass (1997) asserted that the operation of the
theory and its relationships can be observed in many types of organisations and
cultures, but there might be some exceptions as a consequence of unusual attributes
and different beliefs. The concepts may have certain thought processes, beliefs,
implicit understanding or behaviour that might be perceived differently in different
cultures (Bass 1997).
Inkson and Moss (1993) questioned the universality of the transformational
leadership theory when the findings from their study revealed that the correlations
were all insignificant, suggesting that leaders vary their leadership behaviour
according to the situation. Swierczek (1991) acknowledged in his paper that
leadership theories based on Western cultural values might not be appropriate
worldwide. But the outcomes from his study of two different groups consisting of 40
managers from 24 different countries in Asia (except Japan) showed otherwise.
Similarities were identified in these groups in regard to what constitutes good and
bad leaders. Many of these characteristics reflected transformational and
transactional leadership attributes such as efficient decision making, good
communication, concern for individuals, support for employees, giving motivation
and efficiency in problem solving. These outcomes from very diverse Asian
managers suggest that there is a possibility of a culturally universal theory of
leadership (Swierczek 1991).

39
The same conclusion was also drawn in a study by Den Hartog et al. (1999) across 62
cultures. They found that even though cross-cultural research stressed that different
cultural groups are likely to have different conceptions of what constitutes good
leadership, certain attributes associated with transformational leadership are
universally endorsed as contributing to outstanding leadership. However, they also
acknowledged that some other attributes of transformational leadership are seen as
barriers in certain cultures.
Bass (1997) reinforced the notion that leadership is a universal phenomenon. He
maintained that transformational leaders are more effective than leaders who practise
transactional or laissez-faire leadership, regardless of culture, organisation and
country. His argument was supported when outcomes from different studies in
different countries presented similar results. For example, in Russia, Elenkov (2002)
found that transformational leadership directly and positively impacts on the
organisational performance of Russian companies far more than transactional
leadership. In Chile, Pedraja-Rejas et al. (2006) concluded that the effect of
transformational leadership on organisational performance is stronger than the effects
of transactional and laissez-faire types of leadership. Finally, a more recent study by
Chiang and Wang (2012) of 395 employees from 41 hotels in Taiwan also concluded
that transformational leadership is positively related to cognitive and affective trust
whereas transactional leadership is negatively related to cognitive trust.
Perhaps due to cultural differences, transformational leadership might not be relevant
in developing countries like Malaysia. But given the outcomes generated from every
part of the world in regard to the effect of transformational leadership on

40
organisational performance, similar results might be produced. Although Swierczek
(1991) initially suggested that a Western leadership theory might not be appropriate
worldwide, his results stated otherwise. This means that there might be a possibility
of a universal theory of leadership and that the transformational leadership theory
might have similar effects across cultures.
The fact remains that transformational and transactional leadership theory is the most
recent and commonly used leadership theory by researchers in the current literature
(Pawar 2003; Lo et al. 2009; Law 2011; Judge & Piccolo 2004) and has been proved
to have impacts on the performance of organisations (Law 2011; Matzler et al. 2008).
Judge and Bono (2000) found that from 1990 to 2003, the transformational theory of
leadership was more often cited in articles published in PsycINFO than all the other
leadership theories combined.
2.2.3.1 Criticisms of Transformational Leadership Theory
Despite its popularity, transformational leadership theory has been criticised for
certain weaknesses and limitations. For example, Northouse (2007, 2012) asserted
that the weaknesses of transformational leadership are that it has many components
that seem too broad, it treats leadership more as a set of personality traits than as
learned behaviour, and it has the potential for abusing power. Earlier, Yukl (1999)
claimed that one of the weaknesses of transformational leadership is to the ambiguity
underlying its influences and processes. He claimed that the theory is incapable of
explaining the interacting variables between transformational leadership and positive
work outcomes. The ability of this theory to clearly identify essential influences and

41
to explain how each type of behaviour affects mediating variables and the outcome
would strengthen its utility.
Another weakness of transformational leadership theory as claimed by Yukl (1999) is
related to the ambiguity in explaining the theoretical rationale when differentiating
between different types of embedded behaviour. Research has indicated a partial
overlap of different types of behaviour and a high correlation between different
aspects of transformational behaviour, thus raising doubts about their construct
validity (Geyer & Steyer 1998). For example, ‘intellectual stimulation’ is understood
as a leader motivating a subordinate to question traditional beliefs, to identify
innovative solutions for problems and to view problems in different ways. This
definition has been found to be too broad and ambiguous because it does not clearly
describe what the leader says or does to engage the cognitive processes and
behaviour of followers (Odumeru & Ifeanyi 2013).
Currie and Locket (2007) questioned the effectiveness of this theory in the context of
public service organisations. They argued that a leadership approach should vary
according to organisational circumstances and the type of problems the leader
encounters. Their study in English secondary schools showed that policy makers’
transformational leadership style is ineffective in organisations of this type. They
claimed that ‘leadership of public sector organisations in England appears less about
transforming circumstances… and more about embedding change that others, policy-
makers, have initiated’ (p. 365). Due to the constraints of legal, regulatory and policy
rules, leaders in a public sector organisation may refuse to delegate leadership as they

42
are held accountable for the performance of their organisations; this contradicts the
theory of transformational leadership.
In addition, this theory adopts the ‘heroic leadership stereotype’ (Odumeru & Ifeanyi
2013, p. 357), similar to the majority of leadership theories. The idea of an
organisation, group or employee performing above expectations is too dependent on
leadership by an individual with appropriate skills for identifying effective methods
and motivating others to carry them out.
There have also been other criticisms about the measurements used to measure
transformational leadership (Yukl 1994; Tepper & Percy 1994; Tracey & Hinkin
1998; Davis & Luthans 1979; House & Podsakoff 1994; Mosley 1998). This is
elaborated in Section 2.2.5 in a discussion of the Multifactor Leadership
Questionnaire (MLQ).
2.2.4 Transformational Leadership and SMEs
Ardichvili (2001) claimed that there is universal acceptance of the importance of
leadership in large organisations, but research on leadership behaviour in small
businesses and new ventures is scarce. To date, there have been many initiatives by
scholars and researchers to assess the importance of transformational and
transactional leadership in SMEs (Hood 2003, Yang 2008, Matzler et al. 2008; Visser
et al. 2005; Pedraja-Rejas et al. 2006; Damirch et al. 2011) and many have found that
transformational leadership is relevant to the context of the SME business
environment (Hayat & Riaz 2011; Matzler et al. 2008; Ling et al. 2008). For
example, Hayat and Riaz (2011) claimed that transformational and transactional

43
leadership types are highly relevant to SMEs as they are closely related to the
business approach of SMEs and the environment in which entrepreneurs operate.
Matzler et al. (2008) maintained that transformational leadership is strongly related to
entrepreneurship and SMEs. They reasoned that because SMEs are small, the
entrepreneur is the one who guides the vision and direction, which is equivalent to
the idealised influence of transformational leadership. Being able to communicate
expectations to each employee is relevant to the inspirational and individualised
aspects of transformational leadership characteristics. Secondly, they argued that, due
to limited resources, SMEs explicitly address the intrinsic motivation of employees
because SMEs are unable to use extensive extrinsic rewards in transactions with
employees since they do not have enough financial leeway. Finally, they argued that
SMEs operate in a dynamic environment and global economy which are
distinguished by unpredictable opportunities and threats; therefore, transformational
leadership is perhaps suitable for SMEs to adapt to this kind of environment.
In line with the view of Matzler et al., Ling et al. (2008) also reasoned that the less
complex and more fluid nature of SMEs than large organisations provides an
advantageous setting for transformational CEOs to play a significant role in
enhancing organisational performance. CEOs in SMEs have a great level of
managerial discretion and freedom in which they are more fully empowered than
CEOs in large organisations to empower others. In 2003, Hood examined the data
from 382 CEOs of small to medium size high-technology firms in the US. The results
of her study demonstrated that the impact of transformational leadership on ethical
practices is greater and more significant than the impact of transactional or laissez-

44
faire leadership. She concluded that transactional leaders may follow ethical practices
that are legal mandates, whereas transformational leaders go beyond the legal
requirements and voluntarily undertake more socially responsible and ethical
practices.
Finally, Visser et al. (2005) conducted a study of transformational leadership in
South Africa involving 535 owners and managers of SMEs. The results revealed that
there is a medium degree of positive relationship between transformational leadership
and entrepreneurship. They showed that owners and managers of SMEs in South
Africa possess characteristics of both entrepreneurs and transformational leaders.
These studies have concurred that the transformational and transactional leadership
theory is applicable to the SME business environment. Regardless of the size of an
organisation, leaders who effectively deploy transformational and transactional
leadership produce positive results for their organisations.
2.2.5 Multifactor Leadership Questionnaire (MLQ)
The Multifactor Leadership Questionnaire (MLQ) is the measure of a wide range of
leadership behaviour, including non-leadership behaviour, leaders who use
contingent rewards to followers, and leaders who transform their followers by being
attentive to their higher order needs. The MLQ has been used in many previous
studies on transformational leadership to measure various aspects of
transformational/transactional leadership behaviour (Muenjohn & Armstrong 2008;
Tejeda et al. 2001).

45
Many research programs, empirical research investigations, doctoral dissertations and
master’s theses all around the world have used the MLQ. The MLQ has proved to be
a highly credible and trustworthy tool for measuring leadership behaviour and
leadership effectiveness.
Even though Ozaralli (2003) contended that the MLQ is perhaps the best validated
tool for measuring transformational and transactional leadership, the psychometric
properties of the MLQ have been criticised (Yukl 1994; Tepper & Percy 1994;
Tracey & Hinkin 1998). One of the criticisms has been that it has a heavily reliance
on questionnaires to evaluate the behaviour of leaders and followers (Davis &
Luthans 1979; House & Podsakoff 1994). This criticism has led to construct validity
issues regarding whether researchers are accurately measuring leaders’ behaviour and
the reasons followers give for performance outcomes (Mosley 1998).
Tepper and Percy (1994) examined the factor structure of a reduced 24-item version
of Bass and Avolio’s (1990) 72-item MLQ. Confirmatory factor analysis (CFA) was
performed to examine the factor structure by using a sample of 290 undergraduates
and 95 managers. They found that none of the hypothesised models was supported,
and the idealised influence and inspirational motivation scales converged to a single
latent construct. They also reported that the management-by-exception scales may
need improvement or reinterpretation because none of the hypothesised models
produced an acceptable fit when these scales were included in the analysis.
Geyer and Steyrer (1998) reported that there were high correlations among the
transformational leadership scales. There was also a high positive correlation

46
between the transformational leadership scale and contingent reward. Only after the
original MLQ was modified to consist of only 35 items were the correlations
reduced. The modified scales still produced two basic factors of both
transformational and transactional leadership. A recent study by Kelloway et al.
(2012) based on a sample of 269 in the US also found high correlations among the
transformational leadership scales.
Yukl (1999) highlighted other weaknesses of the transformational leadership theory:
oversimplifying a complex phenomenon, omission of relevant behaviour, too much
emphasis on dyadic processes and other problems. He added that several aspects of
leadership behaviour that are relevant for understanding leadership effectiveness are
not included in the measurement scales. Some task behaviour such as planning and
clarifying, some relationship behaviour such as team building and networking and
some change-oriented behaviour such as scanning and analysing the external
environment are not included in the measurement of leadership effectiveness.
A study by Muenjohn and Armstrong (2008) demonstrated that the nine-correlated
factor model (Full Leadership Model) could be the most appropriate for capturing the
constructs of transformational and transactional leadership. Based on 138 samples,
this study contended that even though some of the leadership scales were strongly
correlated to each other, these scales still clearly measured their own leadership
constructs. Despite arguments relating to the MLQ, Kirkbride (2006) and Zagoršek et
al. (2009) stated that the MLQ remains the most widely used and tested measure for
transformational leadership theory.

47
One of the advantages of using the MLQ is that it is a multi-rater assessment
measure. There is a variety of MLQ tools to choose from in order to assess leadership
behaviour from the perception of the leaders themselves, followers’ assessments of
their leaders’ effectiveness and team perception of the leader’s behaviour. There is
also a resource tool for use in leadership training. Due to its wide acceptance as a
measure of leadership, the original MLQ has been translated into many languages
and is now available in French, Arabic, Spanish, Italian, Chinese, Korean, Thai and
Greek. The following are some of the researchers who have used the MLQ and also
brief descriptions of their studies.
Khan et al. (2009) studied 296 top- and middle-level managers from the main
telecommunications firms in Pakistan by using the transformational leadership
subscale of the MLQ. Their results substantiated that transformational leadership has
a significant and positive impact on organisational innovation.
Chen (2002) used the MLQ with 308 employees from three steel companies in
Taiwan to study the relationship between leadership behaviour and organisational
commitment. He concluded that, at the factor level, idealised influence, inspirational
motivation and individualised consideration are more strongly correlated with
organisational commitment than the other factors of transformational and
transactional leadership are. At the construct level, transformational leadership was
found to have a stronger correlation than transactional leadership with organisational
commitment.

48
Finally, based on the ratings of 2200 employees of the leadership styles of top- and
middle-level managers in a large telecommunications organisation, Berson and
Avolio (2004) demonstrated that leaders rated as transformational displayed a
‘prospector’ strategy in their perception and development of strategic goals. Their
qualitative and quantitative results also showed that in disseminating organisational
goals, leaders with transformational leadership attributes are seen as more effective
communicators by their direct employees.
Even though other measures have been established to assess transformational and
transactional leadership (Rafferty & Griffin 2004; Podsakof et al. 1990), the MLQ is
considered the best validated tool (Ozaralli 2003) and remains the most widely used
and tested measure to describe transformational leadership (Kirkbride 2006;
Zagoršek et al. 2009). Therefore, it is adopted in this study as a measure of leadership
behaviour.
2.2.6 Recent Leadership Theories
This study acknowledges that other leadership theories have started to receive some
attention in leadership literature, such as spiritual leadership, distributed leadership,
servant leadership, authentic leadership and many others. ‘Spiritual leadership’ is
defined as the values, attitudes and behaviour that are necessary to intrinsically
motivate oneself and others to have a sense of spiritual survival and well-being
through calling and membership (Fry 2003). ‘Distributed leadership’ is defined as
leadership from a distance, where communication is done through technological
means such as e-mail and websites (Kayworth & Leidner 2000).
49
However, these new forms of leadership behaviour are beyond the scope of this
study. Some researchers have questioned the applicability of these new concepts to
SMEs (Kempster et al. 2010). For example, given the size of SMEs, perhaps
applying distributed leadership may not be effective since there is a lack of
agreement on whether distributed leadership exists, and the effects of applying this
form of leadership to SMEs have yet to be explored. Therefore these new forms of
leadership behaviour are not included.
Even with the introduction of newer leadership approaches, the transformational and
transactional leadership theory has proved to be relevant in the context of SMEs
(Matzler et al. 2008; Pedraja-Rejas et al. 2006; Damirch et al. 2011). Measures
adopted to assess these types of leadership are well validated in Western literature.
However, these measures need to be applied in the context of a developing country
such as Malaysia to assess their suitability and transferability to a different context.
2.3 Entrepreneurship and Entrepreneurial Orientation
In today’s competitive business environment, strengthening entrepreneurship is
important for any enterprise that is developing its responsiveness to a globalised and
changing environment. Entrepreneurship, according to the concept introduced by
Schumpeter in 1934, is characterised by innovative behaviour and a strategic
orientation in pursuit of profitability and growth (Carland et al. 1988) and it involves
a process of combining resources for value creation in an organisation (Tan 2007).
Others have defined entrepreneurship as the creation of new enterprise (Low &
MacMillan 1988), new entry (Lumpkin & Dess 1996) and taking advantage of

50
opportunities by blending resources in ways which have impacts on the market
(Wiklund 1999).
Bruyat and Julien (2000) outlined certain basic ideas that have to be shared by
researchers in the field of entrepreneurship:
i. Recognition of the individual as an important or vital element in the creation
of new value. Entrepreneurs are definitely not the only people who create new
value for society through venture creation or through innovations of different
kinds. However, they create a large percentage of new value, which
researchers in this field consider to be essential for the proper operation of the
economic system.
ii. The individual is not simply a machine reacting automatically to stimuli from
the environment. The individual is able to learn and develop, is capable of
self-finalisation, and therefore has a certain freedom of action, regardless of
whether the environment provides opportunities or imposes constraints.
iii. The resources in the environment can play a facilitating or motivating role in
helping to increase the number of entrepreneurs in a country.
Compared to the leadership field that has received scholarly attention since the
beginning of the 20th century, entrepreneurship is a young body of knowledge
although rapidly growing (Cogliser & Brigham 2004). The study of entrepreneurship
is at an early stage of development from the conceptual and methodological points of
view (Aldrich & Baker 1997), relatively young compared with the leadership field
(Hitt & Ireland 2000) and currently seen as being in significant growth and an
emerging stage of development (Busenitz et al. 2003).

51
Entrepreneurial orientation (EO), on the other hand, is becoming a popular subject
(Wiklund 1999) and is one of the entrepreneurship research fields where the body of
knowledge is expanding (Rauch et al. 2009). Covin and Wales (2012) also
recognised that the subject of EO as a driving force behind organisational effort to
success has become a central focus of the entrepreneurship literature and the subject
of more than 30 years of research. The study of EO is well established in strategy and
entrepreneurship research in the US but is still in its infancy in non-US business
environments (Runyan et al. 2012).
Miller (1983) defined an entrepreneurial firm as one that is involved in product-
market innovation, willing to take some risks, and is first to come up with proactive
innovations. A non-entrepreneurial firm is characterised by a minimum level of
innovations, is not a risk taker, and is a follower rather than a pioneer compared to
the competitors (Miller 1983). Lumpkin and Dess (1996) defined EO as ‘the process,
practices and decision-making activities that lead to new entry’ (p. 771). More
recently, Wiklund and Shepherd (2005) defined EO as the strategic orientation of a
firm that captures specific aspects of entrepreneurial decision-making styles, methods
and practices. But the definition of EO by Morris and Paul (1987) seems to suit the
context of this study. They defined EO as the inclination of a company’s top
management to take calculated risks, to be innovative, and to display proactiveness in
their approach to strategic decision making.
This definition is not the one currently adopted by most scholars in the field of
entrepreneurship studies; it it is one of the earliest ones used to define EO. In this
definition, EO is regarded as decisions to be made by the top management of an
52
organisation. For the self-assessment approach by either the owners or the top
managers of SME establishments to measure EO, this definition seems to represent
and support the scope of this study.
2.3.1 Key Factors of Entrepreneurial Orientation
The three main factors of EO introduced by Miller (1983) are: innovativeness,
proactiveness and risk taking. These key factors of EO have been extensively used by
researchers in previous studies (Covin & Slevin 1989; Lumpkin & Dess 1996;
Moreno & Casillas 2008). Lumpkin and Dess (1996) added another two factors of
EO: competitive aggressiveness and autonomy. Although they suggested including
these two as additional factors of a firm’s EO, they agreed that innovativeness,
proactiveness and risk taking are the key factors of EO.
In this study, only the three key factors of EO are adopted, namely, innovativeness,
proactiveness and risk taking by strategic leaders. An innovative firm is not
considered entrepreneurial if it does not take risks or is not being proactive towards
competitors and the environment (Aloulou & Fayolle 2005). According to Covin and
Slevin (1989), a firm that displays an excellent performance in these three factors can
be considered an entrepreneurial firm or a high performing firm. They proposed that
entrepreneurial style measures the degree to which top managers favour innovative
activities, are inclined to take considerable business risks and proactively compete
with other firms.
There are several reasons why this study excludes the new factors of EO suggested
by Lumpkin and Dess (1996). Competitive aggressiveness, which represents the

53
element of ‘beating competitors to the punch’, might not be appropriate in the
Malaysian culture. According to Hofstede (1980, 2001), in respect to cultural factors,
Malaysia can be characterised as having low uncertainty avoidance and a highly
collectivist culture. These cultural characteristics result in a low level of aggression
and a relatively high level of tolerance. Autonomy, on the other hand, which
describes a firm’s tendency to independent and autonomous action, represents the
ownership issue which is a defining characteristic of SMEs (Swierczek & Thanh Ha
2003b). Kuratko et al. (2005) argued that the concept of competitiveness often
overlaps with proactiveness, while autonomy can be seen as a contextual variable
that allows entrepreneurial behaviour. For these reasons, only the initial factors of EO
as suggested by Miller (1983) are adopted. The following passages discuss and
define each component of EO used in this study.
Covin and Miles (1999) proposed that entrepreneurship would not exist without
innovation. Hult et al. (2004) agreed that the key element of the success of industrial
firms is innovativeness. Lumpkin and Dess (1996) defined innovativeness as the
willingness of a firm to engage in and support new ideas, novelty and
experimentation to create new products and services. Innovation is especially
important for new organisations and entrepreneurs because without innovation, they
have to rely on old ways of doing business, consecutive products or services and
traditional distributions channels (Lee et al. 2001). These authors also claimed that
innovativeness displayed by new firms cannot be easily imitated by their competitors
since it depends on the quantity and quality of R&D personnel and complex social
relationships among these research scientists. Entrepreneurs need to avoid direct
competition with established firms to avoid failure due to resource shortcomings,

54
diseconomies of scale and unestablished reputation (Lee et al. 2001). Morris et al.
(2007) defined innovativeness as the identification of creative, unusual or novel
solutions to problems and needs. These solutions can take the form of new processes,
new products or new services.
Proactiveness is an important element of entrepreneurship (Venkatraman 1989).
Proactiveness has been described as the ability of a firm to foresee and act on future
wants and needs in the market by establishing a first-mover advantage ahead of
competitors (Lumpkin & Dess 1996). Proactive firms strive to be pioneers, thereby
capitalising on emerging opportunities (Wiklund & Shepherd 2005). Proactiveness is
also important for organisational processes since it demands a forward-looking
perspective (Kropp & Zolin 2005) and is considered a hallmark of entrepreneurship
(Lee et al. 2001). Therefore, it is important for entrepreneurial firms to be proactive,
especially as the competition is becoming very strong in the global market, in order
to capture a high return from their investment and to establish their reputation in the
market. Proactiveness also relates to the implementation of something new, and to
doing what is needed to anticipate and act on an entrepreneurial opportunity. Such
pioneering action usually involves considerable perseverance, adaptability and
tolerance of failure (Morris et al. 2007).
Risk taking can be described as the willingness of a firm to provide resources for
projects where the outcomes are uncertain (Miller 1983; Wiklund & Shepherd 2005).
Since the term ‘entrepreneur’ was first debated, risk-taking behaviour has been linked
with entrepreneurship (Palich & Bagby 1995). Risk taking requires firms to take bold
actions by launching themselves into the unknown, borrowing heavily and/or
55
investing significant resources in uncertain ventures or uncertain environments
(Rauch et al. 2009). Risk taking supplements the entrepreneur’s innovativeness and
proactivity because without taking risks, it is difficult for entrepreneurial firms to
invest in the R&D needed for them to become pioneers in the marketplace.
2.3.2 Research and Practices of Entrepreneurial Orientation
There has been growing research interest in the field of EO (Kreiser et al. 2002),
particularly in small businesses (Fairoz et al. 2010). Even though the concept of EO
seems to be more relevant to entrepreneurs in the SME business environment, many
attempts also have been made by scholars and practitioners to study the impacts of
EO on large organisations (Hult et al. 2003; Short et al. 2009; Hult et al. 2004) and
family firms (Zahra 2005; Zellweger et al. 2011), on students (Mazzarol 2007), on
new ventures (Chen et al. 2007) and in countries all over the world such as Iran
(Madhoushi et al. 2011), Brazil (Martens et al. 2010), Portugal (Ferreira & Azevado
2005), Thailand (Swierczek & Thanh Ha 2003a) and even Malaysia (Arham et al.
2012; Zainol & Ayadurai 2011).
When examining the research on EO in large organisations, Zahra published
independent studies in 2005, 2003, 1996 and 1991. In her 2005 study, she examined
entrepreneurial risk-taking in 209 large family firms and concluded that family
ownership has a particular pattern in entrepreneurial risk-taking. Family firms tend to
invest in both domestic and international markets to increase revenue. She found that
the higher the number of active generations from the same owner family, the higher
the focus on innovation. Multiple generations brought new ideas, knowledge and
experience which enhanced the degree of innovation in the firm.
56
Hult et al. (2004) examined the effects of innovativeness and EO on business
performance in 181 large firms in the US. They concluded that EO is one of the
strongest components of performance and plays a key role in the development and
maintenance of innovation in both high and low market turbulence. They suggested
that EO is an important orientation for managers to promote.
In smaller business settings, EO is needed to improve the performance of the firm.
Smart and Conan (2011) studied 599 independent small business retailers in the US
and found that EO impacted in respect to both distinctive marketing competencies
and organisational performance. Retailers with a high level of EO acknowledge that
their businesses possess a wide range of marketing competencies and perform better.
Successful entrepreneurs not only possess a wide variety of managerial skills and
abilities and have a significant tendency for taking high risks, but they are also
analytic in their approach to decision making and resource allocation. Ferreira and
Azevedo (2008) studied 168 small manufacturing firms in Portugal and pointed out
that entrepreneurial firms are capable of introducing many new products featuring
many differentiated characteristics and these firms are efficient in exploiting their
innovativeness, proactivity and risk taking. They suggested that the application of EO
is an indispensable variable to growth-oriented firms.
The results from all of these studies suggest that EO is an important strategic
orientation for firms of all sizes. Regardless of firm size, firms that are able to
exploit, seize and utilise every opportunity to improve their EO have a high chance of
improving their profitability and growth. Evidence suggests that firms that are
innovative, proactive and willing to take considerable risks have a much better

57
chance of success than firms which are unwilling to take risks, avoid creative and
innovative ideas and are not responsive to market competition.
A significant number of researchers have claimed that the application of EO at the
individual level could be important for both managers and their organisations
(Carland et al. 1988; Gartner 1985). The analysis of EO as an individual-level
variable has started to receive some consideration from researchers (Davis et al.
2010). Aloulou and Fayolle (2005) identified that individual leaders of
entrepreneurial firms show a high level of innovativeness, proactiveness and risk-
taking behaviour. Wiklund and Shepherd (2005), on the hand, contended that EO is
an organisational-level variable. They defined EO as referring to a firm’s strategic
orientation that displays specific elements of entrepreneurial decision-making styles,
methods and practices. Treating EO as an organisational-level measure would also
help to reduce common method variance (Lumpkin & Dess 2001; Podsakoff &
Organ 1986). This view claims that owners’ or top managers’ responses in regard to
EO represent the firm’s responses (Awang et al. 2009; Yang 2008).
One of the issues in regard to EO is whether EO is a global and cross-cultural
construct. Some researchers have proved that it is (Kreiser et al. 2002; Arbaugh et al.
2009). For example, Kreiser et al. (2002) examined 1067 firms from six different
countries: Australia, Finland, Mexico, the Netherlands, Norway and Sweden. Their
study confirmed the cross-cultural validity of the EO scale. A much larger study
conducted by Arbough et al. (2009), which consisted of 1045 respondents from 17
different countries, suggested that the EO construct is not only globally generalisable
to developed countries, but the construct also has a huge potential for explaining firm

58
behaviour in developing countries and therefore the firm-level characteristics of
entrepreneurship are generalisable across borders. More rencently, Runyan et al.
(2012) used samples of SMEs from both the US (n=250) and China (n=187) and their
findings contended that scholars should feel confident to utilise EO in an
international setting since EO exhibited the same pattern of factor loadings across
SMEs in both countries, allowing scholars to assume that the basic underlying
purpose of EO and its factors are the same in both countries.
There is also a debate on whether EO should be treated as a uni-dimensional
construct consisting of innovativeness, proactiveness and risk taking or as a multi-
dimensional construct where each component varies independently of one another. In
some studies, the factors of EO showed high correlations with each other so the
researchers combined these factors into a single factor (Covin & Slevin 1989; Lee et
al. 2001; Rauch et al. 2009). However, more recent studies have suggested that EO is
a multi-dimensional construct and each independent aspect of EO may affect the
performance of an organisation differently (Lumpkin & Dess 2001; Yang 2008;
Runyan et al. 2012). Kreiser et al. (2002) found that the EO best model fit was
produced in the total sample in six independent countries with three sub-factors
consisting of innovativeness, proactiveness and risk taking. At the same time, the
three sub-factors were also found to vary independently of one another.
Regardless of whether or not EO is a uni-dimensional or multi-dimensional construct,
each component is essential, and even if the components can operate independently,
each is not sufficient without the presence of the other two components. In other
words, to be entrepreneurial is to demonstrate the ability to innovate, to be proactive
59
and to take a considerable amount of risk (Morris et al. 2007). The aggregated
measures of EO are useful when a differential relationship is not expected between
the three sub-factors of entrepreneurial orientation and the other key variables being
examined in a particular research model. On the other hand, when such a relationship
is expected to exist, researchers should measure innovation, proactiveness and risk
taking as single variables (Kreiser et al. 2002).
In conclusion, it is important to assess the level of EO as a measure of entrepreneurial
success. Whether it relates to large organisations or to small and medium-sized
enterprises, EO can contribute to the overall performance of a firm. Some studies
have identified a direct and statistically significant relationship between EO and
organisational performance (Zahra 1991; Smart & Conan 1994; Hult et al. 2004;
Ferreira & Azevedo 2008; Smart & Conant 2011). Miller (1983) stated that
innovativeness, risk taking and proactiveness are all important elements of
entrepreneurial activity. By investing efforts into innovativeness, firms can create
new products or services, developing novel ideas and gaining first advantage in the
market (Wiklund 1999; Lumpkin & Dess 1996). By taking considerable risks with
the careful exploitation of those risks, entrepreneurs increase the opportunities to
increase their profits. Lumpkin and Dess (1996) suggested that risk taking and
organisational success were related since risk takers have a high possibility of
making a profit. Finally, having the ability to anticipate changes and react to the
changing environment and seizing the first-mover advantage helps firms to stay
ahead of their competitors.

60
To summarise, EO is important for organisational success and each factor of EO
might have different effects on the outcomes of organisations. This study explores
this by suggesting that each factor of EO has a direct impact on measures of
performance. At the same time, this study examines whether the presence of EO
might mediate the relationship between leadership behaviour and organisational
performance. As Avolio and Howell (1992) suggested, transformational and
transactional leadership predict the levels of innovation and creativity that relate to
proactiveness and risk taking.
2.4 Organisational Performance
Organisational performance is the most important dependent variable for researchers
concerned with almost all areas of management (Richard et al. 2008), because it
explains how well an organisation is doing (Obiwuru et al. 2011). It refers to the
ability of an enterprise to achieve objectives such as high profits, good quality
products, a large market share, good financial outcomes and long-term survival,
using relevant strategies for action (Koonts & Donnell 1993). It is an indicator of
how well a firm realises its objectives (Ho 2008). According to Lusthaus et al.
(2002), the analysis of organisational performance is an important step in ensuring
organisational success but yet there is little agreement as to what constitutes a valid
set of criteria for measuring organisational performance due to the complexity of the
construct. Even though the literature in organisational research shows that
organisational performance has been used extensively as a dependent variable and
that many studies concentrated on identifying the factors that affect the variability in

61
performance outcomes, it is still an indistinct and ‘loosely defined’ variable (Rogers
& Wright 1998, p. 6; March & Sutton 1997; Richard et al. 2008).
From their analyses, Lusthaus et al. (2002) concluded that organisational
performance can be defined in terms of the following elements; effectiveness (ability
of the organisation to achieve its goals), efficiency (accuracy, how economically the
organisation can turn resources/inputs into results), relevance (being adaptive to the
stakeholders and its environment) and financial viability (ability to raise required
funds). Richard et al. (2008) defined organisational performance as encompassing
three specific areas of firm outcomes: (1) financial performance (profits, return on
assets etc.); (2) product market performance (sales, market share etc.); and (3)
shareholder return (total shareholder return, economic value added etc.). Metrics
chosen to quantify the efficiency and/or effectiveness of an action by the organisation
are referred to as organisational performance measures (Tangen 2003).
Carton and Hofer (2006) described five categories of performance measures:
accounting measures (relying on financial information); operational measures
(include non-financial variables such as market share and customer satisfaction);
market-based measures (ratios of the market value of the organisation such as return
to shareholders and market value-added); survival measures (long-term
organisational performance); and economic value measures (adjusted accounting
measures). Accounting measures could be further sub-categorised into profitability
measures, growth measures, leverage, liquidity and cash flow measures, and
efficiency measures.

62
The authors concluded that each category of measures has its strengths and
weaknesses in assessing overall organisational performance. What is certain is that
no individual performance measure category is commonly accepted as the best proxy
for overall performance measurement and further analysis needs to be done to
provide a better understanding of this construct (Carton & Hofer 2006).
Organisational performance can also be measured through financial and non-
financial performance (Chong 2008). Financial measures can include profit before
tax and turnover and non-financial measures can include issues relating to customers’
satisfaction and referral rates, delivery time and employee turnover. Non-financial
performance measures are important indicators of financial performance (Kaplan &
Norton 2001). They can provide managers with incentives to improve their long-term
financial performance. On the other hand, financial performance measures are
‘backward-looking’ and focus on improving the organisation’s short-term financial
performance (Moers 2000).
Zulkiffli and Parera (2011) wrote a paper analysing the basic research methodologies
and approaches for measuring business performance, especially in the context of
SMEs. According to these authors, to assess business performance in the present
business environment is a critical matter for academic scholars and practising
managers and it is important to measure a firm’s accomplishment. When it comes to
measuring the business performance of SMEs, many scholars have used subjective
measures since many SMEs refuse to publicly reveal their actual financial
performance. According to Dess and Robinson (1984), objective data do not fully
represent an organisation’s actual performance, even if they are available, since the

63
managers may manipulate the data in order to avoid personal or corporate taxes.
Therefore, the literature advocates subjective evaluation as an appropriate alternative
to objective evaluation.
Wall et al. (2004) asserted that managers are encouraged to assess business
performance through general subjective measures that can reflect more specific
objective measures. In particular, the use of subjective measures is preferable for
evaluating small organisations where there is a possibility of inaccurate financial
records (Wall et al. 2004). Subjective measures can also be a good alternative when
they focus on a firm’s current condition (Kim 2006) and they allow comparisons to
be made across firms contexts such as industry type or economic conditions (Song et
al. 2005).
Performance is a multi-dimensional concept (Lumpkin & Dess 1996; Carton & Hofer
2006), therefore multiple measures of performance should be used. Becoming a high
performing firm is the main objective of SMEs (Ahmad & Ghani 2010; Madrid-
Guijarro et al. 2007). According Madrid-Guijarro et al. (2007), high performing firms
are able to generate a variety of benefits for both the company and society in general
such as attracting resources, creating wealth and generating jobs. These authors also
claimed that an accurate measure of performance can provide reliable insight into
what affects performance and how firms can develop good strategies, arrange
resources, meet consumer expectations and compete successfully. Inappropriate
measures of performance will produce misleading results and tend to show a poor
competitive position (Madrid-Guijarro et al. 2007). Murphy et al. (1996) confirmed
that growth, profitability and efficiency are the most common performance factors in

64
the entrepreneurship literature. In this study, the organisational performance of SMEs
is measured through growth and profitability, following the measures used in the
studies conducted by Matzler et al. (2008) and Tan (2007). This decision also aligns
with Covin and Slevin’s (1991) conviction that growth and profitability represent the
factors of a firm’s economic performance. Steffens et al. (2006) also claimed that
both are important factors for SMEs performance.
Davidsson et al. (2002) postulated that organisational growth has become mainstream
in the literature with many studies incorporating growth and entrepreneurship.
Growth has been argued as an essential element of sustainable competitive advantage
and profitability (Markman 2002), and it is hard to dissociate sustained growth from
profitability (Fitzsimmons et al. 2005).
In conclusion, growth is considered the most important performance measure since it
is a more precise and more easily accessible performance measure than accounting
indicators, and hence provides a superior indicator of financial performance,
especially for small firms (Wiklund 1999). In the entrepreneurship literature, growth
is often interpreted as evidence of success (Steffens et al. 2006) and is used as the
best available proxy for organisational success due to the fact that reliable data on the
financial performance of small firms can be difficult to obtain. Wiklund (1998) found
that his multiple measures of growth and financial performance were positively
related to one another. Based on these relationships, he concluded that growth may
be an appropriate strategy for small firms that wish to enhance their financial returns.
Ferreira and Azevedo (2008) suggested that organisational growth reflects an
important outcome of the entrepreneurial behaviour of small firms.
65
Profitability is one of the most common measures of business performance that must
be considered as it is unlikely that firm growth can be sustained without profits
(Fitzsimmons et al. 2005). Looking at entrepreneurship as the creation of rents
through innovation (Stewart 1991), in which ‘rents’ are defined as above average
earnings relative to competitors (Norton & Moore 2002), then profitability measures
also seem relevant to SMEs.
Thus, reviewing the proposed research questions and the scope of this study, growth
and profitability might be the most relevant measures in the context of SMEs in
Malaysia. These two dependent measures represent the two main objectives for any
SME establishment: to continue operating and to earn a profit.
2.5 Leadership, Entrepreneurial Orientation and Organisational
Performance
Good leadership and an entrepreneurial attitude have been identified as the key
elements that drive the success of SMEs (Abdul Razak 2010a). Evidence suggests
that inadequate leadership and poor management skills are primary factors
contributing to the failure of SMEs (CEML 2002; Davies et al. 2002). It is
acknowledged that an enterprise requires entrepreneurship, but what is further needed
to maintain the operation and guide the enterprise to success is good leadership
(Arham et al. 2011). Therefore, entrepreneurs need to develop sound leadership
behaviour to steer their firms through good and bad times. Appropriate leadership
behaviour in the enterprise keeps employees focused and motivated, especially at
times of crisis.

66
The right leadership behaviour is an important ingredient for good organisational
performance and to prevent organisational failures. As Fiedler (1996) recognised,
effective leaders are important because they contribute to the success or failure of a
group, an organisation and even a whole country. Achanga et al. (2006) conducted a
study on the critical success factors for implementing lean production in SMEs. One
of the main findings of this research is that to successfully implement lean
manufacturing in SMEs, strong leadership is essential. Sound leadership behaviour
facilitates the integration of all structures in the organisation and instils a vision for
the organisation, which could lead to improved performance.
A recent study by Valdiserri and Wilson (2010), which examined the impact of
leadership behaviour on the profitability and organisational success of 48 small
businesses in West Virginia and Pennsylvania, postulated that transformational and
transactional leadership behaviour contributes to the profitability and success of
small businesses. There was a strong correlation between transformational and
transactional leadership and profitability and a moderate correlation between
transformational and transactional leadership and organisational performance. They
concluded that transformational and transactional leaders are able to produce a
positive atmosphere, and inspire and encourage employees to perform at a high level.
Leaders with transformational and transactional leadership attributes contribute to a
good performance of the firm by demonstrating respect, integrity and direction to all
individuals in the firm. An earlier study by Hernez-Broome and Hughes (2004)
suggested that leaders of small businesses need to develop a good understanding of
forms of leadership behaviours in order to improve organisational performance.

67
A study by Chen (2004) of 749 respondents from 57 small and medium-sized
enterprises in Taiwan was on the same wavelength. Looking at the effects of culture
and leadership behaviour on firm performance, Chen concluded that good leadership
and personal commitment by top management are critical to organisational success.
Specifically, leaders with transformational leadership can promote an innovative
culture in a firm and enhance the performance of the organisation.
Different forms of leadership behaviour might affect performance differently (Yang
2008). In a study by Pedraja-rejas et al. (2006), they utilised the categories of
transformational, transactional and laissez-faire behaviours with a sample of 96
managers of small companies in Chile. They aimed at finding whether leadership
behaviour influences the performance (effectiveness) of small firms. The results
showed that the dominant form of leadership among managers of SMEs in Chile is
transactional leadership. However, a positively significant relationship was found
between transformational leadership and the effectiveness of the small firms. The
effects of transactional and laissez-faire leadership on firm performance were
negative but significant.
Using data from 121 small to medium-sized firms, Ling et al. (2008) examined the
impact of CEO transformational leadership on firm performance measured by
objective and subjective measures. These authors argued that SMEs provide a
particularly advantageous setting for transformational CEOs to play a central role in
improving firm performance. This is because the CEO of an SME is more fully
empowered than those in larger organisations and is therefore more able to fully
empower subordinates. In the setting of an SME, a CEO has a greater potential for

68
instilling individual commitment and establishing high expectations. Therefore, the
potential firm-level impact of transformational leadership will be most evident in the
SME environment. These arguments were supported by the finding of their study that
there is a significant association between the transformational leadership of CEOs
and firm performance. This finding contrasts with that of many researchers who have
found the transformational leadership of CEOs to have an insignificant influence on
firm performance in large firms (Agle et al. 2006; Ensley et al. 2006; Waldman et al.
2001). Ling et al. (2008) concluded that both objective and subjective measures of
performance are influenced by transformational CEOs, who are able to directly
encourage and support novel thinking among their subordinates due to the fact that
they are closely engaged in the implementation of the firm’s strategy and usually
have hands-on experience. Arnold et al. (2001) also suggested that the
transformational leadership of senior managers is a good predictor of improved
performance.
Behery (2008) examined the effects of transformational and transactional leadership
behaviour and knowledge sharing on organisational performance in the non-Western
context of the UAE business environment. Five hundred and four respondents from
ten large-scale companies participated in this study. Adopting the MLQ to measure
leadership behaviour, his findings validated the hypotheses of the study that both
types of leadership behaviour significantly influence organisational performance. The
study also demonstrated that there is universality in the MLQ as it was appropriate in
a non-Western context.

69
In an earlier study by Geyer and Steyrer (1998), an examination of the effects of
transformational leadership and objective performance on banks produced the same
results. Using 1456 samples from 116 branches of 20 different banks in Austria, the
results confirmed that transformational and transactional leadership scales correlated
much more strongly with extra effort than objective performance measures did.
Interestingly, individualised consideration was found to be unrelated to the long-term
performance of banks in Austria. Even though the original factor structure of the
MLQ could not be maintained, the modified MLQ still allowed for the two
dimensions of transformational and transactional leadership. Further analysis
confirmed that transformational leadership has an effect on performance much
stronger than transactional leadership does.
While some researchers contend that leadership is important for the success of a firm,
others associate the failure of small businesses with poor leadership practices (Ihua
2009; Beaver 2003). Beaver (2003), in his observation of subjective and empirical
research on the success and failure of small business, concluded that most of the
causes of small business failure can be attributed to internal factors, which are mainly
the poor leadership and lack of management abilities of the key players in the firms.
A study by Gibb and Webb (1980), which examined the records of 200 bankrupt
firms, revealed that lack of knowledge and neglect by management are the primary
determinants for the failure of small firms. The key players of these firms ultimately
did not have the talent and abilities necessary to excel in business. He suggested that,
for firms to be innovative, productive and competitive, they need to have key players
with the right leadership behaviour combined with luck, good timing and adequate
training and support. Most importantly, for any firm to remain in business for a long

70
period, the leader must have the capability to adapt to the changing business
environment. These ingredients are important to sustain a successful economy
Recent empirical findings by Ihua (2009) in a comparative study conducted to assess
the key failure factors of SMEs in the UK and Nigeria revealed that poor
management and lack of leadership are the most crucial factor influencing SMEs’
failures in the UK while poor economic conditions and infrastructure inadequacy are
the most crucial factors in Nigeria. Even though the sample of this study comprised
only 45 questionnaires and two interviews with respondents from each country, and
therefore would not be expected to be generalisable to the whole population, the
findings still supported the notion that more efforts are needed to develop leadership
and management skills, even though these factors are applicable to the UK and not to
Nigeria. The findings revealed that 77% of the respondents in the UK chose
leadership and management compared to only 44% in Nigeria. These internal factors
need to be given more attention by policy makers in the UK to improve the
performance of SMEs. On the other hand, the Nigerian government needs to address
the difficult economic conditions and to improve the infrastructure inadequacy that
hinders the growth of SMEs.
The strengthening of entrepreneurship is important for any type of enterprise for
developing its responsiveness to a globalised and changing environment (Aloulou &
Fayolle 2005) and EO is considered a key element for a firm’s success (Wang 2008).
Davis et al. (2010) explored the relationship between the three entrepreneurial
characteristics of top managers and the impacts of these characteristics on the
performance of their organisations. The findings are consistent with past research
71
(Rauch et al. 2009) in supporting the contention that EO is positively related to
organisational performance. Specifically, these investigators confirmed that top
managers with a high tolerance of risk, those who favour innovation and those who
possess a high level of proactiveness positively influence organisational performance.
A study by Lee et al. (2001) on 137 Korean technology start-up companies revealed
that EO provides weak support for start-up companies’ performance. They have
suggested that it may require longer than two years for an EO to enhance the
performance of an organisation significantly. This finding is somewhat correlated
with the study conducted by Wiklund (1999), which found that EO has a long-term
effect on performance. The author suggested that it may be valuable for small firms
to invest in EO since it pays off, especially in the long term.
Fairoz et al. (2010) used the innovativeness, proactiveness and risk-taking factors in
their study to examine the degree of EO and its effect on the business performance of
small and medium-scale enterprises in Hambantota District Sri Lanka (HDSL). This
study concluded that there is a moderate degree of EO in the majority of SMEs in
HDSL. There is a positive significant relationship between proactiveness,
innovativeness, risk taking and overall EO on the one hand and market share growth
and overall business performance on the other hand. They also reported that sales
growth, profit and market share were higher for firms that with high EO than for
those with low EO.
Smart and Conant (2011) analysed 599 small business firms in the US and found that
firms with a high degree of EO have a stronger impact on organisational performance

72
than firms with a medium level of EO. A medium level of EO affects performance
more strongly than a low level of EO. Their results suggest that entrepreneurs with a
high level of EO are more effective in making strategic decision and allocating
resources, which result in better organisational performance.
Therefore, the form of leadership behaviour being practise by leaders has
implications for the level of entrepreneurship in a firm (Morris et al. 2007). In SMEs,
the leadership behaviour of top management can have a strong positive impact on the
innovativeness and the performance of the firm (Matzler et al. 2008). As business
becomes globally competitive, SMEs require a new vision and set of directions to
help them to become more competitive and to be able to sustain their business. The
leadership behaviour of the CEO or owner plays a major role in ensuring appropriate
directions and a clear vision to be shared with employees.
According to Stewart (1989), one of the most important elements of the
entrepreneurial process is individual leadership. It is the owner’s or manager’s
leadership style that helps foster entrepreneurial development in SMEs. Soriano and
Martinez (2007) investigated the importance of leadership in transmitting an
entrepreneurial spirit to the work team in an SME. They concluded that there is a
positive impact of a relationship-oriented style of leadership when the leader is
entrepreneurial. The leader supports the employees’ entrepreneurial potential and
encourages it to flow freely among the members of the team by giving them support,
rewards and personal consideration. This finding was supported by Wang and
Poutziouris (2010). According to their study, leaders of SMEs should be encouraged
73
to exercise a people-oriented style of leadership rather than a task-oriented approach
in order to bring success to their firms.
In their study, Hayat and Riaz (2011) investigated the influence of the leadership
style and EO of top-level managers of SMEs on business performance. They claimed
that effective leaders are needed in the rapidly changing global environment that
increases the intensities of business. Therefore, it is important for the leaders of
SMEs to fully understand the rapidly changing business environment and to adopt the
appropriate leadership styles to improve business performance. The study confirmed
that there is a positive relationship between the transformational and transactional
leadership styles of the leaders of SMEs and their performance. This study also
supported the idea that the higher the EO, the higher the SME’s performance. In
regard to the factors of EO, proactiveness and innovativeness were found to add more
value to the performance of SMEs than risk taking did.
Kang et al. (2010) conducted a study of three entrepreneurial companies in Korea,
which examined the relationships between leadership and cultural values and
organisational performance and the effect of EO as a mediating factor. This study
concluded that transformational leadership and long-term orientation have direct and
positive relationships with organisational performance. EO was found to have a
partial mediation effect between transformational leadership and organisational
performance. They claimed that transformational leadership plays a significant role
in shaping employees’ perceptions of EO and concluded that employees whose
manager portrays transformational leadership have more positive perceptions of EO
and hence help to improve organisational performance.

74
Bhattacharyya (2006) posited that the right leadership behaviour is important in
developing entrepreneurial behaviour since it creates the appropriate climate for
entrepreneurship and innovation in an organisation. Entrepreneurs with good
leadership practices, such as leaders who articulate vision, corporate objectives and
expectations, are inspirational. They motivate the management team and the
workforce, do not interfere in day-to-day operations unless necessary, patiently listen
to what others have to say about accomplishments, and acknowledge that team
achievements help the organisation to do better than their competitors. Therefore, this
type of leadership behaviour creates ways for an organisation to become more
entrepreneurial in its approach (Todorovic & Schlosser 2007).
There is limited research that specifically addresses the relationships between
leadership, EO and organisational performance simultaneously. But the results of
studies that have separately examined the relationship between leadership and
organisational performance and that between EO and organisational performance are
important indicators that both of these factors are essential to organisational success.
Leadership is important to provide clear guidance, direction and motivation to
employees and to drive the focus of the organisation, and an appropriate level of EO
provides the strategic orientation that can give a competitive edge.
To summarise, leadership relates to the level of EO in an organisation (Matzler et al.
2008; Morris et al. 2007). Aloulou and Fayolle (2005) claimed that the individual
leaders of entrepreneurial firms display proactive, innovative and risk-taking
characteristics. Yang (2008) postulated that the success of a new business venture is
critically determined by the role of the entrepreneurial leader. In his study, he found

75
that good predictors for differentiating between high and low organisational
performance were transformational leadership, innovation, proactiveness and risk
taking. This means that transformational leadership with a high entrepreneurial
orientation contributes to high organisational performance. Thus, examining the
mediating role of EO might provide a different avenue for understanding the direct
relationship between leadership and performance.
2.6 Summary
Even though research on leadership behaviour has been widely conducted throughout
the world, very little research has been done on leadership behaviour in small
businesses and new ventures (Ardichvili 2001). Regardless of where the organisation
is located and what it does, there is no denying that leadership is important for the
success of any organisation (Lusthaus et al. 2002; Bolden 2007; Van 2005). Yukl
(2002) suggested that the success of a small business clearly relies on the leader’s
innovative ideas and their strong aspirations for business success, and other
researchers have agreed that entrepreneurial leaders are very influential in shaping
the organisational climate (Kang et al. 2010). Finally, EO is an important strategic
orientation of a firm, and the leadership behaviour of the firm’s leaders is influential
in projecting and strengthening this strategic orientation which can influence the
firm’s performance and success (Aloulou & Fayolle 2005). To confirm the research
findings presented throughout this chapter, this study has examined the direct and
indirect relationships between transformational and transactional leadership and EO
and performance measures. The literature review leads to the following research
questions:

76
i. To what extent do transformational and transactional leadership behaviours
have an impact on organisational performance?
ii. Does transformational leadership have a stronger effect on organisational
performance than transactional leadership?
iii. To what extent does entrepreneurial orientation influence organisational
performance?
iv. To what extent does entrepreneurial orientation mediate the relationship
between leadership behaviour and organisational performance?
The next chapter presents a review of the literature relating to SMEs in Malaysia.
The review is further extended by looking at studies on the effects of
transformational leadership and EO on organisational performance in the specific
context of SMEs inMalaysia.
77
CHAPTER 3
OVERVIEW OF SMALL AND MEDIUM ENTERPRISES
(SMEs) IN MALAYSIA
3.1 Introduction
It is generally acknowledged that SMEs contribute significantly to the economic
development of a country. Panitchpakdi (2006) described SMEs as a source of
employment, economic dynamism, competition and innovation. SMEs encourage the
entrepreneurial spirit and the diffusion of skills. SMEs are also a major contributor to
improving income distribution since they are established in a wider geographical area
than large companies, including rural areas. This chapter presents an overview of
Malaysia and the SMEs in the country. Relevant literature on leadership and EO
research and practice is also discussed.
After the introduction, this chapter provides a background of Malaysia in Section 3.2.
Section 3.3 discusses the development of Malaysian SMEs. Sections 3.4 and 3.5
review the literature on research and practice in the areas of leadership and EO.
Section 3.6 provides details of the performance of SMEs in the manufacturing and
service industries and Section 3.7 concludes this chapter.
3.2 Background of Malaysia
Situated in Southeast Asia, Malaysia is bordered by Thailand to the north, Indonesia
and Singapore to the south and the Philippines to the east. The country covers
127,320 square miles and is divided into 13 states and three federal territories. Eleven
states and two federal territories are located in Peninsular Malaysia (also known as

78
West Malaysia) and two states and one federal territory (Labuan) are in East
Malaysia, separated by the South China Sea (see Figure 3.1). Kuala Lumpur is the
capital city of Malaysia, located in southeast Peninsular Malaysia. A new capital city,
Putrajaya, is being developed as a new administrative centre, located just outside the
overcrowded metropolitan area of Kuala Lumpur. Malaysia is situated along the
Strait of Malacca, which has strategic importance as a major sea route connecting the
Far East to Asia, Europe and the Middle East.
Figure 3.1 Map of Malaysia
The current population of Malaysia is estimated at around 28.3 million. Bumiputera
(‘the sons of the soil’), who include ethnic Malays and the indigenous peoples of
Peninsular Malaysia, Sarawak and Sabah, comprise 67.4% of the population, while
Chinese are 24.6%, Indian 7.3% and others 0.7% (DOSM 2010).
Source: Malaysia Tourism 2011

79
Since Independence in 1957, Malaysia has undergone a massive transformation of its
economy. The country is a fast developing economy, with qualified and skilled
labour to attract foreign direct investment (Selvarajah & Meyer 2008). Malaysia’s
economic development since independence presents three distinct phases (Raman &
Yap 1996). In the first phase, 1965–1970, the economy was resource-based and was
highly dependent on the export of rubber and tin. The second phase occurred during
the 1970s, with the engine of growth being the agricultural sector, concentrating on
cocoa, palm oil and timber. The third phase of development occurred during the
1980s and was marked by an improvement in the productivity of existing industries
and a move towards high technology and high value-added industries (Raman & Yap
1996). These achievements have been reflected in the country’s GDP over the years
(Ariff 1998).
Manufacturing industries, the service sector and the agricultural sector are the major
sectors that contribute to the country’s GDP. In 2008, manufacturing industries
contributed 44.6% to the country’s GDP. This sector had only contributed 13.9% in
1970 and 35.5% in 1997. The contributions of the service and agricultural sectors
were estimated at around 45.7% and 9.7% respectively in 2008. The service sector
had contributed 36.2% in 1970 and 45% in 1997, so there was little change. On the
other hand, the contribution of the agricultural sector reduced from 29% in 1970 to
12.2% in 1997 (Ariff 1998). These trends clearly show the shifting from rubber- and
tin-based industries to a more industrialised economy, together with steady growth in
the service sector. As per the GDP-PPP (GDP purchasing power parity), Malaysia is
ranked 29th in the world, and the GDP of Malaysia was estimated at US$207,400
billion in 2009 (Malaysia Economy 2012).
80
3.3 Malaysian SMEs
3.3.1 Definition of SMEs in Malaysia
The definition of SMEs varies widely among different countries. However, in
Malaysia, SMEs are defined according to the number of full-time employees or the
annual sales turnover and industry categories. Table 1.1 shows the definitions of
SMEs based on the number of employees and the annual sales turnover.
Besides considering the number of employees or annual sales turnover, an enterprise
can also be defined as an SME based on industry category. The definitions of SMEs
based on the categories of manufacturing and services are as follows:
a) Manufacturing, manufacturing-related services and agro-based industries.
SMEs in these industries are enterprises employing full-time staff not
exceeding 150 or with annual sales turnover not exceeding RM25 million.
b) Services, primary agriculture, and information and communications
technology (ICT). SMEs in these sectors are enterprises with full-time
employees not exceeding 50 or with annual sales turnover not exceeding RM5
million (NSDC 2010).
3.3.2 Development of SMEs in Malaysia
To understand the context of entrepreneurship in Malaysia, a historical perspective
on the economic development of the country is required. A notable practice
introduced by the British under their colonial rule of Malaya (before independence in
1957) was to segregate economic activity among the ethnic groups (Simpson 2005).
During that period, rubber plantations and tin mines were the major economic

81
resources. Due to insufficient labour pools for these large-scale industries, the British
imported Indian workers to supplement the workforce needed for the rubber industry
and imported Chinese workers to work in the tin mines. The majority of Malays were
concentrated in the low-income agricultural sector and only members of the upper
class and the royal family were allowed to participate in the bureaucracy. Supporting
activities related to the rubber and tin industries such as wholesaling and retailing
were inclined to benefit Indian or Chinese groups. This created a segregated
economic situation among these ethnic groups and worsened the economic conditions
for most Malays (Ariff 1998; Ariff & Abu Bakar 2003).
The government introduced the New Economic Policy (NEP) in 1971 with the
principal intent of achieving a balance between ethnic economic situations and thus
improving the general welfare of the citizens (Saad 2012; Aman et al. 2011). It
showed the government’s commitment to the development of SMEs. Under the NEP,
emphasis was placed on improving effective Bumiputera ownership and participation
in high-income jobs, limiting the income inequality among the ethnic groups and
eliminating poverty among citizens (Abdul Jamak et al. 2012). The NEP was
subsequently replaced in 1990 with the National Development Policy (NDP). The
strategic thrust of the NDP was to redress racial imbalance in explicit ways through
various initiatives including the development of entrepreneurship, managerial
expertise and skills in the Bumiputera community (Athukorala & Menon 1999).
The highlight of the government’s initiatives relating to entrepreneurs and
entrepreneurship development was the establishment of the Ministry of Entrepreneur
Development in 1995 (Othman et al. 2008). This Ministry is the leading agency for
82
the development of Bumiputera entrepreneurs and for coordinating the
entrepreneurial activities in the country. This initiative shows the importance the
government gives to entrepreneurs’ development and its recognition of the significant
contribution of SMEs to the economic development of Malaysia (Ariff & Abu Bakar
2003).
The commitment of the Malaysian government was further strengthened and targeted
through the implementation of the Malaysian Industrial Master Plans, particularly the
Industrial Master Plan 2 (IMP2) for the period 2000 to 2005. This was followed by
IMP 3 for 2006 to 2020 (Abdul Jamak et al. 2012; MITI 2005). Under these plans,
the Malaysian government has enacted various policies and strategies to enhance the
growth of the manufacturing sector across the entire value chain and cluster-based
industrial developments. These plans also provide an integrated approach to the
development of an industrial base and opportunities for the growth of SMEs (MITI
2005).
The contribution of SMEs to the growth and development of the economy in
Malaysia cannot be denied and it has become an important aspect of economic
growth in Malaysia (Chelliah et al. 2010; Hassim 2007; Othman et al. 2008). Besides
providing job opportunities, SMEs play an important role in contributing to the
prosperity of big and multinational corporations through their entrepreneurial
creativity and innovation (Aman et al. 2011). Table 3.1 shows the overall
contribution of SMEs to the Malaysian economy from 2005 to 2010. In 2010, SMEs
represented about 99.2% of total business establishments and contributed 39.1% of
the country’s GDP. SMEs provided 59.5% of total employment and contributed
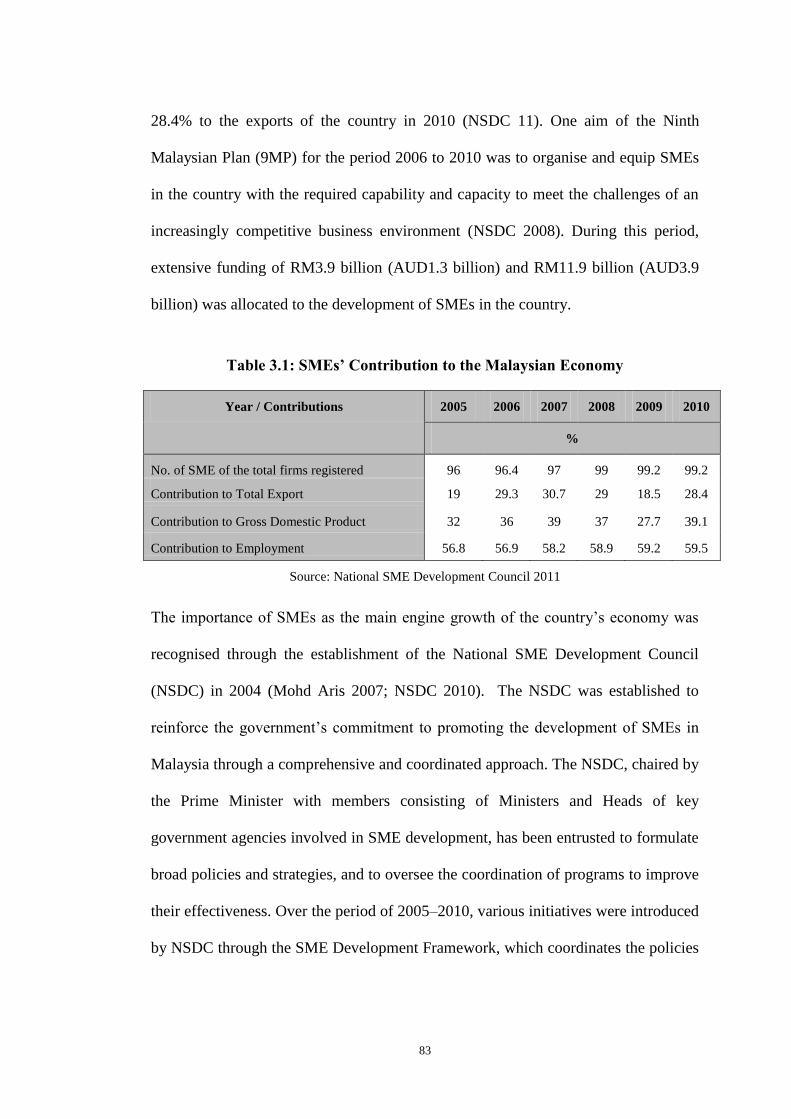
83
28.4% to the exports of the country in 2010 (NSDC 11). One aim of the Ninth
Malaysian Plan (9MP) for the period 2006 to 2010 was to organise and equip SMEs
in the country with the required capability and capacity to meet the challenges of an
increasingly competitive business environment (NSDC 2008). During this period,
extensive funding of RM3.9 billion (AUD1.3 billion) and RM11.9 billion (AUD3.9
billion) was allocated to the development of SMEs in the country.
Table 3.1: SMEs’ Contribution to the Malaysian Economy
Year / Contributions 2005 2006 2007 2008 2009 2010
%
No. of SME of the total firms registered 96 96.4 97 99 99.2 99.2
Contribution to Total Export 19 29.3 30.7 29 18.5 28.4
Contribution to Gross Domestic Product 32 36 39 37 27.7 39.1
Contribution to Employment 56.8 56.9 58.2 58.9 59.2 59.5
Source: National SME Development Council 2011
The importance of SMEs as the main engine growth of the country’s economy was
recognised through the establishment of the National SME Development Council
(NSDC) in 2004 (Mohd Aris 2007; NSDC 2010). The NSDC was established to
reinforce the government’s commitment to promoting the development of SMEs in
Malaysia through a comprehensive and coordinated approach. The NSDC, chaired by
the Prime Minister with members consisting of Ministers and Heads of key
government agencies involved in SME development, has been entrusted to formulate
broad policies and strategies, and to oversee the coordination of programs to improve
their effectiveness. Over the period of 2005–2010, various initiatives were introduced
by NSDC through the SME Development Framework, which coordinates the policies

84
and programs across more than 15 Ministries and 60 agencies (NSDC 2010). The key
initiatives are:
Adoption of a standard SME definition nationwide
Introduction of an annual plan called the National SME Development
Blueprint, later renamed the SME Integrated Plan Action (SMEIPA)
Development of a comprehensive database to track the progress of SMEs
Projections of macro-performance targets of SMEs for 2010
Establishment of a dedicated agency for SMEs, realised through the
transformation of the Small and Medium Industries Development Corporation
(SMIDEC) into the SME Corporation Malaysia (SME Corp. Malaysia) as the
central coordinating agency to streamline, coordinate, monitor and assess all
SME development initiatives.
In 2010, the government introduced a New Economic Model (NEM) with the main
goal for Malaysia to become a high-income advanced nation with inclusiveness and
sustainability by 2020 (National Economic Advisory Council 2010). For Malaysia to
achieve a developed nation and high income status, domestic SMEs are anticipated to
be an important factor of growth. One of the main focuses of the New Economic
Model (NEM) is to unleash the unexploited potential of SMEs and to transform them
to become more competitive and resilient in the demanding business environment
(NSDC 2010).
To realise these objectives, RM15.6 billion (AUD4.8 billion) was allocated to SMEs
in 2010. Of these, a total of 267 programs with a financial commitment of RM6.9
billion (AUD2.1 billion) were implemented through SME Corp. Malaysia. The NEM
85
is targeted at enhancing the viability of SMEs across all sectors, promoting
Bumiputera participation in the SME sector and promoting the development of
knowledge-based (K-based) SMEs (NSDC 2010). Various programs and initiatives
have also been organised to focus on building SMEs’ capacity and capability,
enhancing their access to financing and strengthening the enabling infrastructure for
SMEs.
3.3.3 Owners and Top Managers of SMEs
An analysis of the general leadership and organisational literature showed how
certain individuals in an organisation can influence the actions of others, both
individually and collectively (Tarabishy et al. 2005). Wiklund (1999) claimed that
the strategic orientation of the leader of a firm is likely to represent the strategic
orientation of the firm. Kaiser et al. (2008) identified that much prior research on
leadership and performance relationship has centred on the approval of leaders by
followers rather than on the effects that leaders may have on organisational
performance. There has been little empirical research to study the effects of leaders
on an entire organisation (Mosley 1998).
Previous studies have demonstrated that leaders can be the most significant factor for
organisational performance (Thorlindson 1988; Smith et al. 1984). Zaccaro (2001)
identified that most research on leadership has focused on the low levels of an
organisation with little research focusing on leadership at the top level. Therefore, in
this study owners or top managers of SMEs became the subject. They possess the
required knowledge and expertise regarding their own firm, its operation and
performance (Yang 2008; Isobe et al. 2004). Therefore, leaders seem to be the

86
pertinent source of data on leadership behaviour, the degree of EO practised in an
organisation and organisational performance.
3.4 Leadership Research and Practices in Malaysia
One of the topics that has been and always will be the centre of much discussion in
the management literature is leadership (Hannay 2009). Even though research on the
leadership phenomenon in Malaysia is not as extensive as in Western countries, there
have been attempts made by local and international scholars to develop an
understanding of leadership practices in Malaysia. However, a recent literature
review shows that very little effort has been made to examine leaders in relation to
the leadership behaviour adopted in SMEs (Mohd Sam et al. 2012; Hashim et al.
2012).
Autocratic leadership was the dominant leadership style in all industries in Malaysia
for many years. This style of leadership was accepted by employees due to their lack
of education and poor exposure to information about the rights of employees, and
possibly also because the business leaders were generally the owners of the firms.
One of the strong effects of colonialism was to impose the top-down management
style on the developing industries in the country, hence encouraging the leaders to
practise autocratic leadership for a long time (Abdul Rani et al. 2008; Ansari et al.
2004). Ansari et al. (2004) also suggested that autocratic and directive leadership was
effective for Malaysian managers during that period. However, since the mid-1980s,
firms everywhere have undergone vast transformation, including firms in Malaysia
(Abdul Rani et al. 2008). The growth of the knowledge economy and the
transformation of the workforce have changed the ways managers lead (Jayasingam

87
& Cheng 2009). Employees are more knowledgeable now and require more effective
leadership from their leaders and they may no longer accept the simple use of
positional power and authority to lead them.
Other factors contributing to this transformation are the adoption of emerging
democratic management ideas, a better education system, a vast exposure to
information, joint ventures, technology adoption, and the country’s drive towards a
high level of industrialisation and economic development (Abdul Rani 2006; Mansor
& Kennedy 2000). These factors have been linked with the Westernisation of many
management practices and various styles of leaderships practised by the leaders of
the industries.
One of the largest international studies of leadership involving Malaysia is the Global
Leadership and Organizational Behavior Effectiveness (GLOBE) (1999). Sixty other
countries around the world were also involved in this study, which was led by
Professor Robert House of the Wharton School at the University of Pennsylvania.
The conceptual basis of the study was published in House et al. (1999) and
preliminary analysis of the data on leadership was published by Den Hartog et al.
(1999). Data collected in Malaysia were drawn from a total of 125 managers. One of
the major outcomes from the study by Den Hartog et al. (1999) was that
charismatic/transformational leadership has become universally endorsed leadership
behaviour that is characteristic of outstanding leadership across countries.
Kennedy (2002) and Mansor and Kennedy (2000) explored the Globe study closely
in regard to understanding leadership in Malaysia. They found that the results of the

88
Malaysian sample were similar to those of the other GLOBE countries in that
charismatic/transformational leadership and team-orientation were ranked as highly
important contributors to outstanding leadership. Malaysian ratings for
charismatic/transformational leadership were close to the average for all the
countries. The third most important factor for leadership in Malaysia is the humane
factor. Malaysia was placed in the top 25 per cent of countries in this dimension.
Even though the rating for participative leadership was positive for Malaysian
managers, the rating was below those for most countries. Malaysian managers rated
self-protective leadership the same as the other countries and rated autonomous
leadership above the median rating of all GLOBE countries.
Several key attributes that differentiate the leadership culture in Malaysia are a high
humane orientation rating and a low rating for participative leadership. There is
universal endorsement of the importance of charismatic/transformational leadership.
Managers in Malaysia are considered to be inspirational and to be prepared to accept
and to employ a directive leadership style, but they are also expected to balance this
style with a humane orientation – a consideration of the needs and concerns of
subordinates (Kennedy 2002; Mansor & Kennedy 2000).
Different outcomes were produced by Jaharuddin (2006) when she studied the effects
of the corporate culture, leadership style and performance of foreign and local
organisations in Malaysia. Her data were drawn from a total of 134 companies
comprising 74 local and 60 foreign companies. Regarding leadership, she found no
difference between local and foreign leadership styles. The three most popular styles
in both local and foreign companies are the auditor (who emphasises rules and
89
procedures to ensure smooth operation), the ambassador (who possesses deep
knowledge about the organisation’s history, products and responsibilities) and the
driver (who focuses on high performance achievement). The auditor style can be
linked to transactional leadership behaviour that also focuses on maintaining
operational stability. The driver style can be associated with transformational
leadership that focuses on elevating employees’ awareness so that they perform
beyond expectations. Interestingly, she also found that culture and leadership style
are not associated with performance in either local or foreign organisations. This
study concluded that organisational culture and leadership style are autonomous of
organisational performance in both local and foreign companies and that
organisational performance might be affected by other factors such as socio-
economic conditions, competition and innovation.
Mohd Sam et al. (2012) examined the effects of different leadership styles on the
company performance of SMEs in the information technology (IT) sector in
Malaysia. Leadership was identified based on entrepreneurial leadership, managerial
leadership or a combination of both. Based on a sample of 200 IT companies, they
concluded that managerial leadership is the dominant leadership behaviour of the
owners and managers of SMEs followed by entrepreneurial leadership. But
entrepreneurial leadership has a statistically significant contribution to the financial
performance of the firm. Their findings show that when owners or managers become
more entrepreneurially orientated in the way they lead their organisation, financial
performance improves.

90
Jayasingam and Cheng (2009) studied leadership styles and perceptions of
effectiveness of 269 respondents from various industries in Malaysia. Findings from
both private and public sectors showed that the perception of a leader’s effectiveness
is positively affected by participative and nurturant-task leadership, which is
characterised by people-oriented and relationship-oriented behaviour such as
encouraging involvement in decision making and providing support and guidance.
These characteristics are associated with transformational leadership, as
transformational leaders try to inspire employees and create trust and confidence
among them, show concern for individual employees, and encourage employees’
personal growth and development. Jayasingam and Cheng (2009) also found that
autocratic leadership has a negative effect. They argued that the autocratic leadership
that used to be predominant in Malaysian organisations is no longer effective
leadership behaviour. Their findings also suggest that employees prefer to work as a
team and participate in decision making. They also prefer to receive guidance from
leaders only when necessary.
Several other authors have also closely examined transformational and transactional
leadership in the context of business leaders in Malaysia. These studies were on: the
role of transformational leadership in the public sector (Md Noor 2010; Asgari 2008);
the roles of transformational and transactional leadership and organisational
commitment in the manufacturing industry (Lo et al. 2009); the relationship between
leadership behaviour and leadership effectiveness in Malaysian Government Linked
Companies (GLCs) (Amirul & Daud 2012); the effects of transformational and
transactional leadership on individual outcomes (Ismail et al. 2010); and the
innovative performance of SMEs (Md Saad & Mazzarol 2010).
91
For example, Md Noor (2010) suggested that an organisation must have a
transformational leader in order to respond strategically and forge ahead with
transformational change. He also proposed that to raise the country to a great nation,
conventional forms of leadership behaviour would not be sufficient. He stated that
leaders need to transform themselves and be visionary enough to inspire greatness
and to bring about sustainable transformational changes in their organisations. Ismail
et al. (2010) proposed that the ability of leaders to effectively display
transformational and transactional leadership behaviour may lead to increased
positive individual outcomes and increased trust in leaders.
A more recent study by Amirul and Daud (2012), based on 325 respondents
representing GLCs in Malaysia, revealed that transactional leadership has a slightly
higher mean than transformational leadership among leaders in all positions.
However, the effects of transformational leadership on leadership outcomes
(measured through extra effort, effectiveness and satisfaction) are higher and stronger
than the effects of transactional leadership. Their study concluded that
transformational leadership is more practical and efficient than transactional
leadership for bringing about positive outcomes for organisations.
Based on a survey of 160 executives from the manufacturing industry, Lo et al.
(2009) concluded that transformational leadership has a more significant and stronger
effect than transactional leadership on organisational commitment. Leaders who
display transformational behaviour are more able to develop commitment in
employees than transactional leaders are. Specifically, they also found that
intellectual stimulation, idealised influence and inspirational motivation are

92
significant predictors for affective and normative commitment, whereas
individualised consideration and intellectual stimulation are significantly related to
continuance commitment.
Md Saad and Mazzarol (2010) used data from 87 SMEs from Malaysia’s Multimedia
Super Corridor (MSC) to conclude that transformational leadership has a more
significant impact than transactional leadership on both product and process
innovation undertaken by SMEs. The results showed that transactional leadership has
a minimal role in improving an organisation’s innovative performance.
The review of literature on leadership practices in Malaysia has revealed that a
particular leadership behaviour does have a significant role in enhancing the
performance of the organisation. However, the results are varied and inconclusive
and therefore a more integrated effort is needed to understand the role of leadership
behaviour in relation to organisational performance. The review also found a lack of
initiative by previous scholars to examine the effect of transformational and
transactional leadership in the context of SMEs in Malaysia. Therefore, this study
proposes research questions that attempt to provide a better understanding of the
effects of transformational and transactional leadership on organisational
performance in the context of SMEs in Malaysia. As Abu Kassim and Sulaiman
(2010) suggested, an understanding of leadership behaviour is critical to the further
development of SMEs in Malaysia, due to their size and resource limitations.

93
3.5 Entrepreneurial Orientation Research and Practices in
Malaysia
Entrepreneurship has become one of the new focuses of economic growth for
Malaysia (Othman et al. 2008). However, the literature has suggested that studies on
EO in Malaysia, especially in regard to SMEs, are still at an infant stage (Awang &
Ahmad 2005). Previous scholars have concentrated on a theoretical perspective of
EO as a universal remedy for improving productivity (Abdul Razak 2011), the EO of
public enterprises (Entebang 2010), the relationship between distinctive capabilities
and EO and the performance of SMEs in the agricultural industry (Awang et al.
2010a, 2010b), EO related to the performance of Bumiputera SMEs (Awang et al.
2009; Zainol & Ayadurai 2011; Zainol & Wan Daud 2011) and innovativeness,
market orientation and firm performance (Lee & Ging 2007; Hilmi et al. 2010;
Hassim et al. 2011).
A recent theoretical review by Abdul Razak (2011) suggested that entrepreneurs of
SMEs in Malaysia need to develop a cognitive perspective when making decisions.
This skill will help their firms to be entrepreneurially orientated and consequently
lead to increased productivity.
Awang et al. (2010a) used a sample of 125 agricultural-based SMEs and concluded
that only innovativeness relates positively to the return on sales. Competitive
aggressiveness relates negatively to the return on sales. The other two factors
(proactiveness and risk taking) are not related to sales performance. The
characteristic of distinctive capabilities (financial information capability) was found
to mediate the relationship between EO and financial performance. Interestingly,

94
these authors also suggested that future study should embark on other independent
variables such as knowledge and leadership to further understand EO among
entrepreneurs of SMEs in Malaysia. A much larger study conducted by Awang and
his colleagues (2010b), which consisted of 615 respondents from agro-based
enterprises, proposed that future study on EO should extend the level of analysis and
concentrate on firms from multiple industries of SMEs in Malaysia.
Lee and Ging (2007) investigated firm-level innovation using data from the National
Survey of Innovation. This involved 750 small, medium and large manufacturing
firms. The authors found that for small firms, newish ones and those with more
employees are more likely to innovate. For medium and large firms, the well-
established amongst them are more innovative. Medium-sized firms that produce for
the domestic market and have high market concentration have a higher probability of
innovating.
Hilmi et al. (2010) attempted to explain product and process innovativeness in the
performance of 92 SMEs. They emphasised that product innovativeness refers to the
novelty and meaningfulness of new products and process innovativeness refers to the
introduction of new production methods, management approaches and technology.
Their study revealed that Malaysian SMEs show a high level of both product and
process innovativeness but only process innovativeness is positively related to
performance.
Besides examining the influence of EO on firm performance, Zainol and Wan Daud
(2011) also investigated the mediating role of EO in the relationship between
95
government support (such as training and financial aid) and firm performance. Based
on a sample of 162 family firms from the service and manufacturing industries in
Malaysia, they found that EO and government support explain firm performance but
EO is not a significant mediator between government support and firm performance.
Similar results were produced by Zainol and Ayadurai (2011) when they looked at
the personality traits of entrepreneurs as an independent variable. They also
concluded that EO and personality traits affect firm performance but EO is not a
significant mediator between personality traits and firm performance. Both of these
studies highlighted the importance of EO on enhancing firm performance but failed
to establish the mediating effects of EO when they examined the relationship
between government support and personality traits and performance. These studies
also suggested that further research is needed to explore the antecedents and
underlying processes related to entrepreneurial activity and they suggested that
acknowledging the multi-dimensional nature of EO contributes to a greater
understanding of EO and its contribution to firm performance.
Another attempt by researchers was to associate market orientation and
organisational innovation while examining the impact of EO on firm performance
(Hassim et al. 2011). Based on 398 samples representing various SME sectors in
Malaysia, these authors found significant contributions of EO to market orientation
and to business performance. A firm’s innovative behaviour also related positively to
performance. They suggested that for firms to achieve superior performance, they
need to focus on promoting EO, market orientation and organisational innovation.
96
Apart from investigating the direct impact of EO on performance, Awang et al.
(2009) used perceived environmental factors as moderating variables in the model
developed in their study. 210 SMEs from the manufacturing, service and agriculture
sectors participated in this study. Their findings revealed that factors of EO are multi-
dimensional and each component is independent of one another. Autonomy and
innovativeness are positively and significantly related to performance. The negative
relationship between risk taking and performance is actually an indication of a U-
shaped curvilinear relationship. This indicates that risk taking has a positive effect on
performance up to a point; beyond that point, an increase in risk taking produces a
negative effect on performance. Finally, their study also found that the moderating
impacts of human capital and information technology munificence on the relationship
between EO and performance are important for proactive firms. Their approach
suggests that further research should investigate the impacts of other independent or
mediating variables on the factors of EO.
One study of EO in public enterprises (GLCs) by Entebang and colleagues (2010)
revealed that firms of this type seem to display a certain level of EO; however, most
of their initiatives are new and incremental in nature. These firms demonstrate a low
degree of proactiveness and a tendency to take on low-risk projects. Therefore, to be
more competitive and improve financial performance, they are encouraged to take
bold actions, to venture into new things with a proper risk management strategy and
to be proactive in pursuing and exploiting new markets.
To summarise, all the studies presented here are concerned with understanding EO as
a strategy for enhancing organisational performance. A few conclusions can be

97
drawn from this literature review in regard to the practice and research of EO in
Malaysia, especially in SMEs’ business environments. First, EO is an important
element that can contribute to superior organisational performance. Detailed studies
of the factors of EO have revealed that they contribute independently to
organisational performance (Awang et al. 2009; Awang et al. 2010). These findings
confirmed the outcomes from Western studies by Kreiser et al. (2002) and Lumpkin
and Dess (2001).
Secondly, mixed outcomes from these studies suggest that future research on EO
could include other independent or mediating factors such as knowledge and
leadership (Awang et al. 2010; Zainol & Ayadurai 2011). As Hassim et al. (2011)
suggested, appropriate behaviour of the leaders of SMEs is an important element of a
firm’s strategy to enhance its innovativeness and proactiveness. Therefore, a research
question of whether EO fully mediates the relationship between leadership behaviour
and organisational performance could provide a different avenue to understand how
the performance of SMEs in Malaysia could be further developed and enhanced.
3.6 SMEs’ Performance
Because of their total numbers, sizes and the diverse natures of their businesses,
SMEs in Malaysia have been acknowledged as promoting endogenous sources of
growth and strengthening the infrastructure for the fast economic expansion and
development of the country (Mohd Aris 2007). According to the Census on
Establishment and Enterprises 2005 conducted by the Department of Statistics in
Malaysia (DOSM), SMEs in Malaysia are mainly concentrated in the service sector,
which has 87% of all SMEs in the country with 474,706 establishments, 381,585 of
98
which are considered micro-enterprises. The main business in this sector is
distributive trade, which includes wholesale and retail, as well as hotels and
restaurants (SME Annual Report 2009–2010). The output generated by this sector of
SMEs was about 56.7% or approximately RM361.7 billion in 2003 (Mohd Aris
2007).
The manufacturing sector represents 7% of all SMEs with 39,373 establishments,
21,516 of which are micro-enterprises. The three main subsectors are textiles and
apparel, metal products, and food and beverages, which together contribute 34.9% of
the total output of SMEs. This is followed by the agriculture sector with 6% of
SMEs, accounting for 34,188 businesses which are mostly involved in crop
plantation, horticulture and fishing (SME Annual Report 2009–2010). In 2003, the
agriculture sector contributes about RM8.7 billion to the SMEs’ total output (Mohd
Aris 2007).
In terms of sectoral performance of SME value-added in 2009, the service sector
reported the highest contribution of total SME value-added at 64.6%, followed by the
manufacturing sector at 26%, agriculture at 7.6%, construction at 2.8% and mining at
0.1% (NSDC 2010).
The key businesses that drive growth performance in the service sector are the
distributive trade, real estate and business services, and finance and insurance
businesses. This growth is also closely linked to consumption activities supported by
strong domestic demand and tourism activities. The key growth businesses in the
manufacturing sector are resource-based industries such as chemicals and plastic
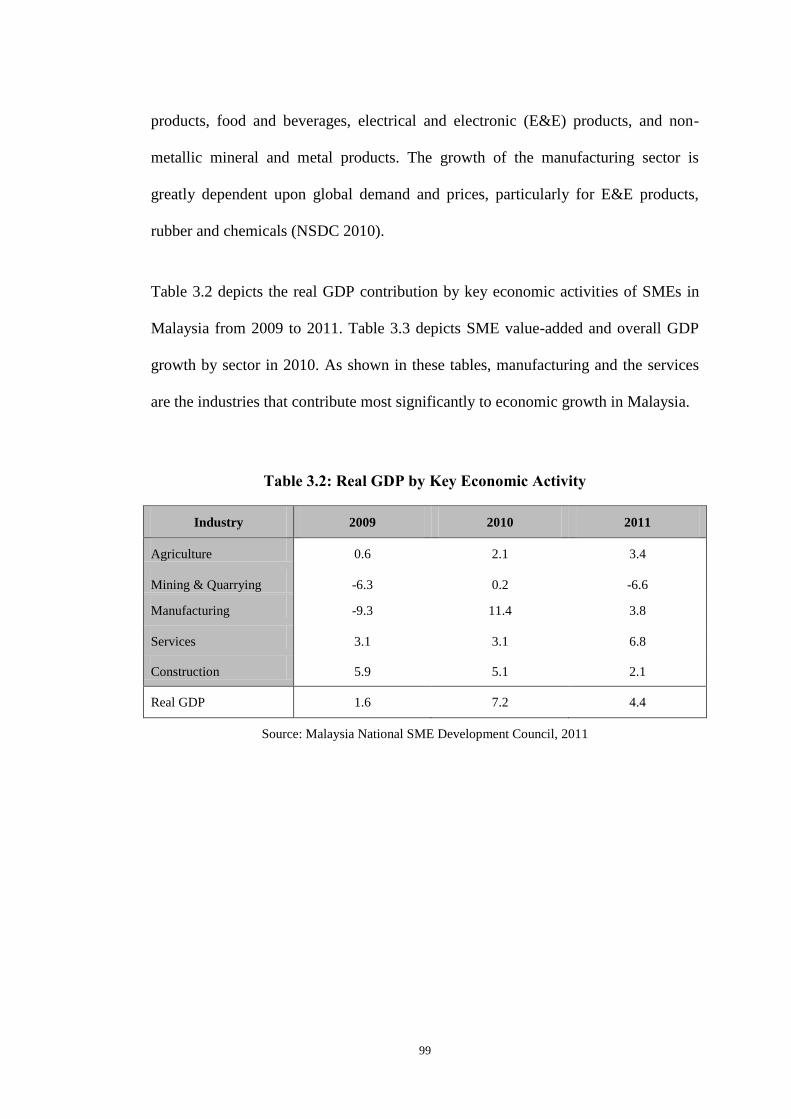
99
products, food and beverages, electrical and electronic (E&E) products, and non-
metallic mineral and metal products. The growth of the manufacturing sector is
greatly dependent upon global demand and prices, particularly for E&E products,
rubber and chemicals (NSDC 2010).
Table 3.2 depicts the real GDP contribution by key economic activities of SMEs in
Malaysia from 2009 to 2011. Table 3.3 depicts SME value-added and overall GDP
growth by sector in 2010. As shown in these tables, manufacturing and the services
are the industries that contribute most significantly to economic growth in Malaysia.
Table 3.2: Real GDP by Key Economic Activity
Industry 2009 2010 2011
Agriculture 0.6 2.1 3.4
Mining & Quarrying -6.3 0.2 -6.6
Manufacturing -9.3 11.4 3.8
Services 3.1 3.1 6.8
Construction 5.9 5.1 2.1
Real GDP 1.6 7.2 4.4
Source: Malaysia National SME Development Council, 2011

100
Table 3.3: SME Value-Added and Overall GDP Growth by Key Economic
Activity in 2010
Industry
Year 2010 (% annual change)
SME Value-Added Growth Overall GDP Growth
Agriculture 5.0 2.1
Manufacturing 11.8 11.4
Services 7.1 6.8
Construction 8.6 5.1
Source: National SME Development Council, 2011
3.7 Summary
To improve the performance of SMEs in Malaysia so that they are competitive with
developed or other developing countries, important resources and capabilities need to
be acknowledged, focused and developed. Understanding the relationships between
leadership and EO as resources and capabilities could contribute to the better
performance of SMEs in Malaysia. A focus on the manufacturing and service sectors,
which contribute significantly to the overall performance of SMEs, could perhaps
provide general findings for SME development in Malaysia. The next chapter,
Chapter 4, covers the development of the theoretical framework of this study.
101
CHAPTER 4
DEVELOPMENT OF THEORETICAL FRAMEWORK
4.1 Introduction
This chapter discusses the development of the theoretical framework of this study.
After the introduction in Section 4.1, Section 4.2 discusses the relevant theories that
are the foundation of the research framework. Section 4.3 presents the research
framework with the definitions of all the variables. Section 4.4 discusses the
development of the hypotheses and presents evidence from the literature review to
support the hypotheses. Section 4.5 discusses the scope of the proposed framework.
The final section provides concluding remarks.
4.2 Theoretical Foundation of Framework
4.2.1 Transformational Leadership Theory
The first theory that contributes to the framework developed in this study is the
transformational leadership theory. This theory was discussed and explained in
Chapter 2 with the presentation of the evolution and transformation of different
leadership theories. This chapter does not repeat the discussion of this theory, but
since the theoretical framework of this study centres on the perception of the effects
of leadership behaviour on organisational performance, and since there is a need to
explain the relevant theories involved in the development of the theoretical
framework, therefore, a brief summary of the theory is given.
It is more than 30 years since the concepts of transformational and transactional
leadership were introduced by Burns (1978). In his views, transactional leaders are

102
concerned with followers’ low-level needs and transformational leaders boost the
morale, motivation and focus of followers’ high-level needs. A transactional leader
focuses on what your country can do for you and a transformational leader focuses on
what you can do for your country.
Bass (1985) expanded Burns’ views of transformational and transactional leadership
into the theory of transformational leadership. According to Bass (1999, 2000), a
transformational leader is the kind of leader who develops followers through creating
a vision that provides meaning and motivation. The ability of a transformational
leader to communicate a convincing vision with enthusiasm and confidence results in
followers having a strong sense of identification with the organisation and influences
followers to go beyond their self-interests. Bass established that an effective leader
with transformational attributes has the ability to transport his or her organisation to
greater heights and to achieve greater performance (Bass 1985, 1990a, 1990b; Bass et
al. 2003; Bass & Riggio 2012).
On the other hand, a transactional leader is described as providing contingent rewards
and negative feedback (Hater & Bass 1988). The main elements of transactional
leadership are structuring, clarifying tasks and providing rewards for extra effort. The
needs of followers are fulfilled when they deliver according to the leader’s
expectation (Avolio & Bass 1988). Recent studies have indicated contingent reward
and active management-by-exception as effective component of leadership (Amirul
& Daud 2012; Bass 2003).

103
Transformational leadership theory also forecasts that effective leaders are able to
adjust their leadership behaviour between more or less transactional and more or less
transformational in order to address dynamic situational demands (Hannah et al.
2008). In stable and clear-cut situations, transactional leadership can deliver effective
performance (Bass 1985). However, when dealing with new circumstances and
unpredictable situations, a transformational leadership approach may be more
appropriate (Avolio 2005). Finally, Bass et al. (2003) suggested that transformational
leadership is more effective than transactional leadership because transformational
leaders empower employees by developing them into high involvement individuals
and teams that focus on service, quality, cost effectiveness and high quantity of
production output.
Based on what has been presented, transformational and transactional leadership are
independent variables in the research framework and are expected to be factors that
influence organisational performance. The practice and display of both types of
leadership behaviour are expected have significant impacts on performance. But due
to the different characteristics intrinsic to each form of leadership behaviour, it is
anticipated that one form might have a greater positive impact than the other on the
performance of organisations.
4.2.2 Resource-Based View
The resource-based view of the firm (RBV) has been a subject of discussion among
researchers in the field of strategic management. The RBV posits that organisational
success is dependent upon resources and capabilities that have certain characteristics
(Galbreath 2005).

104
A firm’s resources and capabilities can be defined as including all assets, capabilities,
organisational processes, firm attributes and knowledge controlled by the firm that
allow that firm to develop and implement strategies that improve its efficiency and
effectiveness (Barney 1995). This is a bundle of available factors owned and
controlled by the firm that can be used to build up and implement their strategies
(Amit & Schoemaker 1993). Firms’ resources and capabilities can generate a
sustainable competitive advantage when they have the following characteristics;
value, rarity, inimitability and non-substitutability (Barney 1991). Later, Barney
(1995) emphasised that developing sustained competitive advantage requires the
unique resources and capabilities that a firm could bring to competition and its
environment. Business owners and managers must discover these resources and
capabilities by looking within their firm for resources that are valuable, rare and
imperfectly imitable, and then exploit these resources. Galbreath (2005) claimed that
only firms which have resources possessing these attributes are able to generate and
sustain the competitive advantage which affords continuing superior performance.
According to Barney (1991), a firm’s resources are categorised according to physical,
human and organisational capital resources. Physical capital includes the physical
technology, plant and equipment, geographic location and access to raw materials.
Human capital includes training, experience, intelligence, relationships, and the
abilities and attributes of individual managers and workers. Organisational capital
includes structures for reporting, formal and informal planning, and the whole
organising process in the firm. Later, Barney (1995) added a new category of
financial resources that includes debt, equity and retained earnings. Alvarez and
Busenitz (2001) suggested the inclusion of the entrepreneurial resources of
105
entrepreneurial alertness, insight, knowledge and ability to coordinate resources.
Dollinger (2003) expanded the application of this theory by including reputational
resources (stakeholders’ perceptions of the company) and technological resources
(processes, systems, physical transformations) as sources of competitive advantage.
4.2.2.1 Leadership and Entrepreneurial Orientation as resources in the RBV
One of the most basic assumptions of the RBV of the firm is that internal intangible
resources are important in understanding an organisation’s competitive success.
However, little is known about which of these resources are related to one another
and, if so, how they are related (Wilderom & van den Berg 2000). In this study,
leadership behaviour and the EO of leaders of SMEs can be seen as a firm’s internal
intangible resources or capabilities. Capabilities contribute more significantly to the
success of a firm than either intangible or tangible assets do (Galbreath 2005). Strong
proponents of the Capability-Based Theory of Competitive Advantage advocate that
a firm can achieve sustainable competitive advantage through distinctive capabilities
owned by the firm (Grant 1991; Hayes et al. 1996) and these capabilities are the most
important elements of a firm’s resources due to their high levels of causal ambiguity
and strong barriers to imitation and substitution (Foon 2011). Likewise, Shurchuluu
(2002) mentioned that capabilities are essential for a firm to have the ability to
combine cost efficiency with continuous productivity improvements to be more
competitive.
Generally, the Capability-Based Theory of Competitive Advantage suggests that a
firm can achieve sustainable competitive advantage through the distinctive
capabilities possessed by the firm (Grant 1991; Prahalad & Hamel 1990; Hayes et al.

106
1996) and these distinctive capabilities allow firms to make good use of their
resources and achieve rents (Mahoney & Pandian 1992). Capabilities, in fact, could
be considered as the most important of a firm’s resources due to their high levels of
causal ambiguity and strong barriers to imitation and substitution
Todorovic and Schlosser (2007) claimed that both of these variables, namely,
leadership and EO, can be valuable rents under the RBV. They contended that
appropriate leadership behaviour by the entrepreneur may enable the firm to achieve
outcomes beyond its expectations. In their views, an entrepreneur, the individual, is
often identified with the firm itself. The entrepreneur’s vision may become the firm’s
vision statement. The charismatic leadership (transformational leadership) of an
entrepreneur can also be viewed as an organisational-level resource, thereby
contributing to organisational performance (Todorovic & Schlosser 2007).
According to Lee et al. (2001), a high level of EO is something that firms cannot
simply buy from the market. Firms need to invest a great amount of time to develop
an entrepreneurial culture and then the EO can be a source of sustainable competitive
advantage that leads to superior performance. EO consisting of innovativeness,
proactiveness and risk taking is considered an internal organisational capability (Lee
et al. 2001) and it has been recognised as key source of sustainable competitive
advantage (Miles & Snow 1978).
Finally, Wilderom & van den Berg (2000) contended that firms require best
organisational practices and strong leadership to perform effectively. EO can be seen
as an organisational practice since it is in effect an organisational strategy in creating
107
a sustainable competitive advantage. The leadership styles of the owner or top
managers represent human capital resources. The complex interactions between these
two resources in a firm could help to generate a superior performance.
Consequently, in this study, leadership behaviour and EO are examined as
antecedents or variables that might affect organisational performance. This study also
examines the possible mediating action of EO in the relationship between leadership
behaviour and organisational performance.
4.3 Research Framework
Figure 4.1 presents the research framework of this study based on the theories
discussed. The variables in the framework are then defined.

108
Figure 4.1 Research Framework
4.3.1 Definitions of Variables
‘Transformational leadership’ is defined as a process where leaders broaden and raise
the interest of their employees. It occurs when they generate employees’ awareness
and acceptance of the purpose and mission of the group and when the employees
look beyond their self-interest for the benefit of the group (Bass 1985, 1990; Bass &
Riggio 2012). There are four factors of transformational leadership:
H1, H3
Idealised
Influence
Transformational
Leadership
Individualised
Consideration
Inspirational
Motivation
Intellectual
Stimulation
Contingent
Reward
MBE Active
MBE Passive
Transactional
Leadership
Entrepreneurial
Orientation Proactiveness
Innovativeness
Risk Taking
Organisational
Performance
Profitability
Growth
H2
H9, H10
H4, H5, H6
H7, H8

109
Idealised influence – leaders provide vision and sense of mission, instil pride,
and get the respect and trust of employees (Bass 1990). The leaders inspire
and excite the employees with the idea that they are able to accomplish great
things by putting in extra effort. They create trust, confidence and act as role
models for their employees (Bass & Riggio 2012).
Inspirational motivation – leaders communicate high expectations, use
symbols to focus effort and convey important purposes to employees in
simple ways and explain what needs to be done (Bass 1990, 1996; Muenjohn
& Armstrong 2008). Inspirational motivation refers to the degree to which
leaders articulate a vision that is appealing and inspiring to employees (Judge
& Piccolo 2004) and establish commitment to common and shared visions
(Bass & Riggio 2012).
Intellectual stimulation – leaders encourage intelligence, rationality and
careful problem solving (Bass 1990). Leaders are willing and able to act as
examples to their employees on finding new perspectives for looking at old
problems. Leaders encourage employees to think outside the box and they
inspire creativity (Bass & Riggio 2012).
Individualised consideration – leaders provide personal attention and treat
each employee individually (Bass 1990). Leaders act as mentors and spend
time coaching and giving advice by paying close attention to differences
among the employees (Muenjohn & Armstrong 2008; Judge & Piccolo 2004).
Leaders identify and acknowledge individual differences of needs and desires
(Bass & Riggio 2012).

110
‘Transactional leadership’ is the type of leadership where the leaders explain what is
required from the employees and what compensation they will get when they
accomplish these requirements. It is a transaction or an exchange process between
leaders and followers (Bass 1990; Bass et al. 2003). The three factors of transactional
leadership used in this study are:
Contingent reward – this refers to the exchange of rewards for efforts. It
promises rewards for excellent performance and it acknowledges
accomplishments and punishes poor performance (Bass 1996; Muenjohn &
Armstrong 2008).
Management-by-exception (active) – leaders act as monitors to watch for
deviations from rules and standards and take corrective actions (Bass 1990,
1996; Muenjohn & Armstrong 2008).
Management-by-exception (passive) – leaders intervene only when
procedures and standards are not met (Bass 1990, 1996; Bass et al. 2003).
In this study, ‘entrepreneurial orientation’ is the inclination of a company’s top
management to take calculated risks, to be innovative and to display proactiveness in
their approach to strategic decision making (Morris & Paul 1987). The three factors
of EO used in this study are:
Innovativeness is the willingness of a firm to engage in and support new ideas
and experimentation to create new products and services (Lumpkin & Dess
1996).
Proactiveness is the ability of a firm to foresee and act on future wants and
needs in the market by establishing a first-mover advantage ahead of
competitors (Lumpkin & Dess 1996).

111
Risk taking is the willingness of a firm to use resources for projects where the
outcomes are uncertain (Miller 1983; Wiklund & Shepherd 2005).
Organisational performance is a multi-dimensional concept (Lumpkin & Dess 1996)
and becoming a high performing firm is the main objective of SMEs (Ahmad &
Ghani 2010; Madrid-Guijarro et al. 2007). Hancott (2005) suggested there are five
major areas to consider in measuring organisational performance. They are: market
share or growth, innovative performance, productivity of all inputs, liquidity and cash
flows, and profitability. In this study, the organisational performance of SMEs is
measured and defined through growth and profitability, adapted from Matzler et al.
(2008). According to Steffens et al. (2006), these two factors are the important
dimensions of SMEs’ performance since they represent the economic performance of
SMEs (Covin & Slevin 1991).
Mao (2009) described enterprise growth as the development of an enterprise from
small to large and from weak to strong. Enterprise growth can be a stable growth of
total performance, which includes output, sales volume, profits and asset growth, or it
can be a fast enhancement of total performance. Profitability indicates the ability of a
firm to earn profits. A firm with high profitability has created a product or service
that delivers considerable value above cost for its customers and gets a substantial
share of that value in profit (Alvarez & Barney 2004; Amit & Zott 2001).

112
Thus, in this study:
Growth is the owner’s or top manager’s perception of how well their
company is doing in regard to market share and overall company performance
relative to their competitors.
Profitability is the owner’s or top manager’s perception of how well their
company is doing in regard to the return on investment and return on sales. It
is their perception on whether or not their company is making money relative
to their competitors.
4.4 Hypotheses Development
This section discusses the literature in relation to the development of the hypotheses
proposed in this study. The ten hypotheses are based on the three main relationships
between the variables: the relationships between leadership behaviour and
organisational performance; the relationships between factors of EO and
organisational performance; and the role of EO as a mediating mechanism in the
relationship between leadership and organisational performance. Three final path
models are then developed to observe these relationships. This section also includes a
discussion of the literature that acts as a foundation for the development of each
hypothesis.
4.4.1 Leadership Behaviour and Organisational Performance
There are three hypotheses on this relationship. In order to test them, the following
research objective and research questions are proposed.
113
Research Objective: To investigate the relationship between transformational and
transactional leadership behaviour and the organisational performance of SMEs in
Malaysia
Research Question: To what extent do transformational and transactional leadership
behaviours have an impact on organisational performance?
Research Question: Does transformational leadership have a stronger effect on
organisational performance than transactional leadership does?
4.4.1.1 Transformational leadership and organisational performance
Leaders who practise transformational leadership stimulate and heightened awareness
and interest in the group or organisation, increase confidence, and move followers
progressively from concern for existence to concern for achievement and growth.
They develop their subordinates to enable them to take on leadership roles and
perform beyond established standards of performance or goals (Bass & Avolio 1990,
1993, 1994).
There are many ways that transformational leadership helps to increase the
motivation, morale and performance of followers. These include connecting the
subordinate's sense of identity with the project and the collective identity of the
organisation; being a role model for followers that inspires them and makes them
interested; challenging followers to take greater ownership of their work; and
understanding the strengths and weaknesses of followers. By doing so, leaders can
match followers with tasks that enhance their performance (Odumeru & Ogbonna
2013).

114
Scholars and researchers have taken many initiatives to identify and assess the
relationship between transformational leadership and various organisational
performance measures. Much evidence suggests that these two are correlated
positively (Avolio et al. 1988; Yammarino & Bass 1990; Avolio 1999; Bass 1998).
Other studies have identified that transformational leadership is correlated with
innovation (Keller 1992; Matzler et al. 2008; Vaccaro et al. 2010), supervisory
assessments of managerial performance (Hater & Bass 1988; Waldman et al. 1987),
promotion (Waldman et al. 1990), effectiveness (Behery 2008), organisational
climate (Koene et al. 2002), financial performance (Koene et al. 2002) and
achievement (Howel & Avolio 1993).
These positive relationships have also been reported in studies concentrating on
SMEs (Hood 2003; Yang 2008; Matzler et al. 2008; Visser et al. 2005; Pedraja-Rejas
et al. 2006; Damirch et al. 2011), and their findings have indicated that
transformational leadership is more relevant to SMEs than to large organisations
(Hayat & Riaz 2011; Matzler et al. 2008; Ling et al. 2008). Hayat and Riaz (2011)
claimed that transformational behaviour is linked to SMEs as its attributes are closely
related to the business approach and environment in which entrepreneurs operate.
Behery (2008) investigated the relationship between transformational leadership and
firm performance among 504 respondents from 10 large-scale companies in the UAE
and reported that a transformational leadership behaviour significantly influences
firm performance. A control-setting study conducted by Barling et al. (1996) with 20
branch managers of the five largest banks in Canada found that the effects of
transformational leadership on financial result are positive. The study indicated that

115
training provided to managers results in subordinates’ perception of the significant
effects that transformational leadership exerts on financial performance measures. A
study of large multinational organisations in China also indicated that
transformational leadership is positively related to subordinates’ creative
performance (Si & Wei 2012).
In the context of SMEs, Matzler et al. (2008) investigated the impact of
transformational leadership on innovation, growth and profitability in Austria. Their
arguments were based on the premise that transformational leadership is not limited
to technical professionals but can be applied to employees at all levels. They argued
that transformational leadership enables all employees to identify and to exploit
business opportunities for the firm. For example, employees may develop more
efficient work routines, thus reducing costs and in turn increasing profitability.
Employees may also gain new customers, which increases the growth of the firm.
Their empirical findings supported their argument that transformational leadership
has a significant positive effect on the innovativeness, growth and profitability of a
firm. Visser et al. (2005) conducted a study of transformational leadership with 535
owners and managers of SMEs in South Africa. The results were that there is a
medium degree of positive relationship between transformational leadership and
entrepreneurship.
Similar results of a positive relationship between transformational leadership and
organisational performance have been identified in studies on SMEs in Malaysia. For
example, Lo et al. (2009) conducted a study to investigate the impact of
transformational leadership in the manufacturing industry. The results showed a

116
significant positive effect between the two variables. Md Saad & Mazzarol (2010)
also indicated that transformational leadership is positively related to product and
process innovation. Finally, Abdul Aziz et al. (2013) also reported in a survey of 375
SMEs in the service industry that transformational leadership has a significant
relationship with performance. Therefore, based on these arguments, it is
hypothesised that:
H1: Transformational leadership is significantly and positively related to
organisational performance.
4.4.1.2 Transactional leadership and organisational performance
Transactional leadership, also referred to as managerial leadership, focuses on the
role of supervision, organisation and group effectiveness. It is a style of leadership
that encourages the compliance of subordinates through rewards and punishments. In
contrast to transformational leaders, transactional leaders like to maintain operational
stability and do not anticipate changing the status quo (Odumuru & Ifeanyi 2013).
Kuhnert and Lewis (1987) asserted that transactional leadership is an exchange
process between the desired outcomes of leaders and followers by fulfilling the
interests of the leaders and the expectations of the followers. This process involves
delivering promises or commitments embedded by respect and trust. Bass (2000)
also indicated that transactional leaders effectively address the interests of their
employees through contingent incentives, honour and promises for those who
succeed in meeting the commitments of the leaders or the goals of the organisation.

117
Research has confirmed that leadership based on a contingent process can positively
affect employees’ satisfaction and performance (Podsakoff & Schriesheim 1985;
Paracha et al. 2012). But some researchers have declared there is a negative effect
between these variables (Yammarino & Bass 1990; Pedraja-rejas et al. 2006).
Howell and Hall-Merenda (1999) concluded that transactional leadership positively
predicts employees’ performance. In Russia, Elenkov (2002) initiated a study to
investigate the impact of leadership on organisational performance and found that
Russian managers who practise transactional leadership behaviour have positive
impacts on organisational performance as well as innovation. In a military setting,
which is characterised as an organisation operating in an unstable environment, Bass
et al. (2003) concluded that platoon leaders who demonstrate transactional leadership
characteristics increase the performance of the platoon members. Yang (2008) also
reported a positive relationship between transactional leadership and business
performance in SMEs in Taiwan.
A study by Pedraja-rejas et al. (2006) indicted that the dominant style of leadership
among managers of SMEs in Chile is the transactional leadership style. But they also
found that this form of leadership has a negative relationship with firm performance.
In contrast, Obiwuru et al. (2011) found that the performance of small businesses in
Nigeria is highly positively affected by transactional leadership behaviour.
In the context of GLCs in Malaysia, Amirul and Daud (2012) investigated the
relationship between transactional leadership and leadership outcomes in 325
companies. The results indicated that transactional leadership is positively related to
118
performance outcomes. Finally, several studies on SMEs in Malaysia also reported
along the same lines. For example, Lo et al. (2009) found that factors of transactional
leadership have a positive relationship with organisational commitment in
manufacturing SMEs. Abdul Aziz et al. (2013) found a positive significant
relationship between transactional leadership and performance in their study on
SMEs in the services sector.
In this study, the practice of transactional leadership behaviour is regarded as highly
important for the success of SMEs. Giving due recognition, creating an effective
exchange mechanism and identifying any problem or deviation before it becomes
serious are the actions of transactional leaders that might exert positive effects on
growth and profitability of SMEs in Malaysia. Therefore, based on these arguments,
it is hypothesised that:
H2: Transactional leadership is significantly and positively related to
organisational performance.
4.4.1.3 Transformational versus transactional leadership and organisational
performance
Generally, in examining the effects of transformational and transactional leadership
on measures of organisational performance, most of the findings reported that
transformational leadership is more effective than transactional leadership (Gardner
& Stough 2002; Bass 1999). Empirical data also show support for transformational
leadership being superior to transactional leadership (Bass et al. 2003; Hood 2003).

119
Elenkov (2002) found that transformational leadership directly and positively
impacts on the organisational performance of Russian companies significantly more
than transactional leadership does. Hood (2003) found that transformational leaders
exhibit significantly higher levels of ethical practices than either transactional or
laissez-faire leaders. A meta-analysis study by Lowe at al. (1996) indicated that
transformational leadership is more highly correlated to work unit effectiveness and
performance than transactional leadership is. Gardner and Stough (2002) found that
the effect of emotional intelligence is highly correlated with every component of
transformational leadership. Recently, findings by Zhu et al. (2012) also suggested
that transformational leadership has a stronger positive relationship with followers’
psychological empowerment and organisational identification than transactional
leadership does.
In the Malaysian business environment, Amirul and Daud (2012) concluded that
transformational leadership is more practical and effective than transactional
leadership for producing positive outcomes for organisations. In manufacturing
SMEs, transformational leadership is reported to have a more significant and stronger
effect on organisational commitment. Leaders who display this behaviour are more
able to develop commitment in employees than transactional leaders are (Lo et al.
2009). Therefore, based on these findings, this study hypothesises that:
H3: Transformational leadership has a greater impact on organisational
performance than transactional leadership does.

120
4.4.2 Entrepreneurial Orientation and Organisational Performance
Three hypotheses are developed on this relationship. In order to test them, the
following research objective and question are proposed.
Research Objective: To examine the relationship between entrepreneurial
orientation and the organisational performance of SMEs in Malaysia
Research Question: To what extent does entrepreneurial orientation influence
organisational performance?
4.4.2.1 Innovativeness and organisational performance
Entrepreneurship would not exist without innovation (Covin & Miles 1999) and
firms that fail to innovate will die. This summarises the importance of innovation
(Kuratko & Hodgetts 2007). ‘Innovativeness’ was introduced into the concept of the
entrepreneurial process by Schumpter (1942). He also coined the term ‘creative
destruction’ to refer to the creation of wealth by the introduction of new goods or
services which disrupts existing businesses. Morris et al. (2007) defined
‘innovativeness’ as identifying creative, unusual or novel solutions to problems and
needs. These solutions can take the form of new processes, new products or new
services.
Innovation is especially important for new organisations and entrepreneurs because,
without innovation, they have to rely on old ways of doing business with consecutive
products/services and traditional distributions channels (Lee et al. 2001). These
authors also claimed that innovativeness displayed by new firms cannot be easily

121
imitated by their competitors since it depends on the quantity and quality of R&D
personnel and complex social relationships among these research scientists.
Innovativeness has been acknowledged as a factor that significantly contributes to
organisational performance (Hult et. al. 2004; Kreiser et al. 2002; Avlonitis &
Salavou 2007). Avlonitis and Salavou (2007) found that the performance of Greek
SMEs is linked positively with product innovativeness. Hughes and Morgan (2007)
investigated the relationship between innovations at early-stage start-ups and
established a positive correlation between innovation and product performance. This
study was generated from 82 high-tech firm incubators in the UK. They also
considered innovation to be the main means to provide differentiation and develop
strategies superior to those of competitors. The outcomes from a meta-analysis study
were also that innovativeness affects business performance (Rauch et al. 2004). In Sri
Lanka, Fairoz et al. (2010) reported a positive significant relationship between
innovativeness and market share growth and overall business performance. They also
concluded that there is a moderate degree of EO in the majority of SMEs in Sri
Lanka. A study of EO across four different industries in Australia revealed that
innovativeness is significant for business performance, and it was identified as the
most significant factor of EO (Coulthard 2007).
In the context of SMEs in Malaysia, Hilmi et al. (2010) attempted to explain the
connection of product and process innovativeness to the performance of 92 SMEs.
They revealed that Malaysian SMEs show a high level of both product and process
innovativeness but only process innovativeness is positively related to performance.
In a different study, innovativeness was found to relate positively to product

122
performance among 101 SMEs in the service industry (Baba & Elumalai 2011).
Awang et al. (2009) investigated 210 SMEs and found that innovativeness is related
significantly and positively to performance. A sample from 143 manufacturing SMEs
also revealed a significant positive relationship between innovativeness and
organisational performance (Ahmad & Ghani 2010).
Based on these findings, it can be argued that it is important for SMEs in Malaysia to
embrace innovativeness in their strategic orientation. Therefore, this study
hypothesises that:
H4: Innovativeness is related significantly and positively to organisational
performance.
4.4.2.2 Proactiveness and organisational performance
Proactiveness is an important element of entrepreneurship (Venkatraman 1989).
Proactiveness has been described as the ability of a firm to foresee and act on the
future wants and needs of the market by establishing a first-mover advantage ahead
of competitors (Lumpkin & Dess 1996). Morris (1998) described this factor as taking
responsibility and doing whatever it takes to ensure an entrepreneurial venture will
produce an outstanding outcome. It also involves perseverance, flexibility and
readiness to assume responsibility for failure.
Research has also indicated that proactiveness positively affects the success of an
organisation. In South Africa, Krauss et al. (2005) investigated the proactiveness of
small business owners and identified a positive significant relationship between
proactiveness and business success. Hughes and Morgan (2007) established that

123
proactiveness has a positive significant effect on both customers and product
performance for firms at an early stage of growth, and this relationship continues as
the venture ages. Lumpkin and Dess (2006) reported that, as a firm grows, the impact
of proactiveness on organisational performance increases. Proactiveness is also
reported to relate positively to sales level, sales growth and gross profit (Kreiser et al.
2002). Earlier, Ward et al. (1994) studied the effect on performance of proactiveness
among manufacturing firms in Ohio and found that proactiveness is positively related
to organisational performance. Proactiveness was also found to positively impact on
market share growth and the overall business performance of SMEs in Sri Lanka
(Fairoz et al. 2010).
Several studies have also reported that the strongest relationship is between
proactiveness and organisational performance compared with the influence of the
other factors of EO (Kreiser et al. 2002; Hughes & Morgan 2007). Comparing
proactiveness and competitive aggressiveness, Lumpkin and Dess (2001) concluded
that the constructs of EO are independent from one another and the relationship
between EO constructs and performance differs between firms. The results from a
study by Kraus et al. (2012) of 124 executives from 94 organisations showed that
proactiveness has a strong significant relationship to organisational performance
measures, whereas competitiveness is negatively, but not significantly, related to
sales growth. Kraus et al. (2012) also found that only the factor of proactiveness is
significantly and positively associated with the performance of the organisation. The
other two factors (innovativeness and risk taking) do not significantly correlate with
business performance.

124
In the context of SMEs in Malaysia, Awang et al. (2009) revealed that proactiveness
has a significant relationship with the overall performance of the 210 SMEs involved
in their study. They also concluded that environmental munificence promotes
proactiveness as the best predictor for effective performance. Ahmad and Ghani
(2010) concluded that proactiveness has the highest significant relationship to
business performance, followed by innovativeness and risk taking, in the business
performance of 143 manufacturing SMEs.
Based on these arguments, it is acknowledged that it is important for organisations to
promote this forward-looking behaviour. The ability of an organisation to anticipate
the needs and wants of the market will enables it to be one step ahead of the
competitors. Therefore, it is hypothesised that:
H5: Proactiveness is related significantly and positively to organisational
performance.
4.4.2.3 Risk taking and organisational performance
Risk taking is described as the willingness of a firm to fund resources for projects
when the outcomes are uncertain (Miller 1983; Wiklund & Shepherd 2005). It also
implies a willingness to pursue opportunities that may incur losses or have
considerable performance inconsistencies (Morris 1998). Since the term
‘entrepreneur’ was first debated, risk-taking behaviour has been linked to
entrepreneurship (Palich & Bagby 1995). It requires firms to take bold actions by
launching into the unknown, borrowing heavily and/or investing significant resources
in ventures in an uncertain environment (Rauch et al. 2009).

125
Mixed results are reported in regard to the impact of risk taking on organisational
performance. Some scholars have reported that there is a significant positive
relationship between risk taking and performance (Wang & Poutziouris 2010; Fairoz
et al. 2008; Yang 2008). Their findings indicated that taking a risk is likely to
improve organisational performance. A UK-based study of 236 family firms by
Wang and Poutziouris (2010) examined the impact of risk taking on business
performance and reported that a risk-taking propensity correlates with entrepreneurial
business performance. Fairoz et al. (2010) and Yang (2008) also reported a
significant relationship between risk taking and business performance measured
through market share growth and financial and overall performance in their
respective studies in Sri Lanka and Taiwan. A meta-analysis consisting of 51 studies
with a total of 14,259 samples also indicated a positive correlation between risk
taking and performance (Rauch et al. 2004).
Some studies have failed to find a significant relationship between these two
variables (Kraus et al. 2012; Haselmann & Wachtel 2007) and have argued that
taking a risk does not entail an impact on the performance of an organisation.
Haselmann and Wachtel’s (2007) study of a random sample of 423 banks in 20
European countries found no clear relationship between banks’ risk taking and their
institutional environment. Likewise, a recent finding by Kraus et al. (2012) on 164
small and medium-sized firms in the Netherlands concluded that risk taking does not
have a direct significant relationship to growth and financial performance. Only when
accounting for its interaction with market turbulence does risk taking show a negative
impact. They also suggested that SMEs should minimise their level of risk and
should avoid projects that are too risky.

126
Another stream of studies has proposed that risk taking produces an inverted U-
shaped curvilinear relationship to sales level and sales growth (Begley & Boyd 1987;
Kreiser et al. 2002; Miller & Friesen 1982). They explained that risk taking shows a
positive effect on performance measures to a certain level, and beyond that level the
increase in risk taking starts to show a negative effect (Begley & Boyd 1987).
Therefore, firms embracing a moderate level of risk taking are higher performers
than those which take high or low levels of risk (Kreiser et al. 2002).
In the context of SMEs in Malaysia, Awang et al. (2009) reported a significant
negative relationship between risk taking and objective measures of performance.
This negative relationship implies that there is a curvilinear relationship between
these two elements. A contrasting finding was reported by Ahmad and Ghani (2010),
who found a significant relationship between risk-taking propensity and the
organisational performance of manufacturing SMEs. They also found that the three
factors of EO (innovativeness, proactiveness and risk taking) account for 66.7% of
the variance in the business performance of manufacturing SMEs.
Based on these arguments, this study argues that being a risk taker supplements an
entrepreneur’s innovativeness and proactiveness. Without the factor of risk taking, it
is very difficult for entrepreneurial firms to make things happen. Taking on risk is
expected to provide growth and profitability. Therefore, in this study, it is
hypothesised that:
H6: Risk taking is related significantly and positively to organisational
performance.

127
4.4.3 Leadership Behaviour, Entrepreneurial Orientation and Organisational
Performance
Four hypotheses are developed for this relationship. In order to test them, the
following research objective and research question are proposed.
Research Objective: To investigate the mediating effect of entrepreneurial
orientation on the relationship between leadership behaviour and the organisational
performance of SMEs in Malaysia.
Research Question: To what extent does entrepreneurial orientation mediate the
relationship between leadership behaviour and organisational performance?
The objective of examining EO as a mediating variable in the relationship between
leadership behaviour and organisational performance is based on suggestions from
the literature. Lumpkin and Dess (1996) urged for research to examine EO as a
mediating variable. Several authors who studied EO in the context of Malaysian
SMEs also suggested future research to identify other independent or antecedent
variables that could provide a better understanding of the performance of SMEs
(Zainol & Ayadurai 2011). Leadership is one of the proposed variables (Awang et al.
2010).
4.4.3.1 Transformational Leadership, Entrepreneurial Orientation and
Organisational Performance
Different types of leadership behaviour can have different effects on the capacity to
transmit entrepreneurial spirit and to encourage small business innovation (Soriano &
Martinez 2007). According to Eyal & Kark (2004), transformational leadership is one

128
of the main processes in influencing followers and improving their devotion, loyalty
and enthusiasm, and it is acknowledged to set the basic conditions for a radical
entrepreneurial approach. Previous studies have shown that transformational
leadership contributes significantly to the factors of EO (Eyal & Kark 2004; Yang
2008).
Among the various factors affecting the innovativeness of an organisation, the top
manager’s leadership behaviour is recognised as being ‘one of the most, if not the
most, important’ (Jung et al. 2003, p. 525; Dess & Picken 2000). According to
Walumbawa and Lawler (2003), transformational leaders encourage followers to
think critically and develop new ideas and approaches to existing practices. In other
words, firms that motivate experimentation and change encourage a culture that
stimulates an entrepreneurial attitude.
Morris et al. (2007) claimed that entrepreneurship is more consistent with
transformational than with transactional leadership. The results from their correlation
matrix showed that EO is significantly correlated with both leadership styles, with
transformational leadership having a greater value than transactional leadership. They
concluded that the more transformational leadership qualities are demonstrated, the
more entrepreneurial the organisation tends to be. This is because transformational
leadership gives employees more discretion in how to do their jobs. Entrepreneurial
firms also tend to have boards of directors that are actively involved in the firm.
Berson et al. (2001) expressed that transformational leadership is helpful for any
innovation implemented by an organisation in the era of competition. A

129
transformational leader can smooth the progress of innovations and changes by
valuing the enlargement of the vision and by encouraging subordinates to pursue that
vision. Matzler et al. (2008) found that the path coefficients between transformational
leadership and innovativeness on the one hand and growth and profitability on the
other hand are all positive and significant. This gives a strong indication that the
relationship between transformational leadership and organisational performance
could be mediated by the presence of EO.
From a sample of 283 respondents from service and manufacturing SMEs in
Malaysia, Arham et al. (2012) also found that transformational leadership is related
to EO and that EO is significantly related to growth and profitability. Hassim et al.
(2011) proposed that appropriate behaviour of the leaders of SMEs is an important
factor of a firm’s strategy for enhancing its entrepreneurial stance. Based on these
outcomes, the following two hypotheses are proposed:
H7: Entrepreneurial orientation fully mediates the relationship between
transformational leadership and growth performance.
H8: Entrepreneurial orientation fully mediates the relationship between
transformational leadership and profitability performance.
4.4.3.2 Transactional Leadership, Entrepreneurial Orientation and Organisational
Performance
Leadership has implications for the level of entrepreneurship in a firm (Morris et al.
2007). Tarabishy et al. (2005) suggested that the leader and their type of leadership
style influence both their subordinates and the organisation’s strategic entrepreneurial

130
orientation. Their study showed that there is a significant relationship between the
CEO’s leadership style, for both transformational and transactional leadership, and an
organisation’s strategic entrepreneurial orientation represented by proactiveness,
innovation and risk taking.
Transactional leadership implies that a leader has monitoring behaviour which seeks
to control others to ensure stability in the workplace and to ensure that procedures are
followed (Bass 1985). There are contradictory findings on leadership behaviour and
EO in previous studies. Yang (2008) found that transactional leadership has a small
positive relationship to EO but in a study conducted by Eyal and Kark (2004), no
significant relationship was found between transactional leadership and EO. They
claimed that managers who employ transactional leadership behaviour, which is
related to managerial stance, are less inclined to be proactive or to encourage
innovativeness.
Jung et al. (2008) contended that the leaders of an organisation have a direct
influence on organisational performance through their characteristics and behaviour
and an indirect influence through the strategic choices they make. EO can be seen as
a firm’s strategic choice that captures the specific entrepreneurial aspects of decision-
making styles, methods and practices (Wiklund & Shepherd 2005) and it is a key to
enhance organisational performance (Covin & Slevin 1989; Lumpkin & Dess 1996).
In the context of of SMEs in Malaysia, Arham et al. (2012) established that
transactional leadership is related to EO, and EO is significantly related to growth

131
and profitability. This perspective supports the development of the final two
hypotheses in this study:
H9: Entrepreneurial orientation fully mediates the relationship between
transactional leadership and growth performance.
H10: Entreprenurial orientation fully mediates the relationship between
transactional leadership and profitability performance.
4.5 Scope of the Research Framework
Based on the proposed research framework, the following factors define the scope of
this framework:
i. This framework only forecasts transformational and transactional leadership
at the construct level. The factor-level relationships of other variables are not
observed. This means that this study does not separately examine the effects
of the four types of behaviour that represent transformational leadership or
the three types of behaviour that represent transactional leadership.
ii. The effects of leadership behaviour on employees and leadership outcomes
such as satisfaction, extra effort and effectiveness are not observed. This
framework only forecasts the perceptions of leaders regarding the effects of
their leadership behaviour on growth and profitability.
iii. This framework focuses on SMEs in Malaysia in the service and
manufacturing industries only.
iv. This study acknowledges that there are other factors that might influence
organisational performance. Besides leadership and EO, other factors such as

132
culture, strategy and environment have been discussed as affecting outcomes.
But in the scope of this study, factors other than leadership and EO are not
included in the framework.
4.6 Summary
This chapter has presented and discussed the development of a theoretical
framework. Prior to the development of the research framework, two relevant
theories of transformational leadership and the RBV were discussed. These theories
serve as the foundation of this study. Then the research framework was presented,
followed by the definitions of the variables in the framework.
Based on this framework, ten hypotheses were proposed that focus on the
relationships between leadership behaviour and organisational performance, EO and
organisational performance and the role of EO as a mediator in the relationship
between leadership behaviour and organisational performance. The relevant literature
and empirical findings to support each hypothesis were reviewed and discussed. The
next chapter discusses the justification of the research methodology employed in this
study.

133
CHAPTER 5
RESEARCH DESIGN AND JUSTIFICATION OF
RESEARCH METHODOLOGY
5.1 Introduction
The previous chapter presented the research framework for examining the
relationships between leadership behaviour, EO and organisational performance. It
also summarised the relevant literature that supported the development of the ten
hypotheses.
The purpose of this study is to develop a theoretically derived and empirically tested
final path model in order to test these relationships. To achieve that, this chapter
describes and discusses the research design and methodology adopted in this study.
After the introduction, Section 5.2 discusses the research paradigm that supports the
selection of the research design and methodology of this study. Section 5.3 provides
an explanation of the research design adopted. Steps involved in each stage are
discussed. Section 5.4 provides the justification of the research design. Section 5.5
discusses the actions related to quantitative research design and data analysis. Section
5.6 explains the qualitative research design and analysis. Ethical considerations are
covered in Section 5.7. Section 5.8 concludes this chapter.
5.2 Research Paradigm
A paradigm can be a conceptual model or a person’s view of the world (Mertens
2003; Guba & Lincoln 1994). Several paradigms could influence the selection of the
methodology used in a study. These paradigms are depicted in Table 5.1, which

134
displays the major elements in different schools of thought on research paradigms, as
discussed by Creswell (2003).
Table 5.1: Alternative Research Paradigms
Postpositivism Constructivism
Determination
Reductionism
Empirical observation and measurement
Theory verification
Understanding
Multiple participant meanings
Social and historical construction
Theory generation
Advocacy/Participatory Pragmatism
Political
Empowerment issue oriented
Collaborative
Change oriented
Consequences of actions
Problem-oriented
Pluralistic
Real world practice oriented
Source: Creswell 2003
Postpositivism is sometimes also called the scientific method, positivist research or
quantitative research. The term ‘postpositivism’ refers to developments after
positivism which challenged the traditional view of the absolute truth of knowledge
(Phillips & Burbules 2000). Other researchers question whether a researcher can ever
be totally objective (Coffey 1999; Creswell 2003). Coffey, for example, argued that
objectivity may perhaps be an illusion for positivist researchers, since in ‘real life’
one does not find out about other individuals by remaining remote from them. In this
paradigm, researchers study causes that influence outcomes. Thus, in this method,
they begin with a theory, collect data related to the theory that either support or reject
their hypotheses, then make necessary revisions before conducting additional tests
(Cresswell 2003). In a different paradigm, the constructivist paradigm, the

135
researcher’s aim is to make sense of the meanings others have about the world. They
inductively generate and develop a theory or pattern of meaning.
The advocacy/participatory approach is another school of thought. It sees enquiry
needs as entwined with politics and a political agenda. Thus, research should
incorporate an action agenda for reforms that may change the lives of the participants
and the researcher, and may change the institutions in which the participants work
and live. Finally, pragmatism is a school of thought that is not committed to any one
system of philosophy or reality. It applies to mixed methods research in that
researchers draw conclusion from quantitative and qualitative data. According to this
school of thought, the researcher is free to choose the methods, techniques and
procedures that best meet their purposes and demands. The world is not viewed as an
absolute unity. Pragmatists view the truth as being what works at the time; it is not
based on a strict dualism between the mind and reality (Creswell 2003; Cherryholmes
1992).
Research is about asking questions and finding information to answer the questions
that we pose (Mukhreji & Albon 2010). The selection of a research paradigm for this
study was influenced by the research questions proposed in this study (see Section
1.5). To find answers to those research questions, this study adopts the pragmatic
research paradigm. Pragmatism has elements of both positivism and constructivism
(Healy & Perry 2000). Under this paradigm, this study adopts a combination of
methodologies with the aim of providing the best understanding of the research
problems (Creswell 2003).

136
The positivist element requires a scientific, systematic approach to research that leads
this research to the quantitative methodology, which is the main method of data
collection in this study. In this approach, researchers focus on the confirmatory stages
of the research cycle that consist of the formulation of hypotheses and the collection
of numerical data to test those hypotheses (Mukhreji & Albon 2010). Sale et al.
(2002) also suggested that the quantitative paradigm is derived from positivism. In
addition, Sobh and Perry (2006) agreed that the use of quantitative methods for
theory formulation and model testing validates the positivist approach.
The constructivist approach leads to the use of qualitative methods to understand a
particular phenomenon in its social context. The use of semi-structured interviews as
a secondary source of data enhances the findings from the quantitative outcomes.
Thus the pragmatic stance adopted in this study allows for the application of methods
and a philosophy to fit together the factual results provided by quantitative research
and the insights provided by qualitative research to produce practical and feasible
solutions (Johnson & Onwuegbuzie 2004).
5.3 Research Design
This study employs mixed methods research, a combination of quantitative and
qualitative approaches to data collections and analysis. Mixed methods research has
evolved to a point where it is a distinct methodological orientation with its own world
view, vocabulary and techniques. In this research, the researcher combines
quantitative and qualitative research techniques, methods, approaches, concepts and
language in a single study (Tashakkori & Teddlie 2003; Johnson & Onwuegbuzie
2004).

137
According to Cassell and Symon (1994), quantitative approaches alone are unable to
assess how and why a change has occurred and therefore qualitative data is also
needed. For example, the results from quantitative data may describe the strength or
the extent of the relationships between variables. But why two independent variables
might have different effects on a dependent variable could be explained only through
the use of qualitative data. Thus, mixed methods can be defined as ‘research in which
the investigator collects and analyses data, integrates the findings, and draws
inferences using both qualitative and quantitative approaches and methods in a single
study or a program of inquiry’ (Tashakkori & Creswell 2007, p. 4).
There are several types of mixed method designs. This study adopts the sequential
explanatory design. In this research design, the researcher collects and analyses the
quantitative data and then the qualitative data in two consecutive stages (Ivankova et
al. 2006). This approach was selected to provide a broad and in-depth understanding
of the relationships between the variables in this study.
In this study, the role of the quantitative data is to test the proposed hypotheses and,
most importantly, to provide answers to the research questions. In accordance with
the purpose of mixed methods research design proposed by Creswell (2003) and
Tashakkori and Teddlie (2003), the role of the qualitative data in this study is to
confirm and to expand on the understanding obtained from the quantitative findings.
In this instance, the purpose of obtaining qualitative data is to gain insights into the
factors which influence hypothesised situations. For example, in the interviews,
respondents were asked whether or not they thought their leadership behaviour
contributed to organisational performance. If they said not, they were allowed to

138
explain the other factors that they considered more critical for organisational success.
Figure 5.1 depicts the sequential model adopted in this study and Figure 5.2 provides
a snapshot view of the research design and the detailed stages involved in this study.
Figure 5.1: Sequential Explanatory Design
Source: Adopted from Creswell & Clark (2007)
QUANTITATIVE Qualitative Interpretation based

139
Figure 5.2: Stages of Research Design
Literature review in broad area of study
Literature review of
leadership behaviour
Literature review of entrepreneurial
orientation
Literature review of organisational
performance
Identify research problem
Identify key constructs
Develop research framework Develop research questions and
hypotheses
Operationalise key construct
Develop sample frame Develop questionnaire
Pilot questionnaire
Refine questionnaire
Administer questionnaire
Data entry and cleaning
EFA, CFA and SEM
Hypothesis testing
Source: Adapted from Neuman (2006); Creswell & Clark (2007)
Stage 4: Thesis
Stage 3: Qualitative data
collection and analysis
Stage 2: Quantitative data
collection and analysis
Stage 1: Literature
review and research
design
Qualitative data collection
Pilot interview Interview participants Development of interview
protocol
Data analysis: Thematic
analysis
Interpret and report findings:
Quantitative and Qualitative

140
Before collecting quantitative data, this research began with an extensive review of
the literature in the areas of leadership, entrepreneurial orientation and organisational
performance (see Figure 5.2). The literature review facilitated the development of the
conceptual model and the formulation of the research objectives, research questions
and hypotheses. Then the final constructs to be included in the model were
operationalised and the research instruments were developed. The final process was
the identification of sampling frames to be used in data collection.
The second stage of the research design was the pilot test and quantitative data
collection and analysis. Pilot testing was conducted to ensure the clarity and
accuracy of the translated questionnaire and to obtain feedback on its format, design,
clarity, understanding and the ease and time for completion. Several modifications
were made to refine the survey questionnaire for use in the data collection stage.
Details of the pilot testing are in Section 5.5.9. The administration of questionnaires
involved the distribution of survey questionnaires to potential respondents. After
obtaining the required number of respondents based on the population of this study
(see Section 5.5.4), data analysis was preceded by data entry and data cleaning, and
followed by quantitative analysis to test the proposed hypotheses. Exploratory factor
analysis (EFA), confirmatory factor analysis (CFA) and structural equation
modelling (SEM) were conducted to examine the proposed relationships.
Methods chosen by researchers should be able to address their research questions
(Punch 2003). Creswell (1994) mentioned that quantitative approaches to scientific
inquiry generally rely on testing theoretical propositions. The quantitative research
method is suggested when the research is designed to investigate causal relationships

141
between underlying variables (Neuman 2011). Quantitative research enables the
researcher to establish statistical evidence of the strengths of the relationships
between independent and dependent constructs (Amaratunga et al. 2002).
Furthermore, these authors suggested that the statistical results from quantitative
research show the directions of relationships and can be used to verify hypotheses.
Therefore, in order to answer the research questions in this study and to develop a
theoretically derived and empirically tested final path model to test the proposed
hypotheses, the quantitative approach to data collection and analysis seemed to be the
most appropriate method for this study. In addition, researchers on leadership
typically adopt quantitative approaches (Antonakis et al. 2004). Based on the content
analysis by Lowe & Gardner (2001) of 188 articles published in The Leadership
Quarterly until 1999, 71% of this type of research used quantitative approaches.
There were about 40 qualitative studies but only 13 of those had employed mixed
methods research.
The third stage was qualitative data collection. Four activities are involved in this,
beginning with the development of the interview schedule (see Appendix G). Then,
pilot interviews were conducted to identify any flaws, mistakes or weaknesses in the
design of the interview questions. Some modifications were consequently made to
the interview questions. A total of nine semi-structured interviews were scheduled
and carried out to compare with the findings obtained from the analysis of the
quantitative data. Semi-structured interviews were employed since they involve an
in-depth examination of the respondents and the topics (Minichiello et al. 1995).
Interview data were analysed by using thematic analysis.
142
There is a growing interest in studying leadership and entrepreneurship from a
qualitative perspective (Arham & Sulaiman 2013; Murphy & Ensher 2008). Parry
(2006) indicated that for many years organisational leadership research has been
dominated by quantitative methods. But this scenario is beginning to change. Conger
and Toegel (2002) proposed three reasons for the qualitative method being an
important tool for leadership research. First, the qualitative method can help us to
understand how leadership is exercised differently at various organisational levels.
Second, due to the dynamic process of leadership, this tool can add a depth and
richness that is lacking in data gathered from survey questionnaires. Third, the
qualitative approach assists in understanding a construct from multiple perspectives.
Thus, the second and third reasons matched the purposes of collecting qualitative
data in this study.
The final stage involved the interpretation and reporting of findings obtained from
quantitative and qualitative data collection. The results are presented in Chapter 6.
5.4 Justification of Research Design
There are several elements of research design discussed by Sekaran and Bougie
(2010) that need to be considered by a researcher. These essential elements are the
following:
i) Purpose of study
ii) Type of investigation
iii) Extent of researcher interference
iv) Study setting
v) Unit of analysis

143
vi) Time horizon of study
Table 5.2 indicates how these elements are involved in this study.
Table 5.2: Elements of Research Design
Elements of research design Application in this study
Purpose of study Hypothesis testing
Type of investigation Correlational
Extent of researcher interference Minimal
Study setting Non-contrived; field study
Unit of analysis Organisational level
Time horizon Cross-sectional
Source: Sekaran & Bougie (2010)
The main purpose of this study is to empirically test the ten hypotheses as proposed
in Chapter 4. The quantitative approach was included to explain the nature of certain
relationships between two or more variables or to predict organisational outcomes.
When the researcher is interested in describing or explaining the important variables
associated with an issue, this is referred to as a correlational study (Sekaran &
Bougie 2010). This study examines the correlation effects of leadership behaviour
and EO on the organisational performance of SMEs.
The extent of interference by the researcher can be categorised into minimal,
moderate and excessive interference. A correlational study involves minimal
interference by the researcher with the normal flow of work and is conducted in a
natural setting (Sekaran & Bougie 2010). Since this study was done in a natural
environment where work proceeds normally, it is referred to as non-contrived setting.
144
The correlational studies conducted in organisations are classified as field study
(Sekaran & Bougie 2010).
The unit of analysis is at the organisational level since the concern of this study is to
examine whether the performance of an organisation is influenced by leadership
behaviour and EO. The owners or top managers of SMEs in the service and
manufacturing industries are the target population of this study. Wiklund (1999)
claimed that the strategic orientation of the chief executive officer is likely to
represent the strategic orientation of the firm. Finally, this study is a cross-sectional
study, in which data are gathered just once (Sekaran & Bougie 2010). Cross-sectional
surveys provide the opportunity to assess the relationships between variables (Reis &
Judd 2000) and have been identified as the most popular form of survey method
(Zikmund 2003). A cross-sectional survey is also less expensive and time-consuming
than a longitudinal study and tfor that reason too it has been employed in this study
The sections that follow explain and justify the elements involved in both
quantitative and qualitative data collection and analysis. It begins with the main
source of data, the quantitative survey.
5.5 Quantitative Data Collection
5.5.1 Population
The three main sectors of SMEs in Malaysia are manufacturing, services and
agriculture. Mining and construction are also considered Key Economic Activities
that contribute to the GDP of Malaysia. Table 5.3 presents the number of
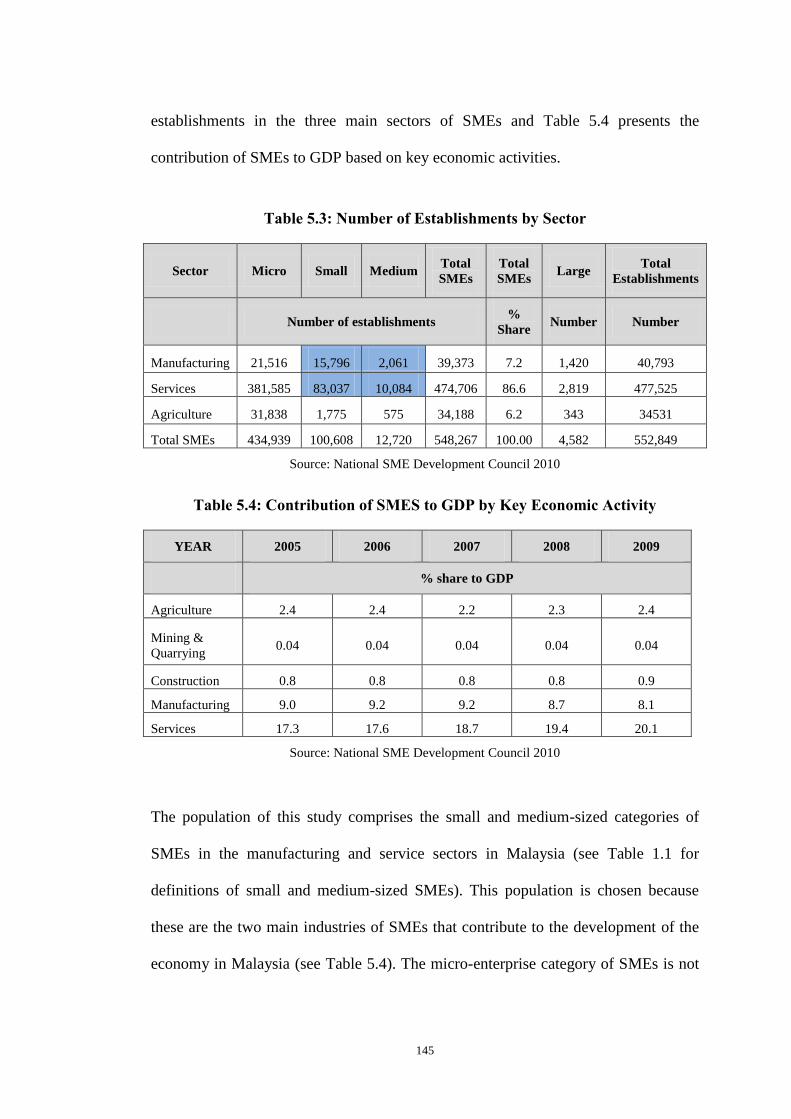
145
establishments in the three main sectors of SMEs and Table 5.4 presents the
contribution of SMEs to GDP based on key economic activities.
Table 5.3: Number of Establishments by Sector
Sector Micro Small Medium Total
SMEs
Total
SMEs Large
Total
Establishments
Number of establishments %
Share Number Number
Manufacturing 21,516 15,796 2,061 39,373 7.2 1,420 40,793
Services 381,585 83,037 10,084 474,706 86.6 2,819 477,525
Agriculture 31,838 1,775 575 34,188 6.2 343 34531
Total SMEs 434,939 100,608 12,720 548,267 100.00 4,582 552,849
Source: National SME Development Council 2010
Table 5.4: Contribution of SMES to GDP by Key Economic Activity
YEAR 2005 2006 2007 2008 2009
% share to GDP
Agriculture 2.4 2.4 2.2 2.3 2.4
Mining &
Quarrying 0.04 0.04 0.04 0.04 0.04
Construction 0.8 0.8 0.8 0.8 0.9
Manufacturing 9.0 9.2 9.2 8.7 8.1
Services 17.3 17.6 18.7 19.4 20.1
Source: National SME Development Council 2010
The population of this study comprises the small and medium-sized categories of
SMEs in the manufacturing and service sectors in Malaysia (see Table 1.1 for
definitions of small and medium-sized SMEs). This population is chosen because
these are the two main industries of SMEs that contribute to the development of the
economy in Malaysia (see Table 5.4). The micro-enterprise category of SMEs is not

146
included in this study. As shown in Table 5.3, there are currently 17,857
manufacturing establishments and 93,121 service establishments of SMEs in the
country. The total of these two categories, 110,978 enterprises, is used in this study
as the entire population.
5.5.2 Sampling
According to Sekaran and Bougie (2010), sampling involves the process of selecting
a sufficient number of the target population so that a generalisation can be made to
the whole population. The manner in which samples are taken influences the
accuracy of the survey results and their generality.
Since this study examines the leadership behaviour of entrepreneurs, the owners or
the top managers of SMEs were selected as the target sample of the population. This
decision was made due to owners’ or top managers’ knowledge and expertise
regarding the establishment, operation and direction of their firms. Owners and top
managers are also the most informed individuals about their firm’s overall
operational activities (Yang 2008). The decision to rely on the single respondent
approach was also based on the size of the firm and the respondent’s familiarity with
the research topic and the information sought. More explicitly, the views of a single
respondent when he or she is the owner or top manager are likely to represent those
of the firm (Lyon et al. 2000). In addition, according to Isobe et al. (2004), small and
medium-sized enterprises tend to have a relatively limited number of core products
and technology and therefore the owners or managers of SMEs are likely to have a
clear understanding of their business operation, consequently enhancing the accuracy
of their responses.

147
5.5.3 Sampling Frame
A sampling frame is a representation of the elements of the population. Sekaran and
Bougie (2010) defined a sampling frame as ‘a physical representative of all elements
in the population from which the sample is drawn’ (p. 267). This physical
representative could be a company database, random-digit dialling or a membership
roster (Hair et al. 2000). It consists of a list or set of directions for identifying the
target population. For this study, lists of SME establishments were obtained from the
SME Corp. Malaysia at http://www.smecorp.gov.my and also at
http://www.smeinfo.com.my. The researcher was able to access information that
included the name of the company, e-mail address, industry type or specialisation,
postal address, website and telephone numbers.
5.5.4 Sampling Technique
There are two basic types of sampling design: probability and nonprobability
sampling. In probability sampling, every unit of the population has some known,
non-zero chance or probability of being chosen as a sample subject. It is used when
the representativeness of the sample is important for generalisations. In
nonprobability sampling, the elements of the population do not have a known or
predetermined chance of being selected as subjects. It is used when time or other
factors are more important than generalisability (Sekaran & Bougie 2010).
In this study, probability sampling, in which each member of the population has an
equal chance of being selected for the sample, was employed (Jackson 2008).
Specifically, the type of probability sampling used in this study was simple random
sampling. Since this study intended generalisation to the entire population, simple

148
random sampling seemed appropriate. Simple random sampling is a technique where
every unit in the population has a known and equal chance of being chosen for the
sample (Jackson 2008; Sekaran & Bougie 2010).
5.5.5 Sample Size
When calculating the sample size, the most appropriate size is an important decision
to be made. If too large, the sample might lead to inefficiencies and wastage of
resources. Yet too small a sample will yield information that might not be valid for
making inferences about the population. Roscoe (1975) suggested that a rule of
thumb for determining sample size is that a sample size of between 30 and 500 is
suitable for most research. To ensure a good decision, Krejcie and Morgan (1970)
simplified the model for the sample size needed given the number of population for
research. Based on the table they proposed, this study required a sample size of 384
to represent the entire population (see also Sekaran & Bougie 2010).
The use of SEM as the main analytical procedure in this study also required a careful
decision in regard to the sample size. Hair et al. (1998) recommended that the sample
should be at least 100 observations to obtain reliable results. Recent
recommendations suggest a critical sample size of 200 to provide sufficient statistical
power for data analysis and to obtain reliable results (Yuksel et al. 2010; Hoe 2008).
Researchers have also strongly suggested avoiding a small sample size when using
SEM since this might create problems and provide unstable results (Gerbing &
Anderson 1988; Fornell & Larcker 1981). Since this study uses a maximum
likelihood estimation in SEM, the target of 384 samples also seemed to fit well with
the requirement of sample size for SEM.
149
5.5.6 Recruitment Strategy
Two strategies were adopted to recruit the intended number of respondents for the
sample. The first strategy was a web-based survey and the second strategy was self-
administered questionnaires distributed through the training programs, seminars and
other events organised by the SME Corp. Malaysia and other agencies such as the
Malaysian Institute of Management and Majlis Amanah Rakyat (MARA). These
agencies provide training and seminars for the entrepreneurs registered with SME
Corp. Malaysia.
Details of SMEs in the manufacturing and service sectors were assessed through the
databases provided by SME Corp. Malaysia at http://www.smecorp.gov.my and at
http://www.smeinfo.com.my. A letter of approval from SME Corp. Malaysia to
access these databases is attached as Appendix B. For the web-based survey, in order
to obtain the intended number for the sample, a total of 1000 individuals were first
identified, considering the possibility of a low response rate from the target
population (Hunt & Chonko 1987). 50% of the SMEs were selected from the
manufacturing sector and 50% from the service sector, based on the sampling
technique chosen. The questionnaire was distributed to them by e-mail.
The researcher anticipated that the response from the online survey might be very
low. Therefore, three follow-up e-email reminders were scheduled and sent. Follow-
up telephone calls were also made to increase the response rate. In case the response
was still inedequate, the researcher had planned another approach to data collection
and this second strategy for reaching the population of this study was required.
During the period of collecting data from the online approach, the researcher initiated

150
direct contact with the SME Corp. Malaysia and several other entrepreneurial
development agencies to obtain permission to distribute survey questionnaires during
events, seminars and training programs organised by them. Positive feedback was
received from some of those agencies, which were willing to assist with the
distribution and collection of the survey questionnaires.
For those who were willing to assist in the distribution of the survey questionnaires,
there was a further discussion with the main contact person of each agency or
department. In this discussion, the researcher further explained the purpose of
conducting the survey, the respondents targeted for the survey, the role of the person
who would be distributing the survey and the timing for the survey to be distributed.
Copies of the survey questionnaire were provided to them based on the expected
number of participants for each program or event.
5.5.7 Research Instrument
A self-reporting instrument was developed for this research in the form of a
questionnaire containing a total of 60 items in five sections: leadership behaviour (32
items), EO (11 items), organisational performance (8 items), background of
business/participant (8 items) and participant’s willingness to participate in a future
interview with the researcher (1 item).
Section 1 contains the measurements for leadership behaviour that were adopted
from the Multifactor Leadership Questionnaire (MLQ) by Bass and Avolio (2004).
They were measured on a five-point Likert scale that ranged from 0 (Not at all) to 4
(Frequently, if not Always).

151
Section 2 measures the EO construct, which in this study comprises the initial factors
developed by Miller (1983): innovativeness, proactiveness and risk taking. The
measurement of these factors was adopted from Covin and Slevin (1989) and Wang
(2008).
Section 3 measures the organisational performance construct through growth and
profitability. The measurement of these factors was adopted from Matzler et al.
(2008) and Tan (2007). To standardise the scaling format of the research instrument,
all items for EO and organisational performance were also measured on five-point
Likert scales ranged from 0 (Strongly Disagree) to 4 (Strongly Agree). (A copy of the
survey questionnaire is in Appendix E.)
Section 4 asks for demographic information and business background of the
respondents. Eight questions are in four different categories. These questions were
asked to obtain information about the background of the respondents and their
businesses which could be used to enhance the outcomes of this study. The
demographic questions are listed in Table 5.5.
The final section of the survey questionnaire asks whether the respondent would be
willing to participate in an interview with the researcher. If he or she agrees, they are
required to provide further contact details in the section provided. If not, that is the
end of the survey questionnaire.

152
Table 5.5: Questions on Background of Respondent
Categories of Questions Item
Demographic Questions
Age
Gender
Race
Role of Respondent Position in Organisation
Education Level
Type of industry Which industry that is best to describe your organisation?
Firm size What is your sales turnover last year?
How many full time employees do you have?
The following sections present a detailed explanations of the measurements selected
for each of the variables in this research.
5.5.7.1 Leadership Behaviour Measures
In the organisational sciences, the Multifactor Leadership Questionnaire (MLQ) is
the most commonly used instrument for measuring transformational and transactional
leadership behaviour (Tejeda et al. 2001; Muenjohn & Armstrong 2007). The
researcher has obtained permission from Mind Garden to use the MLQ Leader 5X
short form that consists of 45 items. Only 32 items representing transformational and
transactional leadership were included in the questionnaire. The remaining items
were excluded from this study since they are used to measure laissez-faire leadership
and leadership outcomes, which are not included in the scope of this study.
Twenty questionnaire items in total measure four types of behaviour of
transformational leadership. Eight items measure idealised influence. There are four
items to measure each of the following: inspirational motivation, intellectual
stimulation and individualised consideration. Twelve items in total measure three

153
types of behaviour of transactional leadership. There are four items to measure each
of the following: contingent reward, management-by-exception (active) and
management-by-exception (passive). Due to the copyright issue, the researcher can
only present samples of the items used in this research (see Table 5.6). It is not
permitted to include all the items used in the survey. The scale used is: 0=Not at all,
1=Once in a While, 2=Sometimes, 3=Fairly Often and 4=Frequently, if not Always.
Table 5.6: Samples MLQ Items
Leadership
Behaviour
Behaviour Sample Item
Transformational
leadership
Idealised influence I talk about my important values and beliefs.
Intellectual
stimulation
I re-examine critical assumptions to question
whether they are appropriate.
Transactional
leadership
Contingent reward I provide others with assistance in exchange for
their efforts.
Management-by-
exception (active)
I focus attention to irregularities, mistakes,
exceptions and deviations from standards.
Source: Bass & Avolio (2004)
5.5.7.2 Entrepreneurial Orientation Measures
As mentioned previously, the items used to measure EO were adopted from the
factors developed by Miller (1983) that consist of innovativeness, proactiveness and
risk taking. The measurement of these factors was adopted from Covin and Slevin
(1989) and Wang (2008). The EO scale that consists of these three factors is the most
widely used measure of EO in entrepreneurship literature (Runyan et al. 2012). Table
5.7 shows the questionnaire items used to assess EO. Four items measure
innovativeness, four items measure proactiveness and three items measure risk

154
taking. The scale used was: 0=Strongly disagree, 1=Disagree, 2=Neither agree or
disagree, 3=Agree and 4=Strongly agree.
Table 5.7: Items for Entrepreneurial Orientation
Innovativeness (Inn)
Q1 My company has marketed many new lines of products or services.
Q4 I believe that changes in the product/service lines in my company have been mostly
minor in naturea.
Q6 In general, I favour a strong emphasis on research & development, technological
leadership and innovations.
Q8 I am willing to try new ways of doing things and seek unusual, novel solutions.
Proactiveness (PA)
Q3 In dealing with competitors, my company typically responds to actions which
competitors initiatea.
Q5 In general, I like to anticipate events occurring related to my jobb.
Q9 In dealing with competitors, my company typically initiates actions which competitors
then respond to.
Q11 In dealing with competitors, my company is very often the first to introduce new
products and administrative techniques.
Risk Taking (RT)
Q2 My company has a strong proclivity/tendency for high risk projects (with chances of
very high returns).
Q7 When confronted with decision making situations involving uncertainty, my company
adopts a bold strategy in order to maximise the probability of exploiting opportunities.
Q10 When confronted with decision making situations involving uncertainty, my company
adopts a cautious ‘wait-and-see’ strategya.
Remarks: aIndicates reverse items for quantitative analysis
bDeveloped by the researcher
Sources: Covin & Slevin (1989) and Wang (2008)
5.5.7.3 Organisational Performance Measures
The following table shows the questionnaire items used to measure organisational
performance. These measures are used to assess the two factors of performance. Four
items measure growth and four items measure profitability, adopted from Matzler et

155
al. (2008) and Tan (2007) with some modifications to fit the context of this study.
For example, Item 8 asks respondents to evaluate their growth during the past three
years. Carneiro et al. (2007) suggested that a three-year time frame seems reasonable
for assessment of past performance by leaders of organisations. The scale used is:
0=Strongly disagree, 1=Disagree, 2=Neither agree or disagree, 3=Agree and
4=Strongly agree.
Table 5.8: Items for Organisational Performance
Profitability (PROF)
Q1 We are satisfied with the return on our investments.
Q3 We have higher return on investment (than our competitors).
Q5 We are satisfied with our return on sales.
Q7 In general, my company has achieved a very positive financial outcomea.
Growth (GR)
Q2 The growth of our company is above average.
Q4 Our growth is satisfying.
Q6 Our market shares are increasing faster than those of our competitors.
Q8 My company is growing steadily for the past three yearsa.
Remark: aDeveloped by the researcher
Source: Matzler et al. (2008) and Tan (2007)
5.5.8 Scaling of Measures
The use of a Likert scale is quite common in leadership, entrepreneurship and social
science studies in general. Hinkin (1995) noted that over the past several decades,
many scales have been developed to measure various attitudes, perceptions and
opinions of people in all walks of life. It is also common practice for surveys to be
adopted by leaders of organisations as a source of information for decision making. A
five-point scale is used in this study because research shows that a five-point scale is

156
as good as any, and that an increase from a scale of five to a scale of seven or nine
points does not improve the reliability of the ratings (Elmore & Beggs 1975).
5.5.9 Pre-testing and Pilot Testing
To strengthen the content validity of the survey instruments, a pre-test was conducted
prior to the pilot survey. This was done by observing the degree of relevance of each
variable item and receiving feedback from an industry expert to confirm the
acceptability of proposed items and questions from a practical perspective. Items
which were found to be misleading or confusing were modified and an unimportant
item was eliminated.
The initial survey instruments were originally developed in English, then they were
translated into Bahasa Melayu, the Malaysian native language or the official
language of Malaysia to be used in this study. Even though Bahasa Melayu is the
official language, English has been widely spoken and accepted as the means of
business communication. Thus it is expected that the entrepreneurs in Malaysia
should be able to understand the survey instruments provided in English as well as
Bahasa Melayu. The translation procedure followed the guidelines established by
Brislin (1980, 1986) in regard to the double-back translation procedure. All items
translated into Bahasa Melayu were then translated back into English by the
researcher and then they were submitted to the National Translation Institute of
Malaysia for a final review of the translation.
The translated version of the questionnaire was then further discussed with an expert
from the industry who manages and organises training for SMEs in the country. His

157
views on the choice of wording and sentence structure were much appreciated since
he has the experience of involvement with entrepreneurs and entrepreneurial
development in the country. Then, final modifications were made accordingly to the
translated version of the questionnaire. The English version of the questionnaire was
finalised with the principal and second supervisors of the study.
To ensure that the items translated into Bahasa Melayu measured the same
constructs, the questionnaire was compared with the original one written in English.
There was no significant difference. Sayuti (2013) indicated that providing a
translated version of a questionnaire in Bahasa Melayu guarantees clear
communication with the respondent in Malaysia. A copy of the Malay version of the
questionnaire is attached as Appendix F.
A pilot test was then conducted with 15 international higher degree students who are
proficient in both languages to ensure the clarity and accuracy of the translated
questionnaire and also to monitor the time allocation needed to complete the survey.
A pilot test can also reveal any deficiency in the design of survey instruments so that
this issue can be addressed before the actual research is carried out. Those 15
respondents were a convenience sample selected by the researcher due to their
proficiency in both languages (English and Malay). The university students were
found to have similar views on motivations and barriers to entrepreneurship (Pruett et
al. 2009) and therefore their responses were significant for the purpose of the pilot
study. Zainuddin and Ismail (2009) argued that students who enroll in business-
related programs have career interests skewed towards business-related fields.

158
5.5.10 Data Analysis
There were four stages involved in data analysis: data screening, exploratory factor
analysis (EFA), confirmatory factor analysis (CFA) and path analysis. Data were
analysed using PASW 18.0 and Amos 18.0. PASW 18.0 (formally referred to as
Statistical Package for Social Science or SPSS) was used to conduct data cleaning,
preliminary analysis of data and EFA. PASW is a powerful, user-friendly software
package for the manipulation and statistical analysis of data used in social science
research (Landau & Everitt 2004; Miller & Acton 2009). Amos 18.0 (Analysis of
Moment Structures) was used to perform structural equation modelling (SEM)
through CFA and the development of path analyses for testing the hypotheses. SEM
has become a popular technique for researchers across a variety of disciplines and
progressively is a ‘must’ for research in the social sciences (Hooper et al. 2008).
The following steps of data analysis were performed sequentially:
i. EFA with principal component analysis (PCA) and varimax rotation to
identify factors
ii. an examination of correlation matrices
iii. CFA with multi-factor measurement models
iv. construct reliability and validity of each factor
v. composite variable calculation based on congeneric measurement models
vi. path analysis for hypothesis testing

159
5.5.10.1 Exploratory Factor Analysis
The primary objective of using EFA is to determine the number of common factors
influencing a set of measurements. Kahn (2006) suggested that EFA facilitates the
identification of the factors that explain the covariances among variables. Principal
component analysis (PCA) with varimax rotation was used for factor analysis. PCA,
which is the most popular factor extraction model (Conway & Huffcutt 2004), is
concerned with which linear components exist within the data and how a particular
variable contributes to that component. It involves a variable reduction technique
which reduces the number of observed variables to a smaller number of principal
components which account for most of the variance of the observed variables (Suhr
2005).
Varimax rotation is used to derive factor loadings and it is the most common rotation
method. It involves an orthogonal rotation of the factor axes to maximise the variance
of the squared loadings of a factor (column) on all the variables (rows) in a factor
matrix. This orthogonal technique is widely used since it simplifies the factor matrix
and also interpretation (Churchill 1979; Hair et al. 2010). A varimax rotation
produces results which it make it easy to identify each variable with a single factor.
Basilevsky (1994) suggested that orthogonal was preferred to oblique rotations when
the underlying constructs are considered to be independent. Finally, this type of
rotation provides solutions that are clearer for interpretation and reporting.
Conway and Huffcutt (2004) identified several purposes for conducting EFA. The
first reason is for data reduction and the second reason is to understand latent
constructs. In data reduction, the research aims to reduce a fairly large set of
160
variables to a manageable number while retaining as much of the original variance as
possible. For understanding latent constructs, EFA is used for the preliminary
evaluation of variables, which assists in preparation for the testing of the hypotheses,
which is the central purpose of most studies. For these reasons, EFA was performed
in this study. In addition, EFA has been widely applied in business and marketing
research relating to the constructs used in this study, such as transformational
leadership, transactional leadership and EO (Costello & Osborne 2005; Boonyachai
2011; Awang et al. 2010).
Criteria for Factors Extraction in Exploratory Factor Analysis
To decide how many factors to retain, several criteria were observed when extracting
factors: (1) items’ loadings (items with loadings less than 0.30 and loaded on
multiple factors were removed during the EFA process); (2) eigenvalues (Kaiser
1960) (The Kaiser rule states that all components with eigenvalue less than 1.0
should be dropped.); (3) variance percentage (solutions accounting for at least 50%
of the total variance); (4) scree plot; and (5) prior research (Hair et al. 2005).
Eigenvalues measure the variance in all of the variables accounted for by each factor.
The ratio of eigenvalues represents the ratio of the explanatory importance of the
factors relative to the variables. When a factor has a low eigenvalue, that factor is
contributing little to the explanation of variances in the variables and therefore it can
be ignored as redundant. The Kaiser criterion is to drop all components with
eigenvalues less than 1.0. However, that should not be the only cut-off point as
eigenvalues often over-extract the true number of factors (Bandalos & Boehm-

161
Kaufman 2009). Jolliffe (1986) criticised the Kaiser criterion as being too strict and
recommended retaining all factors with eigenvalues of 0.7 and above.
5.5.10.2 Confirmatory Factor Analysis
CFA is used as a statistical technique to confirm the factor structure of a set of
observed variables. CFA allows the researcher to test the hypothesis that a
relationship exists between the observed variables and their principal latent construct
(Suhr 2006). It involves the development of measurement models based on
theoretical principals that represent the relationships between the observed items and
the latent constructs that they are supposed to represent. The results developed from
the measurement models through CFA are also used to examine internal consistency
(construct reliability) and distinct validity (variance extracted), to calculate composite
weighted scores and to test for convergent and discriminant validity.
To build the measurement models for each of the constructs, Amos 18.0 was used
and path analysis was performed to test all the hypotheses proposed in this study. In
each measurement model, the ellipses represent latent variables and the rectangles
represent scale items. The observed variables are connected to the latent variables by
a double-headed arrow, which reflects the theoretical relation to the construct. The
values placed on top of each connecting arrow represent loading coefficients. The
value for loading coefficients should be between 0 and 1 and it denotes the
correlation with the construct. The response error (e.g., e3), represented in a circle for
each of the measurement item, represents the portion of the variable that does not
measure the hypothesised variable. Values placed on each of the observed variables
162
indicate the variance of each item and show the reliability of the measurement items
(Schumacker & Lomax 1996).
As suggested by Arbuckle (1998), the used of modification indices (MI) in Amos
could improve the fit of tested models by correlating selected parameters in the
models. A modification index represents the reduction in the value of chi square
when the parameter is estimated or freed in a subsequent revised model (Hair et al.
2010). This modification strategy helps to improve the overall structural validity
without having to change the original factor models (Arbuckle 1998). Therefore, this
strategy was used.
A two-stage approach of SEM as suggested by Anderson & Gerbing (1988) was
adopted. In this approach, CFA was first conducted for each construct to determine
the uni-dimensionality and model fit, including measuring internal consistency,
convergent validity and discriminant validity. Second, SEM was conducted through
path analysis to test the proposed hypotheses. The results of both analyses are
presented in Chapter 6.
5.5.11 Evaluation for Goodness-of-fit
To assess the goodness-of-fit for the hypothesised models, multiple criteria were
examined. These fit criteria are important to determine the congruence between the
theoretical model and the sample data. The determination of a model fit is not as easy
and straightforward as in other multivariate statistical tests. To identify a correct
model given the sample data, there is no single statistical test of significance for SEM
163
fit indices, especially given the existence of equivalence or alternative models that
yield exactly the same data-to-model fit (Schumacker & Lomax 2004; Byrne 2010).
Once the researcher has achieved a specified theoretical model, he or she needs to
test for its plausibility based on the sample data for the purpose of evaluating the
adequacy of the congruence between the hypothesised model and the sample data
(Byrne 2001). The most important task of the estimation process in SEM is to
minimise the discrepancy between the predicted covariance matrices.
Many criteria are used to measure goodness-of-fit. Each model-fit measure is unique
and they can be categorised into three categories: absolute, incremental and
parsimony-fit (Byrne 2010; Hair et al. 2010). Hair et al. (2010) also indicated that it
is acceptable to combine various model-fit criteria to evaluate global-fit measures. It
is important to decide on the use of one or more appropriate fit indices, as some
critical factor may influence the performance of fit indices on evaluating model fit
(Hu & Bentler 1995, 1999).
In every selection of categories, there are different fit indices and some rules of
thumb about the required minimum level of score/value for acceptable suitability
(Byrne 2001). Kline (2005) concluded that many different fit indices have some
problems in the evaluation process since there is no single standard or criterion that
has been used in journals and applied by reviewers. Each reports their own preferred
indices (Maruyama 1998). For example, Kenny and McCoach (2003) maintained that
there is no consistent standard for evaluating an acceptable model, and they used only
CFI, TLI, and RMSEA as common fit indices. In evaluating the structural validity of
MLQ, Muenjohn and Armstrong (2008) used only the CMIN (χ2/df), GFI, AGFI and
164
RMSEA. In this study, the following are considered to evaluate fit indices: RMSEA,
GFI, AGFI, CFI and CMIN (χ2/df). Table 5.9 summarises the criteria used to
measure overall fit of the model.
Table 5.9: Criteria Used for Model Fit
Fit indices Acceptable value Sources
Absolute Fit
Goodness-of-fit Index
(GFI)
Values close to 0.9 reflects a good
fit
Thadani & Cheung (2011)
Root Mean Square Error
Approximation
(RMSEA)
Value below 0.1 reflects an
acceptable fit
Thadani & Cheung (2011)
Incremental Fit
Adjusted Goodness-of-Fit
Index (AGFI)
Values >0.8 reflects a good fit Chau & Hu (2001)
Comparative Fit Index
(CFI)
Values > 0.9 good reflects a good
fit
Values > 0.8 sometimes
permissible
Hair et al. (2010)
Non-normed Fit Index (TLI) Values >0.90 reflects a good fit
Values > 0.8 sometimes
permissible
Bentler & Bonnet (1980)
Hooper et al., 2008; Hair et al.,
2010
Parsimony Fit
Chi Square Statistics
(X2/df)
Values less than 5 indicate a
reasonable fit
Ullman (1996)
Bollen (1989)
5.5.11.1 Absolute fit
Absolute fit indices are used to determine how well an a priori model fits the sample
data (McDonald & Ho 2002) and to demonstrate which proposed model has the best
fit. In this category, the model fit of Root Mean Square Error Approximation
(RMSEA) and Goodness-of-fit Index (GFI) guidelines are used. The RMSEA

165
measure assists in correcting the tendency of chi-square to reject specified models. It
takes into account error approximation in the population. The GFI measure indicates
the relative amount of variance and covariance together explained by the model
(Byrne 1989). The GFI value is calculated by comparing the discrepancy value for
the model under test to the discrepancy value for a saturated version of the model,
which is counted as representing a 100% fit or 1.0. However, this measure is not
adjusted for degrees of freedom (Hair et al. 1995), ranging from 0 (indicating a poor
fit) to 1 (indicating a perfect fit), where a recommended level of acceptance is 0.90
(Kline 2005; Schumacker & Lomax 2008; Byrne 2010). Still, Thadani and Cheung
(2011) suggested that a value close to 0.90 reflects a good fit model.
5.5.11.2 Incremental fit
Incremental fit indices are also known as comparative (Miles & Shevlin 2007) or
relative fit indices (McDonald & Ho 2002), referring to indices that do not use the
chi-square in its raw form but compare the chi-square value to a baseline model. For
these models, the null hypothesis is that all variables are uncorrelated (McDonald &
Ho 2002; Hair et al. 2005).
Related to the GFI is the Adjusted Goodness-of-Fit Index (AGFI) which adjusts the
GFI based on degrees of freedom, with more saturated models reducing fit
(Tabachnick & Fidell 2007). Values for the AGFI also range between 0 and 1 and it
is generally accepted that values of 0.80 or greater indicate well-fitting models (Chau
& Hu 2001).
The Comparative Fit Index (CFI: Bentler 1990) is a revised form of the Normed Fit
Index (NFI) which takes into account sample size (Byrne 1998) and performs well

166
even with a small sample size (Tabachnick & Fidell 2007). This statistic assumes that
all latent variables are uncorrelated (null-independence model) and compares the
sample covariance matrix with this null model. As with the NFI, values for this
statistic range between 0.0 and 1.0 with values close to 1.0 indicate good fit. A cut-
off criterion of CFI ≥ 0.90 was initially advanced. However, recent studies have
shown that a value greater than 0.90 is needed in order to ensure that misspecified
models are not accepted (Hu & Bentler 1999). They range from 0 (poor fit) to 1
(perfect fit), and a level of 0.90 or greater is highly recommended (Hair et al. 2010).
Non-Normed Fit Index (NNFI), also known as the Tucker-Lewis index, is an index
that prefers simple models. However, in situations where small samples are used, the
value of the NNFI can indicate poor fit despite other statistics pointing towards good
fit (Bentler 1990; Kline 2005; Tabachnick & Fidell 2007). A final problem with the
NNFI is that, due to its non-normed nature, values can go above 1.0 and can thus be
difficult to interpret (Byrne 1998). Recommendations are that a cut-off as low as 0.80
is permissible (Hooper et al. 2008; Hair et al. 2010) but a value above 0.90 is
recommended (Hair et al. 2010).
5.5.11.3 Parsimony fit
According to Hair et al. (2010), the third category of parsimonious fit tests the
parsimony of the proposed model by evaluating the fitness of the model to the
number of estimated coefficients required to achieve the level of fit. In this category,
the normed chi-square (χ2/df), also known as CMIN, is the most popular fitness
index used to evaluate this model. In this measure, a range of acceptable values for
the χ2/df ratio has been suggested, ranging from less than 5.0 to indicate a reasonable
167
fit model (Ullman 1996; Bollen 1989). In this study, this measure is used as an
indicator of overall fit, in conjunction with other measures, but not as a basis for
rejecting or accepting the model.
5.5.12 Construct Reliability and Average Variance Extracted
Construct reliability (CR) refers to the measure of reliability and internal consistency
of the measured variables representing a latent construct, and it must be established
before construct validity can be determined (Hair et al. 2010). Average variance
extracted (AVE) measures the amount of variance captured by a construct in relation
to the variance due to random measurement error (Fornell & Larcker 1981). CR and
AVE were also examined as measures of scale or construct reliability.
In order to achieve good reliability measure and high internal consistency, the CR
values should be higher than 0.6 (Bagozzi & Yi 1988). Hair et al. (2010) asserted that
reliability between 0.6 and 0.7 is an acceptable indicator of good reliability. AVE is
also used as measure of convergent validity. Bagozzi and Baumgartner (1994)
asserted that AVE values >0.4 are considered acceptable measures of convergence
validity. The findings on the measures of CR and AVE are explained in detail after
the description of the development of measurement models in this chapter.
5.5.13 Validity
According to Field (2009), it is relevant to determine the accuracy of the
measurement scales in order to assess the extent to which proposed constructs have
been captured, that is, to examine the validity of the instrument. Two types of
validity are examined in this study: content validity and construct validity. Content

168
validity is the agreement among experts that the scale is measuring what it is
expected to measure. Hair et al. (2010) refer to construct validity as the extent to
which an empirical measurement reflects a specific domain of the content. In this
thesis, the instruments used to evaluate all the main constructs possess content
validity because the measurement items selected were obtained from well validated
previous research. In addition to that, a group of international higher degree students
were asked to critically evaluate the survey instrument before it was used. Some
modifications to the instrument were made accordingly and therefore the scales were
deemed to reflect the constructs as defined.
Construct validity refers to the ability of a measure to verify a network of related
hypotheses generated from theory based on constructs. Churchill (1979) elucidated
that construct validity concerns what the instruments are measuring. The two types of
construct validity examined in this thesis are convergent validity and discriminant
validity. Convergent validity refers to the degree to which two measures of the same
concept are correlated whereas discriminant validity is the measure of the extent that
constructs that theoretically should not be related to each other are observed to differ
from each other (Hair et al. 2010). Convergence validity is defined when the AVE
value for each factor is greater than 0.4 (Bagozzi & Baumgartner 1994). Discriminant
validity is defined when the AVE for each factor is greater than the average shared
squared variance (ASV) (Hair et al. 2010). Multi-factor analyses were carried out in
order to assess the convergent and discriminant types of validity.

169
According to Schumacker and Lomax (1996), the convergent validity of an
instrument is also realised when the loading between measurement items and the
latent construct is higher than 0.5.
5.6 Qualitative Data Collection
The previous sections of this chapter discussed the overall research design and the
research methodology used to collect and analyse the quantitative data of this study.
The remaining sections of this chapter describe the research methodology employed
to collect and analyse the qualitative data of this study. The aim of qualitative data is
to explore the following questions that emerged after the analysis of the quantitative
data:
1. Do you agree that leadership is important for organisational success?
2. Does entrepreneurial orientation contribute to organisational performance?
3. What other factors do you think are important for organisational success?
5.6.1 Recruitment Strategy
As mentioned in the research design section, explanatory research requires the
collection and analysis of qualitative data after the collection and analysis of
quantitative data. Thus, semi-structured interviews were conducted after the survey,
to enable the quantitative results to be explored qualitatively. Five to ten interviews
with selected owners or top managers of SMEs seemed adequate (Neves & Amaro
2012). This small number was sufficient for the purpose of confirming,
disconfirming and further elucidating quantitative findings.

170
Two recruitment strategies were prepared for the collection of the qualitative data.
The first strategy was to recruit respondents based on their agreement expressed in
the final section of the survey questionnaire, which asked the respondents whether
they were willing to be interviewed. To obtain the intended number of participant, 15
respondents who said they were willing to be interviewed were contacted for further
discussion. The second strategy was to contact them by telephone and e-mail using
details from the list previously obtained from the SME Corp. Malaysia. These
combined approaches were chosen to provide ensure there would be sufficient
interview participants.
5.6.2 Interview Process
A 20–40 minutes interview was scheduled with each participant. At the beginning of
each interview, the purpose of the study was explained and the participants was asked
for permission to share their stories. All participants gave permission to share their
views and stories. At the conclusion of the interview, the researcher thanked the
participant and provided them with an opportunity to give feedback and express any
further thoughts. Appendix G contains the interview schedule used to collect
qualitative data.
5.6.3 Pilot Testing
To ensure that the questions in the semi-structured interview were clear and
reasonably fit, a pilot test was conducted with two of the researcher’s personal
contacts. Those two were Higher Degree by Research students currently enrolled in
the same university as the researcher. As Zikmund (1994) stated, it is usual to carry
out a ‘try out’ of a questionnaire since this testing process is exceedingly beneficial.
171
It allows the researcher to determine if the respondents might have any difficulty in
understanding the questions and if there are any ambiguous or biased questions. Pilot
testing also gave the researcher an opportunity to practise his interviewing skills.
5.6.4 Data Analysis
The qualitative part of this study was intended to support and strengthen the findings
from the quantitative analysis. For qualitative analysis, the data was analysed through
thematic analysis (Boyatzis 1998; Tuckett 2005), due to the small number of
interviews conducted. Thematic analysis is an approach to identify, analyse and
report patterns (themes) in the data. It thoroughly organises and describes the data
set. It is a straightforward form of qualitative analysis, which does not require the
detailed theoretical and technical knowledge that discourse and content analysis do.
A researcher can easily conduct a good thematic analysis on qualitative data even
without much previous experience (Braun & Clark 2006).
These authors also proposed that there are several advantages to using thematic
analysis. These advantages are:
Flexibility
Relatively easy and quick method to learn and carry out
Accessible to researchers with little or no experience of qualitative research
Results are generally accessible to the educated general public
Can usefully summarise key features of a large body of data and/or offer a
rich description of the data set
Can highlight similarities and differences across the data set
Can generate unanticipated insights
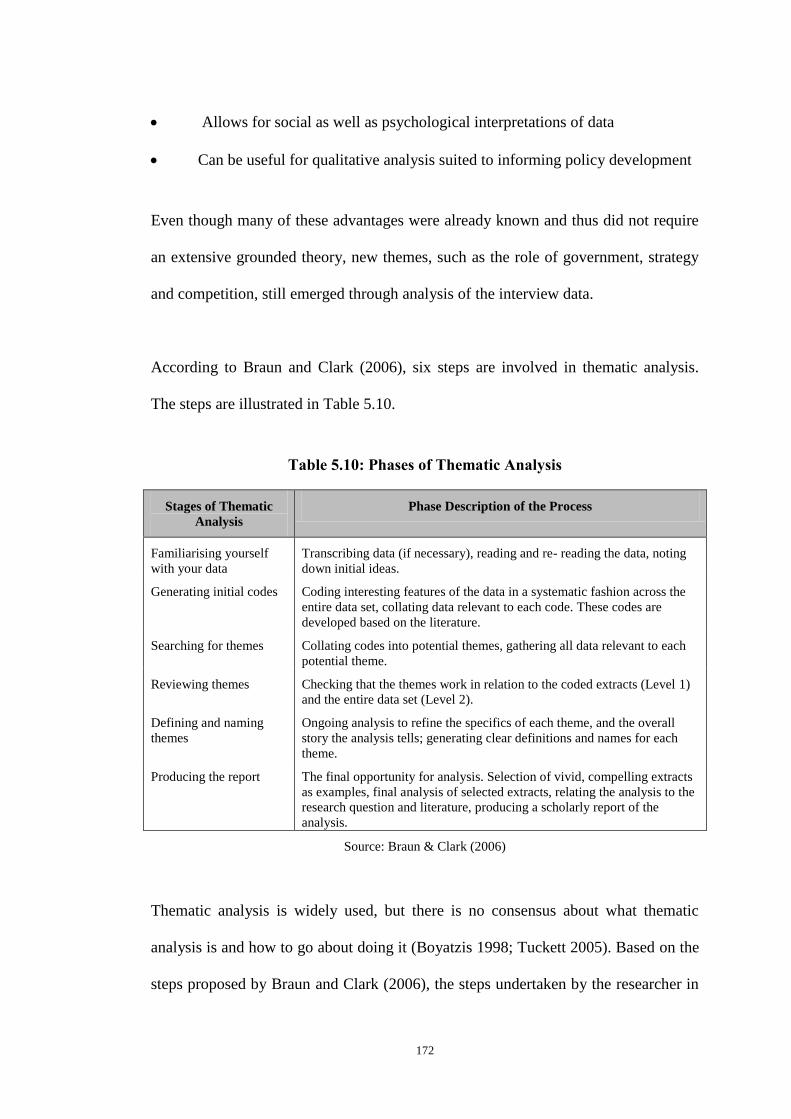
172
Allows for social as well as psychological interpretations of data
Can be useful for qualitative analysis suited to informing policy development
Even though many of these advantages were already known and thus did not require
an extensive grounded theory, new themes, such as the role of government, strategy
and competition, still emerged through analysis of the interview data.
According to Braun and Clark (2006), six steps are involved in thematic analysis.
The steps are illustrated in Table 5.10.
Table 5.10: Phases of Thematic Analysis
Stages of Thematic
Analysis
Phase Description of the Process
Familiarising yourself
with your data
Transcribing data (if necessary), reading and re- reading the data, noting
down initial ideas.
Generating initial codes Coding interesting features of the data in a systematic fashion across the
entire data set, collating data relevant to each code. These codes are
developed based on the literature.
Searching for themes Collating codes into potential themes, gathering all data relevant to each
potential theme.
Reviewing themes Checking that the themes work in relation to the coded extracts (Level 1)
and the entire data set (Level 2).
Defining and naming
themes
Ongoing analysis to refine the specifics of each theme, and the overall
story the analysis tells; generating clear definitions and names for each
theme.
Producing the report The final opportunity for analysis. Selection of vivid, compelling extracts
as examples, final analysis of selected extracts, relating the analysis to the
research question and literature, producing a scholarly report of the
analysis.
Source: Braun & Clark (2006)
Thematic analysis is widely used, but there is no consensus about what thematic
analysis is and how to go about doing it (Boyatzis 1998; Tuckett 2005). Based on the
steps proposed by Braun and Clark (2006), the steps undertaken by the researcher in

173
analysing the qualitative data are described below. The elements of reliability and
validity are discussed throughout the analysis.
According to Hesse-Biber and Leavy (2006), the process of collecting and analysing
qualitative data is actually an interactive process. The analysis of the data usually
begins during the data collection stage when the interview is taking place. In this
study, the first stage of the data analysis began shortly after each interview, when the
researcher listened to the recorded interview. This helped the researcher to gain a
general understanding of the important elements communicated during the interview.
This exercise also helped the researcher to refine the interview protocol for
subsequent interviews. Eisenhardt (1989) suggested that data analysis should be done
after each interview. The data from one interview are collected and then analysed
before the next interview is conducted. However, in this study, no transcribing was
done at this stage.
The next stage involved transcribing the interviews. According to Green (2005), it is
beneficial for the interview to be transcribed immediately after it is conducted. When
the researcher does the transcribing, it provides him or her with more familiarity with
the data than is gained by just reading the transcripts. According to Rubin and Rubin
(2005), by transcribing the interview, the researcher is able to develop some insights
into the data and is able to identify important concepts, themes and events that were
recorded. Poland (2003) said that the process of transcribing the interview also
allows the researcher to make informed decisions about punctuating the text, since
punctuation can alter the meaning of a sentence. Therefore, Poland (2003)
174
recommended that the researcher transcribe each interview prior to the next interview
to ensure the accuracy of the data.
The recorded interviews provided a rich source of verbatim material. Bucher et al.
(1956) suggested that a recorded interview not only eliminates the omissions,
distortions, elaborations, condensations and other modifications of data that usually
occur in written answers but a recorded interview also provides an objective basis for
assessing the adequacy of the interview data in relation to the performance of the
interviewer. The use of recorded data is one of the strategies which increase validity
in the qualitative research paradigm (McMillan & Schumacher 2006).
The third stage of qualitative data analysis involves the process of typing the
interview transcripts. Despite being a time-consuming and tedious process (Gibbs,
2007), in this study the researcher typed all the interview transcripts himself. As
Rubin and Rubin (2005) suggested, the transcribing process enhances the
researcher’s understanding of the important points made during the interviews as
well as allowing a search for their intended meanings. Therefore, while typing each
interview transcript, notes were made from time to time when important concepts,
themes or events emerged from the interviews. Specific quotations that could be used
to support the quantitative findings or to answer the research questions were also
noted. Transcribing the data, as suggested by Lamnek (1988), also enabled the
researcher to ‘clean’ the manuscript by deleting errors and contradictions.
The fourth stage of the qualitative analysis was the actual analysis of the interview
data. To perform this task, the researcher listened again to all the recorded interviews
175
and made final comparisons with the transcripts. Poland (2003) asserted that this
process is important for the researcher to ensure the accuracy of the interview data as
well as to confirm their reliability. The important themes extracted from the
interview data were identified. These themes were developed based on the literature
and also directly through an analysis of uncoded data. Categories were then
developed to separate the emerging themes: the background of respondents,
leadership behaviour and factors affecting leadership, entrepreneurial orientation and
factors affecting entrepreneurial orientation, and factors affecting organisational
performance. Other themes that emerged from the interviews were also recorded in
case the emerging new themes might be relevant.
Two types of coding were used in data analysis. The first type was a priori coding,
which was the codes developed before examining the interview data. The second
type was inductive coding, which were the codes developed by the researcher
through examination of the interview data (Willis 2006). Miles and Huberman (1984)
referred to inductive codes as post-data coding, which allows the researcher to
remain sensitive to the diversity and context of the data – to let the data ‘speak for
itself’ and allow codes to emerge. Through these two types of coding approaches, the
researcher reread each interview transcript carefully and identified quotations or
remarks by the respondents that would fit into the themes or sub-themes of this study.
The final analysis was conducted by the researcher going back and forth between the
themes and interview transcripts to check if there were any significant issues that had
been not identified in the process of creating themes. Patton (2002) suggested that a
qualitative analyst returns to the data over and over again to see if the constructs,
categories, explanations and interpretation make sense. This process also allows the
176
researcher to search for ‘disconfirming data’ for the identified themes (Cresswell
1998). Miles and Huberman (1984) proposed this action as one of the tactics for
testing or confirming findings and also checking for the meaning of outliers and
extreme cases. In addition, it can be useful for identifying the strength of the findings
and developing reliable conclusions. This ongoing analysis also helped the researcher
to refine the specifics of each of the themes identified in this study.
To ensure that rigorous analysis was being conducted, several actions had been
implemented by the researcher. These were the use theoretical memos, examining
uncoded data and constant comparison between themes and data. The final stage of
thematic analysis involved producing the analysis report. The findings of the
qualitative data analysis are reported together with the findings of the quantitative
data analysis in Chapter 6.
5.7 Ethical Considerations
This study followed the Ethics Guideline Procedures stipulated by RMIT University
in the Ethics Review Process. Ethics approval was obtained to carry out this research.
Detailed information about the background of the study, the research design and
methodology, together with the survey questionnaire and interview questions, were
sent for evaluation by the research committee. This was to ensure that the interview
questions met the standards required by the committee and to ensure that no
demeaning questions were included in the survey. The researcher was prepared,
organised and considerate of participants’ confidentiality in this study. Ethics
approval was obtained from the RMIT Human Research Ethics Committee (HREC)
prior to commencement of the research stage involving respondents. A copy of the

177
Plain Language Statement used when collecting the quantitative data is in Appendix
C and that used when collecting the qualitative data is in Appendix D. The Ethics
Approval is in Appendix A.
5.8 Summary
As discussed throughout this chapter, the main objective of this study is to
empirically test research hypotheses. Quantitative research was chosen as the primary
source of data collection and qualitative data were used to enhance, confirm or
contradict the findings from quantitative data analysis.
This chapter summarised the research design and explained the process of survey
development. Most importantly, this chapter provided details on how the data
gathered would be analysed. The following chapter focuses on the findings derived
from the analysis of the quantitative and qualitative data.

178
CHAPTER 6
ANALYSIS AND FINDINGS
6.1 Introduction
As previously mentioned, this study employed mixed method research in which both
quantitative and qualitative data were collected and analysed. Chapter 5 presented the
justification for the research methodology chosen for this study. The objective of this
chapter is to report on the analyses and findings of the results gathered from the
quantitative and qualitative data collected. These analyses and findings are discussed
into two parts. Part A discusses the findings from the analysis of the quantitative
data, which are the main type of data in this study and Part B discusses the findings
from the analysis of the qualitative data. The quantitative data in this study were
analysed by using PASW 18.0 and AMOS 18.0, and the qualitative data were
analysed by using thematic analysis.
After the introduction in Section 6.1, Part A comprises Section 6.2 to Section 6.10.
Part B comprises Section 6.11 to Section 6.20. Section 6.21 concludes this chapter.
PART A QUANTITATIVE FINDINGS
Part A presents the analyses and findings for the quantitative data in this study.
Section 6.2 reports on the response rate to the survey. Section 6.3 discusses the
response bias test. Section 6.4 discusses the data screening procedures done before
any other tests were performed. The data were checked for accuracy of data entry and
missing values, and then checked for violations of the multivariate statistical
assumptions of normality, homogeneity of variance, multicollinearity and outliers.
179
Section 6.5 presents measures of reliability. Reliability coefficients are reported at
construct level and at factor level. The descriptive analyses are discussed in Section
6.6. The demographic characteristics of respondents from both methods of data
collection are presented. This section also covers the means and standard deviation
for each variable at construct level and factor level. The results from t-test analyses
based on several demographic characteristics are compiled and discussed in Section
6.7.
Section 6.8 presents the initial analysis of variables in the initial full model consisting
of all the variables, and the initial measurement model of each variable. Due to
unsatisfactory results from this initial analysis, the section that follows discusses the
statistical procedures involved in the development of final path models. Exploratory
factor analysis (EFA), confirmatory factor analysis (CFA), the development of a
multi-factor measurement model, and construct reliability and validity are also
discussed.
For EFA, Principal Component Analysis (PCA) with varimax rotation was used to
determine the number of factors associated with transformational leadership,
transactional leadership, EO and organisational performance measured through
growth and profitability. Through EFA, initial factor structures were discovered and
survey items with loadings <0.3 on factors were eliminated (Hair et al. 2005). CFA
was conducted to develop four measurement models to examine if each of the
variables, as suggested in the proposed framework, loads on to its respective
construct (Anderson & Gerbing 1988). In other words, CFA is used to confirm the
factor structure discovered through the EFA and to allow the measurement of

180
discriminant and convergent validity. Section 6.10 presents the final path models
developed to test the research hypotheses. The sections that follow discuss the
findings from the analysis of the qualitative data.
6.2 Response Rate
In the survey, a total of 1700 questionnaires were distributed to the respondents via e-
mail or self-administered throughout Malaysia. From 1000 questionnaires distributed
through the website, there were 103 responses. Of these, 23 were not usable either
because they fell into the category of micro-SME (which was not included in the
target sample) or they were incomplete. In the second approach through training
agencies, a total of 700 questionnaires were distributed and 370 responses were
received. Of these, 45 were not usable for the same reasons mentioned above. To
sum up, out of a total of 1700 questionnaires distributed, there were 473 responses
but there were only 405 usable questionnaires, representing an effective response rate
of 24% in this study.
6.3 Response Bias Test
An independent sample t-test was carried out to examine if there was any statistically
significant difference between the two sources of data. Dillman (2000) argued that
different approaches to data collection often produce different results. To address this
issue, the researcher followed the suggestion of Cole (2005) and compared the mean
scores between the online and self-administered questionnaires. Table 6.1 shows the
distribution of the mean scores between the two sources of data in the three main
variables.

181
Table 6.1: Mean Comparisons of Variables between Online and Self-
Administered Surveys
Variables Mean
Online
Mean
Self-
Administered
T-
value
Significant Effect
Size
η2
Leadership Behaviour 2.76 2.65 -2.198 0.029 0.01
Entrepreneurial Orientation 2.70 2.57 -2.282 0.023 0.01
Organisational Performance 2.59 2.64 0.786 0.432
N 80 325
As shown in Table 6.1, there was no statistical significant in the mean scores between
the online (M=2.59, SD=0.57) and self-administered surveys (M=2.64, SD=0.55; t
(405) =.786, p =0.43) on organisational performance. There is a statistical significant
in the mean scores between online and self-administered surveys on leadership
behaviour (t (405) =-2.198, p=0.029) and EO (t (405) =-2.282, p=0.023) scales.
However, following the guidelines proposed by Cohen (1998), the magnitude of the
differences in their means was small (η2 = 0.01). Therefore, these results show that
the sample can be considered sufficient to draw conclusions on the owners/top
managers of SMEs in Malaysia for this study.
6.4 Data Screening
A total of 405 usable questionnaires were first examined for accuracy of data entry
and missing values, and then checked for violations of the multivariate statistical
assumptions of normality, homogeneity of variance, multicollinearity and outliers.
To address the issue of missing data, the researcher used the ‘expectation-
maximisation’ (EM) iterative method available in SPSS. EM is an effective method
that is often used in data analysis to manage missing data (Schafer & Olsen 1998). It

182
is a procedure that occurs in two discrete steps to replaces the missing value. EM
overcomes the problems generated through other techniques such as mean
substitution or regression substitution, which produce biased estimates and
underestimate the standard errors.
To test the normality of the data, the residuals were screened for normality through
expected normal probability plot and detrended normal probability plot. From the
normal probability plot, a reasonably straight line denoted a normal distribution.
Figures 6.1 to 6.3 present the normal probability plot of each of the main variables in
this study.
Figure 6.1: Normal P-P Plot of Regression Standardised Residual: Leadership
Behaviour
An examination of the normal probability plot of leadership behaviour suggested
there is no significant deviation from normality for the data. As can be seen in Figure
6.1, a reasonably straight line indicates a normal distribution. A further examination
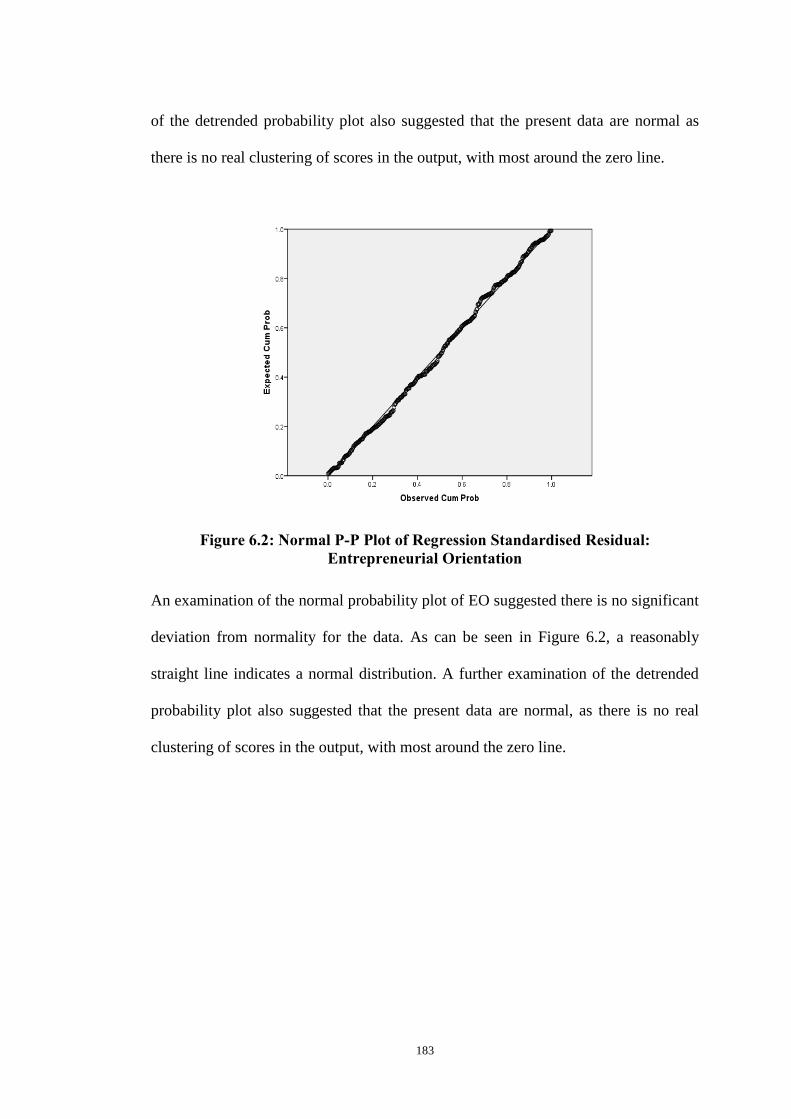
183
of the detrended probability plot also suggested that the present data are normal as
there is no real clustering of scores in the output, with most around the zero line.
Figure 6.2: Normal P-P Plot of Regression Standardised Residual:
Entrepreneurial Orientation
An examination of the normal probability plot of EO suggested there is no significant
deviation from normality for the data. As can be seen in Figure 6.2, a reasonably
straight line indicates a normal distribution. A further examination of the detrended
probability plot also suggested that the present data are normal, as there is no real
clustering of scores in the output, with most around the zero line.

184
Figure 6.3: Normal P-P Plot of Regression Standardised Residual:
Organisational Performance
An examination of the normal probability plot of organisational performance
suggested there is no significant deviation from normality for the data. As can be
seen in Figure 6.3, a reasonably straight line indicates a normal distribution. An
examination of the detrended probability plot also suggested that the present data are
normal, as there is no real clustering of scores in the output, with most around the
zero line.
Correlation matrices and collinearity statistics were analysed to address assumptions
for multicollinearity. When the correlation between independent variables is high
(>0.7), Tabachnick and Fidell (2001) suggested considering deleting one of the
variables or forming them into one. For the data in this study, the correlations
between independent variables are low to middling, ranging from 0.011 to 0.514 (see
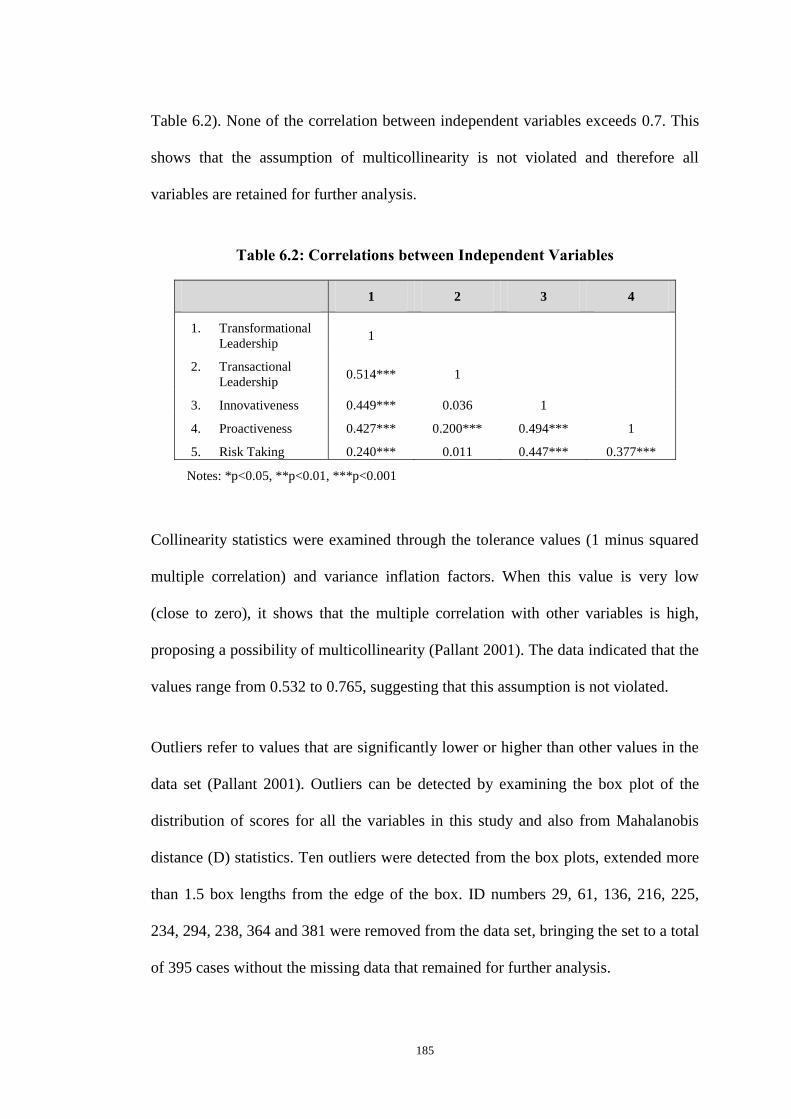
185
Table 6.2). None of the correlation between independent variables exceeds 0.7. This
shows that the assumption of multicollinearity is not violated and therefore all
variables are retained for further analysis.
Table 6.2: Correlations between Independent Variables
1 2 3 4
1. Transformational
Leadership 1
2. Transactional
Leadership 0.514*** 1
3. Innovativeness 0.449*** 0.036 1
4. Proactiveness 0.427*** 0.200*** 0.494*** 1
5. Risk Taking 0.240*** 0.011 0.447*** 0.377***
Notes: *p<0.05, **p<0.01, ***p<0.001
Collinearity statistics were examined through the tolerance values (1 minus squared
multiple correlation) and variance inflation factors. When this value is very low
(close to zero), it shows that the multiple correlation with other variables is high,
proposing a possibility of multicollinearity (Pallant 2001). The data indicated that the
values range from 0.532 to 0.765, suggesting that this assumption is not violated.
Outliers refer to values that are significantly lower or higher than other values in the
data set (Pallant 2001). Outliers can be detected by examining the box plot of the
distribution of scores for all the variables in this study and also from Mahalanobis
distance (D) statistics. Ten outliers were detected from the box plots, extended more
than 1.5 box lengths from the edge of the box. ID numbers 29, 61, 136, 216, 225,
234, 294, 238, 364 and 381 were removed from the data set, bringing the set to a total
of 395 cases without the missing data that remained for further analysis.
186
To test the assumption of multivariate outliers, D statitistics was used. Multivariate
outliers are cases with a strange combination of scores on the various dependent
variables (e.g., very low on one variable but very high on another). D statistics refers
to the distance of a particular case from the centroid of the remaining cases, where
the centroid is the sample means of all the variables (Tabachnick & Fidell 1996). To
identify any strange pattern of scores across variables, it is necessary to determine the
critical chi-square (values greater than critical value are considered multivariate
outliers) by using the number of independent variables equal to the degree of
freedom. Based on Tabachnick and Fidell’s (1996) suggestion, the critical value of
these data is equal to 20.52. There are five independent variables in this study with D
values range from 0.47 to 17.25. None of the cases has value greater than the critical
value and this indicates that the data have no multivariate outliers. The following
section discusses reliability measures, followed by descriptions of the demographic
characteristics of the respondents and each scale used in this study.
6.4.1 Assessment of Common Method Variance
As previously mentioned, this study is a cross-sectional study. Cross-sectional
research involves collection of all data through the same questionnaire during the
same period of time. However, the use of single respondents to answer all questions
might produce common method variance (CMV), variance that is credited to the
measurement method rather than to constructs of interest (Podsakoff et al. 2012,
2003). Craighead et al. (2011) referred to CMV as the amount of spurious correlation
between variables that is created by using the same method, often a survey, to
measure each variable. This variance may cause systematic measurement errors,
187
which may lead to incorrect estimates of the true relationships between variables by
inflating or deflating findings.
Based on the suggestion made by Podsakoff et al. (2003), the Harman single-factor
test was used to assess the CMV in this study. This is the most widely used technique
for assessing CMV. Researchers in the leadership field have used this test to address
the issue of CMV (Salanova et al. 2011; Cheung & Wong 2011; Norris 2008).
According to Podsafoff et al. (2003), this test is used to identify and measure
variables that reflect the observed constructs. It requires loading all the measures in
the study into an exploratory factor analysis, with the assumption that CMV is
present if there is a single factor that emerges from the factor analysis or a general
factor accounting for the majority of the covariance among measures.
All variables were loaded into exploratory factor analysis, using principal component
analysis with unrotated factor solution. The results from the extraction sums of
squared loading indicated that only 19.5% of variance was attributed to the measured
items. Since one general factor did not account for the majority of the covariance
among the measures (Podsakoff et al. 2003), it can be concluded that CMV did not
appear to be a problem in this study.
6.5 Measures of Reliability: Cronbach’s Alpha Coefficient
According to Hair et al. (2005), instrument reliability shows the internal consistency
of items representing a latent construct. It refers to the extent to which instruments
are consistently measuring what they are supposed to. Reliability coefficients or
Cronbach’s alpha coefficients were calculated for all measures used in this study.

188
This is commonly used as a measure of internal consistency. Table 6.3 reports the
results of the Cronbach’s alpha coefficients for all variables at construct level and
factor level.
As shown in Table 6.3, Cronbach’s alpha coefficients for total leadership behaviour,
total EO and total organisational performance all achieved 0.70 or above, indicating
an acceptable statistic testing level (Nunnaly 1967).
The overall Cronbach’s alpha coefficient for transformational leadership was 0.87
while the Cronbach’s alpha coefficients of the four transformational leadership
factors ranged from 0.60 to 0.73. The overall Cronbach’s alpha coefficient for
transactional leadership was 0.61 while the Cronbach’s alpha coefficients of the three
transactional leadership factors ranged from 0.50 to 0.65.
The overall Cronbach’s alpha coefficient for EO was 0.72 while the Cronbach’s
alpha coefficients of the three EO factors ranged from 0.50 to 0.55. Finally,
Cronbach’s alpha coefficients of the two organisational performance factors ranged
from 0.59 to 0.70.
Even though there were some values, especially at the factor level, that did not
achieved a value of 0.70 or above, Nunnaly (1967) stated that reliabilities of α = 0.50
to α = 0.60 are sufficient for the early stage of basic research. Hair et al. (1998) also
suggested that a value of above 0.6 is an acceptable value for internal consistency.
Given that these measures have also been used by other well-validated research, a
decision was made to retain all the factors of each construct.

189
Table 6.3: Results of Cronbach’s Alpha Coefficients
Measures Number
of Items
Coefficients
α
Total Leadership Behaviour
Transformational Leadership
Idealised Influence
Inspirational Motivation
Individualised Consideration
Intellectual Stimulation
Transactional Leadership
Contingent Reward
Management-by-exception (active)
Management-by-exception (passive)
Total Entrepreneurial Orientation
Innovativeness
Proactiveness
Risk taking
Total Organisational Performance
Growth
Profitability
32
20
8
4
4
4
12
4
4
4
11
4
4
3
8
4
4
0.86
0.87
0.70
0.73
0.60a
0.71
0.61
0.64b
0.50c
0.65
0.72
0.50
0.53
0.55
0.80
0.59
0.70
Notes: aafter deletion of IC2
bafter deletion of CR1
cafter deletion of MBEA1
6.6 Descriptive Analysis
6.6.1 Demographic Characteristics of Respondents
Table 6.4 presents a summary of the nine demographic characteristics of respondents.
The total number of respondents retained for the remaining analysis was 395 (N =
395). In regard to the type of industry, 206 respondents were from the manufacturing
industry, representing 52.2% of the sample. The remaining 189 respondents came
from the service industry, representing 47.8% of the sample. 45.8% of the

190
respondents (n = 181) were the owners of the firms and the remaining 54.2% were
the top managers (n = 214).
The majority of the respondents were relatively young, aged between 31 and 40,
representing 44.8% (n = 177) and 26.6% (n = 105) were aged between 41 and 50.
The third largest age group was between the ages of 25 and 30, representing 13.45%
(n = 53) of the sample. Respondents aged over 51 represented 8.4% (n = 33) of the
sample and respondents aged under 25 represented 6.8% (n = 27) of the sample
population.
In terms of gender distribution, there were 247 male respondents, representing 62.5%
of the sample population while the 148 female respondents represented 37.5%.
The majority of the respondents were Malay, representing 84.3% (n = 333) of the
sample population. There were 46 Chinese respondents (11.6%), nine Indian
respondents (2.3%) and seven respondents from other races (1.8%).
In regard to the highest education level, the majority of the respondents had at least a
Degree (Bachelor), representing 45.6% (n = 180). This was followed by those with a
Certificate or Diploma qualification represented by 28.1% (n = 111) of the sample.
52 respondents had a Master’s degree, represented 13.2% of the sample. 26
respondents (9.1%) had had only secondary education. 11 respondents (2.8%) had a
PhD or or other doctorate while there were only five respondents with other
qualifications, representing 1.3% of the sample population.

191
The majority of the respondents (52.7%; n = 208) employed between five and 19
employees; 105 respondents (26.6%) employed between 20 and 50 employees; 53
respondents (13.4%) employed between 51 and 150 employees; 24 respondents
(6.1%) employed fewer than five employees; and only five respondents (1.3%)
employed more than 150 employees.
In terms of sales turnover, 35.4% (n = 140) of the respondents had a sales turnover
between RM200,000 and RM1,000,000; 33.7% (n = 133) had a sales turnover
between RM1,000,000 and RM5,000,000; 10.9% (n = 43) had a sales turnover
between RM5,000,000 and RM10,000,000; 9.1% (n = 36) had a sales turnover
between RM10,000,000 and RM25,000,000; 9.1% (n = 36) had a sales turnover of
less than RM200,000; and 1.8% (n = 7) did not disclose this information.
As mentioned in Chapter 3, the classification of SMEs in Malaysia can be based on
the number of employees or the sales turnover (see Table 3.1). Based on the number
of employees, a number of respondents were retained in the final analysis even
though they employed fewer than five or more than 150 employees, which should be
in the categories of micro- or large enterprises, respectively. However, they were
kept in the final analysis since their sales turnovers were still in the category of small
and medium enterprises. This process was also applied to the sales turnover
classification. Even though there were a number of enterprises that generated less
than RM200,000, which should be in the category of micro-enterprises, they were
retained in this data analysis since they employed more than five full-time employees.
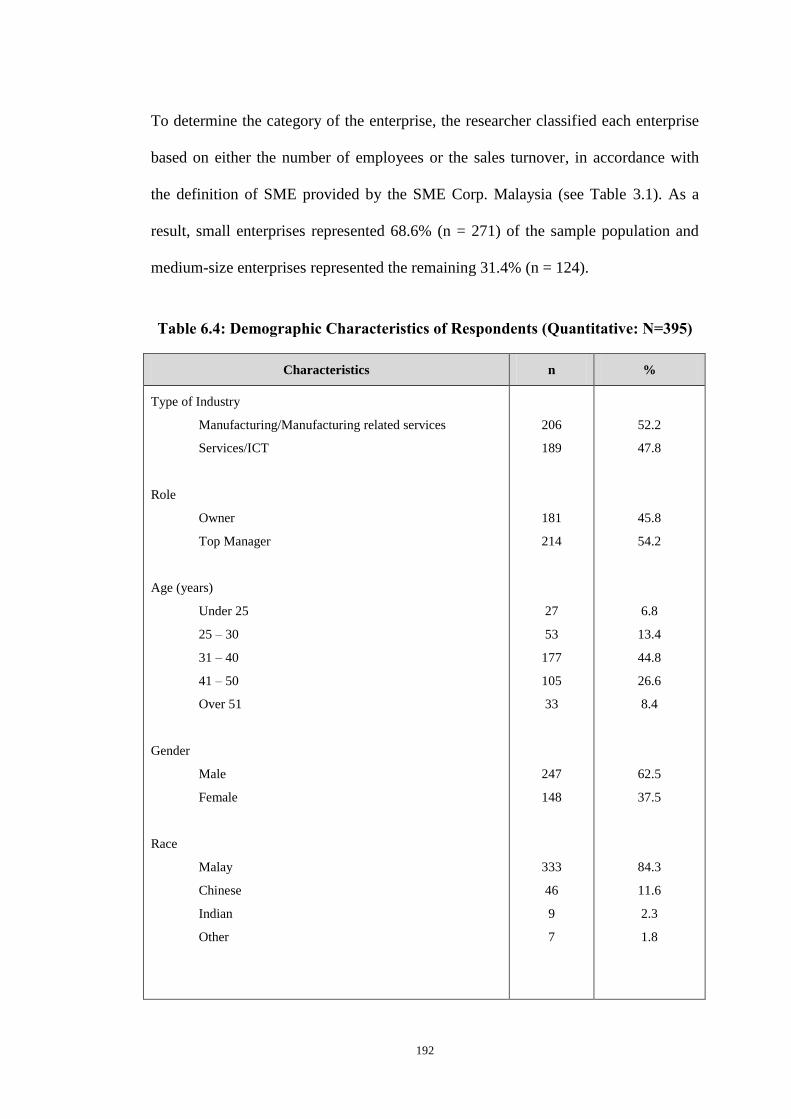
192
To determine the category of the enterprise, the researcher classified each enterprise
based on either the number of employees or the sales turnover, in accordance with
the definition of SME provided by the SME Corp. Malaysia (see Table 3.1). As a
result, small enterprises represented 68.6% (n = 271) of the sample population and
medium-size enterprises represented the remaining 31.4% (n = 124).
Table 6.4: Demographic Characteristics of Respondents (Quantitative: N=395)
Characteristics n %
Type of Industry
Manufacturing/Manufacturing related services
Services/ICT
Role
Owner
Top Manager
Age (years)
Under 25
25 – 30
31 – 40
41 – 50
Over 51
Gender
Male
Female
Race
Malay
Chinese
Indian
Other
206
189
181
214
27
53
177
105
33
247
148
333
46
9
7
52.2
47.8
45.8
54.2
6.8
13.4
44.8
26.6
8.4
62.5
37.5
84.3
11.6
2.3
1.8
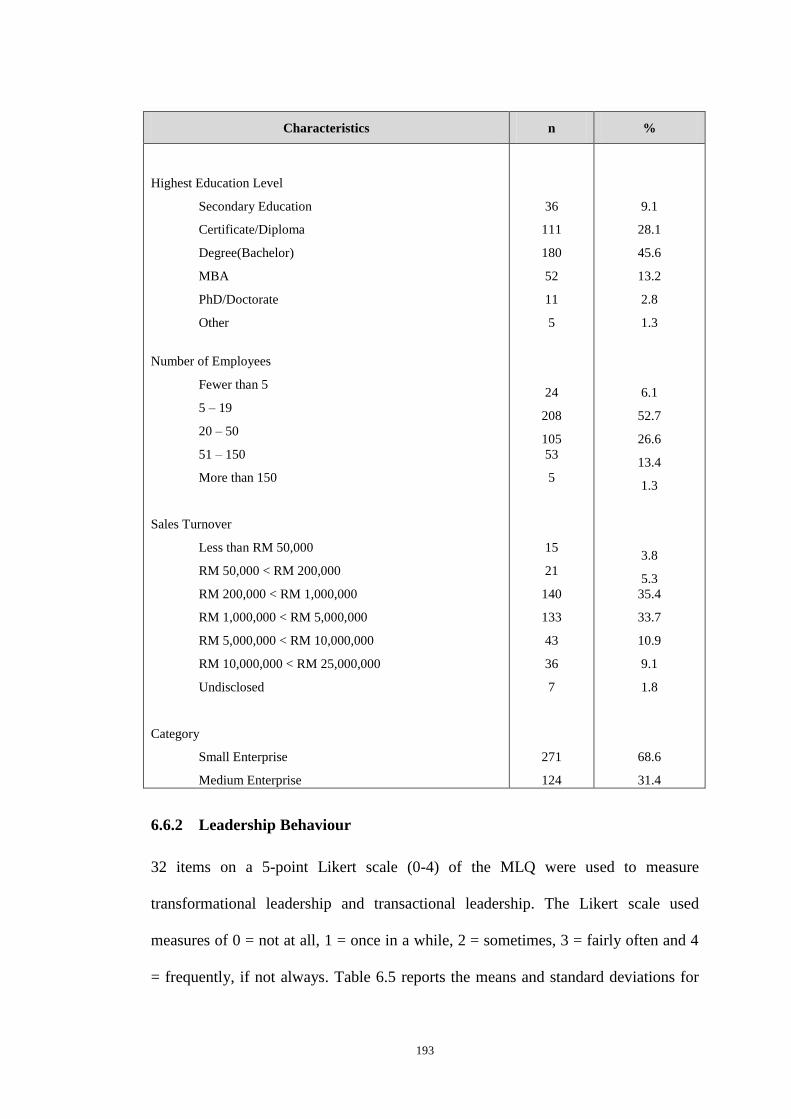
193
Characteristics n %
Highest Education Level
Secondary Education
Certificate/Diploma
Degree(Bachelor)
MBA
PhD/Doctorate
Other
Number of Employees
Fewer than 5
5 – 19
20 – 50
51 – 150
More than 150
Sales Turnover
Less than RM 50,000
RM 50,000 < RM 200,000
RM 200,000 < RM 1,000,000
RM 1,000,000 < RM 5,000,000
RM 5,000,000 < RM 10,000,000
RM 10,000,000 < RM 25,000,000
Undisclosed
Category
Small Enterprise
Medium Enterprise
36
111
180
52
11
5
24
208
105
53
5
15
21
140
133
43
36
7
271
124
9.1
28.1
45.6
13.2
2.8
1.3
6.1
52.7
26.6
13.4
1.3
3.8
5.3
35.4
33.7
10.9
9.1
1.8
68.6
31.4
6.6.2 Leadership Behaviour
32 items on a 5-point Likert scale (0-4) of the MLQ were used to measure
transformational leadership and transactional leadership. The Likert scale used
measures of 0 = not at all, 1 = once in a while, 2 = sometimes, 3 = fairly often and 4
= frequently, if not always. Table 6.5 reports the means and standard deviations for

194
the leadership behaviour scales with each factor of transformational and transactional
leadership behaviour used in this study.
Table 6.5: Means and Standard Deviation for Leadership Behaviour (N=395)
Measures Mean SD
Transformational Leadership
Idealised Influence
Individualised Consideration
Intellectual Stimulation
Inspirational Motivation
Transactional Leadership
Contingent Reward
Management-by-exception (Active)
Management-by-exception (Passive)
Total Leadership Behaviour
2.90
2.90
2.73
2.84
3.13
2.33
2.94
2.78
1.26
2.69
0.47
0.51
0.58
0.64
0.57
0.37
0.57
0.56
0.73
0.39
As shown in Table 6.5, the mean score for total leadership behaviour was 2.69
(SD=0.39). Comparing the two forms of leadership behaviour, the mean score for
transformational leadership was 2.90 (SD = 0.47), which was higher than the mean
score for transactional leadership 2.33 (SD = 0.37). This shows that the respondents
in this study display transformational leadership more frequently than transactional
leadership behaviour.
In regard to the factors of transformational leadership, the highest mean was
attributed to the inspirational motivation factor with a mean score of 3.13 (SD =
0.57). This was followed by idealised influence with a mean score of 2.90 (SD =
0.51). The mean score for intellectual stimulation was 2.84 (SD = 0.64).

195
Individualised consideration was the form of transformational leadership least
perceived by respondents with a mean score of 2.73 (SD = 0.58). This shows that in
regard to the factors of transformational leadership, the respondents perceived that
they practise the attribute of inspirational motivation more often than the other
attributes of transformational leadership.
In analysing the factors of transactional leadership, the highest mean was attributed
to contingent reward with a mean score of 2.94 (SD = 0.57). This was followed by
management-by-exception (active) with a mean score of 2.78 (SD = 0.56) and
management-by-exception (passive) with a mean score of 1.26 (SD = 0.73). This
shows that when it comes to transactional leadership, the respondents display the
attribute of contingent reward quite often, followed by the management-by-exception
(active) attribute. It also shows that the respondents practise the management-by-
exception (passive) attribute only ‘once in a while’.
6.6.3 Entrepreneurial Orientation
For EO, there were 11 items on a 5-point Likert scale (0-4) to measure
innovativeness, proactiveness and risk taking. The Likert scale used measures of 0 =
strongly disagree, 1 = disagree, 2 = neither, 3 = agree and 4 = strongly agree. Table
6.6 shows the means and standard deviations for the scales used to measure EO in
this study.

196
Table 6.6: Means and Standard Deviation for Entrepreneurial Orientation
(N=395)
Measures Mean SD
Innovativeness
Proactiveness
Risk taking
Total Entrepreneurial Orientation
2.82
2.49
2.48
2.60
0.52
0.53
0.70
0.46
As shown in Table 6.6, the total mean score for EO was 2.60 (SD = 0.46). On
average, the respondents agreed that EO was practised in their organisations. In
regard to the mean scores for each factor of EO, innovativeness had the highest mean
score of 2.82 (SD = 0.52). The mean score for proactiveness was 2.49 (SD = 0.53)
and the mean score for risk taking was 2.48 (SD = 0.70). These results indicate that
the respondents perceived that their organisations display more of the innovative
attribute of EO than proactiveness and risk taking.
6.6.4 Organisational Performance
The organisational performance scale had eight items on a 5-point Likert scale (0-4)
to measure growth and profitability. The Likert scale used measures of 0 = strongly
disagree, 1 = disagree, 2 = neither, 3 = agree and 4 = strongly agree. Table 6.7 shows
the means and standard deviations for the scales used to measure organisational
performance in this study.

197
Table 6.7: Means and Standard Deviation for Organisational Performance
(N=395)
Measures Mean SD
Growth
Profitability
Total Organisational Performance
2.69
2.59
2.64
0.54
0.63
0.55
As shown in Table 6.7, the total mean score for organisational performance was 2.64
(SD = 0.55). On average, most of the respondents are satisfied with their
performance. In regard to the mean scores for each factor of organisational
performance, growth has the highest mean score of 2.69 (SD = 0.54) and the mean
score for profitability is 2.59 (SD = 0.63). These results indicate that in regard to
organisational performance measures, the respondents value growth much more than
profitability.
6.7 T-tests: Analysis of Size, Type of Industry, Gender and
Position between Leadership Behaviour, Entrepreneurial
Orientation and Organisational Performance
To extend the profile of the population, t-tests were conducted to examine whether or
not there were statistical differences on the main variables of this study (leadership
behaviour, EO and organisational performance), based on the size of the enterprise,
type of industry, gender of respondent and type of ownership/position in the
organisation. Levene’s test for equality of variance was also used. All variables did
not violate the assumption of equal variance. The results are presented in Tables 6.8
to 6.11.

198
Table 6.8: T-test: Size of Enterprises
Variables
Mean
Small
Enterprises
Mean
Medium
Enterprises
T-value Significant
Effect
Size
η2
Transformational
Leadership
2.86 3.00 -2.87 0.004 0.020
Transactional
Leadership
2.32
2.34
-0.58
0.564
EO 2.58 2.65 -1.53 0.126
Innovativeness 2.78 2.89 -1.95 0.126
Proactiveness 2.47 2.53 -1.03 0.303
Risk taking 2.46 2.51 -0.67 0.505
Organisational
Performance
2.58
2.78
-3.65
0.000
0.032
N 271 124
In regard to the size of enterprises (see Table 6.8), there was a statistically significant
difference in the mean scores for transformational leadership and organisational
performance between small and medium enterprises, both with a very small effect
size. The mean score for transformational leadership of small enterprises was 2.86
compared to 3.00 for medium enterprises, t (395) = -2.87, p = 0.004.
The mean score for the organisational performance of small enterprises was 2.58
compared to 2.78 for medium enterprises, t (395) = -3.65, p = 0.000. However, there
was not a statistically significant difference in the mean scores of transactional
leadership, EO and each factor of EO for small and medium enterprises.
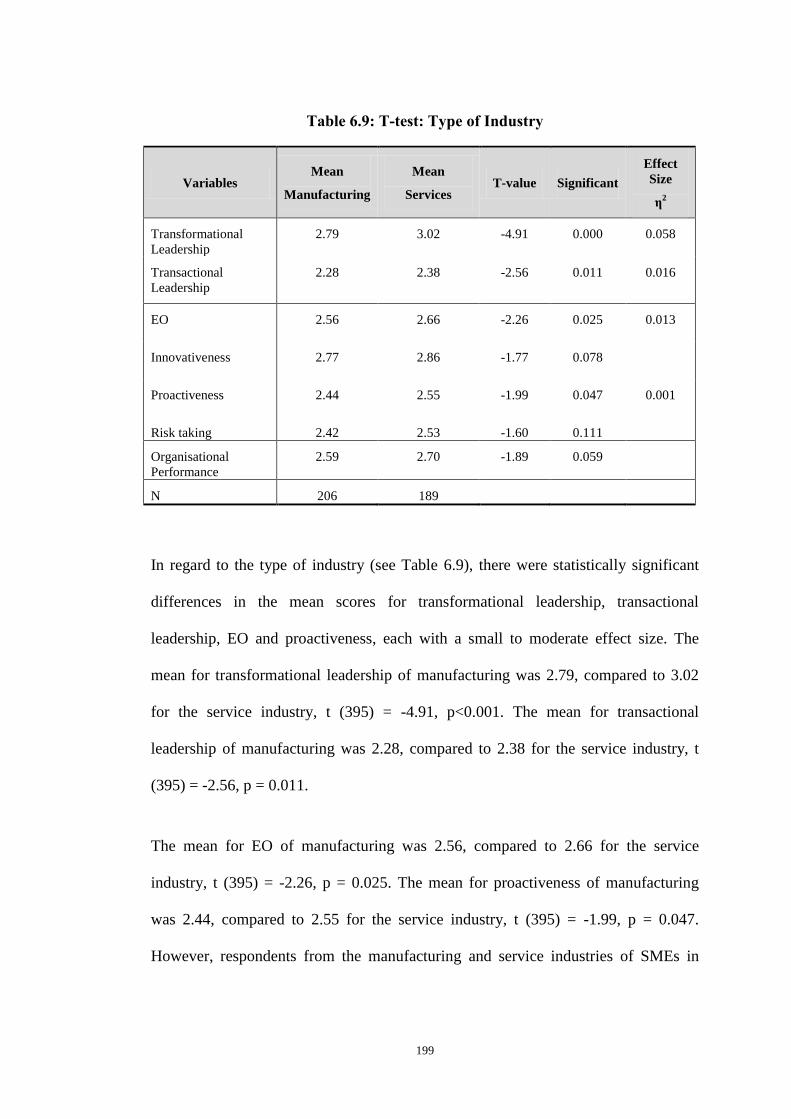
199
Table 6.9: T-test: Type of Industry
Variables Mean
Manufacturing
Mean
Services T-value Significant
Effect
Size
η2
Transformational
Leadership
2.79 3.02 -4.91 0.000 0.058
Transactional
Leadership
2.28 2.38
-2.56
0.011
0.016
EO 2.56 2.66 -2.26 0.025 0.013
Innovativeness 2.77 2.86 -1.77 0.078
Proactiveness 2.44 2.55 -1.99 0.047 0.001
Risk taking 2.42 2.53 -1.60 0.111
Organisational
Performance
2.59 2.70 -1.89 0.059
N 206 189
In regard to the type of industry (see Table 6.9), there were statistically significant
differences in the mean scores for transformational leadership, transactional
leadership, EO and proactiveness, each with a small to moderate effect size. The
mean for transformational leadership of manufacturing was 2.79, compared to 3.02
for the service industry, t (395) = -4.91, p<0.001. The mean for transactional
leadership of manufacturing was 2.28, compared to 2.38 for the service industry, t
(395) = -2.56, p = 0.011.
The mean for EO of manufacturing was 2.56, compared to 2.66 for the service
industry, t (395) = -2.26, p = 0.025. The mean for proactiveness of manufacturing
was 2.44, compared to 2.55 for the service industry, t (395) = -1.99, p = 0.047.
However, respondents from the manufacturing and service industries of SMEs in

200
Malaysia did not show any significant differences in organisational performance and
the other two factors of EO.
Table 6.10: T-test: Gender
Variables Mean
Male
Mean
Female T-value Significant
Effect
Size
η2
Transformational
Leadership
2.94 2.85 1.78 0.076
Transactional
Leadership
2.35 2.29
1.49
0.138
EO 2.62 2.59 0.64 0.523
Innovativeness 2.81 2.81 0.09 0.926
Proactiveness 2.56 2.41 2.28 0.023 0.013
Risk taking 2.45 2.52 -0.87 0.383
Organisational
Performance
2.64 2.64 -0.02 0.986
N 247 148
In regard to gender (see Table 6.10), there was no statistical difference in the mean
scores of each of the variables between male and female respondents, except for one
factor of EO, which was proactiveness. The mean for proactiveness of males was
2.56, compared to 2.41 for females, t (395) = -2.28, p = 0.023.
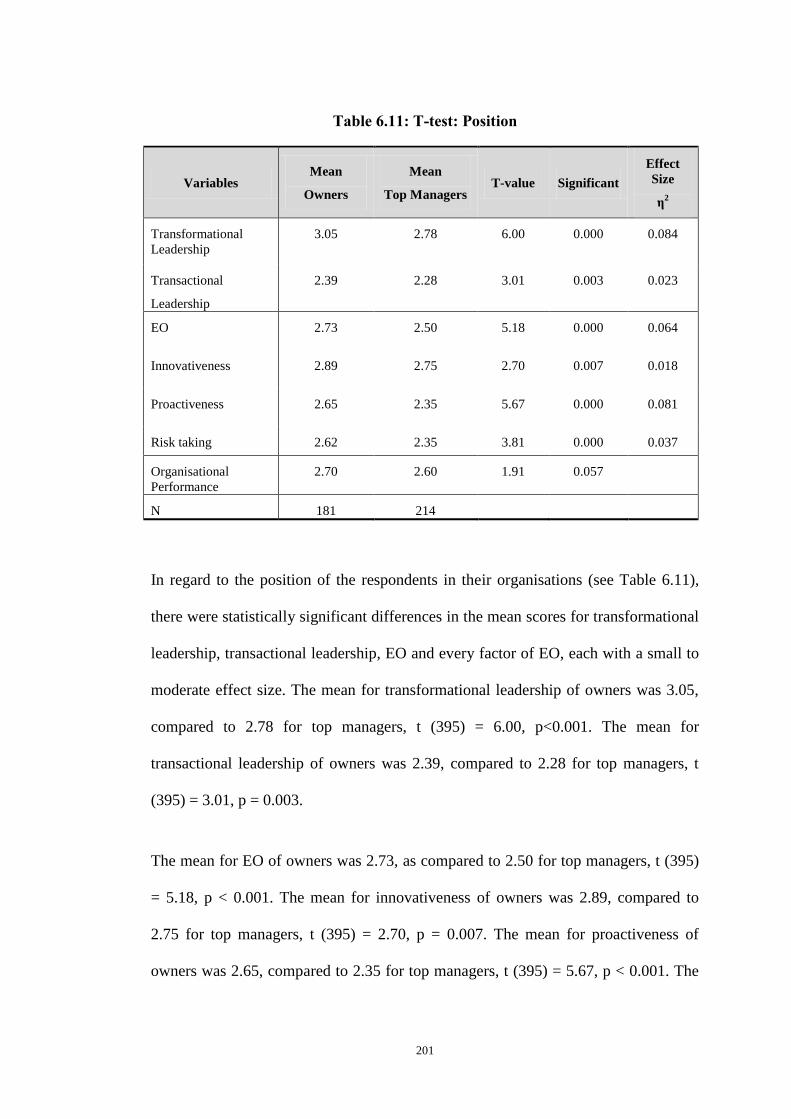
201
Table 6.11: T-test: Position
Variables Mean
Owners
Mean
Top Managers T-value Significant
Effect
Size
η2
Transformational
Leadership
3.05 2.78 6.00
0.000 0.084
Transactional
Leadership
2.39 2.28 3.01 0.003 0.023
EO 2.73 2.50 5.18 0.000 0.064
Innovativeness 2.89 2.75 2.70 0.007 0.018
Proactiveness 2.65 2.35 5.67 0.000 0.081
Risk taking 2.62 2.35 3.81 0.000 0.037
Organisational
Performance
2.70 2.60 1.91 0.057
N 181 214
In regard to the position of the respondents in their organisations (see Table 6.11),
there were statistically significant differences in the mean scores for transformational
leadership, transactional leadership, EO and every factor of EO, each with a small to
moderate effect size. The mean for transformational leadership of owners was 3.05,
compared to 2.78 for top managers, t (395) = 6.00, p<0.001. The mean for
transactional leadership of owners was 2.39, compared to 2.28 for top managers, t
(395) = 3.01, p = 0.003.
The mean for EO of owners was 2.73, as compared to 2.50 for top managers, t (395)
= 5.18, p < 0.001. The mean for innovativeness of owners was 2.89, compared to
2.75 for top managers, t (395) = 2.70, p = 0.007. The mean for proactiveness of
owners was 2.65, compared to 2.35 for top managers, t (395) = 5.67, p < 0.001. The
202
mean for risk taking of owners was 2.62, compared to 2.35 for top managers, t (395)
= 3.81, p < 0.001.
However, there was not a statistically significant difference in the mean scores of
organisational performance for the owners and top managers of SMEs in Malaysia.
The following section discusses the instruments used for the initial analysis in this
study.
6.8 Initial Analysis of Variables
As mentioned in the Chapter 5, before any other tests were conducted to examine the
psychometric properties of the questionnaire in this study, an initial full model was
examined consisting of all items for each of the variables simultaneously. Figure 6.4
shows the initial full model of this study. This model was developed to examine
whether it would fit with the data of this study since all constructs were adopted from
well-validated research. No modification of the model was made. The results of the
path analysis of the initial full model indicated that the goodness-of-fit statistics
produced a very poor result. This means that the model did not fit well with the data
of this study. The goodness-of-fit statistics were as follows: χ2
=3968.106, df = 1062,
χ2
/df = 3.736, RMSEA = 0.083, GFI = 0.709, CFI = 0.573,TLI = 0.546 and AGFI =
0.678.

203
e
Figure 6.4: Initial Full Model of All Variables
Based on the results produced by the initial full model of this study, a decision was
made to look into the measurement model of each variable. This decision was made
to look at the goodness-of-fit statistics for each variable and to see whether each
measurement model would fit the data well. If all models fitted the data well, then
EFA would not be run. However, if the model did not fit the data well or produced
poor goodness-of-fit statistics, then EFA and CFA to test the psychometric properties
of the questionnaire would be run. Figures 6.5 to 6.8 present the initial measurement
models for each of the variables.
2.31
1.86
4.17
-3.57
3.49
-0.49
0.83
-2.79
Transformational
Leadership
Transactional
Leadership
Profitability
Growth
e4
Entrepreneurial
Orientation
Goodness-of-fit statistics: GFI=0.709, AGFI=0.678, RMSEA=0.083,
CMIN=3.736, CFI=0.573, TLI=0.546.

204
Figure 6.5: Initial Measurement Model: Transformational Leadership
0.85
0.90
1.02
0.99
0.55
0.68
0.67
0.54
0.64
0.66
0.48
0.74
0.67
0.63
0.43
0.70
0.56
0.60
0.31
0.45
0.31
0.48
0.48
0.55
0.44
0.40
0.19
0.23
0.09
0.20
0.10
0.36
0.29
0.46
0.45
0.41
0.23
0.30
0.42
0.32
0.49
0.90
0.23
1.07
Idealised
Influence
Inspirational
Motivation
Intellectual
Stimulation
II1
II2
II3
II4
II5
II6
II7
II8
IS1
IS2
IS3
IS4
IC1
IC3
IC4
IM1
IM2
IM3
IM4
Individualised
Consideration

205
As Figure 6.5 illustrates, the initial measurement model of transformational
leadership comprised 20 items. One item (item IC2) was deleted during the stage of
measuring scale reliability. Two covariances between the latent variables (II and IC;
IS and IC) exceeded 1.00. Goodness-of-fit statistics for the initial measurement
model for transformational leadership were: χ2
=716.252, df = 164, χ2
/df = 4.367,
RMSEA = 0.092, GFI = 0.837, CFI = 0.782, TLI = 0.748 and AGFI = 0.917. These
results showed that the initial measurement model for transformational leadership
produced poor goodness-of-fit statistics.
Figure 6.6: Initial Measurement Model: Transactional Leadership
-0.08
0.61
0.43
0.64
0.36
0.71
0.61
0.64
0.41
0.52
0.77
0.57
0.27
0.59
0.33
0.37
0.13
0.50
0.42
0.19
0.41
0.17
-0.33
Management-
by-exception
(Passive)
Contingent
Reward
CR2
CR3
CR4
MBE
A2
MBE
A3
MBE
A4
MBEP
1
MBEP
2
MBEP
3
MBEP
4
Management-
by-exception
(Active)
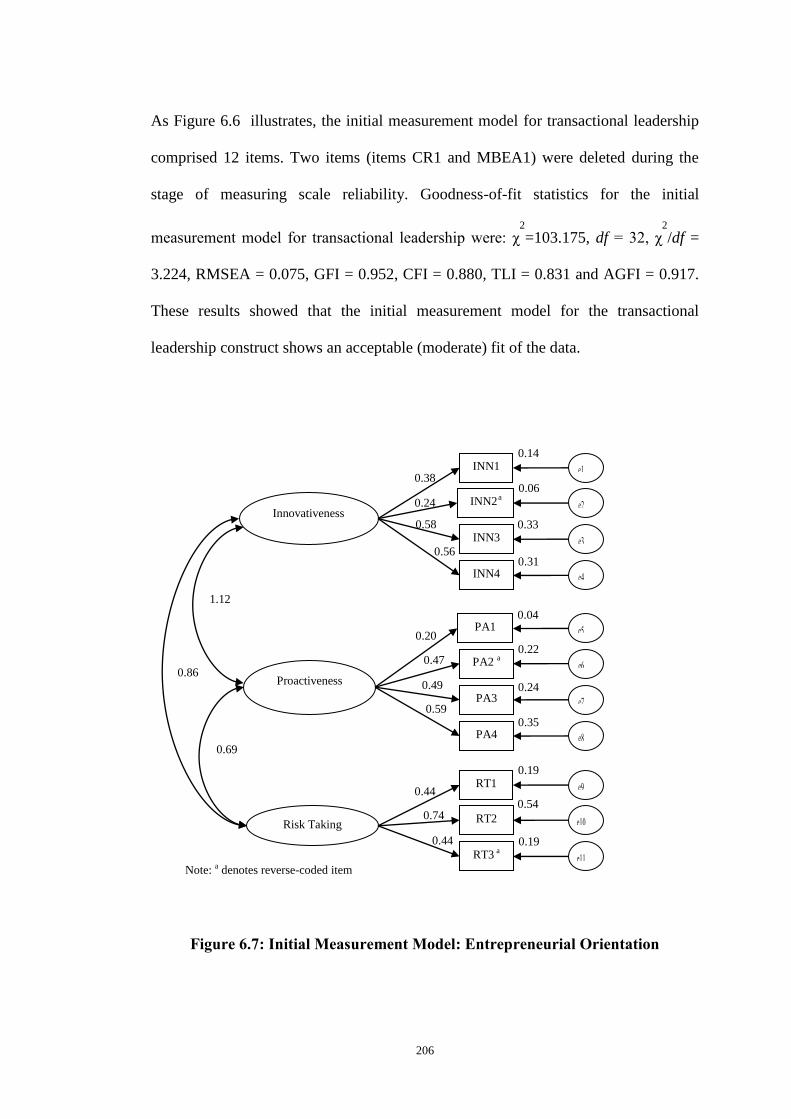
206
As Figure 6.6 illustrates, the initial measurement model for transactional leadership
comprised 12 items. Two items (items CR1 and MBEA1) were deleted during the
stage of measuring scale reliability. Goodness-of-fit statistics for the initial
measurement model for transactional leadership were: χ2
=103.175, df = 32, χ2
/df =
3.224, RMSEA = 0.075, GFI = 0.952, CFI = 0.880, TLI = 0.831 and AGFI = 0.917.
These results showed that the initial measurement model for the transactional
leadership construct shows an acceptable (moderate) fit of the data.
Figure 6.7: Initial Measurement Model: Entrepreneurial Orientation
0.69
1.12
0.47
0.49
0.44
0.74
0.44
0.59
0.20
0.56
0.58
0.24
0.38
0.31
0.33
0.06
0.14
0.19
0.54
0.19
0.22
0.04
0.24
0.35
0.86
Risk Taking
Innovativeness
INN1
INN2 a
INN3
INN4
PA1
PA2 a
PA3
PA4
RT1
RT2
RT3 a
Proactiveness
Note: a denotes reverse-coded item

207
As Figure 6.7 illustrates, the initial EO measurement model comprised 11 items. One
covariance between latent variables exceeded 1.00. Goodness-of-fit statistics for the
initial measurement model for EO were: χ2
= 185.6.9, df = 41, χ2
/df = 4.527, RMSEA
= 0.095, GFI = 0 .920, CFI = 0.791, TLI = 0.720 and AGFI = 0.871. These results
showed that the initial measurement model for the EO construct produced acceptable
goodness-of-fit statistics.
Figure 6.8: Initial Measurement Model: Organisational Performance
As Figure 6.8 illustrates, the initial organisational performance measurement model
comprised eight items. The covariance between latent variables exceeded 1.00.
Goodness-of-fit statistics for the initial measurement model for organisational
performance were: χ2
= 196.507, df = 19, P-value = .000, χ2
/df = 10.342, RMSEA =
0.154, GFI = 0.896, CFI = 0.796, TLI = 0.699 and AGFI = 0.804. These results
1.14
0.58
0.61
0.62
0.62
0.47
0.39
0.62
0.54
0.22
0.15
0.39
0.29
0.34
0.38
0.37
0.39
Growth
GR1
GR2
GR3
GR4
PRO1
PRO2
PRO3
PRO4
Profitability

208
showed that the initial measurement model for the organisational performance
construct did not fit the data well.
To summarise, the results based on the initial measurement models for each variable
concluded that some of the models did not produce an acceptable level of goodness-
of-fit statistics. Also, there were some covariances between latent variables that
exceeded 1.00 in almost all of the initial measurement models. Overall, the x2/df
ranged from 3.224 to 10.342. The RMSEA ranged from 0.075 to 0.154. The GFI
ranged from 0.837 to 0.952. The CFI ranged from 0.791 to 0.880. The TLI ranged
from 0.699 to 0.831 and the AGFI ranged from 0.791 to 0.917. Therefore, due to
these unsatisfactory results from the initial measurement models, the researcher ran
the EFA and the CFA procedures to identify whether or not the final measurement
models for each variable would produce better results for the final analysis. The
following section discusses the procedures and findings involved in the EFA and
CFA processes.
6.9 Development of Path Model
6.9.1 Exploratory Factor Analysis (EFA)
The primary objective of using EFA is to determine the number of common factors
influencing a set of measurements based on the data. Kahn (2006) suggested that
EFA facilitates the identification of the factors that explain the covariances among
variables. To decide how many factors to retain, several criteria were observed when
extracting the factors of: (1) loadings of items (items with loadings less than 0.30 and
loaded on multiple factors were removed during the EFA process); (2) eigenvalues
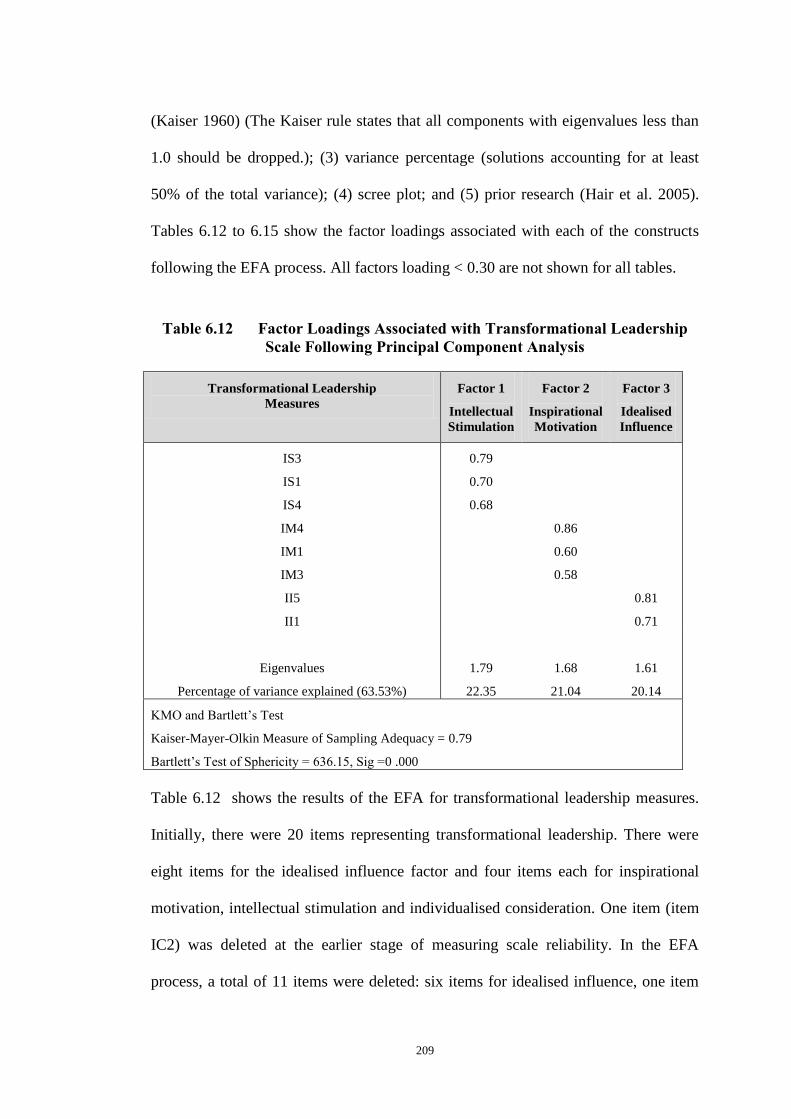
209
(Kaiser 1960) (The Kaiser rule states that all components with eigenvalues less than
1.0 should be dropped.); (3) variance percentage (solutions accounting for at least
50% of the total variance); (4) scree plot; and (5) prior research (Hair et al. 2005).
Tables 6.12 to 6.15 show the factor loadings associated with each of the constructs
following the EFA process. All factors loading < 0.30 are not shown for all tables.
Table 6.12 Factor Loadings Associated with Transformational Leadership
Scale Following Principal Component Analysis
Transformational Leadership
Measures
Factor 1
Intellectual
Stimulation
Factor 2
Inspirational
Motivation
Factor 3
Idealised
Influence
IS3
IS1
IS4
IM4
IM1
IM3
II5
II1
0.79
0.70
0.68
0.86
0.60
0.58
0.81
0.71
Eigenvalues
Percentage of variance explained (63.53%)
1.79
22.35
1.68
21.04
1.61
20.14
KMO and Bartlett’s Test
Kaiser-Mayer-Olkin Measure of Sampling Adequacy = 0.79
Bartlett’s Test of Sphericity = 636.15, Sig =0 .000
Table 6.12 shows the results of the EFA for transformational leadership measures.
Initially, there were 20 items representing transformational leadership. There were
eight items for the idealised influence factor and four items each for inspirational
motivation, intellectual stimulation and individualised consideration. One item (item
IC2) was deleted at the earlier stage of measuring scale reliability. In the EFA
process, a total of 11 items were deleted: six items for idealised influence, one item

210
for intellectual stimulation, one item for inspirational motivation and all three
remaining items for individualised consideration, due to low loadings and items not
loading on their corresponding constructs. The decision to remove those items was
taken with the consideration that the measures of transformational leadership were
taken from a well-developed scale (Avolio & Bass 2004). Therefore, items that did
not load onto their corresponding constructs were removed from the next analysis.
Relating items and their associated factors to the theoretical construct, the outcome
from the three-factor solution of the transformational leadership accounted for 64%
of the variance. It also revealed a good KMO result of 0.79. The result of Bartlett’s
test of sphericity for the presence of correlation among the variables should be
significant (p<0.05); in this case, it produced a favourable result of 0.000.
Table 6.13: Factor Loadings Associated with Transactional Leadership Scale
Following Principal Component Analysis
Transactional Leadership
Measures
Factor 1
Management-
by-exception
Passive
Factor 2
Contingent
Reward
Factor 3
Management-
by-exception
Active
MBEP2
MBEP1
MBEP4
MBEP3
CR2
CR3
CR4
MBEA2
MBEA4
MBEA3
0.80
0.73
0.64
0.61
0.77
0.77
0.65
0.82
0.65
0.59
Eigenvalues
Percentage of variance explained (54.71%)
2.03
20.32
1.92
19.24
1.52
15.17
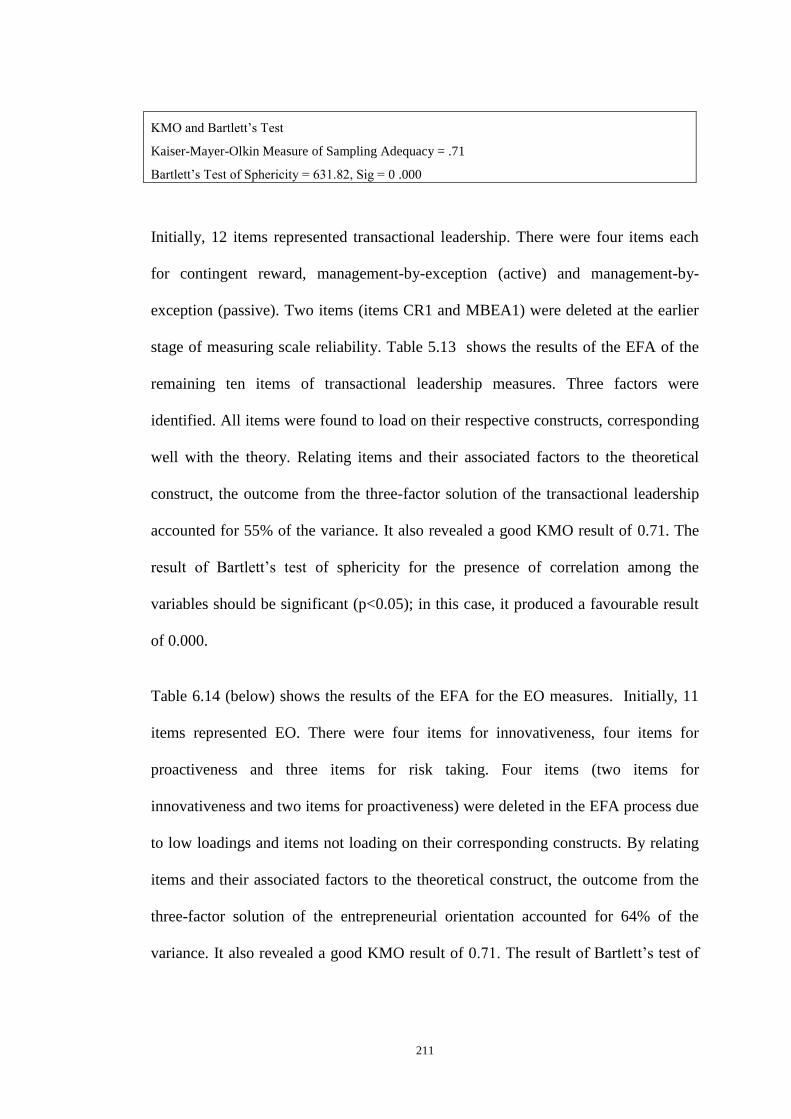
211
KMO and Bartlett’s Test
Kaiser-Mayer-Olkin Measure of Sampling Adequacy = .71
Bartlett’s Test of Sphericity = 631.82, Sig = 0 .000
Initially, 12 items represented transactional leadership. There were four items each
for contingent reward, management-by-exception (active) and management-by-
exception (passive). Two items (items CR1 and MBEA1) were deleted at the earlier
stage of measuring scale reliability. Table 5.13 shows the results of the EFA of the
remaining ten items of transactional leadership measures. Three factors were
identified. All items were found to load on their respective constructs, corresponding
well with the theory. Relating items and their associated factors to the theoretical
construct, the outcome from the three-factor solution of the transactional leadership
accounted for 55% of the variance. It also revealed a good KMO result of 0.71. The
result of Bartlett’s test of sphericity for the presence of correlation among the
variables should be significant (p<0.05); in this case, it produced a favourable result
of 0.000.
Table 6.14 (below) shows the results of the EFA for the EO measures. Initially, 11
items represented EO. There were four items for innovativeness, four items for
proactiveness and three items for risk taking. Four items (two items for
innovativeness and two items for proactiveness) were deleted in the EFA process due
to low loadings and items not loading on their corresponding constructs. By relating
items and their associated factors to the theoretical construct, the outcome from the
three-factor solution of the entrepreneurial orientation accounted for 64% of the
variance. It also revealed a good KMO result of 0.71. The result of Bartlett’s test of

212
sphericity for the presence of correlation among the variables should be significant
(p<0.05); in this instance, it achieved a favourable result of 0.000.
Table 6.14: Factor Loadings Associated with Entrepreneurial Orientation Scale
Following Principal Component Analysis
Entrepreneurial Orientation Measures
Factor 1
Proactiveness
Factor 2
Risk
taking
Factor 3
Innovativeness
PA4
PA3
RT1
RT3
RT2
INN2
INN1
In dealing with competitors, my company
is very often the first to introduce new
products and administrative techniques.
In dealing with competitors, my company
typically initiates actions which
competitors then respond to.
My company has a strong
proclivity/tendency for high risk projects
(with chances of very high returns).
When confronted with decision making
situations involving uncertainty, my
company adopts a cautious “wait-and-see”
strategya.
When confronted with decision making
situations involving uncertainty, my
company adopts a bold strategy in order to
maximise the probability of exploiting
opportunities.
I believe that changes in the product/service
lines in my company have been mostly
minor in naturea.
My company has marketed many new lines
of products or services.
0.83
0.80
0.82
0.64
0.61
0.87
0.66
Eigenvalues
Percentage of variance explained (64.13%)
1.61
22.98
1.51
21.63
1.37
19.51
KMO and Bartlett’s Test
Kaiser-Mayer-Olkin Measure of Sampling Adequacy = .71
Bartlett’s Test of Sphericity = 369.97, Sig = 0.000
Note: a = reverse coded item

213
Table 6.15: Factor Loadings Associated with Organisational Performance Scale
Following Principal Component Analysis
Organisational Performance
Measures
Factor 1
Profitability
Factor 2
Growth
PRO1
PRO2
PRO3
GRO3
GRO4
We are satisfied with the return on our investments.
We have higher return on investment (than our
competitors).
We are satisfied with our return on sales.
Our market shares are increasing faster than those of our
competitors.
My company is growing steadily for the past three yearsa.
0.93
0.67
0.50
0.89
0.61
Eigenvalues
Percentage of variance explained (63.02%)
1.63
32.61
1.55
31.02
KMO and Bartlett’s Test
Kaiser-Mayer-Olkin Measure of Sampling Adequacy = .63
Bartlett’s Test of Sphericity = 349.88, Sig =0 .000
Table 6.15 shows the results of the EFA of the organisational performance measures.
Initially, eight items represented the organisational performance. There were four
items each measuring profitability and growth. Three items (two items for growth
and one item for profitability) were deleted in the EFA process due to low loadings
and items not loading on their corresponding constructs. By relating items and their
associated factors to the theoretical construct, the outcome from the two-factor
solution of the organisational performance accounted for 64% of the variance. It
revealed a KMO score of 0.63. The result of Bartlett’s test of sphericity for the

214
presence of correlation among the variables should be significant (p<0.05); in this
instance, it achieved a favourable result of 0.000.
To summarise the EFA process, up to 12 items were deleted for each construct due to
low loadings and cross-loadings. The majority of the items loaded onto their
respective constructs, endorsing the theory behind each of them. Tables 6.16 to 6.19
show the descriptive statistics and correlation coefficients of retained items for the
main variables.
Table 6.16: Descriptive Statistics and Correlation Matrix for Transformational
Leadership Construct
Transforma-
tional
Leadership
Items
Mean
Score
Std.
Dev II1 II5 IS1 IS3 IS4 IM1 IM3
II1
II5
IS1
IS3
IS4
IM1
IM3
IM4
2.94
2.45
2.82
2.84
2.88
3.01
3.08
3.29
0.91
1.04
0.84
0.86
0.89
0.86
0.76
0.71
1
0.33***
0.17***
0.17**
0.21***
0.37**
0.21***
0.10**
1
0.23***
0.05
0.10*
0.29***
0.26***
0.09*
1
0.30***
0.26***
0.25**
0.34***
0.15**
1
0.53***
0.28***
0.27***
0.30***
1
0.30***
0.40***
0.34***
1
0.46***
0.36***
1
0.42***
Notes: *p<0.05. **p<0.01.***p<0.001.
Based on the correlation matrix produced during factor analysis of transformational
construct, there was no correlation between variables that exceeded 0.9. As
Tabachnick and Fidell (2001) suggested, when there is a high correlation (>0.9)
between variables, the assumption of multicollinearity is violated. Thus the data
presented no violation of the assumption.

215
Table 6.17: Descriptive Statistics and Correlation Matrix for Transactional Leadership Construct
Transactional
Leadership
Items
Mean
Score
Std.
Dev CR2 CR3 CR4 MBEA2 MBEA3 MBEA4 MBEP1 MBEP2 MBEP3
CR2
CR3
CR4
MBEA2
MBEA3
MBEA4
MBEP1
MBEP2
MBEP3
MBEP4
2.88
2.87
3.13
2.90
2.95
2.70
1.22
1.01
1.92
.90
0.87
0.87
0.72
0.85
0.86
0.92
0.96
0.98
1.14
1.05
1
0.46***
0.28***
0.13**
0.24***
0.16**
-0.06
0.03**
0.11*
-0.16**
1
0.38***
0.09*
0.33***
0.22***
-0.12**
-0.13**
-0.05
-0.30***
1
0.08
0.24***
0.13**
-0.22***
-0.21***
0.00
-0.26***
1
0.29***
0.28***
0.09*
-0.01
0.08
-0.09*
1
0.20***
0.04
-0.11*
-0.01
-0.08
1
-0.04
0.02
0.01
-0.08*
1
0.47***
0.24***
0.37***
1
0.28***
0.42***
1
0.19***
Notes: *p<0.05. **p<0.01.***p<0.001.
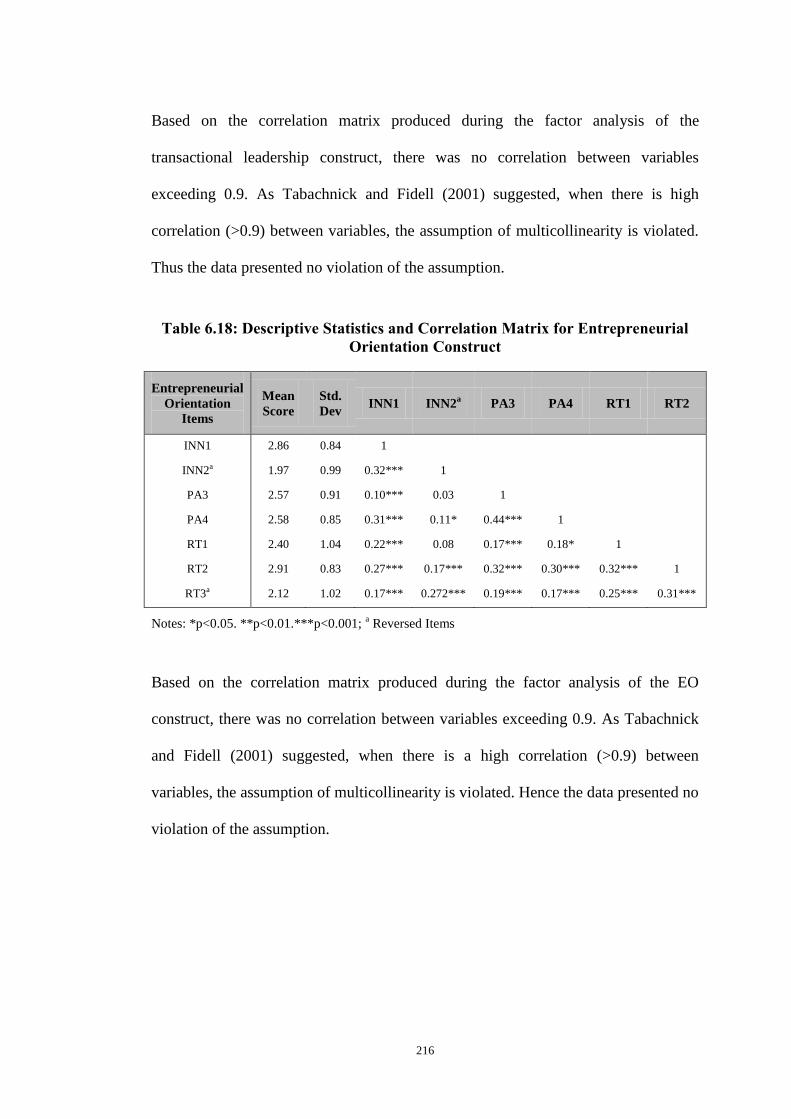
216
Based on the correlation matrix produced during the factor analysis of the
transactional leadership construct, there was no correlation between variables
exceeding 0.9. As Tabachnick and Fidell (2001) suggested, when there is high
correlation (>0.9) between variables, the assumption of multicollinearity is violated.
Thus the data presented no violation of the assumption.
Table 6.18: Descriptive Statistics and Correlation Matrix for Entrepreneurial
Orientation Construct
Entrepreneurial
Orientation
Items
Mean
Score
Std.
Dev INN1 INN2
a PA3 PA4 RT1 RT2
INN1
INN2a
PA3
PA4
RT1
RT2
RT3a
2.86
1.97
2.57
2.58
2.40
2.91
2.12
0.84
0.99
0.91
0.85
1.04
0.83
1.02
1
0.32***
0.10***
0.31***
0.22***
0.27***
0.17***
1
0.03
0.11*
0.08
0.17***
0.272***
1
0.44***
0.17***
0.32***
0.19***
1
0.18*
0.30***
0.17***
1
0.32***
0.25***
1
0.31***
Notes: *p<0.05. **p<0.01.***p<0.001; a Reversed Items
Based on the correlation matrix produced during the factor analysis of the EO
construct, there was no correlation between variables exceeding 0.9. As Tabachnick
and Fidell (2001) suggested, when there is a high correlation (>0.9) between
variables, the assumption of multicollinearity is violated. Hence the data presented no
violation of the assumption.

217
Table 6.19: Descriptive Statistics and Correlation Matrix for Organisational
Performance Construct
Organisational
Performance
Items
Mean
Score
Std.
Dev
Pro1 Pro2 Pro3 Gro3
Pro1
Pro2
Prof3
Gro3
Gro4
2.58
2.36
2.57
2.36
3.13
0.94
0.78
0.91
0.80
0.81
1
0.48***
0.36***
0.08
0.27***
1
0.31***
0.40***
0.25***
1
0.32***
0.30***
1
0.31***
Notes: *p<0.05. **p<0.01.***p<0.001.
Based on the correlation matrix produced during the factor analysis of the
organisational performance construct, there was no correlation between variables that
exceeded 0.9. As Tabachnick and Fidell (2001) suggested, when there is a high
correlation (>0.9) between variables, the assumption of multicollinearity is violated.
Hence the data presented no violation of the assumption. To verify the factor
structure derived from this EFA process, measurement models were then developed.
The following section discusses the multi-factor measurement models, part of the
CFA process of this study.
6.9.2 Confirmatory Factor Analysis (CFA)
As noted earlier, CFA enables the researcher to test how well the measured variables
represent the intended constructs. CFA also allows the researcher to assess the
contribution of each scale item as well as how well the scale measures the related
concept (Hair et al. 2010). The first step in CFA involved developing measurement
models based on the theoretical principles that reflect the relationships between the
observed items and the latent constructs that they are supposed to represent. To build

218
the measurement models for each of the construct, AMOS version 18.0 (Analysis of
Moment Structures) was used. It is also used to develop path analysis to test all the
hypotheses.
6.9.2.1 Multi-factor measurement model
There is considerable support for conducting multi-factor model analysis to test for
the multi-dimensionality of each theoretical construct. Bass and Avolio (1994)
posited that transformational and transactional leadership are multi-dimensional
constructs. Regarding EO, even though earlier scholars used aggregated scores to
suggest EO is a uni-dimensional construct (Miller 1983; Covin & Slevin 1989),
others have suggested that EO should be treated as a multi-dimensional construct
(Lumpkin & Dess 1996; Yang 2008). Finally, organisational performance is also a
multi-dimensional construct, as suggested by Lumpkin and Dess (1996) and
Cameron (1978). In addition, Covin and Slevin (1991) postulated that growth and
profitability represent the factors of a firm’s economic performance.
The used of multi-factor measurement models also helped to determine the values for
composite reliability, average variance extracted and average shared variance. These
measures were used to examine internal consistency and to test for convergent and
discriminant validity. Figures 6.9 to 6.12 and Tables 6.20 to 6.23 show the final four
multi-factor measurement models and the results of fit analysis associated with each
final model.
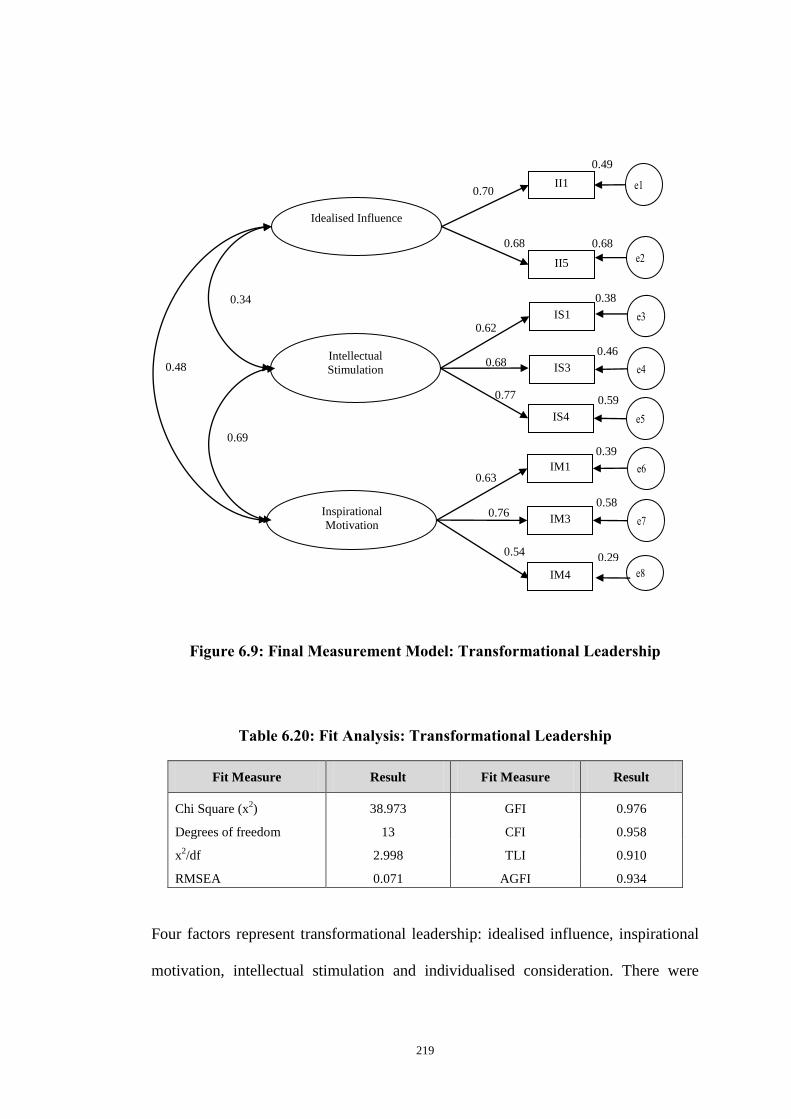
219
Figure 6.9: Final Measurement Model: Transformational Leadership
Table 6.20: Fit Analysis: Transformational Leadership
Fit Measure Result Fit Measure Result
Chi Square (x2)
Degrees of freedom
38.973
13
GFI
CFI
0.976
0.958
x2/df 2.998 TLI 0.910
RMSEA 0.071 AGFI 0.934
Four factors represent transformational leadership: idealised influence, inspirational
motivation, intellectual stimulation and individualised consideration. There were
0.69
0.34
0.48
0.68
0.70
0.62
0.68
0.77
0.63
0.76
0.54
0.58
0.29
0.39
0.59
0.46
0.38
0.68
0.49
Idealised Influence
Intellectual
Stimulation
Inspirational
Motivation
II1
II5
IS1
IS3
IS4
IM1
IM3
IM4

220
eight items for idealised influence, and four items each for inspirational motivation,
intellectual stimulation and individualised consideration. One item (item IC2) was
deleted during the measurement for scale reliability. The remaining 19 items were
examined for factor structure. As Figure 6.9 shows, the final transformational
leadership measurement model comprises only eight items and fits the data well.
Goodness-of-fit statistics are: χ2
=38.973, df = 13, χ2
/df = 2.998, RMSEA = 0.071,
GFI = 0.976, CFI = 0.958, TLI = 0.910 and AGFI = 0.934. The fit results (Table
6.20) indicate an acceptable fit and therefore convergent validity is demonstrated.
Figure 6.10: Final Measurement Model: Transactional Leadership
-0.36
-0.09
-0.43
0.11
0.88
0.53
0.55
0.75
0.78
0.73
0.94
0.34
0.52
0.77
0.57
0.27
0.60
0.61
0.30
0.56
Contingent Reward
Management-by-
exception (Active)
Management-by-
exception (Passive)
CR3
CR4
MBEA2
MBEA3
MBEA4
MBEP1
MBEP2
MBEA4
9
CR2
0.32
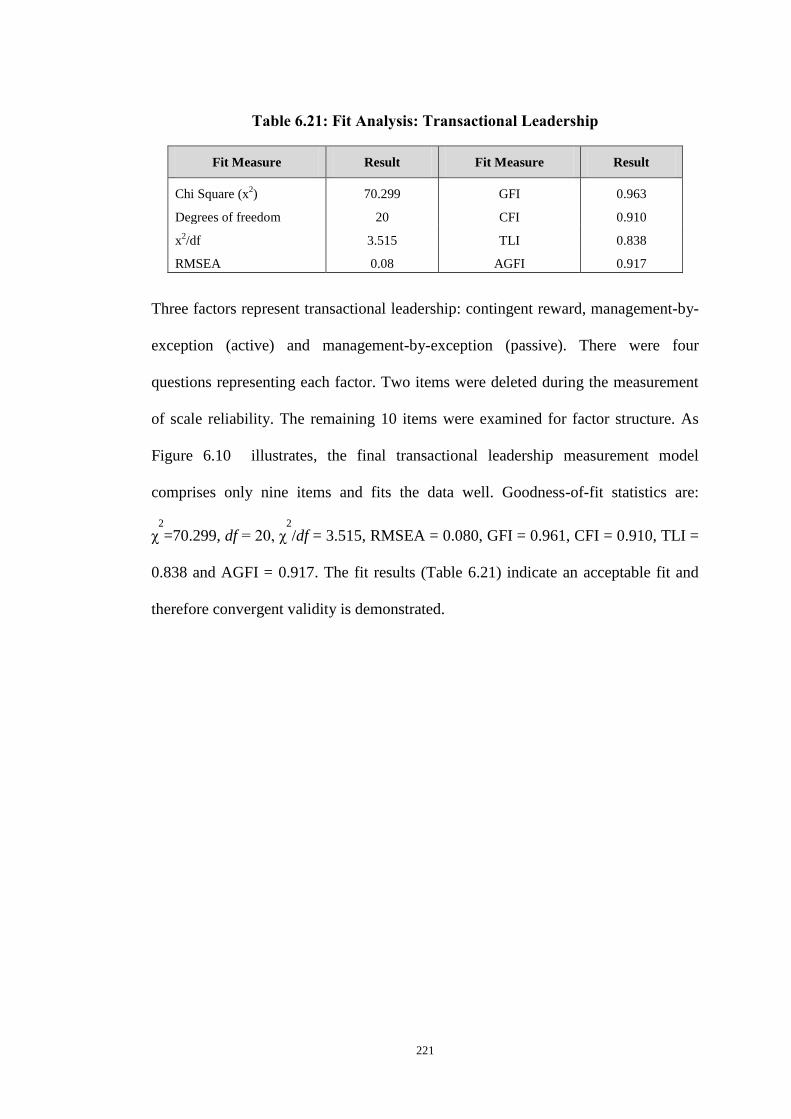
221
Table 6.21: Fit Analysis: Transactional Leadership
Fit Measure Result Fit Measure Result
Chi Square (x2)
Degrees of freedom
70.299
20
GFI
CFI
0.963
0.910
x2/df 3.515 TLI 0.838
RMSEA 0.08 AGFI 0.917
Three factors represent transactional leadership: contingent reward, management-by-
exception (active) and management-by-exception (passive). There were four
questions representing each factor. Two items were deleted during the measurement
of scale reliability. The remaining 10 items were examined for factor structure. As
Figure 6.10 illustrates, the final transactional leadership measurement model
comprises only nine items and fits the data well. Goodness-of-fit statistics are:
χ2
=70.299, df = 20, χ2
/df = 3.515, RMSEA = 0.080, GFI = 0.961, CFI = 0.910, TLI =
0.838 and AGFI = 0.917. The fit results (Table 6.21) indicate an acceptable fit and
therefore convergent validity is demonstrated.

222
Figure 6.11: Final Measurement Model: Entrepreneurial Orientation
Table 6.22: Fit Analysis: Entrepreneurial Orientation
Fit Measure Result Fit Measure Result
Chi Square (x2)
Degrees of freedom
12.785
6
GFI
CFI
0.991
0.981
x2/df 2.131 TLI 0.933
RMSEA 0.053 AGFI 0.957
0.41
0.50
0.35
0.48
0.39
0.39
0.66
0.88
0.63
0.69
0.61
0.71
0.38
0.51
0.77
0.15
0.66
Innovativeness
Proactiveness
Risk Taking
INNO1
INNO2a
PA3
PA4
RT1
RT2
RT3a Notes:.
a denotes reversed items

223
Three factors represent EO: innovativeness, proactiveness and risk taking. There
were four items for innovativeness, four items for proactiveness and three items for
risk taking. The 11 items were assessed for factor structure via goodness-of-fit
statistics. As Figure 6.11 shows, the final EO measurement model comprises only
seven questions and fits the data well. Goodness-of-fit statistics are: χ2
=12.785, df =
6, χ2
/df = 2.131, RMSEA = 0.053, GFI = 0.991, CFI = 0.981, TLI = 0.933 and AGFI
= 0.957. These statistics as presented in Table 6.22 indicate an acceptable fit and
therefore the convergent validity is demonstrated.
Figure 6.12: Two-factor Organisational Performance Measurement Model
0.73
0.57
0.87
0.71
0.65
0.52 0.27
0.43
0.51
0.57
0.76
Growth
Profitability
GR3
GR4
PRO1
PRO2
PRO3
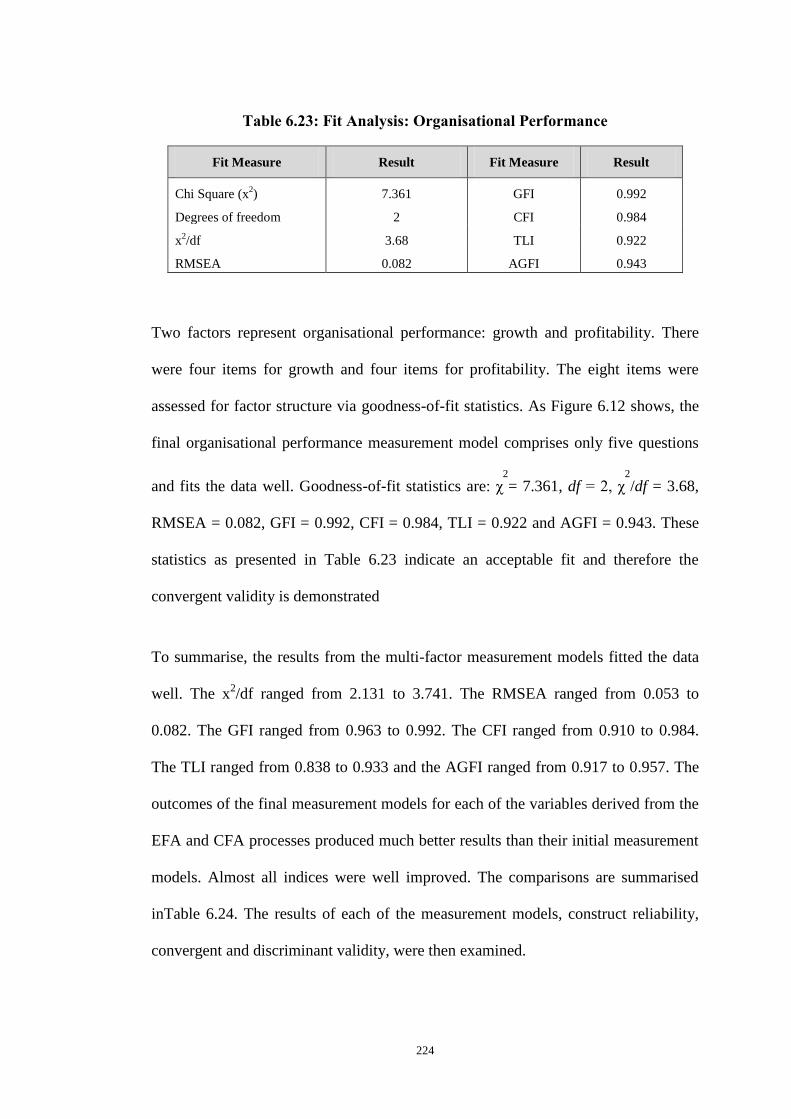
224
Table 6.23: Fit Analysis: Organisational Performance
Fit Measure Result Fit Measure Result
Chi Square (x2)
Degrees of freedom
7.361
2
GFI
CFI
0.992
0.984
x2/df 3.68 TLI 0.922
RMSEA 0.082 AGFI 0.943
Two factors represent organisational performance: growth and profitability. There
were four items for growth and four items for profitability. The eight items were
assessed for factor structure via goodness-of-fit statistics. As Figure 6.12 shows, the
final organisational performance measurement model comprises only five questions
and fits the data well. Goodness-of-fit statistics are: χ2
= 7.361, df = 2, χ2
/df = 3.68,
RMSEA = 0.082, GFI = 0.992, CFI = 0.984, TLI = 0.922 and AGFI = 0.943. These
statistics as presented in Table 6.23 indicate an acceptable fit and therefore the
convergent validity is demonstrated
To summarise, the results from the multi-factor measurement models fitted the data
well. The x2/df ranged from 2.131 to 3.741. The RMSEA ranged from 0.053 to
0.082. The GFI ranged from 0.963 to 0.992. The CFI ranged from 0.910 to 0.984.
The TLI ranged from 0.838 to 0.933 and the AGFI ranged from 0.917 to 0.957. The
outcomes of the final measurement models for each of the variables derived from the
EFA and CFA processes produced much better results than their initial measurement
models. Almost all indices were well improved. The comparisons are summarised
inTable 6.24. The results of each of the measurement models, construct reliability,
convergent and discriminant validity, were then examined.
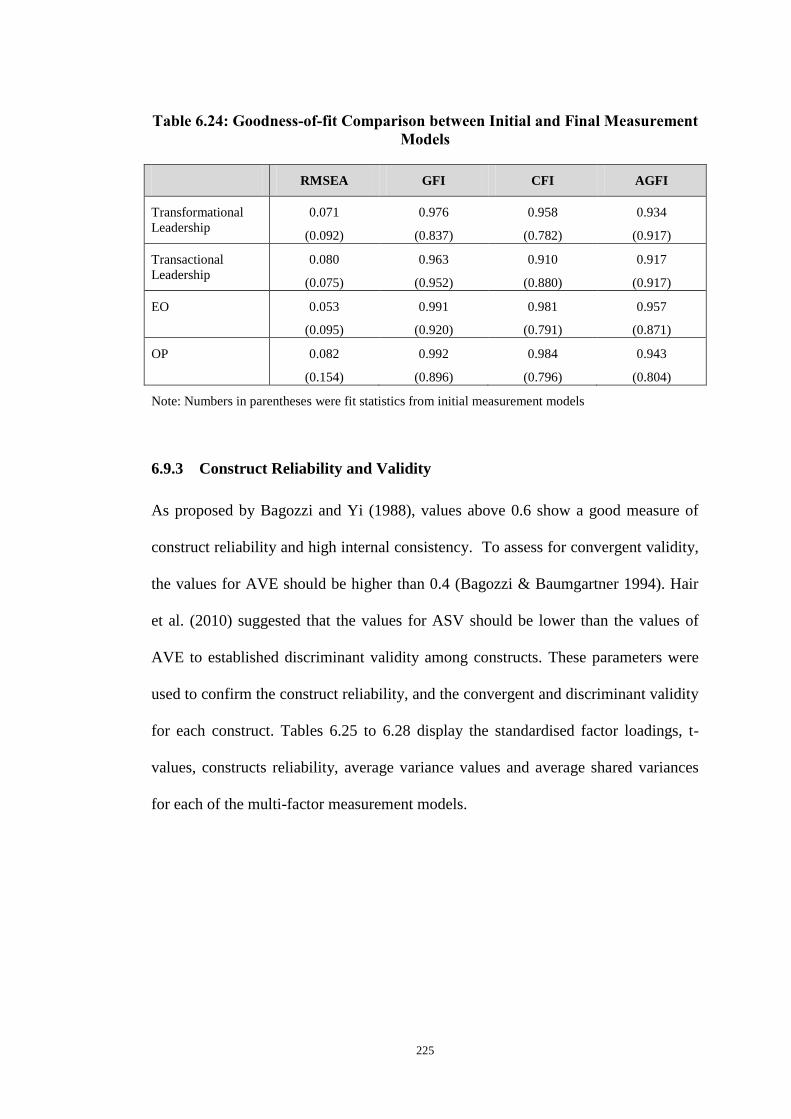
225
Table 6.24: Goodness-of-fit Comparison between Initial and Final Measurement
Models
RMSEA GFI CFI AGFI
Transformational
Leadership
0.071
(0.092)
0.976
(0.837)
0.958
(0.782)
0.934
(0.917)
Transactional
Leadership
0.080
(0.075)
0.963
(0.952)
0.910
(0.880)
0.917
(0.917)
EO 0.053
(0.095)
0.991
(0.920)
0.981
(0.791)
0.957
(0.871)
OP 0.082
(0.154)
0.992
(0.896)
0.984
(0.796)
0.943
(0.804)
Note: Numbers in parentheses were fit statistics from initial measurement models
6.9.3 Construct Reliability and Validity
As proposed by Bagozzi and Yi (1988), values above 0.6 show a good measure of
construct reliability and high internal consistency. To assess for convergent validity,
the values for AVE should be higher than 0.4 (Bagozzi & Baumgartner 1994). Hair
et al. (2010) suggested that the values for ASV should be lower than the values of
AVE to established discriminant validity among constructs. These parameters were
used to confirm the construct reliability, and the convergent and discriminant validity
for each construct. Tables 6.25 to 6.28 display the standardised factor loadings, t-
values, constructs reliability, average variance values and average shared variances
for each of the multi-factor measurement models.

226
Table 6.25: A Standardised Factor Loading, T-values, Constructs Reliability,
Average Variance Extracted Values and Average Shared Variances for the
Three-factor Transformational Leadership Measurement Model
Construct Standardised
Factor
Loadings
t-value Construct
Reliability
(CR)
Average
Variance
Extracted
(AVE)
Average
Shared
Variance
(ASV)
Idealised Influence
II1
II5
0.70
0.68
4.33
Scaling
0.65 0.48 0.17
Intellectual
Stimulation
IS1
IS3
IS4
0.62
0.68
0.77
Scaling
6.38
6.58
0.69 0.43 0.30
Inspirational
Motivation
IM1
IM3
IM4
0.63
0.76
0.54
9.83
Scaling
8.83
0.68
0.42
0.35
Note: Scaling means value indicator of standardised factor loadings set to 1 to enable latent factor
identification.
As shown in Table 6.25, values for construct reliability among transformational
leadership constructs represented by idealised influence, intellectual stimulation and
inspirational motivation were 0.66, 0.69 and 0.68, respectively. All values were
above the threshold value of 0.6 as recommended by Bagozzi and Yi (1988).
Therefore these constructs show good measure of reliability and internal consistency.
Convergent validity was demonstrated for all constructs since the values for AVE
were all above 0.4. Discriminant validity was also demonstrated when the values of
ASV for each construct were lower than the values of AVE.

227
Table 6.26: A Standardised Factor Loading, T-values, Construct Reliability,
Average Variance Extracted Values and Average Shared Variances for the
Three-factor Transactional Leadership Measurement Model
Construct Standardis
ed Factor
Loadings
t-value Construct
Reliability
(CR)
Average
Variance
Extracted
(AVE)
Average
Shared
Variance
(ASV)
Contingent Reward
CR2
CR3
CR4
0.57
0.77
0.52
Scaling
7.29
7.29
0.66 0.40 0.16
Management-by-
exception (Active)
MBEA2
MBEA3
MBEA4
0.34
0.94
0.73
2.59
Scaling
5.97
0.73 0.51 0.10
Management-by-
exception (Passive)
MBEP1
MBEP2
MBEP4
0.55
0.78
0.75
Scaling
3.67
3.64
0.74
0.49
0.07
Note: Scaling means value indicator of standardised factor loadings set to 1 to enable latent factor
identification.
As shown in Table 6.26, values for construct reliability among transactional
leadership constructs represented by contingent reward, management-by-exception
(active) and management-by-exception (passive) were 0.66, 0.73 and 0.74,
respectively. All values were above the threshold value of 0.6 as recommended by
Bagozzi and Yi (1988). Therefore, these constructs show good measure of reliability
and internal consistency. Values of AVE for each construct of transactional
leadership were all above 0.4 and therefore convergent validity was demonstrated.
Discriminant validity was also demonstrated when the values of ASV for each
construct were lower than the values of AVE.

228
Table 6.27: Table 6.26: A Standardised Factor Loading, T-values, Construct
Reliability, Average Variance Extracted Values and Average Shared Variances
for the Three-factor Entrepreneurial Orientation Measurement Model
Construct Standardise
d Factor
Loadings
t-value Construct
Reliability
(CR)
Average
Variance
Extracted
(AVE)
Average
Shared
Variance
(ASV)
Innovativeness
INN1
INN2a
0.71
0.61
4.58
Scaling
0.61 0.44 0.14
Proactiveness
Pa3
Pa4
0.69
0.63
Scaling
5.99
0.61 0.44 0.25
Risk taking
RT1
RT2
RT3a
0.39
0.88
0.66
3.60
Scaling
5.79
0.69
0.45
0.21
Note: Scaling means standardized factor loadings value indicator set to 1 to enable latent factor
identification. a denotes reversed items
As shown in Table 6.27, values for construct reliability among EO constructs
represented by innovativeness, proactiveness and risk taking were 0.61, 0.61 and
0.69, respectively. All values were above the threshold value of 0.6 as recommended
by Bagozzi and Yi (1988). Therefore, these constructs show good measure of
reliability and internal consistency. Convergent validity was also demonstrated for
all construct since the values for AVE were all above 0.4. Discriminant validity was
also demonstrated when the values of ASV for each construct were lower than the
values of AVE.

229
Table 6.28: A Standardised Factor Loading, T-values, Construct Reliability,
Average Variance Extracted Values and Average Shared Variances for the
Two-factor Organisational Performance Measurement Model
Construct Standardise
d Factor
Loadings
t-value Construct
Reliability
CR
Average
Variance
Extracted
(AVE)
Average
Shared
Variance
(ASV)
Growth
Gro3
Gro4
0.87
0.57
Scaling
5.74
0.69
0.54 0.52
Profitability
Prof1
Prof2
Prof3
0.71
0.65
0.52
Scaling
7.88
7.31
0.66 0.40 0.52
Note: Scaling means value indicator of standardised factor loadings set to 1 to enable latent factor
identification.
As shown in Table 6.28, values for construct reliability among organisational
performance constructs represented by growth and profitability were 0.69 and 0.66,
respectively. All values were above the threshold value of 0.6 as recommended by
Bagozzi and Yi (1988). Therefore, these constructs show good measure of reliability and
internal consistency. Values of AVE for each construct of organisational performance
were all above 0.4 and therefore convergent validity was demonstrated. Discriminant
validity was also demonstrated for growth when the value of ASV for the construct was
lower than the value of AVE, but was not demonstrated for the profitability construct.
However, there is a utility in keeping the two constructs separate, as suggested through
the EFA, since these measures were borrowed scales that had already been tested for
reliability and validity (Matzler et al. 2008). There was also theoretical support for
separating these two measures of organisational performance. Covin and Slevin (1991)
postulated that growth and profitability represent factors of a firm’s economic performance.
Therefore, both were maintained as distinct dependent variables in this study.

230
6.10 Path Analysis: Hypotheses testing
To test the hypotheses developed in this thesis, path analysis using the maximum
likelihood estimation was used to consider the rational and significant relationship
between leadership behaviour and EO and organisational performance and also to
examine the mediating effect of EO in the relationship between leadership behaviour and
organisational performance. Path analysis, which is a subset of SEM, uses bivariate
correlations to assess the direct and indirect relationships among these variables. This
procedure assesses the strength of each structural relationship in a path diagram (Hair et
al. 2010).
One of the benefits of using SEM is that the researcher can modify the model when the
hypothesised model does not fit the data well. According to Hoyle (1995), when the
outcome from the estimated covariance/variance matrix does not reproduce the sample
variance/variance matrix adequately, a hypothesis can be adjusted and the model can be
retested. The researcher can either add new paths or remove original paths (deletion of
nonsignificant paths) (Kline 2005). Modification can also be done based on the
improvement information obtained from Amos 18.0 through modification indices.
According to Hair et al. (2010), the modification index is measured for every possible
relationship that is not estimated in a model, and the value of a modification index denotes
the reduced values of χ2 if a particular parameter is left unconstrained (free). However,
these authors also stressed that making changes to the model based solely on the
modification indices is not recommended. Finally, Kline (1998) advised that model re-
specification should be consistent with theory and not solely data driven.

231
6.10.1 Leadership Behaviour and Organisational Performance
To examine the relationship between leadership behaviour and organisational
performance and to answer the first three hypotheses proposed in this study, the following
path model was developed. The final path of the direct model (Figure 6.13) of the
relationship between leadership behaviour and organisational performance fitted the data
well and the majority of the indices achieved a satisfactory level of goodness-of-fit
statistics. The fit indices of the model are: χ2
=338.741, df = 79, χ2
/df = 4.288, RMSEA =
0.091, GFI = 0.905, AGFI = 0.855.
Figure 6.13: Final Path of Direct Model: Leadership Behaviour and
Organisational Performance
0.31*
0.19**
0.13
0.45***
Transformational
Leadership
Transactional
Leadership
Profitability
Growth
Note: Dashed arrow denotes nonsignificant relationship *p<.05. **p<.01.***p<.001
Goodness of fit statistics: GFI=0.905, AGFI= 0.855,
RMSEA= 0.091, CMIN=4.288

232
Three hypotheses were based on the relationship between leadership behaviour and
organisational performance. Based on the results shown in Figure 6.13,
transformational leadership has a significant positive relationship to growth (β =
0.45, p = 0.000) and also profitability (β = 0.19, p <0.01). Hence, these results show
full support for H1.
On the other hand, transactional leadership has a significant positive relationship
only to growth (β = 0.31, p<0.05). The path between transactional leadership and
profitability is positive but not significant (β = 0.13, p>0.05). Therefore, these
results conclude that H2 is only partially supported.
Based on the outcomes of this direct path model of the relationship between
leadership behaviour and organisational performance, it can be concluded that
transformational leadership has a greater impact on the organisational performance of
SMEs than transactional leadership does. The path coefficients of transformational
leadership are found to be higher and more significant than the path coefficients
between the relationship of transactional leadership to growth and profitability
performance of SMEs. Hence these results show full support for H3. Table 6.29
summarises the results of the path model, standardised coefficients, standard errors
and respective z-values between leadership behaviour and organisational
performance. The next section discusses the results of the final path model of the
direct relationship between EO and organisational performance.

233
Table 6.29: Path Summary of Direct Model of Relationships between
Leadership Behaviour and Organisational Performance
Relationships Standardised
Coefficients
S.E z-value
Transformational
Leadership
Growth 0.45 0.07 4.14
Transformational
Leadership
Profitability 0.19 0.07 2.67
Transactional Leadership Growth 0.31 0.14 2.47
Transactional Leadership Profitability 0.13 0.14 ns
Note: ns means nonsignificant.
6.10.2 Entrepreneurial Orientation and Organisational Performance
To examine the relationship between EO and organisational performance and to
answer three of the hypotheses proposed in this study, the following path model was
developed. The final path of direct model of the relationship between EO and
organisational performance (Figure 6.14) fitted the data well and the majority of the
indices achieved a satisfactory level of goodness-of-fit statistics. The fit indices of
the model are: χ2
=103.665, df = 28, χ2
/df = 3.702, RMSEA = 0.083, GFI = 0.956,
AGFI = 0.896, CFI= 0.895.

234
Figure 6.14: Final Path of Direct Model: Entrepreneurial Orientation and
Organisational Performance
It was hypothesised that each factor of EO would have a significant positive
relationship to both organisational performance measures. Based on the results
shown in Figure 6.14, innovativeness has a significant positive relationship to growth
(β = 0.36, p = 0.000) and profitability (β = 0.36, p<0.05). These results show full
support for H4. Proactiveness also has a significant positive relationship to growth
(β = 0.70, p = 0.000) and profitability (β = 0.45, p = 0.000). Therefore, H5 is fully
supported.
Finally, the risk-taking factor has a significant positive relationship only to growth (β
= 0.18, p<0.05). However, the path between risk taking and profitability is positive
but not significant (β = 0.04, p>0.05). Therefore, these results show only partial
0.45***
0.70***
0.18*
0.17*
0.05
0.36***
Innovativeness
Risk Taking
Profitability
Growth
Note: Dashed arrow denotes nonsignificant relationship *p<.05, **p<.01, ***p<.001
Goodness of fit statistics: GFI=0.956, AGFI=0.896,
RMSEA=0.083, CMIN=3.702, CFI=0.895
Proactiveness
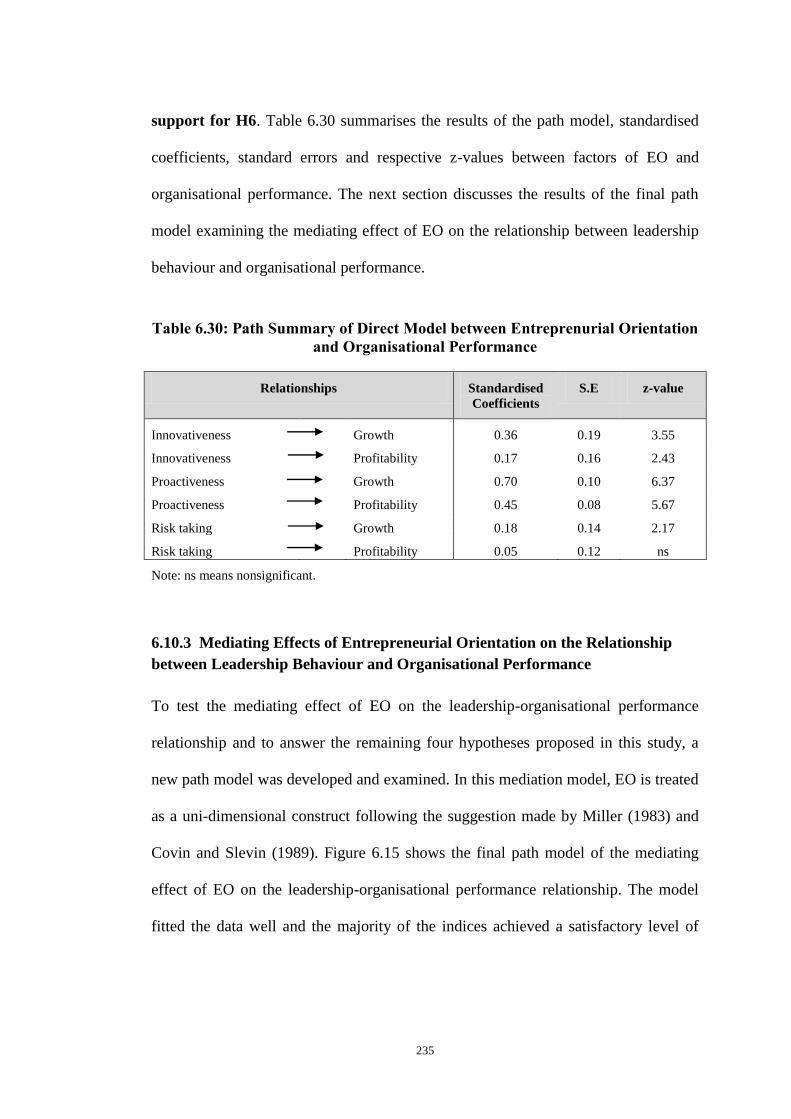
235
support for H6. Table 6.30 summarises the results of the path model, standardised
coefficients, standard errors and respective z-values between factors of EO and
organisational performance. The next section discusses the results of the final path
model examining the mediating effect of EO on the relationship between leadership
behaviour and organisational performance.
Table 6.30: Path Summary of Direct Model between Entreprenurial Orientation
and Organisational Performance
Relationships Standardised
Coefficients
S.E z-value
Innovativeness Growth 0.36 0.19 3.55
Innovativeness Profitability 0.17 0.16 2.43
Proactiveness Growth 0.70 0.10 6.37
Proactiveness Profitability 0.45 0.08 5.67
Risk taking Growth 0.18 0.14 2.17
Risk taking Profitability 0.05 0.12 ns
Note: ns means nonsignificant.
6.10.3 Mediating Effects of Entrepreneurial Orientation on the Relationship
between Leadership Behaviour and Organisational Performance
To test the mediating effect of EO on the leadership-organisational performance
relationship and to answer the remaining four hypotheses proposed in this study, a
new path model was developed and examined. In this mediation model, EO is treated
as a uni-dimensional construct following the suggestion made by Miller (1983) and
Covin and Slevin (1989). Figure 6.15 shows the final path model of the mediating
effect of EO on the leadership-organisational performance relationship. The model
fitted the data well and the majority of the indices achieved a satisfactory level of

236
goodness-of-fit statistics. The fit indices of the model are: χ2
= 334.344, df = 100,
χ2
/df = 3.343, RMSEA = 0.077, GFI = 0.914, AGFI = 0.868, CFI = 0.819.
Figure 6.15: Final Path of Mediating Model of Entrepreneurial Orientation in
the Relationship between Leadership Behaviour and Organisational
Performance
It was proposed that EO would fully mediate the relationship between both
transformational and transactional leadership and both measures of organisational
performance. To show support for these hypotheses, a suggestion made by Baron and
Kenny (1986) in regard to the mediation of a relationship was followed. The first step
in establishing a mediating effect is to show that each of the independent variables
(transformational and transactional leadership) has a significant relationship with the
0.76*
0.55*
0.23*
0.70***
ns
ns
ns
ns
Transformational
Leadership
Transactional
Leadership
Profitability
Growth
Notes: Dashed arrows denote nonsignificant relationships *p<0.05. **p<0.01.***p<0.001
Goodness of fit statistics: GFI= 0.914, AGFI= 0.868, RMSEA= 0.077,
CMIN=3.343, CFI= 0.819
Entrepreneurial
Orientation

237
dependent variables (growth and profitability). The outcomes of these relationships
were presented and discussed in the previous section (see Figure 6.13).
The second step is to establish that the independent variables are correlated
significantly with the mediating variable. The third step is to establish that the
mediating variable is correlated significantly with the dependent variable(s). Based
on the results presented in Figure 6.15, both independent variables –
transformational leadership (β = 0.70, p = 0.000) and transactional leadership (β =
0.23, p<0.01) – have a significant relationship to EO. EO also has a significant
relationship to growth (β = 0.76, p<0.05) and profitability (β = 0.55, p<0.05). Thus,
both conditions are fulfilled.
Finally, according to Baron and Kenny (1986), a variable mediates a relationship if it
reduces the path coefficient of a direct relationship once the mediator is computed
into the model. Full mediation occurs when the path between the independent
variables (transformational and transactional leadership) and the dependent variables
(growth and profitability) becomes insignificant when EO is introduced into the
model. Similar conditions were also suggested by Hair et al. (2005, 2010) when they
indicated that there is no mediation if the relationship between the independent
variable and the dependent variable remains significant and unchanged when the
mediation variable is included in the model. Partial mediation occurs if the
relationship between independent and dependent variables is reduced but remains
significant when the mediation variable is included as an additional predictor. If the
relationship between independent and dependent variables is reduced to a point
238
where it is not significant after the mediation variable is included, full mediation
occurs (Hair et al. 2005, 2010).
Based on suggestions made by Baron and Kenny (1986) and also by Hair et al.
(2005, 2010), the following paragraphs discuss each of the mediating hypotheses
proposed in this study.
The results demonstrated in Figure 6.13 show that, in the direct model,
transformational leadership is significantly related to growth (β = 0.45, p = 0.000).
Based on the mediation model (Figure 6.15), significant relationships are found
between transformational leadership and EO (β = 0.70, p = 0.000) and between EO
and growth (β = 0.76, p<0.05). However, the path coefficient between
transformational leadership and growth becomes insignificant in the mediation model
(β = -0.25, p>0.05). These results indicate that EO fully mediates the effect of
transformational leadership on growth performance, and suggest that H7 is fully
supported.
The results demonstrated in Figure 6.13 show that, in the direct model,
transformational leadership is significantly related to profitability (β = 0.19, p<0.01).
Based on the mediation model (Figure 6.15), significant relationships are
demonstrated between transformational leadership and EO (β = 0.70, p = 0.000) and
between EO and profitability (β = 0.55, p<0.05). However, the path coefficient
between transformational leadership and profitability becomes not significant in the
mediation model (β = -0.26, p>0.05). These results indicate that EO fully mediates
239
the effect of transformational leadership on profitability performance, and suggest
that H8 is fully supported.
The results demonstrated in Figure 6.13 show that, in the direct model, transactional
leadership is significantly related to growth (β = 0.31, p< 0.05). Based on the
mediation model (Figure 6.15), significant relationships are found between
transactional leadership and EO (β = 0.23, p<0.05) and between EO and growth (β =
0.76, p<0.05). However, the path coefficient between transactional leadership and
growth become insignificant significant in the mediation model (β = -0.19, p>0.05).
These results indicate that EO fully mediates the effect of transactional leadership on
growth performance, and suggest that H9 is fully supported.
The results demonstrated in Figure 6.13 show that, in the direct model, transactional
leadership is not significantly related to profitability (β = 0.13, p>0.05). Since this
relationship is not significant, no mediation occurs between transactional leadership
and profitability through EO. Thus, H10 is rejected. However, the results
demonstrated in the mediation model (Figure 6.15) confirmed that transactional
leadership is significantly related to EO (β = 0.23, p<0.05) and EO is significantly
related to profitability (β = 0.55, p<0.05). Therefore, it can only be concluded that
transactional leadership has an indirect effect on profitability through EO. Table 6.31
summarises the results of the path model, standardised coefficients, standard errors
and respective z-values between leadership behaviour, EO and organisational
performance.

240
Table 6.31: Path Summary of Mediating Model
Relationships Standardised
Coefficients
SE z-value
Transformational
Leadership
Growth -0.25 0.22 ns
Transformational
Leadership
Profitability -0.26 0.17 ns
Transactional Leadership Growth -0.49 0.19 ns
Transactional Leadership Profitability -0.18 0.12 ns
Transformational
Leadership
EO 0.70 0.12 3.620
Transactional Leadership EO 0.23 0.06 2.073
EO Growth 0.76 0.61 2.556
EO Profitability 0.55 0.46 2.373
Notes: ns means nonsignificant.
PART B QUALITATIVE FINDINGS
In order to gain a better understanding of the quantitative analyses, qualitative data
collection was conducted. The source of data for this stage was semi-structured
interviews with some of the respondents who had previously been involved in
quantitative data collection. Part B of this chapter presents and discusses findings
from the semi-structured interviews. Besides looking for answers to the research
question of this study, an objective of conducting qualitative data collection was to
confirm and if possible to expand the findings from the quantitative data. Part B
begins with Section 6.11 that describes the strategy for recruiting respondents and the
response rate. Section 6.12 discusses the demographic characteristics of respondents.
Section 6.13 discusses the themes developed for this study. Themes were developed
based on the variables adopted in this study as well as the relationships observed in the

241
quantitative data. Other valuable information obtained from the interview data is
presented in Section 6.14. Section 6.15 concludes this chapter.
6.11 Respondents and Response Rate
The strategy employed to obtain respondents for the interviews was a question
included in the survey questionnaire distributed during quantitative data collection.
The final section of the questionnaire asked the respondents if they would be willing
to participate in an interview with the researcher. If they agreed, the respondents
were then asked to provide further details about themselves so that they could be
easily contacted. From the 405 questionnaires collected, 42 respondents agreed to
participate in interviews. For those who agreed, the portion of the questionnaire that
contained their details was removed and was kept separately before the researcher
began the process of analysing the quantitative data. That was done to ensure the anonymity
of the respondents who had agreed to participate in the quantitative part of this study.
Since the main purpose of conducting qualitative data collection was to support the
findings from the quantitative data, this study intended to schedule only five to ten
interviews. To achieve this target sample, 15 potential respondents from the pool of
consenting participants were randomly selected. An invitation was sent to each of
them by e-mail explaining the purpose of the interview (including a plain language
statement) and asking for an interview appointment. A follow-up telephone call was
made to increase the response rate. Of the 15 potential participants, three did not
respond to the invitation, two declined and the remaining 10 respondents agreed to
participate and to make an appointment for an interview. However, only nine
respondents were finally interviewed. The interview with the last respondent had to
242
be rescheduled several times. Since the researcher found that no new theme had
emerged from the nine interviews that had been conducted, it was decided to stop
collecting data. In practice, the number of required respondents usually becomes
obvious as a study progresses, as new categories, themes or explanations stop
emerging from the data (Marshall 1996).
6.12 Demographic Characteristics of Respondents
Table 6.32 presents a summary of the background of the respondents who
participated in the interviews. Of the nine interviews conducted, four respondents
came from the manufacturing industry (RESP 1, RESP 5, RESP 7 and RESP 9) and
five from the service industry (RESP 2, RESP 3, RESP 4, RESP 6 and RESP 8). The
ages of the respondents were between 34 and 51. In terms of gender distribution,
only one female respondent (RESP 9) participated in this study. Of the nine
respondents, two were Chinese (RESP 1 and RESP 8) and the rest were Malays. One
respondent (RESP 1) held the position of Sales Manager and the rest were the
owners/founders of their companies with the position of either Chief Executive
Officer or Managing Director. In regard to their highest education level, two
respondents possessed only a secondary school qualification (RESP 1 and RESP 3),
one had a Diploma (RESP 6), two had Master’s Degrees (RESP 8 and RESP 9) and
the rest had Degrees in various specialisations. In terms of the years of their
company’s operation, five respondents (RESP 1, RESP 4, RESP 6, RESP 8 and
RESP 9) had at least 10 years experience and the rest had between four and nine
years experience. There were four small enterprises (RESP 2, RESP 5, RESP 7 and
RESP 9) and the rest were medium-sized enterprises.
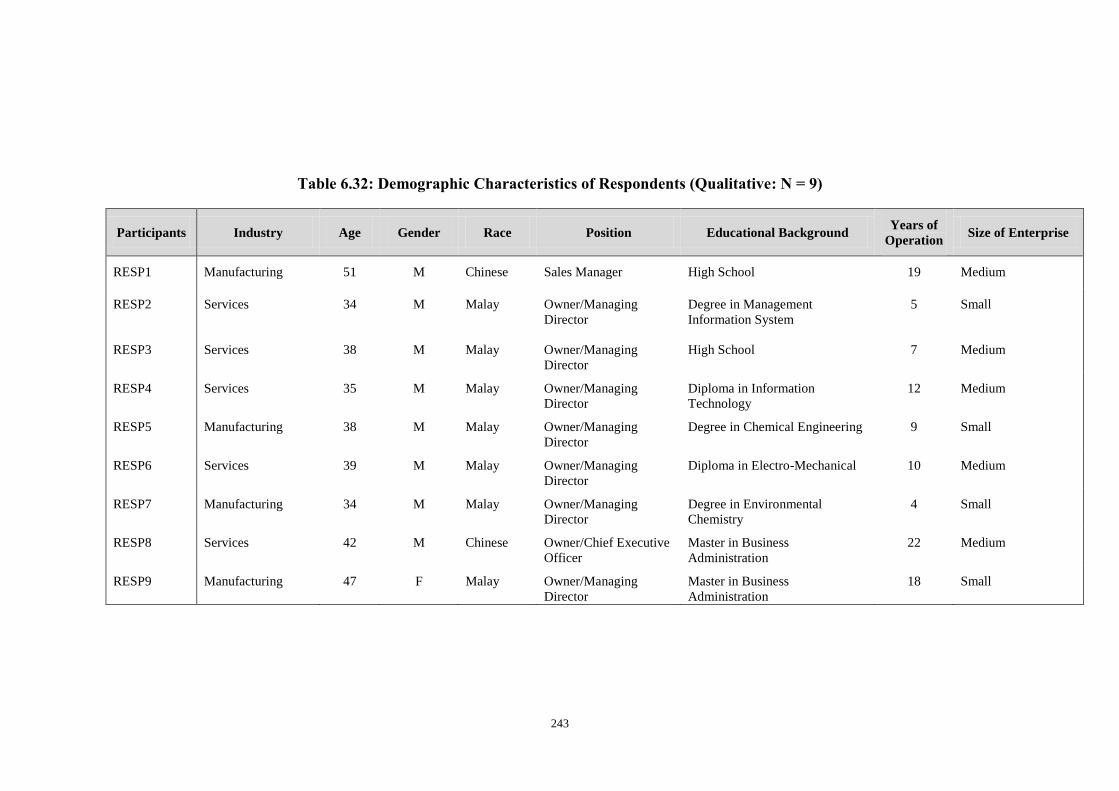
243
Table 6.32: Demographic Characteristics of Respondents (Qualitative: N = 9)
Participants Industry Age Gender Race Position Educational Background Years of
Operation Size of Enterprise
RESP1 Manufacturing 51 M Chinese Sales Manager High School 19 Medium
RESP2 Services 34 M Malay Owner/Managing
Director
Degree in Management
Information System
5 Small
RESP3 Services 38 M Malay Owner/Managing
Director
High School 7 Medium
RESP4 Services 35 M Malay Owner/Managing
Director
Diploma in Information
Technology
12 Medium
RESP5 Manufacturing 38 M Malay Owner/Managing
Director
Degree in Chemical Engineering 9 Small
RESP6 Services 39 M Malay Owner/Managing
Director
Diploma in Electro-Mechanical 10 Medium
RESP7 Manufacturing 34 M Malay Owner/Managing
Director
Degree in Environmental
Chemistry
4 Small
RESP8 Services 42 M Chinese Owner/Chief Executive
Officer
Master in Business
Administration
22 Medium
RESP9 Manufacturing 47 F Malay Owner/Managing
Director
Master in Business
Administration
18 Small

244
6.13 Themes and Findings Emerging from Interviews
6.13.1 Leadership Behaviour
The two types of leadership behaviour observed in this study are transformational
leadership and transactional leadership. At the beginning of each interview, the
respondents were asked to describe the way they run and manage their organisation
and their relationship with their employees. From their responses, the researcher then
tried to identify whether either of these two types of leadership behaviour was being
practised by the respondents.
6.13.1.1 Transformational Leadership
Bass (1985) and Bass and Riggio (2012) described transformational leadership as a
process where leaders broaden and raise the interest of their employees.
Transformational leaders generate awareness and acceptance of the purpose and
mission of the group when they encourage their employees to focus on the benefits of
the group as whole beyond their self-interest. The four factors of transformational
leadership are idealised influence, inspirational motivation, intellectual stimulation
and individualised consideration.
Based on the interviews, all the respondents demonstrated that they had the
characteristics of transformational leaders. Each factor of transformational leadership
emerged from the interview data. These characteristics were evident through the
participants’ relationships with their employees and the ways they operated and
managed their organisations.

245
Eight respondents gave indications of possessing the idealised influence quality.
Some of them talked about how important it was for them to instil trust and gain
respect from their employees. They mentioned that when employees believe in the
company’s vision and trust their leader, they are willing to do more for the benefit of
the organisation. One of the indicative remarks was:
I must pass on the right attitude of work to all level of colleagues and
sales staff. Only when people feel that you are truly here to work, in
return they will give you their full-hearted support (RESP 1).
The second factor observed was inspirational motivation. Eight respondents seemed
to possess this leadership quality. By being able to communicate clearly on the things
that need to be done, they keep their employees motivated. The employees are then
willing to invest more effort in their tasks, they feel optimistic about the future and
believe in their abilities. One notable remark was:
In a setting like mine, we try to make sure that this is not really a job.
This is a career for them. When you work, you have to make sure that the
company sustain or even excel in its own business. They are responsible
to make sure that the company excel. They know that. So I believe that
these people in my setting right now are capable and they are willing to
spend more time to make sure that company excel (RESP 5).
Remarks by most of the other respondents also indicated that as inspirational
motivators, they tried to communicate high expectations to employees, to challenge
them to meet high standards and to provide meaning for the task at hand.
The third factor of transformational leadership is intellectual stimulation. Leaders are
seen to have this characteristic when they encourage intelligence, rationality and

246
careful problem solving (Bass 1990). Only three respondents mentioned practising
this leadership quality. The following is an example of how one of them
demonstrated this behaviour:
I also like to instil a critical thinking value amongst them. Even though
they come from the village and do not have much education, they are still
capable to solve a problem and make decision when I am not around. I
always encourage them to think what they should be doing if there is a
work-related problems that need to be solved (RESP 7).
Finally, transformational leaders also tend to provide personal attention and treat
each employee individually. Coaching, teaching and providing advice to employees
were some of the key themes that emerged from the interview data to represent this
characteristic. Five respondents practised this leadership quality. The following was
an indicative remarks by one of the respondents:
I will schedule myself to sit and discuss with the sales and marketing
team during the first week of the month. In the second week, I will
schedule myself to sit with the accounting staffs and the third week
usually I will focus on the operational site… I also coach them
personally, but most of the coaching involve with the sales team (RESP
6).
6.13.1.2 Transactional Leadership
According to Bass (1990), transactional leadership occurs when leaders explain what
is required from employees and what compensation the employees will receive when
they meet this expectation. Transactional leaders use reward and punishment to gain
compliance from their employees. They tend to accept the existing goals and
structure of their organisation and tend to be directive and action-oriented. The three

247
factors of transactional leadership are contingent reward, management-by-exception
(active) and management-by-exception (passive).
Besides displaying significant instances of transformational leadership, some of the
respondents also provided significant examples of transactional leadership
characteristics. One respondent (RESP 6) referred to maintaining a good work
system in his organisation when he said that ‘We try to document everything that we
do, so that it will be easier in the future’. Respondent 9 said, ‘Every morning, we
have our morning assembly at 8.30 a.m. During this assembly, I will highlight to
them what need to be accomplished because we are always involved with R&D’.
These comments show that some of the respondents focus on maintaining the status
quo in the organisation and tend to be directive and action-oriented, which are
attributes of transactional leaders.
The first factor of transactional leadership is contingent reward. The comments of
four respondents (RESPs 2, 3, 4 and 9) could be associated with this attribute. One
respondent mentioned, ‘I always appreciate and give due respect for the efforts
provided by my employees’ (RESP 3). Another respondent (RESP 2) said that not
only does he recognise the contributions made by his employees but he also always
rewards them accordingly.
The second factor of transactional leadership is management-by-exception (active).
Five respondents described how they like to closely monitor work progress and take
corrective action when standards are not met. Some of their comments are as follows:

248
When there is a customer complaint, what I will usually practise is that I
will call everybody especially those who are related with the complaint to
discuss on what is the immediate action that we as a team should be
doing in order to overcome and also solve the issue (RESP 6).
I try to closely monitor what is going on within my organisation and I
have to keep a close relationship with my employees (RESP 9).
Finally, two respondents (RESP 2 and RESP 3) described the practice of
management-by-exception (passive) in regard to their leadership behaviour. They
intervene only when procedures and standards are not met. Perhaps they think that by
waiting to see whether or not they should interfere when a problem arises, there
would be more opportunity for their employees to learn how to make decisions. One
of them said:
Sometimes I like to observe when they are dealing with problems or
issues. I will look at how they handle the situation. Even when they are
making the wrong decision, I let it be as long as it does not really affect
us significantly. If I see that they still can’t handle the situation, I will
interfere and show them what they did wrong and show them the right
way to handle the situation (RESP 3).
6.13.2 Entrepreneurial Orientation
During the interviews, all respondents were asked several questions relating to their
EO. Their responses provided a general picture and understanding of the level of EO
in their organisation. Basically, the same factors of EO were observed throughout the
interviews, namely, innovativeness, proactiveness and risk taking.
249
The first factor of EO is innovativeness. Remarks made by the respondents such as
‘introduce many new products’, ‘invest in R&D’ and ‘new ways of doing things’
were significant indications that there was innovativeness in their organisation.
Basically, all respondents indicated innovativeness during their interviews. Examples
of their remarks are:
I used to have only one main product, but now we have 36 products,
ranging from traditional medicine to energy drink, to cosmetic products
and now we start to introduce facial and hair products (RESP 3).
We do favour a strong emphasis on R&D (RESP 2).
The second factor of EO is proactiveness. Comments such as ‘the first to introduce
product/service’, ‘competitors respond to our actions’ and ‘ability of the firm to
anticipate and act on future wants and needs in the market’ were indicative remarks
made during the interviews. Six respondents (except RESPs 1, 5 and 9) mentioned in
some way that they are proactive in their organisational actions. Examples are:
As an entrepreneur, not only I have to be innovative, I have to anticipate
demand for this kind of product in the future and assess whether or not
we have the in-house expertise to produce it (RESP 7).
Right now I believe that we are still the market leader… I would say that
they [the competitors] normally respond to us rather than we respond
directly to them. I also believe that my vast experience in this line of
business, we are mostly the pioneers in this field in Malaysia (RESP 8).
As mentioned earlier, not everybody indicated proactive behaviour in making
strategic decisions. The following response is from the respondent who did not
250
promote proactive behaviour in his organisation. When asked about the competitive
environment in his industry, his response was:
Basically, the trend in the engine oil market is being set by this one
society which is known as American Petroleum Institute. They set the
trend in the open market. So when we want to market our product, we
have to make sure that our product is at par with what they are offering in
the market. If, in every three months they come up with a new product,
we have to come up with a new product as well to make sure that our
product is competitive in the market (RESP 5).
The final factor of EO being observed was risk taking. There were mixed outcomes
in regard to participants’ willingness to take the risk of investing a large amount of
capital in their businesses. Maybe due to limited capital and resources, most of the
respondents were quite selective about the type of risk they would venture for their
business. Only five respondents (RESPs 1, 3, 7, 8 and 9) mentioned a willingness to
take a high risk with a chance of a very high return. As one of the five put it:
Like I said earlier, I am not an engineer, therefore I need to identify our
strengths and focus on them. This line of business is dominated by
Chinese and men. It is a very big challenge for me to hold and stay in the
business. Because of these reasons as well, I have decided to take on
higher risks business like oil and gas, weaponry, aerospace and
automotive (RESP 9).
The rest of the respondents were only willing to take a moderate amount of risk that
might result in the return of their investment. Examples of their remarks are:
I am not willing to take a very high risk at the moment. I can say that we
are willing to take a moderate kind of risk, whereby we have really

251
explored those kinds of risks that are manageable and calculated risks
with calculated returns (RESP 4).
We have to be realistic since we do not have much fund to spend on
something that is really big. We cannot pump in more money if the
business is not successful. There is always a chance that if you are
making a business, your business will collapse. Therefore in regards to
risk taking, we always need to have awareness to the risks that we take
and we will only be taking and considering calculated and manageable
risks (RESP 6).
6.13.3 Organisational Performance
The final element being observed during the interviews was organisational
performance. Respondents were asked to describe their perception of their
organisation’s performance and to consider whether or not leadership behaviour and
entrepreneurial orientation would have any effect on organisational performance. The
respondents were also asked to identify factors other than those two that they felt
might also influence the performance of their organisation. The respondents were
keen and interested to provide information in regard to this theme since
organisational performance is an importance subject for all of them.
There were mixed responses regarding how the respondents perceived their
organisational performance. Some respondents (RESPs 2, 5 and 8) believed that their
organisation was performing much better than their competitors in respect to the
ability to control market share, provide consistent growth and earn a steady profit.
Others felt that there was room for improvement. They believed that it was important
to focus on the growth of the company because as the company grows, business will
become more profitable. One of these respondents said:

252
I am still not satisfied with our performance. My long-term target for this
company is to be able to get it out of the SME category. I want to become
large corporation. In order to get yourself out of the SME category, you
will need to generate RM25 million…. and we still have a long way to go
(RESP 6).
One respondent (RESP 9) expressed concern that the lack of support and trust from
financial institutions for the industry she is in has affected her company’s
performance.
6.13.4 Leadership Behaviour and Organisational Performance
Interview data revealed that almost all respondents (except RESP 1 and RESP 6)
agreed that their leadership behaviour has an effect on organisational performance.
They agreed that having the right kind of leadership behaviour, especially when
relating to their employees, would translate into better organisational performance.
Since they are categorised as small and medium enterprises, they acknowledged the
importance of a leader showing a strong vision for the organisation and being able to
provide supervision, guidance and direction to their employees. One of the indicative
remarks was:
To keep employees motivated, it is important to have the right leadership
style. In a way, by having the right leadership style, meaning that when
you are able to provide good directions, good plans to them, you know
how to motivate them and at the same time help to reduce their stress
level, then only my employees can really perform and improve the
organisational performance (RESP 4).

253
Having the opportunity to work directly with the leader of the organisation would
also provide an opportunity for success. Employees seem to be motivated to perform
at their best when their leaders are directly involved with their tasks. This can lead to
improved organisational outcomes.
My leadership style has an effect on my organisational performance.
When they work directly with the owner of the company rather than with
a manager (….because sometimes on a smaller project, I do have
managers that will handle the project), I could definitely see the
difference between the passion of my employees… I also would like to
say that when I involved with key employees, they will be directly
inspired by my management style and leadership and this would make
them more motivated….. I think that makes a difference in the outcomes
of the company (RESP 8).
A respondent who specifically disagreed that leadership behaviour has an effect on
organisational performance was Respondent 6. When asked whether or not his
leadership behaviour has any effect on his organisational performance, he said:
I personally do not think so. I personally think that in order for a business
to have a sustainable performance, the most important aspect for it to
have is a very strong foundation. From this strong foundation, you must
be able to build up a good system that runs throughout the organisation
(RESP 6).
Respondent 1, on the other hand, said that factors such as good management and
teamwork would contribute more to good organisational performance than leadership
would.

254
These data indicate that some of these leaders perceived that other factors contribute
to organisational success besides their leadership. Given the complexity of business
environments for some of them, factors such as a good management culture,
teamwork and a strong foundation emerged from the interview data.
6.13.5 Entrepreneurial Orientation and Organisational Performance
It was also anticipated that EO would affect the performance of SMEs. Based on the
interview data, almost all respondents (except for RESP 5) agreed that by becoming
entrepreneurially orientated, they perform much better. Most of them also understand
that in today’s competitive environment, consumers do not simply consume whatever
is available like they used to. Consumers expect more and anticipate better products
and services from time to time. Therefore, SMEs have to be proactive and
innovative in their product or service offerings and willing to take considerable risks.
The following was a revealing response from one of the respondents:
I do believe that my entrepreneurial orientation affects my organisational
performance. When we are more innovative, it shows that our services
are much superior to our competitors. This will also give you more
advantage with the customer whereby they will be keener to deal with
you. When you are innovative, proactive and able to keep your company
one step ahead of your competitors, your team’s motivation will be
better… For example, for the sales team who are being paid based on
their performance, they will have higher chances of making more money
and bring in more sales when they work with a company that always
move one step ahead from the competitors. Therefore, a good level of
entrepreneurial orientation helps to motivate the team and this means
better organisational performance (RESP 6).
255
The respondents who believed they possessed these three attributes also believed that
these attributes have positive effects on their entrepreneurial success. This is
demonstrated in the following quote:
Ninety per cent of my entrepreneurial orientation influences my
organisational performance. If we are being more innovative and
proactive and willing to take risks, there will be positive effects towards
our organisational performance… the more entrepreneurially orientated
you are, the better performance you are going to achieve (RESP 7).
However, one respondent (RESP 5) had a different view of the relationship between
EO and organisational performance. When asked whether his EO had any influence
on organisational performance, he said: ‘In our market segmentation, which is a
close-locked system, we only supply to the government side and the government is
only obliged to buy certain products from certain companies. Therefore, this will not
really affect my level of entrepreneurial orientation’.
His remarks indicated that when an organisation operates in a stable environment or
in a system where demand and supply are fixed and are therefore not important
economic factors that influence competition, being entrepreneurially orientated is not
important.
6.13.6 Leadership Behaviour and Entrepreneurial Orientation
As described in Section 6.10.3, to explain the mediating effect of EO on the
relationship between leadership behaviour and organisational performance, it is
important to establish that leadership behaviour also affects EO. Interview data
indicate that almost all respondents (except RESP 1) agreed that their leadership

256
behaviour has some influence on the level of EO in their organisation. Most of them
indicated that their leadership behaviour helps to foster the entrepreneurial spirit and
eventually enhances their organisation’s performance. Some of their quotes are:
I do believe that my leadership style does influence my entrepreneurial
orientation. Because, when we are making a particular decision, this
decision is a reflection from my direction or leadership. In terms of the
strategy that involved, the risk that we calculated for that particular
decision and the rest of other decisions that we have been making so far
is really depended upon the input that I have been given (RESP 4).
I really feel that the leadership behaviour that I practise helps to foster the
entrepreneurial level within my organisation. As an entrepreneur, we
always strive to find new things and as a leader in my organisation, I will
always share and lead them towards development of new ideas, new
methodology and technology that can help us to be more
entrepreneurially orientated… I also encourage them to come out with a
new idea once in every three months, let it be in the form of new product,
new technology or new method of doing thing that can be more profitable
or minimise our costs of doing business. They accept this as a challenge
(RESP 7).
However, Respondent 1 preferred to associate other factors such as organisational
strategy rather than his leadership with the influences on EO.
6.14 Other Findings from the Qualitative Data
Through the interviews, valuable additional data were gathered. These data were
important in providing a better understanding of the variables in this study. The data
also revealed some other factors that might affect leadership and EO, as well as other
factors that might affect organisational performance. This information was utilised
257
when a proposed new framework was developed on the entrepreneurial success of
SMEs in Malaysia.
6.14.1 Factors Affecting Leadership Behaviour
During the interview, the respondents were asked to describe the factors that might
influence their leadership behaviour. Since they were from different industries and
managed organisations of different sizes, it was interesting to see if there would be
similarities in the factors that influence their leadership behaviour.
Based on their responses, two distinctive factors emerged frequently from the
interview data. These factors are the experience of owners and top managers and the
organisational structure/culture. Five respondents mentioned that their organisational
structure and the culture in their organisation dictate their leadership behaviour. For
example, due to the limited number of full-time employees that they employ, most of
them practise an open-door policy. They prefer to be close to their employees and be
attentive to their needs and issues. By doing so, they can develop a sense of mutual
trust and respect which will later be translated into improve performance by the
employees. Remarks that support this behaviour are:
Based from the open communication that we are having as I mentioned
earlier, it gives me the opportunity to foresee in terms of the activities at
the operational level and also all activities within every single department
within my organisation. This would really affect the way that I motivate
them and the way I provide direction (RESP 5).
As business owner… you must always recognise the importance of
having a quality of life in all aspect. This is important and I always
remind my staffs about the importance of having this in their life as well.
258
You must have a good balance in your work as well as your family life. I
want my employee to achieve something in everyday work that they do,
but at the same time to give the same focus and attention towards their
family life. I think this could help them to get more satisfaction from
working here and also gives them more motivation to perform at their
very best. (RESP 6)
Secondly, four respondents mentioned that their past experience helped to shape the
way they lead their organisation. As two of them said:
My experience and learning from others [having a good mentor]
influence my leadership style. I don’t have a high level of education for
me to really learn about different type of leadership styles. Therefore, the
key point that I think would influence might leadership styles would be
from my mentors. I learn from others and also my experience of doing
things (RESP 4).
Life experience also is a platform for me to form a more effective
leadership style (RESP 3).
Other factors that emerged from the interview data were the level of maturity of
employees and education. Two respondents said that having to work with new
employees requires them to play a more directive and monitoring role. They have to
constantly monitor the work by new employees to minimise losses or mistakes. The
factor of education was mentioned in terms of having the opportunity to obtain an
overseas education, which had exposed them to the practices of the Western styles of
leadership and management.

259
6.14.2 Other Factors Affecting Entrepreneurial Orientation
Besides seeking confirmation of the assumption that leadership behaviour affects EO,
this study also identified other factors that could affect EO at the organisational level.
Previous research has suggested that factors such as strategy, competition and
environment might play a role in the cultivation of EO in an organisation (Rauch et
al. 2004). It was therefore interesting to see whether these factors would emerge from
the interview data and whether there would be new factors relevant to the context of
Malaysian SMEs. Based on the analysis of the interview data, two factors conformed
to the suggestions in the literature of competition and strategy. A new factor that
emerged from the data was the influence of employees on EO.
Five respondents (RESPs 3, 4, 5, 7 and 9) identified that competition might influence
their EO. As competition increases, the organisation is under more pressure to stay
ahead of the competitors. As two respondents said:
In my opinion, a healthy competition would really influence your
entrepreneurial orientation. We can feel that healthy competition always
forces us to keep up the pace and be one step ahead of our competitors.
(RESP 3).
I also think that the competition plays a role in influencing the level of
entrepreneurial orientation within my company… When competition
arises, what you need to do is to find out what is your niche that others do
not have and focus on this element. Competition will keep you on your
feet and will not make your complacent with what you are offering in the
market (RESP 7).

260
In addition to competition, another factor that emerged from the interviews was the
importance of strategy, which was mentioned by five respondents (RESPs 1, 2, 3, 5
and 8). Having the right strategy might influence how innovative and proactive you
are as well as your willingness to take risks. Two of the indicative remarks were:
I don’t wait and see what my competitors are offering, but usually I will
set the benchmark for them. I used to have one main product but now I
have adopted a diversification strategy within our company and we are
able to offer 36 different products. If you know what the competition is
offering and based from your research you are able to diversify and offer
better products to the customer, this can also change you level of
innovativeness and proactiveness in the industry (RESP 3).
I would say that in my line of business, the strategy that we take is the
most important factor that would influence my entrepreneurial attitude.
Right now we run about 10 different events. I would say that more than
five are something new than the last five years. I think a lot of
satisfaction comes up in building a new brand in a new show. I think it is
more of that rather than a competition (RESP 8).
Four out of the nine respondents (RESPs 3, 4, 6 and 7) gave due recognition to their
employees as a factor that would influence the EO of their organisation. The
contributions made by their employees helped to improve the level of EO. Having
skilled and experienced employees also assists the organisation to keep up the pace in
their operating environment. Comments included:
I think one of the most important factors for SMEs is the employees
because we are small in numbers. Let say that we have 10 employees in
our company, each one of them is actually representing 10% of your
company. Therefore, we need to get competent and trustworthy

261
employees. This factor could help to foster the entrepreneurial spirit
within our company (RESP 6).
If you can continuously improve and provide guidance to your
employees, they also can contribute to your level of entrepreneurship
(RESP 3).
6.14.3 Other Factors Affecting Organisational Performance
This section discusses some of the other factors affecting organisational performance
that emerged from the interview data. This information contributes to the
development of a proposed new framework in this study. Based on the interview
data, there were five factors other than leadership and EO that seemed relevant and
important. The responses are tabulated in Table 6.33.
Table 6.33: Other Factors Affecting Organisational Performance
Factors
Respondent
1 2 3 4 5 6 7 8 9
1. Employees/
Teamwork
x
x
x
x
x
x
x
x
x
2. Strategy x x x x x x x
3. Financial Resources x x x x
4. Quality of
Process/Product
x
x
x
5. Government Policy x
6.14.3.1 Employees and Teamwork
All respondents somehow mentioned the importance of having the right type of
employees or teamwork as a very significant factor for their organisational
performance. Due to the size of their organisations and the number of employees

262
they have, this factor would play a major role in achieving, maintaining, enhancing
and sustaining superior organisational performance. Some of the quotes were:
Also, having the right people in the company is important. You have to
get the right person to run things. It is very obvious that, if you do not get
the right people, the work will not be completed (RESP 5).
Our employees also are another important element towards better
performance. If I do not have their support, it will be very difficult for
me. If I do not have competent employees that I can trust, I will have to
stay and monitor them all the time and I will not be able to go out and see
people. But now, I have confidence in them and I can leave the company
to them without my supervision (RESP 7).
6.14.3.2 Strategy
The second new factor affecting organisational performance was mentioned by seven
of the respondents (RESPs 1, 2, 3, 5, 6, 7 and 8). It is having an effective
organisational strategy. Strategies for the activities of diversification, customer
orientation, price orientation and publicity were all mentioned as affecting
organisational performance. Two respondents said:
Our product is highly competitive in the market. We have changed from
price strategy to quality and image strategy… Our sales are in double
digit growth from 2007 to 2011 except in 2009 which recorded only 8%
growth… We managed to create new item, new sales area and new sales
staff and employed the correct strategy for the right product. Marketeer
responded to us that from market survey, we are the hottest and the most
expose brand in the industry and of course the most sellable in the market
(RESP 1).
263
Always makes your customer happy. Their satisfaction comes first and
monetary will follow through. Happy customers will promote your
product or services or even engage the company back on another project
(RESP 2).
To support the point he was making, this respondent also said:
We developed the systems and installed and operated for six months
without any offer letter or payment from the customer. We try to portray
our willingness of doing things differently, with customer orientation as
our priority. We suffered badly at first, but at the end, they started to offer
us contract and from that moment, we keep on receiving jobs from them
(RESP 2).
6.14.3.3 Financial Resources
The third new factor that emerged from the interview data was having sufficient
financial resources. Having sufficient finance definitely helps owners and top
managers to make a decision on whether to invest, expand or take on bigger projects.
All of these would definitely have an impact on organisational performance. In
regard to this factor, one respondent said:
When we talk about small companies in Malaysia, getting loans or grants
from the government side or the private sector is very difficult. So we
have to rely on our own sources of money in order for us to sustain in the
market. Having said that, we can’t go big instantly. Even though we have
orders coming-in in big quantity, we won’t go for that (RESP 5).
6.14.3.4 Quality of Product or Process
The fourth new factor that was identified from the interview data related to the
quality of the product or process in the organisation. Some of the respondents

264
commented that the good quality of either their products or their organisational
processes enhances their organisation’s performance. Some of their remarks were:
In my organisation, we try to be matured and delicately handle our
business risks and always stress on the quality in order to improve high
performance (RESP 3).
People implement so many systems like the ISO and 5S by the Japanese
and there are so many systems implemented in certain companies. These
are very good system to be followed…. So our approach in our market is
through the quality, the implementation of the quality system. They can
actually see the quality in our product. In fact Sirim or even Petronas
come to our company to have product testing (RESP 5).
6.14.3.5 Government Policy
The final new factor that was identified from the interview data was the role of the
government or government policy. Even though only one respondent (RESP 6)
mentioned this, it seems relevant to consider this factor, especially within the context
of Malaysian SMEs. Some of the main business for these SMEs came from the
government. The procurement system and rotation methods used by government
agencies in awarding contracts seem to discourage the ability of some of SMEs to
generate more income. As this respondent put it:
I deal a lot with the government and also GLCs and I don’t agree with
few of the rotation methods that they implemented in awarding contracts.
It means that if you get the contract this time, there is a huge possibility
that you will not be getting any during the next round. If the government
keeps on using this rotation concept, this whole process will become a
welfare services to the suppliers because the intention is to make sure that
everybody will get a piece of the cake. This type of policy will deter
265
people to put effort in innovation and this will have an effect towards
your organisational performance… our government also awarded a lot of
contracts through direct negotiations and central contract and a lot of
these go to those less competent companies in this field of business… If
there is no such thing as direct negotiations and central contracts
practised by the government, I believe I could double or maybe triple the
sales of my company.
6.15 Summary
Part A of this chapter explained and discussed the findings from the quantitative
data, the main data collected. The early sections of that part presented the response
rate, data cleaning procedures, evaluation of each construct, the reliability and
validity of the data and the descriptive statistics. This was followed by the initial
analysis of the full model and theoretical constructs. Then the results from the EFA,
CFA and path analyses were presented. Three models were developed to test the
hypotheses in this study. It was concluded that the measurement scales used in this
study were reliable and valid for testing the hypotheses.
Of the ten hypotheses that had been developed, seven were fully supported, two were
partially supported and one was rejected. In regard to the direct relationship between
the two types of leadership behaviour and organisational performance, the results
showed that transformational leadership has a positive and significant relationship to
both factors of organisational performance, whereas transactional leadership has a
positive significant relationship only to growth. The relationship between
transactional leadership and profitability is positive but not significant. The
relationship between transformational leadership and organisational performance was
266
found to be higher and stronger than the relationship between transactional leadership
and organisational performance.
Through examination of the direct relationship between each factor of EO and
organisational performance, it was found that innovativeness and proactiveness have
a positive and significant relationship to both measures of organisational
performance. Risk taking has a positive and significant relationship only to growth
and its relationship to profitability is not significant.
Examining the mediating effect of EO, it was found that EO fully mediates the
relationship between transformational leadership and growth and profitability. EO
was also found to fully mediate the relationship between transactional leadership and
growth. However, the results did not support a full mediating effect of EO on the
relationship between transactional leadership and profitability. It can only be
concluded that EO has an indirect effect on the relationship between transactional
leadership and profitability.
Part B of this chapter presented and discussed findings from the qualitative data
collected in interviews. The interview data were organised according to the themes
that were developed based on variables and observed relationships in this study. The
qualitative findings have definitely added value to the qualitative findings. They are
also useful in the development of the proposed new framework for future research. In
the next chapter, this thesis discusses both sets of findings in relation to the research
questions and research objectives of this study.

267
CHAPTER 7
DISCUSSION
7.1 Introduction
The main objective of this chapter is to discuss the findings presented in Chapter 6 in
relation to the research questions and hypotheses developed for this study. The first
section of this chapter provides a key descriptive summary of this study. This
includes a discussion on several demographic results that are palpably suitable for
further elaboration. It also includes the significant results of the t-tests conducted on
the main variables of this study against the size of enterprises, the type of industry,
and the gender and position of the respondents. The second section provides
justification for the removal of the factor of individualised consideration from the
transformational leadership construct. The final section discusses the findings from
the quantitative and qualitative data according to the main themes of this study by
relating them to the relevant literature on the relationships between leadership
behaviour, EO and organisational performance.
7.2 Discussion of Key Demographic Results
Several demographic characteristics are worth further elaboration in this study. They
are discussed in the following sections.
7.2.1 Race of Respondents
The demographic results as presented in Table 6.4 show that the majority of the
respondents in this study were Malays, followed by Chinese and Indians. However,
the proportion of Malay compared to Chinese respondents does not match the

268
percentage of business equity in the country, the majority of which is owned by the
Chinese at 42.4% compared to Bumiputera at only 19.4% ownership (Economic
Planning Unit 2008).
There are several possible explanations for there being mostly Malay respondents in
this study. It might be attributed to the sources of data collection. Besides using an
online survey to collect data, this study also relied on self-administered
questionnaires distributed through several agencies that conduct training and
development programs for entrepreneurs. One of these agencies, Majlis Amanah
Rakyat (MARA), organises programs only for Bumiputera since it was established to
support them in the fields of entrepreneurship, education and investment. Therefore,
data collected through this agency were mostly from Malays or some indigenous
people.
Secondly, by not being present when the training and development programs were
conducted by those agencies, the researcher was unable to personally encourage
more direct participation from non-Malays. Groves et al. (1992) suggested that the
experience of researchers tends to affect the levels of cooperation from participants.
Perhaps, by being there during the programs, the researcher would have been able to
approach more non-Malays to participate in this study.
Cultural biases perhaps also influence the lack of participation from non-Malay
entrepreneurs in this survey. Cialdini (1988) and Groves et al. (1992) proposed that
several factors might influence a respondent’s decision to participate. One of them is
‘liking’. Factors that enhance liking might include a similarity of attitude (Byrne

269
1971) and a similarity of background (Stotland & Patchen 1961). They concluded
that a researcher who possesses one or both of these features in a survey request
situation would be able to influence potential respondents and obtain more willing
compliance from them. In addition, several socio-demographic characteristics of the
researcher, such as race, age and gender, are believed to affect a respondent’s
perception of the intent of the researcher (Groves Cialdini & Couper 1992).
Thissuggestsing that the researcher being a Malay would attract participation from
Malay respondents. Consequently, having a Malay background may hinder
participation by non-Malays. As suggested by Ryen (2003), the cultural biases of the
researcher as a Malay may engender distrust in non-Malays and suspicions about the
intentions of the survey. This argument was supported by the experience of the
researcher while conducting follow-up telephone calls to increase the number of
participants in the online survey. Most of the non-Malay potential respondents who
were contacted refused to participate in the survey.
Even though Malays were over-represented in this study, a recent study by Yahya et
al. (2011) based on 186 small and medium enterprises in the services sector
concluded that both Bumiputera and non-Bumiputera are indifferent to the
management skills that affect their entrepreneurial success. Interestingly, there were
more Chinese respondents (n = 103) than Malay respondents (n = 56) in their study.
The key results from their study showed no significant different at all between
Malays and non-Malays in the t-tests conducted on 24 variables. Some of the
variables included in their study were clear goods and objective-setting skills, the
ability to act quickly (responsiveness), management expertise and readiness to
delegate responsibility to employees when necessary. Their study indicated that the

270
factors associated with the organisational success of SMEs in Malaysia are viewed
similarly by entrepreneurs regardless of their race. Due to Chinese and Malays
having similar perceptions of many organisational factors such as leadership and
entrepreneurial skills, the over-representation of Malays might not influence the
generalisation of the outcomes of this study.
7.2.2 Categories of Enterprises
The second key characteristic is the category of an enterprise. As shown in Table 6.4,
more small enterprises (69%) than medium-sized enterprises (31%) participated in
this study. Small and medium-sized enterprises are differentiated according to the
number of employees and sales turnover. The significantly larger number of small
enterprises is consistent with the actual distribution of small and medium enterprises
in Malaysia, where there are more small enterprises than medium-sized enterprises.
Small enterprises are regarded as the main contributors to economic growth in the
country (Jamil & Mohamed 2011).
Research in regard to the size of enterprises and organisational performance has
presented mixed outcomes. Moini (1995) and McMahon (2001) suggested that the
size of an enterprise is significantly linked to organisational performance when their
empirical results found that large companies perform better than small ones. Using
data drawn from 102 Wisconsin exporters, Moini (1995) identified that firm
characteristics such as size are important determinants for export success.
However, Calof (1993) did not find any significant relationship between firm size
and firm performance. He concluded that firm size is not a success factor for
271
internationalisation. In fact, small firms are just as capable as their larger
counterparts of entering the same market. His findings were supported by a more
recent empirical study by Ha-Brookshire (2009), which concluded that there is no
statistically significance effect of firm size on the relationship between firm
entrepreneurship and SMEs’ contribution and profitability outcomes. These
arguments suggest that the relationship between the firm and its contribution and
profitability is not influenced by the size of the firm.
7.2.3 Gender
The results of this study revealed that more male (62.5%) than female (37.5%)
respondents participated in this study. Based on the census conducted in 2005, only
about 16% (close to 83,000) of SMEs in Malaysia are owned by women (Ministry of
International Trade and Industry [MITI] 2009). This low number of women
entrepreneurs indicates that SMEs in Malaysia is a male-dominated industry. Perhaps
there might be more female managers than female owners and thus this would have
contributed to the higher percentage of women leaders in this study.
The higher percentage of female respondents in the survey could be due to the
sampling unit used in this study. Besides having firm owners as the sampling unit,
the rest of the respondents were the top managers of SMEs. Perhaps more women
than men hold these senior managerial positions. Thus, the sampling approach
resulted in a higher percentage of women respondents than the actual percentage of
women entrepreneurs in the country.

272
7.2.4 T-test Results
To further enhance the demographic results obtained in this study, t-test analyses
were conducted on the main variables – both forms of leadership behaviour, EO and
organisational performance – against the size of enterprises, the type of industry, and
the gender and position of respondents.
7.2.4.1 Size of Enterprise
As shown in Table 6.8, there were small significant differences between small and
medium-sized enterprises in regard to the transformational leadership and
organisational performance measures. These results indicated that, on average,
owners or top managers of medium-sized enterprises display transformational
leadership behaviour to a greater extent than their counterparts in small enterprises
do. On average also, medium-sized enterprises achieve better performance than small
enterprises.
Respondents from medium-sized enterprises seem to display transformational
leadership more frequently than those who operate small enterprises. This outcome
confirmed the view of House et al. (1991), who argued that leaders are more
important than ever in an age of complexity, change, large enterprises and nation
states. Perhaps the attributes of transformational leadership become more important
for leaders as the company becomes bigger. It is understood that medium-sized
enterprises are associated with the two core factors of more full-time employees and
higher sales turnover than small enterprises. To pool and align these resources, the
importance of inspirational motivation, idealised influence, intellectual stimulation
and individualised consideration becomes more apparent. At the very least, when the

273
number of employees increases, leaders need to be inspirational and attentive to the
different needs of the employees.
In regard to organisational performance, Peteraf (1993) proposed that different
resources used by firms in the production process produce different outcomes. As
some resources are superior to others, there will be efficiency differences between
resources. Therefore, firms with more resources are able to produce more cost
effectively and achieve better outcomes. His views provided support for the
significant difference that was found between small and medium enterprises in regard
to their organisational performance. Due to medium-sized enterprises having larger
resources of manpower and capital, they have more capability than small enterprises
to produce a better performance in terms of profitability and growth.
7.2.4.2 Type of Industry
Based on the results presented in Table 6.9, statistically significant differences were
found in the mean scores for each form of leadership behaviour, EO and
proactiveness.
The results indicated that, on average, leaders in the service industry more frequently
display both transformational and transactional leadership behaviour than leaders in
the manufacturing industry do. This may perhaps be due to the service industry
relying more on a people-oriented business and therefore the leaders need to exercise
transformational and transactional leadership to a greater extent than leaders in the
manufacturing industry.
274
The service environment is considered to involve more complex and more
interpersonal relationships than the manufacturing environment (Gilmore et al.
2006). Babaita et al. (2010) suggested that the leaders in the service environment are
expected to be close to their employees and they must endorse affirmation in their
organisation. Perhaps due to the nature of this industry, which focuses on providing
services to customers and thus deals a lot with people, organisations in the service
industry tend to rely heavily on the performance and effectiveness of the people in
their organisation. Therefore, leaders in this sector of the economy perceive
themselves as having more significant leadership behaviour that equates with
transformational and transactional leadership than their counterparts in the
manufacturing industry.
The effect size of the mean scores for transformational leadership was found to be
higher than the effect size for transactional leadership in the service industry. Past
researchers have argued that the attributes of transformational leadership relate
directly to service quality (Parasuraman et al. 1988) and help employees to become
more creative and innovative and to create new ideas that allow the service
organisation to grow competitively and adapt to the changing business environment
(Bushra et al. 2011). These characteristics are also compatible with human services
values and principles, especially those of appreciating and empowering individuals
(Packard 2009), which are closely aligned with the attributes of transformational
leadership.
The results indicated that there is a significant difference in EO between the service
and manufacturing industries, with a small effect size reported at η2= 0.013. This

275
means that, on average, leaders of SMEs in the service industry show slightly more
concern for EO than their counterparts in the manufacturing industry do. Even
though it might be assumed that the factors of EO might be more relevant to those in
the manufacturing industry than in the service industry, Sirilli and Evangelista (1998)
argued that the value of EO is as important to those in the service industry as it is to
those in the manufacturing industry since the most important objectives of a firm are
to improve the quality of products or services, increase market share and minimise
production costs. They added that in modern economies, the service industry is the
main element of structural change and there has been a progressive shift of
employment from the agricultural sector to manufacturing and then from
manufacturing to services. The results of this study provide evidence that SMEs in
the service industry consider themselves to be slightly more innovative, proactive
and willing to take risks than their counterparts in the manufacturing industry.
At the factor level, only proactiveness reported a statistically significant difference in
the mean scores between the manufacturing and service industries. This means that
leaders in the services industry tend to be more proactive than leaders in the
manufacturing industry. This result is reasoned to be acceptable since services
industry is characterised by perishable, heterogeneous and intangible products which
are provided to either individuals or businesses to satisfy their needs (Sampson &
Froehle 2006). Therefore, it seems that the perception of leaders in the services
industry that they are quickly responsive, able to anticipate future needs and wants,
and strive to be pioneers in their respective fields aligns with the nature of the
industry.
276
7.2.4.3 Gender
Referring to Table 6.10, no statistically significant difference was found in the
leadership behaviour of male and female leaders of SMEs. The researcher then
analysed the data to find whether there was any statistically significant difference at
the factor level for each form of leadership behaviour. In the four attributes of
transformational leadership, no statistical significance was found between male and
female leaders. However, in the three attributes of transactional leadership,
contingent reward was found to have a statistically significant different in the mean
scores between male and female leaders, with a very small effect size.
The results displayed in Table 6.10 indicate that there is no significant difference in
the mean scores of EO and organisational performance between male and female
leaders. But at the factor level of EO, proactiveness has a significant difference in the
mean scores between male and female leaders. This means that male leaders rated
themselves as more proactive than female leaders did.
The literature review produced mixed results regarding gender and leadership. Some
studies have indicated that women leaders adopt a different leadership behaviour
from men (Eagly & Carli 2003; Kim & Shim 2003; Grant 1988). This is an area that
is highly contestable in this study. At one end, arguments have been made that
female leaders are transformational, considerative, participative and people-oriented,
whereas male leaders are associated with transactional, structural, autocratic and
business-oriented leadership behaviour (Appelbaum et al. 2003). Another study by
Druskat (1994) also found that female leaders are rated to possess significantly
higher transformational qualities than male leaders, and male leaders are rated to

277
display significantly more transactional behaviour than female leaders. However, the
outcomes of Druskat’s study might be attributed to the context of the study. This
study was conducted among 6359 subordinates in all-female and all-male religious
orders of the Roman Catholic Church in the US. It can be argued that in an all-female
context, where women hold power and control all resources, they might display more
transformational behaviour than male leaders do in an all-male context. Therefore,
the outcomes of Druskat’s study need to be treated with caution.
One study worth mention is a meta-analysis of 45 studies comparing male and female
managers. This study found that female leaders are more transformational
(significant on all factors except for one subscale, attributed of idealised influence)
and demonstrate more significant contingent reward behaviour than male leaders
(Eagly & Carli 2003). In contrast, male leaders are more likely than female leaders to
exhibit management-by-exception (a factor of transactional leadership) and laissez-
faire leadership.
Researchers have also suggested that female leaders might have a slight advantage in
performance over male leaders since they outscore men on all the components of
leadership that are associated with leadership efficacy and positive workplace
outcomes (Smith & Smits 1994; Eagly & Carli 2003). These studies suggested that
women may, in fact, be better suited than men to managerial roles.
The findings of this study seem to agree with the findings at the opposite end of the
spectrum of gender and leadership studies in which there is no difference in the self-
reported outcomes of men and women leaders, and therefore the findings seem to

278
disagree with the studies discussed above. The findings of this research suggested
that there is little or no difference in the outcomes produced by men and women
leaders and a range of outcomes from previous studies support this finding. For
example, Anderson et al. (2006) and Morgan (2004) specified that firms’ outcomes
have little to do with the gender of the leaders. In Germany, Kent et al. (2010)
conducted a study among 337 respondents who evaluated the frequency of
transformational leadership behaviour between their male and female leaders. The
outcomes indicated that male and female leaders behave in the same way as leaders.
Similar to the outcomes of this study, they reported that for each attribute of
transformational leadership, there was no difference between male and female
leaders’ behaviour.
Regarding EO, Bertoncelj and Kovac (2009) investigated whether there is any gender
difference in the EO of managers in Slovenia. Of the 183 Slovene top and middle
managers analysed, the results indicated that there are no gender differences in the
variables of capturing opportunities, taking risks and innovating. In regard to firm
performance, Watson’s (2003) summary of Australian research comparing the
performances of male- and female-controlled SMEs indicated that there is no
significant difference in the performances between genders. This stream of studies
has indicated that male and female leaders do not differ from one another when it
comes to promoting entrepreneurial orientation and that gender is not related to the
success of the organisation.
In the context of SMEs in Malaysia, this study found that male and female leaders
are perceived to act similarly. There is no difference between male and female

279
entrepreneurs in their leadership behaviour, in their level of promoting EO or in their
perception of organisational performance. Perhaps male and female leaders
expressed similar perceptions to the main variables in this study because women are
now in more top managerial positions. The mean scores for each of the attributes
were also found to be similar for men and women in this study.
7.2.4.4 Position
The results in Table 6.11 show that, except for organisational performance, statistical
significance was found in the mean scores between owners and top managers for
each form of leadership behaviour, EO and every factor of EO.
The results indicated that, on average, the owners of SMEs in Malaysia use
transformational leadership and transactional leadership to a greater extent than the
managers of SMEs. Judge et al. (2006) concurred that the relationship between
leadership and firm performance is stronger when the CEO is the firm owner rather
than the manager. This means that owners display much more significant leadership
behaviour in relation to the performance of their organisation than people appointed
to manage a company do. As owners always want to maximise their returns
(Czarnitzki & Kraft 2004), this significant difference may be due to the reason that,
as owners, they value their ownership and know that they have a lot at stake in the
survivability and sustainability of their enterprises. A recent study of 41 top
managers and 110 owners/founders of SME in the US by Langowitz and Allen
(2010) suggested that leaders who are also the founders of their firms are more
action-oriented by nature, with a heightened interest in looking for opportunities and
a greater willingness to take on problem solving. Therefore, in order to maximise

280
their profits, they tend to practise transformational and transactional leadership
behaviour to a greater extent than the top managers of such establishments.
When it comes to EO, this study found contradictory results to what was suggested
by Langowits and Allen (2010), who found no significance difference in overall EO
between founders and top managers of SMEs. The results of this study presented in
Table 6.11 show a significant mean difference between owners and top managers in
the EO they display.
Langowitz and Allen also made several important remarks relevant to the results of
this study. First, even though they found no significant difference between founders
and top managers in overall EO, their results indicated that there is a significant
difference in the proactiveness factor of EO. Firms led by founders show a
significantly more aggressive response to competitors than those led by non-
founders. Second, they also reported that founders are more focused on product
innovation than non-founders are. The results from this study show somewhat strong
support for a difference between owners and top managers. However, they were
based on an assumption that the owners were also the founders of these SMEs. The
results indicate that, on average, owners exercise every factor of EO to a greater
extent than top managers of SMEs. The effect size is higher for proactiveness than
for innovativeness or risk taking. This indicates that owners of SMEs expect and try
to promote strong entrepreneurial attitudes in their firms to ensure better
organisational performance.

281
The results from Zahra’s (2005) study indicated that firms that are controlled by
active generations of the same family tend to have a high focus on innovation. This
shows that owners might have a stronger inclination than managers to nurture and
promote EO in the organisation. As suggested, owners always want to get the
maximum return on their investments (Czarnitzki & Kraft 2004), and they
understand that their position influences the level of EO in their companies. Owners
therefore tend to show that they are concerned about whether their firm is innovative
and proactive enough and they tend to take considerable risks to guarantee the
success of their organisation.
The next section discusses the results of the analysis of each of the main variables of
this study. The section that follows after that discusses the justifications for excluding
individualised consideration from this study.
7.3 Discussion of Main Variables
7.3.1 Leadership Behaviour
Based on the means distribution between the two types of leadership behaviour and
their respective attributes presented in Table 6.5 (see also Section 6.6.2),
transformational leadership has a higher mean (M=2.90) than transactional leadership
(M=2.33). These findings are similar to the findings of most of the previous studies
and confirm the propositions by Bass and Avolio (1995, 2004) and Bass et al. (2003)
that the mean for transformational leadership (M = 2.85) is higher than the mean for
transactional leadership (M = 2.27). Bass and Avolio’s (1995, 2004) study was based
on 27,285 respondents in the US. In a study of Taiwanese SMEs, data from 406
282
respondents also reported a higher mean for transformational leadership (M = 3.00)
than the mean for transactional leadership (M = 2.68) (Yang 2008).
The results of this study indicate that leaders of SMEs in Malaysia perceive
themselves as practising both transformational and transactional leadership, but
incline more to the practice of transformational leadership. This shows that the
leaders of SMEs in Malaysia see themselves more as transformational leaders than
transactional leaders. Leaders of SMEs in Malaysia seem to consider themselves to
be transformational when they deal with organisational problems or issues with
employees. They believe that, to lead an organisation, they do not necessarily have to
focus on finding employees’ mistakes or providing contingent rewards for good
performance and punishing poor performance. They see themselves more frequently
as focusing on developing the trust of employees to earn respect from them,
providing assistance in dealing with problems or issues, giving individual attention
and communicating high expectations. These are the attributes of transformational
leaders.
Several previous studies also reported that leaders usually rate themselves as
favouring transformational rather than transactional leadership, perhaps due to the
self-assessment (Muenjohn 2011, Church & Waclawski 1998; Carless et al. 1996).
The results of this study indicated that owners and top managers of SMEs in
Malaysia believe they display higher transformational leadership characteristics than
transactional leadership characteristics. One possible explanation for this is that
transformational leadership is regarded by the respondents to be more effective in
increasing followers’ satisfaction. It is also becoming the ideal leadership behaviour

283
regardless of country and culture (Muenjohn & Armstrong 2007). Therefore, leaders
of SMEs in Malaysia rate themselves as transformational leaders.
Results from the interview data supported this finding, as more transformational
themes were mentioned by the respondents during the interviews. The interview data
revealed that every attribute of transformational and transactional leadership was
reported throughout the interviews. More of the responses reflected transformational
leadership qualities than transactional leadership qualities (see Section 6.13.1).
At the factor level of transformational leadership, this study found something
different from what has been reported in Western countries. This study found that
inspirational motivation has the highest mean of the four transformational leadership
attributes at M = 3.13, followed by idealised influence, intellectual stimulation and
individualised consideration. This is quite an interesting finding of this study. Most
Western research (Tosi et al. 2004; Waldman et al. 2001) has found that idealised or
charismatic influence is considered to be the key element of transformational
leadership. But in the context of SMEs in Malaysia, inspirational motivation is
perceived to be the key attribute of transformational leadership. A similar finding
was reported in another non-Western context study in Iran by Jandaghi et al. (2009).
Based on data gathered from personnel in private manufacturing companies in Qom,
successful companies scored the highest mean for inspirational motivation, followed
by idealised influence, intellectual stimulation and individualised consideration.
This evidence of inspirational motivation having the highest mean of all the attributes
of transformational leadership suggests that leaders of SMEs in Malaysia believe that
284
steering the organisation to success, communicating high expectations to employees
and using the simplest way to convey purposes to employees are the most important
qualities of a leader. They believe that creating trust for mutual respect comes
second. They also believe that encouraging critical thinking by their employees is
more important than providing individual attention to employees. Perhaps it is due to
the size of their organisation (which in this study consisted of more small than
medium-sized organisations) that the attribute of inspirational motivation is
considered to be important for ensuring good organisational performance. Leaders
are expected to understand how to communicate high expectations and to show how
to achieve good outcomes. Several respondents admitted that because of having
employees with minimum or no qualifications, they need to be motivational leaders.
They believe that leaders who can to do this will motivate employees to perform
beyond what is normally expected from them.
On a different note, the low mean score of individualised consideration indicates that
leaders of SMEs in Malaysia need to practise more of this behaviour.
Transformational leadership is concerned with developing employees' capabilities
and capacities (Jandaghi et al. 2009). Therefore, paying close attention to the
different needs of individual employees and spending time in teaching and coaching
could develop the skills and capabilities of their employees to enhance organisational
performance.
Possibly, Malaysia being characterised as having a collectivist culture influences the
perception of leaders in Malaysia of the importance of providing individual attention.
A collectivist society, as described by Hofstede (1986), gives priority to group goals

285
over individual goals. In his book Culture’s Consequences, Hofstede said that a
collectivist society fosters strong relationships where every member of a group takes
responsibility for fellow members. Employer–employee relationships are perceived
in moral terms (like a family link), and employment and promotion take account of
the employee’s in-group (Hostede 2001). This is quite the opposite to the
individualist culture of Western countries. The people in an individualist society give
primary importance to their own interests and their immediate family.
Therefore, in the context of SMEs in Malaysia, leaders do not see the need to address
employees’ needs individually. They see their employees as being the entire team
and workforce in their organisation. Employee growth and development are
addressed in groups to ensure that the goals of the organisation are communicated to
all members of the organisation.
At the factor level of transactional leadership, contingent reward scored a higher
mean at M = 2.94 than the other transactional leadership attributes, management-by-
exception (active) at M = 2.78 and management-by-exception (passive) at M = 1.26.
These results show that in regard to transactional leadership, leaders of SMEs in
Malaysia perceive that providing rewards for good performance and punishment for
poor performance is an effective exchange process between leaders and followers.
They also reported that they intervene when procedures or standards are not met only
‘once in a while’. This shows that these leaders do not believe in intervening in what
has been assigned to their employees if it can be avoided, because interference can
cause employees to become unsettled and uncomfortable, which could affect their
whole performance.

286
This research has found that the owners and top managers of SMEs are prone to be
more transformational than transactional in their leadership behaviour. The results
from the interviews support this proposition. This means that the leaders of SMEs in
Malaysia perceive themselves as displaying the attributes of transformational
leadership more often than the attributes of transactional leadership. They also
believe they exercise transactional leadership behaviour but to a lesser extent than
they practice transformational leadership.
7.3.2 Entrepreneurial Orientation
Based on the results of the means distribution of EO and factors of EO presented in
Table 6.6, the higher the score, the greater the degree to which a firm is
entrepreneurially orientated (Covin & Slevin 1989). The respondents’ scores on total
EO (M = 2.60) indicated that owners and top managers of manufacturing and service
SMEs in Malaysia perceive themselves as being reasonably entrepreneurially
orientated. Almost all the respondents in this study agreed that, in general, EO is an
important element to be encouraged in their establishments. They seemed to agree
that the attributes of EO that consist of innovativeness, proactiveness and risk taking
should be nurtured and practised in their firms. The interview data also indicated that
those respondents acknowledge the importance of EO. They seemed to react
positively to promoting EO and the factors of EO. Their positive actions in regard to
EO were shown when everybody interviewed repeatedly mentioned behaviour
categorised as factors of EO.
At the factor level, innovativeness scored the highest mean score, followed by
proactiveness and risk taking (see Table 6.6). These results were similar to those

287
reported by Yang (2008) and Yoo (2001). Even though Yang (2008) used a different
scale (1 to 7) to compare the means of EO variables between low and high business
performance in his study, he also found that in both categories (low and high
business performance), innovativeness scored the highest mean, followed by
proactiveness and risk taking.
Owners and top managers of SMEs in Malaysia seem to understand the benefits and
advantages of becoming the market leader and producing and promoting new
products or services. This influences their perception of the greater importance of
innovativeness than the other factors. Innovativeness is also thought to be critical for
SMEs in Malaysia to remain competitive, and it is considered a key to sustain
organisational performance (Mahmod et al. 2013). Hilmi and Ramayah (2008) also
suggested that owners and managers of SMEs in Malaysia should focus on
developing and designing an organisational strategy that embraces innovative culture
to continuously evolve and be relevant to market needs.
These results indicate that of the three variables of EO, innovativeness is perceived to
be a more important factor for SMEs in Malaysia than proactiveness and risk taking.
This finding is similar to the results of a study on technology-based SMEs, where
innovativeness was recognised to be the most important factor when compared with
proactiveness and risk taking (Yoo 2001). The respondents in this study seemed to
agree that for their firm to be entrepreneurially orientated, it is important for them to
engage in innovative behaviour. They need to create new products and services and
get involved in experiments and R&D. Engaging in these activities distinguishes
them from their competitors. Interview data also revealed strong support for EO

288
behaviour, most frequently for innovative behaviour, followed by proactiveness and
risk taking.
7.3.3 Organisational Performance
The overall mean of organisational performance was M = 2.60. Of the two
organisational performance measures adopted in this study, growth scored a higher
mean than profitability (see Table 6.7). These results indicate that the owners and
top managers of SMEs in Malaysia perceive organisational growth as a more
desirable goal than the firm’s profitability. Perhaps due to the relatively small size of
their firms, the respondents view the most important organisational outcomes as
expanding their market share, stabilising their operation and improving the
economies of scale. They believe that profits will materialise once all of these are
achieved.
The importance of growth over profitability has been acknowledged by researchers in
the past (Wiklund 1999; Fitzsimmons et al. 2005; Davidsson et al. 2002). Wiklund
(1999) suggested that growth is the most important performance measure for small
firms and is superior to indicators of financial performance. Markman (2002)
indicated that the use of growth as a performance measure is generally based on the
belief that growth is a prerequisite to the attainment of sustainable competitive
advantage and profitability.
These findings also support the researcher’s argument that since more small firms
than middle-sized firms participated in this study, the owners and top managers of
small firms are more concerned with ensuring the survival of their firms than with
289
making a profit and maintaining the operational stability of their businesses. Owners
tend to be interested in long-term growth because they want their business to be
sustainable. Zahra (2005) seems to support this. In her study she mentioned that
owners/founders are mostly concerned about the sustainability of their business to
protect the legacy for future generations. Perhaps top managers are more interested in
short-term performance than owners are because that is what they are being paid for.
7.4 The Removal of Individualised Consideration
As presented in Chapter 6, due to items for individualised consideration of the
transformational leadership construct being cross-loaded into different factors, this
factor was removed from the final analysis. There are several possible reasons for
this factor being removed from this study and they are discussed further later in this
section. Even though this factor was removed from transformational leadership in the
final analysis, the factors that remain are deemed significant representatives of the
transformational leadership construct.
Several studies have included only one or a few transformational leadership factors
in their study. For example, Tosi et al. (2004) and Waldman et al. (2001) both used
only the charismatic attribute (idealised influence) to represent transformational
leadership. They argued that this factor is the key attribute of transformational
leadership.
Lee et al. (2011) conducted a study to examine the impact of transformational
leadership, team performance and service quality in retail banks. Of all the attributes
of transformational leadership, only intellectual stimulation was left in the final path
290
model, and it contributed a significant relationship to service quality. Elenkov (2002)
also used only three attributes of transformational leadership – idealised influence,
intellectual stimulation and individualised consideration – when he observed the
effects of leadership on organisational performance in 350 small Russian companies.
Similar to this study, the study of Ozaralli (2003), who studied the effects of
transformational leadership on empowerment and team effectiveness in Turkey, also
removed individualised consideration from his final analysis.
The first possible reason for this removal could be the influence of culture in the
Malaysian business environment. Possibly influenced by a collectivist culture, where
emphasis is placed on the group and gives priority to group goals (Triandis 2001;
Hofstede 1986, 2001), behaviour that focuses on providing individual attention does
not seem pertinent. The results of the mean distribution for the four factors of
transformational leadership support this argument, as individualised consideration
scored the lowest mean (see Table 6.5). This is consistent with the discussion in
Section 7.3.1, which concluded that, being embedded in a collectivist society, leaders
of SMEs in Malaysia tend to focus on group goals rather than individual goals. These
results indicate that Malaysia is still influenced by a strong collectivist culture even
40 years after the cultural studies initiated by Geert Hofstede.
Rosinski (2003) also argued that, in a collectivist culture, coaching and providing
individual attention are less important when employees may readily reach consensus.
This means that employees in a collectivist society may willingly focus on their
team’s accomplishments rather than on their own needs.

291
Bass (1996) stated that there might be some aspects of individualised consideration
or contingent reward which are explicit in the American culture but are implicit in
others. Even though the concepts of transactional and transformational leadership
travel across languages, countries and cultures, he proposed that the specific forms of
behaviour related to these forms of leadership behaviour may change to some extent,
especially when in non-Western cultures. As in this study, it is proposed to remove
individualised consideration from the transformational leadership construct.
Secondly, the majority of the sample in this study were leaders of small enterprises.
Thus, it can be argued that their main concern is focused on ensuring the
effectiveness and efficiency of organisational performance as a whole. Team synergy
and team spirit are more relevant than focusing on the development of individuals.
Thus, the respondents in this study perceive that individualised consideration is not
particularly significant.
Thirdly, by having more experienced employees, such as those who have been with
the organisation since its inception, less individual attention is needed. Experienced
employees understand their roles and the motivation and direction of the
organisation. A couple of the interview respondents also acknowledged that
individualised consideration is less important when they have experienced
employees. As one leader put it:
By having more experience employees, closer supervision is not needed
thus less time and attention is given to them (RESP 8).
292
Bass (1997) mentioned that transformational leadership is universal and should be
applicable across cultures. But he also argued that the specific behaviour related to
each leadership factor might vary to some extent, particularly from one country to
another. Thus the outcome of this study provides support for this proposition. The
removal of individualised consideration from this study suggests that
transformational leadership is influenced by culture and/or the business environment.
The other three transformational leadership factors remain significant representatives
of the transformational leadership construct, as they do in the other studies mentioned
above that used only one or a few factors of transformational leadership.
7.5 Discussion on Main Findings
7.5.1 Relationships between Leadership Behaviour and Organisational
Performance
The first final path model was developed to examine the relationship between the
leadership behaviour and the organisational performance of SMEs. To examine these
relationships, two research questions were addressed:
Research Question 1: To what extent do transformational and transactional
leadership have an impact on organisational performance?
Research Question 2: Does transformational leadership have a stronger effect on
organisational performance than transactional leadership does?
To provide answers to these first two research questions, three hypotheses were
proposed and tested. The first two hypotheses suggest that both transformational and

293
transactional leadership exert positive significant effects on organisational
performance and the third hypothesis suggests that the effects of these relationships
are stronger for transformational leadership than for transactional leadership. The
findings as presented in Figure 6.13 show that Hypothesis 1 is fully supported when
transformational leadership has significant relationships with both measures of
organisational performance. H2 is only partially supported when transactional
leadership has a significant relationship only to growth, and the path to profitability
is found to be insignificant.
Based on the results presented in the direct model of the relationship between
leadership behaviour and organisational performance (see Figure 6.13), it can be
concluded that the finding confirms the third proposed hypothesis that
transformational leadership has a stronger impact on organisational performance than
transactional leadership does, due to displaying higher path coefficients with growth
and profitability. Hence, the results show full support for H3.
The significant positive relationship reported between the transformational leadership
and organisational performance measures of this study are consistent with the results
of studies conducted by Matzler et al. (2008), Pedraja-Rejas et al. (2006), Yang
(2008) and Abdul Aziz et al. (2013). For example, drawing from a sample of 97
CEOs of innovative SMEs in Austria, Matzler et al. (2008) found that the
transformational leadership displayed by the leaders of SMEs has a significant direct
impact on innovation, growth and profitability. They argued that the effect of
transformational leadership displayed by the leader applies not only to staff in
product development but is spread and applied throughout the organisation.

294
Transformational leadership enables employees to identify and take advantage of
business opportunities for the firm. For instance, employees may be prepared to
develop more efficient work routines, which reduce costs, in turn increasing
profitability. At the same time, there might be business opportunities that are not
related to product innovations. Employees may benefit from these opportunities and
gain new customers in established markets, which in turn will increase sales.
The results from analysing the interview data also show support for this proposition.
One interviewed respondent said that instilling trust and confidence among
employees results in employees putting effort into improving their performances.
Investigating the relationship between transactional leadership and both measures of
organisational performance used in this study, Ensley et al. (2006) and Yang (2008)
found a significant relationship between transactional leadership and growth. Based
on 168 respondents from the 66 fastest growing private firms in the US, Ensley and
colleagues found that transactional leadership is significantly related to sales growth
and sales volume. They argued that transactional leadership assists coordination by
setting performance expectations and clarifying reward contingencies. Over time,
transactional behaviour can be used to leverage performance monitoring and send
signals that allow continuing coordination and adjustment of individual behaviour to
achieve better growth for the organisation.
The insignificant relationship between transactional leadership and profitability
found in this study is similar to the finding of a study conducted by Waldman et al.
(2001), who also found that transactional leadership is not significantly related to

295
profitability. Perhaps this maintenance form of leadership behaviour (Ensley et al.
2006) does not encourage the organisation to make a huge investment. As Bass
(1990a) said, transactional leaders are risk averse and they perform well in a stable
and predictable situation (Bass 1990a; Ensley et al. 2006). Therefore, the finding of a
partial relationship between transactional leadership and organisational performance
in this study indicates that transactional leadership does not significantly affect both
measures of organisational performance. It means that the leaders of SMEs in
Malaysia perceive that their transactional leadership behaviour is effective in
enhancing the growth of their organisation but does not affect their profitability.
One of the important findings of this study is that transformational leadership has a
stronger effect on organisational performance than transactional leadership does.
This outcome supports the findings of Lowe et al. (1996), Gardner and Stough (2002)
and Abdul Aziz et al. (2013) and it is consistent with other studies in Western
countries (Elenkov 2002; Howell & Avolio 1993; Bass 1997). Most importantly, this
outcome is consistent with Bass’s Full Range Leadership model (Bass & Avolio
1997, 2004; Bass 1996, 1999). All these studies concluded that transformational
leadership has a stronger correlation with the productivity and performance of a firm
than transactional leadership does and hence it is a more effective form of leadership
behaviour.
In Russia, Elenkov (2002) found that transformational leadership directly and
positively impacts on the organisational performance of Russian companies far
beyond the impact of transactional leadership. In Canada, Howell and Avolio (1993)
measured 78 senior managers’ leadership behaviour in a large Canadian financial

296
institution and concluded that leaders who display more attributes of transformational
leadership than transactional leadership positively contribute to the achievement of
business unit goals. Bass (1997) also suggested that transformational leaders are
more effective than leaders who practise transactional or laissez-faire leadership
behaviour, regardless of culture, organisation or country.
In the context of SMEs in Malaysia, similar results were reported recently by Abdul
Aziz et al. (2013) when they studied 375 SMEs in the services industry. They found
that both transformational and transactional leadership have significant effects on
business performance. They suggested that the stronger the behaviour of both forms
of leadership, the better the performance outcomes of the firm. Their results also
strongly suggested that transformational leadership is more effective than
transactional leadership and passive avoidant leadership.
However, recent studies by Obiwuru et al. (2011) and Rao (2012) have suggested the
opposite. Obiwuru and colleagues examined the effect of leadership behaviour on the
performance of small organisations in Nigeria. The models of OLS multiple
regression were employed, estimated and evaluated. Their results indicated that
performance is highly positively affected by transactional leadership behaviour and
insignificantly affected by transformational leadership behaviour. Therefore, they
concluded that transactional leadership behaviour is recommended for small
enterprises. Perhaps it is due to the different culture and economic development in
Nigeria that transactional leadership is considered to be more effective than
transformational leadership. On the other hand, Roa (2012) tested the relationship
between transformational and transactional leadership and business performance

297
among managers and entrepreneurs of micro, small and medium enterprises in India
and concluded that transactional leadership is more correlated to business
performance than transformational leadership is.
Contrary to what those researchers found, the results from this study indicate that
when leaders exert transformational leadership behaviour, they induce higher
performance in their firms than transactional leadership does. Leaders of SMEs in
Malaysia recognise that their ability to exercise the attributes of transformational
leadership can motivate employees and encourage higher performance outcomes.
Each attribute of transformational leadership is believed to engage employees and
encourage positive outcomes from them, and positively affect the growth and
profitability of the firm. Gillespie and Mann (2004) suggested that for a firm to gain
support from employees, which contributes to the success of the firm, leaders need to
encourage employees to grow and develop, to challenge them by setting high targets
for them, to show emotional support and provide direction, to recognise individual
needs and team requirements, and to develop employees’ skills and capabilities.
Even though Malaysia is categorised as a developing country and possesses a
different set of cultures from Western countries, entrepreneurs of SMEs in Malaysia
tend to display similar leadership behaviour when it comes to transformational and
transactional leadership. As discussed by Kennedy (2002) and Mansor and Kennedy
(2000) in regard to the GLOBE study by House et al. (1999), Malaysian ratings for
charismatic/transformational leadership are close to average when compared to 60
other countries. The findings of this study also confirm that transformational

298
leadership is a universally endorsed leadership behaviour, as suggested by Bass
(1997) and Den Hartog et al. (1999).
The study finding of a positive relationship between transformational leadership and
both measures of organisitional performance indicates the vast transformation that
the country has undergone since the mid-1980s. Factors such as the growth of the
knowledge economy, the transformation of the workforce, the adoption of emerging
democratic management ideas, a better education system, a vastly increased exposure
to information, joint ventures, the adoption of technology and the country’s focus on
a high level of industralisation and economic development have all been linked with
the adoption of many Western management theories and have led to the practice of
particular leadership behaviours among business leaders in the country (Abdul Rani
et al. 2008; Jayasingam & Cheng 2009; Abdul Rani 2006; Mansor & Kennedy 2000).
It seems that transactional leadership is unable to affect an organisation’s return on
investment. In today’s globalised competitive environment, an organisation needs to
act strategically and to formulate corporate strategies that transcend borders and earn
a worthwhile return on investment by outperforming the rivals (Baloch & Inam
2008). These authors argued that leaders who can respond to the new realities and
embrace change can take control of the future to realise its objectives. This strategic
thinking can enable an organisation to maximise its financial returns and also its
return on people. Therefore, leaders who focus on maintaining operational stability
(Ensley et al. 2006) or those who emphasise the end result and focus on work tasks
and outcomes, rewards and punishment (Mullins 2002) are not capable of affecting
the profitability of Malaysian SMEs. Many earlier findings also seemed to suggest

299
that a total dependence on this form of leadership may have undesirable effects on
performance and satisfaction (Bass 1985; Bryman 1992; Burns 1978).
However, this study still wants to acknowledge the importance of leaders providing
rewards and taking corrective actions, which are integral elements of transactional
leadership behaviour. It is suggested that employees may perform better when
leaders do not monitor their performance too closely and provide room for growth
and involvement. The creation of positive attitudes among employees through the
transactional leadership behaviour of leaders can result in better growth of the
employees and, hopefully, this will contribute to better profitability outcomes for
their organisation.
Therefore, in the context of SMEs in Malaysia, this study suggests that first, the
leaders of SMEs in Malaysia need to practise both forms of leadership behaviour. A
similar recommendation was made by Abdul Aziz et al. (2013). Ismail et al. (2010)
also promoted that the ability of leaders to display both transformational and
transactional leadership behaviour effectively can lead to an increase in positive
individual outcomes and trust in leaders which in turn produces better outcomes for
the organisation. Transformational leadership increases employees’ awareness of
collective interest and helps them to achieve their collective goals. In contrast,
transactional leadership promotes the individual interests of the leaders and their
followers and achieves the satisfaction of both on meeting contractual obligations by
establishing objectives and monitoring and controlling the results (Bass & Avolio
2000).

300
The interview data also supported this argument. The majority of respondents agreed
that their leadership behaviour has a significant influence on the performance of their
organisations. They agreed that having appropriate leadership behaviour, especially
towards employees, would result in better organisational performance. Since these
leaders are in enterprises categorised as small and medium-sized, they acknowledged
the importance of a leader to show a strong vision and the mission of the
organisation, to communicate high expectations, and to provide supervision,
guidance and direction to their employees.
Secondly, leaders are recommended to embrace, display and practise more
transformational leadership behaviour. Md Noor (2010) suggested that an
organisation must have a transformational leader to be able to respond strategically
and forge ahead for transformational change. He also proposed that to raise the
country of Malaysia to a great nation, conventional ways of leadership would not be
sufficient. Abdul Aziz et al. (2013) also suggested that transformational leadership is
the best predictor for SMEs’ business performance. Hence, leaders need to be
visionary enough to inspire greatness and bring about sustainable transformational
changes in their organisation. In steering the direction of the organisation in a
globalised competitive environment, transformational leadership is thought to be the
best form of leadership behaviour for producing excellent performance.

301
7.5.2 Relationship between Entrepreneurial Orientation and Organisational
Performance
The second final path model focused on the relationship between EO and
organisational performance. In order to address this relationship, the following
research questioned was proposed:
Research Question 3: To what extent does entrepreneurial orientation influence
organisational performance?
To answer the research question and taking into consideration that the three factors of
EO may vary independently (Krauss et al. 2005; Lumpkin & Dess 1996), three
hypotheses were posed and tested. This study has suggested that each factor of EO –
innovativeness, proactiveness and risk taking – has a positive effect on organisational
performance. The findings as indicated in Figure 6.14 showed that both
innovativeness and proactiveness have significant and positive relationships with
both measures of organisational performance. Thus, these results support H4 and H5
of this study. However, it was found that risk taking has a significant and positive
relationship only with growth and not with profitability, providing only partial
support for H6.
There were mixed outcomes in regard to the direct relationships between the factors
of EO and organisational performance. A recent study by Kraus et al. (2012) found
that of the three factors of EO, only proactiveness has a direct and significant impact
on SME business performance in the Netherlands. In 164 Dutch SMEs,
innovativeness and risk taking were not significantly associated with the business
performance measure. These two factors showed a direct significant relationship with

302
performance measure only when accounting for their interaction with the operating
environment.
Nevertheless, previous research has also suggested that a high level of innovativeness
and proactiveness improves organisational performance (Zahra & Bogner 2000;
Lumpkin & Dess, 2001; Awang et al. 2010). Innovativeness is regarded as a firm’s
readiness to be involved in creativity and experimentation through the introduction of
new products or services as well as technological leadership through R&D in new
processes (Rauch et al. 2009), and therefore innovativeness is regarded as critical to
the survival of a firm (Zahra 1996). She further argued that, to achieve superior
performance, the success of a firm depends on how well the firm pursues technology
strategies in developing a plan to utilise its technological resources (Zahra 1996).
Venkatraman (1989) posited that proactiveness is an important element of
entrepreneurship. This factor of EO represents a firm’s effort to be ahead of
competitors in selling new products or services or in using new technology. Proactive
firms are excellent at exploiting opportunities to meet the future needs of consumers
and in anticipating changes in demand and identifying emerging issues that might
lead to new venture possibilities (Dess & Lumpkin 2005). Proactivity thus enhances
organisational performance.
The risk-taking factor refers to the willingness of a firm to invest significant
resources in opportunities in the presence of uncertainty. Mixed outcomes were
produced in regard to the relationship between risk taking and organisational
performance. A study by John et al. (2008) based on firms from 39 countries found a
303
positive and significant relationship between risk taking and growth. Awang et al.
(2010a), on the other hand, found that risk taking is not related to the profitability of
the 125 agricultural-based SMEs they studied. Others have found that risk taking has
a U-shaped or curvilinear relationship with sales level and growth (Kreiser et al.
2002; Miller & Friesen 1982).
The results of this study indicate that factors of EO are important for organisational
success. This is consistent with the findings of several other studies (Zahra & Bogner
2000; Lumpkin & Dess 2001; Awang et al. 2010; Litov & Yueng 2008;
Venkatraman 1989; Kraus et al. 2012). Innovative SMEs in Malaysia which are
willing to be involved in the generation of new ideas and in experimentation to create
new products and services have an opportunity to become the market/industry leader
and ensure the success of the firm. Firms of this type have more chance of generating
high growth and profitability.
The significant relationships between innovativeness and measures of organisational
performance were also supported by the qualitative data in this study. Leaders of
SMEs in Malaysia acknowledged that innovativeness is an important factor for
organisational success. All the respondents quoted one and usually more of the
innovative themes during their interviews, such as ‘introduce many new products’,
‘invest in R&D’ and ‘new ways of doing things’. Few of the respondents mentioned
introducing new products and services or their involvement in R&D.
Second, the results also indicated that firms which seek to capitalise on every
opportunity and establish the first-mover advantage by anticipating and acting on
304
future needs and wants also have a high chance of success. This proactive behaviour
and pioneering action allows a firm to achieve a higher market share and exploit their
competitive advantage. As Kraus et al. (2005) indicated, proactiveness is a critical
behaviour of a firm. It is important not only for start-up organisations but for SMEs
in general. Organisations benefit by being proactive in their strategic decision
making regardless of their business. The ability of these entrepreneurs to anticipate
future needs and wants places them one step ahead of their competitors.
Data from the interviews on proactiveness supported the quantitative findings. Most
of the respondents said they are proactive in strategic action. The majority of them
said that when it comes to competition, their competitors respond to them, perhaps
due to the fact that they have extensive experience in their particular line of business.
Third, in regard to risk taking, the results indicate only a partial relationship to
organisational performance measures. Leaders of SMEs in Malaysia believe that their
risk-taking attitude has a significant effect on the growth of their firm but not on
profitability. These results suggest that entrepreneurs in Malaysia recognise risk
taking as an opportunity that is necessary for business sustainability. They perceive
that taking risks support innovative and proactive actions which would help to
expand their business. Without a willingness to take risk, it is unlikely a firm would
invest heavily in R&D and become a pioneer in the marketplace.
Interview data showed mixed outcomes regarding respondents’ views on their risk-
taking propensity. Most of them perceived themselves as risk takers, willing to

305
venture into unknown territory, taking on high-risk projects in the hope of expanding
their market share and obtaining more profit.
However, not all the respondents thought that taking more risks would provide more
profit. Some of them recognised that they do not have enough capital to take on big
projects that involve a huge amount of capital. They also acknowledged the
possibility that such projects might not turn out well and would be very costly for the
organisation. As one of them put it:
We have to be realistic since we do not have much fund to spend on
something that is really big. We cannot pump in more money if the
business is not successful… We always need to have awareness to the
risks that we take and will only be considering calculated and
manageable risks (RESP 6).
The insignificant relationship between risk taking and profitability is in line with an
earlier finding by Awang et al. (2010a). In this study, this result might be due to these
entrepreneurs recognising that the benefits of taking higher risks might take years to
be realised. Given the size of their firms and their limited amount of capital, they
perceive that taking risks would not guarantee an immediate profit to their
organisation. They just do not have the capital to invest in a high risk venture while
staying in business to wait for the profits of their investment to be realised. Zahra
(2005) contended that entrepreneurship centres on identifying and exploiting
opportunities by redeveloping existing and new resources in ways that create an
advantage. Going for these opportunities is risky because their duration and the
payoff from them are uncertain. Therefore, the leaders of SMEs tend to be very
calculative and limit themselves to manageable risks.

306
The findings in this study support the notions that the factors of EO vary
independently in their influence on organisational performance and that
entrepreneurs who are willing to exploit each of these factors have a high possibility
of success. SMEs in Malaysia need to be efficient and brave enough to nurture each
factor of EO in order to achieve success for their organisations in the environment of
globalisation, legislation, reduction of trade barriers and market expansion due to the
advances in technology and innovations (Smit & Watkins 2012). If they intend to go
beyond the local market and compete globally, they need to be entrepreneurially
orientated since EO contributes to the organisation’s ability to internationalise
(Knight & Cavusgil 2004).
A recent study by Fauzul et al. (2010) found that EO has a positive relationship to
firm performance among Sri Lankan SMEs. Tajeddini (2010) established the effect
between EO and business performance of the hotel industry in Switzerland. Tzokas et
al. (2001) recognised that EO increases the operational competencies of small-scale
manufacturing firms in Greece. In line with this stream of literature that supports the
effect of EO on SMEs’ performance (Tajeddini 2010; Fauzul et al. 2010; Tzokas et
al. 2001), this study concludes that EO is perceived to influence organisational
performance and is important for the success of SMEs in Malaysia. As one of the
respondents said:
If we are being more innovative and proactive, and willing to take risks,
there will be positive effects towards our organisational performance…
The more entrepreneurially orientated you are, the better performance
you are going to achieve (RESP 7).

307
7.5.3 Mediation Effect of Entrepreneurial Orientation on the Relationship
between Leadership and Organisational Performance
The final path model developed in this study examined the role of EO as a mediator
in the relationship between leadership behaviour and organisational performance. To
examine this relationship, the following research question was proposed:
Research Question 4: To what extent does entrepreneurial orientation mediate the
relationship between leadership behaviour and organisational performance?
Four hypotheses were posed and tested to answer this final research question. It was
hypothesised that EO would fully mediate the relationship between transformational
and transactional leadership and the growth and profitability of SMEs. To answer this
research question, suggestions made by Baron and Kenny (1986) in regard to the
mediation relationship were followed and two final path models were examined. The
first model was the final path of direct relationship between leadership behaviour and
organisational performance. The second model was the final path of the mediating
effect of EO on the relationship between leadership and organisational performance.
The results of these relationships are shown in Figures 6.13 and 6.15.
The first two hypotheses proposed in this model focus on the mediating role of EO in
the relationship between transformational leadership and growth (H7) and in the
relationship between transformational leadership and profitability (H8). Based on the
results as discussed in Section 6.10.3, EO fully mediates the relationship between
transformational leadership and growth (H7) and profitability (H8) of SMEs. Hence,
both hypotheses were fully supported. The results of this study indicated that, in a
direct relationship, transformational leadership positively influences organisational

308
growth and profitability performance. However, with the presence of EO, that direct
relationship becomes insignificant, which indicates that EO plays a full mediating
role that increases that positive relationship. In the mediation model, transformational
leadership is found to significantly affect EO, and EO to significantly affect growth
and profitability. Thus, these findings demonstrate that EO is not only an
independent strategic orientation but also an integral mechanism that leverages
transformational leadership on the organisational performance of SMEs.
The final two hypotheses proposed in this study focus on the role of EO as a
mediator in the relationship between transactional leadership and growth (H9) and in
the relationship between transactional leadership and profitability (H10). As
proposed by Baron and Kenny (1986), the first step in establishing the existence of
mediation is to show that the independent variable has a significant relationship with
the dependent variables (growth and profitability). The results presented in Figure
6.13 show that there is no significant relationship between transactional leadership
and profitability; therefore H10 is spontaneously rejected. This means that no
mediation occurs between transactional leadership and profitability. But the results
still find full support for H9. Based on the mediation model as presented in Section
6.10.3, it was found that transactional leadership has a significant relationship to EO,
and EO has a significant relationship to growth. Therefore, these results indicate that
EO fully mediates the relationship between transactional leadership and the growth
of SMEs (H9). In a direct model, transactional leadership positively influences
organisational growth. However, with the presence of EO, this direct relationship
becomes insignificant, which indicates a full mediation effect of EO on this
relationship. Thus it is demonstrated that EO is not only an independent strategic

309
orientation but also an integral mechanism that leverages transactional leadership on
the growth performance of SMEs.
Even though there is no mediation of EO in the relationship between transactional
leadership and profitability, the results presented in the final path model can still
conclude that EO has an indirect impact on the relationship between transactional
leadership and profitability. As discussed earlier, leaders who display transactional
leadership behaviour are perceived as not having a positive effect on profitability.
But the outcomes from this final path model indicate that transactional leaders can
affect profitability but only when they exercise EO behaviour. This means that
profitability can be improved by transactional leaders if they are also innovative,
proactive and willing to take risks.
To prove that mediation occurs, it is important to establish that the independent
variables representing both forms of leadership behaviour have significant
relationships with the mediating variable of EO. As required, significant positive
relationships were shown between both transformational and transactional leadership
and EO. The results upheld the relationship between these two concepts (leadership
behaviour and EO), and so it can be postulated that leadership behaviour enhances
EO.
The literature has also shown strong support for these relationships. For example,
Yang (2008) found significant relationships between transformational and
transactional leadership and EO among Taiwanese SMEs. Tarabishy et al. (2005)
suggested that the leader and their type of leadership style influence both their

310
subordinates and the organisation’s entrepreneurial strategic orientation. The results
of their study based on the CEOs and senior managers of companies in Washington
DC in the US showed that there is a significant relationship between a CEO’s
leadership style for both transformational and transactional types and their
organisation’s entrepreneurial strategic orientation represented by proactiveness,
innovation and risk taking. However, Eyal and Kark (2004) found a significant
relationship only between transformational leadership and EO. They reported no
significant relationship between transactional leadership and EO.
Another significant finding related to the relationship between leadership behaviour
and EO was that transformational leadership has a stronger impact on EO than
transactional leadership does. The path coefficient between transformational
leadership and EO was much stronger than the path coefficient between transactional
leadership and EO (see Figure 6.15). This outcome is in line with the views of Morris
et al. (2007), Yang (2008), Roomi and Harrison (2011) and Öncer (2013), who all
agreed that transformational leadership is a more appropriate form of leadership
behaviour and contributes the most to the entrepreneurial environment. Leaders in
entrepreneurial organisations demonstrate skills at nurturing the entrepreneurial
capabilities of employees, guarding innovative ideas that threaten the current
business model, making opportunities that benefit the organisation, questioning the
dominant logic in the industry, and linking entrepreneurship and business strategy
(Covin & Slevin 2002). Gupta et al. (2004) suggested that entrepreneurial leaders are
those who endorse the challenges of communicating a vision and influence others to
help them realise it. These qualities are more associated with transformational
leadership than with transactional leadership.

311
These results show that transformational leaders are perceived to have a more
significant effect on the implementation of EO than transactional leaders have.
Perhaps leaders with the attribute of intellectual stimulation challenge existing ways
of doing things and provide employees with new approaches to problem solving
(Eisnbeiss et al. 2008). This would encourage employees’ creativity and
experimentation (Podsakoff et al. 1990), which is integral to fostering EO in the
organisation. Inspirational leaders also challenge employees to reach high standards,
communicate optimism about future goals attainment, and provide meaning for the
task at hand (Judge & Piccolo 2004). The full potential of EO can be achieved only
when the workforce develops innovations that are ahead of the competition in terms
of quality and speed to market (Lumpkin & Dess 1996). To achieve this, an
organisation needs employees who strive for best-in-class outcomes in product
development and product modification (Gumusluoglu & Ilsev 2009). Therefore,
when leaders stress the importance of communicating and collaborating for high
expectations, this in turn improves communication between employees from various
departments in the organisation, which is necessary for the effective development of
EO. As Covin and Slevin (1991) suggested, a smooth conversion of EO into superior
performance requires input and activities from all functional groups in the
organisation. Finally, a leader with the attribute of idealised influence provides vision
and a sense of mission, instils pride, and generates respect and trust among
employees (Bass 1990a). Employees who feel that their leaders gauge their interest
and engage in entrepreneurial activities such as favouring innovations and being
proactive are likely to increase their trust in these processes. This also assists in an
effective development of EO in their organisation.
312
Another important element in proving that mediation occurs is that there must be a
positive significant relationship between the mediator (EO) and the dependent
variables (growth and profitability). The results as presented in Figure 6.15 meet this
condition. Similar results were also discussed in the literature. For example, based on
a sample of 166 firms in Northern China, Tang et al. (2007) reported that EO has a
positive influence on business performance. Zainol and Ayadurai (2011) suggested
that one of the most important factors for an organisation’s growth and profitability is
the development of EO, which is associated with organisational innovativeness, a
risk-taking propensity and being proactive. Based on a sample of 162 leaders of
SMEs in Malaysia, they found that EO has a significant positive effect on the
performance of organisations. In the US, Davis et al. (2010) explored the relationship
between the three entrepreneurial characteristics of 69 top managers and their
impacts on organisational performance. Their findings were consistent with a
significant amount of other research (Rauch et al. 2009), in which EO is positively
related to organisational performance. These investigators confirmed that top
managers with a high tolerance of risk, those who favour innovation and those who
possess a high level of proactiveness positively influence organisational
performance.
In another study, Gurbuz and Aykol (2009) investigated the impact of EO on firm
growth and endorsed that EO affects firm growth. Their study was based on data
gathered from 221 owners or managers of small Turkish enterprises. The relationship
between EO and profitability is also well established. Chow (2006) tested the
relationship between EO and firm performance in China and concluded that EO
affects profitability, especially for non-state firms.

313
All of these studies suggest that leadership behaviour affects EO and EO affects
organisational performance. These findings support the argument in this study that
EO could mediate the relationship between leadership and organisational
performance. Jung et al. (2008) also contended that leaders of an organisation have a
direct influence on organisational performance directly through their characteristics
and behaviour and indirectly through the strategic choices they make. This means
that leadership behaviour might have both direct and indirect impacts on
organisational performance. The indirect impact of leadership on organisational
performance might occur through the strategic orientation of the organisation. In line
with this view, EO can be seen as an organisation’s strategic choice that captures the
entrepreneurial aspects of decision-making styles, practices and methods (Wiklund &
Shepherd 2005) and can be the key to enhance organisational performance (Covin &
Slevin 1989; Lumpkin & Dess 1996).
Likewise, Morris et al. (2007) suggested that leadership affects the level of
entrepreneurship in a firm. Leadership is not only a reflection of a leader’s behaviour,
but is also a process that concentrates on activities that are important for a leader to
fulfil his or her responsibilities, which include motivating others to understand and
work towards common goals and shared values, and at the same time, fulfilling
collective and individual goals (Yukl 2010). Therefore, the implementation of EO
assists an organisation to translate and achieve these aspects of leadership in a better
performance of the organisation.
It appears that organisations benefit from the leadership behaviour of their leaders if
they also focus on developing EO in their organisation. The significant influence of

314
leadership behaviour on EO indicates that in examining the model of strategic
orientation and organisational performance, leadership is an important antecedent
that can improve the outcomes of the organisation. This argument is in line with that
of Covin and Slevin (1989), who suggested that internal variables (which in this
study refer to leadership behaviour) affect the EO of a firm. Tarabishy et al. (2005)
also proposed that leaders and their leadership behaviour influence both their
subordinates and their organisation’s entrepreneurial strategic orientation. The
integration between leadership and EO is perceived to provide a positive effect on
organisational performance.
This study also found that transformational leadership is perceived to have a stronger
impact on EO than transactional leadership has. Perhaps the attribute of
transformational leaders that questions the status quo and the usual ways of doing
things increases the likelihood of employees finding increasingly effective and
efficient ways of implementing EO (Engelen et al. 2012), thus improving the
relationship between transformational leadership and organisational performance.
This outcome is in line with the findings by Yang (2008), who suggested that
transformational leaders with high EO contribute to higher business performance.
This means that EO is more effective with transformational leadership
characteristics. Therefore, leaders who encourage the development of EO and display
transformational leadership characteristics could exploit their leadership behaviour to
significantly improve the performance of their organisation.
The results of this study are contrary to the findings that suggest there is no
significant relationship between transactional leadership and EO (Eyal & Kark 2004;
315
Morris et al. 2007). Morris et al. (2007) used data gathered from 145 CEOs from
NPOs and found that transactional leadership is not significantly related to EO.
Based on their result, it can be argued that leaders who exercise strict control and
emphasise managing workers or volunteers (in the context of their study) according
to strict rules and regulations will definitely be ineffective in fostering the
development of EO or even enhancing the performance of the organisation. The
significant relationship between transactional leadership and EO found in this study
is in line with the argument by Öncer (2013) that leaders need to engage in
entrepreneurial activities regardless of their leadership behaviour. Thus, the
transactional leadership behaviour practised by some leaders of SMEs in Malaysia
can still advantageously affect entrepreneurial activities in their organisations.
Therefore, it is suggested that leaders who focus on work tasks and outcomes,
rewards and punishment (Mullins 2002) and maintain a tight logistical control by
monitoring the performance of employees can still benefit from EO. This monitoring
behaviour of transactional leaders is the control of employees in an effort to make the
existing strategic processes more effective and to achieve a significant growth for the
organisation. Due to a shortage of resources and a limited amount of capital, leaders
of this type feel they need to be concerned about every decision made about
introducing new products, being the market leader and even the amount of risk they
should take. They feel they cannot allow any mistake that might jeopardise the
money they have invested to favour EO in their organisation.
To summarise, this study strongly advocates that EO is an important mediator
between leadership behaviour and organisational performance. The right integration
316
between leadership behaviour and EO is perceived to have a significant effect on the
growth and profitability of the organisation. The results of this study show that
leaders’ transformational and transactional leadership behaviour is positively related
to EO, and EO is positively related to growth and profitability. The findings from the
final path model extend the research in the field by suggesting that transformational
and transactional types of leadership behaviour are ‘latent’ constructs that influence
leaders’ EO. It is also suggested that by focusing on EO in their organisation, leaders
demonstrate their ability to develop their level of innovativeness, proactiveness and
risk-taking behaviour and hence influence growth and profitability. Therefore it is
proposed that SMEs in Malaysia could perform above their expectation by adopting
these forms of leadership and entrepreneurial behaviour.
Second, the mediation effect of EO between transformational leadership and
organisational performance was found to be stronger than the mediation effect of EO
between transactional leadership and organisational performance. Hence, it can be
concluded that leaders with transformational leadership that favour elements of EO
would have a strong positive effect on organisational performance.
Finally, leaders of SMEs in Malaysia should be encouraged to effectively foster the
elements of EO. They should be able to exploit their leadership behaviour in
effective performance when they favour innovativeness, being proactive and willing
to take risks. In moving Malaysia towards a developed country status, leaders of
SMEs must take the initiative to develop innovative ideas, creativity and
experimentation in their organisations. Instead of responding to competitors, they
must strive to stay clearly ahead of the competition and be bold enough to venture

317
into an unknown market. The ability of their organisation to exercise all elements of
EO would transform the behaviour of their leaders into significant performance. As
one of the interview respondent said:
One thing that I believe in business is not about what the product or
services, but who are the people behind it… Syed Mokhtar, Donald
Trump, Eric Chia are all men with steel heart. They fail a lot of times but
they managed to fight back. Business and entrepreneurship is for the
brave and bold. Only fighters will survive. It is about conquering our
mind, our fear and our rage. It is about channelling our negative energy
and our anger into stream of forces for conquering our enemies and
channelling our positive energies for making our customers, friends and
family happy… I walk the talk and my staffs have some sense of respect
on me… Thus, entrepreneurial attitudes rest on the person’s quality of
conquering oneself, and conquering negative habits and therefore can
create a wave of forces that can influence others, co-workers, families,
friends, customers and clients (RESP 2).
7.6 Summary
Several issues were discussed in this chapter. First, several notable demographic
characteristics and the results from the t-test analyses were discussed. It was
acknowledged that Malays and women are over-represented in this study. The most
significant effect size was detected when comparing the means of transformational
leadership and EO between the owners and top managers of SMEs in Malaysia.
Justifications were presented and discussed.
The second part of this chapter presented the descriptive results obtained on the main
variables of this study: both forms of leadership behaviour, EO and organisational

318
performance. For transformational leadership, inspirational motivation scored the
highest mean. For transactional leadership, contingent reward scored the highest
mean. For EO, innovativeness was regarded as the most important element and
growth was perceived as the most important performance indicator in the context of
SMEs in Malaysia.
The third part discussed reasons for the removal of individualised consideration from
the transformational leadership construct. The factors that remained were deemed
sufficient representatives of transformational leadership.
Finally, discussion centred on the main findings of this study. It was concluded that,
besides having a direct significant relationship to measures of organisational
performance, the relationships between transformational and transactional leadership
and organisational performance are also mediated by the presence of EO. Both the
direct relationship and the mediating relationship were found to be stronger for
transformational leadership than for transactional leadership. Therefore, leaders of
SMEs in Malaysia are encouraged to display transformational leadership qualities
and to focus on developing elements of EO to improve the performance of their
organisations. The following chapter discusses the conclusions, implications and
limitations of this study and recommendations for future research.

319
CHAPTER 8
CONCLUSIONS, IMPLICATIONS AND
FUTURE RESEARCH
8.1 Introduction
This is the final chapter of this thesis. After presented an introduction and the
background of the study, this thesis reviewed the literature on all the main variables.
Then a description of SMEs in Malaysia was presented. After that, this thesis
discussed the development of the theoretical framework and the choice of research
methodology. Next, analysis and findings were presented, followed by a discussion
of the findings. This final chapter consolidates the key findings of this study. Thus,
the objectives of this chapter are to summarise the conclusions from research
findings, to highlight possibly valuable theoretical, managerial and practical
implications of the study and to propose a new framework on entrepreneurial success
in the context of SMEs in Malaysia.
After a brief introduction in Section 8.1, Section 8.2 presents the conclusions drawn
from the research framework, research questions and methodological approach. This
section also deliberates on other significant findings of the study. Section 8.3
presents the contributions and implications of this research and Section 8.4 highlights
the limitations of the study. Section 8.5 proposes directions for future research and
Section 8.6 provides an overall summary to concludes this thesis.

320
8.2 Conclusions from Research Findings
8.2.1 Conclusions Based on Research Framework
Prior to the development of the research framework for this study, a comprehensive
review of potential theories and theoretical literature was carried out in Chapters 2
and 3. The research framework developed in this study was influenced by the
transformational leadership theory and the RBV. Based on these theories, the
framework suggests that leadership behaviour, namely, transformational and
transactional leadership, and EO are both important predictors for the performance of
SMEs. In addition, this framework explored the role of EO as a mediator in the
relationship between leadership behaviour and organisational performance.
Figure 8.1 displays the final research framework of this study.
Figure 8.1: Final Research Framework
H1, H3
Idealised
Influence
Transformational
Leadership Inspirational
Motivation
Intellectual
Stimulation
Contingent
Reward
MBE Active
MBE Passive
Transactional
Leadership
Entrepreneurial
Orientation Proactiveness
Innovativeness
Risk Taking
Organisational
Performance
Profitability
Growth
H2
H9, H10
H4, H5,
H6
H7, H8

321
Three stages of analysis were performed, based on the research framework. The first
stage was an empirical investigation of the effects of transformational and
transactional leadership on the organisational performance of SMEs. The second
stage was an empirical investigation of the effects of each factor of EO on
organisational performance. The third stage examined the extent of the effect of EO
as a mediator in the relationship between leadership behaviour and organisational
performance. The results from these analyses are summarised in the following
section.
Besides contributing empirical results on the hypotheses proposed, the most
significant contribution from the research framework relates to the transformational
leadership construct. Initially, this construct was represented by four first-order
constructs (see Figure 4.1). But through the analysis obtained from the EFA, one
first-order construct, individualised consideration, was removed from further analysis
due to low factor loadings and items loaded into different factors. The three
remaining first-order constructs were validated as multi-dimensional constructs and
the results from CFA produced acceptable goodness-of-fit statistics.
Thus, the final framework consists of the three second-order exogenous constructs of
transformational leadership, transactional leadership and EO, and the endogenous
construct of organisational performance. All these constructs were validated as multi-
dimensional and produced acceptable goodness-of-fit statistics. The detailed results
of these analyses were discussed in Chapter 6.
322
8.2.2 Conclusion from Research Questions
Four research questions were established at the beginning of this study. This section
summarises each of them.
Research Question 1: To what extent do transformational and transactional
leadership have an impact on organisational performance?
To answer Question 1, the study undertook an empirical examination of the impacts
of both forms of leadership behaviour on organisational performance measures. Two
hypotheses (H1 and H2) were proposed to answer this question. The results
generated from the findings (discussed in Chapter 6) indicate that transformational
leadership has a significant positive relationship with both measures of organisational
performance. The results showed that the practice of transformational leadership
behaviour by owners and top managers of SMEs in Malaysia has a positive effect on
growth and profitability. However, the results found support for only a partial
relationship between transactional leadership and organisational performance
measures when the path between transactional leadership and profitability was found
to be insignificant. This showed that transactional leadership has a positive effect on
growth but no significant effect on profitability. The conclusion is that leaders who
emphasise an exchange process between leaders and followers and who have a
maintenance form of leadership do not significantly affect their organisation’s return
on its investment.
Research Question 2: Does transformational leadership have a stronger effect on
organisational performance than transactional leadership does?

323
Question 2 generated another hypothesis (H3). Both the question and the hypothesis
were developed to examine the extent and the magnitude of the relationships between
both forms of leadership behaviour and organisational performance measures. This
question was posed due to inconsistent findings in the relevant literature about the
effects of these forms of leadership behaviour on organisational performance. The
applicability of the findings in studies in Western countries to organisations in
developing countries was also examined. The results from the hypothesis testing
showed support for and were consistent with the results of research in Western
countries (Bass et al. 2003). Leaders who display and practise the characteristics of
transformational leadership have a greater effect on organisational outcomes than
those who favour transactional leadership behaviour do.
Research Question 3: To what extent does entrepreneurial orientation influence
organisational performance?
Question 3 addresses the impacts of each factor of EO on the measures of
organisational performance. Three hypotheses (H4, H5 and H5) were developed and
tested to answer this question. The findings concluded that innovativeness and
proactiveness factors of EO are significantly and positively related to both measures
of organisational performance. Organisations that increase their level of
innovativeness and proactiveness increase their growth and profitability. On the other
hand, risk taking has a significant and positive relationship only to growth and not to
profitability. Leaders of SMEs acknowledged that taking risks would be likely to
expand their business and improve their market share to ensure that they could
sustain their businesses. They also recognised that this factor is an important element

324
in being innovative and proactive. But they also thought that taking more risks would
not guarantee additional profit. As Zahra (2005) discussed, exploiting opportunities
is risky because both their duration and the payoff from them are uncertain and many
risk-taking businesses fail. Therefore, the leaders of these SMEs understood that due
to their limited capital they could not undertake high-risk businesses because they
might run out of money to sustain business operation and there would be a possibility
that the business might fail. Interview data also showed strong support for these
outcomes and indicated that most of the respondents would consider taking
calculated risks only when the outputs seem certain.
Research Question 4: To what extent does entrepreneurial orientation mediate the
relationship between leadership behaviour and organisational performance?
Question 4 is the central question of this study, requiring an empirical examination of
the role of EO as mediator in the relationship between leadership behaviour and
organisational performance. Four hypotheses (H7, H8, H9 and H10) were presented
to answer this question. Two structural models were developed as reported in
Chapter 6 to indicate the direct model (Figure 6.13) and the mediating model (Figure
6.15) to allow for a demonstration of these hypotheses.
It was concluded that EO fully mediates the relationships between transformational
leadership and both measures of organisational performance. Transformational
leadership was found to significantly affect the level of EO practised in an
organisation. In turn, EO significantly affects growth and profitability. EO also fully
mediates the relationship between transactional leadership and growth. But no

325
mediation occurs between transactional leadership and profitability. An insignificant
relationship was found between these two in the direct model.
These results show that the degree of EO being practised, developed and nurtured in
an organisation is affected by leadership behaviour, particularly transformational
leadership. In turn, growth and profitability are affected by EO. The results indicate
that both forms of leadership behaviour have a positive effect on the entrepreneurial
strategy of a firm. At the same time, this entrepreneurial strategy has a positive effect
on performance. Thus, this study concludes that EO is a good mediator in leadership
and organisational performance and suggests that leaders need to focus on
transformational leadership and to develop an appropriate level of entrepreneurial
strategy to have a positive effect on organisational outcomes. The factors of
transformational leadership such as creating a clear vision and mission, inspiring and
guiding employees towards realising organisational goals and stimulating creative
thinking seem to be relevant to the entrepreneurial strategies of being innovative,
proactive and willing to take high risks. The right levels of all of these elements
would translate into better performance for the organisation. Table 8.1 summarises
the testing of hypotheses in this study.

326
Table 8.1: Summary of Hypotheses Testing
Hypotheses Results
H1: TF OP Fully supported
H2: TA OP Partially supported
H3: TF OP > TA OP Fully supported
H4: Innovativeness OP Fully supported
H5: Proactiveness OP Fully supported
H6: Risk taking OP Partially supported
H7: TF EO Growth Fully supported
H8: TF EO Profitability Fully supported
H9: TA EO Growth Fully supported
H10: TA EO Profitability Rejected
Notes: TF = transformational leadership; TA = transactional leadership;
OP = organisational performance; EO = entrepreneurial orientation.
8.2.3 Methodological Conclusion
Methodologically, the use of mixed method research has added value to the existing
literature, especially in the context of SMEs in Malaysia. This study might be the
first one to examine the issues of leadership behaviour and EO by using both
quantitative and qualitative data. The quantitative data, the main type of data in this
study, quantified and measured the extent of relationships between variables and
tested proposed hypotheses. The qualitative data was used to provide support,
contradiction or further elucidation of the quantitative findings. For both methods,
data were gathered from the manufacturing and service industries to provide some
generalisability to the population of SMEs in Malaysia. Previous studies in Malaysia

327
on leadership behaviour and EO have mainly been quantitative, focusing on
transformational leadership and/or with only a single-industry perspective (Abdullah
et al. 2012; Abdul Aziz et al. 2012; Lo et al. 2009).
Using the qualitative method not only strengthened the methodological approach of
this study but also provided several advantages to the findings. First, the qualitative
data confirmed the findings derived from the quantitative data. Second, they provided
a detailed and deeper understanding of the essence or meaning of a particular
phenomenon from the perspectives of the respondents, who had an opportunity to
explain their attitudes, behaviour and feelings related to a particular phenomenon
(Patton 2002). Third, in the semi-structured interviews, respondents were encouraged
to expand on their responses and this led to the discovery of new topics or themes
which had not initially been included in this study. For example, factors such as
competition and strategy emerged as factors that influence EO. Finally, these detailed
responses influenced the development of a new proposed framework of
entrepreneurial success in the context of SMEs in Malaysia.
8.2.4 Other Important Outcomes
Several other elements of this study need to be highlighted. The first one is the high
representation of female respondents compared to the actual percentage of women
entrepreneurs in Malaysia. Perhaps there are more female managers than female
owners and this has influenced this outcome. The high representation of female
respondents also indicates that female entrepreneurs want their opinions to be heard.
It is a strong indication that they acknowledge and understand their important roles
and that they contribute to the development of entrepreneurship in the country.
328
Further analysis to examine whether there is any significance different between
female and male leaders in their leadership behaviour, EO and organisational
performance showed no significant different between them. The governing body of
entrepreneurial development in the country should acknowledge this outcome and
monitor the development of women entrepreneurs in the country. They are a force
that will contribute a great deal to the performance of SMEs in the years to come.
Their active participation in the economy is increasing and therefore they should be
given the same amount of access and assistance financially and physically as men
receive.
Second, leaders who are the owners of SMEs rate themselves higher in both forms of
leadership behaviour and EO than top managers do. The difference in the mean
scores between these two was found to be significant. This indicates that owners
perceive that they have more responsibility than managers for ensuring the long-term
success of their organisation. An important reason for this disparity is that their
business means everything to the owners of small and medium-sized enterprises.
They have put everything they have into the business – their savings, experience and
passion. They cannot afford to lose their business and therefore they perceive that
they need to be both transformational and transactional in their leadership behaviour
and also to be concerned about the levels of innovation, proactivity and risk taking in
their business. Managers who are paid a salary are perhaps more concerned with the
short-term performance of the organisation.
While examining the mean scores of factors for both forms of leadership behaviour,
an interesting finding emerged when empirical data indicated that inspirational

329
motivation is the most important factor of transformational leadership rather than
idealised influence, as found in Western countries. Leaders of SMEs in Malaysia
acknowledged that for them to be effective transformational leaders, they need to
display more inspirational motivation than any of the other transformational
leadership factors of idealised influence, intellectual stimulation and individualised
consideration. Sidani (2007) described leaders with this quality as motivating
followers to commit to the vision of the organisation and encouraging team spirit to
reach the organisational goals of increased profitability and market growth. This
factor being perceived as the most important is perhaps also influenced by the
collectivist culture of Malaysia, where strong emphasis is placed on group goals as
well as the wellbeing of group members (Hofstede 2001, 1986).
Triandis (2001) and Engin and McKeown (2012) also suggested that in a collectivist
culture, people are likely to describe themselves as aspects of a group and to focus
more on group achievements for the benefit of the common good. This means that
employees see themselves as a function of a group rather than as just individuals. In
contrast, people in an individualist culture are motivated by personal goals. Malaysia
is described as having a highly collectivist culture, so it follows that the leaders of
SMEs in Malaysia would perceive being inspirational as a more critical element of
transformational leadership than the other three elements. The characteristics of
inspirational leadership as defined in the literature are inspiring and encouraging
employees to achieve shared goals and to have a shared vision of the organisation
(Bass & Avolio 1994; Bass & Riggio 2012) and encouraging team spirit (Sidani
2007). It is therefore plausible that inspirational motivation is the priority for
transformational leaders of SMEs in Malaysia.
330
8.3 Contributions and Implications of Research Findings
The outcomes of this study generate theoretical contributions and managerial
implications. These contributions and implications are drawn from the conclusions as
discussed in the previous sections.
8.3.1 Theoretical Contributions
The first theoretical contribution of this study comes from the framework based on
the transformational leadership theory and the RBV. This framework augments the
body of knowledge in existing literature in the area of leadership and
entrepreneurship in confirming the applicability of these Western-developed
concepts to a developing country such as Malaysia. In addition, the assessment of
leadership behaviour and EO as resources and capabilities from the RBV perspective
enables a conclusive examination of whether transformational leadership,
transactional leadership and each factor of EO impact on the organisational
performance of SMEs in Malaysia. It can be concluded that both leadership
behaviour and EO are important resources and capabilities that enhance and sustain
organisational performance.
A major theoretical contribution of this study relates to the modified version of the
MLQ for the transformational leadership construct. The results as presented in
Chapter 6 indicated that the factor structure for the transformational leadership
construct of the MLQ cannot be maintained. In the EFA some items were dropped
due to low factor loadings, and cross-loading resulting in the removal of the
individualised consideration factor. Ozaralli (2003) also had to remove this factor
from his final analysis, but found that the other three factors loaded into one factor.

331
However, in this study, the remaining three factors were found to be distinct from
each other, validated and producing acceptable goodness-of-fit statistics in the CFA.
Similar to the outcomes of the study by Geyer and Steyrer (1998), many of the
eliminated items can be viewed as redundant, as there are other items which can
relate to the same behavioural aspect. For example, the eliminated item of ‘I instil
pride in others for being associated with me’ can be covered by ‘I act in ways that
build others’ respect for me’. Thus, the remaining three factors of transformational
leadership maintain the basic distinction of the transformational leadership construct.
It was empirically proved that transformational leadership and transactional
leadership have significant positive relationships with measures of organisational
performance. The theoretical and hypotheses testing provided evidence that leaders
of SMEs in Malaysia perceive themselves as practising transformational and
transactional leadership behaviour, and both were found to have significant positive
effects on performance.
This study also makes a significant contribution to the field of entrepreneurship in the
context of a developing country. The results of this study provide evidence that EO is
an important strategic orientation for small and medium-sized enterprises, and the
effect of each factor of EO varies independently. Quantitative and qualitative data
provided significant evident that leaders of SMEs in Malaysia believe that they are
practising and developing this strategic orientation in their organisation. Empirical
findings demonstrated positive effects between each factor of EO and growth. But
only innovativeness and proactiveness were found to have significant positive effects
on profitability. The data from the interviews repeatedly recorded themes that reflect

332
the factors of EO. Thus, the development of this strategic orientation improves
organisational growth and profitability.
The central finding of this study arose from the intention to study EO as a mediating
mechanism to enrich existing theoretical models of the direct relationship between
leadership behaviour and organisational performance. Despite the independent links
established between leadership and performance (As-Sadeq & Khoury 2006; Ling et
al. 2008; Lo et al. 2010) and between EO and performance (Moreno & Casillas 2008;
Rauch et al. 2009; Wiklund 1999), very few studies have examined the relationships
between these three variables simultaneously (Todorovic & Schlosser 2007; Yang
2008). Therefore, a further understanding of the relationships between these
variables (transformational and transactional leadership, EO and organisational
performance) adds new knowledge to leadership and entrepreneurship literature in
the context of SMEs in Malaysia.
It was found that EO is a mediator between leadership behaviour and organisational
outcomes. The final theoretical models, besides confirming the direct relationships
between transformational leadership and growth and profitability and between
transactional leadership and growth, also indicate that the presence of EO fully
mediates these direct relationships. This signifies that an organisation’s strategies to
expand the business and to earn more profits may be realised not only from
leadership behaviour but also through the development of EO. A strong emphasis on
EO may effectively enhance the ability of leadership behaviour to affect
performance. This also indicates that the factors of EO are effectively compatible
333
with both transformational and transactional leadership, while being more effective
for transformational leadership.
It was demonstrated that transformational leadership has a stronger and more
significant relationship to EO than transactional leadership has, and EO is
significantly related to both measures of organisational performance. This means that
transformational leadership is able to foster effective utilisation of the strategic
orientation of a firm and this orientation exerts positive outcomes. Theoretically,
leaders with a transformational leadership behaviour who embrace the development
of EO would have a significantly strong effect on organisational performance.
Another significant finding in this study is that transformational leadership is
perceived to have a stronger effect on growth and profitability than transactional
leadership does. Even though most studies in the scope of small businesses in
developing countries have indicated the opposite (Obiwuru et al. 2011; Rao 2012,
Paracha et al. 2012), the outcomes of this study are similar to those in the majority of
Western research (Boerner et al. 2007; Elenkov 2002; Howell & Avolio 1993; Bass
1997; Bass et al. 2003). The leaders of SMEs in Malaysia perceive that the
performance of their firms will significantly improve when they practise the
behaviour of transformational leaders. Thus, this result contributes significantly to
the field of leadership research, especially in the context of SMEs in Malaysia.
8.3.2 Managerial Implications
The core objective of conducting this study is to present outcomes which might be
beneficial to and practical for SMEs in the manufacturing and service industries. The

334
findings of this study conclude that the leadership behaviour of owners and top
managers and EO are important variables that affect a firm’s growth and profitability.
The effective display and practice of transformational leadership, transactional
leadership and each factor of EO are perceived to positively affect the outcomes of
the firm. More importantly, leaders of SME establishments in these industries are
encouraged to understand the complex interaction between their leadership behaviour
and the level of EO practised in their organisation since these factors are
acknowledged as important elements for organisational success.
It is hoped that the outcomes of this study will help to fill the gap in the
understanding of the leadership behaviour of Malaysian business leaders, particularly
in the context of SMEs. The study concludes that leaders of SMEs in Malaysia are
practising and displaying transformational and transactional leadership. These two
types of leadership behaviour were empirically tested and showed significant positive
effects on growth and profitability. The results from the interview data confirmed the
practice of each factor of transformational and transactional leadership by leaders of
SMEs in Malaysia. Thus, leaders are encouraged to further develop their
understanding of transformational and transactional leadership. Personal initiatives to
learn and develop skills and knowledge in regard to these forms of leadership
behaviour may benefit them and their organisations.
The results obtained from both set of data established the form of leadership
behaviour that would contribute most to the success of SMEs. This study suggests
that, of the two types of leadership behaviour, transformational leadership is a more
efficient form of leadership behaviour than transactional leadership. Thus, leaders of

335
SMEs in Malaysia need to display, practise and nurture the qualities of
transformational leadership to improve the performance of their organisation. The
qualities associated with transformational leadership elevate the level of motivation
of employees and encourage them to reach their full potential. In return,
entrepreneurs who practise transformational leadership seem to generate and achieve
better organisational growth associated with a high market share, business expansion
and high profitability.
The quantitative findings also have significant implications for the development of
strategic orientation in a firm. The empirical findings indicate that the ability of
SMEs to innovate, be proactive in their strategic action and willing to take a
considerable amount of risk can significantly affect the success of the firm. Thus, the
implementation and development of factors of EO requires organisations to
persevere, and to be consistent and creative in their efforts and the allocation of the
resources to be invested into their products and services. These entrepreneurial
attitudes must be the practice and policy not only for leaders. They must be
transferred to every member of the organisation to maximise results for the
organisation.
Significantly, this study contributes to the literature on the relationship between
leadership behaviour and organisational performance by providing evidence that EO
mediates that relationship. The managerial implications are that, for small and
medium-sized organisations, the challenges for displaying and practising good
leadership behaviour are threefold:
336
1. The practice of leadership behaviour must be aligned with the level of
innovativeness and proactiveness in the firm.
2. Understanding which leadership behaviour favours change may help
organisations to champion an entrepreneurial spirit to streamline business,
promote the delegation of power and decision-making and develop
individuals’ creative ability. These measures stimulate an entrepreneurial
culture and spirit among all members of the organisation.
3. Taking higher risks requires organisations to take bold actions.
Transformational leadership is more consistent with risk taking due to its
characteristics of forward thinking, vision and willingness to tap into new
ideas. Transactional leadership is associated with risk-averse behaviour (Bass
1990a). Thus, organisations must develop and improve transformational
leadership to be more entrepreneurially orientated.
Practically, the outcomes from this study have significant implications for the
development of entrepreneurs in Malaysia. SME Corp. Malaysia, which is the
governing body that oversees entrepreneurial development in Malaysia, should
provide more leadership training and development programs for entrepreneurs. The
training should focus on developing and nurturing the transformational and
transactional leadership qualities of entrepreneurs. A specific leadership training
course based on transformational and transactional leadership should be mandated
for all new entrepreneurs who received assistance from any entrepreneurial
development agencies in the country.

337
To further improve the performance of SMEs, they need to develop their EO.
Continuing support and assistance from the government and financial institutions
would definitely help these enterprises to fully engage in innovation and other
proactive activities and thus allow them to venture into risky territory with a high
potential for profits.
Another practical implication for Malaysian entrepreneurs is that the results of this
study provide a clear indication that their perceptions are not much different from
those of their counterparts in Western countries. These results should be taken as an
eye-opener for Malaysian entrepreneurs to believe that they can compete locally and
globally, on par with competitors from the other side of the world. The results from
this study are consistent with those of previous studies conducted in Western
countries, namely that: (1) transformational leadership is more effective than
transactional leadership and (2) EO is an important attribute for an entrepreneurial
firm. In order to achieve success as outlined by the government, SMEs in Malaysia
need to have high ambition and be confident to expand their business and compete
internationally.
The final practical implication of this study pertains to the relevance of this study to
other Asian countries. Due to having similar culture and values to Malaysia,
neighbouring countries such as Thailand, Indonesia, Brunei and Vietnam could
definitely benefit from the outcomes of this study.
To summarise, this study makes concrete contributions by providing an empirical
framework and findings for understanding leadership and entrepreneurial practices in

338
the context of SMEs in Malaysia. The integration of leadership behaviour and EO as
resources and capabilities is found to provide positive increases in organisational
outcomes. These clearly proved results may help these organisations to focus on what
really matters to improve their performance.
8.3.3 Unique Contribution to Leadership/Entrepreneurship Theory and
Practice
The development of Figure 8.2 (please refer to page 340) was derived from the
outcomes from both sources of data collection and analysis in this study. This figure
pertains to the factors that are important for entrepreneurial success for Malaysian
SMEs. The details of each factor are elaborated below.
Based on this framework, there are three main variables that could have significant
direct or indirect impacts on the performance of organisation. The first variable is the
people in an organisation. Through interview data, it was found that besides leaders’
performance, the behaviour of employees is an important factor for entrepreneurial
success. Due to SMEs having a limited number of employees, the effectiveness and
efficiency of every member of the organisation contributes to the organisational
outcomes. The ability of the leaders to develop good teamwork among employees
can also affect the development of entrepreneurial ideas and strategy.
Besides having direct impacts on EO and organisational performance, leadership
behaviour is suggested to have a direct impact on the selection of strategy and
structure in the organisation. For example, according to Miles and Snow’s (1978)
strategy types, transformational leaders might adopt a prospector strategy, which
involves finding and exploiting new products and market opportunities, whereas

339
transactional leaders might prefer a defender strategy, which seeks stability by
producing a limited set of products directed at a narrow segment of the total potential
market. Those who favour transformational leadership might promote an open-door
policy and the delegation of power in their organisation to ensure a fast decision-
making process and to promote employees’ development. Transactional leaders
might have a more rigid structure to maintain control and stability in the
organisation. These attitudes were observed and supported through interview data
gathered from respondents.
Figure 8.2: New Proposed Framework for Organisational Success of SMEs in
Malaysia
Indirect Impact
Direct Impact
PEOPLE
Leadership Behaviour of
Leaders
Employees
ENVIRONMENTS Internal
(Strategy/Structure)
External (Competition)
ENTREPRENEURIAL
ORIENTATION Innovativeness
Proactiveness
Moderate Risk Taking
Financial support Government policy
Knowledge,
Experience
Firm age
Firm size
Key Success
Factors
ORGANISATIONAL
PERFORMANCE Objective
Strategic Performance
Organisational
Performance
Moderating Factors

340
The second variable is EO, which is characterised by innovativeness, proactiveness
and moderate risk taking. Even though the majority of interview respondents said
that they were willing to take high risks with the possibility of high returns, most of
them were actually calculative or moderate risk-takers. The possibility of not having
enough financial resources to cover operational costs deters these leaders from taking
high risks. But, given that they have the resources and sufficient financial support,
they stated that they were willing to take more risks than they were at the time this
study was undertaken.
The third variable is the environmental factors that are internal factors such as
organisational strategy and structure and external factors such as competition. These
factors emerged through the interview data. They are aligned with the findings of
other research and are important for an organisation’s performance and
entrepreneurial strategy. For example, research has indicated a positive impact of EO
on performance, but supplementary analysis has shown that the relationship between
EO and performance is mediated or moderated by a diverse set of variables
(Messersmith & Wales 2013; Rauch et al. 2009; Yu 2012). Competitive strategy and
competitive environment are variables that have been identified and tested in
literature (Yu 2012; Awang et al. 2010; Lechner & Gudmundsson 2012). Yu (2012)
found that competition intensity is negatively related to firm performance but it also
has a significant moderating role on the relationship between EO and performance.
Interview data in this study also indicated that, when entrepreneurs are operating in a
stable environment where there is not much competition, they are not very concerned
about being proactive and tend to be conservative about the amount of risk they take.
Organisational strategies such as product diversification and customer orientation

341
also emerged as factors that could influence performance. Thus, in the model
illustrated in Figure 8.2, it is suggested that internal and external environmental
factors could serve as factors that mediate, moderate or even have direct impacts on
EO as well as on organisational performance.
The measures of organisational performance should be extended to include objective
and strategic performance measures. The simplest approach to measure strategic
performance is to include a diverse set of financial measures (returns on assets, cost
reduction, annual earnings) and non-financial measures (customer satisfaction,
employee satisfaction) (Ittner et al. 2003). Firms that measure strategic performance
can provide information for identifying the strategies that offer the highest potential
for achieving the firm’s objectives and aligning its management processes (Gates
1999).
Finally, within this framework, there are elements of knowledge and experience that
could serve as moderating factors that might influence the approach to leadership
practice, the effectiveness of the workforce and the level of EO practised in the
organisation. The elements of financial support and government policy are also
suggested as factors that could moderate organisational performance. These factors
all emerged through interview data. The amount of knowledge and experience of the
leaders might influence the leadership behaviour and EO practices in the
organisation. Some leaders mentioned in interviews that the experience and
knowledge they possess have influenced the way they practise leadership. Having a
more experienced workforce facilitates employees’ growth and provides support for
the development of entrepreneurial strategy in the organisation.
342
Having sufficient financial support from the government and financial institutions
seems to be very important for the organisational performance of SMEs. Without
such support, it is very difficult for them to expand their business and develop a
sustainable performance. Lastly, even though this factor emerged only once in the
interviews, the role of government and its policy seems to be an important factor that
needs further attention. It was explained that for some of these enterprises, most of
their business comes from government-related agencies. It was stated that the
procurement system and rotation methods used by these agencies in awarding
contracts seems to deter the ability of the SMEs to become more competitive and
innovative and has affected their performance adversely. Perhaps the government and
its related agencies should reassess their procurement system to allow for a healthier
competitive environment which can improve the performance of these organisations.
8.4 Limitations of Study
All research has its limitations. The ability of a study to acknowledge its limitations
is part of the strength of the research undertaking (Dolen et al. 2004). There are
several limitations in regard to what has been compiled, analysed, presented and
discussed in this study. These limitations are identified in this section.
First, this study relied on self-reported data from single informants. All measures on
leadership behaviour, EO and organisational performance were evaluated by either
the owners or the top managers of SMEs in Malaysia. The informants in this study
may have exaggerated their evaluation of their leadership behaviour, their firm’s EO
and also their organisational performance. According to a recent review of literature,
self-assessment of leadership behaviour tends to be more inflated than other sources

343
(Muenjohn et al. 2012). Thus, the findings must be interpreted in the light of this
limitation, even though the Harman’s one-factor test showed that common method
bias was not an issue in this study. The significant positive relationships between
transformational leadership and measures of organisational performance and EO, the
relationships between transactional leadership and measures of organisational
performance and EO, and the relationships between each factor of EO and measures
of organisational performance should be discounted accordingly.
Second, this study adopted subjective measures. Moers (2005) argued that the use of
subjective performance measures might encourage performance evaluation bias but
the results of this study were tested for that bias and there did not seem to be a
problem. Zulkiffli and Parera (2011) suggested that in the context of measuring the
business performance of SMEs, subjective measures tend to be used since many
SMEs refuse to publicly reveal their actual financial performance. Besides, Dess and
Robinson (1984) mentioned that objective data may not fully represent an
organisation’s actual performance, even if they are available, since the managers may
manipulate the data in order to avoid personal or corporate taxes. Song et al. (2005)
also suggested that subjective measures could be an effective approach to evaluate
business performance as they allow comparisons to be made across firms and
contexts, such as industry types and economic conditions.
Third, the cross-sectional design used in this study only provides a snapshot view of
the researched phenomena where data on all measures were collected at the same
time. Thus, causal inferences could not be drawn from this research. The use of
longitudinal data would provide a remedy for this limitation when data on
344
independent variables and dependent variables are measured at two or more points in
time.
Fourth, this study showed that there is a small significant difference in the mean
scores for transformational leadership and organisational performance measures
between small and medium-sized enterprises. Some of these enterprises are also
longer established than others. Thus, this study did not control for firm size and age
in the examination of the hypothesised relationships. Firm age is particularly
important in the examination of EO in smaller firms as their ability to innovate might
be influenced by their longevity as well as the amount of their resources.
Fifth, the language choice chosen for this study posed another limitation. The
decision to translate the survey instruments only into Bahasa Melayu had attracted
higher participations from Bumiputera entrepreneurs. Thus, this study would have
attracted more participation from Chinese leaders if the survey instruments were also
available in Chinese. But, this limitation imposes only to SME Chinese leaders who
are not efficient in English or Bahasa Melayu.
Finally, this study provides generalisations for both manufacturing and service
industries. It does not take into account the categorical difference between the two
industries. There are several sub-categories of SMEs in each of these industries. A
more detailed study looking at each of the two industries and the differences between
the sub-categories within and between industries in respect to their leadership
behaviour, EO and organisational performance might provide an avenue for future
research.

345
8.5 Directions for Future Research
The findings of this study provide several opportunities for future research. It is
hoped that despite their limitations, the findings of this study will indicate directions
for further research. The main suggestion for future research arises from the
development of the proposed new framework for the organisational success of SMEs
in Malaysia as depicted in Figure 8.1. Other future research possibilities arise from
the limitations of this study, as previously discussed.
First, the inclusion of some environmental factors that affect the performance of
entrepreneurial ventures might provide useful insights. Kreiser et al. (2002) found
that environmental munificence encouraged EO in predicting better organisational
performance.
Second, a longitudinal study would enable greater understanding of the leadership
and entrepreneurial processes as it could measure leadership effects and the
development of entrepreneurial ventures at different points in time. Thus, it would
provide valuable information about variations in performance as an organisation
moves through different stages.
It is also recommended that future research explore the applicability of the proposed
entrepreneurial success framework to a different industry context and country,
especially to another developing country. The findings of such research would
further test the applicability of the transformational leadership theory and EO to
different industries in other non-Western business environments.

346
Fourth, to improve the model, the element of culture could be incorporated. House et
al. (1999) suggested that cultural difference might influence the way people perceive
their leaders. Other authors have also concluded that leadership behavour affects
organisational outcomes, culture and practices, and organisational culture and
practices also affect what leaders do (House et al. 2002). Ogbanna and Harris (2000)
found that organisational culture and leadership are related, and the relationship
between leadership and organisational performance is mediated by the organisational
culture. Thus, the inclusion of culture could further explain the relationship between
leadership behaviour and organisational performance. Perhaps such an investigation
could shed some light on the insignificant relationship between transactional
leadership and profitability found in this study.
Fifth, as mentioned in the limitations of study, future research might want to consider
to provide the survey instruments in Chinese language. This might attract higher
participation from Chinese leaders of SMEs in Malaysia.
Sixth, it is also recommended that future research to consider exploring leadership of
SME leaders from employees’ perspective. A comparative study of effective
leadership between the results obtained from the leaders themselves and employees’
perception might produce a better undertsanding of how performance of SMEs could
be further improved.
Finally, an examination of leadership behaviour at the factor level could enhance and
develop a better understanding of the factoral effects of leadership on organisational
performance. In this study it was found that some of these factors – inspirational

347
motivation, idealised influence and contingent reward – were perceived to be
practised more than the other factors by the leaders of SMEs in Malaysia. Thus, a
detailed study at the factor level could provide empirical findings with implications
for specific leadership training to be provided for entrepreneurial development in the
country.
8.6 Summary
Even though the transactional and transformational leadership theory is the most
recent and commonly used theory by researchers in the current literature (Lo et al.
2009; Kimura 2012), there is still a need to develop empirical evidence on its
relationships with the EO and organisational performance of SMEs in Malaysia. The
leadership behaviour of top management affects the organisational performance of
SMEs (Matzler et al. 2008) and the right leadership behaviour is important in
developing EO since it creates the appropriate climate for entrepreneurship and
innovation in an organisation (Bhattacharyya 2006). Wang (2008) also posited that
EO is important for organisational success. Therefore it is essential to subject the
model to theoretical testing to provide a better understanding of the intersection
between leadership behaviour and EO and organisational performance.
The findings of this study suggest that leadership behaviour is one of the most
important elements for organisational success. The leaders of organisations must first
understand that the leadership behaviour they display and practise has significant
direct and indirect (through EO) contributions to organisational performance. It is not
the intention of this study to suggest that leaders should practise a particular form of
leadership behaviour, but empirical findings indicate that when transformational

348
leadership is practised, it exerts stronger effects on EO and organisational outcomes
than transactional leadership does.
The research framework, the research questions and the methodological approach of
this study contribute to the existing body of knowledge in leadership and
entrepreneurship literature. The theoretical contributions and managerial implications
are also significant findings for leaders of SMEs and entrepreneurial development in
the country. Some limitations are acknowledged that indicate future research
directions.
Finally, the timing of this study is particularly important as Malaysia is moving from
being a developing country towards having developed country status, and
entrepreneurial developments are considered as one of the engines for the growth of
the country’s economy (NSDC 2008). Thus, the outcomes of this study could be
useful to entrepreneurial agencies in Malaysia for refining and enhancing their
entrepreneurial development, hence effecting a significant improvement in the
overall contribution of Malaysian SMEs to the country’s economy.

349
REFERENCES
Abdul Aziz, R, Abdullah, MH, Anas, T & Mahmood, R 2013, 'The effect of
leadership styles on the business performance of SMEs in Malaysia',
International Journal of Economics Business and Management Studies, vol.
2, no. 2, pp. 45-52.
Abdul Aziz, R, Abdullah, MH, Tajudin, A & Mahmood, R 2012, 'The effect of
leadership styles on the business performance of SMEs in Malaysia',
International Journal of Economics Business and Management Studies, vol.
2, no. 2, pp. 45-52.
Abdul Jamak, A, Salleh, R, Sivapalan, S & Abdullah, A 2012, 'Micro business
enterprise of Bumiputera Malays, Malaysia', African Journal of Business
Management, vol. 6, no. 22, pp. 6504-10.
Abdul Rani, N 2006, 'A study of Malaysian managers: Management styles in the era
of IT and globalization', International Journal of Knowledge, Culture and
Change Management, vol. 5, no. 4, pp. 145-54.
Abdul Rani, N, Pa'wan, F, Che Musa, N & Mohamed Tajudin, M 2008, 'Malaysian
employees' preference of their managers leadership styles', International
Review of Business Research Papers, vol. 4, no. 5, pp. 97-108.
Abdul Razak, MN 2010a, Keynote address by the Honorary Prime Minister at Invest
Malaysia 2010, Kuala Lumpur.
Abdul Razak, MN 2010b, Message from the Honorary Prime Minister on SME
Annual Report 2009/2010, National SME Development Council.
Abdul Razak, R 2011, 'Entrepreneurial orientation as a universal remedy for the
receding productivity in Malaysian small and medium enterprises: A
theoretical perspective', International Journal of Business and Social Science,
vol. 2, no. 19, pp. 249-57.
Abdullah, MA 1999, 'The accessibility of the government-sponsored support
programmes for small and medium-sized enterprises in Penang', Cities, vol.
16, no. 2, pp. 83-92.
Abdullah, NH, Shamsuddin, A & Wahab, E 2012, 'The influence of transformational
leadership on product innovations among small business', paper presented to
International Conference of Technology Management, Business and
Entrepreneurship 2012 (ICTMBE2012), Renaissance Hotel, Melaka,
Malaysia, 18-19 Dec 2012.
Abu Bakar, J, Mad, CA & Abdul Latif, R 2006, 'Liberalization and globalization: A
case of Naza and a lesson to SME', paper presented to Persidangan
Kebangsaan IKS (National Conference of SME) 2006, Kuala Lumpur.
350
Abu Kassim, Z & Sulaiman, M 2011, 'Market orientation and leadership styles of
managers in Malaysia', International Journal of Leadership Studies, vol. 6,
no. 2, pp. 230-45.
Achanga, P, Shehab, E, Roy, R & Nelder, G 2006, 'Critical success factors for lean
implementation within SMEs', Journal of Manufacturing Technology
Management, vol. 17, no. 4, pp. 460-71.
Agle, BR, Nagarajan, NJ, Sonnenfeld, JA & Srinivasan, D 2006, 'Does CEO
charisma matter? An empirical analysis of the relationships among
organizational performance, environmental uncertainty, and top management
team perceptions of CEO charisma', Academy of Management Journal, vol.
49, no. 1, pp. 161-74.
Ahmad, S & Ghani, AHA 2010, 'The relationship between entrepreneurial
orientation and business performance of Malaysia SMEs', paper presented to
The 2nd International Conference on Arab-Malaysian Islamic Global
Business and Entrepreneurship Jordan & Syria, 20-24 March
Aldrich, HE & Baker, T 1997, 'Blinded by the cites? Has there been progress in
entrepreneurship research?', in DL Sexton & RW Smilor (eds),
Entrepreneurship 2000, Upstart Publishing Company, Chicago, IL, pp. 377-
400.
Aloulou, W & Fayolle, A 2005, 'A conceptual approach of entrepreneurial
orientation within small business context', Journal of Enterprising Culture,
vol. 13, no. 1, pp. 24-45.
Alstete, JW 2008, 'Aspects of entrepreneurial success', Journal of Small Business and
Entreprise Development, vol. 15, no. 3, pp. 584-94.
Alvarez, S & Busenitz, L 2001, 'The entrepreneurship of resource based theory',
Journal of Management, vol. 27, no. 755-775.
Aman, O, Tahir, MNH, Majid, IA, Aziz, NAA & Rahmiati, F 2011, 'The success
factors of food small medium entrepreneurs under the One District One
Industry programme: A case on food manufacturing entrepreneurs in Melaka',
Journal of Global Entrepreneurship, vol. 1, no. 1, pp. 44-64.
Amaratunga, D, Baldry, D, Sarshar, M & Newton, R 2002, 'Quantitative and
qualitative research in the built environment: Application of “mixed” research
approach', Work Study, vol. 51, no. 1, pp. 17-31.
Amirul, SR & Daud, N 2012, 'A study on the relationship between leadership styles
and leadership effectiveness in Malaysian GLCs', European Journal of
Business and Management, vol. 4, no. 8, pp. 193-202.
Amit, R & Schoemaker, PJH 1993, 'Strategic assets and organisational rent',
Strategic Management Journal, vol. 14, pp. 33-46.
Amit, R & Zott, C 2001, 'Value creation in E-business', Strategic Management
Journal, vol. 22, pp. 493-520.
Anderson, JC & Gerbing, DW 1988, 'Structural equation modelling in practice: a
review and recommended two-step approach', Psychological Bulletin, vol.
103, no. 3, pp. 411-23.
351
Anderson, N, Lievens, F, Van Dam, K & Born, M 2006, 'A construct-driven
investigation of gender differences in a leadership-role assessment center',
Journal of Applied Psychology, vol. 91, pp. 555-66.
Ansari, MA, Ahmad, ZA & Aafaqi, R 2004, 'Organizational leadership in the
Malaysian context', in D Tjosvold & K.Lueng (eds), Leading in High Growth
Asia: Managing Relationship for Teamwork and Change, World Scientific
Publishing Co., Singapore, pp. 109-38.
Antonakis, J, Schriesheim, CA, Donovan, JA, Gopalakrishna-Pillai, K, Pellegrini,
EK & Rossomm, JL 2004, 'Methods for Studying Leadership', in J Antonakis,
AT Cianciolo & RJ Sternberg (eds), The Nature of Leadership, Sage
Publication, Thousand Oaks, California.
Appelbaum, SH, Audet, L & Miller, JC 2003, 'Gender and leadership? A journey
through the landscape of theories', Leadership & Organization Development
Journal, vol. 24, no. 1, pp. 43-51.
Arbaugh, JB, Cox, LW & Camp, SM 2009, 'Is entrepreneurial orientation a global
construct? A multi-country study of entrepreneurial orientation, growth
strategy, and performance', The Journal of Business Inquiry, vol. 8, no. 1, pp.
12-25.
Arbuckle, JL 1997, Amos User's Guide: Version 3.6, SmallWaters Corporation,
Chicago, IL.
Ardichvili, A 2001, 'Leadership styles of Russian entrepreneurs and managers',
Journal of Developmental Entrepreneurship, vol. 6, no. 2, pp. 169-87.
Arham, AF, Muenjohn, N & Boucher, C 2011, 'The role of entrepreneurial
orientation in the leadership-organisational performance relationship: A
Malaysian SMEs perspective', paper presented to 24th Annual Small
Enterprise Association of Australia and New Zealand (SEAANZ)
Conference, Australian Technology Park, Sydney.
---- 2012, 'Leadership, entrepreneurial orientation and performance: The case of
SMEs in Malaysia', in N Muenjohn (ed.), Organisational Leadership:
Concepts, Cases and Research, Cengage Learning Australia, Melbourne, pp.
27-50.
Arham, AF & Sulaiman, N 2013, 'Leadership and risk-taking propensity among
entrepreneurs in Malaysia', Business and Management Quarterly Review, vol.
4, no. 1, pp. 31-9.
Ariff, M 1998, 'The Malaysian economic experience and its relevance for the OIC
member countries', Islamic Economic Studies vol. 6, no. 1, pp. 1-41.
Ariff, M & Abubakar, SY 2003, 'Strengthening entrepreneurship in Malaysia',
Malaysian Institute of Economics Research, Kuala Lumpur.
Arnold, KA, Barling, J & Kelloway, EK 2001, 'Transformational leadership or the
iron cage: which predicts trust, commitment and team efficacy?', Leadership
& Organizational Development Journal, vol. 22, no. 7, pp. 315-220.
Aronson, E 2001, 'Integrating leadership styles and ethical perspectives', Canadian
Journal of Administrative Sciences, vol. 18, no. 4, pp. 244-56.

352
Asgari, A, Silong, AD, Ahmad, A & Abu Samah, B 2008, 'The relationship between
transformational leadership behaviors, organizational justice, leader-member
exchange, perceived organizational support, trust in management and
organizational citizenship behaviors', European Journal of Scientific
Research, vol. 23, no. 2, pp. 227-42.
As-Sadeq, HA & Khoury, GC 2006, 'Leadership styles in the Palestinian large-scale
industrial enterprises', Journal of Management Development, vol. 25, no. 9,
pp. 832-49.
Athukorala, P-C & Menon, J 1999, 'Outward orientation and economic development
in Malaysia', The World Economy, vol. 22, no. 8, pp. 1119-39.
Avery, CG & Ryan, J 2002, 'Applying situational leadership in Australia', The
Journal of Management Development, vol. 21, no. 4, pp. 242-63.
Avlonitis, GJ & Salavou, HE 2007, 'Entrepreneurial orientation of SMEs, product
innovativeness, and performance', Journal of Business Research, vol. 60, no.
5, pp. 566-75.
Avolio, BJ 1999, Full Leadership Development: Building the Vital Forces in
Organizations, Sage Publications, Thousand Oaks, CA.
Avolio, BJ 2005, Leadership Development in Balance: Made/Born, Erlbaum,
Mahwah NJ.
Avolio, BJ & Bass, BM 1999, 'Re-examining the components of transformational
and transactional leadership using the Multifactor Leadership Questionnaire',
Journal of Occupational & Organizational Psychology, vol. 72, no. 4, pp.
441-62.
Avolio, BJ, Bass, BM & Jung, DI 1999, 'Re-examining the components of
transformational and transactional leadership using the multifactor leadership
questionnaire', Journal of Occupational and Organizational Psychology, vol.
72, p. 441.
Awang, A & Ahmad, ZA 2005, 'Firm's entrepreneurial orientation and Bumiputera
SMEs performance: The impact of munificent environment', paper presented
to 7th International Research Conference on Quality, Innovation and
Knowledge Management, Monash University, Melbourne.
Awang, A, Asghar, ARS, Ahmad, ZA & Subari, KA 2010b, 'Entrepreneurial
orientation among Bumiputera small and medium agro-based enterprises
(BSMAEs) in West Malaysia: Policy implication in Malaysia', International
Journal of Business and Management, vol. 5, no. 5, pp. 130-43.
Awang, A, Asghar, ARS & Subari, KA 2010a, 'Study of distinctive capabilities and
entrepreneurial orientation on return on sales among small and medium agro-
based enterprises (SMAEs) in Malaysia', International Business Research,
vol. 3, no. 2, pp. 34-48.
Awang, A, Khalid, SA, Yusof, AA, Kassim, KM, Ismail, M, Zain, RS & Madar,
ARS 2009, 'Entrepreneurial orientation and performance relations of
Malaysian Bumiputera SMEs: The impact of some perceived environmental
353
factors', International Journal of Business and Management, vol. 4, no. 9, pp.
84-96.
Ayman, R & Korabik, K 2010, 'Leadership: Why gender and culture matter',
American Psychologist, vol. 65, no. 3, pp. 157-70.
Baba, R & Elumalai, S 2011, 'Entrepreneurial orientation of SMEs in Labuan and its
effects on performance', Universiti Malaysia Sarawak (UNIMAS), 1113.
Babaita, C, Sipos, G, Ispas, A & Nagy, A 2010, 'Leadership style and culture for
innovation in hotel industry', paper presented to 5th WSEAS International
Conference on Economy and Management Transformation, West University
of TimisoaraTimisoara, Romania, October 24-26, 2010
Bagozzi, R & Yi, Y 1988, 'On the evaluation of structural equation models', Academy
of Marketing Science, vol. 16, no. 1, pp. 74-94.
Bagozzi, RP & Baumgartner, H 1994, 'The Evaluation of Structural Equation Models
and Hypothesis Testing', in R Bagozzi (ed.), Principles of Marketing
Research, Blackwell, Cambridge, Mass, pp. 386-422.
Baker, W & Sinkula, JM 2009, 'The complementary effects of market orientation and
Entrepreneurial Orientation on Profitability in Small Businesses', Journal of
Small Business Management, vol. 47, no. 4, pp. 443-64.
Baloch, QB & Inam, M 2008, 'Strategic thinking: Catalyst to competitive advantage',
Journal of Managerial Sciences, vol. 1, no. 2, pp. 1-26.
Bandalos, DL & Boehm-Kaufman, MR 2009, 'Four Common Misconceptions in
Exploratory Factor Analysis', in CE Lance & RJ Vandenberg (eds), Statistical
and Methodological Myths and Urban Legends, Routledge, New York, pp.
61-87.
Banerji, P & Krishnan, V 2000, 'Ethical preferences of transformational leaders: an
empirical investigation', Leadership and Organization Development Journal,
vol. 21, no. 8, pp. 405-13.
Barbuto, JEJ 2005, 'Motivation and transactional, charismatic, and transformational
leadership: A test of antecedents', Journal of Leadership & Organizational
Studies, vol. 11, no. 4, pp. 28-40.
Barker, RA 1997, 'How can we train leaders if we do not what leadership is?', Human
Relations, vol. 50, no. 4, pp. 343-63.
Barling, J, Weber, T & Kelloway, EK 1996, 'Effects of transformational leadership
training on attitudinal and financial outcomes: A field experiment', Journal of
Applied Psychology, vol. 81, no. 827-832.
Barney, J 1991, 'Firm resources and sustained competitive advantage', Journal of
Management, vol. 17, no. 1, pp. 99-120.
Barney, JB 1995, 'Looking inside for competitive advantage', The Academy of
Management Executive (1993-2005), vol. 9, no. 4, pp. 49-61.
Baron, RM & Kenny, DA 1986, 'The moderator-mediator variable distinction in
social psychological research: Conceptual, strategic, and statistical

354
considerations ', Journal of Personality and Social Psychology, vol. 51, pp.
1173-82.
Basilevsky, A 1994, Statistical Factor Analysis and Related Methods: Theory and
Applications, John Wiley, Hoboken, NJ.
Bass, BM 1985, Leadership and Performance Beyond Expectations, The Free Press,
New York.
---- 1990a, Bass and Stogdill's Handbook of Leadership: Theory, Research and
Managerial Applications, Free Press, New York.
---- 1990b, 'From transactional to transformational leadership: Learning to share the
vision', Organizational Dynamics, vol. 18, no. 3, pp. 19-31.
---- 1996, 'Is there universality in the full range model of leadership?', International
Journal of Public Administration, vol. 19, no. 6, pp. 731-61.
---- 1997, 'Does the transactional-transformational leadership paradigm transcend
organizational and national boundaries?', American Psychologist, vol. 52, no.
2, pp. 130-9.
Bass, BM 1999, 'Two decades of research and development in transformational
leadership', European Journal of Work and Organizational Psychology, vol.
8, no. 1, pp. 9-32.
Bass, BM 2000, 'The future of leadership in learning organizations', Journal of
Leadership & Organizational Studies, vol. 7, no. 3, pp. 17-40.
Bass, BM & Avolio, BJ 1989, 'Potential biases in leadership measures: How
prototypes, lenienca, and general satisfaction relate to ratings and rankings of
transformational and transactional leadership constructs', Educational and
Psychological Measurement, vol. 59, pp. 508-27.
Bass, BM & Avolio, BJ 1990, 'The Implications of Transactional and
Transformational Leadership for Individual, Team, and Organizational
Development', in W Pasmore & RW Woodman (eds), Research in
Organizational Change and Development, Jai Press, Greenwich, CT.
Bass, BM & Avolio, BJ 1993, 'Transformational Leadership: A Response to
Critiques', in MM Chemers & R Ayman (eds), Leadership theory and
research: Perspectives and directions, Academic Press Inc., Sydney.
Bass, BM & Avolio, BJ 1994, Improving Organizational Effectiveness Through
Transformational Leadership, Sage Publications, Thousand Oaks, CA.
Bass, BM & Avolio, BJ 1994, 'Transformational leadership and organizational
culture', International Journal of Public Administration, vol. 17, no. 3, pp.
541 - 54.
Bass, BM & Avolio, BJ 1995, Multifactor Leadership Questionnaire, Mind Garden,
Menlo Park, CA.
Bass, BM & Avolio, BJ 2000, MLQ - Multifactor Leadership Questionnaire
Technical Report, Sage Publications, Thousand Oaks.

355
Bass, BM & Avolio, BJ 2004, Multifactor Leadership Questionnaire. Manual and
Sampler Set, 3rd edn, Mindgarden, Redwood City, CA.
Bass, BM, Jung, DI, Avolio, BJ & Berson, Y 2003, 'Predicting unit performance by
assessing transformational and transactional leadership', Journal of Applied
Psychology, vol. 88, pp. 207-18.
Bass, BM & Riggio, RE 2012, Transformational Leadership, 2nd edn, Taylor &
Francis, New Jersey.
Bass, BM & Yammarino, FJ 1991, 'Congruence of self and others' leadership ratings
of naval officers for understanding successful performance', Applied
Psychology: An International Review, vol. 40, pp. 437-54.
Beaver, G 2003, 'Small business: Success and failure', Strategic Change, vol. 12, no.
3, pp. 115-22.
Begley, TM & Boyd, DP 1987, 'Psychological characteristics of associated with
performance in entrepreneurial firms and small businesses', Journal of
Business Venturing, vol. 2, pp. 79-83.
Behery, MH 2008, 'Leadership behaviors that really count in an organization's
performance in the Middle East: The case of Dubai', Journal of Leadership
Studies, vol. 2, no. 2, pp. 6-21.
Bentler, PM 1990, 'Comparative fit indexes in structural models', Psychological
Bulletin, vol. 107, no. 2, pp. 238-46.
Bentler, PM & Bonnet, DC 1980, 'Significance tests and goodness of fit in the
analysis of covariance structures', Psychological Bulletin, vol. 88, no. 3, pp.
588-606.
Berson, Y & Avolio, BJ 2004, 'Transformational leadership and the dissemination of
organizational goals: A case study of a telecommunication firm', The
Leadership Quarterly, vol. 15, pp. 625-46.
Berson, Y, Shamir, B, Avolio, B & Popper, M 2001, 'The relationship between vision
strength, leadership style, and context', The Leadership Quarterly, vol. 12, pp.
53-73.
Bertoncelj, A & Kovac, D 2009, 'Gender difference in the conative component of
entrepreneurial orientation', Journal of East European Management Studies,
vol. 4, pp. 357-68.
Bhattacharyya, S 2006, 'Entrepreneurship and innovation: How leadership style
makes the difference', Vikalpa, vol. 31 no. 1.
Blanchard, K & Johnson, S 1983, The One Minute Manager, Willow, London.
Blank, W, Weitzel, JR & Green, SG 1990, 'A test of the situational leadership
theory', Personnel Psychology, vol. 43, pp. 579-97.
Boerner, S, Eisenbeiss, S & Griesser, D 2007, 'Follower behavior and organizational
performance: The impact of transformational leaders', Journal of Leadership
and Organizational Studies, vol. 13, no. 3, pp. 15-26.

356
Bolden, R 2007, 'Leadership development in SMEs: Designing a customised
solution', Journal of Management, vol. 5, no. 3, pp. 40-53.
Bollen, KA 1989, Structural Equations with Latent Variables, John Wiley & Sons,
Inc, New York.
Boonyachai, Y 2011, 'An investigation of the leadership styles of middle managers in
the Thai hotel industry using the MLQ (5X-Short Form) and Hofstede’s
Cultural Dimensions', ' Southern Cross University, Lismore, NSW.
Bowers, DG & Seashore, SE 1966, 'Predicting organizational effectiveness with a
four-factor theory of leadership ', Administrative Science Quarterly, vol. 11,
no. 2, pp. 238-63.
Boyatzis, RE 1998, Transforming Qualitative Information: Thematic Analysis And
Code Development, Sage, Thousand Oaks, CA.
Braun, V & Clarke, V 2006, 'Using thematic analysis in psychology', Qualitative
Research in Psychology, vol. 3, no. 2, pp. 77-101.
Brislin, RW 1980, 'Translation and Content Analysis of Oral and Written Material',
in HC Triandis & JW Berry (eds), andbook of Cross-Cultural Psychology,
Allyn & Bacon, Boston, vol. 2, pp. 389-444.
---- 1986, 'The Wording of Translation of Research Instruments', in WJ Lonner & JW
Berry (eds), Field Methods in Cross-Cultural Research, Sage Publications,
Berverly Hills, pp. 137-64.
Bruyat, C & Julien, P-A 2000, 'Defining the field of research in entrepreneurship',
Journal of Business Venturing, vol. 16, no. 2, pp. 165-80.
Bryant, TA 2004, 'Entrepreneurship', in GR Goethals, GJ Sorenson & JM Burns
(eds), Encyclopedia of leadership, Sage, Thousand Oaks, CA, vol. 1, pp. 442–
8.
Bryman, A 1992, Charisma and Leadership in Organizations, Sage, London.
Bucher, R, Fritz, CE & Quarantelli, EL 1956, 'Tape recorded interviews in social
research', American Sociological Review, vol. 21, no. 3, pp. 359-64.
Burns, JM 1978, Leadership, Harper & Row, New York, NY.
Busenitz, LW, West, GPI, Shepherd, D, Nelson, T & Chandler, GNZ, A. 2003,
'Entrepreneurship research in emergence: Past trends and future directions',
Journal of Management, vol. 29, pp. 285–308.
Bushra, F, Usman, A & Naveed, A 2011, 'Effect of transformational leadership on
employees' job satisfaction and organizational commitment in banking sector
of Lahore (Pakistan)', International Journal of Business and Social Science,
vol. 2, no. 18, pp. 261-7.
Butler, JK, Jr. & Reese, RM 1991, 'Leadership style and sales performance: A test of
the situational leadership model', The Journal of Personal Selling & Sales
Management, vol. 11, no. 3, pp. 37-.

357
Byrne, B 1989, A Primer of Lisrel: Basic Applications and Programming for
Confirmatory Factor Analytic Models, Springer-Verlag Publishing, New
York, US.
Byrne, BM 2001, Structural Equation Modeling With Amos: Basic Concepts,
Applications and Programming, Lawrence Erbaum Associates, New Jersey.
---- 2010, Structural Equation Modeling with AMOS: Basic Concepts, Application
and Programming, Taylor & Francis Group New York.
Byrne, D 1971, The Attraction Paradigm, Academic Press, New York.
Calof, JL 1993, 'The impact of size on internationalisation', Journal of Small
Business Management, vol. October, pp. 60-9.
Cameron, K 1978, 'Measuring organizational effectiveness in institutions of higher
education', Administrative Science Quarterly, vol. 23, pp. 604-32.
Carland, JW, Hoy, F & Carland, JAC 1988, '"Who is an entrepreneur?" Is a question
worth asking', American Journal of Small Business, vol. 12, no. 4, pp. 33-9.
Carless, S, Mann, L & Wearing, A 1996, 'Transformational leadership and teams', in
KW Parry (ed.), Leadership research and practice: emerging themes and new
challenges, Pitman, Melbourne, pp. 77-90.
Carneiro, J, Rocha, Ad & Silva, JFd 2007, 'A critical analysis of measurement
models of export performance ', Brazilian Administration Review, vol. 4, no.
2, pp. 1-19.
Carton, RB & Hofer, CW 2006, Measuring Organizational Performance: Metrics for
Entrepreneurship and Strategic Management Research, Edward Elgar,
Northampton, MA.
Casimir, G & Ng, YNK 2012, 'Combinative aspects of leadership style and the
interaction between leadership behaviors', Leadership & Organizational
Development Journal, vol. 31, no. 6, pp. 501-17.
Cassell, C & Symon, G 1994, Qualitative Methods in Organizational Research, Sage
Publications, London.
CEML 2002, Joining Entrepreneurs in Their World: Improving Entrepreneurship,
Management and Leadership in UK SMEs, Council for Excellence in
Management and Leadership, London.
Chau, PYK & Hu, PJH 2001, ' Information technology acceptance by individual
professional: a model comparison approach', Decision Sciences, vol. 32, no.
4, pp. 699-719.
Chelliah, S, Sulaiman, M & Pandian, S 2010, 'The determinants of
internationalization of small and medium enterprises (SMEs): A case in
Malaysia', World Applied Sciences Journal, vol. 10, no. 10, pp. 1202-15.
Chemers, MM 1997, An Integrative Theory of Leadership, Erlbaum, Mahwah, NJ.
Chen, C-N, Tzeng, L-C, Ou, W-M & Chang, K-T 2007, 'The relationship among
social capital, entrepreneurial orientation, organizational resources and

358
entrepreneurial performance for new ventures', Contemporary Management
Research, vol. 3, no. 3, pp. 213-32.
Chen, YL 2004, 'Examining the effects of organization culture and leadership
behaviors on organizational commitment, job satisfaction, and job
performance at small and middle-size firms of Taiwan', The Journal of
American Academy of Business, vol. 5, no. 1&2, pp. 432-8.
Cherryholmes, CH 1992, 'Notes on pragmatism and scientific realism', Educational
Reseacher, vol. 14, no. August-September, pp. 13-7.
Cheung, MFY & Wong, C-S 2011, 'Transformational leadership, leader support, and
employee creativity', Emerald, vol. 32, no. 7, pp. 656-72.
Chiang, C-F & Wang, Y-Y 2012, 'The effects of transactional and transformational
leadership on organizational commitment in hotels: The mediating effect of
trust', Journal of Hotel and Business Management, vol. 1, no. 1, pp. 1-11.
Chong, HG 2008, 'Measuring performance of small-and-medium sized enterprises:
the grounded theory approach', Journal of business and Public Affairs, vol. 2,
no. 1, pp. 1-10.
Chow, IH 2006, 'The relationship between entrepreneurial orientation and firm
performance in China', SAM Advanced Management Journal (USA), vol. 71,
no. 3, pp. 11-21.
Chung, R-G & Lo, C-L 2007, 'The relationship between leadership behavior and
organizational performance in non-profit organizations, using social welfare
charity foundations as an example', The Journal of American Academy of
Business, Cambridge, vol. 12, no. 1, pp. 83-7.
Church, A & Waclawski, J 1998, 'The relationship between individual personality
orientation and executive leadership behaviour', Journal of Occupational and
Organisational Psychology, vol. 71, no. 2, pp. 99-125.
Churchill, GA, Jr. 1979, 'A paradigm for developing better measures of marketing
constructs', Journal of Marketing Research, vol. 16, no. 1, pp. 64-73.
Cialdini, RB 1988, Influence: Science and Practice, Scott, Foresman., Glenview, IL.
Coffey, A 1999, The Ethnographic self: Fieldwork and the Representation of
Identity, Sage, London.
Cogliser, CC & Brigham, KH 2004, 'The intersection of leadership and
entrepreneurship: Mutual lessons to be learned', The Leadership Quarterly,
vol. 15, no. 6, pp. 771-99.
Cohen, J 1988, Statistical Power Analysis for the Behavioral Sciences, 2nd edn,
Erlbaum Associates Hillsdale, NJ.
Cole, ST 2005, 'Comparing mail and web-based survey distribution methods: Results
of surveys to leisure travel retailers', Journal of Travel Research, vol. 43, pp.
422-30.
Conger, JA 1999, 'Charismatic and transformational leadership in organizations: An
insider's perspective on these developing streams of research', The Leadership
Quarterly, vol. 10, no. 2, pp. 145-79.

359
Conger, JA & Toegel, G 2002, 'A Story of Missed Opportunities', in KW Perry & JR
Meindl (eds), Grounding Leadership Theory and Research, Information Age
Publishing, Greenwich City, pp. 175-97.
Conway, JM & Huffcutt, AI 2003, 'A review and evaluation of exploratory factor
analysis practices in organizational research', Organizational Research
Methods, vol. 6, no. 2, pp. 147-68.
Costello, AB & Osborne, JW 2005, 'Best practices in exploratory factor analysis:
Four recommendations for getting the most from your analysis', Practical
Assessment Research & Evaluation, vol. 10, no. 7, pp. 1-9.
Covin, J & Slevin, D 2002, 'The Entrepreneurial Imperatives of Strategic
Leadership', in A Hitt, RD Ireland, SM Camp & DL Sexton (eds), Strategic
Entrepreneurship: Creating a New Mindset, Blackwell Publishers, Oxford,
pp. 3009-327.
Covin, J & Wales, W 2012, 'The measurement of entrepreneurial orientation’,
Entrepreneurship Theory and Practice, vol. 36, no. 4, pp. 677-702.
Covin, JG & Lumpkin, GT 2011, 'Entrepreneurial orientation theory and research:
Reflections on a needed construct', Entrepreneurship: Theory & Practice,
vol. 35, no. 5, pp. 855-72.
Covin, JG & Miles, MP 1999, 'Corporate entrepreneurship and the pursuit of
competitive advantage', Entrepreneurship Theory and Practice, vol. 23, no. 3,
pp. 47-63.
Covin, JG & Slevin, DP 1989, 'Strategic management of small firms in hostile and
benign environments', Strategic Management Journal, vol. 10, no. 1, pp. 75-
87.
Covin, JG & Slevin, DP 1991, 'A conceptual model of entrepreneurship as firm
behavior', Entrepreneurship: Theory and Practice, vol. 16, no. 1, pp. 7-24.
Craighead, C, Ketchen, D, Dunn, K & Hult, G 2011, 'Addressing common method
Variance: Guidelines for survey research on information technology,
operations, and supply chain management', IEEE Transactions on
Engineering Management, vol. 58, no. 3, pp. 578-88.
Creswell, JW 1998, Qualitative Inquiry and Research Design: Choosing Among Five
Traditions, Sage, Thousand Oaks, CA.
---- 2003, Research Design: Qualitative, Quantitative and Mixed-methods
Approaches, 2nd edn, Sage Publications, Thousand Oaks, California.
Creswell, JW 2003, Research Design: Qualitative, Quantitative and Mixed Methods
Approaches, Sage Publications, Thousand Oaks, California.
Creswell, JW & Clark, VLP 2007, Designing and Conducting Mixed Methods
Research, Sage Publications, Thousand Oaks, California.
Cummings, GG, MacGregor, T, Davey, M, Lee, H, Wong, CA, Lo, E, Muise, M &
Stafford, E 2010, 'Leadership styles and outcome patterns for the nursing
workforce and work environment: A systematic review', International
Journal of Nursing Studies, vol. 47, no. 3, pp. 363-85.

360
Currie, G & Lockett, A 2007, 'A critique of transformational leadership: Moral,
professional and contingent dimensions of leadership within public services
organizations', Human Relations, vol. 60, no. 2, pp. 341-70.
Curry, LA, Nembhard, IM & Bradley, EH 2009, 'Qualitative and mixed methods
provide unique contributions to outcomes research', Circulation, vol. 119, pp.
1442-52.
Czarnitzki, D & Kraft, K 2004, 'Firm leadership and innovative performance:
Evidence from seven EU countries', Small Business Economics, vol. 22, pp.
325-32.
Daft, RL 2008, The Leadership Experience, 4th edn, South-Western, OH.
Damirch, QV, Rahimi, G & Seyyedi, MH 2011, 'Transformational leadership style
and innovative behavior on innovative climate at SMEs in Iran', Kuwait
Chapter of Arabian Journal of Business and Management Review, vol. 1, no.
4, pp. 119-27.
Davidsson, P, Kirchoff, B, Hatemi-J, A & Gustavsson, H 2002, 'Empirical analysis
of business growth factors using Swedish data', Journal of Small Business
Management, vol. 40, no. 4, pp. 332-49.
Davies, J, Hides, M & Powell, J 2002, 'Defining the development needs of
entrepreneurs in SMEs', Education + Training, vol. 44, no. 8/9, pp. 406-12.
Davis, JLB, R. Greg, Payne, GT & Kreiser, P 2010, 'Entrepreneurial Orientation and
Firm Performance: The Moderating Role of Managerial Power', American
Journal of Business, vol. 25, no. 2, pp. 41-54.
Davis, TRV & Luthans, F 1979, 'Leadership reexamined: A behavioural approach',
Academy of Management Review, vol. 4, pp. 237-48.
---- 2007, 'Organizational commitment in Mexican small and medium-sized firms:
The role of work status, organizational climate, and entrepreneurial
orientation', Journal of Small Business Management, vol. 45, no. 4, pp. 467-
90.
Den Hartog, D & Koopman, P 2001, 'Leadership in organizations', Handbook of
Industrial, Work and Organizational Psychology, vol. 2, pp. 166-87.
Den Hartog, DN, House, RJ & Hanges, PJ 1999, 'Culture specific and cross-
culturally generalizable implicit leadership theories: Are attributes of
charismatic/transformational leadership universally endorsed?', Leadership
Quarterly, vol. 10, no. 2, pp. 219-56.
Den Hartog, DN, Van Muijen, JJ & Koopman, PL 1997, 'Transactional versus
transformational leadership: An analysis of the MLQ', Journal of
Occupational & Organizational Psychology, vol. 70, no. 1, pp. 19-34.
Dess, GG & Lumpkin, GT 2005, 'The role of entrepreneurial orientation in
stimulating effective corporate entrepreneurship. ', Academy of Management
Executive, vol. 19, no. 1, pp. 147-56.
Dess, GG & Picken, JC 2000, 'Changing roles: Leadership in the 21st century',
Organizational Dynamics, vol. 28, no. 3, pp. 18-34.

361
Dess, GG & Robinson, JRB 1984, 'Measuring organizational performance in the
absence of objective measures: The case of the privately-held firm and
conglomerate business unit. ', Strategic Management Journal (pre-1986) vol.
5, no. 3, pp. 265-73.
Dillman, DA 2000, Mail and Internet Surveys: The Tailored Design Method, Wiley,
New York.
Dolen, W, Ruyter, K & Lemmink, J 2004, 'An empirical assessment of the influence
of customer emotions and contact employee performance on encounter and
relationship satisfaction', Journal of Business Research, vol. 57, pp. 437-44.
Dollinger, M 2003, Entrepreneurship: Strategies and Resources, 3rd edn, Prentice-
Hall, New Jersey.
DOSM 2010, Population Distribution And Basic Demographic Characteristic
Report, Department of Statistics Malaysia, 31 October 2013,
<http://www.statistics.gov.my>.
Druskat, VU 1994, 'Gender and leadership style: Transformational and transactional
leadership in the Roman Catholic Church', Leadership Quarterly, vol. 5, no.
2, pp. 99-119.
Dubinsky, A, Yammarino, F & Jolson, M 1995, 'An examination of linkages between
personal characteristics and dimensions of transformational leadership',
Journal of Business and Psychology, vol. 9, no. 3, pp. 315-35.
Duygulu, E & Ozeren, E 2009, 'The effects of leadership styles and organizational
culture on firm's innovativeness', African Journal of Business Management,
vol. 3, no. 9, pp. 475-85.
Eagly, AH & Carly, LL 2003, 'The female leadership advantage: An evaluation of
the evidence', The Leadership Quarterly, vol. 14, pp. 807–34.
Eisenbeiss, SA, van Knippenberg, D & Boerner, S 2008, 'Transformational
leadership and team innovation: Integrating team climate principles', Journal
of Applied Psychology, vol. 93, no. 1438-1446.
Eisenbeiss, SA, van Knippenberg, D & Boerner, S 2008, 'Transformational
leadership and team innovation: Integrating transformational leadership and
team climate models', Journal of Applied Psychology, vol. 93, no. 6, pp.
1438-46.
Eisenhardt, KM 1989, 'Building theories from case study research', Academy of
Management Review, vol. 14, no. 4, pp. 532-50.
Elenkov, DS 2002, 'Effects of leadership on organizational performance in Russian
companies', Journal of Business Research, vol. 55, no. 6, pp. 467-80.
Elenkov, DS & Manev, IM 2005, 'Top management leadership and influence on
innovation: The role of sociocultural context', Journal of Management, vol.
31, no. 3, pp. 381-402.
Elmore, PE & Beggs, DL 1875, 'Salience of concepts and commitment to extreme
judgements in response pattern of teachers', Education, vol. 95, no. 4, pp.
325-34.

362
Engelen, A, Gupta, V, Strenger, L & Brettel, M 2012, 'Entrepreneurial orientation,
firm performance, and the moderating role of transformational leadership
behaviors', Journal of Management, vol. 20, no. 10, pp. 1-30.
Engin, M & McKeown, K 2012, 'Cultural influences on motivation and theor goals
for studying at University', Learning and Teaching in Higher Education: Gulf
Perspectives, vol. 9, no. 1, pp. 1-15.
Ensley, MD, Pearce, CL & Hmieleski, KM 2006, 'The moderating effect of
environmental dynamism on the relationship between entrepreneur leadership
behavior and new venture performance', Journal of Business Venturing, vol.
21, no. 2, pp. 243-63.
Entebang, H, Harrison, RT & de Run, EC 2010, 'Entrepreneurial orientation of public
enterprises in Malaysia', Business Strategy Series, vol. 11, no. 2, pp. 75-7.
EPU 2008, Mid-term review of the Ninth Malaysian Plan 2006-2010, Economic
Planning Unit, Prime Minister's Department.
Eyal, O & Kark, R 2004, 'How do transformational leaders transform organizations?
A study of the relationship between leadership and entrepreneurship',
Leadership and Policy in Schools, vol. 3, no. 3, pp. 211-35.
Fairoz, FM, Hirobumi, T & Tanaka, Y 2010, 'Entrepreneurial orientation and
business performance of small and medium scale enterprises of Hambantota
District Sri Lanka', Asian Social Science, vol. 6, no. 3, pp. 34-46.
Fauzul, MF, Takenouchi, H & Yukiko, T 2010, 'Entrepreneurial orientation and
business performance of small and medium scale enterprises in Sri Lanka. ',
Asian Social Science, vol. 6, no. 3, pp. 34-46.
Fernald, JLW, Solomon, GT & Tarabishy, A 2005, 'A new paradigm: entrepreneurial
leadership', Southern Business Review, vol. 30, no. 2, pp. 1-10.
Ferreira, JJ & Azevedo, S 2007, 'The impact of entrepreneurial orientation and
resource-based view on growth of small firms', SSRN eLibrary, Available at
SSRN: http://ssrn.com/abstract=1029985.
Fiedler, FE 1996, 'Research on leadership selection and training: One view of the
future', Administrative Science Quarterly, vol. 41, no. 2, pp. 241-50.
Field, A 2009, Discovering Statistics Using SPSS, 3rd edn, Sage Publications,
London.
Fitzsimmons, JR, Steffens, P & Douglas, EJ 2005, 'Growth and profitability in small
and medium sized Australian firms', paper presented to AGSE
Entrepreneurship Exchange, Melbourne, Feb 2005.
Foon, LS 2011, 'Capabilities differentials as strategic assets of firms: A pragmatic
review', SEGi Review, vol. 4, no. 1, pp. 143-64.
Fornell, C 1982, 'A Second Generation of Multivariate Analysis - An Overview ', in
C Fornell (ed.), A Second Generation of Multivariate Analysis, New York,
vol. 1.
363
Fornell, C & Larcker, D 1981, 'Structural equation models with unobservable
variables and measurement error', Journal of Marketing Research, vol. 18,
no. 1, pp. 39-50.
Galbreath, J 2005, 'Which resources matter the most to firm success? An exploratory
study of resource-based theory', Technovation, vol. 25, no. 9, pp. 979-87.
Gartner, WB 1985, 'A conceptual framework for describing the phenomenon of new
venture creation', Academy of Management Review, vol. 10, no. 4, pp. 696-
706.
---- 1990, 'What are we talking about when we talk about entrepreneurship?', Journal
of Business Venturing, vol. 5, no. 1, pp. 15-28.
Gartner, WB & Stough, C 2002, 'Examining the relationship between leadership and
emotional intelligence in senior level managers', Leadership & Organization
Development Journal, vol. 23, no. 1/2, pp. 68-78.
Gates, S 1999, Aligning Strategic Performance Measures and Results, The
Conference Board, New York, NY.
Geyer, ALJ & Steyrer, JM 1998, 'Transformational leadership and objective
performance in banks', Applied Psychology: An International Review, vol. 47,
no. 3, pp. 397-420.
Ghosh, BC, Liang, TW, Meng, TT & Chan, B 2001, 'The key success factors,
distinctive capabilities, and strategic thrusts of top SMEs in Singapore',
Journal of Business Research, vol. 51, no. 3, pp. 209-21.
Gibb, A & Webb, T 1980, Policy Issues in Small Business Research, Andover,
Teakfield.
Gibbs, GR 2007, Analyzing Qualitative Data, Sage Publication, Thousand Oaks,
California.
Gillespie, NA & Mann, L 2004, 'Transformational leadership & shared values: The
building blocks of trust', Journal of Managerial Psychology, vol. 19, no. 6,
pp. 588-607.
Gilmore, A, Carson, D, Grant, K, O’Donnell, A, Laney, R & Pickett, B 2006,
'Networking in SMEs: Findings from Australia and Ireland', Irish Marketing
Review, vol. 18, no. 1&2, pp. 21-8.
Graeff, CL 1983, 'The situational leadership theory: A critical view', The Academy of
Management Review, vol. 8, no. 2, pp. 285-91.
Grant, J 1988, 'Women as managers: What can they offer organizations?',
Organizational Dynamics, vol. Winter, pp. 56-63.
Grant, RM 1991, 'The resource-based theory of competitive advantage: Implications
for strategy formulation', California Management Review, vol. 33, no. 3, pp.
114-35.
Green, J 2005, Analysing qualitative data. In J Greene & J Browne (eds), Principles
of Social Research, Open University Press, Berkshire, UK.

364
Groves, RM, Cialdini, RB & Couper, MP 1992, 'Understanding The Decision to
Participate in a Survey', The Public Opinion Quarterly, vol. 56, no. 4, pp.
475-95.
Guba, EG & Lincoln, YS 1994, 'Competing paradigms in qualitative research', in NK
Denzin & YS Lincoln (eds), Handbook of qualitative research, Sage
Publications, Thousand Oaks, pp. 105-17.
Gul, S, Ahmad, B, Rahman, SU, Shabir, N & Razzaq, N 2012, 'Leadership styles,
turnover intentions and the mediating role of organizational commitment',
Information and Knowledge Management, vol. 2, no. 7, pp. 44-51.
Gumusluoglu, L & Ilsev, A 2009, 'Transformational leadership, creativity, and
organizational innovation', Journal of Business Research, vol. 62, no. 4, pp.
461-73.
Gupta, V, MacMillan, IC & Surie, G 2004, 'Entrepreneurial leadership: Developing
and measuring a crosscultural construct', Journal of Business Venturing, vol.
19, pp. 241-67.
Gupta, V, MacMillan, IC & Surie, G 2004, 'Entrepreneurial leadership: developing
and measuring a cross-cultural construct', Journal of Business Venturing, vol.
19, no. 2, pp. 241-60.
Gurbuz, G & Aykol, S 2009, 'Entrepreneurial management, entrepreneurial
orientation and Turkish small firm growth', Management Research News,
vol. 32, no. 4, pp. 321-36.
Ha-Brookshire, JE 2009, 'Does the firm size matter on firm entrepreneurship and
performance? US apparel import intermediary case', Journal of Small
Business and Enterprise Development, vol. 16, no. 1, pp. 131-45.
Hair, J, Bush, R & Ortinau, D 2000, Marketing Research: A Practical Approach For
The New Millennium, Irwin/McGraw-Hill, Boston.
Hair, JF, Black, WC, Babin, BJ & Anderson, RE 2010, Multivariate Data Analysis,
7th edn, Prentice Hall, Upper Saddle River, New Jersey.
Hair, JF, Black, WC, Babin, BJ, Anderson, RE & Tatham, RL 2005, Multivariate
data analysis, 6 edn, Pearson Prentice Hall, Upper Saddle River.
Hair, JFJ, Anderson, RE, Tatham, RL & Black, WC 1998, Multivariate Data
Analysis, 5th edn, Prentice Hall, Upper Saddle River, NJ.
Haltiwanger, J, Jarmin, RS & Miranda, J 2013, 'Who creates jobs? Small versus large
versus young', The Review of Economics and Statistics, vol. 95, no. 2, pp.
347-61.
Hannah, S, Avolio, BJ, Luthans, F & Harms, P 2008, 'Leadership efficacy: Review
and future directions', Leadership Quarterly, vol. 19, pp. 669-92.
Hannay, M 2009, 'The cross-cultural leader: The application of servant ladership
theory in the international setting', Journal of International Business and
Cultural Studies, vol. 1, pp. 1-12.

365
Haselmann, R & Wachtel, P 2007, 'Risk taking by banks in the transition countries',
Comparative Economic Studies, Palgrave Macmillan, vol. 49, no. 3, pp. 411-
29.
Hashim, J 2007, 'Information communication technology (ICT) adoption among
SME owners in Malaysia', International Journal of Business and Information,
vol. 2, no. 2, pp. 221-40.
Hashim, MK 2000, 'A proposed strategic framework for SMEs success', Malaysian
Management Review, vol. 35, no. 2, pp. 32-43.
Hashim, MK, Ahmad, Sa & Zakaria, M 2012, 'A study on leadership styles in SMEs',
paper presented to International Conference on Islamic Leadership-2 (ICIL
2), The Royale Chulan, Kuala Lumpur, 26-27 September.
Hassim, A, Abdul Talib, A & Abu Bakar, A 2011, 'The Effects of Entrepreneurial
Orientation on FirmOrganisational Innovation and Market Orientation
towards Firm Business Performance', paper presented to International
Conference Sociality and Economic Development, Singapore.
Hassim, J 2007, 'Information communication technology (ICT) adoption among
SME owners in Malaysia', International Journal of Business and Information,
vol. 2, no. 2, pp. 221-40.
Hater, JJ & Bass, BM 1988, 'Superiors' evaluations and subordinates' perceptions of
trasnformational and transactional leadership', Journal of Applied
Psychology, vol. 73, no. 4, pp. 695-702.
Hayat, N & Riaz, MT 2011, 'The Influence of the SMES Top-Level Managers
Leadership Styles and Their Entrepreneurial Orientation on the Business
Performance', SSRN eLibrary, Available at SSRN:
http://ssrn.com/abstract=1884069.
Hayes, RH, Pisano, GP & Upton, DM 1996, Strategic Operations: Competing
Through Capabilities (Text and Cases), The Free Press, New York, NY.
Healy, M & Perry, C 2000, 'Comprehensive criteria to judge validity and reliability
of qualitative research within the realism paradigm', Qualitative Market
Research: An International Journal, vol. 3, no. 3, pp. 118-26.
Hernez-Broome, G & Hughes, LR 2004, 'Leadership development: Past, present, and
future', Human Resources Planning, vol. 27, no. 1, pp. 24-33.
Hersey, P & Blanchard, K 1969, 'Life-cycle theory of leadership. ', Training and
Development Journal, vol. 23, pp. 26-34.
Hersey, P & Blanchard, K 1993, Management of organizational behavior:
Utilizing human resources, 6th edn, Prentice Hall, Inc., Englewood Cliffs,
NJ.
Hesse-Biber, SN & Leavy, P 2006, The Practice of Qualitative Research, Sage
Publications, Thousand Oaks, CA.
Hilmi, MF & Ramayah, T 2008, 'Market innovativeness of Malaysian SMEs:
Preliminary results from a first wave data collection', Asian Social Science,
vol. 4, no. 12, pp. 42-9.

366
Hilmi, MF, Ramayah, T, Mustapha, Y & Pawanchik, S 2010, 'Product and process
innovativeness: Evidence from Malaysian SMEs', European Journal of Social
Sciences, vol. 16, no. 4, pp. 547-55.
Hinkin, TR 1995, 'A review of scale development practices in the study of
organizations', Journal of Management, vol. 21, no. 5, pp. 967-88.
Hitt, MA & Ireland, RD 2000, 'The intersection of entrepreneurship and strategic
management research', in DL Sexton & H Landstrom (eds), Handbook of
entrepreneurship, Blackwell Publishers, Oxford, pp. 45–63.
Ho, L-A 2008, 'What affects organizational performance?: The linking of learning
and knowledge management', Industrial Management & Data Systems, vol.
108, no. 9, pp. 1234-524.
Hoe, S 2008, 'Issues and procedure in adopting structural equation modeling
technique', Journal of Applied Quantitative Methods, vol. 3, no. 1, pp. 76-83.
Hofstede, G 1980, Culture’s Consequences: International Differences in Work
Related Values, Sage Publications, Inc, Thousand Oaks, CA.
---- 1986, 'Cultural differences in teaching and learning', International Journal of
Intercultural Relations, vol. 10, no. 3, pp. 301-20.
---- 2001, Cultures Consequences: Comparing Values, Behaviours, Institutions and
Organizations Across Nations, 2nd edn, Sage Publications, Thousand Oaks,
CA.
Hood, JN 2003, 'The relationship of leadership style and CEO values to ethical
practices in organizations', Journal of Business Ethics, vol. 43, pp. 263-73.
Hooper, D, Coughlan, J & Mullen, MR 2008, 'Structural equation modelling:
Guidelines for determining model fit', Journal of Business Research Methods,
vol. 6, pp. 53-60.
House, RJ 1971, 'A path goal theory of leader effectiveness', Administrative Science
Quarterly, vol. 16, no. 3, pp. 321-39.
House, RJ, & Podsakoff, P.M. 1994, 'Leadership effectiveness: Past perspectives and
future directions for research', in J Greenberg (ed.), Organizational Behavior,
Erlbaum, Hillsdale, NJ, pp. 45-82.
House, RJ, Hanges, PJ, Ruiz-Quintanilla, SA, Dorfman, PW, Javidan, M, Dickson,
M, Gupta, V & Associates, G 1999, 'Cross-cultural Research on
Organizational Leadership: A Critical Analysis and a Proposed Theory', in C
Earley & M Erez (eds), New Perspectives on International Industrial?
Organizational Psychology, Sage Publications, Thousand Oaks, CA.
House, RJ, Spangler, WD & Woycke, J 1991, 'Personality and charisma in the U.S.
presidency: a psychological theory of leader effectiveness', Administrative
Science Quarterly, vol. 36, no. 3, pp. 364-96.
Howell, JM & Avolio, BJ 1993, 'Transformational leadership, transactional
leadership, locus of control, and support for innovation: Key predictors of
consolidated business-unit performance. ', Journal of Applied Psychology,
vol. 78, pp. 891-902.
367
Howell, JM & Hall-Merenda, KE 1999, 'The ties that bind: The impact of leader–
member exchange, transformational and transactional leadership, and distance
on predicting follower performance', Journal of Applied Psychology, vol. 84,
pp. 680-94.
Howell, JM & Higgins, CA 1990, 'Champions of technological innovation',
Administrative Science Quarterly, vol. 35, no. 2, pp. 317-41.
Howell, JM, Neufeld, DJ & Avolio, BJ 2005, 'Examining the relationship of
leadership and physical distance with business unit performance', The
Leadership Quarterly, vol. 16, no. 2, pp. 273-85.
Hoyle, RH 1995, 'The Structural Equation Modeling Approach: Basic Concepts and
Fundamental Issues', in RH Hoyle (ed.), Structural Equation Modeling:
Concepts, Issues, and Applications, Sage Publications, Thousand Oaks, CA,
pp. 1-15.
Hu, L & Bentler, PM 1999, 'Cutoff criteria for fit indexes in covariance structure
analysis: Conventional criteria versus new alternatives', Structural Equation
Modeling, vol. 6, no. 1-55.
Hu, L-T & Bentler, P 1995, 'Evaluating Model Fit', in RH Hoyle (ed.), Structural
Equation Modeling. Concepts, Issues, and Applications, Sage Publications,
London, pp. 76-99.
Hult, GTM, Hurley, RF & Knight, GA 2004, 'Innovativeness: Its antecedents and
impact on business performance', Industrial Marketing Management, vol. 33,
pp. 429-38.
Hult, GTM, Snow, CC & Kandemir, D 2003, 'The role of entrepreneurship in
building cultural competitiveness in different organizational types', Journal of
Management, vol. 29, no. 3, pp. 401-26.
Hunt, SD & Chonko, LB 1987, 'Ethical problems of advertising agency executives',
Journal of Advertising, vol. 16, no. 4, pp. 16-24.
Ihua, UB 2009, 'SMEs key failure-factors: A comparison between the United
Kingdom and Nigeria', Journal of Social Science, vol. 18, no. 3, pp. 199-207.
Inkson, K & Moss, AT 1993, 'Transformational leadership - Is it universally
applicable?', Leadership & Organization Development Journal, vol. 14, no. 4,
pp. 1-2.
Ireland, RD & Hitt, MA 2005, 'Achieving and maintaining strategic competitiveness
in the 21st century: The role of strategic leadership', Academy of Management
Executive, vol. 19, no. 4, pp. 65-77.
Ismail, A, Mohamad, MH, Mohamed, HA-B, Rafiussin, NM & Zhen, KWP 2010,
'Transformational and transactional leadership styles as a predictor of
individual outcomes', Theoretical and Applied Economics, vol. 17, no. 6, pp.
89-104.
Isobe, T, Makino, S & Montgomery, D 2004, 'Exploitation, Exploration, and Firm
Performance: The case of Small Manufacturing Firms in Japan', viewed April
20, 2011, <http://ink.library.smu.edu.sg/lkcsb_research/2342>.

368
Ittner, CD, Larcker, DF & Randall, T 2003, 'Performance implications of strategic
performance measurement in financial services firms', Accounting,
Organizations and Society, vol. 28, no. 715-741.
Ivankova, NV, Creswell, JW & Stick, SL 2006, 'Using mixed-methods sequential
explanatory design: From theory to practice', Field Methods, vol. 18, no. 1,
pp. 3-20.
Ullman, JB 1996, 'Structural Equation Modeling', in BG Tabachnick & LS Fidell
(eds), Using Multivariate Statistics, 3rd edn, HarperCollins College
Publishers. , New York, NY, pp. 709-819.
Jackson, SL 2008, Research Methods: A Modular Approach, Thomson, Wadsworth.
Jaharuddin, NS 2006, 'Corporate culture, leadership style, and performance of
foreign and local organizations in Malaysia', paper presented to International
Conference on Business and Information, Singapore, 12-14 July.
Jamil, CM & Mohamed, R 2011, 'Performance measurement system (PMS) in small
medium enterprises (SMES): A practical modified framework', World
Journal of Social Sciences, vol. 1, no. 3, pp. 200-12.
Jandaghi, GH, Matin, H & Farjami, AA 2009, 'Comparing transformational
leadership in successful and unsuccessful companies', International Journal
of Social Sciences, vol. 4, no. 3, pp. 211-6.
Jayasingam, S & Cheng, MY 2009, 'Leadership style and perception of effectiveness:
Enlightening Malaysian managers', Asian Social Science, vol. 5, no. 2, pp. 54-
64.
John, K, Litov, L & Yeung, B 2008, 'Corporate governance and risk-taking', The
Journal of Finance 63, vol. 63, pp. 1679-728.
Johnson, RB & Onwuegbuzie, AJ 2004, 'Mixed methods research: A research
paradigm whose time has come', Educational Researcher, vol. 33, no. 7, pp.
14-26.
Jolliffe, IT 1986, Principal Component Analysis, Springer-Verlag, New York.
Jones, DW & Rudd, RD 2007, 'Transactional, transformational, or laissez-faire
leadership: An assessment of College of Agriculture Academic Program
Leaders (Deans) leadership styles', paper presented to AAAE Research
Conference, Minneapolis, Minnesota, May 16-18, 2007.
Judge, T & Piccolo, R 2004, 'Transformational and transactional leadership: a meta-
analytic test of their relative validity', Journal of Applied Psychology, vol. 89,
no. 5, pp. 755-68.
Judge, TA & Bono, JE 2000, 'Five-factor model of personality and transformational
leadership', Journal of Applied Psychology, vol. 85, pp. 751-65.
Judge, TA, Piccolo, RF & Ilies, R 2004, 'The forgotten ones? The validity of
consideration and initiating structure in leadership research ', Journal of
Applied Psychology, vol. 89, no. 1, pp. 36-51.
369
Judge, TA, Woolf, EF, Hurst, C & Livingston, B 2006, 'Charismatic and
transformational leadership: A review and agenda for future research. ',
Zeitschrift für Arbeits- und Organisationspsychologie, vol. 50, pp. 203-14.
Jung, D, Wu, A & Chow, CW 2008, 'Towards understanding the direct and indirect
effects of CEOs' transformational leadership on firm innovation', The
Leadership Quarterly, vol. 19, no. 5, pp. 582-94.
Jung, DI & Avolio, BJ 2000, 'Opening the black box: an experimental investigation
of the mediating effects of trust and value congruence on transformational
and transactional leadership', Journal of Organizational Behavior, vol. 21, no.
8, pp. 949-64.
Jung, DI, Chow, C & Wu, A 2003, 'The role of transformational leadership in
enhancing organizational innovation: Hypotheses and some preliminary
findings', The Leadership Quarterly, vol. 14, no. 4-5, pp. 525-44.
Kahn, JH 2006, 'Factor analysis in counselling psychology research, training, and
practice: Principles, advances, and applications', The Counselling
Psychologist, vol. 34, no. 5, pp. 684-718.
Kaiser, HF 1960, 'The application of electronic computers to factor analysis',
Educational and Psychological Measurement, vol. 20, pp. 141-51.
Kaiser, HF 1961, 'A note on Guttman’s lower bound for the number of common
factors', Multivariate Behavioral Research, vol. 1, pp. 249-76.
Kaiser, RB, Hogan, R & Craig, SB 2008, 'Leadership and the fate of organizations',
American Psychologist, vol. 63, no. 2, pp. 96--110.
Kang, JH, Park, SC & Tarabishy, A 2010, 'Leadership and culture matters: empirical
investigation for the mediating mechanism of entrepreneurial orientation',
paper presented to International Council for Small Business 2010 World
Conference, United States, Washington, 2010.
Kaplan, RS & Norton, DP 2001, 'Transforming the balanced-scorecard from
performance measurement to strategic management: Part I', Accounting
Horizons, vol. 15, pp. 87-104.
Kayworth, T & Leidner, D 2000, 'The global virtual manager: A prescription for
success', European Management Journal, vol. 18, no. 2, pp. 183-94.
Keh, HT, Nguyen, TTM & Ng, HP 2007, 'The effects of entrepreneurial orientation
and marketing information on the performance of SMEs', Journal of Business
Venturing, vol. 22, pp. 592-611.
Kelloway, EK, Turner, N, Barling, J & Loughlin, C 2012, 'Transformational
leadership and employee psychological well-being: The mediating role of
employee trust in leadership', Work & Stress: An International Journal of
Work, Health & Organisations, vol. 26, no. 1, pp. 39-55.
Kempster, S & Cope, J 2010, 'Learning to lead in the entrepreneurial context',
International Journal of Entrepreneurial Behaviour & Research, vol. 16, no.
1, pp. 5--34.

370
Kennedy, JC 2002, 'Leadership in Malaysia: Traditional values, international
outlook', The Academy of Management Executive (1993-2005), vol. 16, no. 3,
pp. 15-26.
Kenny, D & McCoach, D 2003, 'Effect of the number of variables on measures of fit
in structural equation modeling', Structural Equation Modeling: A
Multidisciplinary Journal, vol. 10, no. 3, pp. 333-51.
Kent, TW, Blair, CA & Rudd, HF 2010, 'Gender differences and transformational
leadership behaviour: Do both German men and women lead in the same
way?', International Journal of Leadership Studies, vol. 6, no. 1, pp. 52-66.
Khan, R, Rehman, AU & Fatima, A 2009, 'Transformational leadership and
organizational innovation: Moderated by organizational size', African Journal
of Business Management, vol. 3, no. 1, pp. 678-84.
Kim, H & Shim, S 2003, 'Gender-based approach to the understanding of leadership
roles among retail managers', Human Resource Development Quarterly, vol.
14, pp. 321-42.
Kim, SW 2006, 'Effects of supply chain management practices, integration and
competition capability on performance', Supply Chain Management: An
International Journal, vol. 11, no. 3, pp. 241-8.
Kimura, T 2012, 'Transformational leadership and job satisfaction: The mediating
effects of perceptions of politics and market orientation in the Japanese
context', International Journal of Business Science and Applied Management,
vol. 7, no. 1, pp. 29-42.
Kirkbride, P 2006, 'Developing transformational leaders: The full range leadership
model in action', Industrial and Commercial Training, vol. 38, no. 1, pp. 23-
33.
Kirkpatrick, SA & Locke, EA 1991, 'Leadership: Do trait matters?', The Executive,
vol. 5, pp. 48-60.
Kline, RB 1998, Principals and Practice of Structural Equation Modeling, The
Guilford Press, New York.
Kline, RB 2005, Principles and Practice of Structural Equation Modeling, 2nd edn,
The Guilford Press, New York.
Knight, G 2000, 'Entrepreneurship and marketing strategy: The SME under
globalization', Journal of International Marketing,, vol. 8, pp. 12-32.
Knight, G & Cavusgil, S 2004, 'Innovation, organizational capabilities, and the born
global firm ', Journal of International Business Studies, vol. 35, no. 2, pp.
124-41.
Koene, BAS, Vogelaar, ALW & Soeters, JL 2002, 'Leadership effects on
organizational climate and financial performance: Local leadership effect in
chain organizations', The Leadership Quarterly, vol. 13, no. 3, pp. 193-215.
Koontz, H & Donnell, C 1993, Introduction to Management, McGraw-Hill, New
York.

371
Kraus, S, Rigtering, JPC, Hughes, M & Hosman, V 2012, 'Entrepreneurial
orientation and the business performance of SMEs: a quantitative study from
the Netherlands', Review Management Science, vol. 6, pp. 161-82.
Krauss, SI, Frese, M, Freidrich, C & Unger, JM 2005, ' Entrepreneurial orientation:
A psychological model of success among southern African small business
owners. ', European Journal of Work and Organizational Psychology, vol.
14, no. 3, pp. 315-44.
Kreiser, P & Davis, J 2010, 'Entrepreneurial orientation and firm performance: The
unique impact of innovativeness, proactiveness, and risk-taking', Journal of
Small Business and Entrepreneurship, vol. 23, no. 1, p. 39.
Kreiser, PM, Marino, LD & Weaver, KM 2002, 'Assessing the psychometric
properties of the entrepreneurial orientation scale: A multi-country analysis',
Entrepreneurship Theory and Practice, vol. Summer, pp. 71-94.
Krejcie, RV & Morgan, DW 1970, 'Determining sample size for research activities',
Educational and Psychological Measurement, vol. 30, pp. 607-10.
Kropp, F & Zolin, R 2005, 'Technological entrepreneurship and small business
innovation research programs', Academy of Marketing Science Review, vol.
2005, no. 7, pp. 1-14.
Kuhnert, KW & Lewis, P 1987, 'Transactional and transformational leadership: A
constructive developmental analysis. ', Academy of Management Review, vol.
12, pp. 648-57.
Kuratko, DF & Hodgetts, RM 2007, Entrepreneurship: Theory, Process, Practice,
South-Western College Publishers. , Mason, OH.
Kuratko, DF, Ireland, RD, Covin, JG & Hornsby, JS 2005, 'A model of middle-level
managers' entrepreneurial behaviour', Entrepreneurship Theory and Practice,
vol. 29, no. 6, pp. 699-716.
Lamnek, S 1988, Qualitative Sozialiforschang Bond 1: Methodologie; Bond 2:
Method und Techniken, Psychologie Verlags Union, Munich.
Landau, S & Everitt, BS 2004, A Handbook of Statistical Analyses using SPSS,
Chapman & Hall/Crc, Boca Raton.
Langley, WM & Kahnweiler, WM 2003, 'The role of pastorals leadership in the
sociopolitically active African-American Church', Organization Development
Journal, vol. 21, no. 2, pp. 43-51.
Langowitz, N & Allen, I 2010, 'Small business leadership: Does being the founder
matter?', Journal of Small Business and Entrepreneurship, vol. 23, no. 1, pp.
53-63.
Law, MJ 2011, 'The study of transformational leadership and leader development of
public health directors in the Midwest', PhD thesis, School of Business,
Capella University.
Leblanc, G 1992, 'Factors affecting customer evaluation of service quality in travel
agencies: An investigation of customer perceptions', Journal of Travel
Research, vol. 30, no. 4, pp. 10-6.

372
Lechner, C & Gudmundsson, SV 2012, 'Entrepreneurial orientation, firm strategy
and small firm performance', International Small Business Journal, vol. 0, no.
0, pp. 1-25.
Lee, C & Ging, LC 2007, 'SME Innovation in the Malaysian manufacturing sector',
Economics bulletin, vol. 12, no. 30, pp. 1-12.
Lee, C, Lee, K & Pennings, JM 2001, 'Internal capabilities, external networks, and
performance: a study on technology-based ventures', Strategic Management
Journal, vol. 22, no. 6-7, pp. 615-40.
Lee, PKC, Cheng, TCE, Yeung, ACL & Lai, K-h 2011, 'An empirical study of
transformational leadership, team performance and service quality in retail
banks', Omega, vol. 39, pp. 690-701.
Lee, SM & Peterson, SJ 2000, 'Culture, entrepreneurial orientation, and global
competitiveness', Journal of World Business, vol. 35, no. 4, pp. 401-16.
Lieberson, S & O'Connor, JF 1972, 'Leadership and organizational performance: A
study of large corporations', American sociological Review, vol. 37, pp. 117-
30.
Ling, Y, Lubatkin, MH, Simsek, Z & Veiga, JF 2008, 'The impact of
transformational CEOs on the performance of small-to-medium-sized firms:
Does organizational context matter?', Journal of Applied Psychology, vol. 93,
no. 4, pp. 923-34.
Li-Yueh, C 2002, 'An examination of the relationship between leadership behavior
and organizational commitment at steel companies', Journal of Applied
Management and Entrepreneurship, vol. 7, no. 2, pp. 122-42.
Lo, M-C, Ramayah, T & Hii Wei, M 2009, 'Leadership style and organizational
commitment: a test on Malaysia manufacturing industry', African Journal of
Marketing Management, vol. 1, no. 6, pp. 133-9.
Lo, M-C, Ramayah, T, Hii Wei, M & Songan, P 2010, 'The relationship between
leadership styles and organizational commitment in Malaysia: role of leader-
member exchange', Asia Pacific Business Review, vol. 16, no. 1/2, pp. 79-
103.
Low, MB & MacMillan, IC 1988, 'Entrepreneurship: Past research and future
challenges', Journal of Management, vol. 14, no. 2, pp. 139-61.
Lowe, K & Gardner, W 2001, 'Ten years of the leadership quarterly: Contributions
and challenges for the future', The Leadership Quarterly, vol. 11, no. 4, pp.
459-514.
Lowe, KB, Kroeck, KG & Sivasubramaniam, N 1996, 'Effectiveness correlates of
transformation and transactional leadership: A metaanalytic review of the
MLQ literature', Leadership Quarterly, vol. 7, pp. 385-425.
Lu, JW & Beamish, PW 2001, 'The internationalization and performance of SMEs',
Strategic Management Journal, vol. 22, no. 6-7, pp. 565-86.
---- 2002, 'The internationalization and growth of SMEs', paper presented to 30th
Annual ASAC Conference, Winnipeg, Manitoba, May 25-28, 2002.

373
Luetkenhorst, W 2004, 'Corporate social responsibility and the development agenda:
The case for actively involving small and medium enterprises',
Intereconomics, vol. 39, no. 3, pp. 157-66.
Lumpkin, GT & Dess, GG 1996, 'Clarifying the entrepreneurial orientation Construct
and linking it to performance', The Academy of Management Review, vol. 21,
no. 1, pp. 135-72.
Lumpkin, GT & Dess, GG 2001, 'Linking two dimensions of entrepreneurial
orientation to firm performance: The moderating role of environment and
industry life cycle', Journal of Business Venturing, vol. 16, pp. 429-51.
Lussier, RN & Achua, CF 2001, Leadership: Theory, Application, Skill-building,
South-Western College, Cincinnati.
Lusthaus, C, Adrien, M-H, Anderson, G, Carden, F & Montalván, GP 2002,
Organizational Assessment: A Framework for Improving Performance,
International Development Research Centre, Ottawa.
Luthans, F & Avolio, BJ 2003, 'Authentic Leadership Development', in JED K. S.
Cameron, & R. E. Quinn (ed.), Positive Organizational Scholarship, Berrett-
Koehler, San Francisco, pp. 241-58.
Lyon, DW Lumpkin, GT & Dess, GG 2000, 'Enhancing entrepreneurial orientation
research: Operationalizing and measuring a key strategic decision making
process', Journal of Management, vol. 26, no. 5, pp. 1055-85.
Madhoushi, M, Sadati, A, Delavari, H, Mehdivand, M & Mihandost, R 2001,
'Entrepreneurial orientation and innovation performance: The mediating role
of knowledge management', Asian Journal of Business Management, vol. 3,
no. 4, pp. 310-6.
Madrid-Guijarro, A, Auken, H & García-Pérez-de-Lema, D 2007, 'An analysis of
factors impacting performance of Spanish manufacturing firms', Journal of
Small Business and Entrepreneurship, vol. 20, no. 4, pp. 369-79.
Mahmod, R, Rosnan, H & Hazman-Fitri, MH 2013, 'Knowledge management and
innovation readiness among SMEs in Malaysia', paper presented to Business
Engineering and Industrial Applications Colloquium (BEIAC), 7-9 April
2013 IEEE, Langkawi.
Mahoney, JT & Pandian, JR 1992, 'The resource-based view within the conversation
of strategic management', Strategic Management Journal, vol. 13, pp. 363 –
80.
Malaysia Economy 2012, Altius Directory, viewed 10 Oct 2012,
<http://www.altiusdirectory.com/Business/malaysia-economy.php>.
Malaysia Tourism 2011, Malaysia Map, viewed 31 October 2013,
<http://malaysiatourism11.blogspot.com.au/>.
Mansor, N & Kennedy, J 2000, 'Malaysian culture and the leadership of
organizations: A GLOBE study', Malaysian Management Review, vol. 35, no.
2.

374
Mao, H 2009, 'Review of enterprise growth theories', International Journal of
Business and Management, vol. 4, no. 8, pp. 20-3.
March, JG & Sutton, RI 1997, 'Organizational performance as a dependent variable',
Organization Science, vol. 8, no. 6, pp. 698-706.
Markman, G & Gartner, W 2002, 'Is extraordinary growth profitable? A study of Inc.
500 high-growth companies', Entrepreneurship Theory and Practice, vol. 27,
no. 1, pp. 65-75.
Marshall, M 1996, 'Sampling for qualitative research', Family Practice, vol. 13, no.
6, pp. 522-5.
Martens, CDP, Freitas, HMRd, Salvi, EJ, Lajus, GM & Boissin, J-P 2010,
'Entrepreneurial orientation in food industries: Exploratory study on medium
and large size companies in South of Brazil', paper presented to International
Conference Entrepreneurship in BRICS, Sao Paulo.
Maruyama, G 1998, Basics of Structural Equation Modeling, Sage, Thousand Oaks,
CA.
Matzler, K, Schwarz, E, Deutinger, N & Harms, R 2008, 'Relationship between
transformational leadership, product innovation and performance in SMEs ',
Journal of Small Business and Entrepreneurship, vol. 21, no. 2, pp. 139-52.
Mazzarol, T 2007, 'Awakening the entrepreneur: An examination of entrepreneurial
orientation among MBA students', paper presented to 37th Entreprneurship,
Innovation & Small Business Annual Conference, Ljubljana, Slovenia, 13-14
September.
McDonald, R & Ho, M-H 2002, 'Principles and practice in reporting structural
equation analyses', Psychological Methods, vol. 7, no. 1, pp. 64-82.
McKelvie, A & Wiklund, J 2010, 'Advancing firm growth research: A focus on
growth mode instead of growth rate', Entrepreneurship Theory and Practice,
vol. 34, no. 2, pp. 261-88.
McMahon, RGP 2001, 'Growth and performance of manufacturing SMEs: The
influence of financial management characteristics', International Small
Business Journal, vol. 19, no. 3, pp. 10-28.
McMillan, JH & Schumacher, S 2006, Research in Education: Evidence-based
Inquiry, Pearson Education, Inc, New York.
McShane, S & Travaglione, T 2003, Organisational Behaviour-On the Pacific Rim,
McGraw-Hill, Australia.
Md Noor, AR 2010, 'Transformational leadership in the Malaysian public sector:
Issues and recommendations', Journal Excellence, vol. 2, no. 1, pp. 23-33.
Md Saad, MS & Mazzarol, T 2010, 'The impact of leadership on organizational
innovation performance among Malaysia's Multimedia Super Corridor (MSC)
SME', paper presented to International Conference on Applied Business
Research, Ras Al-Khaimah, UAE, 29 Nov-3 Dec 2010.
Mertens, DM 2003, 'Mixed Methods and the Politics of Human Research: The
Transformative-Emancipatory Perspective', in A Tashakkori & C Teddlie

375
(eds), Handbook Of Mixed Methods In Social And Behavioral Research, Sage
Publications, Thousand Oaks, pp. 135-64.
Messersmith, JG & Wales, WJ 2013, 'Entrepreneurial orientation and performance in
young firms: The role of human resource management', International Small
Business Journal, vol. 31, no. 2, pp. 115-36.
Michel, JW, Lyons, BD & Cho, J 2011, 'Is the full-range model of leadership really a
full-range model of effective leader behavior?', Journal of Leadership &
Organizational Studies, vol. 18, no. 4, pp. 493-507.
Miles, J & Shevlin, M 2007, 'A time and a place for incremental fit indices',
Personality and Individual Differences, vol. 42, no. 5, pp. 869-74.
Miles, MB & Huberman, A 1984, Qualitative Data Analysis: A Sourcebook of New
Methods, Sage Publication, Beverley Hill: California.
Miles, MB & Huberman, AM 1994, Qualitative Data Analysis: An Expanded
Sourcebook, Sage Publication, Thousand Oaks, California.
Miles, RE & Snow, CC 1978, Organizational Strategy, Structure, and Process,
McGraw-Hill, New York.
Miller, D 1983, 'The correlates of entrepreneurship in three types of firms',
Management Science, vol. 29, no. 7, pp. 770-91.
Miller, D & Friesen, PH 1982, 'Innovation in conservative and entrepreneurial firms:
Two models of strategic momentum', Strategic Management Journal, vol. 3,
no. 1, pp. 1-25.
Miller, R & Acton, C 2009, SPSS for Social Scientists, Palgrave Macmillan.
Minichiello, V, Aroni, R, Timewell, E & Alexander, L 1995, In-depth Interviewing:
Principles, Techniques, Analysis, Longman, Melbourne, Australia.
Ministry of International Trade and Industry (MITI) 2005, The Third Industrial
Master Plan (IMP3), 1 March 2011, <http://www.miti.gov.my/miti-
imp3.html>.
---- 2009, Opening Address by YB Dato' Mustapa Mohamed Minister of
International Trade and Industry Malaysia - National Women Convention
2009 "Innovative Women Entrepreneurs: The Future Of Nation", 11 Jan
2013,
<http://www.miti.gov.my/cms/content.jsp?id=com.tms.cms.article.Article_c7
e0e1b6-c0a81573-53e353e3-9e688cac>.
Moers, F 2000, 'Financial and non-financial performance measures and managerial
short-term orientation: The interactive effect of performance targets', MARC-
WP/3/2000-15.
Mohd Aris, N 2007, 'SMEs: Building blocks for economic growth', Journal of the
Department of Statistics Malaysia, vol. 1, pp. 1-13.
Mohd Sam, MF, Tahir, MNH & Abu Bakar, K 2012, 'Owner-manager of SMEs in IT
sector: Leadership and company performance', International Journal of
Business and Social Science, vol. 3, no. 14, pp. 195-205.
376
Moini, AH 1995, 'An inquiry into successful exporting: An empirical investigation
using a three-stage model ', Journal of Small Business Management, vol. 33,
no. 3, pp. 9-25.
Moore, MR & Diamond, MA 2000 Academic Leadership: Turning Vision into
Reality, The Ernts & Young Foundation.
Moreno, AM & Casillas, JC 2008, 'Entrepreneurial orientation and growth of SMEs:
A causal model', Entrepreneurship Theory and Practice, vol. 32, no. 3, pp.
507-28.
Morgan, MJ 2004, 'Women in a man’s world: Gender differences in leadership at the
military academy.', Journal of Applied Psychology, vol. 34, no. 12, pp. 2482-
502.
Morris, MH, Coombes, S, Schinddehutte, M & Allen, J 2007, 'Antecedents and
outcomes of entrepreneurial and warket orientations in a non-profit context:
Theoretical and empirical insights', Journal of Leadership & Organizational
Studies, vol. 13, no. 12, pp. 11-39.
Morris, MH, Kuratko, DF & Covin, JG 2011, Corporate Entrepreneurship and
Innovation : Entrepreneurial Development within Organizations 3rd edn,
South-Western Cengage Learning, Mason, Ohio.
Morris, MH & Paul, GW 1987, 'The relationship between entrepreneurship and
marketing in established firms', Journal of Business Venturing, vol. 2, pp.
247-59.
Mosley, AL 1998, 'A behavioral appraoch to leadership: Implications for diversity in
today's organisations', Journal of Leadership & Organizational Studies, vol.
5, no. 1, pp. 38-50.
Muenjohn, N 2011, 'Global leadership competencies: Cultural perceptions of
leadership attributes and performance', paper presented to International
Business Studies Symposium: "Developing Responsible Global Leaders",
College of Business, Rikkyo University, Tokyo, Japan, June 22-23, 2011.
Muenjohn, N & Armstrong, A 2007, 'Transformational leadership: The influence of
culture on the leadership behaviours of expatriate managers', International
Journal of Business and Information, vol. 2, no. 2, pp. 265-83.
Muenjohn, N & Armstrong, A 2008, 'Evaluating the structural validity of the
Multifactor Leadership Questionnaire (MLQ), capturing the leadership
factors of transformational-transactional leadership', Contemporary
Management Research, vol. 4, no. 1, pp. 3-14.
Muenjohn, N, Armstrong, A & Hoare, L 2012, 'Leadership Assessment: Differences
in a Cross-Cultural Setting', in N Muenjohn (ed.), Organisational leadership:
Concepts, Cases and Research, Cengage Learning Australia, Melbourne, pp.
223-38.
Mukhreji, P & Albon, D 2010, Research Methods in Early Childhood: An
Introductory Guide, Sage, London.
Mullins, LJ 2002, Management and Organisational Behaviour, Pearson Education
Limited, Essex.

377
Murphy, GB, Trailer, JW & Hill, RC 1996, 'Measuring performance in
entrepreneurship research', Journal of Business Research, vol. 36, pp. 15-23.
Murphy, SE & Ensher, EA 2008, 'A qualitative analysis of charismatic leadership in
creative teams: The case of television director', The Leadership Quarterly,
vol. 19, pp. 335-52.
National Economic Advisory Council 2010, New Economic Model for Malaysia:
Part 1, Percetakan Nasional Malaysia Berhad, Kuala Lumpur.
Neuman, WL 2006, Social Research Methods: Qualitative and Quantitative
Approaches, 6th edn, Pearson Education, Boston.
---- 2011, Social Research Methods: Qualitative and Quantitative Approaches, Allyn
& Bacon, Boston.
Neves, BB & Amaro, F 2012, 'Too old for technology? How the elderly of Lisbon
use and perceive ICT', The Journal of Community Informatics, vol. 8, no. 1.
Norris, SE 2008, 'An Examination of Self-Leadership', Emerging Leadership
Journeys, vol. 1, no. 2, pp. 43-61.
Northouse, PG 2007, Leadership: Theory and Practice, 4th edn, Sage Publications,
London.
Northouse, PG 2012, Leadership: Theory and Practice, 6th edn, Sage Publication,
Thousand Oaks.
Norton, WIJ & Moore, WT 2002, ' Entrepreneurial risk: Have we been asking the
wrong question?', Small Business Economics, vol. 18, no. 4, pp. 281-7.
NSDC 2008, SME Annual Report 2008: Rising to Meet Global Challenges, National
SME Development Council, Kuala Lumpur.
---- 2010, SME Annual Report 2009/2010: Transformation to the New Economic
Model, National SME Development Council, Kuala Lumpur.
---- 2011, SME Annual Report 2010/11: Leveraging Opportunities, Realising
Growth, SME Corporation Malaysia, Kuala Lumpur.
Nunnaly, JC 1967, Psychometric Theory, McGraw-Hill, New York.
Obiwuru, TC, Okwu, AT, Akpa, VO & Nwankwere, IA 2011, 'Effects of leadership
style on organisational performance: A survey of selected small scale
enterprises in Ikosi-Ketu Council Development area of Lagos State, Nigeria',
Australian Journal of Business and Management Research, vol. 1, no. 7, pp.
100-11.
Odumeru, JA & Ogbonna, IG 2013, 'Transformational vs. transactional leadership
theories: evidence in literature ', International Review of Management and
Business Research, vol. 2, no. 2, pp. 355-61.
Ogbanna, E & Harris, LC 2000, 'Leadership style, organizational culture and
performnance: empirical evidence from UK companies', The International
Journal of Human Resource Management, vol. 11, no. 4, pp. 766-88.
378
Öncer, AZ 2013, 'Investigation of the effects of transactional and transformational
leadership on entrepreneurial orientation', International Journal of Business
and Social Research, vol. 3, no. 4, pp. 153-66.
O'Regan, N, Ghobadian, A & Sims, M 2005, 'The link between leadership, strategy,
and performance in manufacturing SMEs', Journal of Small Business
Strategy, vol. 15, no. 2, pp. 45-57.
Othman, N, Sulaiman, M, Zainudin, N & Hasan, Z 2008, 'Entrepreneurial
acculturation in Malaysia: Efforts and achievements', Munich RePEc Archive
Personal, viewed 4 July 2012, <http://mpra.ub.uni-muenchen.de/8980/>.
Ozaralli, N 2003, 'Effects of transformational leadership on empowerment and team
effectiveness', Leadership & Organization Development Journal, vol. 24, no.
6, pp. 335-44.
Packard, T 2009, 'Leadership and Performance in Human Service Organizations', in
R Patti (ed.), Handbook of Human Services Management, 2nd edn, Sage
Publications, , Thousand Oaks, CA, pp. 143-64.
Palich, LE & Bagby, DR 1995, 'Using cognitive theory to explain entrepreneurial
risk-taking: Challenging conventional wisdom', Journal of Business
Venturing, vol. 10, pp. 425-38.
Pallant, J 2001, SPSS Survival Manual: A Step by Step Guide to Data Analysis
Using SPSS (version 10), Allen & Unwin., St. Leonards, NSW.
Panitchpakdi, S 2006, Statements at the 10th Session of the Commission on
Enterprise, Business Facilitation and Development, Secretary-General of
UNCTAD, Geneva.
Papalexandris, N & Galanaki, E 2009, 'Leadership's impact on employee
engagement', Leadership & Organization Development Journal, vol. 30, no.
4, pp. 365-85.
Paracha, MU, Qamar, A, Mirza, A, Inam-ul-Hassan & Waqas, H 2012, 'Impact of
leadership style (transformational & transactional leadership) on employee
performance & mediating role of job satisfaction: Study of private school
(educator) in Pakistan', Global Journal of Management and Business
Research, vol. 12, no. 4, pp. 54-64.
Parasuraman, P, Zeithaml, VA & Berry, LL 1988, 'SERVQUAL: A multiple-item
scale for measuring consumer perceptions of service quality', Journal of
Retailing, vol. Spring, pp. 12-39.
Parry, KW 2006, 'Qualitative method for leadership research: Now there’s a novel
idea!', Compliance and Regulatory Journal, vol. 1, no. 1, pp. 24-7.
Patiar, A & Mia, L 2009, 'Transformational leadership style, market competition and
departmental performance: Evidence from luxury hotels in Australia',
International Journal of Hospitality Management, vol. 28, no. 2, pp. 254-62.
Patton, M 2002, Qualitative Research and Evaluation Methods, Sage Publications,
Thousand Oaks, California.

379
Pawar, BS 2003, 'Central conceptual issues in transformational leadership research',
Leadership & Organization Development Journal, vol. 24, no. 7, pp. 397-
406.
Pearce, CL 2004, 'The future of leadership: combining vertical and shared leadership
to transform knowledge work', Academy of Management Executive, vol. 18,
no. 1, pp. 47-57.
Pearce, CL & Sims, HP, Jr. 2000, 'Shared leadership: Toward a multi-level theory of
leadership', Advances in Interdisciplinary Studies of Work Teams, vol. 7, pp.
115-39.
Pearce II, JA, Fritz, D & Davis, PS 2010, 'Entrepreneurial orientation and the
performance of religious congregations as predicted by rational choice
theory', Entrepreneurship Theory and Practice, vol. 34, no. 1, pp. 219-48.
Pedraja-Rejas, L, Emilio, R-P, Delgado-Almonte, M & Juan, R-P 2006,
'Transformational and transactional leadership: A study of their influence in
small companies', Ingeniare-Revista Chilena de Ingenieria, vol. 14, no. 2, pp.
159-66.
Perry, CS 2001, 'The relationship between written business plans and the failure of
small businesses in the U.S', Journal of Small Business Management, vol. 39,
pp. 201-9.
Peteraf, MA 1993, 'The cornerstones of competitive advantage: A resource-based
view', Strategic Management Journal, vol. 14, no. 3, pp. 179-91.
Phillips, DC & Burbules, NC 2000, Postpositivism and Educational Research,
Rowman & Littlefield, Lanham, MD.
Podsakoff, P, MacKenzie, S, Lee, J-Y & Podsakoff, N 2003, 'Common method
biases in behavioral research: A critical review of the literature and
recommended remedies', Journal of Applied Psychology, vol. 88, no. 5, pp.
879-903.
Podsakoff, PM, MacKenzie, SB & Bommer, WH 1996a, 'Meta-Analysis of the
relationships between Kerr and Jermier's substitutes for leadership and
employee job attitudes, role perceptions, and performance', Journal of
Applied Psychology, vol. 81, no. 4, pp. 380-99.
---- 1996b, 'Transformational leader behaviours and substitutes for leadership as
determinants of employee satisfaction, commitment, trust, and organizational
citizenship behaviours', Journal of Management, vol. 22, pp. 259-98.
Podsakoff, PM, Mackenzie, SB, Moorman, RH & Fetter, R 1990, 'Transformational
leader behaviors and their effects on followers' trust in leaders, satisfaction,
and organizational citizenship behaviors', Leadership Quarterly, vol. 1, pp.
107-42.
Podsakoff, PM, MacKenzie, SB & Podsakoff, NP 2012, 'Sources of method bias in
social science research and recommendations on how to control it', Annual
Review of Psychology, vol. 63, pp. 539-69.
Podsakoff, PM & Organ, DW 1986, 'Self-reports in organisational research:
Problems and prospects', Journal of Management, vol. 12, pp. 531-43.

380
Podsakoff, PM & Schriesheim, CA 1985, 'Leader Reward and Punishment Behavior:
A Methodological and Substantive Review', in BSaLL Cummings (ed.),
Research in Organizational Behavior, Jossey-Bass, San Francisco, pp. 38-52.
Poland, B (ed.) 2003, Transcription Quality. In JA Holstein & JF Gubrium (ed.),
Inside Interviewing: New Lenses, New Concerns, Sage Publication.,
Thousand Oaks, California, pp. 267-88.
Prahalad, CK & Hamel, G 1990, 'The core competence of the corporation', Harvard
Business Review, vol. May/June, pp. 79-91.
Pruett, M, Shinnar, R, Toney, B, Lopis, F & Fox, J 2009, 'Explaining entrepreneurial
intentions of university students: a cross-cultural study', International Journal
of Entrepreneurial Behaviour & Research, vol. 15, no. 6, pp. 571-94.
Punch, KF 2003, Survey Research: The Basics, 1st edn, SAGE Publications, London.
Rafferty, AE & Griffin, MA 2004, 'Dimensions of transformational leadership:
Conceptual and empirical extensions', Leadership Quarterly, vol. 15, no. 3,
pp. 329-54.
Raman, KS & Yap, CS 1996, 'From a resource rich country to an information rich
society: An evaluation of information technologies policies in Malaysia',
Information Technology for Development, vol. 7, no. 3, pp. 109-31.
Rao, MVKS 2012, 'The impact of entrepreneurial orientation and leadership styles on
business performance: A study on micro small and medium enterprises',
International Journal of Entrepreneurship & Business Environment
Perspectives, vol. 1, no. 2, pp. 473-9.
Rauch, A, Wiklund, J, Lumpkin, GT & Frese, M 2009, 'Entrepreneurial orientation
and business performance: An assessment of past research and suggestions
for the future', Entrepreneurship Theory and Practice, vol. 33, no. 3, pp. 761-
87.
Reis, H & Judd, C 2000, Handbook of Research Methods in Social and Personality
Psychology, Cambridge University Press, New York.
Richard, PJ, Devinney, TM, Yip, GS & Johnson, G 2008, 'Measuring organizational
performance as a dependent variable: Towards methodological best practice',
Journal of Management, vol. 35, no. 3, pp. 718-804.
Robbins, SP 2003, Organizational Behavior, 10th edn, Prentice Hall, Upper Saddle
River, NJ.
Robbins, SP & Coulter, M 2005, Management, 8th edn, Prentice Hall, Upper Saddle
River, NJ.
Rogers, EW & Wright, PM 1998, 'Measuring organizational performance in strategic
human resource management: Problems, prospects and performance
information markets', Human Resource Management Review, vol. 8, no. 3,
pp. 311-31.
Roomi, MA & Harrison, P 2011, 'Entrepreneurial leadership: What is it and how
should it be taught?', International Review of Entrepreneurship, vol. 9, no. 3,
pp. 1-44.

381
Roscoe, JT 1975, Fundamental Research Statistics for the Behavioural Sciences, 2nd
edn, Holt Rinehart & Winston, New York.
Rosinski, P 2003, 'Coaching across cultures', International Journal of Coaching in
Organizations, vol. 1, no. 4, pp. 4-16.
Rost, JC 1993, 'Leadership development in the new millennium', The Journal of
Leadership Studies, vol. 1, pp. 91-110.
Rubin, H & Rubin, I 2005, Qualitative Interviewing: The Art of Hearing Data, 2nd
edn, Sage Publications., Thousand Oaks, California.
Runyan, RC, Ge, B, Dong, B & Swinney, JL 2012, 'Entrepreneurial orientation in
cross-cultural research: Assessing measurement invariance in the construct',
Entrepreneurship Theory and Practice, vol. July, pp. 819-36.
Ryen, A 2003, 'Cross-Cultural Interviewing', in In JA Holstein & JF Gubrium (ed.),
Inside Interviewing: New Lenses, New Concerns, Sage Publications,
Thousand oaks, California, pp. 429-48.
Saad, S 2012, 'Re-building the concept of nation building in Malaysia', Asian Social
Science, vol. 8, no. 4, pp. 115-23.
Salanova, M, Lorente, L, Chambel, MJ & Martinez, IM 2011, 'Linking
transformational leadership to nurses’ extra-role performance: the mediating
role of self-efficacy and work engagement', Journal of Advanced Nursing,
vol. 67, no. 10, pp. 2256-66.
Sale, JEM, Lohfeld, LH & Brazil, K 2002, 'Revisiting the quantitative-qualitative
debate: Implications for mixed-methods research', Quality & Quantity, vol.
36, pp. 43-53.
Saleh, AS & Ndubisi, NO 2006, 'An evaluation of SME development in Malaysia',
International Review of Business Research Papers, vol. 2, no. 1, pp. 1-14.
---- 2006, SME Development in Malaysia: Domestic and Global Challenges,
University of Wollongong.
Samad, NA 2007, 'Positioning Malaysian SMEs in the global', paper presented to
Persidangan Kebangsaan IKS (National Conference of SME) 2007 Kota
Kinabalu.
Sampson, SE & Froehle, CM 2006, 'Foundation and implication of a proposed
unified services theory', Production and Operations Management, vol. 15, no.
2, pp. 329-43.
Sarros, JC, Cooper, BK & Santora, JC 2008, 'Building a climate for innovation
through transformational leadership and organizational culture', Journal of
Leadership & Organizational Studies, vol. 15, no. 2, pp. 145-58.
Sarros, JC & Santora, JC 2001, 'The transformational-transactional leadership model
in practice', Leadership & Organization Development Journal, vol. 22, no. 8,
pp. 383-93.
Sayuti, NM 2013, 'Antecedents of supply chain relationships between MNCs and
SMEs in agile environment', PhD thesis, RMIT University.

382
Schafer, JL & Olsen, MK 1998, 'Multiple imputation for multivariate missing-data
problems: A data analyst's perspective', Multivariate Behavioral Research,
vol. 33, pp. 545-71.
Schumacker, R & Lomax, R 2004, A Beginner's Guide to Structural Equation
Modeling, Lawrence Erlbaum Associates, Mahwah, New Jersey.
---- 2008, A Beginner's Guide to Structural Equation Modeling, 2nd edn, Lawrence
Erlbaum Associates, Mahwah, New Jersey.
Schumacker, RE & Lomax, RG 1996, A Beginner's Guide to Structural Equation
Modeling, Lawrence Erlbaum Associates, New Jersey.
Schumpeter, JA 1942, Capitalism, Socialism and Democracy, Harper, New York.
Sekaran, U & Bougie, R 2010, Research Methods for Business: A Skill Building
Approach, 5th edn, John Wiley &Sons, United Kingdom.
Selvarajah, C & Meyer, D 2008, 'One nation, three cultures: Exploring dimensiosn
that relate to leadership', Leadership & Organization Development Journal,
vol. 29, no. 8, pp. 693-712.
Shane, S & Venkataraman, S 2000, 'The promise of entrepreneurship as a field of
research', Academy of Management Review, vol. 25, no. 1, pp. 217-26.
Short, JC, Payne, GT, Brigham, KH & Lumpkin, GT 2009, 'Family firms and
entrepreneurial orientation in publicly traded firms', Family Business Review,
vol. 22, no. 1, pp. 9-24.
Shurchuluu, P 2002, 'National productivity and competitive strategies for the new
millennium', Integrated Manufacturing Systems, vol. 13, no. 6, pp. 408-14.
Si, S & Wei, F 2012, 'Transformational and transactional leaderships, empowerment
climate, and innovation performance: A multilevel analysis in the Chinese
context', European Journal of Work and Organizational Psychology, vol. 21,
no. 2, pp. 299-320.
Sidani, YM 2007, 'Perceptions of leader transformational ability: The role of leader
speech and follower self-esteem', Journal of Management Development, vol.
26, no. 8, pp. 710-22.
Simon, MR 'An investigation of Bass leadership theory on organizational
performance of small and medium enterprises in Trinidad and Tobago'.
Simpson, RA 2005 'Government intervention in the Malaysian economy, 1970-1990:
Lessons for South Africa', University of the Western Cape.
Singer, MP 1985, 'Transformational vs. transactional leadership: a study of New
Zealand company managers', Psychological Reports, vol. 57, pp. 143-6.
Sirilli, G & Evangelista, R 1998, 'Technological innovation in services and
manufacturing: Results from Italian surveys', Research Policy, vol. 27, no.
881-899.
Smart, DT & Conant, JS 1994, 'Entrepreneurial orientation, distinctive marketing',
journal of Applied Business Research, vol. 10, no. 3, pp. 28-38.

383
---- 2011, 'Entrepreneurial orientation, distinctive marketing competencies and
organizational performance', Journal of Applied Business Research, vol. 10,
no. 3, pp. 28-38.
Smit, Y & Watkins, JA 2012, 'A literature review of small and medium enterprises
(SME) risk management practices in South Africa', African Journal of
Business Management, vol. 6, no. 21, pp. 6324-30.
Smith, JE, Carson, KP & Alexander, RA 1984, 'Leadership: It can make a
difference', The Academy of Management Journal, vol. 27, no. 4, pp. 765-76.
Smith, PL & Smits, S 1994, 'The feminisation of leadership', Training and
Development Journal, vol. 48, no. 2, pp. 43-6.
Sobh, R & Perry, C 2006, 'Research design and data analysis in realism research',
European Journal of Marketing, vol. 40, no. 11/12, pp. 1194-209.
Somech, A 2003, 'Relationships of participative leadership with relational
demography variables: A multi-level perspective.', Journal of Organizational
Behavior, vol. 24, no. 8, pp. 1003-18.
Song, M, Droge, C., Hanvanich, S & Calantone, R 2005, 'Marketing and technology
resource complementarity: An analysis of their interaction effect in two
environmental contexts', Strategic Management Journal, vol. 26, no. 3, pp.
259-76.
Soriano, DR & Martinez, JMC 2007, 'Transmitting the entrepreneurial spirit to the
work team in SMEs: the importance of leadership', Management Decision,
vol. 45, no. 7, pp. 1102-22.
Sosik, JJ & Jung, DI 2010, Full Range Leadership Development: Pathways for
People, Profit and Planet, Routledge, New York, NY.
Spreitzer, GM, Perttula, KH & Xin, K 2005, 'Traditionality matters: An examination
of the effectiveness of transformational leadership in the United States and
Taiwan', Journal of Organizational Behavior, vol. 26, pp. 205-27.
Steffens, PR, Davidsson, P & Fitzsimmons, JR 2006, 'The performance of young
firms: patterns of evolution in the growth-profitability space', paper presented
to Academy of Management Conference, Hawaii.
Stewart, A 1989, Team Entrepreneurship, Sage, Newbury Park, CA.
Stewart, A 1991, 'A prospectus on the anthropology of entrepreneurship',
Entrepreneurship Theory and Practice, vol. 16, no. 2, pp. 71-9.
Stogdill, RM 1948, 'Personal factors associated with leadership: A survey of the
literature', Journal of Psychology, vol. 25, pp. 35-71.
---- 1974, Handboook of Leadership, The Free Press, New York, NY.
Stotland, E & Patchen, M 1961, 'Identification and change in prejudice and
authoritarianism ', Journal of Abnormal and Social Psychology, vol. 62, pp.
250-6.
Suhr, DD 2005, 'Principal component analysis vs. exploratory factor analysis', paper
presented to SUGI 30, Philadelphia, Pennsylvania April 10-13, 2005.

384
---- 2006, 'Exploratory or confirmatory factor analysis?', paper presented to SUGI 31,
San Francisco, California, March 26-29, 2006.
Swierczek, FW 1991, 'Leadership and culture: Comparing Asian managers',
Leadership & Organization Development Journal, vol. 12, no. 7, pp. 3-10.
Swierczek, FW & Thanh Ha, T 2003a, 'Entrepreneurial orientation, uncertainty
avoidance and firm performance', The International Journal of
Entrepreneurship and Innovation, vol. 4, no. 1, pp. 46-58.
---- 2003b, 'Motivation, entrepreneurship and the performance of SMEs in Vietnam',
Journal of Enterprising Culture, vol. 11, no. 1, p. 47.
Tabachnick, BG & Fidell, LS 1996, Using Multivariate Statistics, 3rd edn,
HarperCollins, New York.
Tabachnick, BG & Fidell, LS 2001, Using Multivariate Statistics, 4th edn, Allyn &
Bacon, Boston.
Tabachnick, BG & Fidell, LS 2007, Using Multivariate Statistics, 5th edn, Allyn and
Bacon, New York.
Tajeddini, K 2010, 'Effect of customer orientation and entrepreneurial orientation on
innovativeness: Evidence from the hotel industry in Switzerland', Tourism
Management, vol. 31, no. 2, pp. 221-31.
Tan, CSL 2007, 'Sources of competitive advantage for emerging fast growth small-
to-medium enterprises: The role of business orientation, marketing
capabilities, customer value, and firm performance', PhD thesis, RMIT
University.
Tan, D, Hock, MG & Piaw, TC 2004, 'An introspective look at the exhibition
industry in Singapore', National University of Singapore, vol. 7, no. 6, pp. 1-
32.
Tang, J, Tang, Z, Zhang. & Li, Q 2007, 'The impact of entrepreneurial orientation
and ownership type on firm performance in the emerging region of China',
Journal of Development Entrepreneurship, vol. 12, no. 4, pp. 383-97.
Tangen, S 2003, 'An overview of frequently used performance measures', Work
Study, vol. 52, no. 7, pp. 347-54.
Tarabishy, A, Solomon, G, Fernald Jr, LW & Sashkin, M 2005, 'The entrepreneurial
leader's impact on the organization's performance in dynamic markets',
Journal of Private Equity, vol. 8, no. 4, pp. 20-9.
Tashakkori, A & Creswell, JW 2007, 'Editorial: The new era of mixed methods',
Journal of Mixed Methods Research, vol. 1, no. 3, pp. 3-6.
Tashakkori, A & Teddlie, C 2003, Handbook of Mixed Methods in Social and
Behavioural Research, Sage Publications, Thousand Oaks.
Tejeda, MJ, Scandura, TA & Pillai, R 2001, 'The MLQ revisited: Psychometric
properties and recommendations', The Leadership Quarterly, vol. 12, pp. 31-
52.

385
Tepper, B & Percy, P 1994, 'Structural validity of the multifactor leadership
questionnaire', Educational and Psychological Measurement, vol. 54, no. 3,
pp. 734-44.
Thadani, DR & Cheung, CMK 2011, 'Online social network dependency: Theoretical
development and testing of competing models', paper presented to 44th
Hawaii International Conference on System Sciences, Hawaii.
Thomas, AS & Mueller, SL 2000, 'Are entrepreneurs the same across cultures?',
International Management Studies, vol. 5, no. 4, pp. 18-36.
Thorlindsson, T 1988, 'The skipper effect in the Icelandic Herring Fishery', Human
Organization, vol. 47, no. 3, pp. 199-212.
Todorovic, W & Schlosser, FK 2007, 'An entrepreneur and a leader!: A framework
conceptualizing the influence of leadership style on a firm's entrepreneurial
orientation - performance relationship', Journal of Small Business and
Entrepreneurship, vol. 20, no. 3, pp. 289-308.
Tosi, HL, Misangyi, VF, Fanelli, A, Waldman, DA & Yammarino, FJ 2004, 'CEO
charisma, compensation, and firm performance', The Leadership Quarterly,
vol. 15, pp. 405-25.
Tracey, JB & Hinkin, TR 1998, 'Transformational leadership or effective managerial
practices?', Group & Organization Management, vol. 23, no. 220-236.
Triandis, H 2001, 'Individualism-collectivism and personality', Journal of
Personality, vol. 69, pp. 907-24.
Tsai, C-W 2008, 'Leadership style and employee's job satisfaction in international
tourist hotels', in AG Woodside (ed.), Advances in Culture, Tourism and
Hospitality Research, Emerald Group Publishing Limited, vol. 2, pp. 293-
332.
Tuckett, AG 2005, 'Applying thematic analysis theory to practice: A researcher's
experience', Contemporary Nurse, vol. 19, no. 1-2, pp. 75-87.
Tzokas, N, Carter, S & Kyriazopoulos, P 2001, 'Marketing and entrepreneurial
orientation in small firms', Enterprise and Innovation Management Studies,
vol. 2, no. 1, pp. 19-33.
Vaccaro, IG, Jansen, JJP, Van Den Bosch, FAJ & Volberda, HW 2010, 'Management
innovation and leadership: The moderating role of organizational size',
Journal of Management Studies, vol. 49, no. 1, pp. 28-51.
Valdiserri, GA & Wilson, JL 2010, 'The study of leadership in small business
organizations: Impact on profitability and organizational success', The
Entrepreneurial Executive, vol. 15, pp. 47-71.
Van, WM 2005, Dynamics of Leadership in Public Service: Theory and Practice, M.
E. Sharpe, Armonk, NY.
Venkatraman, N 1989, 'Strategic orientation of business enterprises: The construct,
dimensionality and measurement', Management Science, vol. 35, pp. 942-62.
Visser, DJ, de Coning, TJ & Smit, EvdM 2005, 'The relationship between the
characteristics of the transformational leader and the entrepreneur in South

386
African SMEs', South African Journal of Business Management, vol. 36, no.
3, pp. 51-63.
Voon, M-L, Lo, M-C, Ngui, K-S & Songan, P 2009, 'Leadership styles in context of
Institution of Higher Education in Malaysia', paper presented to International
Business and Information Conference (BAI 2009), Kuala Lumpur, Malaysia,
6-8 Julai 2009.
Waldman, DA, Bass, BM & Einstein, WO 1987, 'Effort, performance, and
transformational leadership in industrial and military settings', Journal of
Occupational Psychology, vol. 60, no. 177-186.
Waldman, DA, Bass, BM & Yammarino, FJ 1990, 'Adding to contingent-reward
behavior: The augmenting effects of charismatic leadership', Group &
Organization Studies, vol. 15, no. 4, pp. 381-94.
Waldman, DA, Ramirez, GG, House, RJ & Puranam, P 2001, 'Does leadership
matter? CEO leadership attributes and profitability under conditions of
perceived environmental uncertainty', Academy of Management Journal, vol.
44, pp. 134-43.
Waldman, DA & Yammarino, FJ 1999, 'CEO charismatic leadership: Levels-of-
management and levels-of-analysis effects. ', Academy of Management
Review, vol. 24, no. 2, pp. 266-85.
Wall, TD, Michie, J, Patterson, M, Wood, SJ, Sheehan, M, Clegg, CW & West, M
2004, 'On the validity of subjective measures of company performance',
Personnel Psychology, vol. 57, no. 1, pp. 95-118.
Walumbwa, FO & Lawler, JJ 2003, 'Building effective organizations:
transformational leadership, collectivist orientation, work-related attitudes
and withdrawal behaviours in three emerging economies', The International
Journal of Human Resource Management, vol. 14, no. 7, pp. 1083-101.
Wang, CL 2008, 'Entrepreneurial orientation, learning orientation, and firm
performance', Entrepreneurship Theory and Practice, vol. 32, no. 4, pp. 635-
57.
Wang, Y & Poutziouris, P 2010, 'Leadership styles, management systems and
growth: Empirical evidence from UK owner-managed SMEs', Journal of
Enterprising Culture, vol. 18, no. 3, pp. 331-54.
Ward, PT, Leong, GK & Boyer, KK 1994, 'Manufacturing proactiveness and
performance ', Decision Sciences, vol. 25, no. 3, pp. 337-59.
Watson, J 2003, 'SME performance: Does gender matter?', paper presented to 16th
Annual Conference of Small Enterprise Association of Australia and New
Zealand, Ballarat, Victoria, 28 Sept-1 Oct, 2003.
Wiklund, J 1998, 'Small Firm Growth and Performance: Entrepreneurship and
Beyond. ', Jönköping University.
Wiklund, J 1999, 'The sustainability of the entrepreneurial orientation--performance
relationship', Entrepreneurship: Theory & Practice, vol. 24, no. 1, pp. 39-50.
387
Wiklund, J & Shepherd, D 2005, 'Entrepreneurial orientation and small business
performance: A configurational approach', Journal of Business Venturing,
vol. 20, no. 1, pp. 71-91.
Wilderom, CPM & van den Berg, PT 2000, ‘Firm culture and leadership as firm
performance predictors: a resource-based perspective’., Tilburg University,
Netherlands.
Willis, K 2006, Analysing Qualitative Data. In M. Walter (Ed.), Social research
methods: An Australian Perspective (pp. 257-280). , Oxford University Press,
Melbourne.
Wright, M & Marlow, S 2012, 'Entrepreneurial activity in the venture creation and
development process', International Small Business Journal, vol. 30, no. 2,
pp. 107-14.
Xenikou, A & Simosi, M 2006, 'Organizational culture and transformational
leadership as predictors of business unit performance', Journal of Managerial
Psychology, vol. 21, no. 6, pp. 566-79.
Yahya, AZ, Fatt, CK, Othman, AS, Rahman, IA & Moen, J 2011, 'Management skills
and entrepreneurial success of small and medium enterprises (SMEs) in the
services sector', African Journal of Business Management, vol. 5, no. 26, pp.
10410-8.
Yammarino, FJ & Bass, BM 1990, 'Long-term forecasting of transformational
leadership and its effects among naval officers: some preliminary findings', in
KE Clark & M.B.Clark (eds), Measures of Leadership. , Center for Creative
Leadership, Greensboro, NC.
Yang, C-W 2008, 'The relationships among leadership styles, entrepreneurial
orientation, and business performance', Managing Global Transitions, vol. 6,
no. 257-275.
Yoo, S-J 2001, 'Entrepreneurial orientation, environmental scanning intensity, and
firm performance in technology-based SMEs', paper presented to
Babson/Kauffman Entrepreneurship Research Conference, Jonkoeping,
Sweden.
Yu, F 2012, 'Strategic flexibility, entrepreneurial orientation and firm performance:
Evidence from small and medium-sized business (SMB) in China', African
Journal of Business Management, vol. 64, no. 4, pp. 1711-20.
---- 2012, 'Strategic flexibility, entrepreneurial orientation and firm performance:
Evidence from small and medium-sized business (SMB) in China', African
Journal of Business Management, vol. 6, no. 4, pp. 1711-20.
Yukl, G 1989, 'Managerial leadership: A review of theory and research', Journal of
Management, vol. 15, pp. 251-89.
Yukl, G 1999, 'An evaluative essay on current conceptions of effective leadership',
European Journal of Work and Organizational Psychology, vol. 8, no. 1, pp.
33 - 48.
Yukl, G 2002, Leadership in Organizations, Prentice Hall, Upper Saddle River, NJ.

388
---- 2010, Leadership in Organizations, 7th edn, Prentice-hall, New Jersey.
Yukl, GA 1994, Leadership in Organizations, 3 edn, Prentice Hall, Englewood
Cliffs, NJ.
Yuksel, A, Yuksel, F & Bilim, Y 2010, 'Destination attachment: Effects on customer
satisfaction and cognitive, affective and conative loyalty', Tourism
Management, vol. 31, no. 2, pp. 274-84.
Zaccaro, SJ 2001, The Nature of Executive Leadership: A Conceptual and Empirical
Analysis of Success APA Books, Washington, DC.
Zagoršek, H, Dimovski, V & Škerlavaj, M 2009, 'Transactional and transformational
leadership impacts on organizational learning', Journal of East European
Management Studies, vol. 14, no. 2, pp. 144-65.
Zahra, SA 1991, 'Predictors and financial outcomes of corporate entrepreneurship:
An exploratory study', Journal of Business Venturing, vol. 6, no. 4, pp. 259-
85.
Zahra, SA 1996, 'Governance, ownership, and corporate entrepreneurship: the
moderating impact of industry technological opportunities. ', Academy of
Management Journal, vol. 39, no. 6, pp. 1713-35.
---- 2003, ' International expansion of U.S. manufacturing family businesses: The
effect of ownership and involvement', Journal of Business Venturing, vol. 18,
pp. 495–512.
Zahra, SA 2005, 'Entrepreneurial risk taking in family firms', Family Business
Review, vol. 18, no. 1, pp. 22-40.
Zahra, SR & Bogner, WC 2000, 'Technology and software new ventures'
performance', Journal of Business Venturing, vol. 15, pp. 135-73.
---- 2000, 'Technology strategy and new software ventures' performance: Exploring
the moderating effect of the competitive environment', Journal of Business
Venturing, vol. 15, no. 135-173.
Zainol, FA & Ayadurai, S 2011, 'Entrepreneurial orientation and firm performance:
The role of personality traits in Malay family firms in Malaysia',
International Journal of Business and Social Science, vol. 2, no. 1, pp. 59-71.
Zainol, FA & Wan Daud, WN 2011, 'Indigenous (Bumiputera) Malay entrepreneurs
in Malaysia: Government supports, entrepreneurial orientation and firms
performances', International Business and Management, vol. 2, no. 1, pp. 86-
99.
Zainuddin, MN & Ismail, H 2009, 'Evaluating nurtured entrepreneurial talent
programs in Malaysian universities', paper presented to National Leadership
Research Conference 2009: Entrepreneurship in higher education, Putrajaya
International Convention Centre.
Zellweger, TM, Nason, RS & Nordqvist, M 2011, 'From longevity of rims to
transgenerational entrepreneurship of families: Introducing family
entrepreneurial orientation', Family Business Review, vol. 20, no. 10, pp. 1-
20.

389
Zhou, H & De Wit, G 2009, Determinants and Dimensions of Firm Growth,
SCALES-initiative (SCientific AnaLysis of Entrepreneurship and SMEs),
Netherlands Ministry of Economic Affairs.
Zhu, W, Riggio, R, Sosik, J & Yang, B 2012, 'The impact of transformational
leadership on organizational identification: The role of psychological
empowerment. ', Journal of Behavioral and Applied Management, vol. 13,
no. 3, pp. 186-212.
Zikmund, W 2003, Business Research Methods, 7th edn, Thomson/South-Western,
Cincinnati, OH.
Zikmund, WG 1994, Business Research Methods, 4th edn, Harcourt Brace College
Publishers. , Orlando, FL.
Zimmermann, P, Wit, A & Gill, R 2008, 'The relative importance of leadership
behaviours in virtual and face-to-face communication settings', Leadership,
vol. 4, no. 3, pp. 321-37.
Zulkiffli, SNA & Perera, N 2011, 'A literature analysis on business performance for
SMEs: Subjective or objective measures?', paper presented to Society of
Interdisciplinary Business Research (SIBR) 2011 Conference on
Interdisciplinary Business Research., 16-18 June.
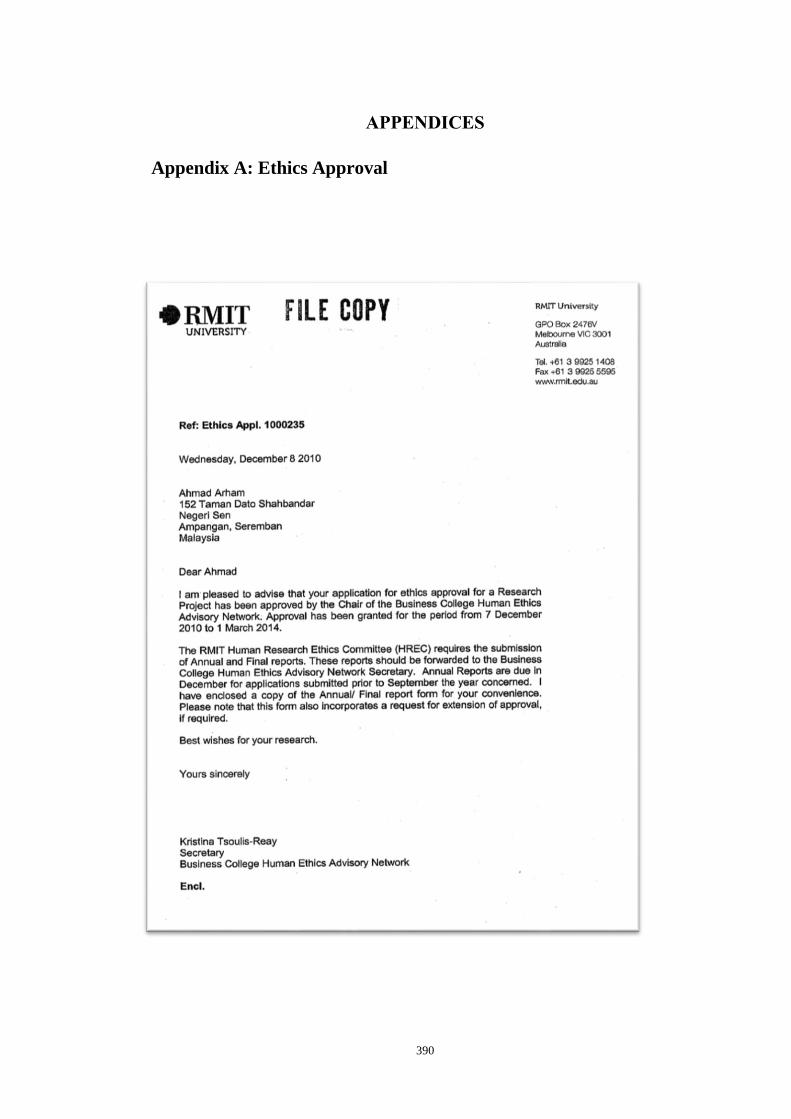
390
APPENDICES
Appendix A: Ethics Approval

391

392
Appendix B: Application to SME Corp Malaysia

393
Appendix C: Invitation to Participate in a Research Project
(Quantitaive)
PROJECT INFORMATION STATEMENT
Project Title: The Relationship between Leadership Behaviour, Entrepreneurial
Orientation and Organisational Performance in Malaysian Small and Medium
Enterprises
Investigators:
Mr. Ahmad Fadhly Arham (PhD degree student, [email protected] +613
99251689)
Dr. Nuttawuth Muenjohn (Principal Supervisor: RMIT University,
[email protected] +613 99255109
Associate Professor Carlene Boucher (Second Supervisor: RMIT University,
[email protected] +613 9925 5914)
Dear potential Participant,
You are invited to participate in a PhD research project being conducted by RMIT
University, in Melbourne Australia, which will take approximately 20-30 minutes to
complete. These two pages are to provide you with an overview of the proposed
research. Please read these pages carefully and be confident that you understand its
contents before deciding whether to participate. If you have any questions about the
project, please ask one of the investigators identified above.
I am currently a research student in the School of Management at RMIT University
in Melbourne, Australia. This project is being conducted as a part of my PhD degree.
My principal supervisor for this project is Dr. Nuttawuth Muenjohn and my second
supervisor is Associate Professor Carlene Boucher. The project has been approved by
the RMIT Business College human Ethics Advisory Network.
The participants in this research have been chosen randomly from a list previously
obtained from the SME Corp. Malaysia and SME Info Databases.
This study is designed to explore the relationships between leadership behaviours and
entrepreneurial orientation towards organisational performance of SMEs in Malaysia.
Up to 2000 people will be invited to complete the questionnaire. In the questionnaire
the participants need to answer the questions related to the leadership behaviours and
entrepreneurial orientation and their impacts towards organisational performance of
SMEs in Malaysia.

394
There are no perceived risks associated with participation outside of your normal
day-to-day activities. If you are unduly concerned about your responses or if you find
participation in the project distressing, you should contact my supervisor as soon as
convenient. My supervisor will discuss your concerns with you confidentially and
suggest appropriate follow-up, if necessary.
Participation in this research is entirely voluntary and anonymous. You may
withdraw your participation and any unprocessed data concerning you at any time,
without prejudice. There is no direct benefit to the participants as a result of their
participation. However, I will be delighted to provide you with a copy of the research
report upon request as soon as it is published.
I am asking you to participate in this survey to provide us with an insight into
understanding the relationships between leadership behaviours and entrepreneurial
orientation towards organisational performance of SMEs in Malaysia. Your privacy
and confidentiality will be strictly maintained in such a manner that you will not be
identified in the thesis report or any publication. Any information that you provide
can be disclosed only if (1) it is to protect you or others from harm, (2) a court order
is produced, or (3) you provide the researchers with written permission. The findings
of this study will be disseminated in conferences and published in journals.
You should be aware that the World Wide Web is an insecure public network that
gives rise to the potential risk that a user’s transactions are being viewed, intercepted
or modified by third parties or the data which the user downloads may contain
computer viruses or other defects.
This project will use an external site to create, collect and analyse data collected in a
survey format. The site we are using is SurveyMonkey.com. If you agree to
participate in this survey, the responses you give to the survey will be stored on a
host server that is used by the investigators only. No personal information will be
collected so none will be stored as data. Once we have completed our data collection
and analysis, we will import the data we collect to the RMIT server where it will be
stored securely for a period of five (5) years). The data on the SurveyMonkey.com
host will then be deleted and expunged. If you are reluctant to use the internet format,
you are still able to participate by downloading the questionnaire and mail it to the
researcher.
To ensure that data collected is protected, the data will be retained for five (5) years
upon completion of the project after which time paper records will be shredded and
placed in a security recycle bin and electronic data will be deleted/destroyed in a
secure manner. All hard data will be kept in a locked filling cabinet and soft data in a
password protected computer in the office of the investigator in the research lab at
RMIT University. Data will be saved on the University network system where
practicable (as the system provides a high level of manageable security and data
integrity, can provide secure remote access, and is backed up on a regular basis).
Only the researcher will have access to the data. Data will be kept securely at RMIT
University for a period of five years before being destroyed.

395
You have the right to have any unprocessed data withdrawn and destroyed, provided
it can be reliably identified, and it does not increase the risk for the participant.
Participants have also the right to have any questions, in relation to the project and
their participation, answered at any time. The interview participants have the right to
request that audio recording be terminated at any stage during the interview.
I am assuring you that responses will remain confidential and anonymous. The
findings of this research could be used by SME Corp. Malaysia and other
government related agencies to develop Malaysian leaders of SMEs to improve their
performance in the future.
If you have any queries regarding this project please contact me at +61 3 99251689
or +61 425 408620 or email me at [email protected] may also contact
my principle supervisor Dr. Nuttawuth Muenjohn, RMIT University at +613
99255109, [email protected] or my second supervisor Associate
Professor Carlene Boucher, RMIT University at +613 9925 5914,
Thank you very much for your contribution to this research.
Yours Sincerely,
AHMAD FADHLY ARHAM
PhD Candidate
Management school
RMIT University, level 13, 239 Bourke Street,
Melbourne, VIC 3000

396
Appendix D: Invitation to Participate in a Research Project
(Qualitative)
PROJECT INFORMATION STATEMENT
Project Title: The Relationship between Leadership Behaviour, Entrepreneurial
Orientation and Organisational Performance in Malaysian Small and Medium
Enterprises
Investigators:
Mr. Ahmad Fadhly Arham (PhD degree student, [email protected] +613
99251689)
Dr. Nuttawuth Muenjohn (Principal Supervisor: RMIT University,
[email protected] +613 99255109
Associate Professor Carlene Boucher (Second Supervisor: RMIT University,
[email protected] +613 9925 5914)
Dear potential Participant,
You are invited to participate in a PhD research project being conducted by RMIT
University, which will take approximately 30-45 minutes to complete. These two
pages are to provide you with an overview of the proposed research. Please read
these pages carefully and be confident that you understand its contents before
deciding whether to participate. If you have any questions about the project, please
ask one of the investigators identified above.
I am currently a research student in the School of Management at RMIT University
in Melbourne, Australia. This project is being conducted as a part of my PhD degree.
My principal supervisor for this project is Dr. Nuttawuth Muenjohn and my second
supervisor is Associate Professor Carlene Boucher. The project has been approved by
the RMIT Business College human Ethics Advisory Network.
The participants in this research have been chosen randomly from those respondents
who have participated in the survey questionnaire and agreed to participate in the
interview with the researcher.
This study is designed to explore the relationships between leadership behaviours and
entrepreneurial orientation towards organisational performance of SMEs in Malaysia.
There will be 8 to 12 interviews to be conducted with selected respondents. In the
interviews you will be asked to answer the questions which relate to your leadership
behaviours and entrepreneurial orientation and their impacts towards organisational
performance of SMEs in Malaysia. As a matter of fact, your responses will contribute

397
to a better understanding of the relationships between leadership behaviours and
entrepreneurial orientation towards organisational performance of SMEs in Malaysia.
There are no perceived risks associated with participation outside of your normal
day-to-day activities. If you are unduly concerned about your responses or if you find
participation in the project distressing, you should contact my supervisor as soon as
convenient. My supervisor will discuss your concerns with you confidentially and
suggest appropriate follow-up, if necessary.
Participation in this research is entirely voluntary and anonymous. There is no direct
benefit to the participants as a result of their participation. However, I will be
delighted to provide you with a copy of the research report upon request as soon as it
is published.
Your privacy and confidentiality will be strictly maintained in such a manner that
you will not be identified in the thesis report or any publication. Any information that
you provide can be disclosed only if (1) it is to protect you or others from harm, (2) a
court order is produced, or (3) you provide the researchers with written permission.
Interview data will be only seen by my supervisor and examiners who will also
protect you from risk. The findings of this study will be disseminated in conferences
and published in journals.
To ensure that data collected is protected, the data will be retained for five years
upon completion of the project after which time paper records will be shredded and
placed in a security recycle bin and electronic data will be deleted/destroyed in a
secure manner. All hard data will be kept in a locked filling cabinet and soft data in a
password protected computer in the office of the investigator in the research lab at
RMIT University. Data will be saved on the University network system where
practicable (as the system provides a high level of manageable security and data
integrity, can provide secure remote access, and is backed up on a regular basis).
Only the researcher will have access to the data. Data will be kept securely at RMIT
University for a period of five years before being destroyed.
You have right to withdraw your participation at any time, without prejudice. You
have the right to have any unprocessed data withdrawn and destroyed, provided it
can be reliably identified, and it does not increase the risk for the participant.
Participants have also the right to have any questions, in relation to the project and
their participation, answered at any time. The interview participants have the right to
request that audio recording be terminated at any stage during the interview.
I am assuring you that responses will remain confidential and anonymous. The
findings of this research could be used by SME Corp. Malaysia and other
government related agencies to develop Malaysian leaders of SMEs to improve their
performance in the future.
If you have any queries regarding this project please contact me at +61 3 99251689
or +61 425 408620 or email me at [email protected] may also contact
my principle supervisor Dr. Nuttawuth Muenjohn, RMIT University at +613

398
99255109, [email protected] or my second supervisor Associate
Professor Carlene Boucher, RMIT University at +613 9925 5914,
Thank you very much for your contribution to this research.
Yours Sincerely,
AHMAD FADHLY ARHAM
PhD Candidate
Management school
RMIT University, level 13, 239 Bourke Street,
Melbourne, VIC 3000
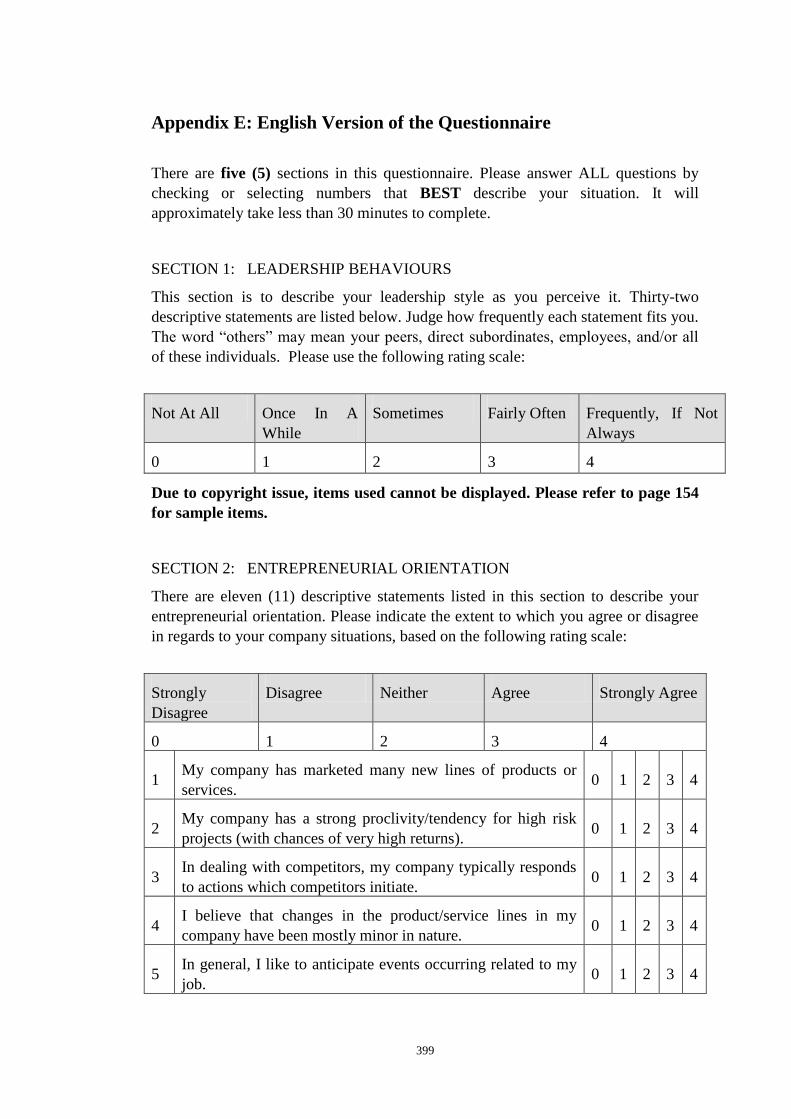
399
Appendix E: English Version of the Questionnaire
There are five (5) sections in this questionnaire. Please answer ALL questions by
checking or selecting numbers that BEST describe your situation. It will
approximately take less than 30 minutes to complete.
SECTION 1: LEADERSHIP BEHAVIOURS
This section is to describe your leadership style as you perceive it. Thirty-two
descriptive statements are listed below. Judge how frequently each statement fits you.
The word “others” may mean your peers, direct subordinates, employees, and/or all
of these individuals. Please use the following rating scale:
Not At All Once In A
While
Sometimes Fairly Often Frequently, If Not
Always
0 1 2 3 4
Due to copyright issue, items used cannot be displayed. Please refer to page 154
for sample items.
SECTION 2: ENTREPRENEURIAL ORIENTATION
There are eleven (11) descriptive statements listed in this section to describe your
entrepreneurial orientation. Please indicate the extent to which you agree or disagree
in regards to your company situations, based on the following rating scale:
Strongly
Disagree
Disagree Neither Agree Strongly Agree
0 1 2 3 4
1 My company has marketed many new lines of products or
services. 0 1 2 3 4
2 My company has a strong proclivity/tendency for high risk
projects (with chances of very high returns). 0 1 2 3 4
3 In dealing with competitors, my company typically responds
to actions which competitors initiate. 0 1 2 3 4
4 I believe that changes in the product/service lines in my
company have been mostly minor in nature. 0 1 2 3 4
5 In general, I like to anticipate events occurring related to my
job. 0 1 2 3 4

400
6 In general I favor a strong emphasis on Research &
Development, technological leadership and innovations. 0 1 2 3 4
7
When confronted with decision making involving
uncertainty, my company typically adopts a bold strategy in
order to maximize the probability of exploiting opportunities.
0 1 2 3 4
8 I am willing to try new ways of doing things and seek
unusual, novel solutions. 0 1 2 3 4
9 In dealing with competitors, my company typically initiates
actions which competitors then respond to. 0 1 2 3 4
10
When confronted with decision making situations involving
uncertainty, my company adopts a cautious “wait-and-see”
strategy.
0 1 2 3 4
11
In dealing with competitors, my company is very often the
first to introduce new products, and administrative
techniques.
0 1 2 3 4
SECTION 3: ORGANISATIONAL PERFORMANCE
There are eight (8) descriptive statements in this section to describe your
organisational performance. Please evaluate the following performance of your
business based on the following rating scale:
Strongly
Disagree
Disagree Neither Agree Strongly Agree
0 1 2 3 4
1 We are satisfied with the return on our investments. 0 1 2 3 4
2 The growth of our company is above average 0 1 2 3 4
3 We have higher return on investment (than our competitors). 0 1 2 3 4
4 Our growth is satisfying. 0 1 2 3 4
5 We are satisfied with our return on sales. 0 1 2 3 4
6 Our market shares are increasing faster than those of our
competitors. 0 1 2 3 4
7 In general, my company has achieved a very positive financial
outcome. 0 1 2 3 4
8 My company is growing steadily for the past three years. 0 1 2 3 4

401
SECTION 4: BACKGROUND OF BUSINESS / PARTICIPANT
Please check/select on the most appropriate number that BEST describe your
situation.
Which industry that is best to describe
your organisation?
Manufacturing and/or Manufacturing
related services 1
Services and/or Information &
Communication Technology (ICT) 2
Other (please specify) :
_______________ 3
I am ……….
The owner of this firm 1
The top management of this firm 2
What is your sales turnover last year?
Less than RM50,000 1
RM50,000 < RM 200,000 2
RM200,000 < RM 1 million 3
RM 1 million < RM 5 million 4
RM 5 million < RM 10 million 5
RM10 million < RM 25 million 6
How many full time employees do you
have?
Less than 5 1
5 to 19 2
20 to 50 3
51 to 150 4
More than 150 5
Age
Below 25 years 1
25 – 30 years 2
31 – 40 years 3
41- 50 years 4
Above 51 years 5
Gender
Male 1
Female 2
Race
Malay 1
Chinese 2
Indian 3
Other ____________ 4
Highest education level
Secondary Education 1
Certificate/Diploma 2
Degree/Bachelor 3
Master 4
PhD or Doctorate 5
Other __________________ 6

402
SECTION 5: WILLINGNESS TO PARTICIPATE IN THE INTERVIEW
Are you willing to participate in an interview with the researcher in the future?
Yes 1 (please fill in the details provided below)
No 2
-------------------------------------------------------------------------------------------------------
Details of potential participant for interview
Name :
Address :
Contact Details
Tel (Office) :
Fax (Office) :
Mobile :
Email address :
- End of Questionnaire -
- Thank you very much for taking the time to complete this questionnaire -
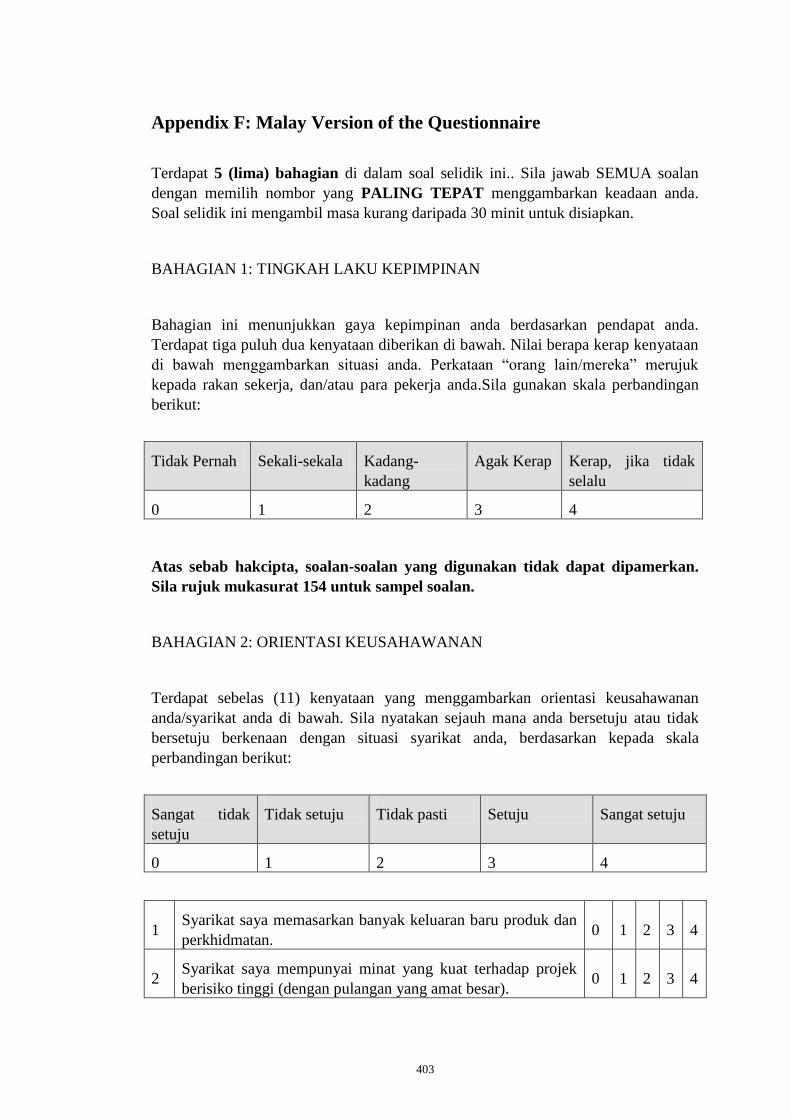
403
Appendix F: Malay Version of the Questionnaire
Terdapat 5 (lima) bahagian di dalam soal selidik ini.. Sila jawab SEMUA soalan
dengan memilih nombor yang PALING TEPAT menggambarkan keadaan anda.
Soal selidik ini mengambil masa kurang daripada 30 minit untuk disiapkan.
BAHAGIAN 1: TINGKAH LAKU KEPIMPINAN
Bahagian ini menunjukkan gaya kepimpinan anda berdasarkan pendapat anda.
Terdapat tiga puluh dua kenyataan diberikan di bawah. Nilai berapa kerap kenyataan
di bawah menggambarkan situasi anda. Perkataan “orang lain/mereka” merujuk
kepada rakan sekerja, dan/atau para pekerja anda.Sila gunakan skala perbandingan
berikut:
Tidak Pernah Sekali-sekala Kadang-
kadang
Agak Kerap Kerap, jika tidak
selalu
0 1 2 3 4
Atas sebab hakcipta, soalan-soalan yang digunakan tidak dapat dipamerkan.
Sila rujuk mukasurat 154 untuk sampel soalan.
BAHAGIAN 2: ORIENTASI KEUSAHAWANAN
Terdapat sebelas (11) kenyataan yang menggambarkan orientasi keusahawanan
anda/syarikat anda di bawah. Sila nyatakan sejauh mana anda bersetuju atau tidak
bersetuju berkenaan dengan situasi syarikat anda, berdasarkan kepada skala
perbandingan berikut:
Sangat tidak
setuju
Tidak setuju Tidak pasti Setuju Sangat setuju
0 1 2 3 4
1 Syarikat saya memasarkan banyak keluaran baru produk dan
perkhidmatan. 0 1 2 3 4
2 Syarikat saya mempunyai minat yang kuat terhadap projek
berisiko tinggi (dengan pulangan yang amat besar). 0 1 2 3 4

404
3 Dalam menghadapi pesaing, syarikat saya lazimnya bertindak
balas terhadap tindakan yang dimulakan pesaing. 0 1 2 3 4
4
Saya percaya bahawa perubahan pada keluaran
produk/perkhidmatan di dalam syarikat saya kebanyakannya
adalah kecil.
0 1 2 3 4
5 Secara umumnya, saya suka memberi menjangkakan perkara
yang akan berlaku melibatkan kerja-kerja saya. 0 1 2 3 4
6
Secara umumnya, saya suka memberi penekanan yang kuat
ke atas Penyelidikan & Pembangunan, kepimpinan teknologi
dan inovasi.
0 1 2 3 4
7
Apabila berhadapan dengan proses membuat keputusan yang
melibatkan ketidakpastian, syarikat saya lazimnya
mengambil langkah berani untuk memaksimumkan
kemungkinan memanfaatkan peluang yang ada.
0 1 2 3 4
8
Saya bersedia untuk mencuba cara baru dalam melakukan
sesuatu perkara dan mencari penyelesaian yang baru serta
luar biasa.
0 1 2 3 4
9
Dalam menghadapi pesaing, syarikat saya lazimnya
memulakan tindakan yang kemudiannya dibalas/diikiuti oleh
pesaing.
0 1 2 3 4
10
Apabila berhadapan dengan proses membuat keputusan yang
melibatkan ketidakpastian, syarikat saya mengambil langkah
berhati-hati “tunggu dan lihat”.
0 1 2 3 4
11
Dalam menghadapi pesaing, biasanya syarikat sayalah yang
pertama memperkenalkan produk dan teknik pentadbiran
baharu.
0 1 2 3 4
BAHAGIAN 3: PRESTASI ORGANISASI
Terdapat lapan (8) kenyataan yang menggambarkan prestasi organisasi syarikat anda.
Sila nyatakan sejauh mana anda bersetuju atau tidak bersetuu dengan kenyataan di
bawah berdasarkan keapda skala perbandingan berikut:
Sangat tidak
setuju
Tidak setuju Tidak pasti Setuju Sangat setuju
0 1 2 3 4
1 Kami berpuashati dengan pulangan pelaburan kami. 0 1 2 3 4
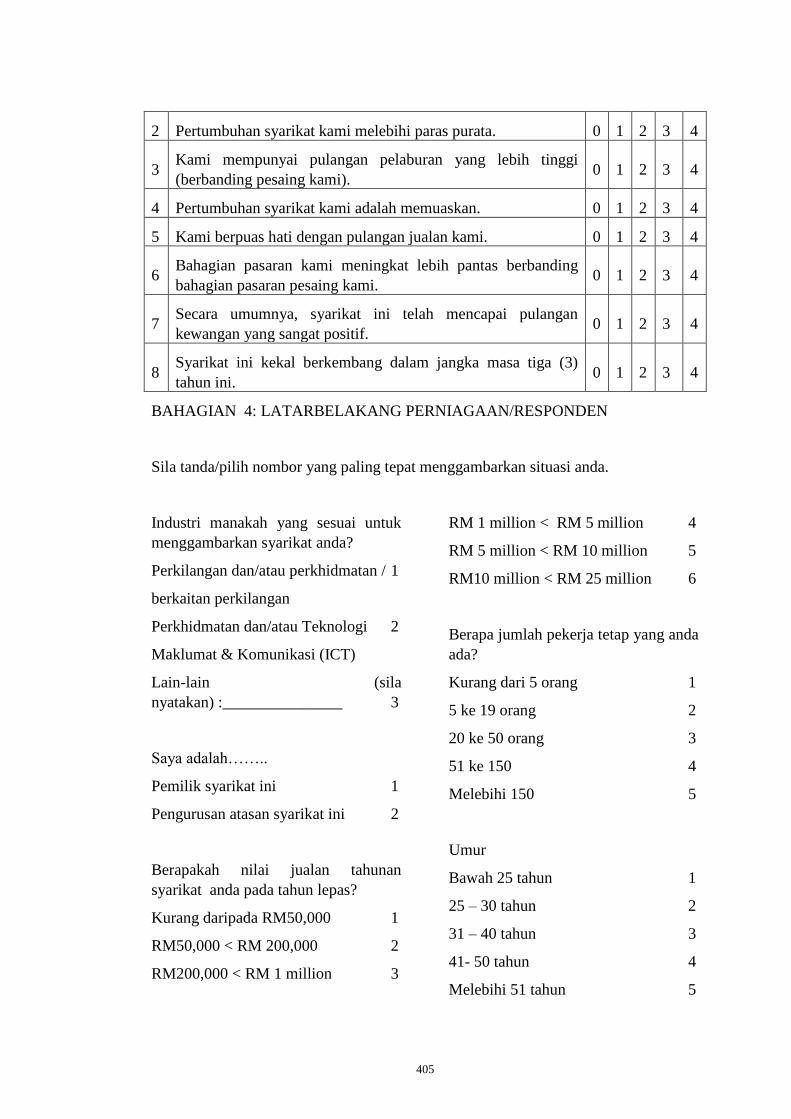
405
2 Pertumbuhan syarikat kami melebihi paras purata. 0 1 2 3 4
3 Kami mempunyai pulangan pelaburan yang lebih tinggi
(berbanding pesaing kami). 0 1 2 3 4
4 Pertumbuhan syarikat kami adalah memuaskan. 0 1 2 3 4
5 Kami berpuas hati dengan pulangan jualan kami. 0 1 2 3 4
6 Bahagian pasaran kami meningkat lebih pantas berbanding
bahagian pasaran pesaing kami. 0 1 2 3 4
7 Secara umumnya, syarikat ini telah mencapai pulangan
kewangan yang sangat positif. 0 1 2 3 4
8 Syarikat ini kekal berkembang dalam jangka masa tiga (3)
tahun ini. 0 1 2 3 4
BAHAGIAN 4: LATARBELAKANG PERNIAGAAN/RESPONDEN
Sila tanda/pilih nombor yang paling tepat menggambarkan situasi anda.
Industri manakah yang sesuai untuk
menggambarkan syarikat anda?
Perkilangan dan/atau perkhidmatan / 1
berkaitan perkilangan
Perkhidmatan dan/atau Teknologi 2
Maklumat & Komunikasi (ICT)
Lain-lain (sila
nyatakan) :_______________ 3
Saya adalah……..
Pemilik syarikat ini 1
Pengurusan atasan syarikat ini 2
Berapakah nilai jualan tahunan
syarikat anda pada tahun lepas?
Kurang daripada RM50,000 1
RM50,000 < RM 200,000 2
RM200,000 < RM 1 million 3
RM 1 million < RM 5 million 4
RM 5 million < RM 10 million 5
RM10 million < RM 25 million 6
Berapa jumlah pekerja tetap yang anda
ada?
Kurang dari 5 orang 1
5 ke 19 orang 2
20 ke 50 orang 3
51 ke 150 4
Melebihi 150 5
Umur
Bawah 25 tahun 1
25 – 30 tahun 2
31 – 40 tahun 3
41- 50 tahun 4
Melebihi 51 tahun 5

406
Gender
Lelaki 1
Perempuan 2
Bangsa
Melayu 1
Cina 2
India 3
Lain-lain _______________ 4
Tahap pendidikan tertinggi
Pendidikan Menengah 1
Sijil/Diploma 2
Ijazah Sarjana Muda 3
Ijazah Sarjana 4
Ijazah Kedoktoran 5
Lain-lain _________________6
BAHAGIAN 5: KESEDIAAN UNTUK TURUT SERTA DALAM TEMU BUAL
Adakah anda bersedia untuk turut serta dalam temu bual dengan penyelidik pada
masa akan datang?
Ya 1 (sila isikan butiran anda di ruangan yang disediakan di bawah)
Tidak 2
-------------------------------------------------------------------------------------------------------
Butiran responden untuk ditemu duga:
Nama :
Alamat :
No Tel (Office) :
Fax (Office) :
Mobile :
Email address :
- Soal Selidik Tamat -
- Terima kasih di atas kesudian anda untuk menyiapkan soal selidik ini -

407
Appendix G: Interview Schedule
DEMOGRAPHIC DATA
Company Name :
Industry/Nature of Business :
What is your position in the company:
How long have you run this company? / How long have you been working with this
company?:
Number of Employees :
Annual Turnover :
Age :
Education Background :
LEADERSHIP STYLE
How do you describe the working environment within your organisation?
How would you describe your relationship with your employees?
What factors would influence your leadership style?
Do you think that your leadership style has any influence on your organisational
performance?
Do you think your leadership style affect your entrepreneurial attitude?
ENTREPRENEURIAL ORIENTATION/ATTITUDE
Has your company marketed many new line services in the past five years?
In your opinion, do your company respond to the competitors or do you think that the
competitors respond to your actions?
In regards to the risk taking, do you think that you are willing to take high risk with a
chance of a very high return?
In your opinion what factors would affect/influence your Entrepreneurial attitude?
Do you think that your entrepreneurial attitude has any influence on your
organisational performance?

408
ORGANISATIONAL PERFORMANCE
In the last 3 years, do you satisfy with your organisational performance in terms of
the profitability and growth?
How do you see your organisational performance as compared to your competitors?
What other factors might influence your organisational performance, besides your
leadership and EO?
Copyright © 2022 FDOKUMEN