
The Relationship Between Student Engagement ... - CiteSeerX
286
The Relationship Between Student Engagement and Standardized Test Scores of Middle School Students: Does Student Engagement Increase Academic Achievement? A DISSERTATION SUBMITTED TO THE FACULTY OF THE GRADUATE SCHOOL OF THE UNIVERSITY OF MINNESOTA BY Matthew James Scheidler IN PARTIAL FULFILLMENT OF THE REQUIREMENTS FOR THE DEGREE OF DOCTOR OF EDUCATION Advisor: Dr. Neal Nickerson October, 2012
-
Upload
khangminh22 -
Category
Documents
-
view
1 -
download
0
Transcript of The Relationship Between Student Engagement ... - CiteSeerX

The Relationship Between Student Engagement and Standardized Test Scores of Middle
School Students: Does Student Engagement Increase Academic Achievement?
A DISSERTATION
SUBMITTED TO THE FACULTY OF THE GRADUATE SCHOOL
OF THE UNIVERSITY OF MINNESOTA
BY
Matthew James Scheidler
IN PARTIAL FULFILLMENT OF THE REQUIREMENTS
FOR THE DEGREE OF
DOCTOR OF EDUCATION
Advisor: Dr. Neal Nickerson
October, 2012

© Matthew J Scheidler, 2012

i
Acknowledgements
I am extremely fortunate to be associated with caring and thoughtful loved ones
that have guided me through the Dissertation experience. The people listed in the
following paragraphs deserve special recognition for their extraordinary support.
My father-Jim Scheidler has been the bedrock for me throughout this process. He
has listened to me when I was frustrated, he has provided sage advice, and he has asked
thoughtful questions in an effort to gently nudge me in the right direction. His faith in me
has been unwavering, and he has inspired me to reach my potential as a scholar and as a
person. I am fortunate to have such a supportive and caring father. Thanks dad!
My brother and sister-I have been blessed to grow up with the best brother and
sister anyone could ask for. My brother Nathan has been a role model as he has followed
his dreams, traveled the world, and always been there for me. Nathan has always been
very supportive of my higher education goals and his focus and insight has helped me
immensely. My sister Mary and I have many similarities, including our current student
status. My sister is studying to become a nurse, and her job will be to make the world a
better place by helping the people she serves. I hope I can mirror her good works.
Mary has been active in the Race for the Cure in Milwaukee, and her commitment to this
cause is evidenced by her countless hours of volunteering, coordinating, and
communicating.
The Triumvirate-Dr. Renee Corneille, Dr. Tim Anderson and I have known each
other for a decade or so, and I am extremely fortunate to be able to pick their brains
regarding educational dilemmas, Ed. D. requirements, and life situations. Renee and I

ii
first met in our Masters of Education/Initial Licensure program at the University of
Minnesota in 1997-98, and I knew right away she was someone I wanted to be around.
Her zest for life, her passion about everything she is involved with has fascinated me.
Tim and I were roommates when we began the Ed. D. voyage, and we have remained
friends and confidantes as we have matriculated. Tim has displayed a resolve and focus
while he has worked towards his Ed. D., and he has been an incredible help to me. I never
laugh as hard or as often as when I‘m with Tim and Renee. They are truly lifelong
learners and lifelong friends.
My Advisor-Dr. Neal Nickerson has been the galvanizing force that has helped
me immerse in the Ed. D. experience. I knew Neal would be the perfect advisor when I
first met him in my EDPA 5396 class. Arriving early on a Saturday morning, I was
startled to find Neal making coffee, and he had treats set out for all the students. We had
the chance to chat about our backgrounds, and I knew this was a very special professor.
Neal has expertly shepherded me through the Ed. D process, and his omnipresent positive
attitude has helped me believe in my capabilities. Neal has constantly told me that I can
complete my doctorate if I would ―just listen to him,‖ and that is exactly what I intend to
do. Thanks for everything Neal!

iii
Dedication
This dissertation is dedicated to my mother, Ellen Marie Scheidler. My mother
was the most beautiful, the strongest, and the friendliest person that I have ever met.
Furthermore, she had a love of learning. Though I didn‘t necessarily display an affinity
for education in my younger years, my mother‘s calming and caring influence eventually
took hold. I became a better person, grew less bitter about life‘s disappointments, and
was quick to praise others when something went well. My mom could always find the
positive in a situation, and she always tried to enhance any situation she was involved
with. My mother lost her battle with breast cancer in October, 1999. I have dedicated
myself to replicating her everlasting positive attitude and her commitment to helping
others.
iv
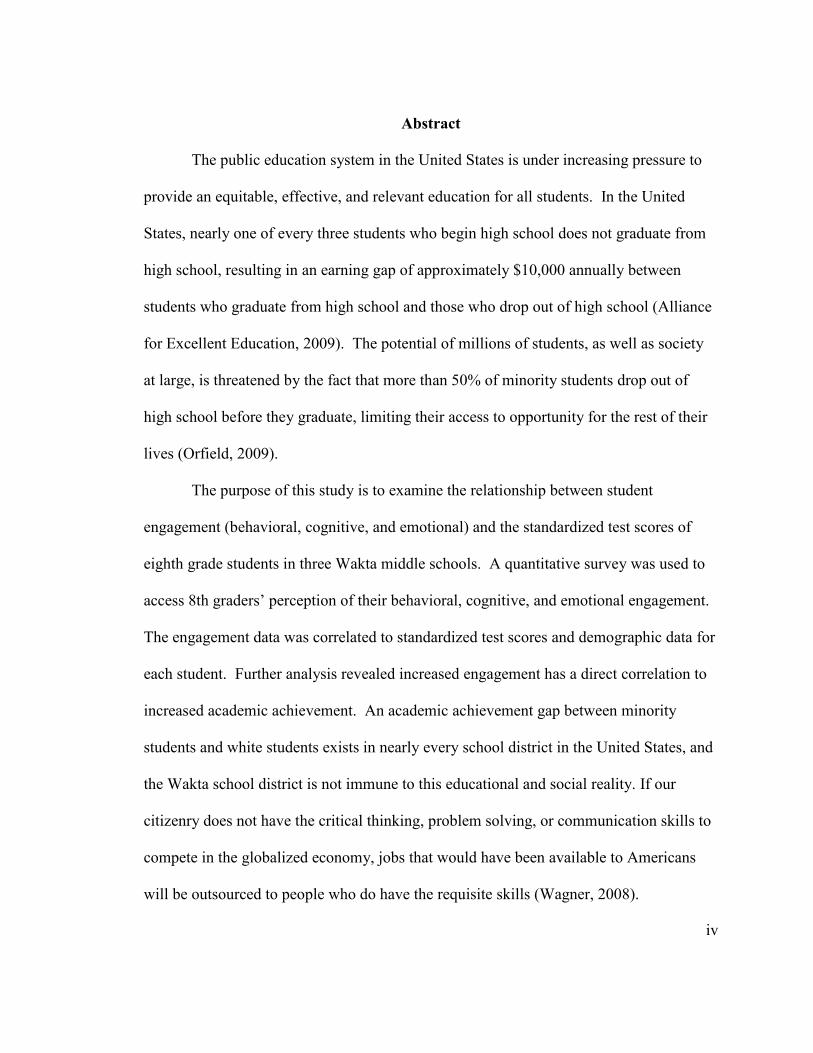
Abstract
The public education system in the United States is under increasing pressure to
provide an equitable, effective, and relevant education for all students. In the United
States, nearly one of every three students who begin high school does not graduate from
high school, resulting in an earning gap of approximately $10,000 annually between
students who graduate from high school and those who drop out of high school (Alliance
for Excellent Education, 2009). The potential of millions of students, as well as society
at large, is threatened by the fact that more than 50% of minority students drop out of
high school before they graduate, limiting their access to opportunity for the rest of their
lives (Orfield, 2009).
The purpose of this study is to examine the relationship between student
engagement (behavioral, cognitive, and emotional) and the standardized test scores of
eighth grade students in three Wakta middle schools. A quantitative survey was used to
access 8th graders‘ perception of their behavioral, cognitive, and emotional engagement.
The engagement data was correlated to standardized test scores and demographic data for
each student. Further analysis revealed increased engagement has a direct correlation to
increased academic achievement. An academic achievement gap between minority
students and white students exists in nearly every school district in the United States, and
the Wakta school district is not immune to this educational and social reality. If our
citizenry does not have the critical thinking, problem solving, or communication skills to
compete in the globalized economy, jobs that would have been available to Americans
will be outsourced to people who do have the requisite skills (Wagner, 2008).

v
Table of Contents
Acknowledgments .............................................................................................. i
Dedication ......................................................................................................... iii
Abstract ............................................................................................................. iv
Table of Contents .............................................................................................. v
List of Tables .................................................................................................. xiii
Chapter One ...................................................................................................... 1
Problem Statement .......................................................................................... 1
Purpose of the Study ....................................................................................... 3
Research Questions ......................................................................................... 5
Context for the Study ...................................................................................... 7
Achievement Differences Between Groups of Students. ............................ 7
Student Engagement. .................................................................................... 10
Behavioral engagement. ........................................................................ 11
Cognitive engagement. ......................................................................... 11
Emotional engagement.......................................................................... 11
Definition of Key Terms ............................................................................... 13
Academic Achievement Gap. ................................................................... 13
Behavioral Engagement. ........................................................................... 14
Cognitive Engagement. ............................................................................. 14
Emotional Engagement. ............................................................................ 15
Developmentally Appropriate School Model (DASM). ........................... 15
vi
Teacher Support. ....................................................................................... 16
Delimitation and Limitations of the Study.................................................... 17
Chapter Two .................................................................................................... 20
Review of Literature ..................................................................................... 20
The Academic Achievement Gap ................................................................. 20
Policies Contributing to the Academic Achievement Gap. ...................... 22
The 1960s. ............................................................................................. 26
The 1970s. ............................................................................................. 28
The 1980s. ............................................................................................. 31
The 1990s. ............................................................................................ 32
The 2000‘s ........................................................................................... 33
Summary of Policies Contributing to the Academic Achievement Gap...36
Differences in Social Class. .................................................................. 37
Test Bias................................................................................................ 37
Heredity and Home Environment. ........................................................ 40
Poverty Levels of Schools .................................................................. 44
Segregation ......................................................................................... 46
Within School Factors That Contribute to the Gap. ................................. 49
Institutional Racism. ............................................................................. 50
Pre-school experiences.......................................................................... 51
Tracking. ............................................................................................... 51
Weak or inappropriate instruction. ....................................................... 52

vii
Class size. .............................................................................................. 54
Mobility..................................................................................................... 56
Student Engagement ..................................................................................... 59
Types of Student Engagement. ................................................................. 62
Behavioral engagement. ........................................................................ 62
Cognitive engagement. ......................................................................... 63
Emotional engagement.......................................................................... 64
DASM‘s, Teacher Support, and Disengagement .......................................... 64
Developmentally Appropriate School Model at the Middle Level. .......... 65
Teacher support. and Classroom Structure ............................................... 68
Authentic Pedagogy .................................................................................. 69
Disengagement .......................................................................................... 71
Oppositional Peer Culture and Stereotype Threat .................................... 76
National and Local Integration Plans ........................................................ 78
Open Enrollment and Voluntary Desegregation Programs ...................... 78
Interdisctict Voluntary Desegregation Plans ............................................ 79
The Choice is Yours (TCIY) Program ...................................................... 81
Summary ................................................................................................... 87
Chapter Three ................................................................................................. 88
Research Methods ......................................................................................... 88
Rationale for the Research Design ................................................................ 88
The Site ......................................................................................................... 90

viii
Sampling Frame. ....................................................................................... 92
Data Collection Tools ................................................................................... 92
The Survey Instrument. ............................................................................. 92
Potential Limitations of the Survey Instrument. ....................................... 98
Achievement Data. .................................................................................... 98
Overview of the Data Collection Process ................................................... 100
The Survey. ............................................................................................. 100
Use of a Modified Tailored Design Method. .......................................... 101
Online Web Based Survey Limitations................................................... 105
The Sample and Response Rate. ......................................................... 106
Data Preparation.......................................................................................... 108
Variable Construction ................................................................................. 109
Data Analysis Methods ............................................................................... 110
Descriptive Statistics. .............................................................................. 110
Inferential Statistics. ............................................................................... 110
Ethical Considerations ................................................................................ 113
Chapter Four ................................................................................................. 115
Survey Results ............................................................................................ 115
Research Questions ..................................................................................... 115
Characteristics of Participants..................................................................... 116
Demographic Characteristics of Participants. ......................................... 121
Research Question One: What is student academic engagement? .......... 128

ix
Research Question 1a: What forms of student engagement emerge? . 128
Subquestion 1b: What are the relationships between these types of
student academic engagement? ........................................................... 128
Subquestion 1c: How does student engagement emerge by school, by
demographic indicators, and overall? ................................................. 130
Research Question Two: What is the relationship between student
engagement and student achievement? ................................................... 146
Subquestion 2a: What is the relationship between student academic
engagement and performance on the reading and mathematics portions
of the MCA II? .................................................................................... 146
Subquestion 2b: What is the relationship between student engagement and
performance on the MAP mathematics and reading assessments? ..................... 148
Research Question Three: What is the relationship between all student
ethnic groups on student engagement and academic achievement? ....... 150
Subquestion 3a: What is the relationship between all student ethnic
groups student engagement and MCA II Mathematics and Reading
scores? ................................................................................................. 150
Subquestion 3b: What is the relationship between student engagement
and MAP Mathematics and Reading scores?...................................... 153
Research Question Four: What is the relationship between students‘
academic engagement and the developmentally appropriate school model,
teacher support, school culture, authentic pedagogy? ............................ 155

x
Subquestion 4a: What is the relationship between student engagement
and teacher support? ........................................................................... 155
Subquestion 4b: What is the relationship between student engagement
and the developmentally appropriate school model? .......................... 157
Subquestion 4c: What is the relationship between student engagement
and school culture? ............................................................................. 159
Subquestion 4d: What is the relationship between student engagement
and authentic pedagogy? ..................................................................... 161
Subquestion 4e: What is the relationship between student engagement
and fairness?........................................................................................ 163
Subquestion 4f: What were the differences between student experiences
of experiences of teacher support, the developmentally appropriate
school model, school culture, authentic pedagogy, and fairness? ...... 165
Research Question Five: To what degree can student academic
engagement decrease or increase the effects of ethnicity on student
academic achievement? .......................................................................... 169
Chapter Summary ....................................................................................... 180
Chapter Five .................................................................................................. 182
Conclusions ................................................................................................. 182
Purpose and Significance of the Study ....................................................... 182
Research Questions ..................................................................................... 183
Summary of the Findings ............................................................................ 185

xi
Student Engagement. .............................................................................. 185
Student Engagement and Academic Achievement. ................................ 186
Ethnicity, Engagement, and Academic Achievement............................. 188
School Model, Teacher Support, and Engagement. ................................ 189
Developmentally Appropriate School Model. .................................... 189
Teacher Support. ................................................................................. 190
Policy Considerations and Possible Implications ....................................... 193
Implications for Federal and State Policy. .............................................. 194
Implications for Districts and School Administrators. ........................... 207
Implications for Teachers. ...................................................................... 217
Implications for Further Research. ......................................................... 220
Critique of the Study ................................................................................... 223
Limitations of the Survey Instrument. .................................................... 223
Limitations of Student Participation ....................................................... 224
Limitations of the Data Collection Process ............................................ 224
Study Summary ........................................................................................... 225
References ...................................................................................................... 227
Appendix A ................................................................................................. 248
Appendix B ................................................................................................. 249
Appendix C ................................................................................................. 250
Appendix D ................................................................................................. 251
Appendix E ................................................................................................. 254

xii
Appendix F.................................................................................................. 256
Appendix G ................................................................................................. 263
Appendix H ................................................................................................. 264
xiii
List of Tables
Table 1.1 Inclusion Rate ................................................................................................... 19
Table 3.1 Survey Instrument ............................................................................................. 97
Table 3.2 Data Analysis by Research Question .............................................................. 112
Table 4.1 MCA II 2011Reading Results ......................................................................... 119
Table 4.2 MCA III 2011 Mathematics Results ................................................................ 120
Table 4.3 Demographic Data of 8th
Grade Students ...................................................... 122
Table 4.4 Factor Analysis ............................................................................................... 126
Table 4.5 Engagement Correlations ............................................................................... 129
Table 4.6 Summary of Descriptive Statistics for Student Engagement ........................... 130
Table 4.7 Summary of Descriptive Statistics for Each Middle School (MS #1, MS #2, and
MS #3) ..................................................................................................................... 133
Table 4.8 ANOVA to Determine if There is a Significant Difference Between Schools on
Engagement Scores ................................................................................................. 134
Table 4.9 Descriptive Statistics Comparing Male and Female Students on Engagment
................................................................................................................................. 136
Table 4.10 ANOVA to Determine if There is a Significant Difference Between Genders on
Student Engagement Scores .................................................................................... 138
Table 4.11 Descriptive Statistics Comparing Ethnicities on Student Engagement ........ 139
xiv
Table 4.12 ANOVA to Determine if There is a Significant Difference Between Ethnicities
on Engagement Scores ............................................................................................ 141
Table 4.13 Descriptive Statistics Comparing Students who Qualify and do not Qualify for
Free and Reduced Lunch, LEP, and Special Education on Student Engagement .. 143
Table 4.14 ANOVA to Determine if There is a Significant Difference Between Free and
Reduced Lunch, Special Education, and Limited English Proficiency on Engagement
Scores ...................................................................................................................... 145
Table 4.15 Correlations between MCA II achievement and Student Engagement ......... 147
Table 4.16 Correlations between MAP achievement and Student Engagement ............. 149
Table 4.17 Correlations for Student Engagement and MCA II Achievement. ................ 152
Table 4.18 Correlations for Student Engagement and MAP Achievement. .................... 154
Table 4.19 Correlations between Teacher Support and the Three Engagement Variables.
................................................................................................................................. 156
Table 4.20 Correlations between the Developmentally Appropriate School Model and the
Three Engagement Variables. ................................................................................. 158
Table 4.21 Correlations between the School Culture and the Three Engagement
Variables ................................................................................................................. 160
Table 4.22 Correlations between Authentic Pedagogy and the Three Engagement
Variables. ................................................................................................................ 162
Table 4.23 Correlations between Fairness and the Three Engagement Variables ........ 164

xv
Table 4.24 Summary of Descriptive Statistics for the Developmentally Appropriate
School Model, Teacher Support, Fairness, Authentic Pedagogy, and School Culture
for all students......................................................................................................... 166
Table 4.25 Wakta 8th
Grade Students and Teacher Support, Developmentally Appropriate
School Model, School Culture, Fairness, and Authentic Pedagogy ....................... 168
Table 4.26 Listwise Regression of MCA II Student Academic Achievement Based on
Engagement and Ethnicity (Asian and White Students). ........................................ 174
Table 4.27 Listwise Regression of MCA II Student Academic Achievement Based on
Engagement and Ethnicity (Hispanic and White Students). ................................... 175
Table 4.28 Listwise Regression of MCA II Student Academic Achievement Based on
Engagement and Ethnicity (Black and White Students). ........................................ 176
Table 4.29 Stepwise Regression of MCA II Student Academic Achievement Based on
Engagement and Ethnicity (Asian and White Students). ........................................ 177
Table 4.30 Stepwise Regression of MCA II Student Academic Achievement Based on
Engagement and Ethnicity (Hispanic and White Students). ................................... 178
Table 4.31 Stepwise Regression of MCA II Student Academic Achievement Based on
Engagement and Ethnicity (Black and White Students). ........................................ 179

1
Chapter One
If a nation expects to be ignorant and free, in a state of civilization, it expects
what never was and never will be.
Thomas Jefferson to Charles Yancey, 1816
Youngsters entering a new school and neighborhood are confronted with multiple
transition challenges. The challenges are compounded when the transition also
involves recent arrival to a new country and culture. In the short run, failure to
cope effectively with these challenges can result in major learning and behavior
problems; in the long run, the psychological and social impacts may be
devastating.
Cárdenas, Taylor, Adelman, 1993
Problem Statement
The public education system in the United States is in peril, and by
extension, so is the future of American society. As Thomas Jefferson indicates in
the quote above, our freedoms are limited by ignorance. Our civilization is
threatened by the fact that more than 50% of minority students drop out of high
school before they graduate, limiting their access to opportunity for the rest of
their lives (Orfield, 2009). The resegregation of schools in the U.S., particularly
racial resegregation, is a national scourge. In Shame of the Nation, Harvard
researchers Gary Orfield and Susan Eaton are cited for their adamant support of
integrated schools: ―American public schools are now 12 years into the process of
continuous resegregation. The desegregation of black students, which increased
continuously form the 1950‘s to the late 1980‘s, has now receded to levels not
seen in three decades‖ (Kozol, 2005, p. 19). Orfield & Eaton stipulate that

2
―Desegregation did not fail. In spite of a very brief period of serious
enforcement…the desegregation era was a period in which minority high school
graduates increased sharply and the racial test score gaps narrowed substantially
until they began to widen again in the 1990‘s‖ (Kozol, 2005, p. 19). As racial
segregation of students in U.S. schools has increased, especially in the urban
cores of the largest cities, the academic achievement gap has widened between
white students and minority students.
An academic achievement gap between minority students (primarily black
and Hispanic students) and white students exists in nearly every school district in
the United States, and the Wakta school district is not immune to this educational
and social reality. In the 2010-11 school year at Wakta MS #2, 83% of white 8th
grade students were proficient on the mathematics MCA-II test, while only 42%
of black 8th
grade students were proficient. The reading MCA-II test results were
similar: 91% of white 8th
grade students demonstrated proficiency, compared to
only 52% of black 8th
grade meeting proficiency requirements. The MCA-II
science results were more dismal, as 66% of white 8th
grade students and only
17% of black 8th
graders attained proficiency. The stark gap between minority and
white student scores on the MCA‘s in Wakta mirrors the achievement gap evident
in school districts across the nation. A black student of graduation age is four
years behind the average white student in terms of academic achievement
(Thernstrom & Thernstrom, 2003). This achievement gap is a national issue that
has global implications. If our citizenry does not have the critical thinking,

3
problem solving, or communication skills to compete in the globalized economy,
jobs that would have been available to Americans will simply be outsourced to
people who do have the capacity and requisite skills (Wagner, 2008).
One cohort of students relatively new to Wakta schools is composed of the
students that enroll via The Choice is Yours (TCIY) program. The Choice is
Yours Program emanated from the NAACP v. State of Minnesota (2001) case, and
it represented a voluntary desegregation effort between Minneapolis and eight
western suburban districts. The 2009 multi-year program evaluation of TCIY was
conducted by Aspen Associates, and both quantitative and qualitative data was
collected for the Minnesota Department of Education. Results were not
disaggregated by individual school, preventing an opportunity to compare and
contrast the experience of TCIY students in each school.
Purpose of the Study
The overarching purpose of this research is to enhance the educational
situation of students by informing educational leaders of student perceptions
regarding their eighth grade experience. The specific purpose of this research is to
investigate the relationship between the academic achievement (as measured by
standardized test scores) and student engagement (behavioral, cognitive, and
emotional). A postpositivist researcher ―…assumes a learning role rather than a
testing one‖ (Agar, 1988, p 12). Though administrators and teachers are viscerally
aware of an academic achievement gap between black and Hispanic students and
white and Asian students in Wakta, there is not a consensus on the reasons the gap

4
persists. The intent of this study is to determine if engagement does indeed have
an impact of narrowing the academic achievement gap between black and white
students. Researchers who employ a postpositivist approach view themselves as
―people who conduct research among other people, learning with them, rather
than conducting research on them‖ (Wolcott, 1990, p 19). This particular point
will be critical in the effort to convince school administrators and eighth grade
teachers that the trade-off of the loss of teaching time for the online student
survey will ultimately benefit all Wakta stakeholders.
Post-positivist research is often exploratory, and explanations for
problems ―sometimes have to be discovered‖ (Hammersley, 2000, p 456).
Students who participate in this study will have an opportunity to include their
comments regarding the reasons they feel they are engaged (or not engaged) in
their education. This research will be ―postpositivism in nature because it will
begin with a theory and data will be collected that will either support or disprove
the theory‖ (Sbrocco, 2009, p 88). Dr. Renee Sbrocco conducted the exact same
study in Bloomfield, MN in 2008. Dr. Sbrocco‘s research revealed a positive and
significant correlation between increased engagement and increased academic
achievement for black students (Sbrocco, 2009).
A postpositivism orientation lends itself to a variety of specific types of
methodology, including both qualitative and quantitative, as long as the purpose is
to look for regular and predictable associations among subjective variables (in this
case, attitudes regarding the 8th
grade experience) and achievement. The benefits
5
of a quantitative study were adroitly outlined by Ryan et al, in 2006. According
to Ryan et al, quantitative studies:
provide a broad familiarity with cases;
examine patterns across many cases;
show that a problem is numerically significant;
provide readily available and unambiguous information.
This study will be cross-sectional, as students will be assessed at a single
point in time (Sbrocco, 2009). Additionally, this study will be correlational.
Researchers utilize correlational studies to address the relationship of one variable
when another variable changes (Thomas, 2003). One advantage of using a
correlational study is the use of statistical techniques for calculating the degree of
a relationship between two variables. The major limitation of a correlational study
is the input data. If a researcher collects faulty data, the correlation is
compromised (Thomas, 2003).
Research Questions
The study has five specific research questions. The questions and related
sub questions are as follows:
1. What is student engagement?
a. What forms of student engagement emerge?
b. What are the relationships among the types of student
engagement?
c. How does student engagement emerge by school, by
demographic indicators, and overall?
6
2. What is the relationship between student engagement and student
academic achievement?
a. What is the relationship between student engagement and
performance on the Reading and Mathematics portions of the
MCA II?
b. What is the relationship between student engagement and
performance on the MAP Mathematics and Reading
assessments?
3. What is the relationship between 8th
grade students‘ engagement and
academic achievement?
a. What is the relationship between student engagement and MCA
Mathematics and Reading?
b. What is the relationship between student engagement
and MAP Mathematics and Reading?
4. What is the relationship between students‘ engagement,
developmentally appropriate schooling, and teacher support?
a. What is the relationship between student engagement and teacher
support?
b. What is the relationship between student engagement and
developmentally appropriate schooling?
c. What were the differences between 8th
grade students‘ experience

7
of both teacher support and developmentally appropriate
schooling?
5. To what degree can student engagement decrease or increase the
effects of ethnicity on student academic achievement?
Context for the study
The significance of this proposed study is to examine the relationship of
student engagement and academic achievement. This study will include all
Wakta eighth grade students, thus the Wakta School District will be a beneficiary
of the results of the student responses and accompanying analysis. Dr. Renee
Sbrocco utilized this survey and research design in her 2008 study and published
her findings in 2009. Once this study is complete, there will be data and analysis
regarding the relationship of student engagement and academic achievement for
both Bloomfield and Wakta, two similar suburban school districts. Each district
has three middle schools, and each district has approximately 10,000 students.
Achievement Differences Between Groups of Students
The Wakta Public School District is not immune to the presence of
academic achievement gaps among groups of students. In fact, an achievement
gap between black and Hispanic students and their white and Asian peers exists in
reading, mathematics, and science tests at every grade level in Wakta. The
vagaries of an achievement gap between groups of students have local, national
and global implications, yet there remains a relative lack of research focusing on
student perceptions regarding their educational experience.
8
The results of disengaged students are harrowing. In the U.S., nearly one of every
three students entering high school will not graduate (Alliance for Excellent
Education, 2012). According to the Alliance for Excellent Education, Hispanic
(56%) and black (54%) student graduation rates are significantly lower than their
white (77%) and Asian (81%) peers. This achievement gap leads directly to an
earning gap of approximately $10,000 between students who graduate from high
school and those who drop out of high school (Alliance for Excellent Education,
2009). The personal, social, and economic costs of disengagement are
quantifiable. According to Bridgeland et al, (2006):
High school dropouts live a decade less than graduates and are
disproportionately affected by heart disease, diabetes, and obesity.
A one percent reduction in dropout rates would reduce the number of
crimes by 100,000 annually. Increasing graduation rates by 10%
would correlate with a 20% reduction in murder and assault rates.
The lower wages of dropouts mean $36 billion dollars in state and
local funding is lost each year.
The children of dropouts are more likely to drop out and to live in
poverty.
The average high school dropout makes 27% less income per year than
the average high school graduate. Over a lifetime, this adds up to over
a quarter-million dollars in reduced personal capital.
Given the negative outcomes related to student disengagement, there have
been innumerable attempts to stanch the exodus of students from U.S. secondary
schools. One structural attempt to enhance the experience of students is the
implementation the middle school model. Students are placed in teams with a
common group of teachers who are able to discuss the emotional, social, and
academic progress (or regress) of each student (Turning Points, 2000). Middle
Schools are often arranged by some combination of students in grades 5-9. Wakta

9
completed a middle school self-study in 2008-09, and Turning Points 2000 served
as one of the guiding documents in this effort. Wakta has utilized a middle school
model since the 1997-98 school year. Individual differences in scheduling, course
offerings, etc., have emerged among the middle schools, creating divergent
learning opportunities for students. The main goal of the 2009 middle school self-
study was to create a common experience for all Wakta middle school students,
regardless of the school they attended. Advisory classes were instituted at the
beginning of the school day (between 8:20-8:40) in each middle school as a result
of the work of this committee, with the intent to ensure an adult advocate for each
student in middle school (Turning Points, 2000).
The public education system in the United States is the bedrock of our
society, serving as a beacon of hope for citizens to pursue the American Dream.
The future of U.S. civilization is threatened by the fact that more than 50% of
minority students drop out of high school before they graduate, limiting their
access to opportunity for the rest of their lives (Orfield, 2009). The resegregation
of schools is a national scourge. In Shame of the Nation, Harvard researchers
Gary Orfield and Susan Eaton are cited for their adamant support of integrated
schools: ―American public schools are now 12 years into the process of
continuous resegregation. The desegregation of black students, which increased
continuously form the 1950‘s to the late 1980‘s, has now receded to levels not
seen in three decades‖ (Kozol, 2005, p. 19).
Academic achievement gaps between groups of students exist in nearly

10
every school district in the United States, and the Wakta school district is not
immune to this educational and social reality. In the 2010-11 school year,
yawning gaps in achievement between groups of students were evident in the
MCA II Reading results. Of the 8th
grade students, 92.2% of Asian students,
90.6% of white students, 71.4% of Hispanic students, and 48.6% of black students
were proficient in reading. The 8th
grade mathematics MCA-III test results were
similar: 82.1% of Asian students, 72.2% of white students, 38.1% of Hispanic,
and 26.1% of black students demonstrated proficiency. The stark gap in academic
achievement between black and Hispanic students and white and Asian students
in Wakta mirrors the achievement gap evident in the overwhelming majority of
school districts across the nation. This achievement gap is a national issue that has
global implications.
One cohort of students relatively new to Wakta schools enroll via The
Choice is Yours (TCIY) program. The Choice is Yours Program emanated from
the NAACP v. State of Minnesota (2001) case, and it represented a voluntary
desegregation effort between Minneapolis and eight western suburban districts.
The 2009 multi-year program evaluation of TCIY was conducted by Aspen
Associates, and both quantitative and qualitative data was collected for the
Minnesota Department of Education. Unfortunately, the results were not
disaggregated by individual schools.
Student Engagement

11
Multiple researchers (e.g., Adelman & Taylor, 2010; Fredricks, Paris, &
Blumenfeld, 2004) have professed the positive educational outcomes associated
with students that are engaged in their education. Fredricks, Paris & Blumenfeld
(2004) summarized the connection between student engagement and academic
achievement:
Engagement is associated with positive academic outcomes, including
achievement and persistence in school; and it is higher in classrooms with
supportive teachers and peers, challenging and authentic tasks,
opportunities for choice, and sufficient structure (p. 4).
Fredricks, Blumenfeld, & Paris (2004) have identified and explained three
types of student engagement that have emerged in school research literature:
1) Behavioral engagement draws on the idea of participation; it includes
involvement in academic and social or extracurricular activities and is
considered crucial for achieving positive academic outcomes and
preventing dropping out.
2) Emotional engagement encompasses positive and negative reactions to
teachers, classmates, academics, and school and is presumed to create ties
to an institution and influences willingness to do the work.
3) Cognitive engagement draws on the idea of investment; it incorporates
thoughtfulness and willingness to exert the effort necessary to comprehend
complex ideas and master difficult skills. (p. 3).
Unfortunately, disengaged students are prevalent in schools both in the
United States and abroad. The existence of disaffected students is a global
problem and can occur at fluctuating levels in schools around the world
(Williams, 2003). Citing a devastating report issued by The National Research
Council and Institute of Medicine (2004), Dr. Sbrocco noted ―that large numbers

12
of American students are not fully engaged intellectually in the teaching and
learning enterprise‖ (Sbrocco, 2009, p. 9).
A low level of academic engagement has negative effects, one of which is
low academic achievement. Dropping out of school is the ultimate form of
disengagement (Finn, 1993), Dr. Sbrocco noted ―absenteeism, poor overall
attitude about school, and greater number of discipline referrals often portend
students at risk of prematurely leaving school (Sbrocco, 2009, p. 9). Minority
students demonstrate the highest levels of disengagement among U.S. students
(Voelkl, 1997). Adelman & Taylor (2010) outlined the deleterious effects of
disengagement in their research:
Conversely, for many students, disengagement is associated with behavior
problems, and behavior and learning problems may eventually lead to
dropout. From a psychological perspective, disengagement from
classroom learning is associated with threats to feelings of competence,
self-determination, and/or relatedness to value others. The demands may
be from school staff, peers, instructional content and processes.
Psychological disengagement can be expected to result in internalized
behavior (e.g., boredom, emotional distress) and/or externalized behavior
(misbehavior, dropping out) (p. 3).
As a result of the increased number of disengaged students, student
engagement (behavioral, cognitive, and emotional) has emerged as a crucial
aspect of education reform efforts intended to stanch the negative effects of
students who are not identifying with their school. Though not a panacea, student
engagement ―is seen as a possible antidote to declining student academic
motivation and achievement‖ (Sbrocco, 2009, p. 10).

13
Student engagement may be connected to student achievement, and, as a
result, may serve to create an equitable environment that could close the academic
achievement gap between black and Hispanic students and their Asian and white
peers. If students are motivated (intrinsically or extrinsically), they will often ―be
conscious and purposeful in the learning process‖ (National Research Council and
Institute of Medicine, 2003, p. 23). Dr. Sbrocco (2009) cited the work of Finn
(1993), Marks (2000), and Ogbu (2003) as she stated ―teacher behaviors, a
school‘s climate, and the elimination of racist beliefs can positively impact
student‘s academic engagement‖ (p. 10). Student engagement is malleable, and
results from an interaction between the student and the school setting (Connell,
1990; Finn & Rock, 1997; Fredricks, Blumenfeld, and Paris, 2004).
Definition of Key Terms
Academic Achievement Gap
The academic achievement gap in the United States is defined as the lower
average test scores, grades and college attendance rates among black and Latino
students compared to their white, non-Hispanic peers (Solomon, 2009). The
persistent achievement gap between black and white students shows up in grades,
standardized-test scores, course selection, dropout rates, and college-completion
rates (EPE, 2004). Myron Orfield‘s (2011) research found black students tend to
receive lower grades in school (Demo & Parker, 1987), score lower on
standardized tests of intellectual ability (Steele & Aronson, 1995), drop out at

14
higher rates (Steele, 1992), and graduate from college with substantially lower
grades than white students (Nettles, 1988).
Behavioral Engagement
Behavioral engagement includes both academic and nonacademic school
behavior, and research indicates that it has a significant impact on academic
achievement. Dr. Sbrocco (2009) posited that behavioral engagement can be seen
as positive student conduct, such as following the rules in the classroom and
demonstrating behaviors that do not disrupt the learning environment (Finn, 1993;
Finn, Pannozzo, & Voelkl, 1995; Finn & Rock, 1997). Another indicator of
behavioral engagement is a student‘s involvement in the daily routines of a
classroom. Behavioral engagement may be observed in the effort students
display, the amount and depth of questions asked, as well as their concentration
on various learning activities (Finn et al., 1995).
Cognitive Engagement
Cognitive engagement is dependent on the commitment a student invests
in the learning process (Fredericks, Blumenfeld, & Paris, 2004). Students who
demonstrate a commitment to learning attain higher grades and test scores and are
less likely to be disruptive, truant, or drop out (Klem & Connell, 2004). Dr.
Sbrocco (2009) cited Newmann, Secada, and Wehlage‘s (1995) definition of
engagement in academic work as ―student‘s psychological investment in and
effort directed toward learning, understanding, mastering the knowledge, skills, or
crafts that the academic work is intended to promote‖ (p. 12).

15
Emotional Engagement
Emotional engagement encompasses student actions and feelings of their
classroom experience and their school (Sbrocco, 2009). School identification is an
integral characteristic of emotional engagement (Finn, 1989; Voelkl, 1997).
Boredom, sadness, and anxiety are a few of the indicators of emotional
disengagement (Connell & Wellborn, 1991, Skinner & Belmont, 1993), while
feelings related to school safety and connectedness with peers and staff
demonstrates emotional engagement. Lee and Smith (1995) have measured
emotional engagement by recording student reactions to school and their teachers
(Stipek, 2002). One limitation of measuring emotional engagement is the
difficulty to focus on one of a wide array of academic factors that impact the
educational experience (Fredericks, Blumenfeld, & Paris 2004).
Developmentally Appropriate School Model (DASM)
The seminal Turning Points 2000 outlines a Developmentally Appropriate
School Model (DASM) for 10-14 year-olds as well as provides recommendations
for increasing student engagement and academic achievement (Jackson & Davis,
2000). Dr. Sbrocco (2009) outlined the definition for the developmentally
appropriate school model in her research:
Students who are emotionally and mentally disengaged from school most
often are bored, distracted, mentally troubled, or do not see the value of
schooling (National Research Council and Institute of Medicine,
[NRCIM], 2003). The ultimate form of disengagement is dropping out of
school. Younger students are most often compliant enough to attend
school because they do not have the means to avoid it. DASM is a list of
recommendations that are designed to provide a comprehensive approach

16
to educating young adolescents - particularly students in grades six-eight.
The model is made up of the following components:
1) Curriculum grounded in rigorous, public academic standards;
2) Instructional methods designed to prepare all students to achieve
higher standards and become lifelong learners;
3) Teachers who are expert at teaching young adolescents;
4) Organized relationships for learning to create a climate of intellectual
development and a caring community of shared educational purpose;
5) Govern democratically;
6) Provide a safe and healthy school environment as part of improving
academic performance and developing caring and ethical citizens;
7) Involve parents and communities in supporting student learning and
healthy development (Jackson & Davis, 2000). (Sbrocco, 2009, p. 16).
Teacher Support
Teacher support is defined by a teacher‘s ability to deliver authentic
curriculum and instruction in addition to cultivating a classroom environment in
which students interact appropriately with their teacher and with each other.
According to the Programme for International Student Assessment (PISA) index
(2003), teacher support is manifested when ―the teacher shows an interest in every
student‘s learning; the teacher gives students an opportunity to express opinions;
the teacher helps students with their work; the teacher continues teaching until the
students understand; the teacher does a lot to help students; and the teacher helps
students with their learning‖ (OECD, 2003, p. 1).
School Culture
School culture is defined by Stephanie Stolp (1994) as:
The obvious elements of schedules, curriculum, demographics, and
policies, as well as the social interactions that occur within those structures
and give a school its look and feel as ―friendly,‖ ―elite,‖ ―competitive,‖
―inclusive,‖ etc. (p. 1).
17
School culture has emerged in educational research as an important topic
of future research and is considered a significant variable in educational reform
efforts.
Delimitation and Limitations of the Study
Delimitations are defined as ―…how a study will be narrowed in scope,
that is, how it is bounded‖ (Pajares, 2007). This study only includes 8th
graders
from three Wakta middle schools. Consequently, it will be difficult to generalize
the results of this sample of Wakta 8th
grade students to 8th
grade students in other
districts in the U.S. This study was limited to Wakta 8th
grade students in order to
replicate the Sbrocco 2009 study (i.e., only 8th
graders included in the study).
The limitations of the study are those ―…characteristics of design or
methodology that set parameters on the application or interpretation of the results
of the study; that is, the constraints on generalizability and utility of findings that
are the result of the devices of design or method that establish internal and
external validity‖ (Clark, 2000). Limitations also ―identify possible weaknesses of
the study‖ (Pajares, 2007). In this study, the sampling frame consisted of all 8th
grade students and the sample would be one of convenience (Sbrocco, 2009). One
limitation of this study emerged as only eighth grade students in Wakta Public
Schools were surveyed. Coverage error occurred as there were student absences
on the day the survey was taken. Other coverage errors occurred when a parent or
student opted not to participate in this voluntary survey. Measurement error was
reduced as three groups of 7th
grade students piloted the survey in January, 2011.

18
These 7th
grade students provided feedback regarding vocabulary, process, ease of
use, and structure of the survey. Non-response error was mitigated as the 8th
grade
students completed the survey in a computer lab during the school day under the
supervision of their geography teacher. Each student had access to a computer,
and they had enough time to complete the survey in their geography class.
Students were required to answer each question on the survey, eliminating non-
response error for the students who took the survey.
The sample size consisted of the entire Wakta 8th
grade student population
(786 students). A response rate of 88% (692/786) was achieved for this study.
However, 42 students were not included in the final analysis as they had
incomplete test data (e.g., missing MCA test(s), missing MAP test(s), or a
combination of missing MCA or MAP test(s). The final number of participants (N
= 650) represents 83% of the Wakta 8th
graders. Mobility emerged as a limitation
as the 42 students not included in the final analysis were new to Wakta Public
Schools in the 2009-2010 or 2010-2011 school years (and thus their test data was
unavailable). The dearth of Native Americans and the comparatively lower
number of Hispanic and Black participants prevent this study from
generalizability as the particular demographics of Wakta 8th
graders do not mirror
the majority of 8th
grade levels in other U.S. school districts. Table 1.1 includes a
breakdown of inclusion rates by ethnicity. The final inclusion rate for all students
was 83% (650/786).

19
Table 1.1 8th
Grade Student Inclusion Rate, Spring 2011.
Ethnicity Declined
to take
survey
Did
not
take
survey
Took
Survey
Data
Gaps
Took
survey
and
included
in
analysis
Total
Students
Inclusion
Rate %
Asian 5 4 3 68 80 85%
Hispanic 2 3 1 16 22 73%
Black 2 17 16 39 74 53%
White 15 47 22 527 610 86%
Overall 24 71 42 650 786 83%

20
Chapter Two
―Learning and succeeding in school requires active engagement. ... The core
principles that underlie engagement are applicable to all schools—whether they
are in urban, suburban, or rural communities. ... Engaging adolescents, including
those who have become disengaged and alienated from school, is not an easy
task. Academic motivation decreases steadily from the early grades of elementary
school into high school. Furthermore, adolescents are too old and too
independent to follow teachers’ demands out of obedience, and many are too
young, inexperienced, or uninformed to fully appreciate the value of succeeding
in school.‖
National Academy of Science‘s Research Council (2004)
Review of Literature
This chapter reviews current literature pertaining to the evolution of the
U.S. school system, achievement gaps between cohorts of students, and the
initiatives intended to ameliorate educational inequities. The academic
achievement gap has increased the stratification of access to opportunity in our
nation by both race and income level with negative effects (Orfield, 2009). An
analysis of the research of both in-school factors and societal factors of student
achievement is included in this chapter as well. This review also examines the
Choice is Yours Program, a Minneapolis Voluntary Desegregation Plan created in
2000 after the settlement of the lawsuit brought by the National Association for
the Advancement of Colored People (NAACP) versus the State of Minnesota.
The Academic Achievement Gap
The academic achievement gap in the United States is defined as the lower
average test scores, grades and college attendance rates among black and Latino
students compared to their white, non-Hispanic peers (Solomon, 2009). Myron
Orfield (2011) summarized several researchers; Black students tend to receive

21
lower grades in school (Demo & Parker, 1987), score lower on standardized tests
of intellectual ability (Steele & Aronson, 1995), drop out at higher rates (Steele,
1992), and graduate from college with substantially lower grades than white
students (Nettles, 1988). The expanding achievement gap, ―of a large and
growing scale of African American children is nothing short of national crisis‖
(Haycock, 2001, p 7). The academic achievement gap in the United States
between black and white students has fluctuated in the years since Brown v.
Board of Education. Recent trends indicate the achievement gap is widening,
thereby erasing significant gains made by black students in mathematics and
reading during the 1970‘s and 1980‘s. By the year 2010, black and Hispanic
students will make up approximately 50% of students in U.S. schools (Haycock,
2001). The increase of achievement gaps among groups of students threatens U.S.
prosperity when one considers the catastrophic impact on society when half of
minority students are not proficient on standardized tests (Orfield, 2006).
Furthermore, nearly 50% of all black and Hispanic students drop out before they
graduate high school (Orfield, 2009).
The effects of a pervasive achievement gap on our nation‘s economy,
society, and future are harrowing. Tony Wagner outlined the problem in his
Global Achievement Gap (2008): ―Over the next 25 years or so…nearly half of
the projected job growth will be concentrated in occupations associated with
higher education and skill levels. This means that tens of millions more of our
students and adults will be less able to qualify for higher-paying jobs‖ (p. xx).
22
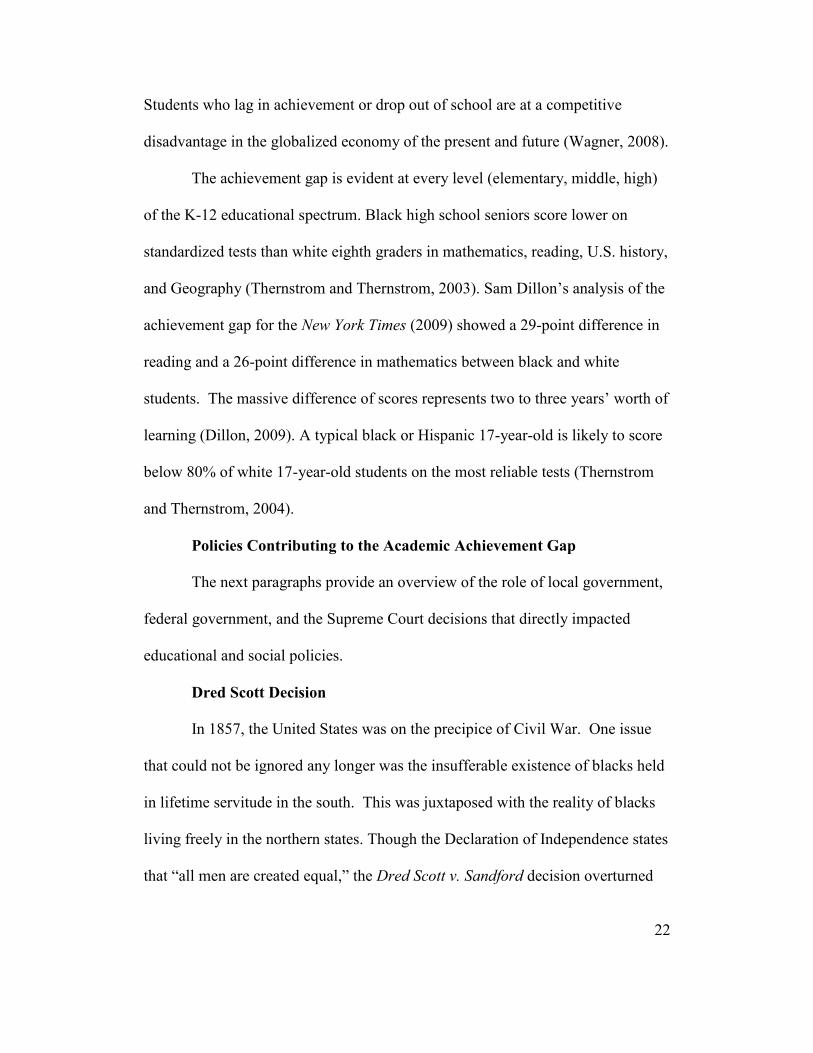
Students who lag in achievement or drop out of school are at a competitive
disadvantage in the globalized economy of the present and future (Wagner, 2008).
The achievement gap is evident at every level (elementary, middle, high)
of the K-12 educational spectrum. Black high school seniors score lower on
standardized tests than white eighth graders in mathematics, reading, U.S. history,
and Geography (Thernstrom and Thernstrom, 2003). Sam Dillon‘s analysis of the
achievement gap for the New York Times (2009) showed a 29-point difference in
reading and a 26-point difference in mathematics between black and white
students. The massive difference of scores represents two to three years‘ worth of
learning (Dillon, 2009). A typical black or Hispanic 17-year-old is likely to score
below 80% of white 17-year-old students on the most reliable tests (Thernstrom
and Thernstrom, 2004).
Policies Contributing to the Academic Achievement Gap
The next paragraphs provide an overview of the role of local government,
federal government, and the Supreme Court decisions that directly impacted
educational and social policies.
Dred Scott Decision
In 1857, the United States was on the precipice of Civil War. One issue
that could not be ignored any longer was the insufferable existence of blacks held
in lifetime servitude in the south. This was juxtaposed with the reality of blacks
living freely in the northern states. Though the Declaration of Independence states
that ―all men are created equal,‖ the Dred Scott v. Sandford decision overturned

23
that noble sentiment, at least as it pertained to black people (Waks, 2005). The
Scott Decision stipulated that ―all men‖ in the Declaration of Independence could
not possibly have included black men, and the court ruled ―that no African
Americans, free or slave, could claim any rights and privileges guaranteed to
citizens by the Constitution‖ (Waks, 2005). At a time when the idea of slavery
was still debated in this nation, the status of blacks had been decided in the Dred
Scott case.
Plessy v. Ferguson
Whereas the Dred Scott Decision stipulated that black Americans could
not be considered citizens, Plessy v. Ferguson (Plessy v. Ferguson, 163 U.S. 537,
1896) outlined a ―separate but equal‖ doctrine that would eventually permeate
every segment of American society. In his dissenting opinion, Justice Harlan
noted the Plessy v. Ferguson decision violated both the 13th
and 14th
Amendments. With the 14th
Amendment in mind, Harlan argued:
…It added greatly to the dignity and glory of American citizenship, and to
the security of personal liberty, by declaring that 'all persons born or
naturalized in the United States, and subject to the jurisdiction thereof, are
citizens of the United States and of the state wherein they reside,' and that
'no state shall make or enforce any law which shall abridge the privileges
or immunities of citizens of the United States; nor shall any state deprive
any person of life, liberty or property without due process of law, nor deny
to any person within its jurisdiction the equal protection of the laws.'
(Plessy v. Ferguson, 163 U.S. 537 (1896))
The prose of the 14th
Amendment, coupled with Justice Harlan‘s scathing
dissenting opinion in Plessy v. Ferguson, could not overcome the untenable racial
realities of the era. Blacks may have been considered ―equal‖ under the 14th
and

24
15th
amendments, however, vigilante justice and mob rule led to the censure or
possible death of those blacks who did attempt to exercise their constitutionally
guaranteed freedoms (Waks, 2005). In his famous dissenting opinion in Plessy v.
Ferguson, Justice John Marshall stated, "Our Constitution is color-blind, and
neither knows nor tolerates classes among citizens" (Lopez, 2006). De facto
segregation, the separation of races by custom or tradition rather than by law, and
de jure segregation, evidenced by Jim Crow Laws and other official forms of
segregation that evolved after the Plessy v. Ferguson decision, revealed an
American society was anything but color-blind.
The doctrine of ―separate but equal‖ codified in the Plessy decision led to
inequalities in school funding, facilities, and teacher quality in black schools
(Garibaldi, 1997). Laws were enacted across the nation to create segregated
schools:
1) In Missouri, separate free schools shall be established for the
education of children of African descent; and it shall be unlawful for
any colored child to attend any white school, or any white child to
attend a colored school.
2) In Florida, the schools for white children and the schools for Negro
children shall be conducted separately.
3) In North Carolina, books shall not be interchangeable between the
white and colored schools, but shall continue to be used by the race
that used them first.
4) In Oklahoma, any instructor who shall teach in any school, college or
institution where members of the white and colored race are received
and enrolled as pupils for instruction shall be deemed guilty of a
misdemeanor, and upon conviction thereof, shall be fined in any sum
not less than ten dollars ($10.00) nor more than fifty dollars ($50.00)

25
for each offense.
5) In Texas, [The County Board of Education] shall provide schools of
two kinds; those for white children and those for colored children.
(Randall, 2001)
Brown v. Board of Education
The Brown v. Board decision was a watershed event in educational policy
in the United States. The Supreme Court had to decide three pernicious issues
pertaining to desegregated schools. The first was to overthrow Plessy v.
Ferguson’s interpretation that ―separate but equal‖ school buildings were
permissible (Ascik, 1984). Second, the court had to decide whether "the physical
facilities and other 'tangible' factors" were unequal (Ascik, 1984, p 6). Finally,
the court decreed "separate educational facilities are inherently unequal," and the
separation of children based on race created a "sense of inferiority" caused by the
low esteem of black children, it affected "the motivation of a child to learn," and it
slowed "the educational and mental development of Negro children" (Ascik,
1984, p 7). An explosion of education-related litigation and legislation followed
the Brown v. Board decision. Though schools were to be desegregated ―with all
deliberate speed,‖ presidential intervention was needed to force integration in
some communities.
In September, 1957, Arkansas Governor Orval Faubus mobilized the
National Guard in September 1957 in order to ―keep the peace,‖ but he also
ordered the soldiers to bar the black students from entering Central High School
(Central High 1957, 2008). Eventually President Eisenhower deployed 1,000

26
members of the 101st Airborne of the U.S. Army to protect the black students as
they entered the newly segregated school. The drama of armed American soldiers
escorting black students into school in order to comply with Brown v Board
played out for the nation to see. Though the black students were allowed to attend
an integrated school for the 1957-58 school year, the controversy continued to
flare. On September 27, 1958, Little Rock voters disapproved of integration of
the high schools by a staggering 129,470 to 7,561 margin. The school board
decided to cancel the entire 1958-1959 school year for Little Rock high schools,
and the city‘s 3,698 high school students had to find alternative schooling options
(Central High 1957, 2008). The infamous ―Little Rock 9‖ dramatized the
complex struggles integration of black and white students would cause in
communities across the nation. Congress began to enact legislation intended to
create equitable educational opportunities for all of America‘s students, regardless
of race, gender, etc. Following is an overview of the legislative and judicial
efforts.
The 1960’s
The Griffin v. County School Board (1964) case in Virginia was
representative of the subterfuge tactics utilized by various school boards in the
wake of Brown v. Board of Education decision. Similar to the case in Little Rock,
AR, the school board in the Griffin case attempted to avoid integration by
shuttering the public high schools. Instead of offering public schooling to the
high school students in the Griffin case, the school board attempted to issue

27
vouchers for private schools to the affected students. The Supreme Court ruled
that the school board was not acting ―with all deliberate speed‖ to integrate the
public schools and ordered the public schools to be re-opened immediately.
President Lyndon B. Johnson‘s initiatives included an emphasis on
education reform. In 1964, Johnson signed the Civil Rights Act, which forbade
segregation in public places, including public schools (U.S. Commission on Civil
Rights [USCCR], 2007). If a school were to be in violation of Title VI, it would
face forfeiture of federal funding (USCCR, 2007). Another prong of Johnson‘s
Great Society was the War on Poverty, with an emphasis on efforts to eradicate
educational inequities in the U.S. The Compensatory Education for Cultural
Deprivation posited that children of poor urban and rural families would benefit
from early education. The Head Start program emerged as a comprehensive
intervention that combined education, health care and social services for both
parents and their children (Zigler & Muenchow, 1992). The Elementary and
Secondary Education Act (ESEA) was passed in 1965. The ESEA of 1965
marked a dramatic shift from local to federal control of education funds, as Title 1
allowed the U.S. Department of Education to provide increased funding to school
districts with high rates of students living in poverty (U.S. Department of
Education, 2002).
The decision in the Green v. County School Board (1968) case affected
school districts throughout the U.S. In a district evenly divided between white
and black students, the county school board created a program in which each

28
student could choose which school to attend. Until 1968, the black students
attended school on one side of the county, while the white students attended
school on the opposite end of the county. Following the school board‘s school
choice initiative, a group of black students chose to attend the formerly all-white
school, while none of the white students chose to attend the all-black school.
Ultimately a group of students and parents sued the school board, claiming true
integration was not occurring under this plan (Green v. County School Board, 391
U.S. 430, 88 S. Ct. 1689, 20 L. Ed. 2d 716 (1968)). The unanimous decision
rendered by the Supreme Court had a wide-ranging impact. Though local school
districts were given flexibility in creating a school desegregation plan, the
Supreme Court maintained the option to intervene if a school board did not
"effectuate a transition to a racially nondiscriminatory school system‖ in a swift
manner (Green v. County School Board, 391 U.S. 430, 88 S. Ct. 1689, 20 L. Ed.
2d 716 (1968)).
The 1970’s
Three landmark Supreme Court cases in the 1970‘s represented the high
courts‘ conflicting and shifting attitude regarding desegregation of U.S. schools.
The Swann v. Charlotte-Mecklenburg Board of Education (1971) decision
focused on the plight of black students in urban areas (Swann v. Charlotte-
Meckenburg Board of Education, 402 U.S. 1, 91 S. Ct. 1267, 28 L. Ed. 2d 554
(1971)). The high court ruled that a desired ratio of 71% white students to 29%
black students was advisable (the demographics of the district mirrored the 71-29

29
racial split). Significantly, the court declared the racial ratio was part of the
solution, but not the only solution. Chief Justice Burger wrote for the court, ―We
see [however] that the use made of mathematical ratios was no more than a
starting point in the process of shaping a remedy, rather than an inflexible
requirement‖ (Hall, 1992, p 11). The Milliken v. Bradley (1974) case upheld the
power of local school districts and highlighted the distinct differences in school
organization between northern and southern states. Southern school districts were
countywide educational systems, and schools that were previously desegregated
could be efficiently integrated under the purview of the district leadership (Orfield
& Eaton, 1996). School districts in northern states were not organized by county,
and the irregular district boundaries served to ensure racial segregation (Orfield &
Eaton, 1996). Housing segregation in the north led to far less school integration,
especially in the suburbs of large urban cities. Suburban schools were reticent to
integrate with sprawling urban school districts and their large minority
populations (Orfield, 1997). The Milliken case focused on the integration efforts
of the Detroit, MI, School District with 53 bordering school districts. The
proposed school district would have included over 750,000 students, and extended
bus rides worried many parents (Hall, 1992). Many believe ―White Flight‖
accelerated as a result of this pivotal case. Indeed, the Milliken decision ensured
suburban school districts would not be broken up for integration purposes.
―The world was made safe for white flight. White suburbs were secure in
their grassy enclaves .... Official, legal segregation indeed was dead; but
what replaced it was a deeper, more profound segregation ... Tens of
thousands of black children attend schools that are all black, schools

30
where they never see a white face; and they live massed in ghettos which
are also entirely black‖ (Friedman, 2002).
Henceforth, racial integration efforts could only occur within a school
district‘s boundaries. Suburban school districts were exempt from any obligation
to integrate their schools with urban school districts. Coupled with overt and
covert real estate practices that dissuaded black families from settling in primarily
white neighborhoods, a system of segregated schools was destined to continue
(Orfield, 2005). University of Minnesota Law Professor Myron Orfield (2005)
asserted:
―Pervasive housing discrimination by public and private actors helped
create, and now maintains poor, minority neighborhoods. Until the end of
World War II, physical violence, racial zoning, and discriminatory real
estate practices kept blacks closely confined to the ghetto. In many cities,
white property owners attached restrictive covenants to deeds that forbade
blacks from buying homes in their neighborhoods. Real estate agencies
engaged in a variety of discriminatory practices, including racial steering
of blacks and whites away from each other and blockbusting, which
involves selling a few homes in a white neighborhood to black tenants,
buying neighboring homes at lower prices from panicked white
homeowners, then reselling the homes to middle-income blacks at a
premium.‖
As Orfield stated, housing discrimination existed both pre- and post-
Brown v Board of Education. Black families were essentially trapped in ―islands‖
of poverty, especially in the north (Orfield, 2005). The Supreme Court‘s
reticence to disband local school districts was also evident in the Pasadena Board
of Education v. Spangler (1976) decision. The high court decreed that since
Pasadena‘s public schools were not segregated as a result of ―intentionally
segregationist policies,‖ there was no legal impetus to force the schools to

31
integrate (Hall, 1992).
The National Assessment of Educational Progress (NAEP) represented the
emergence of educational accountability in the U.S. The priority of federal
education funding was not focused on improving the education of the nation‘s
poor and minority students. Students were tested yearly in reading, mathematics,
science, writing, history, geography and the arts (Hombo, 2003). Since the initial
tests in 1969, the goals of NAEP were to measure academic achievement at the
national level as well as measure trends in academic performance (Hombo, 2003).
In the latter portion of the 1970‘s (1977-1980), Jimmy Carter‘s
administration attempted to provide equitable education to an increasingly diverse
cohort of students. Carter struggled to fund the expansive and expensive new
programs that federal courts demanded. The President‘s efforts were further
hampered by stagflation and the oil crisis of 1979. Dr. Sbrocco (2009) highlighted
President Carter‘s efforts to highlight the efficacy of the various educational
initiatives in an effort to legitimize continued financial investment (SIFEP, 2006).
Finally, an emerging movement of program evaluation was used to analyze the
effectiveness of educational programs receiving millions of federal tax dollars.
The 1980’s
When Ronald Reagan assumed the Presidency in 1981, he followed
through on his campaign pledge of reducing taxes (Frenze, 1996). Federal
categorical aid to the nations‘ school districts was slashed, resulting in a transfer
of control of funding from the Federal level to the state and local level. The
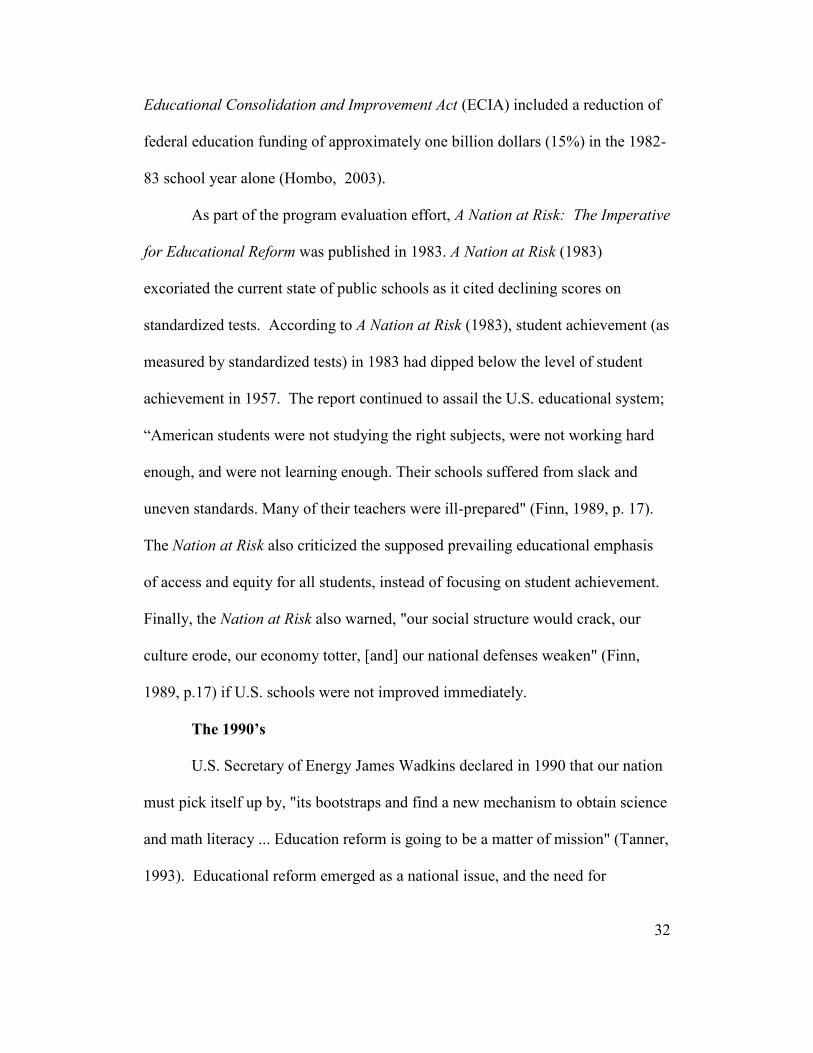
32
Educational Consolidation and Improvement Act (ECIA) included a reduction of
federal education funding of approximately one billion dollars (15%) in the 1982-
83 school year alone (Hombo, 2003).
As part of the program evaluation effort, A Nation at Risk: The Imperative
for Educational Reform was published in 1983. A Nation at Risk (1983)
excoriated the current state of public schools as it cited declining scores on
standardized tests. According to A Nation at Risk (1983), student achievement (as
measured by standardized tests) in 1983 had dipped below the level of student
achievement in 1957. The report continued to assail the U.S. educational system;
―American students were not studying the right subjects, were not working hard
enough, and were not learning enough. Their schools suffered from slack and
uneven standards. Many of their teachers were ill-prepared" (Finn, 1989, p. 17).
The Nation at Risk also criticized the supposed prevailing educational emphasis
of access and equity for all students, instead of focusing on student achievement.
Finally, the Nation at Risk also warned, "our social structure would crack, our
culture erode, our economy totter, [and] our national defenses weaken" (Finn,
1989, p.17) if U.S. schools were not improved immediately.
The 1990’s
U.S. Secretary of Energy James Wadkins declared in 1990 that our nation
must pick itself up by, "its bootstraps and find a new mechanism to obtain science
and math literacy ... Education reform is going to be a matter of mission" (Tanner,
1993). Educational reform emerged as a national issue, and the need for

33
enhanced mathematics and science literacy was paramount if U.S. students were
to compete with Russians in a post-Sputnik world (Tanner, 1993). In 1994,
President G.H. Bush commissioned a committee that created Goals 2000, a
combination of educational goals and national standards that were to be
implemented by the year 2000. Though an unfunded mandate, Goals 2000 served
as a template for school districts in their effort to implement standards. The
1990‘s also gave rise to a national standards movement. Scope and sequences for
school subjects, including mathematics and science, outlined ―what‖ students
were to learn during their K-12 educational experience.
The 2000’s
The No Child Left Behind Act (NCLB), signed on January 8, 2002,
represented an unprecedented adjustment by the Federal Government in terms of
educational policy. A bi-partisan bill championed by influential Democratic
Senator Ted Kennedy and Republican President George W. Bush, NCLB
represented a federally mandated intervention into each of the nation‘s school
districts (Fusarelli, 2007). One reason for the shift of federal involvement was the
incongruous reality that despite a ten-fold increase in federal education spending
since 1975, the achievement gap had actually increased between black and white
students (Fusarelli, 2007). NCLB (2002) would now connect federal funding to
the performance of every group of students in a school. The requirements set
forth in NCLB for each school are as follows:
1) By the year 2014 all students must be performing at a proficient level
in mathematics, reading, and science;
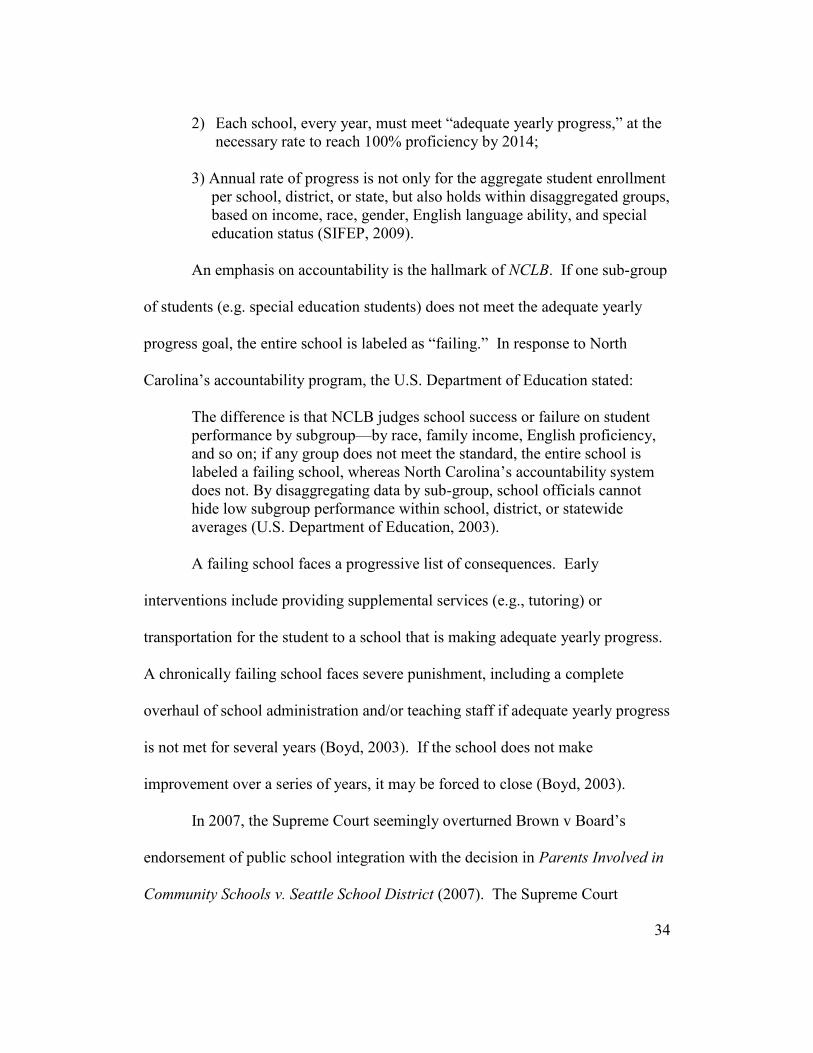
34
2) Each school, every year, must meet ―adequate yearly progress,‖ at the
necessary rate to reach 100% proficiency by 2014;
3) Annual rate of progress is not only for the aggregate student enrollment
per school, district, or state, but also holds within disaggregated groups,
based on income, race, gender, English language ability, and special
education status (SIFEP, 2009).
An emphasis on accountability is the hallmark of NCLB. If one sub-group
of students (e.g. special education students) does not meet the adequate yearly
progress goal, the entire school is labeled as ―failing.‖ In response to North
Carolina‘s accountability program, the U.S. Department of Education stated:
The difference is that NCLB judges school success or failure on student
performance by subgroup—by race, family income, English proficiency,
and so on; if any group does not meet the standard, the entire school is
labeled a failing school, whereas North Carolina‘s accountability system
does not. By disaggregating data by sub-group, school officials cannot
hide low subgroup performance within school, district, or statewide
averages (U.S. Department of Education, 2003).
A failing school faces a progressive list of consequences. Early
interventions include providing supplemental services (e.g., tutoring) or
transportation for the student to a school that is making adequate yearly progress.
A chronically failing school faces severe punishment, including a complete
overhaul of school administration and/or teaching staff if adequate yearly progress
is not met for several years (Boyd, 2003). If the school does not make
improvement over a series of years, it may be forced to close (Boyd, 2003).
In 2007, the Supreme Court seemingly overturned Brown v Board‘s
endorsement of public school integration with the decision in Parents Involved in
Community Schools v. Seattle School District (2007). The Supreme Court
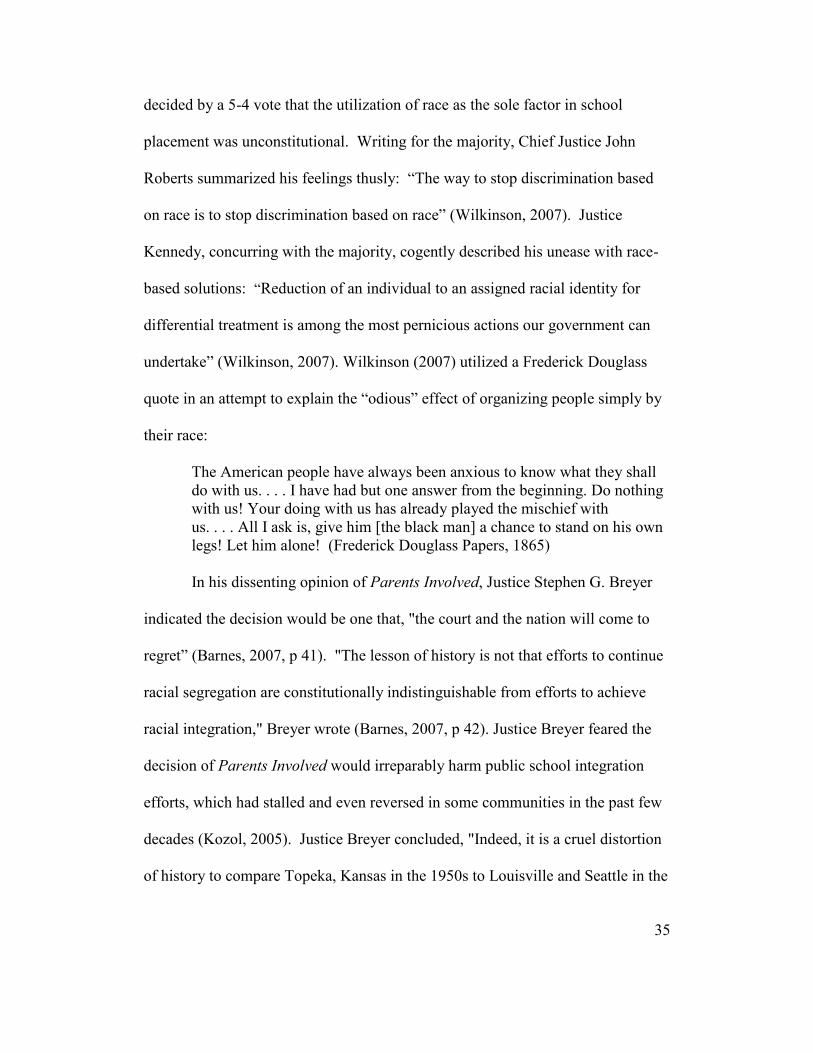
35
decided by a 5-4 vote that the utilization of race as the sole factor in school
placement was unconstitutional. Writing for the majority, Chief Justice John
Roberts summarized his feelings thusly: ―The way to stop discrimination based
on race is to stop discrimination based on race‖ (Wilkinson, 2007). Justice
Kennedy, concurring with the majority, cogently described his unease with race-
based solutions: ―Reduction of an individual to an assigned racial identity for
differential treatment is among the most pernicious actions our government can
undertake‖ (Wilkinson, 2007). Wilkinson (2007) utilized a Frederick Douglass
quote in an attempt to explain the ―odious‖ effect of organizing people simply by
their race:
The American people have always been anxious to know what they shall
do with us. . . . I have had but one answer from the beginning. Do nothing
with us! Your doing with us has already played the mischief with
us. . . . All I ask is, give him [the black man] a chance to stand on his own
legs! Let him alone! (Frederick Douglass Papers, 1865)
In his dissenting opinion of Parents Involved, Justice Stephen G. Breyer
indicated the decision would be one that, "the court and the nation will come to
regret‖ (Barnes, 2007, p 41). "The lesson of history is not that efforts to continue
racial segregation are constitutionally indistinguishable from efforts to achieve
racial integration," Breyer wrote (Barnes, 2007, p 42). Justice Breyer feared the
decision of Parents Involved would irreparably harm public school integration
efforts, which had stalled and even reversed in some communities in the past few
decades (Kozol, 2005). Justice Breyer concluded, "Indeed, it is a cruel distortion
of history to compare Topeka, Kansas in the 1950s to Louisville and Seattle in the
36
modern day" (Barnes, 2007, p 41).
Summary of Policies Contributing to the Academic Achievement Gap
The United States has undergone a metamorphosis in terms of recognizing
the citizenship of its inhabitants. Over the past century, there has also been a
dramatic change in how children are educated, and there is an impetus to provide
a quality education for all children. The Plessy v Ferguson decision held that
black Americans, free or slave, could never claim the rights of white citizens. A
―separate but equal‖ epoch was spawned. The Jim Crow Laws and de facto
segregation were overturned in the Brown v Board of Education case. Black
Americans were afforded the right to the same education their white counterparts
received. The 1960‘s were a decade of civil rights struggles, including the
implementation of the promises of the Great Society agenda. The 1970‘s
represented an upheaval of education legislation, marked by Supreme Court
decisions that some claim allowed a retrenchment of segregation in American
schools. Accountability was the educational reform de jure of the 1980‘s,
buttressed by the scathing criticisms the A Nation at Risk report leveled at the
current U.S. educational system. Movements to create a national standard
curriculum in various disciplines arose in the 1990‘s. The 2000‘s featured the
most comprehensive educational reform since the ESEA of 1965 in the form of
the No Child Left Behind Act. Every group of students is expected to make
adequate yearly progress and to become proficient by 2013-2014. Federal
education funding is directly tied to the ability of school districts to ensure each

37
group of students is proficient in mathematics, reading and science. The Parents
Involved Supreme Court decision has had widespread ramifications throughout
diverse communities that have heretofore struggled to integrate their schools.
Those districts must now work to integrate their schools, but they may not use
race of students as the sole factor in their integration policy.
Differences in Social Class
Socioeconomic status (SES) has long been identified as an indicator of
potential academic success. Dr. Sbrocco (2009) explained that even if researchers
controlled for SES, education level, and occupation, the achievement gap between
minority and white students narrowed, but still existed (Jencks & Phillips, 1998).
Additionally, a growing body of research has found children living in low-income
families ―display lower levels of academic self-efficacy and achievement relative
to other children‖ (Dearing, Taylor & McCartney, 2004, p 8). Within low-
income families, low levels of parental education place children at exceptionally
high risk for academic failure (Rauh, Parker, Garfinkel, Perry, & Andrews, 2003).
Students who live in poverty also have a substantially higher probability of child
health problems that cause learning problems (Dearing, Taylor & McCartney,
2004). Dr. Sbrocco (2009) indicated that since National Assessment of
Educational Progress (NAEP) testing began in 1969, a black-white achievement
gap has existed, despite controlling for parent education and socioeconomic status
(NAEP, 2000; Steele, 1997).
Test Bias

38
The achievement gaps in standardized testing performance between
minority and white students may be caused by tests that are either culturally or
racially biased. According to Jencks (1998), there are five types of biases in
terms of standardized tests—labeling, content, methodological, prediction and
selection bias.
Labeling bias occurs when a standardized test is intended to measure one
thing but actually measures something altogether different (Jencks, 1998). Tests
that claim to assess ―intelligence‖ imply that they are measuring something
innate, and it is widely believed that intelligence is a genetic trait. Dr. Sbrocco
(2009) found ―psychologists now understand that a score on an intelligence test
relies on both genetic makeup and environmental influences‖ (p. 28).
Content bias is comparable to labeling bias, as a test may claim to measure
one skill, but actually measures a different skill. A test that suffers from content
bias includes questions that favor one cohort (race, gender, etc.). A stark example
of content bias can be seen in the case of English language proficiency differences
between white and Hispanic students in California. A 2002 College Board report
concluded that Hispanic students on average score 81 points lower than white
students on the verbal section of the SAT I (Lee & Parthasarathy, 2002). In this
case the white students may have been more comfortable with the English
vocabulary on the test section than the Hispanic students. Hispanic students from
families that have recently immigrated to the United States may not be as familiar
with English words and phrases, English may not be the primary language of the

39
household, and Hispanic students may be in the process of learning English. This
is an example of content bias as the white student‘s experienced favorable test
content as compared to the Hispanic students.
Methodological bias exists when a test assesses mastery of some skill or
body of information using a technique that underestimates the ability of one group
relative to another (Sbrocco, 2009). Black students may record lower scores
because of the method used to gather information, rather than the actual ability of
the group of students (Jencks 1998). Dr. Sbrocco (2009) cited studies that have
shown Black students receive lower test scores on a difficult test when they are
told that it measures a specific ability than if no reference is made to ability
(Steele & Aronson, 1998). The preponderance of white test administrators, most
of whom are strangers to students, and the unfamiliar content of tests create an
environment that may increase anxiety for black students (Jencks, 1998). To date
there has not been a testing methodology that has reduced the achievement gap
between black and white students, so the effect on test scores is uncertain
(Sbrocco, 2009).
Prediction bias occurs when future performance is ostensibly foretold by
the result on a standardized test. The SAT and ACT represent standardized tests
that purportedly predict future grades (Sbrocco, 2009). If a black student and a
white student earn the same SAT score, one would expect them to earn similar
grades in college. Dr. Sbrocco (2009) examined studies that have shown,
however, that white students outperform their black peers in terms of grades

40
earned in college (Kane, 1998).
Selection bias focuses on external factors rather than the test-taking
methodology. Jencks (1998) explains that selection bias occurs when:
―Three conditions are met: (1) performance depends partly on
cognitive skills and partly on other traits; (2) it is easy to measure
cognitive skills but hard to measure the other traits that determine
performance; and (3) the racial disparity in cognitive skills is larger
than the racial disparity in the other, unmeasured traits that influence
performance. When these three conditions hold, both educational
institutions and employers have strong incentives to adopt a
selection system that emphasizes test scores. Such a selection
system is ―unfair‖ to anyone whose competitive rank on the
cognitive test is lower than their rank on the other unmeasured
determinants of performance. As a result, it puts Blacks… at a
greater disadvantage than a selection system based on actual
performance‖ (pp. 57-58).
The difficulty of measuring ―other‖ traits that determine performance has
led many educational institutions to utilize an easily quantifiable standardized test
in order to determine acceptance for prospective students. This reliance on
standardized tests, and the reticence of utilizing a system based on actual
performance, leads to a less qualified and less diverse student population (Jencks,
1998).
Heredity and Home Environment
Heredity was a widely believed determinant of student success for over a
century; however, it has been debunked as an explanation of the achievement gap.
Sir Francis Galton espoused his theory of eugenics in 1883, building on his half-
cousin Charles Darwin‘s theory of natural selection (Sbrocco, 2009). He believed
that the evolution of civilizations allowed the weak and disabled to survive,

41
thereby violating the natural elimination of inferior genes as explained in Natural
Selection (Hawkins, 1997). Galton‘s (1883) ideas proved popular domestically,
as one of the first nations to sterilize ―defectives‖ was the United States, followed
by similar programs in Canada, Belgium, Brazil, and Sweden (Hawkins, 1997).
Adolf Hitler became the most famous supporter of the eugenics theory as he used
it to buttress his ideas of the racial superiority of Aryans over others, including
Jews, Gypsies, mentally and physically disabled people, etc. A supposed
superiority of white skin to black skin was used for centuries to defend slavery in
the United States and beyond (Sbrocco, 2009). The publication of The Bell Curve
(Herrnstein & Murray, 1994) alleged that ―blacks have a lower mean intelligence
than whites because of genetic differences‖ (Sbrocco, 2009, p. 30). A
comprehensive review of related literature reveals little to no evidence for genetic
explanations of the intelligence quotient (IQ) difference between blacks and
whites (Nisbett, 1998). Though correlations between genetics and IQ were
argued in previous eras, such connections are not considered valid in present
research.
Herrnstein & Murray believed that white people were genetically
predisposed to have higher IQ‘s than black people. One confounding aspect of
race-based IQ differences is the presence of European ancestry in the gene pool of
approximately 30% of black Americans. If Herrnstein & Murray‘s theory were
accurate, the IQ of blacks with more European genes would be higher than black
students who had more black genes and no European genes (Nisbett, 1998). None

42
of Herrnstein & Murray‘s theories regarding IQ differences between blacks and
whites has been proven by a legitimate study (Nisbett, 1998).
Dr. Sbrocco (2009) noted that parental involvement and home
environment have emerged as important factors in student academic performance
(Epstein, 1992; Jeynes, 2003). The more parents participate in their children‘s
schooling as advocates, in decision-making and oversight roles, as fund-raisers,
boosters and volunteers, the more improvement is evident in student achievement
(Williams & Chavkin, 1989). Family participation in education is twice as
predictive of students‘ academic success as family socioeconomic status, and
some programs of parent participation have effects that are 10 times greater than
other factors (Walberg, 1984). Increased parental involvement has been shown to
narrow the achievement gap between black and white students. Dr. Sbrocco
(2009) discussed the reality that parental involvement of white parents is
considered to have a positive impact on student achievement by teachers, while
the lack of black family involvement is viewed as negative and as a contributing
factor in the lack of achievement of black students (Gavin & Greenfield, 1998;
Fields-Smith, 2005).
A correlation between parents‘ educational achievement and their
children‘s low educational attainment has existed in educational research for
decades (Boocock, 1972). Children living in low-income families demonstrate
lower levels of academic self-efficacy and academic achievement compared to
other children according to several studies (Bandura et al., 1996; Taylor, Dearing,

43
& McCartney, 2004). A student in a low-income family with low levels of
parental education is considered academically at-risk (Rauh, Parker, Garfinkel,
Perry, & Andrews, 2003).
Using data from the Children of the National Longitudinal Survey of
Youth (CNLSY) and National Longitudinal Survey of Youth (NLSY), Phillips, et.
al. (1998) studied the effects of a student‘s home environment on achievement.
Sbrocco (2009) found ―home environment was determined by the mother‘s
educational attainment and quality of schooling, family income, parenting
practices, and neighborhood effects‖ (p. 32).
Another longitudinal study that clearly illuminates the impact of home
environment on student achievement focused on professional, working class, and
welfare families in Kansas City, MO (Hart & Risley, 1995). By four years of age,
an average child in a professional family would have been exposed to almost 45
million words, an average child in a working-class family would have heard 26
million words, and an average child in a welfare family would have experience
with 13 million words. At four years of age, an astonishing 30 million-word gap
existed between professional children and welfare children (Hart & Risley, 1995).
The study also focused on the type of interactions between parents and children in
regard to behavior. By the time a child had reached four years of age, they would
have heard 560,000 more instances of encouraging feedback than discouraging
feedback if they were in a professional family and 100,000 more encouragements
than discouragements if they were in a working-class family. The children who

44
grew up in a welfare family heard 125,000 more discouragements than
encouragements (Hart & Risley, 1995). Furthermore, the children raised in
impoverished conditions experienced an encouragement deficit, while their
counterparts in the professional and working class family experienced substantial
encouragement surpluses. Though word gaps and the proportion of encouraging
comments to discouraging comments are not the only indicators of future student
performance, parenting practices and involvement are important predictors of
children‘s test performance (Berlin et al., 1995; Bradley et al., 1994).
Poverty Levels of Schools
Richard Rothstein‘s Class and Schools (2004) outlines several studies that
have demonstrated strong links between individual poverty, school poverty, race,
and educational inequality. Rothstein maintains that poverty is irrefutably related
to a host of development indicators, from the ―child‘s physical development to the
family‘s ability to stay in a neighborhood long enough so that a school might have
an effect on the student‖ (Rothstein, 2004, p 14). His research also suggests that
students receive a relatively weaker education in highly impoverished schools.
Rothstein believes the NCLB-mandated ―proficiency‖ movement has opened the
door to incessant political machinations intended to obscure the intent of the law.
Instead of students (and schools) held to account for their test results, academic
benchmarks are often manipulated in order to claim students have attained their
academic goals (Rothstein, 2004). Finally, Rothstein (2004) asserts meaningful
school change is unrealistic if the issues related to poverty of students and their

45
families are not addressed.
High poverty schools often have less qualified and a less stable teaching
staff than suburban schools. A less qualified teaching staff and a less stable
teaching staff are two significant challenges facing high poverty schools.
According to the 2004 U.S. Department of Education report, ―at least 75% of the
students were low-income, and there were three times as many uncertified or out-
of-field teachers in both English and science‖ (Boger, 2005). Though the NCLB
legislation mandates a highly qualified teacher in each classroom, high poverty
schools are not able to fill their teaching positions, and thus must resort to hiring
substitute teachers on a semi-permanent basis to fill the void. It is generally
understood that teachers often become more effective with more experience, and
that creating a high-functioning team of educators takes years of working together
(Orfield & Lee, 2005). Constant turnover of the teaching force inhibits a school‘s
ability to cultivate high performance teams, and individual teachers are robbed of
the opportunity to learn from their peers and mentors over the course of several
years.
Schools with high poverty rates may also face variances in school funding,
thereby leading to teacher instability. Teachers are usually released in inverse
order of their arrival. The most recent hires are usually the first to be fired when
districts face economic downturns. Despite the passage of several levy
referendums, the Minneapolis School District has faced budget deficits for eight
consecutive years, including a $28 million shortfall for the 2009-2010 school

46
years (Johns, 2009). In response to an expected $25 million deficit 2009-2010,
St. Paul was forced to cut 117 teaching positions (Johns, 2009). A recent Star
Tribune article revealed that Minneapolis, MN, is hemorrhaging 12,000 students
per year; with an average loss of $13,000 per student, Minneapolis is losing
approximately $154 million in state aid each year (Draper & Johns, 2009).
Minneapolis schools must adapt to the student exodus, and as schools close or are
reorganized, teaching jobs are either lost, or teachers must move to a new building
in what Minneapolis Public Schools chief financial officer Peggy Ingison terms a
―downward spiral‖ (Draper & Johns, 2009). In one glaring example of high
teacher turnover, Charlotte, NC‘s highest poverty schools lose nearly a third of
their teachers every year. Nationally, teacher attrition has increased by 50% over
the past fifteen years (National Commission on Teaching and America‘s Future
[NCTAF], 2007). Poor urban schools have experienced an accelerated teacher
turnover rate that dwarfs the national average. Nearly 50% of all new teachers
leave the profession within five years, but in urban schools of high poverty, the
teacher attrition rate exceeds 20% per year (NCTAF, 2007; NEA, 2006).
Segregation
Historically, the aim of desegregation efforts were described as ―taking a
black and Latino student from a high poverty school to a middle class school that
often has better resources, more qualified teachers, tougher academic competition,
and access to more developed social networks‖ (Orfield & Lee, 2005).
Orfield & Lee (2005) argue segregation is a complex issue and the simplification

47
of ―segregation into purely a racial issue ignores the fact that schools tend to
reflect and intensify the racial stratification in society‖ (p. 15). Usually, a
school‘s demographics will mirror the neighborhood demographics, and the
differences in educational experiences for students of various races are stunning.
The Milliken (1974) decision ruled that school districts could not combine
integration efforts by judicial decree. However, school districts maintained the
option to voluntarily enter into desegregation efforts with other school districts.
It is impossible to separate segregation of schools with the societal trends
presently observed in the U.S. Orfield & Lee (2005) contend that ―segregation
has never just been by race: segregation by race is systematically linked to other
forms of segregation, including segregation by socioeconomic status, by
residential location, and increasingly by language‖ (Orfield & Lee, 2005, p.14).
The movement of white families from urban cores to the suburbs has been dubbed
―white flight‖, and it has accelerated since the 1970‘s. As a result of white flight,
the demographics of the largest cities in the U.S. are skewed in relation to the
demographics of the entire nation, especially as they pertain to the percentage of
black and Latino students in their schools (Hauser, Simmons & Pager, 2004).
Orfield & Lee (2005) found students in segregated schools have a much higher
chance of living in ―conditions of distress-housing inadequacy and decay, weak
and failing infrastructure, and critical lack of mentors and shortage of jobs‖ (p.
14). Segregated schools also face issues that include high numbers of students
who do not eat nutritional meals, gang violence that infiltrates the schools, and

48
unstable home environments (Knapp, et al., 1995). Schools devoid of more than a
negligible percentage of white students are usually high-poverty schools, and thus
deal with the raft of obstacles related to concentrated poverty (Orfield & Lee,
2004). Myron Orfield (2009) noted that in the Minneapolis metropolitan area,
minority students are five times as likely as white students to attend schools with
high percentages of students living in poverty. Students of color are nearly 18
times more likely than white students to attend schools in which more than 75%
of the students are living in poverty (Orfield, 2009).
Segregated schools are a result of housing segregation, and when
residential choices are limited, so is ―access to opportunity‖ (Orfield, 2009).
Access to opportunity is defined as ―access to jobs, good schools, and decent
economic prospects in life‖ (Orfield, 2009). In the Twin Cities, more than 75% of
the people of color live in central cities and stressed suburbs. These regions offer
few opportunities to the people living there as compared to suburban and exurban
communities. Only 40% of white residents live in these types of neighborhoods
(Orfield, 2009). Most white families (over 60%) live in areas deemed to have
moderate or high levels of opportunity. This neighborhood segregation tends to
lead to school segregation, denying students of various races the opportunity to
learn to work with and from each other.
Recent studies have revealed positive effects for students who attend an
integrated school. Minority students who attend racially integrated schools
demonstrate increased academic achievement on standardized tests (Orfield &

49
Lee, 2005). In addition to the academic benefits of attending an integrated school,
minority students also experience more stable interracial friendships (Halinan and
Williams, 1987; Kahlenberg, 2001), have expanded access to friendships and
contacts associated with opportunity (Granovetter, 1986), and are more likely to
live, work, and attend college in more integrated settings (Braddock &
McPartland, 1991). Without positive peer role models in the classroom, academic
achievement may suffer. According to the Coleman Report (1966), peer influence
was cited as the second most important factor (second to family background) as it
relates to student achievement. Similarly, a 2003 study focusing on southern
schools with high poverty found that ―the absence of a strong positive peer
influence‖ had a significant negative effect on student achievement (Orfield &
Lee, 2005).
Within School Factors That Contribute to the Gap
Though research has shown pre-school experiences, home life and
parental background impact student preparedness, opinions vary on the extent of
the impact (Phillips, Crouse & Ralph, 1998). Dr. Sbrocco (2009) found some
education reformers contend that black and white students begin their educational
experience with roughly the same skills and motivation, but the strictures of the
educational system and teacher preconceptions are responsible for the
achievement gap (Phillips, Crouse & Ralph, 1998). On the other hand,
researchers point to studies that indicate elementary age minority students have
less developed academic skills than white students, and the achievement gap has

50
begun well before they begin school (Phillips, Crouse & Ralph, 1998). Following
is an explanation of factors that occur within school that tend to perpetuate the
achievement gap between groups of students.
Institutional Racism
Dr. Sbrocco (2009) indicated that both former President George W. Bush
and former Secretary of Education Rod Paige stated students and schools
accountable via No Child Left Behind-mandated testing would help eliminate the
―soft bigotry of low expectations,‖ and thus eliminate achievement gaps among
groups of students (U.S. Department of Education, 2003; 2004). One key
component of NCLB is the expectation that every classroom will have a ―highly
qualified teacher‖ (NCLB, 2001). Of all the factors that affect student
achievement, teacher quality has consistently been proven to be the most
important (Kane & Staiger, 2008). In Tennessee, one study indicated a significant
difference in achievement of 50 percentile points on standardized tests between
students who attended classes taught by high-quality versus those taught by low-
quality teachers (Sanders & Rivers, 1996). Students enter into a learning contract
with their teachers, no matter school demographics, school resources, or how
children are organized for instruction (Ferguson, 1998). The significance of the
relationship between students and their teacher cannot be overstated. If a student
believes their teacher has diminished expectations regarding her or his
capabilities, their educational experience and efficacy are adversely affected
(Ladson-Billings, 1994). Racism affects life for all students both outside and

51
inside school, and the difficult task of diminishing the negative impact of
stereotypes regarding the ability and motivation of black students necessitates
adjustments in curriculum and in teaching methods (Steele, 1992).
Pre-school experiences
Lyndon Johnson‘s War on Poverty attempted to reverse the negative
effects of growing up poor in the U.S. Pre-school instruction, now known as
Head Start, began in the summer of 1965 with 561,000 children, most of whom
were black. Head Start continues to this day as a legacy of the 1960‘s attempt to
close the achievement gap. Sbrocco (2009) stated that Head Start‘s intent was to
ensure kindergartners living in poverty were prepared for elementary school
(Ferguson, 1998). Studies have shown that participation in Head Start is
associated with short-term benefits as indicated by improved test scores (Barnett,
1995). Long-term benefits of participation in Head Start include the reduced
likelihood black students will be convicted of a crime as well as the increased
probability that black males will graduate from high school and to participate in
the work force (Garces, Thomas, & Currie, 2000).
Tracking
A common argument endorsed by educators and parents is that the
creation of low-tracking and high-tracking classes will benefit high achievers
(Burris & Welner, 2005). Parents of high achievers believe that heterogeneous
grouping of all ability levels will result in ―lowered learning standards‖ for their
children (Burris & Welner, 2005, p. 8). No matter how schools determine

52
placement of students, tracking has a negative effect on the education of black
students. According to Dr. Sbrocco (2009), ―white students are
disproportionately enrolled in more advanced curriculum tracks (e.g., Advanced
Placement classes), and black students are not proportionally represented in
advanced classes or in high ability groups‖ (p. 35). Though black students are
overrepresented in low-track classes and underrepresented in high-track classes,
and the ineffectiveness of low-track schools has been demonstrated (Oakes,
Gamoran & Page, 1992), schools still create tracked classes (Mickelson & Heat,
2008). Sbrocco (2009) posited that while student placement in high and low
tracks may or may not be attributed to racial bias, schools that utilize teacher
recommendations to determine placement in tracked classes do tend to show a
racial bias (Braddock & Slavin, 1993). Ferguson (1998) discovered ―when
schools track students based on differences in academic proficiencies as
determined by quantifiable measurements such as test scores or grades, classes
will represent a racial imbalance‖ (Sbrocco, 2009, p. 35). Though a racial
imbalance may exist, the research does not conclusively prove that a racial bias
lead to the differences in representation of black and white students in high and
low tracked classes (Ferguson, 1998). Despite the research that indicates tracking
negatively impacts the progress of black students, segregated classes ostensibly
based on academic ability continue in thousands of schools.
Weak or Inappropriate Instruction
Sbrocco (2009) stated that measuring individual teacher effectiveness has

53
proven elusive, and many schools identify teacher effectiveness based on years of
teaching experience, degrees earned, and the standardized test scores earned by
teachers (Greenwald, Hedges, & Laine, 1996). Students fortunate to have an
educational experience with competent teachers have shown marked improvement
in one school year. Dr. Sbrocco (2009) indicated the difference between having an
effective teacher and an ineffective teacher can lead to as much as one grade level
of student achievement improvement per school year (Hanushek, 1992). In the
U.S., black students are more likely to have teachers with limited experience,
lower competency scores, and diminished effectiveness compared to their white
peers (Ferguson, 1998). In order to overcome the test bias effect, teacher
certification testing might be able raise the level of teacher academic
achievement, and consequently, raise the achievement of students (Ferguson,
1998).
Haycock, Jerald, and Huang (2001) found, ―students in predominantly
minority schools are also about twice as likely as students in other schools to be
taught by inexperienced teachers…We take the kids that are most dependent upon
teachers for academic learning and systematically assign them teachers with the
weakest academic base‖ (p. 16-17). The North Carolina Education Research
Council reviewed a study on teacher quality compared to student achievement in
the current year and to that of the previous year. The results were disconcerting as
they pertained to student achievement: ―The effects of even a single ineffective
teacher are enduring enough to be measurable at least four years later. Good

54
teachers in subsequent grades boost achievement, but not enough to compensate
for the effects of an earlier ineffective teacher‖ (Thompson & O‘Quinn, 2001, p.
45). Effective teachers are able make inroads in terms of remediation, but the
adverse effects of an ineffective teacher are nearly insurmountable for a student to
overcome in their educational experience.
A few studies indicate that ―students will learn more in a ‗culturally
congruent school‘ in which a student‘s home and school environment are similar‖
(Sbrocco, 2009, p. 36). However, the research is unclear when it comes to
determining whether the academic performance of black students improves when
black teachers teach them (Sbrocco, 2009). One study found revealed that black
7th and 8th graders‘ truancy rates declined when they were instructed by black
teachers (Farkas, et al., 1990; Sbrocco, 2009). In another study, Ehrenberg,
Goldhaber, and Brewer (1995), utilizing National Educational Longitudinal Study
(NELS, 1998), were not able to find statistically significant effects of teacher race
on test scores for black and white students (Sbrocco, 2009). Remarkably, black
teachers of low socioeconomic status and white teachers of high SES were the
only groups of teachers that displayed marginally positive effects on black student
mathematics tests (Ferguson, 1998). This paradoxical finding does not support
other studies that claim a teacher‘s race has a significant impact on student
achievement.
Class size
Several studies have shown that smaller class size leads to higher test
55
scores (Jencks & Phillips, 1998), though the results of other studies indicate class
size may not have a lasting impact after students leave these smaller classes
(Slavin, 1989; Greenwald, Vedges & Laine, 1996). A 1999 review of Tennessee‘s
STAR (Student/Teacher Achievement Ratio) program revealed that students who
were in small classes in early grades tended to have higher grades than students
who were in larger classes in early grades (Krueger & Whitmore, 2002). Black
students who had participated in the small classes demonstrated ―twice the
improvement in math and reading as white students in the STAR program‖
(Sbrocco, 2009, p. 37). Though the improvement on test scores dissipated for
white students as they matriculated, the advantage was evident until seventh grade
for black students (Krueger & Whitmore, 2002). The effects of small class size
were visible in high school as well as black students who attended small classes in
the early elementary years were more likely to take the college board tests in high
school, reducing the black/white gap in SAT and ACT participation by 60%
(Krueger & Whitmore, 2002).
However, research of the effects of class size on academic achievement is
mixed. Konstantopoulos (2007) discovered that reductions in class size did not
reduce the achievement gap between low and high achievers (Sbrocco, 2009).
Other researchers have focused on classes that maintained a lower class size for
an entire school year (Slavin, 1989). Though there was a slight improvement in
academic achievement for the current year, students did not display higher test
scores in subsequent years in which they were not part of a small class size

56
(Slavin, 1989). After analyzing standardized test trend data between 1950-1986,
Tomlinson decided the soaring costs for reduced class sizes were not justified by
negligible increases in test scores (Tomlinson, 1988).
Mobility
Student mobility is defined as the movement of a student from one school
to another for any reason besides grade promotion. Students who move from
school to school in a non-normative fashion often encounter increased academic
and behavioral issues (Hartman, 2002). Several researchers have found student
transitions between school districts do not always lead to diminished academic
achievement, and such transitions may benefit students in terms of adjustment to
shifting circumstances (Reynolds, Chen, & Herbers, 2009). For the most part,
mobility is associated with lower average school achievement (Alexander et al.,
1996), increased risk of school dropout (Rumberger & Larson, 1998), increased
need for remedial education (Alexander et al., 1996), and social and psychological
difficulties (Rumberger, 2003; Swanson & Schneider, 1999). There is a
disproportionate racial difference evident in student mobility as children who
experience non-normative school changes are ―more likely to be ethnic
minorities, reside in low-income and in single-parent households, and have home
languages other than English‖ (Reynolds, Chen, & Herbers, 2009, p 4).
Approximately 66% of residential moves are within the same counties while one-
third are between counties or from abroad (U. S. Census Bureau, 2000). Despite
the majority of residential moves within the same county, students often
57
experienced a non-normative school change as a result (Reynolds, Chen, &
Herbers, 2009). According to the U.S. Government Accountability Office (1994)
report of the U. S. Department of Education‘s Prospects study of 15,000 children,
41% of third graders attended a different school from first grade, and 17%
attended three or more schools since first grade (Reynolds, Chen, & Herbers,
2009). While 25% of inner-city third graders changed schools three or more
times, this was double the rate that rural and suburban children changed schools
(Reynolds, Chen, & Herbers, 2009).
Several studies focusing on the urban cores of American cities revealed
the frequency in which students change schools. Since student mobility has been
found to lead to discontinuities in learning environments and weaker connections
between mobile students and their peers and teachers (Reynolds, Chen, &
Herbers, 2009), the impact on public school systems attempting to educate a
mobile population is immense. Heinlein and Shinn (2000) found that over 40% of
students had two or more moves from kindergarten to sixth grade and 25% of
students had at least three moves in one low-income New York City school.
Alexander, et al. (1996) found in their first-grade Baltimore City sample that 56%
changed schools over the next five years while 43% of students remaining in
Baltimore schools eventually transferred to other schools. An examination of
Texas public elementary schools revealed that more than 60% of all students
changed schools at least once (normative or non-normative) over a four-year
period while 33% of students in fourth through seventh grade had non-normative

58
moves (Mao, Whitsett, & Mellor, 1997; Rivkin, Hanushek, & Kain, 2005).
Chicago‘s alarming mobility rate is evident in de la Torre and Gwynne‘s (2009)
meta-analysis of first grade students in 2000. Only 25% of students in K-8
schools stayed in the same school until eighth grade. Mobility rates of sixth
graders (66%), seventh graders (72%) and eighth graders (75%) illustrate the
constant churning of student cohorts. Students in Chicago Public Schools doubled
the rates of mobility found in most other areas of the United States (de la Torre &
Gwynne, 2009).
When a student changes schools, they are subject to differing behavioral
policies, class choices and curriculums, and expectations of teachers in the
classroom. Since these aspects of the educational experience can differ
dramatically amongst schools, learning is often compromised for mobile students
(Reynolds, Chen, & Herbers, 2009). Entwisle, Alexander, & Olson, (1997) found
that teachers in schools serving many high-risk children ―find it necessary almost
continuously to ‗reteach,‘ ‗backtrack,‘ or in other ways try to catch new students
up to the class‖ (p. 7). When students change schools, their new reality ―requires
adjusting to a new school, new teachers, and new peer groups that may hold
different attitudes and expectations about school life which lead to a different
school climate than what the student is used to‖ (Reynolds, Chen, & Herbers,
2009). Research indicates that students who are highly mobile acquire basic skills
at a slower pace, have an increased chance of school failure and dropout, and are
more likely to experience behavioral and interpersonal problems than their non-

59
mobile peers (Hartman, 2002). In fact, students who have moved more than three
times over a period of six years are likely to ―fall a full academic year behind their
peers‖ (Hartman, 2002). Without intentional institutional policies to ease such
transitions for students, parents, and staff, performance deficits often develop for
mobile students (Reynolds, Chen, & Herbers, 2009).
Student Engagement
Dr. Sbrocco (2009) noted that although schools have made myriad
attempts to close the achievement gap amongst groups of students, their efforts
may actually contribute to the widening of the gap (Phillips, Crouse & Ralph,
1998). Dr. Tyrell of Miami of Ohio University refers to the ―7/17‖ principle to
explain the limitations a school faces when working with students. A student is
completely under the purview of a school for a maximum of seven hours, while
the other 17 hours are spent with family or friends in an environment that is often
much different than school. Parenting practices, parents‘ education levels, and
parental income, are outside of a school‘s control, therefore Dr. Tyrell urges
schools to focus on policies that will help their students close the achievement
gap, and that can be completely controlled during school hours. Schools are
utilizing an assortment of strategies to increase student engagement, hopefully
leading to increased student achievement.
Though the future of a school and staff depends on the test scores of their
students, it is debatable that students who are neither motivated nor engaged will
suddenly try their best on standardized tests. In educational parlance, ―testing

60
season‖ in schools generally takes place in the spring of each school year and is
met with a mix of trepidation, fear, and angst by teachers and students. Wayne
Au‘s (2008) Teaching in Dystopia is a withering attack on the proliferation of
standardized tests, and he claims students in the U.S. are "tested to death, and the
curriculum is deformed by the test-score chase, especially in schools with large
amounts of low income and students of color‖ (RSO, 2008, p. 3). Though most
schools depend on students to think and act altruistically (i.e., to ―learn for
learning‘s sake‖), some schools have begun to reward students and teachers who
have displayed gains in standardized test scores. In a 2008 New York Times
article, Javier Hernandez highlighted the efforts of Roland Fryer and his
Educational Innovation Laboratory. The laboratory, which combines the efforts
of economists, educational researchers, and marketing experts, has begun a
controversial program in New York City that rewards students in grades 4-8 with
cash payments ranging from $25 to $50 for gains on their standardized tests.
Similar financial reward programs are already in place in Chicago and
Washington D.C. California Governor Grey Davis trumpeted the Academic
Performance Index award system as a way to ostensibly reward teachers for
working in the most difficult school districts. Though $350 million was
distributed to teachers in 4800 schools, there was a backlash of resentment from
teachers who saw the financial incentives as demeaning and as a ―back-door merit
pay system‖ (Bacon, 2002). Reva Kidd was one such teacher: "We've had to fight
hard for adequate salaries, but this money is a bribe, to make us complacent in the
61
face of changes that are hurting students and teachers alike" (Bacon, 2002).
Students who are engaged in their education and are challenged with a rigorous
and relevant curriculum tend to fare well on standardized tests
Student engagement may be the answer to the pernicious issues of anemic
levels of academic motivation and the accompanying decrease in achievement
(Fredricks, Blumenfeld, & Paris, 2004). The interconnected and technologically
advanced world students experience 2012 outside of the classroom is often at
odds with the experience of sitting in rows and listening to teachers speak for long
periods of time in school. Some educators are reticent to include emerging
technologies in their classroom lest they be seen as entertaining students instead
of educating them. Dr. Sbrocco (2009) referenced the trend that researchers have
detected that student respect for authority in school settings has diminished
(Fredricks, Blumenfeld, & Paris, 2004). School officials now must grapple with
the increasingly volatile situation of students who often do not tacitly conform to
the rules and regulations governing behavior and academics (Modell & Elder,
2002). Engagement becomes more important in a time when authority is less
respected. Minority students, who disproportionately suffer through the worst
school environments, tend to be affected the most of any racial group by
disengagement (Voelkl, 1997). Sbrocco (2009) stated that disengagement of
minority students compounds the issues for a group of students who score the
lowest on standardized tests and have the highest school dropout rates (Voelkl,
1997).

62
Types of Student Engagement
Fredricks, Blumenfeld, and Paris (2004) divided the existing research into
three engagement categories: behavioral, emotional, and cognitive (Sbrocco,
2009). Instead of examining the categories together, there is value to exploring
each category individually. Dr. Sbrocco (2009) highlighted Fredricks, et al‘s
explanation regarding the decision to examine engagement: ―The fusion of
behavior, emotion, and cognition under the idea of engagement is valuable
because it may provide a richer characterization of children that is possible in
research on single components‖ (Fredricks, Blumenfeld, and Paris, 2004, p. 61).
Engagement does not occur in isolation, as personal beliefs, previous school
experiences and the student‘s ability and motivation in their educational
environment all affect student achievement. Sbrocco (2009) stipulated that
schools that offer opportunities for students to participate in a variety of clubs, to
play sports, and to develop interpersonal relationships and engage in critical
thinking activities often experience an increase student engagement (Fredricks,
Blumenfeld, and Paris, 2004). Depending on teaching methods and learning
activities, educators have the ability to increase or decrease student engagement in
their classroom. Skinner, Wellborn, & Connell (1990) believe that teachers‘
support and involvement plays a crucial role in enhancing student engagement in
school (Sbrocco, 2009).
Behavioral engagement includes both academic and nonacademic school
behavior, and research indicates that it has a significant impact on academic

63
achievement (Sbrocco, 2009). Following the rules in the classroom and
demonstrating behaviors that do not disrupt the learning environment are
indicators of behavioral engagement (Finn, 1993; Finn, Pannozzo, & Voelkl,
1995; Finn & Rock, 1997). Another indicator of behavioral engagement is a
student‘s involvement in the daily routines on a classroom. Sbrocco (2009)
explained behavioral engagement may be observed in the effort students display
during class, the amount and depth of questions asked, as well as their
concentration on various learning activities (Finn et al., 1995; Skinner & Belmont,
1993). Research shows that positive behaviors such as completing homework and
complying with school rules indicate behavioral engagement (Finn et al. 1995;
Sbrocco, 2009).
Cognitive engagement is dependent on the commitment that a student
invests in the learning process (Fredericks, Blumenfeld, & Paris, 2004). Students
who demonstrate a commitment to learning attain higher grades and test scores
and are less likely to be disruptive, truant, or drop out (Klem & Connell, 2004).
Newmann, Secada, & Wehlage (1995) define engagement in academic work as
―student‘s psychological investment in and effort directed toward learning,
understanding, mastering the knowledge, skills, or crafts that the academic work
is intended to promote‖ (p. 12). Students that exceed the expectations of a task
and seek academic challenges display high levels of cognitive engagement
(Connell & Wellborn, 1991). Students are cognitively engaged when they use
meta-cognition, when they can think about their thinking in an effort to assess

64
their learning and decision-making as it relates to an educational experience
(Zimmerman, 1990).
Emotional engagement encompasses student actions and emotions related
to their classrooms and school. Positive school identification is an integral
characteristic of emotional engagement (Finn, 1989; Voelkl, 1997). Sbrocco
(2009) indicated boredom, sadness, and anxiety are a few of the indicators of
emotional engagement (Connell & Wellborn, 1991, Skinner & Belmont, 1993),
while feelings related to school safety and connectedness with peers and staff also
demonstrate a student‘s level of emotional engagement. One limitation of
measuring emotional engagement is the difficulty to focus on one of multiple
academic factors that impact the educational experience (Fredericks, Blumenfeld,
& Paris 2004).
Developmentally Appropriate Schools, Teacher Support, and
Disengagement
Standardized tests are the most expedient measure of academic
achievement, and NCLB is an example of the increased use of national standards
and high stakes assessments has transformed the educational landscape (SIFEP,
2006). The NCLB legislation‘s goal is for every child (gender, race, disability not
withstanding) in the nation to attain proficiency in math, science and reading by
2014 (U.S. Department of Education, 2001). However, research indicates that
implementation of high stakes testing proves to be an insufficient academic
intervention unless students are motivated to do their best (Melaville, Berg, &

65
Blank, 2005). A growing body of research explores the impact of engagement on
student achievement, with data consistently indicating that increased engagement
enhances student academic attainment. The act of learning requires an individual
student to be conscious and purposeful in the learning process (National Research
Council and Institute of Medicine, 2003), and classes that allow students to
explore answers to their own questions demonstrate higher student achievement
(Bransford, Brown, and Cocking 1999). Since the Dewey (1938) era, several
learning theorists have discussed the significance of engaging students in
authentic or real-world experiences that allow for dialogue, taking action, and
reflection. (Kolb, 1984; Rogers, 1969). Teacher behavior and attitude, school
climate and removal of racist beliefs in a school all have a positive impact on
student achievement (Finn, 1993; Marks, 2000, Ogbu, 2003). Since engagement
depends on an individual student and their educational situation (classroom,
teacher, school, etc.), adjustments in a school environment may impact
engagement level (Connell, 1990; Finn & Rock, 1997; Fredricks, Blumenfeld, and
Paris, 2004).
Developmentally Appropriate School Model (DASM) at the Middle
Level
The middle school level is a unique and challenging time for students.
The seminal Turning Points 2000 outlines a Developmentally Appropriate School
Model (DASM) for 10-14 year-olds, as well as provides recommendations for
increasing student engagement and academic achievement (Jackson & Davis,

66
2000). Teacher support is defined by a teacher‘s ability to deliver authentic
curriculum and instruction in addition to cultivating a classroom environment in
which students interact appropriately with their teacher and with each other. The
last segment analyzes the particular issues faced by black students in an
educational setting. Jonathan Ogbu (1978) focused on the societal and school
forces, as well as community and individual-level forces that impact the academic
achievement of minority students in the U.S. In addition, the academic
achievement of black students may be affected by the stereotype threat resulting
from oppressive and widely perceived negative stereotypes (Jencks & Phillips,
1998; Ryan & Ryan, 2005; Steele & Aronson, 1995). Each of these concepts will
be explained in-depth in the following paragraphs.
Dr. Sbrocco (2009) explained the Carnegie Council on Adolescent
Development defines the time period of 10- to 14- years of age for adolescents as
a period of physical, intellectual, and social development (Carnegie Council on
Adolescent Development, 1989). Before middle level education evolved, students
matriculated from elementary schools to junior highs to high schools. The junior
high school was essentially a mini-high school, and the less-supportive
environment has been linked to a decrease in student self-esteem, academic self-
esteem as well as a decline in school identification (Jackson & Davis, 2000).
Middle schools are usually arranged into teams of teachers and students, and are
able to create conditions that foster student engagement via interdisciplinary
projects, service learning opportunities, and a balanced curriculum (Lee & Smith,
67
1993). Dr. Sbrocco (2009) found when students feel as if their voice is both heard
and respected, their engagement tends to increase as well (Marks, 2000). Student
council, athletics, school band, choir, musical, after school study table and any
number of intramural clubs are all examples of how middle schools create
opportunities for students to identify with their school. Studies have shown that
students who feel they have adult advocates in the building that care about their
well-being and hold them accountable for their academic achievement,
engagement will increase (Yair, 2000). One way schools can increase student
engagement is to discontinue tracking of students into high and low classes.
A teacher plays a vital role in the creation and cultivation of a positive
school climate. Research has shown that teachers are the most crucial factor in
terms of influencing achievement of their students (Hammond & Young, 2002).
Approximately seven percent of the difference in student test scores can be
attributed to the differences in teachers (Rivkin, Hanushek, & Kain, 2005). The
impact of teachers on student achievement indicates that there are teaching
methods and student activities that lead to substantial gains in student
achievement. Beyond teaching methods and assessment, the significance of a
positive connection with an adult in the building is a crucial factor in student
success.
Teacher support can be defined as academic or interpersonal support for
students (Fredricks, Blumenfeld, Paris, 2004). Classroom structure is observed in
the rules and procedures utilized by each individual teacher in their classroom. An

68
example of classroom structure is the clarity of teacher expectations, the ability to
communicate those expectations to students, and the well-defined consequences
for students if they do not comply with those expectations (Connell, 1990).
Authentic pedagogy refers to a type of instructional planning and assessment used
by a teacher. Finally, students at the middle level are at a crossroads in their
academic, social and behavioral development. Middle School students have
unique needs as compared to elementary and high school students.
Teacher Support and Classroom Structure
Though teacher support has been shown to impact student academic
engagement at all levels, most assume the influence wanes in secondary schools.
Students tend to spend less time with each individual teacher in the middle and
high school level as compared to their time spent with elementary teachers. The
middle level model calls for more interpersonal support for students (Jackson &
Davis, 2000). Many schools that have had success in closing the achievement gap
have placed an emphasis on teachers creating substantive connections. These
connections between staff and students occur via advisory programs, personalized
education plans for each student that takes into account their academic strengths
and weaknesses, and by cultivating an environment safe for learning, inclusive of
trust, respect, and encouragement (McNulty & Quaglia, 2006). Dr. Sbrocco found
that a strong relationship has been found between the initial behavioral
engagement of a student and the resulting positive relationship with a teacher
(Ladd, 1999). Emotional engagement has also been found to be positively

69
associated with teacher support (Skinner & Belmont, 1993), while students are
more likely to remain in school if they feel they have a strong relationship with an
adult advocate (Wehlage et al., 1989). The positive effects of strong relationships
between students and their teachers cannot be underestimated, especially when
one considers the consequences of high school dropouts on society. The
economic stratification in our society will only intensify when one considers that
over 55% of minority students fail to graduate high school (Orfield, 2009).
Teacher support is not simply being nice to students. By providing a rich
and rigorous curriculum in which students are challenged to develop solutions and
to ask questions, teachers will experience fewer disruptions and more engaged
students (Newmann, et al., 1995). Fredericks, Blumenfeld, & Paris (2004)
observed that engagement increases in middle school classrooms where teachers
create an atmosphere that emphasized academic challenge and student
understanding of classroom content. Dr. Sbrocco (2009) discovered that the
teachers who had high academic expectations for their students and who
supported students to create and defend their own opinions also experienced
higher student engagement (Stipek, 2002).
Authentic Pedagogy
Authentic pedagogy challenges students to participate in intellectual
accomplishments that are significant and connected to the real world (Newmann,
Secada, & Wehlage, 1995). Wehlage et al., (1989) identify that student
participation in authentic tasks will be more likely to motivate students to work

70
hard in academics and therefore be more engaged. Students who are not mired in
low-level and menial academic tasks, and instead are challenged to confront real
world issues, demonstrate a positive attitude towards school (Newmann, Secada,
& Wehlage, 1995). Dr. Sbrocco (2009) revealed that middle school students who
participate in authentic learning activities are likely to be more engaged in school,
however, authentic learning opportunities are limited in U.S. secondary schools
(Louis & Marks, 1998).
Authentic academic achievement is defined as the ―construction of
knowledge, disciplined inquiry, and value of learning beyond the school‖
(Sbrocco, 2009, p. 50). When a student actively builds their own knowledge, they
are challenged to produce original expressions of knowledge, rather than
regurgitating the thoughts and ideas of their teacher or textbook (Sbrocco, 2009).
Disciplined inquiry requires students to consider what they already know and to
begin to create connections between their prior knowledge and the new content
they interact with. As Tony Wagner (2008) describes in The Global Achievement
Gap, ―we need to approach problems and challenges as a learner as opposed to a
knower. We need to be curious versus thinking ‗I know the answer.‘ Yesterday‘s
solution doesn‘t solve tomorrow‘s problem‖ (p. 17). Dr. Sbrocco (2009) found
that when students share their construction of knowledge with people who are not
their classmates or teacher, motivation surges and students are more apt to
experience value beyond school (Wagner, 2008; Newmann, Secada, & Wehlage,
1995; Jackson & Davis, 2000).

71
Authentic instruction is vitally important in the effort to close the
achievement gap as the use of authentic pedagogy produces student achievement
at high levels, regardless of student background (Newmann et al., 1996). Dr.
Sbrocco (2009) discovered that engagement levels (behavioral, emotional, and
cognitive) are increased for students who have teachers who utilize authentic
pedagogy (Fredricks, Blumenfeld, & Paris, 2004). Authentic pedagogy strives to
shift the emphasis of schools from simply learning facts to striving for deep
understanding of issues and using an inquiry based protocol to increase
knowledge. If students believe their work is important, that it is related to ―real
world‖ issues, they will become more engaged in their educational activities
(Marks, 2000).
Disengagement
Students who are not engaged in their education often earn lower grades
and test scores, are absent more often, and dropout from school more often than
students who are engaged. Minority students usually fare worse than their white
counterparts, evidenced by higher dropout rates, lower grades, not completing as
many years of school, and by not taking as many advanced placement classes
(Gay, 1989; Shapiro, Loeb, & Bowermaster, 1993). Researchers have found
overwhelming evidence that racial minorities in U.S. schools are victimized by
negative stereotypes and diminished expectations regarding their academic
ability, and do not perform to the best of their ability as a result (Birenbaum &
Kraemer, 1995). By 2001, minority students represented the majority of public

72
school students in 23 of 25 of the largest cities in the U.S (Landsman, 2001). The
concentration of minority students in our largest public school systems, and the
attenuating issues regarding student engagement, may be exacerbated by the
dearth of minority teachers, administrators and support staff in many U.S.
schools.
Since the Brown v. Board of Education decision in 1954, the majority of
U.S. teachers, administrators, and support staff have been white, even in schools
that primarily serve minority students (Landsman, 2001). According to one study
in 2005, 85% of teachers in the U.S. were white (Feistritzer & Haar, 2005). Gary
Landsman (1992) predicted the percentage of minority teachers would actually
decline over the next few decades as college educated people of color would
choose professions other than teaching. The decline in minority teachers will
occur simultaneously with the unprecedented demographic shift of minority
students emerging as the majority of students in the U.S. (Parker, 2003).
The preponderance of white teachers in U.S. schools often view minority
students as ―foreign‖ to the school environment and believe their role is to ―help
minority students to be more like whites‖ (Bolgatz, 2005). In many schools,
students believe that ―white is right‖, which may contribute to the disengagement
of minority students. Studies have shown that perceived racism leads to the
creation of an oppositional culture. Ogbu‘s controversial finding that black
students eschew the white dominant culture often present in educational settings
has been debated for the past two decades. Dr. Sbrocco (2009) described the

73
oppositional culture theory that students who try their best in school and who
demonstrate academic achievement are ―acting white‖ (Fordham & Ogbu, 1986).
Ogbu based his hypothesis on his analysis of 5,000 black students in the affluent
Cleveland suburb of Shaker Heights, OH. Ogbu found that even though black
students understood what was needed to earn A‘s in school and could thoroughly
explain the effort necessary to earn high grades, most black students nonetheless
earned sub-par grades (Fordham & Ogbu, 1986). Ogbu was also surprised to
learn black students often failed to recognize the role models in their own homes,
as their parents were often working two and three jobs to provide for their
children. Black students instead focused on entertainers, specifically rappers, as
their role models; role models who did not seem to reinforce the importance of
education (Fordham & Ogbu, 1986). Even black students whose parents were
doctors or lawyers struggled in the Shaker Heights educational system, and many
of them were unable to correlate educational success with job opportunities in the
future (Fordham & Ogbu, 1986). Dr. Sbrocco (2009) explained that Ogbu
discovered the same phenomenon many other researchers have found; black
students often view academic success as incompatible with black identity
(Steinberg, 1996; Jencks & Phillips, 1998; Peterson-Lewis & Bratton, 2004).
Ogbu also found similarities in the educational attitudes of both black
parents and black students with low-status minorities in other nations he had
studied as an anthropologist. Ogbu (1978) believes that ―involuntary immigrants‖
in a particular society accept an oppositional culture in which the dominant

74
culture‘s educational goals are resisted. In the U.S., black Americans whose
ancestors experienced the evils of slavery would represent involuntary
immigrants, and they are found to suffer in much the same way minority cultures
are oppressed in nations abroad (Ogbu, 1978). Black students who do well
academically experience ―achievement dissonance,‖ believing their academic
achievement is out of the ordinary for black students (Fordham & Ogbu, 1986).
As Professor Fordham offered in a 2002 interview with Felicia Lee of the New
York Times (2002), ―black kids don‘t get validation and are seen as trespassing
when they exceed academic expectations.‖
Sbrocco (2009) described the conundrum thusly: Black students find
themselves in an educational vortex in which they can choose to ―act white‖ and
ignore their cultural identity, or they can reject academics in an attempt for social
acceptance from their black peers (Ogbu, 1985). This self-destructive choice
affects both academics and self-identification. One vestige of the pattern of
discrimination against black students in U.S. schools is revealed in the propensity
of black students to believe they have inferior thinking skills (Fordham & Ogbu,
1986). If a black student attempts to do their best in school, they are seen as
emulating their white oppressors (Ogbu, 1994). Black students may also
unwittingly exert peer pressure on fellow black students, as those who are trying
their best in school are ―acting white‖ (Fordham & Ogbu, 1986).
Stereotype threat is also a threat to the success of minority students
(Sbrocco, 2009). Negative stereotypes affect minority students‘ academic

75
achievement (Jencks & Phillips, 1998). The stereotype threat is defined as being
placed in a situation where a stereotype about your group could apply (Steele,
1997). Black students operate in an environment in which negative stereotypes
related to academic ability has a corrosive impact on their confidence. A few of
the stereotypes are that black students may be on campus only as a result of
Affirmative Action, or that the black-white achievement gap will affect their
achievement, or the relatively miniscule representation of black students on
campuses reflects the intelligence levels of blacks. Dr. Sbrocco (2009)
summarized research that revealed the stereotype threat most often affects
academically successful blacks (Jencks & Phillips, 1998; Ryan & Ryan, 2005)
because getting a low score on a test will confirm the stereotype that all black
people are deficient in innate intelligence (Jencks & Phillips, 1998; Steele &
Aronson, 1995; Steele, 1999).
Stanford Psychology Professor Claude Steele‘s 1995 study captures the
stereotype threat experienced by blacks. Steele chose a section of the rigorous
verbal section from the Graduate Record Examination (GRE) because he knew it
would cause frustration in his undergraduate students. If black students were told
the test measured diagnostic ability, they would be under stereotype threat when
they took the test because they believed their personal intelligence was to be
measured (Steele, 1997). White students may have personal issues with
standardized tests (e.g., test anxiety), but since they are not at risk of confirming
negative stereotypes about their entire race, they do not face the added pressure

76
experienced by black students. When students were told the test was a
measurement of their intelligence, white student performance was unaffected,
while black student performance dropped precipitously (Sbrocco, 2009). A
second group of students took the same test, albeit with different instructions.
The instructions for the second group conveyed that the test did not measure their
intelligence, rather that the test would help students develop their problem solving
ability. Black and white students performed the same on the second test because
the stereotype threat was removed (Steele & Aronson, 1995). The advent of
disaggregated scores for NCLB legislated tests presents an added layer of
stereotype threat. If black students are aware of the black-white achievement gap
shown in every state‘s standardized tests (Nation‘s Report Card, 2009), they may
feel increased pressure to perform when they take the state tests.
Oppositional Peer Culture and Stereotype Threat
Though research directly connecting oppositional culture and stereotype
threat with middle-level students is rare, a few studies have discovered a link
(Sbrocco, 2009). Similar to the stereotype threat research at Stanford, studies have
shown black middle school students also face diminished scores if they believe
the tests evaluate their innate intelligence (McKown & Weinstein, 2003). Dr.
Sbrocco (2009) indicated Middle school students are also able to understand
racial stereotypes, and research shows black students confront negative academic
stereotypes more often than white students (McKown & Weinstein, 2003).
Jackson and Davis (2000) found identification development is a crucial

77
development for adolescents as they learn their roles in their social groups as well
as adopt their morals and values.
Dr. Sbrocco (2009) explained that black students often disidentify with
school in an effort to preserve their identity (Steele, 1992; Jencks & Phillips,
1998, Steele & Aronson, 1995; Osborne, 1995; Osborne, 1997). Disidentification
by black students represents the tenuous connection between self-esteem and
academic achievement (Steele, 1992). Dr. Sbrocco (2009) explained the
counterintuitive situation in many schools; though black students often earn lower
grades in classes and on standardized tests, they report higher levels of self-
esteem than white students (Osborne, 1995; Rosenberg, Schooler, Shoenback &
Rosenberg, 1995). Steele, et al, were cited in the Sbrocco (2009) research because
―the negative cycle is perpetuated in schools as black students disidentify with
their school in an attempt to retain or even enhance their self-esteem‖ (p. 55).
Multiple studies have found a strong correlation between school identification and
academic engagement, and resultant success in school (Finn, 1989; Steele, 1992;
Voelkl, 1997). The stereotype threat evidenced by the Stanford experiments
reveals a loathsome psychological struggle for black students. Convinced they
lack innate academic ability, or have diminished intelligence, black students may
become anxious on tests because they desperately want to avoid confirming the
prevailing negative stereotypes (Steeele & Aronson, 1998). Faced with the
stereotype threat for years, some black students may disidentify with school and
their educational environment (Sbrocco, 2009).

78
National and Local Integration Plans
One solution to closing the achievement gap may be voluntary
desegregation efforts. The Choice is Yours (TCIY) Program involves students in
Minneapolis and nine participating western suburban school districts. The
positive academic achievement of participating students, as well as overwhelming
satisfaction evidenced by parent surveys (Aspen Associates, 2009), indicate The
Choice is Yours Program holds promise in the quest to integrate hyper-segregated
schools in Minneapolis, MN. Families residing in Minneapolis are provided
school choice with a reduction of traditional barriers (e.g., free transportation for
participating students, family information centers, etc.). The following
paragraphs will provide an overview of major national voluntary desegregation
plans, explain the genesis of The Choice is Yours Program, and provide data
relevant to the evaluation of The Choice is Yours Program.
Open Enrollment and Voluntary Desegregation Programs
Open enrollment inter-district choice plans reflect the recent trend of
framing solutions in market terms, and fierce competition results between school
districts as they try to attract students and their accompanying state funds (Holme
& Wells, 2008).
Lack of transportation reimbursements for participating families,
especially low-income families, affects involvement in open enrollment programs.
Suburban school districts determine the number of students they will accept, and
with little administrative oversight and lower per pupil funding allocation in many

79
states, there is a disincentive for suburban schools to accept students via open
enrollment programs (Holme & Wells, 2008). As a result, open enrollment
programs have not substantially benefitted what William Julius Wilson (2006)
terms ―the truly disadvantaged‖ (Holme & Wells, 2008). The Wisconsin Chapter
220 program, when compared to the Wisconsin open enrollment program,
demonstrates the extreme difference in racial involvement in the two initiatives.
In the Chapter 220 program, 72% of the participating students are black, while
85% of the Wisconsin open enrollment program participants were white in the
2001-02 school year (Holme & Wells, 2008). Furthermore, 63% of the white
students came from Milwaukee Public Schools, which only had an overall 18%
white enrollment (Holme & Wells, 2008). The Wisconsin open enrollment
program was actually decreasing diversity in Milwaukee and the suburbs.
Interdistrict Voluntary Desegregation Plans
The significance of voluntary desegregation programs increased after the
Supreme Court‘s Parents Involved in Community Schools v. Seattle School
District (2007) decision. The majority opinion decreed race could not be used as
the sole factor in school desegregation plans. Nearly every state now has an open
enrollment school choice plan. Another option to increase diversity in school
districts is interdistrict voluntary desegregation plans. The following paragraphs
will outline studies regarding parent understanding of NCLB legislated options as
well as explain the strengths and weaknesses of open enrollment school choice
plans and interdistrict voluntary desegregation plans.

80
NCLB legislation includes a progressive set of penalties if public schools
do not meet adequate yearly progress for all segments of their student body;
however, the reality is that many parents are not aware of a failing school‘s
responsibility to provide tutoring or transportation to a non-failing school (Snell,
2004). A 2004 Harvard study of ten school districts found only three percent of
students in a failing school requested a transfer to a school that was making
adequate yearly progress (Snell, 2004). In Buffalo, NY, 75% of parents of
students in failing schools were oblivious their children‘s school offered transfers
to students because they had not met adequate yearly progress (AYP) for two or
more years. Once parents were aware of their option for their children to transfer
to a non-failing school, 92% indicated they would like to utilize the transfer
option (Snell, 2004). Clotfelter‘s (2004) research revealed the more likely a
district has one or more failing schools, the less likely that the district will have
many non-failing schools. The burden often falls on parents and students to
research school options, to arrange transportation, and to make arrangements for
school transfers (Holme & Wells, 2008).
The goal of an Interdistrict Desegregation Plan is to achieve racial and
socioeconomic status diversity in both suburban and urban schools (Holme &
Wells, 2008). Factors that affect the success of interdistrict desegregation plans
include free transportation, administrative assistance for families who are
transferring schools, programs that assist urban school districts (e.g., magnet
schools), as well as continued support and oversight from the state (Holme &

81
Wells, 2008). There are eight major voluntary interdistrict desegregation plans in
the U.S. The St. Louis integration plan involves more than 14,000 students.
Holme & Wells (2008) maintain there are two significant reasons that explain the
success of the St. Louis program: strong guidelines for participation and a
financial commitment in the form of $8,000 in per pupil funding. Freivogel
(2002) believes the St. Louis transfer plan meets the goals of NCLB and could
serve as a template for present and future voluntary desegregation plans. The St.
Louis interdistrict transfer plan ―permits parents of children in failing schools to
send their children to more successful public schools. And it reconstitutes failing
schools with new principals and educational programs… As a notable example of
the last century‘s great educational experiment of desegregation and as an
example of this century‘s educational reform model, St. Louis has lessons to offer
the rest of the nation‖ (Freivogel, 2002, p. 1).
Despite the fact that most of the interdistrict desegregation plans were
borne of a court case, a number of positive outcomes are associated with these
plans. Transfer students have experienced greater academic achievement,
matriculation to college is increased for transfer students, and evidence exists that
racial attitudes were improved as a result of these integration programs, especially
for participating transfer students (Holme & Wells, 2008).
The Choice is Yours (TCIY) Program
The diversity of Minneapolis Public School (MPS) students has shifted
dramatically over the past 50 years, mirroring the trend of many of the urban

82
centers in the U.S. In 1964, black students made up only 6.2% of Minneapolis
Public School (MPS) enrollment (Reinhardt, 2004). By the 2008-09 school year,
black students comprised 39.2% of MPS students (MPS, 2008). Though the
emergence of black students as the largest racial group in MPS is a recent
development, the existence of racially isolated schools within the district is not.
A Federal Court decided in the 1972 Booker et al. v. Special School District No. 1
case that Minneapolis schools were unlawfully segregated. U.S. District Court
Judge Earl Larson decreed Minneapolis schools had "intentionally and
deliberately" kept students segregated within district schools (Boyd & Hopkins,
2008). In 1973, the state of Minnesota adopted a statewide desegregation rule
with the intent to integrate schools across the state.
The desegregation rule proved ineffective, especially in Minneapolis.
Minorities made up 13% of the population in Minneapolis in 1980. By 1990,
minorities comprised 22% of Minneapolis citizenry. In the same ten-year period,
people living in poverty increased from 14% to 19% (U.S. H.U.D., 2006). The
suburbs had a 2% racial minority population in 1980, and minority presence in the
suburbs doubled to 4% by 1990. Meanwhile, the poverty rate in the suburbs
hovered at 5% during the 1980‘s (U.S. H.U.D., 2006). MPS and neighboring
suburban schools continued to diverge in diversity, poverty level and in
educational opportunities available to students.
Demographic changes in MPS accelerated in the 1990‘s. By 1995, the
poverty level of MPS students soared to 55%, and approximately 66% were

83
minorities (Minneapolis Branch of NAACP v. State of Minnesota, 1995). MPS
made a controversial decision in 1995 to create neighborhood (or community)
schools. MPS students would now go to schools that were closer to their homes,
and the move was approved by nearly 66% of MPS parents (Hotakainen, 1995).
However, Myron Orfield of the University of Minnesota‘s Institute on Race &
Poverty, along with the Minneapolis NAACP and the Urban League, decried the
MPS decision to institute community schools (Orfield, 1997). Though Minnesota
schools were bound by the state desegregation rule to keep each school‘s minority
population within 15% of the overall district minority population, MPS was
allowed to ignore this rule as neighborhood schools were implemented (MN
Department of Children, Families & Learning, 1998). Furthermore, the MPS
school board had a goal that no school would achieve hyper-segregation by
ensuring no school would surpass 70% of any one racial group (MPS, 1995).
This rule was also overlooked, and hyper-segregated schools would proliferate in
MPS as a result.
The Minneapolis NAACP filed a lawsuit in late 1995 against the state of
Minnesota, arguing that MPS students were not receiving an adequate education.
The NAACP‘s lawsuit alleged the high levels of minority and low-income
students in MSP diminished their educational experience as compared to suburban
students. The Minnesota Constitution requires the legislature to ―establish a
general and uniform system of public school for all students‖ (Minnesota
State Constitution, Article XIII). The tactic of utilizing state constitutional law to

84
argue for equitable educational opportunities for all students was first successfully
utilized by plaintiffs in the Sheff v. O’Neill (1989) case (Orfield, 2005). Using the
Minnesota Constitution as the foundation for their argument, the NAACP
produced desultory statistics that demonstrated MPS students lagging behind their
suburban peers in graduation rates, standardized test scores, and matriculation to
college (NAACP v. Minnesota, 1995). In 1998, the NAACP filed the Xiong et al
v. State of Minnesota. The numerous plaintiffs represented the growing
dissatisfaction with the limited educational opportunities of MPS (Orfield et al,
2007). The lawsuit was settled in 2000, and there were several specific outcomes.
The Choice is Yours (TCIY) Program is one outcome of the lawsuit
settlement from the NAACP v. State of Minnesota case. The NAACP contended
that Minneapolis magnet schools and the schools in the suburbs were far superior
to the schools located in poor Minneapolis neighborhoods. The TCIY Program
offers school choice to all Minneapolis students who qualify for free and reduced
price lunch. As a result of the lawsuit settlement, eligible parents were offered
both inter- and intradistrict options for their students (Aspen Associates, 2009).
Impoverished families, defined as a family of four that less than $35,798 a year,
may opt for interdistrict transfers to desirable magnet schools within the
Minneapolis school district, or they may select an intradistrict transfer to one of
the participating western suburban school districts. Per the lawsuit settlement, the
suburban choice school districts offered a minimum of 500 seats in the first year
(2001-2002), and increased the allotment of 500 seats per year for an additional
85
three years for total of 2000 seats by 2004-05 (Settlement Agreement, 2000).
Following the 2004-05 school year, the participating districts agreed to continue
the voluntary desegregation effort. A crucial facet of the TCIY Program is free
transportation. Participating students are given free transportation via bus or taxi,
regardless of the western suburban school district or Minneapolis magnet school
they choose to attend. The West Metropolitan Education Program (WMEP) was
also formed to assist with staff development for MSP and the western suburban
districts, and two Fine Arts Interdisciplinary Resource (FAIR) schools were
created for suburban students who wished to attend school in Minneapolis or
Crystal (Aspen Associates, 2009). For the purposes of this paper, the Choice is
Yours (TCIY) program will exclusively refer to the western suburban choice
program.
By many measures, the TCIY program has been a success. Liz Palmer
(2003) revealed in her two-year evaluation of TCIY that of the major voluntary
desegregation efforts in the U.S., TCIY was found to be the best of nine programs
(Orfield, 2006). Participation has increased from 472 students in the inaugural
2001-02 school year to approximately 2100 students in the 2008-09 school year
(MPS, 2009). The more than four-fold increase in student participation is coupled
with high approval ratings from parents of TCIY students (Aspen Associates,
2009). In a 2007-08 survey, 96% of parents indicated they would recommend the
TCIY Program to their friends (Aspen Associates, 2009). This level of parent
satisfaction is consistent with previous survey data (Orfield, 2006). Though their

86
children are subjected to extended bus rides as well as the prospect of
experiencing racism in schools, parents overwhelmingly approve of the TCIY
program (Orfield, 2005). Nearly 66% of students returned to the suburban choice
school each year through the programs first seven years (Aspen Associates,
2009). Though students involved in other desegregation programs have been
targets of hostility, TCIY students and parents report satisfaction with the racial
climate of the western suburban schools (Orfield, 2006).
The research on the impact of TCIY on student achievement is mixed. In
the first four years at the pilot stage (2001-2005), TCIY students outperformed
their non-participating peers who remained in Minneapolis (Orfield, 2006).
Between 2005 and 2008, students who attend schools in the western suburbs have
continued to demonstrate academic gains over their non-participating peers who
remained in Minneapolis schools (Aspen Associates, 2009). Students in the
TCIY program outperformed their non-participating peers in 2004-05 and 2007-
08. In 2005-06, TCIY students were outperformed by their non-participating
peers, and in 2006-07, the academic achievement of TCIY students and non-
participating peers were virtually the same (Aspen Associates, 2009). One
limitation to the evaluation of academic performance in the TCIY program is
student mobility. Though the TCIY student participation has increased each year,
there are different TCIY students from year to year as 33% do not return to their
same school (Aspen Associates, 2009). Though students who qualify for free and

87
reduced price lunch can still be compared, the same cohort of TCIY students does
not exist from year to year.
One intended goal of the TCIY program is to increase integration in the
western suburban schools through voluntary desegregation methods. The
majority of students participating in the TCIY program live in two mostly black
zip codes in north Minneapolis, and their exodus to western suburban schools has
diversified the schools the Minneapolis students attend (Aspen Associates, 2009).
Summary
This chapter has reviewed the evolution of the achievement gap in U.S.
schools. The historical record of the legislative policies and judicial decisions
related to efforts of closing the achievement gap spanned three centuries. Studies
have found student engagement has a positive correlation in terms of increasing
school identification and achievement.
Researchers have focused on what middle level schools and their teachers
are able to control as they look to enhance student engagement, positive school
culture, and authentic curriculum and instruction. Oppositional culture, stereotype
threat, and disidentification all contribute to disengagement of minority students
in their academic environments. Finally, open enrollment policies and voluntary
desegregation programs, notably Minneapolis‘ The Choice is Yours program,
were assessed in terms of their goals, organization, and results.

88
Chapter Three
Research Methods
The overarching purpose of this research is to analyze the relationship between
the achievement of 8th
grade students and their behavioral, cognitive, and emotional
engagement. Each 8th
grade student in Wakta was invited to participate in an online
survey regarding their 8th
grade experience in one of the three district middle schools.
The responses of each student were matched with demographic and academic
achievement data (e.g., MCA and MAP scores). A quantitative analysis of the data
provided an answer to the question of whether increased engagement leads to a decrease
in achievement gaps between groups of students.
There are five sections in this chapter. Section one details the rationale for the
research design for this study. Section two describes each of the three research sites
involved in this study, as well as an overall description of the Wakta School District.
Section three provides information about the sampling frame of this study. The survey
instrument is discussed in section four. Section five describes both data collection and
data analysis utilized in this study. Finally, section six details the limitations experienced
in this research.
Rationale for the Research Design
Postpositivist theory guided this research project. A postpositivist researcher
―assumes a learning role rather than a testing one‖ (Agar, 1988, p 12). Though
administrators and teachers are viscerally aware of an academic achievement gap
between groups of students (e.g., black and white students) in Wakta, there is not a

89
consensus on the reasons ―why‖ the gap persists, or ―how‖ to close the gap in
achievement. The intent of this study is to determine if engagement does indeed have an
impact of narrowing the academic achievement gap between groups of students.
Researchers who employ a postpositivist approach view themselves as ―people who
conduct research among other people, learning with them, rather than conducting
research on them‖ (Wolcott, 1990, p 19).
Postpositivist research is often exploratory, and explanations for problems
―sometimes have to be discovered‖ (Hammersley, 2000, p 456). Students who
participate in this study were provided an opportunity to include their comments
regarding the reasons they feel they are engaged (or disengaged) in their education. This
research is ―postpositivism in nature because it will begin with a theory and data will be
collected that will either support or disprove the theory‖ (Sbrocco, 2009, p 88). Dr.
Renee Sbrocco conducted the exact same study in Bloomfield, MN in 2007, and her
research revealed a positive and significant correlation between increased engagement
and increased academic achievement for black students (Sbrocco, 2009).
A post-positivism orientation lends itself to a variety of specific types of
methodology, including both qualitative and quantitative, as long as the purpose is to
look for regular and predictable associations among subjective phenomena (in this case,
attitudes/subjective experiences and achievement). Ryan et al outlined the benefits of a
quantitative study in 2006. According to Ryan et al, quantitative studies:
provide a broad familiarity with cases;
examine patterns across many cases;
show that a problem is numerically significant;
provide readily available and unambiguous information.

90
This study was cross-sectional, as students were assessed at a single point in time
(Sbrocco, 2009). Additionally, this study was correlational. Researchers utilize
correlational studies to address the relationship of one variable when another variable
changes (Thomas, 2003). One advantage of using a correlational study is the use of
statistical techniques for calculating the degree of a relationship between two variables.
The major limitation of a correlational study is the input data. If a researcher collects
faulty data, the correlation is compromised (Thomas, 2003).
The Site
Wakta is an affluent and growing school district located in the suburbs of
Minneapolis, MN. Wakta Public Schools currently educate approximately 10,000
students from several surrounding communities. Approximately 250 students enroll in
Wakta schools as part of The Choice is Yours program, and hundreds of students attend
via other open enrollment options. Wakta Public Schools include seven elementary
schools (K-5), three middle schools (6-8) and one high school (9-12). These 11 schools
employ 1,287 people, including 697 teachers (Wakta Fact Sheet, 2010-11).
In September 1997, Wakta transitioned to a school reorganization that would
include 9th
graders for the first time in district history. The creation of a 9-12 high school
allowed Wakta to transition from a junior high model to a middle school model. Before
1997, there were two junior high schools (grades 7-9), MS #1 and MS #2. The
emergence of the 9-12 high school occurred simultaneously to the creation of three
middle schools that would serve sixth, seventh, and eighth graders. The three middle
schools were named Middle School #1 (―MS #1‖), Middle School #2 (―MS #2‖), and

91
Middle School #3 (―MS #3‖). Though there are differences among the three middle
schools in terms of student demographics and in the physical plant of each school (e.g.,
MS #3 is the former high school and has a full-size auditorium, a hockey rink, and a
sprawling campus, MS #1 School was constructed in 1951 sans air conditioning, etc.), the
achievement results are similar when the schools are compared to each other.
In terms of student enrollment (grades 6-8), MS #3 serves 945 students, MS #2
has 758 students, and MS #1 has 715 students. MS #3‘s 8th
grade class has 311 students,
while MS #2 (256 eighth graders) and MS #1 (230 eighth graders) have noticeably
smaller 8th
grade enrollments. MS #2 serves the highest percentage of black students
(12%), while MS #3 educates the most Asian students (14%). Hispanic students make up
4% of the MS #2 8th
grade enrollment, while they comprise 2% of both MS #1 and MS
#3‘s 8th
grade student body. MS #2 is the only Title I middle school in the district, and it
has more than twice the number of students who qualify for free/reduced price lunch
(22%) than MS #1 (10%). MS #3 has 12% students that qualify for free/reduced price
lunch. Each middle school‘s 8th
grade class has at least 74% white students.
Appendix G includes the demographic information for each Wakta middle school.
Adequate Yearly Progress (AYP) is ―an individual state's measure of yearly progress
toward achieving state academic standards‖ (www2.ed.gov, 2004, p. 1). This chart
indicates if demographic groups, schools and the district are making AYP progress. Safe
Harbor (SH) occurs when at least a ―10% reduction in the number of students (in each
group) deemed to be non-proficient and makes improvement in one other indicator‖
(www2.ed.gov, 2004, p. 7).

92
Sampling Frame
The sampling frame for this study included all 786 eighth grade students who
attended one of the three middle schools (MS #1, MS #2, or MS #3) in the Wakta Public
School District. This sampling frame is considered purposive for several reasons. Eighth
grade students are on the cusp of their high school experience, thus their perceptions of
their educational experience are highly valuable for teachers, parents, and administrators
whose charge is to create appropriate and engaging educational programming. Dr.
Sbrocco cited Merriam‘s as she explained purposive sampling ―is based on the
assumption that the investigator wants to discover, understand, and gain insight and
therefore must select a sample from which the most can be learned‖ (p. 61). The
researcher was able to obtain demographic and achievement data for all students in the 8th
grade cohort from the Wakta Teaching and Learning Department. Finally, the 8th
grade
cohort was chosen as several national engagement surveys (e.g., NAEP, NELS:88,
NHES, etc.) include responses from 8th
grade students.
Data Collection Tools
Survey Instrument
This research is a replication of Dr. Renee Sbrocco‘s study in 2009. An online
survey was used to collect data for this quantitative research. In the Sbrocco (2009) study,
an online survey was used to measure eighth grade students‘ perceived academic
engagement.
There are several national surveys that provided a template for this research. The
National Education Longitudinal Study of 1988 was taken by a nationally representative

93
sample of 8th
graders in the spring of 1988 (Sbrocco, p. 66). These students subsequently
completed the NELS survey in 1990, 1992, 1994, and 2000. The NELS survey included
statements related to behavioral engagement, cognitive engagement, and emotional
engagement. Dr. Sbrocco‘s research revealed that NELS items included ―school, work,
and home experiences; educational resources and support; the role in education of their
parents and peers; neighborhood characteristics; educational and occupational
aspirations‖ (NELS, 2008). Several researchers have used the NELS survey data to
buttress their engagement studies. Finn and Rock (1997) utilized NELS data to as they
analyzed behavioral engagement in school and the classroom (Sbrocco, 2009). In 1993,
Finn and Voelkl (1993) used NELS data to study overall school engagement, behavioral
engagement, and emotional engagement. The survey utilized in this research includes
several questions from the NELS survey, specifically behavioral, cognitive, and
emotional engagement questions (Sbrocco, 2009). Appendix F includes the survey
questions as well as the four-point Likert (1932) scale utilized in this study.
Another national survey that provided information for this research was the
Educational Longitudinal Study (ELS) of 2002. The ELS survey focused on the
educational experience of 10th
graders that matriculated high school and moved on to
work or postsecondary options (ELS, 2008). The researcher found the ELS survey
included questions that could be adapted for an engagement survey for 8th
graders. One
focus of the ELS survey was an analysis of the correlation between academic
achievement (measured by test scores) and student recollections regarding their
educational experience. Lee and Smith (1993, 1995) cited NELS data to support their

94
finding that students in schools with more elements of a community organization showed
higher engagement and greater gains in engagement over time (Fredricks, Blumenfeld, &
Paris, 2004). Sbrocco (2009) used items from the both NELS and ELS as she created the
instrument that measured behavioral, emotional, and cognitive engagement of 8th
grade
students.
In addition to the NELS and ELS, the High School Survey on Student
Engagement 2005 (HSSSE) was used to help create the instrument for this study. The
HSSSE was developed by the Indiana University School of Education and has been
completed by nearly 300,000 students from high schools across 29 states. The survey is
intended to assess the extent to which high school students engage in educational
practices associated with high levels of learning and development (HSSSE, 2008).
Although few studies have been completed on data collected on HSSSE, the survey
articulates all areas of engagement and was written using the current cannon of
knowledge on engagement, so items from it are included on the Bloomfield instrument as
well.
Renee Sbrocco created a survey that ―measures students‘ perceived thoughts on
how well teachers and schools utilize a developmentally appropriate school model and
authentic instruction‖ (Sbrocco, 2009). Several questions were created to assess student
perceptions regarding their 8th
grade experience as well as the real world implications of
their education. Sbrocco (2009) created these questions by utilizing Turning Points 2000,
the seminal work of Jackson & Davis. Turning Points 2000 (Jackson & Davis, 2000)
outlines a host ―of recommendations for schools to implement‖ (Sbrocco, 2009). The

95
recommendations included in Turning Points 2000 were tailored to the middle-level
experience (usually students in grades 6-8). The researcher utilized the framework of
Turning Points 2000 to create statements for the survey instrument. In the final survey,
fifteen of 83 questions are specifically related to the developmentally appropriate school
model (Sbrocco, 2009).
Authentic Pedagogy was a focus in this research. Fred Newmann et al (1995)
have found that authentic pedagogy is one way to engage students in their educational
environments. Wehlage (1989) found ―participation in authentic tasks will motivate
students to work hard in academics, and therefore be more engaged‖ (Sbrocco, 2009).
Newmann, Secada, and Wehlage (1995) coined authentic pedagogy in their work, and
found the following aspects lead to increased student engagement:
1) Higher Order Thinking
2) Deep Knowledge
3) Substantive Conversation
4) Connections to the World Outside the Classroom
Dr. Sbrocco measured authentic instruction with statements that included the four
components outlined by Newmann et al. Students were asked to respond to five
authentic pedagogy-related questions on this survey. Sample items included, ―What I‘m
learning in my classes will help me in the real world,‖ and ―I‘m required to talk with my
classmates about the subject we are learning during class‖ (Sbrocco, 2009).
Students were also queried about their perception of teacher support and school
climate. Teacher support of students has long been connected to increased engagement.

96
In the study entitled Relationships Matter (2004), Klem & Connell found ―students with
caring and supportive interpersonal relationships in school report more positive academic
attitudes and values, and more satisfaction with school.‖ The DASM posits that young
adolescents will be more successful in school if teachers infuse ―interpersonal support
into regular classroom instruction‖ (Sbrocco, 2009). In the survey instrument, students
indicated their level of agreement with fourteen statements related to teacher support. A
Likert Scale was used, and students had four choices for each statement: strongly agree,
agree, disagree, and strongly disagree. A few examples of teacher support statements
were, ―My teachers believe I can do well in school,‖ and ―My teachers really listen to
what I have to say.‖ Researchers have found a positive correlation between school
climate and student achievement. Adelman & Taylor (2010) state ―a positive climate can
have a beneficial impact on students and staff; a negative climate can be another barrier
to teaching and learning‖ (p. 16). Seventeen school climate-related questions were
included in the survey instrument. Examples included ―My school honors academic
achievement,‖ and ―Discipline rules at my school are fair‖ (Sbrocco, 2009).
Survey research was used in this study for several reasons. First, surveys can be
administered confidentially and are useful for collecting information on sensitive matters.
Surveys also provide an efficient means to collect and analyze data. A summary of the
types of questions are listed in Table 3.1.

97
Table 3.1 Survey Instrument
Factors Sample Questions Number of
Questions
Behavioral Engagement I participate in class discussions. 8
Emotional Engagement I like coming to my school. 10
Cognitive Engagement I like when I have to think really
hard about an academic problem.
14
Overall Engagement I have been sent to the office/quiet
room because I was misbehaving.
8
Teacher Support When I work hard on schoolwork,
my teachers praise my effort.
14
School Climate/Culture At my school students are
expected to do homework.
17
Authentic Pedagogy I‘m required to talk with my
classmates about the subject we
are learning during class.
5
Developmentally
Appropriate School
Model
My teachers are preparing me to
be a lifelong learner.
15
Source: Sbrocco (2009) survey

98
Potential Limitations of the Survey Instrument
A limitation of this study is generalizability. The use of a convenient sample
instead of a simple random sample of eighth grade students prevents the use of sampling
error statistics. Since the unit of analysis is limited to one district, the results may not be
generalizable to other public school districts. Another limitation of this study is the scope
of the study. The subjects of the study are exclusively Wakta eighth graders, and there
will not be an attempt to survey other eighth grade students from around Minnesota or the
United States (Sbrocco, 2009).
Renee Sbrocco (2009) was the first researcher of record to create a survey
instrument that merged student engagement (behavior, cognitive, and emotional), DASM,
teacher support, authentic pedagogy, and school climate questions. When using an
instrument that has only been utilized once before ―an important limitation is that both
the validity and the reliability of the instrument has not been established when measuring
the perceptions of eighth-grade students‖ (Sbrocco, 2009). Nationally normed surveys
(NELS, ELS, HSSE) have proven to be both reliable and valid, and several questions on
this survey instrument were taken directly from these surveys. Another limitation is
multicollinearity between the types of engagement found in previous research (Fredricks,
Blumenfeld, & Paris, 2004). This intercorrelation of variables is a severe threat to
validity as ―predictors are confounded due to the correlations among them‖ (Stevens,
2002).
Achievement Data

99
In addition to the data collected from the students‘ surveys, demographic and
achievement data was collected for all 8th
grade students. Barbara Smith, the director of
Research and Evaluation for Wakta Public Schools, provided the demographic and
achievement data for each 8th
grade student. The researcher requested and received
achievement data for the 786 students, including 7th
grade MAP math and reading scores,
7th
grade MCA-II math and reading scores, 8th
grade MAP math and reading scores, 8th
grade MCA-II reading scores, and 8th
grade MCA-III math scores. Following the survey,
the achievement data will be linked with the demographic and survey responses for each
student. The MAP tests are created and administered by Northwest Evaluation
Association (NWEA). The NWEA website offers this summation:
Created by educators for educators, MAP assessments provide detailed,
actionable data about where each child is on their unique learning path. Because
student engagement is essential to any testing experience, NWEA works with
educators to create test items that interest children and help to capture detail about
what they know and what they‘re ready to learn. It‘s information teachers can use
in the classroom to help every child, every day. (nwea.org)
The MAP also allows ―schools and the district to compare individual and
aggregate student growth in learning to national norms‖ (Sbrocco, 2009, p. 73). The
MAP test ―dynamically adapts to a student‘s responses-as they take the test‖ (nwea.org,
2011). If a student answers a question correctly, the test will automatically ratchet up the
rigor of the next question. If a student answers incorrectly, the MAP test will offer a
simpler item in the future.
The MCA-II (Reading) and MCA-III (Math) ―is a criterion-referenced test that
aligns with the state of Minnesota‘s current academic standards‖ (Sbrocco, 2009). In
Minnesota, students in grades 3-8 take the MCA-II in reading and the MCA-III in math.

100
A requirement of the No Child Left Behind (2001) law is for each school district to assess
and communicate the achievement level of all students. The analysis will reveal student
achievement in relation to district, state, and national standards. Another facet of NCLB is
the Adequate Yearly Progress report. Students are divided into ethnic, socioeconomic
status, language, and special education categories (or ―cells‖) for purposes of comparison.
If one of the cells (there are 33 in all) is determined to be not making Adequate Yearly
Progress (AYP), the entire school is deemed to not be be making AYP. The AYP for
each category of students is based on averages of past performance of students in that
particular cell in that particular school and district. Once the MCA and MAP
achievement data was gathered, the data was merged with the demographic information
for each student.
Mobility emerged as an issue in data collection. If a student moved into the
Wakta school district mid-year, achievement data may not have been on file. There were
other students who had achievement data on file who had moved out of the district before
a student took the survey. Approximately a dozen students completed the survey, but did
not have the MCA or MAP achievement data available for analysis. Similar to Renee
Sbrocco‘s (2009) study, students must have survey responses and achievement data
recorded to be included in the research.
Overview of the Data Collection Process
The Survey
An online survey served as the data collection instrument. A pilot involving three
reading classes of 7th
graders (72 students overall) allowed the researcher to refine

101
instructions, ensure vocabulary was appropriate for middle school students, as well as test
the online survey log in and passwords. The 7th
grade students participated in the pilot
study in December 2010, during their reading class. The pilot survey revealed potentially
catastrophic programming errors. For example, every student in the second pilot class on
December 22, 2010, experienced a paralyzing ―white screen.‖ Once this screen appeared,
students were unable to complete their survey, to observe their responses, etc.
Consultation with Wakta Webmaster Francois Thompson allowed the researcher to locate
the issue and to set up a third pilot opportunity on January 21, 2011. This third pilot
session was a complete success in terms of student ability to access the survey, ability to
complete the survey, and ability of the researcher to analyze the results. Appendix A
includes student comments, student suggestions and subsequent revisions to the online
survey. Appendix B includes response data from the first pilot survey.
Approval from the Institutional Review Board (IRB) at the University of
Minnesota was secured on March 14, 2011. Upon receipt of IRB approval, the researcher
was able to commence data collection. The data collection process will be described in
the remainder of this section.
Use of a Modified Tailored Design Method
Dr. Sbrocco collected survey responses via ―an online, web-based, survey data
collection process‖ (Sbrocco, 2009, p. 75). Don Dillman (2007) outlines five elements
necessary to create an effective survey. Dillman‘s ―Tailored Design Method‖ served as
the foundation for both Dr. Sbrocco‘s and this researcher‘s study. Upon analysis, this

102
study satisfies four of the five elements of the ―Tailored Design Method.‖ The ―Tailored
Design Method‖ calls for implementation of the following conditions:
1. a respondent-friendly questionnaire,
2. up to five contacts with the questionnaire recipient,
3. inclusion of stamped return envelopes,
4. personalized correspondence, and
5. a token financial incentive that is sent with the survey request.
Upon analysis, this study satisfies four of the five elements of the ―Tailored
Design Method.‖ This research did not necessitate the use of stamped return envelopes
(#3) as the all communication was transported by student, staff member, or via email. As
Dr. Sbrocco (2009) states in her research, a researcher who institutes the above methods
of survey implementation should achieve good results.
The researcher strived to create a respondent-friendly questionnaire. The pilot
study with 7th
grade students allowed the researcher to observe student completion of the
survey. Furthermore, the researcher was able to collect data related to ease of use,
vocabulary, and comprehension of questions. A web-based survey was created with
Wakta Webmaster Francois Thompson, whose experience in survey creation and data
analysis aided the researcher throughout the data collection process. The final survey
included 90 questions. Though there were a substantial number of questions, the
efficiency of the survey resulted in an average completion time of 15 minutes. Students
were encouraged to share their views regarding their educational experience.
Furthermore, students were reminded that their identity would be protected. Responses

103
would not be released with identifying information attached. Eventually, 692/786 (88%)
Wakta 8th
grade students completed the survey between March and June 2011. If
students were absent when their class took the survey, they were able to access the
engagement survey on each subsequent trip to the computer lab. A few students
completed the survey on the last days of school in June 2011.
The second of Dillman‘s items calls for ―up to five contacts with each
respondent‖ (Dillman, 2007). Multiple contacts with respondents were not deemed
necessary for this particular study. Students took the survey in school under the
supervision of their geography teacher. This study was approved by both the Wakta
School District and the University of Minnesota. Full parental consent was mandated for
student participation per the University of Minnesota‘s IRB approval of this study.
Parents of each participant as well as each potential participant received several
informational reminders regarding participation in the study. Appendix D includes the
introductory information each student and family received.
Parents and guardians received a second, more thorough letter three weeks before
students were to take the engagement survey (see Appendix C). This parental consent
letter satisfied several of Dillman‘s tenets of effective communication, including
background information of the study, background information of the researcher, the
University of Minnesota‘s research policies, the procedures of the study, the risks and
benefits of participation, confidentiality of the study, and contact information for both the
researcher and the advisor (Dillman 2007). The final point of contact involved the
student assent letter (Appendix E). Students were provided a brief overview of the study,

104
an option to withdraw from the study at any time, and instructions on how to complete
the survey if they wished to participate.
Neither step 3 nor step 4 of Dillman‘s Tailored Design Method was fully realized
in this research project. Step 3 calls for inclusion of ―stamped return envelopes‖
(Dillman, 2007); however, all communication for this research required the participant to
transfer documents between school and their home. Dillman‘s 4th
step requires a
researcher to include ―at least one personalized communication‖ during the study
(Dillman, 2007). In terms of introduction of the survey, the researcher relied on the
geography teachers to pass out materials, collect parental consent forms, answer
questions, and proctor the survey. Each geography teacher had a personalized connection
with students in their class, a connection a researcher would not be able to replicate for
the sampling frame of nearly 800 students. The results of the survey were confidential,
but not anonymous. Students used their unique ―network folder‖ username and password
to log in to the survey. The use of the network folder information provided a level of
personalization in the survey process. Students were able to log in comfortably and
without perturbation (i.e., they did not need to utilize an unfamiliar username and
password), and the researcher was able to seamlessly merge survey response data with
demographic and achievement data.
Dillman‘s 5th
step of the Tailored Design Method requires a token financial
incentive for survey participation. The researcher consulted with the geography teachers,
building principals, his Doctoral Advisor, and parents in creating an incentive that would
fit within the confines of the budget. The financial incentive was tied to the return of

105
parental consent forms. There were six geography teachers involved in this study. Each
teacher would reward their class with the highest return percentage of parental consent
forms. The class with the highest return percentage would hold a drawing for three $25
gift certificates.
Online Web Based Survey Limitations
Renee Sbrocco detailed two limitations to online surveys outlined by Dillman
(2007) in her dissertation: participant access to computers and assumption that
participants are computer-literate (Sbrocco, 2009, p 79). Access to computers was not a
limitation in this particular study as the survey was taken within the participants‘
geography class. The Internet connection and computer availability was assured, and
technical assistance was available if any questions were raised. Each middle school
employs a tech pro that was available to assist, the Wakta Webmaster provided his cell
phone to all geography teachers in case they experienced technical difficulties, and the
geography teacher was present in the computer lab. Student participants had prior
experience with their network folder username and password. Each time students use a
computer in their middle school, they are required to enter their username and password.
Temporary usernames and passwords were provided to each geography teacher in case a
student experienced difficulty accessing the survey.
The University of Texas-Austin‘s Information Technology Systems (2009)
delineates several web-based survey limitations that may affect survey completion.
Freezes and crashes are possible whenever an online survey is administered. Indeed, the
freeze in the form of a ―white screen‖ afflicted the second pilot attempt by 7th
grade

106
students. Fortunately, this glitch was solved and there were no freezes or crashes during
8th
grade survey administration. Error messages may emerge once a respondent
completes a questionnaire (ITS, 2009). Diligent planning and preparation by the
Webmaster prevented this limitation from evolving. Finally, double entry is a threat to
online survey research. In some instances, it is possible for a participant to complete
multiple surveys. The utilization of the network username and password as well as a
timestamp allowed the researcher to quickly identify any double entry occurrences.
There were two instances of double entry in this study. The second entry of each
respondent was discarded during data analysis, eliminating this threat to validity.
The Sample and Response Rate
Coverage error had the potential of emerging as a limitation of this research.
Coverage may occur when not all members of a particular population have an equal
opportunity to participate in the study. Middle School students are not known for their
reliability in communicating with their parents or guardians. In this case, the parental
consent form was presented to students in geography class. Students were required to
take the form home, present it to their parents or guardians, bring the form back to
school, and turn it in to their geography teacher. The token financial incentive
encouraged students to return the parental consent form to their geography teacher,
whether or not they wished to participate in the survey. Though each potential
participant received identical instructions, a substantial number of 8th
grade students
failed to complete each of these steps satisfactorily. The geography teachers called home
to remind parents to return the parental consent form, students were encouraged to call

107
home and remind their parents about the parental consent form, and the researcher was
able to communicate with parents via email and phone. The combined efforts of 8th
grade participants, parents of participants, teachers, and the researcher resulted in a robust
completion rate.
Of the 786 students in the sample frame, 692 students completed the 8th
grade
engagement survey. The 88% response rate for this survey was similar to Dr. Sbrocco‘s
response rate of 94% for her 8th
grade engagement survey (Sbrocco, 2009). Non-response
bias occurs when there is a substantial number of non-responders to a survey. The dearth
of responders in a survey limits the researcher‘s ability to draw conclusions of the larger
population (Electronic Data Information Source, 2011). Non-response bias is mitigated
with an elevated response rate, especially a rate that approaches 90% inclusion.
Measurement error did not arise as a limitation in this study. Per Renee Sbrocco‘s
(2009) research protocol, a pilot version of the survey was tested with 72 7th
grade
students. Three 7th
grade-reading classes participated in the pilot survey. The second
group to take the survey experienced technical difficulties and were unable to complete
the survey. This allowed the researcher and the Webmaster to retool the survey, thereby
avoiding future problems related to the online survey program. Eight students
participated in a think-aloud (see Appendix A) with the researcher, providing feedback
and perceptions related to the pilot survey. This process allowed the researcher to refine
questions, correct grammatical and spelling errors, and modify the appearance of the
survey. Measurement error was not a factor as students were required to answer each
question before proceeding to the next screen of the survey. Each participant answered

108
each question of the survey, eliminating the need to monitor student response for missing
data for a particular question.
Though 692 students completed the survey, several students in this group did not
have achievement data on file. As a result of missing achievement data, the final sample
size was 650 students for this research. These 650 students had survey responses to each
question, achievement data, and demographic data available to the researcher.
Data Preparation
The researcher was able to merge the data sets of demographics, achievement, and
survey responses. Once the data was merged into one document, the responses were
transformed from ―strongly agree‖ or ―disagree‖ to an ordinal value of 1, 2, 3, or 4
(Sbrocco, 2009). The response ―Strongly agree‖ was given a value of 4, ―agree‖ a 3,
―disagree‖ a 2, and ―strongly disagree‖ a score of 1. In order to avoid positive bias,
several questions were written with negative presuppositions. The following statement is
one such example: ―I feel as if I don‘t have control over my grades.‖ If a student
responded with a ―strongly disagree‖ to this statement, they are actually demonstrating a
high level of engagement. The response to this statement was converted from a ―1‖ to a
―4‖ for analysis purposes. In this analysis, a score of ―4‖ represented complete
engagement, while a score of ―1‖ represented complete disengagement. The responses
for all questions with negative presuppositions were adjusted accordingly. If a student
was missing either achievement data or survey data, they were eliminated from
consideration for this research. Though 692 students completed the survey, a total 650
students had both survey data and achievement data.
109
Variable Construction
Dr. Sbrocco (2009) provided a template for variable construction in her student
engagement survey. The researcher analyzed the combined data set of demographic
information (e.g., ethnicity), achievement scores (e.g., MAP scores), and survey
responses. The researcher was able to construct variables by ―running a factor analysis
for distinct groups of questions and coding them according to appropriate research and
analysis‖ (Sbrocco, 2009, p. 82). The construction of variables increased the ease and
efficiency of further analysis of the combined data set.
A Likert Scale limited students to four possible answers (strongly agree, agree,
disagree, and strongly disagree). Strongly agree was correlated with a ―4‖, agree with a
―3,‖ disagree with a ―2‖, and strongly disagree with a ―1.‖ In this particular survey, 24
statements on the survey ―corresponded with student engagement‖ (Sbrocco, 2009).
Eight questions assessed behavioral engagement, nine statements measured cognitive
engagement, and seven correlated with emotional engagement.
The researcher conducted a component factor analysis with varimax-rotation in
order ―to determine independent variables and confirm the presence of similar types of
engagement that the survey‖ (Sbrocco, 2009, p. 83). Following the factor analysis, six
factors emerged with eigenvalues over 1.0. Behavioral engagement, cognitive
engagement, emotional engagement, teacher support, school climate, and authentic
pedagogy all had Eigenvalues over 1.0. Each of these factors was deemed viable as they
had ―more than two items with a factor loading of .5 or higher‖ (Sbrocco, 2009, p. 83).
The National Center for School Engagement (2006) describes Cronbach‘s Alpha as ―an

110
index of reliability for a set of items that indicates the extent to which items measure the
same characteristic‖ (p. 8). These factors were deemed viable for research as ―typical
acceptable Cronbach Alpha in social sciences is .70‖ (NCSE, 2006, p. 9). Table 4.4
includes the factors that emerged with the corresponding statements from the survey, the
Cronbach Alpha, and the Eigenvalue.
Data Analysis Methods
Descriptive and inferential statistics were utilized in the data analysis of this
study. Descriptive statistics typically ―describe what is or what the data shows‖ (Social
Research Methods, 2006). Alternatively, inferential statistics attempt to ―reach
conclusions that go beyond the immediate data alone‖ (Social Research Methods, 2006).
Furthermore, inferential statistics are ―used to provide information on the relationship and
predictability between variables‖ (Sbrocco, 2009).
Descriptive Statistics
Demographic data was collected from the Wakta Teaching and Learning
department. The researcher was able to collect ethnicity, English learner status, free and
reduced lunch status, and special education status. This information formed the
foundation of the data that would eventually be transferred to SPSS. The information
collected from the Wakta Teaching and Learning department was also used to compare
the demographics of the three Wakta middle schools.
Inferential Statistics
Several research questions of this study related to relationships between variables,
and inferential statistics were utilized to analyze correlations between particular variables

111
(Sbrocco, 2009). Initially, correlations were ―run on each type of behavioral, cognitive,
and emotional engagement‖ (Sbrocco, 2009, p. 88). A subsequent correlation was
executed to find the relationship between the engagement variables and achievement
data. An analysis of the relationships allowed the researcher to run step-wise regressions
―in order to examine engagement variables to see which variables are associated with
student achievement, over and above the control variable of student ethnicity‖ (Sbrocco,
2009, p. 88). Table 3.4 indicates the statistical analysis method for each research
question.

112
Table 3.2 Data Analysis by Research Question
Research Question Specific Statistical Test
1. What is student academic engagement? Factor Analysis
1a. What forms of student academic engagement
emerge?
1b. What are the relationships between these types of
student academic engagement?
1c. How does student academic engagement emerge
overall, by school and demographic indicators?
Factor Analysis
Bivariate Correlations
Descriptive Statistics
2. What is the relationship between academic
engagement and student academic achievement (and
all subquestions)?
Bivariate Correlation
3. What is the relationship between white and black
students‘ academic engagement and academic
achievement (and all subquestions)?
Bivariate Correlation
4. What is the relationship between students‘
academic engagement, the developmentally
appropriate school model and teacher support (and all
subquestions)?
5. To what degree can student academic engagement
decrease or increase the effects of ethnicity on student
academic achievement (and all subquestions)?
Bivariate Correlation
Stepwise Regression

113
Ethical Considerations
According to the University of Minnesota‘s ―Protecting Human Subjects Guide‖
(2009), the Institutional Review Board has two ethical considerations for research
involving human subjects:
1) to protect human subjects involved in research at the University from
inappropriate risk, and
2) to ensure that human subjects consent to their research participation.
Students were protected from inappropriate risk in this study. Parental consent
was a prerequisite for participant inclusion in this research. Sans parental consent, 8th
grade students were not able to participate in this study, regardless of their willingness to
complete the survey. Anonymity is a serious ethical issue that was preserved throughout
research process as only the researcher had access to identifying information (Punch,
2005). Once survey responses, demographic data, and achievement data were combined
into a single data set, identifying information was removed. Furthermore, encryption
software was utilized to provide increased security of research data.
Potential participants had multiple opportunities to consent to their inclusion in
this research. Fowler (2008) suggests that research participants should be briefed on the
purpose of the study, and how the data will be recorded. The 8th
grade students involved
in this research project had the option of withdrawing from the survey at any time.
Students indicated their consent on the parental consent form. On the day of the survey,
students were given another chance to provide consent. Student survey information was

114
included only if a student consent form was collected. Information on the student assent
form detailed ―what‖ students were to do in lieu of the survey (i.e., work on homework).
The researcher sought IRB approval in November 2010. Following consultation with
advisor Neal Nickerson and Wakta Teaching and Learning administrators, the revisions
were presented to IRB on January 31, 2010. Further revisions were requested by IRB,
and the researcher satisfied each requirement. Final IRB approval was granted on March
14, 2011.

115
Chapter Four
Survey Results
This study is a replication of Dr. Sbrocco‘s (2009) research. The purpose of the
Sbrocco study, as well as this research, was ―to assess the relationship between students‘
engagement and their academic achievement‖ (Sbrocco, 2009, p. 93). Student
engagement has been exhaustively studied by a myriad of researchers (e.g., Fredricks,
Blumenfeld, & Paris; Adelman & Taylor, etc.). This study intends to analyze the
relationship between student engagement and academic achievement (as measured by
standardized test scores). Each Wakta 8th
grader was invited to participate in this study,
and eventually 88% (692/786) of the students completed the engagement survey.
In order to focus the analysis of the impact of engagement on academic
achievement, five research questions were formulated. The research questions mirror Dr.
Sbrocco‘s (2009) study on the relationship between student engagement and academic
achievement.
Research Questions
1. What is student engagement?
a. What forms of student engagement emerge?
b. What are the relationships between these types of student engagement?
c. How does student engagement emerge by school, by demographic
indicators, and overall?
2. What is the relationship between student engagement and student academic
achievement?

116
a. What is the relationship between student engagement and performance
on the Reading and Mathematics portions of the MCA II?
b. What is the relationship between student engagement and performance
on the MAP Mathematics and Reading assessments?
3. What is the relationship between 8th
grade students‘ engagement and
academic achievement?
a. What is the relationship between student engagement and MCA II
Mathematics and Reading?
b. What is the relationship between student engagement and MAP
Mathematics and Reading?
4. What is the relationship between students‘ engagement, developmentally
appropriate schooling, and teacher support?
a. What is the relationship between student engagement and teacher
support?
b. What is the relationship between student engagement and
developmentally appropriate schooling?
c. What were the differences between 8th
grade students‘ experience of
both teacher support and developmentally appropriate schooling?
5. To what degree can student engagement decrease or increase the effects of
ethnicity on student academic achievement?
Characteristics of Participants

117
The Wakta Teaching and Learning department provided the researcher with
demographic and assessment information for each 8th
grade student. This information
included the middle school attended, gender, ethnicity, free and reduced lunch status,
special education status, English language proficiency, MCA-II mathematics and reading
scores, and MAP mathematics and reading scores.
During the spring of 2011, 692 of a possible 786 students completed the
engagement survey (88% response rate). In order to be included in the data analysis,
students needed to satisfy both of the following requirements:
1) complete the engagement survey
2) have both 7th
grade MAP and 7th
grade MCA-II scores on file
Standardized test scores from the MCA-II and MAP were utilized as achievement
data for Wakta 8th
grade students. Though test scores are comparatively similar among
the Wakta Middle Schools, MS #1‘s MCA-II reading scores were the highest in several
demographic categories. Overall, 91.8% of MS #1 students were proficient on the MCA-
II reading test, while MS #3 had 87.0% of students that were proficient, and 81.3% of
students at MS #2 were proficient. Asian students were 100% proficient at MS #1,
95.2% proficient at MS #3, and 83.3% proficient at MS #2. Black students had the
highest proficiency rate at MS #2 (53.6%), followed by MS #1 (46.2%) and MS #3
(44.8%). White students at MS #1 had the highest reading scores (94.2%), followed by
MS #3 (91.2%) and MS #2 (86.2%).
The scores varied a bit on the Mathematics MCA-III test. The scores are
depressed for each cohort of students as ―new, more rigorous standards were

118
implemented in 2011‖ (MDE, 2011). MS #3 had the highest overall proficiency rate
(73.6%), followed by MS #1 (70.6%) and MS #3 (59.8%). Asian students demonstrated
the highest proficiency (82.1%). White students were ten points behind at 72.2%
proficiency. There was a precipitous drop-off in proficiency rates for both Hispanic
students (38.1%) and black students (26.1%).
Achievement variations between black students and their Asian and white peers
are glaringly apparent. On the Reading MCA II test, only 48.6% of black 8th
grade
students were proficient, while Asian 8th
grade students (92.2%) and white 8th
grade
students (90.6%) demonstrated much higher proficiency rates. The Mathematics MCA
III test showed a higher gap between black 8th
grade students (26.1% proficiency) and
their white (72.2%) and Asian (82.1%) 8th
grade peers. Across Minnesota, white students
were 59.7% proficient on the MCA III Mathematics test, while black students were
24.5% proficient. Though black students in Wakta performed marginally better on the
mathematics test compared to the state average for black students, they still trailed every
other ethnic category of students in Wakta. The 46% gap (between black 8th
grade
students and white 8th
grade students) and 56% gap (between black 8th
grade students and
Asian 8th
grade students) represent a larger difference of achievement for groups than the
state averages. The following charts highlight the differences in achievement among the
three Wakta middle schools during the 2010-2011 academic year.

119
Table 4.1 MCA-II 2011 Reading Results
MS #2 MS #3 MS #1 District State
All
Students
Proficiency
81.3 87.0 91.8 86.5 68.1
All
Students
AYP Status
Yes Yes Yes Yes No
Asian
Students
Proficiency
83.3 95.2 100 92.2 61.6
Asian
Students
AYP Status
Yes Yes Yes Yes Yes
Hispanic
Students
Proficiency
N/A N/A N/A 71.4 45.7
Hispanic
Students
AYP Status
N/A N/A N/A Yes No
Black
Students
Proficiency
53.6 44.8 46.2 48.6 43.5
Black
Students
AYP Status
Yes Yes Yes Yes Yes (SH)
White
Students
Proficiency
86.2 91.2 94.2 90.6 74.1
White
Students
AYP Status
Yes Yes Yes Yes Yes
Scores are reported in percentages.
AYP Calculation was based on multi-year averaging (see previous page).
SH indicates that the cell met AYP Safe Harbor target (see page previous page).
N/A indicates less than 20 students in that cell took the MCA-II
Data retrieved from MN Dept. of Education, 10/15/11.
Table 4.2 MCA-III Mathematics 2011 Results

120
Score
s are reported in percentages.
AYP Calculation was based on multi-year averaging.
SH indicates that the cell met AYP Safe Harbor target.
Data Retrieved from Minnesota Department of Education website, 10/5/11.
MS #2 MS #3 MS #1 District State
All
Students
Proficiency
59.8 73.6 70.6 68.3 67.7
All
Students
AYP
Status
Yes Yes Yes Yes Yes
Asian
Students
Proficiency
72.0 85.7 90.9 82.1 53.5
Asian
Students
AYP
Status
Yes Yes Yes Yes Yes
Hispanic
Students
Proficiency
N/A N/A N/A 38.1 27.7
Hispanic
Students
AYP
Status
N/A N/A N/A Yes No
Black
Students
Proficiency
18.5 27.6 38.5 26.1 24.5
Black
Students
AYP
Status
Yes Yes Yes Yes No
White
Students
Proficiency
66.0 77.3 72.3 72.2 59.7
White
Students
AYP
Status
Yes Yes Yes Yes Yes
121
Demographic Characteristics of Participants
For varying reasons, 42 students who had completed the survey did not have a
complete testing profile of MCA II and MAP tests. Of the 692 students that took the
survey, 650 had MCA II and MAP test results on file and were included in the data
analysis. The three Wakta middle schools included a varying amount of students in the
study: 265 students (40.8%) attended MS #3, 193 students (29.7%) attended MS #1, and
192 (29.5%) attended MS #2. Female students accounted for 334 responses (51.4%),
while 316 males participated (48.6%). This study included 527 white students (81.1%),
68 Asian students (10.5%), 39 Black students (6.0%), and 16 Hispanic students (2.5%).
The 650 participants included 71 students who qualified for free and reduced lunch, 26
students who received special education services, and three students that participated in
this study were Limited English Proficiency (LEP) students. Table 4.3 includes a
complete composite of student demographic information.

122
Table 4.3 Demographic Data of 8th
Grade Students
Middle Schools
MS #3 MS #2 MS #1
Total Number 265 192 193
Frequency 40.8% 29.5% 29.7%
Gender
Male Female
Total Number 316 334
Frequency 48.6% 51.4%
Ethnicity
Asian Hispanic Black White
Total Number 68 16 39 527
Frequency 10.5% 2.5% 6% 81.1%
Free and Reduced Lunch
Yes No
Total Number 71 579
Frequency 10.9% 89.1%

123
Table 4.3 Demographic Data of 8th
Grade Students
Special Education
Yes No
Total Number 26 624
Frequency 4% 96%
Limited English Proficiency
Yes No
Total Number 3 647
Frequency .5% 99.5%

124
Prior to completing a correlation analysis, the researcher determined which
factors emerged from the survey results. A component factor analysis with varimax-
rotation was used to ascertain engagement variables (Sbrocco, 2009). Following this
analysis, behavioral engagement, cognitive engagement, and emotional engagement
emerged as significant factors (each had a factor loading over .5). Table 4.4 includes the
results.
Cognitive Engagement: This factor had a Cronbach‘s Alpha of .808. Items found
to have high loadings (over .5) included ―Most of my schoolwork is interesting,‖ ―I like
coming to my school,‖ and ―I like when I have to think really hard about an academic
problem.‖
Behavioral Engagement: This factor had a Cronbach‘s Alpha of .822. There were
several questions that demonstrated high loadings, including ―I do my homework,‖ ―I do
my school work because I want to get good grades,‖ and ―I take pride in my
assignments.‖ Students who are behaviorally engaged display positive behaviors in
school. Each question that emerged with a high loading reflected positive school
behaviors.
Emotional Engagement: This factor had a Cronbach‘s Alpha of .683. Statements
that demonstrated high loadings included ―I am able to do school as well as other
students,‖ ―I feel safe in my school,‖ and ―I feel good about myself.‖
Teacher Support: This factor had a Cronbach‘s Alpha of .760. This factor had
high loadings on items such as ―My teachers are interested in me,‖ ―My teachers believe I
can do well in school,‖ and ―My teachers praise my efforts when I work hard.‖ All of

125
these items reflected the definition of teacher support for this study. A few items that had
high loadings for teacher support were written to assess authentic pedagogy, but also
connected to teacher support. For example, ―My teachers require me to think hard about
the subjects we are learning.‖
Fairness: This factor had a Cronbach‘s Alpha of .775. Statements that had high
loadings included ―I am treated fairly by teachers,‖ ―My friends are treated fairly by
teachers,‖ and ―I am treated fairly by administrators.‖
Developmentally Appropriate School Model (DASM): This factor emerged with a
Cronbach‘s Alpha of .564. Statements that had high loadings included ―My school is a
caring community,‖ ―Teachers and administrators support student leadership,‖ and
―There is an adult in my school that I know cares about me.‖ Each item in this factor
resembles the current research of the DASM (Sbrocco, 2009).
Achievement variables were also created in order to analyze the correlation
between achievement and engagement (Sbrocco, 2009). Variable construction of MCA
achievement included the average of the MCA math and MCA reading score. Student
achievement on the ―MAP math and reading tests were also averaged to create one
combined MAP variable‖ (Sbrocco, p 87, 2009).

126
Table 4.4 Factor Analysis
Factor Survey Statement Eigen-
value
Alpha
Cognitive
Engagement
I often feel bored at school.
The topics we study in school are usually
interesting.
Most of my schoolwork is interesting.
I like coming to my school.
I often count the minutes before school
ends.
I do my schoolwork because I want to
learn as much as I can.
I like it when I have to think really hard
about an academic problem.
I learn more outside of school than inside.
7.624 .808
Behavioral
Engagement
I work hard because I plan to graduate
from college in the future.
I do my schoolwork because I want to get
good grades.
I do my schoolwork because I know it
will help me in the future.
I do my homework.
I take pride in my assignments.
If I do not understand something in class I
keep working until I find the answer.
In school, good luck is more important
than hard work for success.
1.670 .822
Emotional
Engagement
I feel I do not have much to be proud of
in school.
I am able to do school as well as most
other students.
I feel good about myself.
I feel as if I don‘t have a lot of control
over my grades.
I feel safe in my school.
1.325 .683

127
Teacher Support
Teacher Support
(cont.)
My teachers really listen to what I have to
say.
My teachers are interested in me.
My teachers know me well.
The teaching in my school is good.
My teachers believe I can do well in
school.
My teachers praise my efforts when I
work hard.
My teachers are willing to give extra help
if I need it.
What I‘m learning in my classes will help
me in the real world.
Students get along well with teachers in
my school.
Discipline rules at my school are fair.
My teachers expect me to memorize
rather than think.
5.491 .760
Fairness I am treated fairly by teachers.
I am treated fairly by administrators.
My friends are treated fairly by teachers.
My friends are treated fairly by
administrators.
5.828 .775
Developmentally
Appropriate
School Model
(DASM)
My school is a caring community
My school wants me to be a good citizen.
My school helps me be a healthy person.
My school is safe.
My school is dedicated to improving the
intelligence of all students.
Teachers and administrators support
student leadership.
There is an adult in my school that I know
cares about me.
My school involves my parents.
1.459 .564
128
Research Question One: What is student engagement?
In order to answer question one, the variables connected to engagement would
need to be analyzed. A factor analysis was utilized, and bivariate correlations were run
on each engagement variable (see pages 13-14) that surfaced in order to answer the
question of, ―What is student academic engagement?‖ (Sbrocco, 2009). Table 4.5
includes the results.
Research sub question 1a: What forms of student engagement emerge?
A component factor analysis with varimax-rotation was used to ascertain
engagement variables (Sbrocco, 2009). Following this analysis, behavioral engagement,
cognitive engagement, and emotional engagement emerged as significant factors (each
had a factor loading over .5). See Table 4.4 for results.
Research sub question 1b: What are the relationships between these types of
student academic achievement?
Analysis via SPSS revealed the correlation between the three engagement
variables of behavioral, cognitive, and emotional engagement. Table 4.5 includes the
correlation findings.
A positive and significant correlation between behavioral engagement and
cognitive engagement (a = .619) emerged after analysis. Behavioral engagement and
emotional engagement were found to be positively and significantly correlated (a = .604).
A positive and significant correlation also emerged between cognitive engagement and
emotional engagement (a = .529).

129
Table 4.5 Engagement Correlations
Cognitive
Engagement
Behavioral
Engagement
Emotional
Engagement
Cognitive
Engagement
Pearson
Correlation
1.000 .619** .529**
Sig. (2-tailed) .000 .000
N 650 650 650
Behavioral
Engagement
Pearson
Correlation
.619** 1 .604**
Sig. (2-tailed) .000 .000
N 650 650 650
Emotional
Engagement
Pearson
Correlation
.529** .604** 1
Sig. (2-tailed) .000 .000
N 650 650 650
**. Correlation is significant at the 0.01 level (2-tailed)

130
Multicollinearity did not emerge as a threat to validity as the correlation of
between behavioral engagement and cognitive engagement (a = .619), between
behavioral engagement and emotional engagement (a = .604), and between cognitive
engagement and emotional engagement (a = .529). Each of these correlations were
below the .70 multicollinearity threshold.
Research sub question 1C: How does student academic engagement emerge by
school, by demographic indicators, and overall?
Analysis of the results reveals that student engagement varied by middle school
attended. Table 4.6 displays the minimum, maximum, mean, and standard deviation for
each engagement variable (behavioral, cognitive, and emotional).

131
Table 4.6 Summary of Descriptive Statistics for Student Engagement
N Minimum Maximum Mean Std.
Deviation
Behavioral
Engagement
50 1.00 4.00 3.3048 .44309
Cognitive
Engagement
50 1.13 3.75 2.4796 .47977
Emotional
Engagement
50 1.40 4.00 3.1938 .45095
Valid N (listwise) 50

132
Research sub question 1C includes an analysis of student engagement levels by
school. MS #1 emerged with the highest mean scores in behavioral engagement,
cognitive engagement, and emotional engagement. These results can be found in table
4.7. Table 4.8 displays the significance of the differences in engagement scores among
the three middle schools.

133
Table 4.7 Summary of Descriptive Statistics by Each School (MS #1, MS #2, and MS #3)
Mean
(S.D.)
Types of
Engagement
MS #1
(N=193)
MS #2
(N=192)
MS #3
(N=265)
Behavioral
Engagement
3.36
(.43)
3.23
(.42)
3.31
(.46)
Cognitive
Engagement
2.57
(.46)
2.43
(.47)
2.45
(.49)
Emotional
Engagement
3.24
(.44)
3.17
(.46)
3.17
(.45)
Valid N = 650

134
Table 4.8 ANOVA to Determine if There is a Significant Difference Between Schools on
Engagement Scores
F
(Sig.)
Behavioral
Engagement
Cognitive
Engagement
Emotional
Engagement
Between Groups 4.184
(.016)
4.883
(.008)
1.600
(.203)

135
Research sub question 1C includes an analysis of whether or not student academic
engagement varies, depending on demographic differences (e.g., gender, ethnicity,
special education, and LEP). Table 4.9 reveals females had higher scores in behavioral
engagement, cognitive engagement, and emotional engagement.

136
Table 4.9 Descriptive Statistics Comparing Male and Female students on Student
Engagement
Mean
(S.D.)
Type of
Engagement
Male
(N=316)
Female
(N=334)
Behavioral 3.23
(.47)
3.37
(.41)
Cognitive 2.43
(.49)
2.52
(.47)
Emotional 3.17
(.45)
3.22
(.45)
Valid N = 650

137
An ANOVA analysis is included in Table 4.10. A significant difference between
male and female students did not emerge in cognitive engagement or emotional
engagement; however, a significant difference among males and females did emerge in
behavioral engagement.
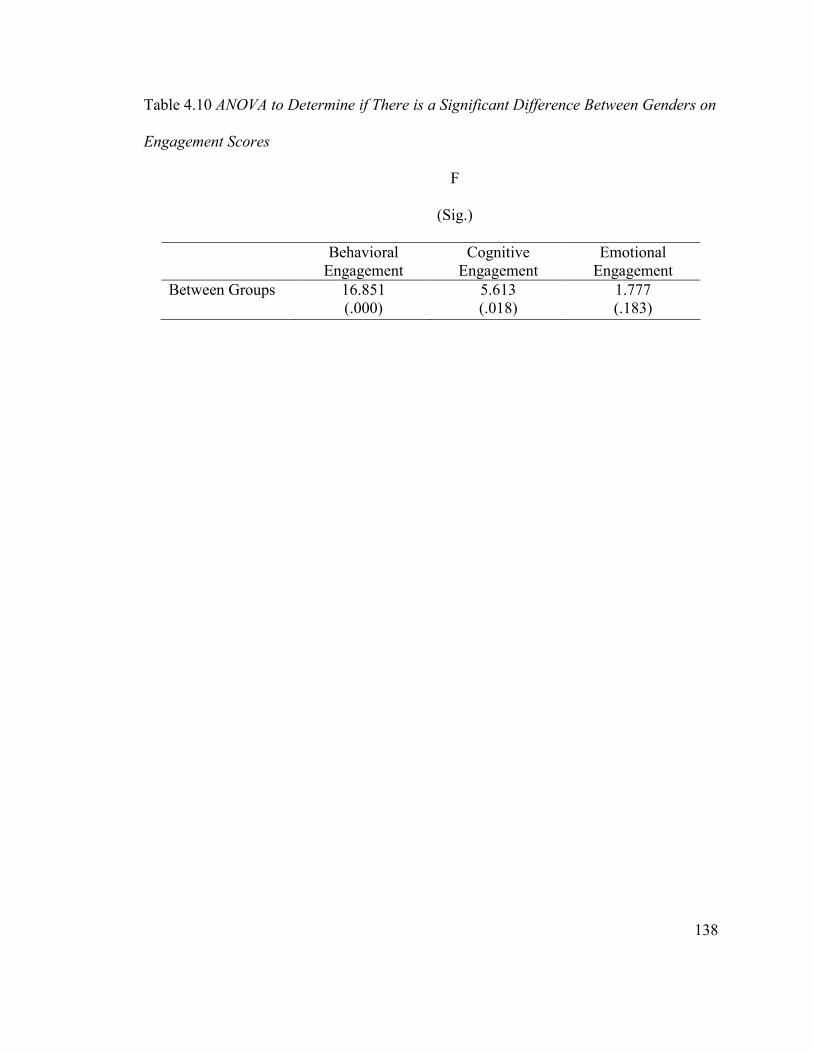
138
Table 4.10 ANOVA to Determine if There is a Significant Difference Between Genders on
Engagement Scores
F
(Sig.)
Behavioral
Engagement
Cognitive
Engagement
Emotional
Engagement
Between Groups 16.851
(.000)
5.613
(.018)
1.777
(.183)

139
Sub question 1C analyzes the variance in engagement levels amongst students of
each ethnic group. Table 4.11 includes engagement levels for Asian, Hispanic, black and
white students. Asian students had the highest behavioral, cognitive, and emotional
engagement. The ANOVA analysis included in table 4.12 reveals a significant difference
amongst the ethnic groups in emotional engagement. Behavioral engagement and
cognitive engagement are relatively similar amongst the ethnic groups of students.

140
Table 4.11 Descriptive Statistics Comparing Ethnicities on Student Engagement
Type of
Engagement
Asian
(N=68)
Hispanic
(N=16)
Black
(N=3)
White
(N=527)
Behavioral 3.51
(.32)
3.10
(.40)
3.21
(.46)
3.30
(.44)
Cognitive 2.64
(.45)
2.45
(.41)
2.55
(.57)
2.48
(.48)
Emotional 3.26
(.41)
3.10
(.40)
3.10
(.46)
3.20
(.46)
Valid = 650

141
Table 4.12 ANOVA to Determine if there is a significant difference between ethnicities on
Engagement scores.
F
(Sig.)
Behavioral
Engagement
Cognitive
Engagement
Emotional
Engagement
Between Groups 7.111
(.000)
3.314
(.020)
1.768
(.152)

142
Research sub question 1C analyzed the impact special education status, Limited
English Proficiency (LEP) students, free and reduced lunch students had on academic
engagement. Only three students were LEP, so they are not included in the analysis in
table 4.13. These factors are routinely used to compare and contrast achievement
outcomes for students in U.S. schools. In this study, student who qualified for free and
reduced lunch demonstrated lower behavioral engagement and emotional engagement
scores. Students who qualified for free and reduced lunch had the exact same cognitive
engagement score (2.48) as students who did not qualify for free and reduced lunch.
Finally, students who received SPED services had lower behavioral engagement and
emotional engagement scores while they displayed a slightly higher cognitive
engagement score.

143
Table 4.13 Descriptive Statistics Comparing Students Who Qualify and Who Do Not
Qualify for Free and Reduced Lunch and Special Education on Student Engagement
Mean
(S.D.)
Type of
Engagement
No-Free
Reduced
Lunch
(N=579)
Yes-Free
Reduced
Lunch
(N=71)
No SPED
(N=624)
SPED
(N=26)
Behavioral 3.33 3.14 3.32 3.01
Cognitive 2.48 2.48 2.48 2.50
Emotional 3.21 3.05 3.20 2.96
N = 650

144
Significant differences in emotional engagement (.005) and behavioral
engagement (.001) scores emerged between students who qualified for free and reduced
lunch and those who did not qualify for free and reduced lunch. Though students who
received special education services had a higher cognitive engagement (2.50) score than
students that did not receive special education services (2.48), the difference was
negligible and therefore not considered significant. Students who received special
education services did display significantly lower behavioral engagement scores (See
Table 4.14 for ANOVA). Finally, students who received special education services had
lower emotional engagement scores, though the difference was not considered significant
(.007).

145
Table 4.14 ANOVA to Determine If There is a Significant Difference Between Special
Education and Free and Reduced Lunch on Engagement Scores
Behavioral
Engagement
Cognitive
Engagement
Emotional
Engagement
Between Groups 11.649 .003 8.119
Free & Reduced (.001) (.959) (.005)
Between Groups 12.582 .075 7.257
Special Education (.000) (.785) (.007)

146
Research Question Two: What is the relationship between student
engagement and student achievement?
This particular research question explores the correlation between student
engagement and their academic achievement. Bivariate correlations were utilized on
each engagement variable and achievement measurements (Sbrocco, 2009).
Research sub question 2a: What is the relationship between student
engagement and performance on the reading and mathematics portions of the
Minnesota Comprehensive Assessment (MCA-II)?
Bivariate correlation was used to analyze the relationship between engagement
(behavioral, cognitive, and emotional) and the averaged MCA-II mathematics and
reading scores. Each state utilized a criterion-referenced test to measure adequate yearly
progress as part of NCLB, and Minnesota utilizes the MCA-II assessment for this
purpose. MCA-II mathematics and reading scores were combined to create a single
academic achievement variable for the purpose of this study (Sbrocco, 2009). Based on
table 4.15, the results indicate behavioral engagement and MCA-II achievement were
positively and significantly correlated at .316. Cognitive engagement and MCA-II
achievement were positively, but not significantly correlated, at .150. Emotional
engagement and MCA-II achievement were positively and significantly correlated at
.343.

147
Table 4.15 Correlations Between MCA-II Achievement and Student Engagement
Combined MCA II
(Math and Reading)
Behavioral
Engagement
Cognitive
Engagement
Emotional
Engagement
Pearson
Correlation
.316** .150* .343**
Sig. (2-tailed) .000 .000 .000
N 650 650 650
**. Correlation is significant at the 0.01 level (2-tailed).

148
Sub question 2b: What is the relationship between student academic
engagement and performance on the Measures of Academic Progress (MAP)
mathematics and reading assessments?
The Measures of Academic Progress (MAP) is an assessment utilized by
Wakta Public Schools to assess the progress of each student. The criterion-referenced
tests are given to students in grades 3-8 in Wakta Public Schools. Similar to the Sbrocco
(2009) study, the MAP results for mathematics and reading were combined into a single
variable for analysis purposes. In order to analyze the relationship between engagement
and academic achievement (as measured by MAP scores), bivariate correlations were run
on each engagement variable (behavioral, cognitive, and emotional) and the MAP scores
for each 8th
grade student (Sbrocco, 2009). Based on table 4.16, the results indicate a
positive and significant correlation exists between behavioral engagement and MAP
scores (.306), between cognitive engagement and MAP scores (.144), and between
emotional engagement and MAP scores (.347).

149
Table 4.16 Correlations Between MAP Achievement and Student Engagement
Combined MAP
(Mathematics and Reading)
Behavioral
Engagement
Cognitive
Engagement
Emotional
Engagement
Pearson
Correlation
.306** .144** .347**
Sig. (2-tailed) .000 .000 .000
N 650 650 650
**. Correlation is significant at the 0.01 level (2-tailed).

150
Research Question Three: What is the relationship between all student ethnic
groups on student engagement and academic achievement?
The third research question analyzes the relationship between student engagement
and academic achievement. To examine this relationship, ―bivariate correlations were
conducted on each engagement variable by ethnicity and achievement measurements‖
(Sbrocco, 2009). The remainder of this section includes analysis for sub questions 3a, 3b,
3c, and 3d.
Sub question 3a: What is the relationship between all student ethnic groups
student engagement and MCA-II Mathematics and Reading scores?
The same method used for research question two were utilized for all of research
question three. The MCA-II mathematics and reading scores were combined to create
one achievement variable for analysis purposes. Table 4.17 includes the correlations for
engagement and academic achievement (as measured by MCA-II mathematics and
reading) for each ethnic group. Asian students showed a positive and significant
relationship between academic achievement and behavioral engagement (.366) and
emotional engagement (.251). Moreover, Asian students showed a positive but not
significant statistical relationship between cognitive engagement and achievement (.060).
Hispanic students did show a positive and significant correlation between behavioral
engagement and achievement (.747) and as well as between emotional engagement and
achievement (.703); however there was an insignificant correlation between cognitive
engagement and achievement (.105). Black students showed positive but not significant
correlations between academic achievement and behavioral engagement (.175) and

151
cognitive engagement (-.094). Black students showed a slightly negative and not
significant correlation between cognitive engagement and academic achievement (-.094).
Finally, white students displayed positive and significant correlations between academic
achievement and behavioral engagement (.291), cognitive engagement (.195), and
emotional engagement (.350). Table 4.17 includes the correlations for student
engagement and MCA II achievement.

152
Table 4.17 Correlations for MCA-II Achievement and Student Engagement
Asian
Students
Hispanic
Students
Black
Students
White
Students
Behavioral
Engagement
Pearson
Correlation
.366** .747** .175 .291**
Sig. (2-
tailed)
.002 .001 .286 .000
N 68 16 39 527
Cognitive
Engagement
Pearson
Correlation
.060 .105 -.094 .195**
Sig. (2-
tailed)
.629 .698 .568 .000
N 68 16 39 527
Emotional
Engagement
Pearson
Correlation
.251* .703** .184 .350**
Sig. (2-
tailed)
.039 .002 .262 .000
N 68 16 39 527
**. Correlation is significant at the 0.01 level (2-tailed).
*. Correlation is significant at the 0.05 level (2-tailed).

153
Sub question 3b: What is the relationship between student engagement and
MAP Mathematics and Reading scores?
The MAP mathematics and reading scores were averaged to create a singular
achievement variable (just as in research question 2). Based on table 4.18, the results
indicate Asian students have a positive but not significant relationship between
behavioral engagement and achievement (.303) and between emotional engagement and
achievement (.260). Hispanic students displayed a positive and significant correlation
between behavioral engagement and achievement (.699) and between emotional
engagement and achievement (.683). Black students demonstrated a positive but not
significant correlation between achievement and behavioral engagement (.166) and
emotional engagement (.268). A negative correlation between cognitive engagement and
achievement (-.059) emerged for black students. Finally, white students showed a
positive and significant correlation between achievement and behavioral engagement
(.279), cognitive engagement (.173), and emotional engagement (.348).

154
Table 4.18 Correlations for Student Engagement and MAP Achievement
Asian
Students
Hispanic
Students
Black
Students
White
Students
Behavioral
Engagement
Pearson
Correlation
.303* .699** .166 .279**
Sig. (2-
tailed)
.012 .003 .314 .000
N 68 16 39 527
Cognitive
Engagement
Pearson
Correlation
.080 .162 -.059 .173**
Sig. (2-
tailed)
.517 .548 .722 .000
N 68 16 39 527
Emotional
Engagement
Pearson
Correlation
.260* .683** .268 .348**
Sig. (2-
tailed)
.032 .004 .099 .000
N 68 16 39 527
**. Correlation is significant at the 0.01 level (2-tailed).
*. Correlation is significant at the 0.05 level (2-tailed).

155
Research Question Four: What is the relationship between students’
engagement and the developmentally appropriate school model and teacher
support?
This question pertains to the relationship between student engagement, the
developmentally appropriate school model (see page 29), teacher support (see page 30),
and student engagement. Bivariate correlations were conducted on each engagement
variable (behavioral, cognitive, and emotional), the developmentally appropriate school
model, teacher support, and fairness.
Sub question 4a: What is the relationship between student engagement and
teacher support?
The relationship between engagement and teacher support was answered by
examining the correlation between the engagement variables (behavioral, cognitive, and
emotional) and the teacher support variable (Sbrocco, 2009). Based on table 4.19, the
results indicate that teacher support is positively and significantly correlated to behavioral
engagement (α =.498), cognitive engagement (α =.617), and emotional engagement (α
=.525). Table 4.19 includes the correlations between teacher support and student
engagement.

156
Table 4.19 Correlations between Teacher Support and the Three Engagement Variables.
Teacher Support
Behavioral
Engagement
Cognitive
Engagement
Emotional
Engagement
Pearson
Correlation
.498** .617** .525**
Sig. (2-tailed) .000 .000 .000
N 650 650 650
**. Correlation is significant at the 0.01 level (2-tailed)
157
Sub question 4b: What is the relationship between student engagement and
the developmentally appropriate school model (DASM)?
An analysis of the correlation among the three engagement variables
(behavioral, cognitive, emotional) and the DASM revealed a positive and significant
relationship. For instance, a positive and significant correlation exists between
behavioral engagement and DASM (α =.403). A positive and significant correlation
exists between cognitive engagement and DASM (α = .488) as well as between
emotional engagement and DASM (α = .474). Table 4.20 includes the correlations
between student engagement and DASM.

158
Table 4.20 Correlations Between the Developmentally Appropriate School Model and the
Three Engagement Variables.
Developmentally Appropriate School Model
Behavioral
Engagement
Cognitive
Engagement
Emotional
Engagement
Pearson
Correlation
.403** .488** .474**
Sig. (2-tailed) .000 .000 .000
N 650 650 650
**. Correlation is significant at the 0.01 level (2-tailed)

159
Sub question 4C: What is the relationship between student engagement and
school culture?
Research question 4C explores the relationship between student engagement and
school culture (see page 30). The three engagement variables (behavioral, cognitive, and
emotional) were correlated with school culture. A bivariate correlation was run and
strong correlations emerged between engagement and school culture. A positive and
significant correlation emerged between school culture and behavioral engagement (α =
.334), cognitive engagement (α = .336), and emotional engagement (α = .325). Table
4.21 shows the correlations between engagement and school culture.

160
Table 4.21 Correlations Between School Culture and the Three Engagement Variables.
School Culture
Behavioral
Engagement
Cognitive
Engagement
Emotional
Engagement
Pearson
Correlation
.334** .336** .325**
Sig. (2-tailed) .000 .000 .000
N 650 650 650
**. Correlation is significant at the 0.01 level (2-tailed)

161
Sub question 4D: What is the relationship between student engagement and
authentic pedagogy?
Research question 4d examines the relationship between authentic pedagogy and
student engagement. Authentic pedagogy is based on Fred Newman‘s (1994) conception
that school work should be based on high standards of intellectual quality. A bivariate
correlation was run and strong correlations emerged between authentic pedagogy and
student engagement. Based on table 4.22, the results indicate a positive and significant
correlation exist between authentic pedagogy and behavioral engagement (α = .183) and
cognitive engagement (α = .261). A positive and moderate correlation emerged between
authentic pedagogy and emotional engagement (α = .092). Table 4.22 shows the
correlations between authentic pedagogy and student engagement.

162
Table 4.22 Correlations Between Authentic Pedagogy and the Three Engagement
Variables.
Authentic Pedagogy
Behavioral
Engagement
Cognitive
Engagement
Emotional
Engagement
Pearson
Correlation
.183** .261** .092*
Sig. (2-tailed) .000 .000 .019
N 650 650 650
**. Correlation is significant at the 0.01 level (2-tailed)
163
Sub question 4E: What is the relationship between student engagement and
fairness?
Sub question 4e examines the relationship between fairness and student
engagement. In this study, fairness is the perception of each student regarding ―how‖
they were treated by adults in school, as well as how their peers were treated by the
adults. A bivariate correlation was run, and a positive and significant correlation emerged
between fairness and the three engagement variables (behavioral, cognitive, and
emotional). Based on table 4.23, the results indicate a positive and significant correlation
between fairness and behavioral engagement (α = .410), cognitive engagement (α = .490),
and emotional engagement (α = .378). Table 4.20 shows the correlations between
fairness and student engagement.

164
Table 4.23 Correlations Between Fairness and the Three Engagement Variables.
Fairness
Behavioral
Engagement
Cognitive
Engagement
Emotional
Engagement
Pearson
Correlation
.410** .490** .378**
Sig. (2-tailed) .000 .000 .000
N 650 650 650
**. Correlation is significant at the 0.01 level (2-tailed)

165
Sub question 4F: What were the differences between student experiences of
teacher support, the developmentally appropriate school model, school
culture, fairness, and authentic pedagogy?
Descriptive statistics were utilized to analyze research sub question 4f (Sbrocco,
2009). Mean scores for all ethnic groups were tabulated for teacher support,
developmentally appropriate school model, school culture, fairness, and authentic
pedagogy. Asian students emerged with the highest teacher support mean (3.01),
followed by Hispanic students (2.93), white students (2.90), and black students (2.87).
Both Asian and black students had a school culture mean score of 3.10 while white
students had a 3.09 and Hispanic students had a 3.06. Black students emerged with the
highest authentic pedagogy mean score of 2.85, followed by Asian students (2.77),
Hispanic, and white students (both 2.73). Asian students had the highest fairness mean
score of 3.06, followed by Hispanic students (3.03), white students (2.96), and black
students (2.83). Hispanic students had the highest DASM score of 3.04, with Asian
students close behind at 3.03, and white students at 3.02. Black students had the lowest
DASM score with a mean of 2.93. Table 4.24 shows the descriptive statistics of teacher
support, DASM, school culture, fairness, and authentic pedagogy.

166
Table 4.24 Summary of Descriptive Statistics for the Developmentally Appropriate
School Model, Teacher Support, Fairness, Authentic Pedagogy, and School Culture For
All Students.
Mean
(S.D.)
Asian
Students
(N=68)
Hispanic
Students
(N=16)
Black
Students
(N=39)
White
Students
(N=527)
All
Students
(N=650)
Teacher
Support
3.01
(.33)
2.93
(.40)
2.87
(.48)
2.90
(.40)
2.91
(.40)
School
Culture
3.10
(.34)
3.06
(.36)
3.10
(.43)
3.09
(.39)
3.09
(.38)
Authentic
Pedagogy
2.77
(.44)
2.73
(.39)
2.85
(.52)
2.73
(.42)
2.73
(.43)
Fairness
3.06
(.49)
3.03
(.54)
2.83
(.64)
2.96
(.53)
2.96
(.53)
DASM
3.03
(.35)
3.04
(.31)
2.93
(.43)
3.02
(.37)
3.02
(.37)

167
A one-way ANOVA was run to determine if the differences between ethnic
groups and teacher support, DASM, school culture, fairness, and authentic pedagogy
(Sbrocco, 2009). Based on Table 4.25, the results did not reveal a significant difference
between students of varying ethnicities and their perceptions regarding teacher support,
DASM, school culture, fairness, and authentic pedagogy. Table 4.25 includes the
ANOVA results.

168
Table 4.25 ANOVA to Determine if There is a Significant Difference Between Groups of
Wakta 8th
grade students and teacher support, developmentally appropriate school
model, school culture, fairness, and authentic pedagogy
F Sig.
Teacher Support
Between Groups
1.746 .156
DASM
Between Groups
.796 .497
School Culture
Between Groups
.068 .977
Fairness
Between Groups
1.663 .174
Authentic Pedagogy
Between Groups
1.082 .356
169
Research Question Five: To what degree can student engagement decrease or
increase the effects of ethnicity on student academic achievement?
Both Listwise and Stepwise linear regressions were utilized to determine which
engagement variables were associated with academic achievement. Listwise linear
regressions were run in order to replicate Renee Sbrocco‘s (2009) variable analysis.
Listwise linear regressions were run with student achievement (MAP average, MCA-II
average) serving as the independent variable, and behavioral engagement, cognitive
engagement, and emotional engagement as the dependent variables (Sbrocco, 2009).
Each ethnic group of students was included in this regression analysis. Table 4.26
includes Asian and white students, Table 4.27 includes Hispanic and white students, and
Table 4.28 includes black and white students. Table 4.29 includes a listwise linear
regression analysis of black students and white students. The MCA II average served as
the dependent variable. Ethnicity, behavioral engagement, cognitive engagement, and
emotional engagement were entered. Ultimately, emotional engagement emerged as the
most significant predictor of student achievement.
Listwise and stepwise regression produced differing outcomes in this study.
Listwise regression has a pre-determined order of variables whereas stepwise regression
will allow the most predictive variables to emerge. Ethnicity was entered as a dummy
variable (white = 0), along with the behavioral engagement, cognitive engagement, and
emotional engagement variables. Stepwise regression will ―allow a variable to enter the
equation only if certain criteria are met‖ (Sbrocco, 2009). If the criteria are not met,
variables will be removed from analysis, as was the case with cognitive engagement.

170
Similar to Renee Sbrocco‘s 2009 study, ―the probability associated with the test of
significance is less than or equal to the default in SPSS of .05, the predictor variable with
the largest correlation with achievement enters the equation first‖ (Sbrocco, 2009, p.138).
Any subsequent variable that meets the minimum threshold (PIN = .05) will be added to
the equation, while variables currently in the equation are ―examined for removal
according to the removal criterion (POUT = .10)‖ (Sbrocco, 2009, p. 138). Stepwise
regression provides the researcher with the best method of identifying the most predictive
dependent variable.
The first, second, and third listwise regressions analyzed the relationship between
academic achievement (MCA-II average) and student engagement (behavioral, cognitive,
and emotional). Listwise regression was utilized in order to compare the results with Dr.
Sbrocco‘s 2009 study. Variables were entered in the following order: ethnicity,
behavioral engagement, emotional engagement, and cognitive engagement. Ethnicity
was entered as a dummy variable (white = 0), and compared to Asian, Hispanic, and
black students. The first regression focused on the comparison between Asian and white
students, the second regression compared Hispanic and white students, while the third
regression focused on black and white students.
The first regression analysis revealed the moderating impact engagement had on
ethnicity. This regression compared the engagement levels and achievement levels of
Asian and white students. Ethnicity emerged as an insignificant (.013) predictive
variable that accounted for approximately 10% of the variance in achievement.
Behavioral engagement was added in the second step of analysis, and it mitigated the

171
effect of ethnicity on achievement by nearly half (.102 to .054). Table 4.26 displays the
results of this regression analysis.
The second regression contained mixed results. Hispanic and white students were
included in this regression analysis. In this regression, ethnicity and academic
achievement had a negative beta of -.083 and an insignificant relationship. The R square
was .007 for ethnicity, but when ethnicity was combined with behavioral engagement, the
R square rose to .099. The low number of Hispanic students (N=16) involved in this
study had an impact on the significance of the regression analysis. Table 4.27 includes
the results for this regression analysis.
The third regression included black and white students. The first step of the
regression revealed a beta value of .313, a significance of .000, and an R square of .098.
Once behavioral engagement was entered on the second step, the beta value dropped
from .313 to .301. Behavioral engagement had a significant mitigating effect on ethnicity
for black and white students in terms of academic achievement. Similar to Renee
Sbrocco‘s research, behavioral engagement ―does not eliminate the achievement gap, but
it does reduce the association between ethnicity and achievement‖ (Sbrocco, 2009, p.
139). Table 4.28 includes the results for this particular regression.
In the fourth analysis, a stepwise regression was utilized comparing Asian and
white students. Emotional engagement was the most predictive variable with a beta of
.340. Behavioral engagement emerged in the second step of the stepwise regression with
a beta of .162. Nearly 25% of the variance in achievement of Asian and white students is
predicted by their emotional and behavioral engagement scores. Ethnicity and cognitive
172
engagement were excluded from this analysis. Table 4.29 includes the results of the
regression analysis featuring Asian and white students.
The fifth regression also utilized a stepwise format. Emotional engagement
emerged as the most predictive variable with a beta of .364. This result is considered
significant (.000). Behavioral engagement emerged in the second step of the stepwise
regression with a beta value of .142. Emotional engagement (13.1%) and behavioral
engagement (14.5%) accounted for 27.6% of the variance in achievement amongst
Hispanic and white students. Both ethnicity and cognitive engagement were excluded
variables in this particular regression. See Table 4.30 for complete results of this
regression.
The sixth and final analysis was performed with a stepwise regression. Black and
white students were the focus in this regression, and emotional engagement emerged as
the most predictive variable in the stepwise regression (See Table 4.31). The first
variable‘s R square of .115 reveals that 11.5% of the variance in student achievement on
the MCA II reading test is attributed to emotional engagement. Ethnicity emerged as the
second most predictive variable with 8.7% of the variance explained, and the R square
rose to .202. Behavioral engagement was the last variable that emerged, accounting for
.8% of variance amongst student achievement scores, while the R square rose to .211.
Cognitive engagement was entered into the stepwise regression, but it did not meet the
criteria and was thus removed from the data analysis. Emotional engagement and
ethnicity have similar beta values (.323 and .296), evidence of their predictive value on
achievement of Wakta 8th
grade black and white students.

173
Table 4.26 Listwise Regression of MC- II Student Academic Achievement Based on
Engagement and Ethnicity (Asian and white students).
Predictors β t Sig. R2
1 (Constant)
Ethnicity
.102
1511.199
2.488
.000
.013
.010
2 (Constant)
Ethnicity
Behavioral Engagement
.054
.297
212.668
1.371
7.513
.000
.171
.000
.096
3 (Constant)
Ethnicity
Behavioral Engagement
Cognitive Engagement
4 (Constant)
Ethnicity
Behavioral Engagement
Cognitive Engagement
Emotional Engagement
.054
.302
-.007
.070
.186
-.078
.269
211.622
1.374
5.992
-.141
197.695
1.807
3.472
-1.550
5.511
.000
.170
.000
.888
.000
.071
.001
.122
.000
.097
.141
Model F 24.159 Sig. .000

174
Table 4.27 Listwise regression of MCA II Student Academic Achievement based on
engagement and ethnicity (Hispanic and white students) .
Predictors β t Sig. R2
1 (Constant)
Ethnicity
-.083
1521.731
-1.942
.000
.053
.007
2 (Constant)
Ethnicity
Behavioral Engagement
-.061
.304
210.487
-1.489
7.435
.000
.137
.000
.099
3 (Constant)
Ethnicity
Behavioral Engagement
Cognitive Engagement
4 (Constant)
Ethnicity
Behavioral Engagement
Cognitive Engagement
Emotional Engagement
-.061
.303
.002
-.050
.175
-.075
.296
209.124
-1.488
5.785
.044
195.443
-1.290
3.147
-1.432
5.511
.000
.137
.000
.965
.000
.198
.002
.153
.000
.099
.152
Model F 24.039 Sig. .000
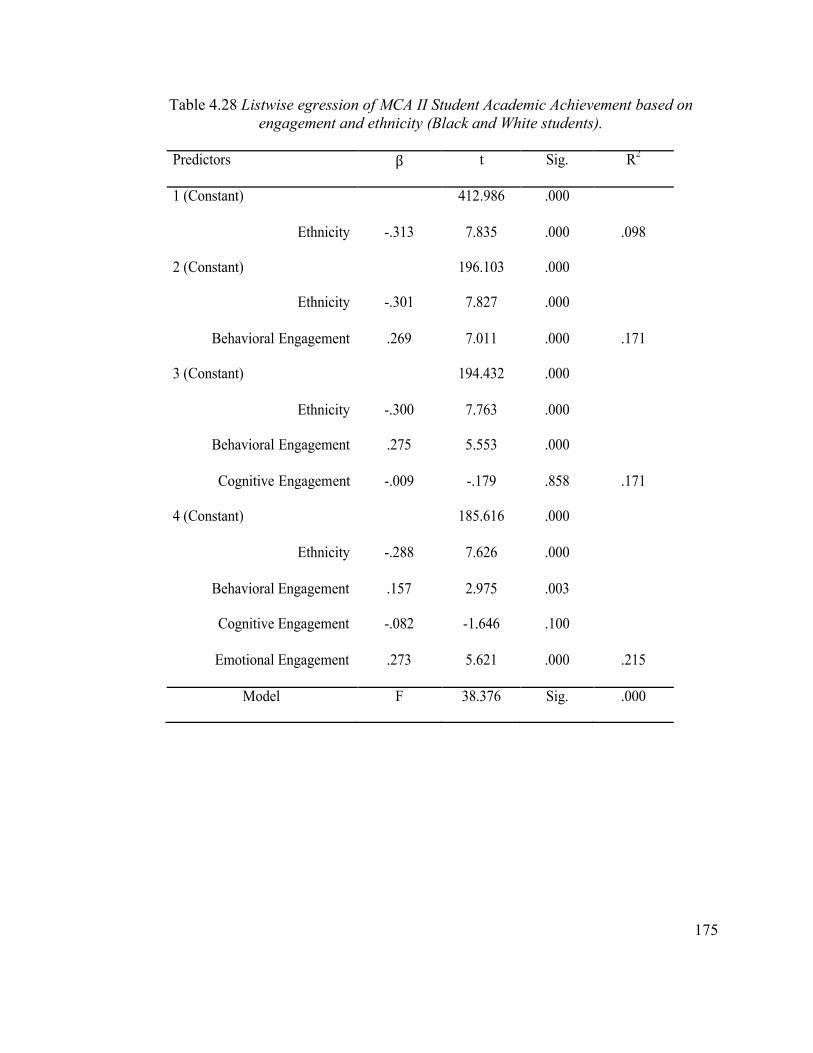
175
Table 4.28 Listwise egression of MCA II Student Academic Achievement based on
engagement and ethnicity (Black and White students).
Predictors β t Sig. R
2
1 (Constant)
Ethnicity
-.313
412.986
7.835
.000
.000
.098
2 (Constant)
Ethnicity
Behavioral Engagement
-.301
.269
196.103
7.827
7.011
.000
.000
.000
.171
3 (Constant)
Ethnicity
Behavioral Engagement
Cognitive Engagement
4 (Constant)
Ethnicity
Behavioral Engagement
Cognitive Engagement
Emotional Engagement
-.300
.275
-.009
-.288
.157
-.082
.273
194.432
7.763
5.553
-.179
185.616
7.626
2.975
-1.646
5.621
.000
.000
.000
.858
.000
.000
.003
.100
.000
.171
.215
Model F 38.376 Sig. .000

176
Table 4.29 Stepwise regression of MCA II Student Academic Achievement based on
engagement and ethnicity (Asian and white students).
Predictors β t Sig. R2
1 (Constant)
Emotional Engagement
.340
227.736
8.805
.000
.000
.116
2 (Constant)
Emotional Engagement
Behavioral Engagement
.245
.162
197.646
5.177
3.432
.000
.000
.001
.133
Model F 45.355 Sig. .000

177
Table 4.30 Stepwise regression of MCA II Student Academic Achievement based on
engagement and ethnicity (Hispanic and white students).
Predictors β t Sig. R2
1 (Constant)
Emotional Engagement
.364
223.649
9.087
.000
.000
.132
2 (Constant)
Emotional Engagement
Behavioral Engagement
.279
.142
195.908
5.616
2.860
.000
.000
.004
.145
Model F 45.922 Sig. .000

178
Table 4.31 Stepwise regression of MCA II Student Academic Achievement based on
engagement and ethnicity (black and white students).
Predictors β t Sig. R2
1 (Constant)
Emotional Engagement
.339
220.172
8.551
.000
.000
.115
2 (Constant)
Emotional Engagement
Ethnicity
.323
-.296
231.494
8.573
-7.860
.000
.000
.000
.202
3 (Constant)
Emotional Engagement
Ethnicity
Behavioral Engagement
.252
-.295
.117
202.804
5.370
-7.849
2.498
.000
.000
.000
.013
.211
Model F 50.113 Sig. .000
179
Chapter Summary
Chapter Four includes quantitative data and analysis that explores the impact of
student engagement on academic achievement. Wakta 8th
grade student demographic
information and analysis of each research question is included in this chapter. Analysis
of research question one revealed that cognitive engagement, behavioral engagement, and
emotional engagement emerged as variables. Further analysis revealed a significant and
positive correlation among the three variables. Research question two explored the
relationship between student engagement and academic achievement, and analysis of the
data demonstrated a significant relationship between these two variables. The data
related to research question three showed a significant relationship between student
engagement and academic achievement for students of each ethnicity (Asian, Hispanic,
black, and white). An analysis of the data revealed Asian and white students
demonstrated a higher positive and significant relationship between student engagement
and academic achievement than their Hispanic and black peers. These findings are
similar to Minnesota as well as national trends regarding achievement differences
amongst groups of students (although Asian students in Wakta score significantly higher
on their standardized tests than Asian students across Minnesota). Analysis of research
question four demonstrated several variables were shown to have a positive and
significant correlation with academic achievement and student engagement, including the
developmentally appropriate school model, teacher support, school culture, fairness and
authentic pedagogy. Research question five focuses on the mitigating effect of student
engagement for students of varying ethnicities. Research question five required

180
regression analysis. The data revealed the mitigating impact student engagement
(behavioral, emotional, and cognitive) has on ethnicity in terms of academic
achievement. Significantly, emotional engagement emerged as the best predictive
variable in terms of academic achievement, not ethnicity. Chapter Five includes an
interpretation of these results, implications on educational policy and practice, and final
conclusions.

181
Chapter Five
Conclusions
This research intended first to analyze the relationship between students‘
behavioral, cognitive, and emotional engagement (see pages 11-13) and academic
achievement as measured by standardized test scores. Secondly, the research explored
the question of whether ―student engagement moderates the association between ethnicity
and academic achievement‖ (Sbrocco, 2009, p. 147). This chapter includes the purpose
of this study, the research questions, the significance of this study, a summary of the data,
an analysis of the data, the limitations of the study, and finally, implications on
educational policy. The chapter concludes with recommendations for further research
related to student engagement and academic achievement.
Purpose and Significance of the Study
The purpose of this study was to analyze the relationship between student
engagement (behavioral, cognitive, and emotional) and academic achievement as
measured by MCA II and MAP scores. The Wakta School District utilizes the Minnesota
Comprehensive Assessment II and III tests to assess student achievement in mathematics,
reading, and science. Additionally, Wakta employs Northwest Evaluation Association‘s
(NWEA) Measures of Academic Progress (MAP) tests in mathematics and reading to
assess student comprehension. Each Wakta 8th
grade student was invited to participate in
this study, and eventually 88% (692/786) completed the engagement survey. The
researcher was able to gather archival and demographic data from the Teaching &
Learning department of Wakta Public Schools. The data provided by the Wakta School
182
District was combined with the survey results, allowing the researcher to commence a
quantitative analysis of the impact of student engagement on academic achievement.
Five research questions guided this research. The research questions reveal which
variables emerged, as well as the impact each variable had on academic achievement.
Finally, the researcher utilized the data in an analysis of whether or not student
engagement moderates the effect of ethnicity on academic achievement. A finding that
student engagement (behavioral, cognitive, and emotional) mitigates the impact of
ethnicity on academic achievement might assist teachers, administrators, students,
parents, and other stakeholders in their quest to narrow achievement gaps between groups
of students.
Research Questions
The study has five specific research questions. The questions and related sub
questions are as follows:
1) What is student engagement?
a) What forms of student engagement emerge?
b) What are the relationships between these types of student
engagement?
c) How does student engagement emerge by school, by demographic
indicators, and overall?
2) What is the relationship between student engagement and student academic
achievement?

183
a) What is the relationship between student engagement and
performance on the Reading and Math portions of the MCA II?
b) What is the relationship between student engagement and
performance on the MAP Mathematics and Reading assessments?
3) What is the relationship between 8th
grade students‘ engagement and academic
achievement?
a) What is the relationship between student engagement and
MCA II Mathematics and Reading?
b) What is the relationship between student engagement and MAP
Mathematics and Reading?
c) What is the relationship between students‘ engagement,
developmentally appropriate schooling, and teacher support?
4) What is the relationship between students‘ engagement, developmentally
appropriate schooling, and teacher support?
a) What is the relationship between student engagement and
teacher support?
b) What is the relationship between student engagement and
developmentally appropriate schooling?
c) What were the differences between 8th
grade students‘ experience on
both teacher support and developmentally appropriate schooling?
5) To what degree can student engagement decrease or increase the
effects of ethnicity on student achievement?

184
Summary of the Findings
Student Engagement
Following a factor analysis of the survey data, the three engagement variables that
materialized were cognitive engagement, behavioral engagement, and emotional
engagement. All three engagement variables were found to be highly correlated, and
shared a statistically significant relationship. In Renee Sbrocco‘s 2009 study, behavioral
engagement, emotional engagement, and disengagement appeared. Whereas behavioral
engagement emerged as the most highly correlated factor in Dr. Sbrocco‘s study,
cognitive engagement was the most highly correlated factor in this study (a variable that
failed to emerge in the Sbrocco study).
Student engagement varied among students in differing ethnic groups. For
instance, Asian students and white students demonstrated higher levels of engagement
than Hispanic and black students. Hispanic and black students demonstrated higher
levels of disengagement than Asian and white students. Jonathan Ogbu posits several
explanations for the variance in both achievement and student engagement by some
groups of students. The oppositional culture hypothesis (Fordham and Ogbu, 1986)
explains the plight of low-income black students in U.S. schools. Students have
developed an oppositional culture that discourages effort and engagement for fear of
acting white and possibly alienating themselves from their black peer group (Ogbu,
1986). Renee Sbrocco cited Ogbu‘s (1986) notion of ―white space‖ as a possible
explanation of disengagement by some students: ―Black students often feel that school is
the white students‘ realm, not theirs. This sense of school as ‗white space‘ as well as

185
subtle racism embedded within schools could be reasons why white students score higher
than black students on measures of student engagement‖ (Sbrocco, 2009, p. 148). In this
study, black students displayed the lowest levels of behavioral and emotional
engagement, though they did post the second highest level of cognitive engagement. Only
Asian students demonstrated a higher level of cognitive engagement in this study.
Finally, similar to Renee Sbrocco‘s 2009 study, a slight difference amongst groups of
students on academic achievement measures emerged. Asian students demonstrated the
highest level of academic achievement, followed by white students, Hispanic students,
and black students. Though there was a discernible difference in academic achievement
scores, the difference was not statistically significant.
Student Engagement and Academic Achievement
This study analyzed the relationship between student engagement and academic
achievement. Similar to Renee Sbrocco‘s 2009 study, a significant and positive
relationship emerged between student engagement and academic achievement in Wakta.
When students are more engaged (behaviorally, cognitively, and emotionally), they are
more likely to score well on standardized tests. Stuart Yeh‘s 2006 research revealed the
inverse is also true; increased academic achievement and increased student engagement
are positively and significantly correlated. This research will focus on the increase in
student engagement and its correlation with an increase in academic achievement
(Sbrocco, 2009).
Cognitive Engagement demonstrated the strongest relationship with academic
achievement (MCA II scores and MAP scores). Students with a high cognitive

186
engagement score are interested in the topics they are studying, like coming to school,
complete schoolwork because they want to learn, and enjoy the challenge of working and
thinking hard to solve a problem. According to National Academy of Science‘s Research
Council (2004), cognitive engagement ―draws on the idea of investment; it incorporates
thoughtfulness and willingness to exert the effort necessary to comprehend complex ideas
and master difficult skills‖ (Adelman & Taylor, 2010, p. 3). Students who are willing to
put forth extra effort to solve complex problems will likely learn for more altruistic
reasons than students who wish to ―play school.‖ Furthermore, students who are invested
and care deeply about their educational career will overcome the obstacles and barriers
that may inhibit the efforts of less dedicated students.
Behavioral Engagement demonstrated a positive and significant correlation with
student achievement. The behavioral engagement variable was created when students
indicated they do their homework, they take pride in their assignments, they believe their
schoolwork will help them in the future, and they work hard because they want to
graduate from college. According to Adelman & Taylor (2010), ―behavioral engagement
includes involvement in academic and social or extracurricular activities and is
considered crucial for achieving positive academic outcomes and preventing dropping
out‖ (p. 3). Students who work hard, complete their homework, and are prideful in their
work will reap the rewards for their effort, both in subjective measures (grades) and
objective measures (standardized test scores).
Emotional engagement was the third engagement variable that emerged in this
study. Students who indicated they felt safe in school, they were able to do school work,

187
and they felt good about themselves demonstrated high emotional engagement levels.
Increased emotional engagement has a positive and significant relationship with
increased academic achievement. Adelman & Taylor (2010) define emotional
engagement thusly: ―Emotional engagement encompasses positive and negative reactions
to teachers, classmates, academics, and school and is presumed to create ties to an
institution and influences willingness to do work‖ (p. 3). The emotional engagement
variable emerged as the single best predictor of achievement in this study, eclipsing all
other types of engagement as well as ethnicity in terms of portending success on
standardized tests.
Ethnicity, Student Engagement, and Academic Achievement
In this study, Asian and white students demonstrated higher engagement levels
than their Hispanic and black peers. Asian and white students also registered higher
academic achievement levels as measured by standardized test scores (e.g., MCA II and
MAP) than Hispanic and black students.
The data in this study revealed a statistically significant variance in engagement
correlated to student ethnicity. In the Sbrocco (2009) study, white students demonstrated
higher achievement scores on standardized tests as well as had higher behavioral,
cognitive, and emotional scores than their 8th
grade peers. The Sbrocco (2009) study
focused on black and white students, while this study included Asian, Hispanic, black and
white students. In Wakta, Asian students emerged with the highest academic achievement
as well as the highest behavioral engagement, cognitive engagement, and emotional
engagement ratings. White students had the second highest achievement scores and the

188
second highest behavioral engagement and emotional engagement measurement. White
students were the only cohort to demonstrate a positive and significant relationship
between academic achievement and behavioral, cognitive, and emotional engagement.
Though black students had a higher cognitive engagement score than their white
counterparts, they demonstrated the least amount of emotional engagement and
behavioral engagement of all the ethnic groups included in this study. Black students
also demonstrated the lowest academic achievement of any ethnic group.
School Model, Teacher Support, and Student Engagement
Similar to Renee Sbrocco‘s 2009 research, the Developmentally Appropriate
School Model (DASM) and teacher support were found to have both a positive and
significant relationship with behavioral engagement. Both DASM teacher support were
found to be positively and significantly correlated with cognitive engagement and
emotional engagement.
Developmentally Appropriate School Model (DASM)
Several researchers have analyzed the diminished motivation exhibited by
students as they matriculate from elementary school to middle school (Meece, Anderman
& Anderman 2006, Brooks-Gunn, Duncan & Aber 1997). Student achievement
decreases, behavioral problems increase, and disengagement emerge as a severe threat to
graduation. The students are not the only ones who struggle in the middle level. Middle
schools are rarely staffed with teachers with a middle school endorsement, relying instead
on elementary teaches with a general education or secondary teachers who have
specialized training in a particular subject (Gootman, 2007). Elissa Gootman noted that

189
over an eight-year period in New York City ―middle school teachers account for 22% of
the 41,291 teachers who have left the school system since 1999, even though they make
up only 17% of the overall teaching force‖ (Gootman, 2007). The constant turnover of
staff in middle schools is an impediment to cultivating the trust and rapport between
teachers, staff and parents that buttress student engagement and academic achievement in
effective schools.
Turning Points 2000 provided a framework for the DASM. In order for
adolescents to thrive in their educational environment, a systematic approach that focuses
on the academic and social development is necessary. Wakta has utilized the DASM
since 1997 when the junior high model was replaced with three middle schools with
students in grades 6-8. In a DASM, a team of teachers (usually a math, a social studies, a
language arts, and a science teacher) educates the same cohort of students. The DASM
includes common prep time, allowing teachers to collaborate on behavioral and curricular
interventions for their students of all abilities, motivation, and behavior levels.
In this research, as was the case in Renee Sbrocco‘s 2009 study, the DASM was
found to have a significant and positive correlation with behavioral engagement. Wakta
8th
grade students indicated their school is a caring community, the school is safe, their
school is dedicated to improving the intelligence of all students, and that they are aware
that at least one adult in their school cares about them.
Teacher Support
Teacher support was also found to be positively and significantly correlated with
behavioral, cognitive, and emotional engagement. Intuitively, students who enjoy

190
positive relationships with effective teachers will thrive academically. Fredricks, et al.
(2004) defined teacher support as academic or interpersonal support for students.
Jackson & Davis (2000) highlighted the need for teachers to create substantive
interpersonal connections with students, and schools that have successfully closed
achievement variances amongst groups of students often have high levels of teacher
support. Renee Sbrocco cited the work of Marks (2000) when she proclaimed ―a
classroom in which students report feeling supported by both teachers and peers is
associated with higher levels of engagement‖ (Sbrocco, 2009, p. 153). The results of this
survey support the research related to teacher support and its impact on achievement.
The results also mirror Renee Sbrocco‘s (2009) findings. For instance, white students
had higher levels of teacher support than their black peers. The slight difference between
black (2.87 mean) and white (2.91 mean) student responses regarding teacher support
was not deemed to be statistically significant. Asian and Hispanic students demonstrated
higher levels of teacher support than white students.
Increasing cultural competency of Wakta School District employees has been a
priority for several years. Wakta participates in the WEST Metro Education Program
(WMEP), a voluntary integration program involving ten suburban school districts and
Minneapolis. The Choice is Yours program has infused the district with hundreds of
students that live in Minneapolis and bring their unique experiences with them into
Wakta classrooms. Nearly a dozen cohorts specializing in implementation of National
Urban Alliance (NUA) strategies exist in the three Wakta middle schools. The three core

191
beliefs of NUA (NUAtc.org/about-us/) help to guide the practice of several Wakta
educators. The NUA program includes the following tenets:
1) Intelligence is modifiable
2) All students benefit from a focus on high intellectual performance;
3) Learning is influenced by the interaction of culture, language, and cognition.
High expectations for all students, regardless of ethnicity, gender, past
achievement, etc., is a major tenet of NUA‘s philosophy. Wakta is able to continue to
provide professional development as a result of the DASM (common prep time), as well
as the utilization of a cohort model of professional development in which cadres of
teachers work together over the course of the year to increase cultural competency,
become acquainted with best practices, and eventually modify and differentiate
curriculum to meet the needs of their students.
The Wakta school district, as is the case in many other school districts in
Minnesota, has experienced significant student demographic changes. The evolving
demographics of the students are not mirrored in the demographics of the administrators,
teachers, paraprofessionals, culinary staff, custodians, coaches, or nearly any other group
of adults working with students. Of Wakta 8th
grade students in 2010-2011, 24% were
non-white at both MS #2 and MS #3 and 15% were non-white at MS #1. Though
research is scarce regarding a direct correlation between the ethnicity of a teacher and the
academic achievement of minority students, there are innumerable benefits related to a
diversified teaching force. Increasing the cultural competency of educators in school

192
districts across the United States is imperative, especially considering the burgeoning
diversity of future cohorts of students in public schools.
An effective teacher who demonstrates command of their content as well as
fosters a nurturing learning environment is the most critical factor for student success.
Secretary of U.S. Department of Education Arne Duncan recently explained the
significant impact effective teaching has on student achievement:
We know that from the moment students enter a school, the most important
factor in their success is not the color of their skin or the income of their
parents-it is the teacher standing at the front of the classroom
(www.ascd.org/effective-teaching).
In short, there is a positive and significant relationship between student
engagement and academic achievement. Though there are innumerable variables beyond
the purview or control of a school (e.g., ethnicity, parental education, parental support,
SES, etc.), there are in-school factors that can have a substantial effect on student
engagement and academic achievement. The DASM and teacher support have been
found to increase student engagement in both Renee Sbrocco‘s 2009 research and this
study. In particular, behavioral engagement mitigates the effect of ethnicity on academic
achievement (Sbrocco, 2009). This point is salient and significant because schools can
create programs, train staff, and cultivate an atmosphere in which students are safe to
learn. Educators and policy makers have the opportunity to directly influence behavioral
engagement on a daily basis.
Policy Considerations and Possible Implications
Several results from this research have the potential to impact school, district,
state, and national educational policy. The remainder of this section will analyze policy

193
considerations and possible implications on both the micro and the macro level (Sbrocco,
2009).
Implications for Federal and State Policy
Education reform has emerged as a hot-button political issue in the United States.
President Obama‘s Race to the Top initiatives have transformed educational policies in
several states and created the impetus for unprecedented changes in teacher contracts as
well as teacher evaluation. Protests have erupted in Wisconsin, Ohio, Indiana, and other
states as stakeholders of all political backgrounds have made student achievement,
teacher tenure, school dropout rates, etc., political talking points. Dr. Sbrocco (2009)
emphasized four policy suggestions in her research:
1. Include a survey component to NCLB testing requirements.
2. State and federal policy must recognize student engagement as predictor for
academic achievement.
3. Convert all junior high schools to middle schools.
4. Require middle school teaching licensure for every teacher.
Since Dr. Sbrocco concluded her research in 2009, the No Child Left Behind
(NCLB) law has undergone fundamental change. Nearly half of the nation‘s schools are
currently designated as ―failing,‖ and the number of schools not making adequate yearly
progress is destined to grow in the future. President Obama‘s administration granted ten
states a waiver in 2012, releasing them from the onerous strictures the law required for
schools that did not meet adequate yearly progress (Minnesota is one of the states that has
been issued a waiver). In exchange for the waiver, states must create and maintain a

194
comprehensive assessment system for all students and teachers. States will continue to
assess students with standardized tests under NCLB. This researcher agrees with
Sbrocco‘s (2009) suggestion that a student survey that measures behavioral, cognitive,
and emotional engagement should be required of each school in each district. The results
of these surveys will provide school district leaders with robust data in which they can
frame policies and create programs to maximize student achievement. This study serves
to reinforce Dr. Sbrocco‘s 2009 findings that engagement (behavioral, cognitive, and
emotional) has been shown to have a positive and significant relationship with academic
achievement. In other words, the more students are engaged, the higher they will achieve
on standardized tests. Dr. Sbrocco raised a salient issue when she highlighted the need to
set aside funds for the student transition from elementary school to middle school. As
students matriculate to the middle level, special care and attention need to be utilized to
ensure a safe, orderly, and nurturing transition. Sbrocco‘s final recommendation of
requiring a middle school licensure for all teaching staff may ameliorate the negative
aspects of the transition. Requiring middle school licensure for all teachers working with
6th
, 7th
, and 8th
graders would allow students to receive the appropriate academic, social,
and psychological support in these crucial years. This researcher endorses each of Dr.
Sbrocco‘s federal and state policy recommendations.
This study includes several additional federal and state policy considerations. The
first federal consideration is for the United States to institute a national educational policy
that ensures equity and excellence for all students. In the United States, all schools are
not created equal and a disproportionate amount of minority students drop out of school

195
before they earn their high school diploma. The negative outcomes of student dropouts
are undeniable. Upon reflection, 74% of dropouts ―say they would stay in school if they
had a chance to do it all over again‖ (Melville, 2006, p. 7). An average high school
dropout can expect to make 27% less income per year than the average high school
graduate, a sobering statistic that underscores the need for students to earn their high
school diploma (Melville, 2006). Melville (2006) points out that high school dropouts
have diminished earning power, and as a result, 80% depend on government services for
health care. Inequities in access to opportunity (Orfield, 2009) plague the U.S.
educational system.
There are models of school systems that balance excellence and equity, however.
Finland has a renowned educational system that is based on equity for all students. If
students are not meeting expectations, expert teachers are tasked with identifying deficits
in understanding and crafting solutions for individual students. The goal is to return
students to their classroom as soon as they are secure in their skills. In a conversation
with Michael Barber, the author of a Mckinsey report entitled How the World’s Best
Performing Schools Come Out on Top, Tracy Crow summarized this key tenet to
Finland‘s equitable educational system:
Successful systems expect that each child will succeed. When a child falls
behind, people in those systems don‘t say, ‗Oh, that child‘s not clever
enough or comes from a poor background.‘ They say, ‗What‘s the barrier
to that child keeping up with everybody else, and what do we need to do
about it?‘ Finnish schools are a model of this. Any child who falls behind
is referred to special education-and it‘s not what you or I would call special
education in our countries. It‘s truly expert teachers who are paid more, and
they‘re on staff to diagnose a learning barrier or maybe a social, family, or
cultural barrier. They‘ll work to unlock the barrier using a range of experts
who have the knowledge. Their job is to get that child back into the

196
classroom with his or her peers as soon as possible (p. 2).
In Finland‘s educational system, equity goes hand in hand with excellence. Pasi
Sahlberg is the director general of the Centre for International Mobility and Cooperation
in Helsinki, Finland. Sahlberg reveals that, in Finland, ―education sector development
has been grounded on equal opportunities for all and equitable distribution of resources
rather than competition‖ (Sahlberg, p. 10). Anu Partanen recently explained Finland‘s
systemic approach in historical context in the Atlantic:
Since the 1980‘s, the main driver of Finnish education policy has been that
children should have exactly the same opportunity to learn, regardless of family
background, income, or geographic location. Education has been seen first
and foremost not as a way to produce star performers, but as an instrument to
even out social inequality (Partanen, 2011, p. 1).
Finland has emerged as the darling of international education, consistently scoring
high on the Organization for Economic Co-operation and Development‘s (OECD) yearly
Programme for International Assessment (PISA) measures (OECD.org, 2012).
According to OECD Secretary-General Angel Gurria, there is a distinct connection
between academic achievement and future economic prosperity for both the individual
and the nation:
Better educational outcomes are a strong predictor for future economic
growth. While national income and educational achievement are still
related, PISA shows that two countries with similar levels of prosperity
can produce very different results. This shows that an image of a world
divided neatly into rich and well-educated countries and poor and badly-
educated countries is now out of date (OECD.org, 2012).
Finnish envy and Finlandaphilia are terms coined by skeptics who challenge the
notion that the United States, a multicultural, polyglot nation of over 300,000,000 people,
can scale the educational policies of a small Scandinavian nation with a population

197
comparable to the state of Minnesota (5.3 million people). According to several education
leaders (Linda Darling-Hammond, Diane Ravitch, Tony Wagner, etc.), Finland‘s
educational policies could provide a template for reform in the United States. Linda
Darling-Hammond is an education professor at Stanford, and she has found multiple
reasons why the Finnish educational system can provide a model for U.S. decision
makers. She states:
―The fact that we have more race, ethnicity, and economic heterogeneity,
and we have this huge problem of poverty, should not mean we don‘t want
qualified teachers-the strategies become even more important. Thirty years
ago, Finland‘s education system was a mess. It was quite mediocre, very
inequitable. It had a lot of features our system has: very top-down testing,
extensive tracking, highly variable teachers, and they managed to reboot
the whole system (NEA.org, 2011, p. 1).
Teachers in Finland teach three classes a day while their counterparts in the U.S.
average seven. Finnish teachers use the additional time to work collaboratively on
assessments, instructional strategies, and interventions. Darling-Hammond noted the
engagement of students as she described a typical lesson:
In a Finnish classroom, it is rare to see a teacher standing at the front of a
classroom lecturing students for 50 minutes. Instead, students are likely to
determine their own weekly targets with their teachers in specific subject
areas and choose the tasks they will work on at their own pace. In a typical
classroom, students are likely to be walking around, rotating through
workshops or gathering information, asking questions of their teacher, and
working with other students in small groups. They may be completing
independent or group projects or writing articles for their own magazine. The
cultivation of independence and active learning allows students to develop
metacognitive skills that help them to frame, tackle, and solve problems;
evaluate and improve their work; and guide their learning processes in
productive ways (NEA.org, 2011, p. 4).
Darling-Hammond‘s overview captures a dynamic, differentiated classroom in
which students are directly involved in curricular and assessment development.
198
Conspicuously absent in Darling-Hammond‘s description of Finnish schools is a mention
of an emphasis standardized test preparation.
While Finnish teachers have less student contact time than American teachers,
Finnish students are engaged in play and active learning more often than their American
peers. Columbia Education Professor Samuel Abrams reveals in ―The Children Must
Play: What the US Could Learn From Finland About Education‖ that Finnish schools:
Not only do Finnish educational authorities provide students with far more recess
than their U.S. counterparts—75 minutes a day in Finnish elementary schools
versus an average of 27 minutes in the U.S.—but they also mandate lots of arts
and crafts, more learning by doing, rigorous standards for teacher certification,
higher teacher pay, and attractive working conditions. This is a far cry from the
U.S. concentration on testing in reading and math since the enactment of No
Child Left Behind in 2002, which has led school districts across the country,
according to a survey by the Center on Education Policy, to significantly narrow
their curricula. (Abrams, 2011, p. 3).
This increase in play in Finnish schools allows students to engage in
cardiovascular activities throughout the school day. The narrowing of school curricula
not only endangers the job of any teacher besides a mathematics or a reading instructor, it
robs students of opportunities to utilize and realize their multiple intelligences. Finland‘s
students have scored in the top five nations in the PISA in mathematics, reading, and
science testing over the last decade, and one reason for the increased achievement may be
the opportunities for students to engage in authentic, challenging activities that involve
multiple intelligences (e.g., linguistic, musical, kinesthetic, visual, etc.). Columbia
Professor Samuel Abrams asserts that:
The Finns have made clear that, in any country, no matter its size or composition,
there is much wisdom to minimizing testing and instead investing in broader
curricula, smaller classes, and better training, pay, and treatment of teachers. The
United States should take heed. (Abrams, 2011, p. 1).
199
Another aspect of support for students in Finland is the role of the ―special
teacher.‖ This particular staff member is responsible for identifying deficits in
understanding, prescribing solutions, and assessing student progress toward learning
goals. This proactive, intensive process is one reason Finnish students are engaged in
their education. Lynnel Hancock‘s illumining article entitled ―Why Are Finland‘s
Schools Successful?‖ was published recently in the Smithsonian Magazine. According to
Hancock, ―nearly 30% of Finland‘s students receive some sort of special help during the
first nine years of school‖ (Hancock, 2011, p. 1). If Finnish students need help, a veteran,
expert teacher is poised to work one-on-one or in small groups to make sure students are
secure with the current concepts, and are returned to the large group as soon as possible.
The lack of stigmatization of remediation in the Finnish model is one reason students are
able to matriculate year to year with their classmates at an exceedingly high level.
Darling-Hammond notes Finnish students do not begin school before the age of
seven, do not take standardized tests until they are 16, and student test results are not
publicly communicated. Student test scores are not publicized by ethnic groups nor by
individual schools. Conversely, the United States disaggregates test result data that is
subsequently communicated via all forms of media. In the U.S., test results are posted by
school, school district, state, and by demographic groups (e.g., ethnicity, gender, special
education, etc.) in every state. In New York City and Los Angeles, a ―value-added‖ score
has been publicly communicated for thousands of teachers. Despite the dearth of
standardized testing, Finnish students consistently score in the top three nations on the
PISA (math, reading, and science assessments) and there is also the least variance among

200
the highest and lowest student scores. Students in Finland score high on standardized
tests not because of incessant skill-and-drill, and teachers do not ―teach to the test.‖ The
difference between the top students and the lowest scoring students in Finland is the
smallest of any nation included in the OECD analysis. Finland also has the lowest
variance between schools in terms of student achievement on the PISA, signifying a
highly equitable educational system (OECD.org).
Most germane to this research is the relationship between student engagement and
academic achievement found in Finland‘s schools. Students in Finland routinely post
achievement scores among the top three nations in the world, and they also have some of
the highest levels of student engagement of participating nations. In 2000, Finnish
students recorded the highest levels of reading proficiency, and the third highest level of
student engagement (Valijarvi, 2004). Among Finnish students, student engagement
accounted for 22% of the variance on the reading assessment, the most significant factor
that emerged in a correlation analysis (Valijarvi, 2004). In the 2000 PISA, Finland had ―a
mean score of 546, significantly higher than that of any other country. Finland also had a
relatively small spread of scores with a standard of deviation of 89-only four OECD
countries had smaller standard deviations (OECD.org, 2002, p. 82). In terms of student
engagement, ―the country that shows the highest level of engagement in reading (far
beyond that of the others) is Finland (.46)‖ (OECD.org, 2002, p. 118). In short, a strong
correlation between academic achievement and student engagement has undergirded
Finland‘s meteoric rise in international education systems. On a micro level, Dr.
Sbrocco‘s (2009) research and this study have found that increased student engagement

201
has a positive and significant relationship with academic achievement. Finland has
proven that rigorous interventions, high expectations, and creating an environment in
which the majority of students are engaged in their education may be scaled on a national
level. Though Finland may have a population of a little over 5 million people, it is
comparable in size, or larger than, 30 states in the United States. Finland differs in
demographics from the United States. In Finland, the overwhelming majority of citizens
speak Finnish (91.5%), less than 4% of children live in poverty (Sahlberg, 2011), and
there is a small immigrant population.
The equitable education system in Finland has proven that a responsive model can
be successful for all students. Finland‘s rise has proven that ―a rising tide lifts all ships,‖
and the entire nation prospers as a result of engaged and educated citizens. This federal
policy recommendation would call for the cessation of national testing, as well end the
publication of any student assessment data. Recent cheating scandals in Atlanta and New
York City highlight the intense pressure school districts face as they tried to keep up with
NCLB requirements. Pasi Sahlberg (2007) elucidated the effects of NCLB-inspired
testing in the United States:
Perhaps the best-known practical illustration of large-scale education reform
driven by the notion of standardization and related consequential accountability is
found in the USA, where controversial federal legislation termed No Child Left
Behind (Public Law 107-110) links school and teacher performance to Adequate
yearly Progress and to financial and resource allocations to schools (Popham,
2004; Centre on Education Policy, 2006). Recent research, however, suggests that
‗the ability of standardized tests to accurately reflect school performance remains
in doubt‘ (Lemke et al., 2006, p. 246). Furthermore, Amrein and Berliner (2002)
concluded, on the basis of their analysis across 18 states in the USA, that since
clear evidence was not found for the positive impact of high-stakes testing
policies upon increased student learning and because there are numerous reports
of unintended consequences associated with these policies, such as increased

202
student drop-out rates, teacher and student cheating on exams, and teacher
defection from the profession, there is need for transforming existing high-stakes
testing policies. (Sahlberg, 2007, p. 152).
If the goal of education reform is to increase student achievement, rather than
assess students with national tests that may (or may not) be connected to their school
curriculum, a new model should be implemented nationwide. The possibility exists that
states could still gather data to monitor student achievement. However, the publication of
the results of standardized testing leads to a shaming of students and staff. Currently,
teachers have little prior knowledge of what questions will appear on nationally
standardized tests (e.g., MCA, MAP, etc.). If a school district generates the student
assessments, professional learning communities will be able to analyze the data, observe
patterns and trends, and eventually modify and adjust curriculum, instruction and
assessment in order to increase student achievement. The results of district-created
assessments would be communicated to the state, but they would not be published in a
newspaper. A teacher‘s value added rankings would not be widely disseminated as in
Los Angeles and New York City. A focus on cooperation and equality, rather than
competition and inequality, is attainable. Anu Partanen captured the essence of Finland‘s
grandiose plan as she quoted Pasi Sahlberg:
‗When President Kennedy was making his appeal for advancing American
science and technology by putting a man on the moon by the end of the
1960‘s, many said it couldn‘t be done,‖ Sahlberg said during his visit to New
York. ‗But he had had a dream. Just like Martin Luther King a few years
later had a dream. Those dreams came true. Finland‘s dream was we want to
have a good public education for every child regardless of where they go to
school or what kind of families they come from, and many even in Finland
said it couldn‘t be done.‘
Clearly, many were wrong. It is possible to create equality. And perhaps even

203
more important-as a challenge to the American way of thinking about
education reform-Finland‘s experience shows that it is possible to achieve
excellence by focusing not on competition, but on cooperation, and not on choice,
but on equity (Partenen, 2011, p. 3).
Tactical and ongoing professional development is another future policy
implication. Teachers in the U.S. average 1080 hours per year of student contact time,
well above the OECD average of 803 hours/year for primary schools, and 664 hours per
year for upper secondary teachers (NSDC, p. 1). By comparison, teachers in Finland
average 570 hours of student contact time per year, and in South Korea, only about 35%
of teacher work time is spent with students (Darling Hammond, 2009). On a weekly
basis, teachers in OECD nations have 15-20 hours per week devoted to professional
development, creating lessons, collaborating with other teachers, etc., while U.S. teachers
have 3-5 hours for the same tasks. In Finland, teachers have one afternoon a week to
collaborate with other teachers, ―and schools in the same municipality are encouraged to
work together to share materials‖ (NSDC, p. 2). This professional development time
allows teachers to strengthen their pedagogy, create, implement, and analyze
interventions, meet with parents, etc. A more supportive environment for teachers would
be a wise investment:
The United States is squandering a significant opportunity to leverage
improvements in teacher knowledge to improve school and student performance.
Other nations, our competitors, have made support for teachers and teacher
learning a top priority with significant results. In these countries, students learn
and achieve more. Teachers stay in the field longer and are more satisfied with
their work. Educators take on even more responsibility for improving what
happens in their buildings. (NSDC, p. 2).

204
Additional professional development opportunities will allow teachers to analyze
their assessments, observe fellow teachers, consult educational researchers, etc., in an
effort to maximize their student contact time.
Another policy implication at the federal and state level revolves around the
recruitment, development, and support of minority teachers. Though minority students
―make up 40.7% of the public school population, only 14.6% of teachers are black or
Latino‖ (Bireda & Chaitt, 2011, p. 1). Stunningly, in over ―40% of schools, there is not a
single teacher of color‖ (Bireda & Chaitt, 2011, p. 1). During the 2010-11 school year,
there were 32 core (math, science, language arts, and social studies) 8th
grade teachers in
Wakta; none of them were black, Hispanic, or Asian.
The diversity of Wakta students has increased dramatically over the past 15 years,
while the demographics of the teaching staff have remained static. This reality mirrors the
national trend. Though minority students will soon become the majority of U.S. students,
more than 85% of current teachers are white (Bireda & Chaitt, 2011). A significant
federal and state policy initiative would include incentives for minorities to pursue a
future in education. The federal government has the authority to create financial aid
programs for minorities that major in education (Bireda & Chaitt, 2011). At the state
level, initial teacher licensure programs must actively recruit and strive to retain minority
teacher candidates. The diversification of the teaching staff in districts across the nation
is a paramount necessity. Nancy Stevens described a few of the benefits of a diversified
teaching force in her report for the Texas Education Association:
Diversity is considered important because students need role models of like
characteristics in professional positions, and all students need exposure to

205
professionals who reflect the diversity of the state. The absence of role models
gives minority students the negative message that opportunities are unavailable to
persons from their backgrounds. Studies of African American and Hispanic
teachers have found that they do positively affect the academic achievement of
African and Hispanic students. Diversity within a school‘s teaching force may
increase knowledge and understanding of different cultural groups for all the
teachers, thereby enhancing the ability of all teachers to interact successfully in
diverse classrooms (Stevens, 2012, p. 2).
In North Carolina, the Alamance-Burlington School District included the
recruitment of minority teachers as a significant recommendation to close the
achievement gap: ―Increasing numbers of minority teachers are an invaluable tool in
providing positive role models for children. The intrinsic value of being taught by
qualified and competent teachers who are culturally and racially diverse benefits the
whole student population‖ (Alamance-Burlington, 2004, p. 4). A teaching force that
resembles the nation at large will provide positive role models for all students, as well as
promote a culture of inclusion that values the background, perspectives, and opinions of
all ethnic groups.
A final federal and state policy suggestion is the adoption of Adelman & Taylor‘s
(2010) comprehensive system of learning supports. Adelman & Taylor‘s research
describes the development of a comprehensive system of learning supports that will
―enhance a school‘s focus on promoting engagement and re-engagement of students,
staff, and families‖ (Adelman & Taylor, 2010, p. 4). There are six facets of their
comprehensive system:
1) Classroom-focused interventions to enable and re-engage students in learning
2) Crisis assistance and prevention
3) Support for transitions

206
4) Home involvement and engagement in schooling
5) Community outreach for involvement and support
6) Student and family assistance
On a macro level, the correlation between student engagement and student
achievement has emerged in an analysis of Finland‘s educational success story. Dr.
Sbrocco‘s (2009) study as well as this research revealed a significant and positive
correlation between engagement and academic achievement on a micro level. The
adoption of these six aspects of the comprehensive system will ensure a foundation is set
that places a premium on student engagement.
Implications for Districts and School Administrators
An intentional implementation of the Developmentally Appropriate School Model
(DASM) would help districts and school administrators attend to the needs of the middle
level student. In order to transition from K-8 models or junior high schools to DASM‘s,
districts must provide intensive professional development steeped in the education of
adolescent students. The seven components of a DASM are outlined in Chapter two. Of
particular note, school leaders must create ―schools that are developmentally responsive
to students aged 10 to 14‖ (Sbrocco, 2009, p. 155). A developmentally responsive school
must attend to the needs of the student inside and outside of school. The results of this
study, coupled with Dr. Sbrocco‘s findings in 2009, indicate a DASM provides students
with a learning environment that enhances their behavioral, cognitive, and emotional
engagement. In Wakta, emotional engagement and behavioral engagement were shown

207
to have a mitigating impact on the predictability of ethnicity on student achievement
scores.
Many DASM‘s in the United States are staffed with teachers who do not hold a
middle school teaching certificate. An implication for districts and school administrators
would require each teacher to hold a middle school teaching certificate (or endorsement).
This policy would narrow the DASM prospective teaching pool in many districts. In
2007, the New York Times reported ―while 46 states offer some sort of credential
specifically for middle school teachers, only 24 require it (Gootman, 2007, p. 1). An
intentional, deliberate, and systemic change must be undertaken to ensure students aged
10 to 14 are taught by qualified and prepared staff. Requiring a DASM teaching
certificate would motivate current DASM teachers to receive their certificate, and it
would also provide a road map for future DASM teachers as they prepare to work with
this unique group of students.
Another implication for districts and school administrators is the utilization of a
democratic leadership model. A DASM with a democratic leadership model will provide
students, staff, parents, community members, and all other stakeholders an opportunity to
engage in conversations to enhance the experience of everyone involved. In Minnesota,
nearly fifty cents of each general fund tax dollar goes to education. Nearly 40% of
general fund tax dollars are allocated to E-12 education, and 7.6% to higher education
(Senate Finance Committee, 2011). The imperative to include and communicate with all
stakeholders is undeniable. The steady decrease in education funding in Minnesota
necessitates levy referendums in dozens of school districts each year. If school districts

208
wish to receive vital financial support from the local population, they must include the
public voice as they consider curriculum, policies, etc.
Another policy initiative that would have implications for school districts and
administrators is the implementation of Positive Behavior Interventions and Supports
(PBIS). Dr. Sbrocco referenced the potential of PBIS in her study: ―PBIS allows for
teachers and school staff to directly teach expectations, and for students to be positively
rewarded when they exhibit the expected behaviors‖ (Sbrocco, 2009, p. 156). Wakta MS
#2 instituted PBIS prior to the 2007-08 school year. Literature provided by assistant
principal Carter Smith described PBIS thusly:
PBIS is a process for creating safer and more effective schools. MS #2
is committed to facilitating a systems approach to enhancing the capacity of
schools to education all children by developing research-based, school-wide, and
classroom discipline systems. The process focuses on improving a school‘s ability
to teach and support positive behavior for all students. At MS #2, we practice
school-wide procedures and processes intended for:
-All students, all staff, all settings.
-Non-classroom settings within the school environment.
-Individual classrooms and teachers.
-Individual student supports for students who present the most challenging
behaviors (PBIS, 2012, p. 1).
An analysis of the data indicates a steep decline in referrals for major and minor
infractions (see Appendix H). In the 2008-09 school year, there were 71.16 referrals per
100 students at MS #2. By the 2011-12 school year, the number of referrals had
plummeted to 11.70 per 100 students. In terms of major referrals, MS #2 has seen a
significant decrease from the 2009-10 school year. In 2009-10, there were 55.47 major
referrals per 100 students, while there are only 4.63 major referrals per 100 students thus

209
far in the 2011-12 school year. One explanation for the precipitous drop in behavioral
referrals may be all three grade levels (6th
, 7th
, and 8th
) have experienced PBIS each year
at MS #2. Another indication of the PBIS influence is that 6th
graders receive the highest
amount of referrals per 100 students. These students may receive the most referrals as
they are adjusting to the behavioral expectations of their new school setting. The steadily
decreasing referral numbers for 7th
and 8th
grade students reveal a student population and
school staff working in concert to minimize distracting and dangerous behaviors.
Creating a safe learning environment is paramount to cultivating behavioral,
cognitive, and emotional engagement. Specifically, ―I feel safe in school‖ was a
statement that emerged in the emotional engagement variable in this research. For the 8th
graders in Wakta, emotional engagement was found to be the best predictor of the
variance of standardized test scores, underscoring the importance of PBIS in creating a
consistent, caring, and safe atmosphere for all students. PBIS has had a profound impact
on student, teacher, and administrator communication and interaction in schools across
the nation.
PBIS contributes to a safe learning environment for all students and staff.
Additionally, PBIS may engage individual students who may ―present the most
challenging behaviors‖ (Smith, 2002, p. 1). A common language, combined with
common expectations, establishes a school environment in which desired behaviors are
identified, described, and celebrated. Dr. Sbrocco (2009) highlighted 2009 report by the
Konopka Institute of the University of Minnesota in her research which found young
students are apt to drop out of school if they feel the rules are unfair, the staff are

210
uncaring, students feel disconnected with staff, or if the rules are too rigid or
inconsistently enforced (Sbrocco, 2009). The negative personal and societal results of
dropping out of school are quantifiable. As described in chapter one, high school
dropouts can expect to live a decade less, earn 27% less income annually, and be more
likely to be incarcerated than high school graduates. PBIS provides each administrator a
―school wide process for systematic problem solving, planning, and evaluation‖ (Smith,
2012, p. 1). Administrators will be able to cultivate and eventually implement policies
that will create a school environment that is caring, and in which there are positive and
respectful interactions among students, staff, and administrators.
Districts and school administrators need information regarding student
engagement (behavioral, emotional, and cognitive) in order to create policies and
guidelines that will ensure a safe and robust learning environment. Dr. Sbrocco (2009)
recommended that each school require student engagement surveys. Schools also need to
dedicate time and resources (e.g., Director of Research and Evaluation support) to assist
teachers in their analysis of the data. In Wakta, each middle school student has a student
response device (SRD), and soon will be provided with an iPad 3. These devices could be
utilized on a daily, weekly, or semester basis to gather quantifiable student feedback
regarding their behavioral, emotional, and cognitive engagement. Analysis of this data
will reveal patterns or trends amongst various groups of students (e.g., gender, ethnicity,
grade level), and may be used to create policies and guidelines that will support the
engagement of all students.

211
Another implication for districts and school administrators is to create a
comprehensive transition protocol for students matriculating from elementary school to a
DASM, within grades of a DASM, and from a DASM to a high school. Patrick Akos has
detailed the perceptions of transitions of students, parents and teachers. In 2002, Akos at
al indicated that perceptions of transition depend on the age of the student. For students
entering middle school, ―getting lost, older students and bullies, too much homework,
school rules, making friends, and lockers have all been commonly cited‖ (Akos, 2002;
Arth, 1990; Diemert; Mitman & Packer; Odegard & Heath, 1992). Akos found that
students exiting middle school feel trepidation about some of the same concerns as when
they entered middle school (grades, friends, bullies, getting lost, etc.). However, new
concerns emerge for students about to enter high school, namely ―preparing for
college/life, parent expectations, and math class in particular‖ (Akos, 2002, p. 213). Not
all perceptions about transitions between schools were negative, however. Students
about to enter middle school look forward to:
Having their own lockers (although one third of the students worried about that),
having different teachers for different subjects, moving to different rooms for
various classes, eating in the cafeteria, participating in the sports program, and the
opportunity to make new friends (Akos, 2002, p. 213).
When students, teachers, and parents were asked of their perceptions of how to
improve the transitions, several themes emerged. Before the transition, 25% of students
recommended more discussions about middle school, 16% recommended more
discussion of the positive aspects of middle school, 13% wanted better preparation (i.e.,
importance of doing homework, emphasis on organizational skills, etc.), and 11% wished

212
they had a tour of their future school (Akos, 2002). For students that had transitioned to
high school, 64% recommended practical information and insight (e.g., ―tell them don‘t
stress, it is not too bad,‖ ―tell them the myths and truth about high school,‖ ―tell them
what it will really be like‖), 15% wanted to know exactly where their future classes
would be located, and 8% wished that high schools would have visited the middle
schools to answer student questions (Akos, 2002, p. 217). Following the transitions,
students indicated that they hoped the staff in the new building would be both welcoming
(13%) and encouraging (11%) (Akos, 2002). Students also wished they would have had
the opportunity to discuss their transition (13%) to help them process their new
surroundings (Akos, 2002).
Students recognize the significance of the transition between elementary and
DASM, and between DASM and high school. School districts would be prudent to create
a system that includes the behavioral, emotional, and cognitive engagement of each
student. This comprehensive communication system would allow staff to share
information gathered from previous years to the next group of teachers. This system
would be accessible to current staff, and contact information would be readily available
in case the current teacher wishes to speak to a former teacher of a particular student.
Akos (2002) found that students identified three categories of school transition:
academic, procedural, and social. School personnel need to be aware of the transitional
needs of incoming students before, during, and after the transition from elementary
school to middle school. School districts could set aside ―transition days‖ during fall
workshops so that teachers of elementary schools and middle schools (and middle

213
schools and high schools) would have the opportunity to discuss what has worked, and
what has not worked for particular students. Knowledge of past conflicts with students or
staff, intervention attempts, and background information would help the new teacher
prepare an optimal learning environment for their incoming students. A trove of
information is gathered on each student by their teachers on a daily basis in the
approximately 98,700 schools in the U.S. (U.S. Census Bureau, 2012). Sans a systematic
method of communicating both the qualitative and quantitative information about the
student experience, the wisdom, knowledge and non-test score data that is available (yet
rarely utilized) for each student is essentially lost each spring and summer when students
depart for summer break. Software programs exist (e.g., Skyward, TIES, etc.) that could
be utilized to communicate information from teacher to teacher. Student privacy is a
primary concern when it comes to sharing student data, and every effort must be made to
protect student information. Teachers that are aware of effective strategies that have
worked with their incoming students will be able to incorporate policies and practices to
prime students for success.
A final implication for districts and school administrators is to make every effort
to ensure an equitable education for each student in a setting that reflects the burgeoning
diversity of the United States. The Choice is Yours (TCIY) program began in 2000, and
now includes students from Minneapolis and ten suburban school districts. Chapter two
includes an overview of the TCIY program. A benefit of TCIY is the diversification of
students in suburban schools (economically, ethnically, socially, etc.). Myron Orfield,
Executive Director of the Institute on Race & Poverty, has summarized the research on

214
the academic benefits, improved opportunities for minority students, social benefits, and
community benefits of integration (Orfield, 2011). Minority students that attend racially
integrated schools and classrooms experience increased standardized test scores
(Michelson, 2006; Michelson, 2003; Borman et al, 2004; Borman & Dowling, 2006).
According to the multi-year evaluation of TCIY (Aspen Associates, 2009), 90.5% of
TCIY students that have attended Wakta schools are minorities (1.2% are American
Indian, 9.7% are Asian, 73.0% are black, 6.6% are Hispanic). Though the only
requirement for student inclusion in TCIY is eligibility to receive free and reduced lunch,
the TCIY students have increased the racial diversity in Wakta schools, as well as all of
the other participating school districts that receive TCIY students. Granovetter (1986)
―found that integrated schools enable minority students to have access to social networks
associated with opportunity‖ (Orfield, 2011, p. 1). A slew of researchers have found that
―interracial contact in desegregated settings decreases racial prejudice among students
and facilitates more positive interracial relations (Orfield, 2011, p. 1). In addition to the
social and academic benefits, the TCIY program may ameliorate the widening
achievement gap between students from high and low-income families. Greg Duncan
and Richard Murnane‘s (2011) Whither Opportunity? Rising Inequality, Schools, and
Children’s Life Chances is a sobering analysis of the academic achievement of students
from the top quartile of incomes, and those in the lowest quartile of incomes. The gap
between students in the 90th
% of income and the 10th
% of income is ―now nearly twice
as large as the black-white achievement gap‖ (Duncan & Murnane, 2011, p. 4). To put
this income inequality in historical perspective, the black-white achievement gap ―was

215
one and a half to two times as large as the income gap fifty years ago‖ (Duncan &
Murnane, 2011, p. 4).
The TCIY program has provided transportation for Minneapolis students that
wish to attend a school system in the participating school districts. Scarce research exists
regarding the experience of TCIY students, specifically the behavioral, cognitive, and
emotional engagement of TCIY students. In this study, 19 of the 24 (80%) TCIY
students in 8th
grade in Wakta schools completed the engagement survey. An analysis of
the engagement levels reveals TCIY students are comparably engaged in relation to the
rest of the 8th
grade students. Specifically, TCIY students were slightly less behaviorally
engaged (3.34 mean) than their peers (3.45). In terms of emotional engagement, TCIY
students (3.10) were very similar to the other Wakta 8th
graders (3.20). Though some
students, teachers, and parents may worry that TCIY students may experience culture
shock when they arrive in Wakta, the behavioral and emotional engagement levels
exhibited by 8th
grade TCIY students are consistent with the balance of the Wakta 8th
graders.
A powerful discovery was made when analyzing the cognitive engagement of
TCIY students (2.81) with the rest of the Wakta 8th
graders (2.53). The elevated
cognitive engagement average displayed by the TCIY students is significant as it is
nearly a 10% increase over non-TCIY students. Adelman & Taylor (2010) describe
cognitive engagement in terms of investment in learning as well as the desire to work
hard to comprehend difficult concepts. TCIY students are provided transportation that
includes one-way commutes that may last up to an hour, and they learn amongst students

216
that do not live near themselves. However, the elevated cognitive engagement levels of
TCIY students is evidence that this cohort of students that are invested in their education,
and they believe that what they are learning will help them in the future. Between 2001-
2008, Wakta has the highest return percentage of returning students that attended Wakta
schools the previous year (54%). This percentage was higher than any other school
district that welcomes students from north Minneapolis, and the increased levels of
cognitive engagement of TCIY students in Wakta middle schools provide context helpful
to educational leaders (Aspen Associates, 2009). Despite the barriers TCIY students may
experience (extended commute, meeting new peers and teachers, etc.), students that
attend suburban school districts have posted higher achievement on standardized test
scores than eligible students that have chosen not to participate in TCIY in 2004-05 and
2007-08 (Aspen Associates, 2009). In 2005-06, eligible non-participating students
outperformed their TCIY peers, and the two cohorts achieved at the same level in 2006-
07 (Aspen Associates, 2009). Further analysis indicates that the student turnover (about
50% of TCIY students in grades 3-7 were in a different school from the previous year)
may account for the varying results. The cognitive engagement of Wakta 8th
grade TCIY
students (nearly10% higher than non-TCIY Wakta 8th
grade students), as well as the
similar behavioral and emotional engagement levels of TCIY and non-TCIY students,
provide evidence that TCIY is a program that should be replicated in order to increase
economic and racial diversity in suburban school districts.
Implications for Teachers

217
A teacher has an undeniable impact on student engagement (behavioral, cognitive,
and emotional). Several researchers have found teachers to have the most impact of any
in-school variable on student achievement (Rivkin, Hanushek, and Kain, 1998; 2005). In
their 1998 study, Rivkin et al found teacher quality to be the:
Most important school-related factor influencing student achievement. They
conclude from their analysis of 400,000 students in 3,000 schools that, while
school quality is an important determinant of student achievement, the most
important predictor is teacher quality. In comparison, class size, teacher
education, and teacher experience play a small role (Rice, 2003, p. 1).
In Dr. Sbrocco‘s (2009) study, authentic pedagogy was positively and
significantly correlated with student achievement. The same correlation emerged in this
research. Dr. Sbrocco referenced the work of Fred Newmann‘s (1995) to highlight the
influence of authentic instruction on academic achievement. Behavioral engagement was
found to be positively and significantly correlated with academic achievement in this
study. However, cognitive engagement was not shown to have a mitigating impact of
ethnicity on student achievement in neither this study nor the Sbrocco (2009) study.
Researchers have found authentic pedagogy to have a profound impact on student
achievement, and teachers should strive to connect current lessons with the prior
knowledge of their students.
Another implication endorsed by the Sbrocco (2009) study is to increase teacher
support in the classroom. Richard Jones (2008) prescribed various methods for teachers
to increase teacher support in ―Strengthening Student Engagement.‖ Jones suggests, ―the
one-on-one relationship between student and teacher is the critical element that can lead
to increased student motivation and higher levels of engagement in academics and school

218
life (Jones, 2008, p. 2). Teachers that are able to balance classroom management,
engaging and authentic lessons, and supportive relationships with students cultivate a
classroom environment in which students are able to thrive. Richard Jones summarized
the significance of learning relationships:
Strong positive relationships are critical to the education process. Students are
more likely to make a personal commitment to engage in rigorous learning when
they know teachers, parents, and other students care about how well they do.
They are willing to continue making the investment when they are encouraged,
supported, and assisted. Building good relationships complements rigor and
relevance. For students to engage fully in challenging learning, they must have
increased levels of support from the people around them (Jones, 2008, p. 8).
The last sentence highlights the importance of teacher support in regards to
increasing behavioral, cognitive, and emotional engagement. Teachers that survey their
students on their learning experience will be able to identify areas of growth in terms of
supporting their students. As Jones (2008) states, if teachers are to engage all of their
students, a nurturing and safe learning environment is imperative. In Wakta, it is tradition
for National Merit Semi-Finalists to nominate an esteemed teacher from elementary and
secondary (middle or high school) that had a profound impact on their development. The
speeches focus on how welcome a teacher made a student feel when they first arrived in
their classroom, how caring the teacher was when the student experienced frustration, or
how a teacher encouraged them to share their opinions with the class. This level of
teacher support has had a tangible impact on student achievement. Professional
development that focuses on the cultivation of supportive teacher-student relationships
would help identify strengths in current practice, as well as identify areas in which a

219
teacher may enhance their pedagogy to meet the academic and social needs of all
students.
A final implication for teachers would be the opportunity to increase their
pedagogical knowledge in concert with their professional learning communities (PLC‘s).
The Wakta middle schools have utilized the PLC model the last few years. Educators
have the opportunity to analyze common assessment trend data, to create common
formative and summative assessments, to adjust their assessments, and to create and
enhance their instruction. PLC time would be dedicated to district created assessments,
creation of interdisciplinary units, and crafting individualized interventions for struggling
students as well as for students that are excelling in their classes. Similar to Finland, a set
of lean, easy to understand national standards would be presented for each subject.
PLC‘s would have the autonomy to create assessments in each school district.
Implications for Further Research
There are several opportunities for further research based on data and analysis of
this study. Similar to Renee Sbrocco‘s (2009) suggestion, this study could be replicated
in more suburban school districts. Additionally, this survey could be utilized with
students in urban and rural schools. The West Metro Education Program (WMEP) would
glean valuable information if each middle school in the Minneapolis and ten suburban
school districts surveyed their students regarding their behavioral, cognitive, and
emotional engagement. Parents in Minneapolis would be able to analyze the responses of
students that choose to attend school in Minneapolis as well as the students that
participate in the TCIY program.

220
Another implication for further research would be the inclusion of qualitative data
to create a mixed-methods study (Sbrocco, 2009). The quantitative data in this research
allowed students to indicate their level of engagement on a Likert Scale (e.g., strongly
agree, agree, disagree, and strongly disagree). This quantitative data is valuable, but it
would be enhanced if a researcher were able to inquire ―why‖ students have experienced
various engagement levels. Follow-up interviews or focus groups would allow a
researcher to probe for specificity and to ask follow-up questions that may reveal patterns
and trends that have a marked impact on student engagement. Specifically related to this
study, MS #1 students emerged with the highest levels of behavioral, cognitive, and
emotional engagement. Qualitative data gleaned from students in all three middle
schools would help to explain why MS #1 students felt more engaged than their
contemporaries at MS #2 and MS #3.
Another opportunity for further research would be to include a similar amount of
students from each ethnic group. In this study, 86% of white students participated, while
85% of Asian students, 73% of Hispanic students, and 53% of black students
participated. If a school district conducts the research in the future, they will not need to
receive IRB permission (and the requirement for parental consent0, and thus conceivably
will be able to include a higher percentage of each cohort of students. Quantitative and
qualitative data from each student would assist school leaders in their quest to create a
safe, welcoming, and effective learning environment for all students.
Emotional engagement emerged as the variable with the best predictive value in
relation to academic achievement for Wakta 8th
graders. The ―I feel safe in school‖

221
statement could be clarified in a future study. A respondent may answer this question in
terms of physical safety, while another student interprets this statement to indicate that
they feel safe to make mistakes, to try new things, etc. As emotional engagement has the
most impact on the variance of achievement in Wakta, qualitative responses would help
to identify the true rationale behind the answers of the respondents.
A closer analysis of the TCIY data is another implication for further research. In
this study, 19/24 (80%) of the TCIY students participated. The similar emotional and
behavioral engagement levels, as well as the elevated cognitive engagement levels
demonstrated by TCIY students could have regional and national implications. Follow-
up questions of the TCIY students might reveal why the students chose to attend Wakta,
what made Wakta schools an effective learning environment, what barriers did the TCIY
students feel they encountered when they began attending Wakta schools, and what
suggestions do they have to help future TCIY students adjust to their learning
environment in Wakta. Myron Orfield is a staunch proponent of integration of schools
and the resultant access to opportunity provided to all students (Orfield, 2005). If the
TCIY students are engaged and achieving at an elevated level in the Wakta school
district, future researchers might analyze the district policies, the role of teachers, parents,
and the students to identify the roots of success.
A final opportunity for further research would be for Wakta to conduct
longitudinal research regarding the behavioral, cognitive, and emotional engagement of
their students. A correlation between academic achievement and student achievement
could be analyzed each year. Furthermore, researchers could analyze individual students

222
and cohorts of students as they matriculate through Wakta schools. It would behoove
Wakta Public schools to conduct an engagement survey for 5th
, 6th
, 7th
, 8th
and 9th
grade
students. The collection of data from students in these particular grade levels would
indicate the engagement level of students as they are poised to enter middle school, as
they matriculate middle school, and immediately after they have left middle school. Both
qualitative and quantitative data could be analyzed to assess current programming and to
consider policies that may enhance the student, parent, and teacher experience in a
DASM. If engagement level were collected each year, researchers would be able to
analyze the fluctuations in engagement from year to year, as well as the impact on
academic achievement.
Critique of the Study
This study met the threshold established by IRB and University of Minnesota‘s
research standards. The researcher worked diligently to replicate the study originally
completed by Dr. Sbrocco in 2009. The limitations in survey instrument, student
participation, and data collection are identified and described in subsequent paragraphs.
Limitations of the Survey Instrument
This study represented the second time this particular survey instrument was used
with 8th
grade students as the 2009 Sbrocco study represented the first time this survey
instrument was utilized. The validity and reliability of the responses have therefore not
been established to the extent of other national and international student engagement
surveys (Sbrocco, 2009). This study collected data from 8th
graders at one point in time.
A longitudinal study that includes multiple years of engagement survey data would

223
provide the researcher with a clearer picture of the engagement level of each student, and
how their varying engagement levels impacted their academic achievement over a longer
time period (Sbrocco, 2009).
Limitations of Student Participation
Though 88% (692/786) of the Wakta 8th
graders participated in this survey, there
were variances for cohorts of students. For instance, 53% of black students participated in
this study, while over 86% white, 85% Asian, 73% Hispanic students were included in
this research. Every effort was put forth to connect with every student that did not
immediately return their permission slip, however, a significant difference in
participation rates exists between black students and their Asian, Hispanic, and white
peers. Full parental consent as mandated by IRB also may have depressed the
participation rate. Dr. Sbrocco‘s 2009 study did not require IRB, and the student
participation rate was 97%. Though the overall participation rate of this study was 88%,
the difference may be attributable to breakdowns in the communication process. In order
to acquire full parental consent, a permission slip and information describing the study
was sent home via the 8th
grade student. This permission slip was to be signed by a
parent and returned to their geography teacher. A breach in this communication system
may help to explain the roughly 10% difference in student participation between the
Sbrocco (2009) study and this research.
Limitations of the Data Collection Process
As Sbrocco (2009) indicated in her research, generalizability is a limitation with
this study as the engagement levels of 8th
graders are collected from three middle schools

224
in one Western suburban school district. The response rate and sample size were robust,
and this allowed both Dr. Sbrocco and this researcher that the ―findings can be cautiously
generalized to other middle schools‖ (Sbrocco, 2009, p. 162). A mixed-method approach
would have enhanced the quantitative data collected in this research as well (Sbrocco,
2009). The limitations of quantitative data prevent the researcher from gleaning the
reasons ―how‖ Wakta teachers and school policies have engaged students behaviorally,
cognitively, and emotionally. A qualitative component would allow the researcher to
investigate the reasons why and how the 8th
grade students perceive their levels of
engagement.
Study Summary
This study was a replication of Renee Sbrocco‘s 2009 doctoral research. The
purpose of this study was to analyze the relationship between student engagement and
academic achievement and to analyze whether or not student engagement can moderate
the impact of ethnicity on academic achievement (Sbrocco, 2009). Each Wakta 8th
grade
student from the three middle schools was invited to participate in this study. Participants
completed an online survey that measured their level of behavioral, cognitive, and
emotional engagement. This research found a positive and statistically significant
correlation between academic achievement and behavioral, cognitive, and emotional
engagement. Regression analysis revealed that for Wakta 8th
grade students, emotional
engagement was the best predictive variable in relation to academic achievement.
Furthermore, behavioral engagement and emotional engagement were found to have a
moderating impact of ethnicity on student achievement.

225
The state of Minnesota has made education a priority since its inception in 1858.
Article 8, Section 1 of the Minnesota Constitution states:
The stability of a republican form of government depending mainly upon the
intelligence of the people, it shall be the duty of the Legislature to establish
a general and uniform system of public schools. (MNHS.org, 2012, p.21)
The necessity for educating the youth of Minnesota is codified in the state constitution.
Unfortunately, an analysis of the school districts in Minnesota reveals a distinctly non-
uniform system of public schools. Students born in affluent and well-funded school
districts have ―access to opportunity‖ (Orfield, 2005) that their peers do not enjoy.
Though the MN state constitution calls on the legislature to create a ―thorough and
efficient system of Public Schools in each township in the State‖ (MNHS.org, 2012, p.
22), the funding, resources, and demographics vary widely from school district to school
district. The political machinations and geographic manipulation that has created the
school districts in this state are beyond the focus of this research. Rather, this study has
found a positive and significant correlation between student engagement (behavioral,
cognitive, and emotional) and academic achievement as measured by standardized tests.
Fostering an environment that is conducive to learning, that is safe, and that welcomes
the talents and experiences of all students is within the purview of individual teachers,
administrators, and policy makers. The stark terms of the Minnesota State Constitution
place the importance of education in sharp relief. The legislature of Minnesota has the
responsibility for funding schools, while the teachers, parents, administrators, policy
makers and community members have the responsibility of ensuring every student
receives an equitable education.

226
References
Abrams, S. (2011). The Children Must Play: What the U.S. Could Learn From
Finland About Education. The New Republic. Retrieved on February 11,
2012 at
http://www.tnr.com/article/politics/82329/education-reform-Finland-US
Adelman, H.S., & Taylor, L. (2010). School Engagement, Disengagement, Learning
Supports, & School Climate. Thousand Oaks, CA: Corwin Press.
Adequate Yearly Progress [Editorial]. (2004, August 3). Education Week, p. 1.
Alamance-Burlington School System (2004). Recommendations for closing the
Achievement gap: School Subcommittee: Recruitment of minority teachers
[website]. Retrieved 2/25/11 from
www.abss.k12.nc.us/system/committee_reports/closegap/rec4schools.htm.
Alexander, K. L., Entwisle, D. R., & Dauber, S. L. (1996). Children in motion: School
transfers and elementary school performance. The Journal of Educational
Research, 90(1), 3-12.
Ascik, T. (1984). An investigation of school desegregation and its effects on black
student achievement. American Education, Vol. 44, No. 3, pp. 68-76.
Akos, P. (2002). Middle and High School Transitions as Viewed by Students, Parents,
and Teachers. Retrieved on January 4, 2012 from
http://asca2.timberlakepublishing.com/files/7-4-212Akos.pdf
Aspen Associates. (2003). The choice is yours after two years: An evaluation.
Minneapolis: Aspen Associates.
Aspen Associates. (2009). Multi-Year Evaluation Summary of Choice is Yours Program.
Minneapolis: Aspen Associates.
Au, W (2008). Teaching in Dystopia. Rethinking Schools Online, Vol. 22, No. 3.
Retrieved on July 22, 2009 at
http://www.rethinkingschools.org/archive/22_03/dyst223.shtml
Barnett, S. (1995). ―Long-Term Effects of Early Childhood Programs on Cognitive and
School Outcomes. The Future of Children, 5 (3) 25-50.
Boger, J. & Orfield, G (2005). School Resegregation: Must the South Turn Back.
Chapel Hill: University of North Carolina, UNC Press.

227
Booker et al. v. Special School District No. 1. (1972). 351 F. Supp. 799.
Braddock II, J.H., McPartland, J.M. (1991)., "Equality of Opportunity", E.F. Borgatta,
M.L. Borgatta (eds.) Encyclopedia of Sociology, Macmillan, New York
Brandt, S. (2005, January 15). ‗Choice‘ report short on data: program lets poor
Minneapolis kids attend school in some suburbs. Minneapolis Star Tribune.
Burris, C. C. & Welner, K. G. (2005). Closing the Achievement Gap by Detracking, Phi
Delta Kappan, 86(8), pp. 594-598.
Bacon, D. (2002) Teachers Reject Testing ―Bribes.‖ Rethinking Schools Online,
Vol. 16, No. 3. Retrieved on December 4, 2009 at
http://www.rethinkingschools.org/archive/16_03/Brib163.shtml
Barnes, R. (2007). Divided Court Limits Use of Race by School Districts. The
Washington Post. Retrieved on July 28, 2009 at
http://www.washingtonpost.com/wp-dyn/content/article/2007/06/28.html
Battistich, V., Solomon, D., Watson, M., & Schaps (1997). Caring school communities.
Educational Psychologist, 32 (3), 137-151.
Bentz, V. M., & Shapiro, J. J. (1998). Mindful inquiry in social research. Thousand Oaks,
CA: Sage Publications, Inc.
Berlin, L. J., Brooks-Gunn, J., Spiker, D., & Zaslow, M. J. (1995). Examining
observational measures of emotional support and cognitive stimulation in Black
and White mothers of preschoolers. Journal of Family Issues, 16 (5), 664-686.
Bireda, S., Chait, R. (2011). Increasing Teacher Diversity: Strategies to Improve the
Teacher Workforce. Retrieved on January 5, 2012 from
www.americanprogress.org/issues/2011/11/increasing_teacher_diversity.html
Birenbaum, M & Kraemer, R. (1995). Gender and Ethnic-Group Differences in Causal
Attributions for Success and Failure in Mathematics and Language Examinations
Journal of Cross-Cultural Psychology, Vol. 26 (4) 342-359.
Blank, W. "Authentic Instruction." In Promising Practices for Connecting High School to
the Real World, edited by W. E. Blank & S. Harwell, 15–21. Tampa, FL:
University of South Florida, 1997. (ERIC Document Reproduction service No.
ED 407 586).
Bolgatz, J. (2005). Talking Race in the Classroom. New York: Teachers College Press.

228
Boocock, S.S. (1972). An introduction to the sociology of learning. Boston, MA:
Houghton Mifflin Co.
Boyd,W. L. (2003). Public education‘s crisis of performance and legitimacy: Introduction
And overview of the yearbook. In Boyd, W.L., & Miretzky, D. (Eds.), American
educational governance on trial: Change and challenges (pp. 1-32). Chicago:
National Society for the Study of Education.
Boyd, C. & Hawkins, B. (2008). A better way to integrate schools: by race and class.
MinnPost.com, Retrieved on November 24, 2009 at
http://www.minnpost.com/stories/2008/11/21/4760/a_better_way_to_integrate_sc
hools_by_race_and_class
Braddock, J. H, II & Slavin, R. E. (1993). Why ability grouping must end: Achieving
excellence and equity in American education. Journal of Intergroup Relations, 20
(2), 51-64.
Bradley, R. H., Whiteside, L. Mundfrom, P. H., Casey, P. H., Kelleher, K. J., Pope, S. K.
(1994). Early indications of resilience and their relation to experiences in the
home environment of low birth weight, premature children living in poverty.
Child Development, 65 (2), 346-360.
Bransford, J., Brown, A., Cocking, R. (1999). How People Learn: Brain, Mind,
Experience, and School. Washington DC, National Academy Press
Brooks-Gunn, J., Dungan, G, & Aber, J.L (EDs.) (1997). Neighborhood Poverty: Context
and consequences for children. New York: Russell Sage.
Brown v. Board of Education, 347 U.S. 483 (1954)
Carnegie Council on Adolescent Development (1989). Turning Points: Preparing
American Youth for the 21st Century: The Report of the Task Force on Education
of Young Adolescents. Washington, DC: Carnegie Council.
Central High 1957, Retrieved October 10, 2009, from http://www.centralhigh57.org/
Civil Rights Act of 1964, Retrieved October 7, 2009, from
http://usinfo.state.gov/usa/infousa/laws/majorlaw/civilr19.htm
Clark, D. (2000). ―A Writer‘s Guide to Research Development Proposals.‖ Retrieved on
July 16, 2010 at http://education.astate.edu/dcline/guide/Limitations.html.
Connell, P. P. (1990). Context, self, and action: A motivational analysis of self-system

229
processes across the life span. In D. Cicchetti (Ed.), The self in transition: Infancy
to childhood (pp. 61-97). Chicago: University of Chicago Press.
Connell, J. P., Spencer, M. B., & Aber, J. L. (1994). Educational risk and resilience in
African-American youth: Context, self, action, and outcomes in school. Child
Development, 65, 493-506.
Connell, J. P., & Wellborn, J. G. (1991). Competence, autonomy, and relatedness: A
motivational analysis of self-system processes. In M. Gunner & L. A. Sroufe
(Eds.), Minnesota Symposium on Child Psychology (Vol. 23). Chicago:
University of Chicago Press.
Connell, J. P., Halpern-Felsher, B. l., Clifford, E., Crichlow, W., & Usinger, P. (1995).
Hanging in there: Behavioral, psychological, and contextual factors affecting
whether African-American adolescents stay in school. Journal of Adolescent
Research, 10, 41-63.
Cook, P. J., & Ludwig. (1998). The burden of ―acting White‖: Do Black adolescents
disparage academic achievement?. In Jencks, C. & Phillips, M. (Ed.), The Black-
White Test Score Gap (pp. 375-400). Washington, D.C., Brookings Institution
Press.
Creswell, J. W. (2003). Research design: Qualitative, quantitative and mixed methods
approaches (2nd Edition). Thousand Oaks, California, USA: Sage.
Crow, T. (2009). What Works, Works Everywhere. Retrieved on July 14, 2011 from
www.learningforward.org/news/policypoints/crow301.pdf
Darling-Hammond, L. (2010). What we can learn from Finland‘s successful school
reform. Retrieved on December 16, 2011 from
http://www.nea.org/home/40991.htm
Dearing, E., McCartney, K., & Taylor, B. (in press). Does higher-quality early childcare
promote low-income children‘s math and reading achievement in middle
childhood. Child Development.
Deci, E. L., & Ryan, R. M. (1987). The support of autonomy and the control of behavior.
Journal of Personality and Social Psychology, 53. 1024-1037.
De la Torre, M & Gwynne, J. (2009). When schools close: effects on displaced
students in Chicago public schools. Chicago, IL: Consortium on Chicago
School Research, University of Chicago.
Demo, David H., and Keith D. Parker. (1987). Academic achievement and self esteem

230
among black and white college students. Journal of Social Psychology,
127, 345-355.
Dillon, S. (2009).‗No Child‘ Law Is Not Closing a Racial Gap. The New York Times
April 28. Retrieved on October 21, 2009 from
http://www.nytimes.com/2009/04/29/education/29scores.html
Douglass, Frederick (1882). ―Life and Times of Frederick Douglass.‖ Retrieved on
October 22, 2009 at
http://books.google.com/books?id=X8ILAAAAIAAJ&printsec=frontcover&dq=li
fe+and+times+of+frederick+douglas&cd=2#v=onepage&q=&f=false
Draper, N & Johns, E. (2009). Big school districts lose big as students leave. The Star
Tribune. Retrieved on December 4, 2009 at
http://www.startribune.com/local/78190337.html?elr=KArksUUUoDEy3LGD
Duncan, G., Murnane, R. (2011). Whither Opportunity? Rising Inequality, Schools, and
Children’s Life Chances. New York: Russell Sage Foundation.
Eccles, J. S., Midgley, C., Wigfield, A., Buchanan, C. M., Reuman, D., Flanagan, C., et
al. (1993). Development during adolescence: The impact of stage-environment fit
on young adolescents‘ experience in school and in families. American
Psychologist, 48, 90-101.
Educational Longitudinal Study (2002), Retrieved on February 21, 2009 from
http://nces.ed.gov/surveys/ELS2002/
Ehrenberg, R. G., Goldhaber, D. D., & Brewer, D. J., (1995). Do teachers‘ race, gender,
and ethnicity matter? Evidence from the National Education Longitudinal Study
1988. Industrial and Labor Relations Review (48), 547-561.
Electronic Data Information Source (2011), Retrieved on July 22, 2011 from
http://edis.ifas.ufl.edu/pd008
Entwisle, D., Alexander K., and Olson, L. (1997). Children, schools, and inequality.
Boulder, CO: Westview Press. EPE Research Center. Retrieved September 15,
2009 from: http://www.edweek.org/rc/issues/achievement-gap/
Epstein, J. L. (1992). School and family partnerships, Report no. 6. Center on Families
Communities, Schools and Children’s Learning. John Hopkins Univ., Baltimore,
MD
Farkas, G., Grobe, R. P., Sheehan, D., & Shuan, Y. (1990). Cultural resources and school
success: Gender, ethnicity, and poverty groups within an urban school district.
American Sociological Review, 55 (1), 127-142.

231
Feistritzer, E. & Haar, C. (2005) Profile of Teachers in the U.S. 2005. National Center
for Education Information. Retrieved on August 15, 2009 at
http://www.ncei.com/POT05PRESSREL3.htm
Ferguson, R. F. (2003). Teachers‘ perceptions and expectations and the Black-White test
score gap. Urban Education, 38 (4), 460-507.
Ferguson, R. F. (1998). Teachers‘ perception and expectations and the Black-White test
score gap. In Jencks, C. & Phillips, M. (Ed.), The Black-White Test Score Gap
(pp. 273-317). Washington, D.C., Brookings Institution Press.
Fields-Smith, C. (2005). African American parents before and after Brown. Journal of
Curriculum & Supervision. 20 (2), 129-135.
Finn, J. D. (1989). Withdrawing from school. Review of Education Research, 59, 117-
142.
Finn, J. D. (1993). School Engagement and Students at Risk. Washington, DC: National
Center for Educational Statistics, U.S. Department of Education.
Finn, J. D., Pannozzo, G.M., & Voelkl, K. E. (1995). Disruptive, inattentive, and
withdrawn behavior and achievement among fourth graders. Elementary School
Journal, 95, 421-454.
Finn, J. D., & Voelkl, K. E. (1993). School characteristics related to school engagement.
Journal of Negro Education, 62, 249-268.
Finn, J. D., & Rock, D. A. (1997). Academic success among students at risk for school
failure. Journal of Applied Psychology, 82, 221-234.
Fordham, S. & Ogbu, J. (1986). Black students‘ school success: Coping with the burden
of acting White. Urban Review, 18 (3), 176-206.
Fowler, F. (2008). Survey research methods. London: Sage Publishers.
Fredricks, J.A., Blumenfeld, P.C., & Paris, A.H. (2004). School Engagement: Potential of
the Concept, State of the Evidence. Review of Educational Research, 74, 59-109.
Freivogel, W. (2002). St. Louis: Desegregation and School Choice in the Land of
Dred Scott. Equality & Education, Retrieved on November 3, 2009 at
http://www.equaleducation.org/publications.asp?pubid=256
Frenze, C. (1996). The Reagan Tax Cuts: Lessons for Reform. Joint Economic

232
Committee Report, Retrieved on August 15th
, 2009 from
http://www.house.gov/jec/fiscal/tx-grwth/reagtxct/reagtxct.htm
Friedman, L. M., American Law in the Twentieth Century (New Haven: Yale University
Press, 2002), 296.
Furrer, C. & Skinner, C. (2003). Sense of relatedness as a factor in children‘s academic
engagement and performance. Journal of Educational Psychology, 95, 148-162.
Fusarelli, L. (2004). The Potential Impact of the No Child Left Behind Act on Equity and
Diversity in American Education. Educational Policy, 18; 71.
Fusarelli, L. (2007). Restricted choice, limited options: Implementing choice and
supplemental educational services in no child left behind. Educational Policy,
21 (1), 132-154.
Garces, E., Thomas, D., & Currie, J. (2000). Longer-term effects of Head Start. Working
Paper 8054. Cambridge, MA
Garibaldi, (1997). Four decades of progress…and decline: An assessment of African
American educational attainment. The Journal of Negro Education, 66 (2), 105-
120.
Gavin, K. M. & Greenfield, D. B. (1998). A comparison of levels of involvement for
parents with at-risk African-American kindergarten children in classrooms with
high versus low teacher encouragement. Journal of Black Psychology, 24 (4),
403-417.
Gay, G. (1989). Ethnic minorities and educational equality. In J. A. Banks and C. A.
McGee Banks (eds.). Multicultural education: Issues and perspectives (pp.167-
188). Boston, MA: Allyn & Bacon.
Gootman, E. (2007, March 17). For Teachers, Middle School Is Test of
Wills. New York Times.
Granovetter, M. (1986). ―The Micro Structure of School Desegregation,‖ in Prager, J,
Longshore, D. & Seemen, M (eds) School Desegregation Research: New
Directions in Situational Analysis. New York, Plenium Press, 81-110.
Green v. County School Board, 391 U.S. 430, 88 S. Ct. 1689, 20 L. Ed. 2d 716 (1968).
Greenwald, R., Hedges, L. V., & Laine, R. D. (1996). The effects of school resources on
student achievement. Review of Educational Research. 66, 361-396.

233
Griffin v. School Board of Prince Edward County, No. 592 Decided May 25, 1964
377 U.S. 218
Grissmer, D., Flanagan, A., & Williamson, S. (1998). Why did the Black-White score
gap narrow in the 1970s and 1980s? In Jencks & Phillips (Eds.), The Black-
Whitetest score gap (pp. 182-226). Washington, DC: Brookings Institution Press.
Groenewald, T. (2004) A Phenomenological Research Design Illustrated. International
Journal of Qualitative Research. 3 (1). 1-20.
Hall, K. L., ed. The Oxford Companion to the Supreme Court of the United States. New
York: Oxford University Press, 1992.
Hallinan, M. & Williams, R. (1987) ―The Stability of Students‘ Interracial Friendships,‖
American Sociological Review, Vol. 52, 653-664.
Hammond & Young (2002). Defining ―highly qualified teachers‖: What does
―scientifically-based research‖ actually tell us? Educational Researcher. 31 (9).
13-25.
Hancock, L. (2011). Why are Finland‘s Schools Successful? Smithsonian Magazine.
Retrieved on January 16, 2012 at http:/www.smithsonianmag.com/people
places/Why-Are-Finlands-SchoolsSuccessful.html?c=y&page=1
Hanushek, E. (1992). The trade-off between child quantity and quality. Journal of
Political Economy, 100, 84-117
Hart, B. & Risley, T. (1995) Meaningful Differences in the Everyday Experience of
Young American Children. Baltimore: Paul H Brooks.
Hartman, C. (2002), ―High Classroom Turnover: How Children Get Left Behind,‖ in
Dianne M. Piche, W.L.Taylor, and R.A. Reed (Eds.), Rights at Risk: Equality in
an Age of Terrorism, pp.227-244
Hawkins, M. (1997) Social Darwinism in European and American Thought, 1860–1945
(Cambridge: Cambridge University Press).
Haycock, K. 2001. Closing the achievement gap. Educational Leadership, 58, 6, 6-11.
Wilson Web.
Haycock, K., Jerald, C., and Huang, S. (2001). Closing the gap: Done in a decade.
Thinking K-16, Education Trust, Spring 2001.
234
Hauser RN, Simmons SJ, Pager DI. Center for Demography and Ecology, University of
Wisconsin-Madison, Center for Demography and Ecology; 2000. ―High School
Dropout, Race/Ethnicity, and Social Background from the 1970s to the 1990s.‖
Working paper no. 2000-12.
Hedges & Nowell (1999). Changes in the Black-White in achievement test scores.
Sociology of Education, 72 (2), 111-135
Hernandez, J (2008). New Effort Aims to Test Theories of Education. The New York
Times. Retrieved on August 5, 2009 at
http://www.nytimes.com/2008/09/25/education/25educ.html
Herrnstein, R. & Murray, C. (1994). The Bell Curve: Intelligence and Class Structure in
American Life. Free Press.
Holme, J., and Wells, A. ―School Choice Beyond District Borders: Lessons for the
Reauthorization on NCLB from Interdistrict Desegregation and Open Enrollment
Plans,‖ in Improving On No Child Left Behind: Getting Education Reform Back
on Track, Richard D. Kahlenberg, ed. (New York: The Century Foundation Press,
2009), pp.139–215.
Hombo, C. M. (2003). NAEP and No Child Left Behind: Technical Challenges and
Practical Solutions, Theory Into Practice, 42.1, 59-65
Hotakainen, R. (1995). ―Community Schools movement prompts a clash of values,‖
Minneapolis Star Tribune, Retrieved on August 15, 2009 at
www.forumonpublicpolicy.com/archivespring07/green.pdf
Information Technology Systems (2009). Retrieved on August 25th
, 2011 from
http://www.utexas.edu/learn/surveys/disadvantages.html
Jackson, A., & Davis, G. (2000). Turning Points 2000: educating adolescents in the 21st
century. New York: Teachers College Press.
Jencks, C. & Phillips, M. Ed. (1998), The Black-White Test Score Gap (pp. 375-400).
Washington, D.C., Brookings Institution Press.
Jencks, C. (1998). Racial bias in testing. In Jencks, C. & Phillips, M. (Ed.), The Black-
White Test Score Gap (pp. 375-400). Washington, D.C., Brookings Institution
Press.
Jeynes, W. H. (2003). A meta-analysis: The effects of parental involvement on minority
children‘s academic achievement. Education and Urban Society, 35 (2), 202-218.
Johns, E. (2009). New Teachers aren‘t on Minneapolis‘ list of deficit cuts. The Star

235
Tribune. Retrieved on July 29, 2009 from
http://www.startribune.com/politics/local/48210817.html?elr=KArksUUUoDEy3
LGDiO7aiU
Johns, E. (2009). Minneapolis Schools May Ditch Segregation Effort. The Star Tribune.
Retrieved on December, 24, 2009 from
http://www.startribune.com/local/79763172.html?elr=KArksUUUoDEy3LGDiO7
aiU
Jones, R. (2008). Strengthening Student Engagement. International Center for Leadership
in Education. Retrieved on December 21, 2011 from
http://www.leadered.com/pdf/strenghtenstudentengagementwhitepaper.pdf
Kahlenberg, M. (2001) All Together Now: Creating Middle-Class Schools through
Public School Choice. Brookings Institution Press.
Kane, T., & Staiger, D. (2008). "Estimating Teacher Impacts on Student
Achievement: An Experimental Evaluation.‖ Retrieved on October 8, 2009 at
http://ideas.repec.org/p/nbr/nberwo/14607.html
Klem, A., &. Connell, J. (2004). Relationships matter: Linking teacher support to
student engagement and achievement. Journal of School Health, 74 (7), 262.
Knapp, M. S. et al. (1995). Teaching for meaning in high-poverty classrooms. New York,
NY: Teachers College Press.
Kolb, D. A. (1984) Experiential Learning, Englewood Cliffs, NJ.: Prentice Hall
Konstantopoulos, S. (2007). Do Small Classes Reduce the Achievement Gap
between Low and High Achievers? Evidence from Project Star. Boston College;
Institute for the Study of Labor (IZA), IZA Discussion Paper No. 2904
Kozol, J. (2005) The Shame of the Nation: The Restoration of Apartheid Schooling
in America. New York, NY, Three Rivers Press.
Krueger, A. (1997). Experimental Estimates of Education Production Functions.
Princeton University.
Krueger, A. & Whitmore, D. (2002). Would smaller classes help close the black-white
achievement gap? In J. Chubb and T. Loveless (Eds.). Washington, DC:
Brookings Institution.
Ladd, E. C. (1999), The Ladd Report, New York, The Free Press.

236
Ladson-Billings, G. (1994). The Dreamkeepers: Successful Teachers of African American
Children. San Francisco, California, Jossey-Bass Inc.
Lee, F. (2002). Why Are Black Students Lagging? The New York Times, Retrieved on
September 22, 2009 at http://www.nytimes.com/2002/11/30/arts/why-are-black-
students-lagging.html
Lee, O., & Anderson, C. W. (1993). Task engagement and conceptual change in middle
school science classrooms. American Educational Research Journal, 30, 585-610
Lee, W. & Parthasarathy, K. (2002). ―Report Finds Gaps Still Evident in SAT I Test
Scores.‖ The Daily Californian Online 29.
Lee, V. E.; Smith, J. B. (1993) Effects of School Restructuring on the
Achievement and Engagement of Middle-grade Students. Sociology of Education,
66, 164-187
Lee, Valerie E., Smith, Julia B. (1995) Effects of School Restructuring on size and early
gains in achievement and engagement. Sociology of Education, 68, 241-270.
Levine, D. L. (1994). Instructional approaches and interventions that can improve the
academic performance of African American students. Journal of Negro
Education, 63, 46-63.
Lopez, I. (2006), ―Colorblind to the Reality of Race in America‖, 53 Chronicle of Higher
Education, November 3 (2006)
Louis, K.; Marks, H. Does professional community affect the classroom? Teachers‘ work
and student experiences in restructuring schools. American Journal of
Education,106 (4), 532-575.
Mao, M. X., Whitsett, M. D., & Mellor, L. T. (1998). Student mobility, academic
performance, and school accountability. ERS Spectrum, 16(1), 3-15.
Marks, H. M. (2000). ―Student Engagement in Instructional Activity: Patterns in the
Elementary, Middle, and High School Years,‖ American Educational Research
Journal, 37, (1) 153–84
Marshall, C., & Rossman, G. B. (1998). Designing qualitative research (3rd
ed.).
Thousand Oaks, CA: Sage
McKown, C., and Weinstein, R. (2003). The development and consequences of
stereotype consciousness in middle childhood. Child Development, 74 (2), 498-
515.

237
McNulty, R. & Quaglia, R. (2007). Tips for using rigor, relevance and relationships to
Improve student achievement. American Association of School Administrators,
retrieved on July 10, 2009 at
http://www.education.com/reference/article/Ref_Rigor_Relevance/
Meece, J.L, Anderman, E.M., & Anderman, L.H. (2006). Classroom goal structure,
student motivation, and academic achievement. Annual review of psychology, 57,
487-503.
Merriam, S. B. (1998). Qualitative research and case study applications in education. San
Francisco: Jossey-Bass.
Melaville, Berg & Blank (2009). Coalition for Community Schools. Community-Based
Learning: Engaging students for success and citizenship. Retrieved September
22, 2009, from http://www.communityschools.org/CCSDocuments/CBLFinal.pdf.
Melville, K. (2006). The School Drop Out Crisis: Why One-Third of High School
Students Don’t Graduate. Retrieved September 16, 2011, from
www.learningtofinish.org
Mickelson, R., & Heat, D. (2008). The effects of segregation and tracking on African
American high school seniors‘ academic achievement. Journal of Negro
Education, 17 (2) 7-12.
Milliken v. Bradley, 418 U.S. 717 (1974)
Minnesota Historical Society (2012). The Constitution of the State of Minnesota.
Retrieved on December 12, 2011 from
http://www.mnhs.org/library/constitution/transcriptpages/dt.html
Minneapolis Public Schools Fact Sheet (2008). Retrieved on November 3, 2009 at
www.mpls.k12.mn.us/sites/f7071225-9844-4da6.../FactSheet08-09.pdf
Minneapolis Branch of NAACP v. State of Minnesota, 1995. Retrieved on July 22,
2009 at
www.irpumn.org/.../Choice,_Equal_Protection_and_Metro_Integration.pdf
Minnesota Department of Children, Families & Learning, 1998. Retrieved on July,
24, 2009 at http://www.leg.state.mn.us/lrl/issues/grad2.asp.
Minnesota State Constitution, Article XIII (1858). Retrieved on August 15, 2009 at
http://www.house.leg.state.mn.us/cco/rules/mncon/Article13.htm

238
Modell, J, and GH Elder (2002). Children develop in history: So what's new? In W
Hartup and R Weinberg (Eds.), Child psychology in retrospect and prospect: In
celebration of the 75th anniversary of the Institute of Child Development, Vol. 32
(pp. 173-205). Mahwah, NJ: Lawrence Erlbaum. Minnesota Symposia on Child
Psychology. http://www.questia.com/PM.qst?a=o&d=104338278
Moustakas, C. (1994). Phenomenological research methods. Thousand Oaks, CA: Sage.
National Assessment of Educational Progress. Retrieved October 15th, 2009 from
http://nces.ed.gov/nationsreportcard/
National Assessment of Educational Progress. Retrieved October 21st, 2009 from
http://nces.ed.gov/ecls/
National Center for School Engagement. Retrieved June 6th, 2010 from
http://www.schoolengagement.org/.
National Center for Educational Statistics. Retrieved August 10th, 2009 from
http://nces.ed.gov/nationsreportcard/
National Commission on Excellence in Education (1983). Nation at Risk: The Imperative
for Educational Reform. Retrieved on October 20, 2009.
http://www.ed.gov/pubs/NatAtRisk/index.html
National Commission on Teaching and America‘s Future (2007). Teacher turnover:
examining exit attrition, teaching area transfer and school migration. Retrieved
on July 25, 2009 at
http://www.accessmylibrary.com/article-1G1-184231218/teacher-turnover-
examining-exit.html
National Education Longitudinal Study of 1988 (NELS 88). Retrieved on September
22, 2009 at http://nces.ed.gov/surveys/NELS88/
National Urban Alliance. (2012). Retrieved on January, 12, 2012 at
http://nuatc.org/about-us/
National Research Council & Institute of Medicine. (2003). Engaging schools: fostering
high school students’ motivation to Learn. Washington, DC: National Academy
Press.
Nettles, Michael T. 1988. Toward Black Undergraduate Student Equality in American
Higher Education. New York: Greenwood Press.
Newmann, F. (1981). Reducing student alienation in high schools: Implications of theory.

239
Harvard Educational Review, 51, 546-564.
Newmann, F. (1992). Student engagement and achievement in American secondary
schools. New York: Teachers College Press.
Newmann, F., G. Wehlage, Successful School Restructuring; A Report to the Public and
Educators (Madison: Wisconsin Center for Education Research, 1995), p. 8.
Newmann, F., Secada, W., and Wehlage, G. (1995). A Guide to Authentic Instruction
and Assessment; Vision, Standards, and Scoring. Madison; Wisconsin Center for
Education Research, 1995.
Newmann, Marks, and Gamoran (1996). Authentic pedagogy and student performance.
American Journal of Education, 104 (4), p. 280-312.
Nisbett, R. E. (1998). Race, genetics, and IQ. In Jencks, C. & Phillips, M. Ed. (1998),
The Black-White Test Score Gap (pp. 375-400). Washington, D.C., Brookings
Institution Press.
Northwest Evaluation Association (2011). Retrieved on September 16, 2011 at
http://www.nwea.org/products-services/computer-based-adaptive-
assessments/map
Oakes, J. (1990). Opportunities, Achievement, and Choice: Women and Minority
Students in Science and Mathematics, Review of Research in Education, 16,
p.153-222.
Oakes, J. Gamoran, A. & Page, R. (1992). Curriculum differentiation: Opportunities,
outcomes, and meanings. In P.W. Jackson (ed.), Handbook of research on
Curriculum. New York: Macmillan, 570-608.
Organization for Economic Co-operation & Development (2002). Reading for Change:
Performance and Engagement Across Countries. Retrieved on July 18, 2011
from www.oecd.org/dataoecd/43/54/33690904.pdf
Organization for Economic Co-operation & Development (2012). Retrieved on
November 15, 2011 at: www.oecd.org/document/12
Ogbu JU (1978). Minority Education and Caste: The American System in Cross-Cultural
Perspective. San Diego, CA: Academic Press.
Ogbu, J. U. (1985). A cultural ecology of competence among inner city Blacks. In M.B.
Spencer, G.K. Brookins, & W.R. Allen (Eds.), Beginnings: The social and
affective development of Black children (pp.45-66). Hillsdale, NJ: Lawrence

240
Erlbaum Associates
Ogbu, J. U. (2003). Black American students in an affluent suburb: A study of academic
disengagement. Mahwah, NJ: Lawrence Erlbaum.
Orfield, M. (1997). Metropolitics: A Regional Agenda for Community and Stability.
Minneapolis, MN. Brookings Institutional Press
Orfield, M. (2005) Racial Integration and Community Revitalization: Applying the Fair
Housing Act to the Low Income Housing Tax Credit. Vanderbilt Law Review, 58
(6) 1754.
Orfield, M. (2009). A Comprehensive Strategy to Integrate Twin Cities Schools and
Neighborhoods. Minneapolis, MN. University of Minnesota Law School
Orfield, M. (2011). Research on the Benefits of Integration. Minneapolis, MN
University of Minnesota Law School.
Orfield, G., & Eaton, S. (1996). Dismantling segregation: The quiet reversal of Brown v.
Board of Education. New York: The New Press.
Orfield, G. & Lee, C. (2005). Why Segregation Matters: Poverty and Educational
Inequality. Cambridge, MA: Harvard University.
Organisation for Economic Cooperation and Development (2003). Programme for
International Student Assessment Glossary. Paris: Warm. Retrieved from
http://stats.oecd.org/glossary/detail.asp?ID=5403
Osborne, J. W. (1995). Academics, self-esteem, and race: A look at the underlying
assumptions of the disidentification hypothesis. Personality and Social
Psychology Bulletin, 21 (5) 449-455.
Osborne, J. W. (1997). Race and academic disidentification. Journal of Educational
Psychology. 89 (4) 728-735.
Pajares, F. (2007). Elements of a proposal. Retrieved on 5.14.11 from
http://des.emory.edu/mfp/proposal.html
Palmer, E. (2003). The Choice is Yours After Two Years: An Evaluation. Boulder, CO,
Aspen Associates 40.
Parker, W. (2003). A Model for Recruitment and Retention of Minority Students in
Teacher Preparation Programs. Journal of Teacher Education, Vol. 39 (1), 14-18

241
Partanen, A. (2011). What Americans Keep Ignoring About Finland’s School Success.
Retrieved on January 2, 2012 from:
http://www.theatlantic.com/national/archive/2011/12/what-americans-keep-
ignoring-about-finlands-school-success-250564/
Peterson-Lewis, S. & Bratton, L. M. (2004). Perceptions of ―acting Black‖ among
African-American teens: Implications of racial dramaturgy for academic and
social achievement. The Urban Review, 36 (2), 81-100.
Phillips, M., Brooks-Gunn, J., Duncan, G. J., Klevanov, P., & Crane, J. (1998). Family
background, parenting practices, and the Black-White test score gap. In Jencks, C.
& Phillips, M. Ed. (1998), The Black-White Test Score Gap (pp. 103-148).
Washington, D.C., Brookings Institution Press.
Phillips, M. (1997). What makes schools effective? A comparison of the relationships of
communitarian climate and academic climate to mathematics achievement and
attendance during middle school. American Educational Research Journal, 34
(4), 633-662.
Phillips, M., Crouse, J., & Ralph, J. (1998). Does the Black-White test score gap widen
after children enter school?. In Jencks, C. & Phillips, M. Ed. (1998), The Black-
White Test Score Gap (pp. 229-272). Washington, D.C., Brookings Institution
Press.
Plessy v. Ferguson, 163 U.S. 537 (1896)
Protecting Human Subjects Guide (2009), Retrieved on September 10, 2011 from
http://www.irb.umn.edu/guidance/guide.html#.TwFmEOb6-M4
Punch, K. (2005). Introduction to social research: quantitative and qualitative approaches.
Oxford: Wiley and sons.
Randall, V. (2001). Race, Racism and the Law: Examples of Jim Crow Laws. Retrieved
on September 16, 2009 from
http://academic.udayton.edu/race/02rights/jcrow02.htm
Rauh, V.A., Lamb Parker, F., Garfkel, R.S., Perry, J. and Andrews, H. (2003) Biological,
social and community influences on third grade reading levels of minority Head
Start children: a multi level approach. J. Comm. Psychology, 31(3): 255 278.
Reinhardt, H. (2004). A Report on the Minneapolis School District as part of the
facilities utilization plan: An analysis of enrollment and enrollment projections.
Minneapolis: Hazel Reinhardt Consulting.
242
Reynolds, A. J., Chen, C. C., & Herbers, J. E. (2009). School mobility and educational
success: A research synthesis and evidence on prevention. National Research
Council, Washington, DC.
Rice, J (2003). Teacher Quality: Understanding the Effectiveness of Teacher Attributes.
Retrieved on July 18, 2011 from
http://www.epi.org/publicatoins/books_teacher_quality_execsum_intro/
Rivkin, S.G., Hanushek, E.A., & Kain, J.F. (2005). Teachers, schools, and
academic achievement. Econometrica, 73(2), 417-458.
Rogers, C.R. (1969). Freedom to Learn. Columbus, OH: Merrill.
Rossman, G.B., & Rallis, S.F. (1998). Learning in the field: An introduction to
qualitative research. Thousand Oaks, CA: Sage.
Rothstein, R. (2004). Class and schools: Using social, economic, and educational reform
to close the black-white achievement gap. Washington, D.C.: Economic Policy
Institute
Rumberger, R. W., & Larson, K. A. (1998). Student mobility and the increased risk of
high school drop out. American Journal of Education, 107,1-35.
Ryan, A. M., & Patrick, H. (2001). The classroom social environment and changes in
adolescents‘ motivation and engagement during middle school. American
Educational Research Journal, 38 (2), 437-460.
Ryan, K. E. & Ryan, A. M. (2005). Psychological processes underlying stereotype threat
and standardized math test performance. Educational Psychologist, 40 (1), 53-63.
Sahlberg, P. (2007). Education policies for raising student learning: the Finnish approach.
Journal of Educational Policy, Vol. 22 (2), 147-171.
Sahlberg, P. (2011). Lessons From Finland. Retrieved on August 27, 2011, from
http://www.aft.org/pdfs/americaneducator/summer2011/Sahlberg.pdf
Sanders, W., & Rivers, J. (1996). Cumulative and residual effects of teachers on future
Student academic achievement (Research progress report). In University of
Tennessee Value-Added Assessment Center, Knoxville, TN. Retrieved August 17,
2009, from http://mdk12.org/practices/ensure/tva/ tva_2.html
Shapiro, J. P., Loeb, P., Bowermaster, D., & Toch, T. (1993). Separate and equal. U.S.
News & World Report, 115 (23), 46-55.

243
Skinner, E., & Belmont, M. (1993). Motivation in the classroom: Reciprocal effects of
teacher behavior and student engagement across the school year. Journal of
Educational Psychology. 85 (4), 571-581.
Skinner, E., Wellborn, J. G., & Connell, J. P. (1990). What it takes to do well in school
and whether I‘ve got it: The role of perceived control in children‘s engagement in
school achievement. Journal of Educational Psychology, 82, 22-32.
Slavin, R. E. (1989). School and Classroom Organization. Hillsdale, NJ, Lawrence
Erlbaum Associates, Inc, Publishers.
Snell, L. (2004). No Way Out: The No Child Left Behind Act provides only the illusion
of school choice. Reason Magazine, retrieved on November 1, 2009 from
http://reason.com/archives/2004/10/01/no-way-out
Social Research Methods (2006), Retrieved on September 27, 2011 from
http://www.socialresearchmethods.net/kb/statdesc.php
Smith, C (August 8, 2012). What is PBIS? Minnesota PBIS. Retrieved on February 4,
2012 from http://pbismn.org/PBISschools.html
Solomon, N. (2009) Racial Achievement Gap Still Plagues Schools. NPR. Retrieved on
November 1, 2009 from
http://www.npr.org/templates/story/story.php?storyId=114298676
States‘ Impact on Federal Education Policy (SIFEP). Retrieved on November 6, 2009.
http://www.sifepp.nysed.gov/edindex.shtml
Steele, C. M., & Aronson, J. (1995). Stereotype threat and the intellectual test
performance of African-Americans. Journal of Personality and Social
Psychology, 69 (5), 797-811.
Steele, C. M. (1992). Race and the schooling of Black Americans. The. Atlantic Monthly,
269 (4), 68-78.
Steele, C. M. (1999). Thin Ice: ―Stereotype Threat‖ and Black college students. Atlantic
Monthly (August), 44-54.
Stevens, J.P. (2002). Applied Multivariate Statistics for the Social Sciences. Mahwah, NJ:
Lawrence Erlbaum Associates, Inc.
Stevens, N. (2012). Teacher Supply, Demand, and Quality Policy Research Project.
Retrieved on February 19, 2012 at
244
www.tea.state.tx.us/research/pdfs/prr4.pdf
Stipek, D. (2002). Good instruction is motivating. In A. Wigfield & J.S. Eccles (Eds.),
Development of achievement motivation (p. 309-332). San Diego, CA: Academic
Press.
Stolp, S. (1994). Leadership for School Culture. Eric Digest. Retrieved on March 11,
2012 at
https://scholarsbank.uoregon.edu/xmlui/bitstream/.../digest091.pdf
Swann v. Charlotte-Mecklenburg Board of Education, 402 U.S. 1 (1971)
Swanson, C. B., & Schneider, B. (1999). Students on the move: Residential and
educational mobility in America‘s schools. Sociology of Education, 72, 54-67.
Tanner, D. (1993). A Nation ‗Truly‘ at Risk. Phi Delta Kappan, 75 (3) 4-9.
Thernstrom, A. & Thernstrom, S. (2003). No Excuses: Closing the Racial Gap in
Learning. New York, NY, Simon & Schuster.
Thompson, C. & O‘Quinn, S. (2001). Eliminating the Black-White Achievement Gap: A
summary of research. Chapel Hill: North Carolina Education Research Council.
U.S. Census Bureau (2000). Retrieved on November 2, 2009 at
http://www.census.gov/main/www/cen2000.html
U.S. Commission on Civil Rights (2007). Retrieved on December 1, 2009 at
http://www.usccr.gov/index.html
U.S. Department of Education (2004). Retrieved on January, 4, 2012 at
http://www2.ed.gov/nclb/index/az/glossary.html?src=az#3
U.S. Department of Education (2003). Remarks by Secretary Paige to the Commonwealth
Club of California, March 12. Retrieved on September 9, 2009 at
http://www.ed.gov/news/speeches/2003/03/03122003a.html
U.S. Department of Education (2002). Retrieved on August 25, 2009 at
http://www.ed.gov/about/overview/fed/role.html?src=ln
U.S. Department of Education (2001). Retrieved on November 4, 2009 at
http://www.ed.gov/nclb/landing.jhtml
U.S. Department of Housing and Urban Development. (2006). State of the Cities Data
Systems. Retrieved on August 25, 2009 at
245
Http://socds.huduser.org/Census/race.odb?msacitylist=5120.0*=msa.
Vail, K. (2001). People: The changing face of education. Education Vital Signs.
Retrieved 12/4/11 from
http://www.asbj.com/evs/01/people.html.
Valijarvi, J. (2004). The System and How it Works: Curricular and Pedagogical
Characteristics of the Finnish Comprehensive School. Retrieved January 12,
2011 from http://hkier.fed.cuhk.edu.hk/journal/wp-content/uploads/2009
Villarreal, A. (2007). Academy for Teacher Excellence: Recruiting, Preparing, and
Retraining Latino Teachers through Learning Communities. Teacher Education
Quarterly, 88, 53-69.
Voelkl, K. E. (1997). Identification with school. American Journal of Education, 105,
204-319.
Walberg, H.J. (1984). Families as partners in educational productivity. Phi Delta
Kappan,65 (6), 397-400.
Wagner, T. (2008). The Global Achievement Gap. New York, NY: Basic Books
Waks, L.J. (2005). Brown v. Board, common citizenship, and the limits of curriculum.
Journal of Curriculum and Supervision, 20 (2), 94-128.
Wehlage, G., Rutter, R., Smith, G., Lesko, N., & Fernandez, R. (1989). Reducing the
Risk: Schools as communities of support. Philadelphia, PA: The Falmer Press,
Taylor & Francis.
Wentzel, K. (1998). Social relationships and motivation in middle school: The role of
parents, teachers, and peers. Journal of Educational Psychology, 90 (2),
202-209.
Wilkinson, J. (2007). The Seattle and Louisville Cases: There is no other way.
Harvard Law Review 121 (158) 1-19.
Williams, J.D. (2003). Student engagement at school: A sense of belonging and
participation. Results from PISA 2000. Paris: OECD.
Williams, D.L. & Chavkin, N.F. (1989). Essential elements of strong parent involvement
programs. Educational Leadership, 47, 18-20.
Wolcott, H.T. (1994). Transforming qualitative data: Description, analysis and
interpretation. Thousand Oaks, CA: Sage.

246
Word, E. (1990). Student/teacher achievement ratio (STAR) Tennessee‘s K-3 Class size
study, final summary report, 1985-1990. Tennessee State Department of
Education.
Yair, G. (2000). Educational Battlefields in America: The Tug-of-War over Students'
Engagement with Instruction. Sociology of Education 73(4) p.247-269
Yeh, S.S. (2006). Raising student achievement through rapid assessment and test reform.
Teachers College Press.
Yin, R.K. (2003). Case Study Research: Design and methods. Newbury Park, CA:
Sage.
Zimmerman, B. J. (1990). Self-regulated learning and academic achievement: An
overview. Educational Psychology, 21, 3-17.
Ziegler, H (2003). America‘s lazy students just don‘t stack up. The Seattle Times.
Retrieved on December 2, 2009 from
http://seattletimes.nwsource.com/html/opinion/2001811932_hans11.html

247

248
1
Appendix B

249
Appendix C
Introductory Letter
Dear Wakta 8th
Grader,
My name is Matthew J Scheidler, and I have worked in the Wakta School District since
2000. I have had the good fortune to work in all three middle schools in Wakta as a
social studies teacher and as a peer coach. I am also working on my doctorate (Ed. D.) in
Organizational Leadership, Policy, & Development at the University of Minnesota.
I am asking if you are willing to take a survey about your engagement (interest) in
school, because I am trying to learn more about the engagement of students your age. I‘m
really interested in learning more about the achievement of students (why some students
do well in school and some do not). The survey on engagement will help me learn about
student achievement and the connection to how you think about your educational
experience. I am grateful for the time and effort your teacher is investing in this
endeavor.
Since you are an 8th
grader in Wakta, I am asking you to be in the study. The study will
consist of taking a survey that will take no longer than 30 minutes. The survey will be
taken on a computer during your class. In addition to the survey I will be reviewing your
academic records (MCA test scores, MAP test scores). Don‘t worry; I will be the only
one who will be working with this data. Your name will not be used at any point in this
research, and the survey results and all other data will be kept secret.
You can ask any questions that you have about this study. If you have a question later
that you don‘t think of now, you can ask your teacher or call/e-mail me. If you don‘t want
to be in this study, just let your teacher know. Remember, being in this study is up to you,
no one will be mad at you if you don‘t want to participate or even if you change your
mind later.
The survey will be given to you before or after spring break. Your teacher will let you
know the exact day.
Finally, you will be eligible to earn a cash incentive if you return your permission slip. If
you choose to participate, or don‘t feel like participating, you will have a chance to earn
the incentive if you return the permission slip on the back of this paper. Your teacher will
have more details about this incentive.
Thank you,
Matthew J Scheidler

250
Appendix D
Parent Consent Form
Student Engagement and the Academic Achievement of Middle School Students: Does
Engagement Increase Student Achievement?
INTRODUCTION
Your child is invited to participate in a research study examining their level of
behavioral, cognitive, and emotional engagement. Your child was selected as a possible
participant because they are currently an 8th
grade student at one of the three Wakta
Middle Schools. We ask that you read this form and ask any questions you may have
before agreeing to have your child participate in the study. This study will be conducted
by Matthew J Scheidler, a doctoral candidate in the Department of Organizational
Leadership, Policy, and Development (OLPD) at the University of Minnesota.
The Department of Organizational Leadership, Policy, and Development at the
University of Minnesota supports the practice of protection for human subjects
participating in research. The following information is provided for you to decide
whether you wish to allow your child to participate in the present study. You may refuse
to allow your child to participate in this study. You should be aware that even if you
agree to participate, you or your child is free to withdraw at any time. If you do withdraw
from this study, it will not affect your relationship with this unit, the services it may
provide to you, or the University of Minnesota.
BACKGROUND INFORMATION
The purpose of this study is to examine student‘s level of academic engagement and
determine if higher engagement leads to higher student academic achievement. While
there are numerous studies on the achievement disparities between groups of students
(―groups‖ defined by gender, ethnicity, etc.) and student academic engagement, there are
few that examine the relationship between the two variables and how they intertwine for
middle school students. This study has been approved by the University of Minnesota and
by Wakta Public Schools. It has also been approved by the Institutional Review Board of
the University of Minnesota.
A goal of this study is to examine the relationship between engagement (behavioral,
cognitive, and emotional) and the academic achievement of all 8th grade students in three
suburban middle schools in Wakta. Behavioral engagement is defined as doing
schoolwork and following rules, and examples include student actions that demonstrate
effort, persistence, and concentration. Behavioral engagement statements from the survey
251
include ―I do my homework,‖ and ―I follow classroom rules.‖ Cognitive Engagement
relates to motivation, effort and strategy use, and a few sample statements are: ―I like it
when I have to think really hard,‖ and ―I take pride in my assignments.‖ Emotional
Engagement pertains to the interests, values and emotions of students. Sample statements
include ―I like coming to school,‖ and ―I often feel bored at school.‖ Specifically this
study will answer the following questions:
1. What is the relationship between 8th grade students‘ level of engagement (behavioral,
cognitive, and emotional) and academic achievement?
2. What is the relationship between the middle school model (school climate,
teacher/classroom support, instructional practices) and the academic achievement?
PROCEDURES
If you agree to have your child participate in this study, they will be asked to participate
in a short survey (25-35 minutes) that will consist of 80 questions. The survey will ask
students to assess their level of engagement as they consider statements regarding their
emotions and behavior in school. In addition, I will be looking at your child‘s educational
records, but the records will be kept anonymous with no direct identifiers. Encryption
software will be utilized to ensure there are no breaches of confidentiality while the data
is analyzed.
RISKS AND BENEFITS OF PARTICIPATION
Risks are minimal for participating in this study. The survey will ask students to
evaluate their own feelings about school (i.e. I like coming to school every day). As to
the benefits of participating in this study, there are none for the participants. Students
who return this document with a parent/guardian signature will be eligible to receive a
small incentive (regardless if they are participating in the survey or not). Some people
find participating in a survey to be beneficial because it gives them a chance to express
and reflect on issues that matter to them. Also, information provided may be used to help
inform those who work in education to increase student academic achievement.
CONFIDENTIALITY
The records of this study will be kept private. If any sort of report were to be published, it
would not include any information that will make it possible to identify a subject. Student
names will not be used in this study, and research records will be stored within an
encrypted document.
VOLUNTARY NATURE OF THE STUDY
Participation in this study is voluntary. Your decision whether or not to participate will
not affect your current or future relations with the University of Minnesota or Wakta
Public Schools. If you decide to participate, you child is free to withdraw at any time

252
without affecting those relationships.
QUESTIONS ABOUT PARTICIPATION
Questions about procedures should be directed to the researcher(s) listed at the end of this
consent form.
PARTICIPANT CERTIFICATION
I have read this Consent and Authorization form. I have had the opportunity to ask, and I
have received answers to, any questions I had regarding the study. I understand that if I
have any additional questions about the rights of a research participant, I may contact the
researcher at 763.745.6564 or email [email protected]. I may also
contact the Research Subjects‘ Advocate Line at (612) 625-1650, or by mail at D528
Mayo, 420 Delaware St. Southeast, Minneapolis, Minnesota 55455
If you wish to Allow your child to participate in the study, please sign and date below and
return to the appropriate teacher.
Name of student (please print) :___________________________Date: ______________
Name of parent or guardian (please print) :______________________Date: __________
Signature of parent or guardian:___________________________Date: ______________
Signature of Investigator:________________________________Date: ______________
If you do not want your child to participate in the study, please sign and date below and
return to the appropriate teacher. If your child does not participate in the study they will
have the opportunity to complete class work, read a book, etc., while the other students
are taking the survey.
Name of student (please print) :___________________________Date: ______________
Name of parent or guardian (please print) :______________________Date: __________
Signature of parent or guardian:___________________________Date: ______________
Signature of Investigator:________________________________Date: ______________
Researcher Contact Information
Matthew J Scheidler Neal Nickerson
Principal Investigator Faculty Supervisor
Department of Organizational Leadership, Department of Organizational
Leadership, Policy, and Development (OLPD) Policy, and Development (OLPD)
330 Wulling Hall
Wakta MS #1 University of Minnesota
Wakta, MN XXXX Minneapolis, MN 55455
XXX-XXX-XXXX 612-XXX-XXXX

253
Appendix E

254

255
Appendix F

256

257

258

259

260

261

262
Appendix G
Wakta Student Demographic Information By Middle School
MS #2 MS #3 MS #1

263
Appendix H
Wakta MS #2 Student Referral Data

264
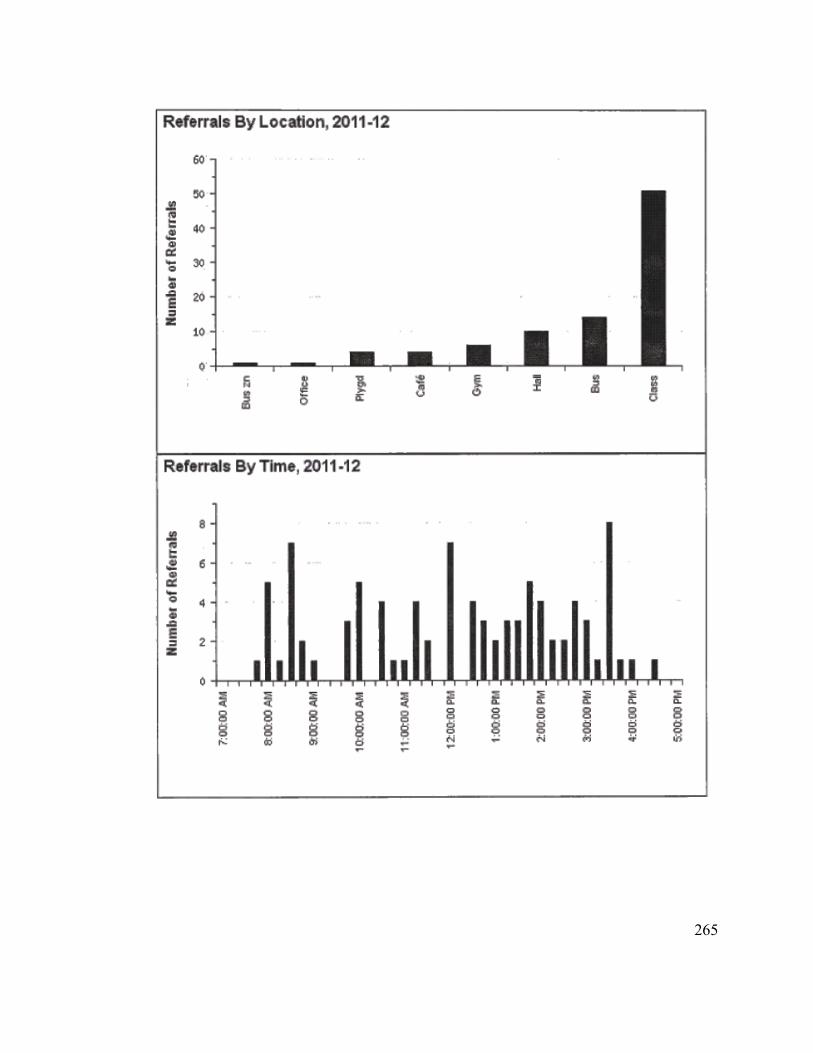
265

266

267

268

269