Reading the graphics: what is the relationship between graphical reading processes and student...
38
1 23 Reading and Writing An Interdisciplinary Journal ISSN 0922-4777 Volume 25 Number 3 Read Writ (2012) 25:739-774 DOI 10.1007/s11145-011-9298-7 Reading the graphics: what is the relationship between graphical reading processes and student comprehension? Rebecca R. Norman
-
Upload
independent -
Category
Documents
-
view
0 -
download
0
Transcript of Reading the graphics: what is the relationship between graphical reading processes and student...

1 23
Reading and WritingAn Interdisciplinary Journal ISSN 0922-4777Volume 25Number 3 Read Writ (2012) 25:739-774DOI 10.1007/s11145-011-9298-7
Reading the graphics: what is therelationship between graphical readingprocesses and student comprehension?
Rebecca R. Norman

1 23
Your article is protected by copyright and
all rights are held exclusively by Springer
Science+Business Media B.V.. This e-offprint
is for personal use only and shall not be self-
archived in electronic repositories. If you
wish to self-archive your work, please use the
accepted author’s version for posting to your
own website or your institution’s repository.
You may further deposit the accepted author’s
version on a funder’s repository at a funder’s
request, provided it is not made publicly
available until 12 months after publication.

Reading the graphics: what is the relationshipbetween graphical reading processes and studentcomprehension?
Rebecca R. Norman
Published online: 4 February 2011
� Springer Science+Business Media B.V. 2011
Abstract Research on comprehension of written text and reading processes sug-
gests a greater use of reading processes is associated with higher scores on com-
prehension measures of those same texts. Although researchers have suggested that
the graphics in text convey important meaning, little research exists on the rela-
tionship between children’s processes prompted by the graphics in informational
text and their overall comprehension of the same texts. In this study, 30 second-
graders read 2 informational texts, were prompted to share their thinking whenever
they looked at a graphic, retold each text in their own words, and answered
8 comprehension questions about each text. Correlations between students’ scores
on the post-reading comprehension measures and the reading processes prompted by
the graphics suggested that: (1) the number of times any process was prompted by
the graphics was significantly correlated with scores on the retelling measure for one
book, but not for the retelling measure of the other book or for the comprehension
question measure for either book; (2) there were no significant correlations between
the number of different processes prompted by the graphics and students’ scores on
any comprehension measure; (3) a number of individual processes were positively
correlated with retelling and/or comprehension question scores.
Keywords Visual literacy � Informational text � Reading processes
Introduction
‘‘A picture is worth a thousand words,’’ but only if one can comprehend it.
Otherwise, it is just a page decoration at best and a waste of space at worst.
Considering how many graphics are found in textbooks and other non-fiction texts
R. R. Norman (&)
Mount Saint Mary College, 109 Hudson Hall, 330 Powell Avenue, Newburgh, NY 12550, USA
e-mail: [email protected]
123
Read Writ (2012) 25:739–774
DOI 10.1007/s11145-011-9298-7
Author's personal copy

for children and adults and the amount of information they contain, it is important to
understand what readers are doing when they see these graphics, how they are
processing them, how they are understanding them, and whether these graphics are
contributing to their overall comprehension of the text. This study begins to address
some of these questions by investigating: What is the relationship, if any, between
children’s processes prompted by the graphics in informational text and their overall
comprehension of those texts?
Theoretical framework
This study is grounded in semiotic (e.g., Jewitt & Oyama, 2001), multiple literacies
(The New London Group, 1996), and dual coding (e.g., Paivio, 1991) theories and
in recognition of previous research on the importance of informational text and
graphics in today’s society. In the twenty-first century, reading and writing printed
words is not enough—one must be able to read and communicate meaning with
spoken, written, and visual text (e.g., IRA/NCTE, 1996; The New London Group,
1996). Therefore, the graphics in text—which I define as any photograph or
illustration in narrative or informational text including but not limited to diagrams,
maps, graphs, and tables—are meaningful signs that need to be understood in order
to make meaning (e.g., Jewitt & Oyama, 2001).
These graphics are particularly important in informational text, where they can
help to organize ideas (e.g., a flow chart explaining how fossils are made), make
abstract ideas more concrete (e.g., an illustration of the circulatory system as
plumbing, Levin, 1981), and provide extra information not included in the written
text (e.g., photographs of fish fossils, plant fossils, and insect fossils to accompany
the written text, ‘‘There are many types of fossils’’). Research has identified
6 common functions of graphics in informational text (Duke et al., 2009; Bishop &
Hickman, 1992; Carney & Levin, 2002; Clark & Lyons, 2004; Levin, 1981; Levin,
Anglin, & Carney, 1987):
• decoration, which appear as an ornament on the page without adding to or
relating to the written text;
• representation, which depict the information presented in informational text;
• organization, which supply a framework for classifying information from the
written text;
• interpretation, which explain abstract ideas by depicting them in a more concrete
fashion;
• transformation, which represent mnemonics to help readers remember the
written text by making it more concrete and meaningful; and
• extension, which provide extra details not directly stated in the text.
Younger students particularly need to learn to read and understand these graphics
because their informational texts contain many graphics (Duke & Kays, 1998;
Fingeret, 2010) and because children often have difficulty reading informational
texts (e.g., Park, 2008). Perhaps if children better understood how to gain
740 R. R. Norman
123
Author's personal copy

information from the graphics in informational text, these texts would be less of a
struggle (Moss, 2008).
In his dual coding theory, Paivio (1991) suggests the brain codes graphics and
verbal text into memory differently. Therefore, students who use comprehension
processes as they study the graphics, as well as the written text, may be better able
to comprehend and remember what they have read. This research study has been
designed to study whether and how the processing of the graphics relates to
students’ comprehension of the overall text.
Review of the literature
Comprehension of written text
Research over the past half century has provided us with a well-developed picture of
what skilled readers are doing and thinking as they read narrative and informational
text. Skilled readers use many and varied reading processes (e.g., prediction,
inferring, summarizing, visualizing, comprehension monitoring) strategically and
flexibly (e.g., Duke & Pearson, 2002; National Institute of Child Health and Human
Development, 2000; Pressley & Afflerbach, 1995). Furthermore, they utilize their
prior knowledge of the topic and of the genre and consider their purpose for reading
the text to assist them in their comprehension (e.g., Duke, 2005; RAND Reading
Study Group, 2002).
Not only has it been found that skilled readers use more strategies than less
proficient readers, but utilization of these strategies has been found to be correlated
with better comprehension (e.g., Braten & Stromso, 2003; Dermitzaki, Andreou, &
Paraskeva, 2008; Samuelstuen & Braten, 2005). For example, Dermitzaki et al.
(2008) found that third graders’ use of strategies such as planning and monitoring of
learning processes were highly correlated with their performance on a comprehen-
sion assessment related to the same text. Moreover, Samuelstuen and Braten (2005)
found that 10th graders who were poor decoders but used many strategies while
reading two expository texts scored better on a comprehension assessment about the
text than good decoders who did not use many strategies. While these findings speak
to the importance of strategy use to comprehension of written text, the question
remains: does this correlation between strategy use and comprehension carry over to
the reading of graphics?
Comprehension of graphics
Although research on comprehension of graphics does exist (and will be discussed
next), it is not as robust as the research on comprehension of written text.
Furthermore, the findings have been inconsistent, with some researchers finding that
the inclusion of graphics has no effect on participants’ comprehension, others
finding detrimental effects, and still others finding beneficial effects. Representative
studies are discussed below.
Reading the graphics 741
123
Author's personal copy

Graphics have no effect on comprehension of written text
A number of studies (e.g., Brookshire, Scharff, & Moses, 2002; Miller, 1938; Rose
& Robinson, 1984) conducted with children found that the presence of graphics
had no effect on the participants’ comprehension. For example, Brookshire et al.
(2002) randomly assigned first- and third-grade students to one of three conditions
for reading a narrative text designed specifically for the experiment: text-only, text
plus illustrations, and illustrations-only (for which the students were told the names
of the characters and instructed to make up a story). After reading (in third grade)
or hearing (in first grade) the text, students were asked 15 comprehension
questions. Five of the questions’ answers could be found in the written text, five
could be found in the graphics, and five could be found in both the written text and
the graphics. They found that the presence of graphics did not significantly
increase students’ comprehension scores on the questions whose answers could be
found in the written text only (which was not surprising) or in the text and the
graphics, and slightly decreased their comprehension scores of illustration-only
questions.
Graphics have negative effects on comprehension of written text
Other studies on graphics and comprehension of connected text, however, have
concluded that graphics negatively impact the reading process (Harber, 1983; Rose,
1986; Watkins, Miller, & Brubaker, 2004). For instance, Rose (1986) researched the
effects of illustrations on the comprehension of students with learning disabilities.
Thirty-two learning disabled elementary students (age 9 years, 3 months–12 years,
8 months) read passages at their reading level, in both illustrated and unillustrated
conditions. Within-subject analyses indicated that the students’ comprehension of
unillustrated passages was significantly higher than their comprehension of the
illustrated passages.
Graphics have beneficial effects on comprehension of written text
Other researchers (e.g., Hannus & Hyona, 1999; Rusted & Coltheart, 1979; Small,
Lovett, & Scher, 1993) have concluded from their research that graphics actually
aid in students’ comprehension. Yet these researchers do not agree for whom or in
what ways.
Graphics benefit All readers For example, in one study, Small et al. (1993) studied
33 first and 33 third graders of varying reading abilities learning about three
unfamiliar animals. Students were randomly assigned to one of three conditions:
description-only (listened to passages), picture-only (examined graphics), and
description-plus-picture condition (listened to passage and examined graphics). After
listening to each passage and/or examining each graphic, the students answered 12
comprehension questions about the animal–four of the answers could be found in the
description, four in the graphic, and four in both. Students were encouraged to guess
742 R. R. Norman
123
Author's personal copy

or make up answers if they were unsure. Students in the description-plus-picture
condition recalled more information presented only in the text and more information
presented in the text and the graphics than those students in the description-only
condition. Thus, the results of the study suggested that the presence of graphics
facilitated recall of information, even if the information had not been presented in the
graphics, for all students in the study.
Graphics benefit Good readers more In contrast to the findings above, based on
their study of fourth graders’ comprehension of biology textbook passages, Hannus
and Hyona (1999) concluded that the graphics assisted good readers more than
others. The participants in this study, 108 fourth graders from two urban
elementary schools in Finland, were exposed to three illustrated passages and three
unillustrated passages. After reading, they answered ten or eleven comprehension
questions for each passage. The questions assessed the students’ recall of specific
details as well as their comprehension of biological principles. The results
indicated that graphics led to better recall of detail information for all students, but
only better comprehension of biological principles for the stronger readers. They
asserted that this difference was due to the fact that students needed to integrate
information from the written text and graphics in order to benefit from the
graphics, which only high-ability readers appeared to be capable of doing.
Furthermore, they hypothesized that better readers recalled and comprehended
more from the illustrated texts because they were better able to understand four
key ideas: (1) when to examine the graphics while reading; (2) which graphics
they should examine; (3) what information they should obtain from the graphics;
and, (4) how to combine information in the written text and the graphics into one
mental representation.
Graphics benefit Poor readers more Still other studies have found that, while
graphics may help all students, they especially improve the reading comprehension
of poor readers and readers from disadvantaged populations. For instance, Rusted
and Coltheart (1979) found that graphics improved the comprehension of poor
readers more than that of good readers. In this study, thirty-six 9- and 10-year olds
(half good and half poor readers) were randomly assigned two sets of six
informational passages about unusual animals, with one set of passages containing
graphics of the animals and the other not containing any graphics. The passages
included information about the physical characteristics of the animals, as well as
their living and eating habits. Before reading, students were told to remember what
they read and to pay attention to graphics if they were present. The students then
read each passage aloud two times. Immediately after the second reading of each
passage, students told the researcher everything they remembered about the passage.
The results of the study suggested that the presence of graphics improved the
general recall of all students, but poor readers actually recalled more illustrated
features than good readers, thus improving their comprehension as a whole.
Furthermore, the researchers reported that the poor readers appeared to study the
graphics more often and use them more intentionally than the good readers.
Reading the graphics 743
123
Author's personal copy

Conclusion
In summary, the research conducted with children thus far has investigated whether
graphics improve children’s comprehension of written text, but the results have been
inconsistent, with some researchers finding them to have neutral effects, others
finding them to have negative effects, and still others finding that they have
beneficial effects. Even those researchers who agree that they are beneficial to
students’ comprehension do not agree for whom or for what reasons.
Outcome versus concurrent measures
Most of the previous research on graphics and comprehension explored whether the
mere presence of graphics had effects on participants’ overall comprehension of the
texts presented to them. Few studies used think alouds (e.g., Norman, 2010a;
Schnotz, Picard, & Hron, 1993) to examine what they were doing with those
graphics, and what relationship that had to participants’ comprehension of the text.
In fact, only one study (i.e., Norman, 2010a) has research the specific reading
processes that were prompted by the graphics and only one study (i.e., Schnotz
et al., 1993) has attempted to investigate how participants used the graphics to assist
in their comprehension of informational text through the use of verbal protocols.
Reading processes prompted by the graphics in informational text In Norman’s
(2010a) study, 9 second graders read two informational texts and were prompted to
think aloud whenever they studied a graphic. These think-alouds revealed that 17
reading processes (i.e., label; literal description; inferential description; prediction;infer the author’s purpose; confirm/disconfirm text; connection-to-self; irrelevantconnection; connection-to-prior knowledge; wonder; knowledge monitoring; affec-tive response; compare-contrast graphics; evaluate; use of running text; use ofcaptions, labels, map key, etc.; and word identification) were prompted by the
graphics in these two texts. This study did not utilize any outcome measures,
however, so it was not possible to determine whether or not a relationship existed
between the reading processes prompted by the graphics and students’ comprehen-
sion of those same texts.
Use of graphics in informational text Schnotz et al. (1993) studied 26 college
students as they read a passage, accompanied by a map of the time zones, about time
and date changes as one passes through the different time zones in order to
determine whether there were differences in how successful and unsuccessful
learners used the graphics (i.e., the map). After reading, the students first described
what information they could extract from the map; then thought aloud as they
answered 11 questions using a map; and finally took a 25 question test for which
they had to apply the information in the written text and the map to figure out times
in different areas of the world. Schnotz et al. compared how often successful and
unsuccessful learners—as determined by the 25 question test about the material—
referred to the map during the think-alouds, finding that successful learners referred
744 R. R. Norman
123
Author's personal copy

to the map significantly more often than their less successful counterparts (i.e., an
average of 21.3 and 12.5 times respectively). Moreover, successful learners
interpreted more sections of the map during their think-alouds and used the map to
determine more spatial and temporal differences as indicated by their think-alouds.
Schnotz et al. hypothesized that the successful learners were using the graphics to
develop mental models, and used the written text to add to these mental models.
In sum, Norman’s (2010a) study provides us with an understanding of what
processes are prompted by the graphics as children reading informational texts, but
no outcome measure was used so it is unknown how well students comprehended
the texts or whether the use of reading processes as they studied the graphics
improved or hindered the students’ comprehension of the overall text. Schnotz
et al.’s (1993) study indicated that successful learners—those students who
comprehended the text more—used the graphic more often, but did not investigate
the specific reading processes that were prompted by the graphic. Therefore more
research is needed in order to investigate specifically the relationship between the
reading processes prompted by the graphics and students’ comprehension of the
same texts.
Methods
Research design
I conducted a study using verbal protocols (Afflerbach, 2000; Pressley & Afflerbach,
1995; Pressley & Hilden, 2004). As the students read, they were prompted to think
aloud whenever they studied a graphic; students were also encouraged to share their
thinking at any other time during the reading. After each reading, the students retold
the book and answered eight researcher-designed comprehension questions. I then
analyzed the verbal protocol transcripts using modified open coding (Strauss &
Corbin, 1998) and scored the retellings and researcher-designed comprehension
questions. Finally, correlations were run between students’ scores on the retelling
and research-designed comprehension questions and the number of times any process
was prompted, the number of different processes, and the number of instances of
individual processes to answer the question: What is the relationship, if any, between
children’s processes prompted by the graphics in informational text and their
comprehension of the same texts?
Participants
The study was conducted with 30 second-grade students (17 males and 13 females)
from eight classrooms in five schools in five school districts in two Northeastern
states. Second graders were chosen for two reasons: (1) previous research has
indicated that second graders are able to produce reliable verbal protocols that
provide insight into their thinking as they read narrative (i.e., Alvermann, 1984;
Hilden, 2006) and informational texts (i.e., Norman, 2010a; Hilden, 2008); and (2)
as indicated above, informational texts written for primary-aged children, which
Reading the graphics 745
123
Author's personal copy

includes second graders, contain a number of graphics (Duke & Kays, 1998;
Fingeret, 2010).
In order to provide a diverse sample of students based on ethnicity and
socioeconomic status, the school districts were selected purposively. Within each
school district, one school agreed to participate; within each of these schools, two
classrooms were randomly selected from all consenting classrooms. Two of the
selected classrooms (one in each of two schools) had to be eliminated from the study
because they lacked a range of readers as indicated by the Gates MacGinitie
Reading Test (GMRT) (MacGinitie, MacGinitie, Maria, & Dreyer, 2000) compre-
hension subtest. In these two schools, all six students were randomly selected from
one classroom. Including only two classrooms from each school and three to six
students from each classroom helped to decrease the likelihood that the results of
the study would be influenced by any one school or teacher placing a greater
emphasis on the graphics in text.
The decoding and comprehension sections of the GMRT, Form T, Level 2 were
administered to all consenting students from each classroom, and students were
identified as below-average readers (i.e., they scored between the 1st and 30th
percentile), average readers (i.e., they scored between the 40th and 60th percentile),
and above-average readers (i.e., they scored between the 70th and 100th percentile).
Those students who did not score between these percentile ranges were eliminated
from the study. Additionally, in order to better control for any language or learning
disability factors, students who received special education services or were English
Language Learners were eliminate from the possible participant pool prior to
selection (i.e., below-average, average, and above-average). Once all students had
been identified or eliminated, randomized cluster sampling was used to select one
reader from each class in each achievement group so that one was a below-average
reader, one was an average reader, and one was an above average reader.
The participants were diverse in terms of ethnicity and socio-economic status,
which was measured using maternal education level (Entwisle & Astone, 1994). For
the sample, per parent report, 6% of the children were Asian–American, 10%
African–American, 50% Caucasian, 20% Hispanic/Latino, and 10% other; and the
parents of two students did not respond. In terms of socio-economic status, 6% of
mothers reported completing eighth grade but not high school, 23% reported
completing high school, 6% held associates degrees, 30% reported holding a
bachelors or other four-year degree, 20% reported holding a masters degree, and 3%
reported holding a doctorate; four declined to respond.
Materials
Students read Dino Dig (Odgers, 2008) and Weather Watching (Ryan, 2008), two
informational texts that are part of Weldon Owen Publishings’ stage two TopReaders series, a series of books that are designed with simple sentences, specialized
vocabulary, and graphics that provide support (Odgers, 2008, back cover; Ryan,
2008, back cover) and contain a range of graphics. Dino Dig explains the process by
which dinosaurs become fossils and how scientists discover and use these fossils to
learn about dinosaurs. Weather Watching describes different types of weather and
746 R. R. Norman
123
Author's personal copy

how scientists study weather. Both of the books are written for second graders to read
independently in the second half of the school year according to Chall’s (1996)
Qualitative Assessment of Text Difficulty.
The graphics in both books represent many of the prototypical graphics found in
informational texts, such as photographs (six in Dino Dig and six in WeatherWatching) and realistic drawings (11 in Dino Dig and 10 in Weather Watching) with
captions, labels (five labeled graphics in Dino Dig and two in Weather Watching),
and keys (four graphics with keys in Weather Watching); maps (one in WeatherWatching); flow charts (one in Dino Dig and two in Weather Watching); diagrams
(one in Dino Dig and one in Weather Watching); cross-sectional graphics (three in
Dino Dig); and cross-sectional diagrams (one in Dino Dig) (Fingeret, 2010; Purcell-
Gates, Duke, & Martineau, 2007). Also, these graphics represent many of the
communicative properties of graphics (i.e., representation [10 in Dino Dig and
seven in Weather Watching], extension [nine in Dino Dig and nine in WeatherWatching], organization [one in Dino Dig and one in Weather Watching], and
decoration [one in Dino Dig and four in Weather Watching]) identified by Levin
et al. (Carney & Levin, 2002; Levin, 1981; Levin et al., 1987), Clark and Lyons
(Clark & Lyons, 2004), Bishop and Hickman (1992), and Norman et al. (2010).
Please note that some graphics were counted more than once (e.g., a map is also a
graphic with a key).
Because the length of the books was a concern, three sections (five pages) were
removed from each book. All sections removed met the following criteria: (1) the
exclusion of those pages would not diminish the range of graphics in the text, and
(2) the removal of those sections would not impact the comprehension of later
sections. Within sections that met these criteria, I gave priority to removing sections
that (1) contained vocabulary or concepts deemed difficult or confusing for second-
grade students and (2) that were not authentic to informational text (i.e., compre-
hension questions at the end of the reading).
Finally, in order to more easily track where the students were looking as they
read (i.e., the running text, the captions, or the graphics), the books were modified
(as in Norman, 2010a). The original books, which measured 6 inches by 9 inches
(15.24 cm by 22.86 cm), were cut apart and glued onto construction paper, which
measured 12 inches by 18 inches (30.48 cm by 45.72 cm), so that the distance
between the main text and the graphics was increased. Only blank space was added.
The labels and titles of graphics were not cut apart from the image, and headings
and the accompanying running text remained intact; the relative position of
graphics, written text, and captions on the page was kept the same. These
modifications were piloted prior to this study and a previous study (Norman, 2010a)
to ensure the increased space did not distract students from looking at the graphics.
Data collection and analysis
Sessions one and two
During the first two sessions, which occurred within the classroom, I introduced
myself to the students and explained the study to them. Then, all students with
Reading the graphics 747
123
Author's personal copy

parental consent completed the decoding and comprehension subtests of the GMRT,
Form T, Level 2 (MacGinitie et al., 2000).
Sessions three and four
During the third and fourth sessions, which were held on a one-to-one basis in a
quiet place outside of the classroom, the students read aloud either Dino Dig(Odgers, 2008) or Weather Watching (Ryan, 2008). As the students read, they were
not corrected and were provided with little assistance in the decoding of words.
When students asked for help, they were encouraged to try their best. In a few
instances, students were supplied with words because they refused to continue
reading. As students read, they were asked to verbalize what they were thinking
(procedures for this are described below). The order of presentation of the two
books was counterbalanced within ability group and classroom.
Verbal protocols Verbal protocols were used to determine the readings processes
prompted by the graphics. As students read, they were prompted to think aloud
about the text when they looked at a graphic. As is recommended in methodological
pieces on verbal protocols (i.e., Pressley & Afflerbach, 1995; Pressley & Hilden,
2004) the directions to students for sharing their thinking were general:
Today, you are going to be reading a book for me. The book is going to look a
little funny (show students book), so don’t worry about that. As you read,
I cannot help you with any of the words. If you come to a word you don’t
know, try your best and keep reading. When you are done reading, I am going
to ask you to retell the book to me. I am also going to ask you some questions
about the book. As you read, I want to know what you are thinking.
Sometimes, I am going to stop you to ask you to tell me what you are thinking.
If you have nothing to say, you can tell me that too. You can also talk about
the book at other times when I don’t ask if you want to. Is it okay to tell me
you have nothing to say? Is it okay to talk about the book whenever you want?
As students read, I watched continuously in order to determine where their eyes
were looking, the text or the graphics. When I noticed that they were looking at a
graphic, I prompted them to share their thinking with, ‘‘What are you thinking?’’ If
students had not looked at any graphics after four pages, they were also prompted
with ‘‘What are you thinking?’’
In order to identify the processes prompted by the graphics, students’ verbal
protocols were transcribed verbatim. The transcription of their readings and that of
their thinking was done in different colors in order to make it easier to distinguish
the two kinds of verbalization.
First, verbalizations were analyzed to determine to what the student was
referring: the written text without reference to the graphic (e.g., ‘‘D-I-G [underlines
word as spells it out]’’); the graphic (e.g., ‘‘Oh, I see a bones [sic] [student points to
bones in picture]’’); the graphic and the written text (e.g., ‘‘So in here they would
have to put a replica [points to spot on the skeleton where a piece is missing]’’ after
748 R. R. Norman
123
Author's personal copy

reading that scientists make replicas to fill in missing piece of a fossil); or an
unrelated comment (e.g., ‘‘I need to go to the bathroom’’). Only those comments
that pertained to the graphics, either because they directly related to the graphic or
because the student was looking at the graphic as they spoke, were coded further.
Second, modified grounded theory (Strauss & Corbin, 1998) was used to reveal the
reading processes prompted by the graphics in each of the texts. Because previous
research (i.e., Norman, 2010a) using grounded theory had already identified
18 codes, I began by analyzing for these processes (i.e., label; literal description;inferential description; prediction; infer the author’s purpose; confirm/disconfirmtext; connection-to-self; irrelevant connection; connection-to-prior knowledge;wonder; knowledge monitoring; affective response; compare-contrast graphics;evaluate; use of running text; use of captions, labels, map key, etc.; word identi-fication) and no process. Any verbalizations that did not fit one of the 18 previous
codes were then described with a short phrase that explained the process prompted
by the graphic. These phrases were compared continuously to ensure that none of
them could be collapsed. In this way, six new codes were developed (i.e., names,graphic-to-written text connection, intertextual [across texts] connection, createsnarrative, repeat-paraphrase written text, and other). Please see results section
below for further discussion of these codes.
In some instances, the graphic prompted more than one reading process;
therefore, the verbalizations could be coded using multiple processes. For example,
while reading Dino Dig (pp. 22–23) and studying a cross-sectional diagram of a
dinosaur, one student commented, ‘‘That looks gross (points to dinosaur)! I think
maybe they’re going to tell us, like (points to muscle), the layers of a dinosaur,
maybe.’’ The first sentence in this verbalization was coded as an affective responsebecause the student was reacting to the graphic; the second sentence was coded a
prediction because the student explained what he thought the page would discuss.
A literacy expert familiar with reading processes of written text was trained to
code the verbal protocols using six of the transcripts. She then coded a random
sample of the transcripts (n = 16 or more than 25%), stratified by book. Inter-rater
agreement was 86.7% or 320 out of 369 codes, which is comparable to inter-rater
agreement in other verbal protocol studies (e.g., Brown, Pressley, Van Meter, &
Schuder, 1996).
Retellings When students had finished reading the book, they were asked to retell
the text. For this study, directions for retelling were adapted from previous research
on younger children’s retellings of expository text (e.g., Romero, Paris, & Brem,
2005), but were modified to utilize the fact that the session was videotaped.
Another second grader hasn’t read this book and wants to know about it. She
(He) will watch the video to hear the retelling. Can you retell the book using
your words and the words in the book as you remember them? Try to include
as many details as you can.
Retellings have been used in previous research on the influence of graphics on
students’ comprehension of the written text (e.g., Gambrell & Jawitz, 1993). They
Reading the graphics 749
123
Author's personal copy
have also been successfully used to assess young children’s comprehension of
narrative (e.g., Baumann & Bergeron, 1993; Morrow, 1985; Roberts, 2010) and
expository text (e.g., Moss, 1997; Romero et al., 2005).
Retellings were scored based on protocols developed for each book. The protocol
scoring procedure is based on that used by Meyer, Brandt, and Bluth (1978) in their
study of the use of top-level text structures and by Taylor (1980) in her study of
children’s memory for expository text. To develop retelling protocols, an expert in
designing retelling protocols and I analyzed each book independently, identifying
superordinate and subordinate ideas from the running text and captions and
developing a checklist to be used in scoring the retellings. Next, we compared
checklists and found three discrepancies—two for Dino Dig and one for WeatherWatching. These disagreements were resolved through discussion and consultation
with another literacy expert.
Finally, we assigned points to each idea. Superordinate ideas received two
points per page—on some pages the superordinate ideas were two separate, but
relate ideas and, therefore, students received one point for each—, and subordinate
ideas received one point. Students could also receive half a point for retelling the
topic of a superordinate idea (e.g., it talked about rainbows) or for retelling part of
a subordinate idea (e.g., the sun makes rain). At times, a superordinate idea for one
page was discussed as a subordinate idea on another page. In these instances,
students received two points (see ‘‘Appendix 1’’ for retelling protocol for DinoDig). Finally, in order to equate the two retellings, the students’ scores on the
retelling were divided by the total possible points (i.e., 45 for Weather Watchingand 49 for Dino Dig) and multiplied by 100 to determine their scores on the
retelling.
A literacy expert familiar with scoring retellings was trained to score the
retellings using 2 transcripts and then scored 10 transcripts for Weather Watchingand 10 transcripts for Dino Dig. First, I looked at whether or not a student
mentioned a main idea or supporting detail; interrater agreement was 96.2%, or 885
ideas out of 920. Then, I compared our final retelling scores for each protocol to see
if they were within 1 point; 80%, or 16 out of 20, were within 1 point.
Book-specific comprehension questions Finally, students were asked 8 book-
specific comprehension questions about the text. All questions were open-ended and
students were asked to respond verbally. Students’ answers were recorded and later
transcribed.
Researcher-designed comprehension questions have also been used as compre-
hension assessments in the study of graphics (e.g., Harber, 1983), as well as in
assessing children’s comprehension of narrative (e.g., Paris & Paris, 2003) and
expository text (e.g., Purcell-Gates et al., 2007). To construct the questions,
I developed a concept map of the written text to illustrate the macro- and
microstructures (Kintsch & van Dijk, 1978). I then wrote open-ended questions that
tapped both concepts at the macro- and micro-level of the text. These questions
were designed to assess the three levels of comprehension recommended by the
2009 National Reading Framework (National Assessment Governing Board, 2008):
750 R. R. Norman
123
Author's personal copy

locate/recall (for which students must identify information explicitly stated in the
text), integrate/interpret (for which students must make inferences within and
across texts), and critique/evaluate (for which students must assess the quality of
the text, decide what is most important in the text, or judge the plausibility of an
argument). Eight experts in the field of literacy reviewed and suggested revisions
for the questions. After questions were refined, the experts identified whether each
question assessed a macro- or micro-level idea, and whether it assessed literal,
inferential, or critical comprehension skills to ensure this distribution was met.
Based on their expert review, it was met (i.e., 2 literal in Dino Dig and 3 in
Weather Watching, 4 inferential in Dino Dig and 5 in Weather Watching, and 1
critical in Dino Dig and 1 in Weather Watching). See ‘‘Appendix 2’’ for questions
from Weather Watching.
On the comprehension questions, students could receive up to two points for
each correct answer. To develop a scoring protocol, an expert in literacy and I
answered each question with what we thought would be considered two-point and
one-point answers for second-grade students. These answers were compared to
each other and to a random sample of six transcripts. From these transcripts,
sample 0-point, 1-point, and 2-point answers were selected to include in the
scoring protocol. Once all answers were scored, students’ comprehension question
scores for each book were divided by the number of points scored by the total
number of points possible (i.e., 16, though for two students, one question was
missed so their possible points were out of 14 instead of 16) and multiplied by
100.
A literacy expert familiar with scoring comprehension questions was trained to
score the comprehension questions using 2 transcripts. She then scored 10
transcripts for Weather Watching and 10 transcripts for Dino Dig. Interrater
agreement was 87.5%, or 140 out of 160 questions.
Videotaping The 2 one-on-one reading sessions were videotaped in order to record
where students were looking and pointing (e.g., running text, caption, label, graphic)
as they discussed their thinking. The transcriptions included references to where the
students were looking or pointing as they read and verbalized.
Statistical analysis
After all verbalizations pertaining to the graphics, retellings, and comprehension
questions were analyzed, a number of statistical analyses were run. First, the
number of times each process was prompted for each student was calculated
separately for each book. Second, the number of different processes prompted for
each student was calculated separately for each book. Third, Spearman’s qcorrelations were run to determine whether and if so, to what degree, there was a
statistically significant relationship between (a) retelling scores and (b) comprehen-
sion question scores and (1) the range of processes used by children, (2) the number
of times any process was used by children, and (3) the number of times each
individual process was used by children.
Reading the graphics 751
123
Author's personal copy

Results
The reading processes
The modified open-coding of the transcripts resulted in 25 codes—23 reading
processes (i.e., affective response; confirm-disconfirm text; intertextual connection;graphic-to-graphic connection; graphic-to-written text connection; irrelevantconnection; connection-to-prior knowledge; connection-to-self; create narrative;evaluate; infer the author’s purpose; inferential description; knowledge monitoring;label; literal description; name; prediction; repeat-paraphrase written text; readingprocess-other; use of graphical devices; use of running text; wonder; and wordidentification), no process, and uninterpretable. Table 1 provides complete descrip-
tions of and student comments that exemplify each process.
The total number of processes prompted by the graphics across the two books
ranged from 9 to 62 (M = 28, SD = 12.625). The number of different processes
prompted by the graphics across both books ranged from 1 to 16 (M = 9.93,
SD = 4.226). Table 2 provides descriptive statistics for the total number of times
each process was prompted for each book, and Table 3 provides descriptive
statistics for the number of times any process was prompted and the number of
different processes prompted by the graphics for each book. For further discussion
of these processes see Norman (2010b).
Correlations between the reading processes and retelling scores
Out of a score of 100, students’ scores on the retellings ranged from 1.02 to 22.45
(M = 9.03, SD = 5.65) for Dino Dig and from 1.11 to 26.67 (M = 8.00,
SD = 5.72) for Weather Watching. The correlation between retelling and number
of times any process was prompted by the graphics approached significance for
Dino Dig (q = 0.333, p = 0.072). This correlation indicates that, for Dino Dig, a
greater use of any process prompted by the graphics was associated with higher
retelling scores. In fact, about 11.09% of the variation in students’ retelling scores
for Dino Dig can be explained by the number of times any process was prompted.
When studying the three reading-achievement groups separately, only the corre-
lation between retelling scores and above-average students’ use of any process
approached significance (q = 0.607, p = 0.063), indicating that for above-average
students 36.84% of the variance in their retelling scores can be explained by the
number of times any process was prompted.
There was no correlation between number of times any process was prompted and
retelling scores for Weather Watching, though the correlation for average readers did
approach significance (q = -0.597, p = 0.068). This negative correlation indicates
that, for average readers, the use of fewer processes is associated with higher scores
on the retelling for Weather Watching. The effect size was strong (q2 = 0.356).
Neither for Weather Watching nor for Dino Dig was the correlation between the
number of different processes and retelling scores statistically significant. When
reading Dino Dig, however, above-average students use of different processes was
positively, significantly correlated with their retelling scores (q = 0.632, p = 0.05);
752 R. R. Norman
123
Author's personal copy

Table 1 Definitions and examples of all processes prompted by the graphics
Affective
response
Student expresses an emotion based on the
graphic
Example 1: Wow!
Example 2: That one is weird
Connection-
graphic-to-
written text
Student makes a connection between a graphic
and the written text in another part of the
same book
Example: (Student studies illustration
of fossil hanging in a museum.) That
was (points at picture) the guy welded
and put it together and then they put it
in a museum, like he was doing to
this one (refers back to text on
previous page)
Connection-
graphic-to-
graphic
Student compares different graphics in order
to better understand both graphics and/or to
gain new information/meaning
Example 1: Hey, I think (looks back
and forth between the two graphics),
it looks like they’re the same thing
Connection-
intertextual
Graphic prompts student to make a connection
to another text (e.g., book, movie, TV show,
etc.)
Example: This picture, this picture and
this picture (points to tropical, desert,
and temperate photographs) look like
the ones in our anthology in our
classroom
Connection-to-
prior
knowledge
Student references prior knowledge related to
the graphic. Prior knowledge may be
inaccurate
Example 1: I thought it was a
vilocaraptor, but it doesn’t have a big
enough toe (points to foot)
Example 2: Lightning can go up (points
to picture) or lightning can come
down. And then there is another thing
that lightning can go like it can either
go up out of nowhere and just form
Connection-to-
self
Graphic prompts student to make a connection
to the student’s own life
Example: (Looking at fossil displayed
in museum) Well, I’m thinking about
when I went to the science
museum…it kind of looked like this
only there were different things.
There was these kind of things up in
the air, hanging from strings
Connection-
irrelevant
The connection made may be topically
connected, but is not relevant to the author’s
intent
Example: (looking at a rainbow)
rainbows (name) and Playland (a
local amusement park)
Create
narrative
The graphic prompts student to create a
narrative. Student ascribes feelings,
thoughts, and actions to the people or
animals in the pictures. The actions are not
present in the graphic and/or not reasonably
inferred from the graphic and the words
Example: I’m thinking this is alive
(points to dinosaur) but they pretend
to be dead. So they can’t get eaten
Evaluate Student judges or forms an opinion based on
the information presented in the graphic and/
or his or her background knowledge
Example: It doesn’t even look like one
(a dinosaur)
Knowledge
monitoring
Student recognizes absence of prior
knowledge or recognizes that the text or
graphic confirms previous thinking
Example: I never knew that the tracks
tell you how dinosaurs move
Label Student labels something in the picture while
pointing to the objects being labeled. Labels
may or may not be correct
Example: That this picture is a city
(points to city)
Reading the graphics 753
123
Author's personal copy

Table 1 continued
Names Student names or lists items found in the
picture without pointing to the objects in
the picture. Names may or may not be
correct
Example: rainbow (looking at picture of a
rainbow, but not pointing)
Literal
description
The graphics prompt student to describe
(not simply name or label) what is
explicitly depicted in the graphic. Student
may be gaining information, or may be
stating what they see in the graphic.
Information may or may not be correct
Example: That these small dinosaurs were
running away from this dinosaur
Inferential
description
The graphic prompts student to infer
information. The information is implied in
the graphic or by combining information
from the graphic and the words, but is not
explicitly depicted. Information may or
may not be correct
Example: I’m thinking that if it shocks
buildings, people might die
Infer
author’s
purpose
Student infers the author’s purpose for
including a graphic, what the author
wanted you to learn from the graphic, or
why author placed a graphic in a specific
spot
Example: It’s kind of like rain and snow are
on the same page because they’re the
same sometimes. Sometimes the rain is
bad weather and sometimes snow is bad
weather
Prediction Student uses the graphic to predict what will
be on the page/in the book
Example: It’s going to tell about the moon,
maybe the moon, maybe the sun, maybe
the planet earth, how it does all this
weather stuff, maybe how it snows
Use of
graphical
devices
Student uses graphical text features (e.g.,
labels, captions, map keys, arrows in flow
chart, graphics’ titles) to understand
graphic. Student is not just restating or
rephrasing the caption or label
Example: I’m thinking that I always I
thought it was like red, orange, yellow,
green, blue, purple, that’s all, instead of
indigo and violet
Use of
running
text
Student uses the text to better understand
and gain information from the graphic.
Student is not just restating or rephrasing
the running text
Example: (After reading running text) Oh so
that’s a kite. I thought it was a plane
Repeat-
paraphrase
text
While looking at the graphic, student
repeats or attempts to repeat text verbatim
or paraphrases or attempts to paraphrase
text using own words. The text can be the
running text, captions, or labels (if the
label is a phrase)
Example: Text: When clouds are very thick
and grey it is sometimes to get out your
umbrella. Student: That you should get
out your umbrella
Confirm-
disconfirm
text
Student uses the graphic to confirm/
disconfirm what was stated in the text
Example: Text: Some insects have even
become fossils!
Student: That doesn’t really look like an
insect
Wonder Student uses the graphics to question or
wonder about topic. The wonders can be
said as statements or questions
They may include words such as if or
wonder but do not have to
Example: If these (points to small dinos)
killed him (points to big dino) or he just
died from not eating?
754 R. R. Norman
123
Author's personal copy

in fact, 39.94% of the variation in above-average readers’ retelling scores for DinoDig can be explained by the number of different process that were prompted. See
Table 4 for means, standard deviations, and ranges of scores on the retellings for the
two books, correlations between retelling scores and total number of processes, and
correlations between retellings and number of different processes.
Table 2 Number of times each process was prompted
Process Weather Watching Dino Dig Both books
No. of times prompted
(% of total processes)
No. of times prompted
(% of total processes)
No. of times prompted
(% of total processes)
Affective response 19 (5.21) 23 (4.97) 42 (5.07)
Confirm-disconfirm text 5 (1.37) 5 (1.08) 10 (1.21)
Create narrative 15 (4.11) 47 (10.15) 62 (7.49)
Intertextual connection 4 (1.10) 3 (0.65) 7 (0.85)
Graphic-to-graphic connection 0 (0.00) 6 (1.30) 6 (0.72)
Graphic-to-written text
connection
0 (0.00) 5 (1.08) 5 (0.60)
Irrelevant connection 7 (1.92) 12 (2.59) 19 (2.29)
Connection-to-prior
knowledge
33 (9.04) 23 (4.97) 56 (6.76)
Connection-to-self 15 (4.11) 10 (2.16) 25 (3.02)
Evaluate 5 (1.37) 2 (0.43) 7 (0.85)
Infer the author’s purpose 1 (0.27) 0 (0.00) 1 (0.12)
Inferential description 27 (7.40) 47 (10.15) 74 (8.94)
Knowledge monitoring 24 (6.58) 23 (4.97) 47 (5.68)
Label 19 (5.21) 23 (4.97) 42 (5.07)
Literal description 28 (7.67) 51 (11.02) 79 (9.54)
Name 15 (4.11) 17 (3.67) 32 (3.86)
Prediction 15 (4.11) 19 (4.10) 34 (4.11)
Repeat-paraphrase written text 35 (9.59) 46 (9.94) 81 (9.78)
Use of graphical devices 28 (7.67) 4 (0.86) 32 (3.86)
Use of running text 4 (1.10) 2 (0.43) 6 (0.72)
Wonder 53 (14.52) 72 (15.55) 125 (15.10)
Word identification 6 (1.64) 9 (1.94) 15 (1.81)
Reading process-other 7 (1.92) 14 (3.02) 21 (2.54)
Table 1 continued
Word
identification
Student uses the graphic to decode
word or comprehend meaning of
word
Example: I was thinking that (pointing to
skeleton) or that. I didn’t know what word that
that was (points to astonished) so I looked at the
picture, then the word, then I looked at it again
and then I looked at the word
Reading
Process-
other
Comment does not fit into any of the
other processes listed
Example: Have you ever seen a wooly mammoth
or a saber tooth statue in museums, hm?
(Student is asking the researcher a question)
Reading the graphics 755
123
Author's personal copy
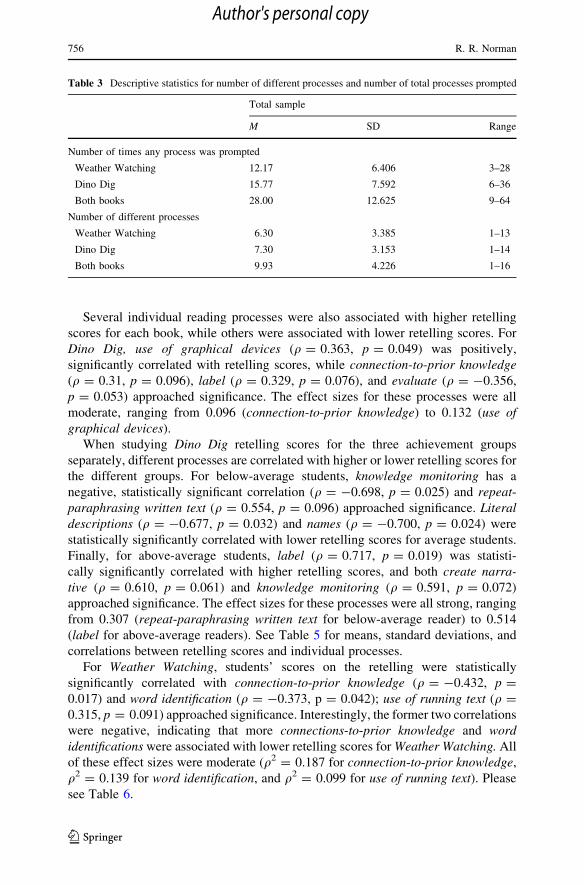
Several individual reading processes were also associated with higher retelling
scores for each book, while others were associated with lower retelling scores. For
Dino Dig, use of graphical devices (q = 0.363, p = 0.049) was positively,
significantly correlated with retelling scores, while connection-to-prior knowledge(q = 0.31, p = 0.096), label (q = 0.329, p = 0.076), and evaluate (q = -0.356,
p = 0.053) approached significance. The effect sizes for these processes were all
moderate, ranging from 0.096 (connection-to-prior knowledge) to 0.132 (use ofgraphical devices).
When studying Dino Dig retelling scores for the three achievement groups
separately, different processes are correlated with higher or lower retelling scores for
the different groups. For below-average students, knowledge monitoring has a
negative, statistically significant correlation (q = -0.698, p = 0.025) and repeat-paraphrasing written text (q = 0.554, p = 0.096) approached significance. Literaldescriptions (q = -0.677, p = 0.032) and names (q = -0.700, p = 0.024) were
statistically significantly correlated with lower retelling scores for average students.
Finally, for above-average students, label (q = 0.717, p = 0.019) was statisti-
cally significantly correlated with higher retelling scores, and both create narra-tive (q = 0.610, p = 0.061) and knowledge monitoring (q = 0.591, p = 0.072)
approached significance. The effect sizes for these processes were all strong, ranging
from 0.307 (repeat-paraphrasing written text for below-average reader) to 0.514
(label for above-average readers). See Table 5 for means, standard deviations, and
correlations between retelling scores and individual processes.
For Weather Watching, students’ scores on the retelling were statistically
significantly correlated with connection-to-prior knowledge (q = -0.432, p =
0.017) and word identification (q = -0.373, p = 0.042); use of running text (q =
0.315, p = 0.091) approached significance. Interestingly, the former two correlations
were negative, indicating that more connections-to-prior knowledge and wordidentifications were associated with lower retelling scores for Weather Watching. All
of these effect sizes were moderate (q2 = 0.187 for connection-to-prior knowledge,
q2 = 0.139 for word identification, and q2 = 0.099 for use of running text). Please
see Table 6.
Table 3 Descriptive statistics for number of different processes and number of total processes prompted
Total sample
M SD Range
Number of times any process was prompted
Weather Watching 12.17 6.406 3–28
Dino Dig 15.77 7.592 6–36
Both books 28.00 12.625 9–64
Number of different processes
Weather Watching 6.30 3.385 1–13
Dino Dig 7.30 3.153 1–14
Both books 9.93 4.226 1–16
756 R. R. Norman
123
Author's personal copy

Ta
ble
4D
escr
ipti
ve
stat
isti
csfo
rth
eco
mpre
hen
sion
mea
sure
san
dco
rrel
atio
ns
bet
wee
nco
mpre
hen
sion
mea
sure
san
dnum
ber
of
dif
fere
nt
pro
cess
esan
dnum
ber
of
tota
l
pro
cess
esp
rom
pte
d
Bo
ok
Co
mp
reh
ensi
on
mea
sure
MS
DR
ange
All
stu
den
tsB
elo
w-a
ver
age
read
ers
Av
erag
ere
ader
sA
bo
ve-
aver
age
read
ers
No
.o
fti
mes
any
pro
cess
was
pro
mp
ted
No
.o
f
dif
fere
nt
pro
cess
es
No
.o
fti
mes
any
pro
cess
was
pro
mp
ted
No
.o
f
dif
fere
nt
pro
cess
es
No
.o
fti
mes
any
pro
cess
was
pro
mp
ted
No
.o
f
dif
fere
nt
pro
cess
es
No
.o
fti
mes
any
pro
cess
was
pro
mp
ted
No
.o
f
dif
fere
nt
pro
cess
es
Wea
ther
Wat
chin
g
Ret
elli
ng
8.0
05
.72
1.1
1–
26
.66
-0
.04
6-
0.1
02
-0
.043
-0
.031
-0
.59
7t
-0
.559
0.3
12
0.3
43
Co
mpre
hen
sio
n
qu
esti
on
s
41
.38
18
.09
3.1
3–
62
.5-
0.0
52
0.0
57
0.1
26
0.6
01
-0
.69
6*
-0
.443
00
.28
Din
oD
igR
etel
lin
g9
.03
5.6
51
.02–
22
.45
0.3
33
0.2
07
-0
.393
-0
.393
0.5
11
-0
.264
0.6
07
0.6
32
*
Co
mpre
hen
sio
n
qu
esti
on
s
47
.43
16
.83
15
.63
–8
1.2
50
.29
0.2
89
-0
.103
0.0
66
0.0
37
-0
.117
0.1
60
.074
*S
ign
ifica
nt
atp\
0.0
5;
tsi
gn
ifica
nt
atp\
0.1
0
Reading the graphics 757
123
Author's personal copy

Ta
ble
5D
escr
ipti
ve
stat
isti
csfo
rin
div
idual
pro
cess
esan
dco
rrel
atio
ns
bet
wee
nco
mpre
hen
sion
mea
sure
san
din
div
idual
pro
cess
esfo
rD
ino
Dig
Pro
cess
MS
DR
ange
All
studen
tsB
elow
-aver
age
read
ers
Aver
age
read
ers
Above-
aver
age
read
ers
Ret
elli
ng
Com
p.
qu
esti
on
s
Ret
elli
ng
Com
p.
qu
esti
on
s
Ret
elli
ng
Com
p.
qu
esti
on
s
Ret
elli
ng
Com
p.
qu
esti
on
s
Aff
ecti
ve
resp
on
se0
.77
1.6
33
0–
70
.015
0.0
72
-0
.468
0.0
59
-0
.232
-0
.405
-0
.046
-0
.165
Co
nfi
rm-d
isco
nfi
rmte
xt
0.1
70
.379
0–
10
.062
0.2
75
-0
.468
-0
.41
40
.482
0.4
09
-0
.418
0.1
15
Co
nn
ecti
on
-gra
phic
-to-g
rap
hic
0.1
0.4
03
0–
20
.30
.484
*-
0.0
59
0.3
55
aa
0.3
12
0.5
2
Co
nn
ecti
on
-gra
phic
-to-w
ritt
ente
xt
0.1
70
.531
0–
20
.155
0.1
31
-0
.468
-0
.41
4a
a0
.51
0.3
44
Co
nn
ecti
on
-in
tert
extu
al0
.20
.484
0–
20
.172
0.2
09
aa
aa
0.0
78
0.0
7
Co
nn
ecti
on
-irr
elev
ant
0.4
0.9
68
0–
50
.287
0.2
42
0.1
76
0.6
65
*0
.181
0.3
06
0.3
54
-0.3
94
Co
nn
ecti
on
-to
-pri
or
kn
ow
led
ge
0.7
71
.104
0–
50
.31
t0
.026
0.3
69
0.3
75
0.0
47
-0
.377
0.5
18
0.0
59
Co
nn
ecti
on
-to
-sel
f0
.33
0.7
58
0–
30
.183
-0
.073
-0
.234
-0
.41
4-
0.2
41
-0
.234
0.1
23
-0
.690
*
Cre
ate
nar
rati
ve
1.5
71.6
95
0–5
0.0
19
-0
.256
-0
.06
0.0
92
0.3
74
-0
.317
0.6
1t
0.0
26
Ev
alu
ate
0.0
70
.254
0–
1-
0.3
56
t-
0.0
54
-0
.468
-0
.41
4-
0.2
41
0.2
92
aa
Infe
rau
tho
r’s
pu
rpose
00
0a
aa
aa
aa
a
Infe
renti
ald
escr
ipti
on
1.5
71
.591
0–
60
.22
-0
.121
-0
.135
-0
.29
80
.132
-0
.548
0.0
97
-0
.082
Kn
ow
led
ge
mon
ito
rin
g0
.77
0.8
98
0–
30
.034
0.2
15
-0
.698
*-
0.3
-0
.547
-0
.384
0.5
91
t0
.534
Lab
el0
.77
1.2
78
0–
60
.329
t0
.353
t-
0.3
64
-0
.00
40
0.4
59
0.7
17
*-
0.0
16
Lit
eral
des
crip
tio
n1
.71
.236
0–
5-
0.0
63
-0
.03
-0
.195
0.0
32
-0
.677
*-
0.4
80
.287
0.2
78
Nam
es0
.57
0.9
35
0–
40
.163
0.1
54
0.1
53
0.2
71
-0
.700
*-
0.1
47
0.3
71
-0
.108
Pre
dic
tio
n0
.63
2.7
35
0–
15
-0
.264
0.0
93
-0
.153
0.6
19
t-
0.2
41
0-
0.4
06
0.0
58
Rea
din
gp
roce
ss-o
ther
0.4
70
.90
–4
0.0
57
0.0
07
-0
.394
-0
.07
2-
0.2
41
00
.322
-0
.121
Rep
eat-
par
aph
rase
wri
tten
tex
t1
.53
2.0
13
0–
60
.186
-0
.179
0.5
72
t0
.11
60
.381
-0
.252
0.0
8-
0.1
31
758 R. R. Norman
123
Author's personal copy

Ta
ble
5D
escr
ipti
ve
stat
isti
csfo
rin
div
idual
pro
cess
esan
dco
rrel
atio
ns
bet
wee
nco
mpre
hen
sion
mea
sure
san
din
div
idual
pro
cess
esfo
rD
ino
Dig
Pro
cess
MS
DR
ange
All
studen
tsB
elow
-aver
age
read
ers
Aver
age
read
ers
Above-
aver
age
read
ers
Ret
elli
ng
Com
p.
qu
esti
on
s
Ret
elli
ng
Com
p.
qu
esti
on
s
Ret
elli
ng
Co
mp.
qu
esti
on
s
Ret
elli
ng
Com
p.
qu
esti
on
s
Use
of
gra
ph
ical
dev
ices
0.1
30
.434
0–
20
.363
*0
.07
30
.117
-0
.118
aa
0.4
93
-0
.07
Use
of
run
nin
gte
xt
0.0
70
.254
0–
10
.271
0.1
16
aa
0.4
82
0.4
09
0.1
74
-0
.467
Wo
nder
2.4
4.5
07
0–
16
-0
.145
0.0
92
-0
.374
-0
.349
0.1
13
0.5
74
t-
0.0
13
0.4
15
Wo
rdid
enti
fica
tio
n0
.30
.837
0–
4-
0.1
81
-0
.05
40
.049
0.1
8-
0.2
41
0.2
92
aa
*S
ign
ifica
nt
atp\
0.0
5;
tsi
gn
ifica
nt
atp\
0.1
0a
Corr
elat
ion
sco
uld
no
tb
eru
n
Reading the graphics 759
123
Author's personal copy

Ta
ble
6D
escr
ipti
ve
stat
isti
csfo
rin
div
idual
pro
cess
esan
dco
rrel
atio
ns
bet
wee
nco
mpre
hen
sion
mea
sure
san
din
div
idual
pro
cess
esfo
rW
eath
erW
atch
ing
Pro
cess
MS
DR
ange
All
studen
tsB
elow
-aver
age
read
ers
Aver
age
read
ers
Above-
aver
age
read
ers
Ret
elli
ng
Com
p.
qu
esti
on
s
Ret
elli
ng
Co
mp.
qu
esti
on
s
Ret
elli
ng
Co
mp.
qu
esti
on
s
Ret
elli
ng
Co
mp.
qu
esti
on
s
Aff
ecti
ve
resp
onse
0.6
31.2
45
0–4
-0
.069
-0
.10
5-
0.0
92
-0
.51
1-
0.2
28
-0
.302
-0
.06
6-
0.0
32
Con
firm
-dis
con
firm
tex
t0
.17
0.4
61
0–
2-
0.1
1-
0.1
95
-0
.408
-0
.37
1-
0.4
71
-0
.30
.53
0.3
64
Con
nec
tio
n-i
nte
rtex
tual
0.1
30
.434
0–
2a
aa
aa
aa
a
Con
nec
tio
n-g
rap
hic
-to
-wri
tten
tex
t0
00
aa
aa
aa
aa
Con
nec
tio
n-g
rap
hic
-to
-gra
ph
ics
00
00
.202
0.1
51
aa
0.1
77
-0
.48
0.1
54
0.2
94
Con
nec
tio
n-i
rrel
evan
t0
.23
0.5
68
0–
2-
0.1
35
-0
.01
40
.412
0.4
68
-0
.22
1-
0.7
21
*-
0.4
42
0.0
45
Con
nec
tio
n-t
o-p
rio
rk
no
wle
dg
e1
.11
.447
0–
5-
0.4
32
*-
0.2
2-
0.3
51
-0
.02
5-
0.3
27
-0
.422
-0
.64
0*
0.2
9
Con
nec
tio
n-t
o-s
elf
0.5
0.9
0–
4-
0.1
53
-0
.01
40
0.4
39
-0
.34
1-
0.4
94
-0
.32
7-
0.2
73
Cre
ate
nar
rati
ve
0.5
0.8
61
0–
30
.066
-0
.09
6-
0.0
07
0.0
33
-0
.17
70
.36
0.4
11
-0
.07
Ev
alu
ate
0.1
70
.531
0–
2-
0.0
73
-0
.09
6a
a-
0.1
71
-0
.595
t-
0.0
59
0.3
64
Infe
rth
eau
tho
r’s
pu
rpose
0.0
30
.183
0–
1-
0.2
27
0.0
32
aa
aa
-0
.41
2-
0.3
03
Infe
renti
ald
escr
ipti
on
0.9
1.2
42
0–4
-0
.076
0.0
02
0.1
10
.08
-0
.13
7-
0.2
09
-0
.21
0.2
03
Kn
ow
led
ge
mo
nit
ori
ng
0.8
1.4
0–
50
.142
0.0
05
0.5
39
0.2
25
-0
.33
10
.14
0.0
88
-0
.366
Lab
el0
.63
1.0
33
0–
4-
0.2
79
0.1
07
-0
.421
0.0
8-
0.2
68
-0
.569
t-
0.2
60
.589
t
Lit
eral
des
crip
tio
n0
.93
1.3
63
0–
50
.078
0.1
71
0.0
92
0.4
58
-0
.10
50
.094
0.2
13
-0
.485
Nam
e0
.51
.306
0–
5-
0.0
21
-0
.08
0.3
86
0.5
37
-0
.26
8-
0.7
16
*-
0.1
77
0.3
64
Pre
dic
tio
n0
.51
.676
0–
90
.244
0.1
31
-0
.177
-0
.22
aa
0.4
52
0.1
11
Rea
din
gp
roce
ss-o
ther
0.2
30
.504
0–
2-
0.1
68
0.3
2t
-0
.059
0.1
17
-0
.48
60
.045
-0
.41
10
.705
*
Rep
eat-
par
aph
rase
wri
tten
tex
t1
.17
1.2
62
0–
50
.242
0.1
69
0.5
48
0.5
54
t0
.35
70
.01
0.3
11
0.0
07
760 R. R. Norman
123
Author's personal copy

Ta
ble
6co
nti
nu
ed
Pro
cess
MS
DR
ange
All
studen
tsB
elow
-aver
age
read
ers
Aver
age
read
ers
Above-
aver
age
read
ers
Ret
elli
ng
Co
mp
.
qu
esti
on
s
Ret
elli
ng
Com
p.
qu
esti
on
s
Ret
elli
ng
Com
p.
qu
esti
on
s
Ret
elli
ng
Co
mp.
qu
esti
on
s
Use
of
gra
ph
ical
dev
ices
0.9
31
.048
0–
40
.051
0.0
17
-0
.017
0.2
87
-0
.365
-0
.302
0.3
81
-0
.037
Use
of
run
nin
gte
xt
0.1
30
.346
0–
10
.315
0.3
54
-0
.059
0.1
17
aa
0.3
86
0.5
16
Wo
nder
1.7
73
.159
0–
11
-0
.061
-0
.056
-0
.105
-0
.05
2-
0.0
38
0.1
23
-0
.09
-0
.021
Wo
rdid
enti
fica
tio
n0
.20
.484
0–
2-
0.3
73
*-
0.2
15
-0
.463
0.1
92
-0
.268
-0
.027
aa
*S
ign
ifica
nt
atp
\0
.05;
tsi
gn
ifica
nt
atp\
0.1
0a
Co
rrel
atio
ns
cou
ldn
ot
be
run
Reading the graphics 761
123
Author's personal copy

When investigating correlations for the three achievement groups, connection-to-
prior knowledge (q = -0.640, p = 0.046) was statistically significantly correlated
with retelling scores for the above-average readers. Interestingly, students’
connections-to-prior knowledge were correlated with lower retelling scores. The
effect sizes for both of this processes was strong (q2 = 0.410). There were no
significant correlations found for either of the other two sub-groups.
Correlations between the reading processes and researcher-designed
comprehension question scores
Students’ scores on the researcher-designed comprehension questions ranged from
15.63 to 81.25 (M = 47.43, SD = 16.83) out of a score of 100 for Dino Dig and from
3.13 to 62.5 (M = 41.38, SD = 18.09) out of a score of 100 for Weather Watching.No correlations between these scores and number of times any process was prompted
or number of different processes used were statistically significant when considering
all students together. For the three sub-groups, the number of times any process was
prompted (q = -0.696, p = 0.025) was significantly correlated with lower scores
on the comprehension questions for the average readers when reading WeatherWatching, and the number of different processes prompted approached significance
(q = 0.601, p = 0.066) for below-average readers reading Weather Watching. For
both of these cases, the effect sizes were strong (q2 = 0.484 and 0.361 respectively).
Again, see Table 4 for means, standard deviations, and ranges of scores on the
comprehension questions for the two books, correlations between comprehension
scores and the number of times any process was prompted, and correlations between
comprehension scores and the number of different processes.
Correlations run between the number of times individual reading processes were
prompted by the graphics and students’ scores on the comprehension questions
indicated that only graphic-to-graphic connection was significantly correlated with
comprehension scores (q = 0.484, p = 0.007) for Dino Dig. The prompting of
labeling also approached significance (q = 0.353, p = 0.056) for Dino Dig. The
effect sizes of these processes on their comprehension question score were moderate
(q2 = 0.125 for labeling and q2 = 0.232 for graphic-to-graphic connection). There
were no significant correlations between any specific reading processes and the
comprehension questions for Weather Watching, though use of running textapproached significance (q = 0.354, p = 0.055). See Tables 5 and 6 for means,
standard deviations, and correlations.
When considering the three sub-groups individually, different processes were
correlated with comprehension question scores for different groups and for different
books. When reading Dino Dig, for below-average students, irrelevant connections(q = 0.665, p = 0.036) is positively, statistically significantly correlated with
comprehension question scores for Dino Dig and prediction (q = 0.601, p = 0.066)
approached significance; wondering (q = 0.574, p = 0.083) approached signifi-
cance for students who were average readers; and connection-to-self (q = -0.690,
p = 0.027) was negatively, statistically significantly correlated for above-average
students. For Weather Watching, correlations between label (q = 0.589, p = 0.072)
and comprehension questions scores approached significance for the above-average
762 R. R. Norman
123
Author's personal copy

readers and between repeat-paraphrase written-text and comprehension question
scores approached significance for below-average readers (q = 0.554, p = 0.096).
All effect sizes were strong.
Discussion
This study investigated what relationship, if any, existed between the processes
prompted by the graphics as second graders read informational text and their scores
on two comprehension measures for that text: retelling and researcher-designed
comprehension questions. A discussion of these findings follows.
Sheer number of processes may not always help
As discussed above, research on reading processes and the comprehension of
written text has shown that students who employ a greater number of total processes
score higher on comprehension assessments (e.g., Braten & Stromso, 2003;
Dermitzaki et al., 2008; Samuelstuen & Braten, 2005). In this study, the correlation
between the number of times students used any process while studying the graphics
in Dino Dig—but not Weather Watching—and the retelling measure approached
significance. When considering the three reading-achievement groups separately,
this correlation approached significance for above-average readers as they read DinoDig, but not Weather Watching. Furthermore, for average achieving students
reading Weather Watching, the greater the number of times any process was
prompted, the lower their scores on the comprehension questions. In this case, using
more comprehension processes did not help average readers.
Previous research has also found that good readers use a greater range of
processes with written text (e.g., Dermitzaki et al., 2008). With respect to the visual
elements of text that were the focus of this study, there were no significant
correlations between range of different processes used and scores on either of the
comprehension measures for either of the books. Above-average students reading
Dino Dig did score higher on the retelling, but not on the comprehension questions,
when they used a great number of different processes; below-average students
reading Weather Watching, this correlation approached significance.
Why do these differences exist between the relationship of how students process
written text and graphical text and subsequent comprehension? I propose three
possible reasons: (1) the designs of the studies differed, (2) it is possible that not all
processes are created equal—that is to say that the use of some are associated with
improved comprehension, while the use of others are not, and (3) students are being
taught to strategically use processes when reading written text, but not when reading
graphics (if they are taught to read graphics, at all).
The studies’ designs
The design of this study differed from the designs of the studies investigating
reading processes prompted by written text and comprehension. In this study,
Reading the graphics 763
123
Author's personal copy

students’ reading processes were revealed through verbal protocols and modified
open-coding. Students were not asked to identify specific processes, but instead
shared their thinking about the graphics in general. In Samuelstuen and Braten
(2005), students were asked to indicate how often they had used specific processes
by selecting (1) not at all to (10) very often on a Likert-type scale. Perhaps some
students over- or under-represented their use of these processes.
Additionally, previous research on the relationship between reading processes
and comprehension has not included as many different reading processes as were
included in this study. For example, Samuelstuen and Braten (2005) investigated the
use of only three types of reading processes—elaboration, organization, and
monitoring. They did not include many of the reading processes included in this
study, such as word identification, predicting, or irrelevant connections. However,
this does not necessarily mean that fewer processes were present, but could mean
that the level of analysis was less refined than in the present study, with several
micro-processes mapping onto one macro-process. Limiting the number and type of
reading processes investigated in this study or consolidating processes may have led
to different results. Please see Norman (2010c) for further discussion of these
macro-processes.
Finally, in research, such as that by Samuelstuen and Braten’s (2005) and
Dermitzaki et al. (2008), participants have only read one selection. In this study,
students read two informational science trade books. Although the books were from
the same publisher and the same series, and they were chosen because of their
similarities in graphics and writing, they do discuss different topics and areas of
science (i.e., life sciences vs. physical sciences). These differences may have
contributed to the different findings. After all, McTigue (2009) did find that when
sixth graders read a life science text about the life cycle of protozoan, the inclusion
of diagrams improved their comprehension, but when they read physical science
text about how heat energy is transformed to mechanical energy, the addition of
diagrams did not improve their comprehension. For further discussion of how
specific books may influence what graphical reading processes are prompted, please
see Norman (2010a, b).
Not all processes are created equal
When looking at the correlations between reading processes and comprehension
scores, it appears that not all reading processes contribute to a readers’ overall
comprehension equally. For example, students who were prompted to respondaffectively did not necessarily score better or worse on the comprehension measures—
these emotional responses did not hurt the students’ comprehension, but it did not help
them recall the information either.
Students’ use of graphical devices (positively statistically significantly correlated
with retellings for Dino Dig) and use of the running text (positively correlated with
retellings for Weather Watching), on the other hand, appear be associated with
better retelling scores (for Dino Dig and Weather Watching respectively). Perhaps
this is partially due to the fact that the graphical devices and the running text helped
them to comprehend the graphic better. For example, Weather Watching discusses
764 R. R. Norman
123
Author's personal copy

the fact that, long ago, scientists used kites to study the weather. When first looking
at the accompanying graphic, a number of students thought it was a picture of the
Wright brothers and their airplane. Only after reading the running text did some of
them comment, ‘‘I just learned that that’s a kite.’’ Understanding that the graphic
showed scientists flying a kite may have cleared up misconceptions and helped
students to remember how scientists studied weather long ago so that they could
correctly include this in their retellings. Qualitative analysis of students’ answers to
the question ‘‘How did people study weather long ago?’’ indicates that students who
used the running text to revise their understanding of this graphic were more likely
to respond correctly than those students who did not use the running text to revise
their thinking. These latter students were more likely to reply that they used
airplanes.
Greater use of labeling a graphic was also associated with higher retelling scores,
but not with higher comprehension question scores. This could be due in part
because to the fact that when children labeled the pictures they turned visual stimuli
into verbal stimuli, thus dual coding (Paivio, 1991) the information and making
them more memorable to the children, and thus made them so they were more likely
to mention them in their retellings. Just restating items did not necessarily assist
them in answering comprehension questions, however, because many of the
comprehension questions asked them to go beyond simply recalling specific items
included in the text. One exception was a question about Dino Dig, which asked
students to ‘‘Tell me as many things as you can from this book that were turned into
fossils.’’ Qualitative analysis of this question suggests that students who labeled the
photographs and illustrations of the different types of fossils were able to include
more types of fossils.
Some processes are associated with lower comprehension scores. For example,
students’ use of word identification while reading Weather Watching is negatively
correlated with their retelling scores for that book. Perhaps students are concen-
trating on decoding the words, thus interfering with their recall of text. Others
depended on the reading-achievement of the students. For example, knowledgemonitoring was associated with lower retelling scores for Dino Dig for below-
average readers, but with higher retelling scores for above-average readers. Perhaps
below-average readers were able to identify whether or not they already knew
information presented in the book, but did not integrate this new information with
their already existing understanding, while above-average readers did integrate this
information, allowing them to better understand and recall what they read.
Reading instruction
Currently, many students (likely including those in this study) have been taught to
predict, summarize, make inferences, make connections, and use other processes
strategically as they read written text. In fact, this strategy instruction is
emphasized in research-based programs, such as those based on transactional
strategy instruction (Brown et al., 1996) and reciprocal teaching (Palincsar &
Brown, 1994), as well as popular books written for teachers, such as Strategies thatWork (Harvey & Goudvis, 2007) and Mosaic of Thought (Keene & Zimmermann,
Reading the graphics 765
123
Author's personal copy

2007). Importantly, this instruction focuses on the quality of the use of these
processes. That is to say, teachers spend time teaching the difference between a
helpful and an unhelpful prediction or connection. By comparison, less emphasis
appears to be placed on the reading and processing of graphics as no research
exists as to whether or not teachers are teaching students to read and process
graphics or to suggest effective ways in which to teach students how to read and
process these graphics. Therefore, students are not learning how to effectively use
these reading processes when studying graphics and it would appear that quality,
strategic use of processes while reading written-text may not transfer to quality,
strategic use of processes while reading the graphics. Given the increasingly visual
nature of the world in which we are living and the fact that according to the
semiotic perspective (e.g., Jewitt & Oyama, 2001) these visuals carry meaningful
information, visual literacy is one ‘‘new’’ literacy that we cannot afford to ignore.
The implications of lack of instruction in processing—and subsequently lack
of ability to process and glean information from—visuals could negatively
affect students’ abilities to comprehend the texts they encounter in and out of
school.
Despite this lack of instruction, just as some readers are naturally strategic at
processing written-text while others are not (e.g., Duke & Pearson, 2002; National
Institute of Child Health and Human Development, 2000; Pressley & Afflerbach,
1995), some students appeared to be able to understand what the graphics were
attempting to convey, while others misinterpreted some graphics. For example,
when studying the map of different climates in Weather Watching, many students
understood the map key explained the symbols—or in this case colors—on the
map and were able to integrate the information in the map key with the
information in map; others appeared to believe they were two separate graphics
that did not relate. When the caption asked students if they could find the deserts,
students who could read these symbols and integrate the information, found the
deserts on the map based on the color indicated in the map key. Those students
who did not integrate these two graphics pointed to the picture of the desert in the
map key. With more—or perhaps any—instruction on how to interpret and process
graphics, perhaps all students would be better able to improve their comprehension
of the overall text.
Reading achievement as moderating factor
Although not explicitly explored in this study, it would appear that a students’
reading achievement may be one moderating factor in determining which processes
are positively and negatively correlated with comprehension scores. For example, as
indicated above, knowledge monitoring and retelling scores for Dino Dig were
negatively, statistically significantly correlated for below-average readers, while the
correlation approached positive significance for above-average readers. These
differences are not surprising in light of the extant verbal protocol research on
graphical reading (i.e., Norman, 2010a, b), which suggests that students’ reading
achievement and the processes prompted by the graphics are related.
766 R. R. Norman
123
Author's personal copy

The curious case of prior knowledge
In looking at specific processes, previous research has found that prior knowledge
of a subject assists in students’ comprehension of the topic (e.g., McNamara &
Kintsch, 1996). In this study, the graphics prompted 20 students to make
connections-to-prior knowledge for a total of 56 times (33 for Weather Watchingand 23 for Dino Dig). Interestingly, these connections-to-prior knowledge were
positively correlated to retelling scores for Dino Dig, but negatively correlated to
retelling scores for Weather Watching, though the former only approached
statistical significance. In some cases, it seems that children’s connections relating
prior knowledge to Dino Dig were of greater quality or were more accurate, thus
assisting them in their comprehension of the text. For example, one above-average
reader was prompted to make connections-to-prior knowledge while reading DinoDig and Weather Watching. For Dino Dig, one of his connections-to-priorknowledge was about mummies while studying a photograph of Leonardo, a
dinosaur fossil that was a mummy. In his retelling, he discussed Leonardo and
received three out of the four possible points for that page, which was almost half
of his Dino Dig retelling points. While reading Weather Watching, his connection-
to-prior knowledge was incorrect—while studying a photograph of lightning, he
stated that lightning could come from the sky or the ground. In his retelling, he did
not mention lightning at all. Accurate and relevant prior knowledge likely assists
students in their comprehension more than inaccurate or less relevant prior
knowledge.
A note about correlations and causations
This study investigated correlations between graphical reading processes and
comprehension scores on retelling and comprehension questions, without addressing
causation. Based on the results, it appears that some graphical reading processes are
correlated with some comprehension measures for some books for some students.
Perhaps the use of these specific processes as they studied the graphics in the books
led to the students’ better comprehension scores. For example, students who were
prompted to use the running text to better understand a graphic may have
comprehended the overall text better because they coded the information from both
the written- and graphical-text. However, we also have to consider the fact that
students’ comprehension of the overall text actually led them to use, or not use,
specific graphical reading processes. For instance, students who did not comprehend
the overall text may have been prompted to make irrelevant connections because of
the fact that they did not understand the author’s meaning.
Limitations
Precautions were taken to maximize the validity of this study, but a few limitations
remain. First, because verbal protocols rely on participants self-reporting of their
thinking and the comprehension measures were dependent upon students
Reading the graphics 767
123
Author's personal copy

verbalizing their answers, students’ verbal abilities may have impacted their
reporting of their thinking (Afflerbach & Johnston, 1984) and their ability to retell
or answer the comprehension questions. Second, the fact that students were
prompted to share their thinking whenever they looked at a graphic may have
affected how often students studied the graphics. Some students may have studied
them more often because of this prompting, while others may have looked at them
less often in order to avoid prompting. In fact, although never specifically told that
they would be asked to share their thinking when they looked at a graphic, some
students appeared to figure out the pattern and began to report their thinking as they
looked at each graphic.
Implications and conclusions
Previous research on comprehension and graphics has been inconsistent with
regard to whether or not the presence of graphics is beneficial to students’ overall
comprehension of the text. None of these previous studies investigated how
students were processing these graphics. The present study indicates that the use of
certain processes when reading graphics in informational text is associated with a
better overall understanding of that same text. Some possible reasons are discussed
above, but more research is needed to investigate how and why these processes
are contributing to the students’ comprehension. Moreover, differences in the
relationship between the use of specific processes and comprehension scores were
found amongst the three reading-achievement groups. Future research utilizing a
larger sample size and more sophisticated statistical analyses than correlations is
needed to determine whether and to what extent the relationship between the use of
processes and comprehension scores is moderated by reading-achievement. Addi-
tionally, neither the quality of students’ processes nor the relationship between the
quality and students’ comprehension scores was analyzed in this study. Future
research should study whether such a relationship exists. Furthermore, research
indicates that students are being taught to use processes as they read written text, but
no research exists to indicate they are being taught to use these processes as they read
graphical text; survey and observational studies are needed to investigate whether
and how teachers are instructing students to use processes as they read the graphics in
text. Finally, because this research suggests that the use of specific processes is
associated with better comprehension, intervention studies that teach students how to
strategically use these processes and comprehend graphics are needed. We are
developing our understanding of the use and comprehension of the graphics in
informational text, but we have a long road before we have a complete picture.
Appendix 1
See Table 7.
768 R. R. Norman
123
Author's personal copy

Tab
le7
Ret
elli
ng
chec
kli
stfo
rD
ino
Dig
Pag
eM
ain
idea
sco
re
Mai
nid
ea(2
po
ints
)(0
.5p
oin
tif
nam
esto
pic
of
the
mai
nid
ea)
Su
pp
ort
ing
idea
sco
re
Su
pp
ort
ing
idea
s(1
po
int
un
less
ind
icat
ed
as1
/2p
oin
t)
Cap
tio
n
sco
re
Cap
tio
n(1
po
int
un
less
ind
icat
ed
as1
/2p
oin
t)
3–
Din
osa
urs
wer
ere
pti
les
(1p
oin
t)–
Alm
ost
ever
yth
ing
we
kn
ow
abo
ut
them
com
esfr
om
stu
dy
ing
the
bo
nes
(1/2
po
int)
–T
hey
liv
edlo
ng
ago
(1p
oin
t)–
Alm
ost
ever
yth
ing
we
kn
ow
abo
ut
them
com
esfr
om
stu
dy
ing
thei
rtr
ack
s
(1/2
po
int)
4–
5–
Din
os
cou
ldtu
rnin
toa
foss
ilw
hen
they
die
(2p
oin
ts)
–D
ino
sau
r’s
bo
dy
lay
on
the
gro
und
(1/2
po
int)
–P
red
ato
rsso
met
imes
ate
its
fles
h
(1/2
po
int)
–D
ino
sau
r’s
bo
dy
lay
inth
ew
ater
(1/2
po
int)
–D
inosa
rus
hav
ep
red
ators
(or
enem
ies)
(1/2
po
int)
6–
7–
Din
osa
urs
bec
ame
foss
ils
afte
ra
lon
g
tim
e(2
po
ints
)
–B
ones
are
repla
ced
by
min
eral
s(1
poin
t)–
Din
osa
urs
are
cover
edby
sand
(1p
oin
t)
–B
on
estu
rnto
sto
ne
(1p
oin
t)–
Lay
ers
of
dir
tco
ver
sth
ed
ino
sau
r’s
bo
dy
(1p
oin
t)
–S
cien
tist
sd
isco
ver
the
din
osa
ur
foss
ils
(1p
oin
t)
8–
9–
Dif
fere
nt
thin
gs
can
be
foss
ils
–P
lan
t(o
rle
aves
)ca
nb
efo
ssil
s(1
po
int)
–T
he
har
d,
bo
ny
par
tsar
est
rong
eno
ugh
tom
ake
foss
ils
(1p
oin
t)
–P
lan
tfo
ssil
sfo
rmw
hen
ale
affa
lls
into
clay
and
mak
esan
imp
ress
ion
(1p
oin
t)
–E
ven
inse
cts
can
bec
om
efo
ssil
s
10
–1
1–
Tra
cks
can
be
foss
ils
(2p
oin
ts)
–T
rack
sh
app
enw
hen
anim
als
wal
kin
mud
(1p
oin
t)
–T
rack
sca
nb
em
ade
wh
enan
imal
s
run
from
ap
red
ato
r(1
po
int)
–T
rack
ste
llu
sh
ow
din
osa
urs
mov
ed
(1p
oin
t)
Reading the graphics 769
123
Author's personal copy

Tab
le7
con
tin
ued
Pag
eM
ain
idea
sco
re
Mai
nid
ea(2
po
ints
)(0
.5p
oin
tif
nam
es
topic
of
the
mai
nid
ea)
Su
pp
ort
ing
idea
sco
re
Su
pp
ort
ing
idea
s(1
po
int
un
less
ind
icat
edas
1/2
po
int)
Cap
tio
n
sco
re
Cap
tio
n(1
po
int
un
less
indic
ated
as1
/2p
oin
t)
12–13
–P
lace
sw
ith
sedim
enta
ryro
ckar
egood
pla
ces
tolo
ok
for
foss
ils
(2p
oin
ts)
–W
her
ey
ou
fin
do
ne
din
osa
ur
foss
il,
yo
um
igh
t
fin
do
ther
s(1
po
int)
–Y
ou
can
bre
akro
cks
wit
ha
ham
mer
tofi
nd
foss
ils
(1p
oin
t)
14
–1
5–
Sci
enti
sts
un
cover
foss
ils
inro
cks
(2p
oin
ts)
–S
cien
tist
shav
eto
work
care
full
y(1
poin
t)
–It
may
tak
ea
lon
gti
me
tou
nco
ver
the
foss
il
(1p
oin
t)
16
–1
7–
Fo
un
din
Mo
nta
na
(1p
oin
t)–
Itw
asa
mu
mm
y(1
po
int)
–F
oun
da
bra
chy
lop
hosa
urs
(1p
oin
t)
–S
oft
tiss
ue
has
bee
nfo
un
das
wel
las
bo
nes
(1p
oin
t)
–It
was
nam
edL
eonar
do
(1p
oin
t)
18
–1
9–
Fo
ssil
bo
nes
are
mix
edu
p(2
po
ints
)–
Hav
eto
pu
tth
emb
ack
tog
eth
erli
ke
ap
uzz
le
(1p
oin
t)
20
–2
1–
Fo
ssil
skel
eto
ns
are
inm
use
um
s
(2p
oin
t)
–S
kel
eto
ns
are
big
(1p
oin
t)–
Info
rmat
ion
and
pic
ture
sar
ou
nd
the
dis
pla
ys
tell
us
wh
atan
imal
sw
ere
lik
e(1
/2p
oin
t)
–In
form
atio
nan
dp
ictu
res
arou
nd
the
dis
pla
ys
tell
us
ho
wth
eyli
ved
(1/2
po
int)
22
–2
3–
Bo
nes
can
be
mis
sin
gfr
om
foss
il
skel
eto
ns
(1p
oin
t)
–T
he
bo
nes
are
mad
eo
ut
of
pla
ster
(1p
oin
t)
–T
hey
add
mu
scle
tiss
ue
(1/2
po
int)
–S
cien
tist
sm
ake
bo
nes
tofi
llin
the
gap
s(1
po
int)
––
Th
eyad
dsk
into
the
skel
eto
n(1
/2p
oin
t)
–T
his
mak
esth
ed
ino
sau
rlo
ok
lik
eit
did
wh
enit
was
aliv
e(1
po
int)
770 R. R. Norman
123
Author's personal copy

Appendix 2: Researcher-designed comprehension questionsfor Weather Watching
1. What are some different types of climates? (locate/recall)
2 points—hot, cold, and mild (warm) OR desert, tropical, polar, mountain,
temperate
1 point—for naming at least 1 of the above
0 points—for not naming any of the above
2. Why do you think the author talks about clouds on so many pages? (integrate/
interpret)
2 points—Because most weather comes from clouds like snow and rain and
hail and all the weather pretty much has to do with the clouds like you can
tell if it’s going to rain or it’s going to snow or stuff like that from looking at
the clouds
1 point—they are part of the weather and the book is about weather
0 points—I don’t know; he likes clouds
3. What causes wind? (locate/recall)
2 points—the sun heats the earth unevenly
1 point—moving air; the sun
0 points—I don’t know; a village
4. Why did the author put rain and snow in one section? (integrate/interpret)
2 points—they are the same thing it is just when rain freezes it turns to snow
1 point—they are like the same thing; they are similar
0 points—he had enough room
5. Do you think the author did a good job of explaining what frost is? Why (not)?
(critique/evaluate)
2 points—Well, the writing part didn’t explain much about frost but the
pictures when you looked at it you could see like the little spikes and like to
me it automatically popped into my head and said, ‘‘oh that’s how frost
looked’’ and I didn’t know how frost looked and that explained its
2 points—Yes, because he told you how water freezes and it forms at night.
1 point—Yes, he used a lot of details
0 points—Yes, I don’t know; Yes, because frost is cool.
6. Why does the author write about rainbows? (integrate/interpret)
2 points—Because rainbows have to do with weather. They have to do with
sun and rain like combining
1 point—because sun makes rainbows OR because rain makes rainbows
0 points—he thinks rainbows are pretty
7. How did people learn about whether a long time ago? How do they learn about
it today? (locate/recall)
Reading the graphics 771
123
Author's personal copy

2 points—A long time ago they flew kites and today they use satellites to
send back pictures
1 point—answers one part of the question
0 points—has neither answer
8. Why did the author write this book? (integrate/interpret)
2 points—to teach people about weather like rain, snow, rainbows and how it
forms.
1 points—because weather is important
0 points—he wanted to, he likes weather, etc.
References
Afflerbach, P. (2000). Verbal reports and protocol analysis. In M. L. Kamil, P. B. Mosenthal, P.
D. Pearson, & R. Barr (Eds.), Handbook of reading research (Vol. III, pp. 163–180). Mahwah,
NJ: Lawrence Erlbaum.
Afflerbach, P., & Johnston, P. (1984). Research methodology: On the use of verbal reports in reading
research. Journal of Reading Behavior, 16, 307–322.
Alvermann, D. E. (1984). Second graders’ strategic reading preferences while reading basal stories.
Journal of Educational Psychology, 77(3), 184–189.
Baumann, J. F., & Bergeron, B. S. (1993). Story map instruction using children’s literature: Effects on
first graders’ comprehension of central narrative elements. Journal of Reading Behavior, 25,
407–437.
Bishop, R. S., & Hickman, J. (1992). Four to fourteen or forty: Picture books are for everyone. In S. Benedict
& L. Carlisle (Eds.), Beyond words: Picture books for older readers and writers (pp. 1–10).
Portsmouth, NH: Heinemann.
Braten, I., & Stromso, H. I. (2003). A longitudinal think-aloud study of spontaneous strategic processing
during the reading of multiple expository texts. Reading and Writing: An Interdisciplinary Journal,16, 195–218.
Brookshire, J., Scharff, L. F. V., & Moses, L. E. (2002). The influence of illustrations on children’s book
preferences and comprehension. Reading Psychology, 23, 323–339.
Brown, R., Pressley, M., Van Meter, P., & Schuder, T. (1996). A quasi-experimental validation of
transactional strategies instruction with low-achieving second-grade readers. Journal of EducationalPsychology, 88, 18–37.
Carney, R. N., & Levin, J. R. (2002). Pictorial illustrations still improve students’ learning from text.
Educational Psychology Review, 14(1), 5–26.
Chall, J. S. (1996). Qualitative assessment of text difficulty: Practical guide for teachers and writers.
Cambridge, MA: Brookline Books.
Clark, R. C., & Lyons, C. (2004). Graphics for learning: Proven guidelines for planning, designing, andevaluation visuals in training materials. San Francisco, CA: Pfeiffer.
Dermitzaki, I., Andreou, G., & Paraskeva, V. (2008). High and low reading comprehension achievers’
strategic behavior and their relation to performance in a reading comprehension situation. ReadingPsychology, 29, 471–492.
Duke, N. K. (2005). Comprehension of what for what: Comprehension as a nonunitary construct. In S.
G. Paris & S. A. Stahl (Eds.), Children’s reading comprehension and assessment (pp. 93–104).
Mahwah, NJ: Earlbaum.
Duke, N. K., & Kays, J. (1998). ‘‘Can I say ‘Once upon a time’?’’: Kindergarten children developing
knowledge of informational book language. Early Childhood Research Quarterly, 13, 295–318.
Duke, N. K., & Pearson, P. D. (2002). Effective practices for developing reading comprehension. In A.
E. Farstrup & S. J. Samuels (Eds.), What research has to say about reading instruction (Vol. 3,
pp. 205–242). Newark, DE: International Reading Association.
772 R. R. Norman
123
Author's personal copy

Duke, N. K., Norman, R. R., Roberts, K. L., Martin, N. M., Knight, J. A., Morsink, P. M.,Calkins, S.
(2009). Visual literacy development in young children: An investigation with informational texts.
Paper presented at the National Reading Conference, Albuquerque, NM.
Entwisle, D. R., & Astone, N. M. (1994). Some practical guidelines for measuring youth’s race/ethnicity
and socioeconomic status. Child Development, 65, 1521–1540.
Fingeret, L. (2010). Graphics in children’s informational texts: Establishing a representative typology ofimages in informational textbooks, little books, and trade books. Manuscript in preparation.
Gambrell, L., & Jawitz, P. B. (1993). Mental imagery, text illustrations, and children’s story
comprehension and recall. Reading Research Quarterly, 28, 265–276.
Hannus, M., & Hyona, J. (1999). Utilization of illustrations during learning of science textbook passages
among low- and high-ability children. Contemporary Educational Psychology, 24, 95–123.
Harber, J. R. (1983). The effects of illustrations on the reading performance of learning disabled and
normal children. Learning Disability Quarterly, 6(1), 55–60.
Harvey, S., & Goudvis, A. (2007). Strategies that work: Teaching comprehension for understanding andengagement. Portland, ME: Stenhouse Publishers.
Hilden, K. (2006). Verbal protocols: A window into second graders’ reading comprehension of narrativetexts. Paper presented at the National Reading Conference, Los Angeles, CA.
Hilden, K. (2008). Connections between SpongeBob SquarePants and zoolpnaton: The informationalreading comprehension processes of second graders. Paper presented at the National Reading
Conference.
IRA/NCTE. (1996). Standards for the English language arts. Newark, DE: International Reading
Association and the National Council of Teachers of English.
Jewitt, C., & Oyama, R. (2001). Visual meaning: A social semiotic approach. In T. van Leeuwen & C.
Jewitt (Eds.), Handbook of visual analysis (pp. 134–156). London, England: Sage.
Keene, E. O., & Zimmermann, S. (2007). Mosaic of thought: The power of comprehension strategyinstruction (2nd ed.). Portsmouth, NH: Heinemann.
Kintsch, W., & van Dijk, T. A. (1978). Toward a model of text comprehension and production.
Psychological Review, 85, 363–394.
Levin, J. R. (1981). On the functions of pictures in prose. In M. C. Wittrock & F. J. Pirozzolo (Eds.),
Neuropsychological and cognitive processes in reading (pp. 203–228). New York, NY: Academic
Press.
Levin, J. R., Anglin, G. J., & Carney, R. N. (1987). On empirically validating functions of pictures in
prose. In D. M. Willows & H. A. Houghton (Eds.), The psychology of illustration (Vol. I,
pp. 51–85). New York, NY: Springer.
MacGinitie, W. H., MacGinitie, R. K., Maria, K., & Dreyer, L. G. (2000). Gates-MacGinitie ReadingTests: Level 2 Form T (4th ed.). Itasca, IL: Riverside Publishing.
McNamara, D. S., & Kintsch, W. (1996). Learning from texts: Effects of prior knowledge and text
coherence. Discourse Processes, 22, 247–288.
McTigue, E. M. (2009). Does multimedia learning theory extend to middle-school students?
Contemporary Educational Psychology, 34, 143–153.
Meyer, B. J. F., Brandt, D. H., & Bluth, G. J. (1978). Use of author’s textual schema: Key for ninthgraders’ comprehension. Paper presented at the annual meeting of the American Educational
Research Association, Toronto, Canada.
Miller, W. A. (1938). Reading with or without pictures. The Elementary School Journal, 38, 676–682.
Morrow, L. M. (1985). Retelling stories: A strategy for improving young children’s comprehension,
concept of story structure, and oral language complexity. The Elementary School Journal, 85,
646–661.
Moss, B. (1997). A qualitative assessment of first graders’ retelling of expository text. Reading Researchand Instruction, 37, 1–13.
Moss, B. (2008). Getting the picture: Visual dimensions of informational texts. In J. Flood, S. B. Heath, &
D. Lapp (Eds.), Handbook of research on teaching literacy through the communicative and visualarts (Vol. II, pp. 393–398). New York, NY: Lawrence Erlbaum.
National Assessment Governing Board. (2008). Reading framework for the 2009 National Assessment ofEducational Progress. Retrieved from www.nagb.org/publications/frameworks/reading09.pdf.
National Institute of Child Health and Human Development. (2000). Report of the National ReadingPanel: Teaching children to read: An evidence-based assessment of the scientific research literatureon reading and its implications for reading instruction (NIH Publication No. 00–4769). Washington,
DC: US Government Printing Office.
Reading the graphics 773
123
Author's personal copy

Norman, R. R. (2010a). Picture this: Reading processes prompted by the graphics in informational text.
Literacy Teaching and Learning, 14(1–2), 1–39.
Norman, R. R. (2010b). Reading the graphics: Reading processes prompted by the graphics as second
graders read informational text. (Unpublished doctoral dissertation). Michigan State University, East
Lansing, MI.
Norman, R. R. (2010c). Graphical reading processes and reading achievement: Is there a connection?
Manuscript in preparation.
Odgers, S. (2008). Dino dig. Sydney, Australia: Weldon Owen Publishing.
Paivio, A. (1991). Dual coding theory: Retrospect and current status. Canadian Journal of Psychology,45, 255–287.
Palincsar, A. S., & Brown, A. L. (1994). Reciprocal teaching of comprehension-fostering and
comprehension-monitoring activities. Cognition and Instruction, 1, 117–175.
Paris, A. H., & Paris, S. G. (2003). Assessing narrative comprehension in young children. ReadingResearch Quarterly, 38, 36–76.
Park, Y. (2008). Patterns in and predictors of elementary students’ reading performance: Evidence fromthe data of the Progress in International Reading Literacy Study (PIRLS). Unpublished doctoral
dissertation, Michigan State University, East Lansing, MI.
Pressley, M., & Afflerbach, P. (1995). Verbal protocols of reading: The nature of constructivelyresponsive reading. Hillsdale, NJ: Lawrence Erlbaum.
Pressley, M., & Hilden, K. (2004). Verbal protocols of reading. In N. K. Duke & M. H. Mallette (Eds.),
Literacy research methodologies (pp. 308–321). New York, NY: The Guilford Press.
Purcell-Gates, V., Duke, N. K., & Martineau, J. A. (2007). Learning to read and write genre-specific text:
Roles of authentic experience and explicit teaching. Reading Research Quarterly, 42, 8–45.
RAND Reading Study Group. (2002). Reading for understanding: Towards and R&D program in readingcomprehension. Santa Monica, CA: Rand Education.
Roberts, K. L. (2010). Retelling as a measure of primary grade narrative listening comprehension.
Manuscript under review.
Romero, F., Paris, S. G., & Brem, S. K. (2005). Children’s comprehension and local-to-global recall of
narrative and expository text. Current Issues in Education, 8(25). Retrieved from
http://cie.asu.edu/volume8/number25/.
Rose, T. L. (1986). Effects of illustrations on reading comprehension of learning disabled students.
Journal of Learning Disabilities, 19, 542–544.
Rose, T. L., & Robinson, H. H. (1984). Effects of illustrations on learning disabled students’ reading
performance. Learning Disability Quarterly, 7, 165–171.
Rusted, J., & Coltheart, V. (1979). The effect of pictures on the retention of novel words and prose
passages. Journal of Experimental Child Psychology, 28, 516–524.
Ryan, D. (2008). Weather watching. Syndey, Australia: Weldon Owen Publishing.
Samuelstuen, M. S., & Braten, I. (2005). Decoding, knowledge, and strategies in comprehension of
expository text. Scandinavian Journal of Psychology, 46, 107–117.
Schnotz, W., Picard, E., & Hron, A. (1993). How do successful and unsuccessful learners use text and
graphics. Learning and Instruction, 3, 181–199.
Small, M. Y., Lovett, S. B., & Scher, M. S. (1993). Pictures facilitate children’s recall of unillustrated
expository prose. Journal of Educational Psychology, 85, 520–528.
Strauss, A., & Corbin, J. (1998). Basics of qualitative research: Grounded theory procedures andtechniques (2nd ed.). Newbury Park, CA: Sage.
Taylor, B. M. (1980). Children’s memory for expository text after reading. Reading Research Quarterly,15, 399–411.
The New London Group. (1996). A pedagogy of multiliteracies: Designing social futures. HarvardEducational Review, 66, 60–92.
Watkins, J. K., Miller, E., & Brubaker, D. (2004). The role of visual image: What are students really
learning from pictorial representations? Journal of Visual Literacy, 24(1), 23–40.
774 R. R. Norman
123
Author's personal copy